

Recensione dell'MSI Raider 18 HX A14V: Prestazioni da Titan senza il prezzo da Titan
")
I portatili da gioco più grandi da 18 pollici stanno facendo una sorta di ritorno, dato che la linea continua ad espandersi costantemente. MSI offre già l'esperienza di gioco 'definitiva' da 18 pollici con la Titan 18 HXma l'ultimo modello Raider 18 HX si colloca un gradino più in basso in termini di caratteristiche per abbassare la barriera d'ingresso.
La nostra unità di prova è una configurazione intermedia con CPU Raptor Lake-R Core i9-14900HX, GPU GeForce RTX 4080 da 175 W e display Mini-LED 3840 x 2400 120 Hz per circa 3200 dollari al dettaglio. Altre SKU includono invece lo Zen 4 Ryzen 9 7945HX, RTX 4070, RTX 4090 o il display IPS QHD+ 2560 x 1600 240 Hz.
I concorrenti del Raider 18 HX includono altri portatili da gioco da 18 pollici come il Razer Blade 18, Alienware m18 R2o Asus ROG Strix G18.
Altre recensioni di MSI:
Potenziali concorrenti a confrontos
Punteggio | Versione | Data | Modello | Peso | Altezza | Dimensione | Risoluzione | Prezzo |
|---|---|---|---|---|---|---|---|---|
| 84.7 % | v8 | 09/2024 | MSI Raider 18 HX A14V i9-14900HX, NVIDIA GeForce RTX 4080 Laptop GPU | 3.6 kg | 32 mm | 18.00" | 3840x2400 | |
| 90.5 % v7 (old) | v7 (old) | 05/2024 | Razer Blade 18 2024 RZ09-0509 i9-14900HX, NVIDIA GeForce RTX 4090 Laptop GPU | 3.1 kg | 21.9 mm | 18.00" | 2560x1600 | |
| 89.5 % v7 (old) | v7 (old) | 03/2024 | Alienware m18 R2 i9-14900HX, NVIDIA GeForce RTX 4090 Laptop GPU | 4 kg | 26.7 mm | 18.00" | 2560x1600 | |
| 88.8 % v7 (old) | v7 (old) | 01/2024 | MSI Titan 18 HX A14VIG i9-14900HX, NVIDIA GeForce RTX 4090 Laptop GPU | 3.6 kg | 32.1 mm | 18.00" | 3840x2400 | |
| 87.4 % v7 (old) | v7 (old) | 03/2023 | Asus ROG Strix G18 G814JI i7-13650HX, NVIDIA GeForce RTX 4070 Laptop GPU | 3 kg | 31 mm | 18.00" | 2560x1600 | |
| 87.1 % v7 (old) | v7 (old) | 03/2024 | Acer Predator Helios 18 PH18-72-98MW i9-14900HX, NVIDIA GeForce RTX 4090 Laptop GPU | 3.3 kg | 29.5 mm | 18.00" | 2560x1600 |
Nota: abbiamo recentemente aggiornato il nostro sistema di valutazione e i risultati della versione 8 non sono paragonabili ai risultati della versione 7. Ulteriori informazioni sono disponibili qui .
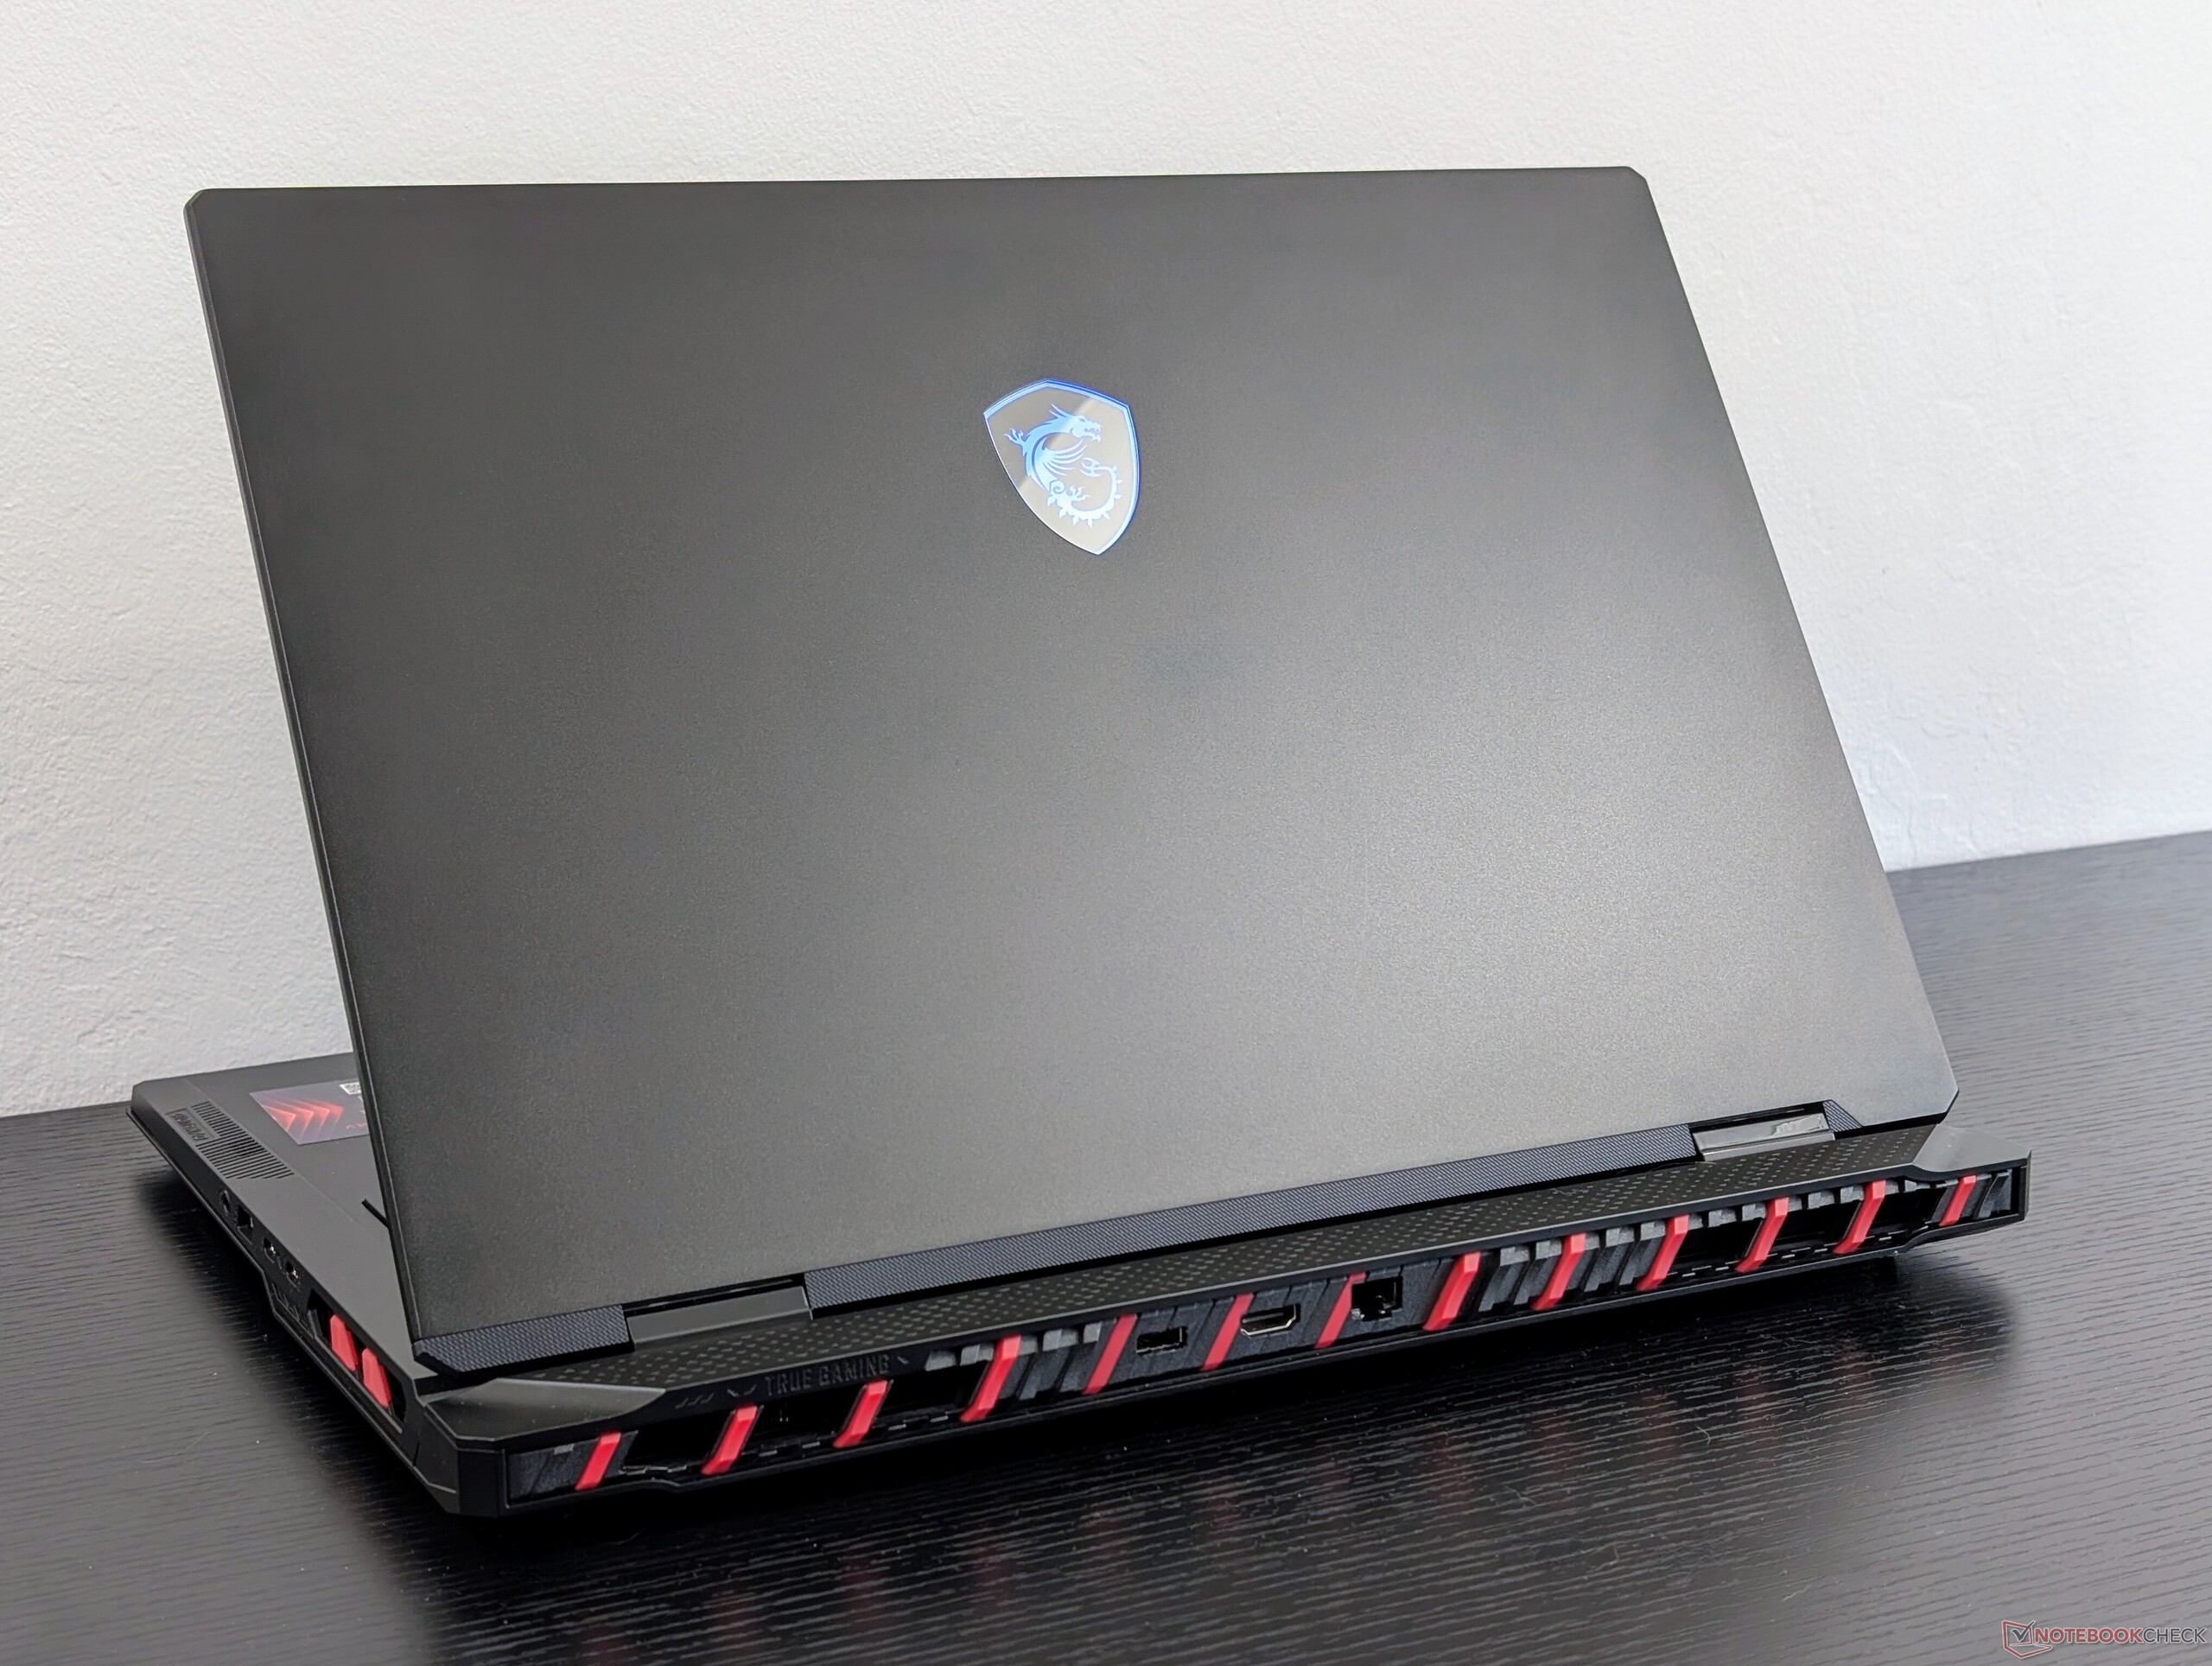
Caso - Dal Drago Blu al Rosso
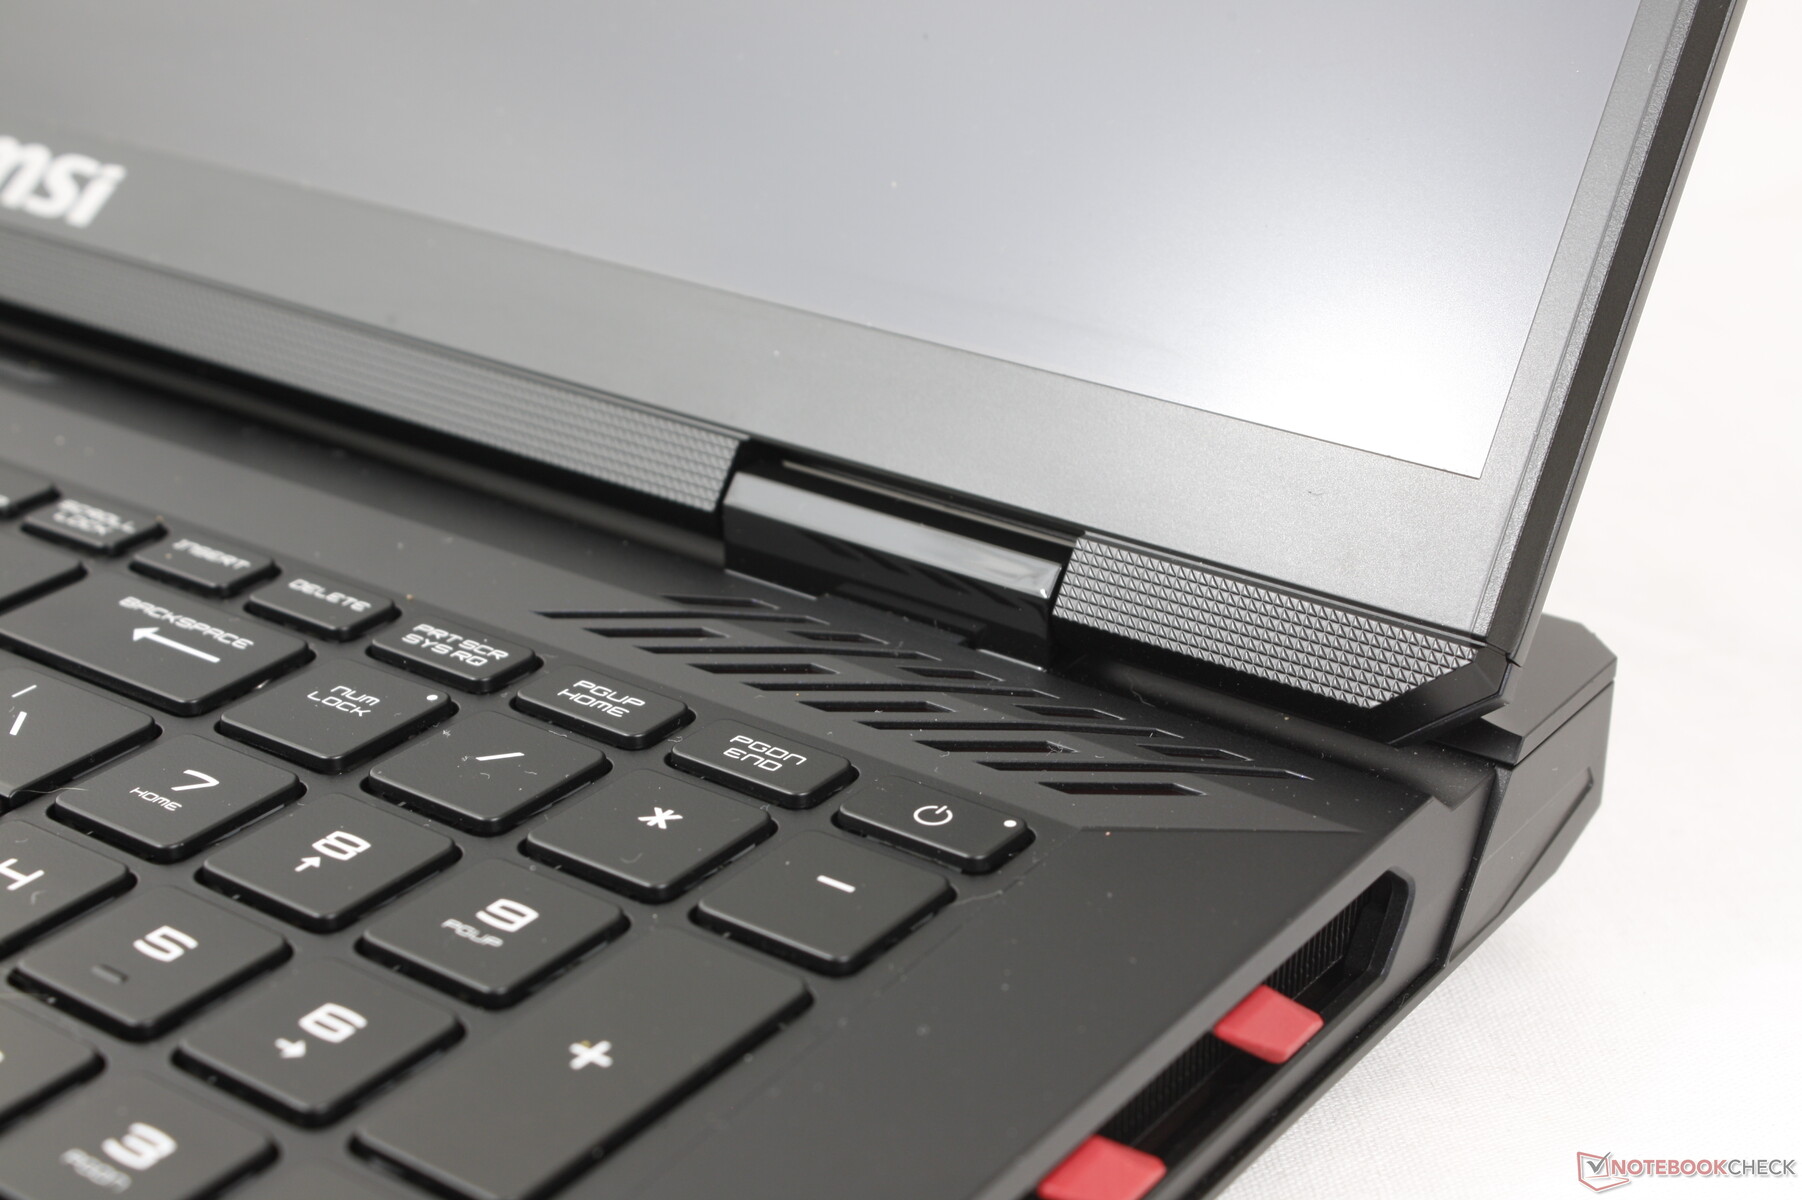
Il telaio è un derivato della Titan 18 HX. Gli accenti rossi della Titan sono invece blu sul nuovo Raider e la maggior parte delle superfici sono nere anziché grigie o argentate, per un look complessivamente più scuro. MSI ha anche aggiunto una barra LED lungo il bordo anteriore del sistema, mentre mancava sul Titan. I cambiamenti sono in gran parte estetici e quindi il Raider si sente ancora forte come il suo fratello più costoso, poiché i materiali sottostanti e lo scheletro sono gli stessi.
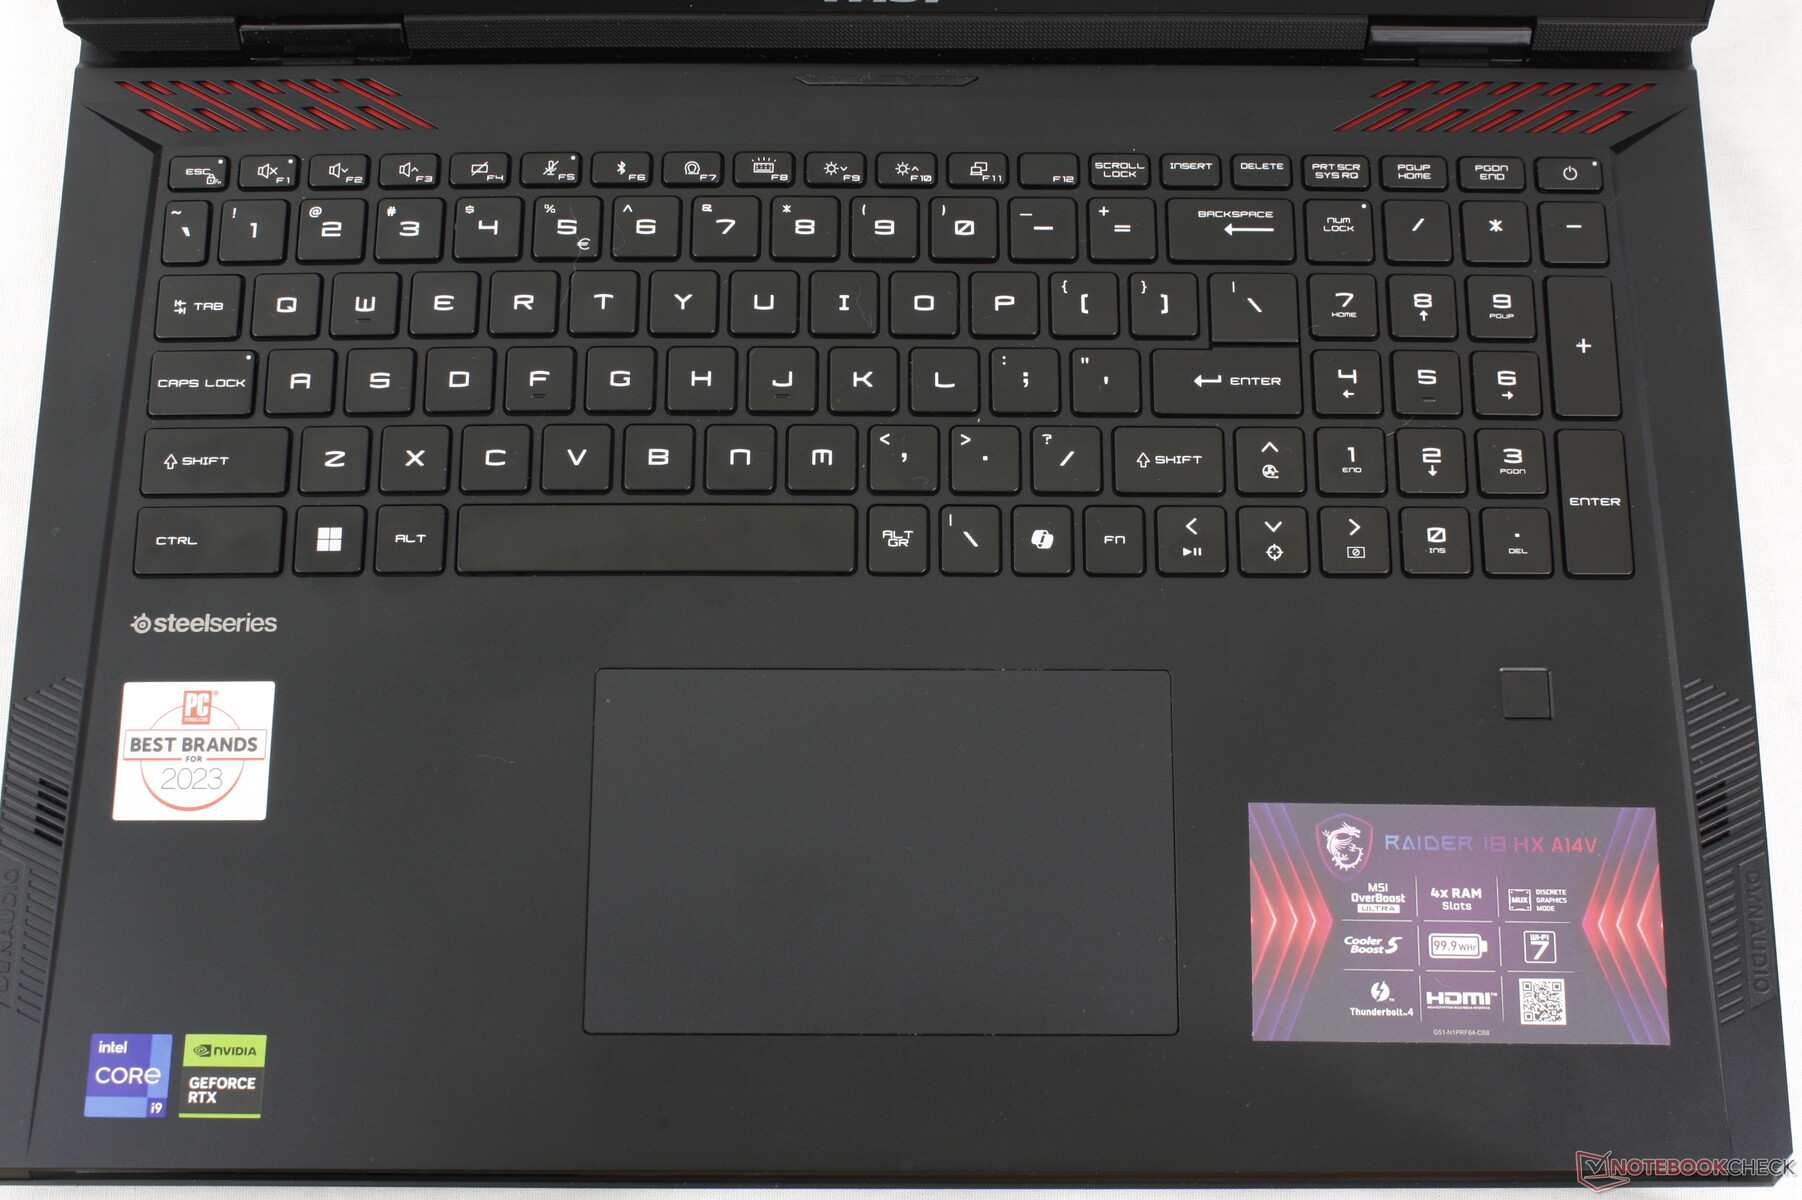
Forse la differenza visiva più notevole tra Raider 18 HX e Titan 18 HX è il piano tastiera ridisegnato. Mentre il Titan 18 HX ha un piano più piatto con un pannello di vetro che si estende sui poggiapolsi e sul clickpad, il Raider ha un approccio più tradizionale, senza vetro e con un clickpad di base.
Le dimensioni e il peso sono sostanzialmente identici a quelli della Titan 18 HX, nonostante le differenze esterne. Il modello si colloca quindi a metà del gruppo per quanto riguarda la portabilità, mentre alternative come il modello Alienware m18 R2 sono più pesanti e più grandi, mentre ROG Strix G18 o Blade 18 sono molto più leggeri.
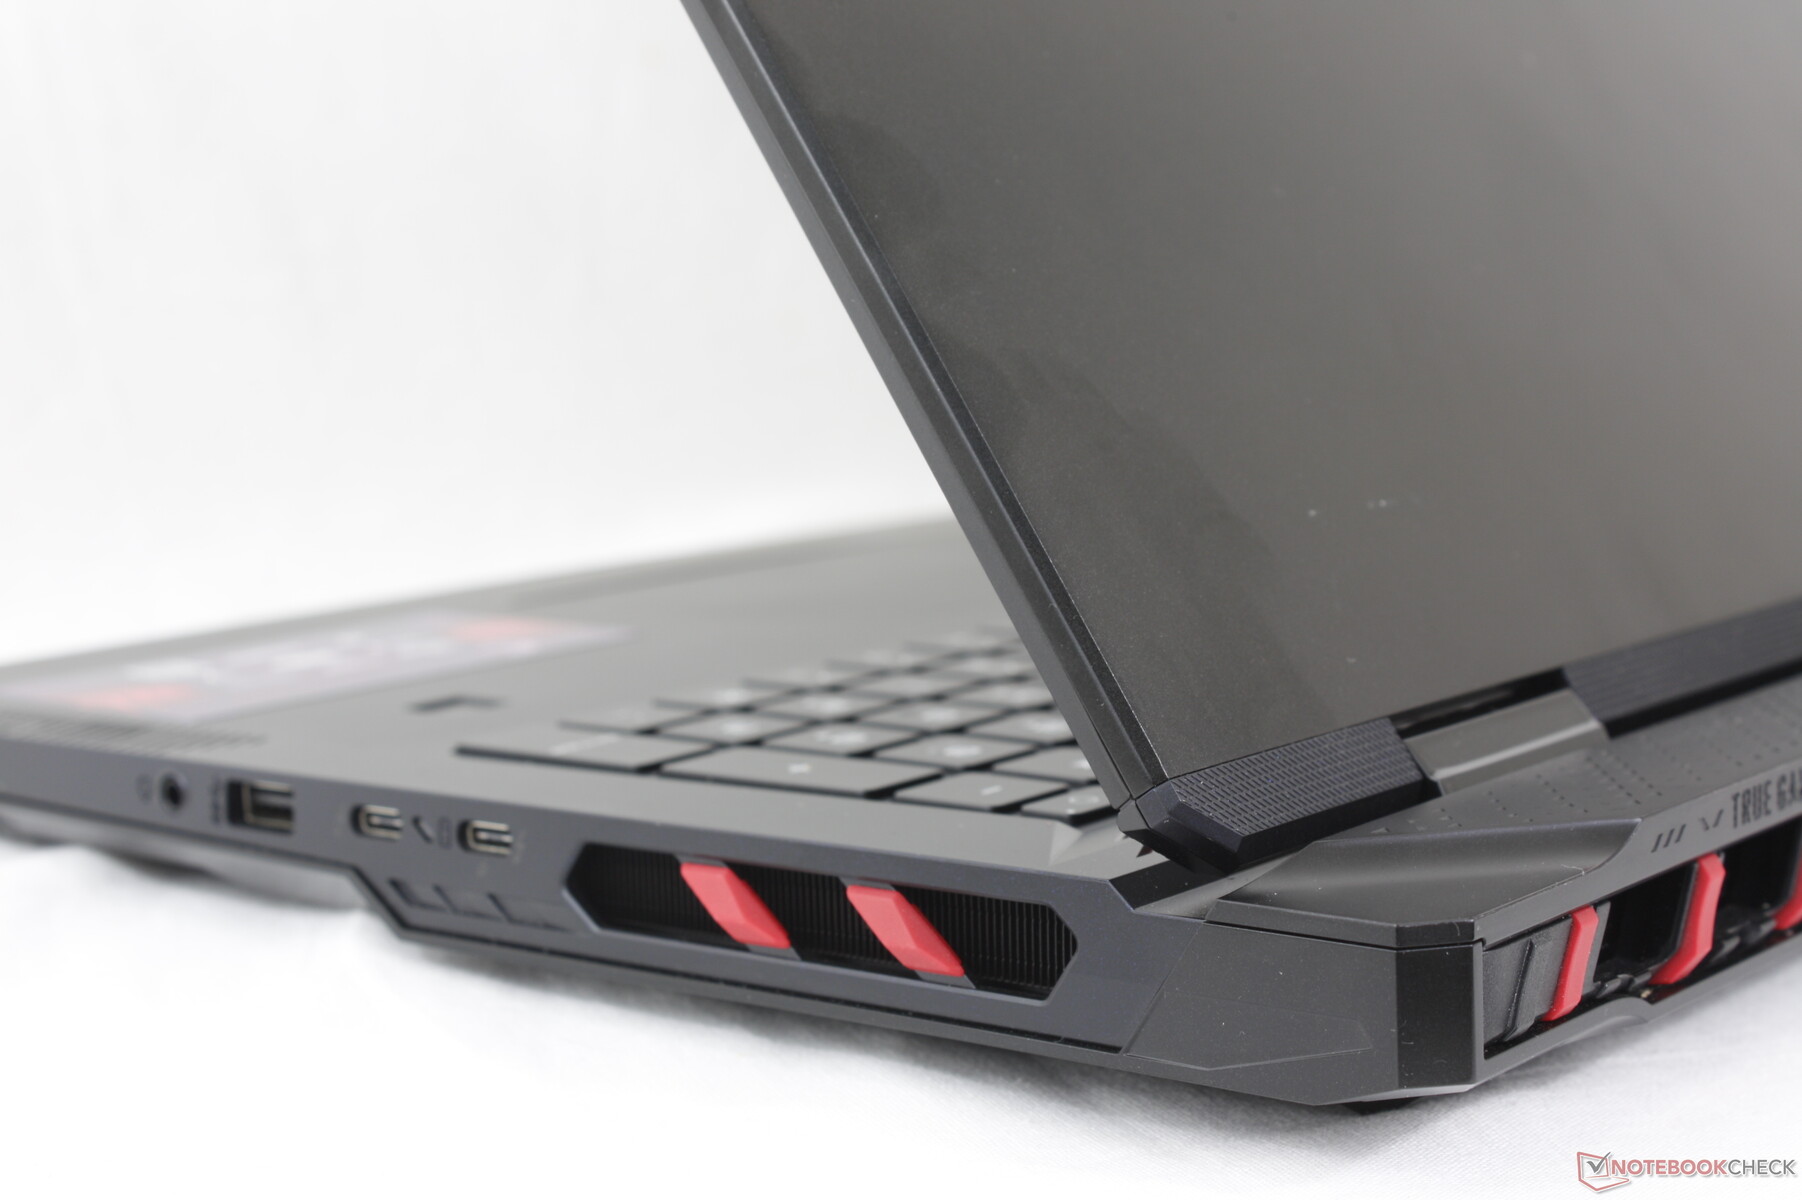
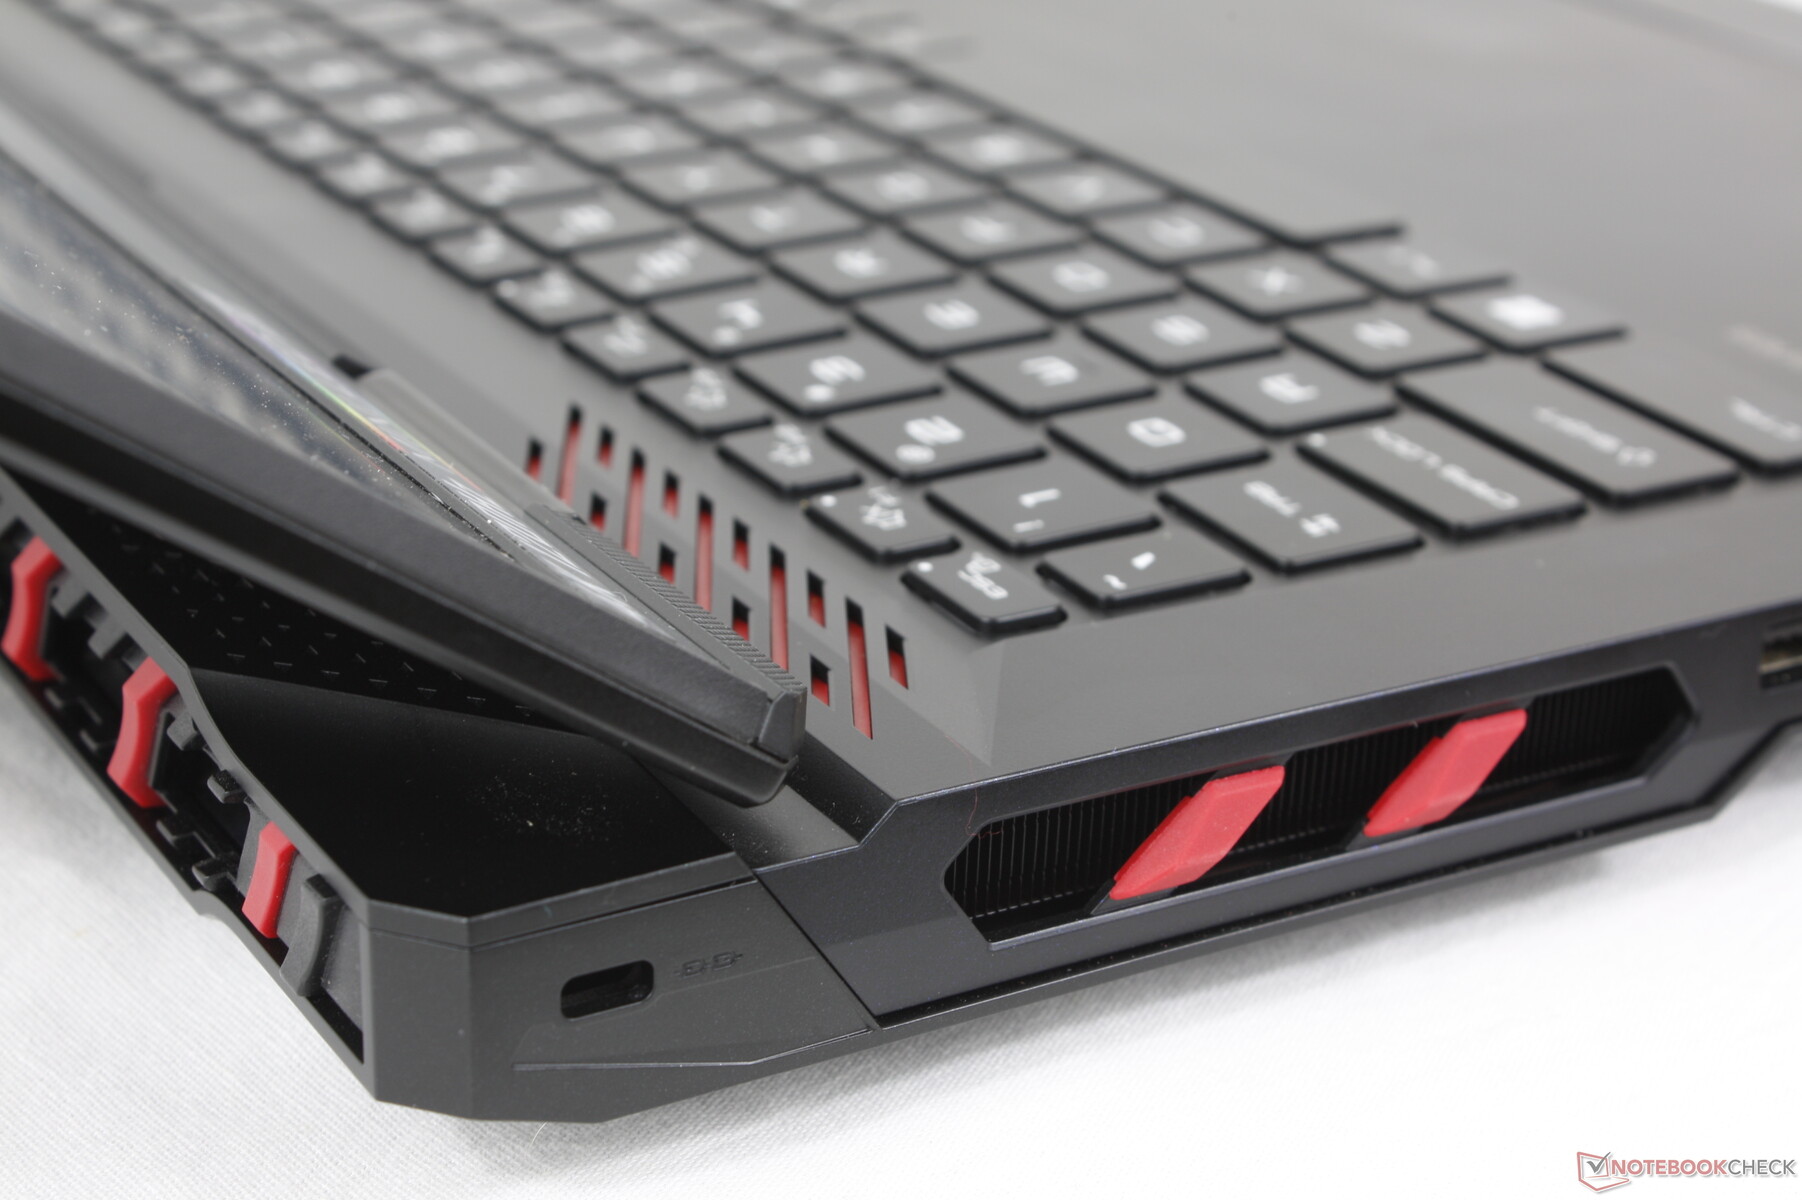
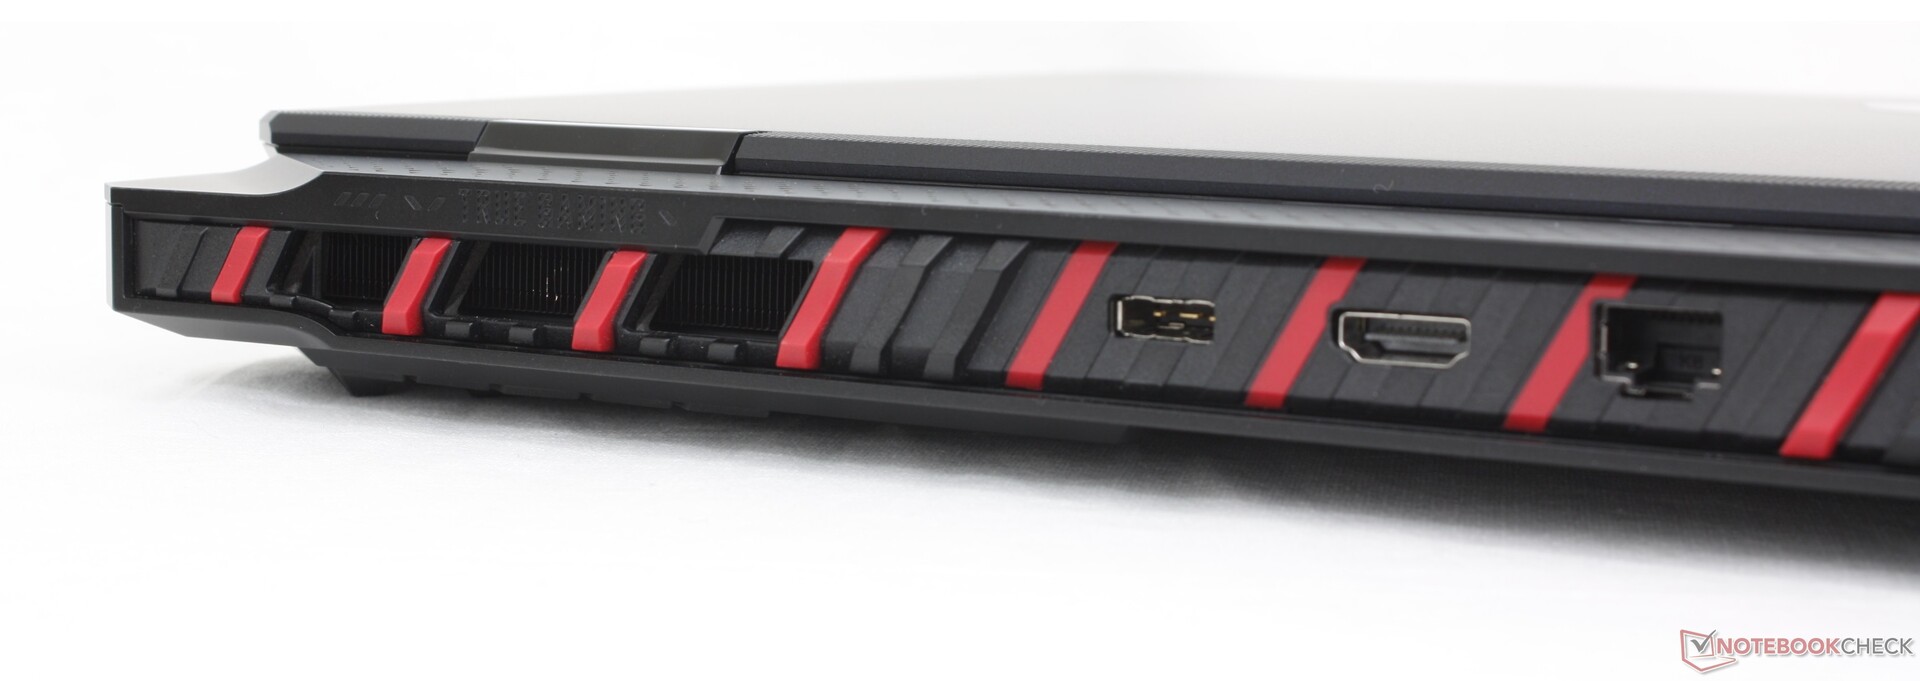
Connettività
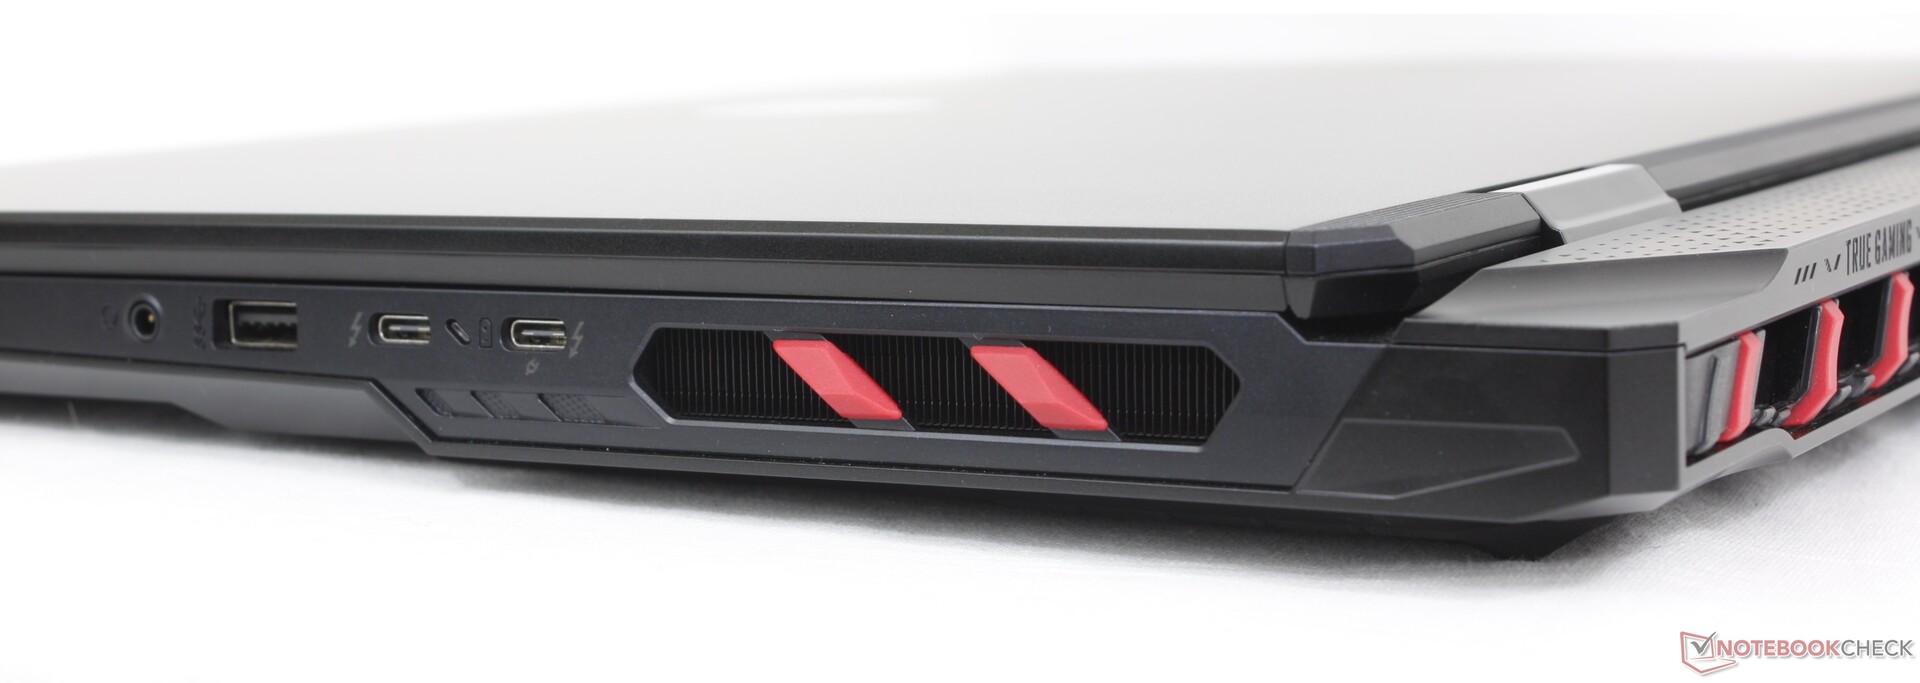
Le porte e il posizionamento sono identici a quelli della Titan 18 HX, il che è un grande indizio su cosa aspettarsi sotto il cofano. Le opzioni integrate sono paragonabili a quelle che troverà sulla Blade 18 o ROG Strix G18, anche se con disposizioni molto diverse.
Tenga presente che solo una delle due porte USB-C supporta Power Delivery. Entrambe sono altrimenti compatibili con DisplayPort.

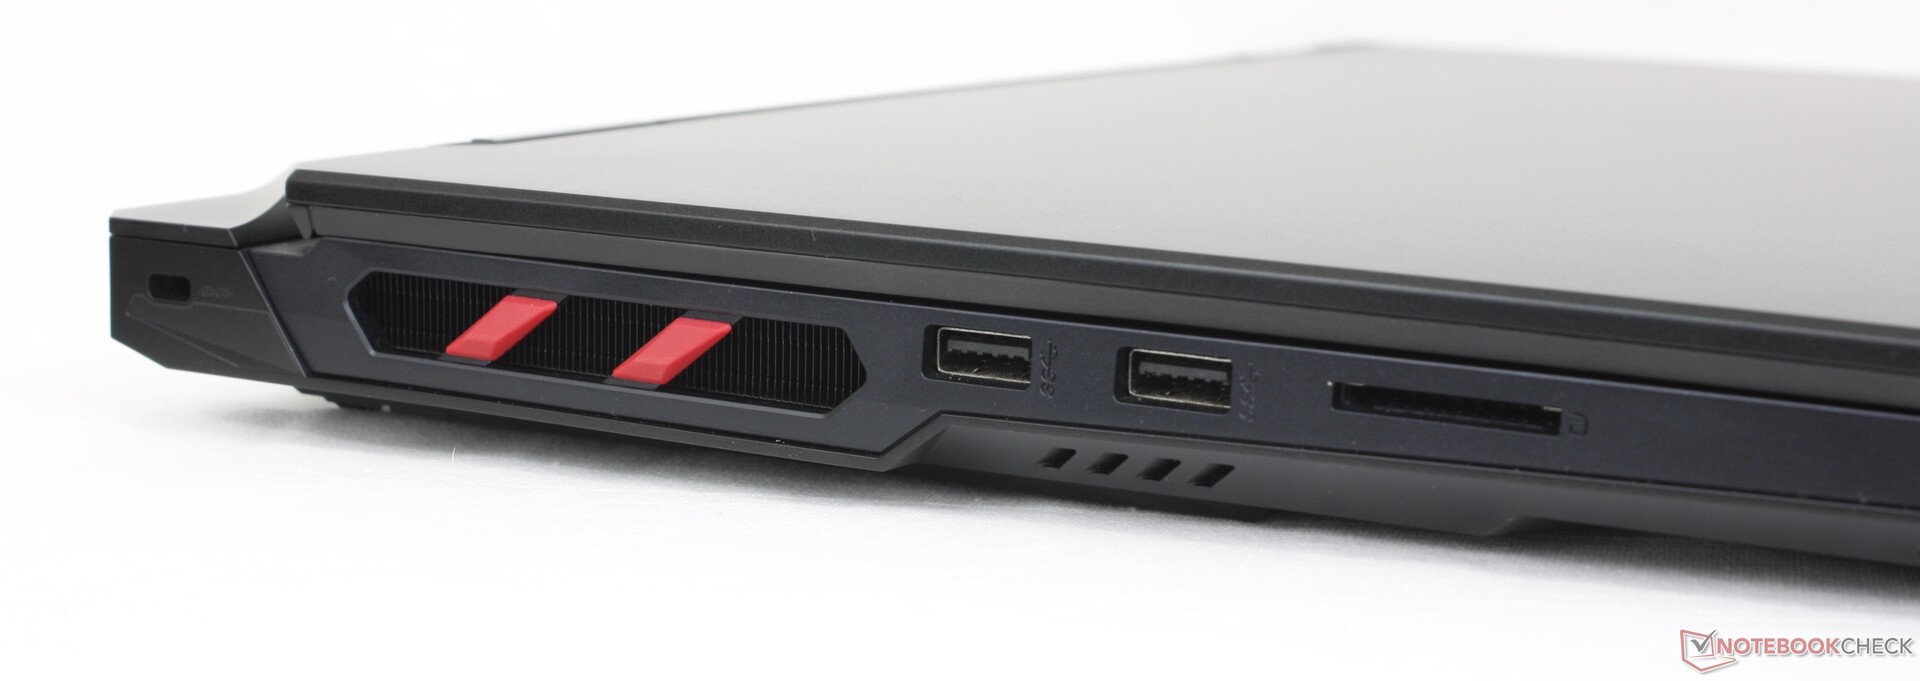
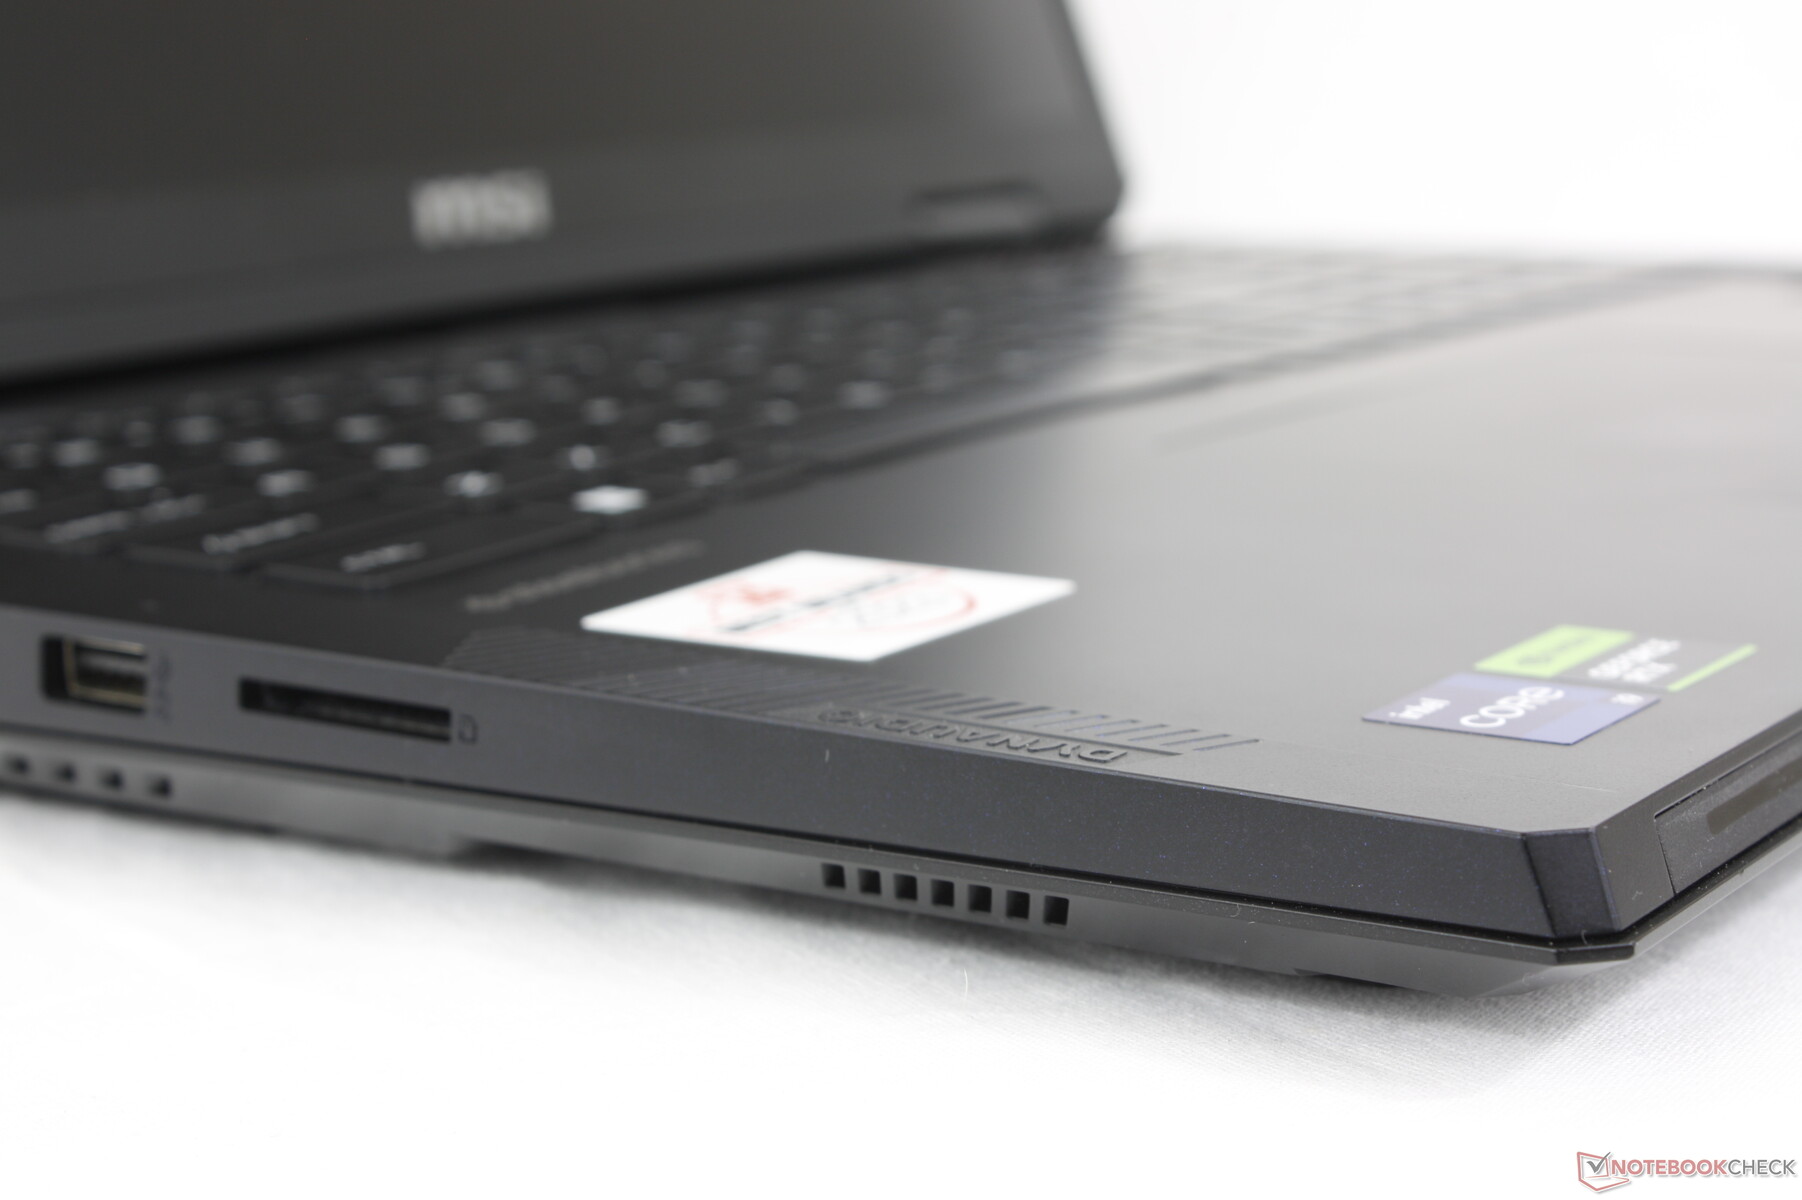
Lettore di schede SD
Con circa 90 MB/s, il lettore SD integrato è decente ma altrimenti lento rispetto al prezzo elevato di Raider 18 HX. I lettori di schede SD di Razer Blade 18 o di Alienware m18 R2, ad esempio, sono oltre due volte più veloci in confronto.
| SD Card Reader | |
| average JPG Copy Test (av. of 3 runs) | |
| Alienware m18 R2 (Toshiba Exceria Pro SDXC 64 GB UHS-II) | |
| Razer Blade 18 2024 RZ09-0509 (Toshiba Exceria Pro SDXC 64 GB UHS-II) | |
| Acer Predator Helios 18 PH18-72-98MW (AV PRO microSD 128 GB V60) | |
| MSI Raider 18 HX A14V (Toshiba Exceria Pro SDXC 64 GB UHS-II) | |
| MSI Titan 18 HX A14VIG (Toshiba Exceria Pro SDXC 64 GB UHS-II) | |
| maximum AS SSD Seq Read Test (1GB) | |
| Razer Blade 18 2024 RZ09-0509 (Toshiba Exceria Pro SDXC 64 GB UHS-II) | |
| Alienware m18 R2 (Toshiba Exceria Pro SDXC 64 GB UHS-II) | |
| MSI Titan 18 HX A14VIG (Toshiba Exceria Pro SDXC 64 GB UHS-II) | |
| MSI Raider 18 HX A14V (Toshiba Exceria Pro SDXC 64 GB UHS-II) | |
| Acer Predator Helios 18 PH18-72-98MW (AV PRO microSD 128 GB V60) | |
Comunicazione
Il Killer BE1750x è dotato di connettività Wi-Fi 7 e Bluetooth 5.4 di serie. Le velocità di trasferimento sono costanti e affidabili quando viene accoppiato al nostro router di prova Wi-Fi 6E.
Webcam
Una webcam da 2 MP con IR e otturatore fisico è di serie, proprio come sul Titan 18 HX. È interessante notare che anche la fotocamera presenta problemi di luminosità simili.


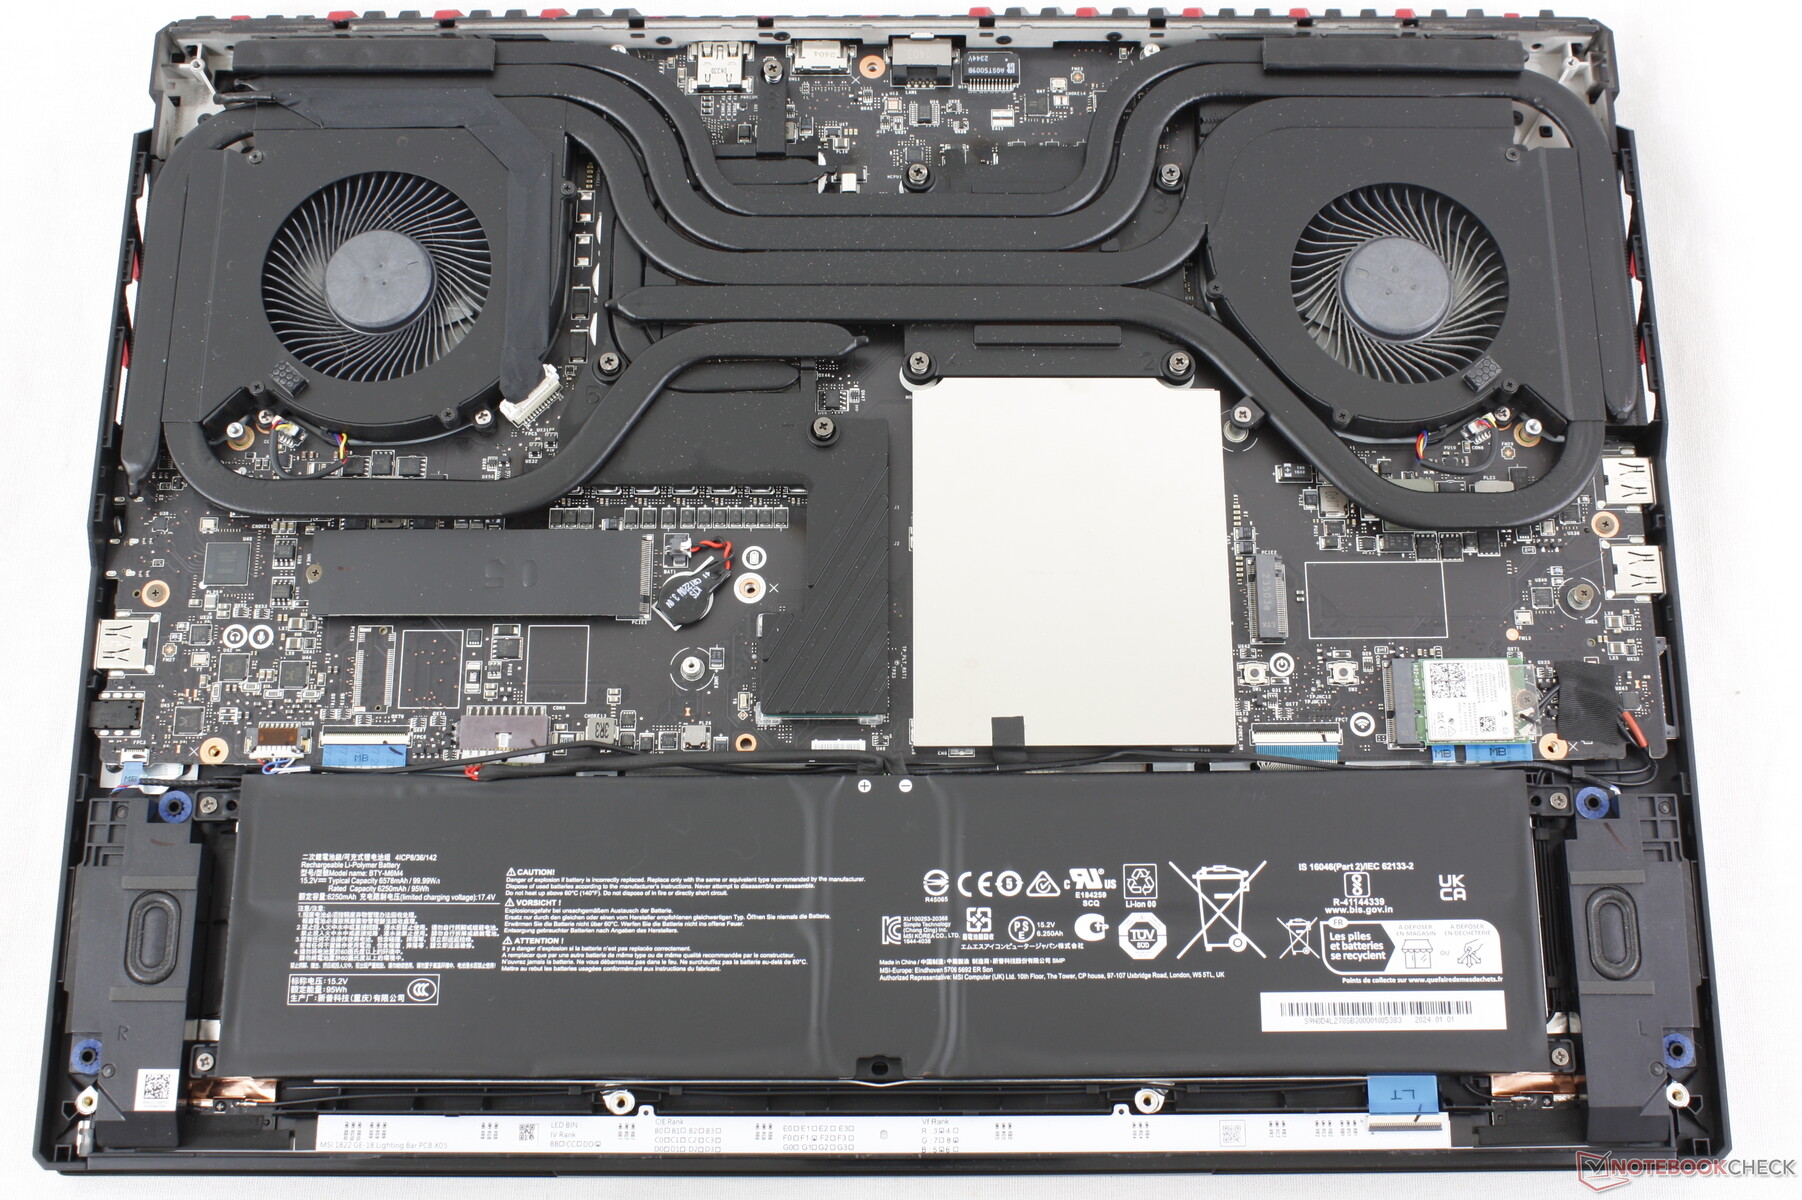
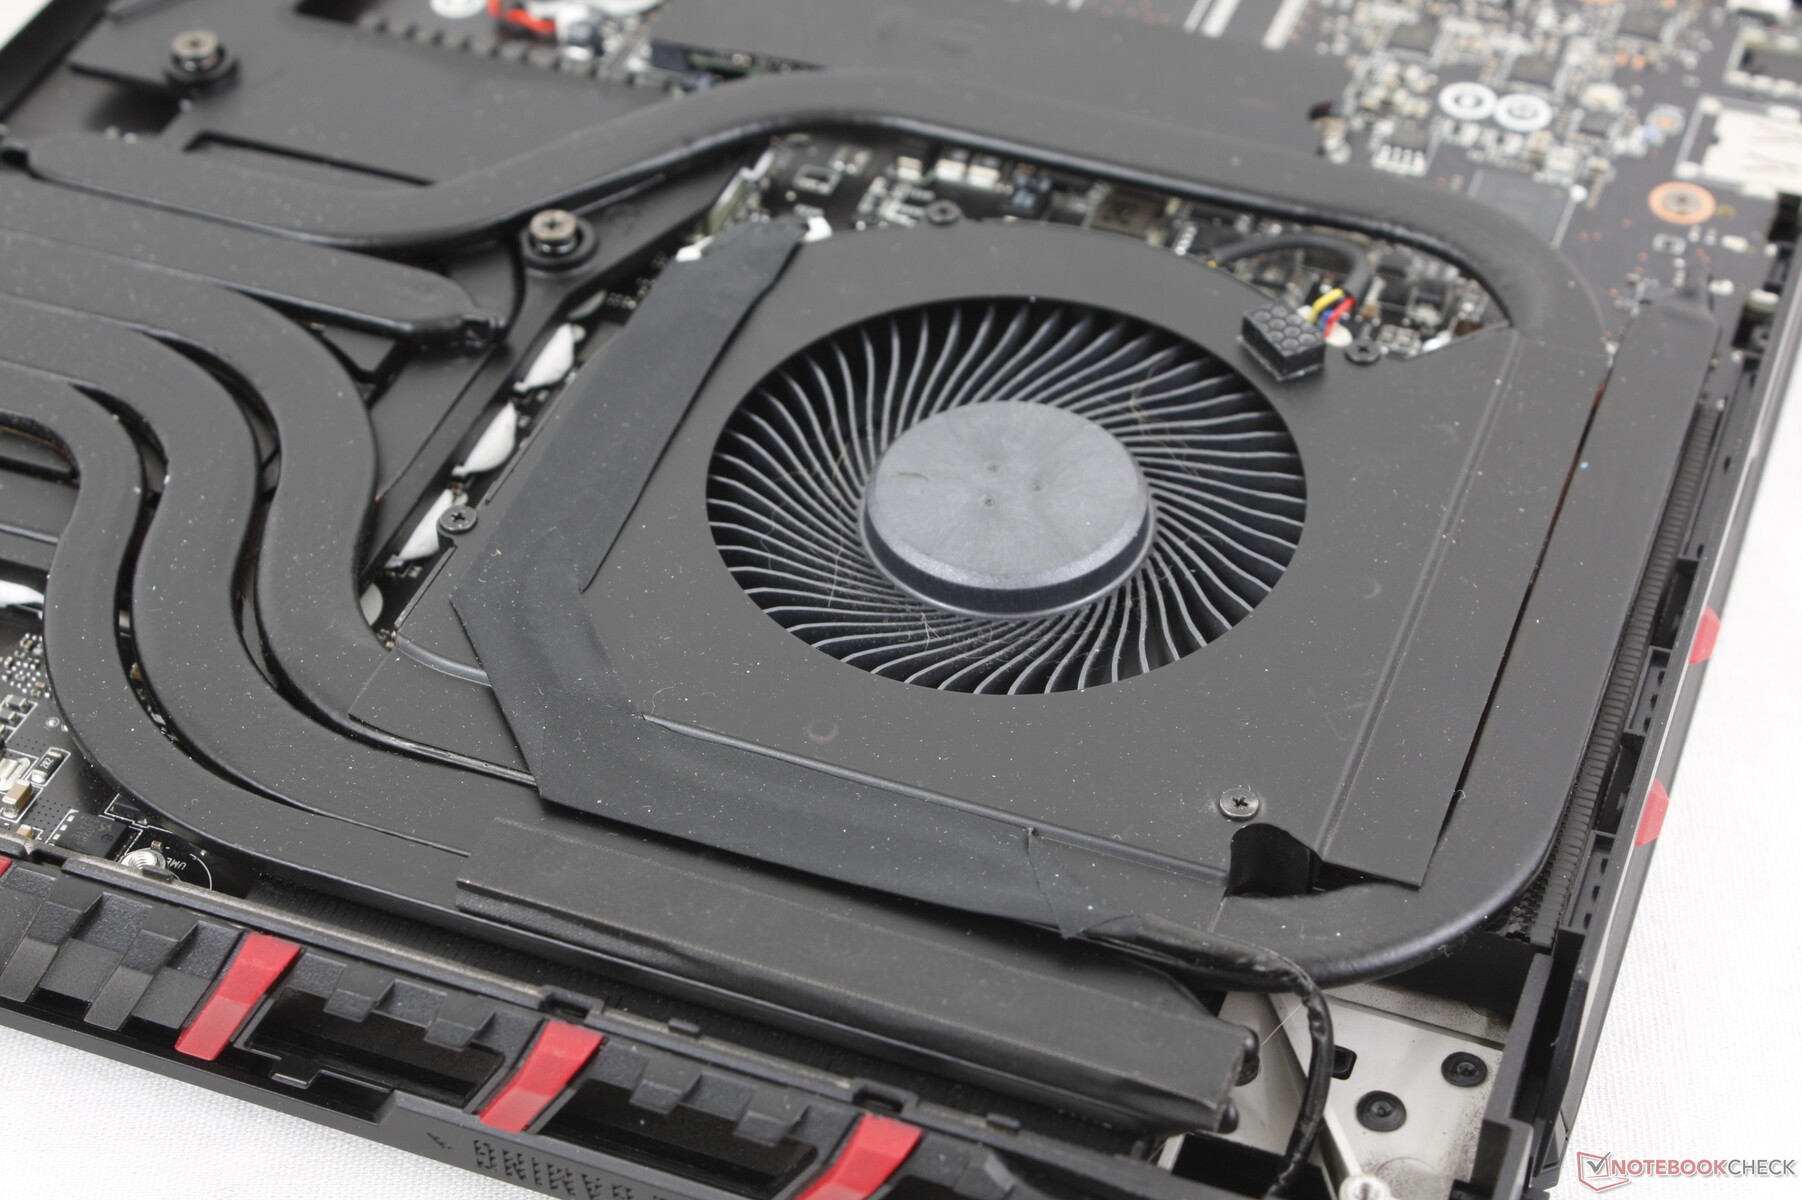
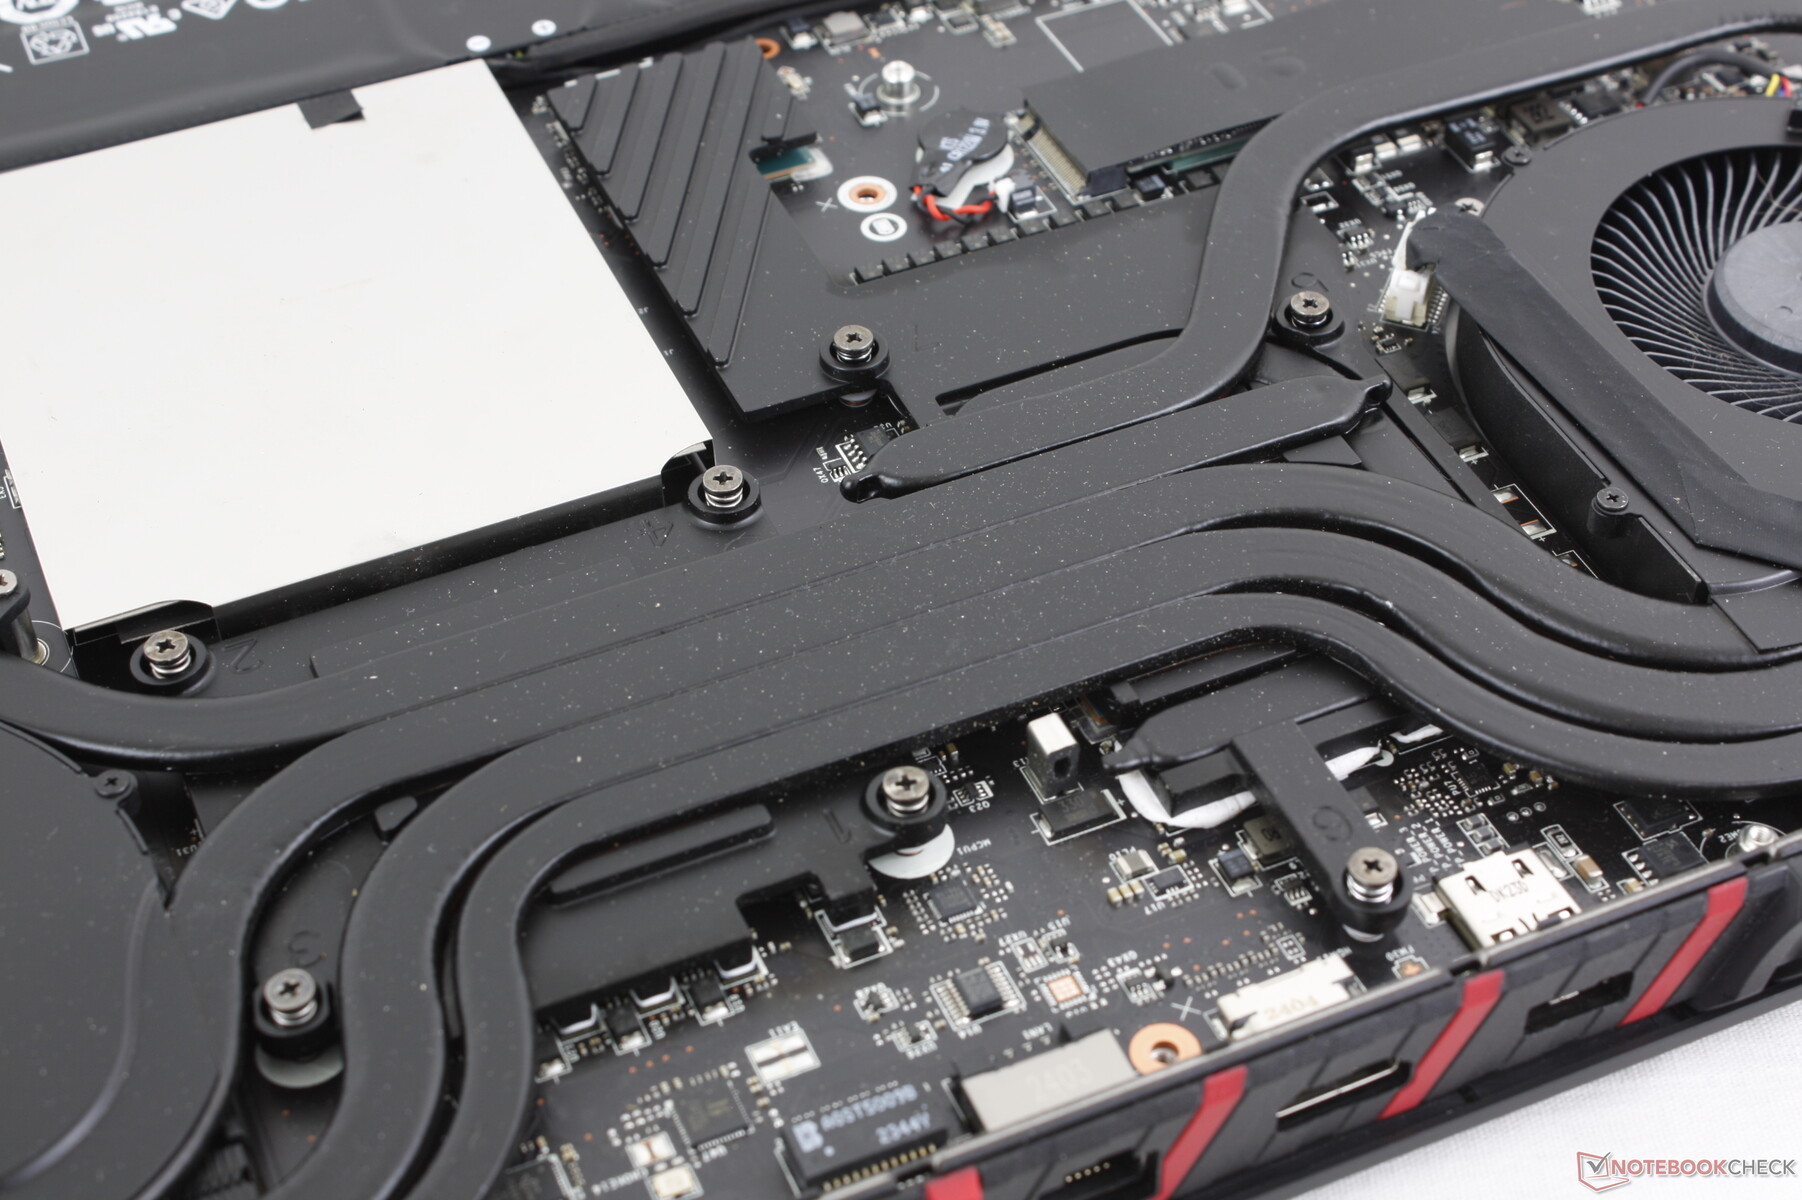
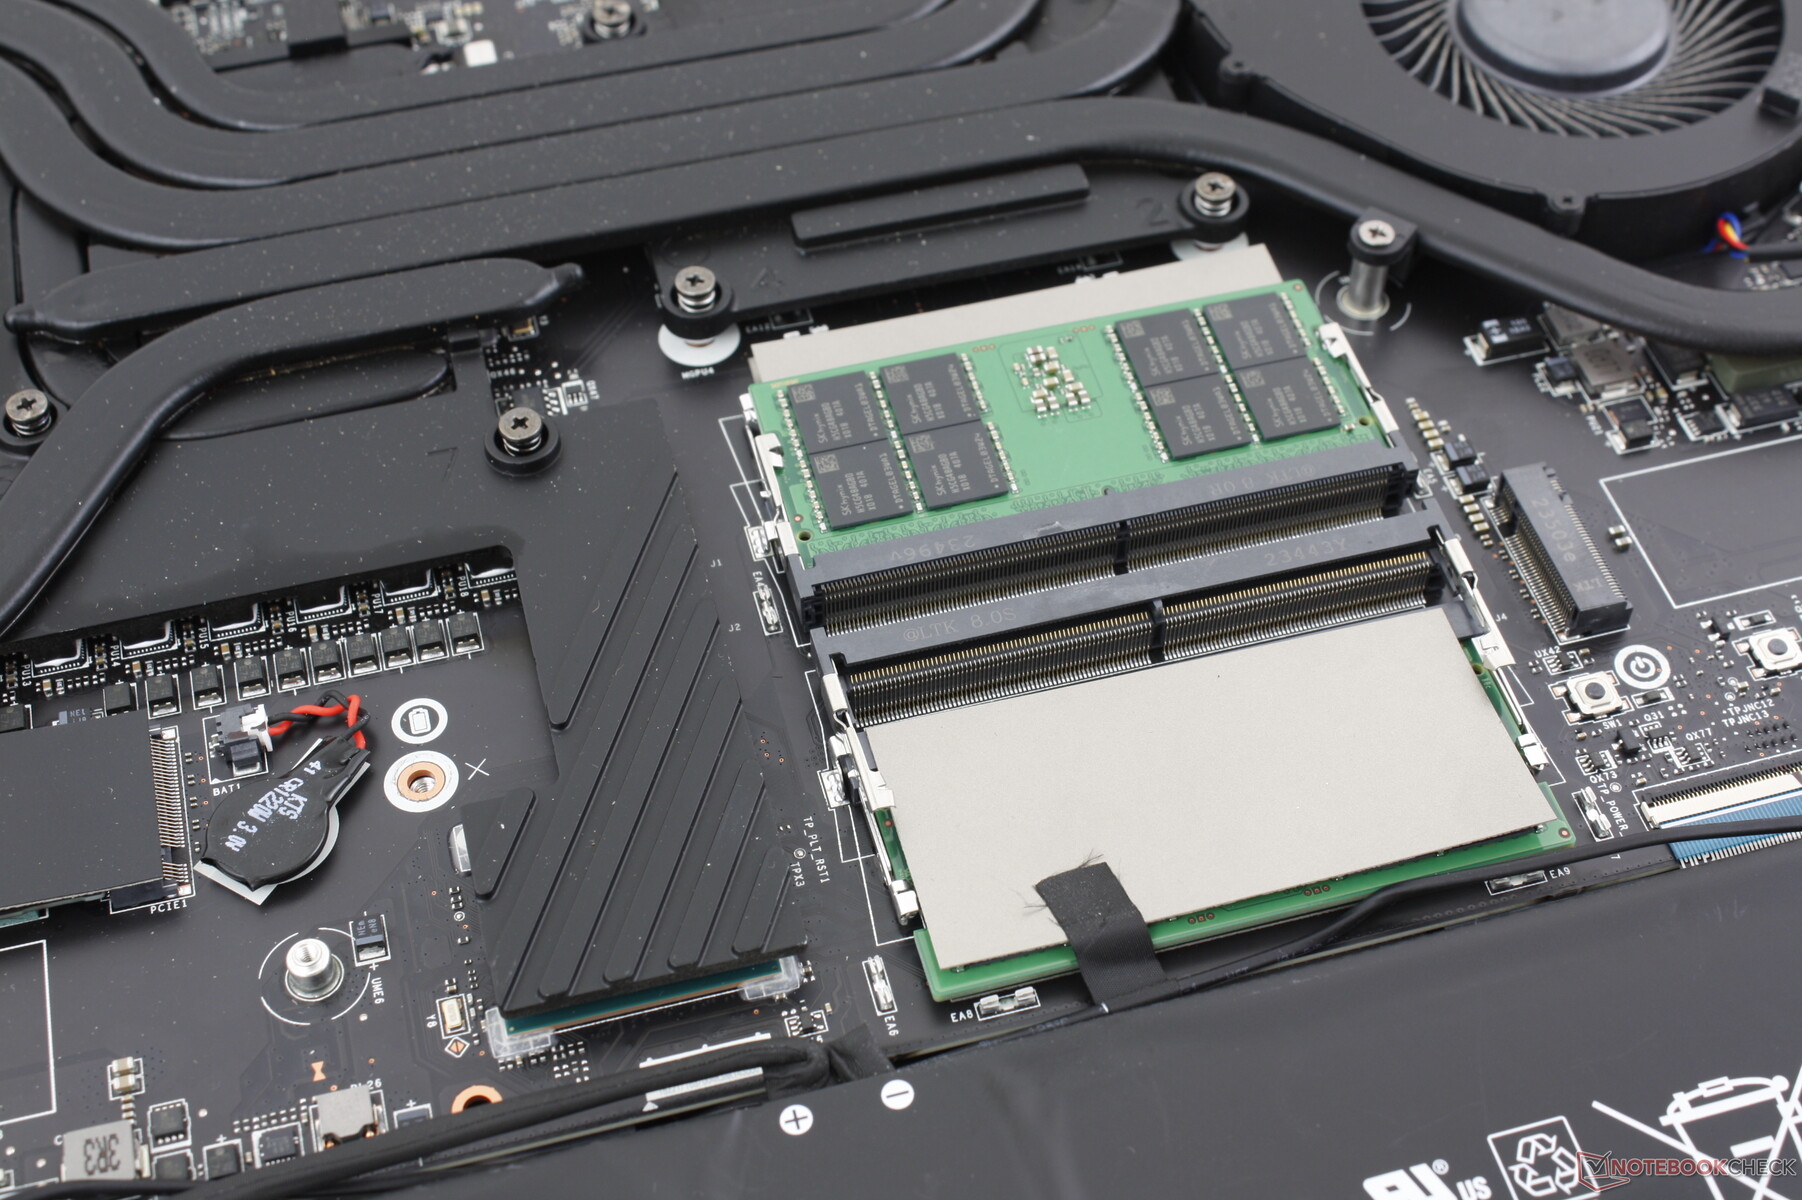
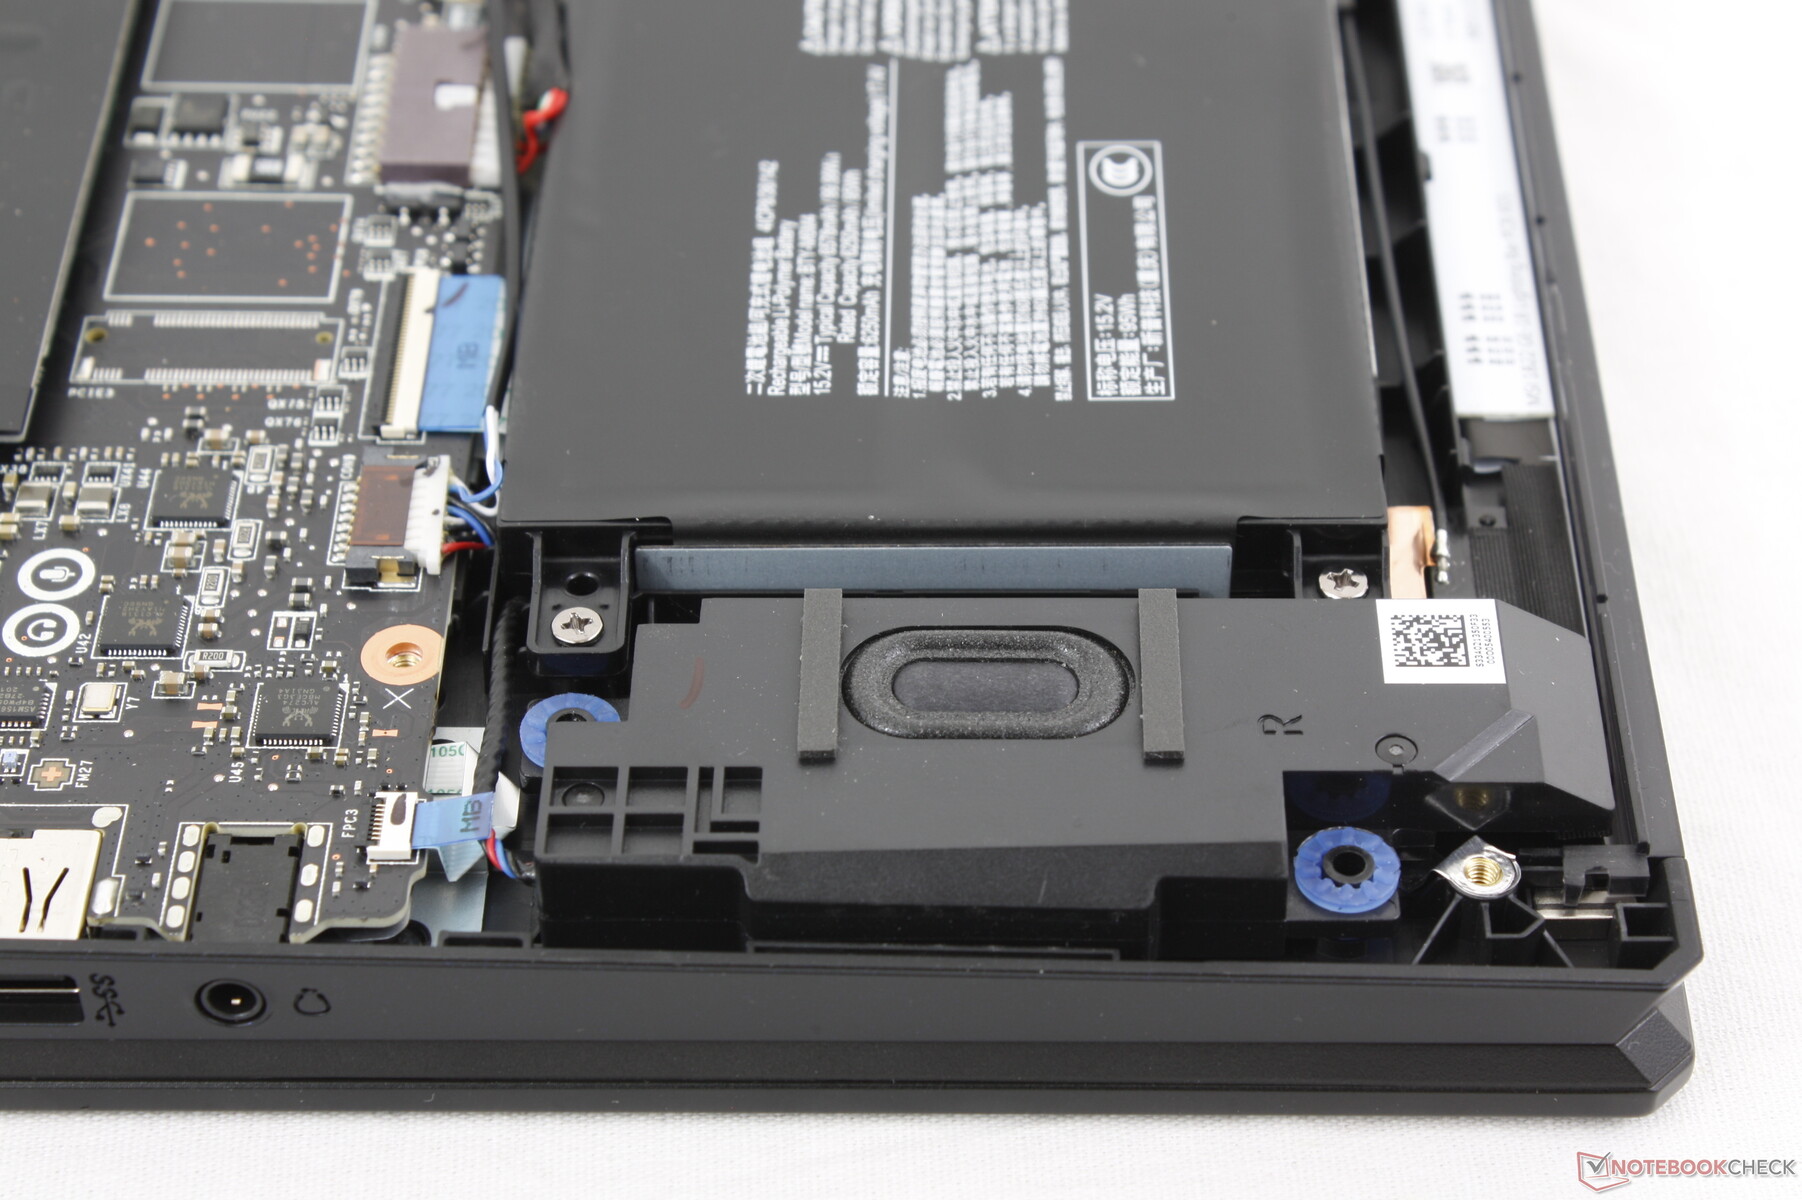
Manutenzione
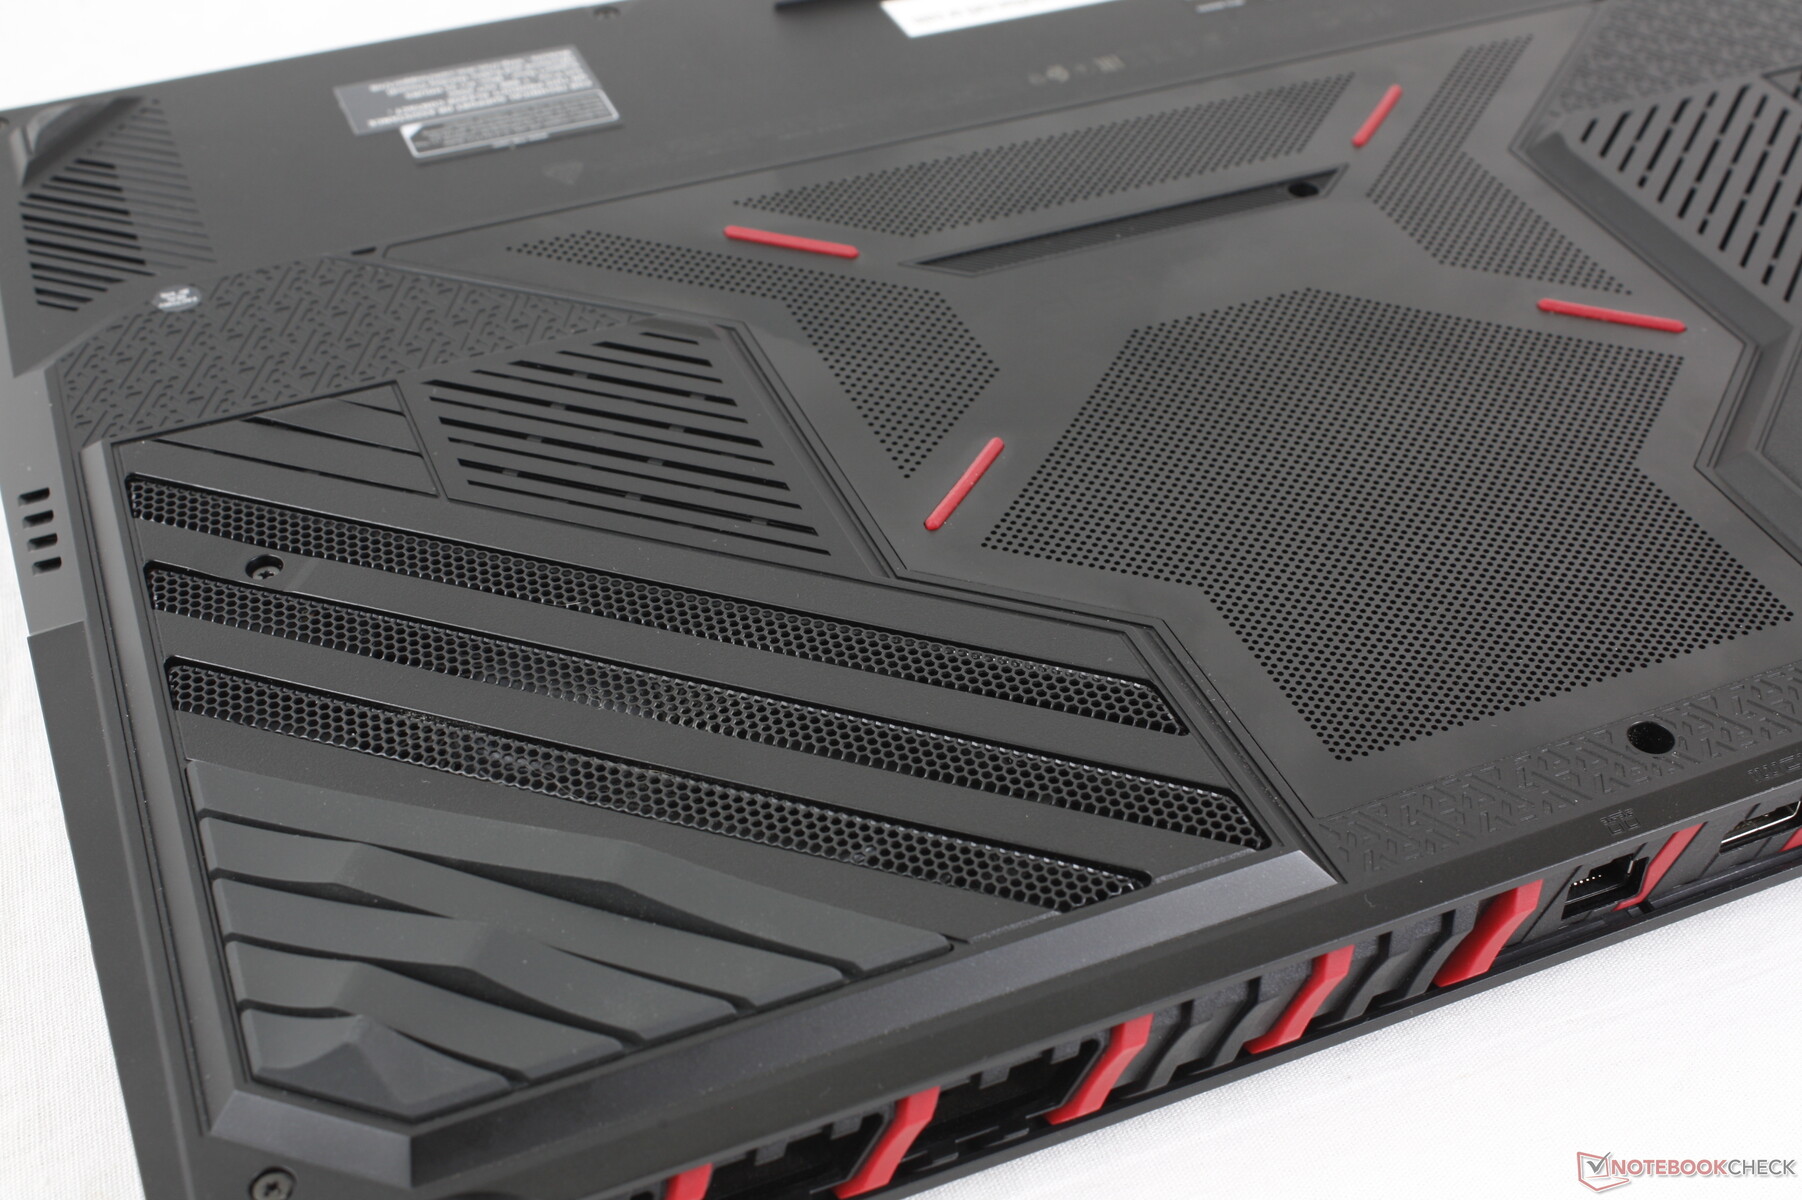
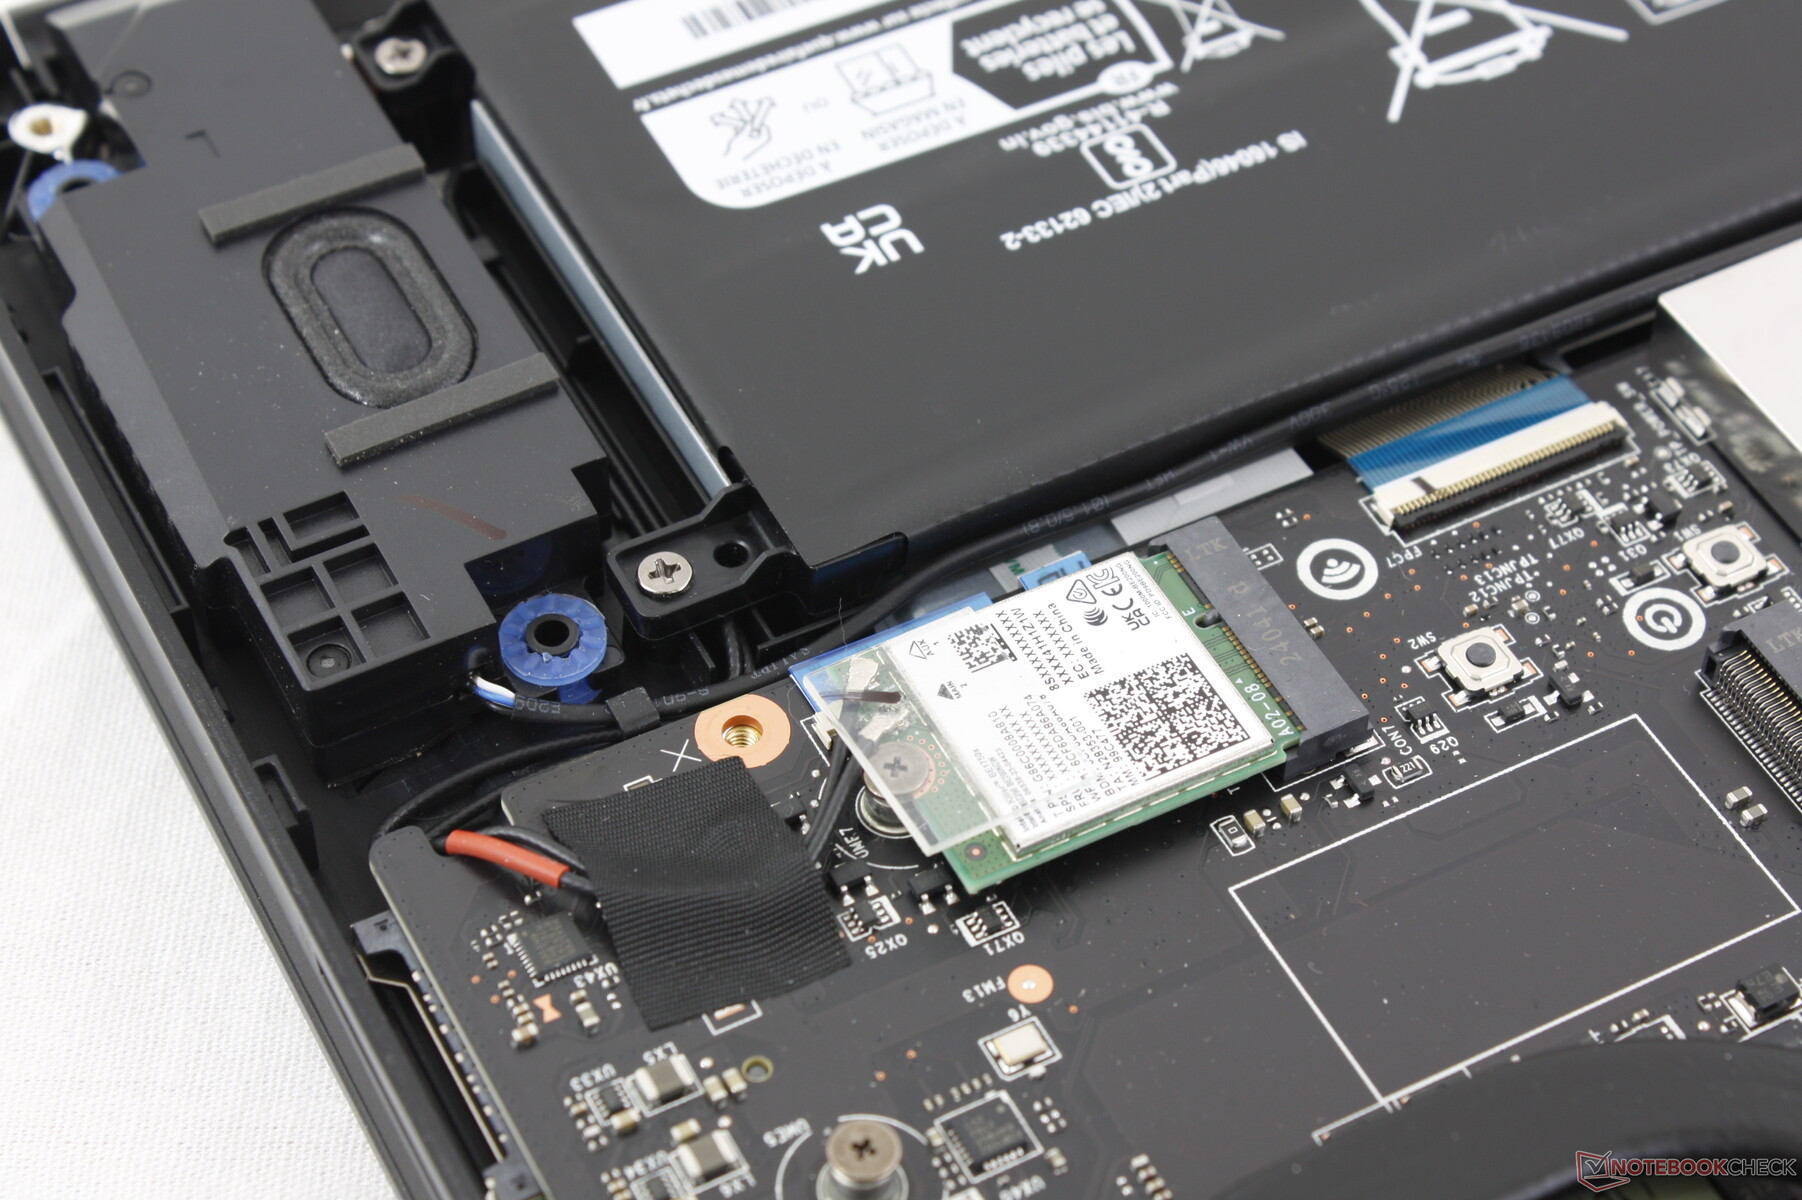
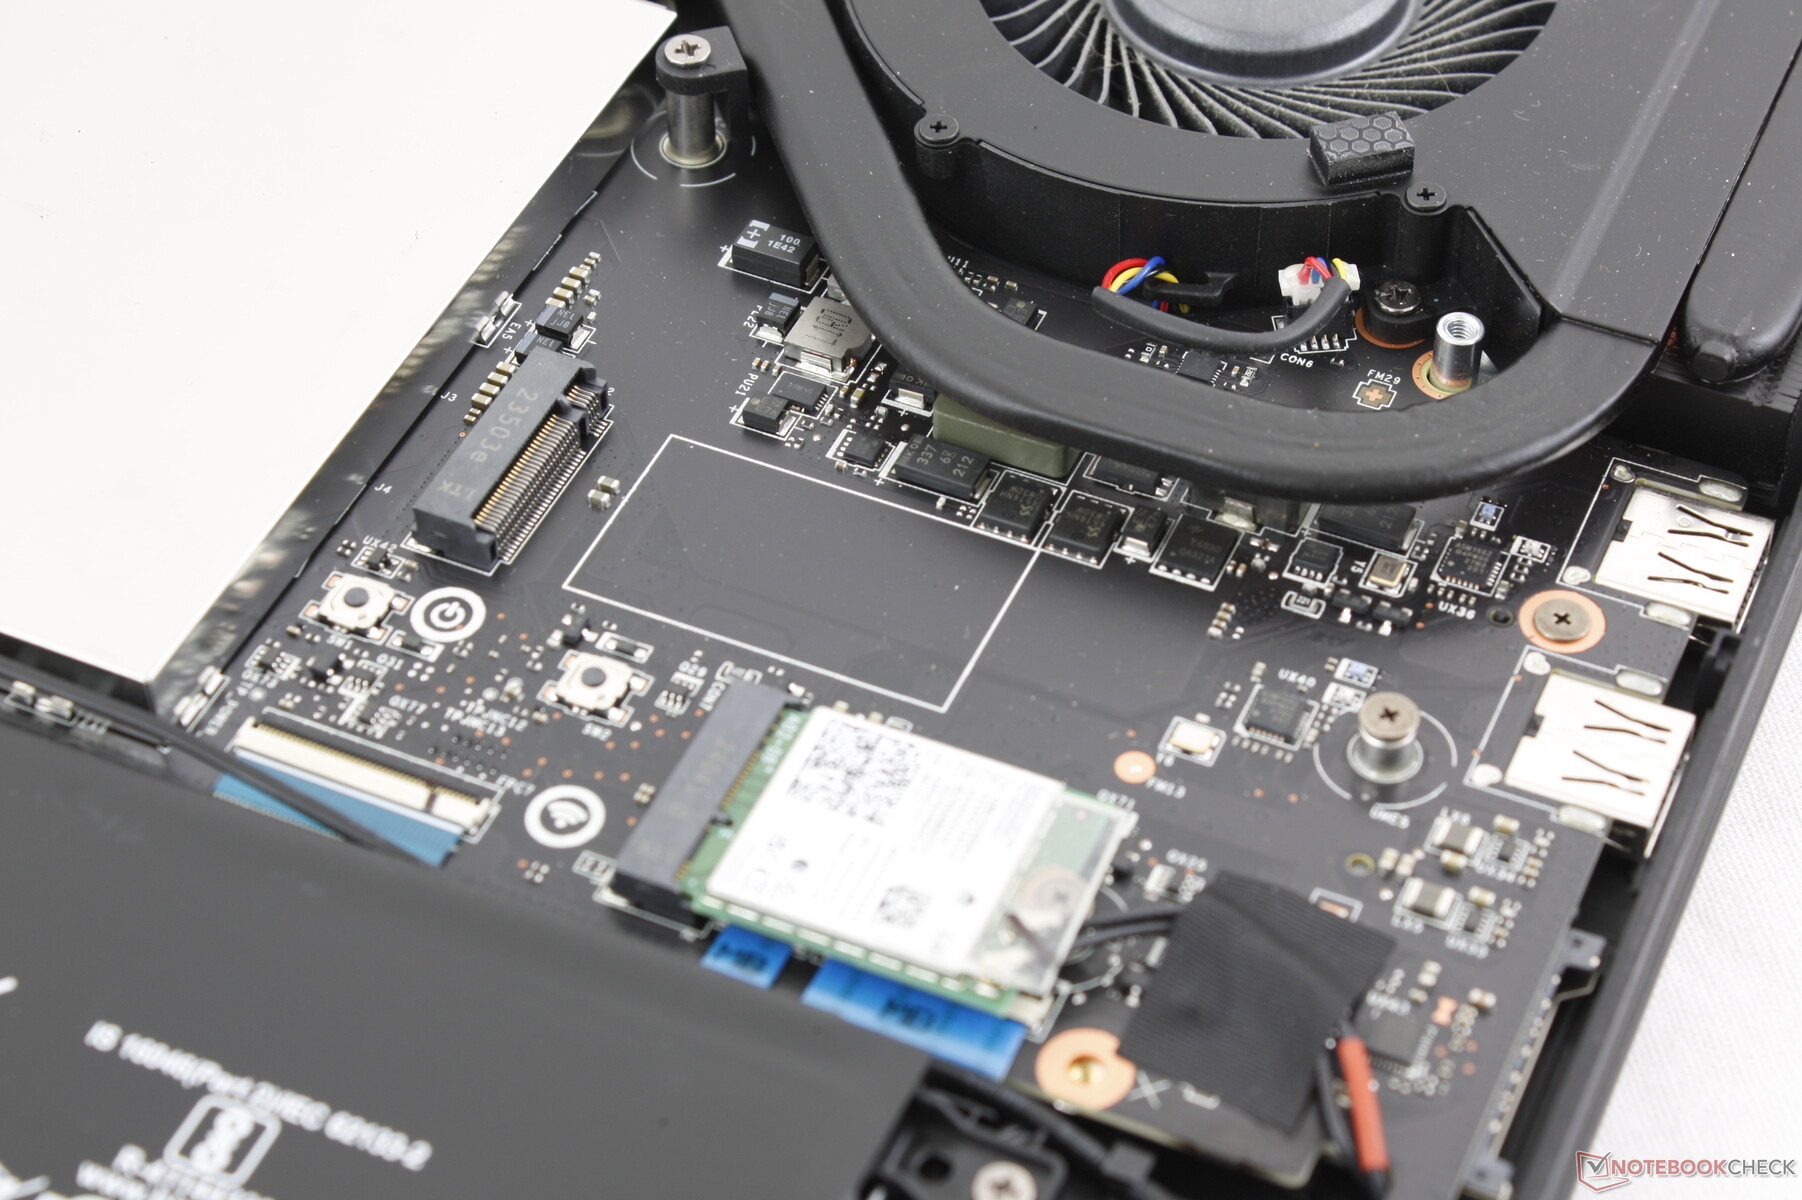
Il pannello inferiore è fissato da 12 viti Phillips per una rimozione relativamente facile. Tuttavia, MSI continua ad essere uno dei pochi produttori con un adesivo anti-manomissione che copre una delle viti, che deve essere rotta anche per semplici aggiornamenti come la RAM o lo storage.
Il Raider 18 HX condivide molti degli stessi componenti interni del Titan 18 HX. Gli utenti hanno accesso a due slot per SSD M.2 2280 e a quattro slot per SODIMM DDR5. Si noti che il terzo slot SSD M.2 è stato rimosso da questo modello; gli utenti devono passare al Titan 18 HX per ottenere questa funzione.

Sostenibilità
La confezione è completamente riciclabile e quasi tutta in cartone, con solo un po' di involucro di plastica per il manuale d'uso. Tuttavia, non ci sono informazioni sui materiali riciclati utilizzati durante la produzione del sistema.
Accessori e garanzia
Nella confezione non ci sono altri extra oltre all'adattatore CA e alla documentazione cartacea. I modelli Raider più vecchi venivano spediti con un panno di velluto per la pulizia, ma sembra che questo non sia più il caso.
Se acquistato negli Stati Uniti, si applica la consueta garanzia limitata di un anno del produttore.
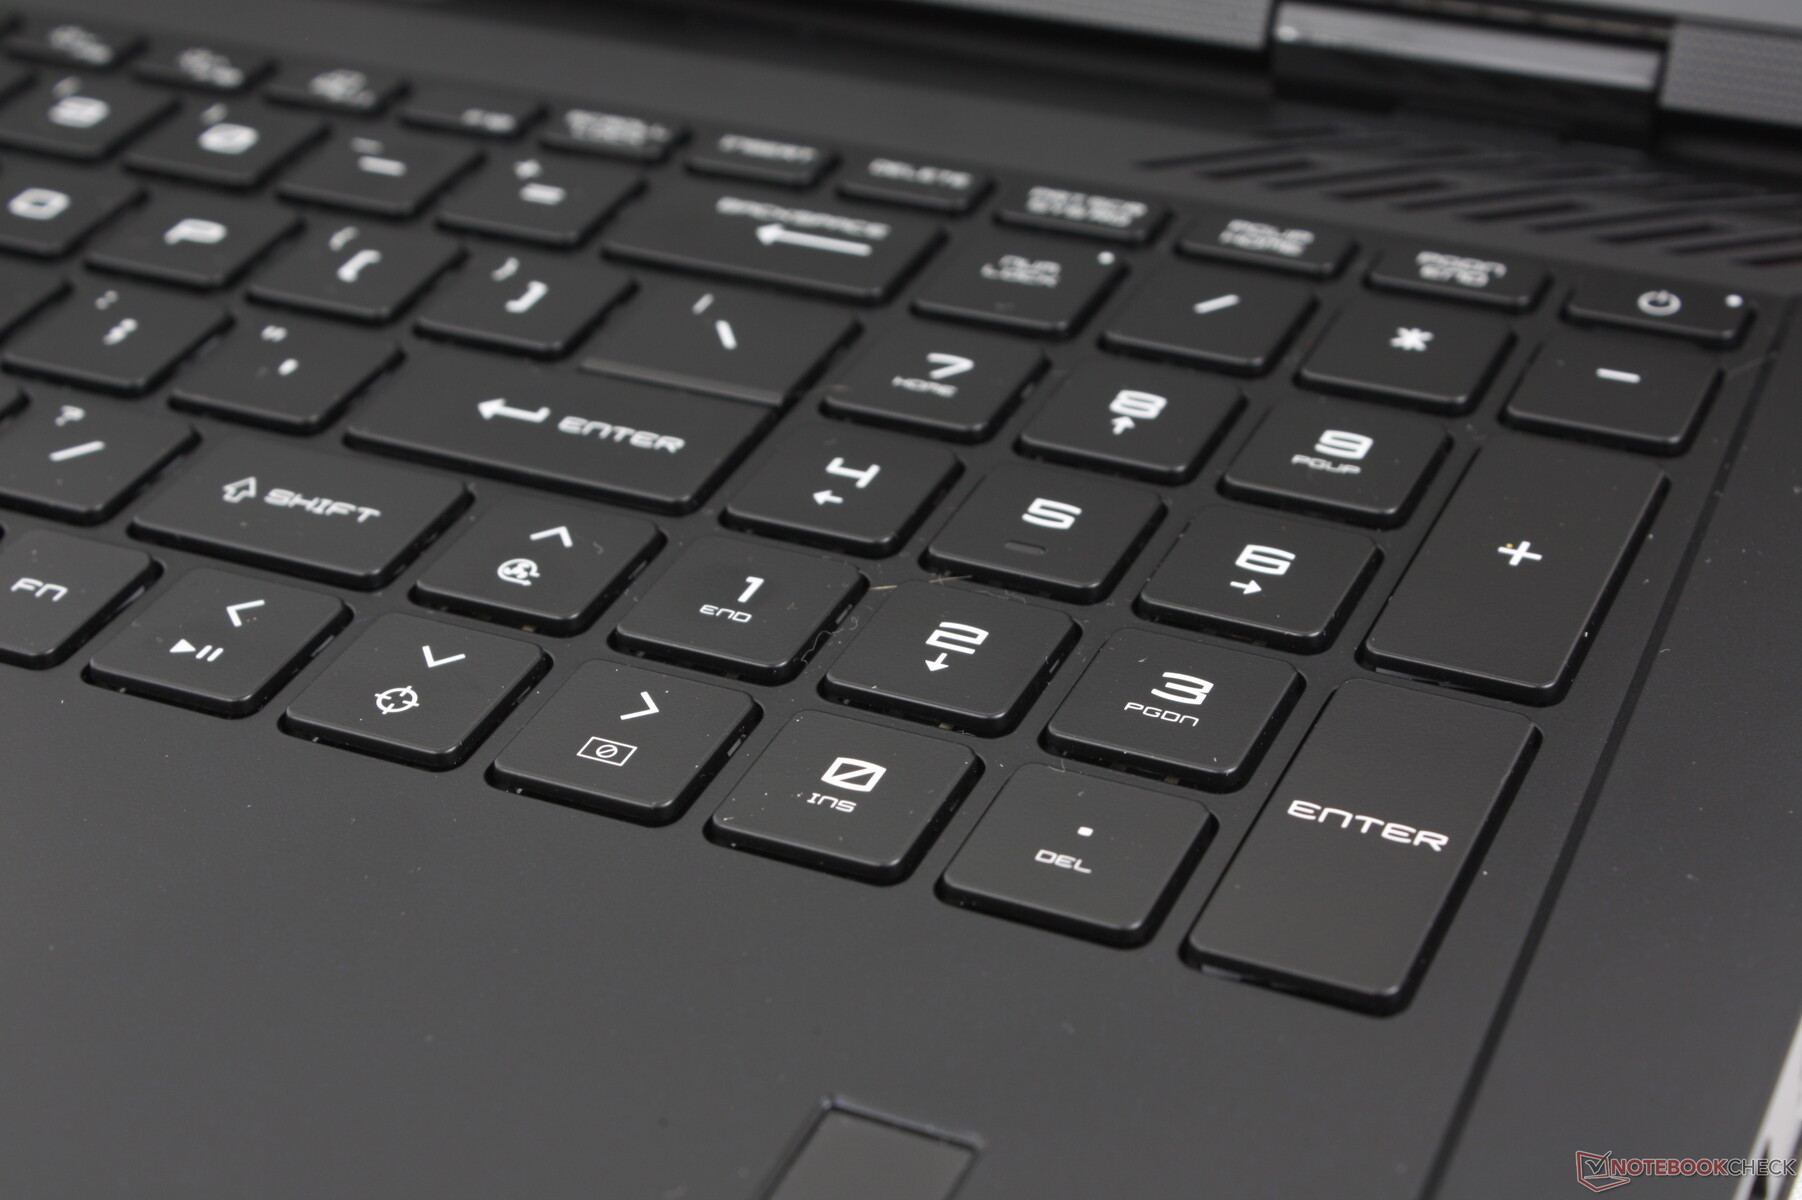
Dispositivi di input: più familiari che fantasiosi
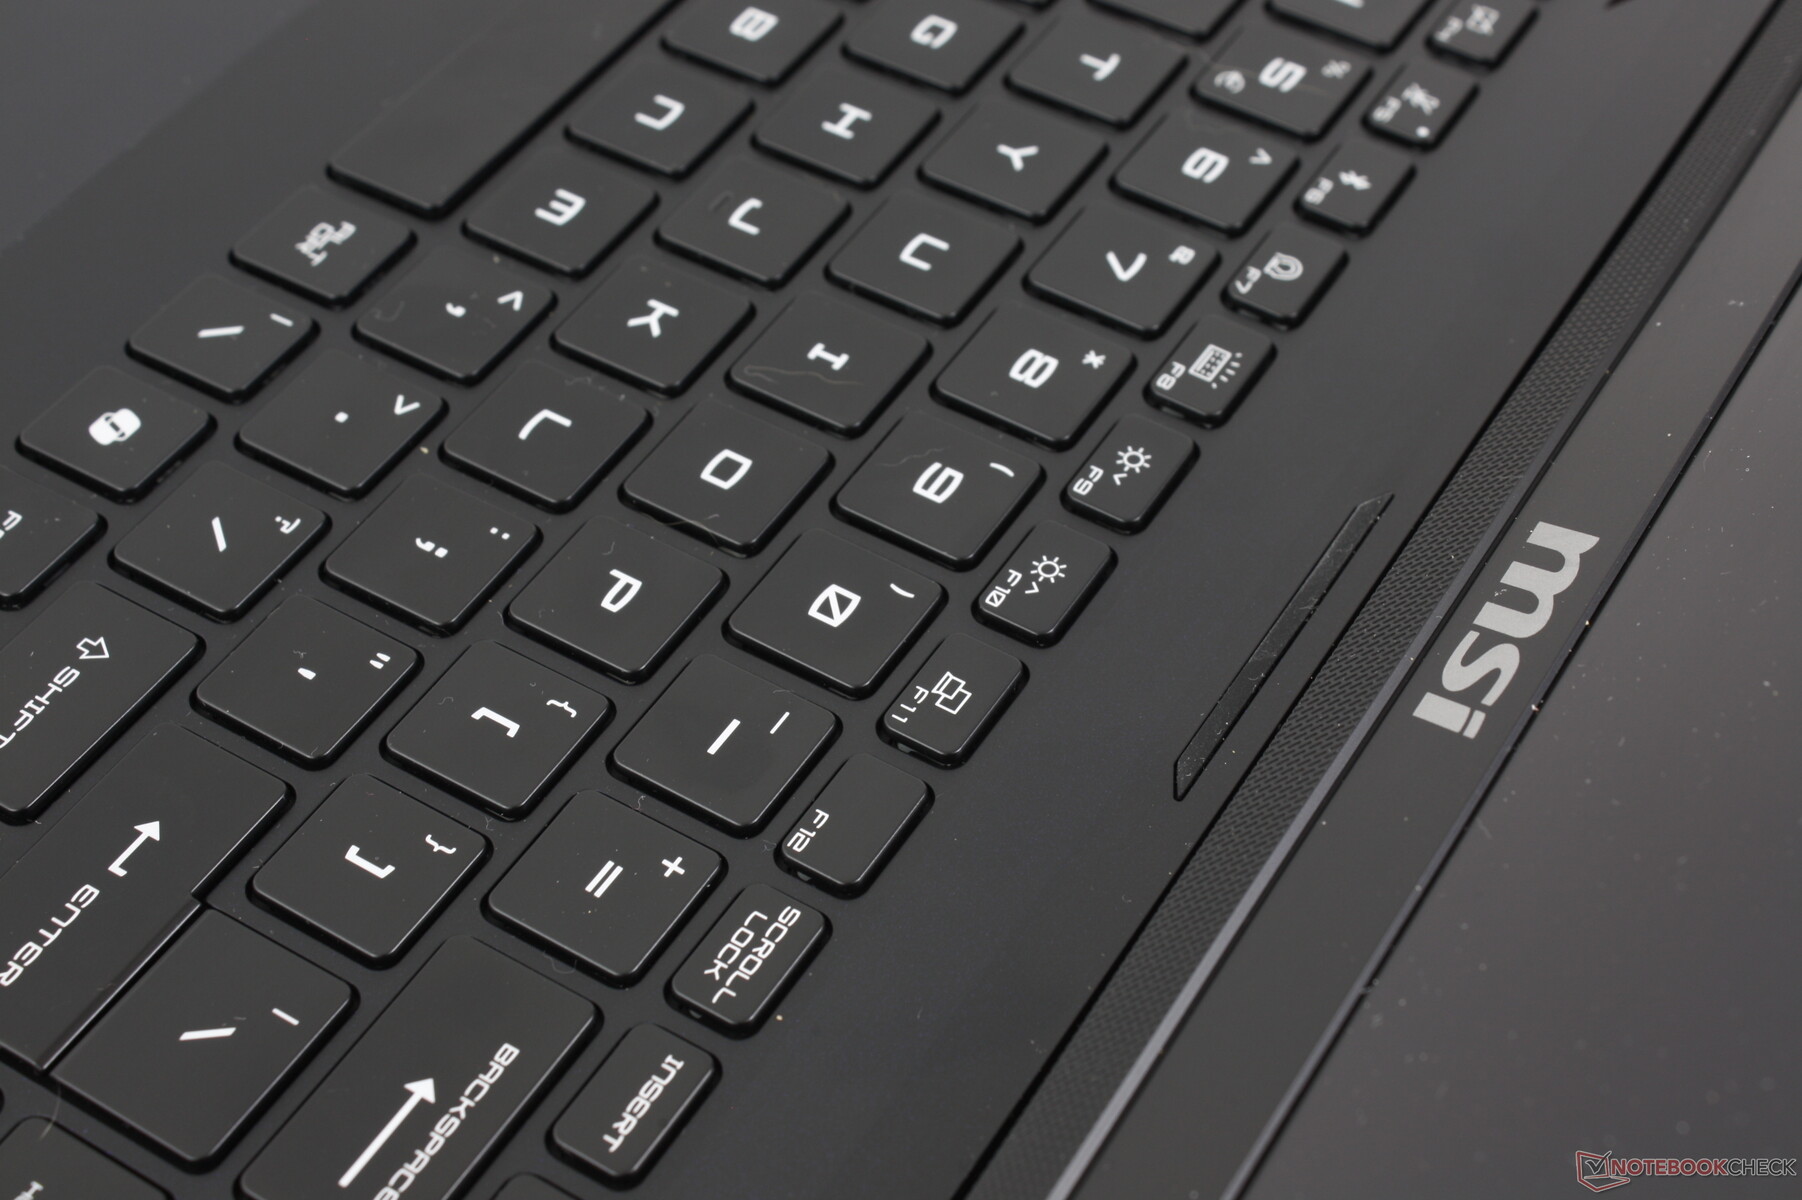
Tastiera
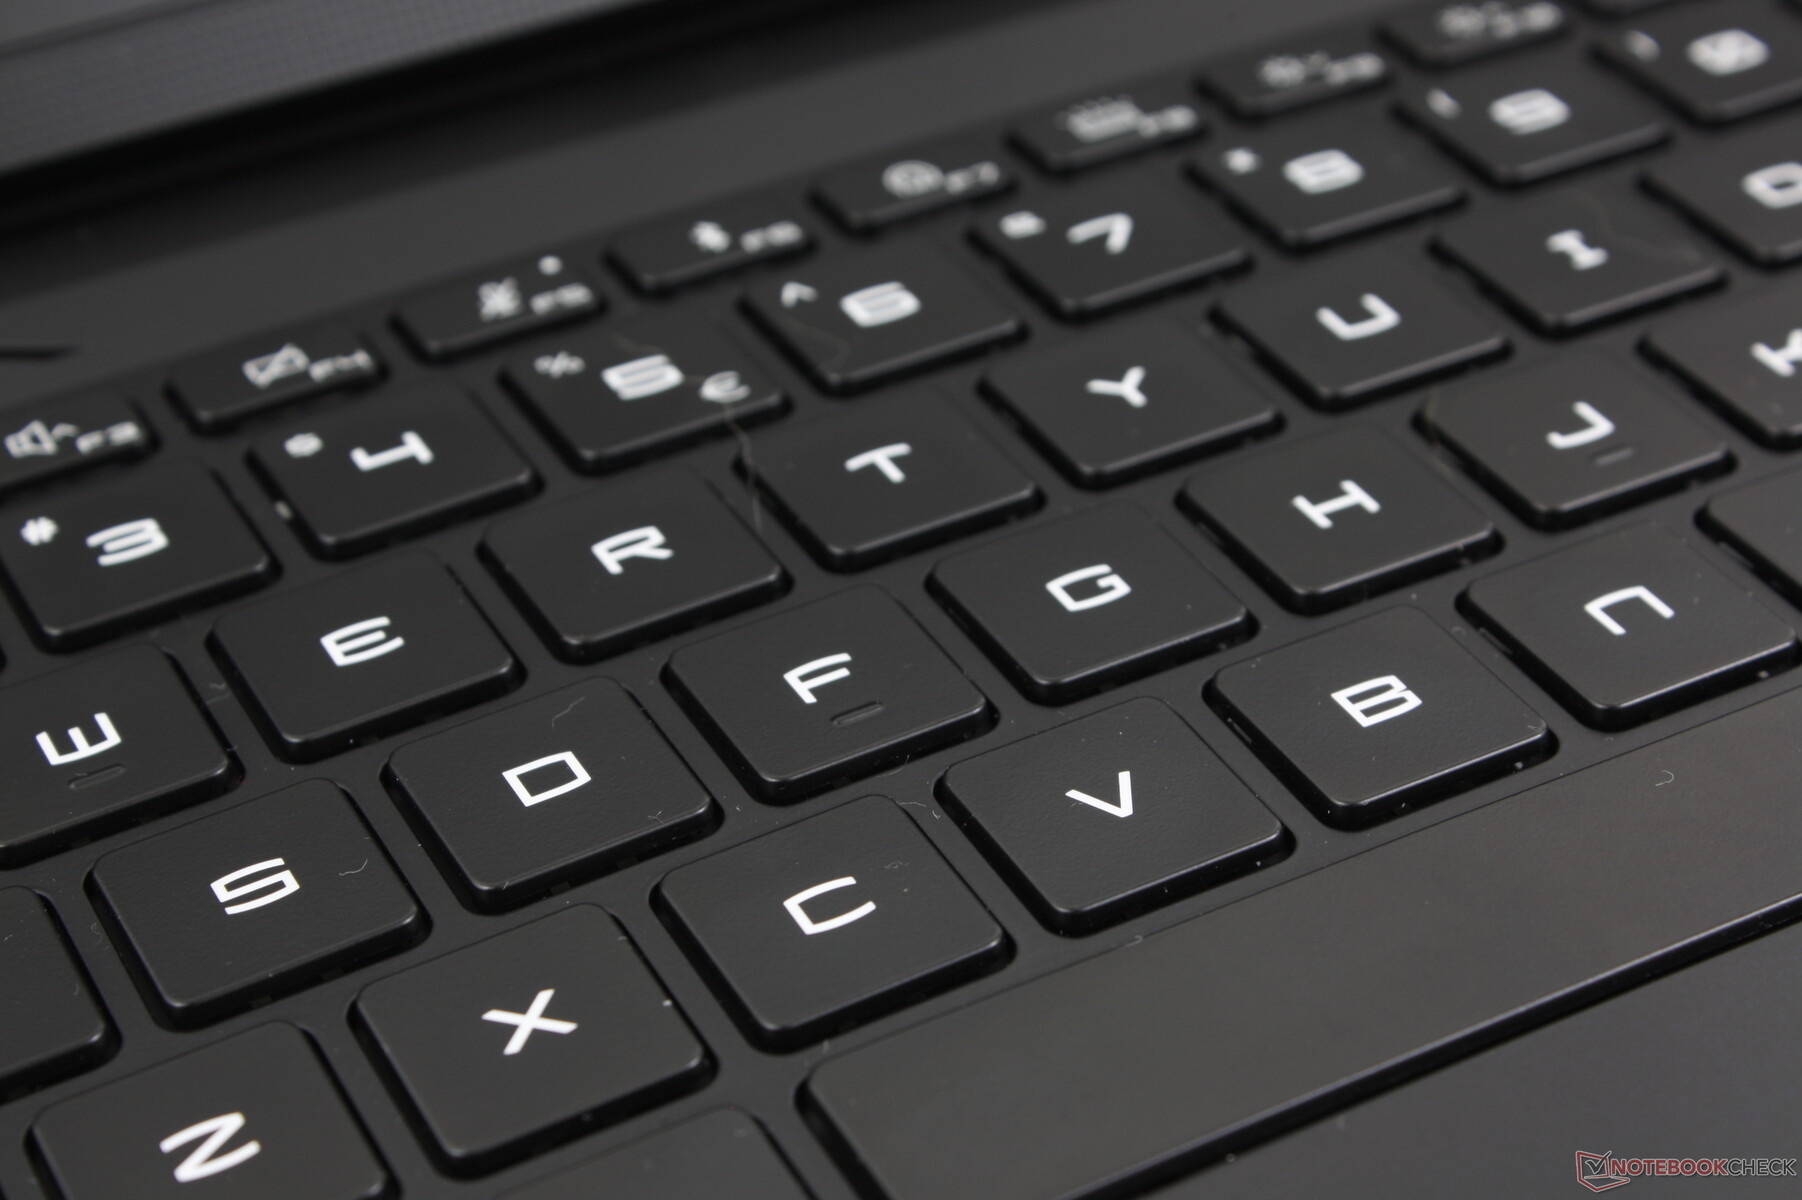
La tastiera è visivamente identica a quella della Titan 18 HX, ma con una differenza molto importante: La mancanza di opzioni meccaniche CherryMX. La digitazione su Raider 18 HX è quindi più vicina a quella su tastiere di laptop più tradizionali, come quelle di MSI Stealth 16 o sui modelli Raider di vecchia generazione. Il feedback non è altrettanto cliccabile o deciso, ma il ticchettio più morbido può essere preferibile per ambienti come sale conferenze, aule, biblioteche o dormitori.
Apprezziamo in modo particolare il tastierino numerico e i tasti freccia a grandezza naturale, perché di solito sono più stretti e più piccoli dei tasti QWERTY principali della maggior parte degli altri computer portatili. Il lavoro con i fogli di calcolo è quindi più comodo sul Raider 18 HX che sul Blade 18 o sul ROG Strix G18.
Touchpad
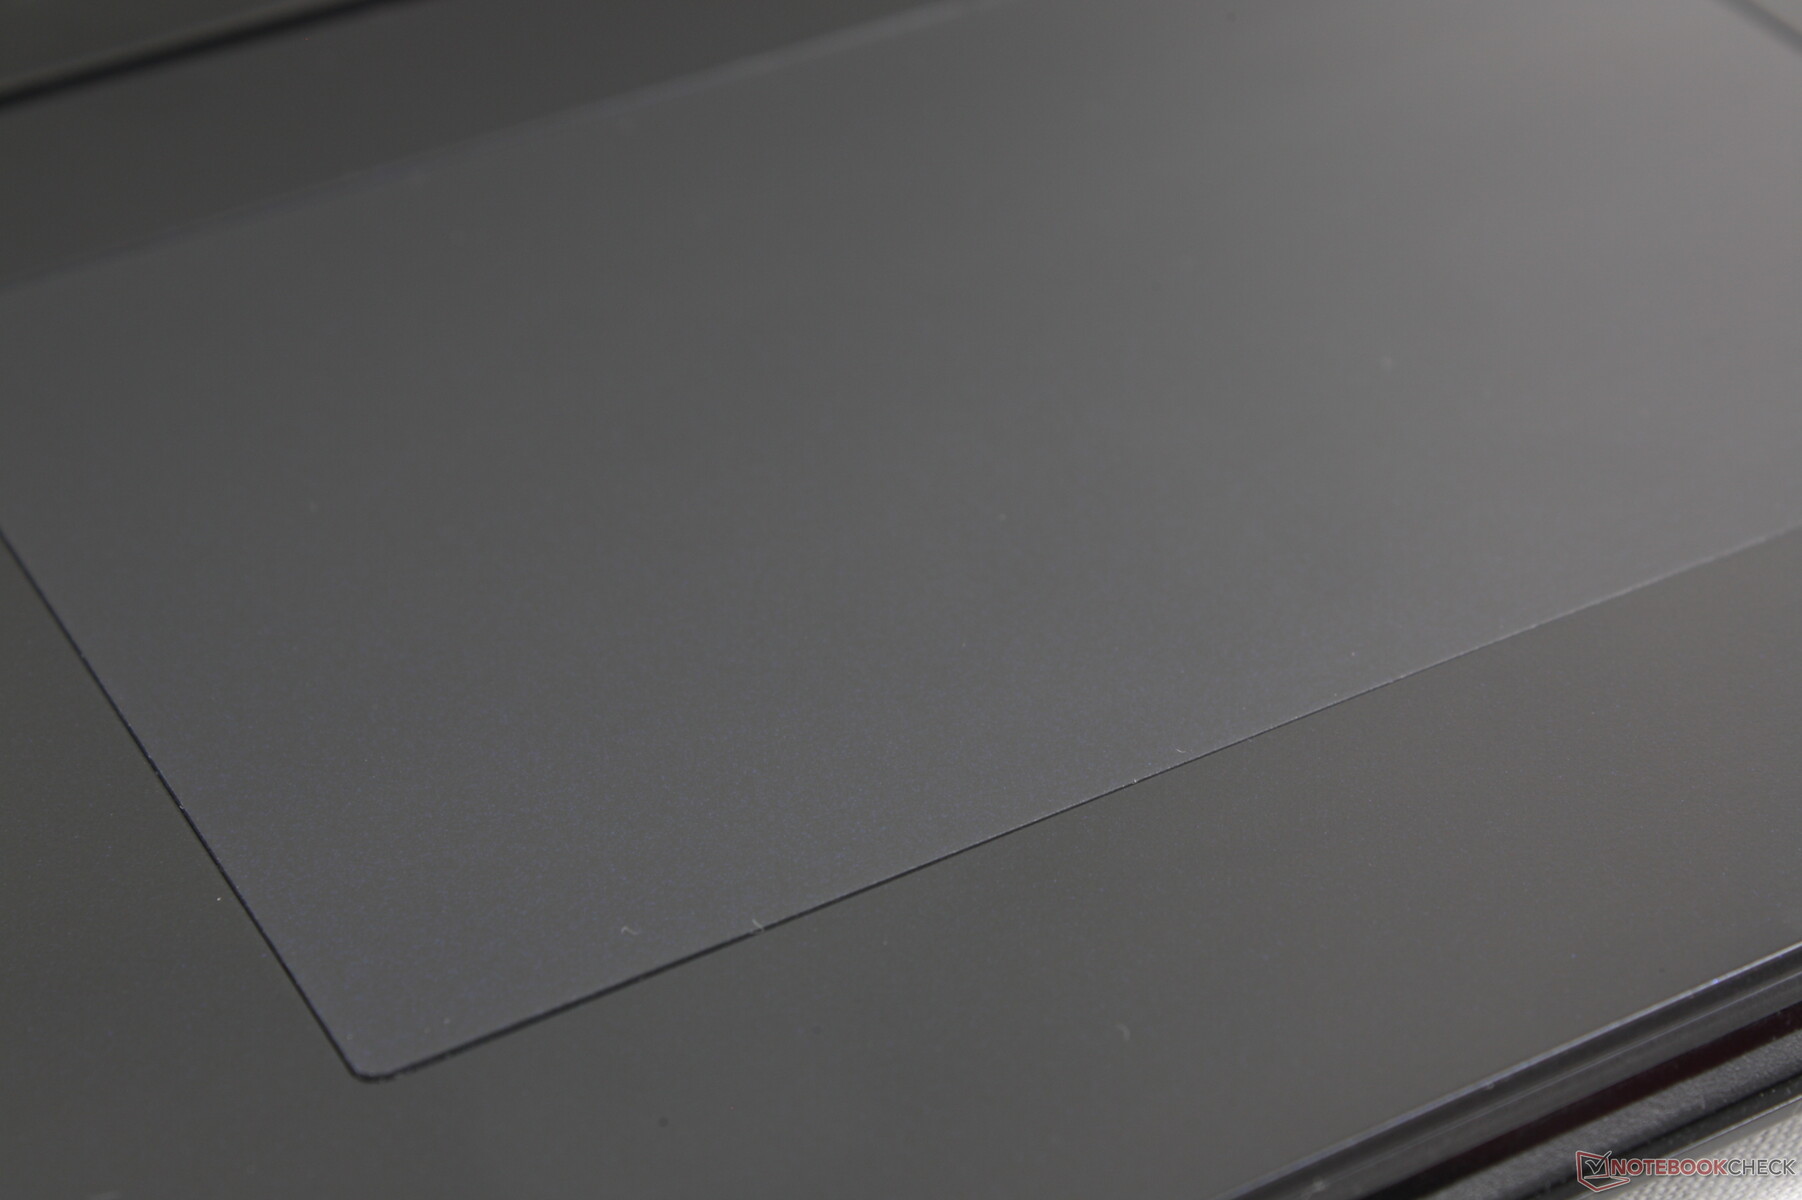
A differenza dell'elegante clickpad edge-less illuminato a LED del Titan 18 HX, il Raider 18 HX utilizza un clickpad tradizionale per una sensazione più familiare. Le dimensioni rimangono esattamente le stesse (13 x 8,2 cm) ed è probabilmente più comodo da usare, in quanto non cerca di essere qualcosa di nuovo o di risolvere un problema che non c'era prima. La trazione è ultra-liscia, con solo un po' di aderenza alle velocità più basse per la precisione.
La pressione per inserire un clic è purtroppo ancora superficiale e morbida, con un feedback insoddisfacente. Sarebbe stato preferibile un clic più forte e deciso o addirittura il ritorno di tasti del mouse dedicati, dato che il piano tastiera è piuttosto spazioso.
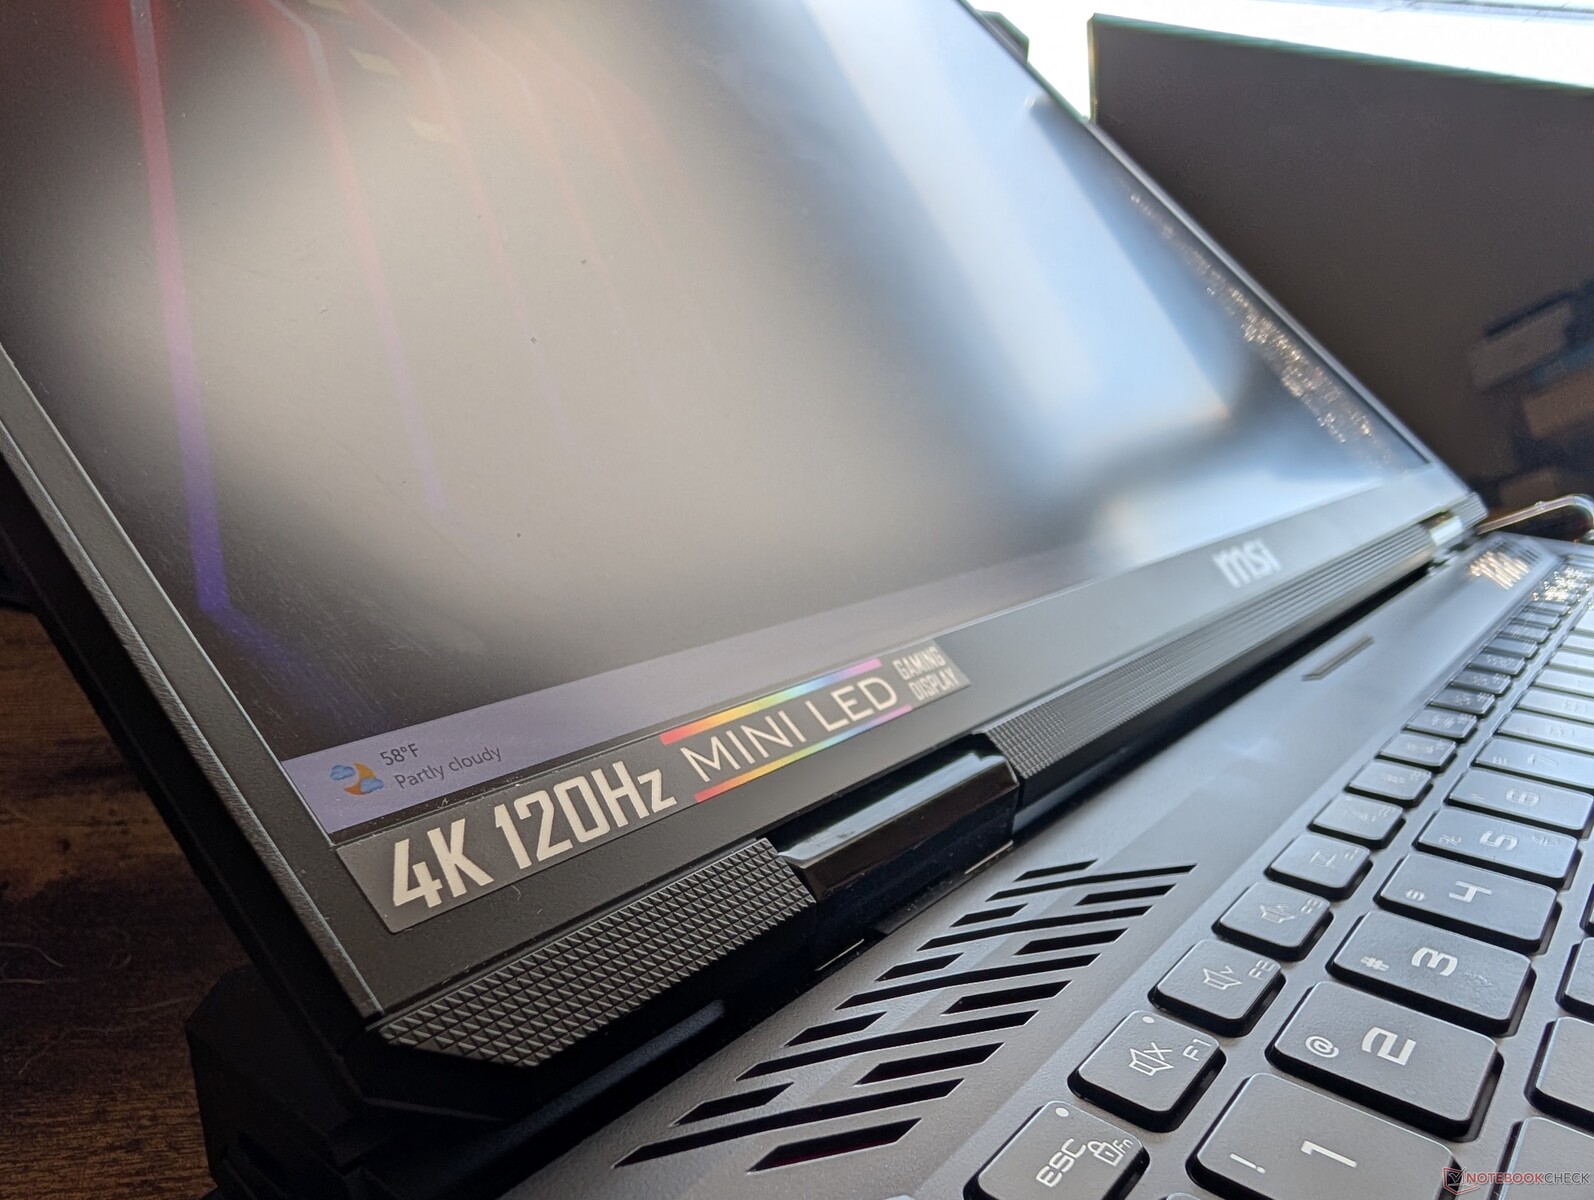
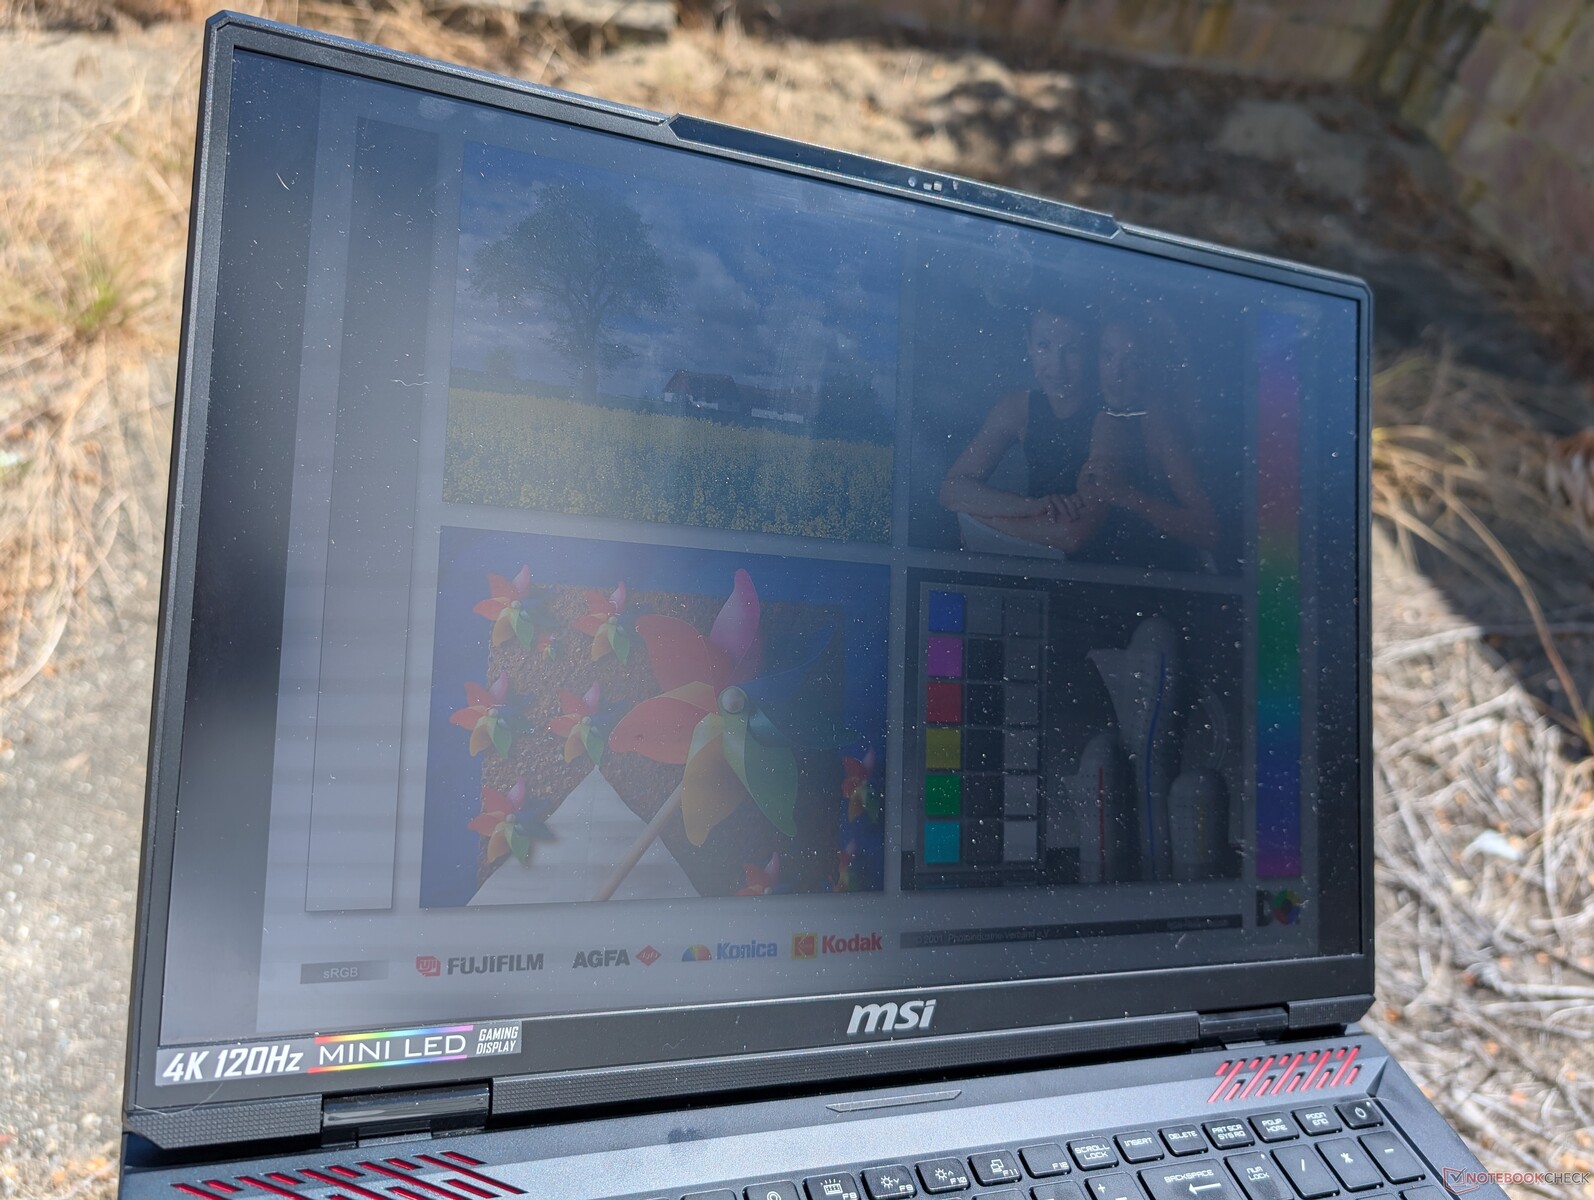
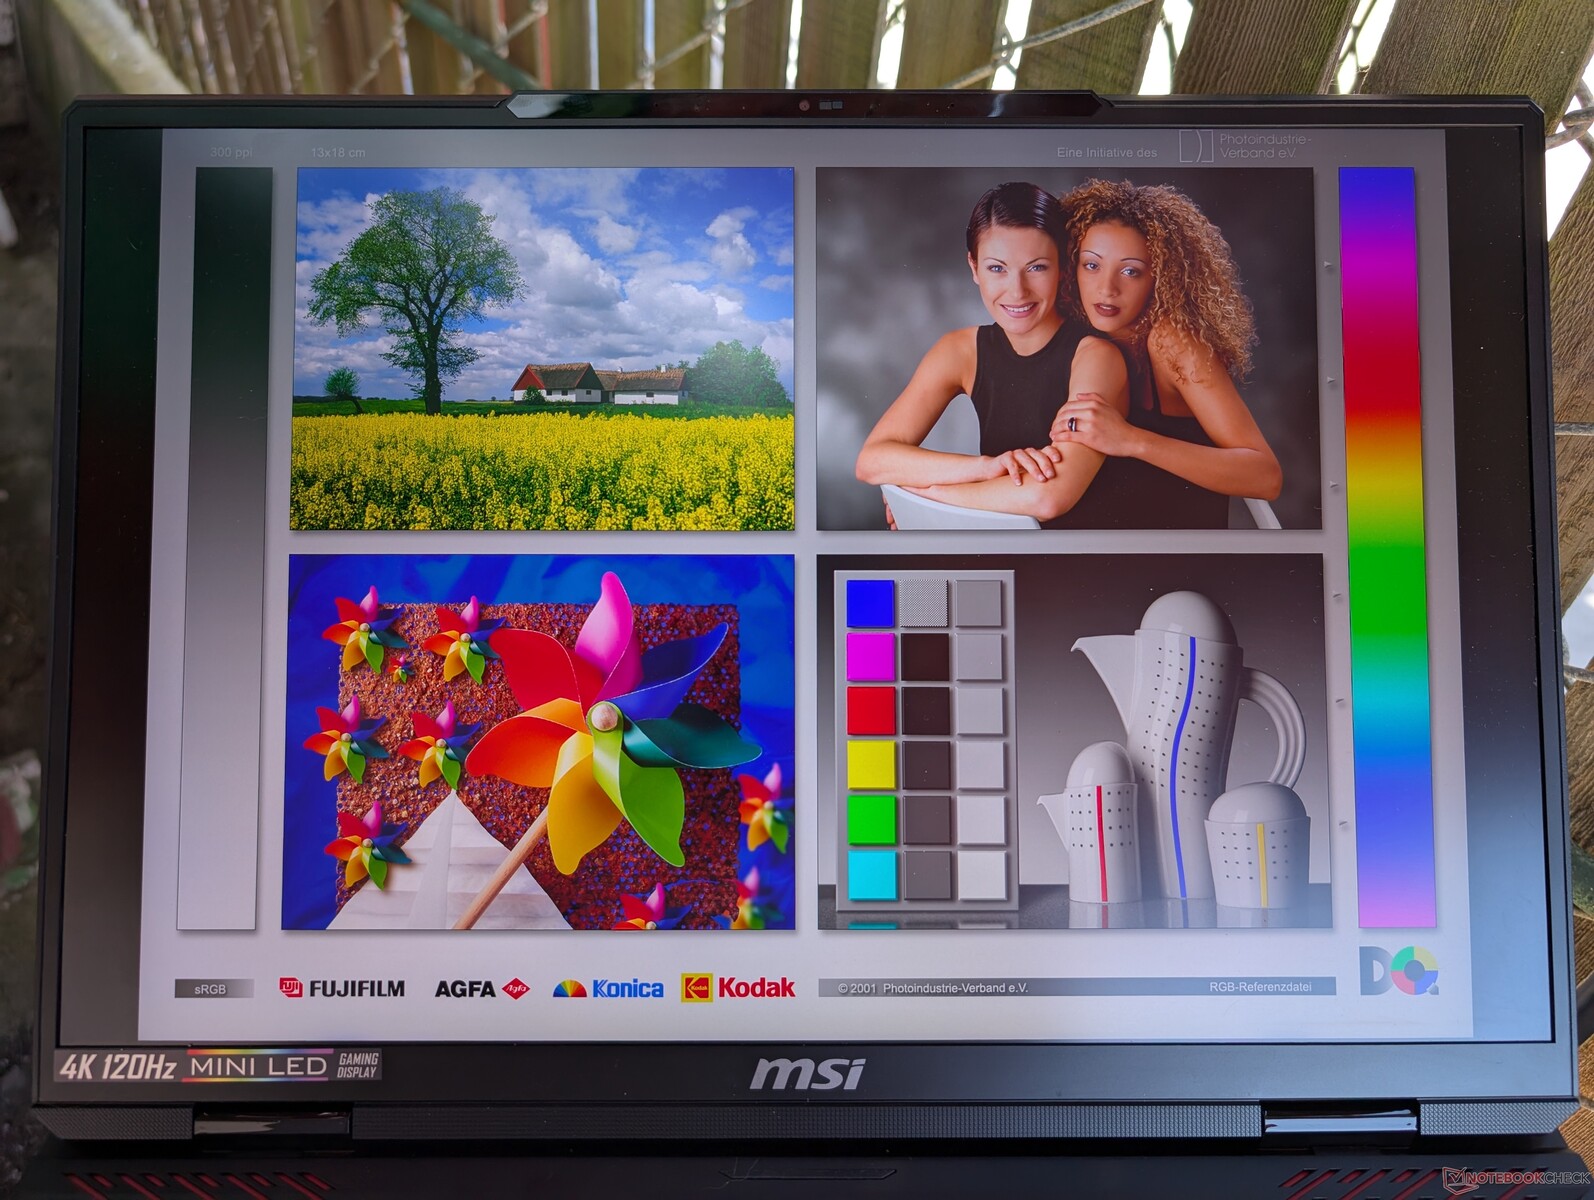
Display - L'esperienza Titan 18 HX a un prezzo inferiore
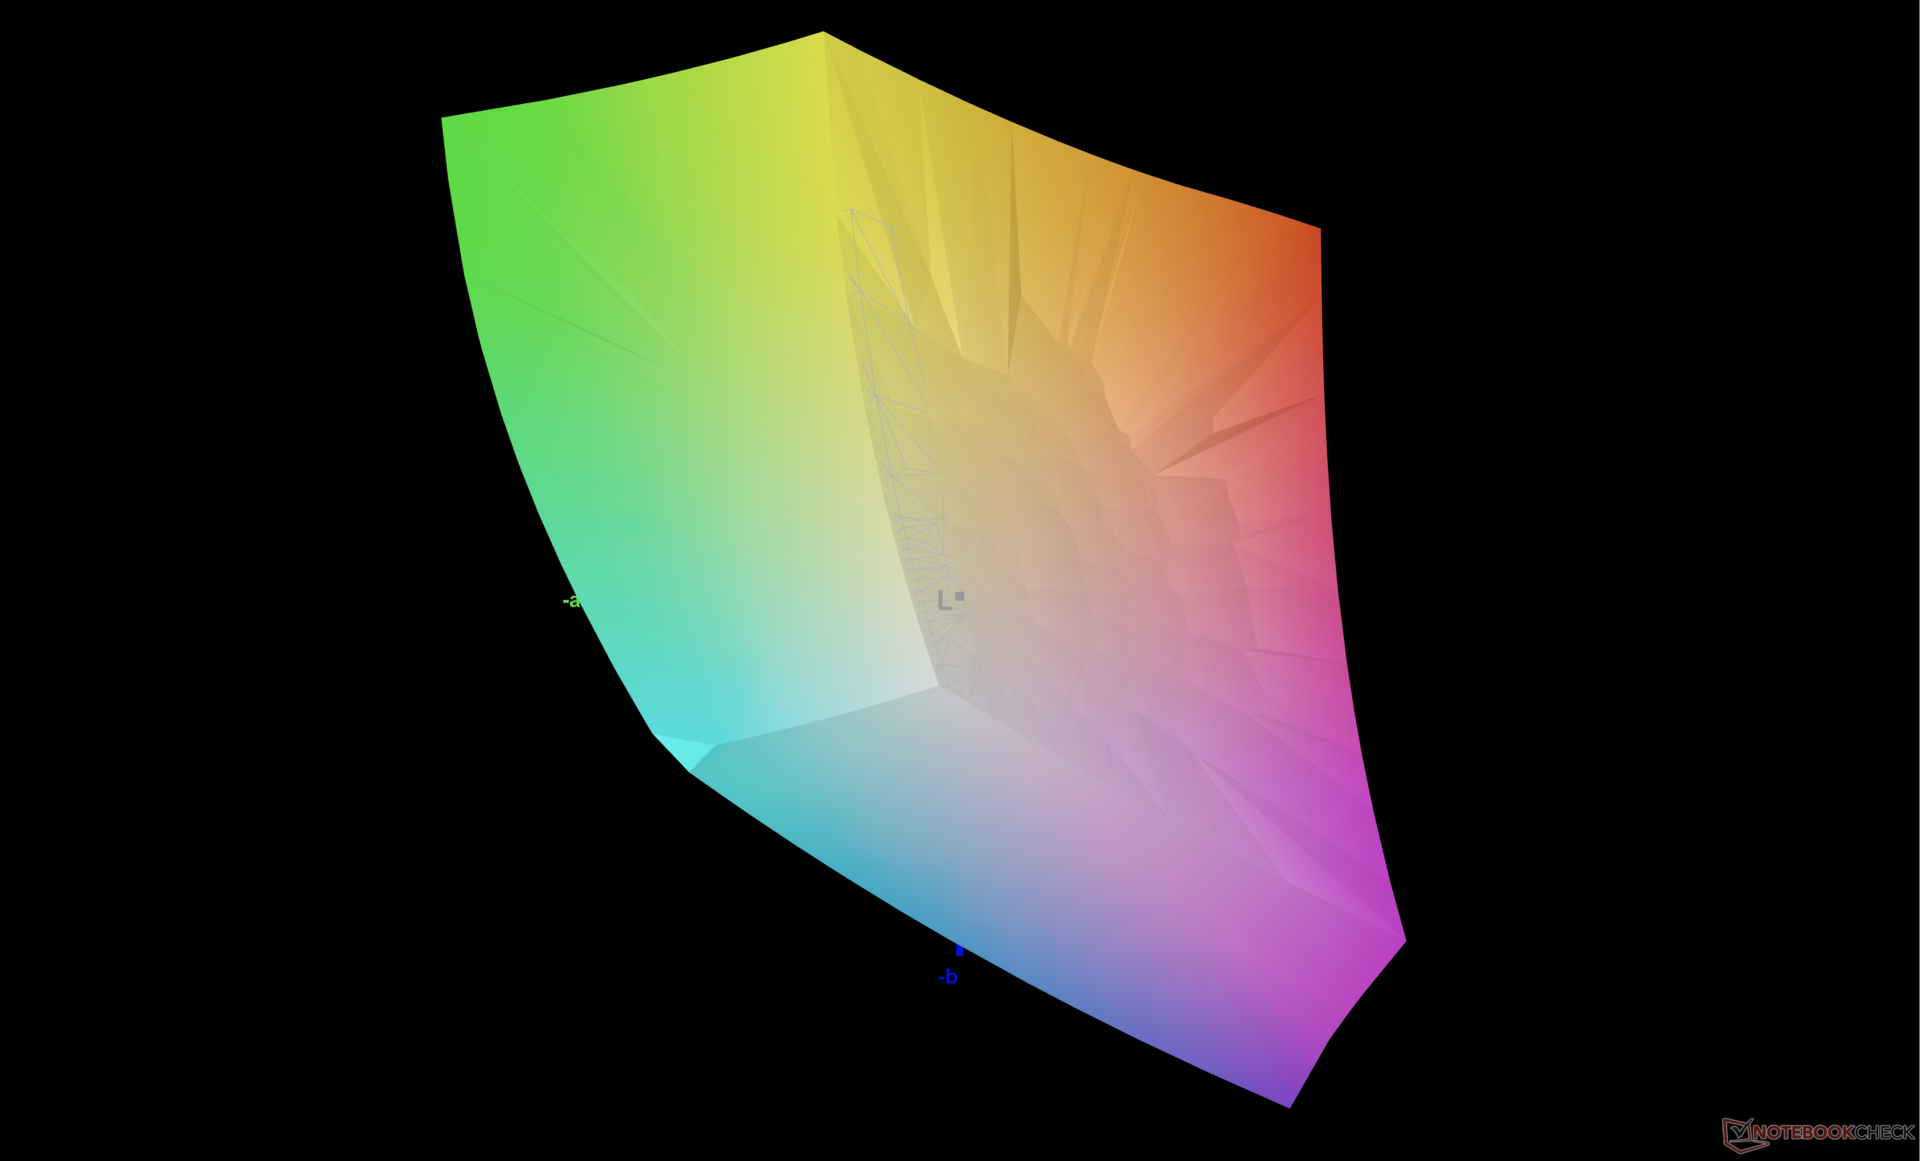
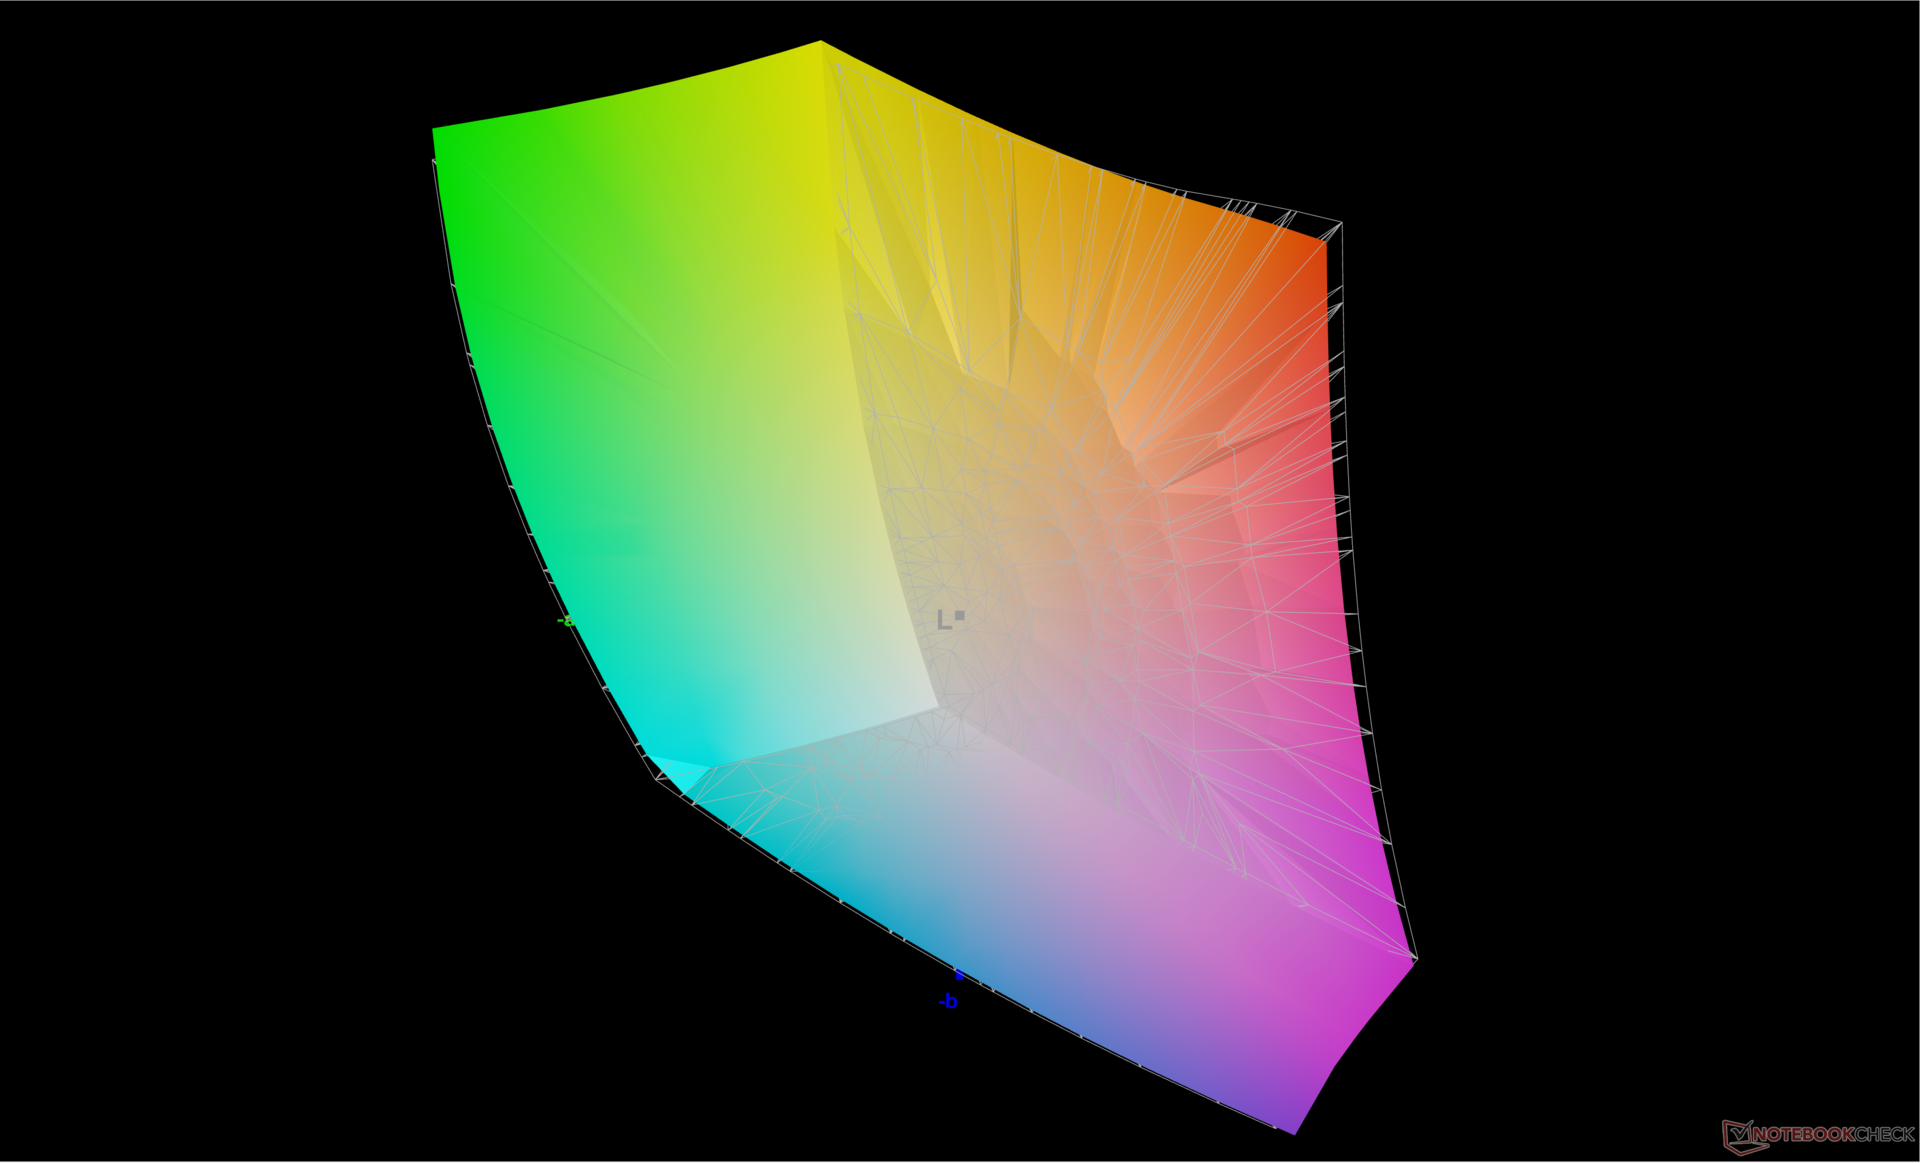
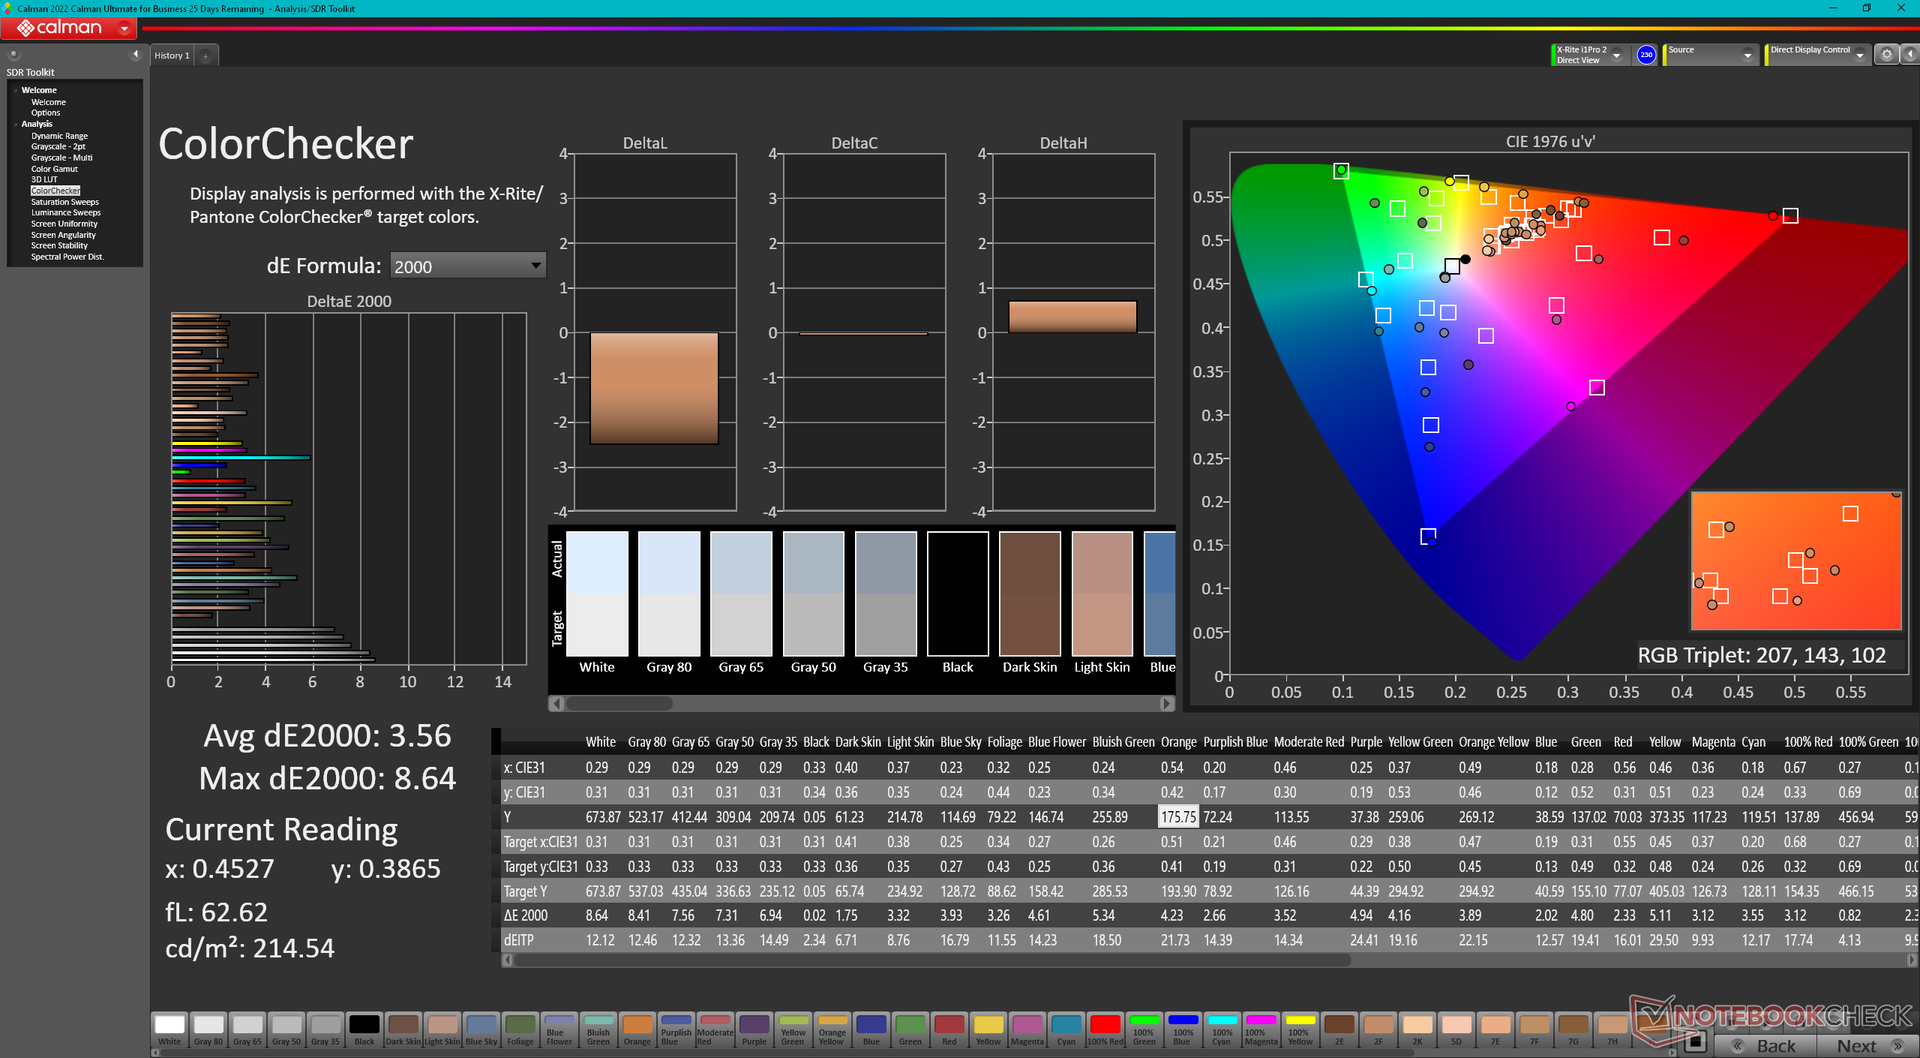
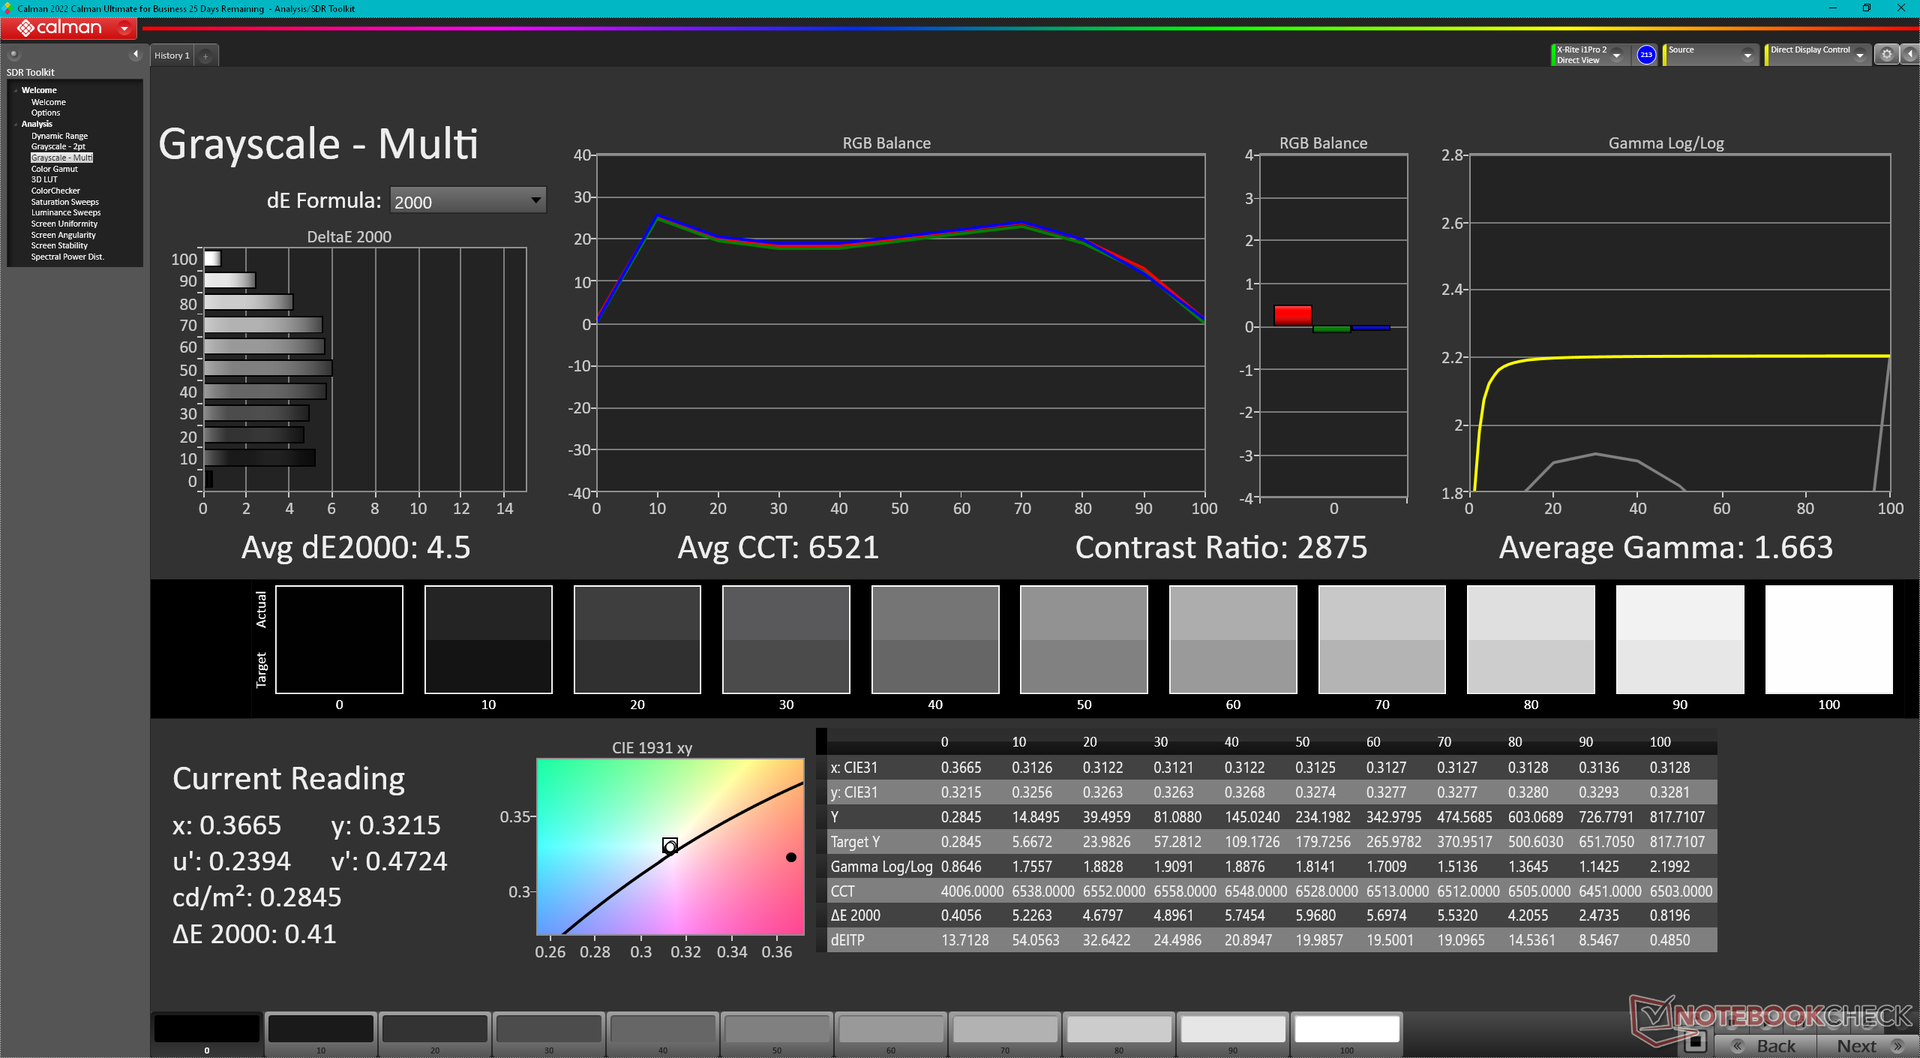
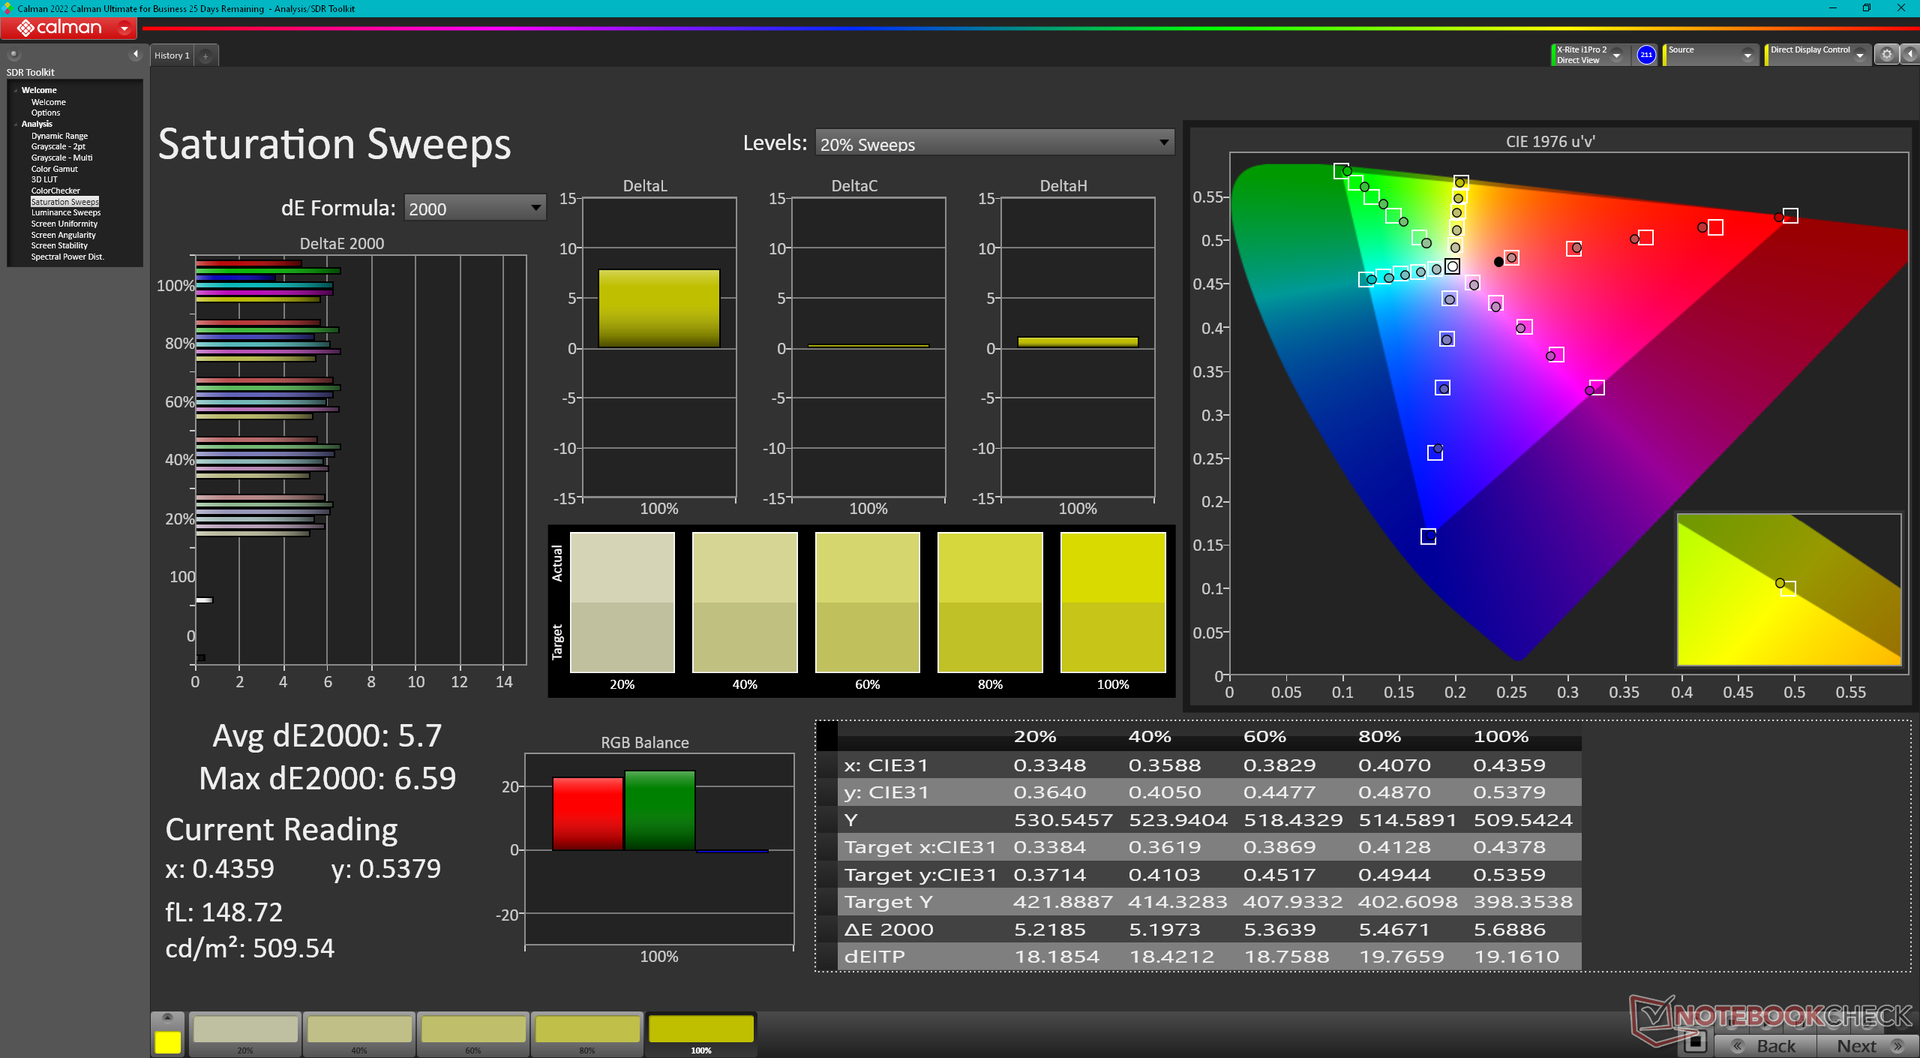
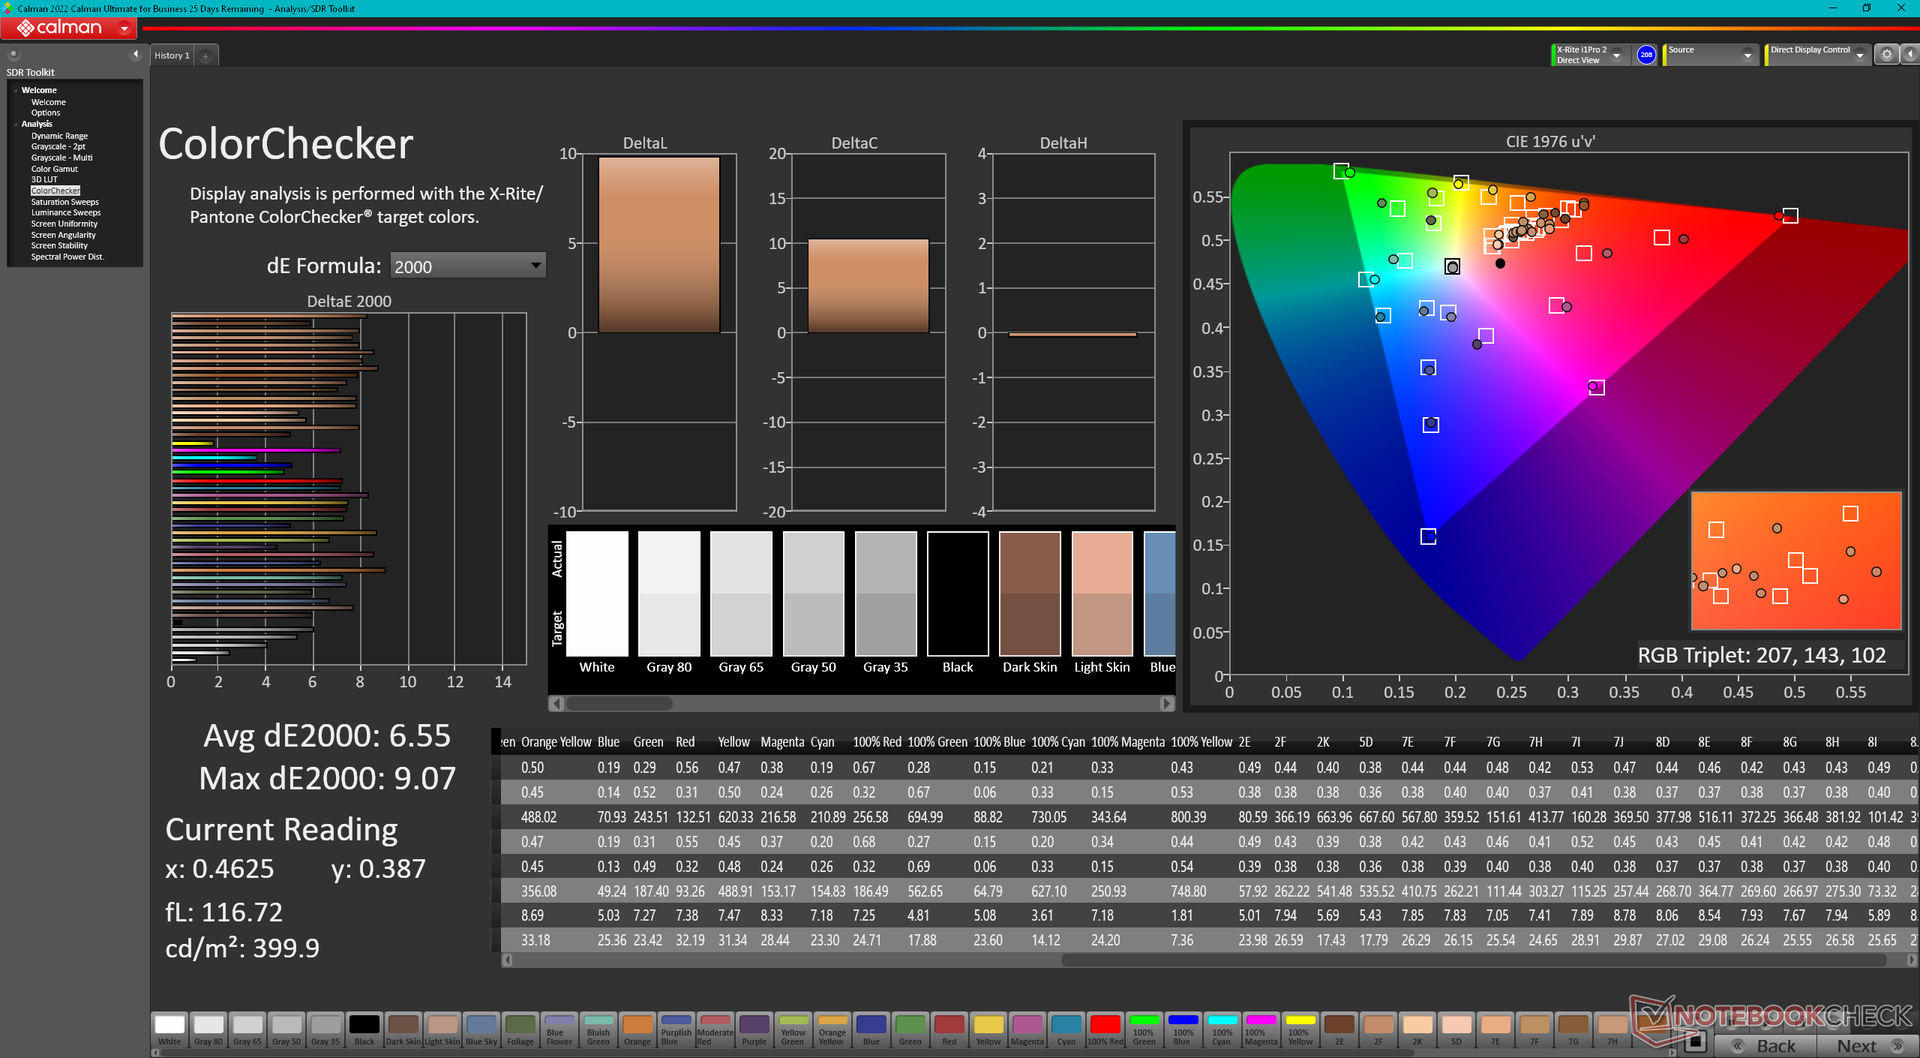
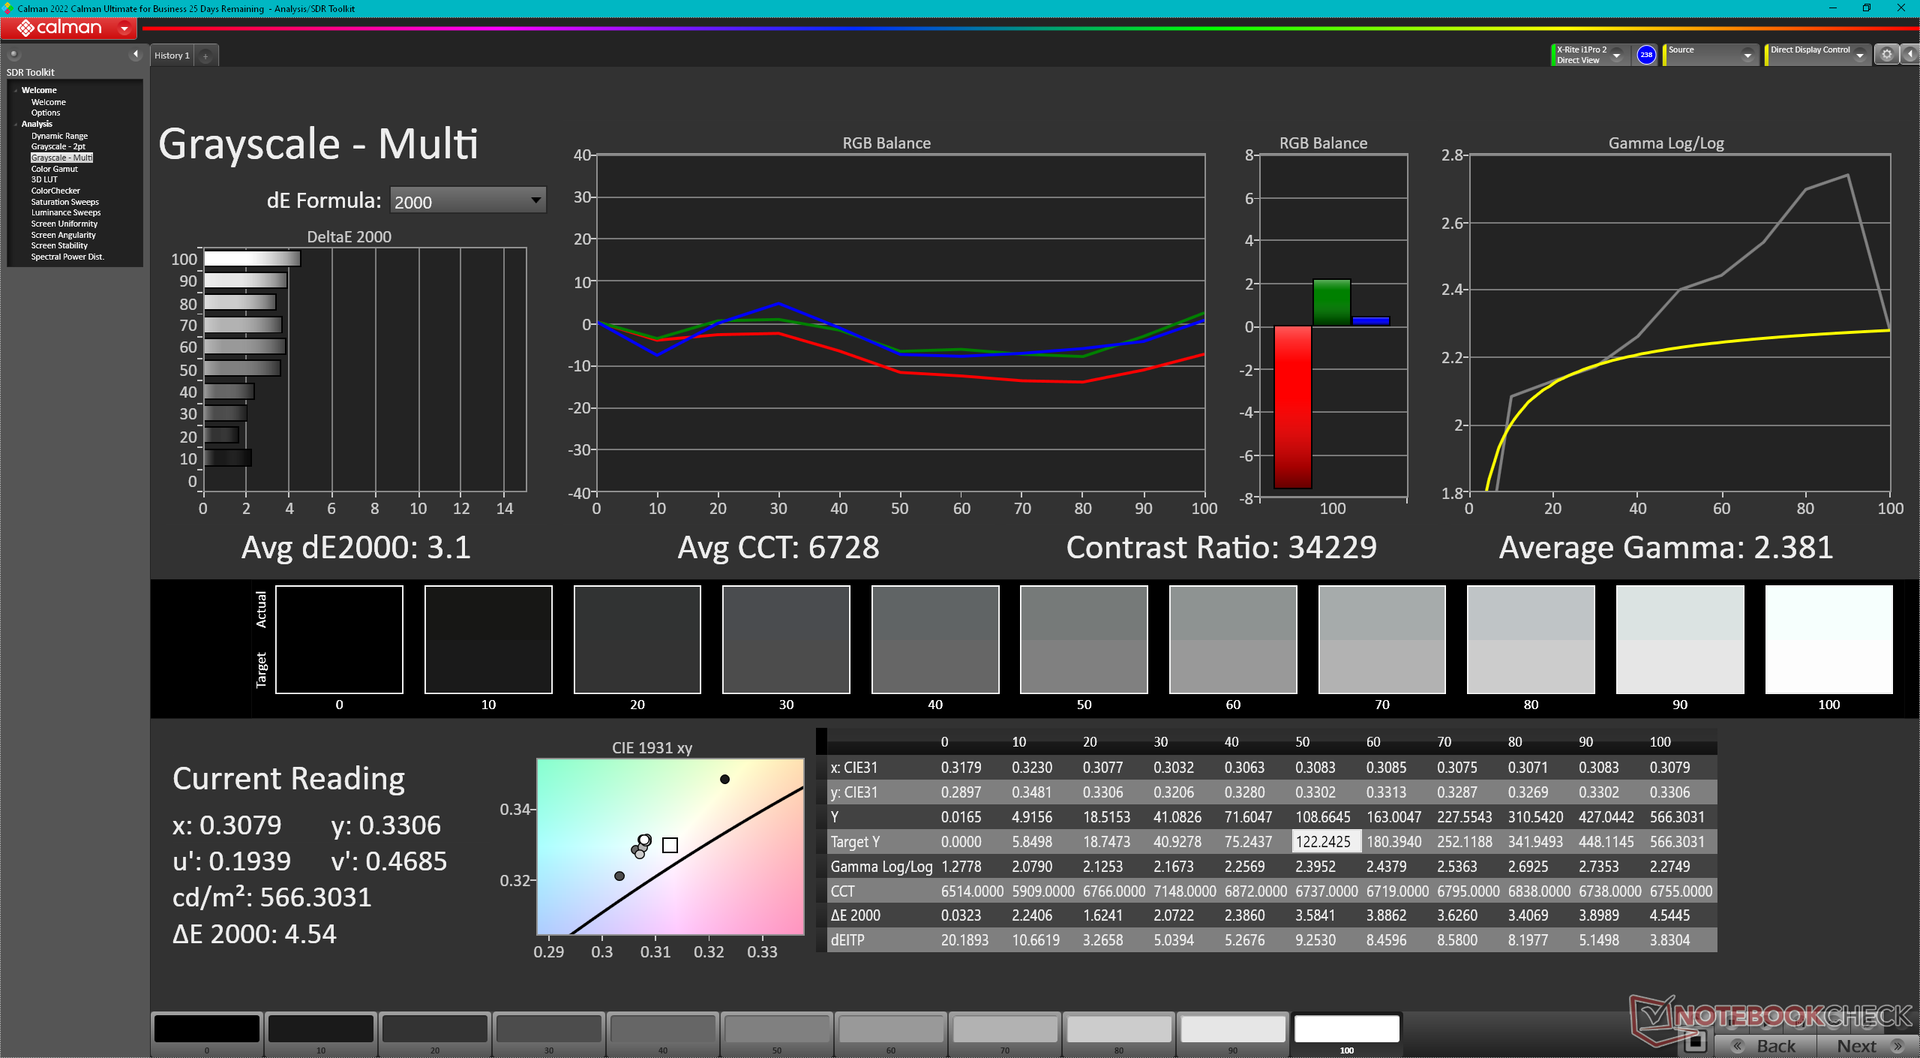
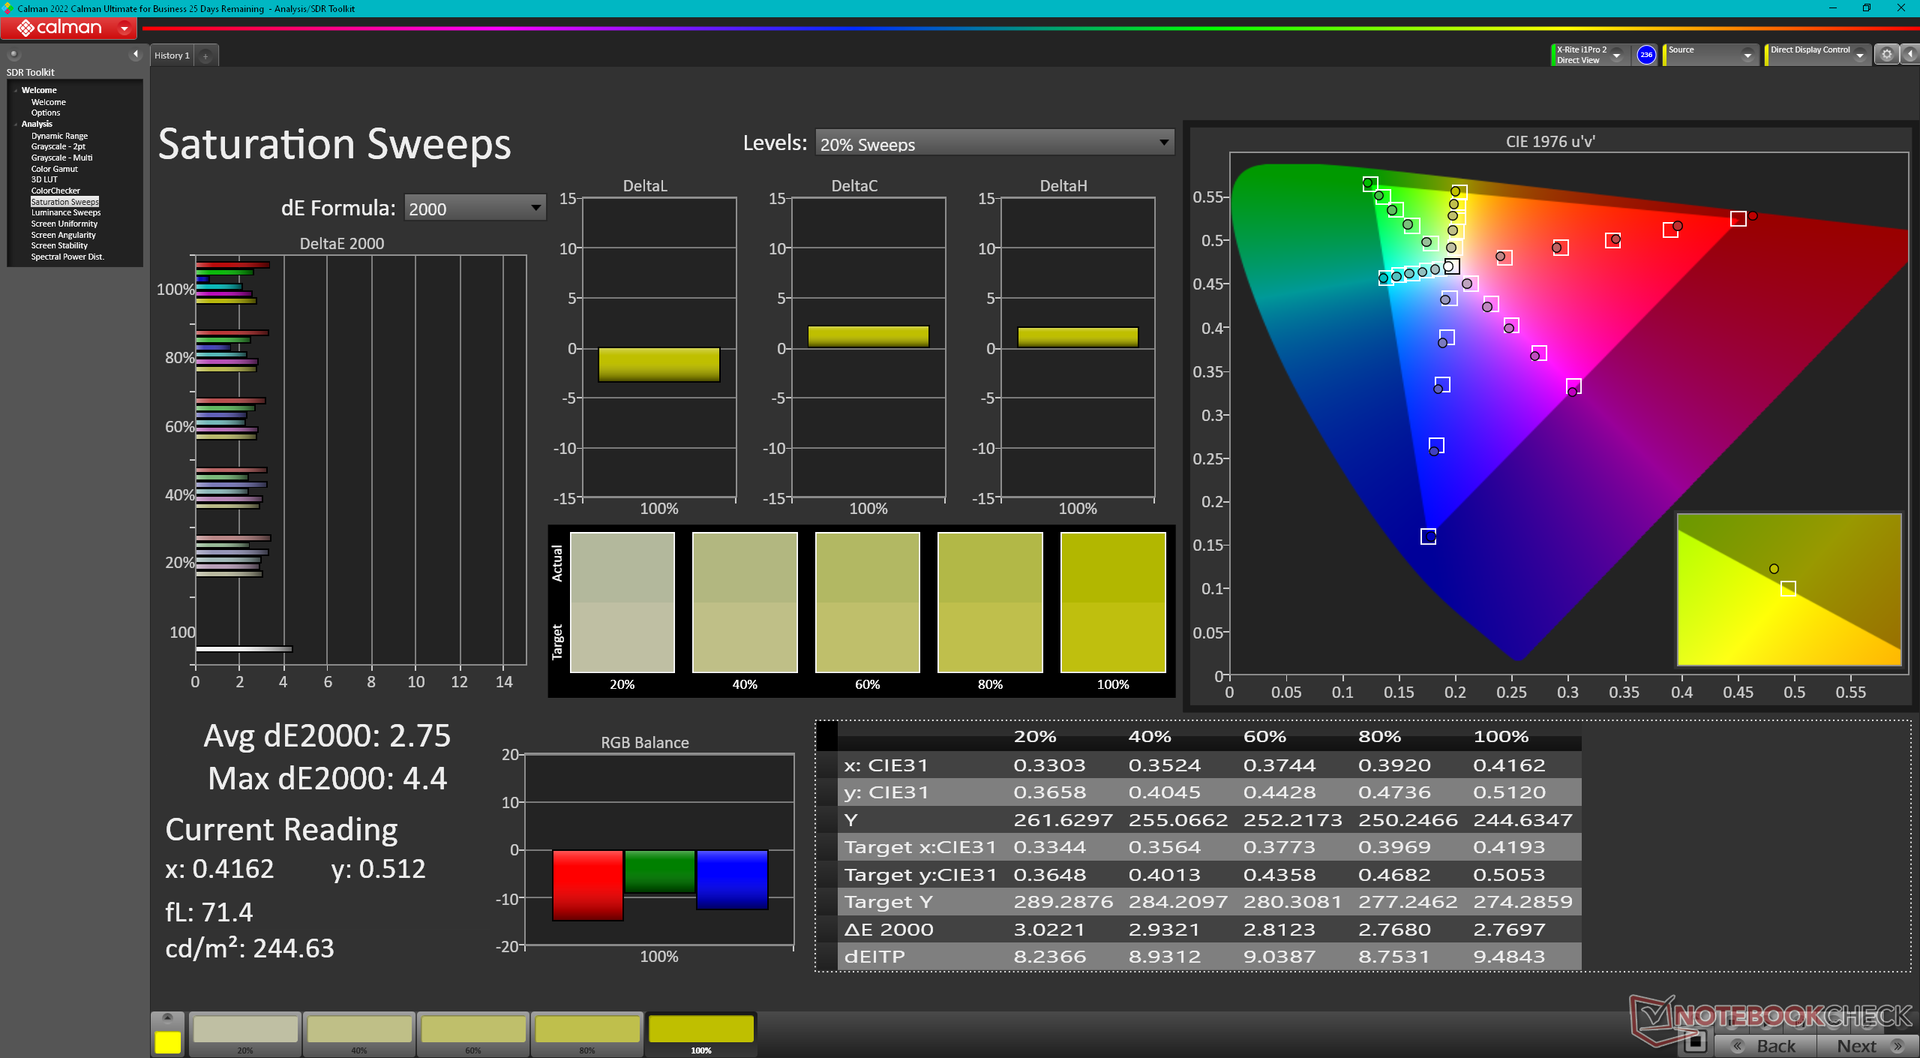
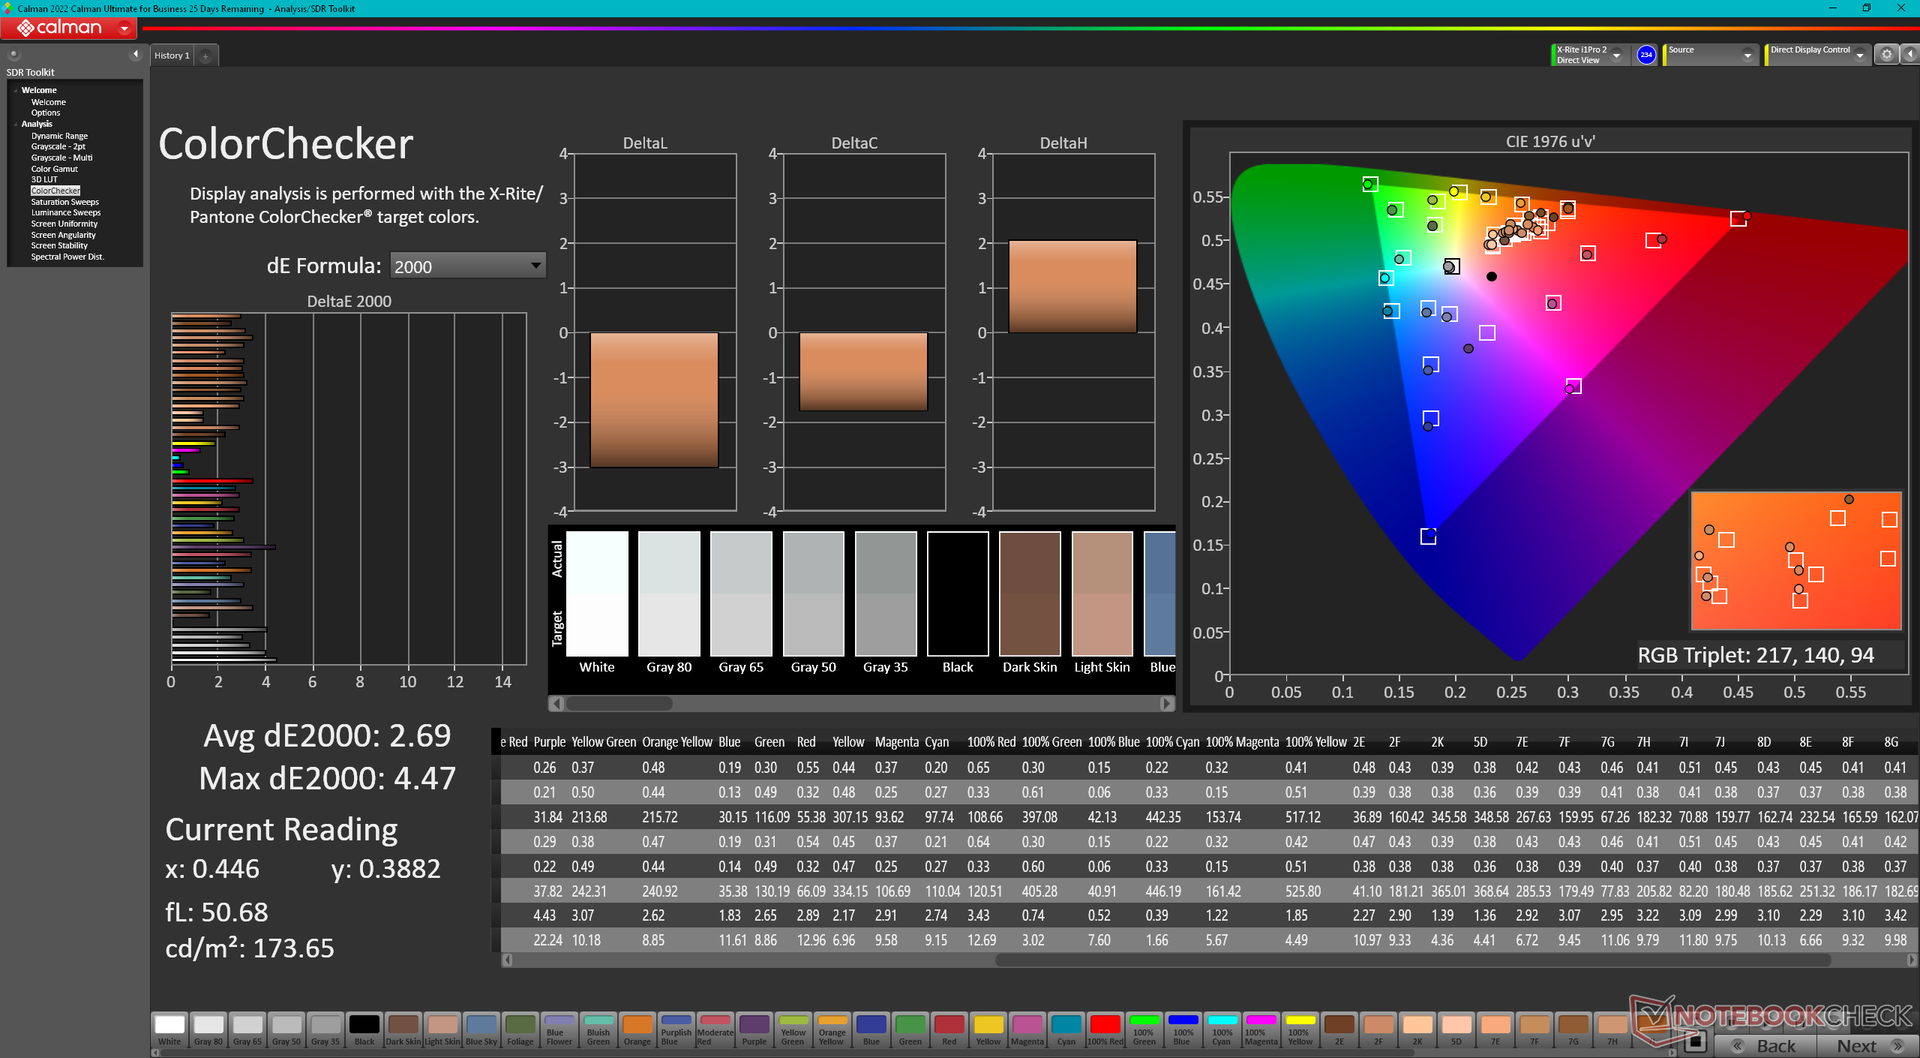
Il Raider 18 HX viene fornito con lo stesso pannello mini-LED da 120 Hz di AU Optronics B180ZAN01.0 presente sul Titan 18 HX, per un'esperienza visiva praticamente identica. La luminosità massima raggiunge quasi 600 nits quando l'HDR è disattivato o 935 nits quando l'HDR è attivato. Rispetto a IPS o OLED, il mini-LED offre un'esperienza visiva HDR migliore, in quanto è in grado di raggiungere livelli di luminosità più elevati di entrambi, a costo di un consumo energetico più elevato. I computer portatili IPS o OLED in genere supportano al massimo l'HDR600, mentre i pannelli mini-LED spesso promettono l'HDR1000.
| |||||||||||||||||||||||||
Distribuzione della luminosità: 94 %
Al centro con la batteria: 392.2 cd/m²
Contrasto: ∞:1 (Nero: 0 cd/m²)
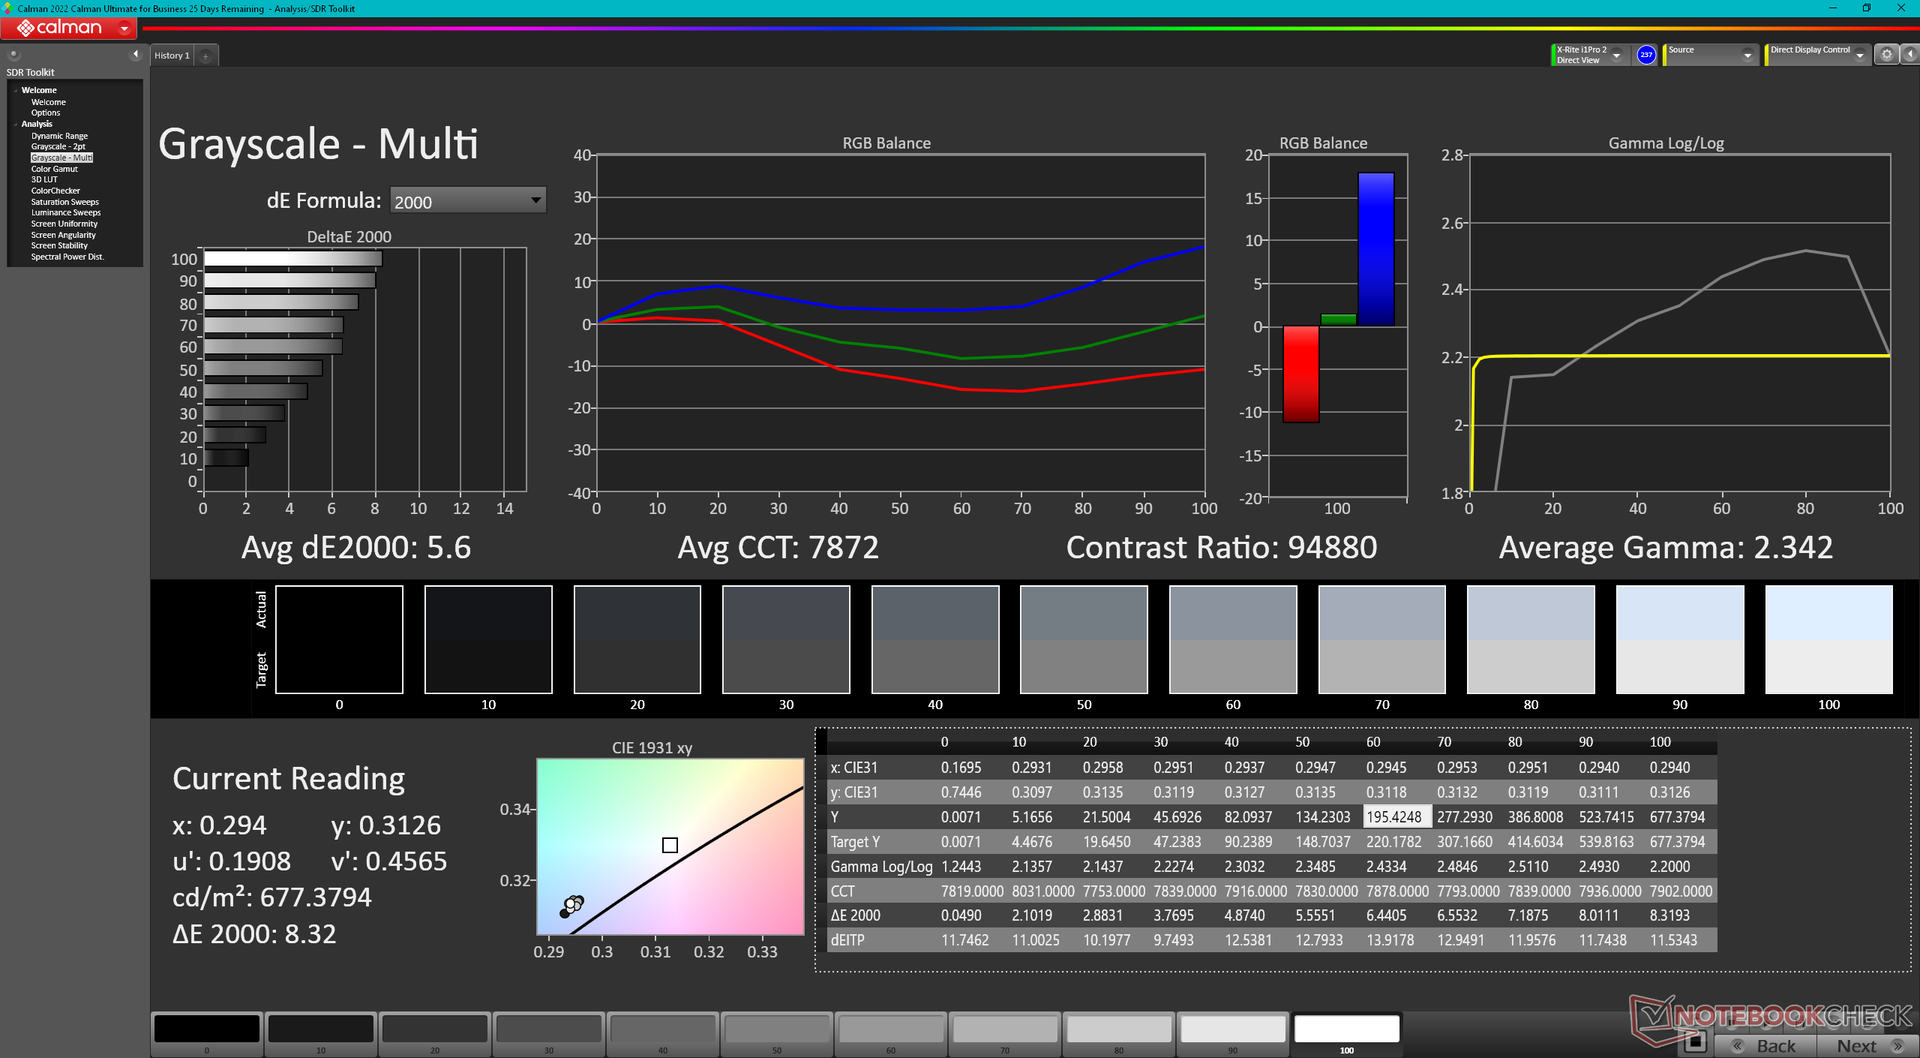
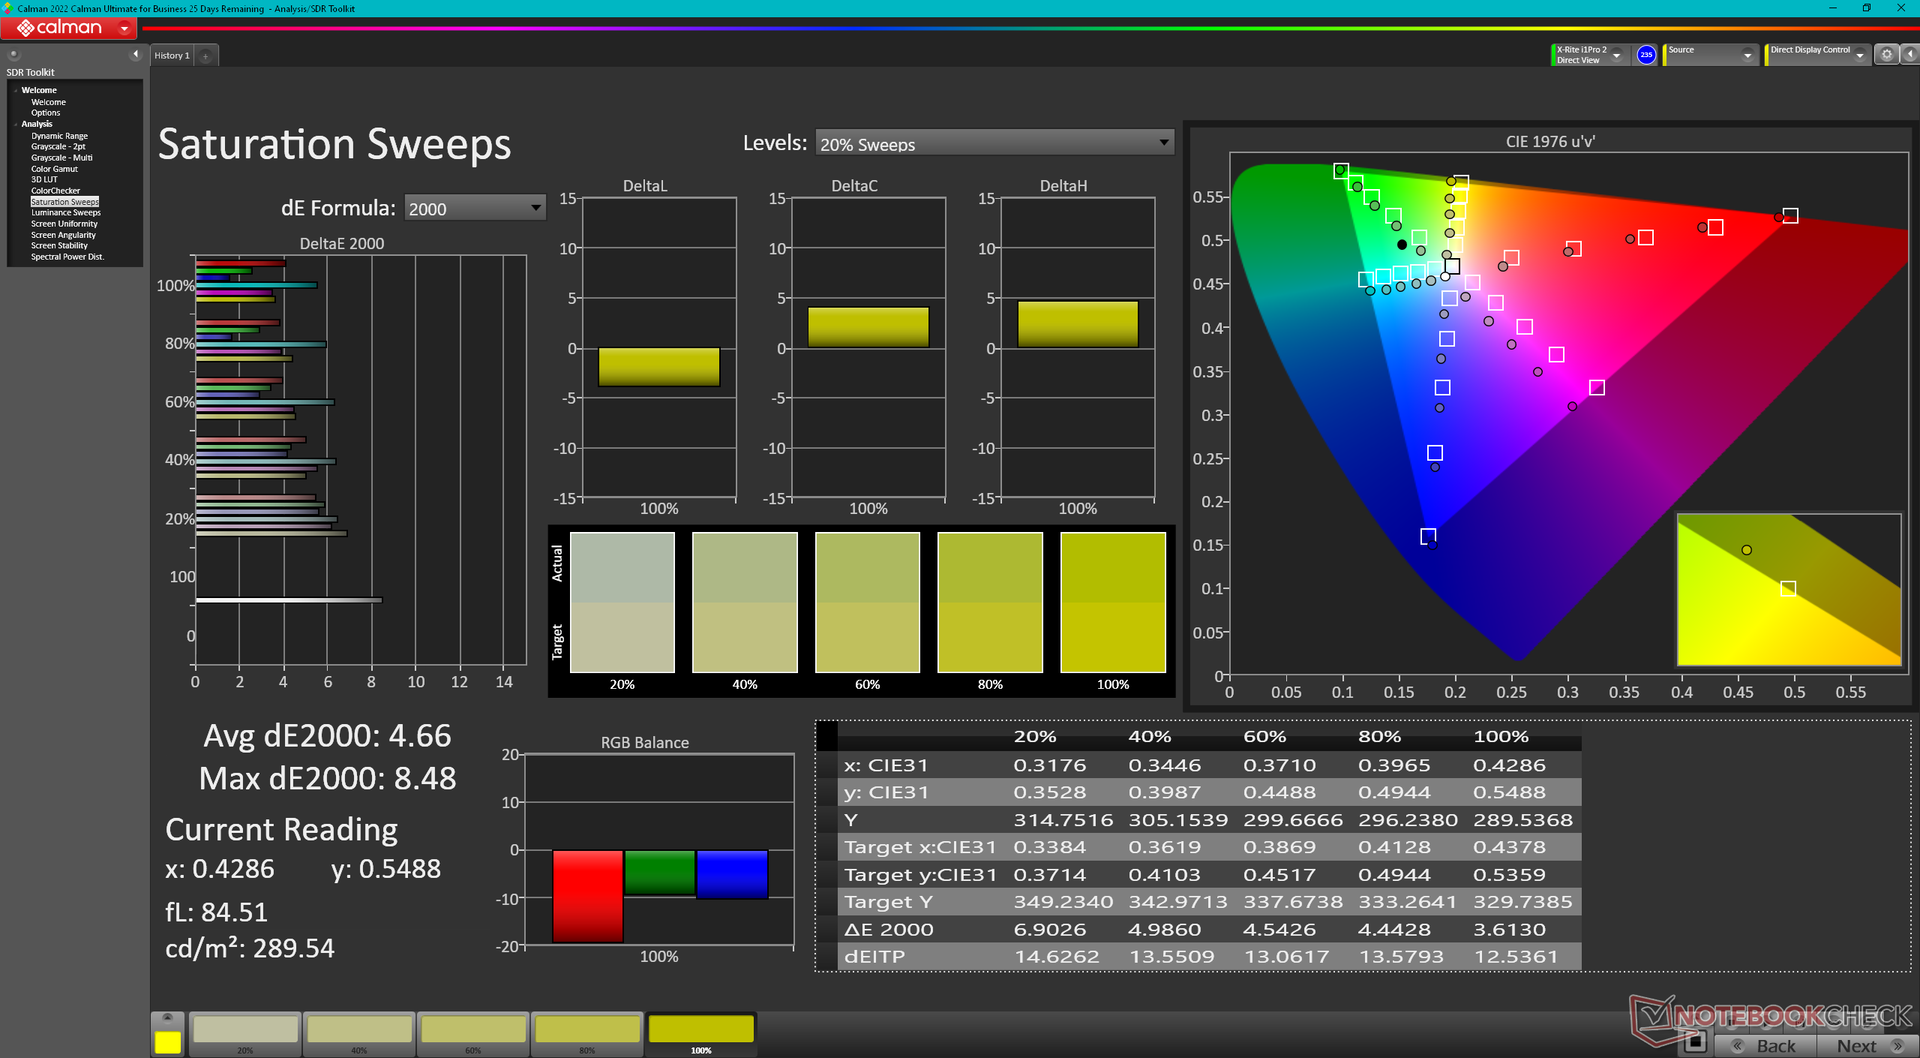
ΔE Color 3.56 | 0.5-29.43 Ø4.87, calibrated: 2.69
ΔE Greyscale 5.6 | 0.5-98 Ø5.1
84.8% AdobeRGB 1998 (Argyll 2.2.0 3D)
99.9% sRGB (Argyll 2.2.0 3D)
96.6% Display P3 (Argyll 2.2.0 3D)
Gamma: 2.34
| MSI Raider 18 HX A14V AU Optronics B180ZAN1.0, Mini-LED, 3840x2400, 18", 120 Hz | Razer Blade 18 2024 RZ09-0509 BOE NE180QDM-NM1, Mini-LED, 2560x1600, 18", 300 Hz | Alienware m18 R2 BOE NE18NZ1, IPS, 2560x1600, 18", 165 Hz | MSI Titan 18 HX A14VIG AU Optronics B180ZAN01.0, Mini-LED, 3840x2400, 18", 120 Hz | Asus ROG Strix G18 G814JI NE180QDM-NZ2 (BOE0B35), IPS, 2560x1600, 18", 240 Hz | Acer Predator Helios 18 PH18-72-98MW B180QAN01.2 (AUO45A8), Mini-LED, 2560x1600, 18", 250 Hz | |
|---|---|---|---|---|---|---|
| Display | 1% | 2% | 1% | 1% | 4% | |
| Display P3 Coverage | 96.6 | 99 2% | 97.8 1% | 98.1 2% | 98.1 2% | 99.7 3% |
| sRGB Coverage | 99.9 | 100 0% | 99.5 0% | 99.8 0% | 99.9 0% | 100 0% |
| AdobeRGB 1998 Coverage | 84.8 | 86.9 2% | 88.9 5% | 86.2 2% | 85.6 1% | 91.6 8% |
| Response Times | 341% | 68% | 3% | 67% | 62% | |
| Response Time Grey 50% / Grey 80% * | 10.4 ? | 7.6 ? 27% | 5.3 ? 49% | 8.6 ? 17% | 5.6 ? 46% | 8 ? 23% |
| Response Time Black / White * | 75.8 ? | 14 ? 82% | 10.4 ? 86% | 81.8 ? -8% | 9 ? 88% | 17.6 ? 77% |
| PWM Frequency | 2606.2 ? | 26444 ? 915% | 2592 ? -1% | 4832 ? 85% | ||
| Screen | 29% | 8% | 2% | 23% | 24% | |
| Brightness middle | 575.7 | 605.4 5% | 271.8 -53% | 467.5 -19% | 471 -18% | 722 25% |
| Brightness | 574 | 600 5% | 275 -52% | 459 -20% | 422 -26% | 724 26% |
| Brightness Distribution | 94 | 97 3% | 78 -17% | 90 -4% | 83 -12% | 93 -1% |
| Black Level * | 0.62 | 0.27 | 0.47 | 0.04 | ||
| Colorchecker dE 2000 * | 3.56 | 1.53 57% | 2.48 30% | 3.77 -6% | 2.05 42% | 3.4 4% |
| Colorchecker dE 2000 max. * | 8.64 | 4.15 52% | 5.59 35% | 6.12 29% | 4.15 52% | 5.32 38% |
| Colorchecker dE 2000 calibrated * | 2.69 | 0.56 79% | 2.94 -9% | 0.8 70% | 1.6 41% | |
| Greyscale dE 2000 * | 5.6 | 2.6 54% | 3.7 34% | 3.2 43% | 2.8 50% | 3.8 32% |
| Gamma | 2.34 94% | 2.22 99% | 2.2 100% | 2.43 91% | 2.204 100% | 2.383 92% |
| CCT | 7872 83% | 6843 95% | 6355 102% | 6478 100% | 7122 91% | 7051 92% |
| Contrast | 976 | 1007 | 1002 | 18050 | ||
| Media totale (Programma / Settaggio) | 124% /
100% | 26% /
16% | 2% /
2% | 30% /
25% | 30% /
28% |
* ... Meglio usare valori piccoli
La temperatura del colore quando è impostata su Display P3 e HDR disattivato è piuttosto fredda, a 7872. Abilitando l'HDR si disabilita automaticamente qualsiasi impostazione MSI TrueColor, ma anche la temperatura del colore diventa automaticamente più calda a 6521 per colori più accurati. MSI non pubblicizza la calibrazione di fabbrica per questo modello Raider.
Tempi di risposta del Display
| ↔ Tempi di risposta dal Nero al Bianco | ||
|---|---|---|
| 75.8 ms ... aumenta ↗ e diminuisce ↘ combinato | ↗ 71 ms Incremento | 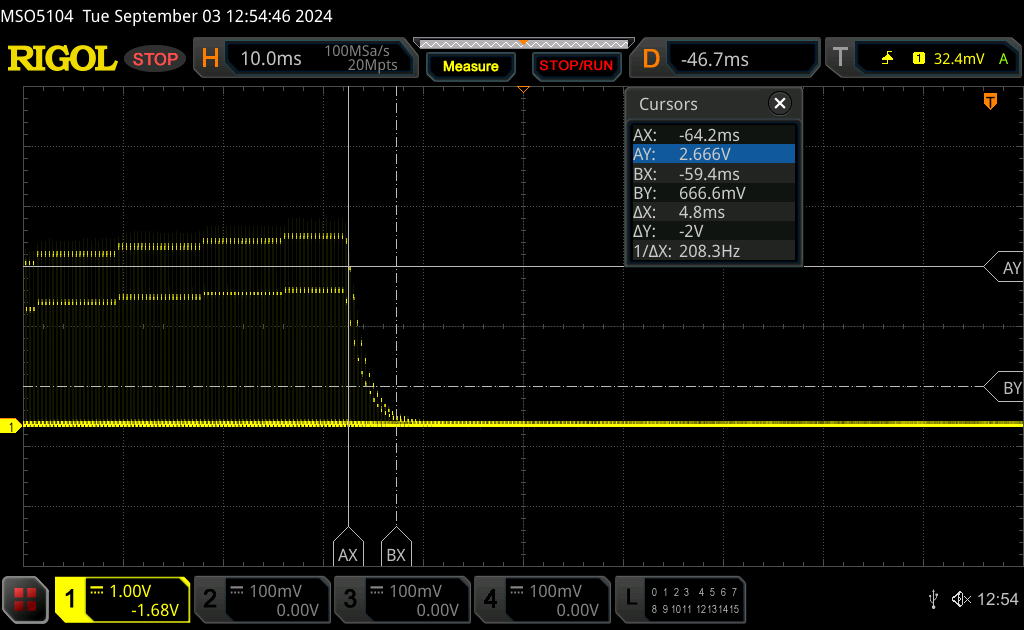 |
| ↘ 4.8 ms Calo | ||
| Lo schermo mostra tempi di risposta lenti nei nostri tests e sarà insoddisfacente per i gamers. In confronto, tutti i dispositivi di test variano da 0.1 (minimo) a 240 (massimo) ms. » 100 % di tutti i dispositivi è migliore. Questo significa che i tempi di risposta rilevati sono peggiori rispetto alla media di tutti i dispositivi testati (20.8 ms). | ||
| ↔ Tempo di risposta dal 50% Grigio all'80% Grigio | ||
| 10.4 ms ... aumenta ↗ e diminuisce ↘ combinato | ↗ 4.8 ms Incremento | 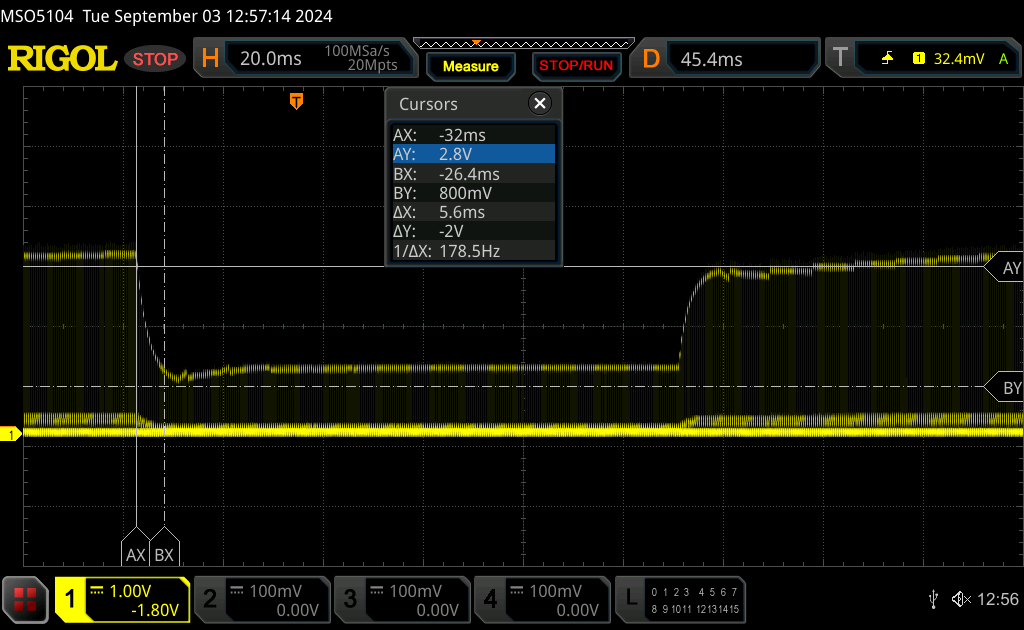 |
| ↘ 5.6 ms Calo | ||
| Lo schermo mostra buoni tempi di risposta durante i nostri tests, ma potrebbe essere troppo lento per i gamers competitivi. In confronto, tutti i dispositivi di test variano da 0.165 (minimo) a 636 (massimo) ms. » 21 % di tutti i dispositivi è migliore. Questo significa che i tempi di risposta rilevati sono migliori rispettto alla media di tutti i dispositivi testati (32.5 ms). | ||
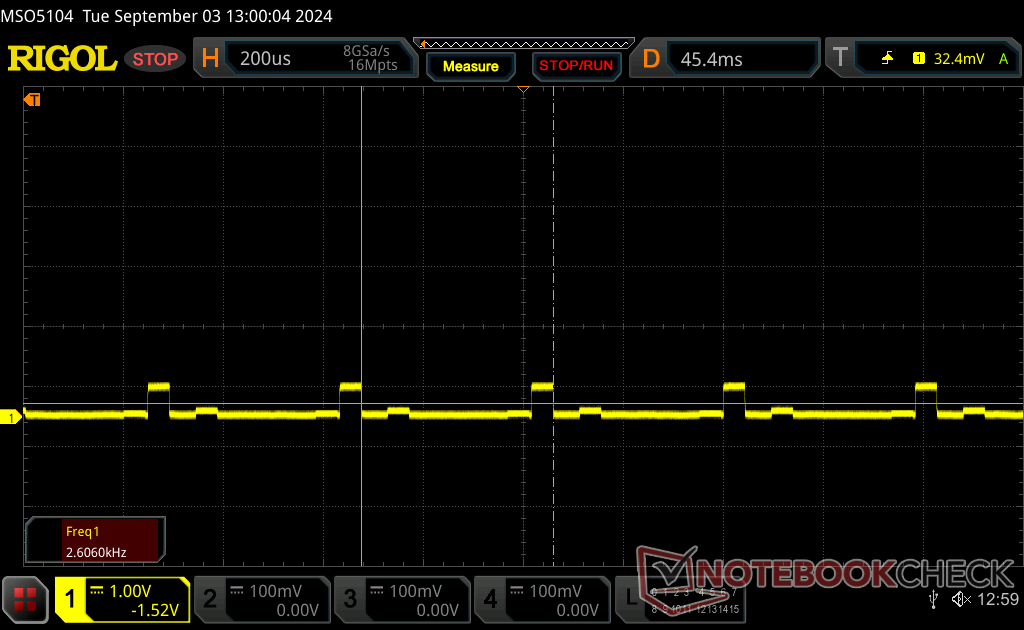
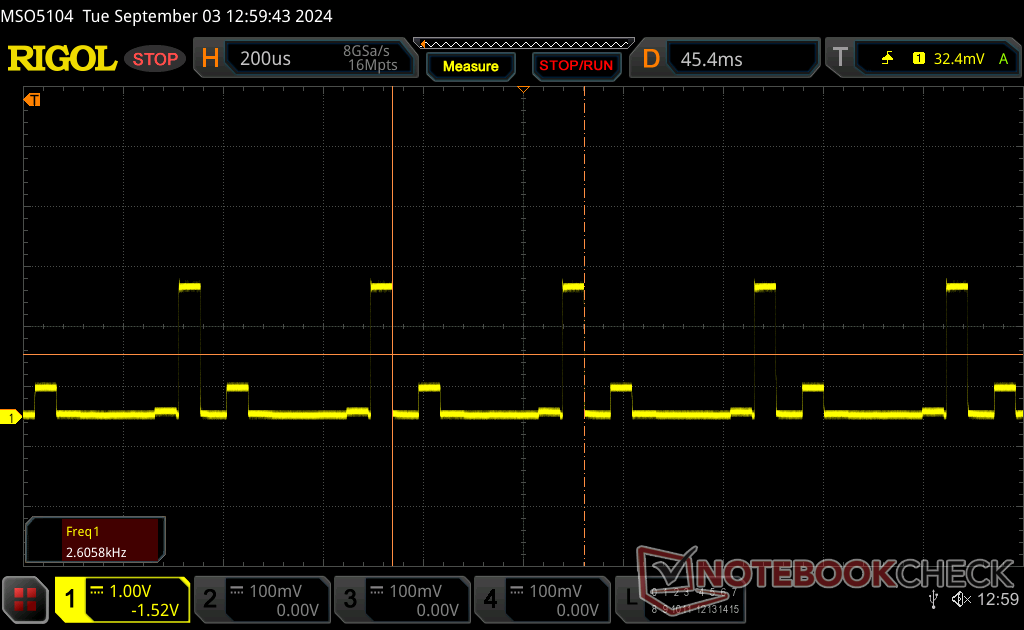
Sfarfallio dello schermo / PWM (Pulse-Width Modulation)
| flickering dello schermo / PWM rilevato | 2606.2 Hz Amplitude: 90 % | ≤ 100 % settaggio luminosita' | 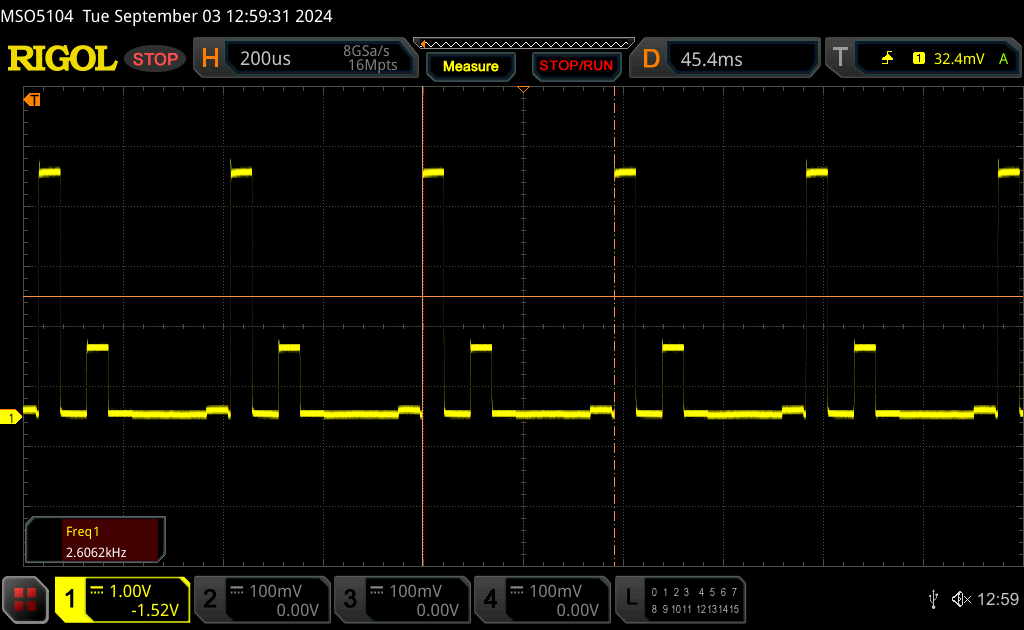 |
Il display sfarfalla a 2606.2 Hz (Probabilmente a causa dell'uso di PWM) Flickering rilevato ad una luminosita' di 100 % o inferiore. Non dovrebbe verificarsi flickering o PWM sopra questo valore di luminosita'. La frequenza di 2606.2 Hz è abbastanza alta, quindi la maggioranza degli utenti sensibili al PWM non dovrebbero notare alcun flickering. In confronto: 53 % di tutti i dispositivi testati non utilizza PWM per ridurre la luminosita' del display. Se è rilevato PWM, una media di 8516 (minimo: 5 - massimo: 343500) Hz è stata rilevata. | |||


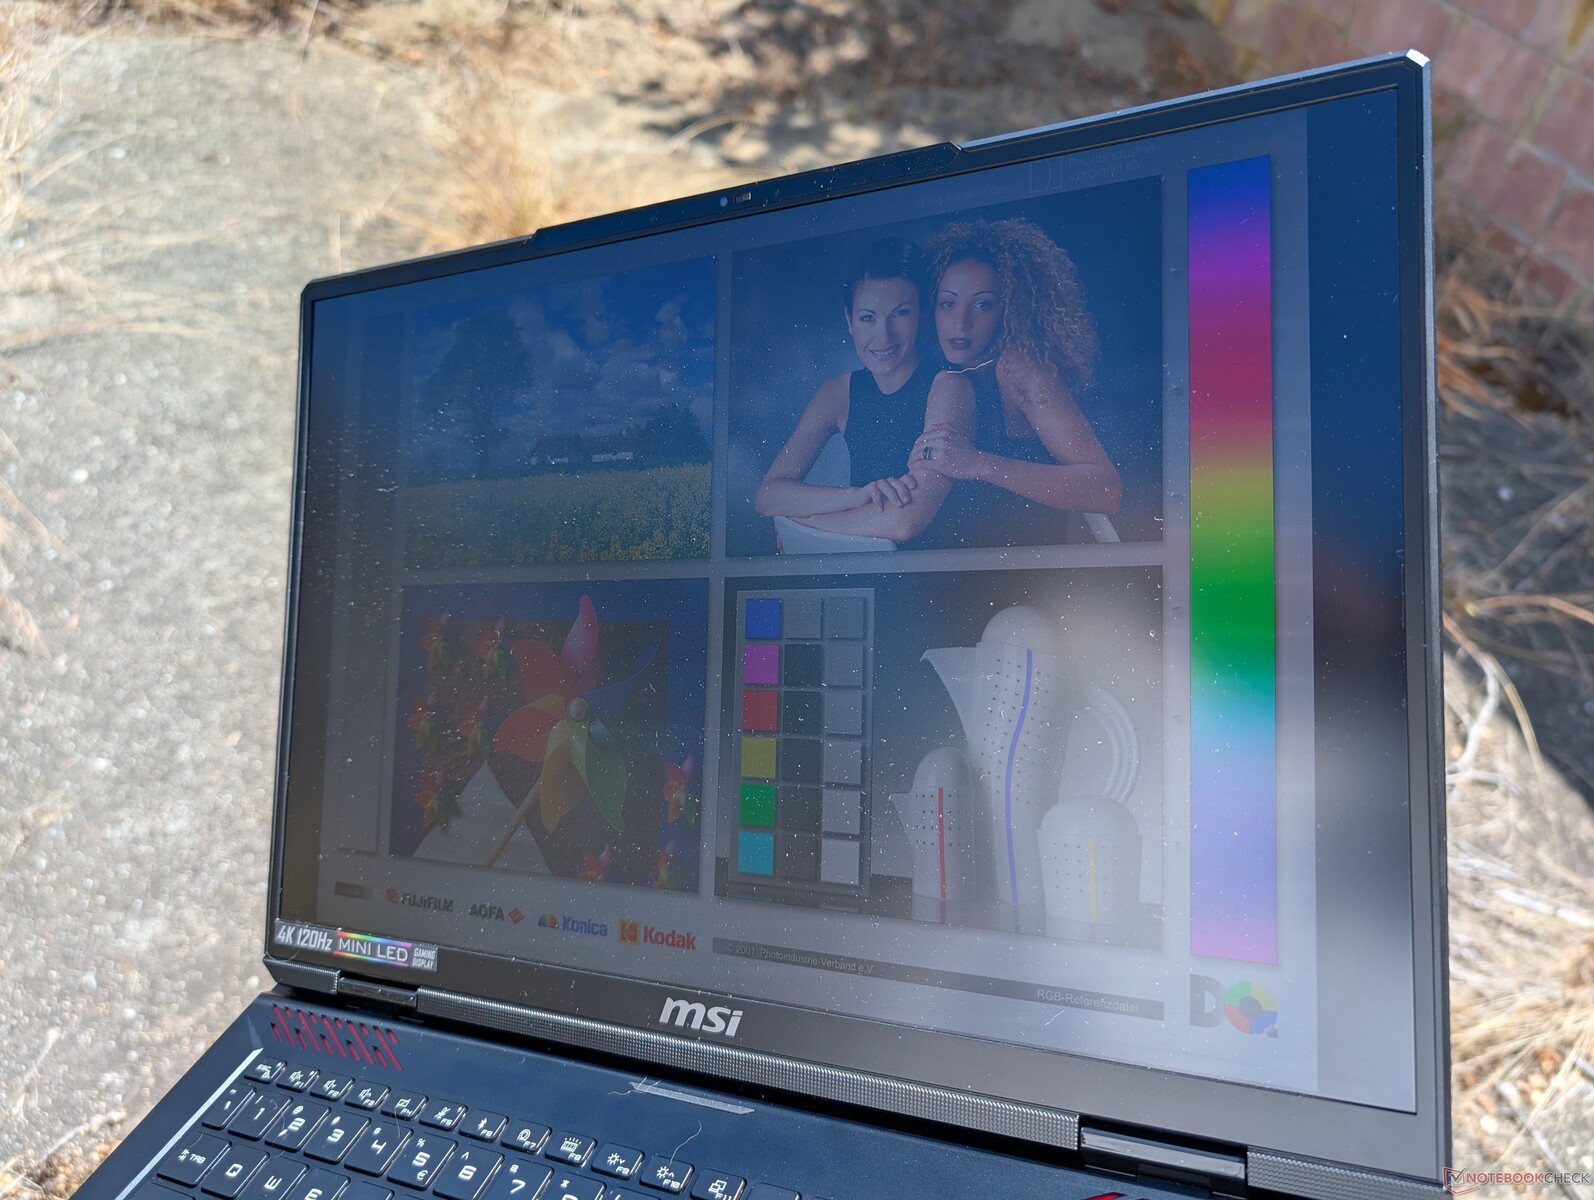
La visibilità all'aperto è solo discreta all'ombra e non è così eccezionale alla luce del sole. Il funzionamento a batteria riduce la luminosità massima a soli 392 nit e l'HDR di Windows viene automaticamente disattivato.
Prestazioni - Nuovo nome della CPU, stesse prestazioni della CPU
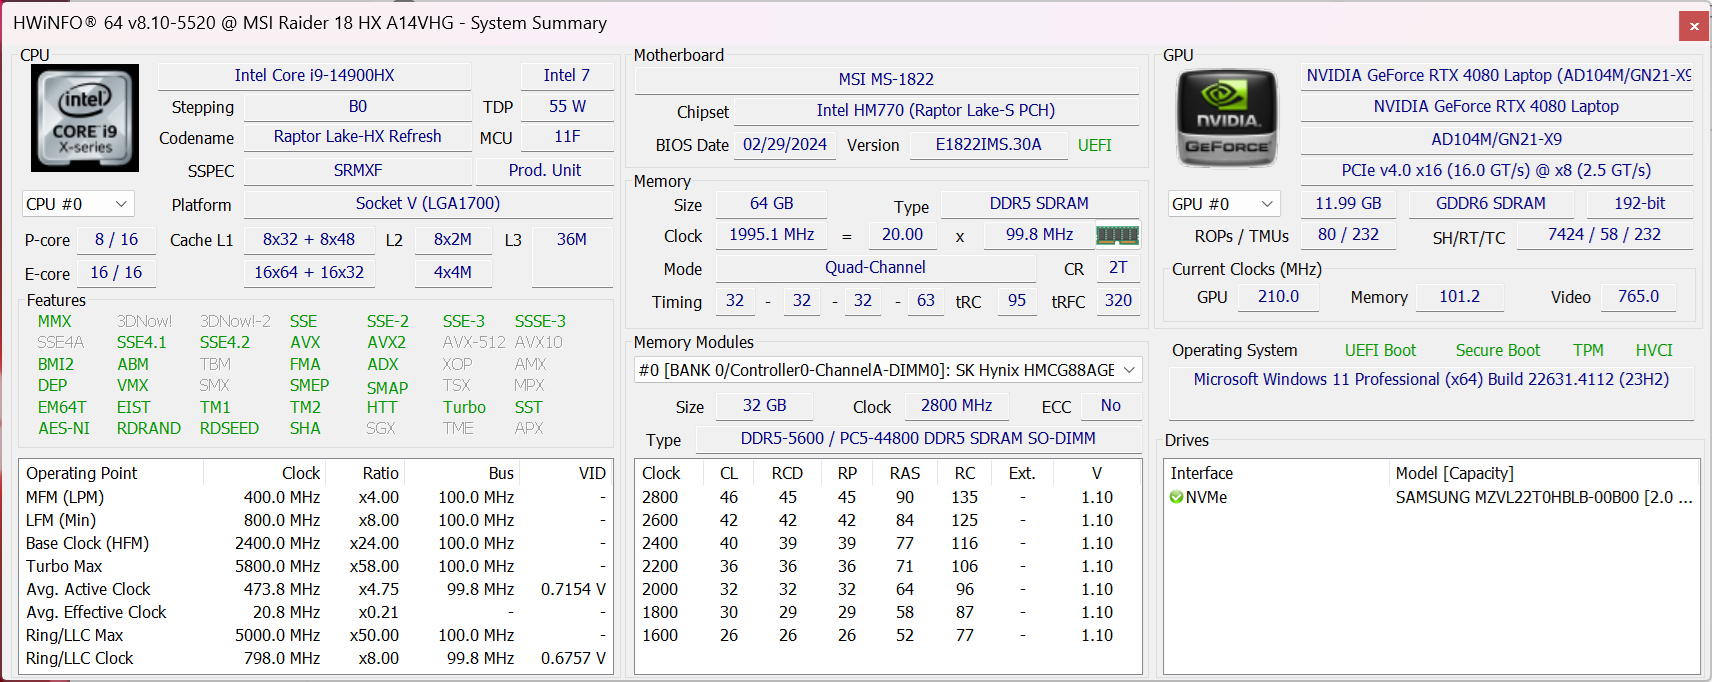
Condizioni del test
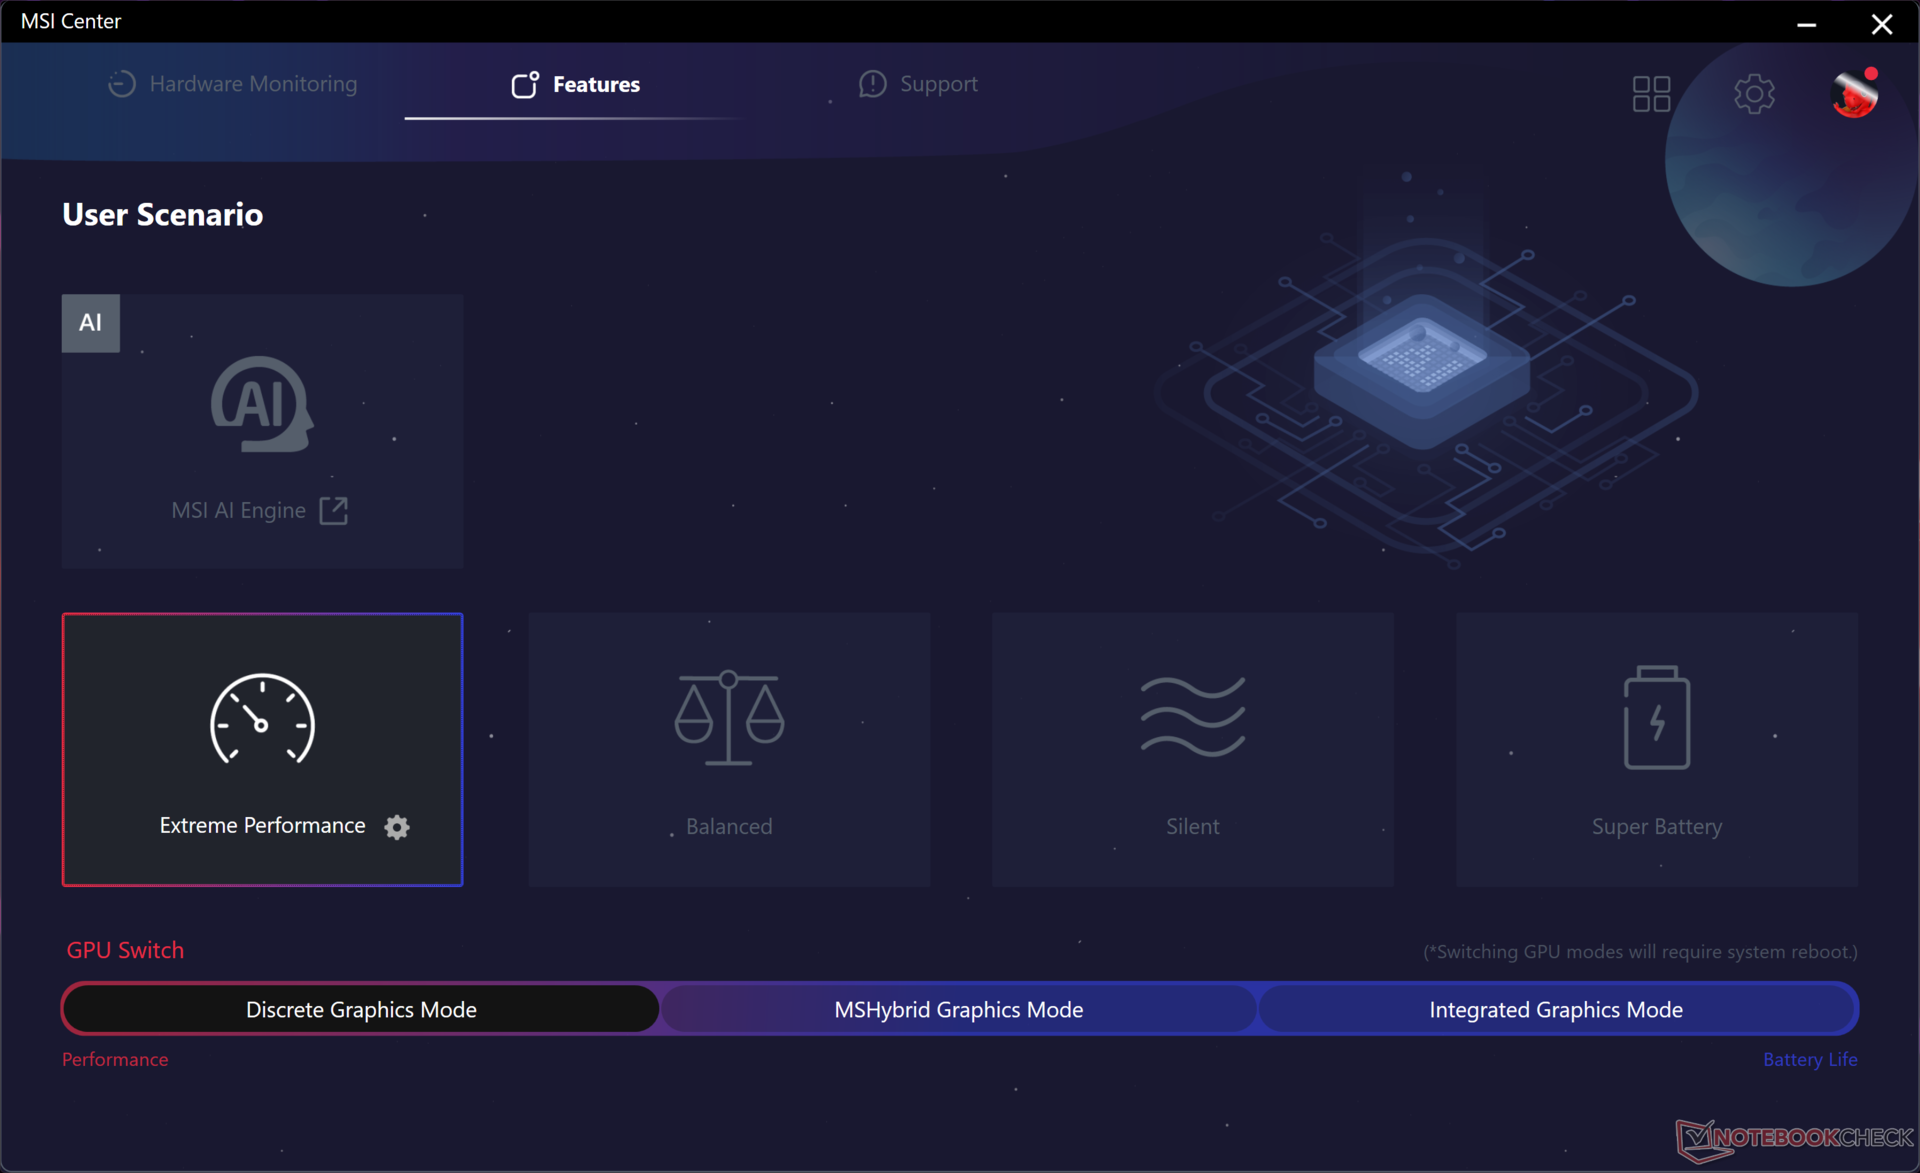
Abbiamo impostato la GPU sulla modalità grafica discreta, Windows sulla modalità Prestazioni e MSI Center sulla modalità Prestazioni estreme prima di eseguire i benchmark qui sotto. La modalità Cooler Boost (cioè la modalità massima della ventola) è un'altra impostazione della modalità Prestazioni estreme, ma questa opzione non è generalmente necessaria per ottenere le massime prestazioni, come dimostreranno i nostri risultati. Questo è coerente con la nostra esperienza su altri computer portatili MSI che presentano la stessa funzione Cooler Boost.
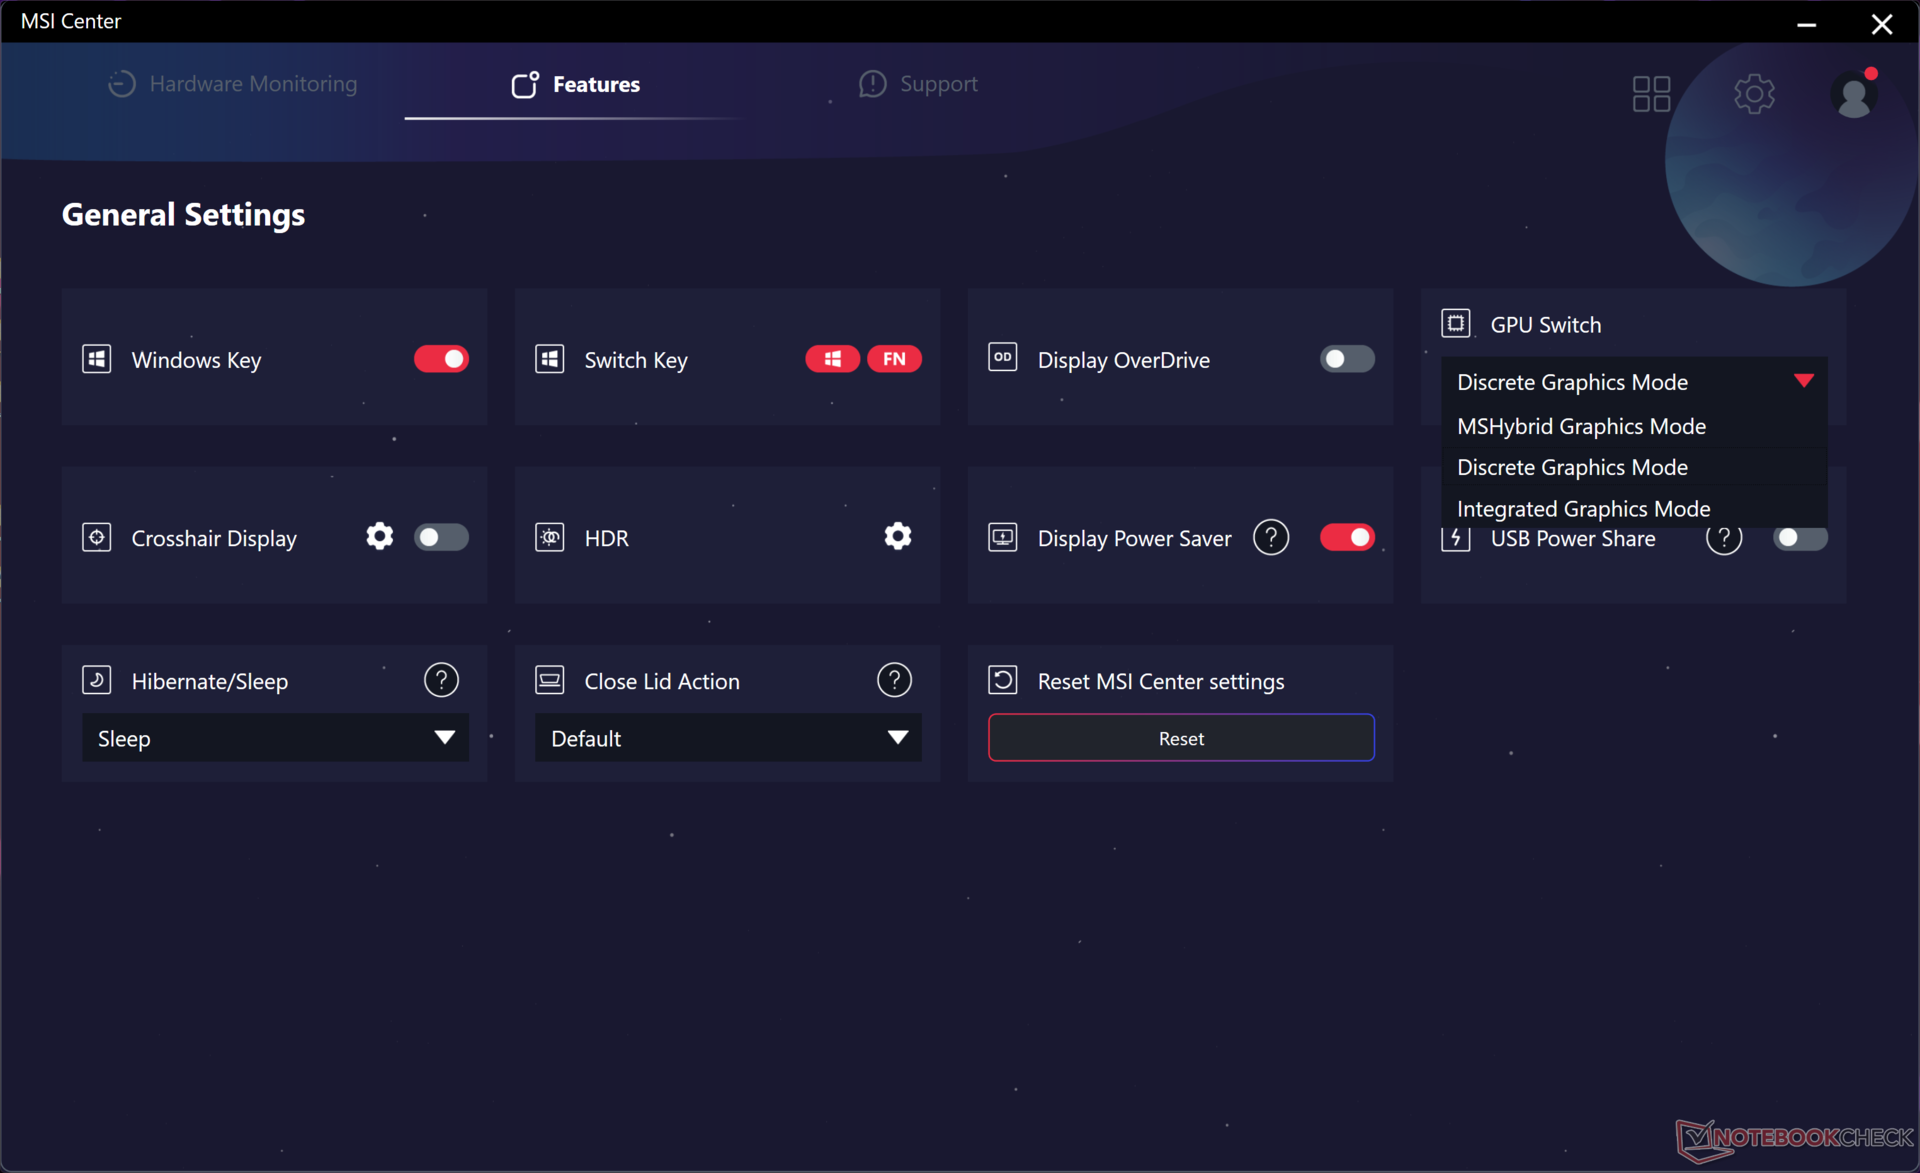
Il MUX è supportato per la commutazione tra le modalità dGPU, iGPU e MSHybrid, ma Advanced Optimus non è presente come sulla Titan 18 HX. Infatti, uno dei principali svantaggi del pannello mini-LED 4K è la mancanza del supporto G-Sync.
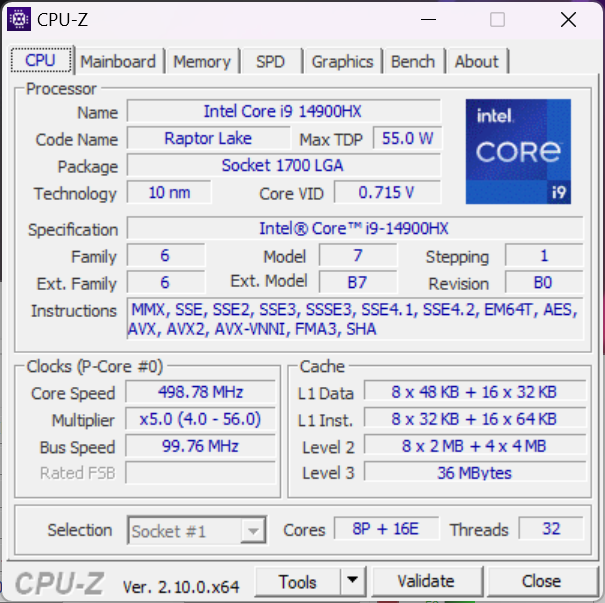
Processore
Il Core i9-14900HX è semplicemente un rebranding del Core i9-13900HX e quindi, nella migliore delle ipotesi, offre solo vantaggi marginali. Nonostante ciò, rimane una delle CPU più veloci disponibili sui computer portatili quando si tratta di metriche di prestazioni tradizionali come CineBench o il rendering di Blender. La CPU integra il Meteor Lake Core Ultra 9 185H che rinuncia ad alcune prestazioni grezze per una NPU integrata che accelera le attività AI.
La sostenibilità delle prestazioni è eccellente, senza grossi cali di velocità di clock quando viene sollecitata, a differenza di quanto abbiamo osservato sul modello Acer Predator Helios 18 dotato della stessa CPU Core i9-14900HX.
Passando alla CPU AMD Ryzen 9 7945HX dovrebbe aumentare le prestazioni multi-thread di circa il 10-15%, mentre le prestazioni single-thread subiscono un calo del 10-15%.
Cinebench R15 Multi Loop
Cinebench R23: Multi Core | Single Core
Cinebench R20: CPU (Multi Core) | CPU (Single Core)
Cinebench R15: CPU Multi 64Bit | CPU Single 64Bit
Blender: v2.79 BMW27 CPU
7-Zip 18.03: 7z b 4 | 7z b 4 -mmt1
Geekbench 6.4: Multi-Core | Single-Core
Geekbench 5.5: Multi-Core | Single-Core
HWBOT x265 Benchmark v2.2: 4k Preset
LibreOffice : 20 Documents To PDF
R Benchmark 2.5: Overall mean
* ... Meglio usare valori piccoli
AIDA64: FP32 Ray-Trace | FPU Julia | CPU SHA3 | CPU Queen | FPU SinJulia | FPU Mandel | CPU AES | CPU ZLib | FP64 Ray-Trace | CPU PhotoWorxx
| Performance Rating | |
| Alienware m18 R2 | |
| MSI Titan 18 HX A14VIG | |
| MSI Raider 18 HX A14V | |
| Media Intel Core i9-14900HX | |
| Razer Blade 18 2024 RZ09-0509 | |
| Acer Predator Helios 18 PH18-72-98MW | |
| Asus ROG Strix G18 G814JI | |
| AIDA64 / FP32 Ray-Trace | |
| MSI Titan 18 HX A14VIG | |
| Alienware m18 R2 | |
| MSI Raider 18 HX A14V | |
| Razer Blade 18 2024 RZ09-0509 | |
| Media Intel Core i9-14900HX (13098 - 33474, n=36) | |
| Acer Predator Helios 18 PH18-72-98MW | |
| Asus ROG Strix G18 G814JI | |
| AIDA64 / FPU Julia | |
| MSI Titan 18 HX A14VIG | |
| Alienware m18 R2 | |
| MSI Raider 18 HX A14V | |
| Razer Blade 18 2024 RZ09-0509 | |
| Media Intel Core i9-14900HX (67573 - 166040, n=36) | |
| Acer Predator Helios 18 PH18-72-98MW | |
| Asus ROG Strix G18 G814JI | |
| AIDA64 / CPU SHA3 | |
| MSI Titan 18 HX A14VIG | |
| Alienware m18 R2 | |
| MSI Raider 18 HX A14V | |
| Razer Blade 18 2024 RZ09-0509 | |
| Media Intel Core i9-14900HX (3589 - 7979, n=36) | |
| Acer Predator Helios 18 PH18-72-98MW | |
| Asus ROG Strix G18 G814JI | |
| AIDA64 / CPU Queen | |
| MSI Titan 18 HX A14VIG | |
| MSI Raider 18 HX A14V | |
| Alienware m18 R2 | |
| Acer Predator Helios 18 PH18-72-98MW | |
| Media Intel Core i9-14900HX (118405 - 148966, n=36) | |
| Razer Blade 18 2024 RZ09-0509 | |
| Asus ROG Strix G18 G814JI | |
| AIDA64 / FPU SinJulia | |
| MSI Titan 18 HX A14VIG | |
| MSI Raider 18 HX A14V | |
| Alienware m18 R2 | |
| Razer Blade 18 2024 RZ09-0509 | |
| Media Intel Core i9-14900HX (10475 - 18517, n=36) | |
| Acer Predator Helios 18 PH18-72-98MW | |
| Asus ROG Strix G18 G814JI | |
| AIDA64 / FPU Mandel | |
| Alienware m18 R2 | |
| MSI Titan 18 HX A14VIG | |
| MSI Raider 18 HX A14V | |
| Razer Blade 18 2024 RZ09-0509 | |
| Media Intel Core i9-14900HX (32543 - 83662, n=36) | |
| Acer Predator Helios 18 PH18-72-98MW | |
| Asus ROG Strix G18 G814JI | |
| AIDA64 / CPU AES | |
| Media Intel Core i9-14900HX (86964 - 241777, n=36) | |
| MSI Titan 18 HX A14VIG | |
| Alienware m18 R2 | |
| MSI Raider 18 HX A14V | |
| Razer Blade 18 2024 RZ09-0509 | |
| Acer Predator Helios 18 PH18-72-98MW | |
| Asus ROG Strix G18 G814JI | |
| AIDA64 / CPU ZLib | |
| MSI Titan 18 HX A14VIG | |
| Alienware m18 R2 | |
| MSI Raider 18 HX A14V | |
| Razer Blade 18 2024 RZ09-0509 | |
| Media Intel Core i9-14900HX (1054 - 2292, n=36) | |
| Acer Predator Helios 18 PH18-72-98MW | |
| Asus ROG Strix G18 G814JI | |
| AIDA64 / FP64 Ray-Trace | |
| Alienware m18 R2 | |
| MSI Titan 18 HX A14VIG | |
| MSI Raider 18 HX A14V | |
| Razer Blade 18 2024 RZ09-0509 | |
| Media Intel Core i9-14900HX (6809 - 18349, n=36) | |
| Acer Predator Helios 18 PH18-72-98MW | |
| Asus ROG Strix G18 G814JI | |
| AIDA64 / CPU PhotoWorxx | |
| Alienware m18 R2 | |
| Razer Blade 18 2024 RZ09-0509 | |
| Acer Predator Helios 18 PH18-72-98MW | |
| Media Intel Core i9-14900HX (23903 - 54702, n=36) | |
| Asus ROG Strix G18 G814JI | |
| MSI Raider 18 HX A14V | |
| MSI Titan 18 HX A14VIG | |
Test da sforzo
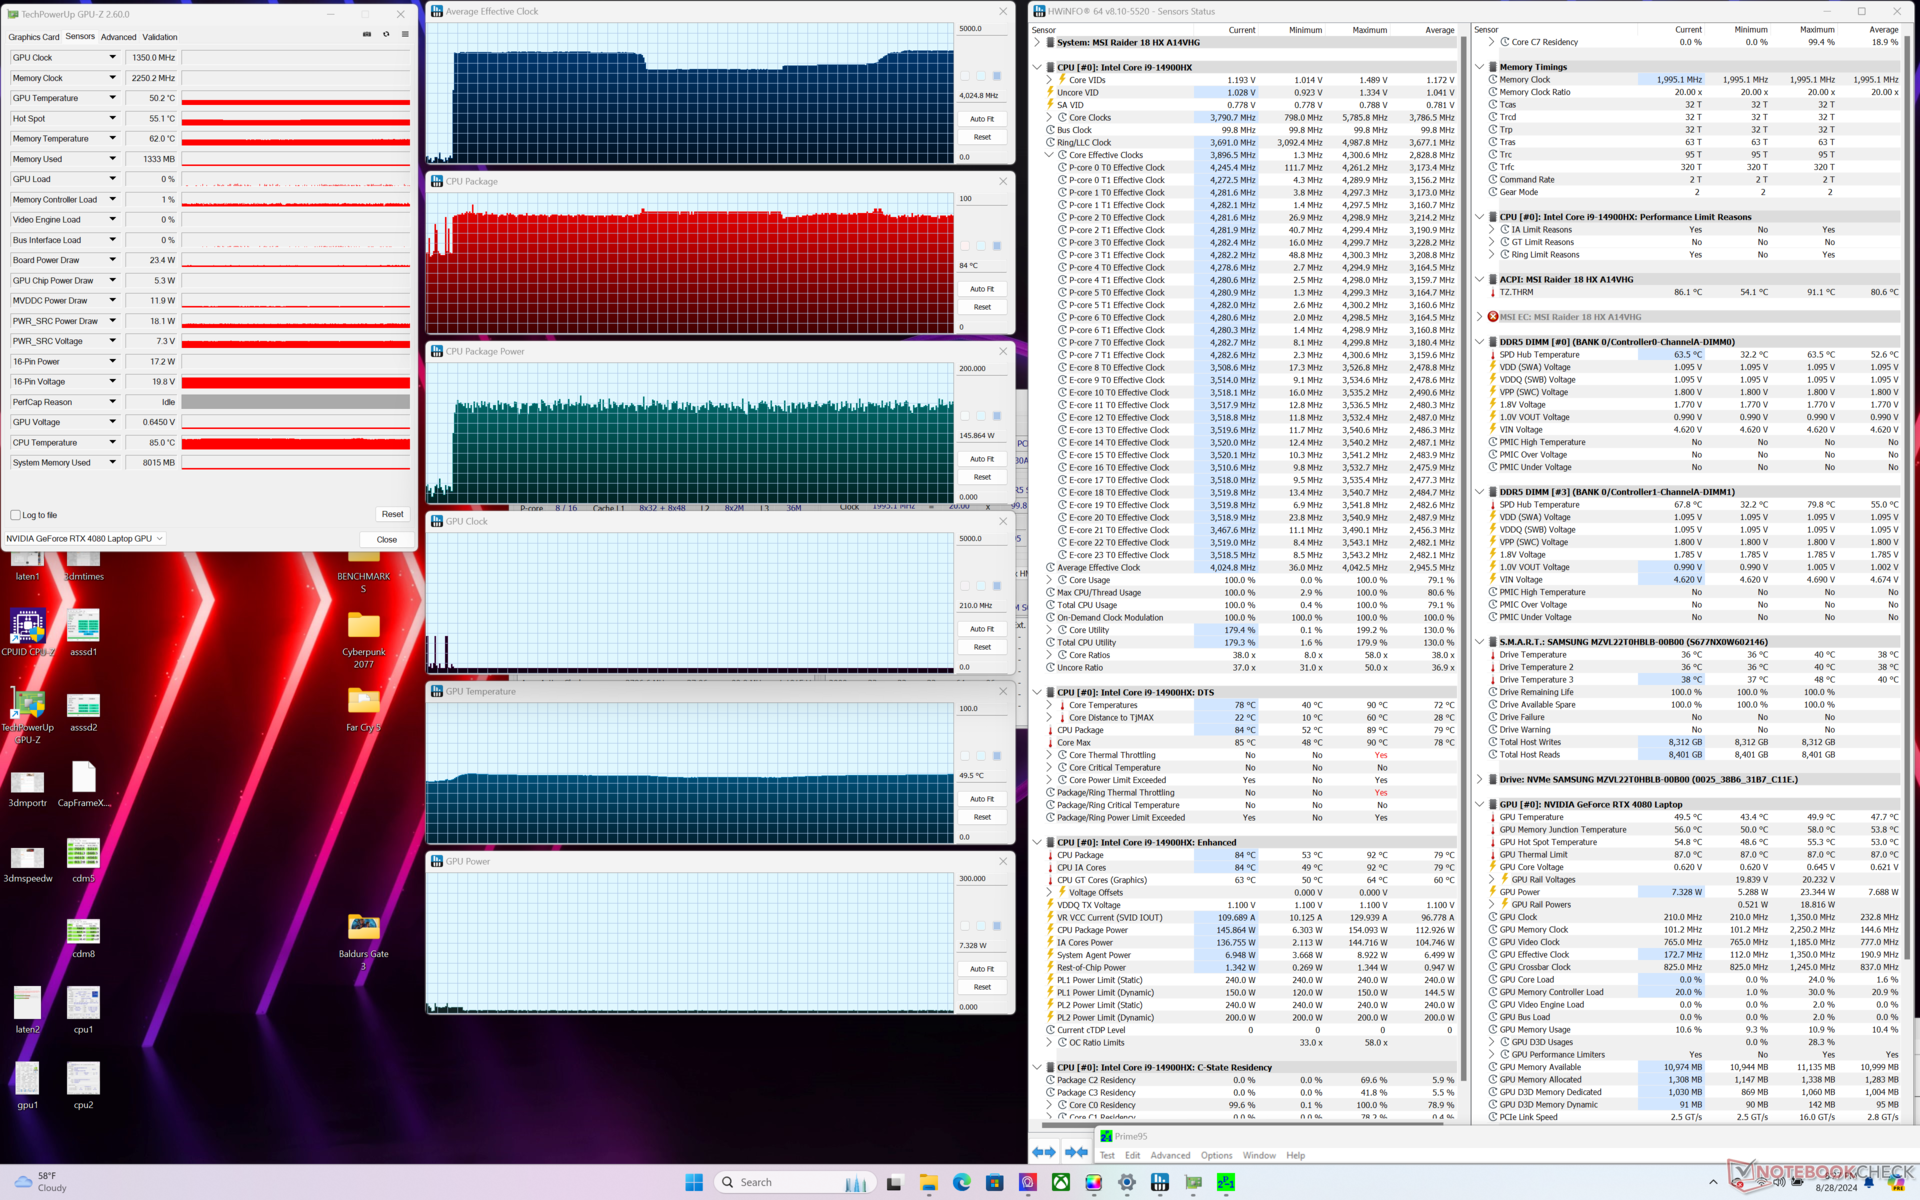
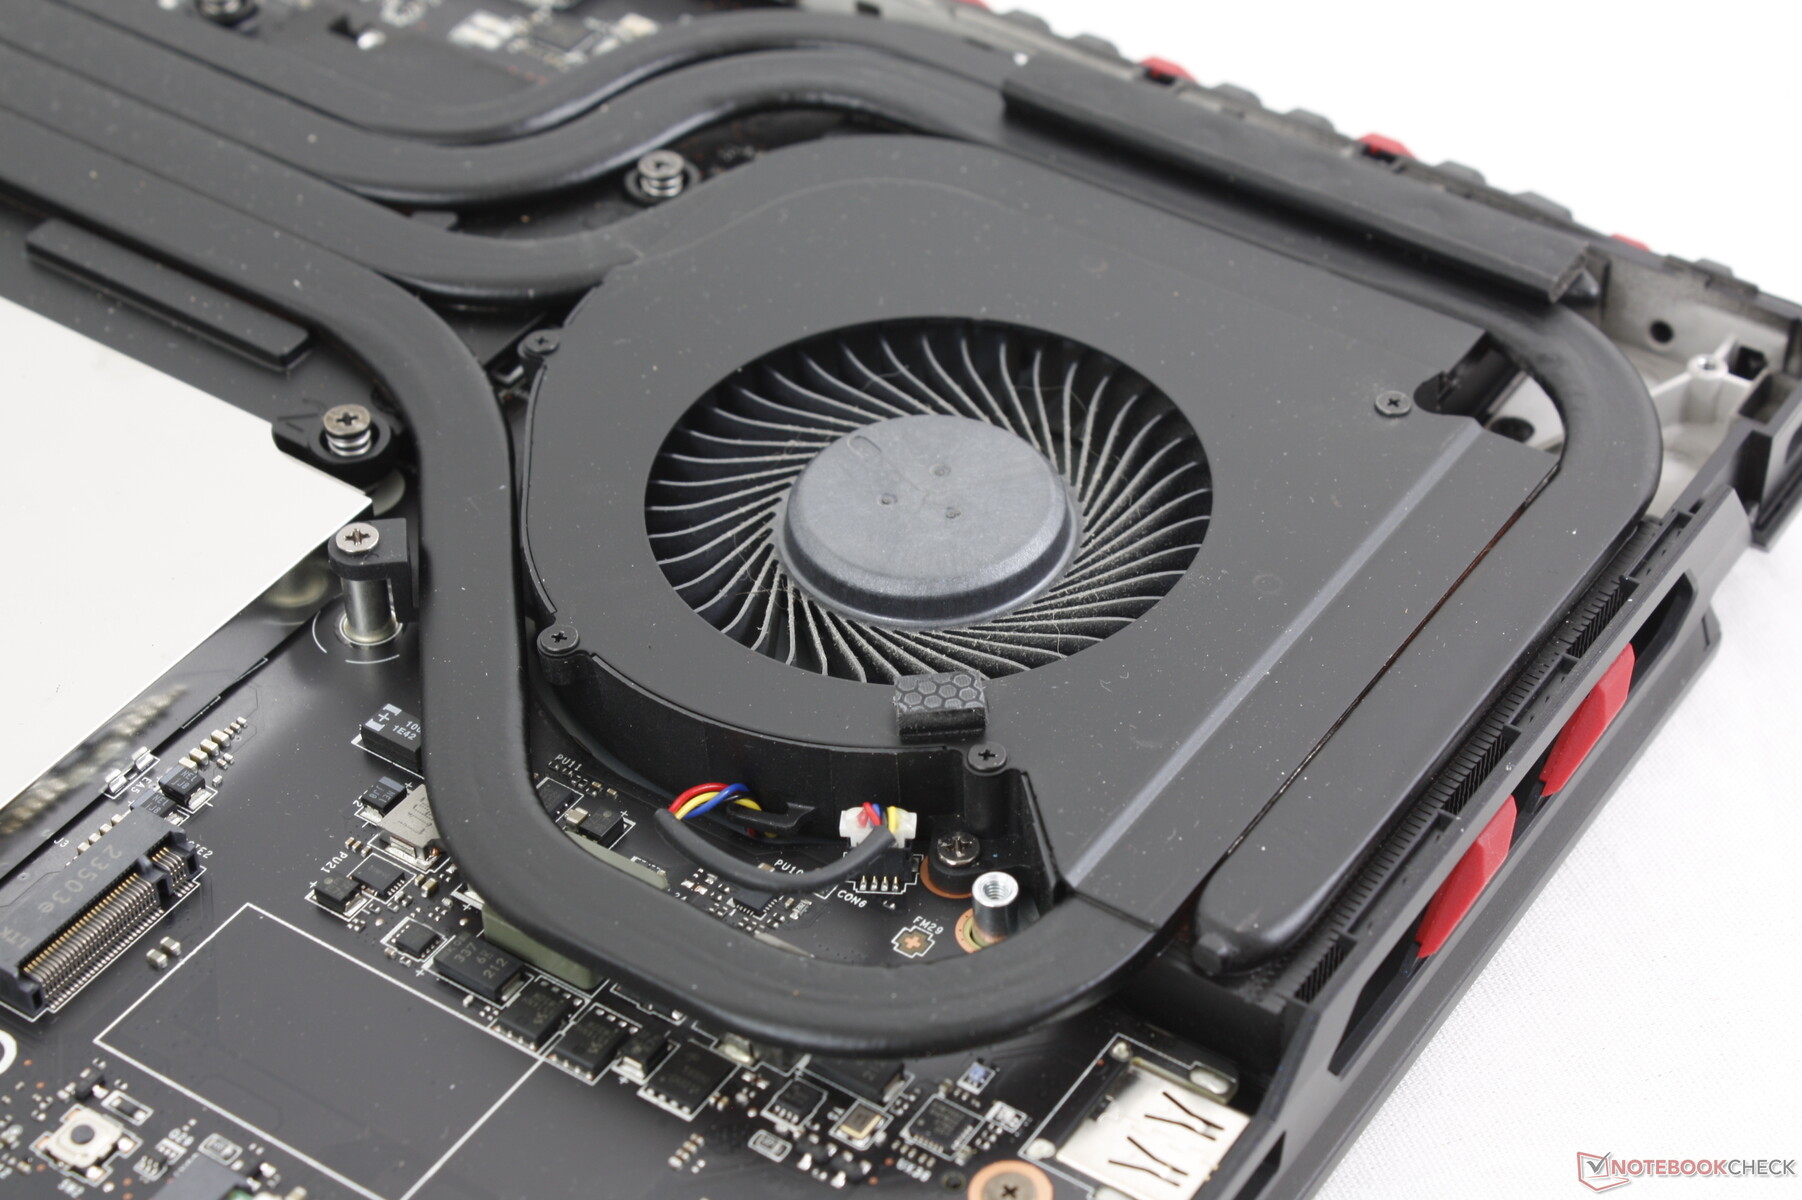
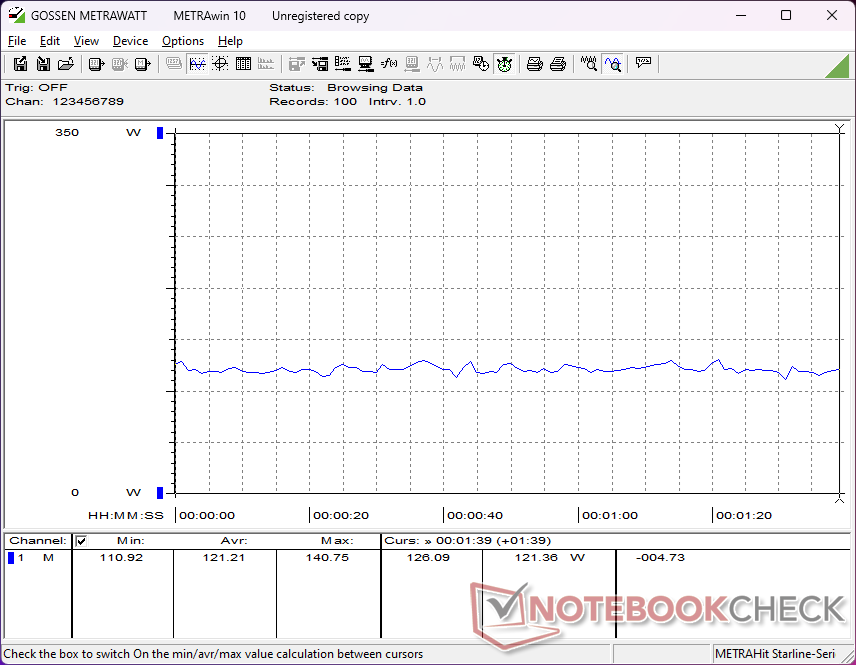
La CPU è arrivata a 4 GHz, 86 C e 145 W quando è stato avviato lo stress Prime95, senza cali importanti nelle velocità di clock o nelle prestazioni nel corso del tempo. L'ampio chassis e la soluzione di raffreddamento possono estrarre maggiori prestazioni dal Core i9-14900HX rispetto a sistemi più piccoli con lo stesso processore, come il RedMagic Titan 16 Pro RedMagic Titan 16 Pro che subiscono un forte throttling.
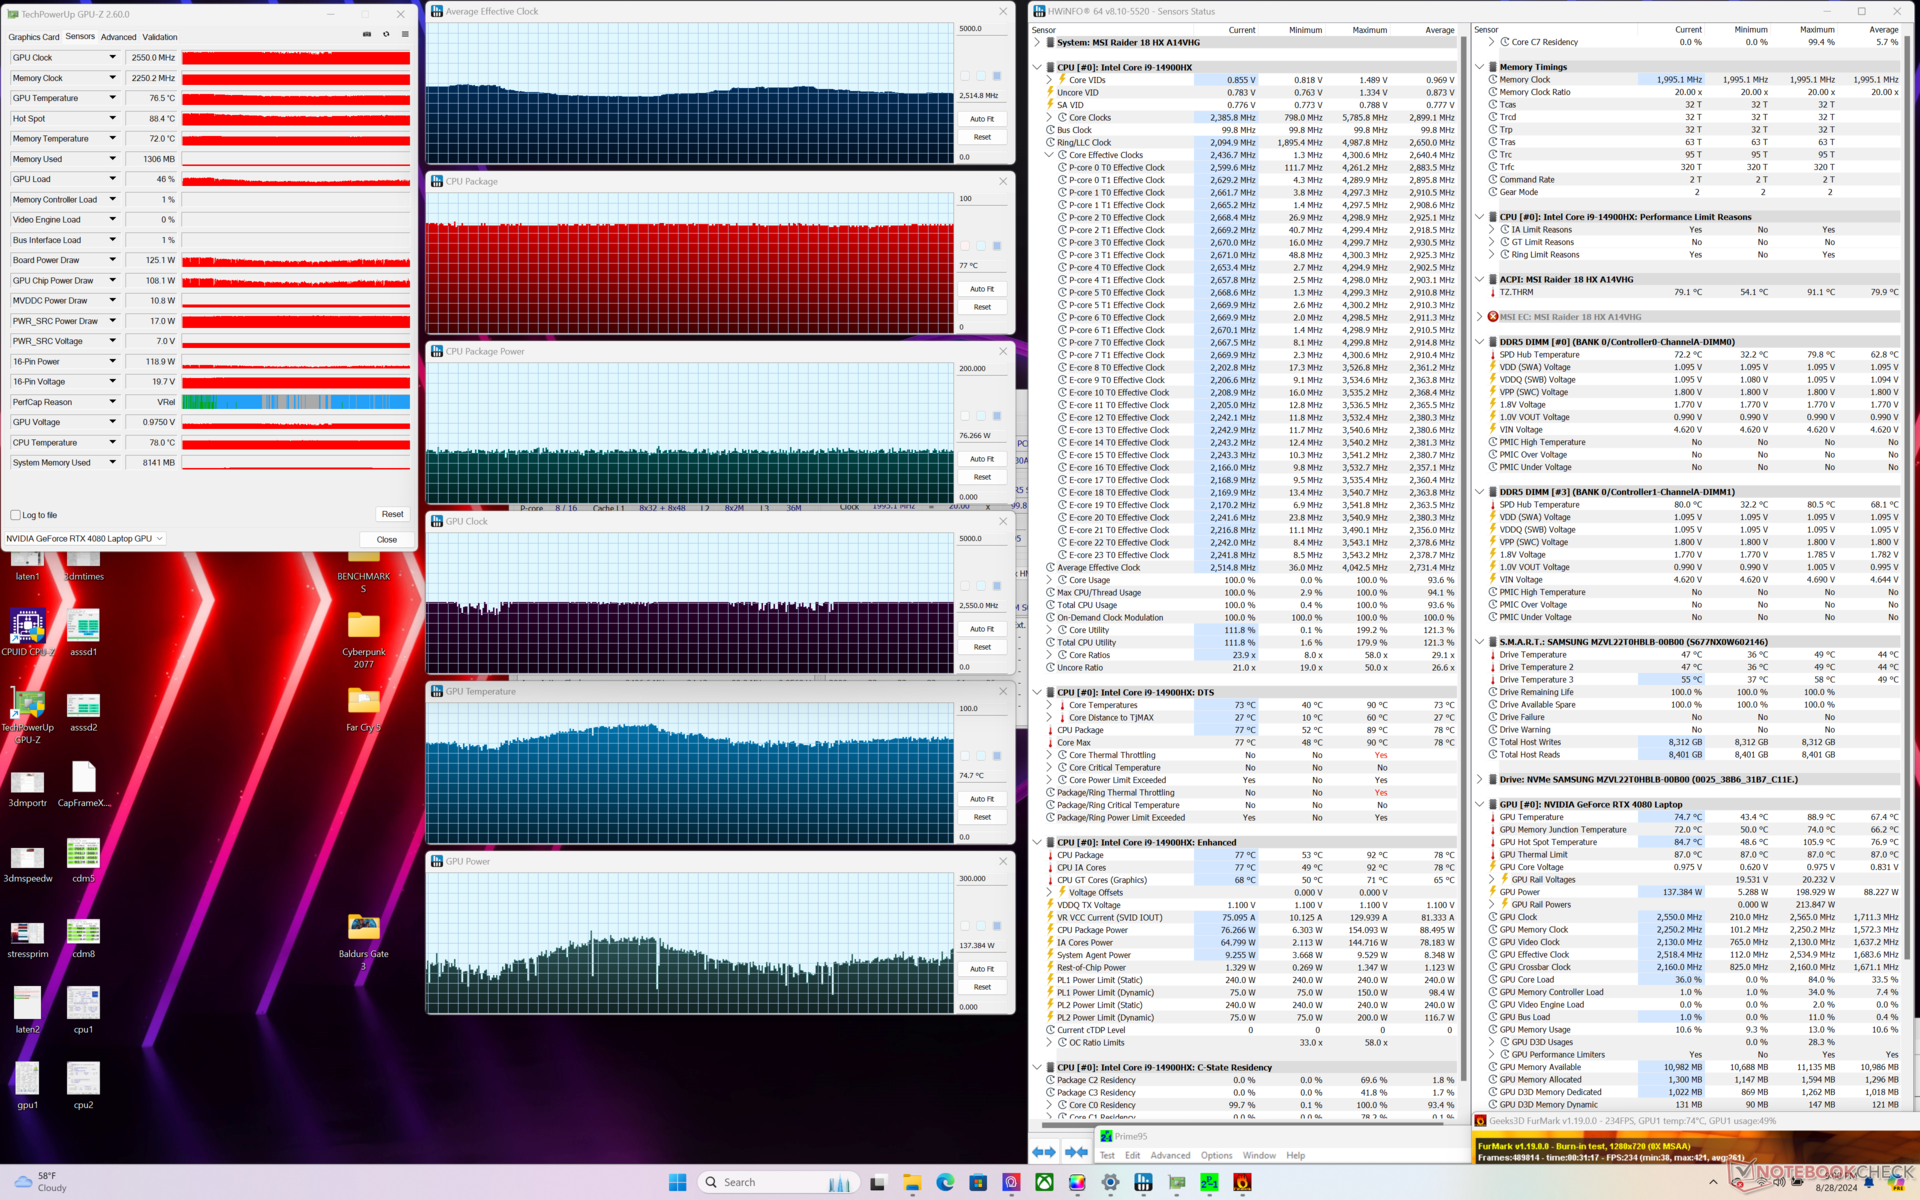
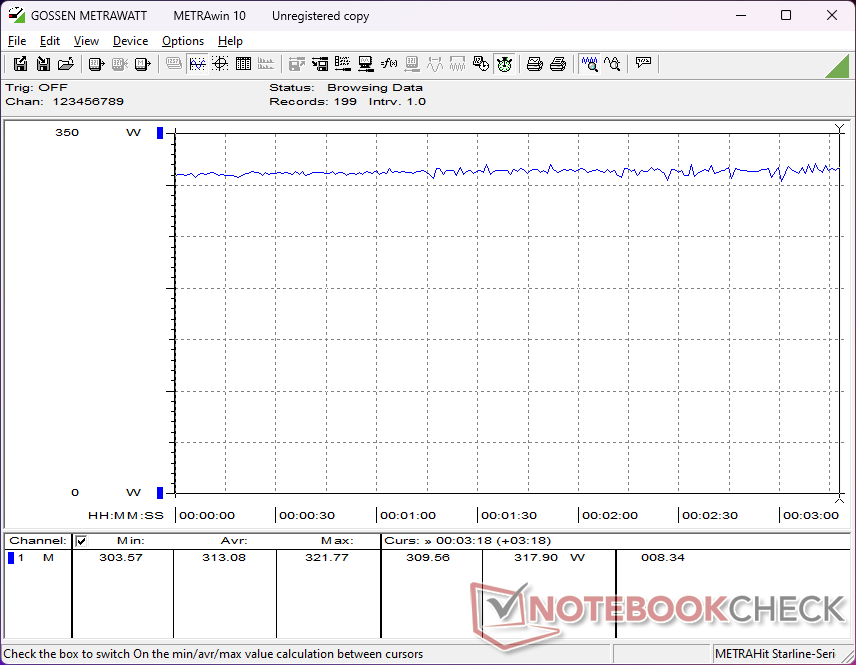
L'esecuzione in modalità Extreme Performance con Cooler Boost attivato non offre vantaggi tangibili in termini di prestazioni rispetto a Cooler Boost disattivato durante i giochi. Le frequenze di clock della GPU, le frequenze di clock della memoria e l'assorbimento di potenza della scheda durante l'esecuzione di Cyberpunk 2077 si stabilizzano rispettivamente a 2550 MHz, 2250 MHz e 159 W tra le due impostazioni. Le temperature del core sono leggermente più basse di qualche grado C con Cooler Boost attivato, poiché il rumore della ventola è più forte, ma questo è l'unico vantaggio degno di nota.
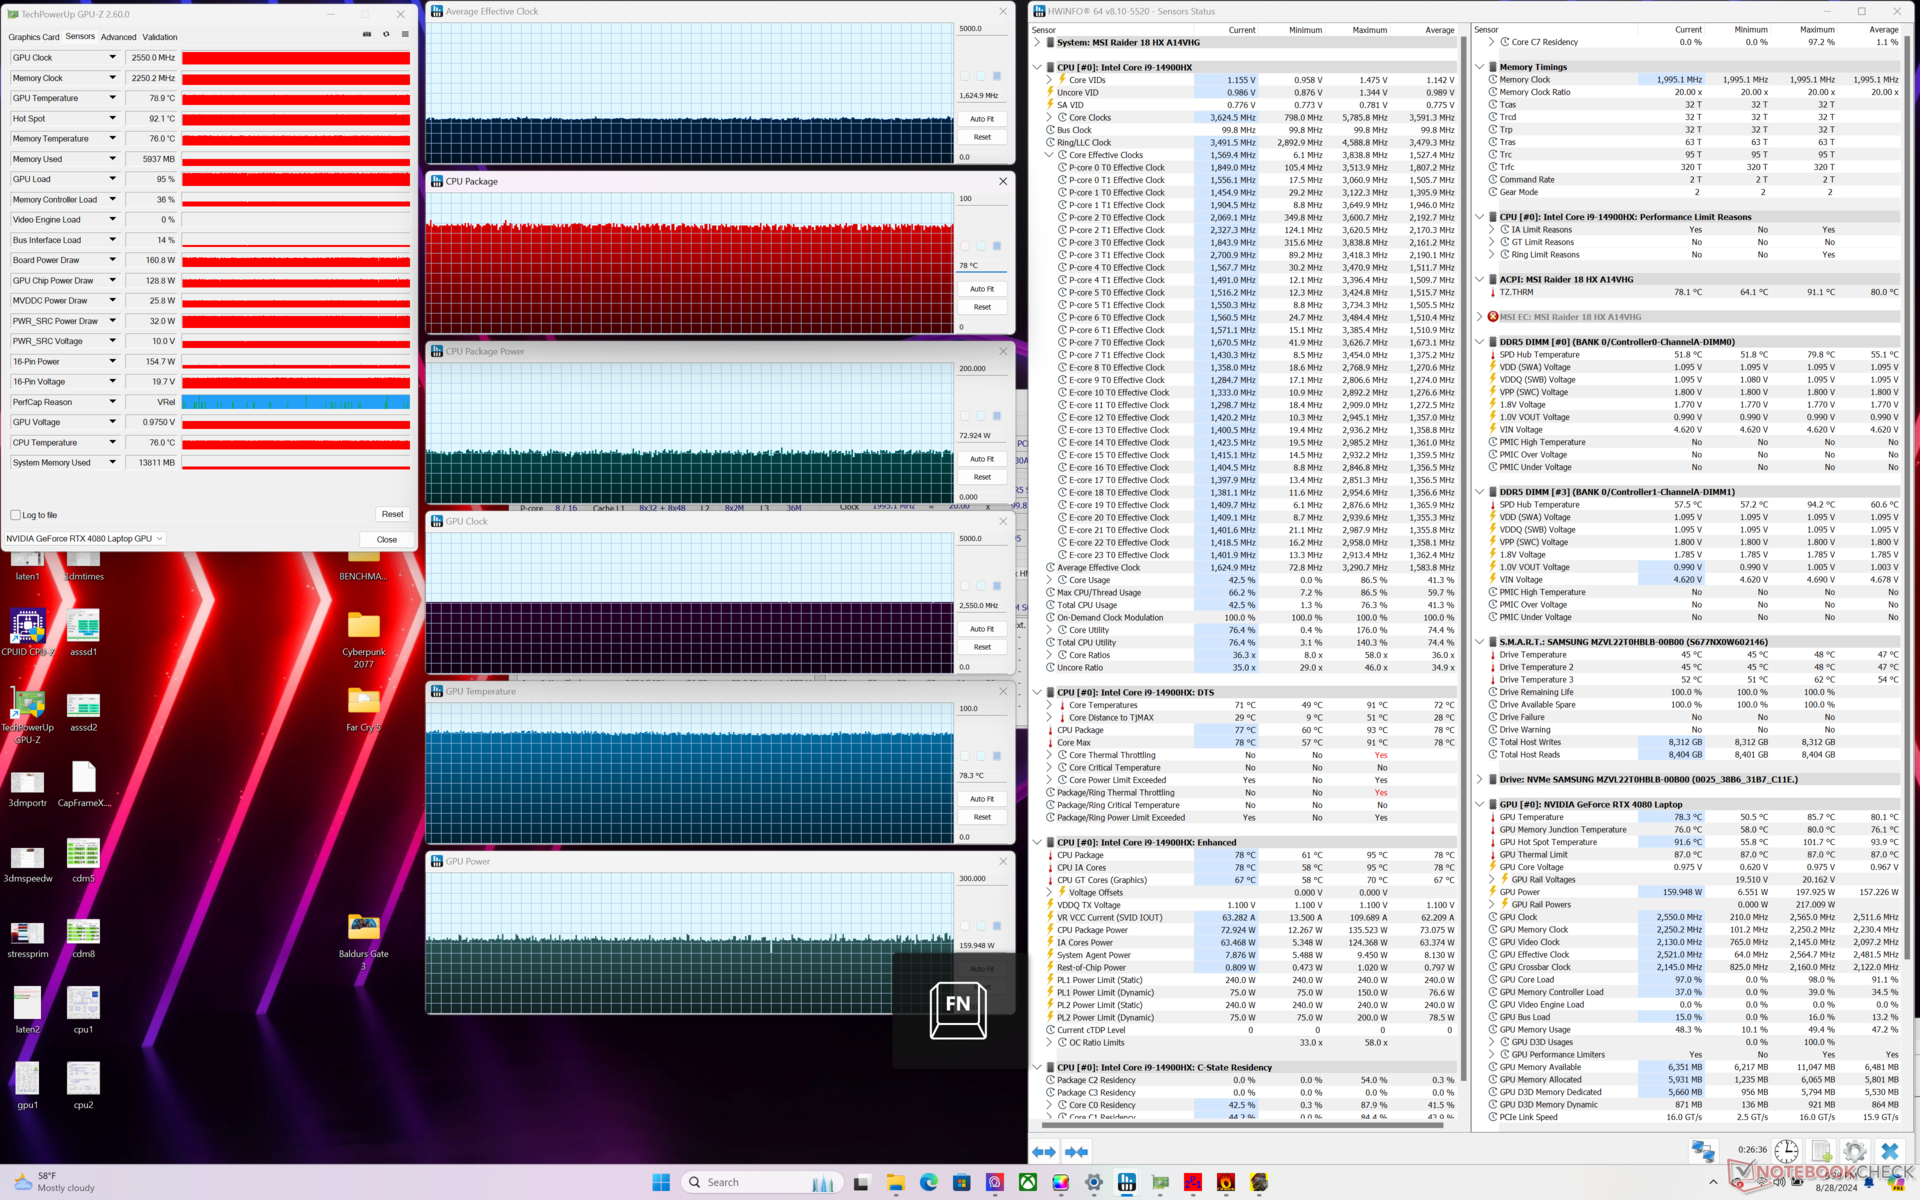
La discesa alla modalità Bilanciata riduce le velocità di clock della GPU e l'assorbimento di potenza della scheda a 2295 MHz e 150 W, rispettivamente, che sono solo marginalmente più lente della modalità Extreme Performance. I delta delle prestazioni tra le modalità Bilanciata e Prestazioni estreme sono quindi inferiori a quanto ci si potrebbe aspettare.
Le temperature della GPU sono più calde rispetto a quelle del Razer Blade 18 fino a 9 C durante i giochi, anche se il nostro MSI è il sistema più spesso e più pesante.
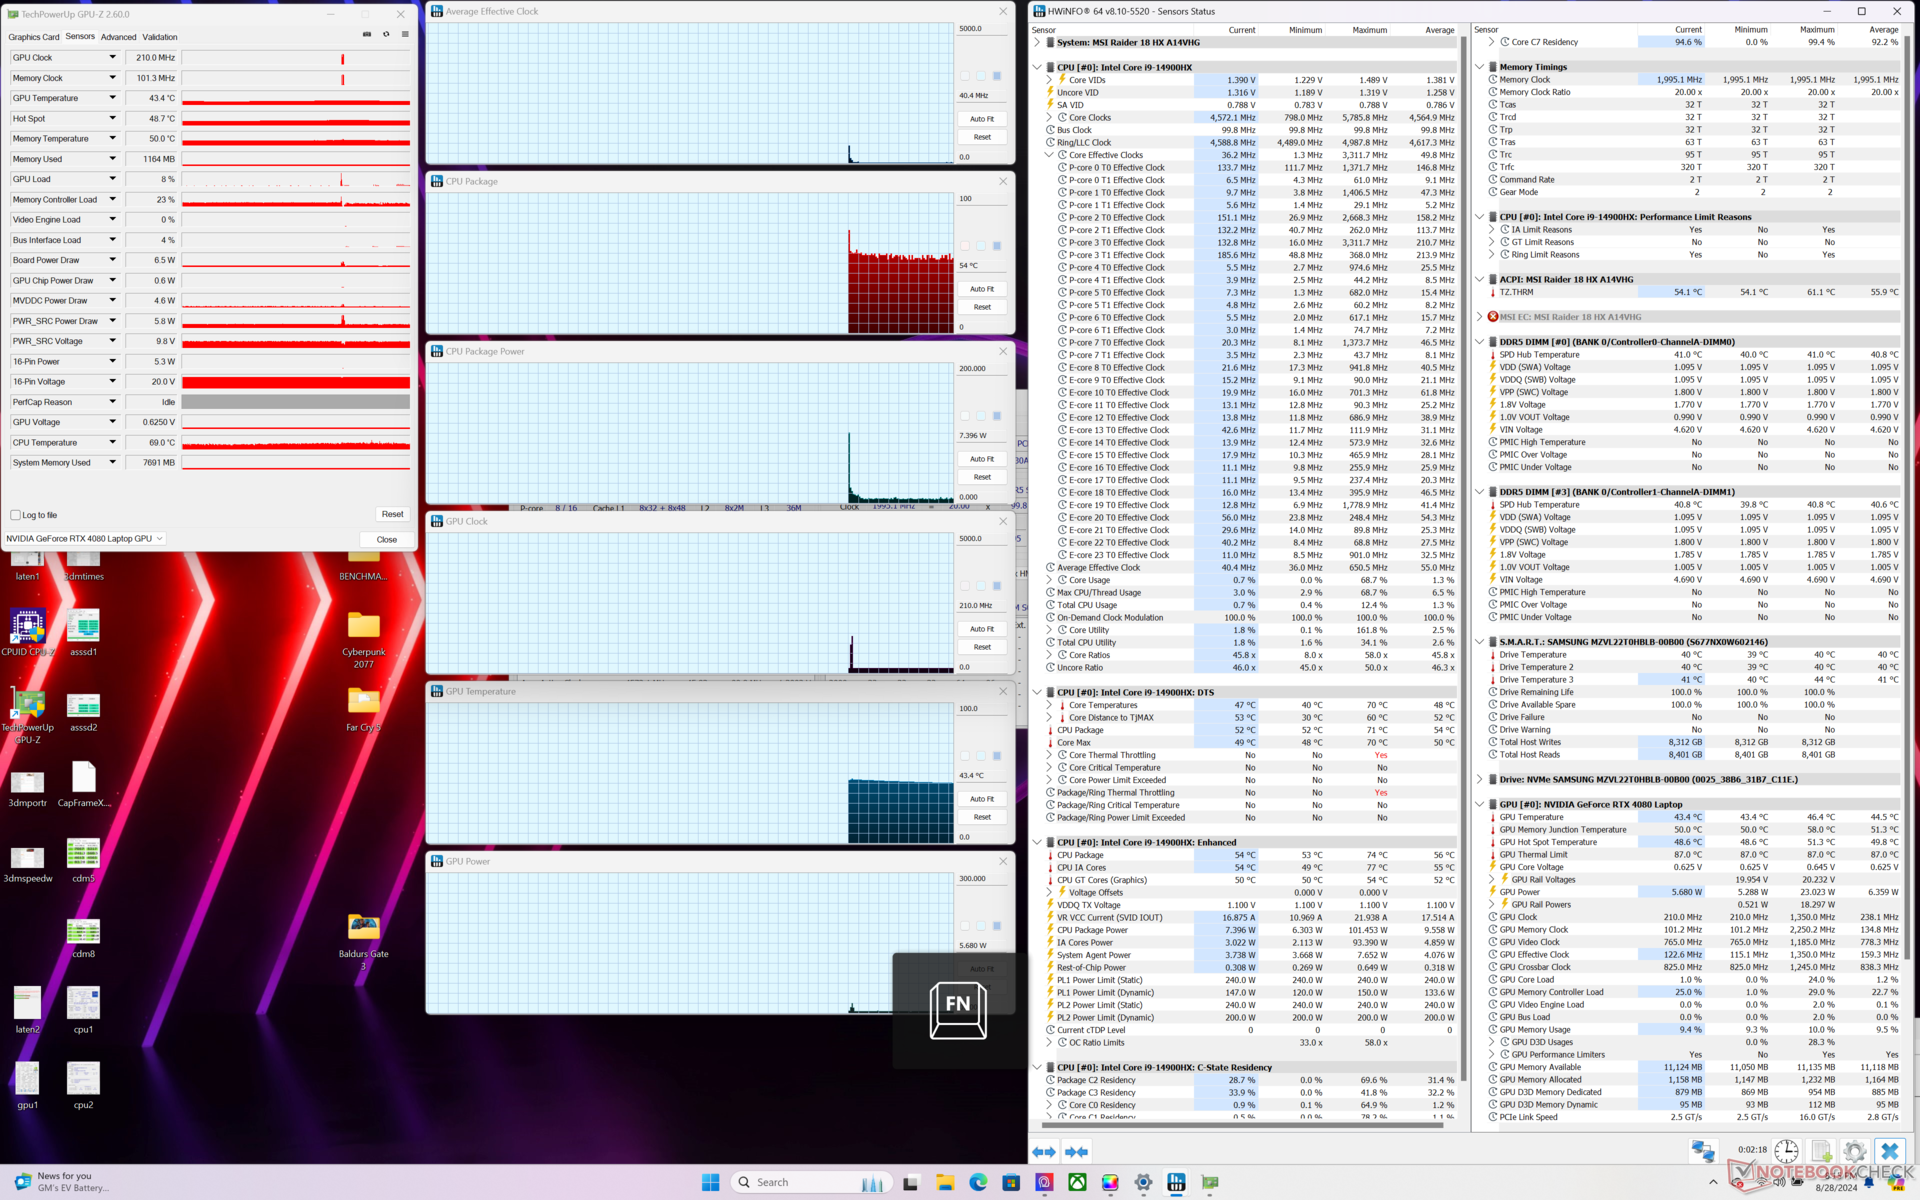

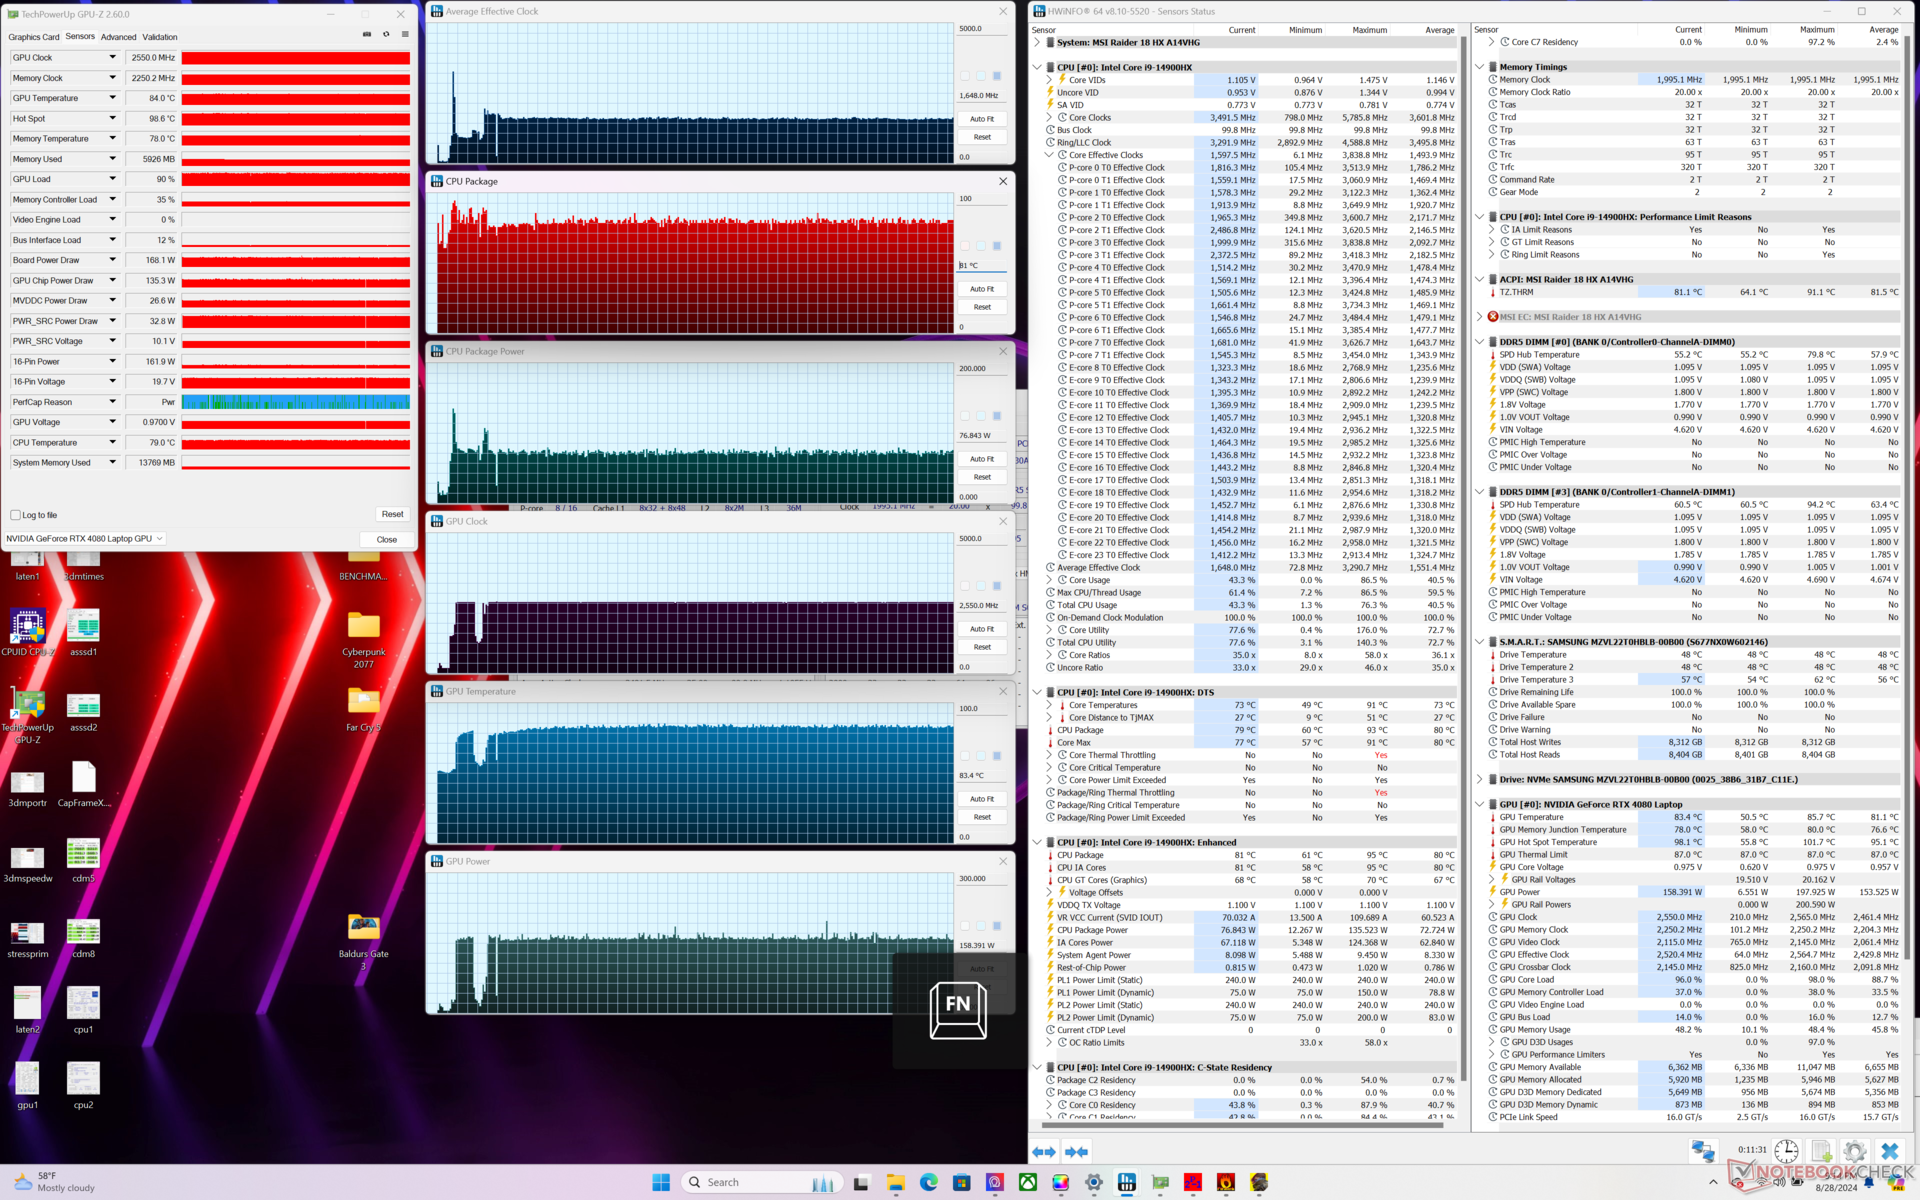
| Clock medio della CPU (GHz) | Clock della GPU (MHz) | Temperatura media della CPU (°C) | Temperatura media della GPU (°C) | |
| Sistema inattivo | -- | -- | 54 | 43 |
| Prime95 Stress | 4.0 | -- | 84 | 50 |
| Prime95 + FurMark Stress | 2,5 | 2550 | 77 | 75 |
| Cyberpunk 2077 Stress (modalità bilanciata) | 1,5 | 2295 | 78 | 85 |
| Cyberpunk 2077 Stress (Prestazioni estreme con Cooler Boost disattivato) | 1,7 | 2550 | 81 | 83 |
| Cyberpunk 2077 Stress (Prestazioni estreme con Cooler Boost attivato) | 1.6 | 2550 | 78 | 78 |
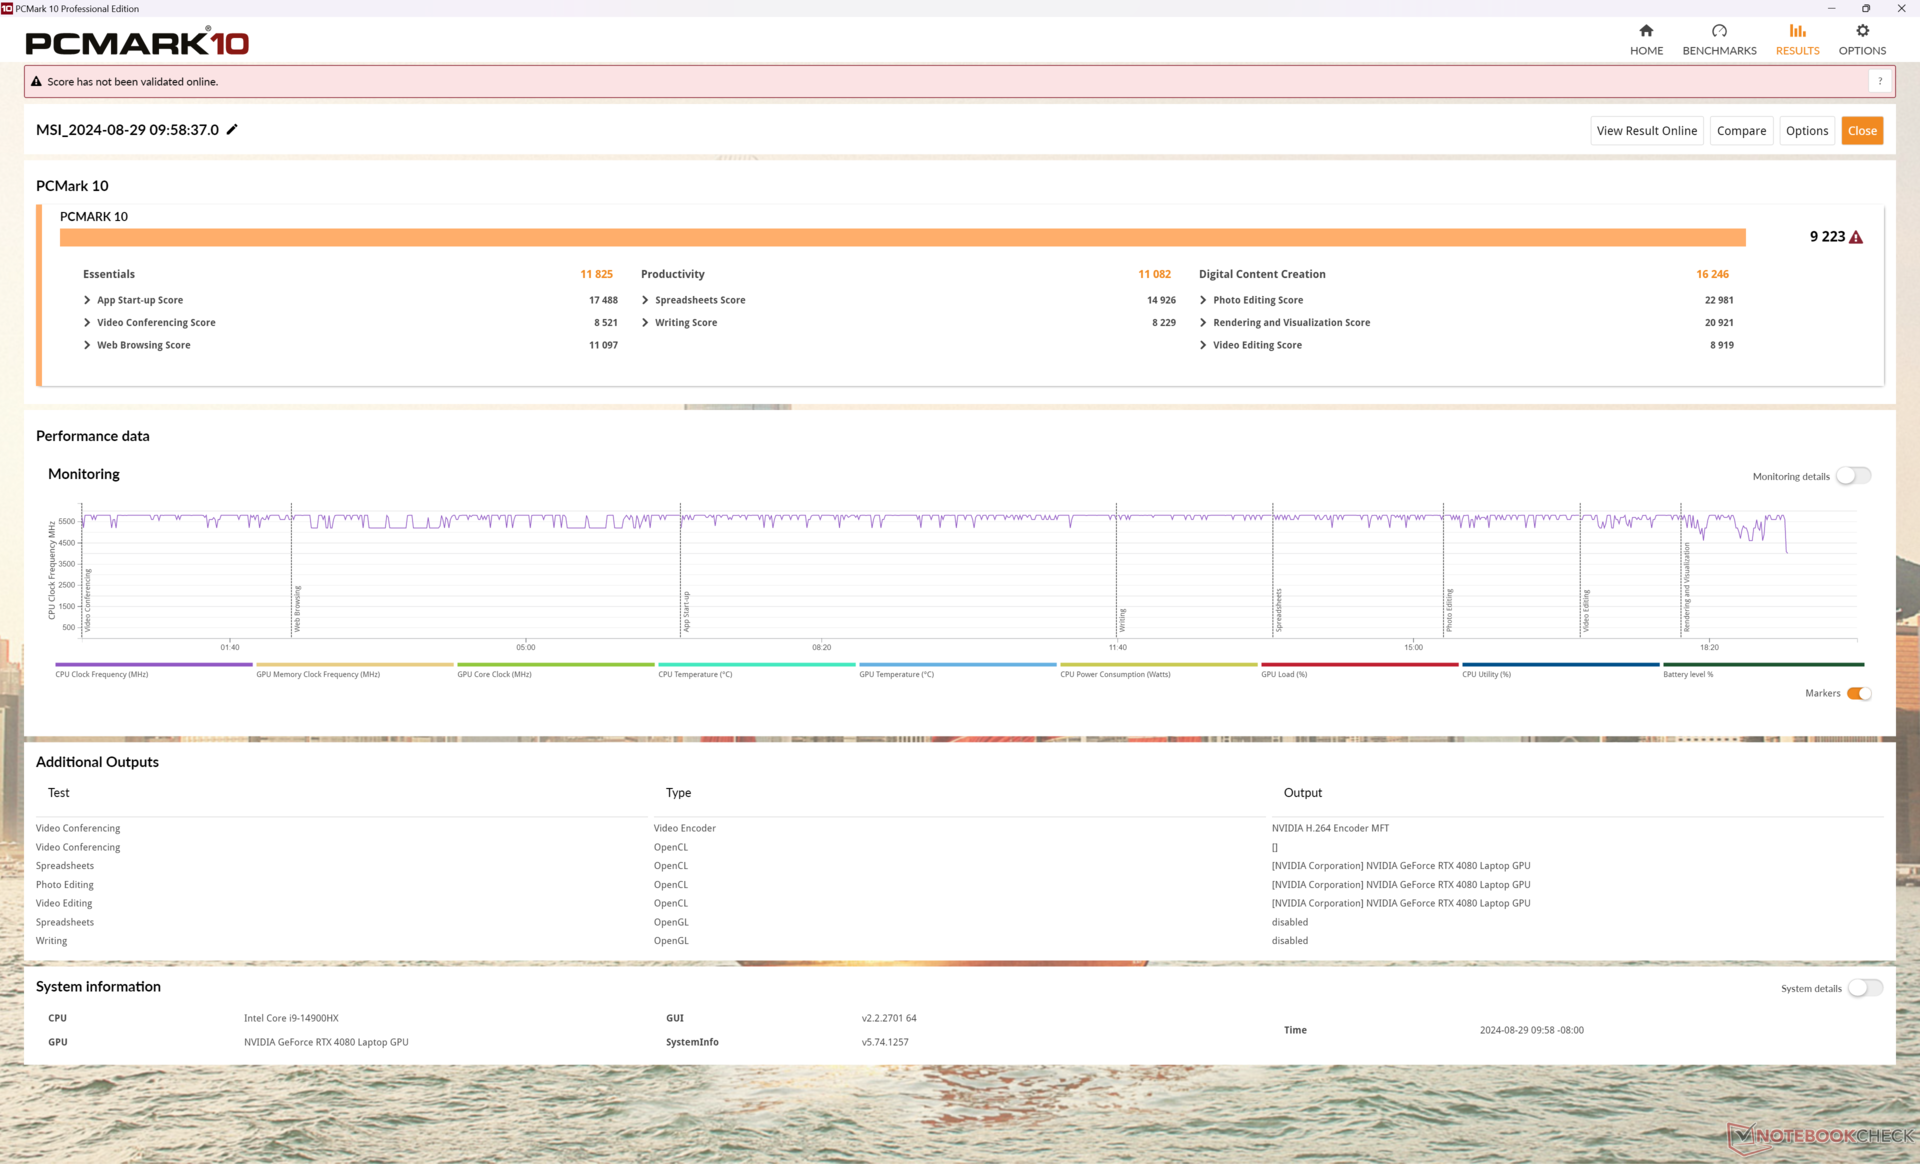
Prestazioni del sistema
I punteggi di PCMark 10 sono paragonabili a quelli di MSI Titan 18 HX, per dimostrare che le attività quotidiane non sono davvero più lente con Raider 18 HX, anche se si tratta essenzialmente di una Titan ridotta.
Abbiamo riscontrato strani problemi di login con la nostra unità di prova quando si passava dalla modalità dGPU a quella iGPU, che ci costringevano a reimpostare il PIN ogni volta.
CrossMark: Overall | Productivity | Creativity | Responsiveness
WebXPRT 3: Overall
WebXPRT 4: Overall
Mozilla Kraken 1.1: Total
| PCMark 10 / Score | |
| Alienware m18 R2 | |
| MSI Raider 18 HX A14V | |
| MSI Titan 18 HX A14VIG | |
| Razer Blade 18 2024 RZ09-0509 | |
| Media Intel Core i9-14900HX, NVIDIA GeForce RTX 4080 Laptop GPU (7703 - 9223, n=7) | |
| Acer Predator Helios 18 PH18-72-98MW | |
| Asus ROG Strix G18 G814JI | |
| PCMark 10 / Essentials | |
| MSI Raider 18 HX A14V | |
| Media Intel Core i9-14900HX, NVIDIA GeForce RTX 4080 Laptop GPU (11255 - 12600, n=7) | |
| MSI Titan 18 HX A14VIG | |
| Alienware m18 R2 | |
| Razer Blade 18 2024 RZ09-0509 | |
| Acer Predator Helios 18 PH18-72-98MW | |
| Asus ROG Strix G18 G814JI | |
| PCMark 10 / Productivity | |
| Alienware m18 R2 | |
| MSI Raider 18 HX A14V | |
| Media Intel Core i9-14900HX, NVIDIA GeForce RTX 4080 Laptop GPU (6662 - 11410, n=7) | |
| MSI Titan 18 HX A14VIG | |
| Razer Blade 18 2024 RZ09-0509 | |
| Acer Predator Helios 18 PH18-72-98MW | |
| Asus ROG Strix G18 G814JI | |
| PCMark 10 / Digital Content Creation | |
| MSI Titan 18 HX A14VIG | |
| Alienware m18 R2 | |
| MSI Raider 18 HX A14V | |
| Razer Blade 18 2024 RZ09-0509 | |
| Media Intel Core i9-14900HX, NVIDIA GeForce RTX 4080 Laptop GPU (14211 - 16246, n=7) | |
| Acer Predator Helios 18 PH18-72-98MW | |
| Asus ROG Strix G18 G814JI | |
| CrossMark / Overall | |
| Media Intel Core i9-14900HX, NVIDIA GeForce RTX 4080 Laptop GPU (1992 - 2334, n=7) | |
| MSI Raider 18 HX A14V | |
| Alienware m18 R2 | |
| Razer Blade 18 2024 RZ09-0509 | |
| MSI Titan 18 HX A14VIG | |
| CrossMark / Productivity | |
| Media Intel Core i9-14900HX, NVIDIA GeForce RTX 4080 Laptop GPU (1812 - 2204, n=7) | |
| MSI Raider 18 HX A14V | |
| Razer Blade 18 2024 RZ09-0509 | |
| Alienware m18 R2 | |
| MSI Titan 18 HX A14VIG | |
| CrossMark / Creativity | |
| Media Intel Core i9-14900HX, NVIDIA GeForce RTX 4080 Laptop GPU (2327 - 2500, n=7) | |
| Alienware m18 R2 | |
| MSI Raider 18 HX A14V | |
| Razer Blade 18 2024 RZ09-0509 | |
| MSI Titan 18 HX A14VIG | |
| CrossMark / Responsiveness | |
| Media Intel Core i9-14900HX, NVIDIA GeForce RTX 4080 Laptop GPU (1520 - 2254, n=7) | |
| MSI Raider 18 HX A14V | |
| Alienware m18 R2 | |
| Razer Blade 18 2024 RZ09-0509 | |
| MSI Titan 18 HX A14VIG | |
| WebXPRT 3 / Overall | |
| Razer Blade 18 2024 RZ09-0509 | |
| MSI Raider 18 HX A14V | |
| Media Intel Core i9-14900HX, NVIDIA GeForce RTX 4080 Laptop GPU (310 - 345, n=7) | |
| MSI Titan 18 HX A14VIG | |
| Alienware m18 R2 | |
| Asus ROG Strix G18 G814JI | |
| Asus ROG Strix G18 G814JI | |
| WebXPRT 4 / Overall | |
| MSI Raider 18 HX A14V | |
| Media Intel Core i9-14900HX, NVIDIA GeForce RTX 4080 Laptop GPU (300 - 321, n=7) | |
| Alienware m18 R2 | |
| MSI Titan 18 HX A14VIG | |
| Asus ROG Strix G18 G814JI | |
| Asus ROG Strix G18 G814JI | |
| Mozilla Kraken 1.1 / Total | |
| Asus ROG Strix G18 G814JI | |
| Asus ROG Strix G18 G814JI | |
| MSI Titan 18 HX A14VIG | |
| Razer Blade 18 2024 RZ09-0509 | |
| MSI Raider 18 HX A14V | |
| Acer Predator Helios 18 PH18-72-98MW | |
| Media Intel Core i9-14900HX, NVIDIA GeForce RTX 4080 Laptop GPU (437 - 446, n=7) | |
| Alienware m18 R2 | |
* ... Meglio usare valori piccoli
| PCMark 10 Score | 9223 punti | |
Aiuto | ||
| AIDA64 / Memory Copy | |
| Alienware m18 R2 | |
| Acer Predator Helios 18 PH18-72-98MW | |
| Razer Blade 18 2024 RZ09-0509 | |
| Media Intel Core i9-14900HX (38028 - 83392, n=36) | |
| MSI Raider 18 HX A14V | |
| Asus ROG Strix G18 G814JI | |
| MSI Titan 18 HX A14VIG | |
| AIDA64 / Memory Read | |
| Alienware m18 R2 | |
| Acer Predator Helios 18 PH18-72-98MW | |
| Razer Blade 18 2024 RZ09-0509 | |
| Media Intel Core i9-14900HX (43306 - 87568, n=36) | |
| Asus ROG Strix G18 G814JI | |
| MSI Raider 18 HX A14V | |
| MSI Titan 18 HX A14VIG | |
| AIDA64 / Memory Write | |
| Alienware m18 R2 | |
| Media Intel Core i9-14900HX (37146 - 80589, n=36) | |
| Acer Predator Helios 18 PH18-72-98MW | |
| Razer Blade 18 2024 RZ09-0509 | |
| MSI Raider 18 HX A14V | |
| Asus ROG Strix G18 G814JI | |
| MSI Titan 18 HX A14VIG | |
| AIDA64 / Memory Latency | |
| MSI Titan 18 HX A14VIG | |
| MSI Raider 18 HX A14V | |
| Razer Blade 18 2024 RZ09-0509 | |
| Alienware m18 R2 | |
| Media Intel Core i9-14900HX (76.1 - 105, n=36) | |
| Asus ROG Strix G18 G814JI | |
| Acer Predator Helios 18 PH18-72-98MW | |
* ... Meglio usare valori piccoli
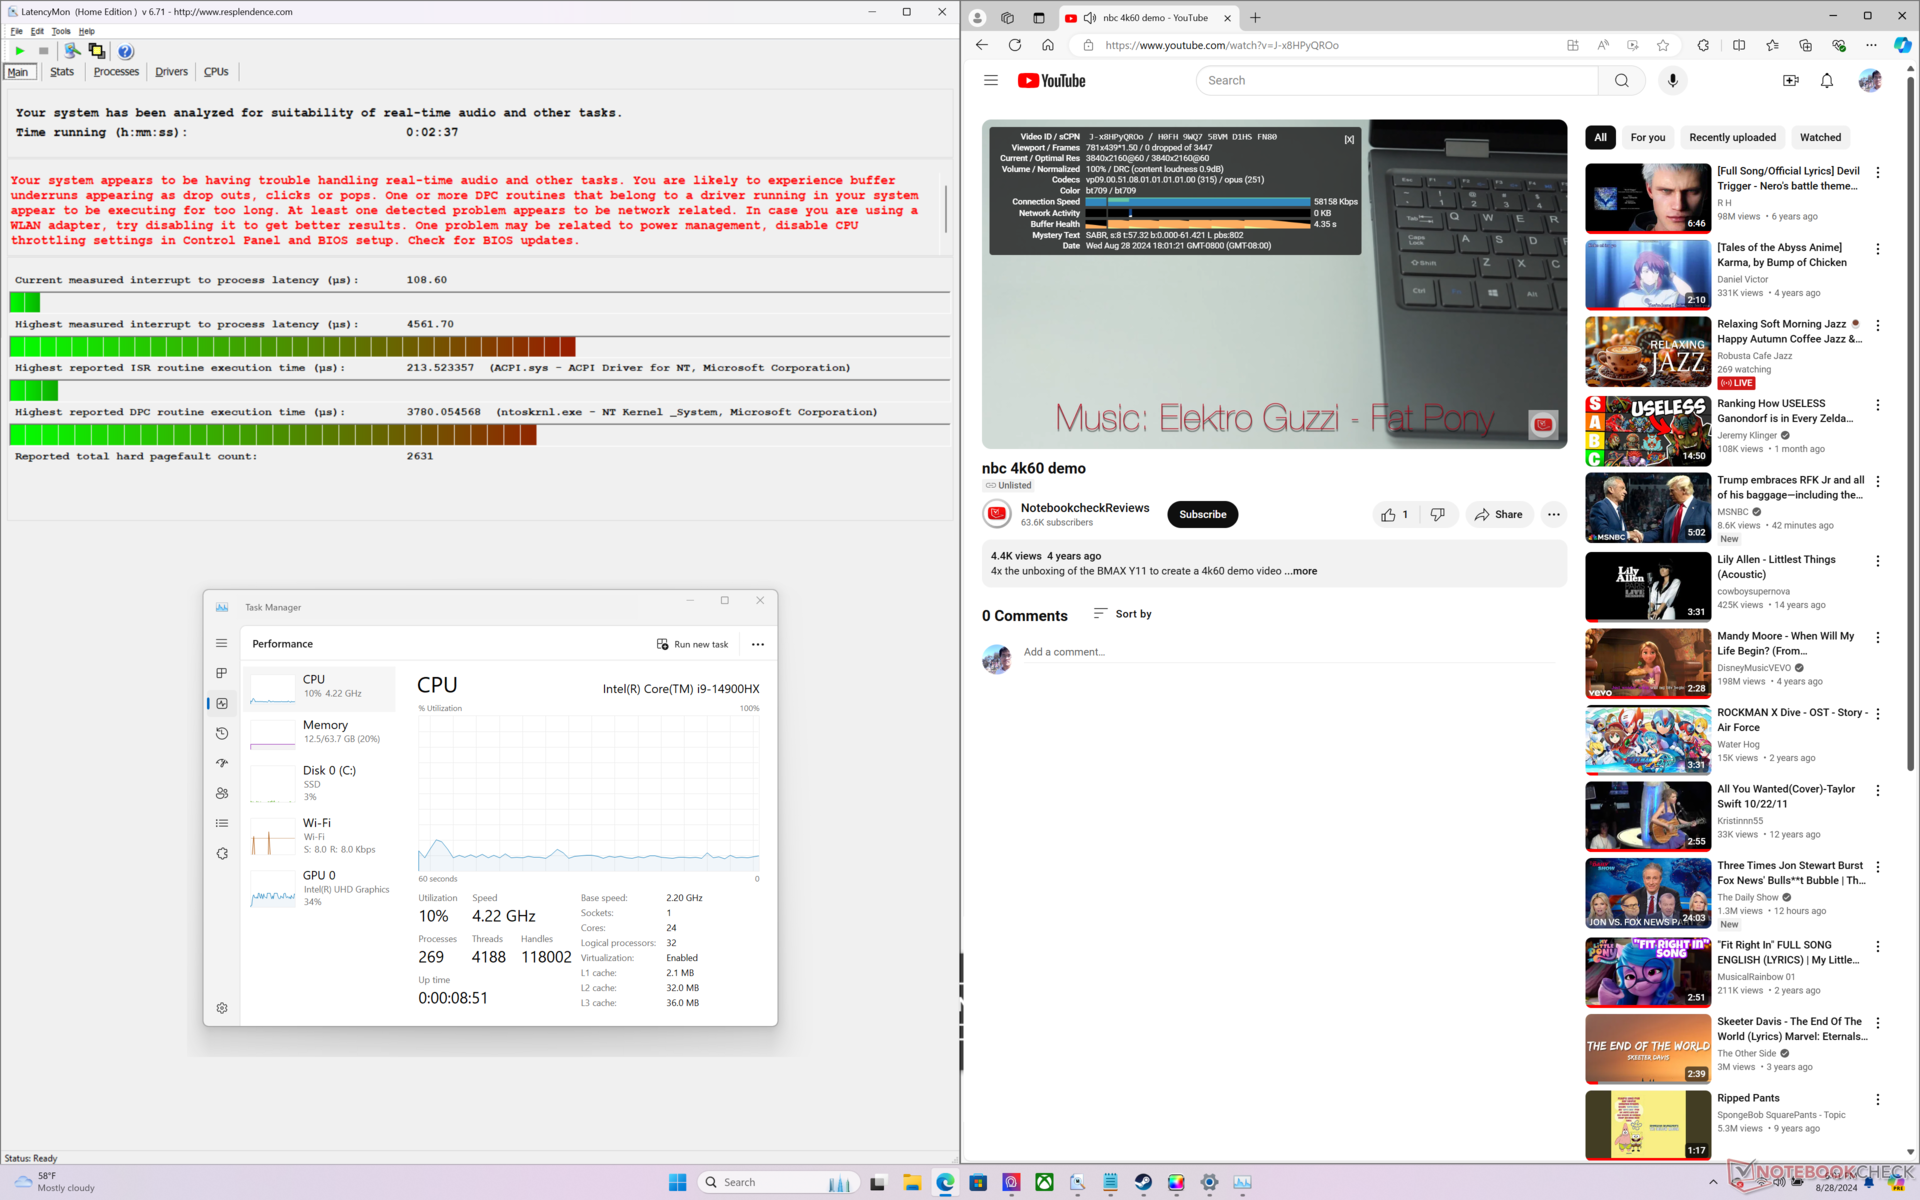
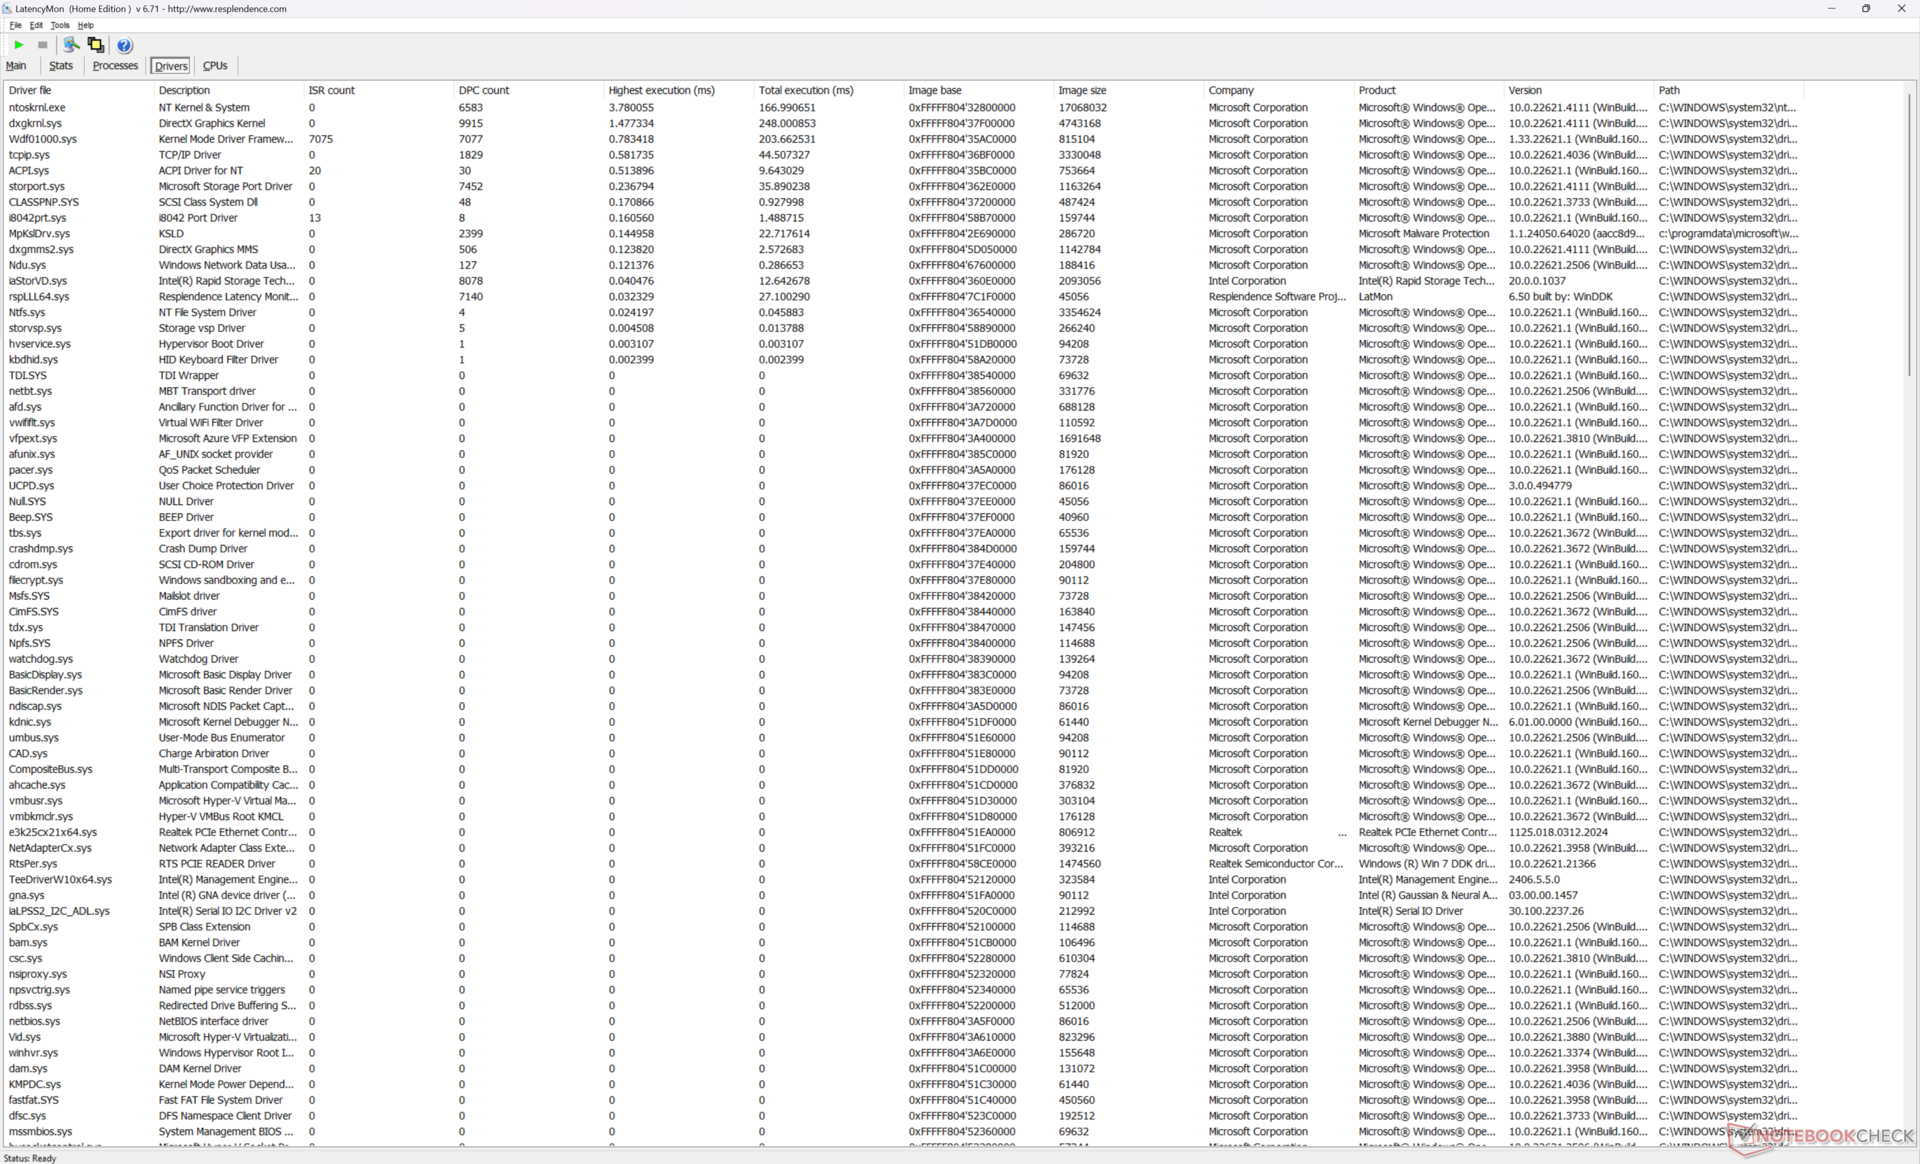
Latenza DPC
LatencyMon rivela problemi di DPC quando si aprono più schede della nostra homepage, anche quando è impostata la modalità iGPU. la riproduzione di video 4K a 60 FPS è invece perfetta, senza alcuna perdita di fotogrammi.
| DPC Latencies / LatencyMon - interrupt to process latency (max), Web, Youtube, Prime95 | |
| MSI Raider 18 HX A14V | |
| Acer Predator Helios 18 PH18-72-98MW | |
| Alienware m18 R2 | |
| MSI Titan 18 HX A14VIG | |
| Razer Blade 18 2024 RZ09-0509 | |
| Asus ROG Strix G18 G814JI | |
* ... Meglio usare valori piccoli
Dispositivi di archiviazione
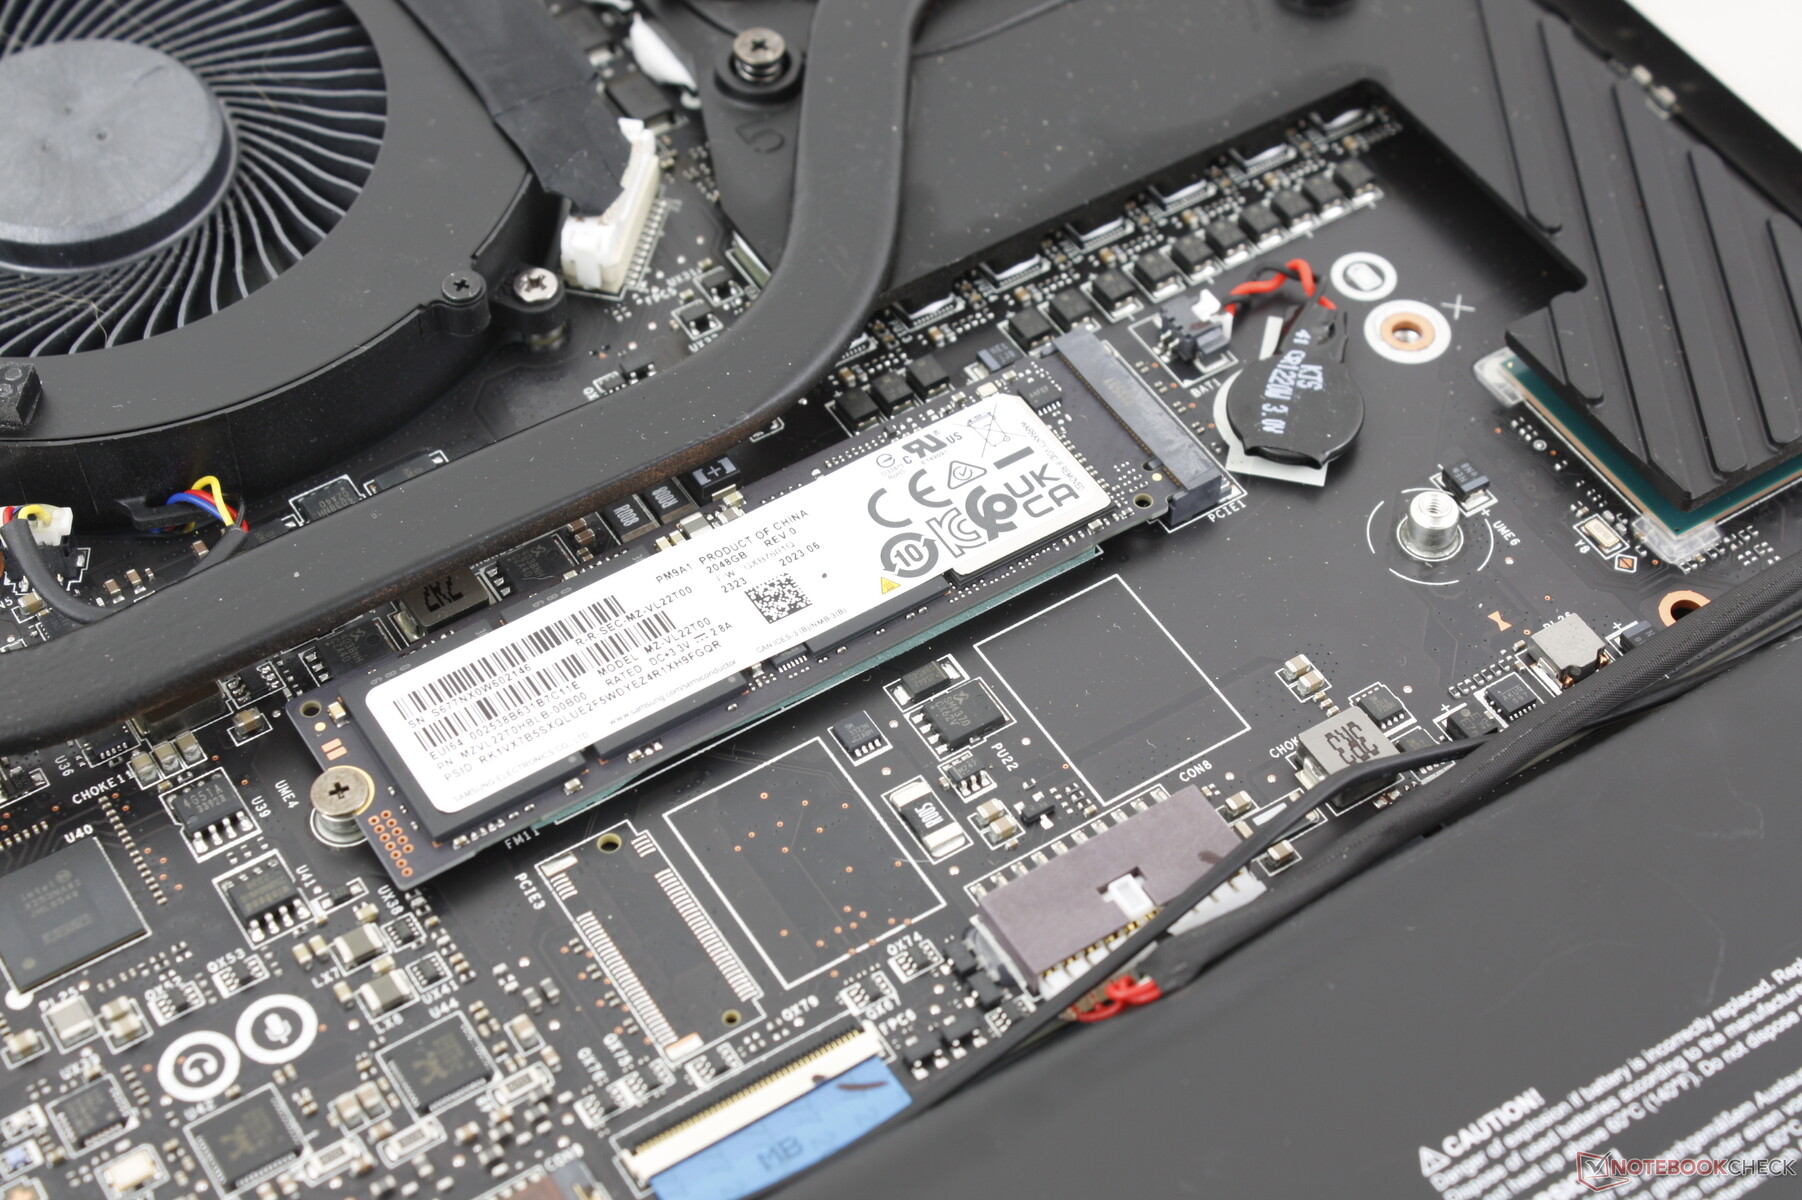
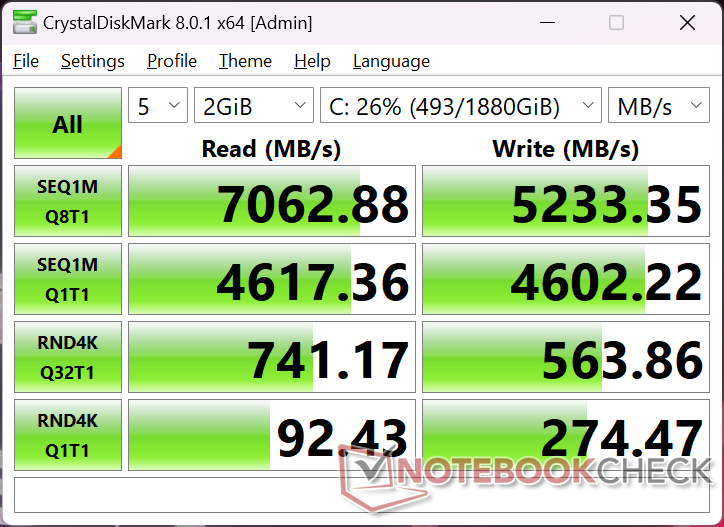
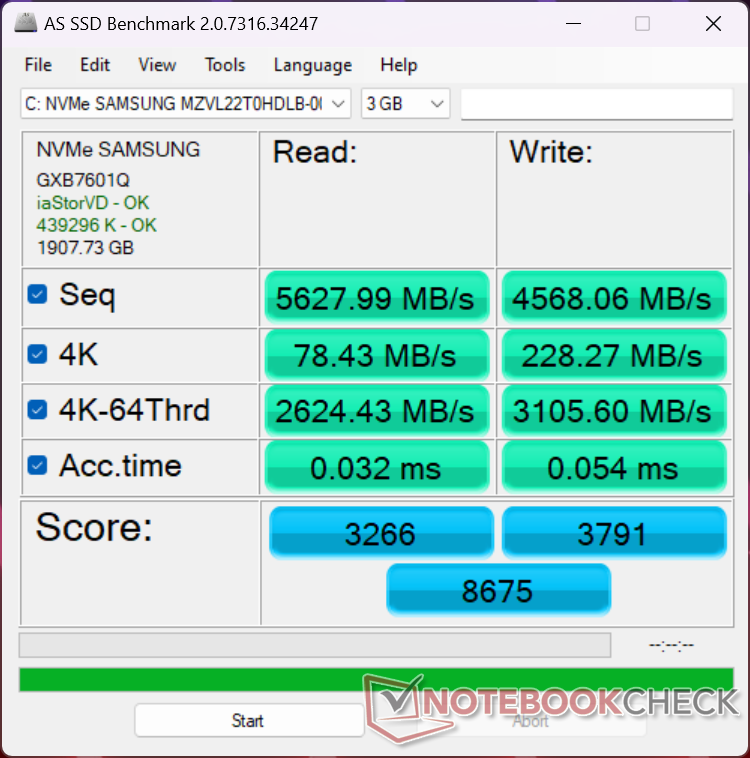
La nostra unità viene fornita con il Samsung PM9A1a MZVL22T0HDLB SSD PCIe4 comunemente presente nei computer portatili di fascia alta. Le velocità di trasferimento sono stabili a ~7000 MB/s anche quando sono stressate e possono essere ancora più veloci se configurate con un'unità PCIe5. Tuttavia, la mancanza di un diffusore di calore incluso può significare che le unità PCIe5 hanno maggiori probabilità di bloccarsi.

| Drive Performance Rating - Percent | |
| Alienware m18 R2 | |
| MSI Raider 18 HX A14V | |
| Acer Predator Helios 18 PH18-72-98MW | |
| MSI Titan 18 HX A14VIG | |
| Razer Blade 18 2024 RZ09-0509 | |
| Asus ROG Strix G18 G814JI | |
* ... Meglio usare valori piccoli
Disk Throttling: DiskSpd Read Loop, Queue Depth 8
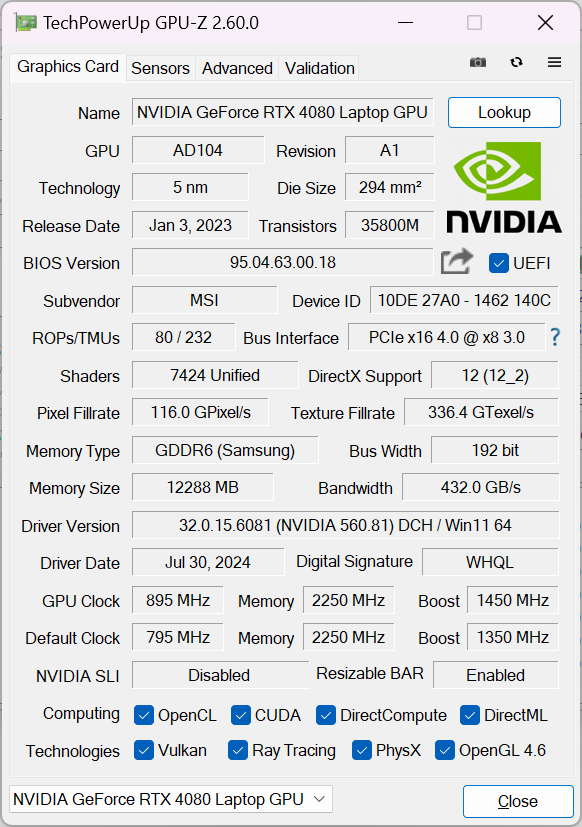
Prestazioni della GPU - Grafica TGP da 175 W
A differenza dei portatili più sottili che possono essere forniti con grafica più debole da 80 W GeForce RTX 4080raider 18 HX, più grande, viene fornito con una versione più potente da 175 W (150 W + 25 W dynamic boost). Le prestazioni sono circa il 5% più veloci rispetto al laptop medio del nostro database con la stessa GPU stessa GPU mentre l'aggiornamento alla RTX 4090 aumenterà le prestazioni di un altro 10 percento.
Tenga presente che le prestazioni complessive sono ancora dal 30 al 35 percento più lente della versione versione desktop di GeForce RTX 4080 anche se la versione mobile condivide lo stesso nome. La nostra RTX 4080 mobile è quindi più vicina in termini di prestazioni alla rTX 4070 desktop.
| Profilo di potenza | Punteggio grafico | Punteggio di fisica | Punteggio combinato |
| Prestazioni estreme (Cooler Boost attivato) | 42289 | 41396 | 11806 |
| Prestazioni estreme (Cooler Boost disattivato) | 41778 (-1%) | 40723 (-2%) | 11968 (-1%) |
| Modalità Bilanciata | 41673 (-2%) | 41013 (-1%) | 10404 (-12%) |
| Alimentazione a batteria | 21731 (-49%) | 17988 (-57%) | 5809 (-51%) |
Passare dalla modalità Prestazioni estreme alla modalità Bilanciata influisce solo leggermente sulle prestazioni, il che è in linea con le osservazioni dello Stress Test di cui sopra. Anche l'attivazione di Cooler Boost fa poca differenza, tranne che per la riduzione delle temperature dei core, aumentando in modo significativo il rumore della ventola.
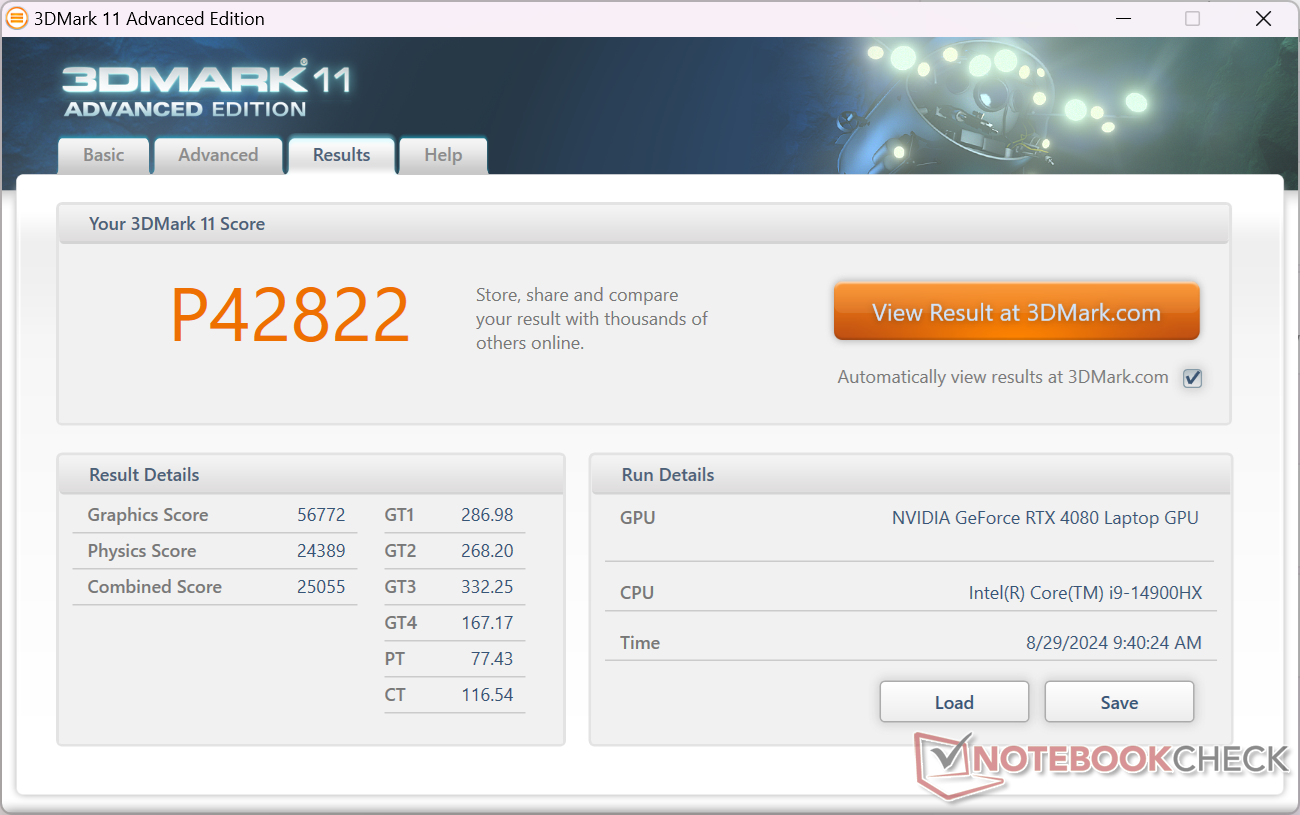
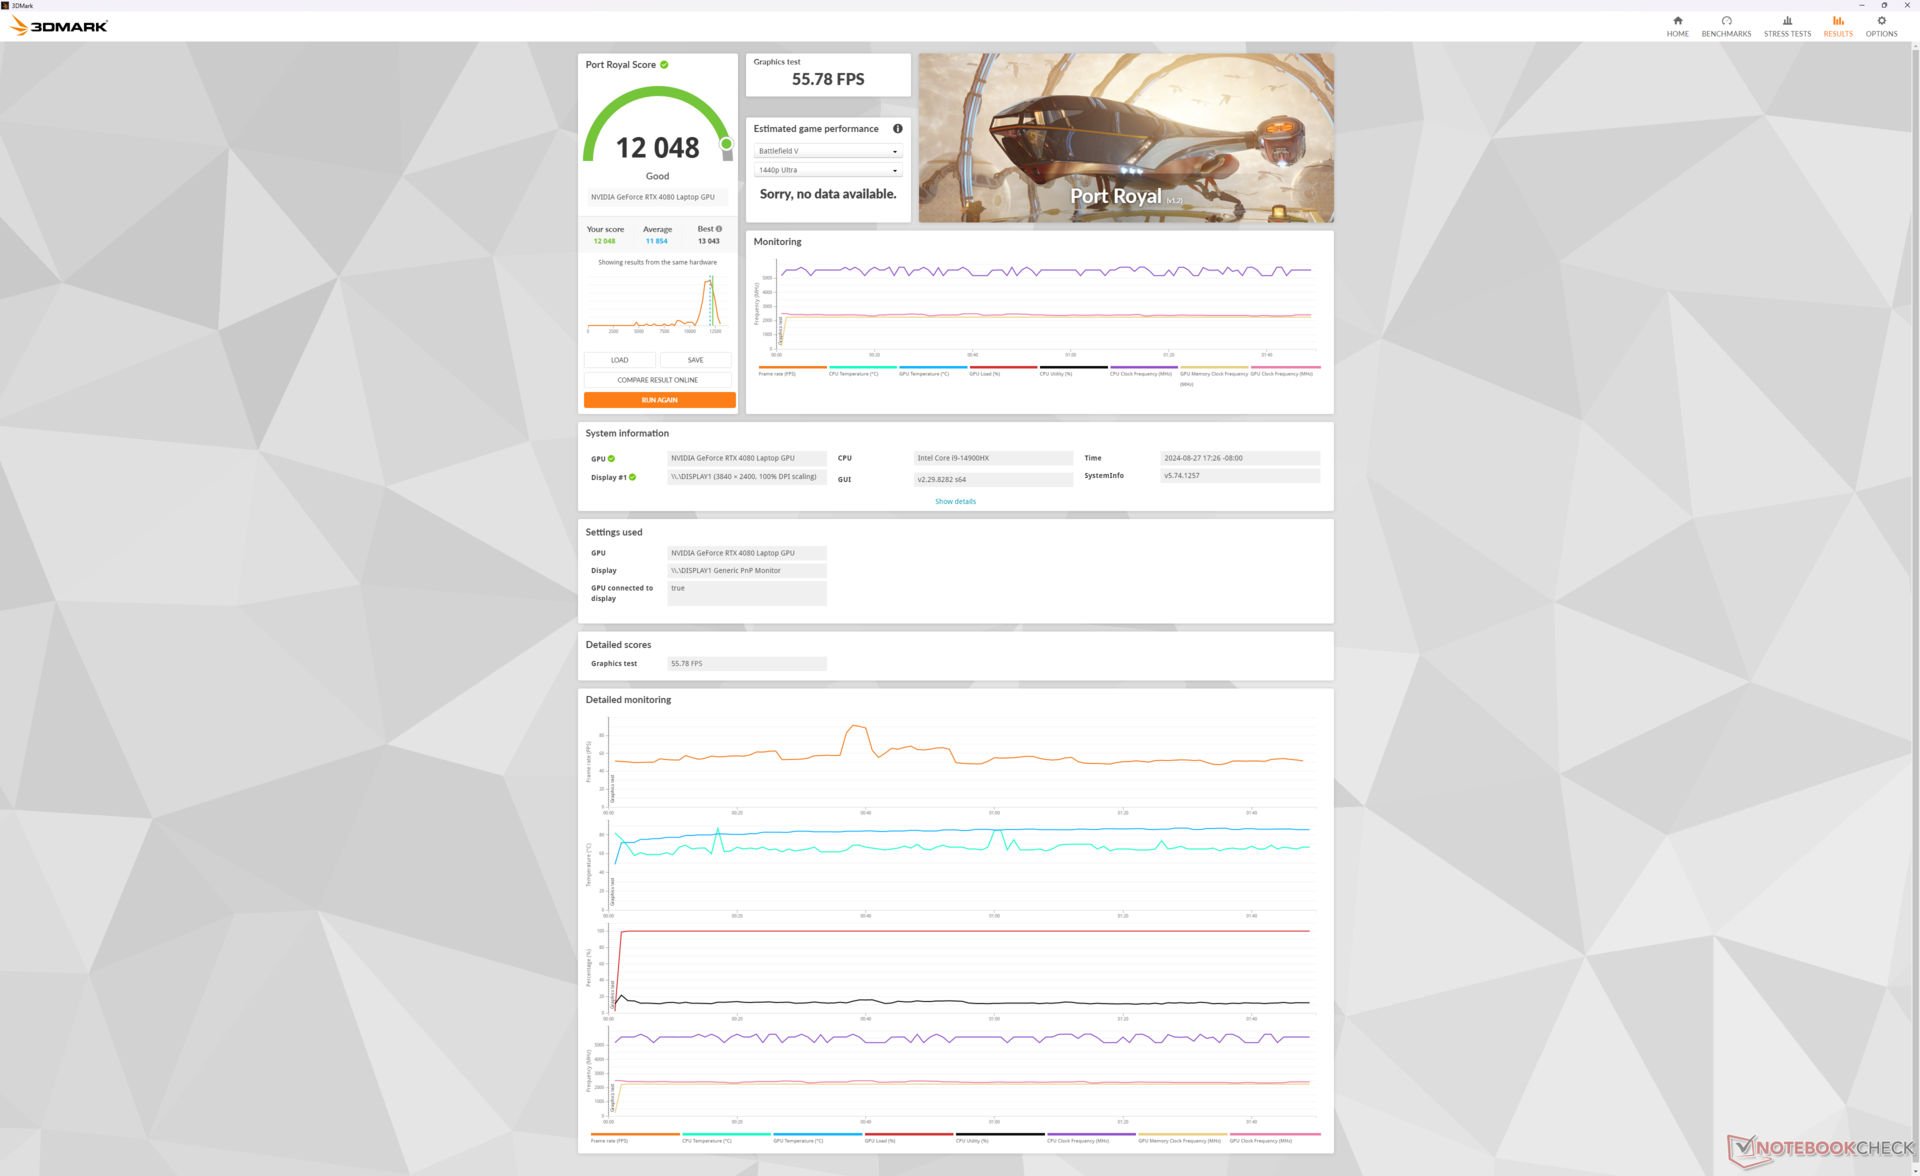
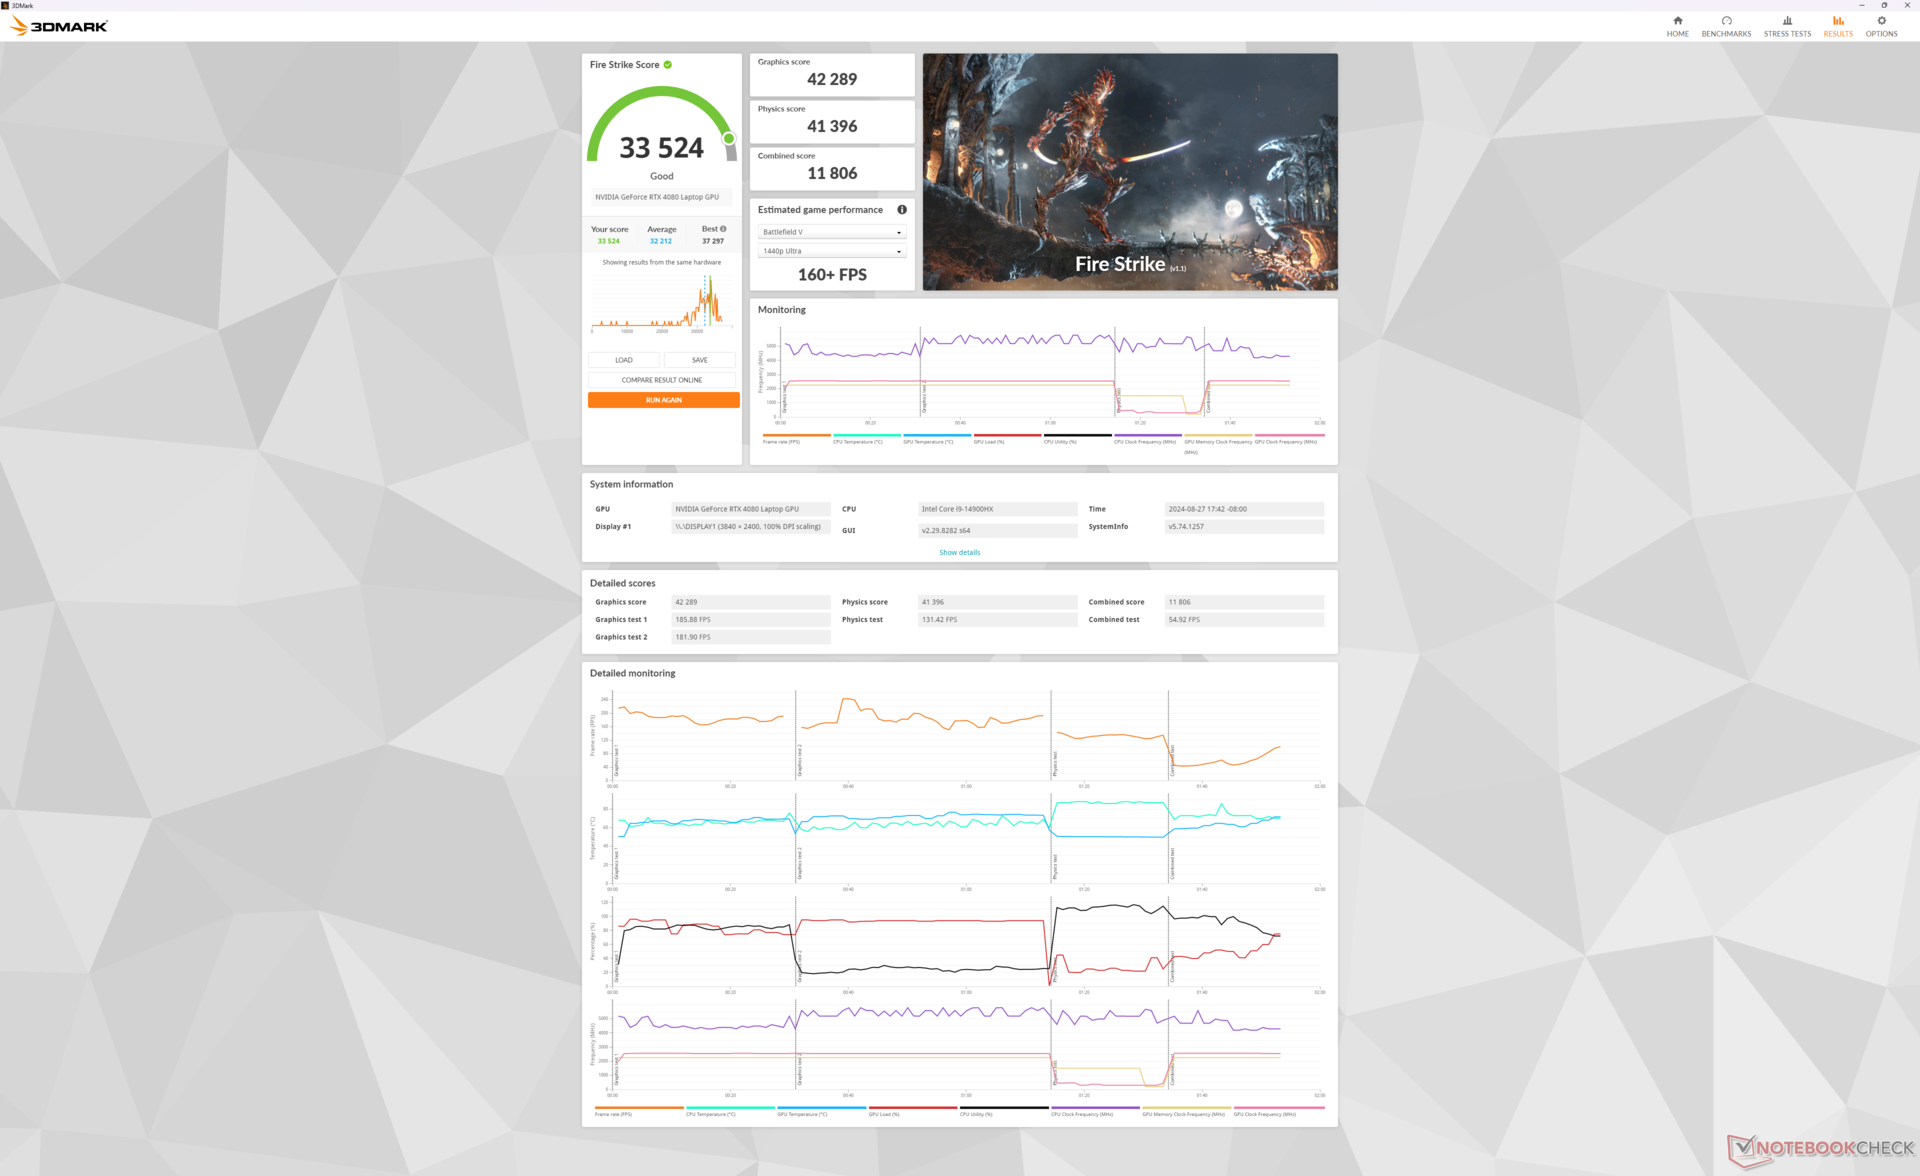

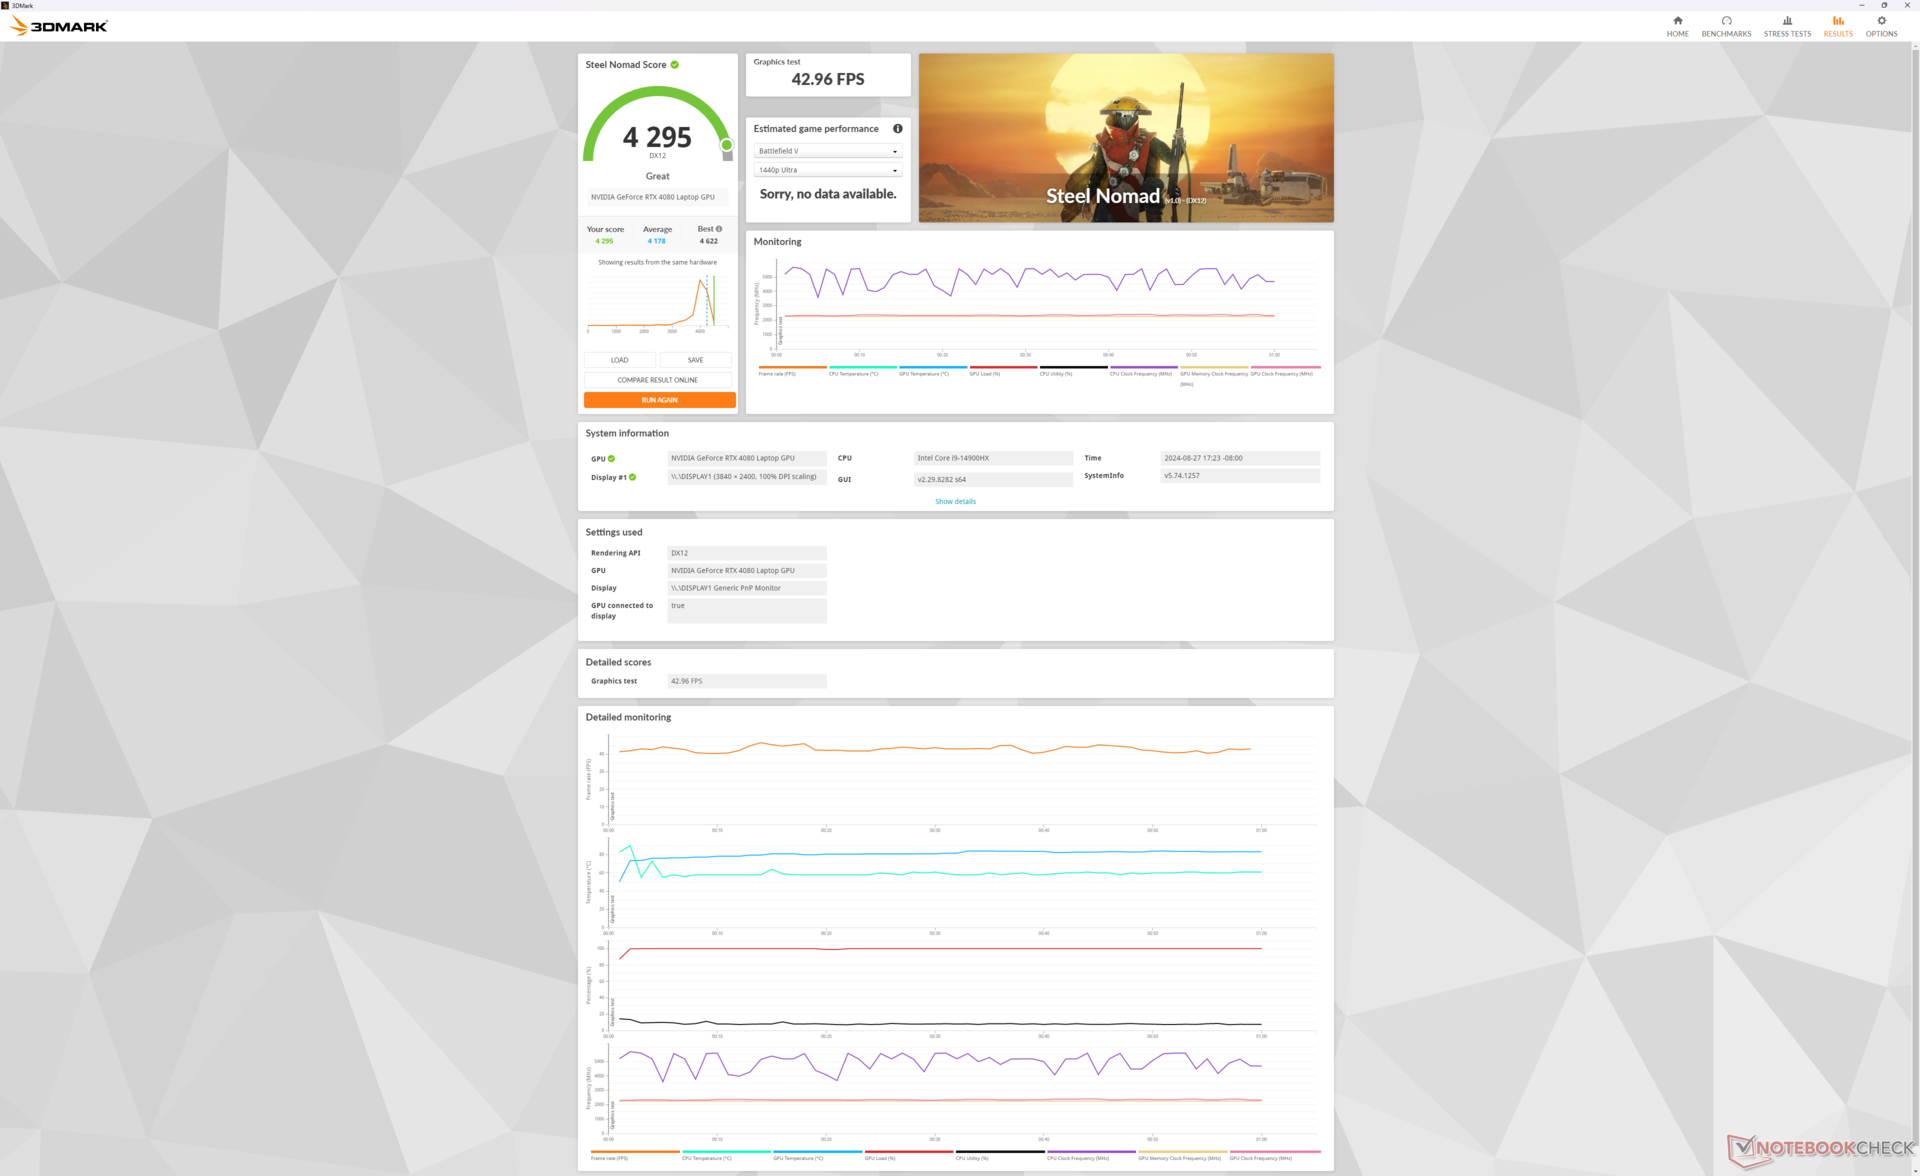
| 3DMark 11 Performance | 42822 punti | |
| 3DMark Fire Strike Score | 33524 punti | |
| 3DMark Time Spy Score | 18608 punti | |
| 3DMark Steel Nomad Score | 4295 punti | |
Aiuto | ||
* ... Meglio usare valori piccoli
Prestazioni di gioco
I titoli moderni girano decentemente bene alla risoluzione nativa 4K UHD+. Il DLSS è consigliato quando si eseguono titoli più impegnativi come Cyberpunk 2077 per aumentare la frequenza dei fotogrammi più vicina ai 60 FPS.
Stranamente, Baldur's Gate 3 non si avviava sulla nostra unità, anche dopo molteplici reset del sistema in modalità DX11 o DX12.
| Performance Rating - Percent | |
| Alienware m18 R2 | |
| MSI Titan 18 HX A14VIG | |
| MSI Raider 18 HX A14V | |
| Razer Blade 18 2024 RZ09-0509 -1! | |
| Acer Predator Helios 18 PH18-72-98MW | |
| Asus ROG Strix G18 G814JI | |
| GTA V - 1920x1080 Highest Settings possible AA:4xMSAA + FX AF:16x | |
| MSI Raider 18 HX A14V | |
| MSI Titan 18 HX A14VIG | |
| Alienware m18 R2 | |
| Acer Predator Helios 18 PH18-72-98MW | |
| Razer Blade 18 2024 RZ09-0509 | |
| Asus ROG Strix G18 G814JI | |
| Final Fantasy XV Benchmark - 1920x1080 High Quality | |
| Alienware m18 R2 | |
| MSI Titan 18 HX A14VIG | |
| MSI Raider 18 HX A14V | |
| Acer Predator Helios 18 PH18-72-98MW | |
| Razer Blade 18 2024 RZ09-0509 | |
| Asus ROG Strix G18 G814JI | |
| Strange Brigade - 1920x1080 ultra AA:ultra AF:16 | |
| MSI Titan 18 HX A14VIG | |
| Alienware m18 R2 | |
| MSI Raider 18 HX A14V | |
| Razer Blade 18 2024 RZ09-0509 | |
| Acer Predator Helios 18 PH18-72-98MW | |
| Asus ROG Strix G18 G814JI | |
| Dota 2 Reborn - 1920x1080 ultra (3/3) best looking | |
| Acer Predator Helios 18 PH18-72-98MW | |
| MSI Titan 18 HX A14VIG | |
| MSI Raider 18 HX A14V | |
| Alienware m18 R2 | |
| Razer Blade 18 2024 RZ09-0509 | |
| Asus ROG Strix G18 G814JI | |
| X-Plane 11.11 - 1920x1080 high (fps_test=3) | |
| MSI Raider 18 HX A14V | |
| Alienware m18 R2 | |
| Razer Blade 18 2024 RZ09-0509 | |
| MSI Titan 18 HX A14VIG | |
| Acer Predator Helios 18 PH18-72-98MW | |
| Asus ROG Strix G18 G814JI | |
| Far Cry 5 - 1920x1080 Ultra Preset AA:T | |
| Alienware m18 R2 | |
| MSI Titan 18 HX A14VIG | |
| MSI Raider 18 HX A14V | |
| Asus ROG Strix G18 G814JI | |
| Acer Predator Helios 18 PH18-72-98MW | |
| Tiny Tina's Wonderlands | |
| 1920x1080 High Preset (DX12) | |
| Alienware m18 R2 | |
| MSI Raider 18 HX A14V | |
| Media NVIDIA GeForce RTX 4080 Laptop GPU (166.7 - 213, n=6) | |
| 1920x1080 Badass Preset (DX12) | |
| Alienware m18 R2 | |
| MSI Raider 18 HX A14V | |
| Alienware m18 R1 AMD | |
| Media NVIDIA GeForce RTX 4080 Laptop GPU (112.9 - 167.1, n=9) | |
| 2560x1440 Badass Preset (DX12) | |
| Alienware m18 R2 | |
| MSI Raider 18 HX A14V | |
| Alienware m18 R1 AMD | |
| Media NVIDIA GeForce RTX 4080 Laptop GPU (85 - 114.8, n=9) | |
| 3840x2160 Badass Preset (DX12) | |
| Alienware m18 R2 | |
| MSI Raider 18 HX A14V | |
| Alienware m18 R1 AMD | |
| Media NVIDIA GeForce RTX 4080 Laptop GPU (46.4 - 60.9, n=9) | |
Cyberpunk 2077 ultra FPS Chart
| basso | medio | alto | ultra | QHD | 4K | |
|---|---|---|---|---|---|---|
| GTA V (2015) | 185.1 | 183.8 | 181.6 | 143.4 | 134.6 | 158.3 |
| Dota 2 Reborn (2015) | 218 | 193.1 | 184.6 | 172.5 | 166.4 | |
| Final Fantasy XV Benchmark (2018) | 223 | 212 | 177 | 141.8 | 78.6 | |
| X-Plane 11.11 (2018) | 199 | 178.5 | 143.5 | 119.3 | ||
| Far Cry 5 (2018) | 173 | 163 | 151 | 149 | 96 | |
| Strange Brigade (2018) | 504 | 408 | 378 | 349 | 246 | 122.6 |
| Tiny Tina's Wonderlands (2022) | 352.5 | 292.6 | 203.3 | 159.4 | 111.2 | 60.9 |
| F1 22 (2022) | 305 | 299 | 271 | 121.2 | 77.8 | 39.8 |
| Cyberpunk 2077 2.2 Phantom Liberty (2023) | 150.6 | 150 | 140.7 | 125.5 | 82.5 | 35.1 |
Emissioni - Silenzioso quando si fa il minimo, rumoroso quando si gioca
Rumore del sistema
Il rumore e il comportamento della ventola sono simili a quelli di Titan 18 HX nonostante le differenze nella soluzione di raffreddamento. Le ventole sono inclini a pulsare anche quando si naviga sul web in modalità Bilanciata o Silenziosa, proprio come sulla Titan, ma l'aumento del rumore fortunatamente non è così netto da essere fonte di distrazione.
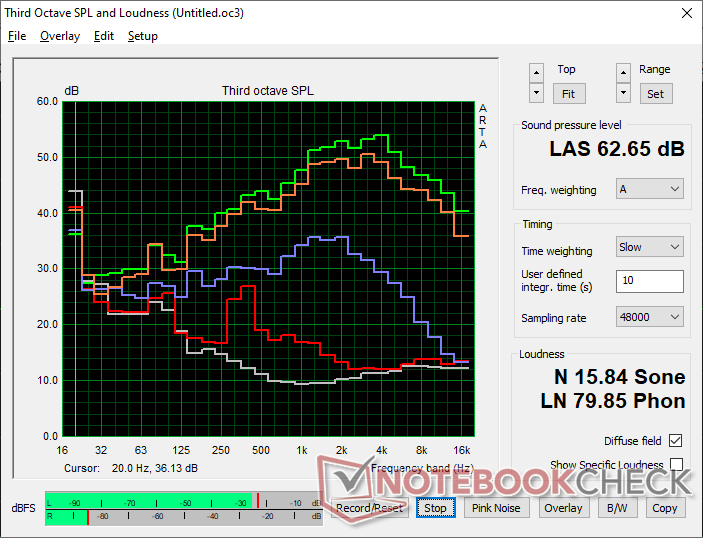
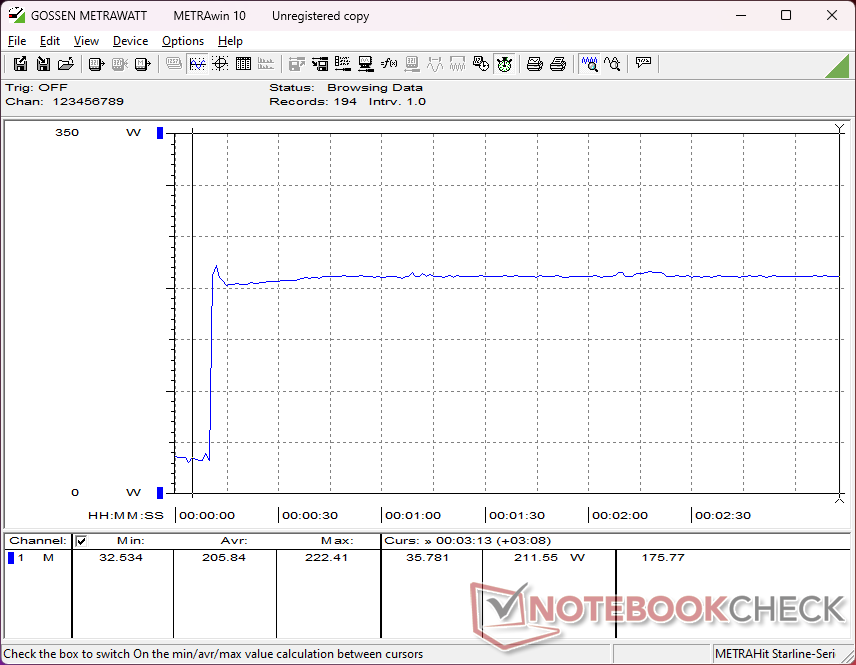
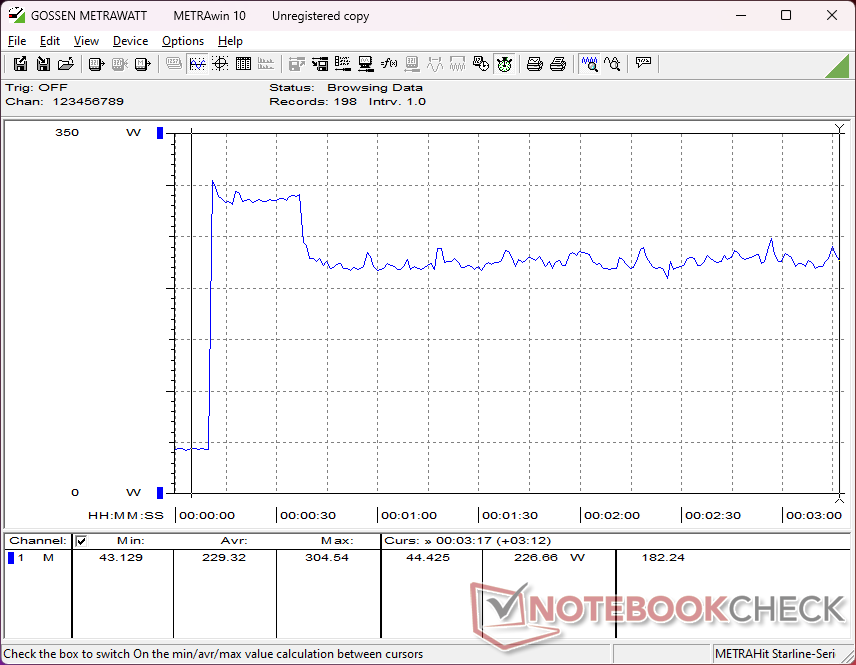
MSI Center influisce direttamente sull'esperienza di gioco, in quanto il rumore delle ventole è strettamente legato al profilo energetico selezionato. Eseguendo Cyberpunk 2077 in modalità Bilanciata, in modalità Prestazioni estreme con Cooler Boost disattivato e in modalità Prestazioni estreme con Cooler Boost attivato, il rumore della ventola stabile sarebbe di 52,8 dB(A), 59,4 dB(A) e 62,7 dB(A), rispettivamente. La differenza di rumore tra le modalità Bilanciata e Prestazioni estreme è significativa, anche se il deficit di prestazioni tra di esse è minimo, il che significa che la modalità Bilanciata è consigliata per la maggior parte degli scenari di gioco. Cooler Boost è quindi utile soprattutto per l'overclocking manuale, poiché altrimenti non offre grandi vantaggi di gioco con le impostazioni stock.
La gamma da bassa a media di 50 dB(A) durante il gioco è molto simile a quella di Blade 18 o di Alienware m18 R2. Si consiglia di utilizzare delle cuffie, soprattutto se si gioca in modalità Prestazioni estreme.
Rumorosità
| Idle |
| 28.6 / 28.6 / 31.3 dB(A) |
| Sotto carico |
| 44.1 / 62.7 dB(A) |
 | ||
30 dB silenzioso 40 dB(A) udibile 50 dB(A) rumoroso |
||
min: | ||
| MSI Raider 18 HX A14V NVIDIA GeForce RTX 4080 Laptop GPU, i9-14900HX, Samsung PM9A1 MZVL22T0HBLB | Razer Blade 18 2024 RZ09-0509 NVIDIA GeForce RTX 4090 Laptop GPU, i9-14900HX | Alienware m18 R2 NVIDIA GeForce RTX 4090 Laptop GPU, i9-14900HX, SK Hynix PC811 HFS002TEM9X152N | MSI Titan 18 HX A14VIG NVIDIA GeForce RTX 4090 Laptop GPU, i9-14900HX, 2x Samsung PM9A1a MZVL22T0HDLB (RAID 0) | Asus ROG Strix G18 G814JI NVIDIA GeForce RTX 4070 Laptop GPU, i7-13650HX, Micron 2400 MTFDKBA1T0QFM | Acer Predator Helios 18 PH18-72-98MW NVIDIA GeForce RTX 4090 Laptop GPU, i9-14900HX, 2x SK Hynix HFS001TEJ9X115N (RAID 0) | |
|---|---|---|---|---|---|---|
| Noise | 7% | 11% | 10% | 8% | -12% | |
| off /ambiente * | 23.3 | 23.4 -0% | 23.6 -1% | 22.8 2% | 25 -7% | 25 -7% |
| Idle Minimum * | 28.6 | 23.9 16% | 23.8 17% | 23.8 17% | 26 9% | 30 -5% |
| Idle Average * | 28.6 | 28.2 1% | 26.1 9% | 23.8 17% | 28 2% | 36 -26% |
| Idle Maximum * | 31.3 | 29 7% | 31.5 -1% | 28 11% | 29 7% | 44 -41% |
| Load Average * | 44.1 | 36.8 17% | 31.5 29% | 38 14% | 41 7% | 48 -9% |
| Cyberpunk 2077 ultra * | 59.4 | |||||
| Load Maximum * | 62.7 | 61.1 3% | 56.6 10% | 62.8 -0% | 46 27% | 51 19% |
| Witcher 3 ultra * | 54.1 | 52.1 | 57.3 | 44 | 49 |
* ... Meglio usare valori piccoli
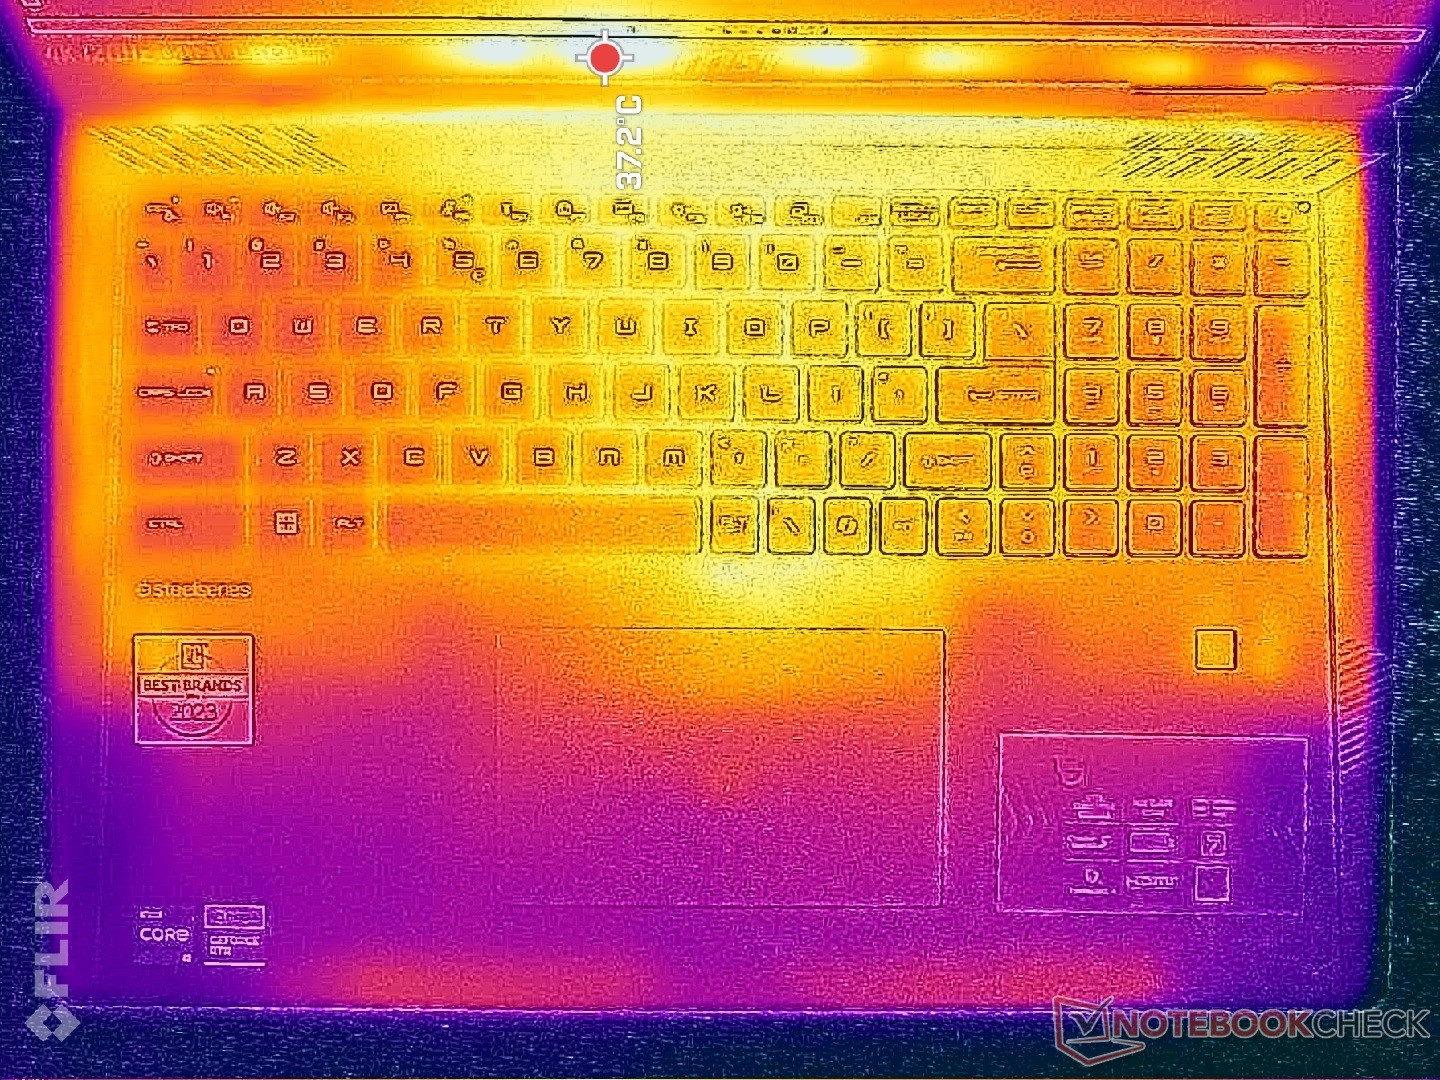
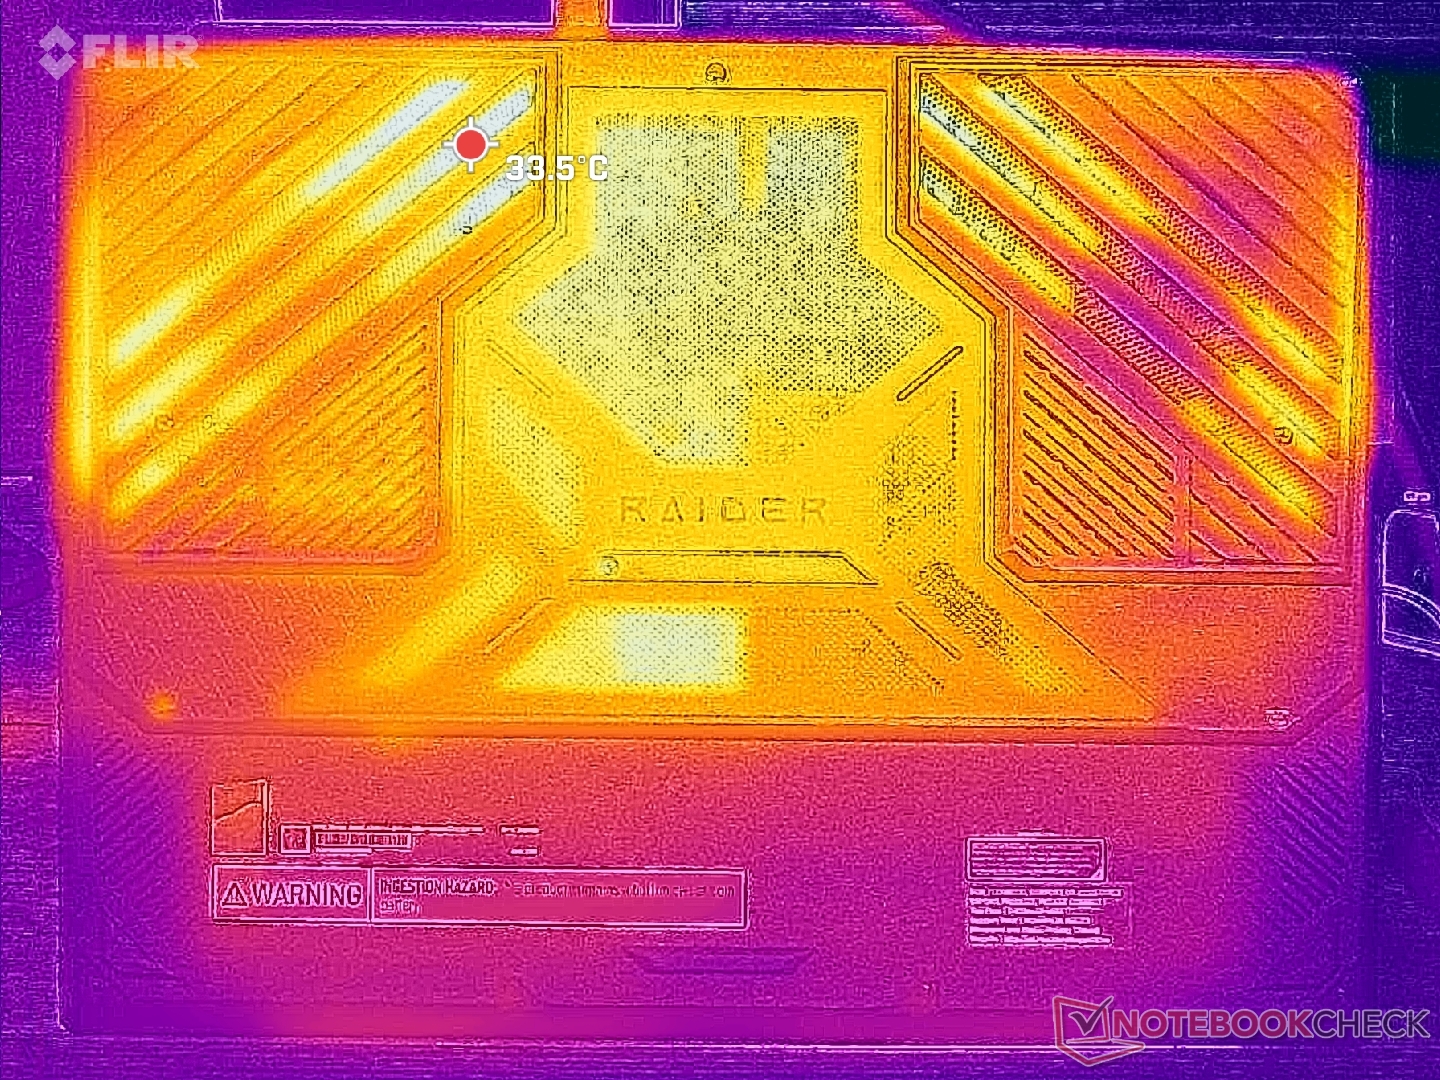
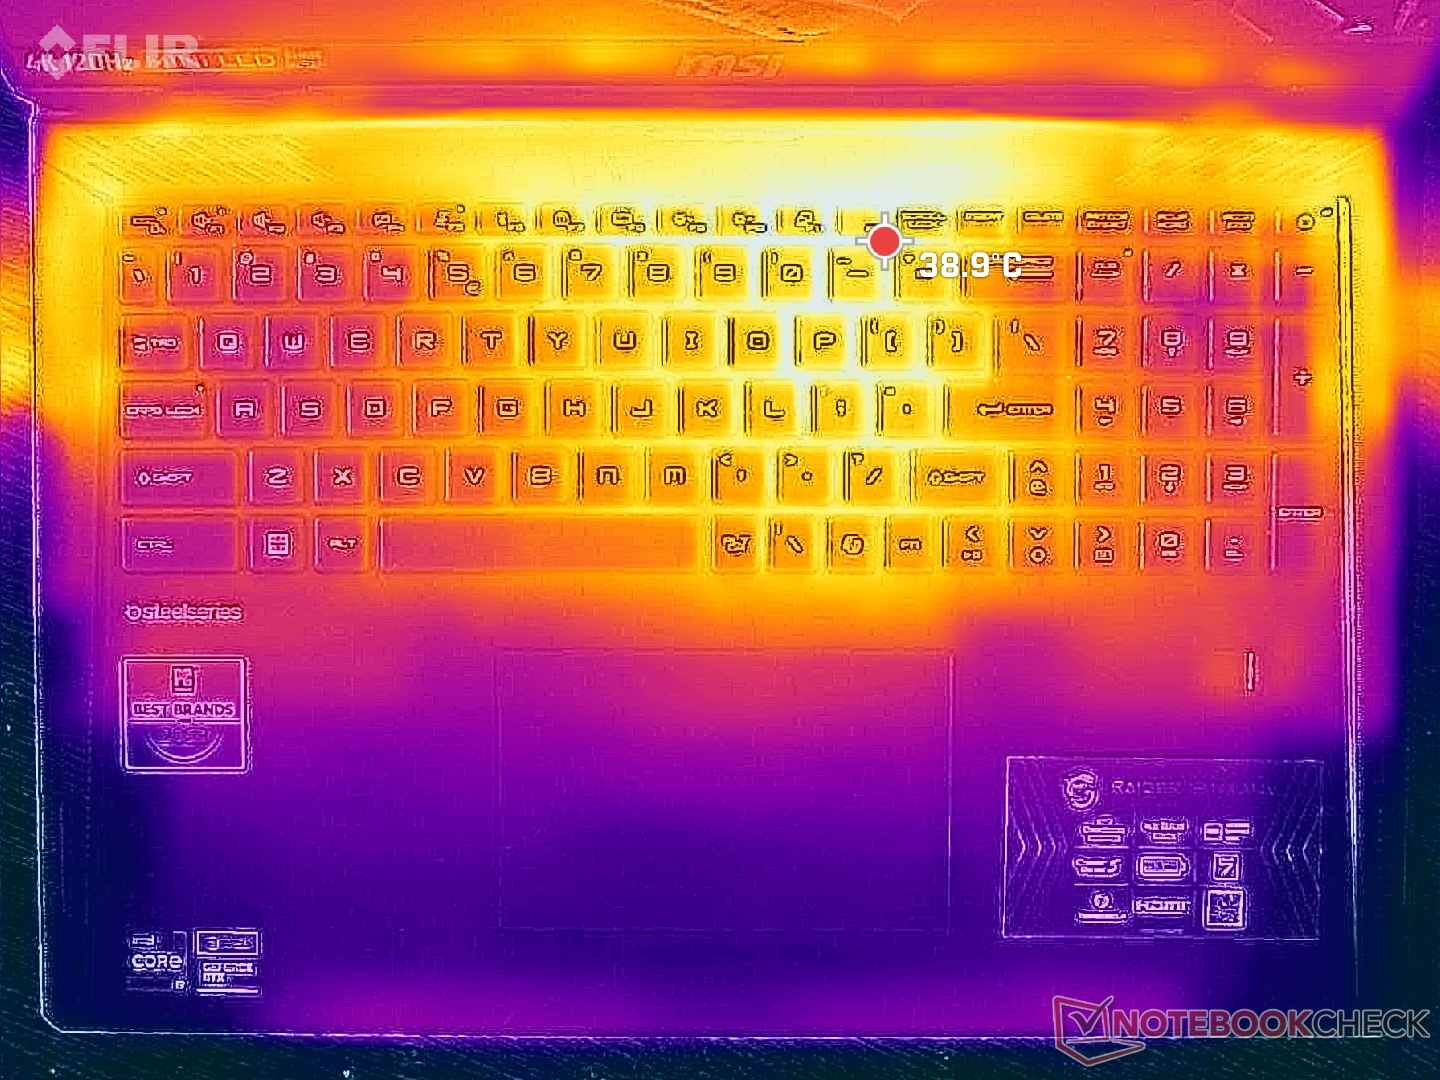
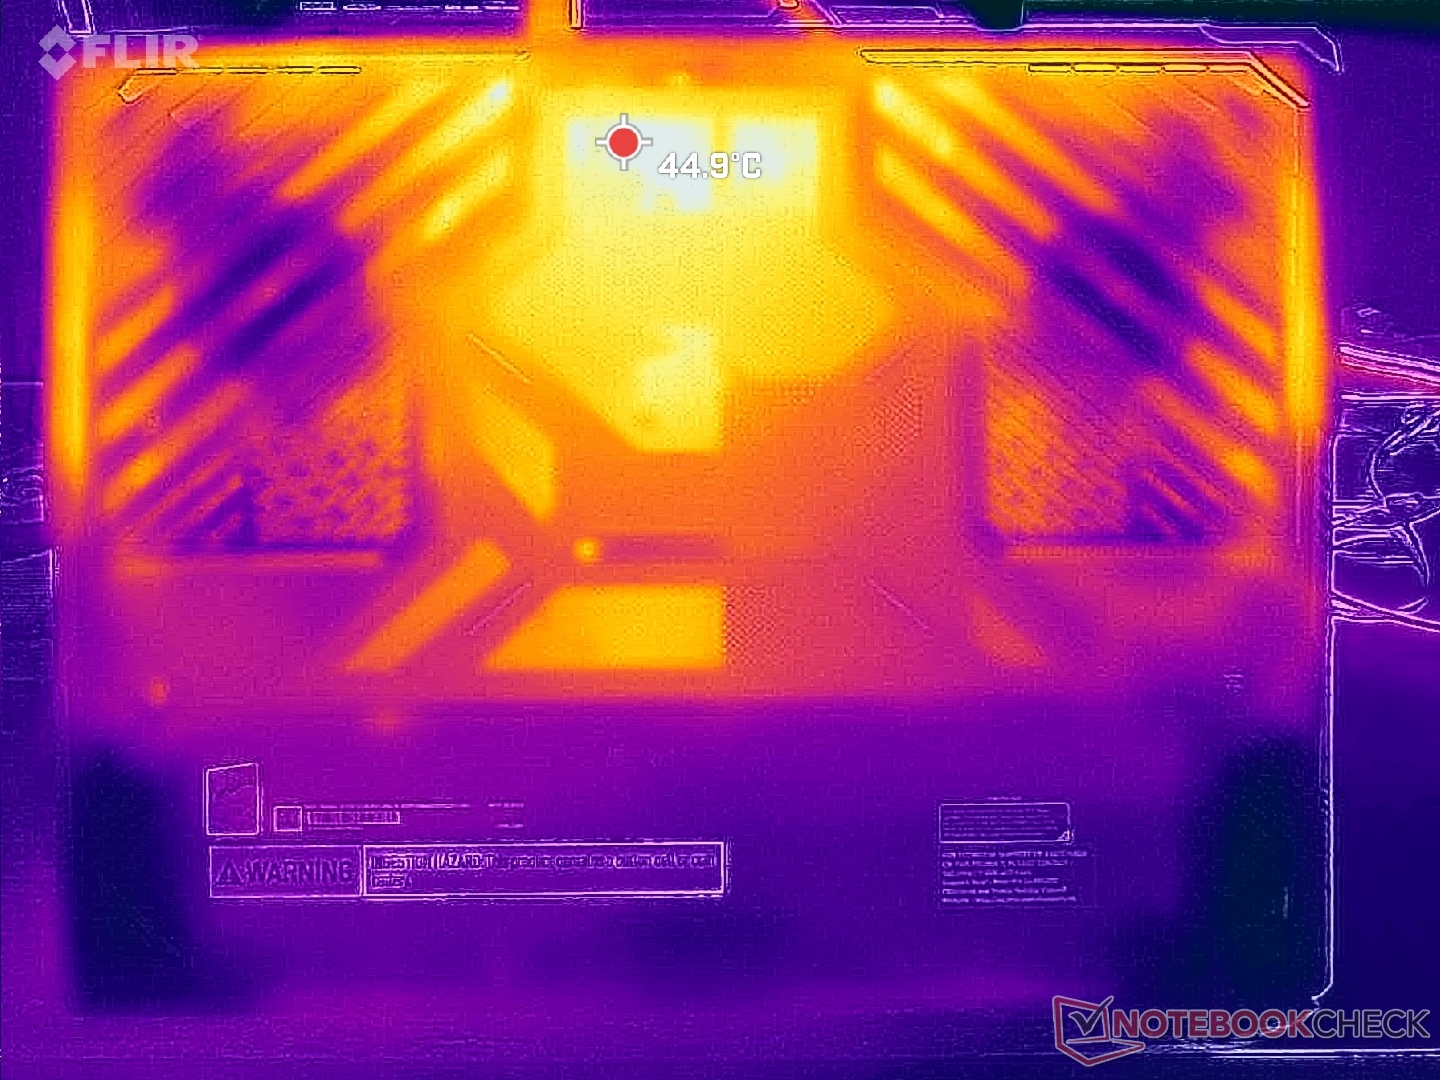
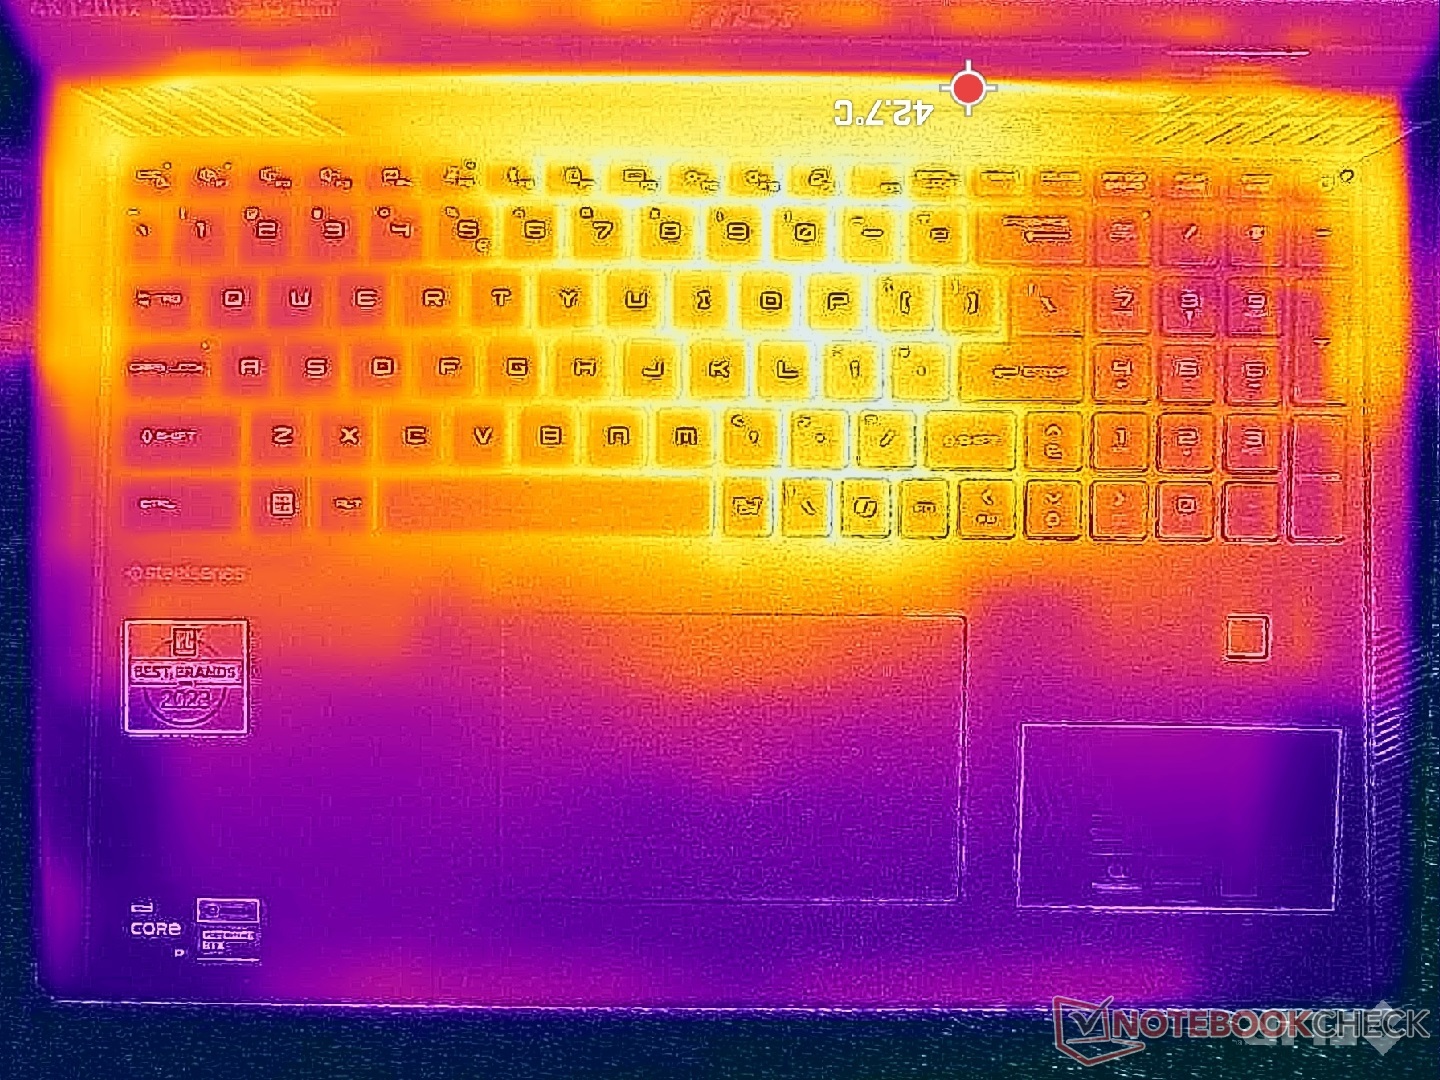
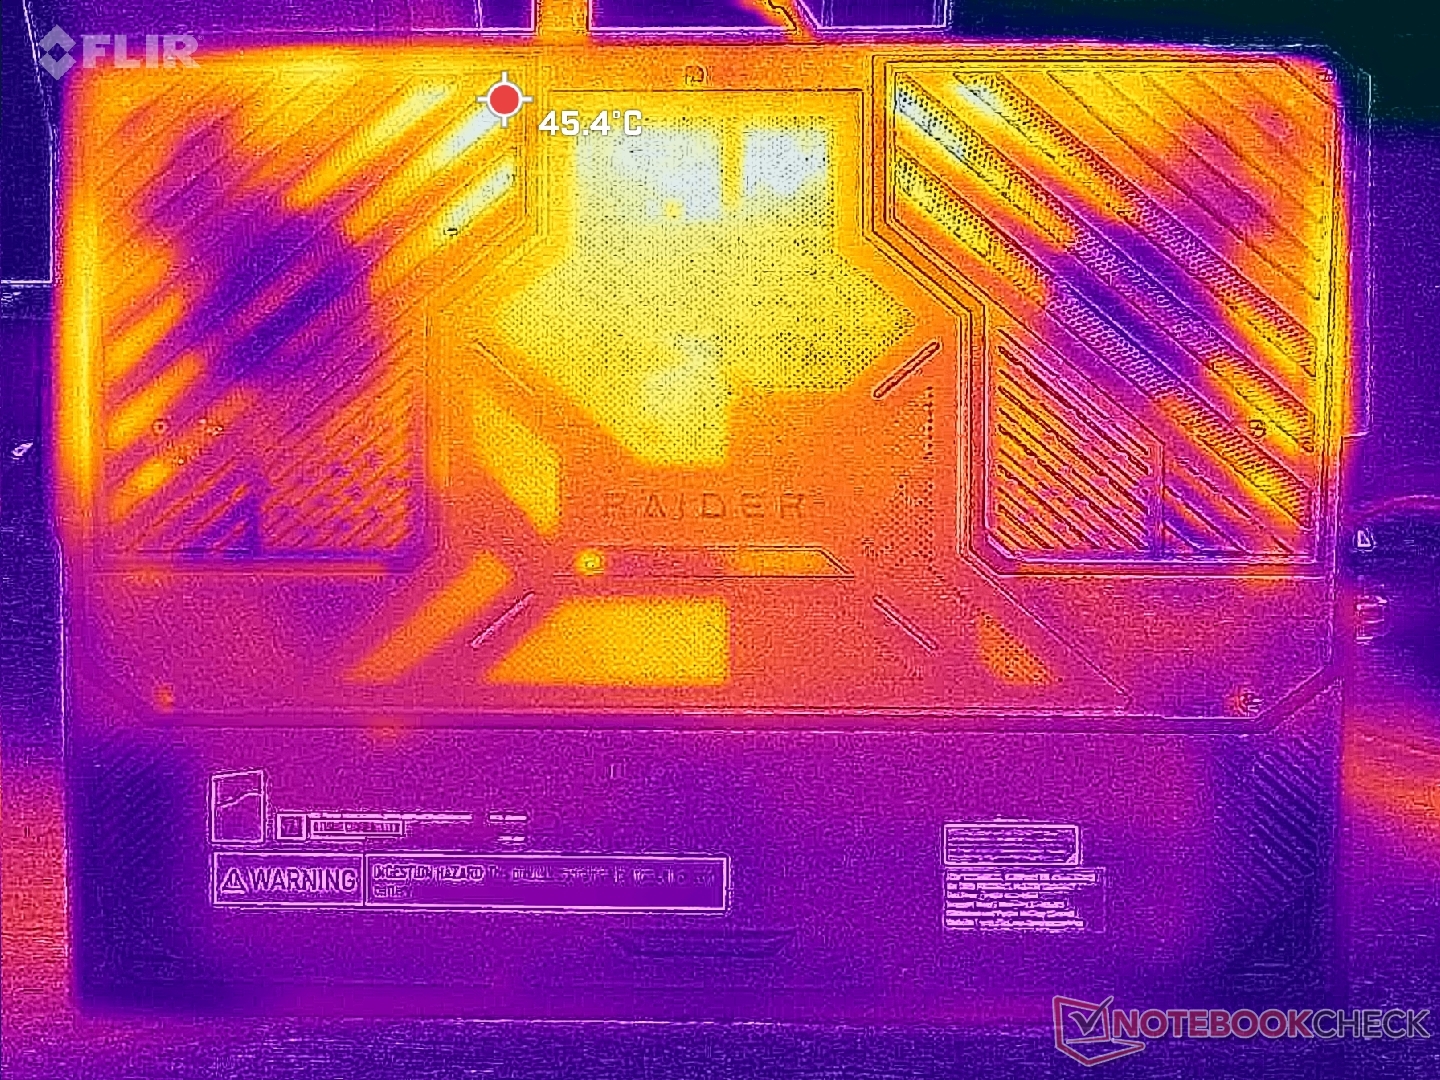
Temperatura
I punti caldi possono raggiungere poco più di 40 C durante il gioco, proprio come sulla Titan 18 HX. Le aree più calde si trovano verso il centro della tastiera e quindi i tasti WASD, il tastierino numerico e i poggiapolsi rimarranno molto più freschi e confortevoli per la pelle.
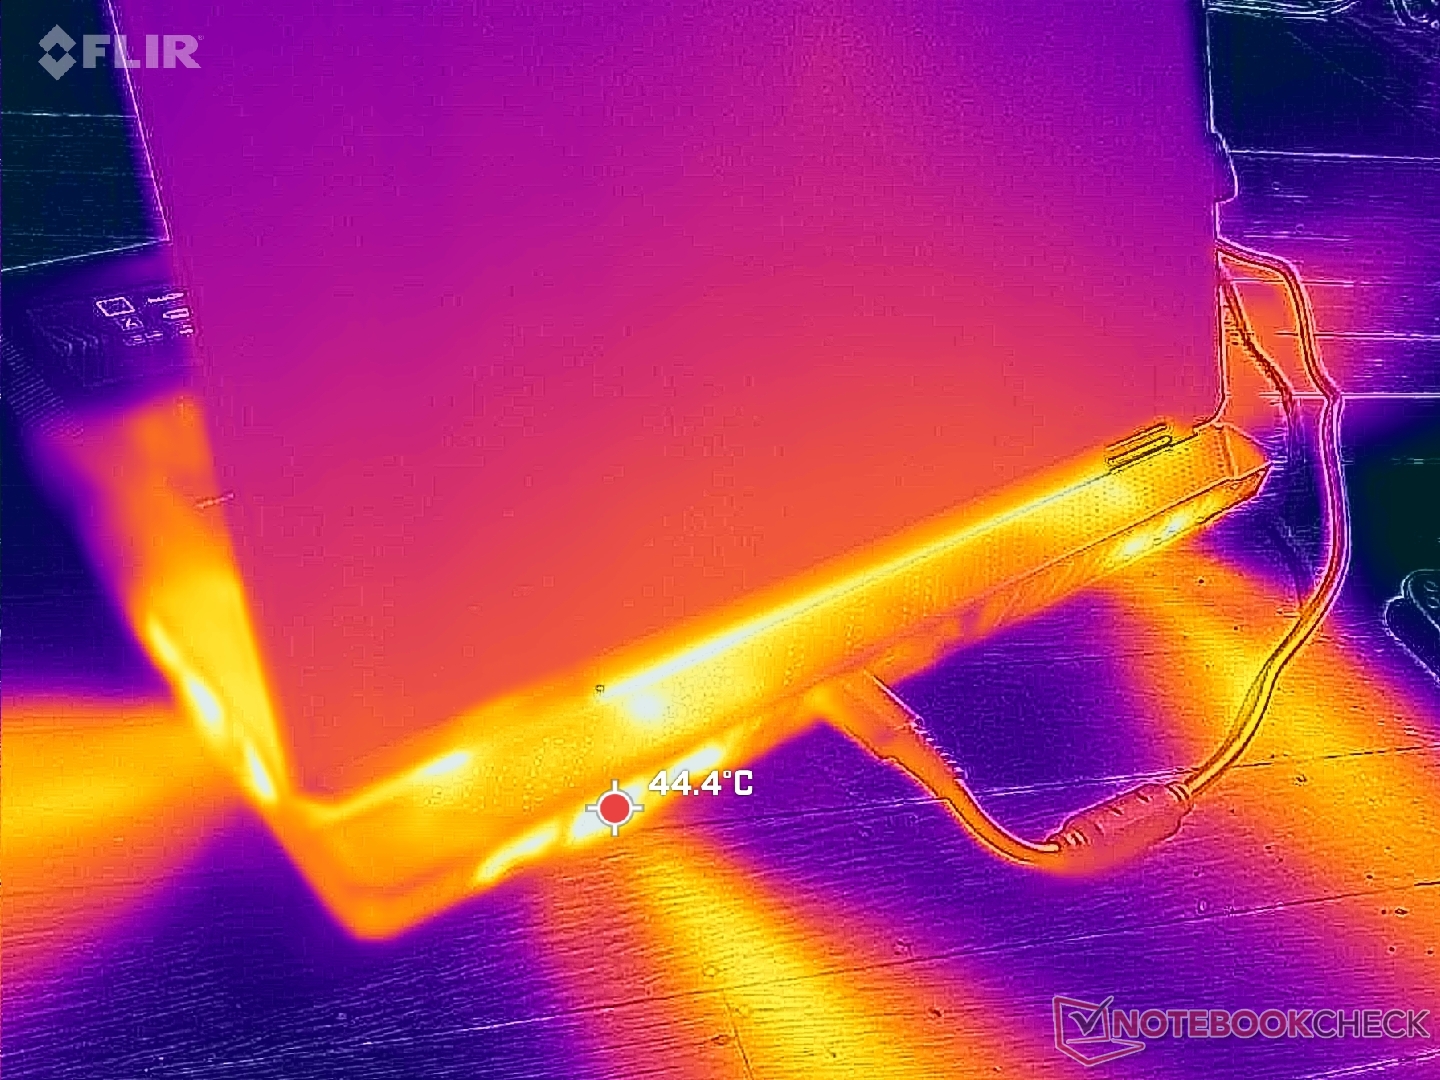
(±) La temperatura massima sul lato superiore è di 40.8 °C / 105 F, rispetto alla media di 40.4 °C / 105 F, che varia da 21.2 a 68.8 °C per questa classe Gaming.
(±) Il lato inferiore si riscalda fino ad un massimo di 43.4 °C / 110 F, rispetto alla media di 43.2 °C / 110 F
(±) In idle, la temperatura media del lato superiore è di 33.7 °C / 93 F, rispetto alla media deld ispositivo di 33.9 °C / 93 F.
(±) 3: The average temperature for the upper side is 34.4 °C / 94 F, compared to the average of 33.9 °C / 93 F for the class Gaming.
(+) I poggiapolsi e il touchpad raggiungono la temperatura massima della pelle (32.6 °C / 90.7 F) e quindi non sono caldi.
(-) La temperatura media della zona del palmo della mano di dispositivi simili e'stata di 28.9 °C / 84 F (-3.7 °C / -6.7 F).
| MSI Raider 18 HX A14V Intel Core i9-14900HX, NVIDIA GeForce RTX 4080 Laptop GPU | Razer Blade 18 2024 RZ09-0509 Intel Core i9-14900HX, NVIDIA GeForce RTX 4090 Laptop GPU | Alienware m18 R2 Intel Core i9-14900HX, NVIDIA GeForce RTX 4090 Laptop GPU | MSI Titan 18 HX A14VIG Intel Core i9-14900HX, NVIDIA GeForce RTX 4090 Laptop GPU | Asus ROG Strix G18 G814JI Intel Core i7-13650HX, NVIDIA GeForce RTX 4070 Laptop GPU | Acer Predator Helios 18 PH18-72-98MW Intel Core i9-14900HX, NVIDIA GeForce RTX 4090 Laptop GPU | |
|---|---|---|---|---|---|---|
| Heat | -1% | -5% | 6% | 5% | -6% | |
| Maximum Upper Side * | 40.8 | 43.2 -6% | 41.2 -1% | 37.8 7% | 45 -10% | 43 -5% |
| Maximum Bottom * | 43.4 | 42.6 2% | 34.6 20% | 37.6 13% | 47 -8% | 59 -36% |
| Idle Upper Side * | 36.4 | 36 1% | 42.8 -18% | 34.8 4% | 28 23% | 32 12% |
| Idle Bottom * | 36.4 | 36.4 -0% | 43.6 -20% | 36 1% | 31 15% | 34 7% |
* ... Meglio usare valori piccoli
Altoparlanti
MSI Raider 18 HX A14V analisi audio
(+) | gli altoparlanti sono relativamente potenti (84.6 dB)
Bassi 100 - 315 Hz
(±) | bassi ridotti - in media 9.2% inferiori alla media
(±) | la linearità dei bassi è media (9.2% delta rispetto alla precedente frequenza)
Medi 400 - 2000 Hz
(+) | medi bilanciati - solo only 4.3% rispetto alla media
(+) | medi lineari (5.1% delta rispetto alla precedente frequenza)
Alti 2 - 16 kHz
(+) | Alti bilanciati - appena 3.8% dalla media
(+) | alti lineari (4.9% delta rispetto alla precedente frequenza)
Nel complesso 100 - 16.000 Hz
(+) | suono nel complesso lineare (11.9% differenza dalla media)
Rispetto alla stessa classe
» 11% di tutti i dispositivi testati in questa classe è stato migliore, 4% simile, 85% peggiore
» Il migliore ha avuto un delta di 6%, medio di 18%, peggiore di 132%
Rispetto a tutti i dispositivi testati
» 8% di tutti i dispositivi testati in questa classe è stato migliore, 2% similare, 90% peggiore
» Il migliore ha avuto un delta di 4%, medio di 24%, peggiore di 134%
Apple MacBook Pro 16 2021 M1 Pro analisi audio
(+) | gli altoparlanti sono relativamente potenti (84.7 dB)
Bassi 100 - 315 Hz
(+) | bassi buoni - solo 3.8% dalla media
(+) | bassi in lineaa (5.2% delta rispetto alla precedente frequenza)
Medi 400 - 2000 Hz
(+) | medi bilanciati - solo only 1.3% rispetto alla media
(+) | medi lineari (2.1% delta rispetto alla precedente frequenza)
Alti 2 - 16 kHz
(+) | Alti bilanciati - appena 1.9% dalla media
(+) | alti lineari (2.7% delta rispetto alla precedente frequenza)
Nel complesso 100 - 16.000 Hz
(+) | suono nel complesso lineare (4.6% differenza dalla media)
Rispetto alla stessa classe
» 0% di tutti i dispositivi testati in questa classe è stato migliore, 0% simile, 100% peggiore
» Il migliore ha avuto un delta di 5%, medio di 18%, peggiore di 45%
Rispetto a tutti i dispositivi testati
» 0% di tutti i dispositivi testati in questa classe è stato migliore, 0% similare, 100% peggiore
» Il migliore ha avuto un delta di 4%, medio di 24%, peggiore di 134%
Gestione dell'energia
Consumo di energia
Il consumo complessivo è molto elevato, come ci si può aspettare da un DTR da 18 pollici dotato di un pannello mini-LED 4K esigente. Il funzionamento al minimo su desktop consuma tra i 27 W e i 48 W a seconda dell'impostazione della luminosità, della GPU e del profilo energetico. Il gioco richiederebbe poco più di 300 W, rispetto ai soli 220 W dell'Acer Predator Helios 18 pollici Acer Predator Helios 18.
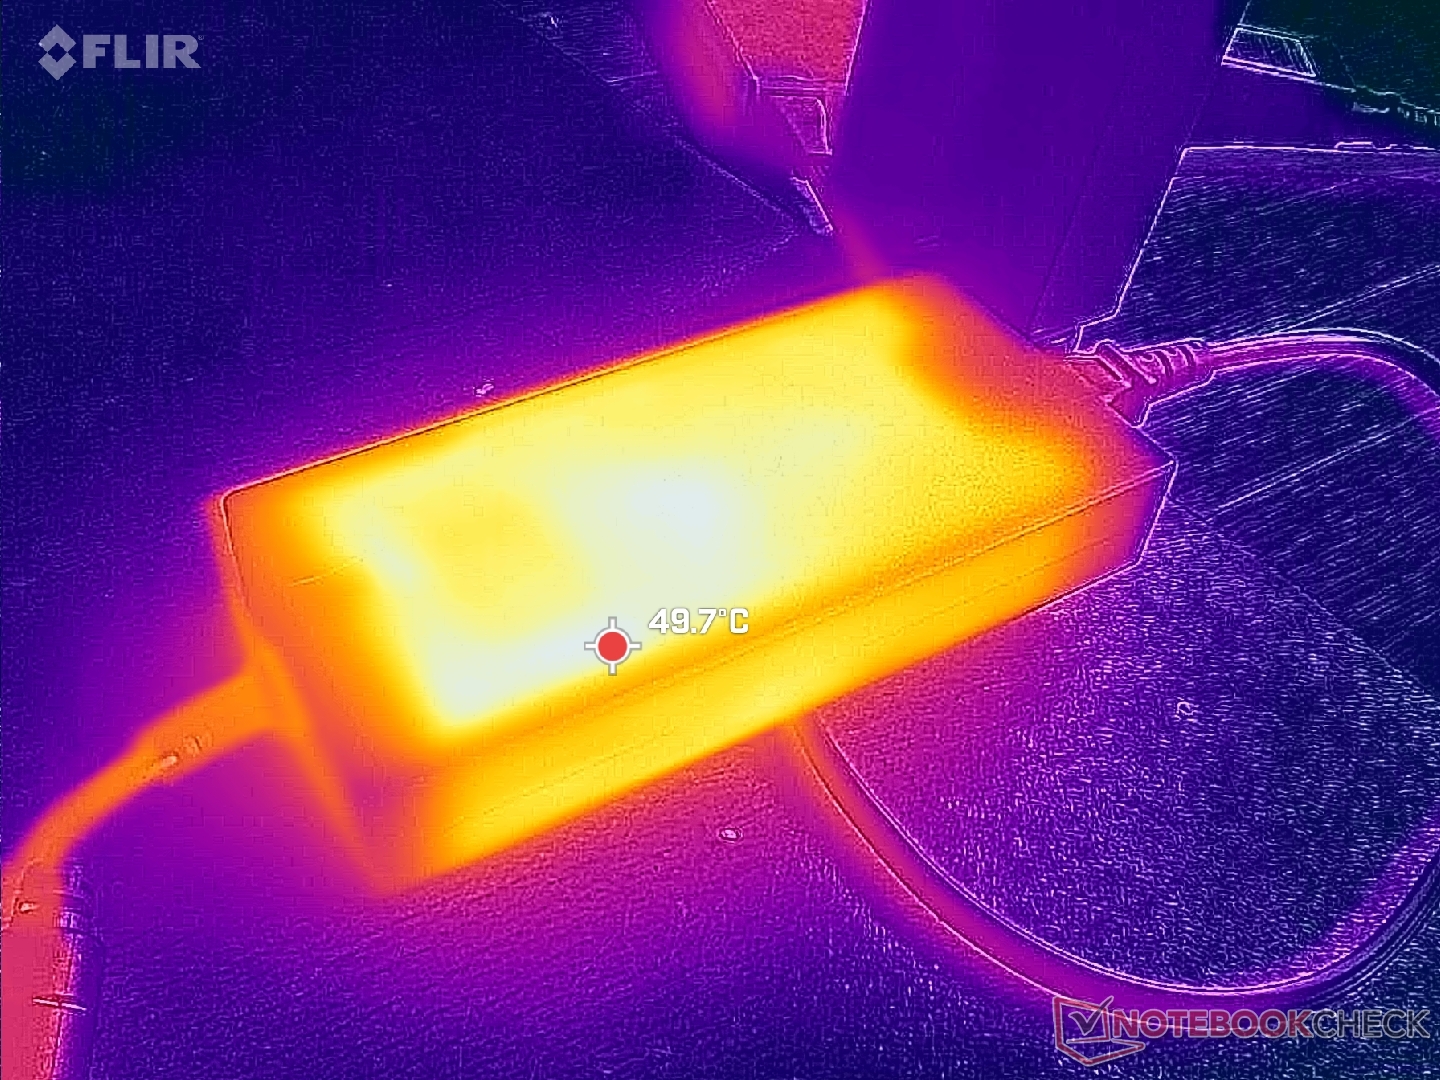
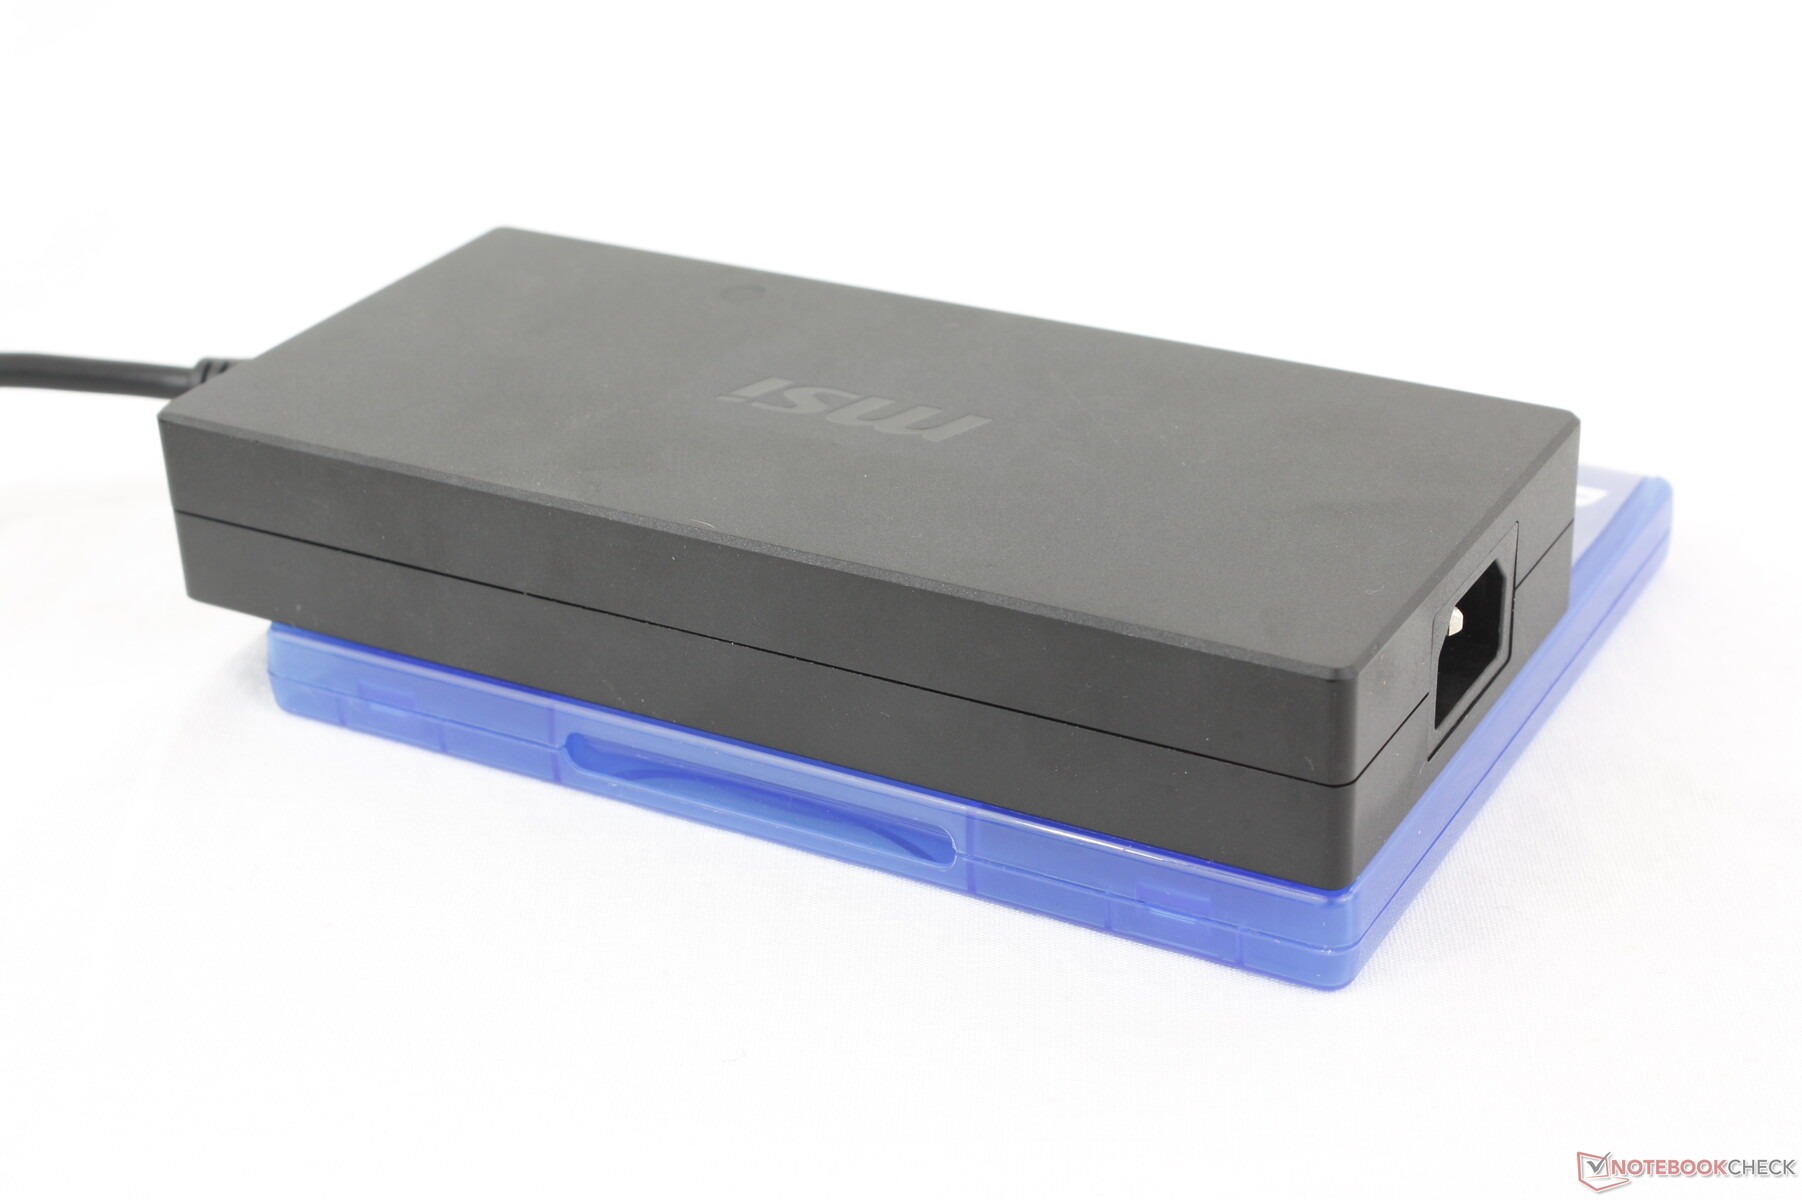
Siamo riusciti a registrare un consumo fino a 322 W dall'adattatore CA da 330 W. Rispetto all'adattatore CA da 400 W per Titan 18 HX, quello da 330 W è leggermente più piccolo (~18,4 x 8,4 x 3,1 cm contro ~18,8 x 8,8 x 3,2 cm). Il consumo durante l'esecuzione di attività ad alta intensità di CPU è generalmente inferiore sul Raider 18 HX, anche se viene fornito con la stessa CPU del Titan 18 HX, il che si allinea con le prestazioni della CPU leggermente più lente registrate nella nostra sezione CineBench di cui sopra.
| Off / Standby | |
| Idle | |
| Sotto carico |
|
Leggenda:
min: | |
| MSI Raider 18 HX A14V i9-14900HX, NVIDIA GeForce RTX 4080 Laptop GPU, Samsung PM9A1 MZVL22T0HBLB, Mini-LED, 3840x2400, 18" | Razer Blade 18 2024 RZ09-0509 i9-14900HX, NVIDIA GeForce RTX 4090 Laptop GPU, , Mini-LED, 2560x1600, 18" | Alienware m18 R2 i9-14900HX, NVIDIA GeForce RTX 4090 Laptop GPU, SK Hynix PC811 HFS002TEM9X152N, IPS, 2560x1600, 18" | MSI Titan 18 HX A14VIG i9-14900HX, NVIDIA GeForce RTX 4090 Laptop GPU, 2x Samsung PM9A1a MZVL22T0HDLB (RAID 0), Mini-LED, 3840x2400, 18" | Asus ROG Strix G18 G814JI i7-13650HX, NVIDIA GeForce RTX 4070 Laptop GPU, Micron 2400 MTFDKBA1T0QFM, IPS, 2560x1600, 18" | Acer Predator Helios 18 PH18-72-98MW i9-14900HX, NVIDIA GeForce RTX 4090 Laptop GPU, 2x SK Hynix HFS001TEJ9X115N (RAID 0), Mini-LED, 2560x1600, 18" | |
|---|---|---|---|---|---|---|
| Power Consumption | -2% | 8% | 5% | 42% | -2% | |
| Idle Minimum * | 27.7 | 25.4 8% | 10.6 62% | 13.2 52% | 8 71% | 31 -12% |
| Idle Average * | 38.3 | 37.7 2% | 20.9 45% | 25.4 34% | 15 61% | 35 9% |
| Idle Maximum * | 47.1 | 57.9 -23% | 40 15% | 53.5 -14% | 26 45% | 43 9% |
| Load Average * | 121.2 | 128.4 -6% | 201.1 -66% | 151.4 -25% | 102 16% | 144 -19% |
| Cyberpunk 2077 ultra * | 313 | |||||
| Cyberpunk 2077 ultra external monitor * | 306 | |||||
| Load Maximum * | 321.8 | 297.9 7% | 378.9 -18% | 395.2 -23% | 267 17% | 318 1% |
| Witcher 3 ultra * | 273.1 | 358 | 336 | 178.6 | 228 |
* ... Meglio usare valori piccoli
Power Consumption Cyberpunk / Stress Test
Power Consumption external Monitor
Durata della batteria
I tempi di esecuzione sono brevi a causa dell'hardware esigente. Siamo riusciti a registrare poco più di 3 ore di utilizzo della WLAN nel mondo reale, anche quando abbiamo impostato la modalità Battery Saver e la modalità iGPU, mentre il ROG Strix G18 può durare più del doppio con il suo display IPS. La capacità della batteria è già al massimo legale di 99,9 Wh.
La ricarica da vuoto a pieno richiede quasi 2,5 ore, un po' di più rispetto alla maggior parte degli altri computer portatili. La ricarica con adattatori CA USB-C di terze parti sarà ancora più lenta.
| MSI Raider 18 HX A14V i9-14900HX, NVIDIA GeForce RTX 4080 Laptop GPU, 99.9 Wh | Razer Blade 18 2024 RZ09-0509 i9-14900HX, NVIDIA GeForce RTX 4090 Laptop GPU, 91.7 Wh | Alienware m18 R2 i9-14900HX, NVIDIA GeForce RTX 4090 Laptop GPU, 97 Wh | MSI Titan 18 HX A14VIG i9-14900HX, NVIDIA GeForce RTX 4090 Laptop GPU, 99.9 Wh | Asus ROG Strix G18 G814JI i7-13650HX, NVIDIA GeForce RTX 4070 Laptop GPU, 90 Wh | Acer Predator Helios 18 PH18-72-98MW i9-14900HX, NVIDIA GeForce RTX 4090 Laptop GPU, 90 Wh | |
|---|---|---|---|---|---|---|
| Autonomia della batteria | 20% | 46% | 19% | 101% | -10% | |
| Reader / Idle | 264 | 395 50% | 353 34% | 702 166% | ||
| WiFi v1.3 | 198 | 263 33% | 290 46% | 252 27% | 484 144% | 192 -3% |
| Load | 76 | 58 -24% | 72 -5% | 71 -7% | 64 -16% |
Pro
Contro
Verdetto - Un Titano nel cuore
Quando abbiamo recensito la Titan 18 HX all'inizio di quest'anno, abbiamo elogiato le sue prestazioni, ma siamo rimasti scioccati quando abbiamo saputo del suo prezzo richiesto di oltre 5000 dollari USA. Il fatto che la CPU e la GPU non fossero effettivamente nulla di nuovo rendeva il modello molto meno attraente. Raider 18 HX affronta il prezzo esorbitante di Titan 18 HX tagliando il grasso e mantenendo le stesse opzioni di CPU, GPU e display. I possessori di Raider perdono il clickpad retroilluminato, il raffreddamento a camera di vapore, i tasti meccanici e il supporto SSD terziario M.2, ma queste caratteristiche di lusso sono facili da abbandonare quando l'esperienza di gioco tra Raider e Titan è esattamente la stessa. In effetti, si può affermare che il Raider è più comodo da usare, in quanto il suo clickpad tradizionale e la sua tastiera a membrana sono più familiari rispetto all'approccio atipico del Titan.
Raider 18 HX spreme ogni grammo di prestazioni dalla CPU Core i9 e dalla GPU da 175 W, anche se deve essere più grande, più pesante e spesso più rumoroso di molti dei suoi concorrenti.
Rispetto ad altri portatili da gioco da 18 pollici, Raider 18 HX offre un'esperienza di digitazione più spaziosa e quattro slot SODIMM, mentre alternative come il modello Blade 18 o ROG Strix G18 non hanno alcun tastierino numerico o possono supportare solo due moduli SODIMM. Tuttavia, il sistema MSI è ancora notevolmente più grande e più pesante rispetto alla maggior parte della concorrenza e non è necessariamente più silenzioso per compensarlo. Le prestazioni della CPU e della GPU potrebbero essere leggermente più veloci, ma molti utenti potrebbero non notarlo nella pratica. In questo caso, dovrà apprezzare la facilità di manutenzione e le opzioni mini-LED 4K del Raider per giustificare il suo peso.
Prezzo e disponibilità
MSI Raider 18 HX, come configurato nella nostra recensione, è ora disponibile su Amazon a 3190 dollari. In alternativa, è disponibile anche la versione IPS a 3290 dollari.
Nota: abbiamo recentemente aggiornato il nostro sistema di valutazione e i risultati della versione 8 non sono paragonabili ai risultati della versione 7. Ulteriori informazioni sono disponibili qui .
MSI Raider 18 HX A14V
- 09/03/2024 v8
Allen Ngo
 Total Sustainability Score:
 Transparency
La selezione dei dispositivi da recensire viene effettuata dalla nostra redazione. Il campione di prova è stato fornito all'autore come prestito dal produttore o dal rivenditore ai fini di questa recensione. L'istituto di credito non ha avuto alcuna influenza su questa recensione, né il produttore ne ha ricevuto una copia prima della pubblicazione. Non vi era alcun obbligo di pubblicare questa recensione. Non accettiamo mai compensi o pagamenti in cambio delle nostre recensioni. In quanto società mediatica indipendente, Notebookcheck non è soggetta all'autorità di produttori, rivenditori o editori.
Ecco come Notebookcheck esegue i test
Ogni anno, Notebookcheck esamina in modo indipendente centinaia di laptop e smartphone utilizzando procedure standardizzate per garantire che tutti i risultati siano comparabili. Da circa 20 anni sviluppiamo continuamente i nostri metodi di prova e nel frattempo stabiliamo gli standard di settore. Nei nostri laboratori di prova, tecnici ed editori esperti utilizzano apparecchiature di misurazione di alta qualità. Questi test comportano un processo di validazione in più fasi. Il nostro complesso sistema di valutazione si basa su centinaia di misurazioni e parametri di riferimento ben fondati, che mantengono l'obiettività.Price comparison

