

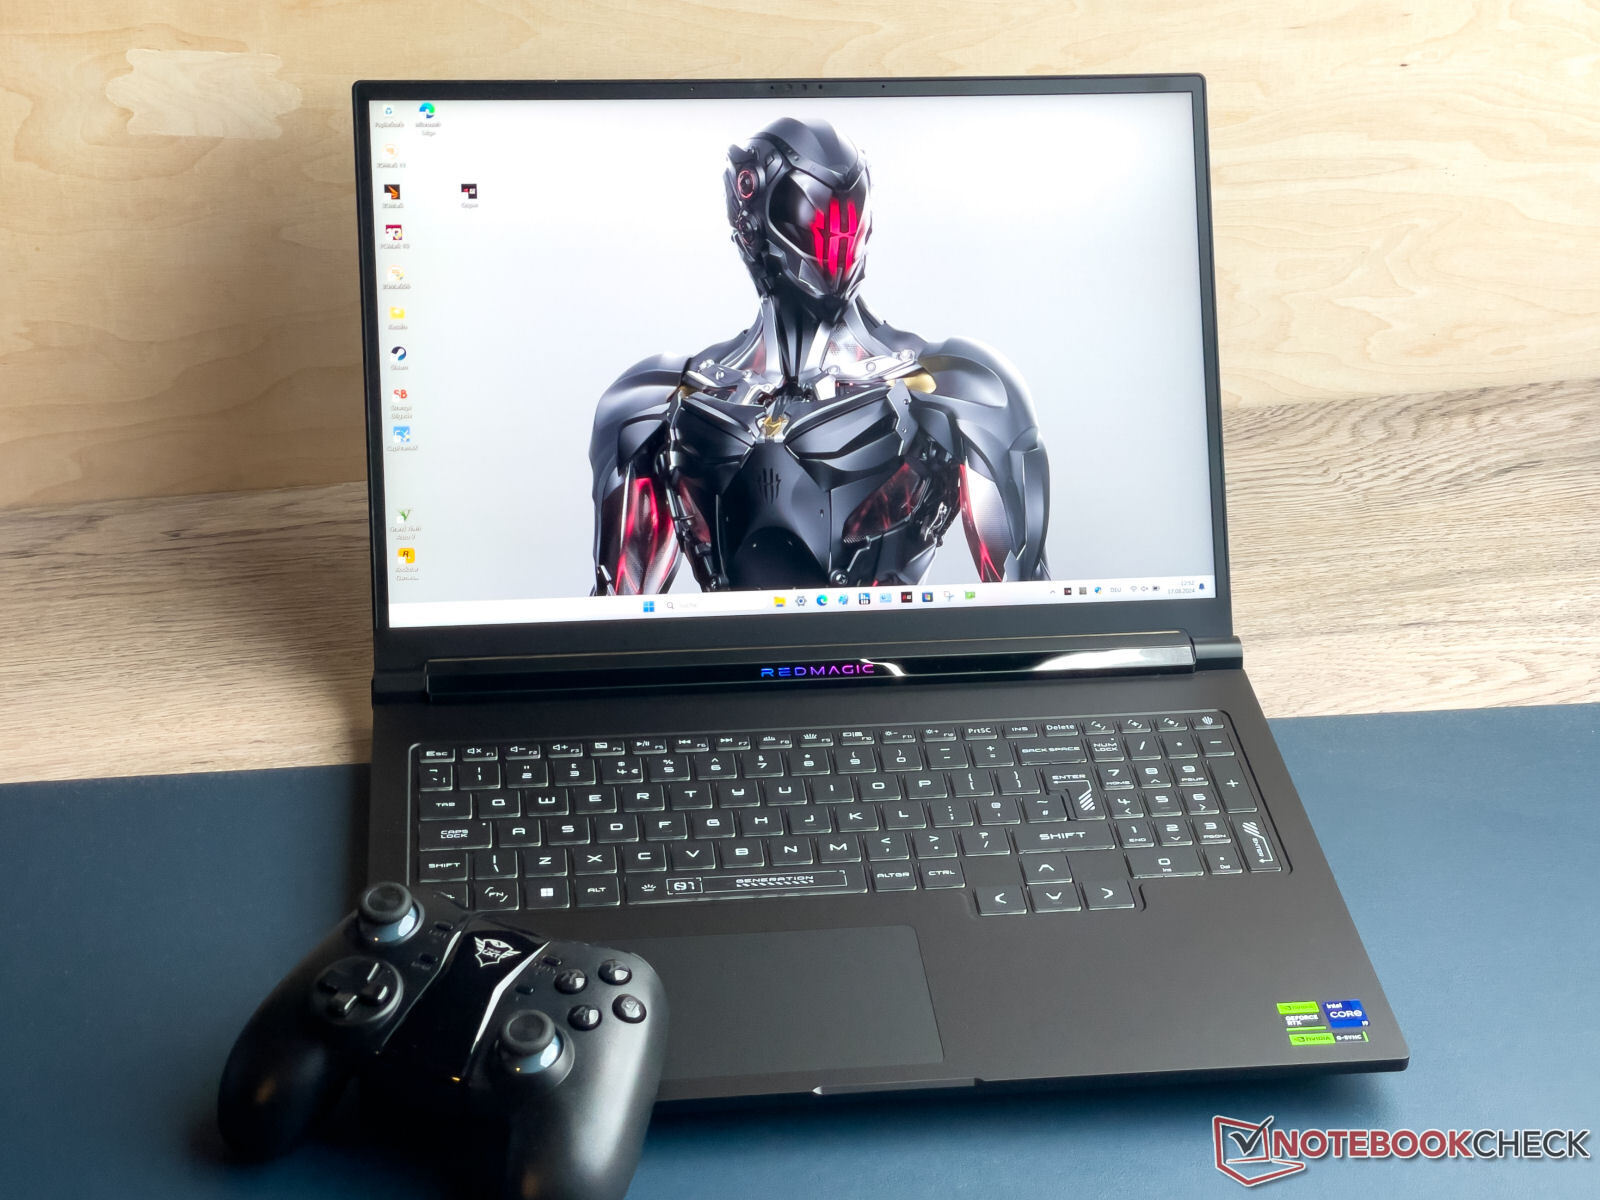
Recensione del RedMagic Titan 16 Pro: Un portatile per il gaming realizzato da un produttore di smartphone

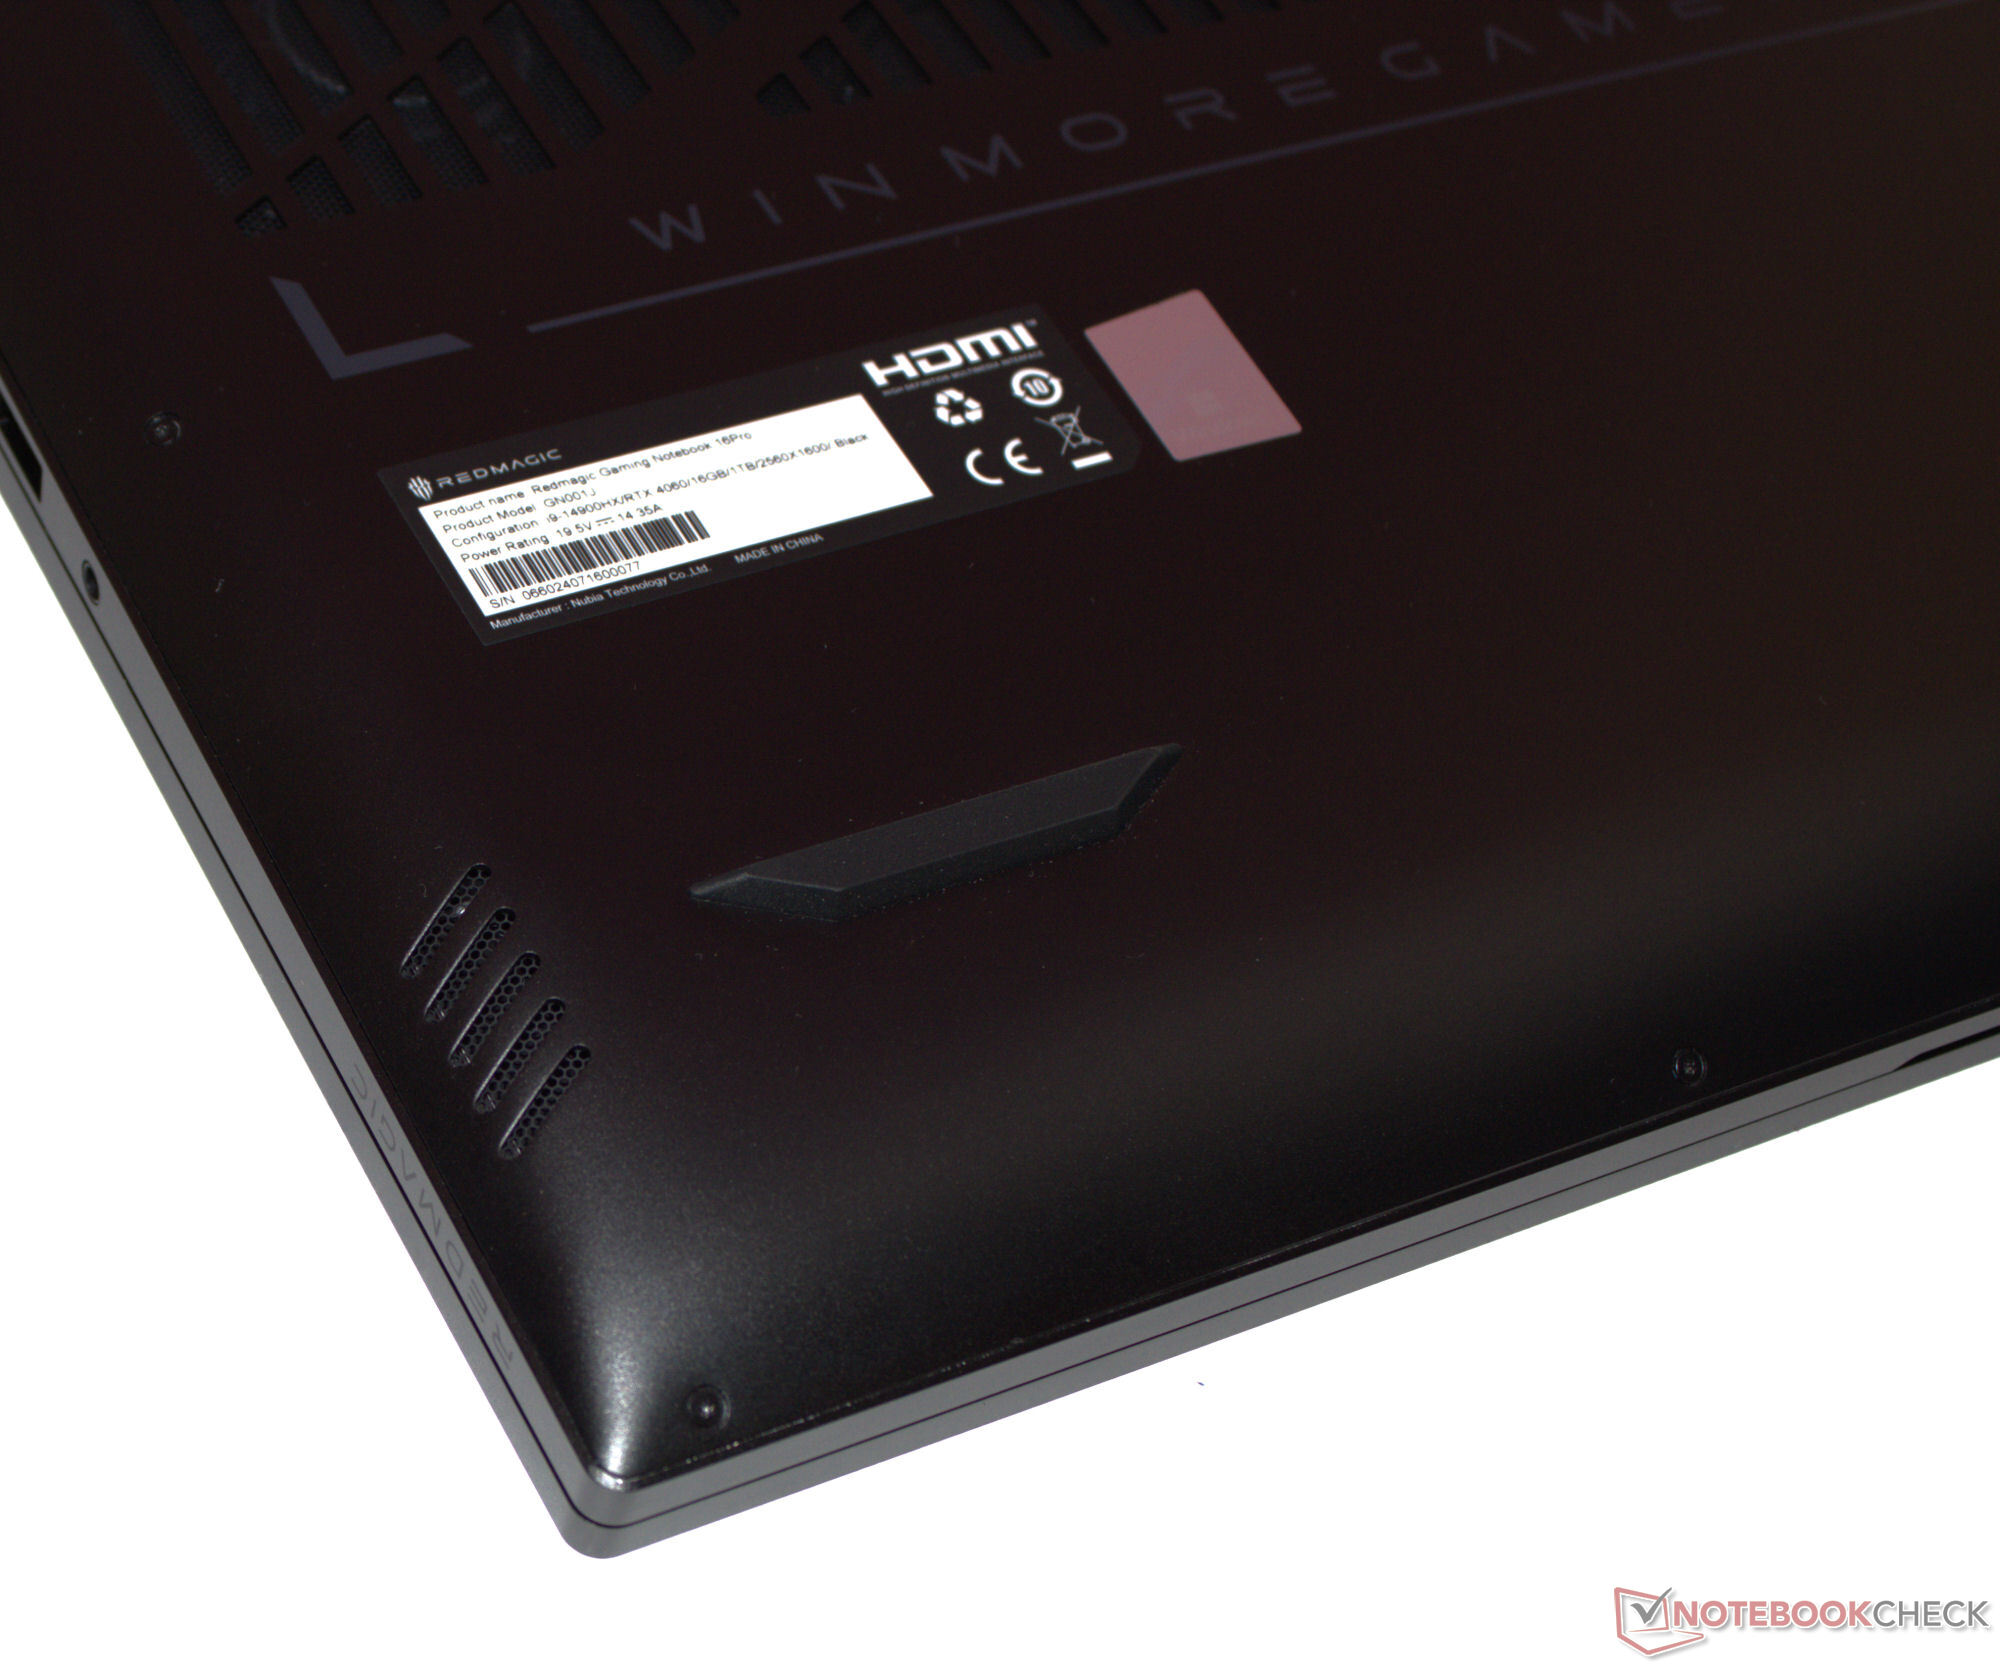
I visitatori abituali di questo sito web potrebbero già conoscere il marchio "RedMagic" dal segmento degli smartphone da gioco (ad esempio il Nubia RedMagic 9 Pro). Il RedMagic Titan 16 Pro è la prima incursione di Nubia nel mondo dei computer portatili da gioco. La sua scheda tecnica non riserva sorprese: A Core i9-14900HX è abbinato a una GeForce RTX 4060. A questo si aggiungono uno schermo da 16 pollici con rapporto di aspetto 16:10, Thunderbolt 4, RAM DDR5 e 2 slot SSD.
Resta da vedere se Nubia sia in grado di reggere il confronto con una concorrenza già consolidata. Il Titan compete con i seguenti dispositivi: Lenovo Legion Pro 5 16IRX9, HP Victus 16 (2024), Acer Predator Helios Neo 16 (2024), XMG Pro 16 Studio (Mid 24) e Gigabyte G6X 9KG (2024).
Potenziali concorrenti a confrontos
Punteggio | Versione | Data | Modello | Peso | Altezza | Dimensione | Risoluzione | Prezzo |
|---|---|---|---|---|---|---|---|---|
| 81.2 % | v8 | 08/2024 | Nubia RedMagic Titan 16 Pro i9-14900HX, NVIDIA GeForce RTX 4060 Laptop GPU | 2.4 kg | 23.9 mm | 16.00" | 2560x1600 | |
| 82.3 % | v8 | 07/2024 | Lenovo Legion Pro 5 16IRX9 G9 i7-14700HX, NVIDIA GeForce RTX 4060 Laptop GPU | 2.5 kg | 26.55 mm | 16.00" | 2560x1600 | |
| 84.3 % v7 (old) | v7 (old) | 05/2024 | HP Victus 16 (2024) i7-14700HX, NVIDIA GeForce RTX 4060 Laptop GPU | 2.4 kg | 23.9 mm | 16.10" | 1920x1080 | |
| 86.8 % v7 (old) | v7 (old) | 05/2024 | Acer Predator Helios Neo 16 (2024) i7-14700HX, NVIDIA GeForce RTX 4070 Laptop GPU | 2.6 kg | 25.95 mm | 16.00" | 2560x1600 | |
| 81.2 % | v8 | 07/2024 | SCHENKER XMG Pro 16 Studio (Mid 24) i9-14900HX, NVIDIA GeForce RTX 4070 Laptop GPU | 2.3 kg | 19.9 mm | 16.00" | 2560x1600 | |
| 83.2 % v7 (old) | v7 (old) | 03/2024 | Gigabyte G6X 9KG (2024) i7-13650HX, NVIDIA GeForce RTX 4060 Laptop GPU | 2.6 kg | 25.1 mm | 16.00" | 1920x1200 |
Nota bene: abbiamo recentemente aggiornato il nostro sistema di valutazione e i risultati della versione 8 non sono confrontabili con quelli della versione 7. Ulteriori informazioni sono disponibili qui.
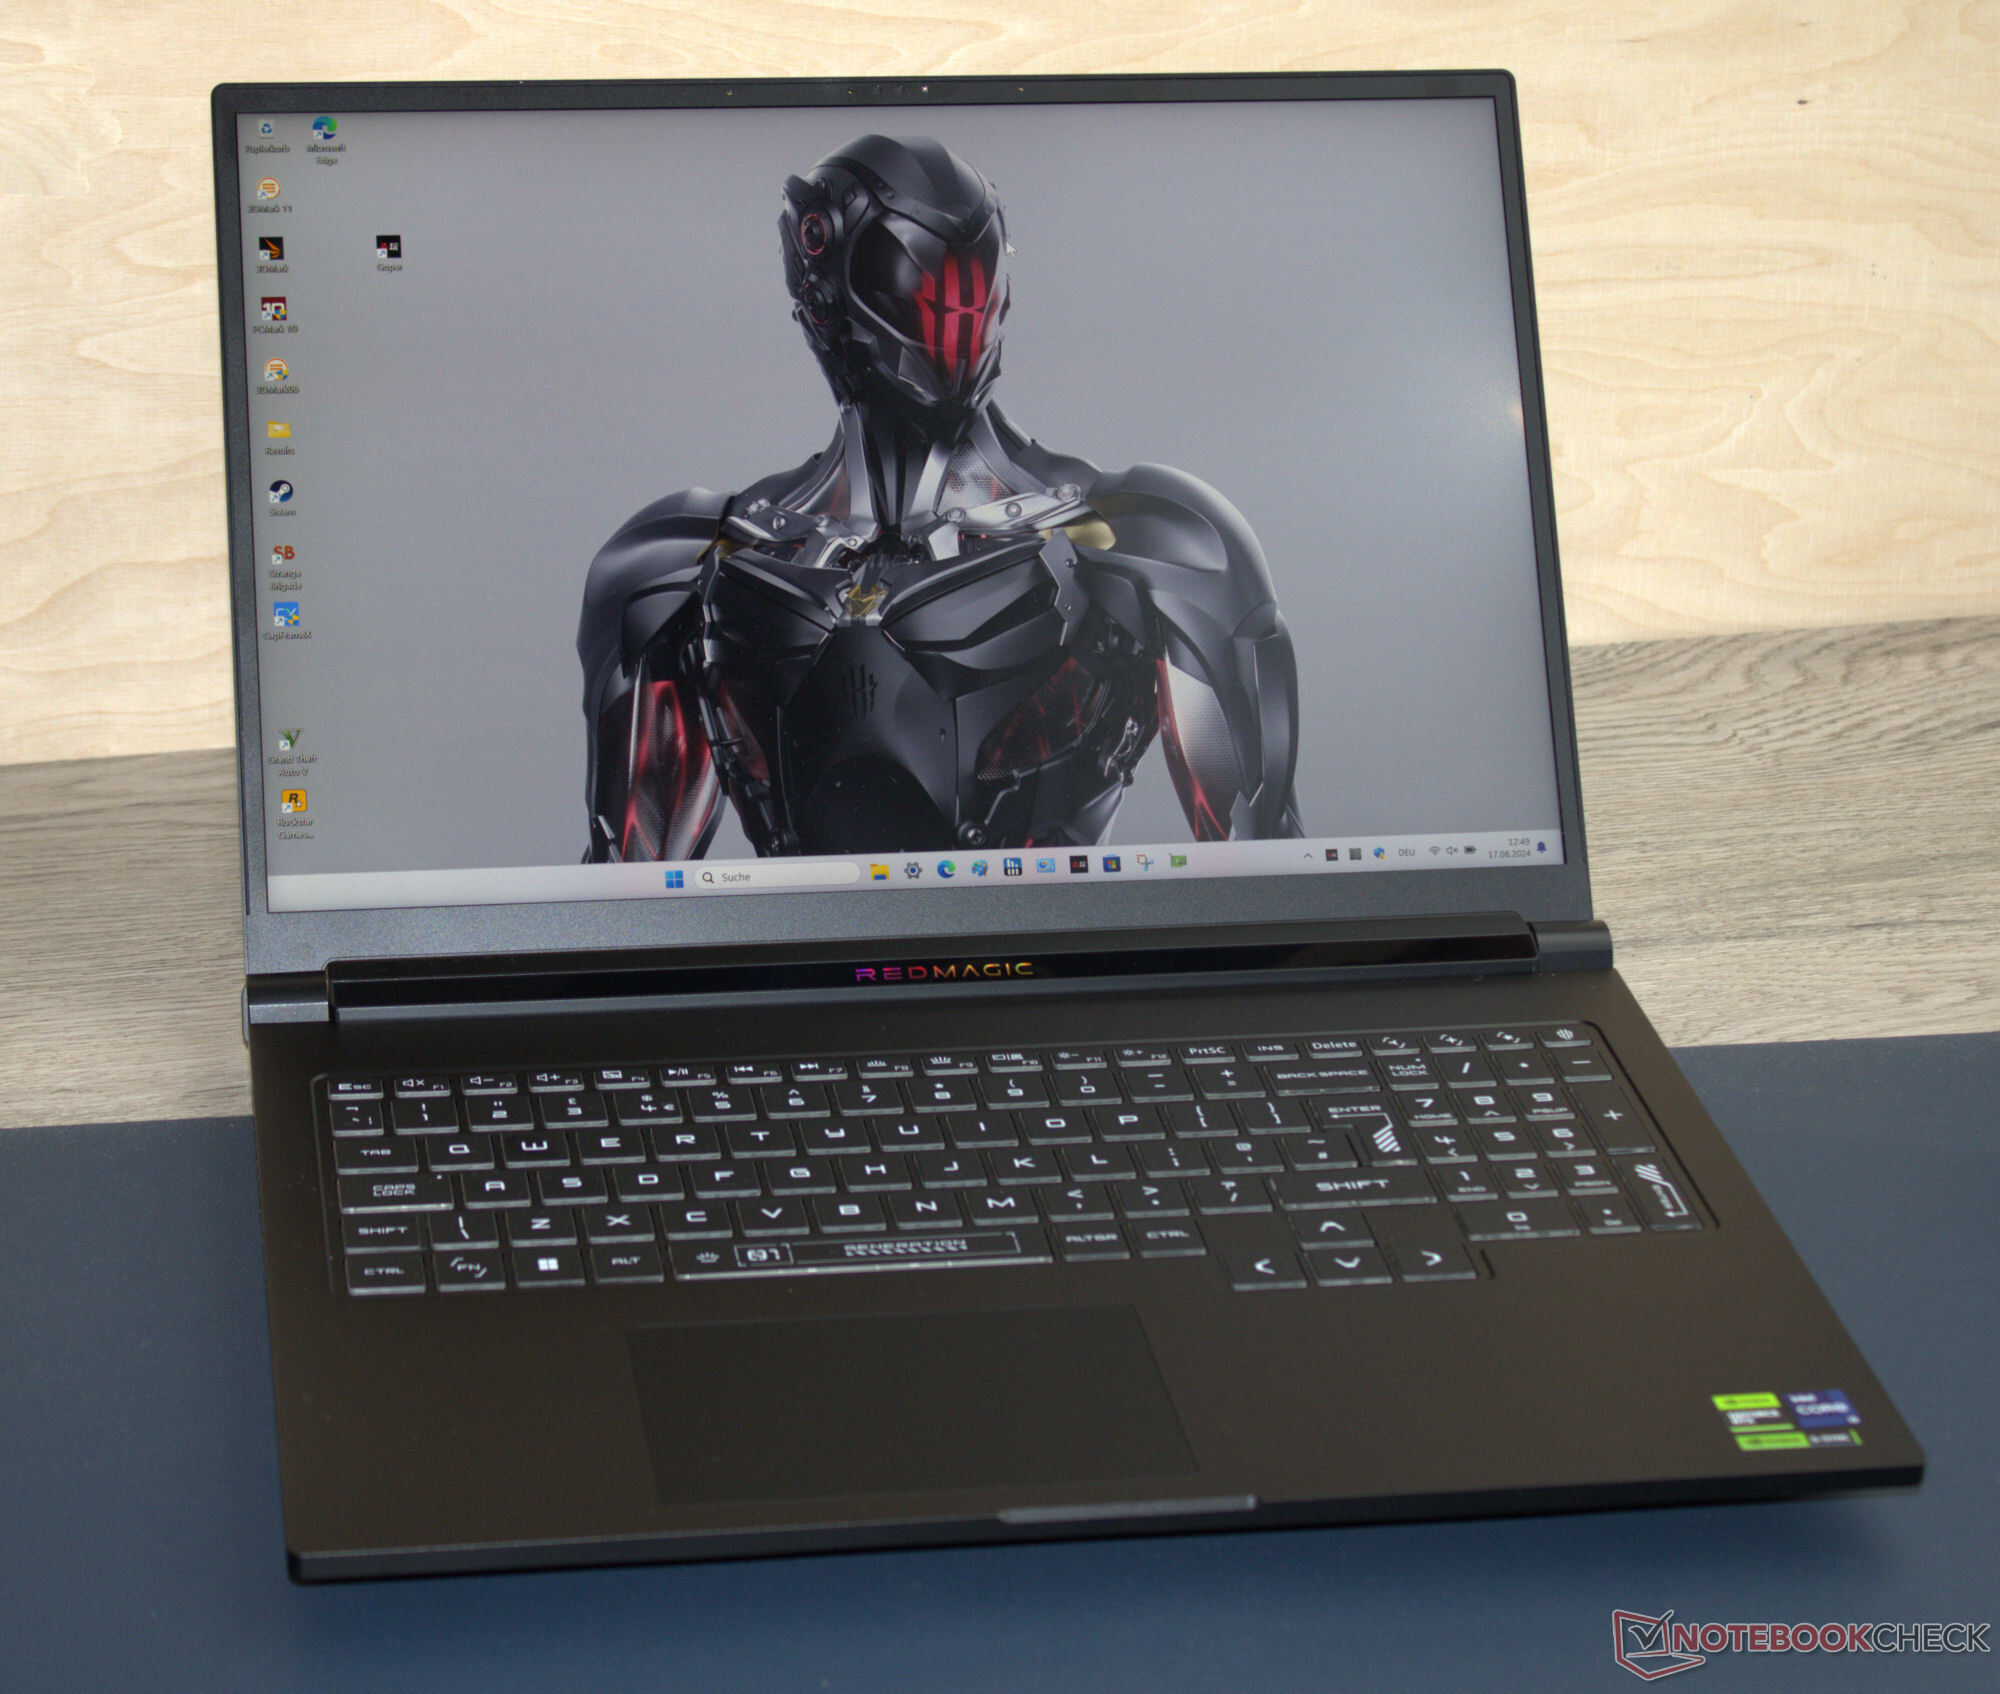
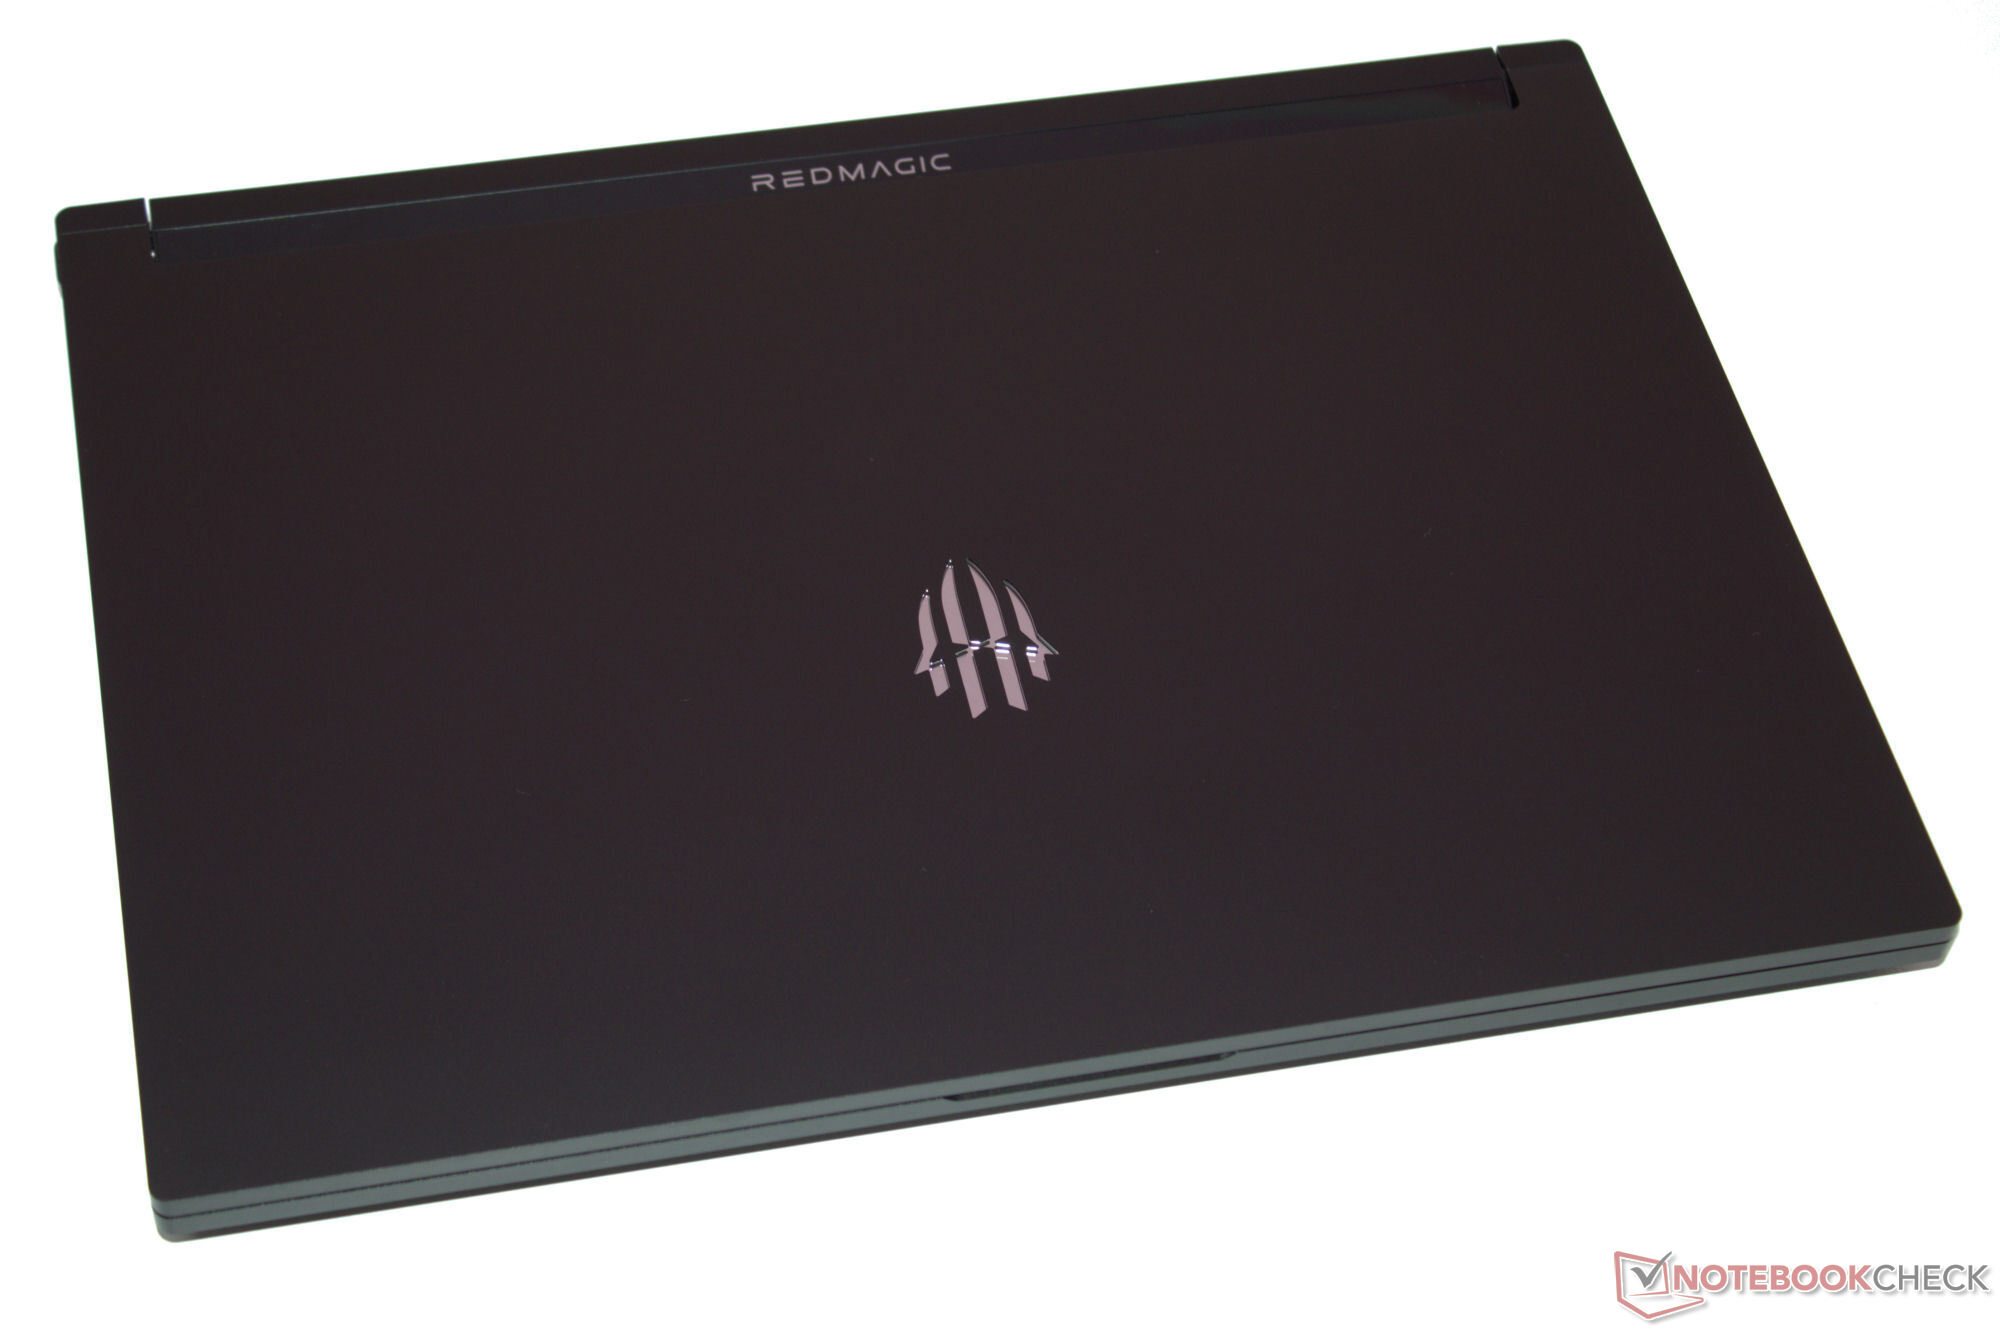
Custodia - Nubia ha scelto una custodia in alluminio
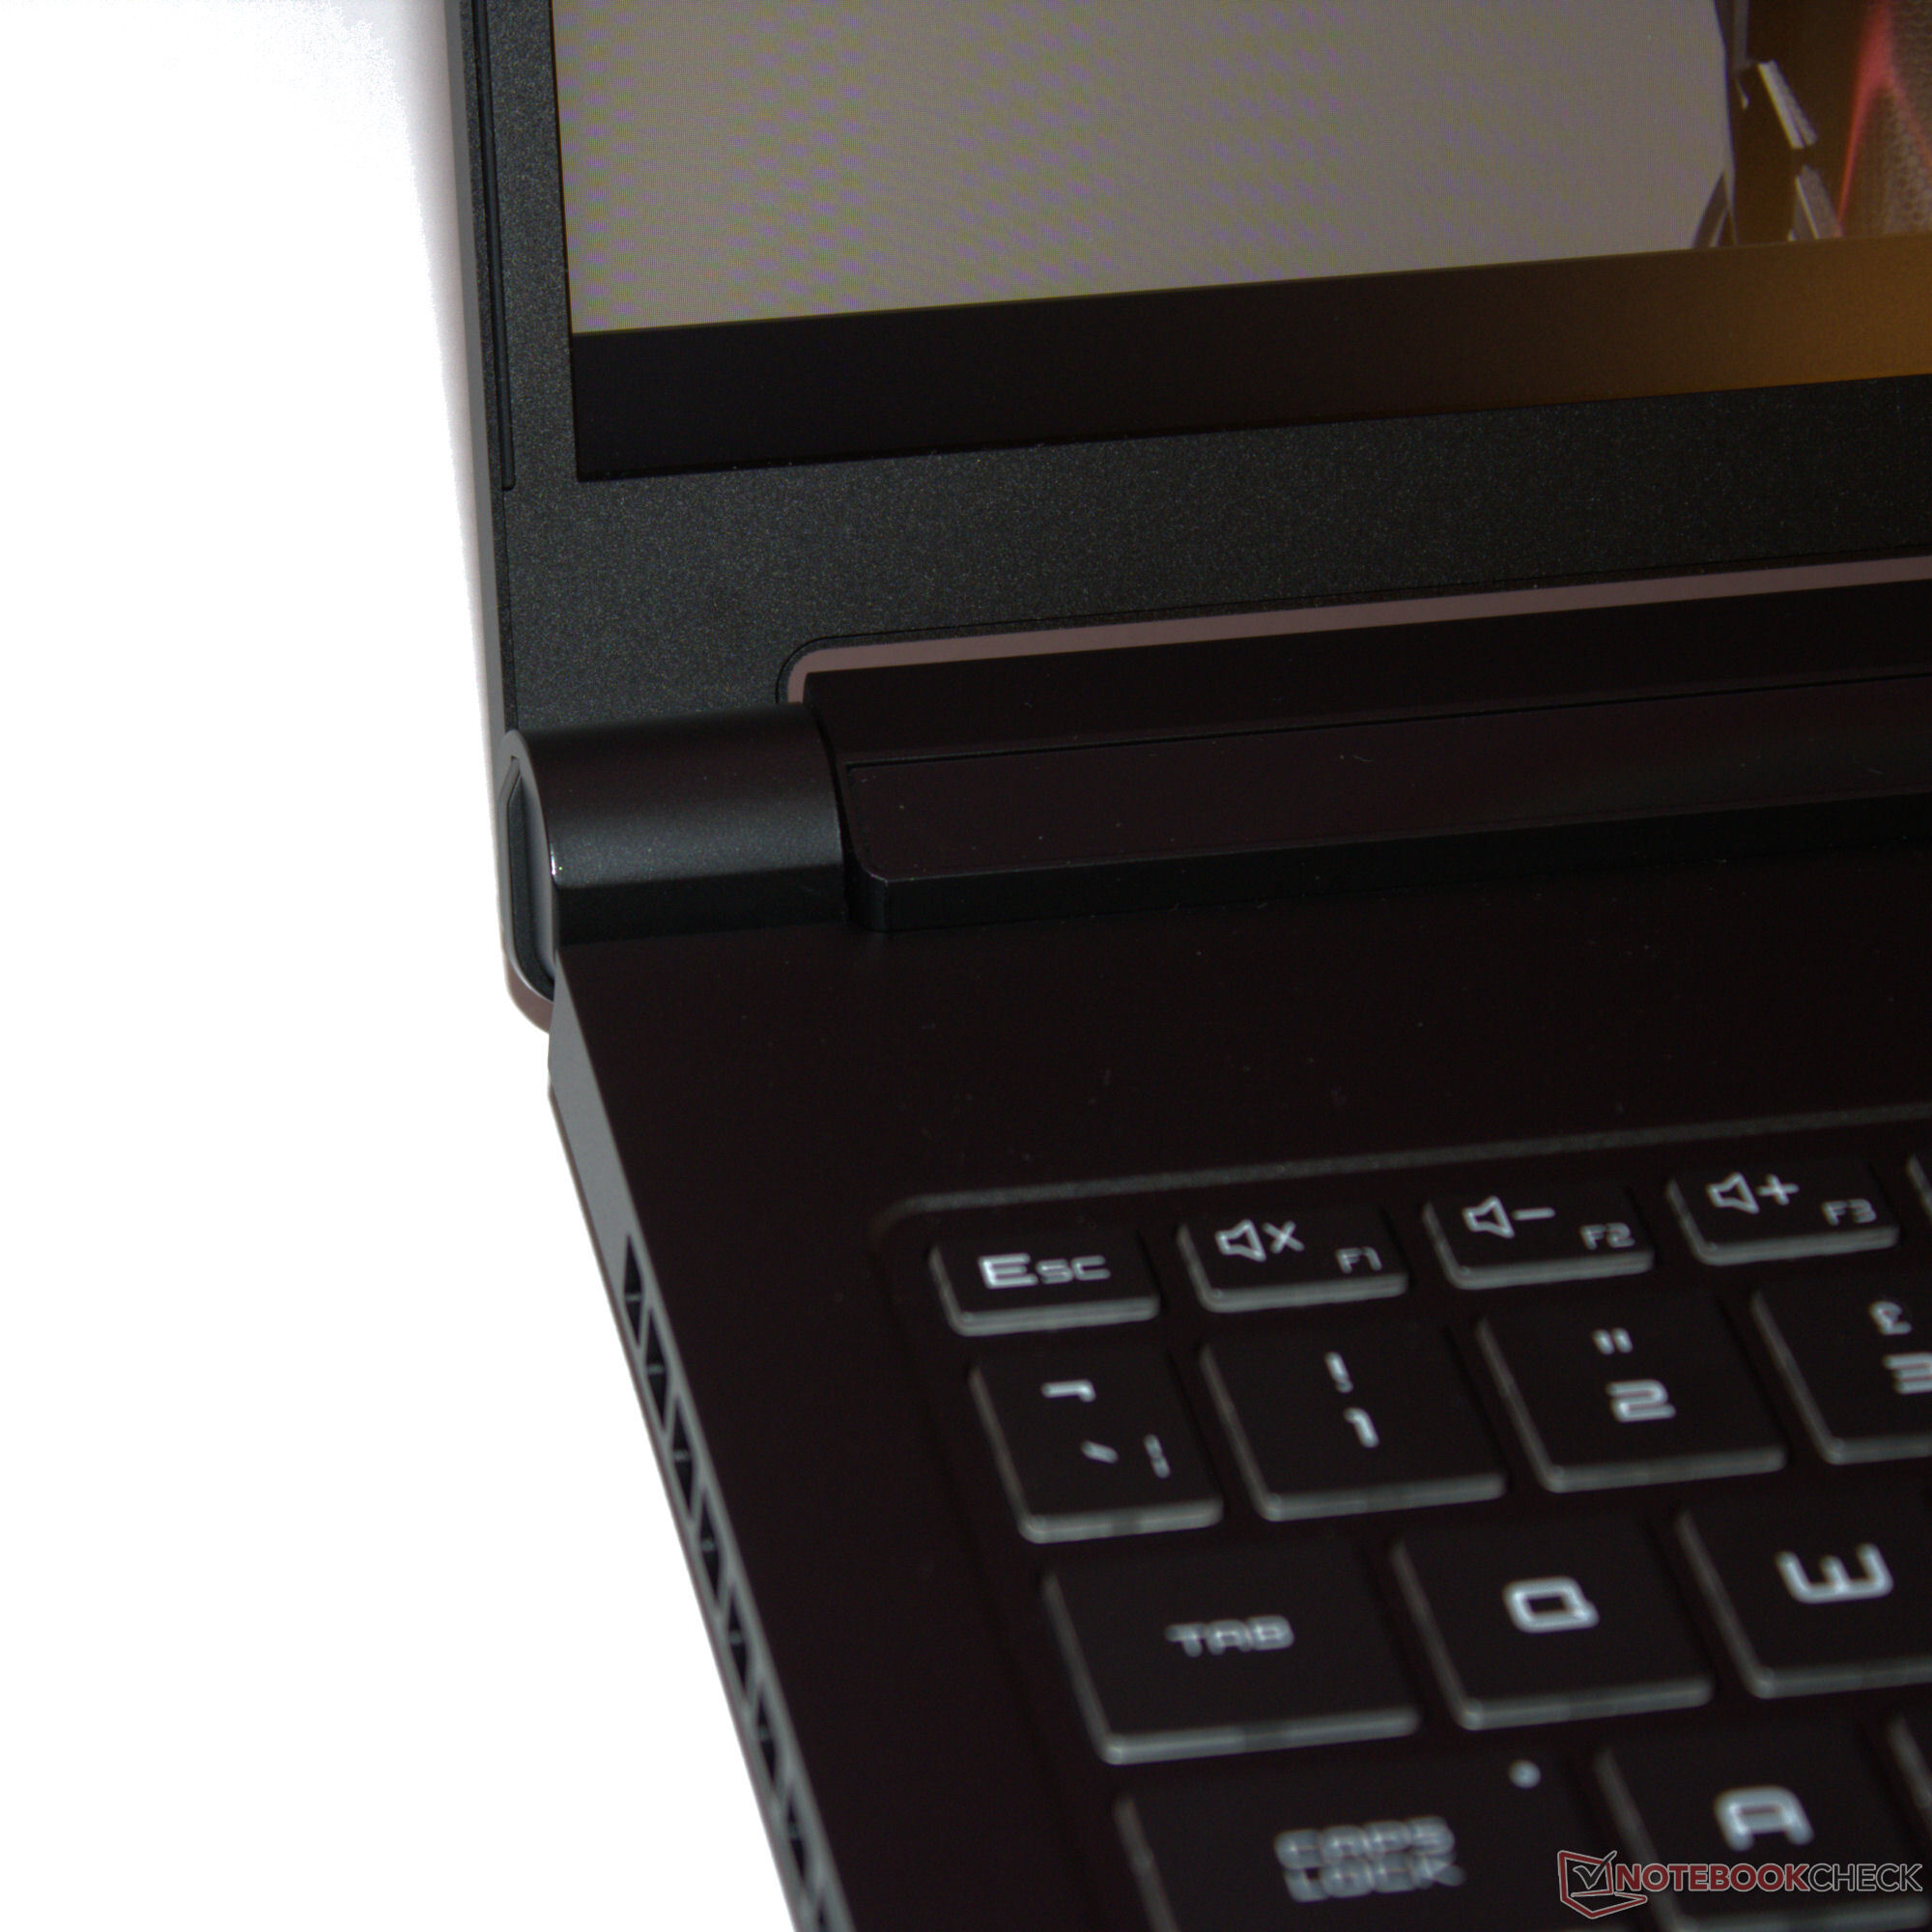
Dovrebbe sempre tenere un panno per la pulizia a portata di mano: Le superfici del case nero opaco sono molto sensibili alla raccolta di impronte digitali. L'unità base e il coperchio del case in alluminio possono essere ruotati solo di poco e non abbiamo riscontrato alcun errore di costruzione. L'applicazione di una pressione sul retro del coperchio non comporta alcun cambiamento di immagine. Le cerniere molto strette mantengono il coperchio saldamente in posizione e oscilla solo in minima parte. L'angolo di apertura massimo è di 130 gradi e si può aprire con una sola mano.
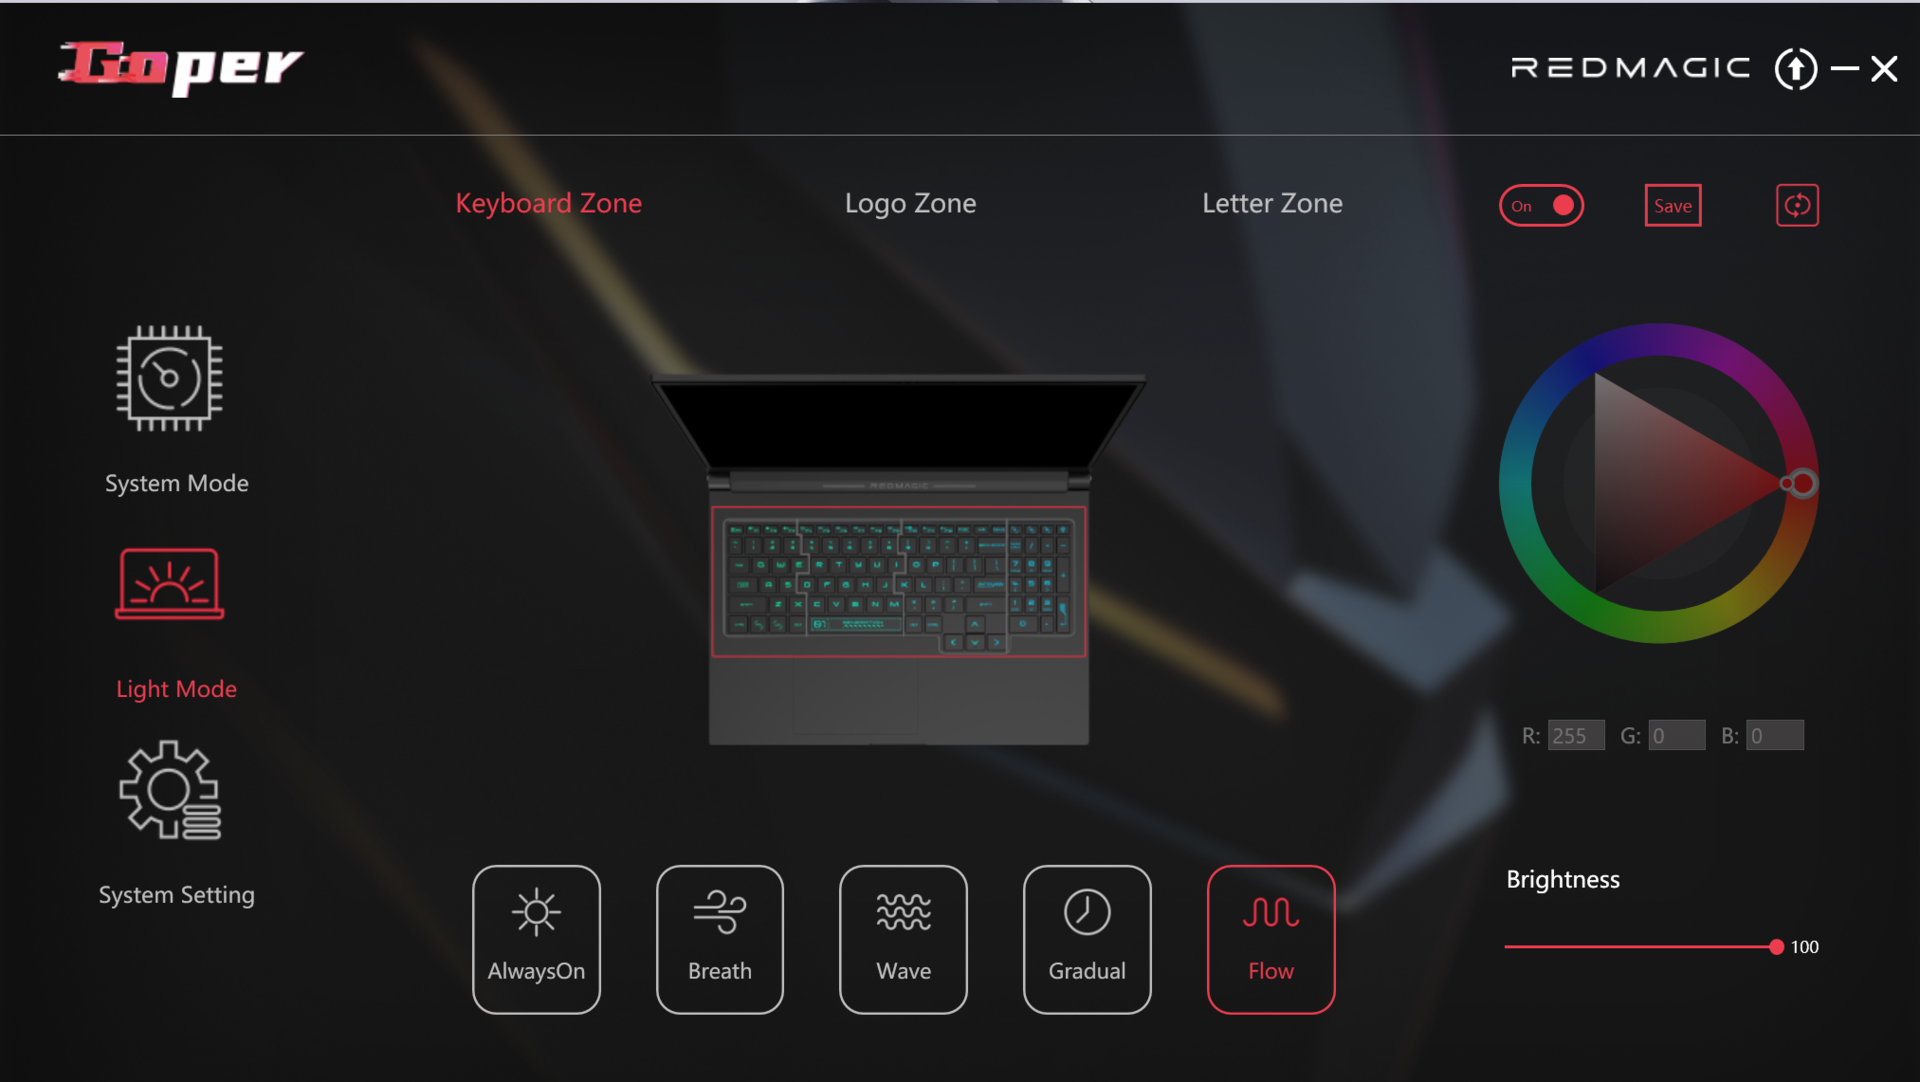
Oltre alla tastiera retroilluminata del portatile, due elementi LED apportano un po' di colore al mix: La scritta RedMagic sul coperchio della cerniera e il logo sul coperchio brillano in tutti i colori dell'arcobaleno. Tutti gli elementi possono essere controllati individualmente. La scritta funge anche da indicatore della batteria: una luce rossa lampeggiante indica un livello di carica basso.
Nel campo del confronto, il Titan si dimostra uno dei dispositivi più compatti e leggeri. Tuttavia, le differenze rispetto alla concorrenza sono piuttosto ridotte.
Connettività - Il Titan è dotato di Thunderbolt 4
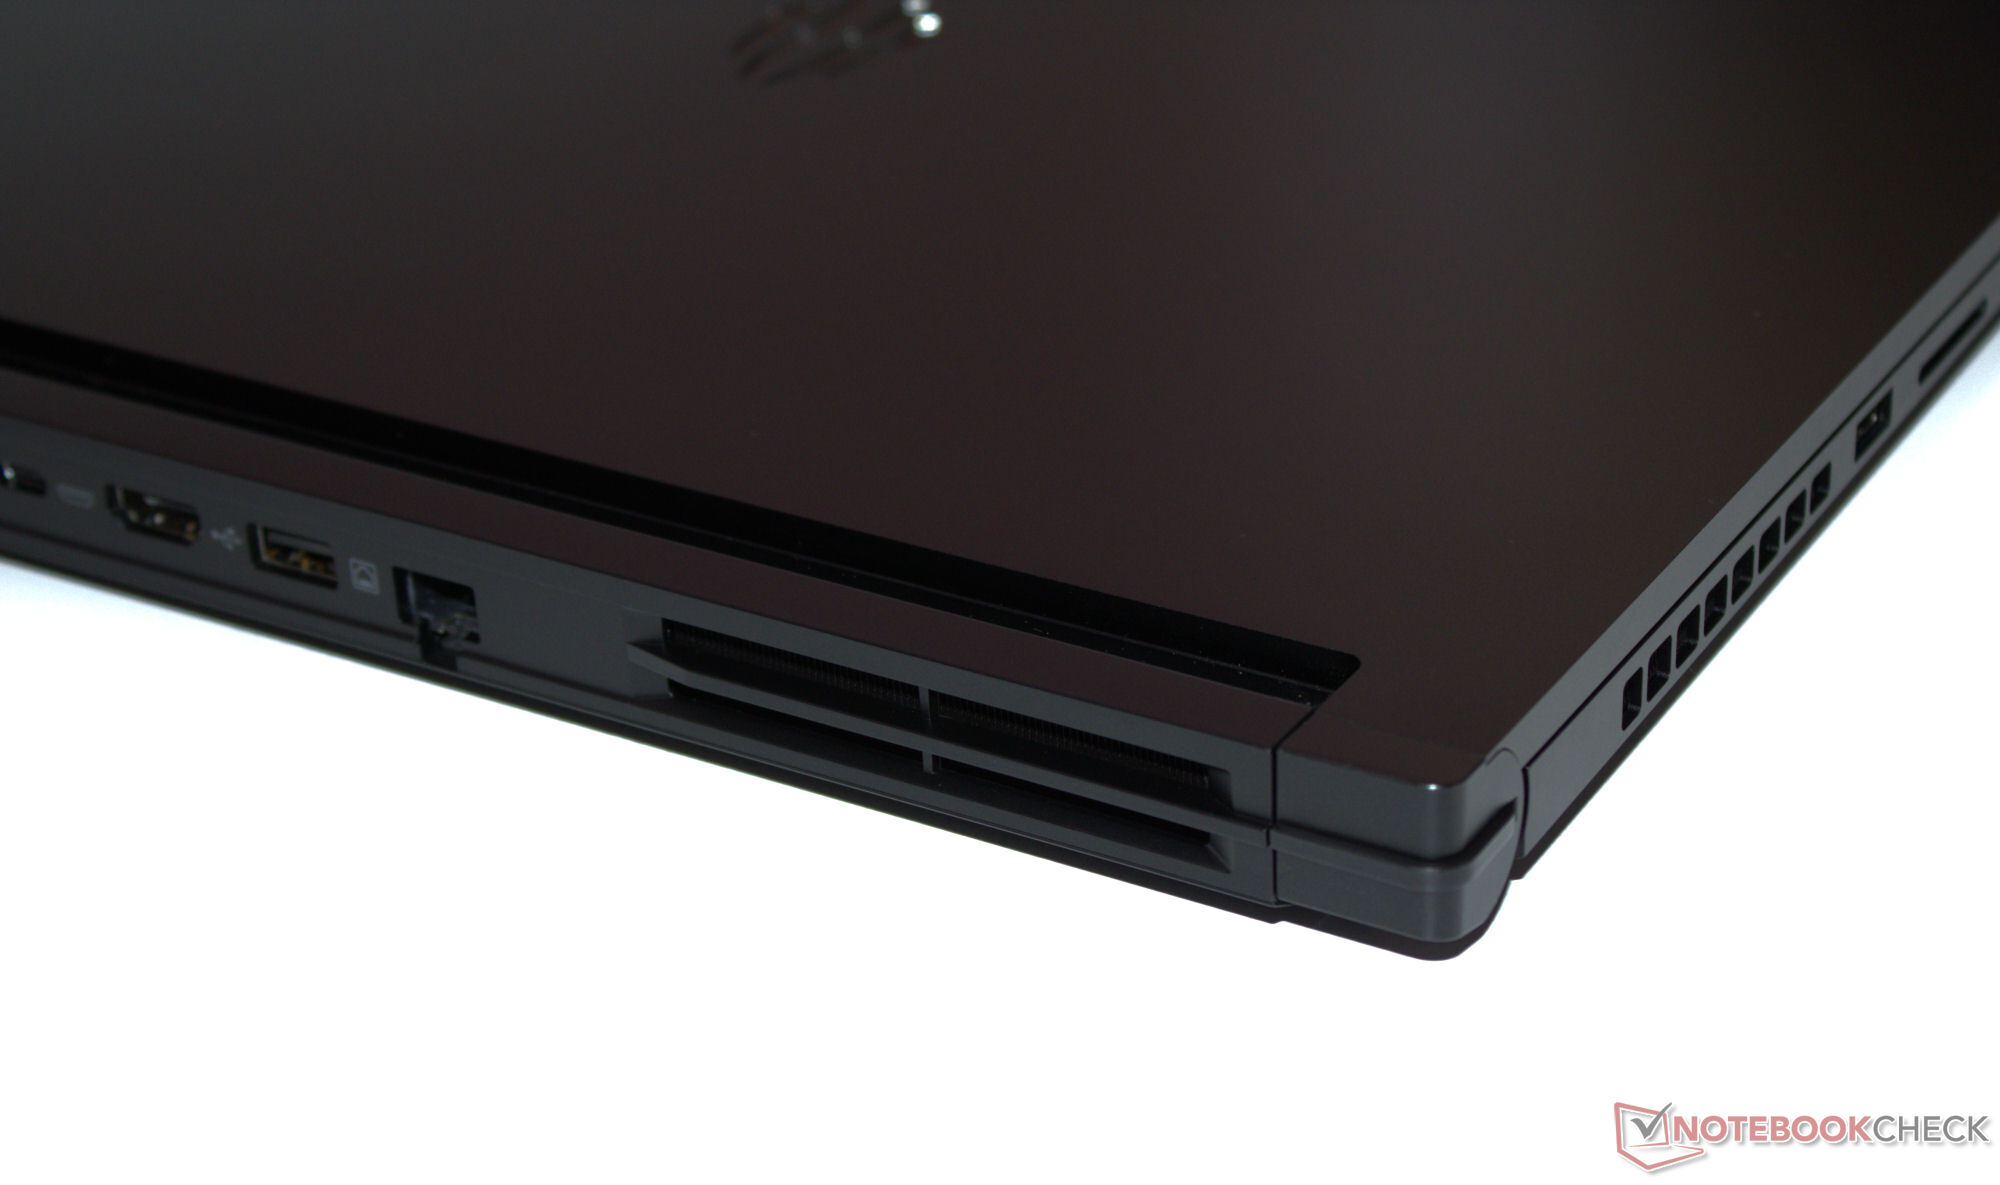
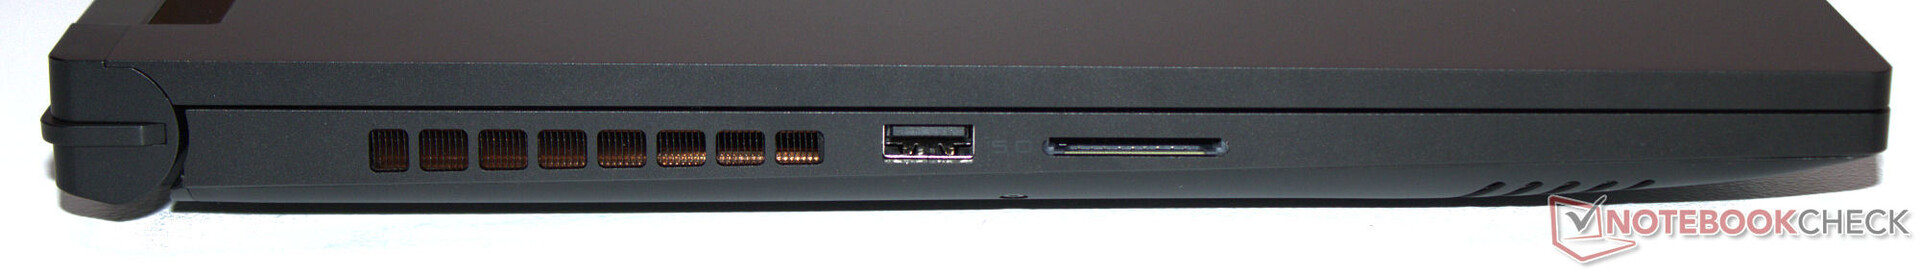
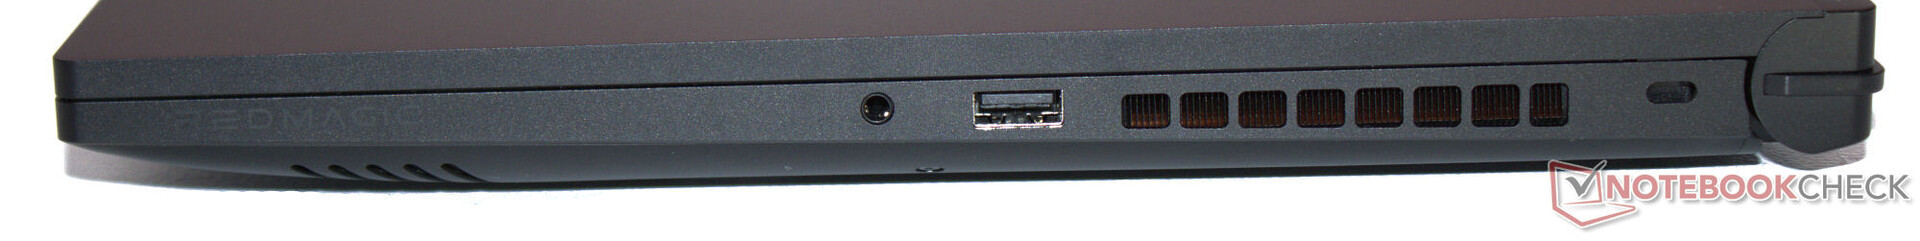
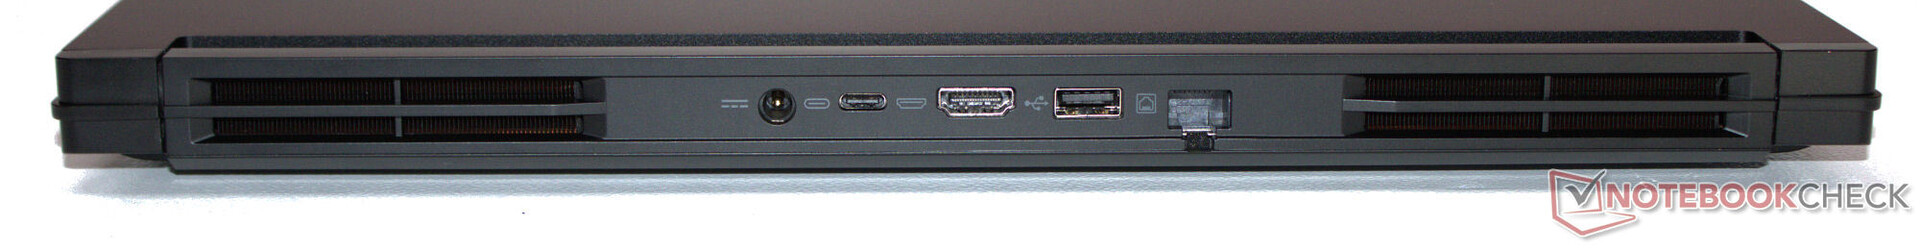
Titan è dotato di tre porte USB-A (2x USB 3.2 Gen 2, 1x USB 3.2 Gen 1) e di una porta USB-C (Thunderbolt 4). Quest'ultima supporta la modalità Power Delivery e DP Alt. Dispone di un totale di due uscite video (1x HDMI, 1x DP). Un jack audio e una porta Ethernet (1 GBit/s) completano il pacchetto totale.
Le uscite video, la presa di rete e la connessione di alimentazione sono tutte situate sul retro del dispositivo, quindi i cavi corrispondenti non dovrebbero essere d'intralcio durante l'uso. Un aspetto positivo è la presenza di una porta USB-A sul lato destro e sinistro del portatile.
Lettore di schede SD
Il lettore di schede SD (scheda di riferimento: AV PRO microSD 128 GB V60) non è uno dei più veloci nel suo genere, ma offre solide velocità di trasferimento dati nella fascia medio-veloce. Confrontandolo con i valori del Blade 16 (2024) dimostra che potrebbero essere possibili velocità di trasferimento significativamente più elevate.
| SD Card Reader | |
| average JPG Copy Test (av. of 3 runs) | |
| Razer Blade 16 2024, RTX 4090 | |
| Media della classe Gaming (19 - 197.3, n=68, ultimi 2 anni) | |
| SCHENKER XMG Pro 16 Studio (Mid 24) (AV PRO microSD 128 GB V60) | |
| Nubia RedMagic Titan 16 Pro (AV PRO microSD 128 GB V60) | |
| Acer Predator Helios Neo 16 (2024) (AV PRO microSD 128 GB V60) | |
| maximum AS SSD Seq Read Test (1GB) | |
| Razer Blade 16 2024, RTX 4090 | |
| Media della classe Gaming (25.8 - 263, n=67, ultimi 2 anni) | |
| SCHENKER XMG Pro 16 Studio (Mid 24) (AV PRO microSD 128 GB V60) | |
| Nubia RedMagic Titan 16 Pro (AV PRO microSD 128 GB V60) | |
| Acer Predator Helios Neo 16 (2024) (AV PRO microSD 128 GB V60) | |
Comunicazione
Non ci sono sorprese per quanto riguarda le opzioni di rete: Le connessioni cablate sono gestite da un affermato controller Gigabit Ethernet (RTL8168/8111, 1 GBit/s) di Realtek. Il chip WiFi 6E di Intel (AX211) offre una velocità di trasmissione dati da buona a molto buona in condizioni ottimali (assenza di dispositivi WiFi nelle vicinanze, breve distanza tra il portatile e il server).
Webcam
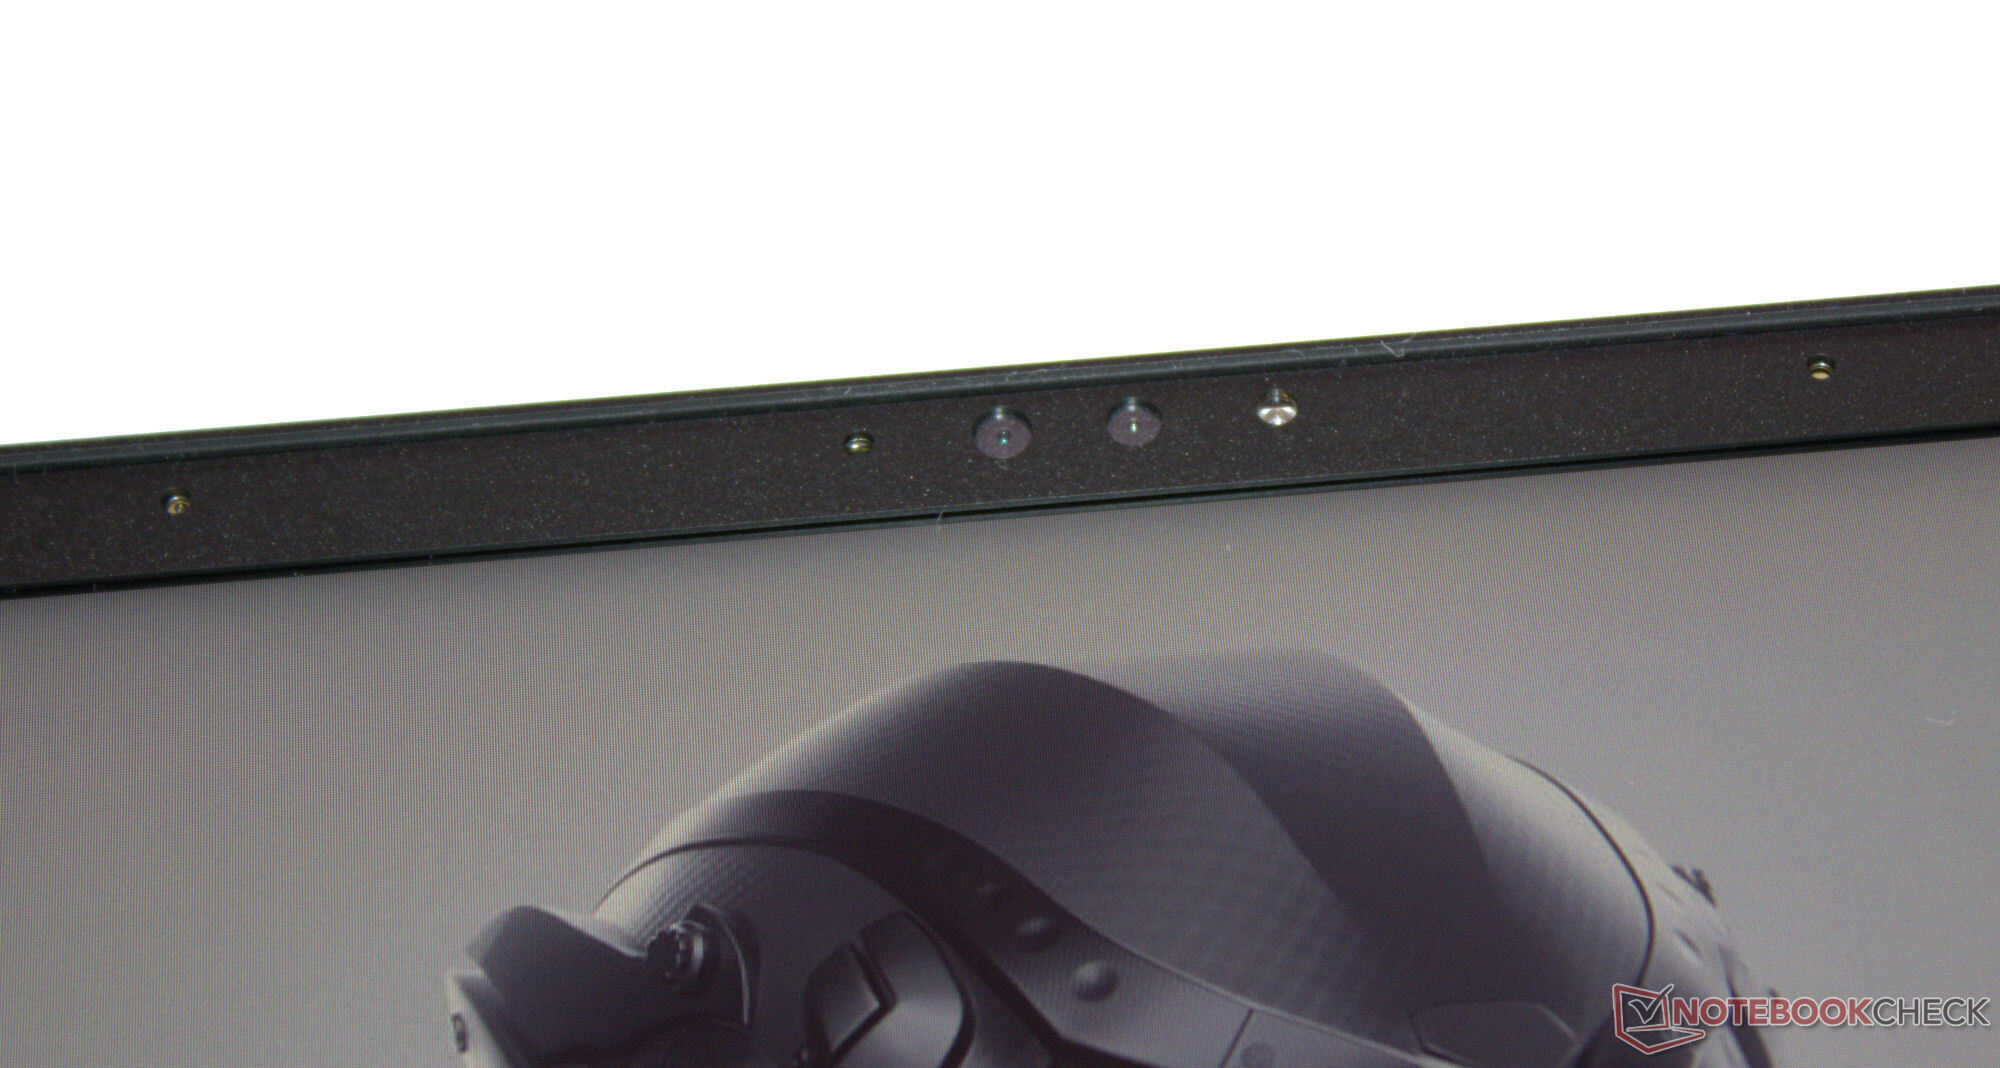
La webcam (2,1 MP) è di tipo standard, con supporto per Windows Hello. La fotocamera non ha una copertura meccanica o un interruttore fisico on/off.


Accessori
A parte i soliti documenti (guida rapida e informazioni sulla garanzia), non sono inclusi altri accessori con il portatile.
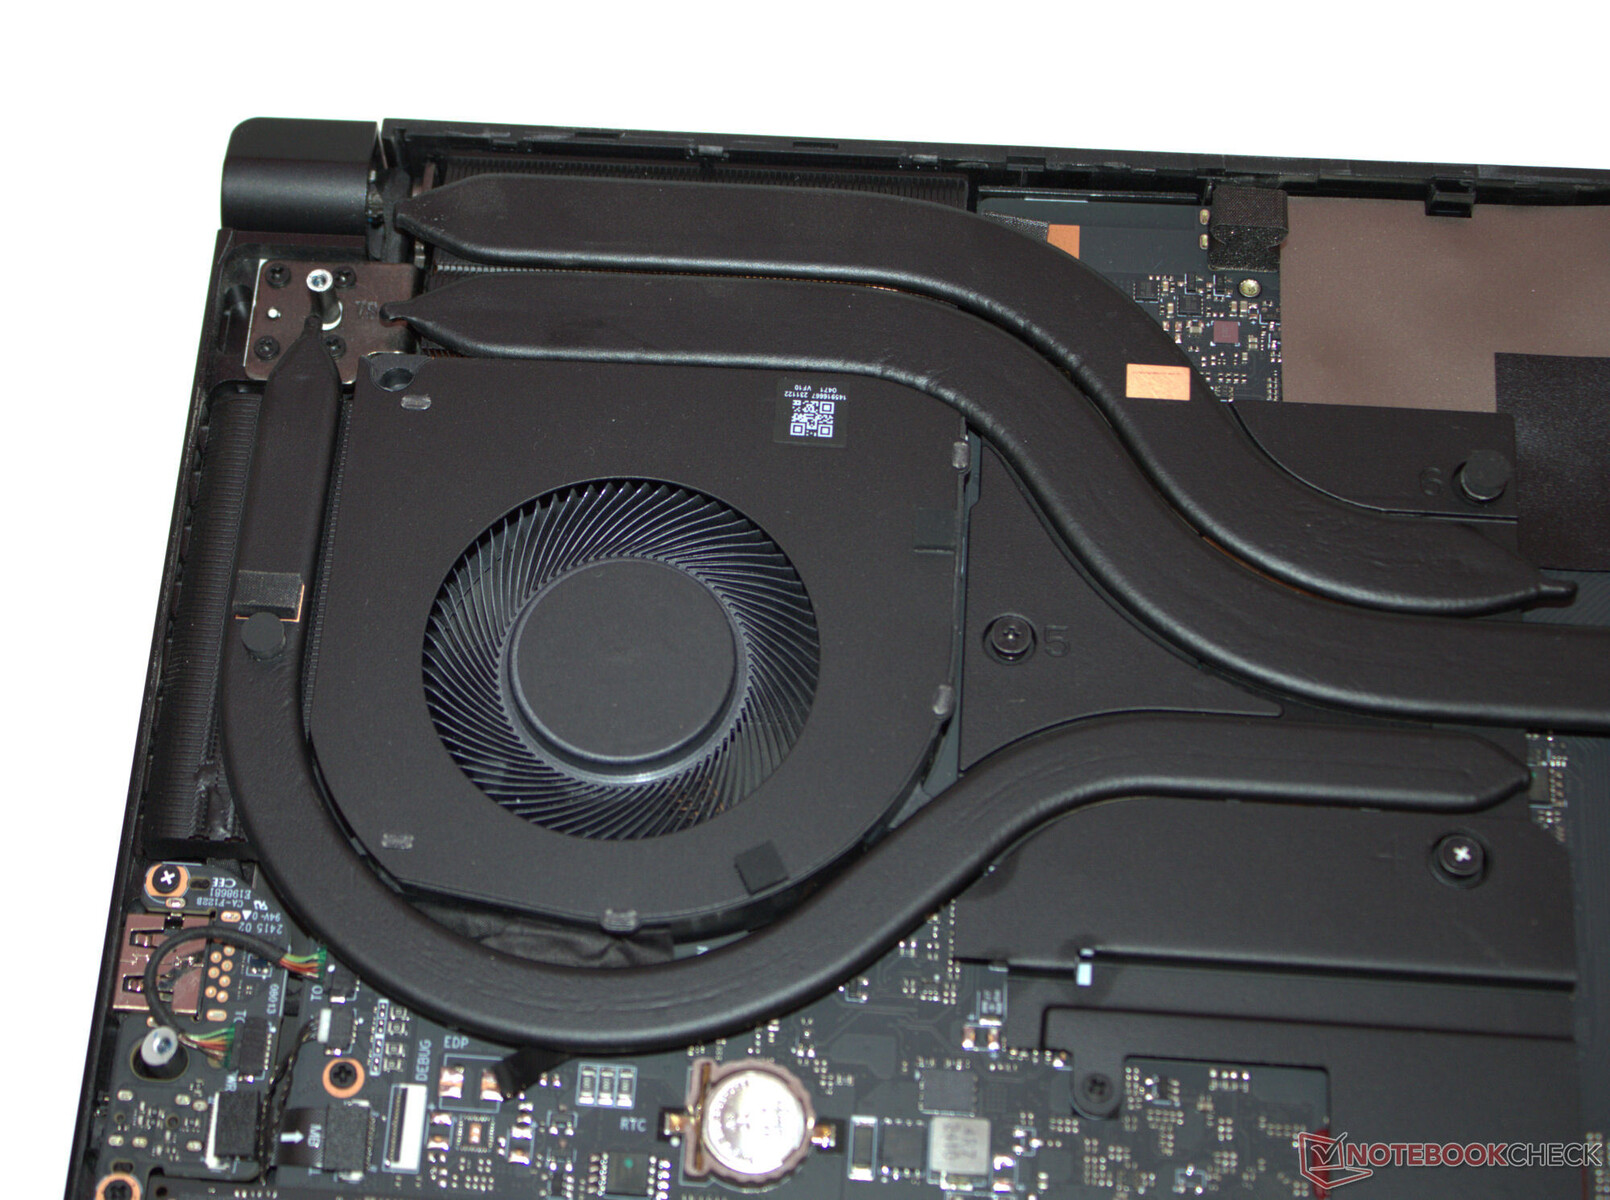
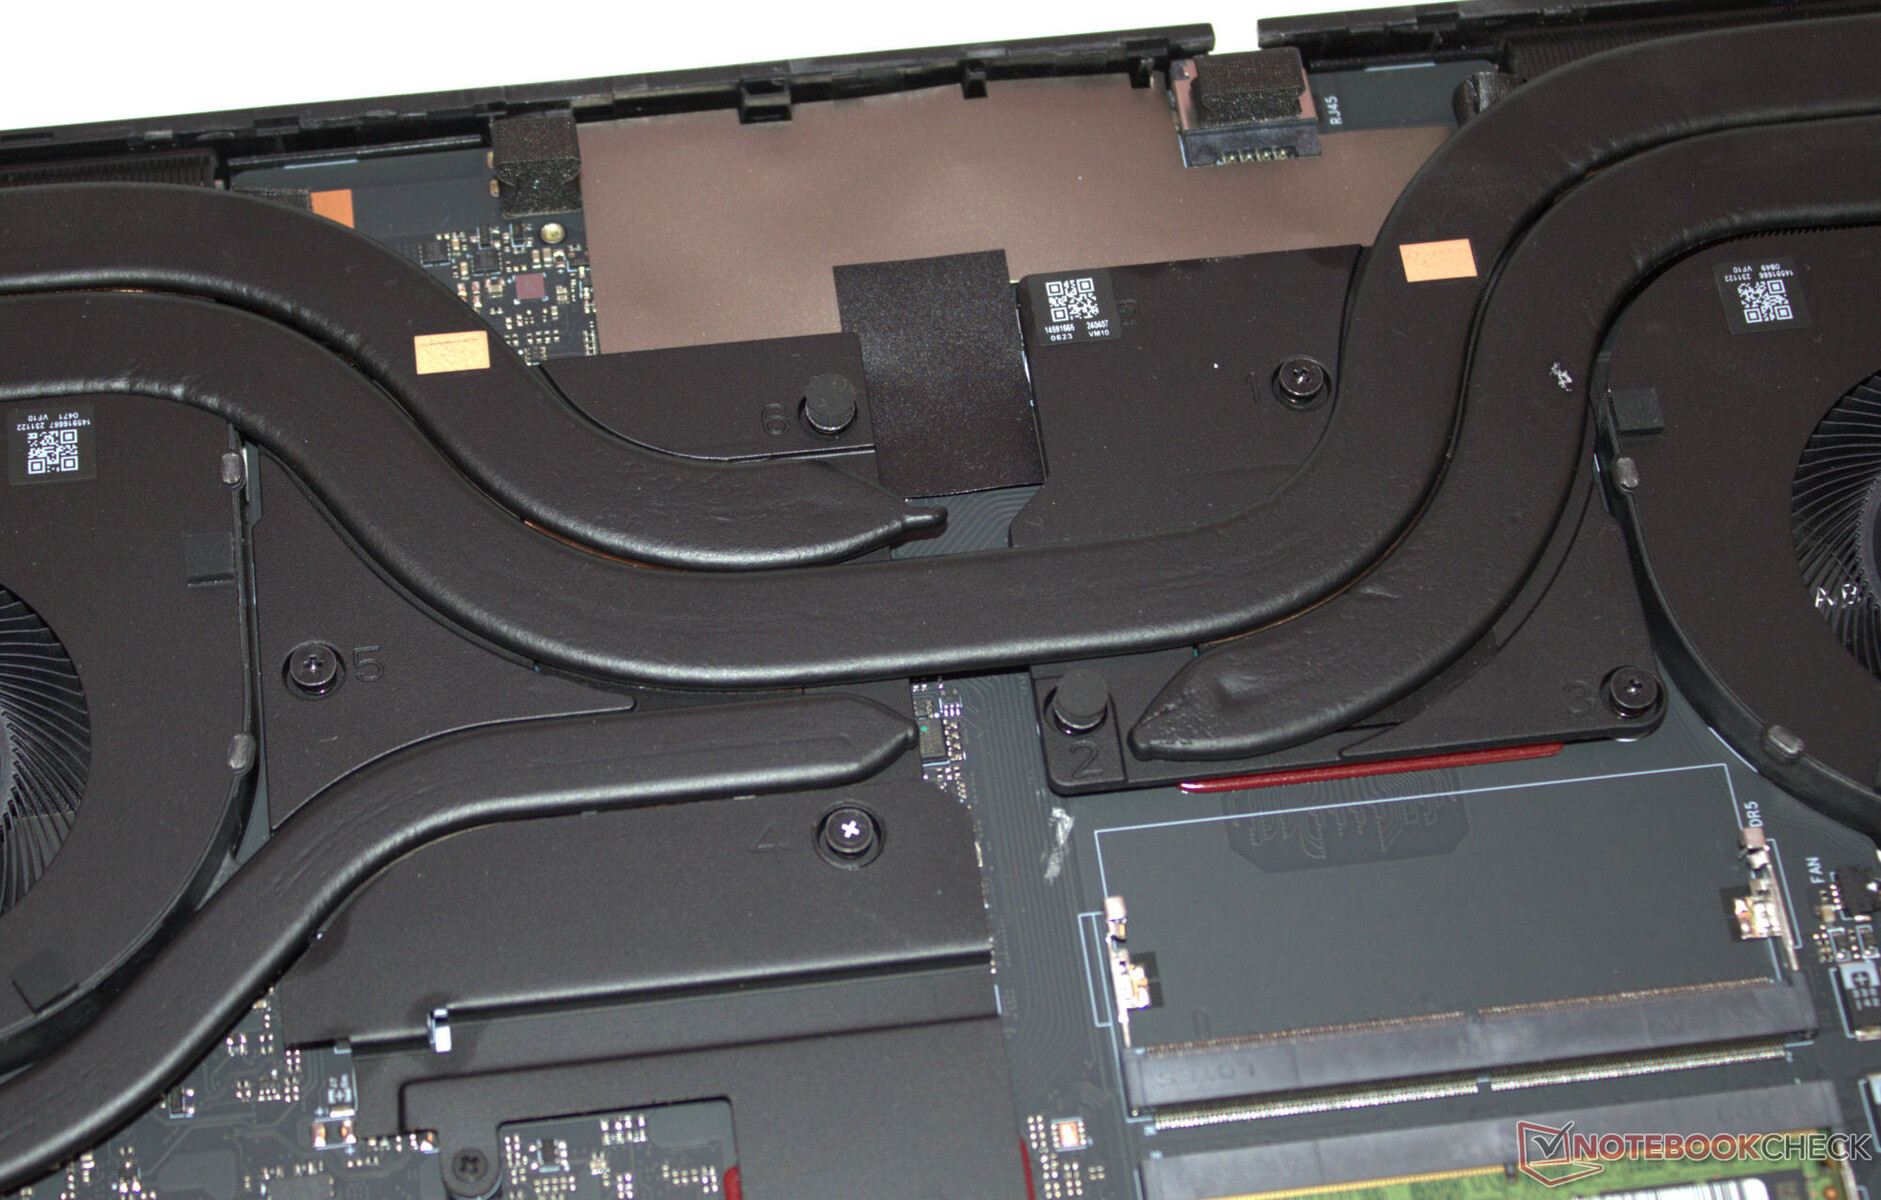
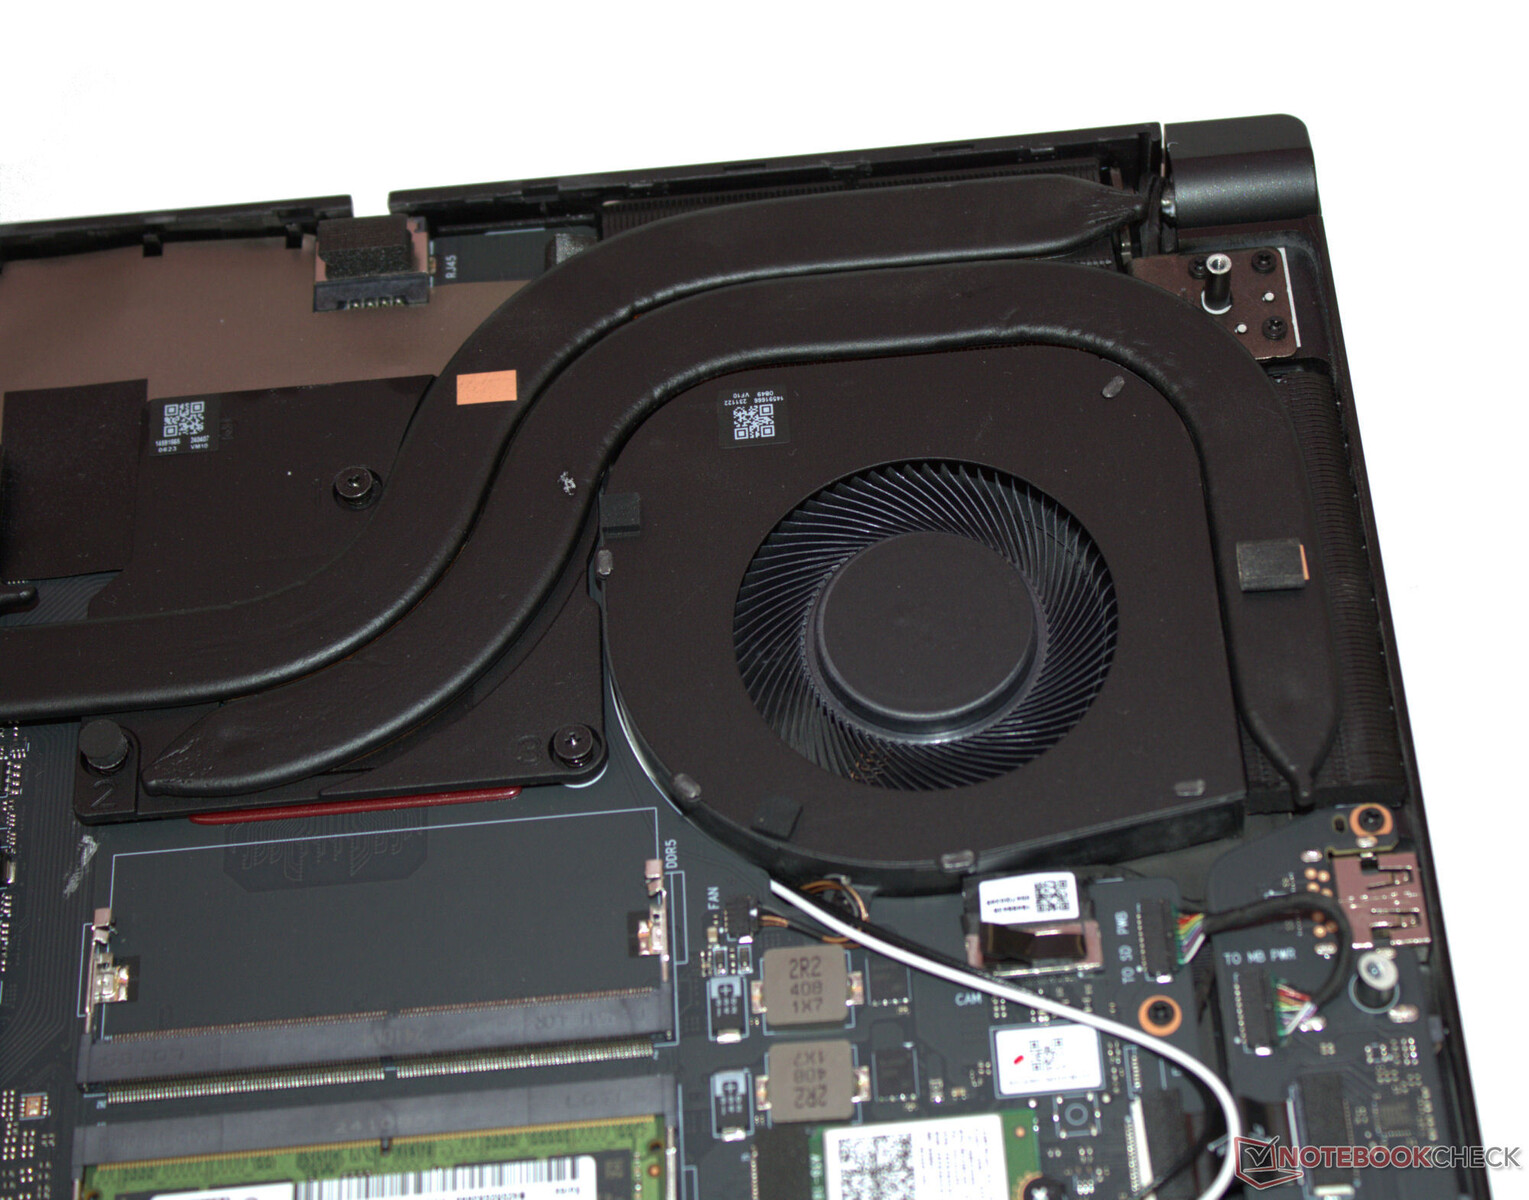
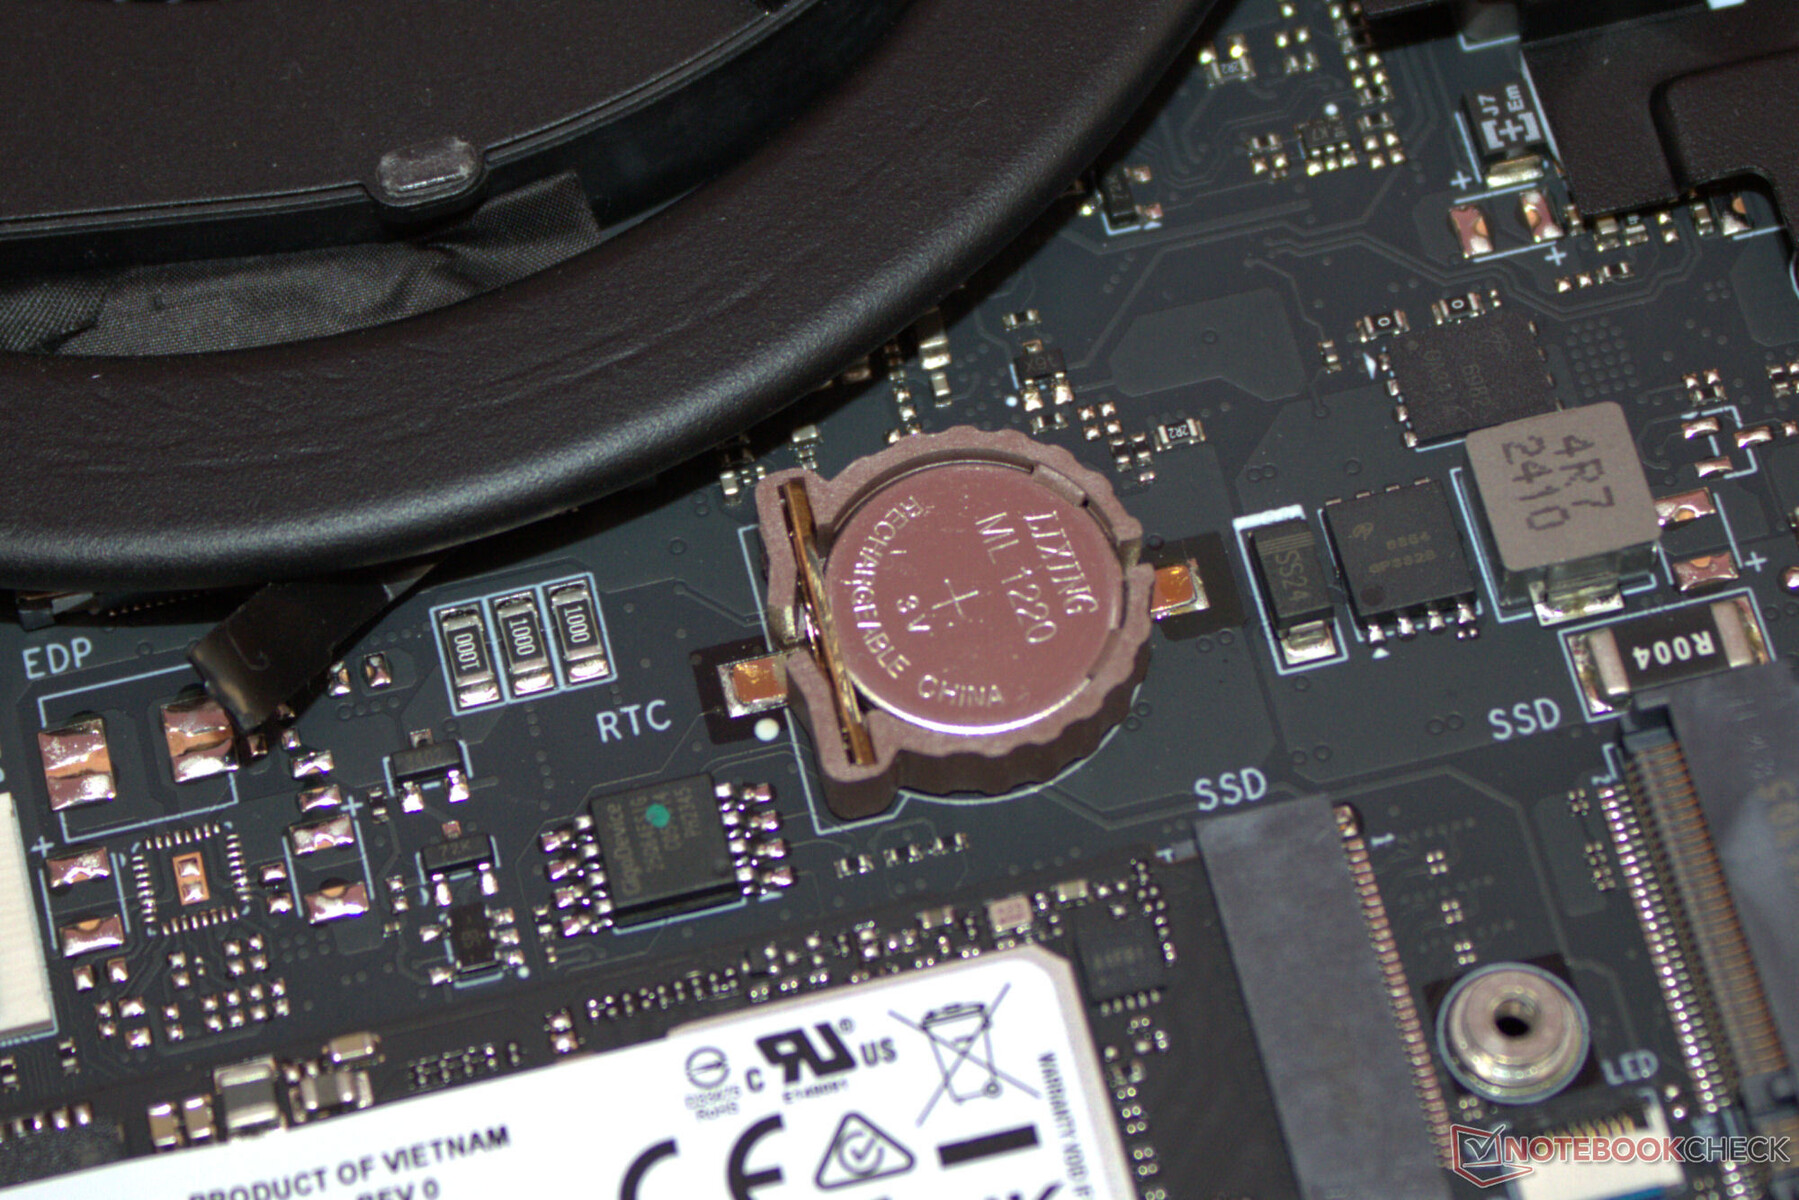
Manutenzione
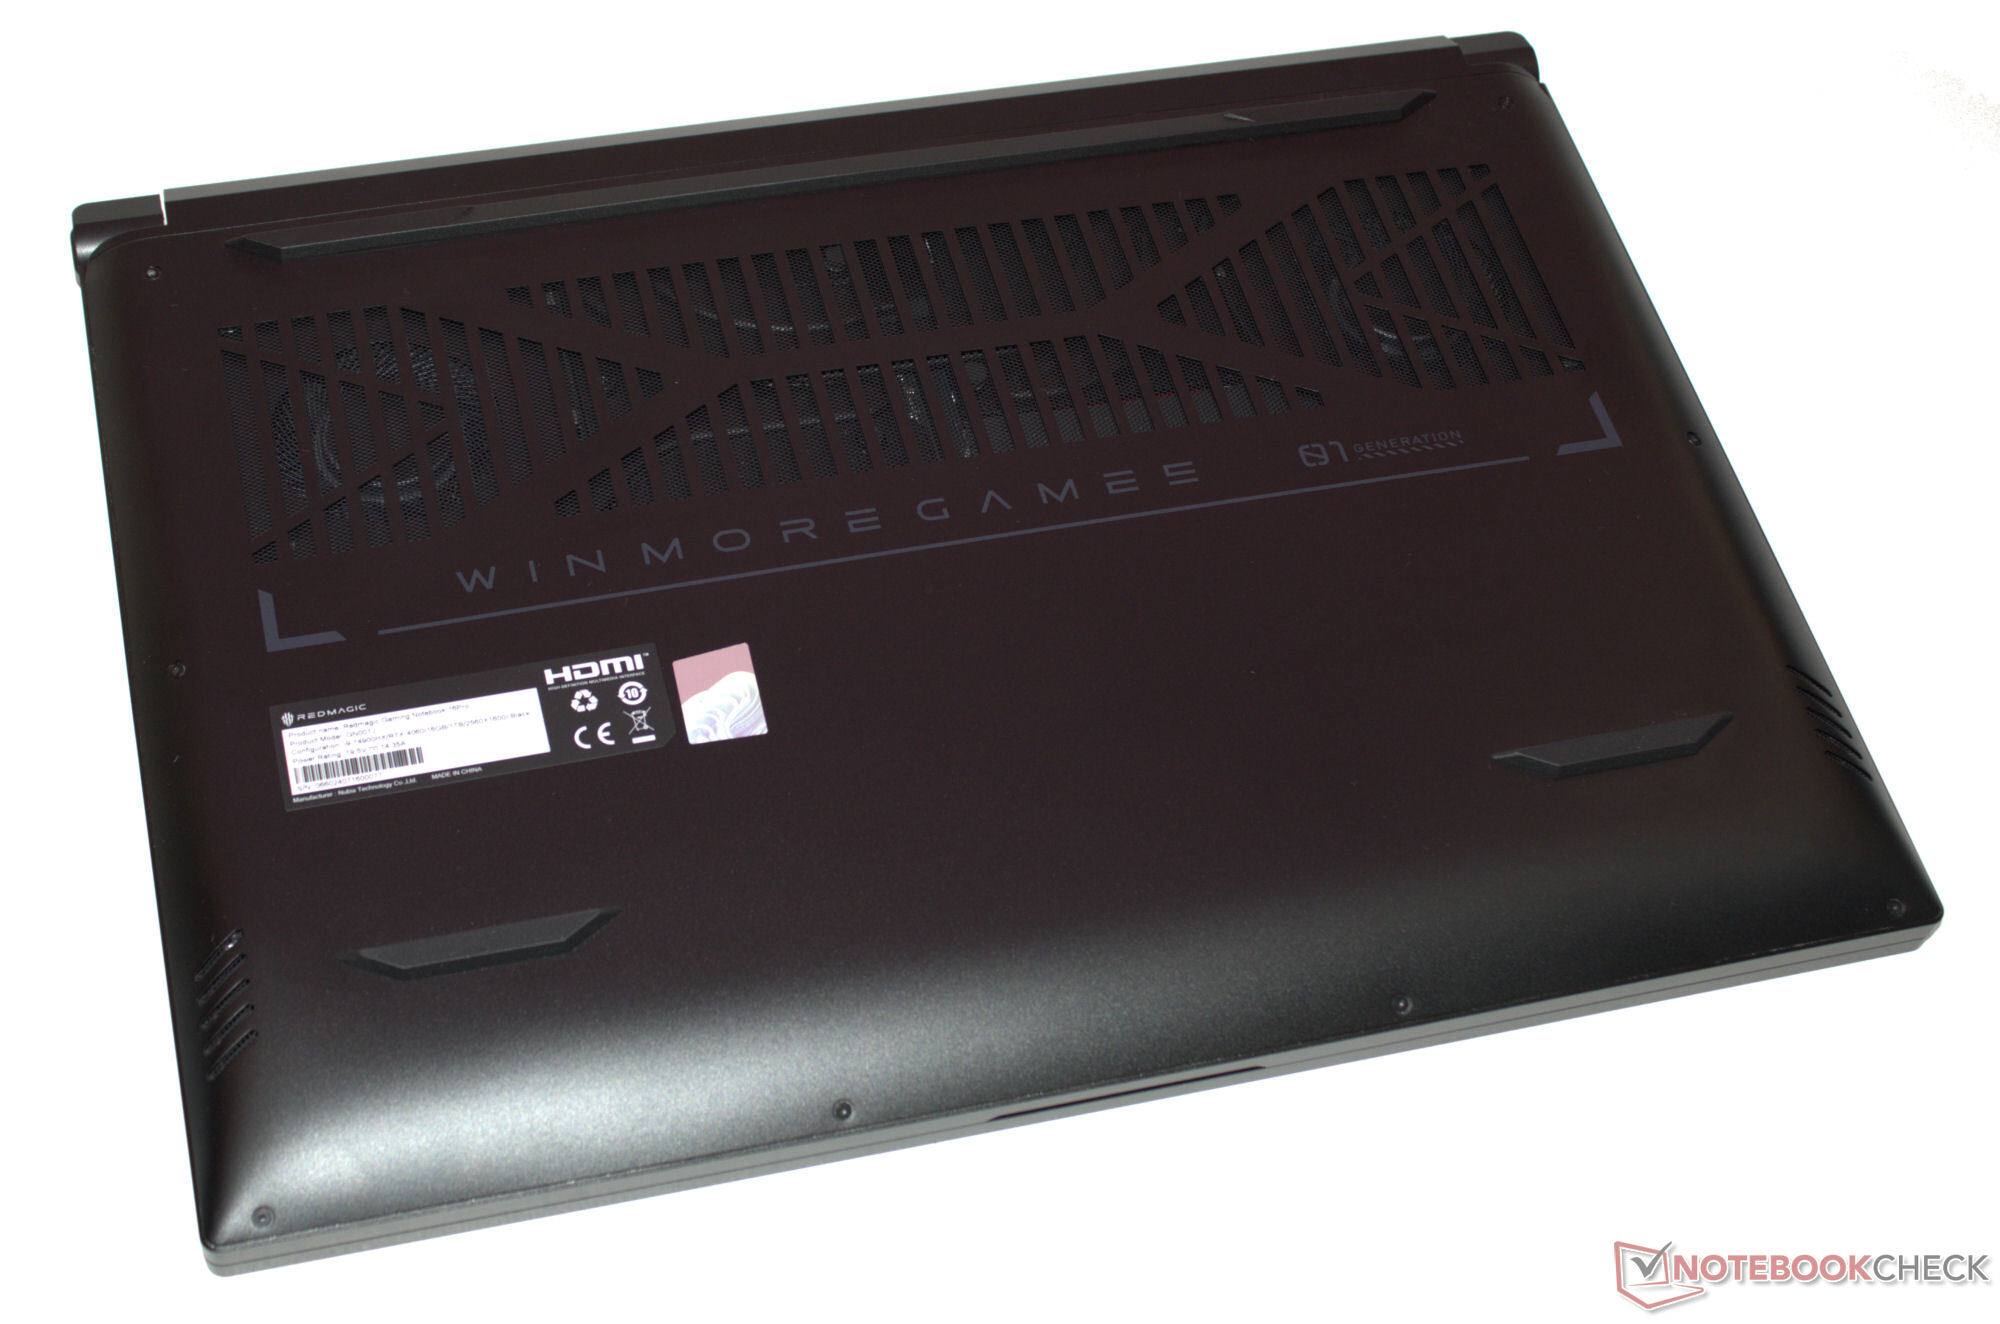
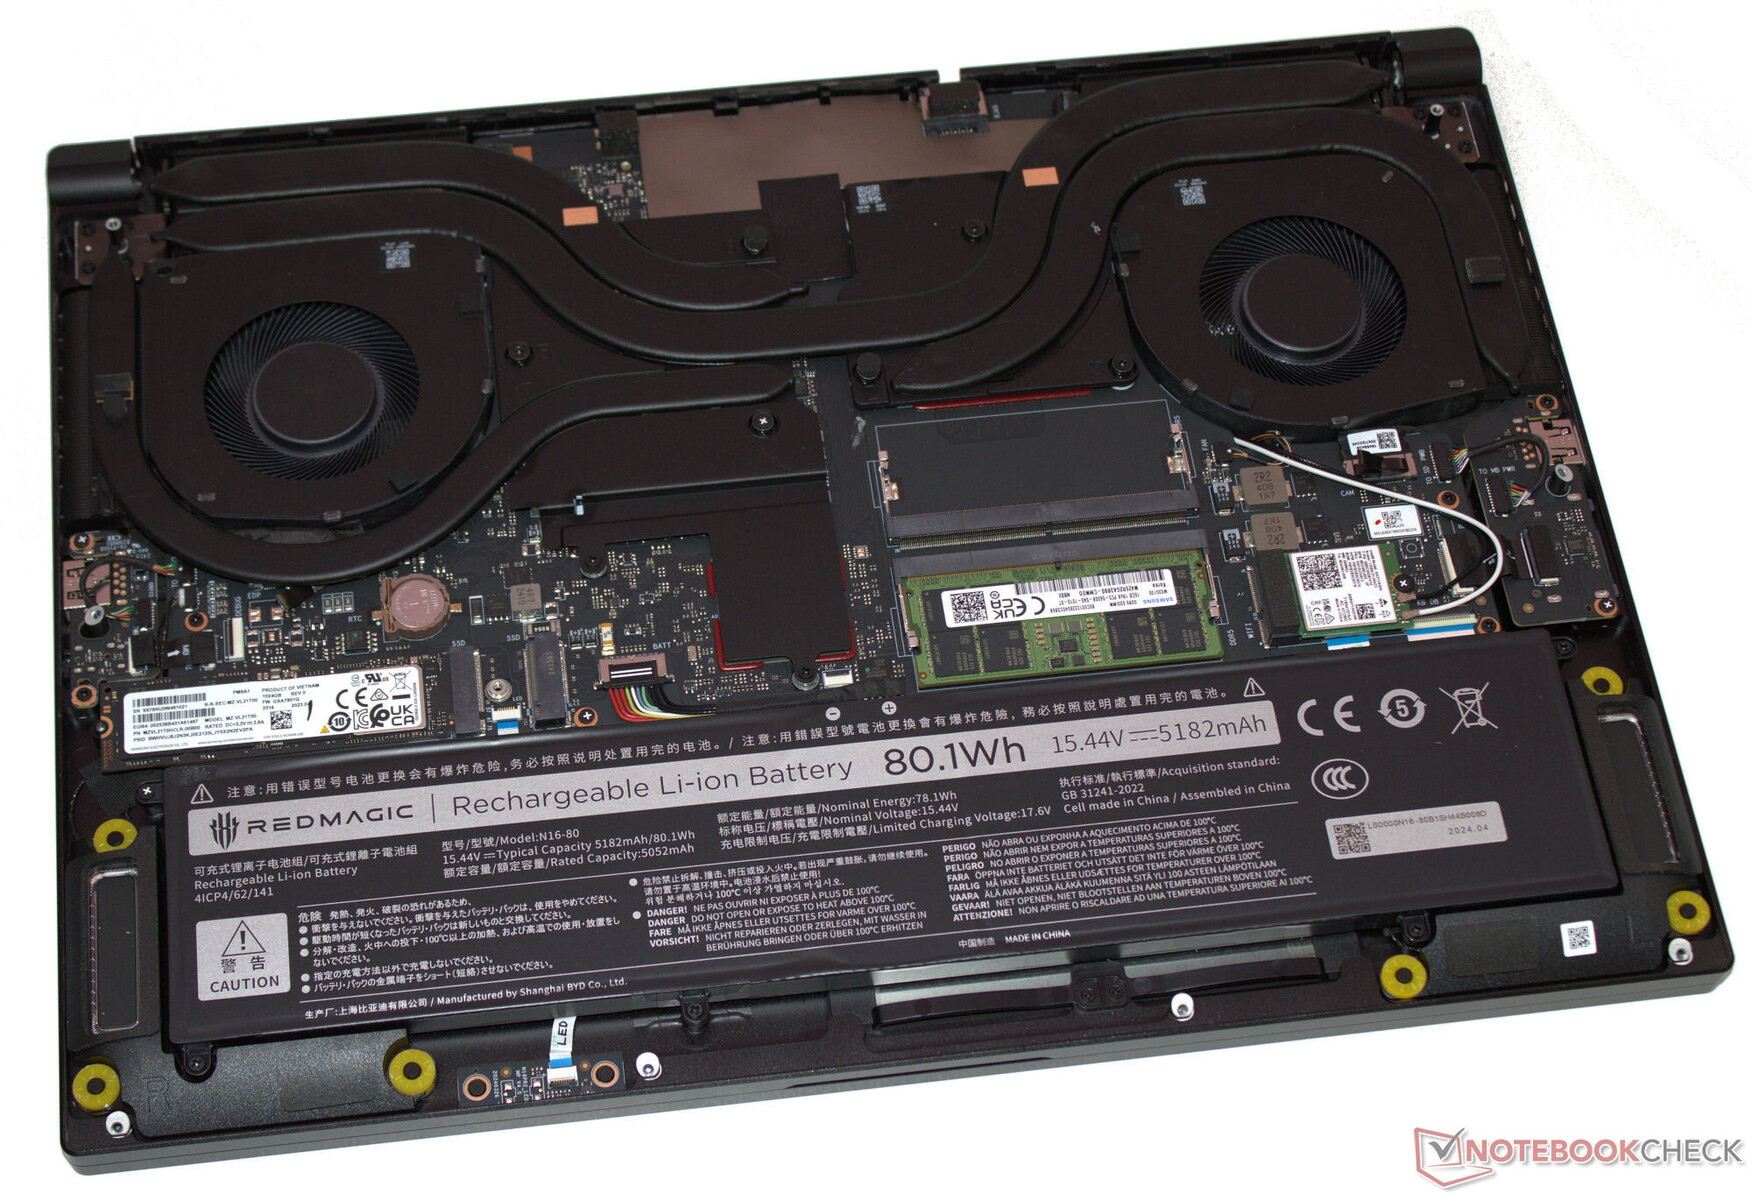
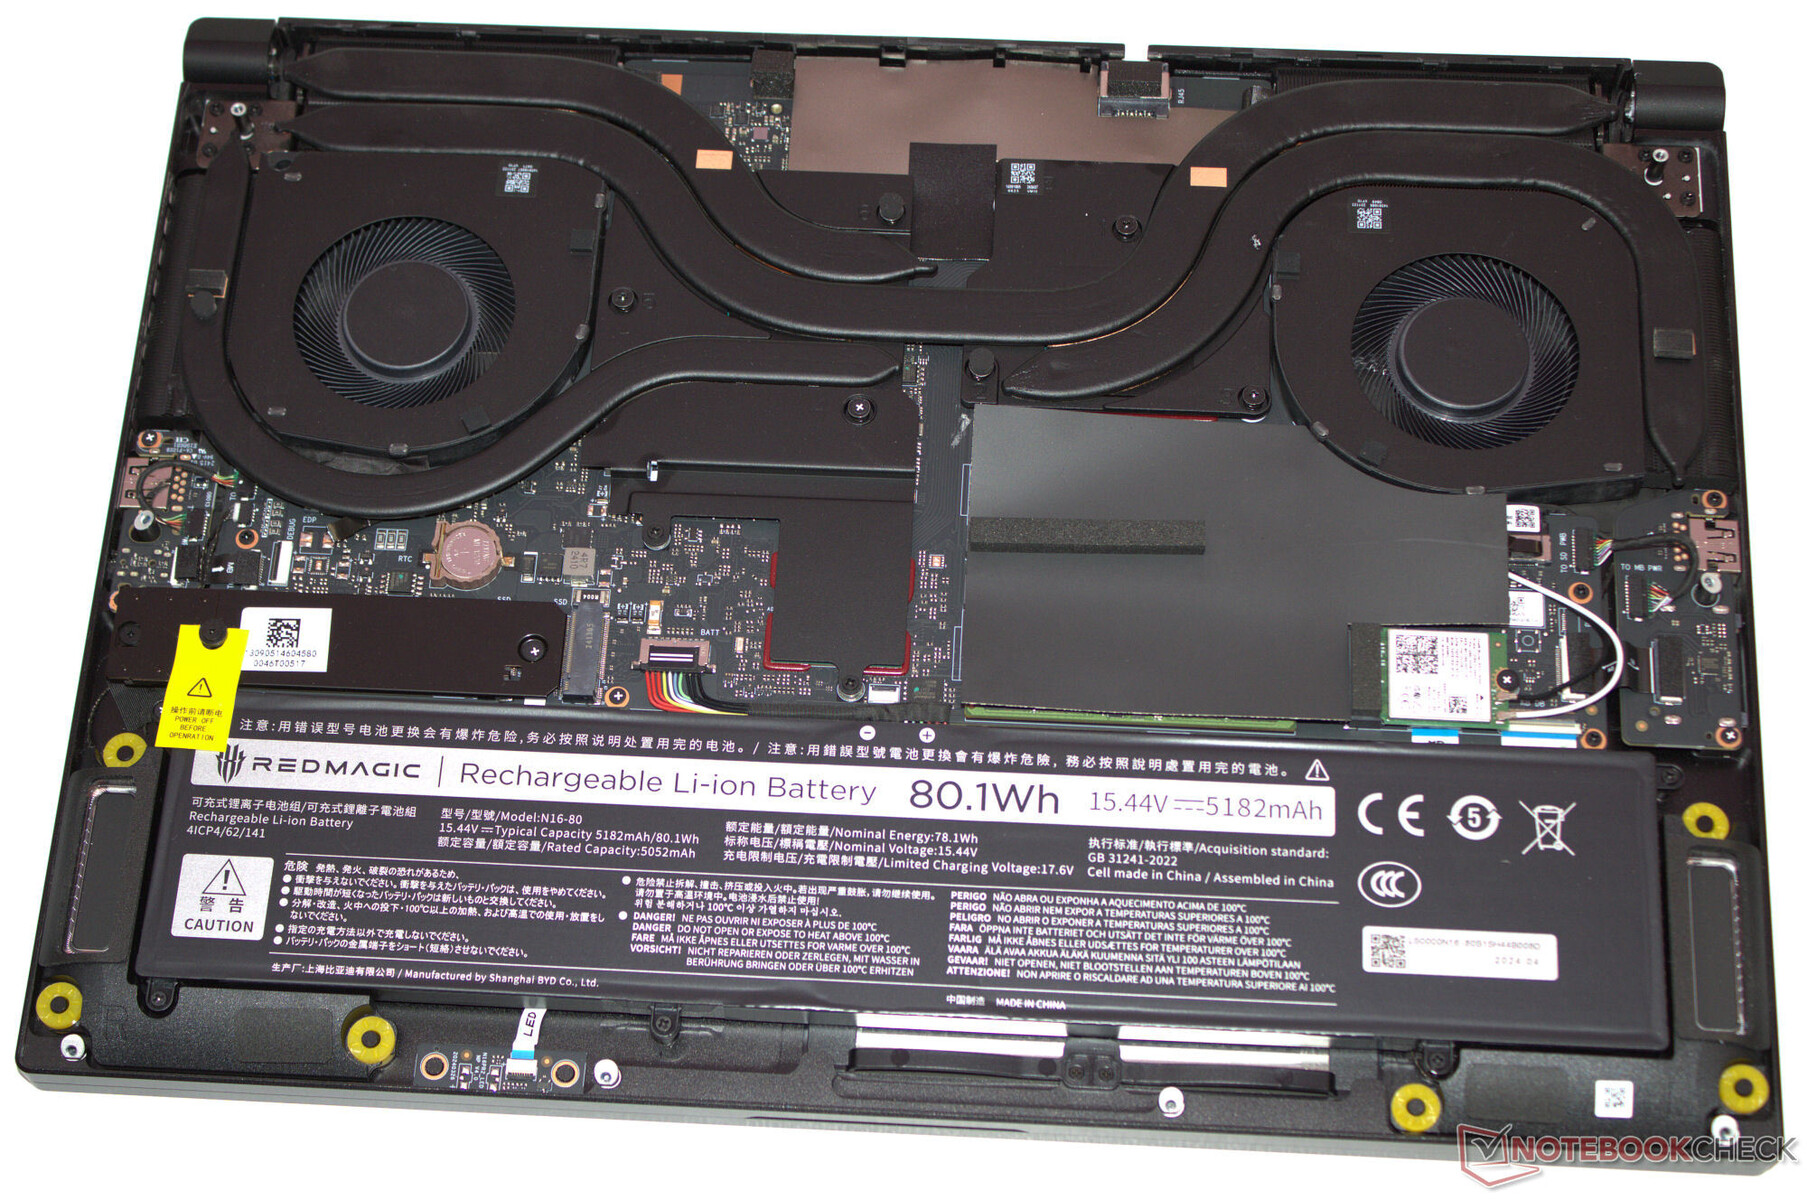
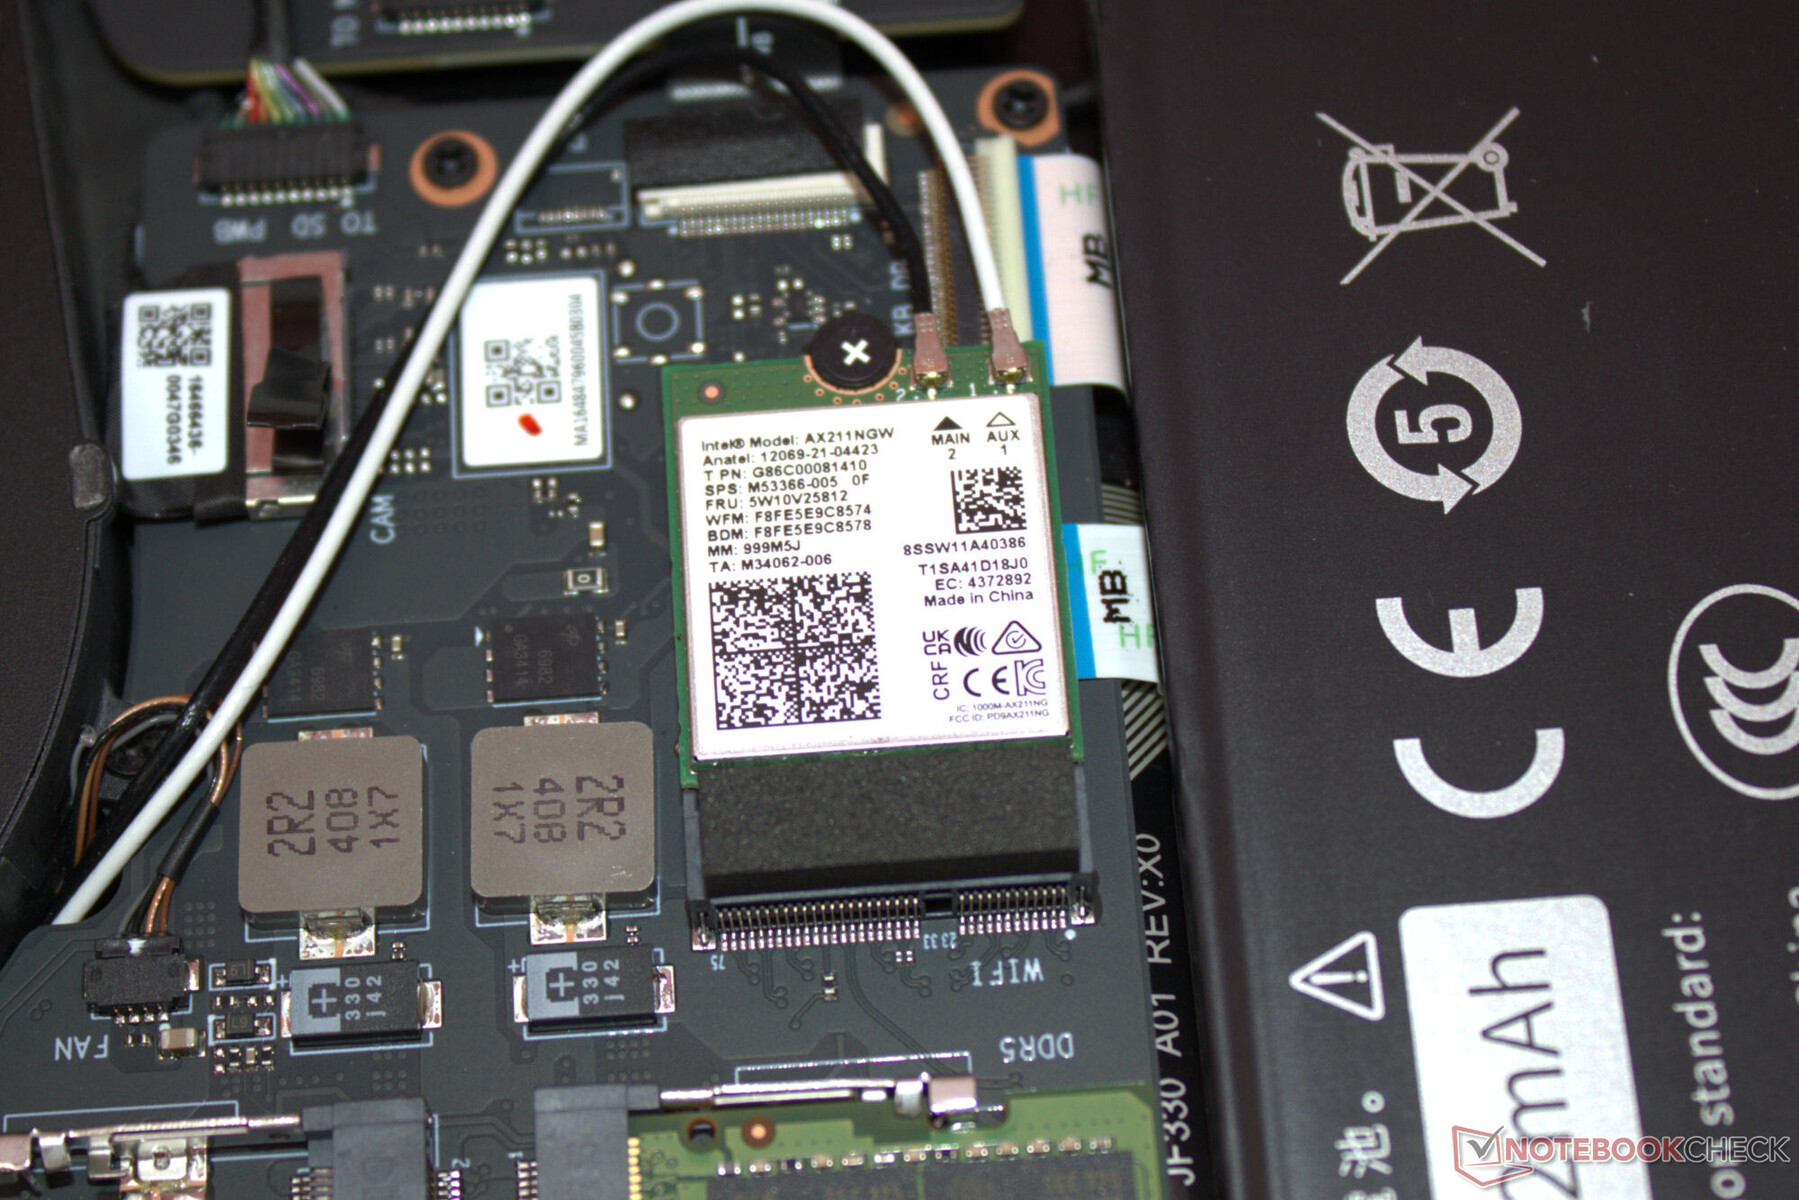
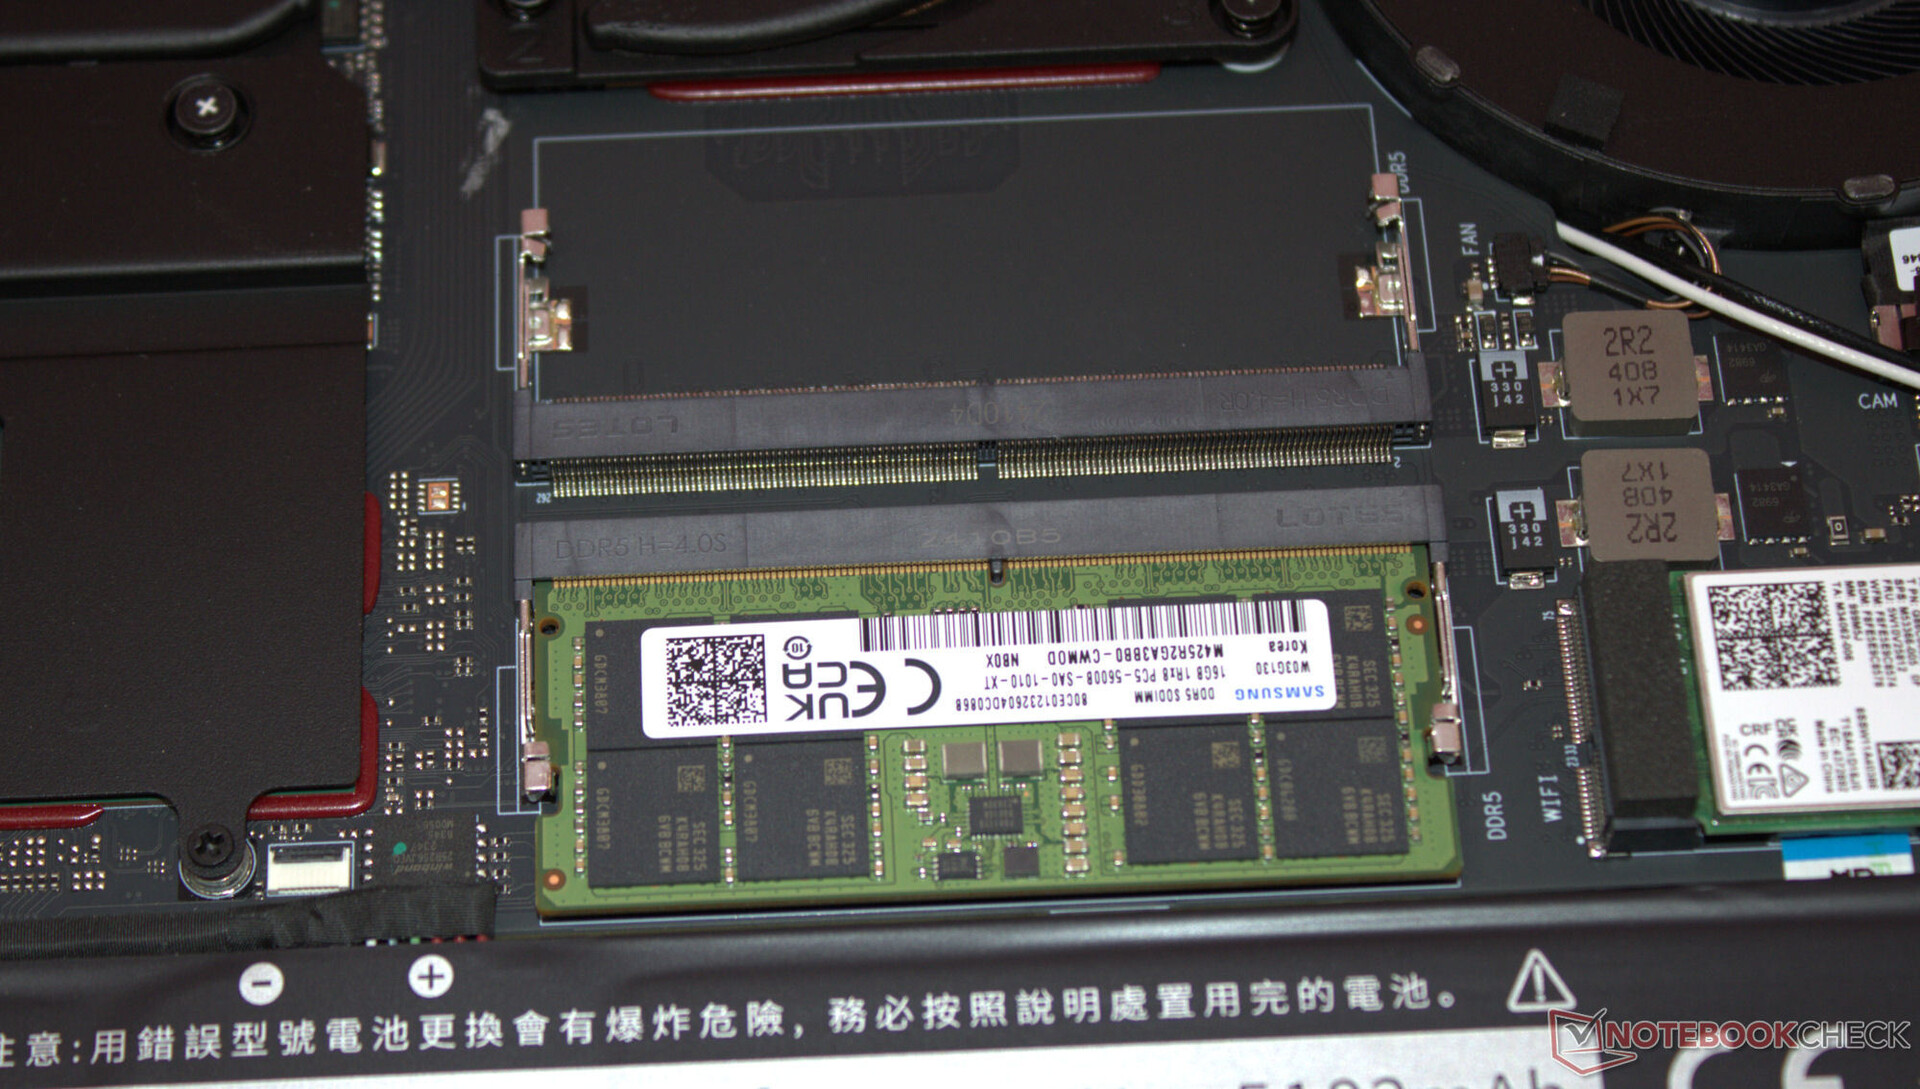
Dopo aver rimosso tutte le viti sul fondo del case, è possibile rimuovere la parte inferiore del case con l'aiuto di un plettro o di una spatola piatta. Quindi è possibile accedere ai banchi di memoria (di cui uno occupato), all'SSD (PCIe 4, M.2-2280), al secondo slot SSD (PCIe 4, M.2-2280) al modulo WLAN, alla batteria del BIOS, alle ventole e alla batteria.
Sostenibilità
Molto cartone, poca plastica: il portatile è racchiuso in una pellicola, mentre un sottile tappetino di schiuma protegge la parte superiore del dispositivo. La guida rapida stampata è contenuta in una busta di plastica. Una piastra di base rimovibile rende possibili le riparazioni del portatile: l'intero hardware è accessibile. Gli aggiornamenti del software non dovrebbero essere un problema per i prossimi anni: dopo tutto, il sistema operativo utilizzato è Windows 11.
Resta da vedere come Nubia gestirà la fornitura di pezzi di ricambio e il supporto per il proprio software. Al momento del test, non esiste ancora un'area di download per il Titan sul sito web di Nubia.
Garanzia
Non possiamo fornire informazioni sulla garanzia del portatile: è probabile che la durata sia di circa 12 mesi, standard negli Stati Uniti. Riteniamo improbabile l'estensione della garanzia.
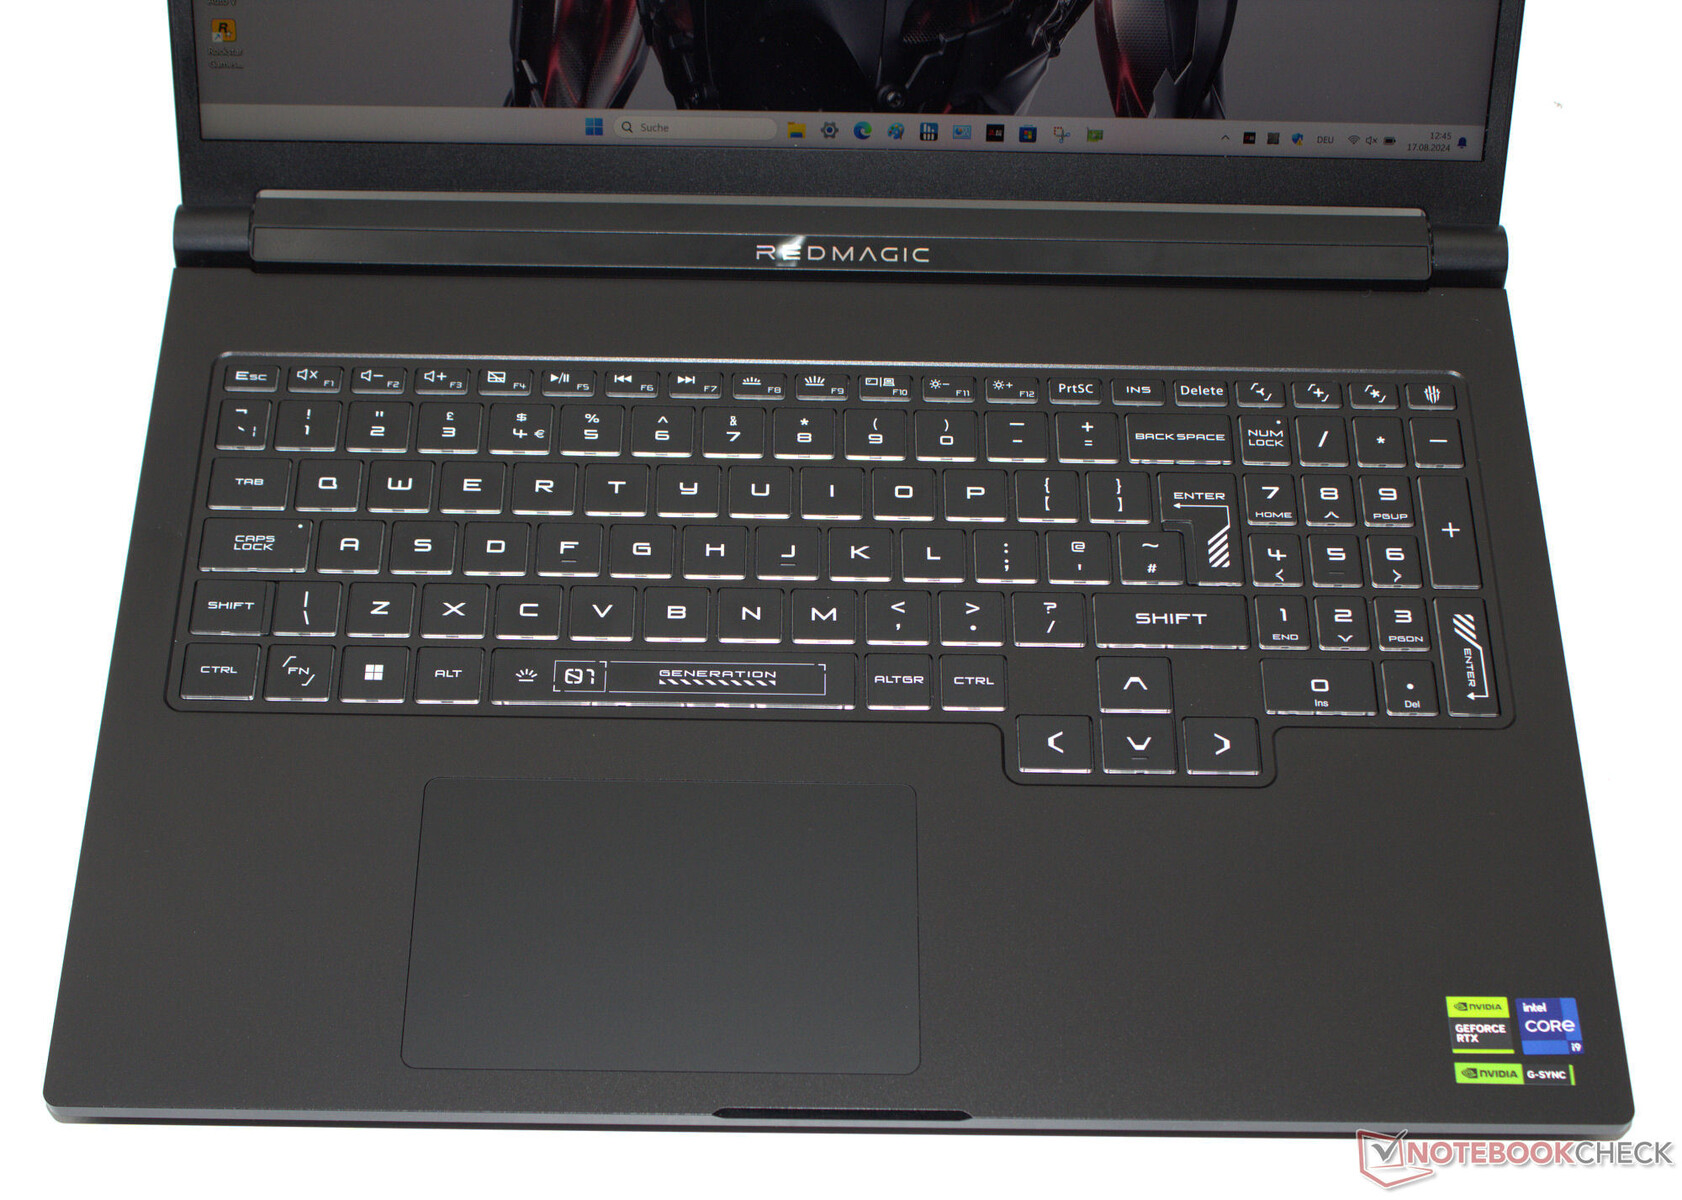
Dispositivi di input - Il laptop RedMagic con illuminazione RGB
Tastiera
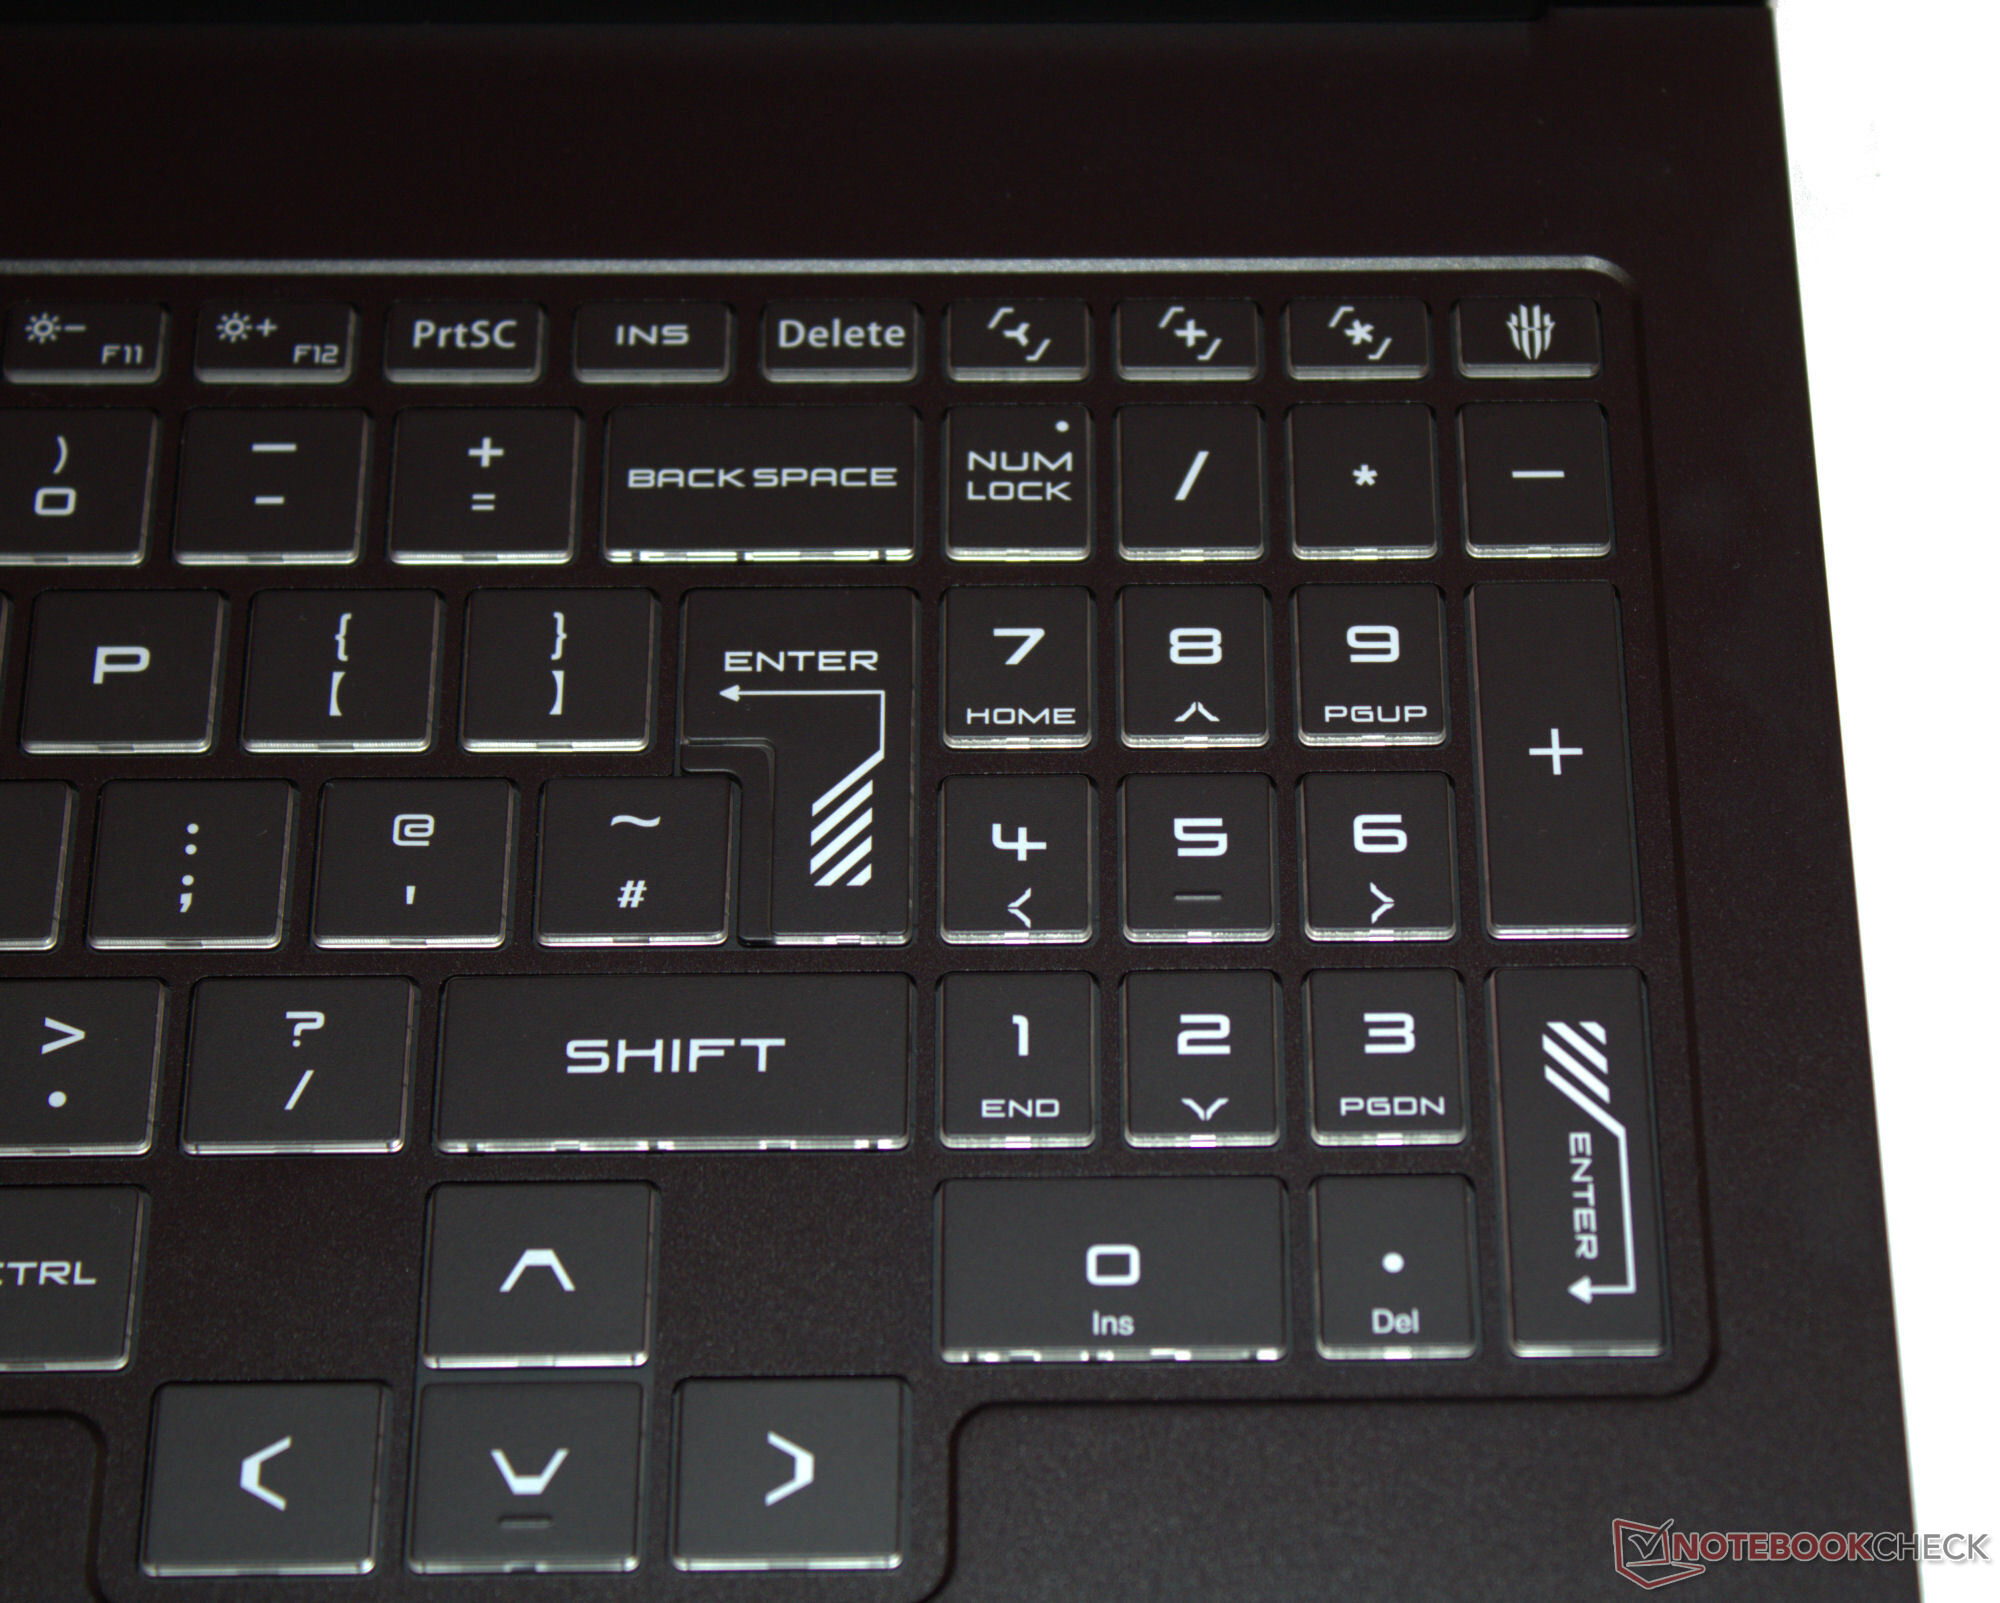
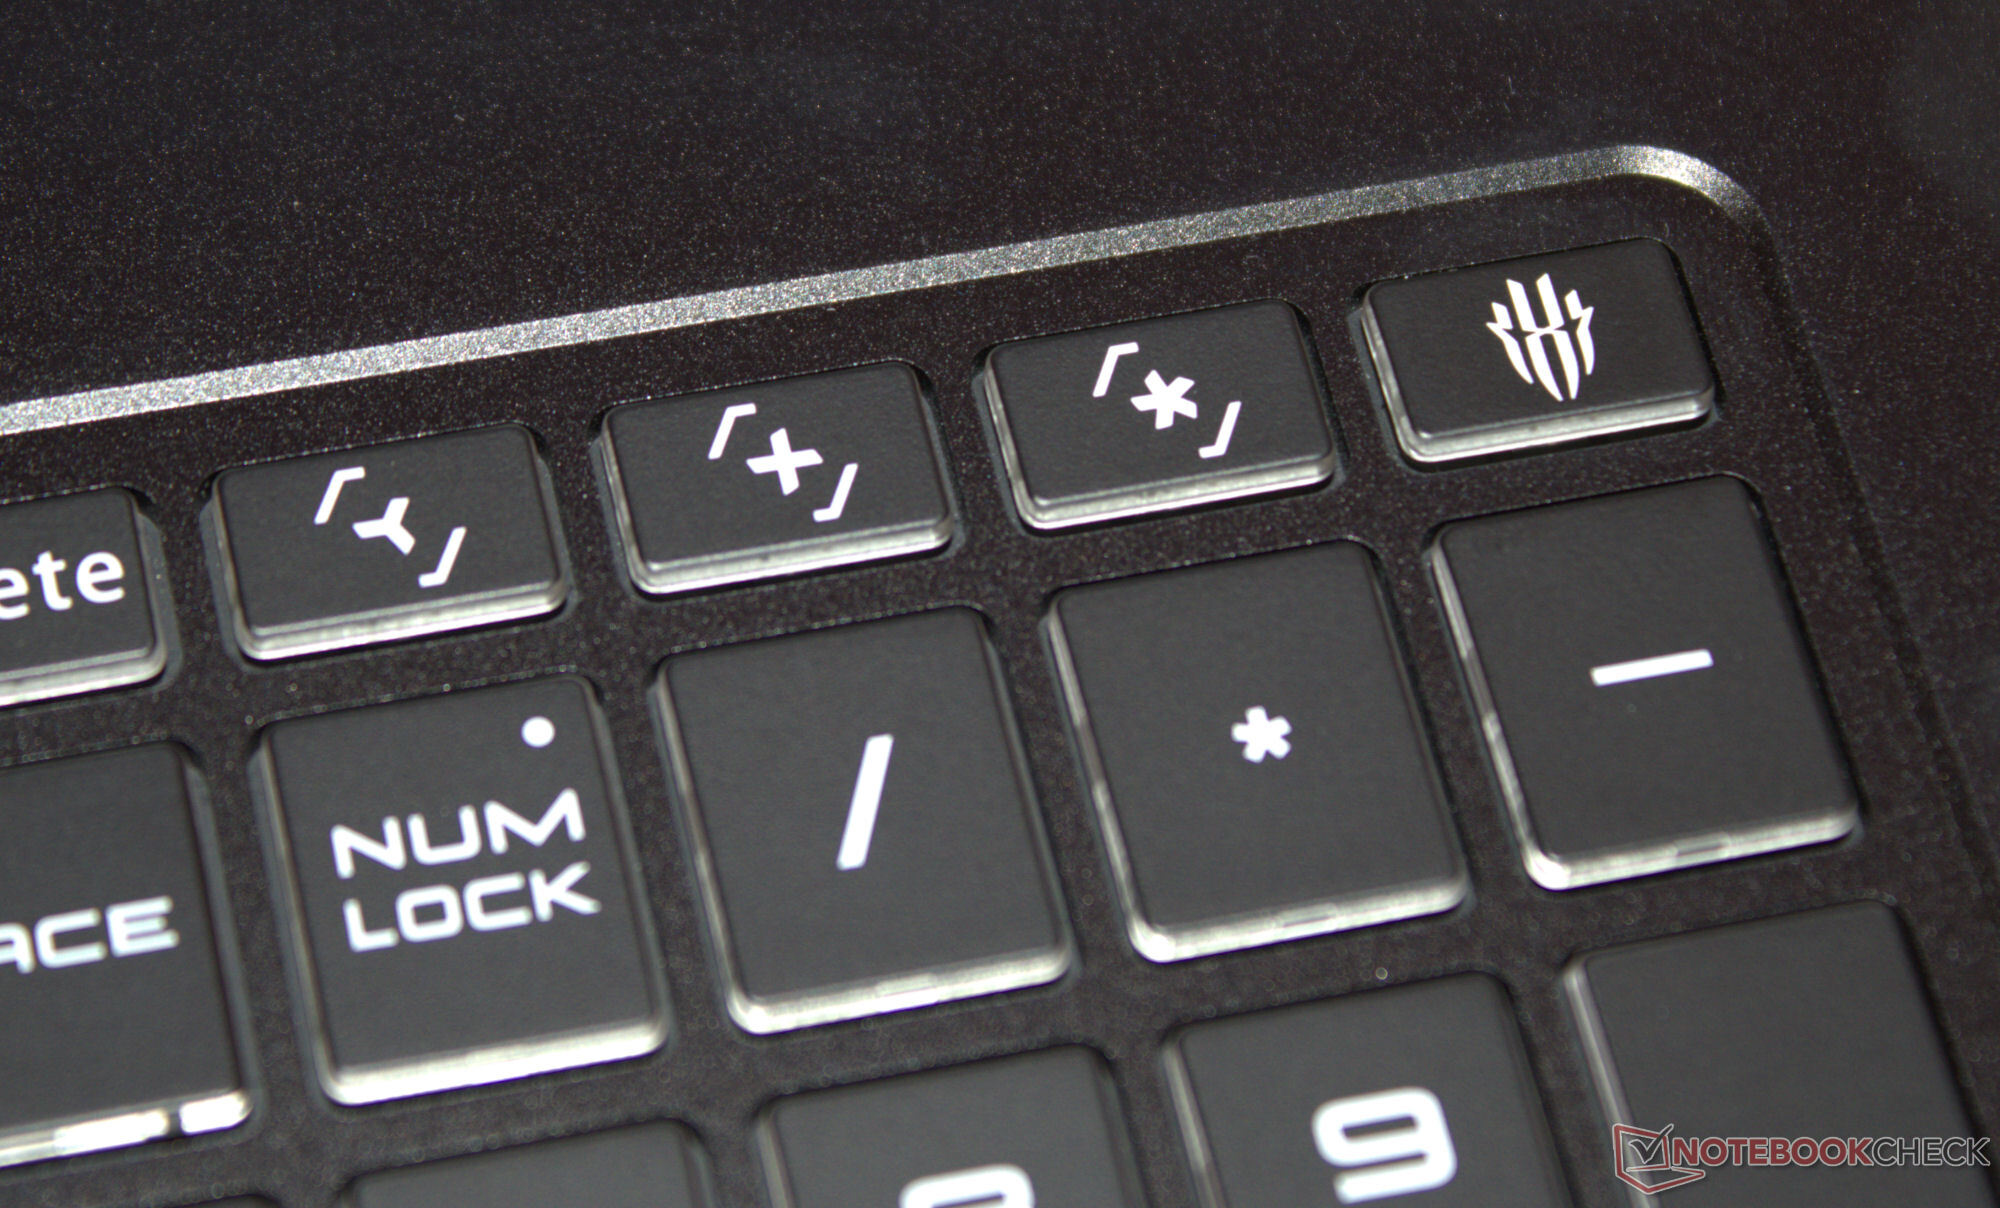
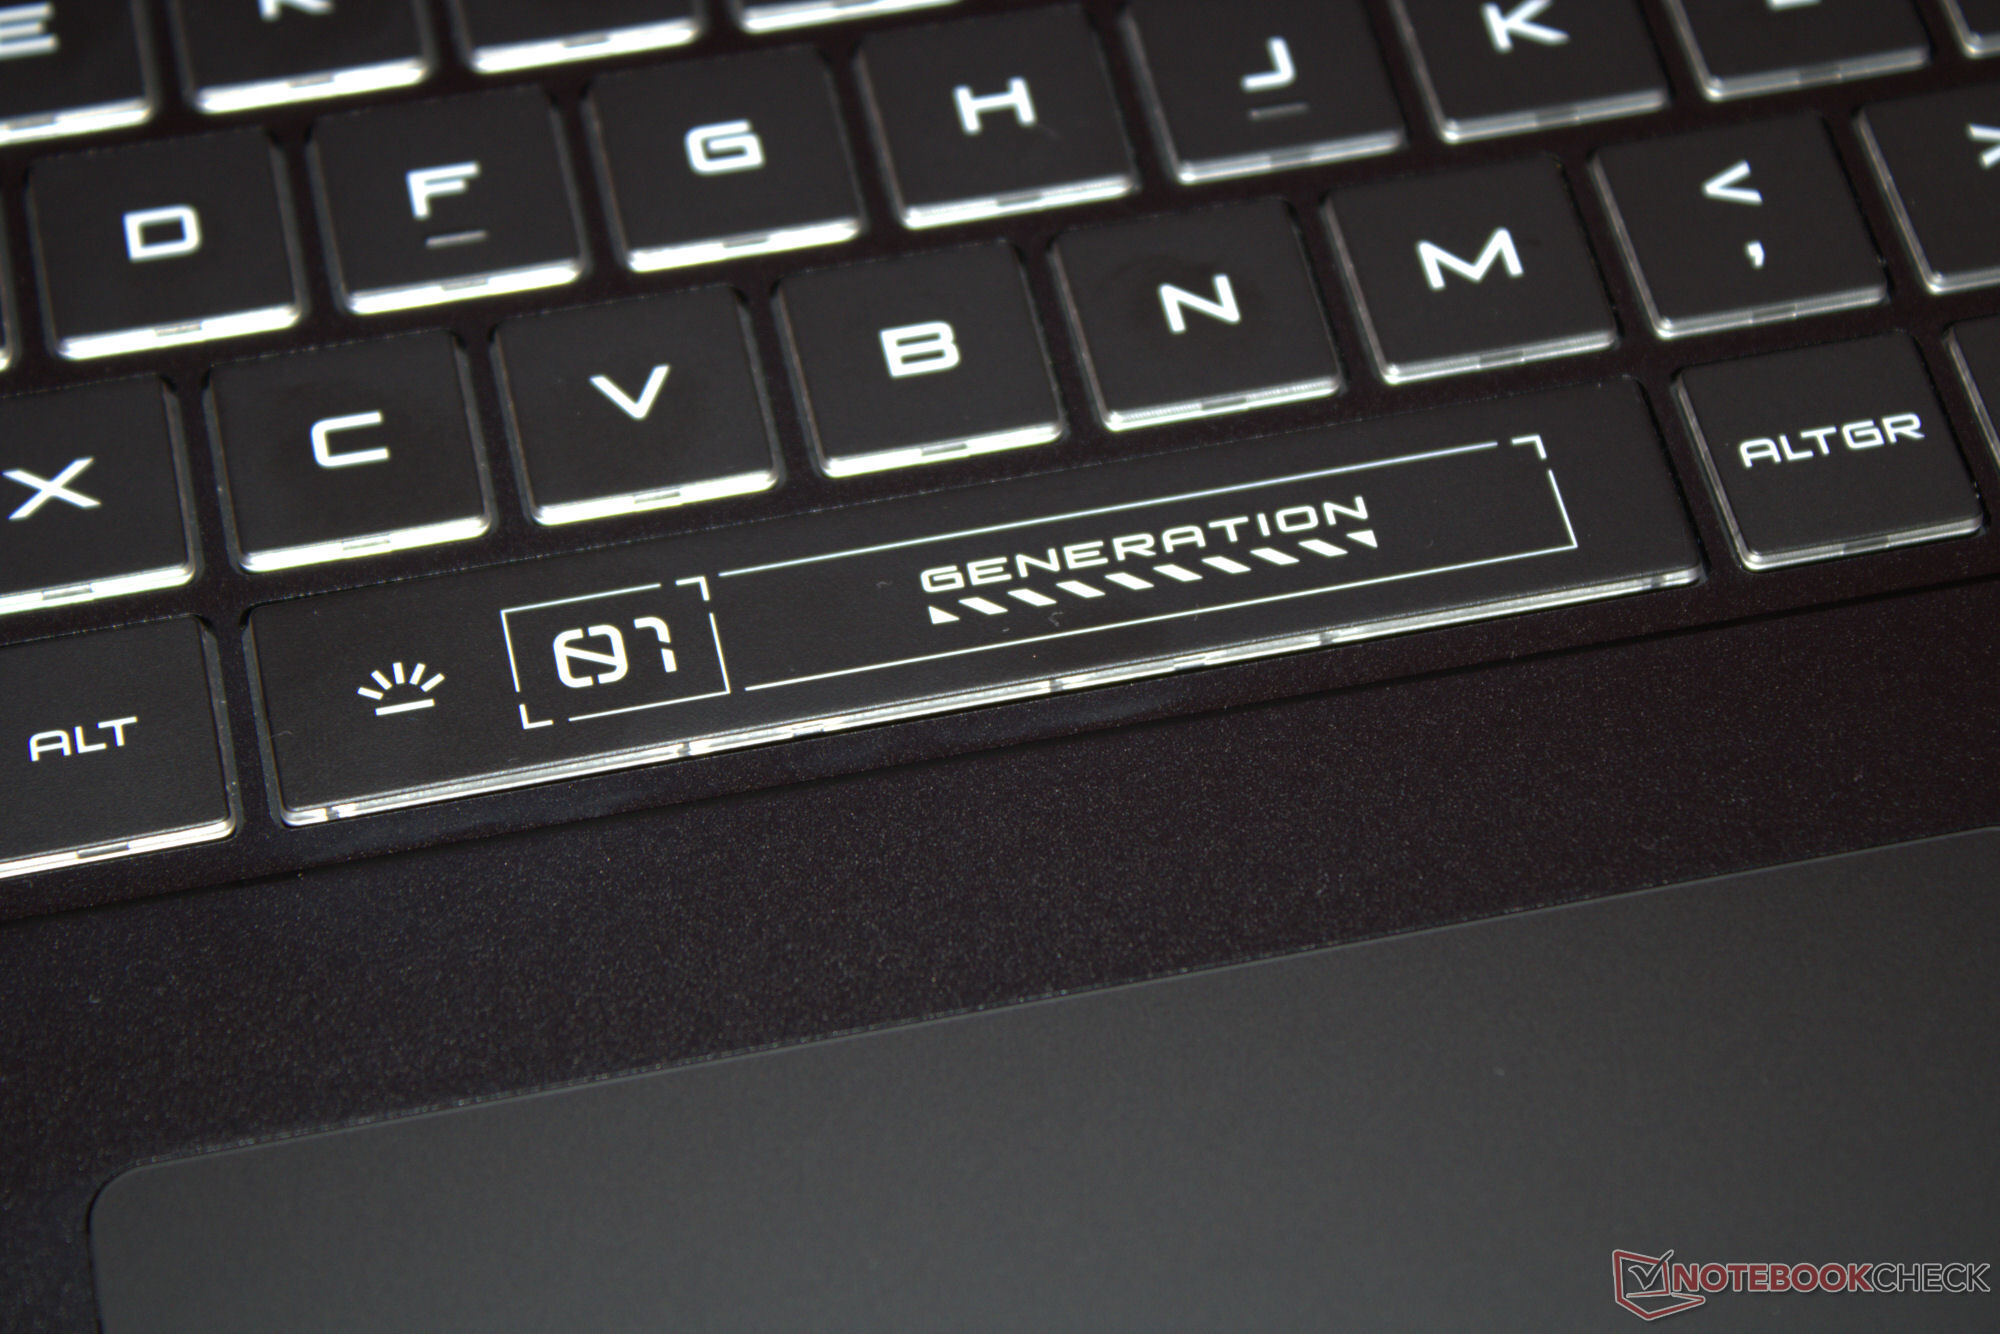
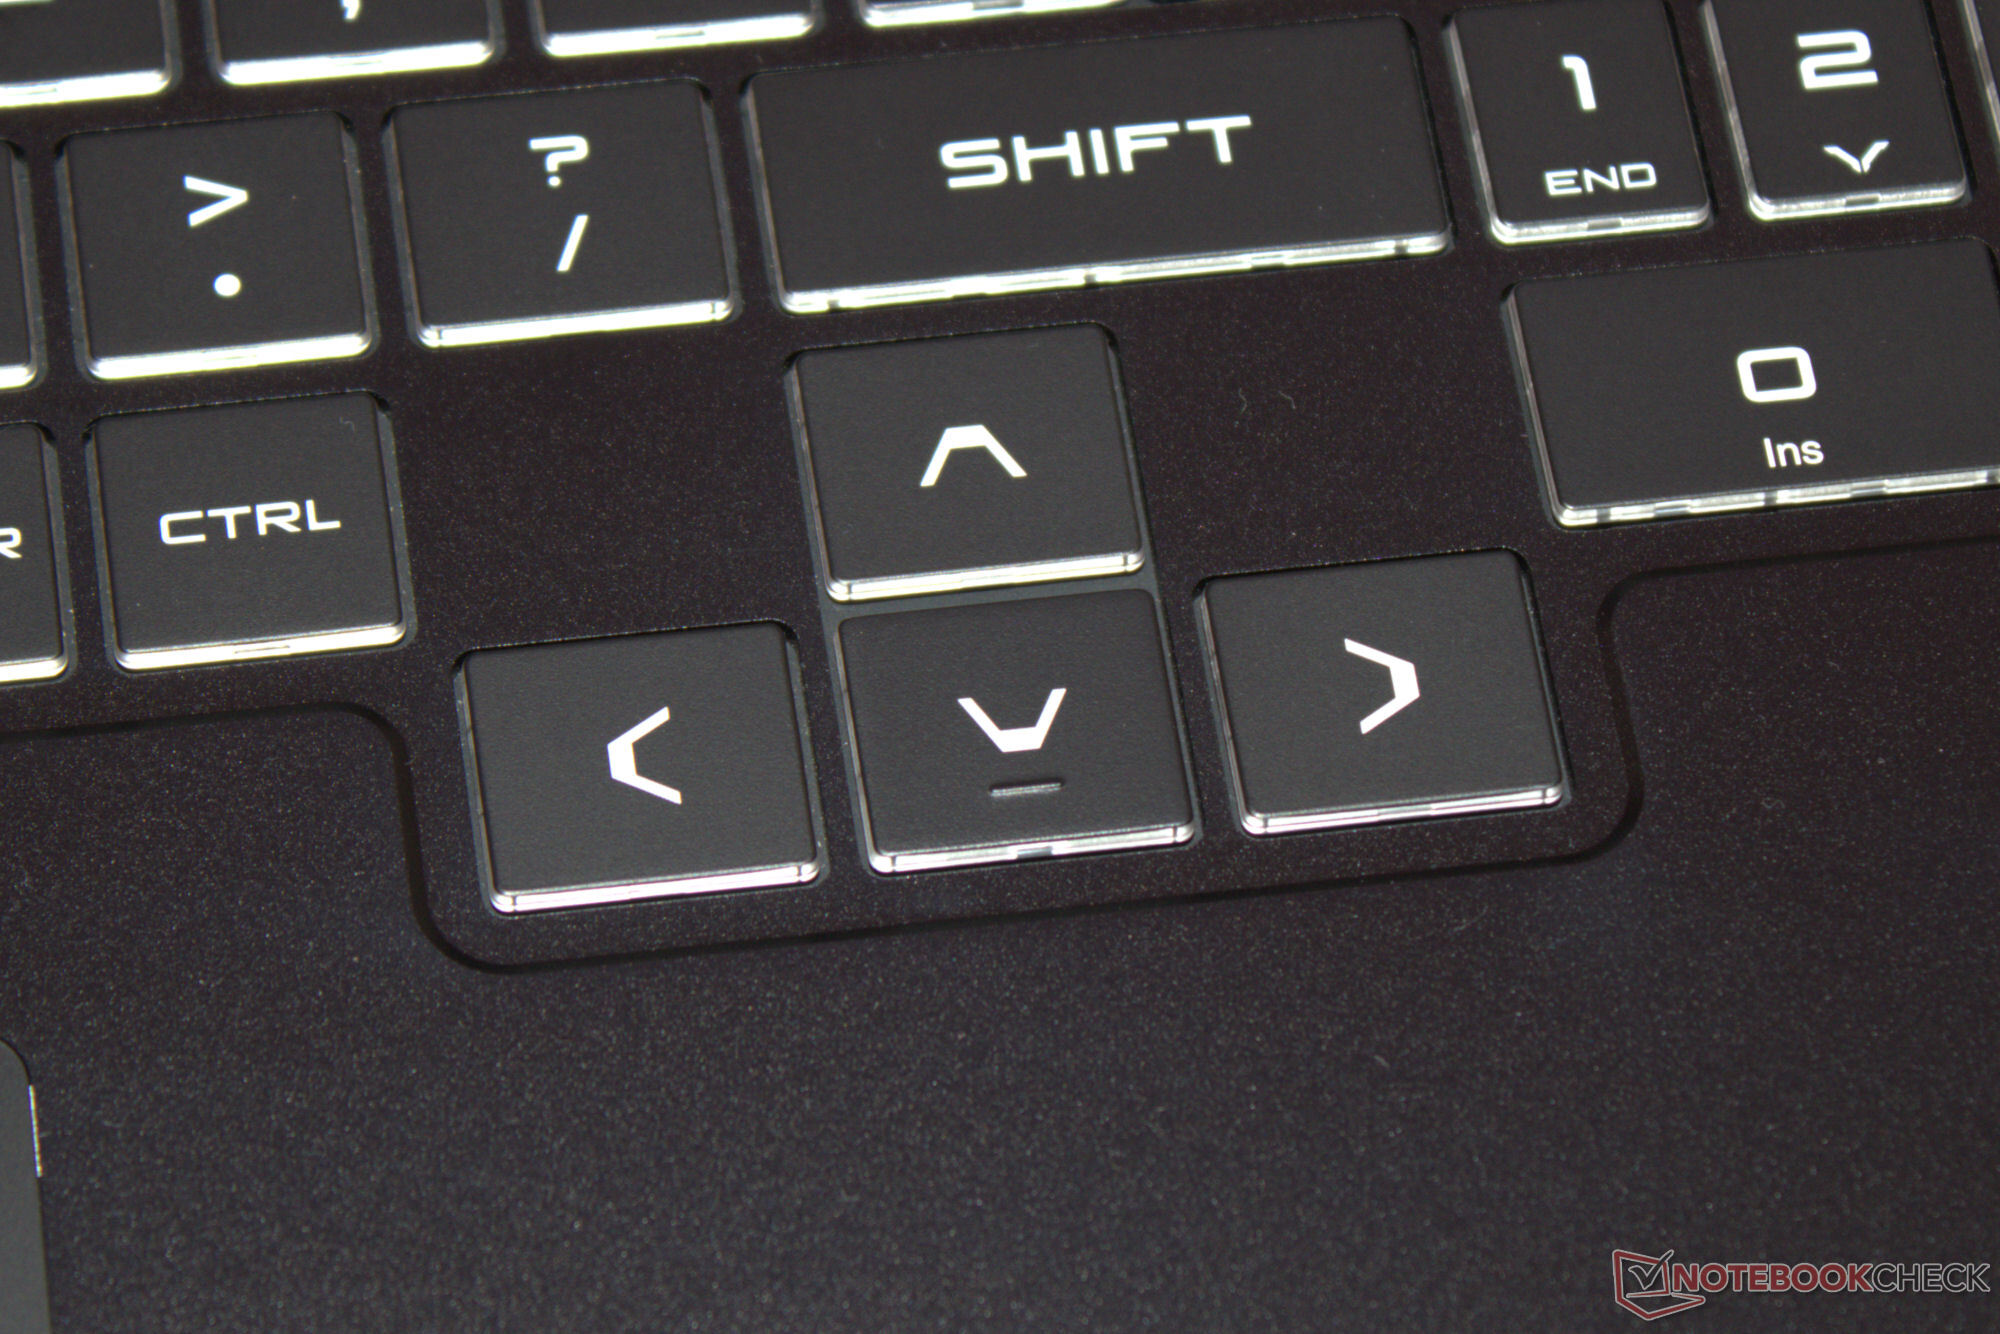
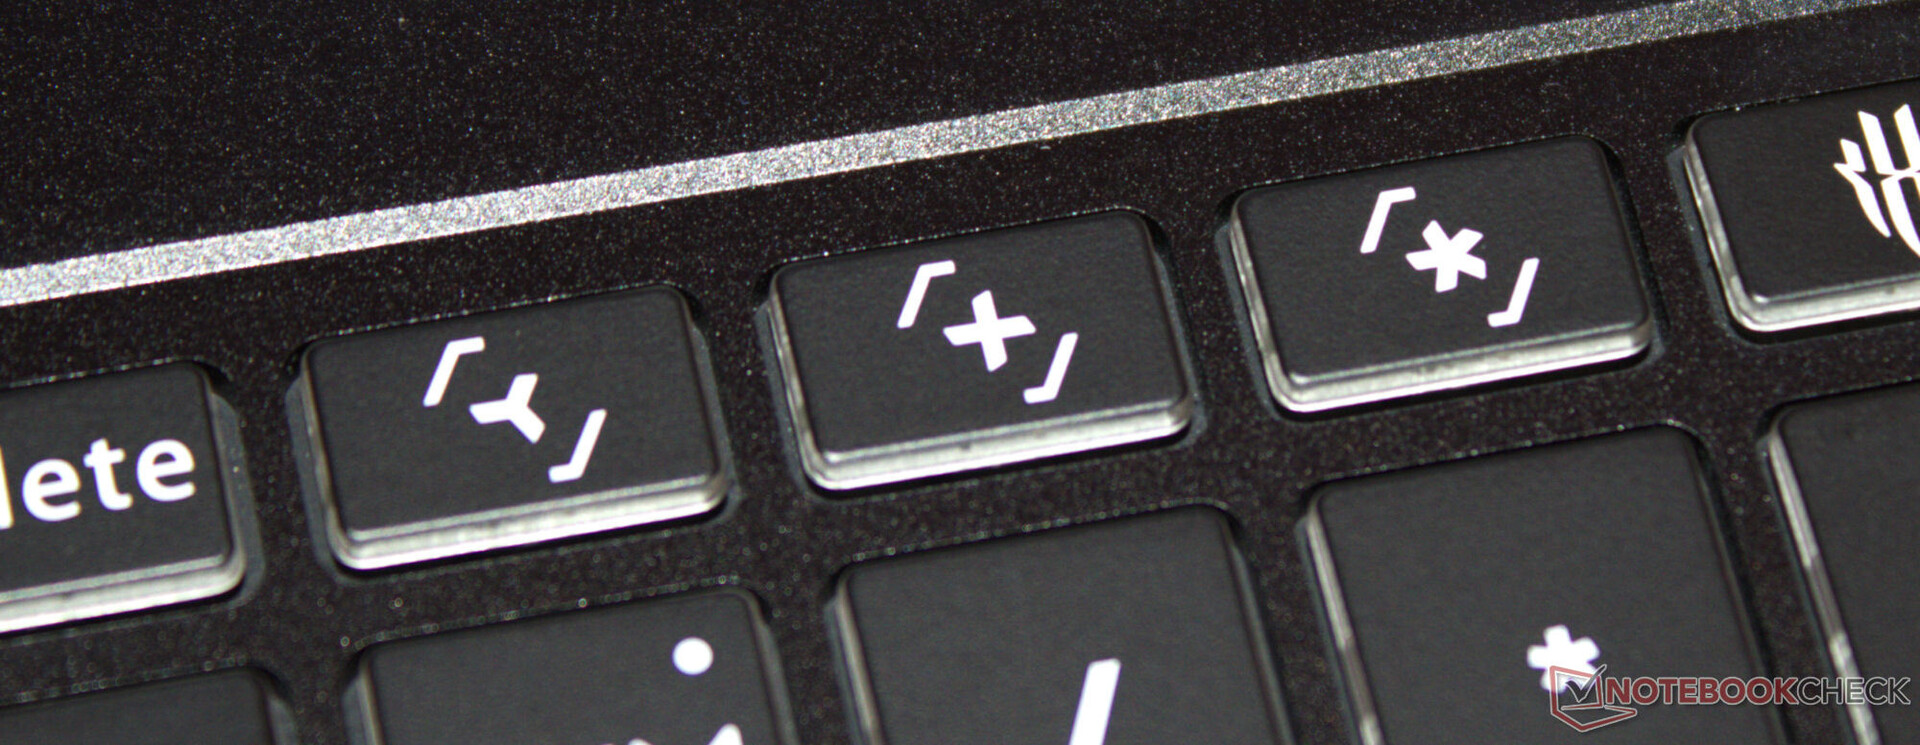
Nubia ha scelto una tastiera chiclet che include un tastierino numerico. I tasti, illuminati in modo uniforme, hanno una corsa breve e un punto di pressione chiaro. La tastiera non cede durante la digitazione. Un aspetto positivo è che i tasti freccia offset sono a grandezza naturale. La retroilluminazione RGB è suddivisa in quattro zone e il nostro dispositivo di prova ha un layout di tastiera QWERTY. Non possiamo dire se il produttore offre layout localizzati.
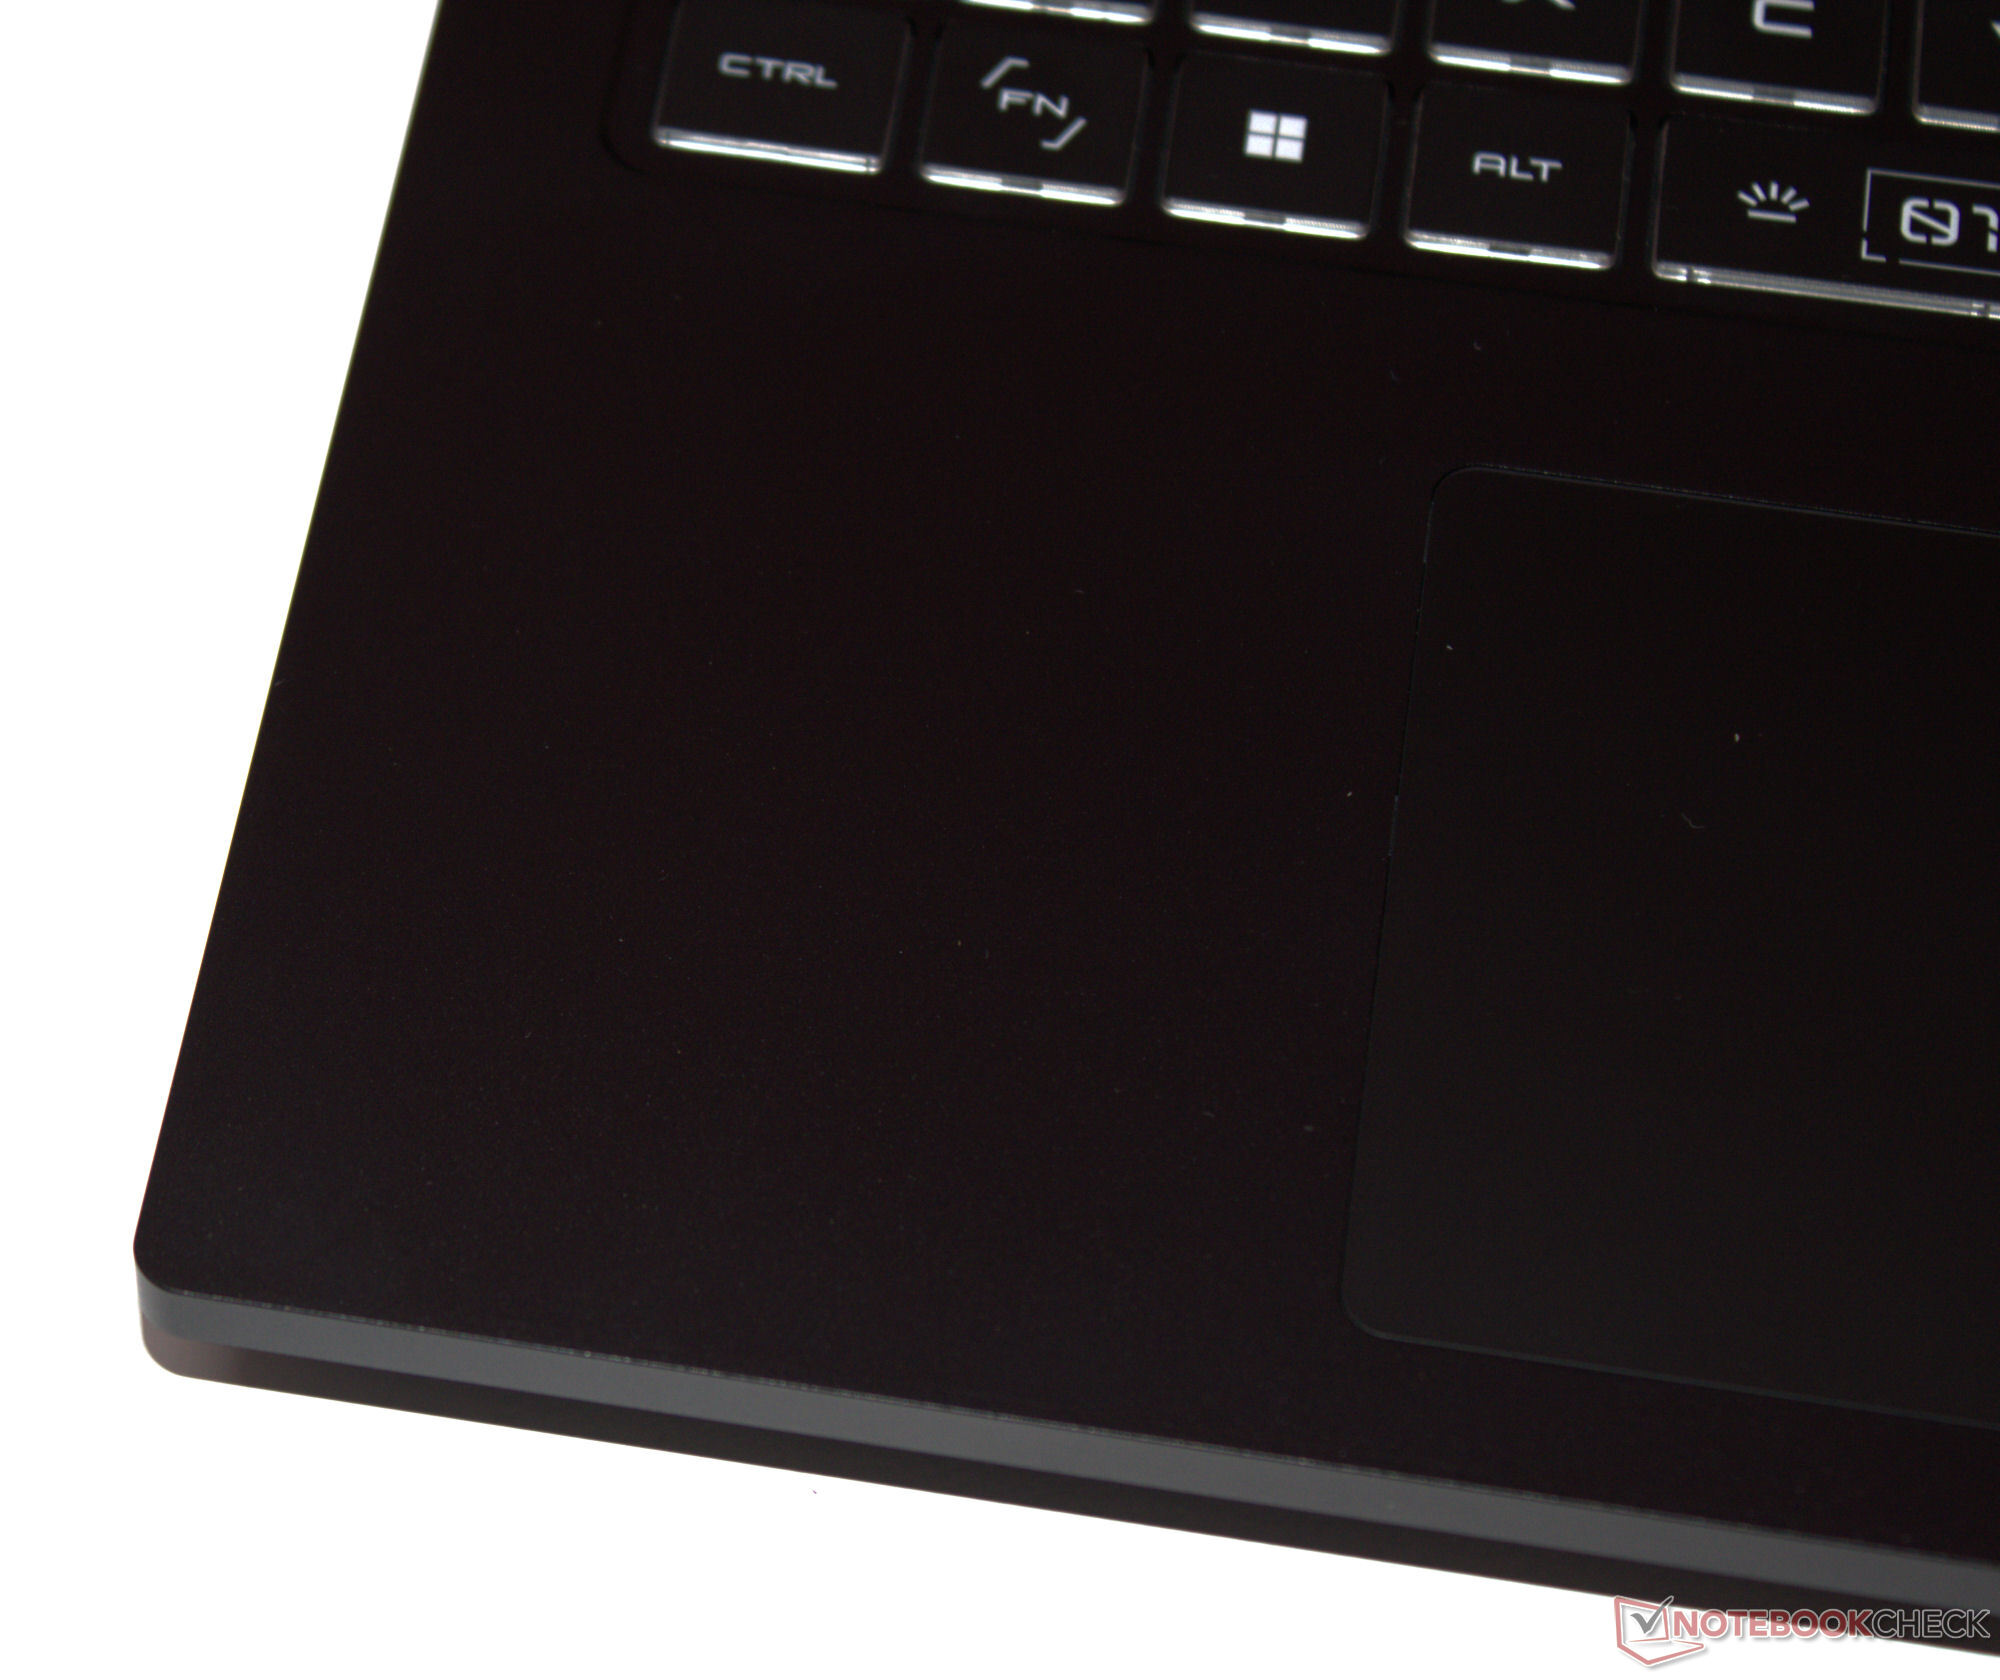
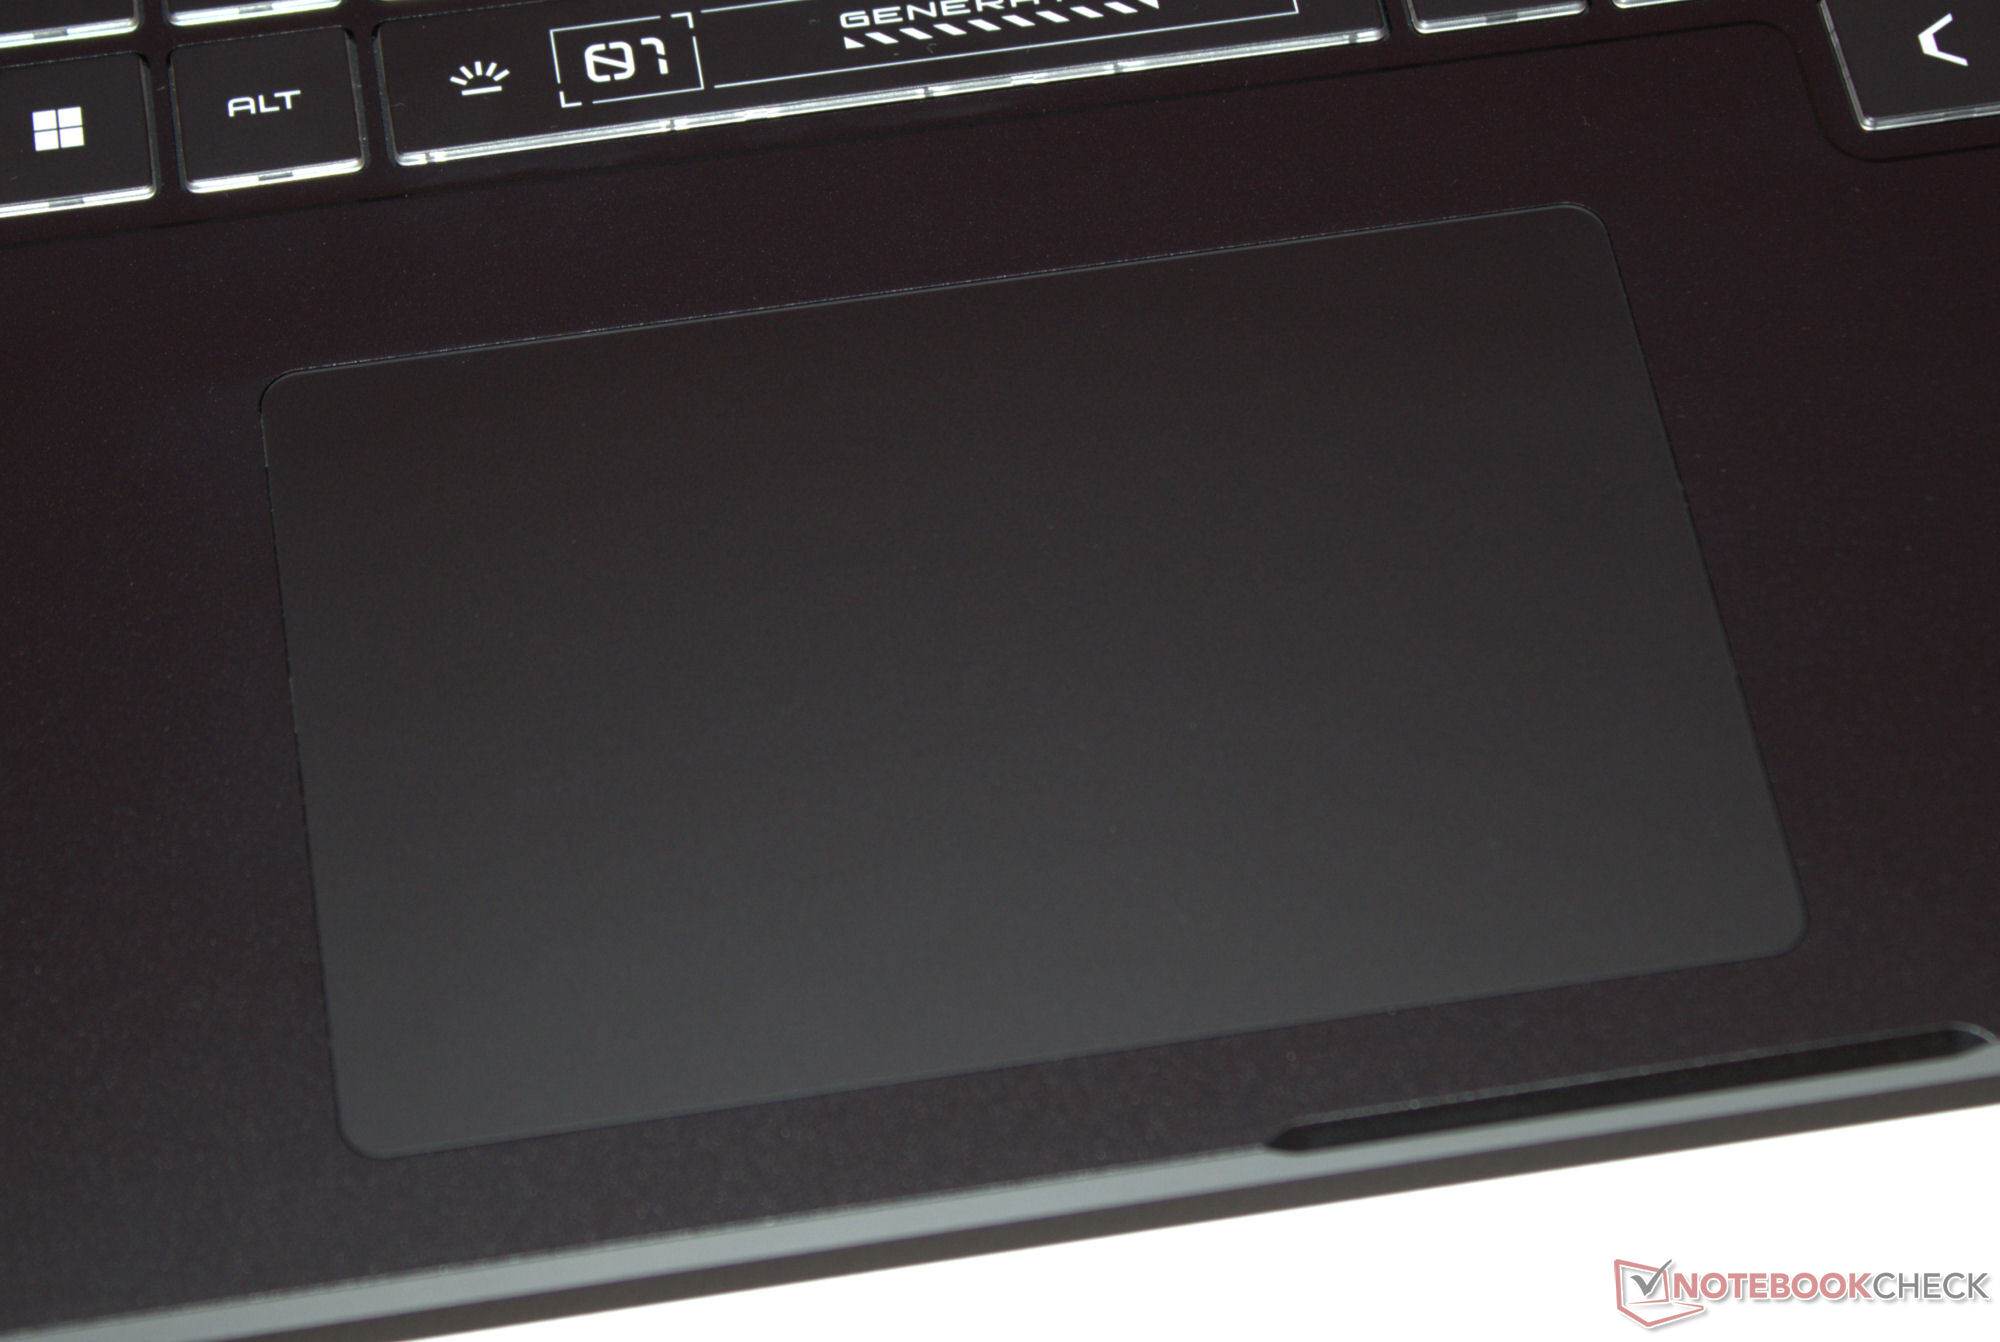
Touchpad
Un clickpad multi-touch (circa 11,7 x 7,5 cm) con superficie in vetro funge da sostituto del mouse. Ha una corsa breve e un punto di pressione chiaro. Il pad può essere disattivato se necessario.
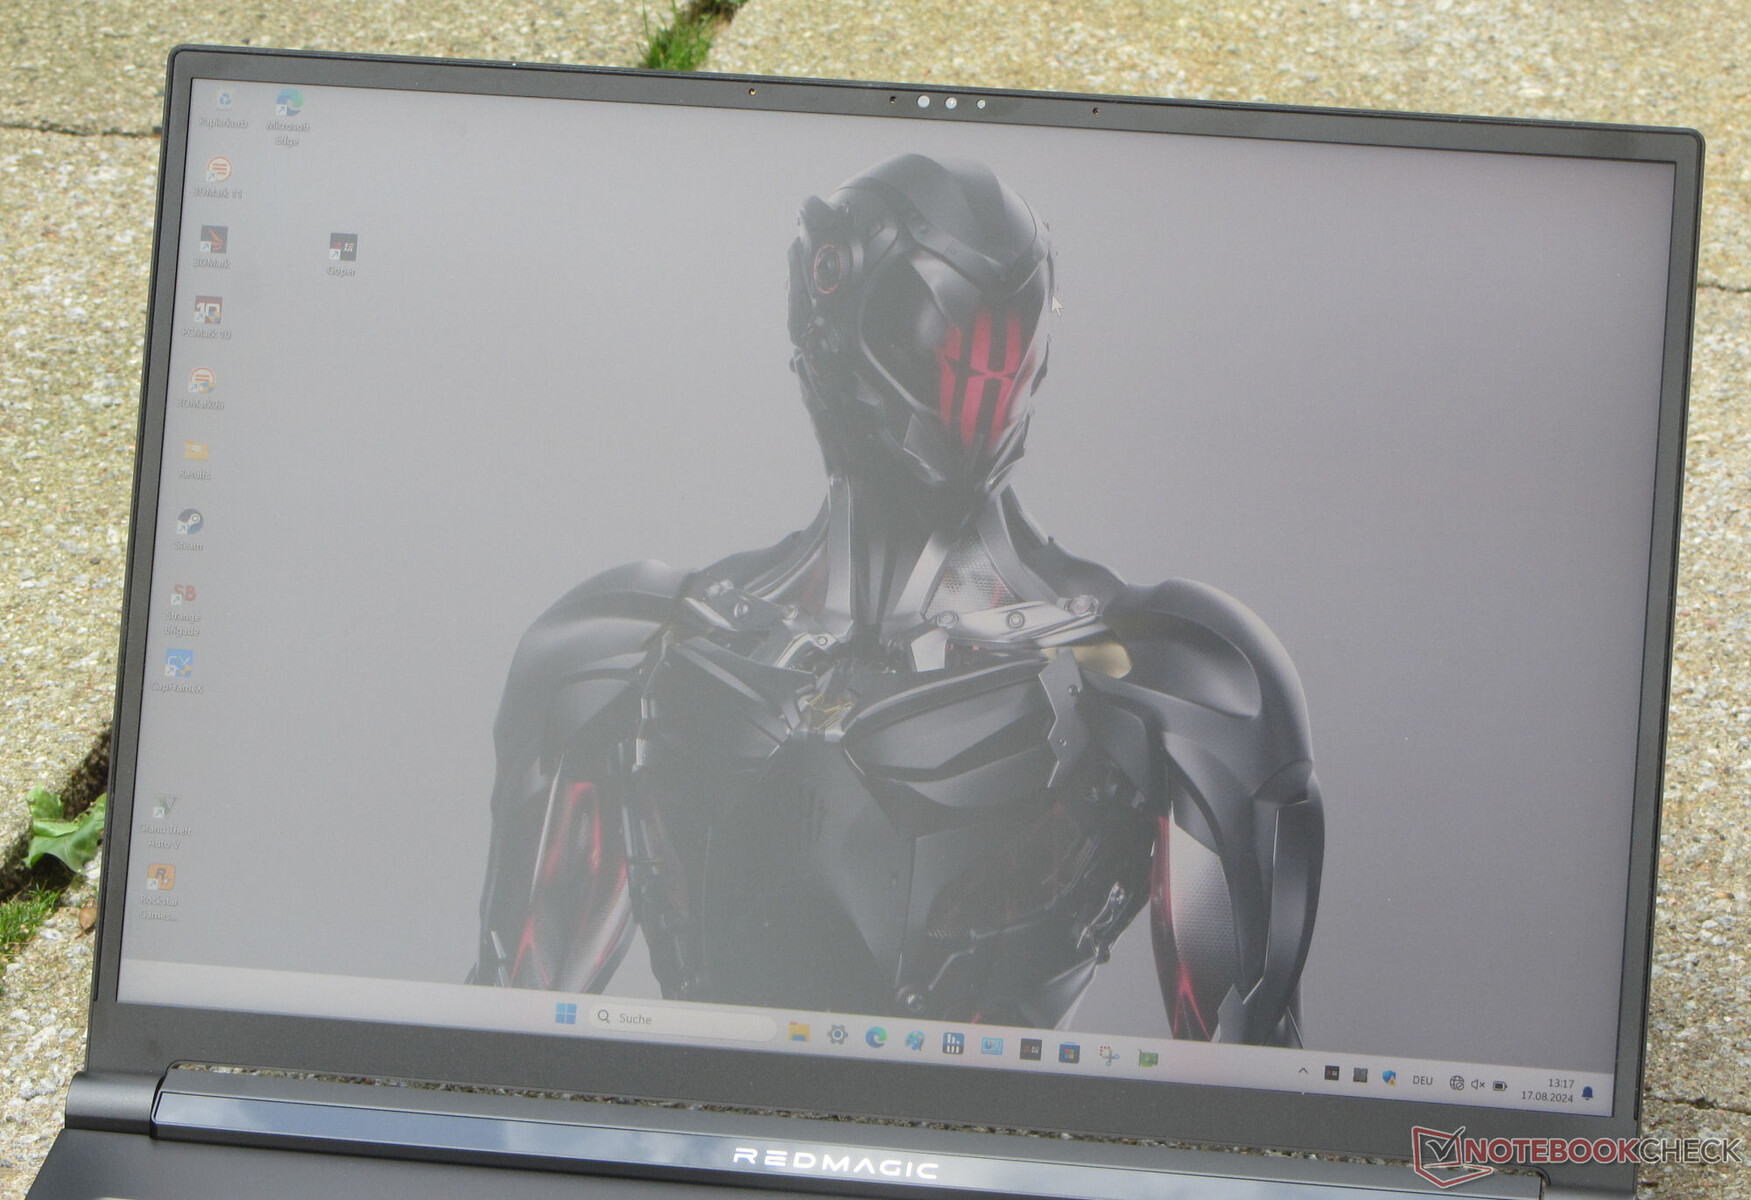
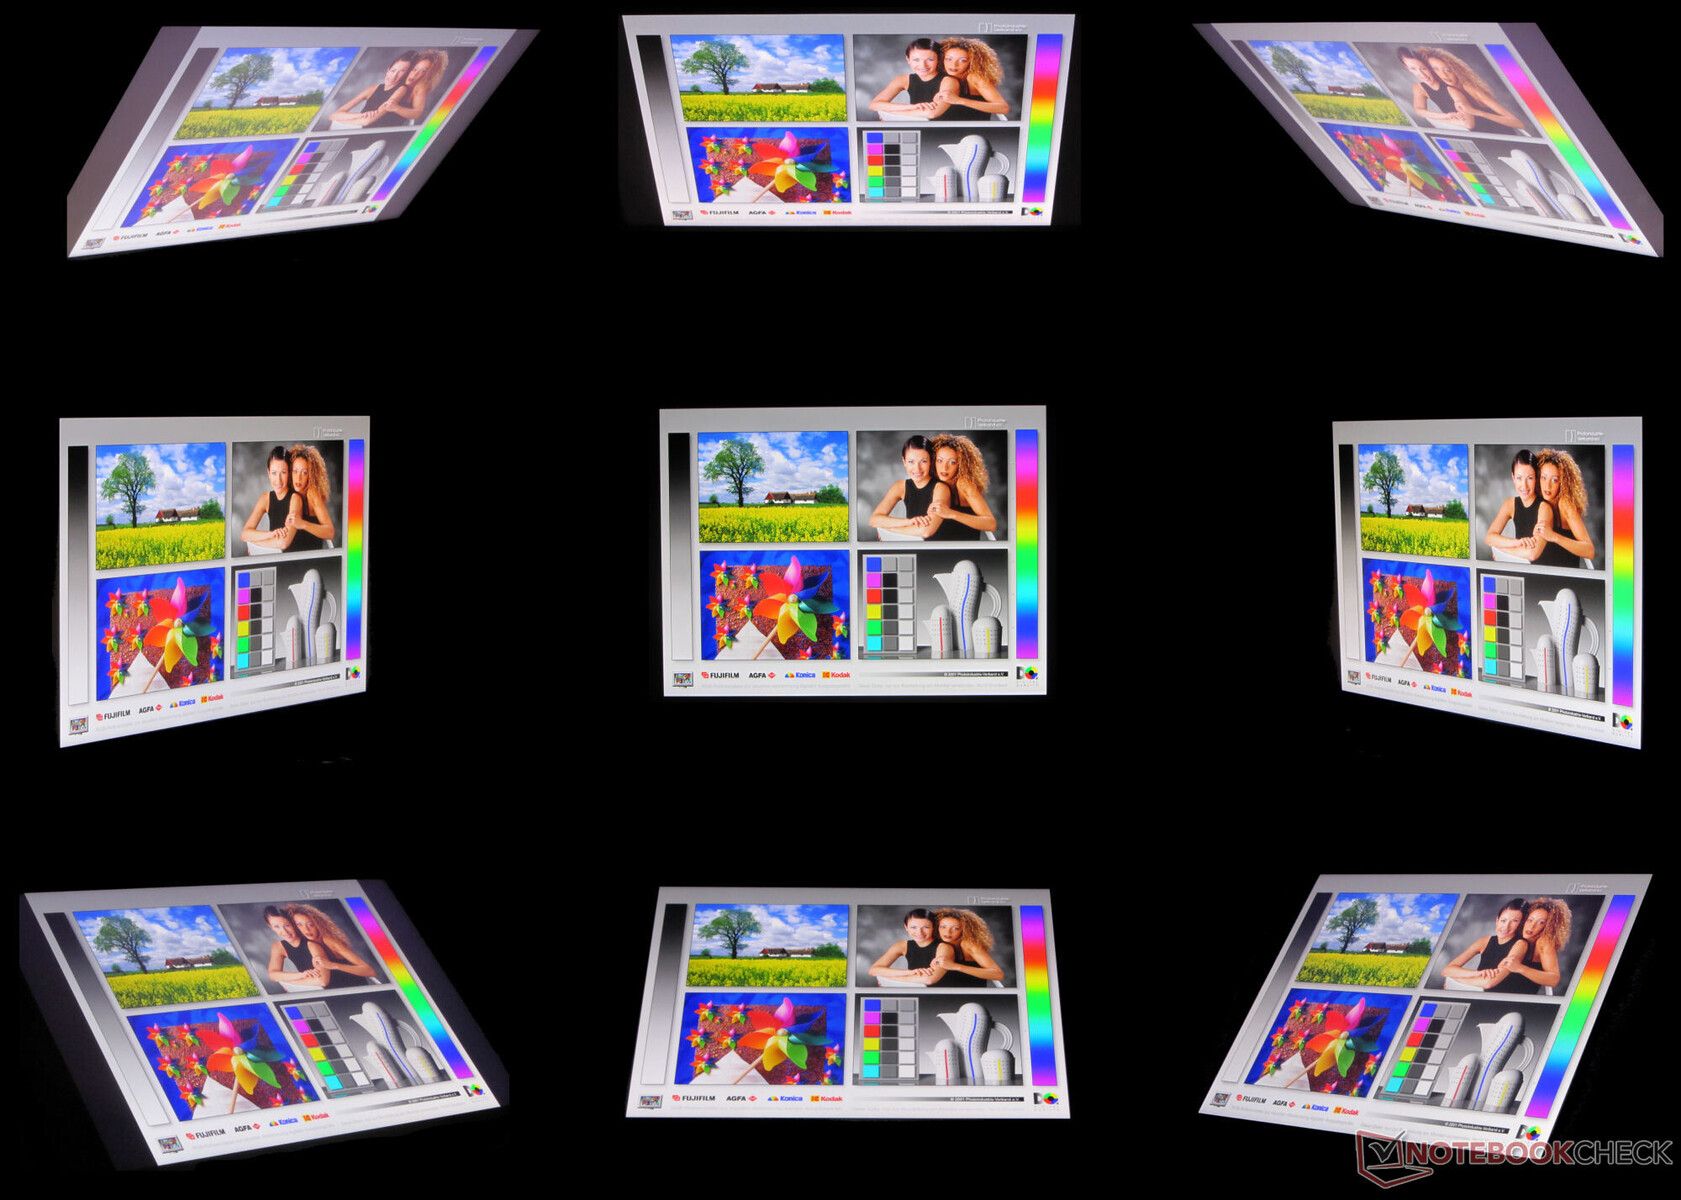
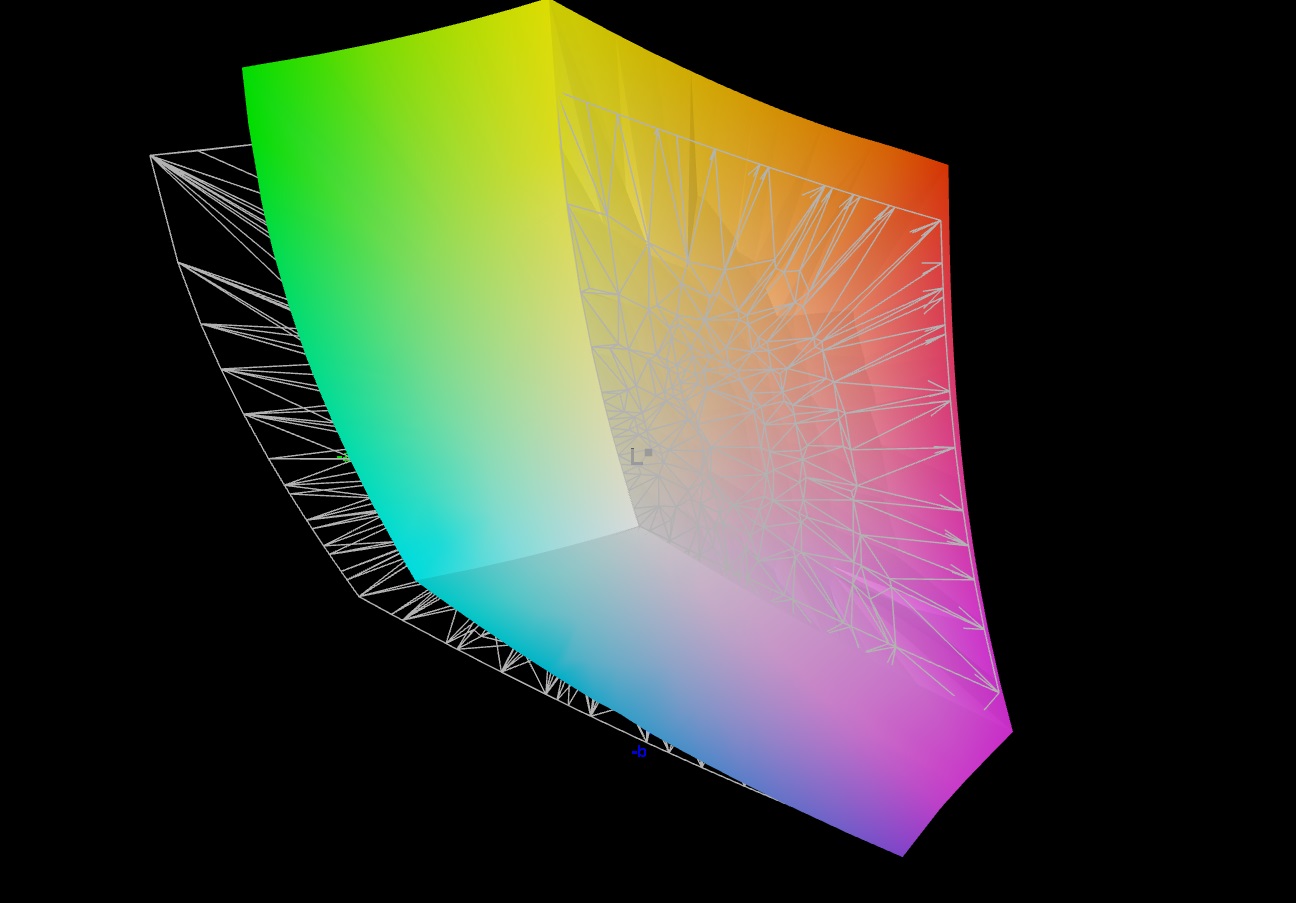
Display - Un pannello IPS con copertura DCI-P3
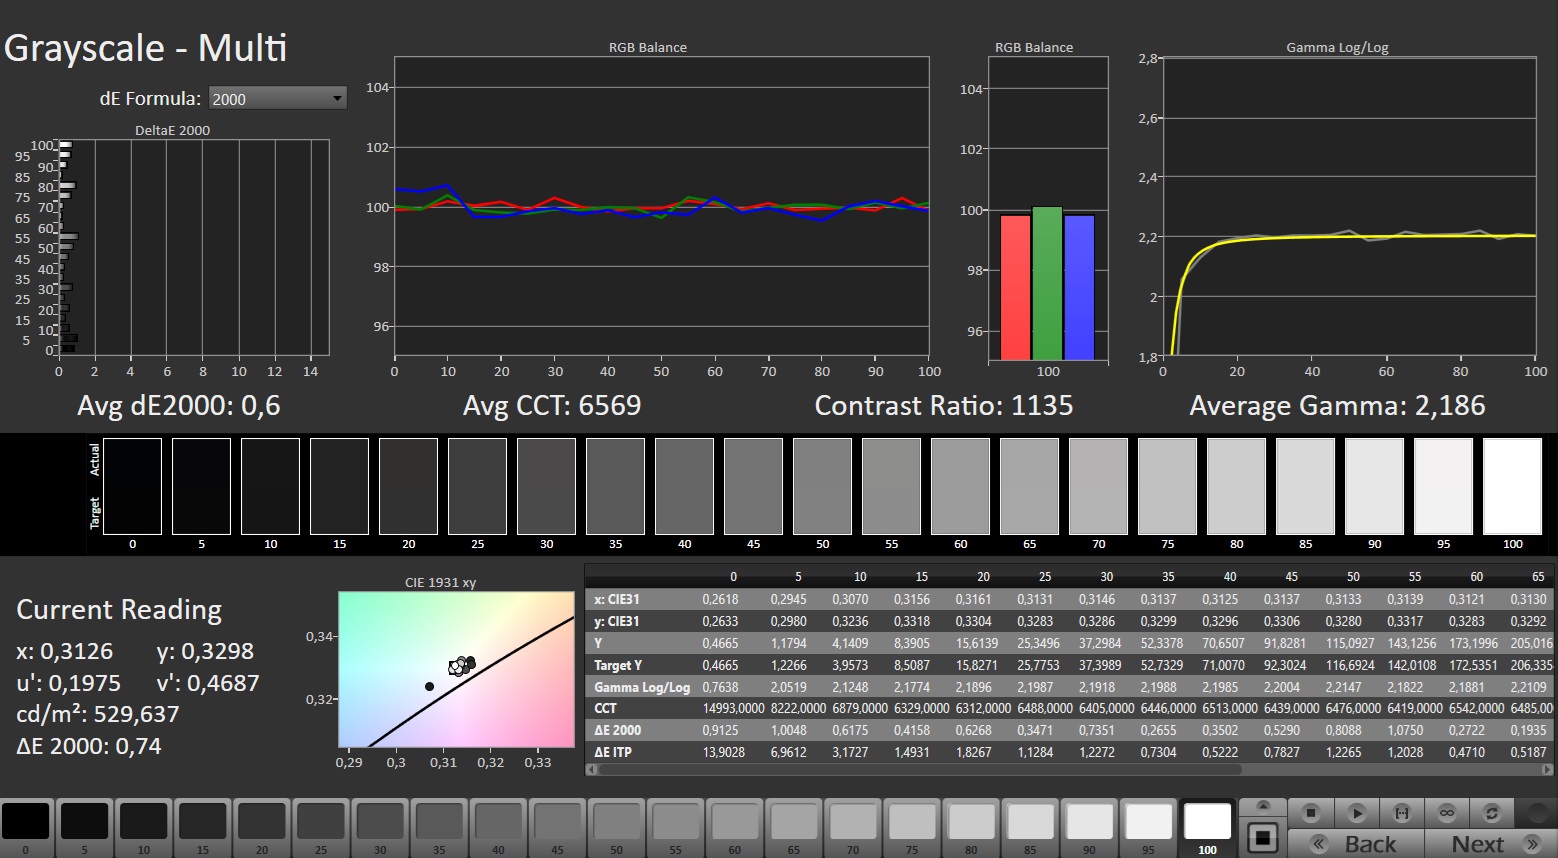
Sembra che il rapporto d'aspetto 16:10, adatto al lavoro, si sia affermato, dato che la maggior parte dei computer portatili nel campo di confronto ha schermi con questo rapporto d'aspetto, compreso il Titan. Nubia ha dotato il suo laptop di un display IPS opaco e stabile sull'angolo di visione (2.560 x 1.600 pixel) con una diagonale di 16 pollici. Il pannello è super luminoso e il suo contrasto soddisfa il valore target. È perfettamente possibile leggere dallo schermo all'aperto. Un aspetto positivo è che il pannello a 240 Hz non mostra segni di sfarfallio PWM e supporta G-Sync. Non sono disponibili display alternativi.
| |||||||||||||||||||||||||
Distribuzione della luminosità: 86 %
Al centro con la batteria: 543 cd/m²
Contrasto: 1065:1 (Nero: 0.51 cd/m²)
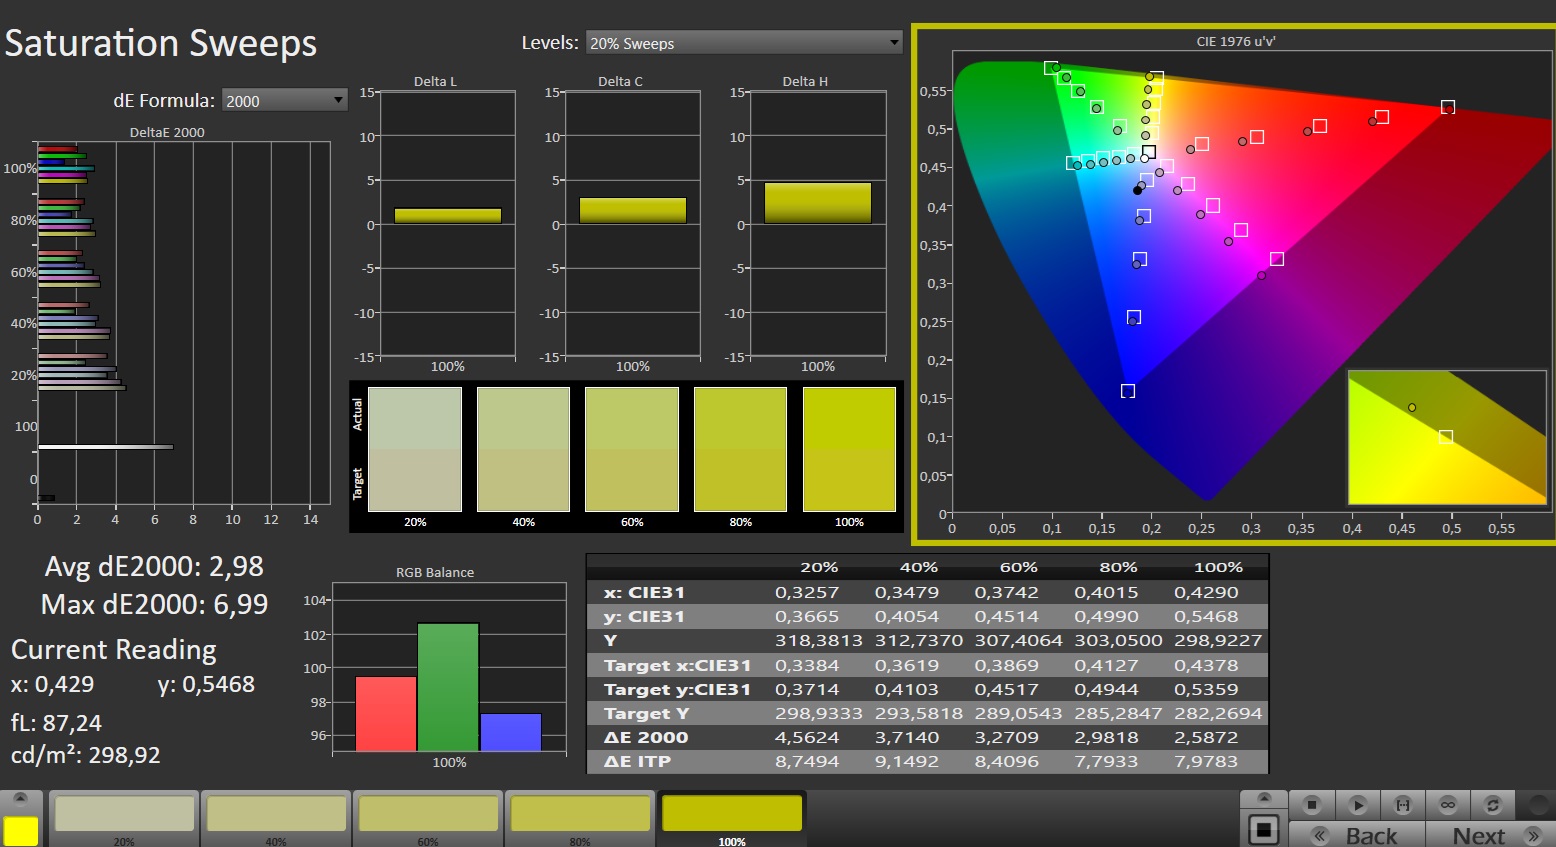
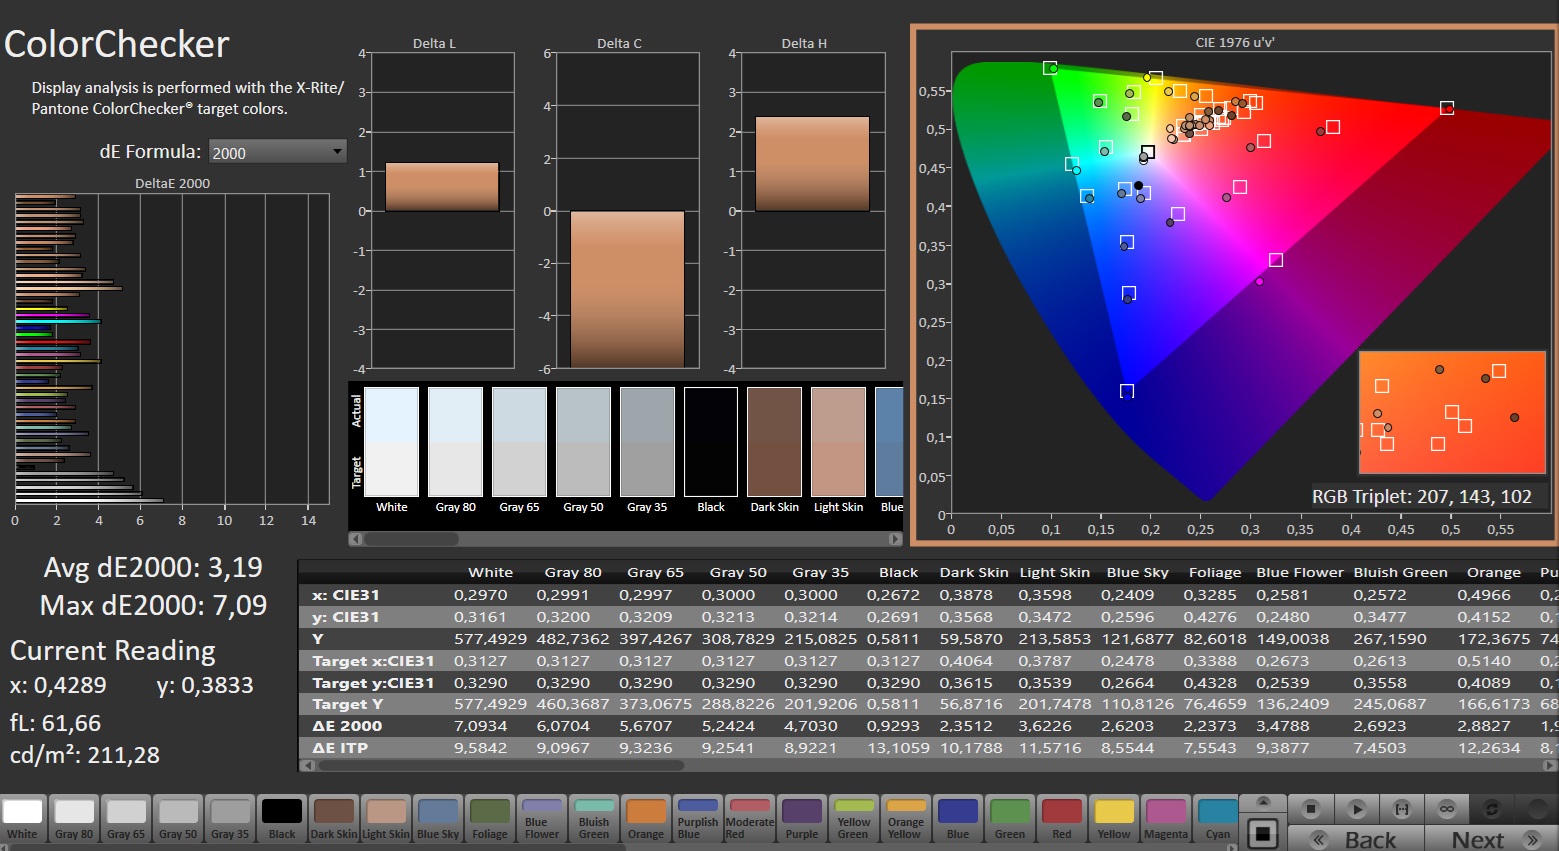
ΔE Color 3.19 | 0.5-29.43 Ø4.87, calibrated: 0.69
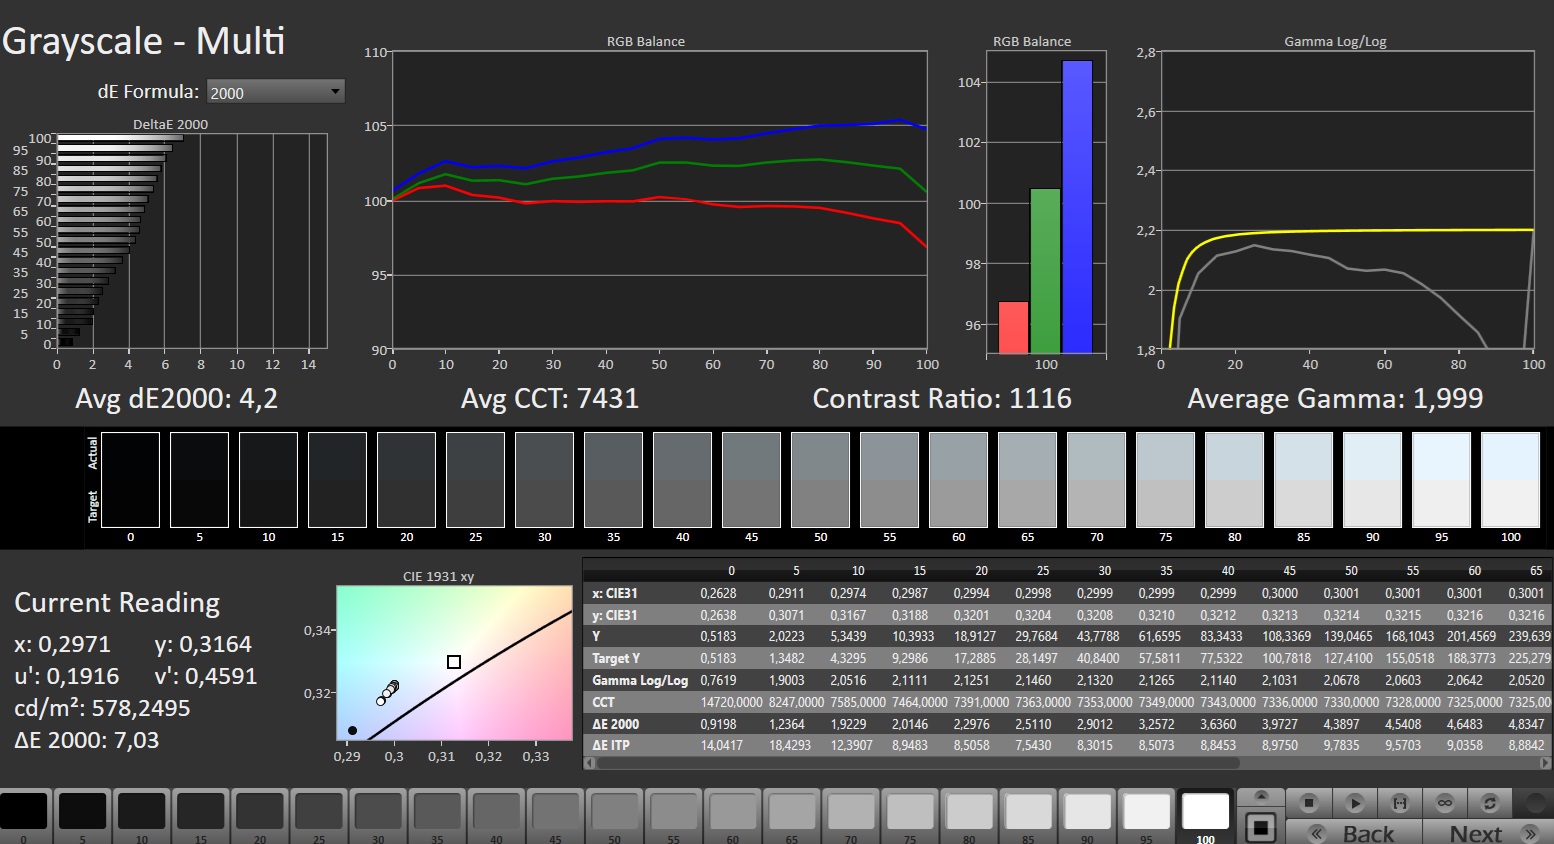
ΔE Greyscale 4.2 | 0.5-98 Ø5.1
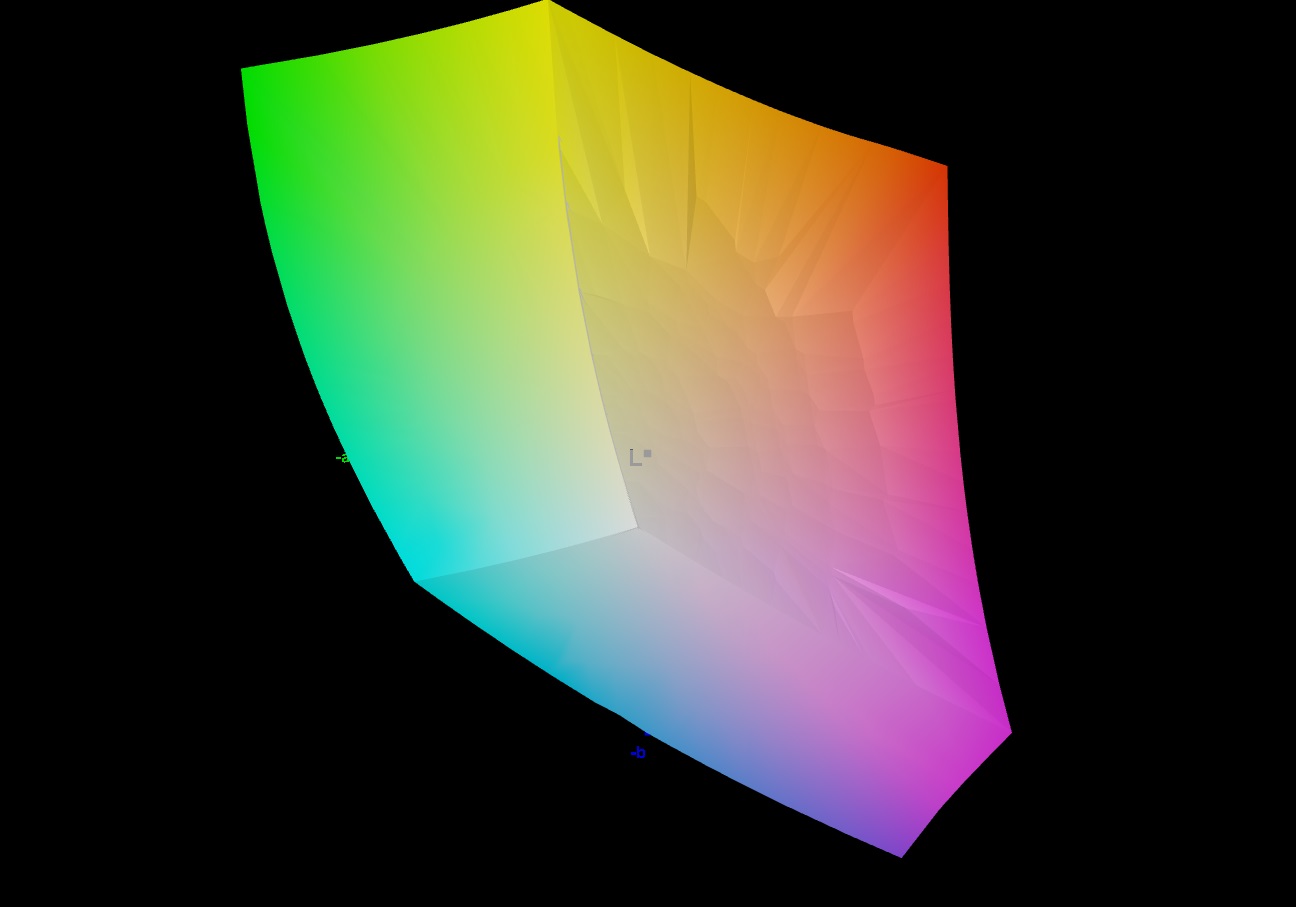
84.1% AdobeRGB 1998 (Argyll 2.2.0 3D)
100% sRGB (Argyll 2.2.0 3D)
96.3% Display P3 (Argyll 2.2.0 3D)
Gamma: 1.999
| Nubia RedMagic Titan 16 Pro BOE CQ NE160QDM-NZ2, IPS, 2560x1600, 16", 240 Hz | Lenovo Legion Pro 5 16IRX9 G9 BOE NE160QDM-NZB, IPS, 2560x1600, 16", 240 Hz | HP Victus 16 (2024) Chi Mei CMN163E, IPS, 1920x1080, 16.1", 144 Hz | Acer Predator Helios Neo 16 (2024) Chi Mei N160GME-GTB, LED, 2560x1600, 16", 240 Hz | SCHENKER XMG Pro 16 Studio (Mid 24) BOE CQ NE160QDM-NZ1, IPS, 2560x1600, 16", 240 Hz | Gigabyte G6X 9KG (2024) BOE NE160WUM-NX6, IPS, 1920x1200, 16", 165 Hz | |
|---|---|---|---|---|---|---|
| Display | 2% | -48% | 1% | -15% | -48% | |
| Display P3 Coverage | 96.3 | 99.22 3% | 41.3 -57% | 95.9 0% | 68.8 -29% | 41.8 -57% |
| sRGB Coverage | 100 | 99.93 0% | 61.7 -38% | 99.8 0% | 99.5 0% | 62.4 -38% |
| AdobeRGB 1998 Coverage | 84.1 | 87.81 4% | 42.7 -49% | 86.4 3% | 70.8 -16% | 43.3 -49% |
| Response Times | -54% | -454% | -52% | -126% | -635% | |
| Response Time Grey 50% / Grey 80% * | 3.9 ? | 4.8 ? -23% | 28.6 ? -633% | 5 ? -28% | 12.7 ? -226% | 40.5 ? -938% |
| Response Time Black / White * | 5 ? | 9.2 ? -84% | 18.7 ? -274% | 8.8 ? -76% | 6.3 ? -26% | 21.6 ? -332% |
| PWM Frequency | ||||||
| Screen | 4% | -74% | 18% | -2% | -68% | |
| Brightness middle | 543 | 518 -5% | 287 -47% | 521 -4% | 416 -23% | 353 -35% |
| Brightness | 516 | 491 -5% | 288 -44% | 506 -2% | 392 -24% | 318 -38% |
| Brightness Distribution | 86 | 90 5% | 86 0% | 85 -1% | 86 0% | 81 -6% |
| Black Level * | 0.51 | 0.36 29% | 0.19 63% | 0.44 14% | 0.38 25% | 0.21 59% |
| Contrast | 1065 | 1439 35% | 1511 42% | 1184 11% | 1095 3% | 1681 58% |
| Colorchecker dE 2000 * | 3.19 | 4.32 -35% | 5.46 -71% | 1.74 45% | 2.33 27% | 5.21 -63% |
| Colorchecker dE 2000 max. * | 7.09 | 6.37 10% | 20.36 -187% | 3.88 45% | 6.07 14% | 19.95 -181% |
| Colorchecker dE 2000 calibrated * | 0.69 | 0.75 -9% | 3.52 -410% | 0.52 25% | 1.02 -48% | 3.61 -423% |
| Greyscale dE 2000 * | 4.2 | 3.66 13% | 4.8 -14% | 3 29% | 3.7 12% | 3.6 14% |
| Gamma | 1.999 110% | 2.19 100% | 2.108 104% | 2.164 102% | 2.161 102% | 2.367 93% |
| CCT | 7431 87% | 6841 95% | 6442 101% | 6816 95% | 7102 92% | 7138 91% |
| Media totale (Programma / Settaggio) | -16% /
-4% | -192% /
-123% | -11% /
4% | -48% /
-22% | -250% /
-145% |
* ... Meglio usare valori piccoli
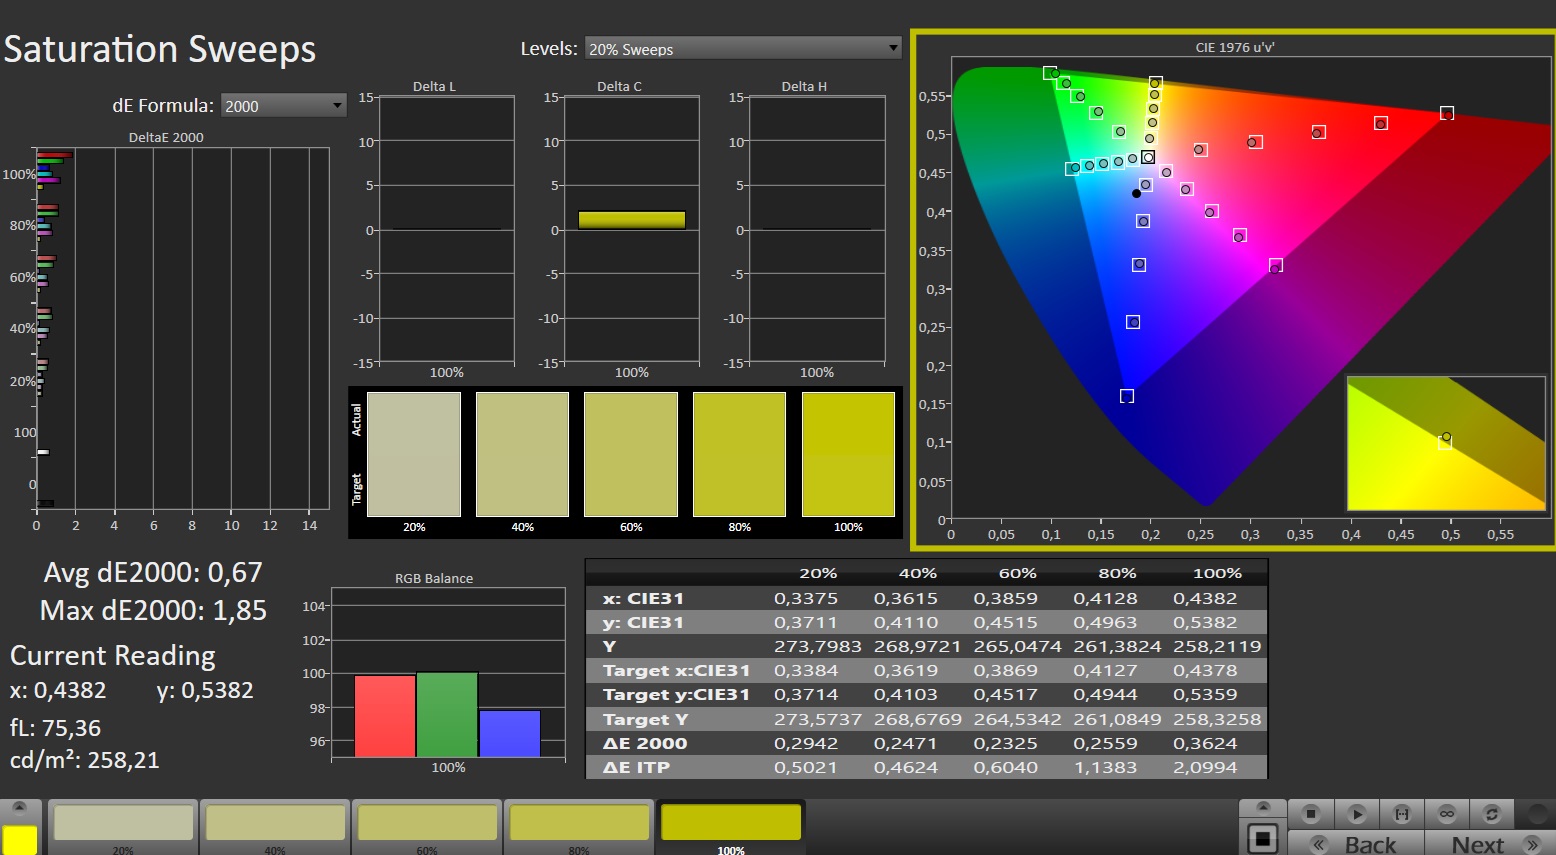
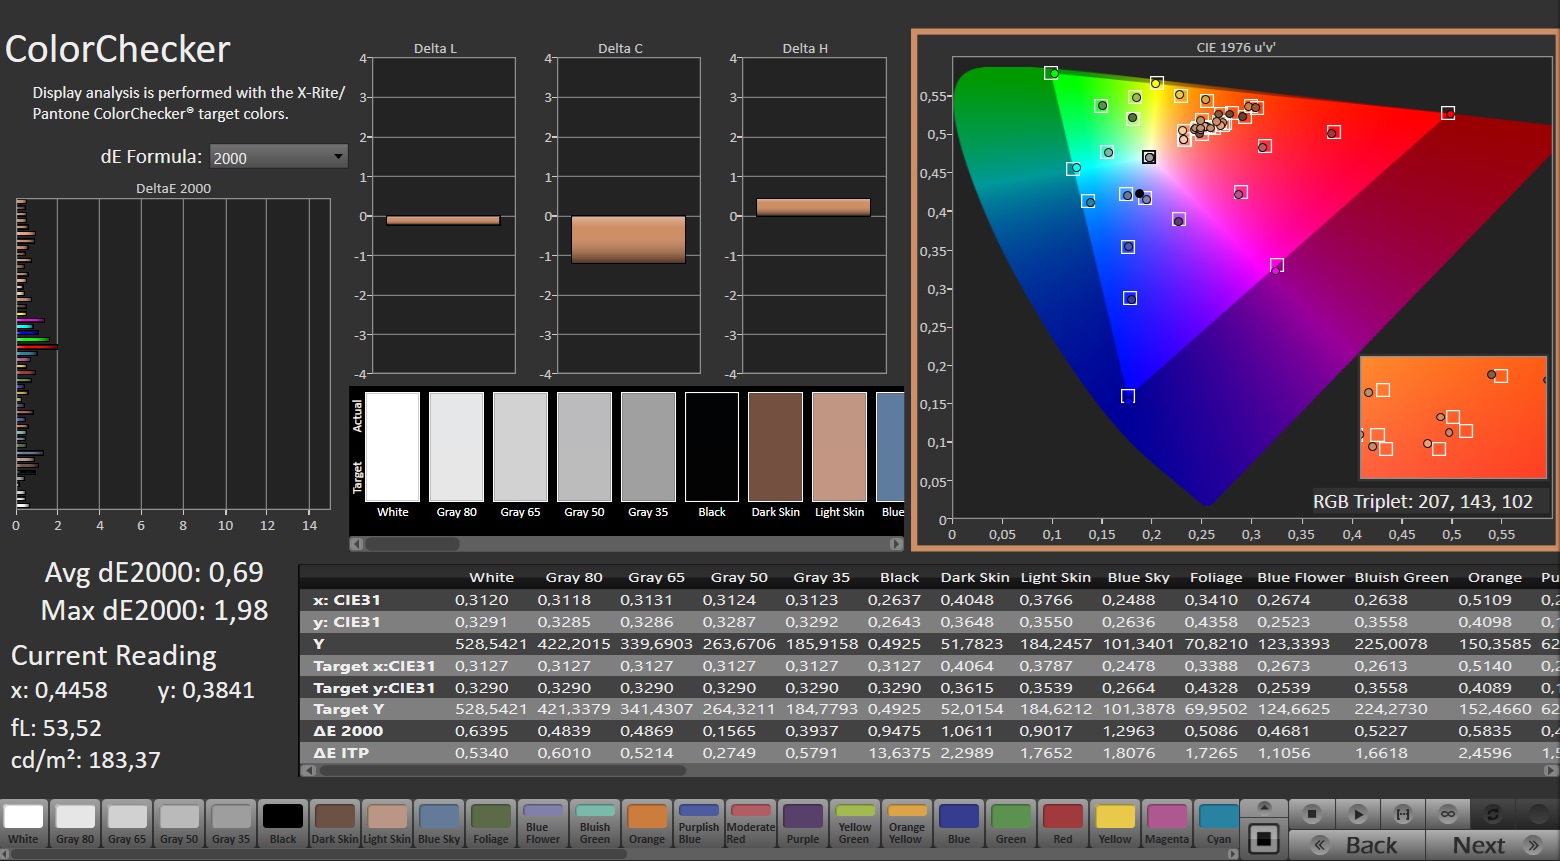
Il pannello copre completamente o quasi gli spazi cromatici sRGB e DCI-P3, ma non lo spazio AdobeRGB: questo è simile agli schermi della maggior parte dei concorrenti. La sua riproduzione cromatica decente, appena uscita dalla scatola, può essere aumentata fino alla gamma molto buona eseguendo una calibrazione: In questo caso, la sua deviazione del colore scende da 3,19 a 0,69 (obiettivo: DeltaE < 3). Allo stesso tempo, la rappresentazione della scala di grigi appare molto più equilibrata.
Il nostro profilo di colore può essere scaricato e utilizzato gratuitamente. Il link si trova nella casella informativa del display.

Tempi di risposta del Display
| ↔ Tempi di risposta dal Nero al Bianco | ||
|---|---|---|
| 5 ms ... aumenta ↗ e diminuisce ↘ combinato | ↗ 1.2 ms Incremento | 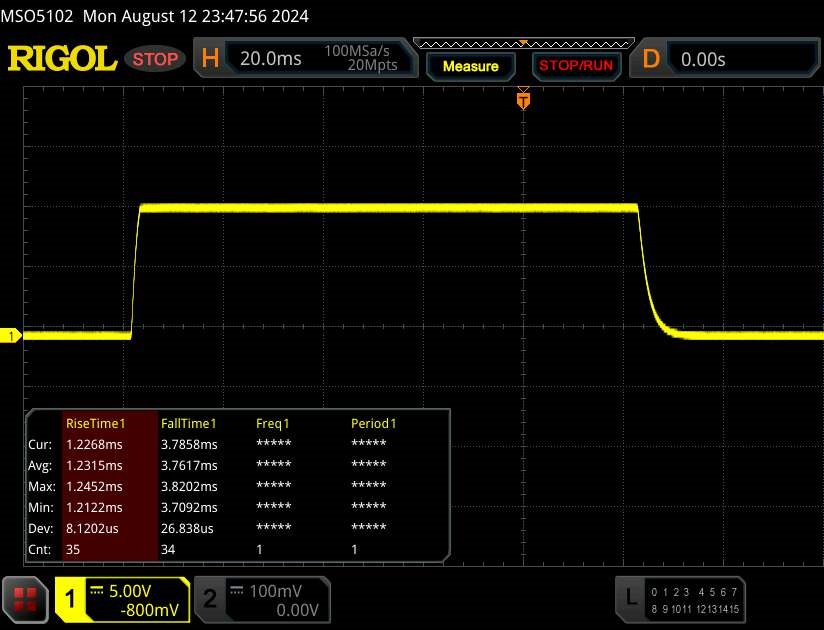 |
| ↘ 3.8 ms Calo | ||
| Lo schermo ha mostrato valori di risposta molto veloci nei nostri tests ed è molto adatto per i gaming veloce. In confronto, tutti i dispositivi di test variano da 0.1 (minimo) a 240 (massimo) ms. » 15 % di tutti i dispositivi è migliore. Questo significa che i tempi di risposta rilevati sono migliori rispettto alla media di tutti i dispositivi testati (20.8 ms). | ||
| ↔ Tempo di risposta dal 50% Grigio all'80% Grigio | ||
| 3.9 ms ... aumenta ↗ e diminuisce ↘ combinato | ↗ 1.7 ms Incremento | 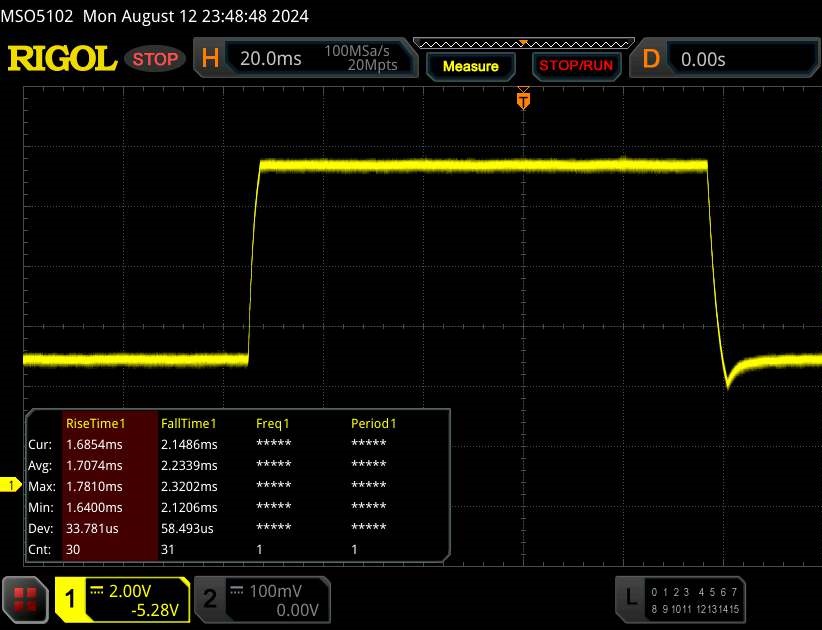 |
| ↘ 2.2 ms Calo | ||
| Lo schermo ha mostrato valori di risposta molto veloci nei nostri tests ed è molto adatto per i gaming veloce. In confronto, tutti i dispositivi di test variano da 0.165 (minimo) a 636 (massimo) ms. » 12 % di tutti i dispositivi è migliore. Questo significa che i tempi di risposta rilevati sono migliori rispettto alla media di tutti i dispositivi testati (32.5 ms). | ||
Sfarfallio dello schermo / PWM (Pulse-Width Modulation)
| flickering dello schermo / PWM non rilevato | 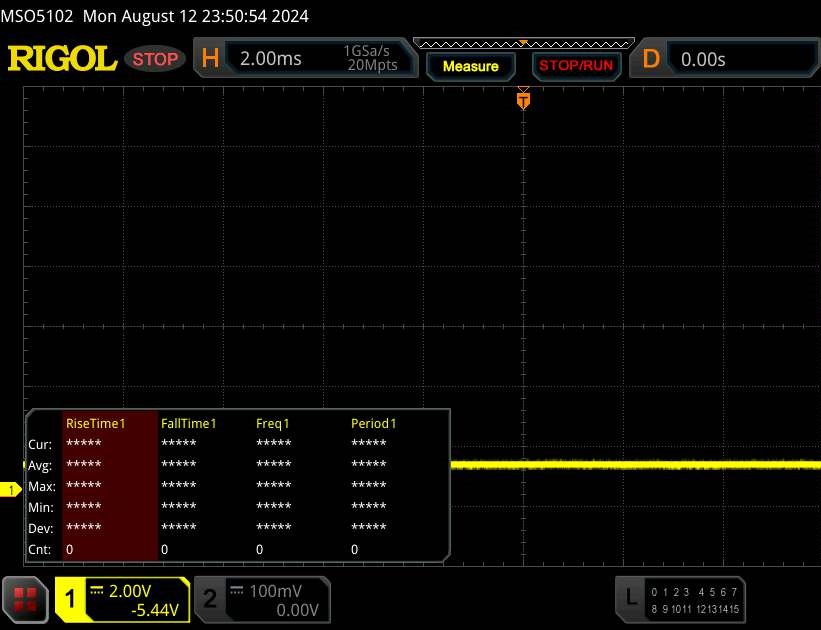 | ||
In confronto: 53 % di tutti i dispositivi testati non utilizza PWM per ridurre la luminosita' del display. Se è rilevato PWM, una media di 8516 (minimo: 5 - massimo: 343500) Hz è stata rilevata. | |||
Prestazioni - Raptor Lake e Ada Lovelace alimentano il computer portatile
La Titan 16 Pro si rivolge ai giocatori e ai creatori, ma probabilmente si concentra sui primi. A Core i9-14900HX e una GeForce RTX 4060 alimentano il portatile. Il suo MRSP è di 1.699 dollari. Nubia offre altre varianti di questo dispositivo, ma non sono ancora disponibili a livello globale.
Condizioni di test
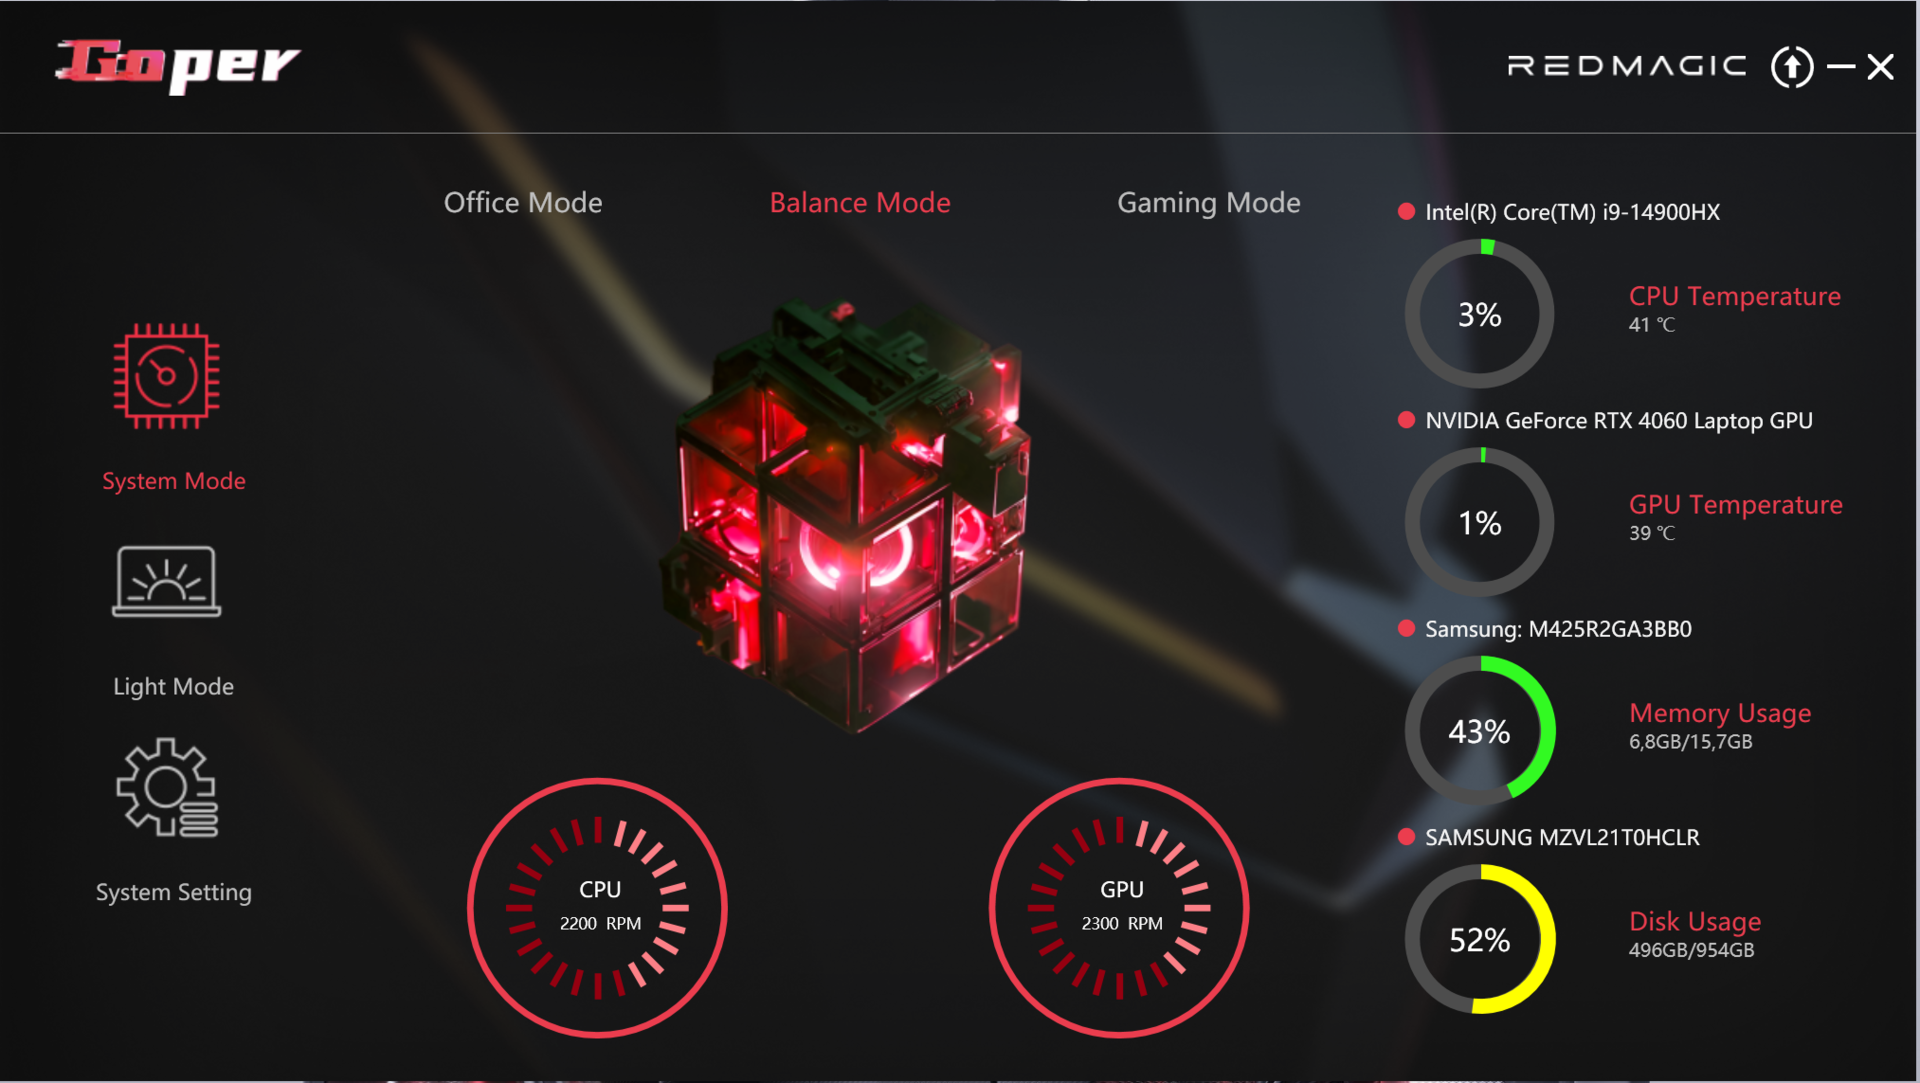
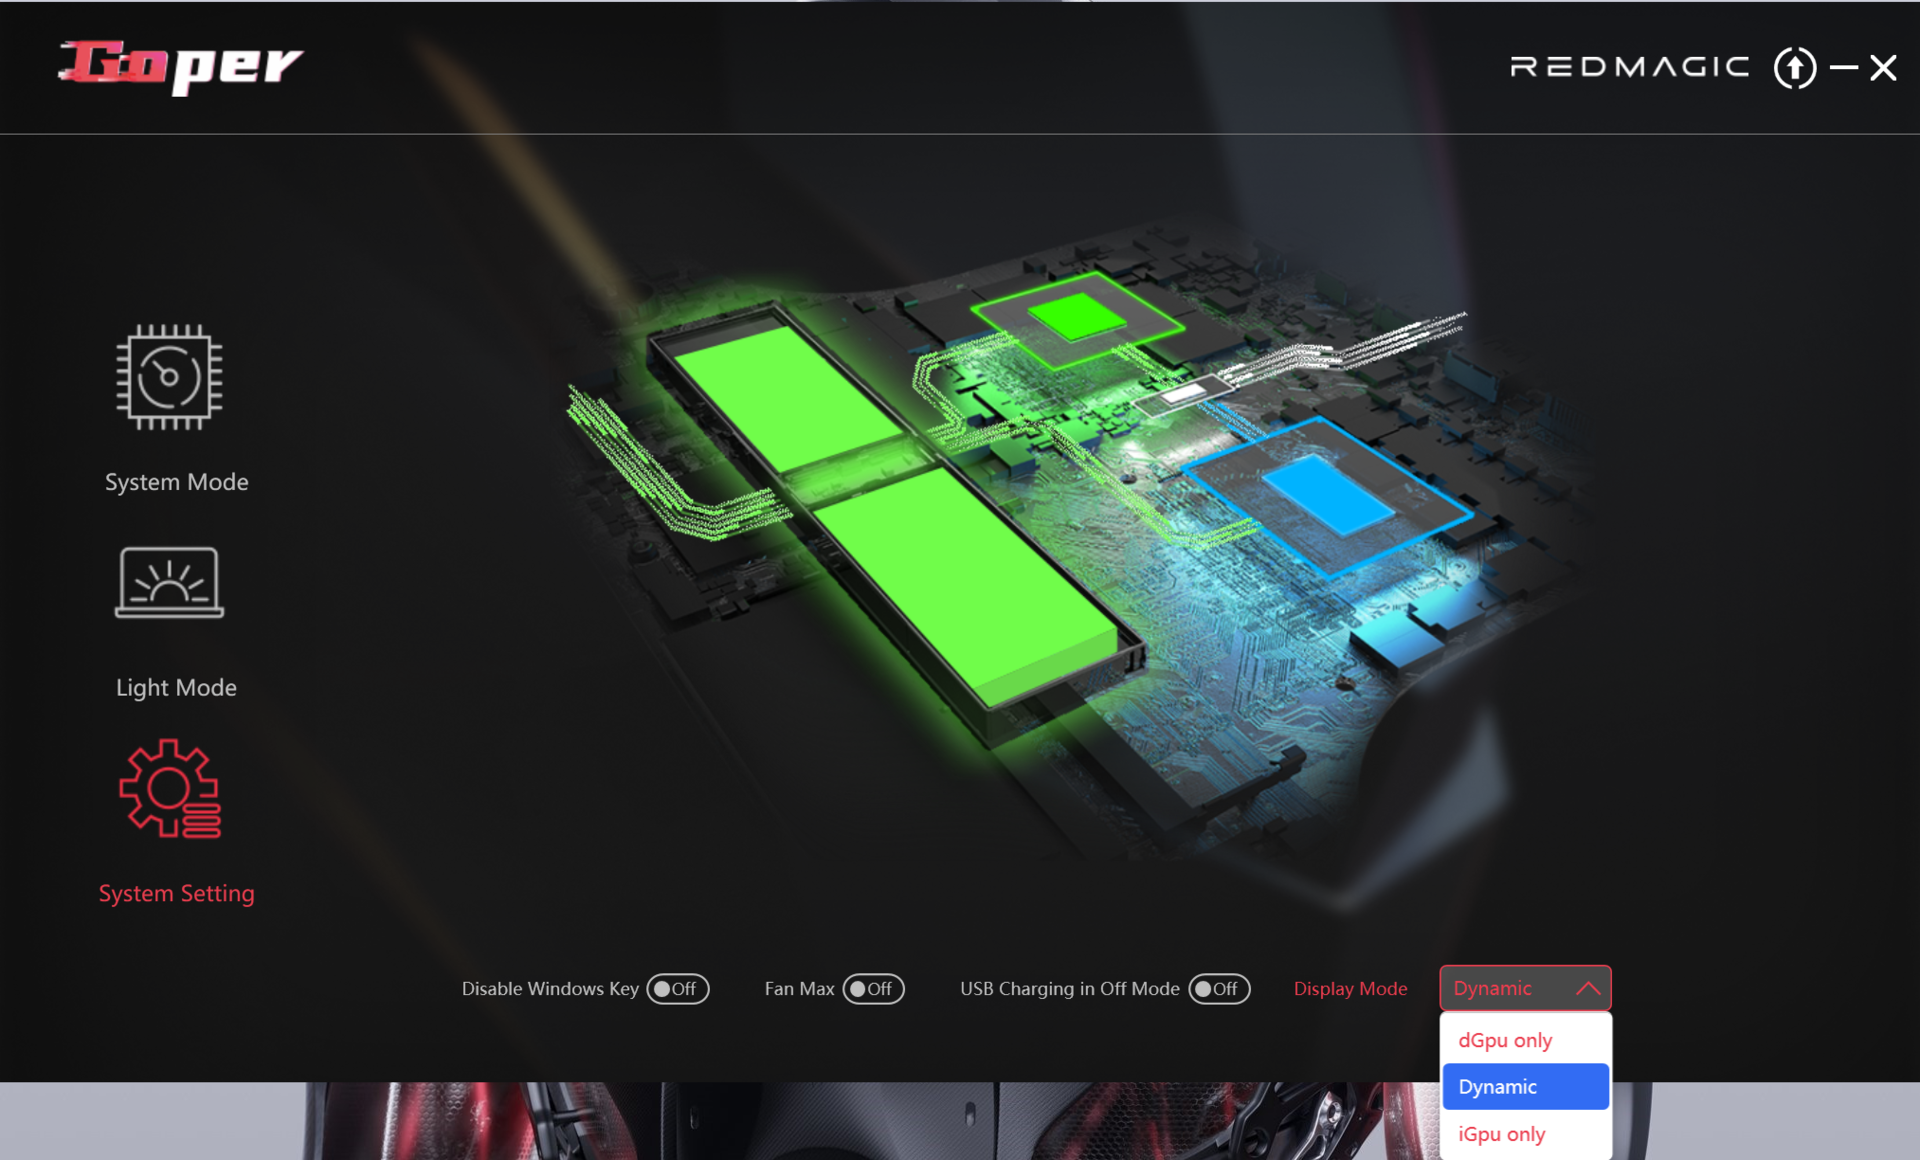
È possibile scegliere tra tre profili di prestazioni specifici del produttore (vedere tabella). Durante il nostro test sono state utilizzate la modalità bilanciata (benchmark) e la modalità ufficio (test della batteria). La modalità GPU era impostata su dinamica (= Optimus). Ogni profilo può essere richiamato direttamente tramite un tasto separato nella riga superiore del tastierino numerico. In alternativa, può cambiarli tramite l'applicazione Goper (centro di controllo del portatile).
| Modalità bilanciata | Modalità gioco | Modalità ufficio | |
|---|---|---|---|
| Limite di potenza 1 (HWInfo) | 45 watt | 100 watt | 35 watt |
| Limite di potenza 2 (HWInfo) | 140 watt | 140 watt | 140 watt |
| Rumore (Cyberpunk 2077) | 50 dB(A) | 53 dB(A) | 47 dB(A) |
| Prestazioni (Cyberpunk 2077) | 66 fps | 66 fps | 60 fps |
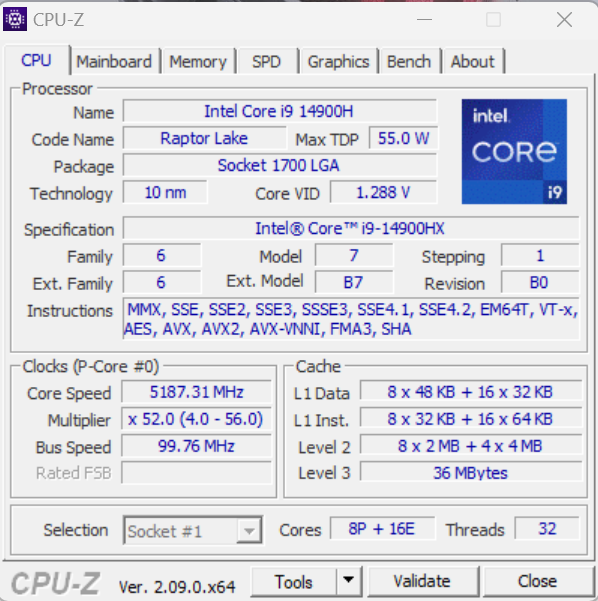
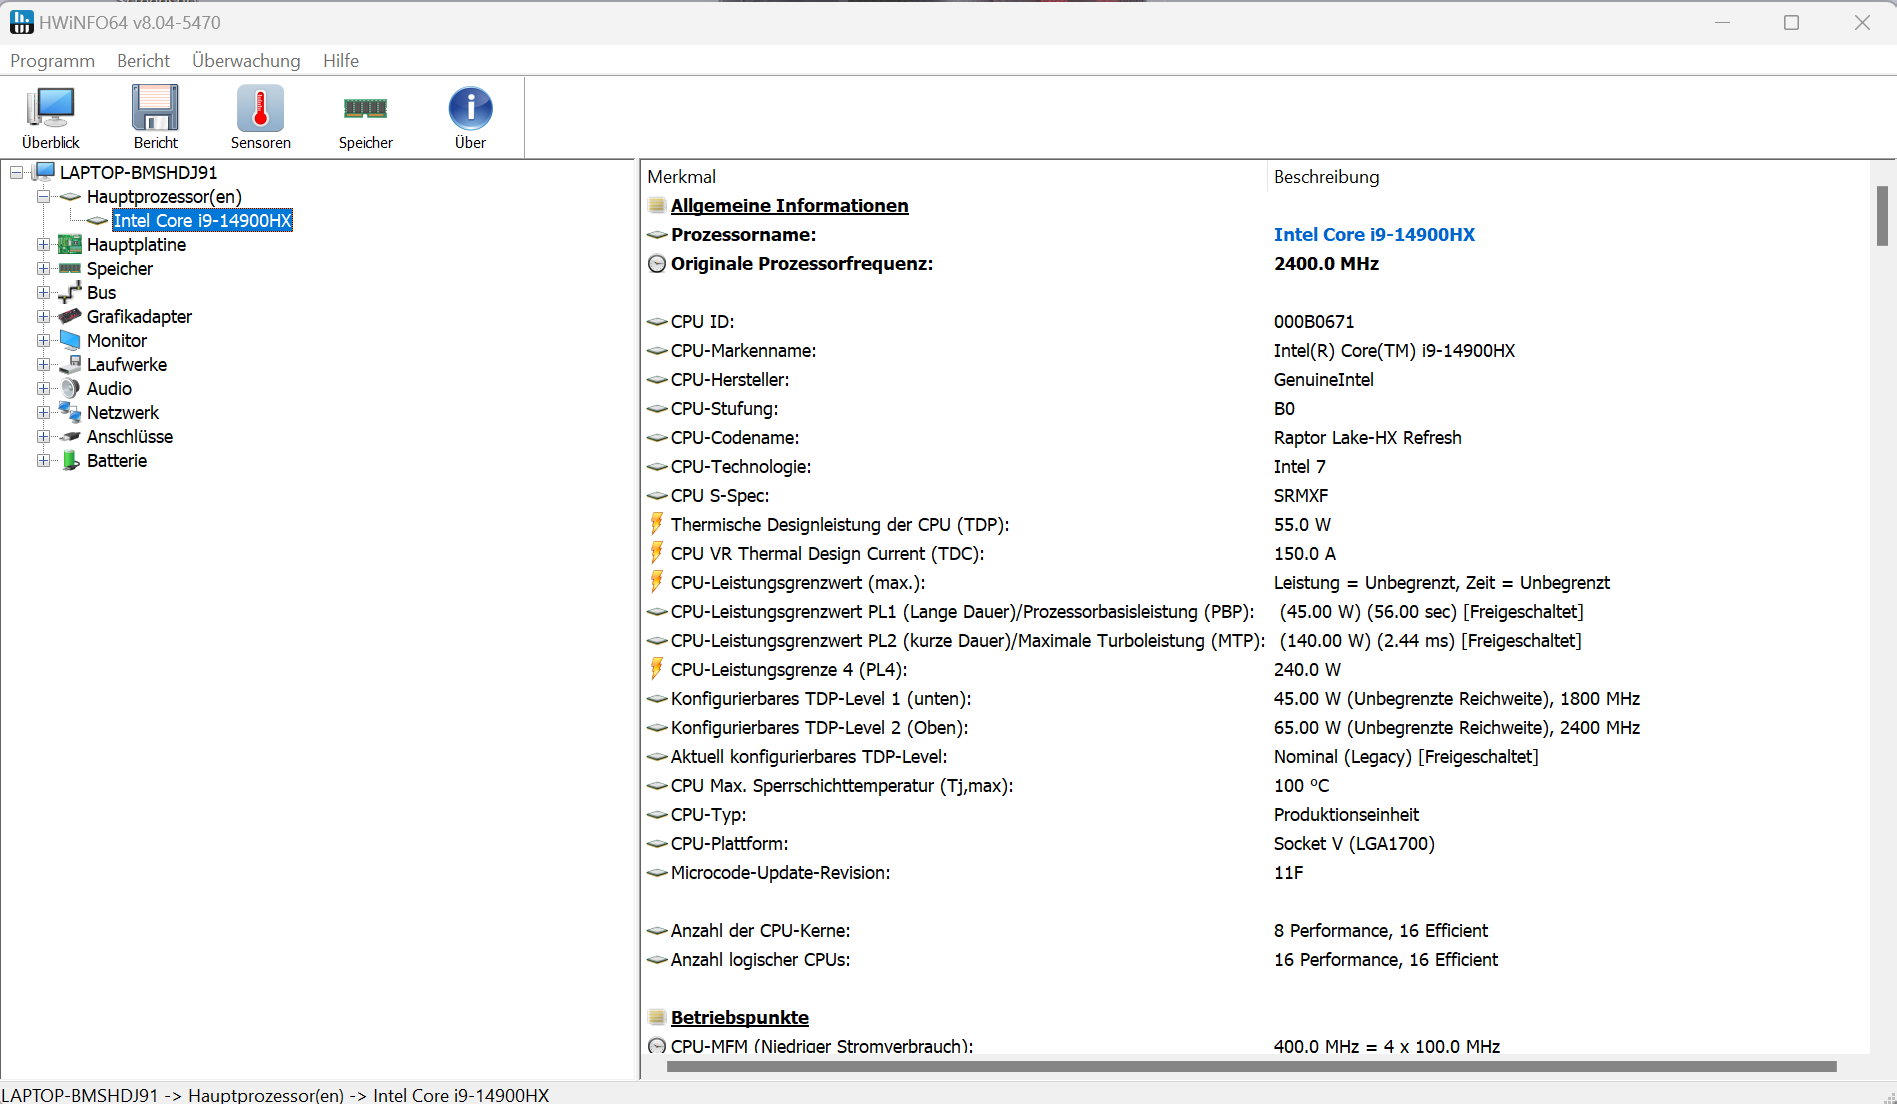
Processore
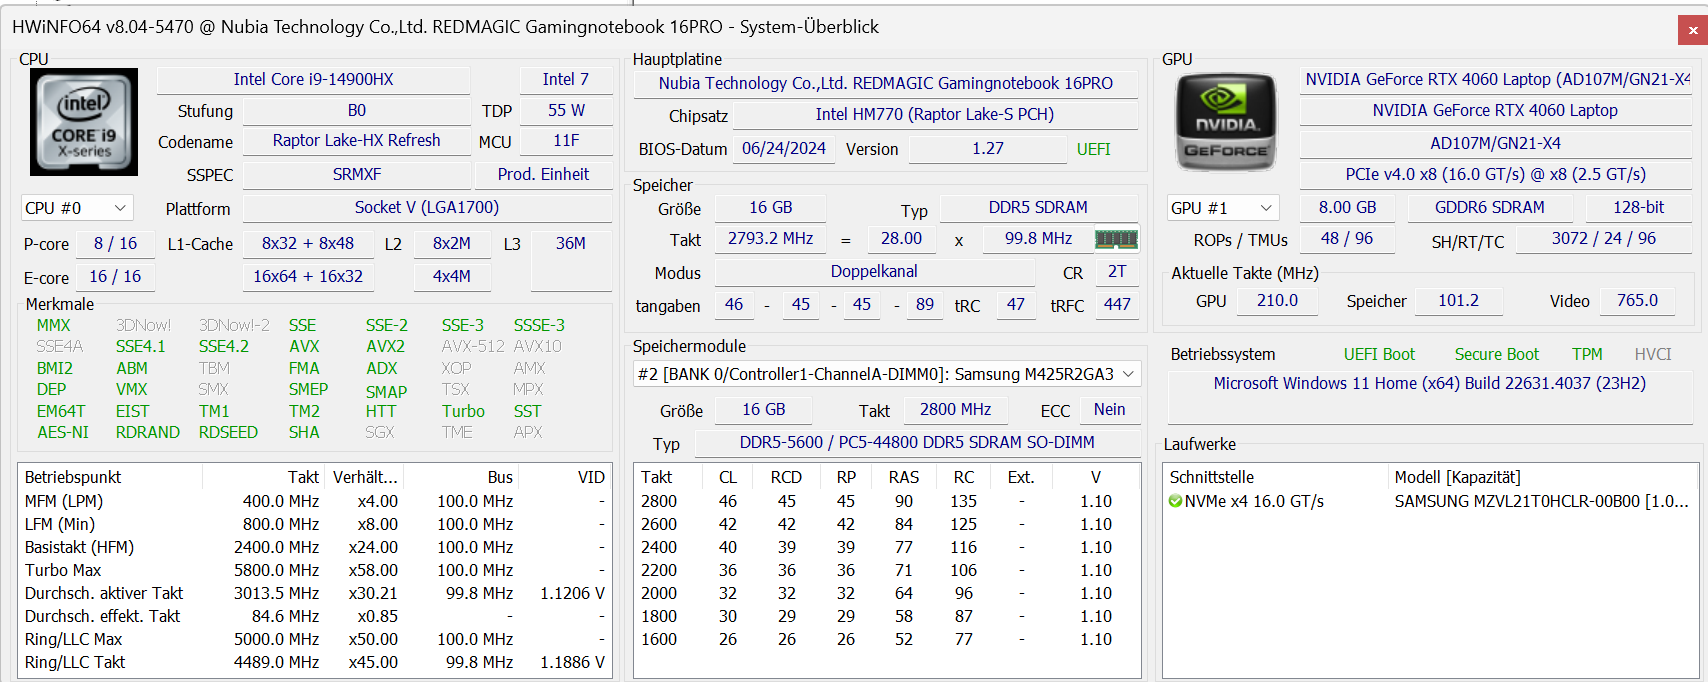
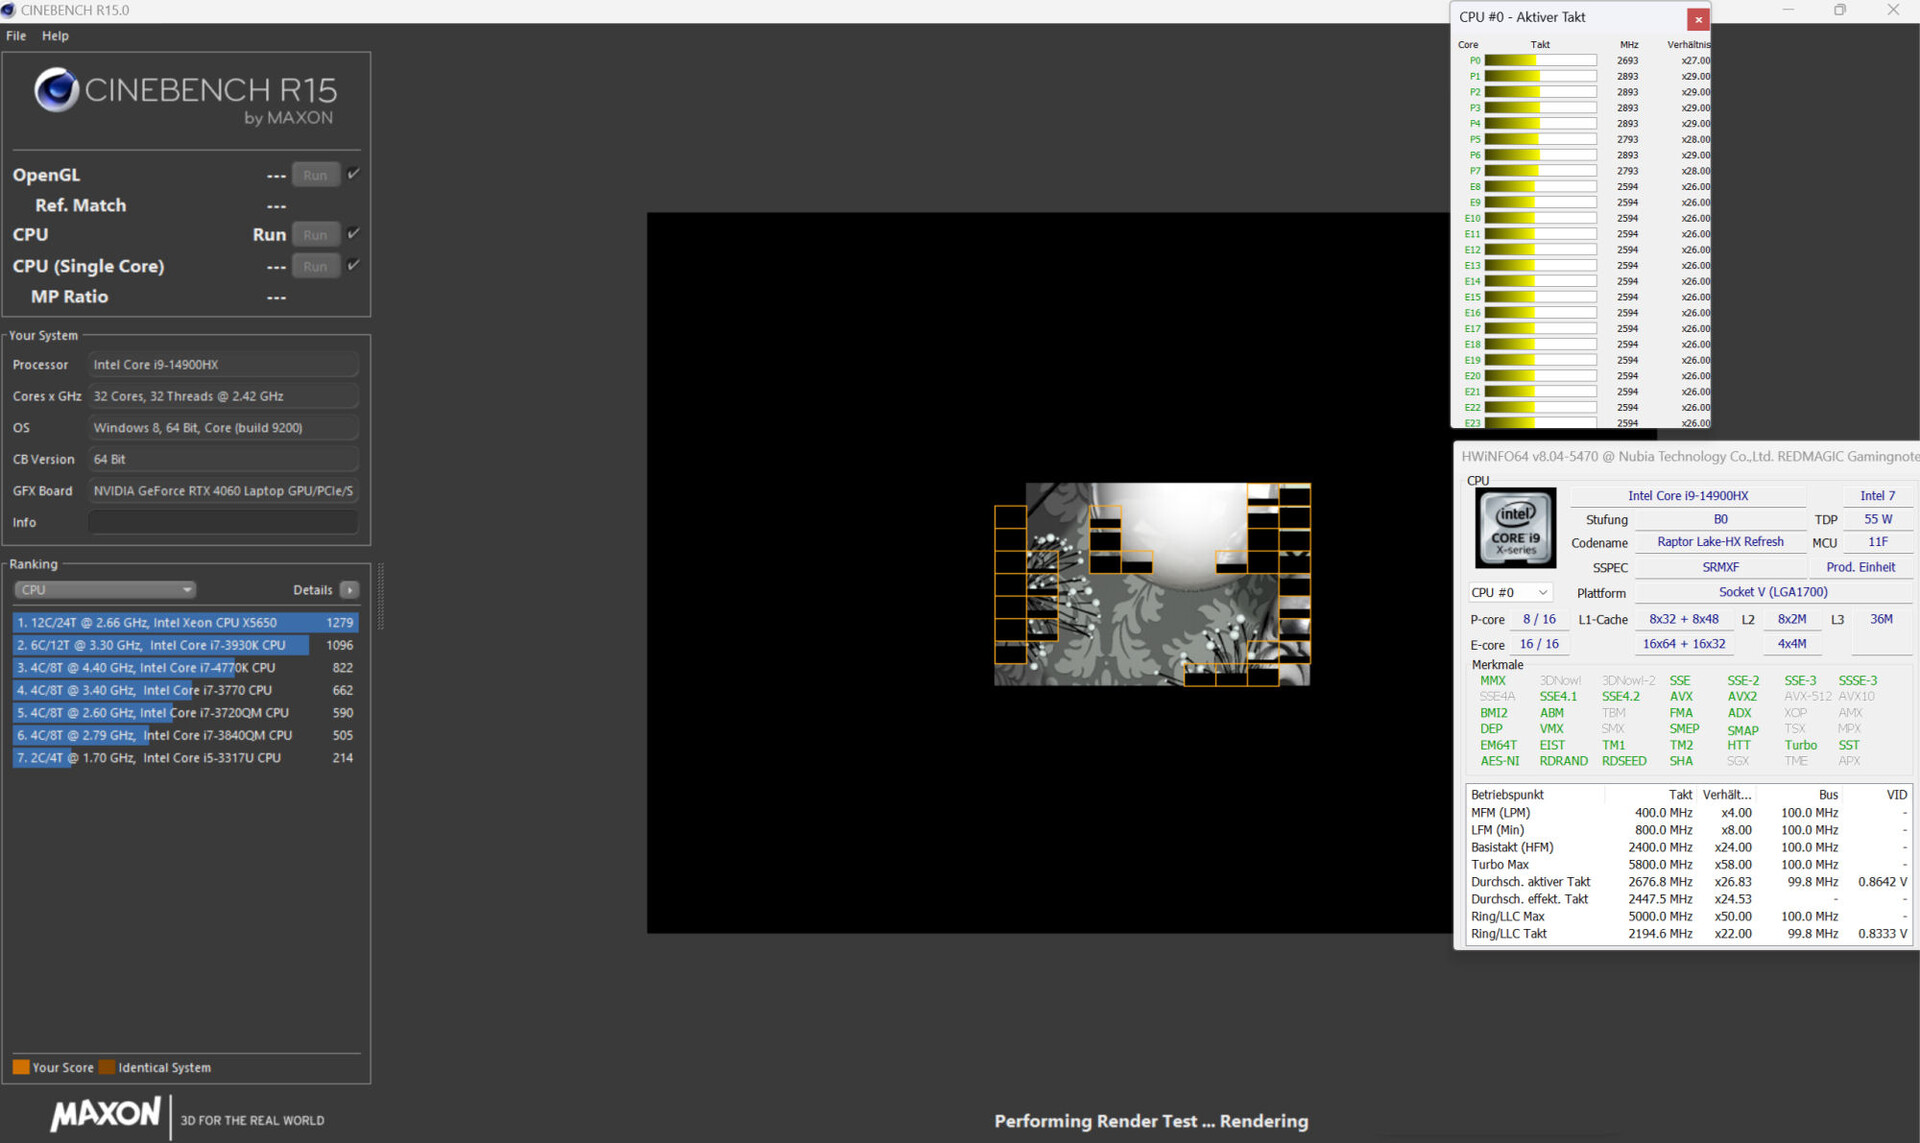
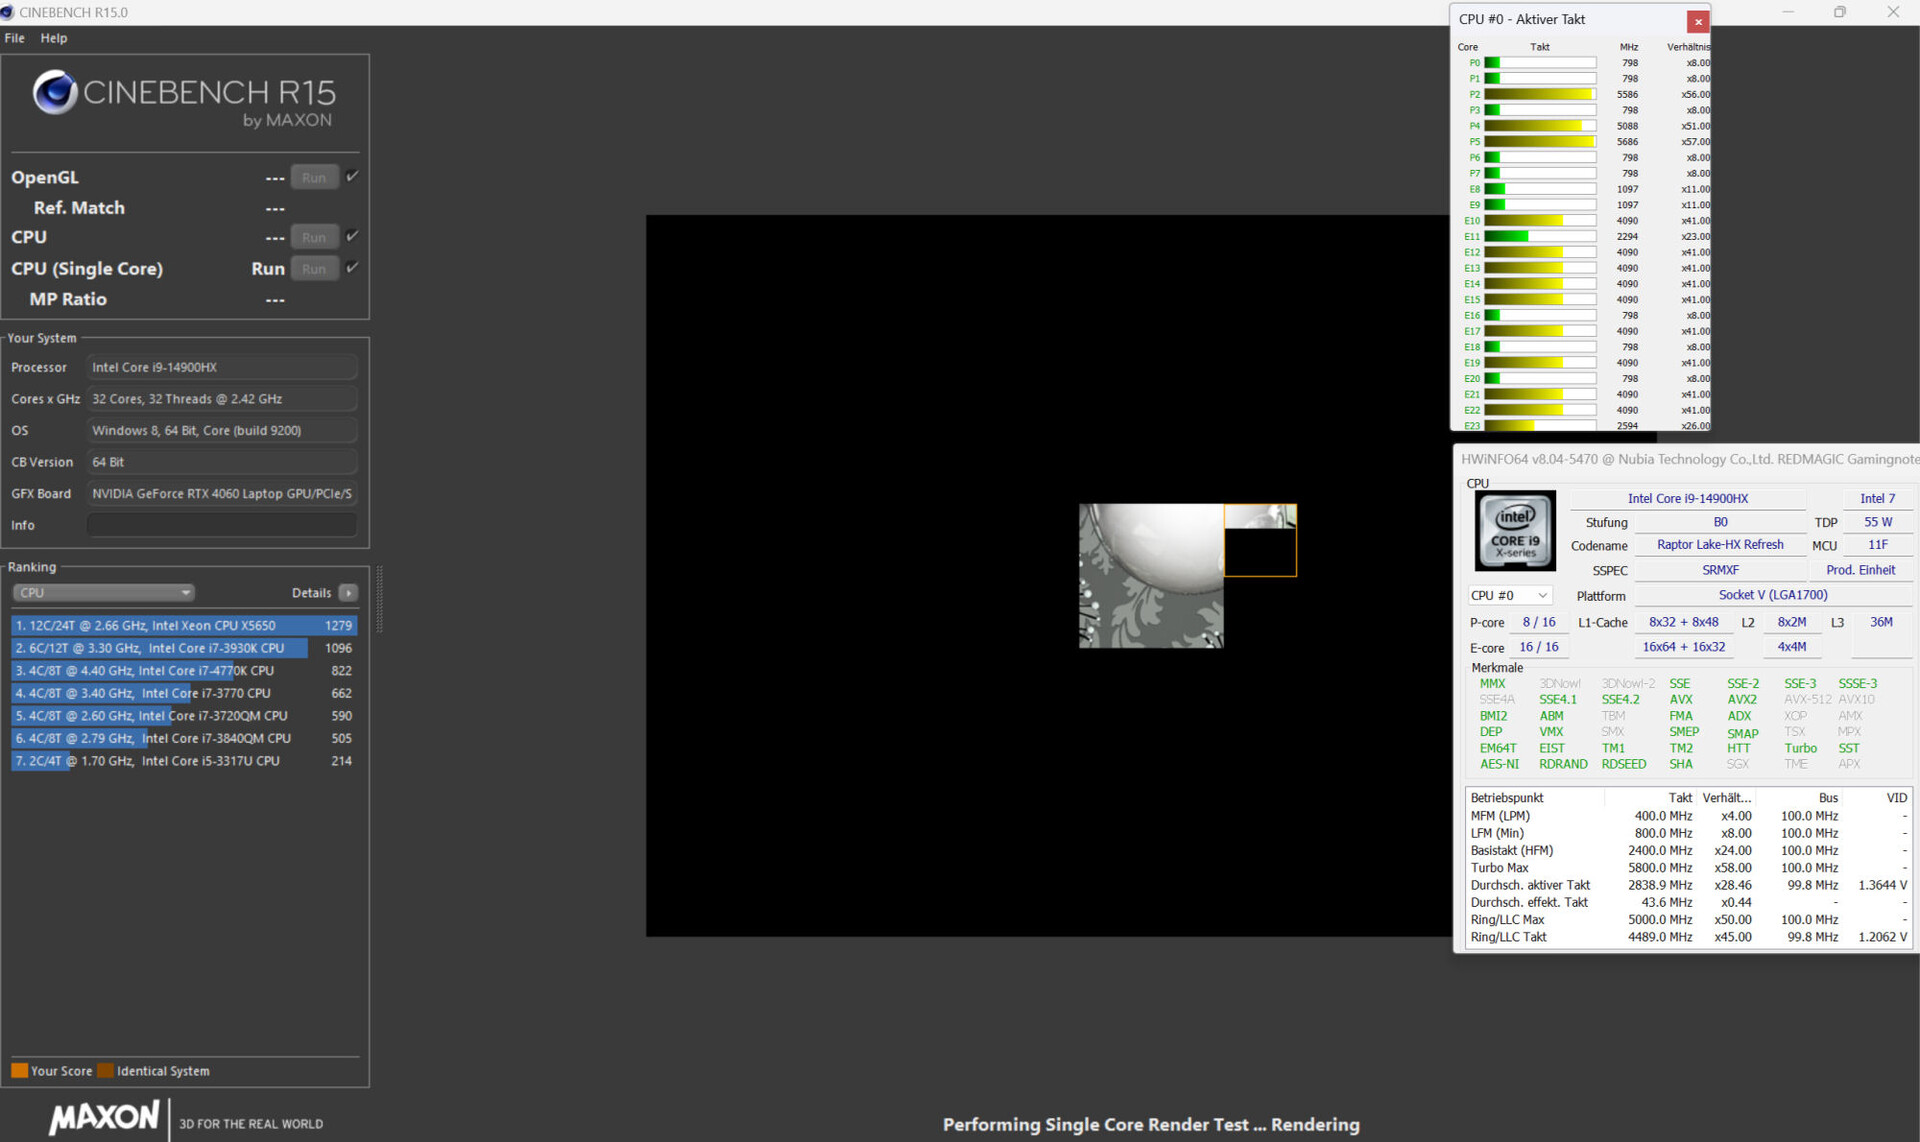
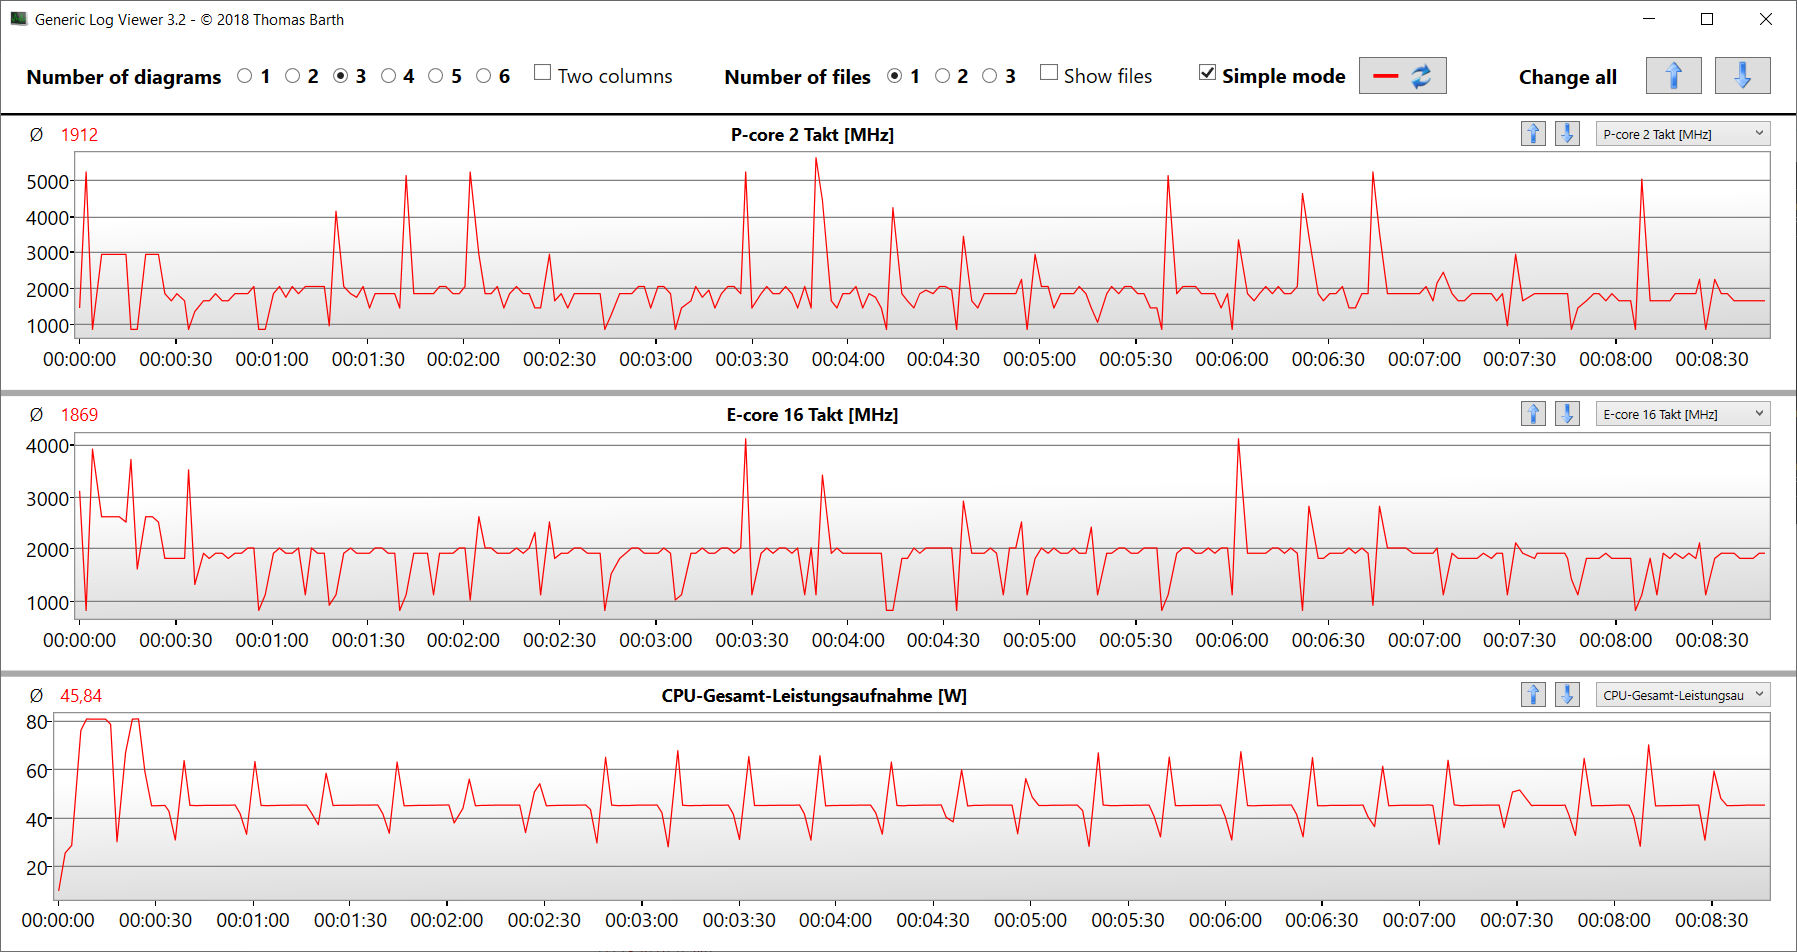
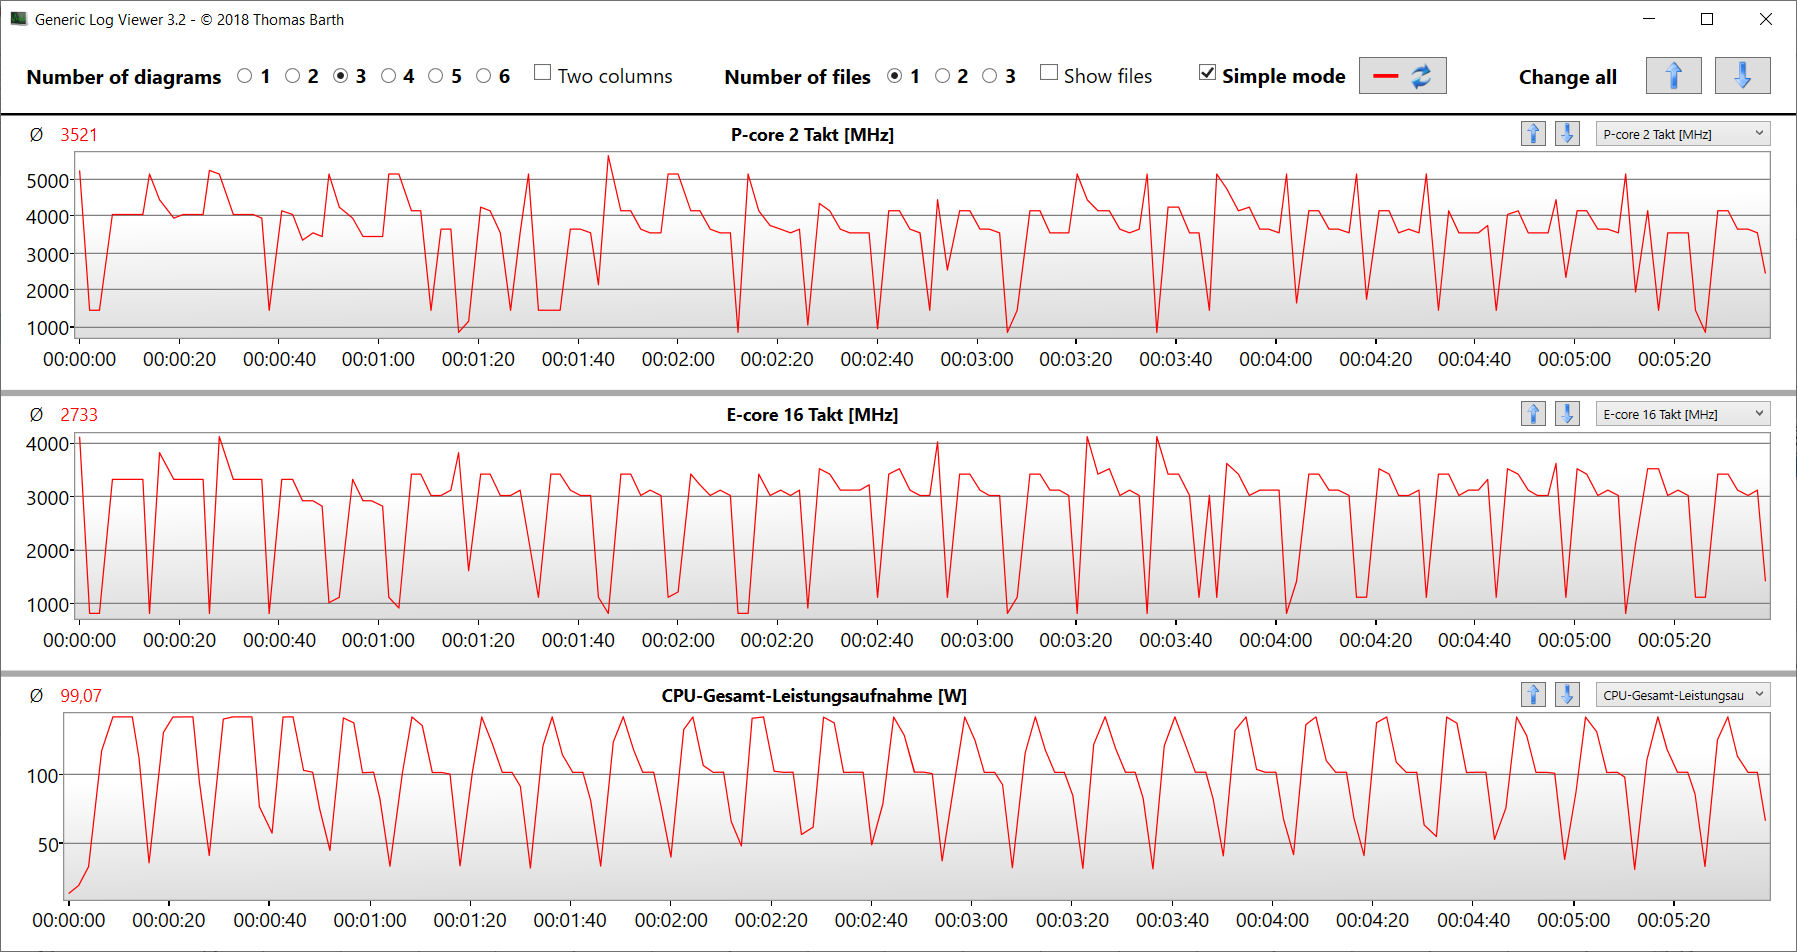
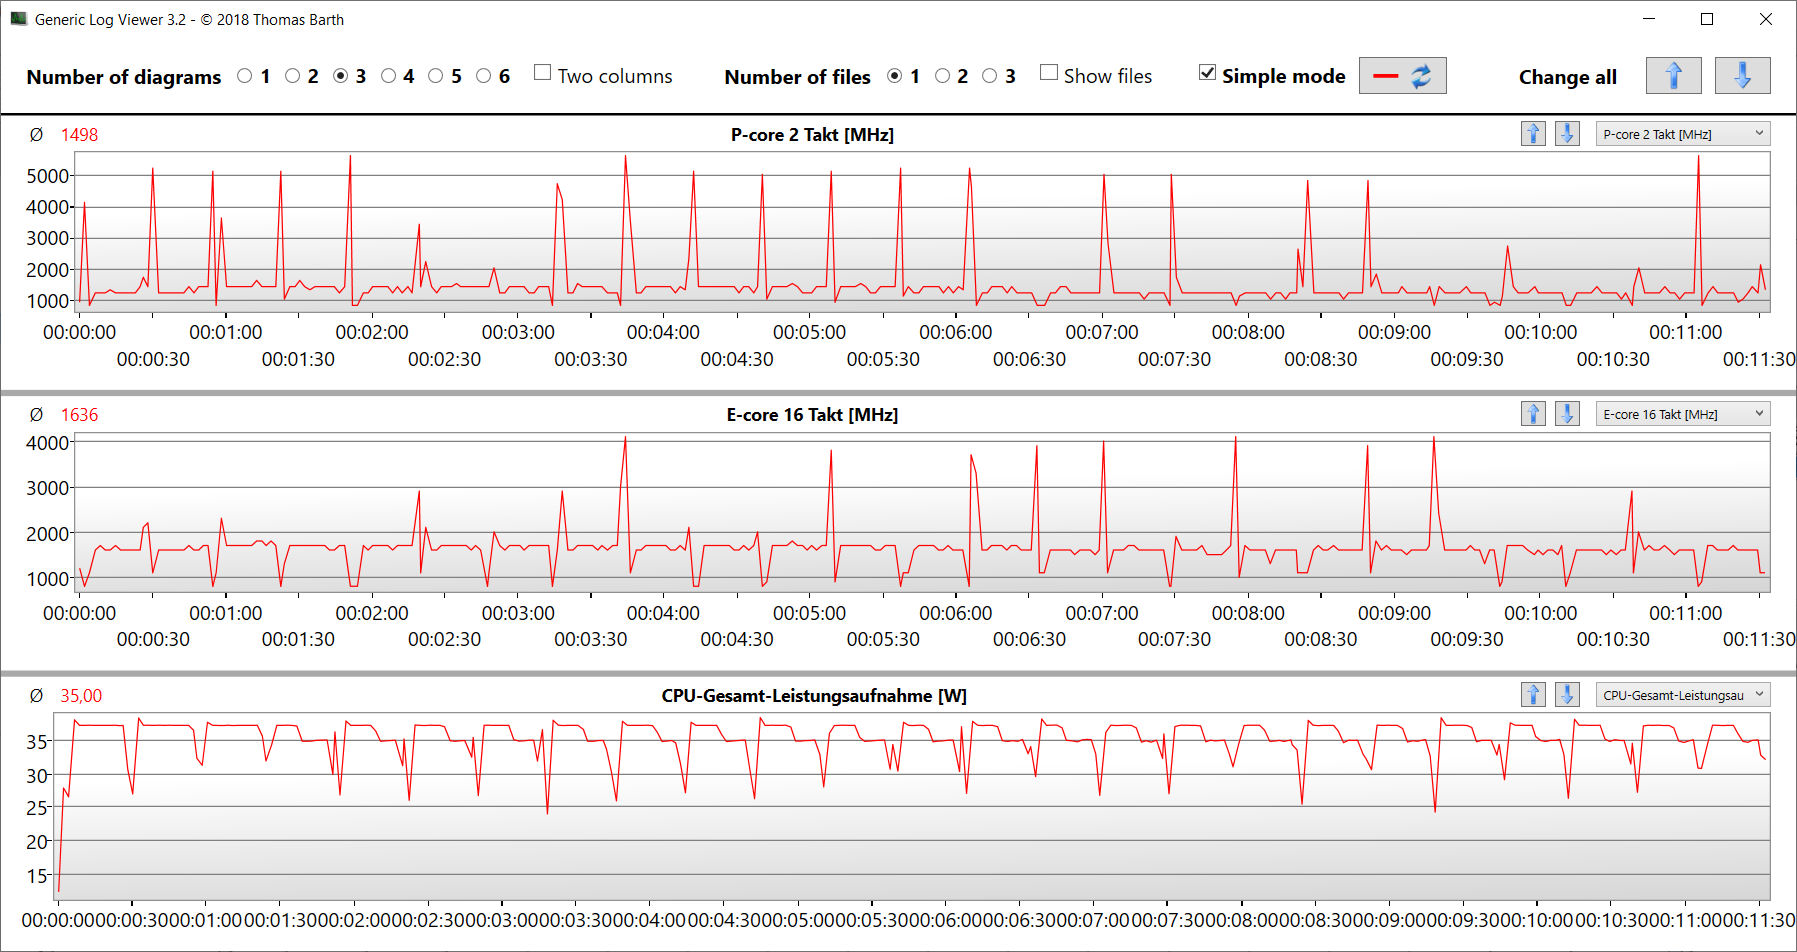
La Titan ha solo un'opzione di CPU disponibile, ovvero il Core i9-14900HX (Raptor Lake). I suoi 24 core della CPU (8P + 16E = 32 thread) raggiungono velocità di clock massime di 5,8 GHz (P) e 4,1 GHz (E). Il carico continuo multi-thread (ciclo CB15) ha fatto sì che il clock della CPU scendesse in modo significativo dalla prima alla terza esecuzione. Successivamente, è stato mantenuto un livello abbastanza costante. Il profilo della modalità gaming assicura un livello di prestazioni significativamente più elevato.
Le tre modalità di alimentazione offrono prestazioni single-thread molto simili, circa allo stesso livello della media della CPU. Le prestazioni multi-thread differiscono in misura molto maggiore: Solo la modalità gaming ha prodotto valori al livello della media della CPU durante il nostro test, mentre le altre due modalità erano significativamente inferiori.
Maggiori informazioni sul Core i9 sono disponibili nel nostro articolo di analisi.
Cinebench R15 Multi continuous test
| CPU Performance Rating - Percent | |
| Media Intel Core i9-14900HX | |
| Lenovo Legion Pro 5 16IRX9 G9 | |
| Nubia RedMagic Titan 16 Pro | |
| SCHENKER XMG Pro 16 Studio (Mid 24) | |
| Acer Predator Helios Neo 16 (2024) | |
| Nubia RedMagic Titan 16 Pro | |
| Media della classe Gaming | |
| HP Victus 16 (2024) | |
| Gigabyte G6X 9KG (2024) | |
| Cinebench R20 | |
| CPU (Multi Core) | |
| Nubia RedMagic Titan 16 Pro (Gaming Mode) | |
| Media Intel Core i9-14900HX (6579 - 13832, n=37) | |
| Lenovo Legion Pro 5 16IRX9 G9 | |
| SCHENKER XMG Pro 16 Studio (Mid 24) | |
| HP Victus 16 (2024) | |
| Acer Predator Helios Neo 16 (2024) | |
| Media della classe Gaming (2179 - 15517, n=151, ultimi 2 anni) | |
| Gigabyte G6X 9KG (2024) | |
| Nubia RedMagic Titan 16 Pro | |
| CPU (Single Core) | |
| Nubia RedMagic Titan 16 Pro | |
| Media Intel Core i9-14900HX (657 - 859, n=37) | |
| Lenovo Legion Pro 5 16IRX9 G9 | |
| Nubia RedMagic Titan 16 Pro (Gaming Mode) | |
| Acer Predator Helios Neo 16 (2024) | |
| SCHENKER XMG Pro 16 Studio (Mid 24) | |
| Media della classe Gaming (439 - 866, n=151, ultimi 2 anni) | |
| Gigabyte G6X 9KG (2024) | |
| HP Victus 16 (2024) | |
| Cinebench R15 | |
| CPU Multi 64Bit | |
| Nubia RedMagic Titan 16 Pro (Gaming Mode) | |
| Media Intel Core i9-14900HX (3263 - 5589, n=38) | |
| SCHENKER XMG Pro 16 Studio (Mid 24) | |
| Lenovo Legion Pro 5 16IRX9 G9 | |
| HP Victus 16 (2024) | |
| Acer Predator Helios Neo 16 (2024) | |
| Nubia RedMagic Titan 16 Pro | |
| Media della classe Gaming (905 - 6074, n=154, ultimi 2 anni) | |
| Gigabyte G6X 9KG (2024) | |
| CPU Single 64Bit | |
| Nubia RedMagic Titan 16 Pro | |
| Nubia RedMagic Titan 16 Pro (Gaming Mode) | |
| Media Intel Core i9-14900HX (247 - 323, n=37) | |
| Lenovo Legion Pro 5 16IRX9 G9 | |
| Acer Predator Helios Neo 16 (2024) | |
| SCHENKER XMG Pro 16 Studio (Mid 24) | |
| Media della classe Gaming (191.9 - 343, n=151, ultimi 2 anni) | |
| Gigabyte G6X 9KG (2024) | |
| HP Victus 16 (2024) | |
| Blender - v2.79 BMW27 CPU | |
| Gigabyte G6X 9KG (2024) | |
| Nubia RedMagic Titan 16 Pro | |
| Media della classe Gaming (81 - 555, n=144, ultimi 2 anni) | |
| HP Victus 16 (2024) | |
| Acer Predator Helios Neo 16 (2024) | |
| SCHENKER XMG Pro 16 Studio (Mid 24) | |
| Nubia RedMagic Titan 16 Pro (Gaming Mode) | |
| Lenovo Legion Pro 5 16IRX9 G9 | |
| Media Intel Core i9-14900HX (91 - 206, n=37) | |
| Geekbench 6.4 | |
| Multi-Core | |
| Lenovo Legion Pro 5 16IRX9 G9 (6.2.1) | |
| Media Intel Core i9-14900HX (13158 - 19665, n=37) | |
| Acer Predator Helios Neo 16 (2024) (6.2.1) | |
| SCHENKER XMG Pro 16 Studio (Mid 24) (6.2.1) | |
| HP Victus 16 (2024) (6.2.1) | |
| Nubia RedMagic Titan 16 Pro (6.2.1, Gaming Mode) | |
| Media della classe Gaming (5340 - 21668, n=119, ultimi 2 anni) | |
| Gigabyte G6X 9KG (2024) (6.2.1) | |
| Nubia RedMagic Titan 16 Pro (6.2.1) | |
| Single-Core | |
| Nubia RedMagic Titan 16 Pro (6.2.1) | |
| Nubia RedMagic Titan 16 Pro (6.2.1, Gaming Mode) | |
| Acer Predator Helios Neo 16 (2024) (6.2.1) | |
| Media Intel Core i9-14900HX (2419 - 3129, n=37) | |
| Lenovo Legion Pro 5 16IRX9 G9 (6.2.1) | |
| SCHENKER XMG Pro 16 Studio (Mid 24) (6.2.1) | |
| Media della classe Gaming (1490 - 3219, n=119, ultimi 2 anni) | |
| Gigabyte G6X 9KG (2024) (6.2.1) | |
| HP Victus 16 (2024) (6.2.1) | |
| HWBOT x265 Benchmark v2.2 - 4k Preset | |
| Nubia RedMagic Titan 16 Pro (Gaming Mode) | |
| Media Intel Core i9-14900HX (16.8 - 38.9, n=37) | |
| Lenovo Legion Pro 5 16IRX9 G9 | |
| SCHENKER XMG Pro 16 Studio (Mid 24) | |
| Acer Predator Helios Neo 16 (2024) | |
| Media della classe Gaming (6.72 - 42.9, n=148, ultimi 2 anni) | |
| HP Victus 16 (2024) | |
| Gigabyte G6X 9KG (2024) | |
| Nubia RedMagic Titan 16 Pro | |
| LibreOffice - 20 Documents To PDF | |
| HP Victus 16 (2024) (6.3.4.2) | |
| Lenovo Legion Pro 5 16IRX9 G9 (6.3.4.2) | |
| Media della classe Gaming (19 - 96.6, n=147, ultimi 2 anni) | |
| SCHENKER XMG Pro 16 Studio (Mid 24) (6.3.4.2) | |
| Media Intel Core i9-14900HX (19 - 85.1, n=37) | |
| Acer Predator Helios Neo 16 (2024) (6.3.4.2) | |
| Nubia RedMagic Titan 16 Pro (6.3.4.2, Gaming Mode) | |
| Gigabyte G6X 9KG (2024) (6.3.4.2) | |
| Nubia RedMagic Titan 16 Pro (6.3.4.2) | |
| R Benchmark 2.5 - Overall mean | |
| HP Victus 16 (2024) | |
| Media della classe Gaming (0.3609 - 0.759, n=150, ultimi 2 anni) | |
| Gigabyte G6X 9KG (2024) | |
| SCHENKER XMG Pro 16 Studio (Mid 24) | |
| Lenovo Legion Pro 5 16IRX9 G9 | |
| Media Intel Core i9-14900HX (0.3604 - 0.4859, n=37) | |
| Acer Predator Helios Neo 16 (2024) | |
| Nubia RedMagic Titan 16 Pro | |
| Nubia RedMagic Titan 16 Pro (Gaming Mode) | |
* ... Meglio usare valori piccoli
AIDA64: FP32 Ray-Trace | FPU Julia | CPU SHA3 | CPU Queen | FPU SinJulia | FPU Mandel | CPU AES | CPU ZLib | FP64 Ray-Trace | CPU PhotoWorxx
| Performance Rating | |
| Media Intel Core i9-14900HX | |
| Nubia RedMagic Titan 16 Pro | |
| Lenovo Legion Pro 5 16IRX9 G9 | |
| SCHENKER XMG Pro 16 Studio (Mid 24) | |
| Acer Predator Helios Neo 16 (2024) | |
| Media della classe Gaming | |
| HP Victus 16 (2024) | |
| Nubia RedMagic Titan 16 Pro | |
| Gigabyte G6X 9KG (2024) | |
| AIDA64 / FP32 Ray-Trace | |
| Media Intel Core i9-14900HX (13098 - 33474, n=36) | |
| Nubia RedMagic Titan 16 Pro (v6.92.6600, Gaming Mode) | |
| Lenovo Legion Pro 5 16IRX9 G9 (v6.92.6600) | |
| Media della classe Gaming (4986 - 81639, n=147, ultimi 2 anni) | |
| Acer Predator Helios Neo 16 (2024) (v6.92.6600) | |
| SCHENKER XMG Pro 16 Studio (Mid 24) (v6.92.6600) | |
| HP Victus 16 (2024) (v6.92.6600) | |
| Gigabyte G6X 9KG (2024) (v6.92.6600) | |
| Nubia RedMagic Titan 16 Pro (v6.92.6600) | |
| AIDA64 / FPU Julia | |
| Media Intel Core i9-14900HX (67573 - 166040, n=36) | |
| Nubia RedMagic Titan 16 Pro (v6.92.6600, Gaming Mode) | |
| Lenovo Legion Pro 5 16IRX9 G9 (v6.92.6600) | |
| SCHENKER XMG Pro 16 Studio (Mid 24) (v6.92.6600) | |
| Acer Predator Helios Neo 16 (2024) (v6.92.6600) | |
| Media della classe Gaming (25360 - 252486, n=147, ultimi 2 anni) | |
| HP Victus 16 (2024) (v6.92.6600) | |
| Gigabyte G6X 9KG (2024) (v6.92.6600) | |
| Nubia RedMagic Titan 16 Pro (v6.92.6600) | |
| AIDA64 / CPU SHA3 | |
| Nubia RedMagic Titan 16 Pro (v6.92.6600, Gaming Mode) | |
| Media Intel Core i9-14900HX (3589 - 7979, n=36) | |
| SCHENKER XMG Pro 16 Studio (Mid 24) (v6.92.6600) | |
| Lenovo Legion Pro 5 16IRX9 G9 (v6.92.6600) | |
| Acer Predator Helios Neo 16 (2024) (v6.92.6600) | |
| Media della classe Gaming (1339 - 10389, n=147, ultimi 2 anni) | |
| HP Victus 16 (2024) (v6.92.6600) | |
| Nubia RedMagic Titan 16 Pro (v6.92.6600) | |
| Gigabyte G6X 9KG (2024) (v6.92.6600) | |
| AIDA64 / CPU Queen | |
| Lenovo Legion Pro 5 16IRX9 G9 (v6.92.6600) | |
| Acer Predator Helios Neo 16 (2024) (v6.92.6600) | |
| Nubia RedMagic Titan 16 Pro (v6.92.6600, Gaming Mode) | |
| Media Intel Core i9-14900HX (118405 - 148966, n=36) | |
| SCHENKER XMG Pro 16 Studio (Mid 24) (v6.92.6600) | |
| HP Victus 16 (2024) (v6.92.6600) | |
| Nubia RedMagic Titan 16 Pro (v6.92.6600) | |
| Media della classe Gaming (50699 - 200651, n=147, ultimi 2 anni) | |
| Gigabyte G6X 9KG (2024) (v6.92.6600) | |
| AIDA64 / FPU SinJulia | |
| Nubia RedMagic Titan 16 Pro (v6.92.6600, Gaming Mode) | |
| Media Intel Core i9-14900HX (10475 - 18517, n=36) | |
| Lenovo Legion Pro 5 16IRX9 G9 (v6.92.6600) | |
| SCHENKER XMG Pro 16 Studio (Mid 24) (v6.92.6600) | |
| Acer Predator Helios Neo 16 (2024) (v6.92.6600) | |
| Media della classe Gaming (4800 - 32988, n=147, ultimi 2 anni) | |
| HP Victus 16 (2024) (v6.92.6600) | |
| Nubia RedMagic Titan 16 Pro (v6.92.6600) | |
| Gigabyte G6X 9KG (2024) (v6.92.6600) | |
| AIDA64 / FPU Mandel | |
| Media Intel Core i9-14900HX (32543 - 83662, n=36) | |
| Nubia RedMagic Titan 16 Pro (v6.92.6600, Gaming Mode) | |
| Lenovo Legion Pro 5 16IRX9 G9 (v6.92.6600) | |
| Acer Predator Helios Neo 16 (2024) (v6.92.6600) | |
| Media della classe Gaming (12321 - 134044, n=147, ultimi 2 anni) | |
| SCHENKER XMG Pro 16 Studio (Mid 24) (v6.92.6600) | |
| HP Victus 16 (2024) (v6.92.6600) | |
| Gigabyte G6X 9KG (2024) (v6.92.6600) | |
| Nubia RedMagic Titan 16 Pro | |
| AIDA64 / CPU AES | |
| Nubia RedMagic Titan 16 Pro (v6.92.6600, Gaming Mode) | |
| Media Intel Core i9-14900HX (86964 - 241777, n=36) | |
| Nubia RedMagic Titan 16 Pro (v6.92.6600) | |
| Lenovo Legion Pro 5 16IRX9 G9 (v6.92.6600) | |
| SCHENKER XMG Pro 16 Studio (Mid 24) (v6.92.6600) | |
| Media della classe Gaming (19065 - 328679, n=147, ultimi 2 anni) | |
| Acer Predator Helios Neo 16 (2024) (v6.92.6600) | |
| HP Victus 16 (2024) (v6.92.6600) | |
| Gigabyte G6X 9KG (2024) (v6.92.6600) | |
| AIDA64 / CPU ZLib | |
| Nubia RedMagic Titan 16 Pro (v6.92.6600, Gaming Mode) | |
| Media Intel Core i9-14900HX (1054 - 2292, n=36) | |
| Lenovo Legion Pro 5 16IRX9 G9 (v6.92.6600) | |
| SCHENKER XMG Pro 16 Studio (Mid 24) (v6.92.6600) | |
| Acer Predator Helios Neo 16 (2024) (v6.92.6600) | |
| Media della classe Gaming (373 - 2531, n=147, ultimi 2 anni) | |
| HP Victus 16 (2024) (v6.92.6600) | |
| Gigabyte G6X 9KG (2024) (v6.92.6600) | |
| Nubia RedMagic Titan 16 Pro (v6.92.6600) | |
| AIDA64 / FP64 Ray-Trace | |
| Media Intel Core i9-14900HX (6809 - 18349, n=36) | |
| Lenovo Legion Pro 5 16IRX9 G9 (v6.92.6600) | |
| Nubia RedMagic Titan 16 Pro (v6.92.6600, Gaming Mode) | |
| Media della classe Gaming (2540 - 43430, n=147, ultimi 2 anni) | |
| SCHENKER XMG Pro 16 Studio (Mid 24) (v6.92.6600) | |
| Acer Predator Helios Neo 16 (2024) (v6.92.6600) | |
| HP Victus 16 (2024) (v6.92.6600) | |
| Gigabyte G6X 9KG (2024) (v6.92.6600) | |
| Nubia RedMagic Titan 16 Pro (v6.92.6600) | |
| AIDA64 / CPU PhotoWorxx | |
| Lenovo Legion Pro 5 16IRX9 G9 (v6.92.6600) | |
| SCHENKER XMG Pro 16 Studio (Mid 24) (v6.92.6600) | |
| Media Intel Core i9-14900HX (23903 - 54702, n=36) | |
| Acer Predator Helios Neo 16 (2024) (v6.92.6600) | |
| Media della classe Gaming (10805 - 60161, n=147, ultimi 2 anni) | |
| HP Victus 16 (2024) (v6.92.6600) | |
| Gigabyte G6X 9KG (2024) (v6.92.6600) | |
| Nubia RedMagic Titan 16 Pro (v6.92.6600) | |
| Nubia RedMagic Titan 16 Pro (v6.92.6600, Gaming Mode) | |
Prestazioni del sistema
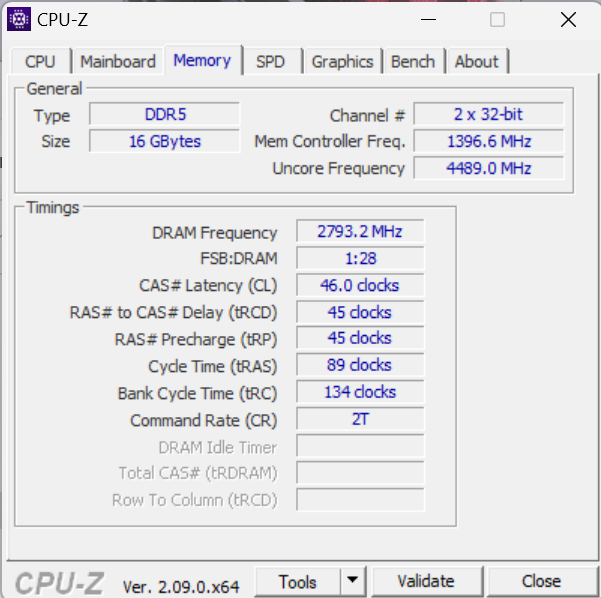
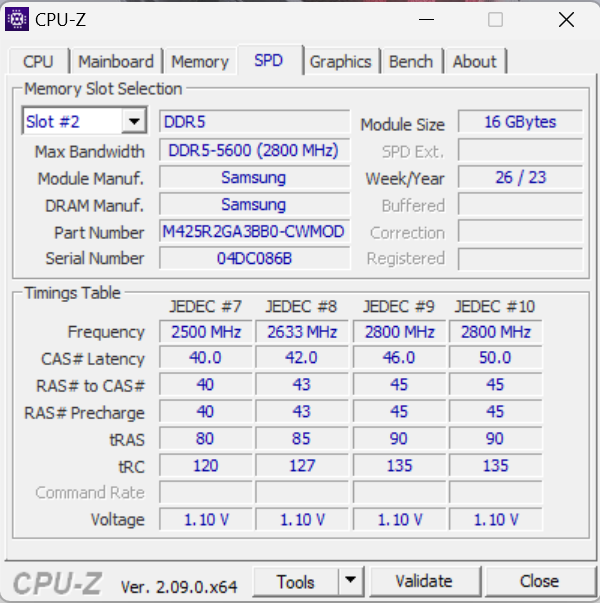
Il sistema, che funziona in modo fluido, offre una potenza sufficiente per le applicazioni più impegnative, come i giochi, il rendering e lo streaming. Tuttavia, una parte della sua potenza di calcolo rimane inutilizzata perché la RAM (16 GB, DDR5-5600) funziona solo in modalità a canale singolo: le basse velocità di trasferimento della memoria del portatile rispetto alla concorrenza lo confermano. L'installazione di un secondo modulo di memoria (= modalità dual-channel attiva) potrebbe porre rimedio a questo problema.
CrossMark: Overall | Productivity | Creativity | Responsiveness
WebXPRT 3: Overall
WebXPRT 4: Overall
Mozilla Kraken 1.1: Total
| PCMark 10 / Score | |
| Acer Predator Helios Neo 16 (2024) | |
| Lenovo Legion Pro 5 16IRX9 G9 | |
| SCHENKER XMG Pro 16 Studio (Mid 24) | |
| Media Intel Core i9-14900HX, NVIDIA GeForce RTX 4060 Laptop GPU (7830 - 8322, n=2) | |
| Nubia RedMagic Titan 16 Pro | |
| Media della classe Gaming (5776 - 9852, n=133, ultimi 2 anni) | |
| Gigabyte G6X 9KG (2024) | |
| HP Victus 16 (2024) | |
| PCMark 10 / Essentials | |
| Acer Predator Helios Neo 16 (2024) | |
| Media Intel Core i9-14900HX, NVIDIA GeForce RTX 4060 Laptop GPU (11022 - 11413, n=2) | |
| Lenovo Legion Pro 5 16IRX9 G9 | |
| Nubia RedMagic Titan 16 Pro | |
| HP Victus 16 (2024) | |
| Media della classe Gaming (9057 - 12600, n=133, ultimi 2 anni) | |
| SCHENKER XMG Pro 16 Studio (Mid 24) | |
| Gigabyte G6X 9KG (2024) | |
| PCMark 10 / Productivity | |
| SCHENKER XMG Pro 16 Studio (Mid 24) | |
| Acer Predator Helios Neo 16 (2024) | |
| Gigabyte G6X 9KG (2024) | |
| Media Intel Core i9-14900HX, NVIDIA GeForce RTX 4060 Laptop GPU (9776 - 10558, n=2) | |
| HP Victus 16 (2024) | |
| Media della classe Gaming (6662 - 14612, n=133, ultimi 2 anni) | |
| Lenovo Legion Pro 5 16IRX9 G9 | |
| Nubia RedMagic Titan 16 Pro | |
| PCMark 10 / Digital Content Creation | |
| Lenovo Legion Pro 5 16IRX9 G9 | |
| Acer Predator Helios Neo 16 (2024) | |
| Media Intel Core i9-14900HX, NVIDIA GeForce RTX 4060 Laptop GPU (12091 - 12979, n=2) | |
| SCHENKER XMG Pro 16 Studio (Mid 24) | |
| Media della classe Gaming (6807 - 18475, n=133, ultimi 2 anni) | |
| Nubia RedMagic Titan 16 Pro | |
| Gigabyte G6X 9KG (2024) | |
| HP Victus 16 (2024) | |
| CrossMark / Overall | |
| Acer Predator Helios Neo 16 (2024) | |
| Media Intel Core i9-14900HX, NVIDIA GeForce RTX 4060 Laptop GPU (2103 - 2184, n=2) | |
| Lenovo Legion Pro 5 16IRX9 G9 | |
| Nubia RedMagic Titan 16 Pro | |
| SCHENKER XMG Pro 16 Studio (Mid 24) | |
| Gigabyte G6X 9KG (2024) | |
| HP Victus 16 (2024) | |
| Media della classe Gaming (1247 - 2344, n=114, ultimi 2 anni) | |
| CrossMark / Productivity | |
| Acer Predator Helios Neo 16 (2024) | |
| Nubia RedMagic Titan 16 Pro | |
| Media Intel Core i9-14900HX, NVIDIA GeForce RTX 4060 Laptop GPU (2040 - 2042, n=2) | |
| Lenovo Legion Pro 5 16IRX9 G9 | |
| SCHENKER XMG Pro 16 Studio (Mid 24) | |
| Gigabyte G6X 9KG (2024) | |
| Media della classe Gaming (1299 - 2204, n=114, ultimi 2 anni) | |
| HP Victus 16 (2024) | |
| CrossMark / Creativity | |
| Acer Predator Helios Neo 16 (2024) | |
| Lenovo Legion Pro 5 16IRX9 G9 | |
| SCHENKER XMG Pro 16 Studio (Mid 24) | |
| Media Intel Core i9-14900HX, NVIDIA GeForce RTX 4060 Laptop GPU (2240 - 2472, n=2) | |
| Nubia RedMagic Titan 16 Pro | |
| HP Victus 16 (2024) | |
| Media della classe Gaming (1275 - 2660, n=114, ultimi 2 anni) | |
| Gigabyte G6X 9KG (2024) | |
| CrossMark / Responsiveness | |
| Acer Predator Helios Neo 16 (2024) | |
| Gigabyte G6X 9KG (2024) | |
| Nubia RedMagic Titan 16 Pro | |
| Lenovo Legion Pro 5 16IRX9 G9 | |
| Media Intel Core i9-14900HX, NVIDIA GeForce RTX 4060 Laptop GPU (1849 - 1899, n=2) | |
| HP Victus 16 (2024) | |
| SCHENKER XMG Pro 16 Studio (Mid 24) | |
| Media della classe Gaming (1030 - 2330, n=114, ultimi 2 anni) | |
| WebXPRT 3 / Overall | |
| Media Intel Core i9-14900HX, NVIDIA GeForce RTX 4060 Laptop GPU (329 - 339, n=2) | |
| Nubia RedMagic Titan 16 Pro | |
| Acer Predator Helios Neo 16 (2024) | |
| SCHENKER XMG Pro 16 Studio (Mid 24) | |
| Gigabyte G6X 9KG (2024) | |
| Lenovo Legion Pro 5 16IRX9 G9 | |
| Media della classe Gaming (215 - 480, n=127, ultimi 2 anni) | |
| HP Victus 16 (2024) | |
| WebXPRT 4 / Overall | |
| Media Intel Core i9-14900HX, NVIDIA GeForce RTX 4060 Laptop GPU (309 - 319, n=2) | |
| Nubia RedMagic Titan 16 Pro | |
| Acer Predator Helios Neo 16 (2024) | |
| SCHENKER XMG Pro 16 Studio (Mid 24) | |
| Lenovo Legion Pro 5 16IRX9 G9 | |
| Media della classe Gaming (176.4 - 335, n=115, ultimi 2 anni) | |
| Gigabyte G6X 9KG (2024) | |
| HP Victus 16 (2024) | |
| Mozilla Kraken 1.1 / Total | |
| HP Victus 16 (2024) | |
| Gigabyte G6X 9KG (2024) | |
| Media della classe Gaming (409 - 674, n=139, ultimi 2 anni) | |
| Lenovo Legion Pro 5 16IRX9 G9 | |
| SCHENKER XMG Pro 16 Studio (Mid 24) | |
| Acer Predator Helios Neo 16 (2024) | |
| Nubia RedMagic Titan 16 Pro | |
| Media Intel Core i9-14900HX, NVIDIA GeForce RTX 4060 Laptop GPU (430 - 439, n=2) | |
* ... Meglio usare valori piccoli
| PCMark 10 Score | 7830 punti | |
Aiuto | ||
| AIDA64 / Memory Copy | |
| SCHENKER XMG Pro 16 Studio (Mid 24) | |
| Lenovo Legion Pro 5 16IRX9 G9 | |
| Acer Predator Helios Neo 16 (2024) | |
| Media Intel Core i9-14900HX (38028 - 83392, n=36) | |
| HP Victus 16 (2024) | |
| Media della classe Gaming (21750 - 97515, n=147, ultimi 2 anni) | |
| Gigabyte G6X 9KG (2024) | |
| Nubia RedMagic Titan 16 Pro | |
| AIDA64 / Memory Read | |
| Lenovo Legion Pro 5 16IRX9 G9 | |
| SCHENKER XMG Pro 16 Studio (Mid 24) | |
| Acer Predator Helios Neo 16 (2024) | |
| Media Intel Core i9-14900HX (43306 - 87568, n=36) | |
| HP Victus 16 (2024) | |
| Media della classe Gaming (22956 - 102937, n=147, ultimi 2 anni) | |
| Gigabyte G6X 9KG (2024) | |
| Nubia RedMagic Titan 16 Pro | |
| AIDA64 / Memory Write | |
| Lenovo Legion Pro 5 16IRX9 G9 | |
| SCHENKER XMG Pro 16 Studio (Mid 24) | |
| Media Intel Core i9-14900HX (37146 - 80589, n=36) | |
| Acer Predator Helios Neo 16 (2024) | |
| Media della classe Gaming (22297 - 108954, n=147, ultimi 2 anni) | |
| HP Victus 16 (2024) | |
| Gigabyte G6X 9KG (2024) | |
| Nubia RedMagic Titan 16 Pro | |
| AIDA64 / Memory Latency | |
| HP Victus 16 (2024) | |
| Media della classe Gaming (59.5 - 259, n=147, ultimi 2 anni) | |
| Acer Predator Helios Neo 16 (2024) | |
| Gigabyte G6X 9KG (2024) | |
| Media Intel Core i9-14900HX (76.1 - 105, n=36) | |
| SCHENKER XMG Pro 16 Studio (Mid 24) | |
| Lenovo Legion Pro 5 16IRX9 G9 | |
| Nubia RedMagic Titan 16 Pro | |
* ... Meglio usare valori piccoli
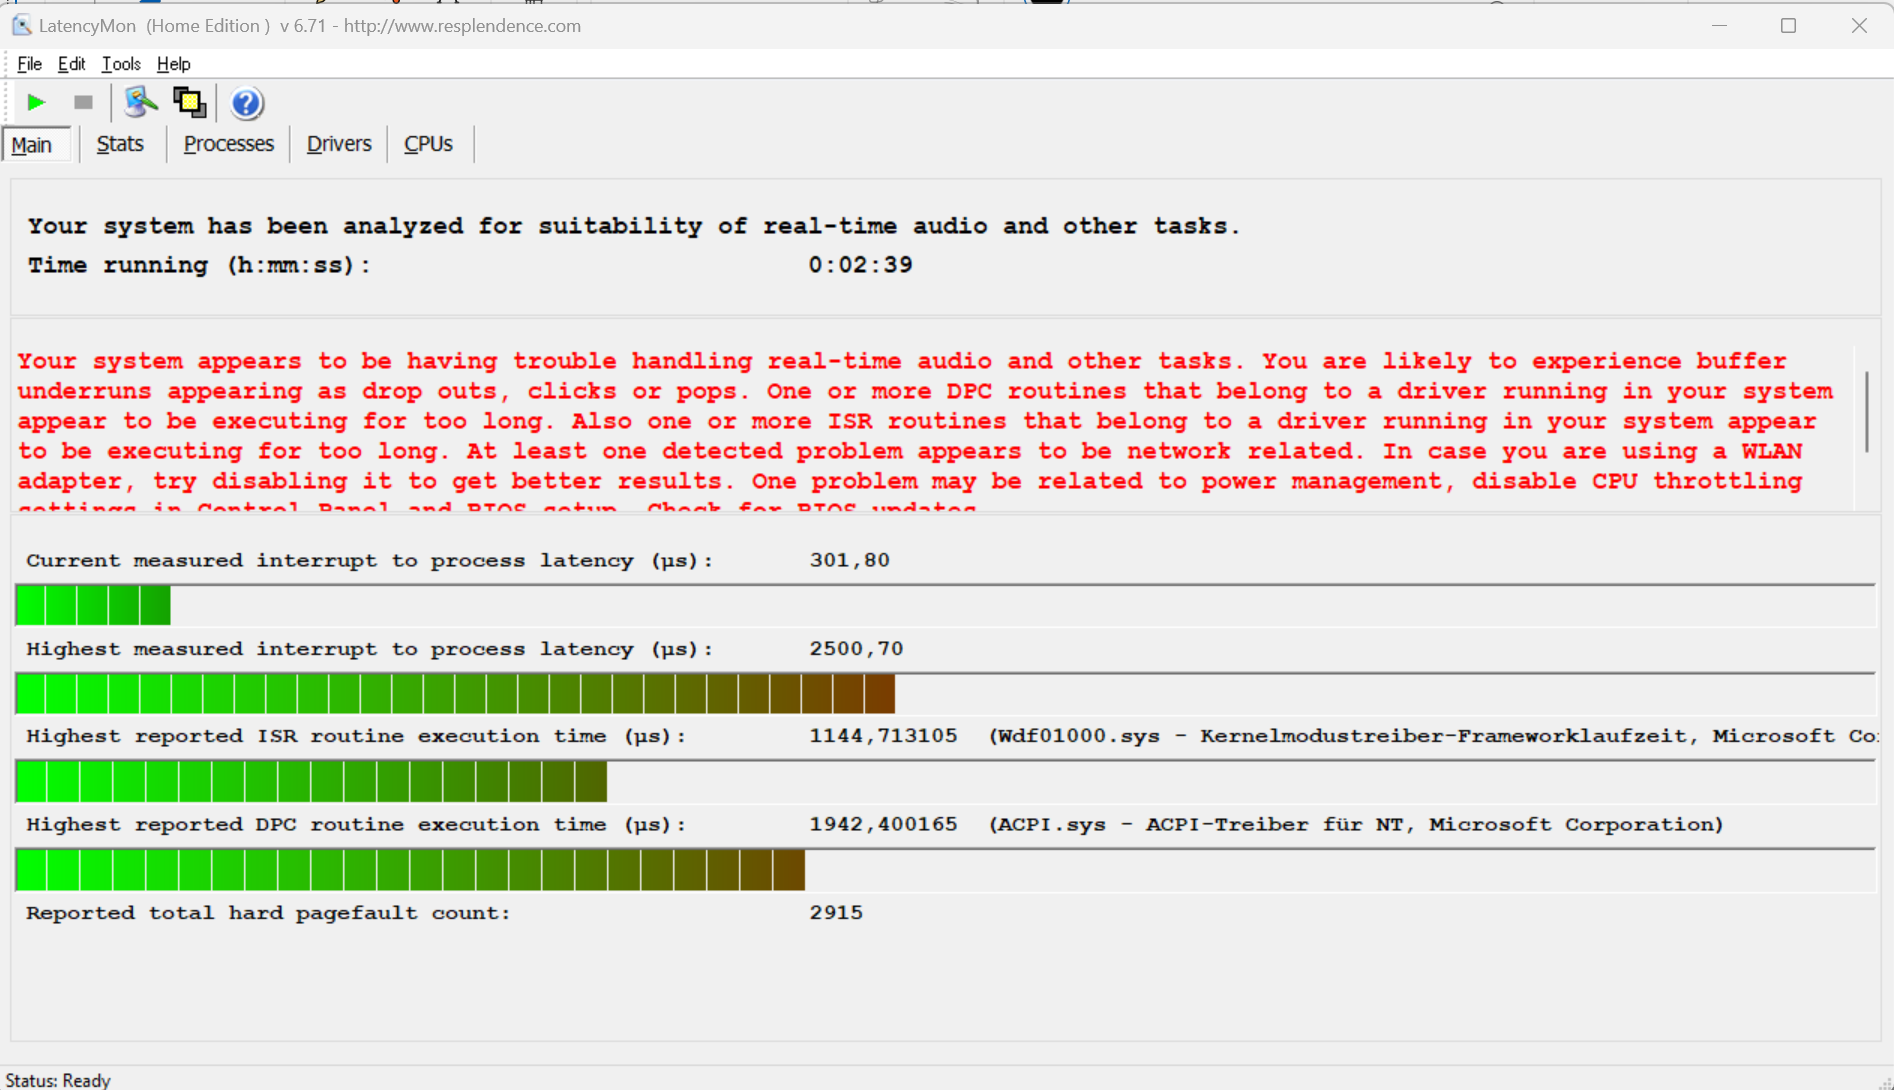
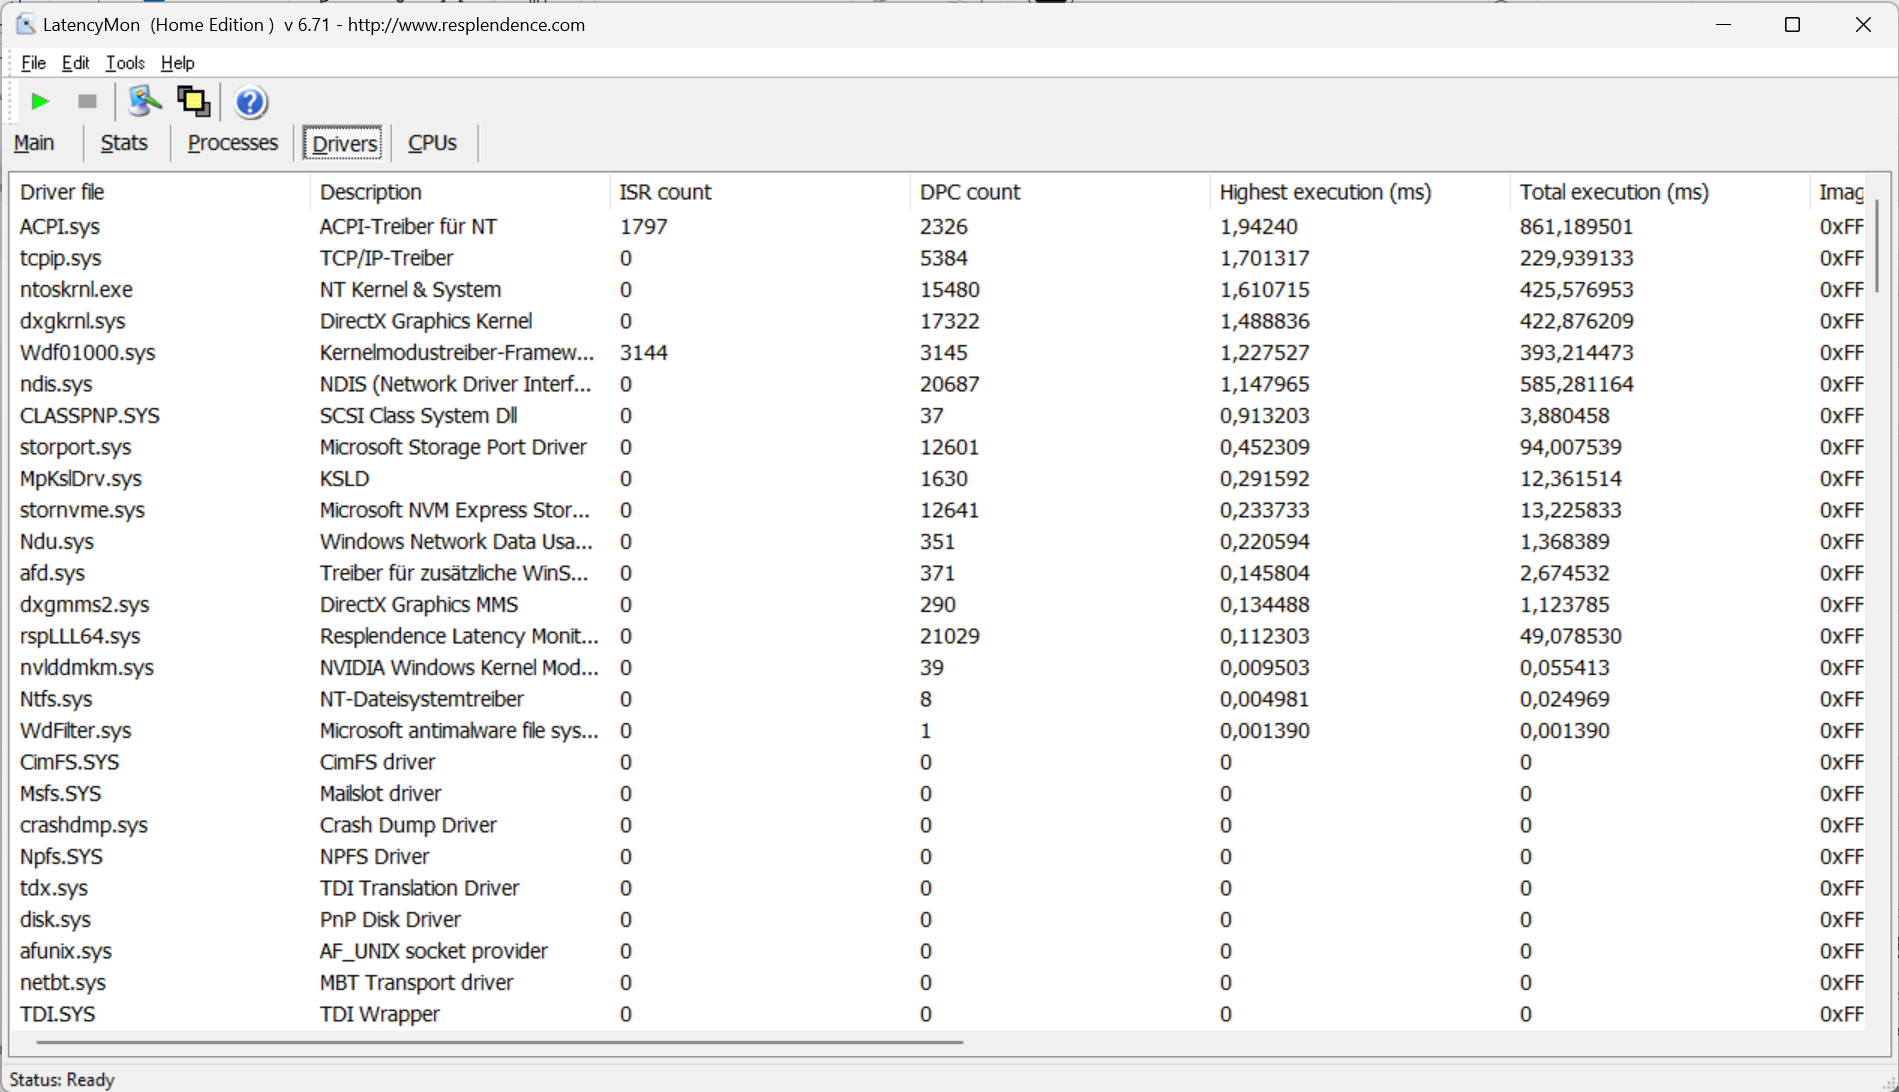
Latenze DPC
Le latenze elevate impediscono l'editing video e audio in tempo reale. I futuri aggiornamenti del software potrebbero apportare miglioramenti o addirittura peggioramenti.
| DPC Latencies / LatencyMon - interrupt to process latency (max), Web, Youtube, Prime95 | |
| Nubia RedMagic Titan 16 Pro | |
| Gigabyte G6X 9KG (2024) | |
| SCHENKER XMG Pro 16 Studio (Mid 24) | |
| Acer Predator Helios Neo 16 (2024) | |
| Lenovo Legion Pro 5 16IRX9 G9 | |
| HP Victus 16 (2024) | |
* ... Meglio usare valori piccoli
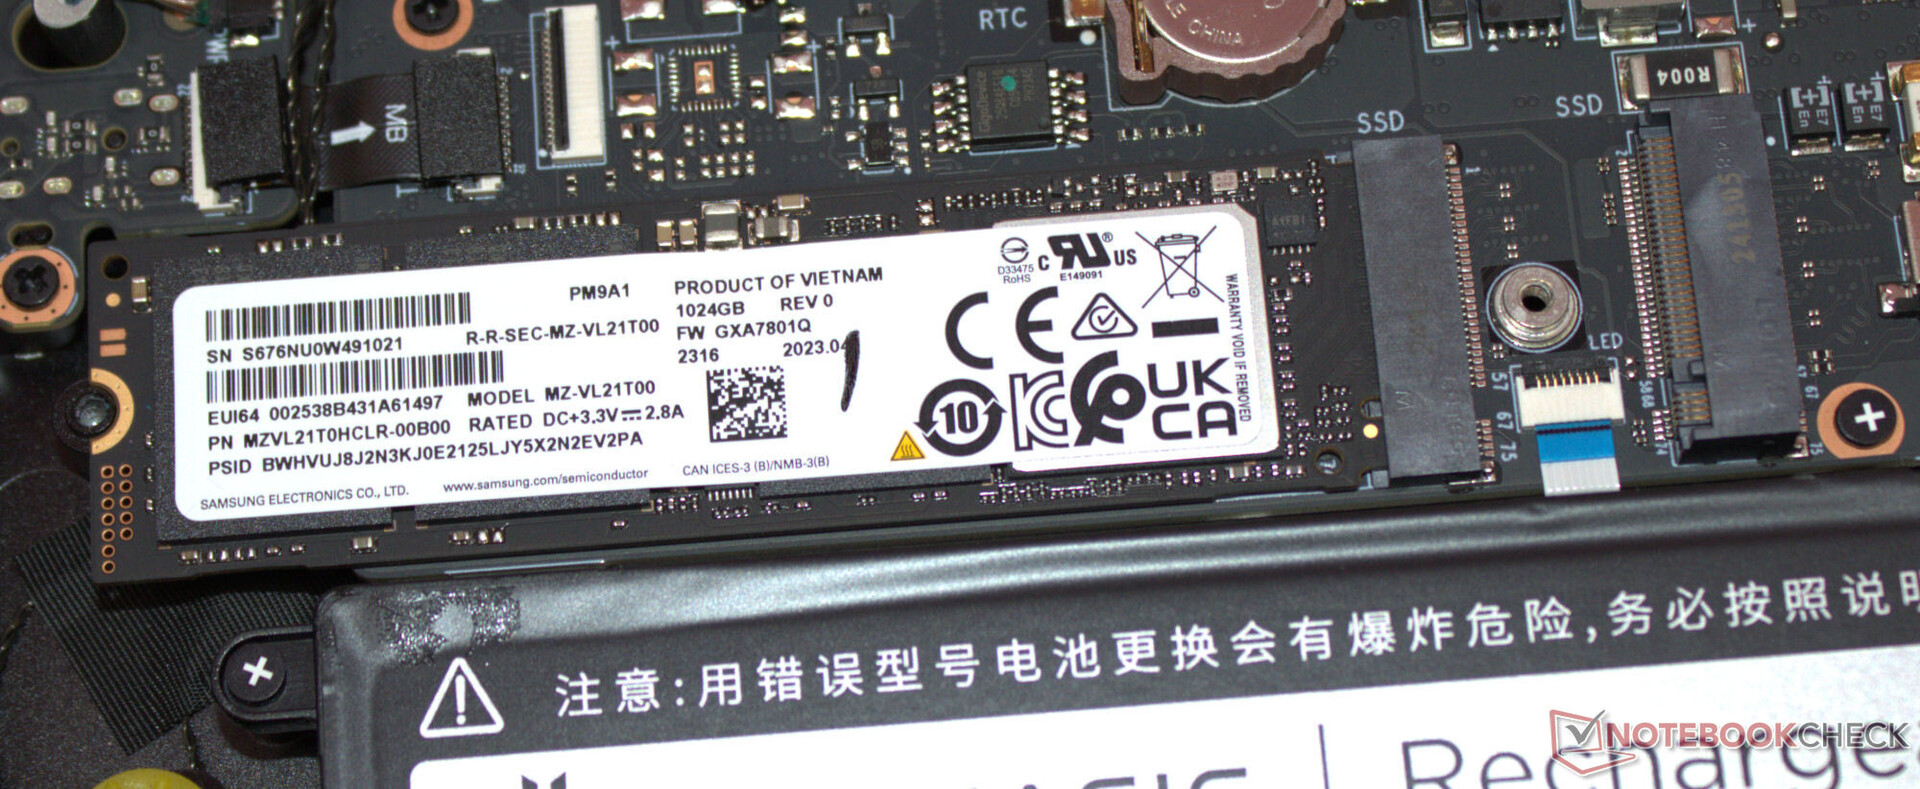
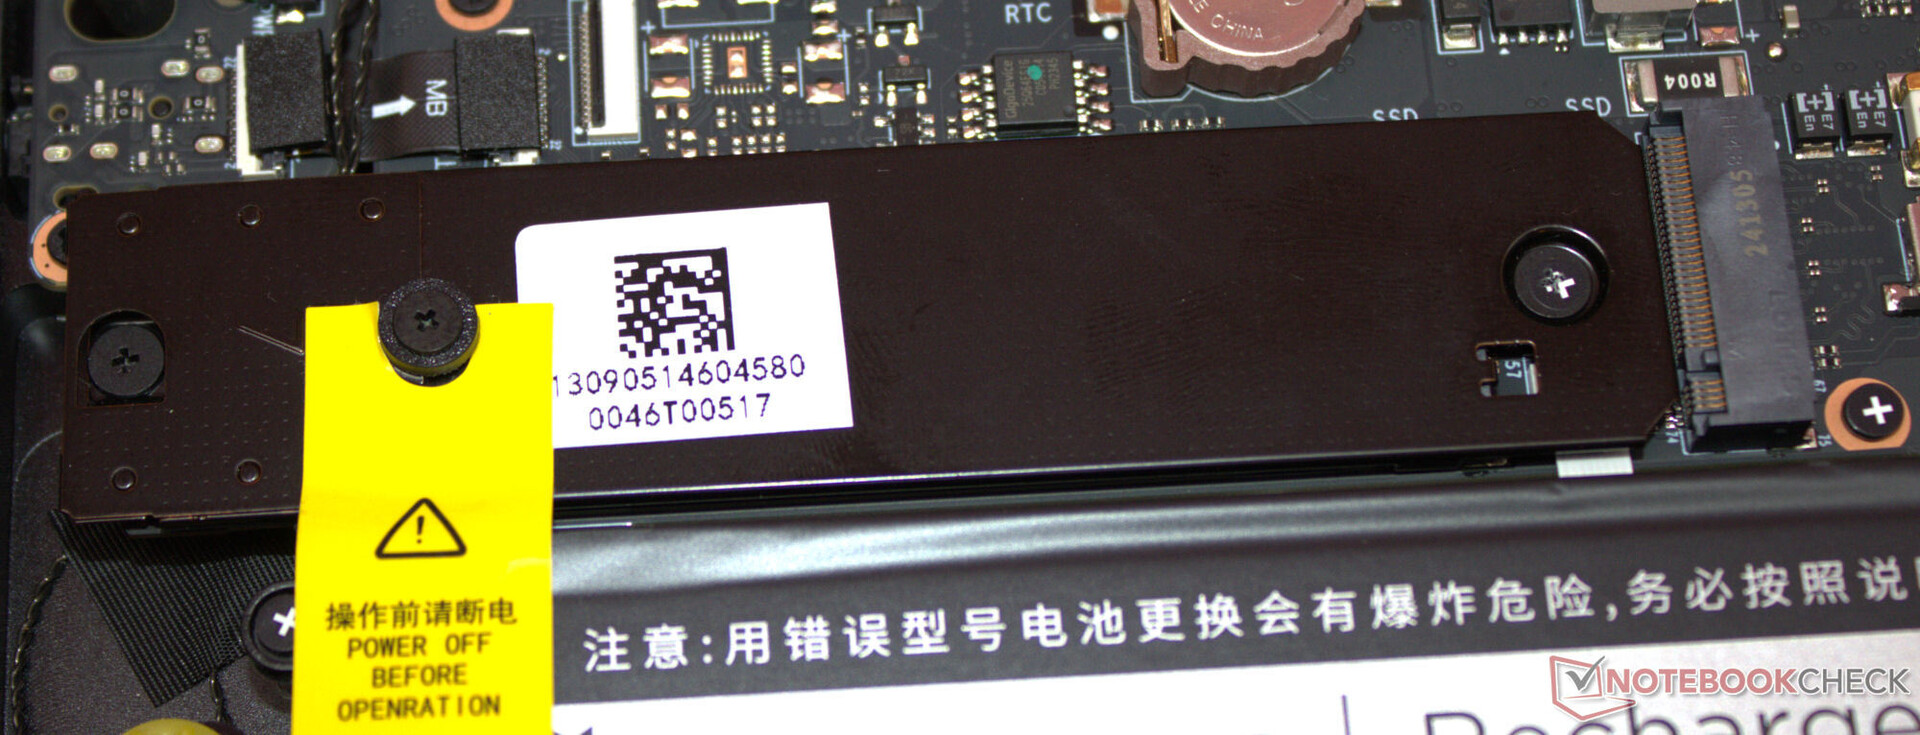
Dispositivi di archiviazione
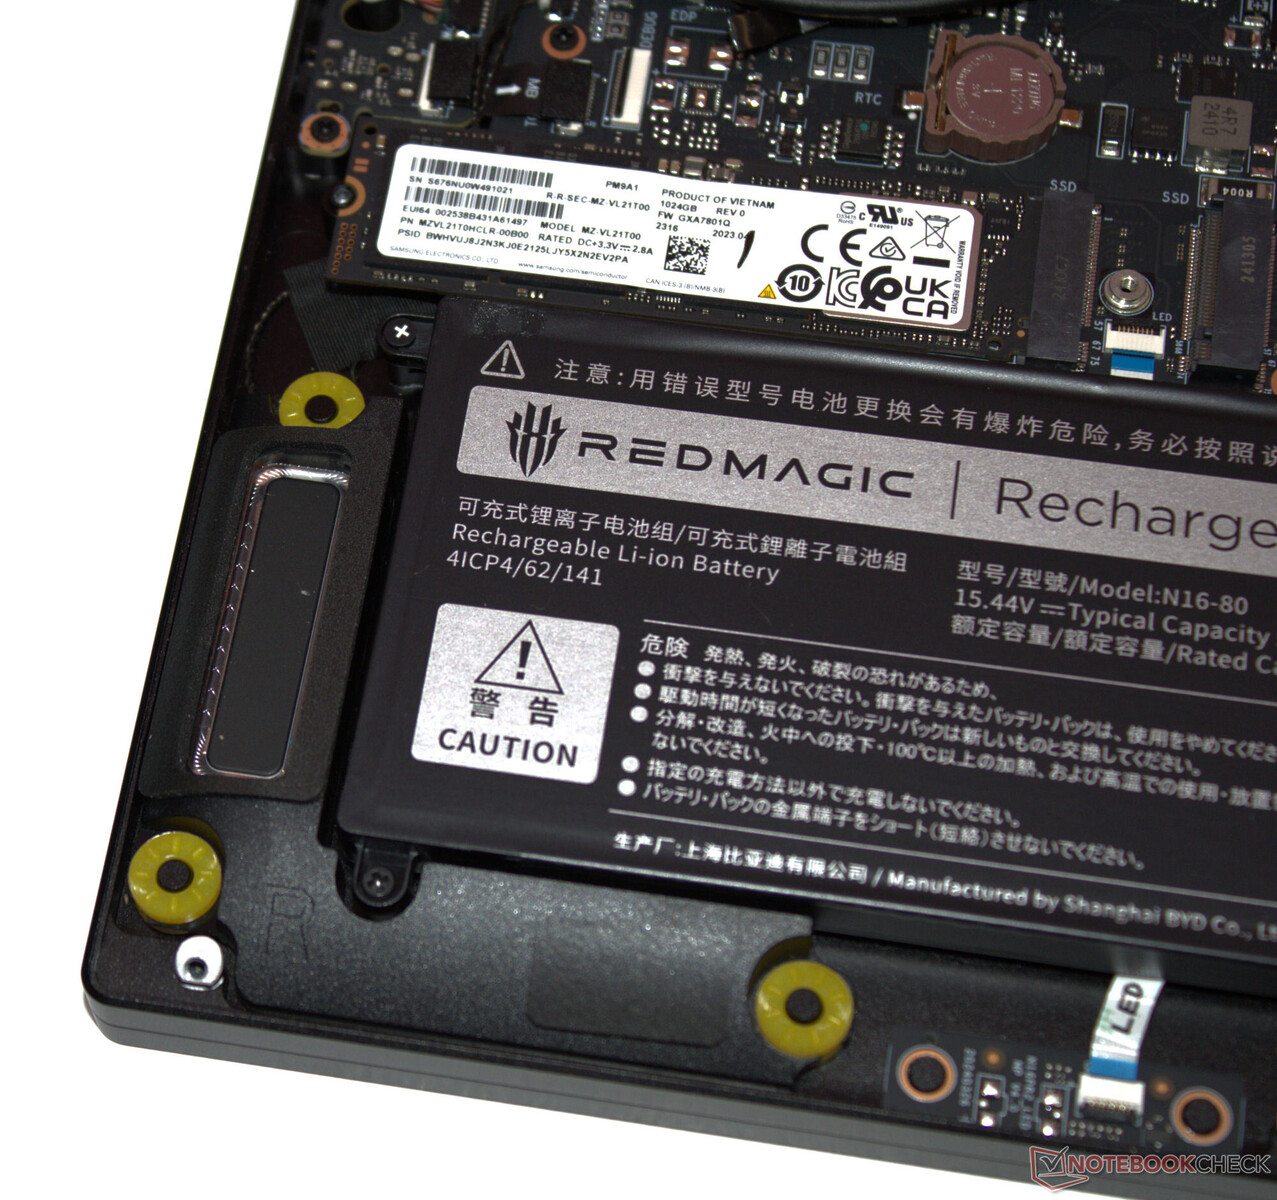
L'SSD PCIe 4 (M.2-2280) di Samsung offre una capacità di archiviazione di 1 TB e offre ottime velocità di trasferimento dati. Positivo: Non abbiamo osservato alcun throttling indotto dal calore. Il portatile ha spazio per un secondo SSD PCIe 4.

* ... Meglio usare valori piccoli
Reading continuous performance: DiskSpd Read Loop, Queue Depth 8
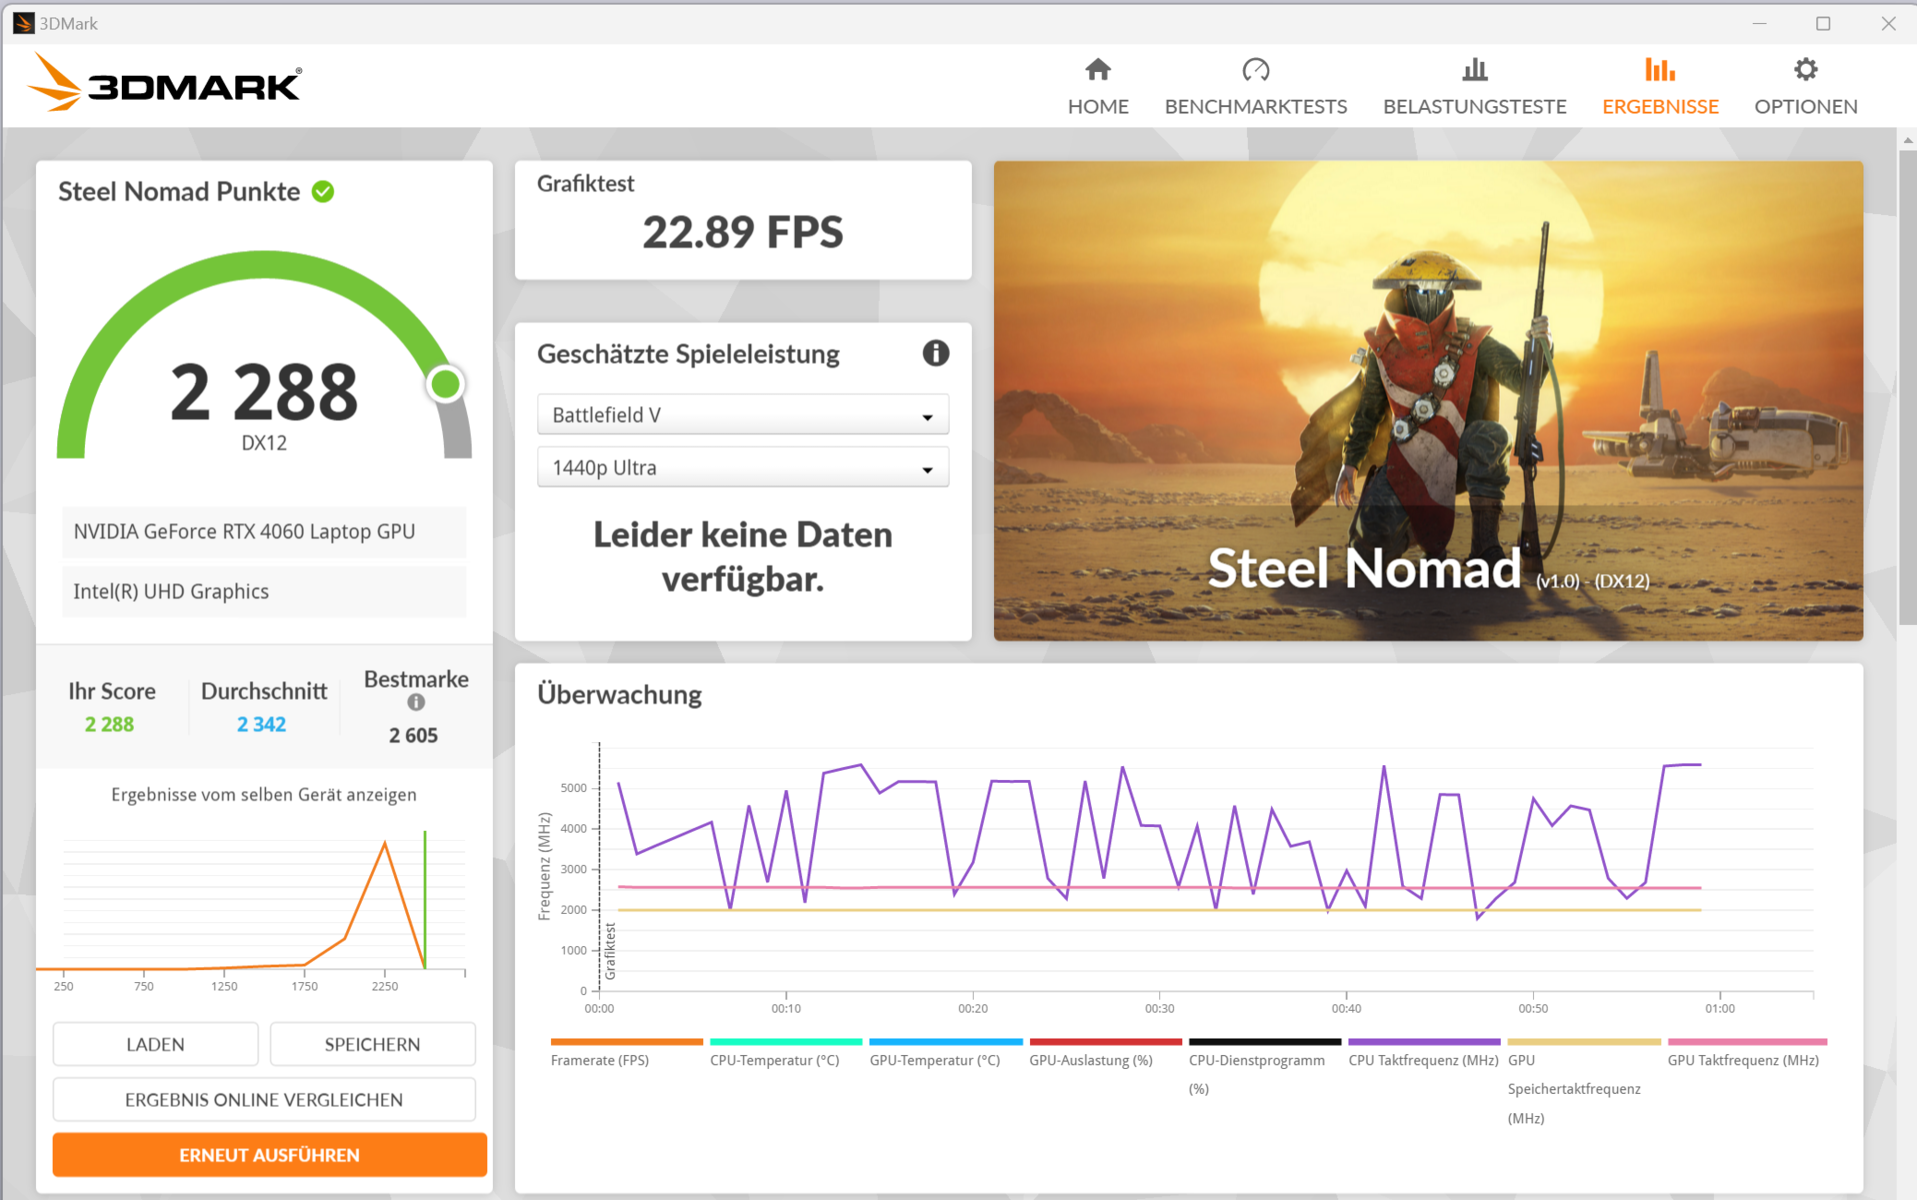
Scheda grafica
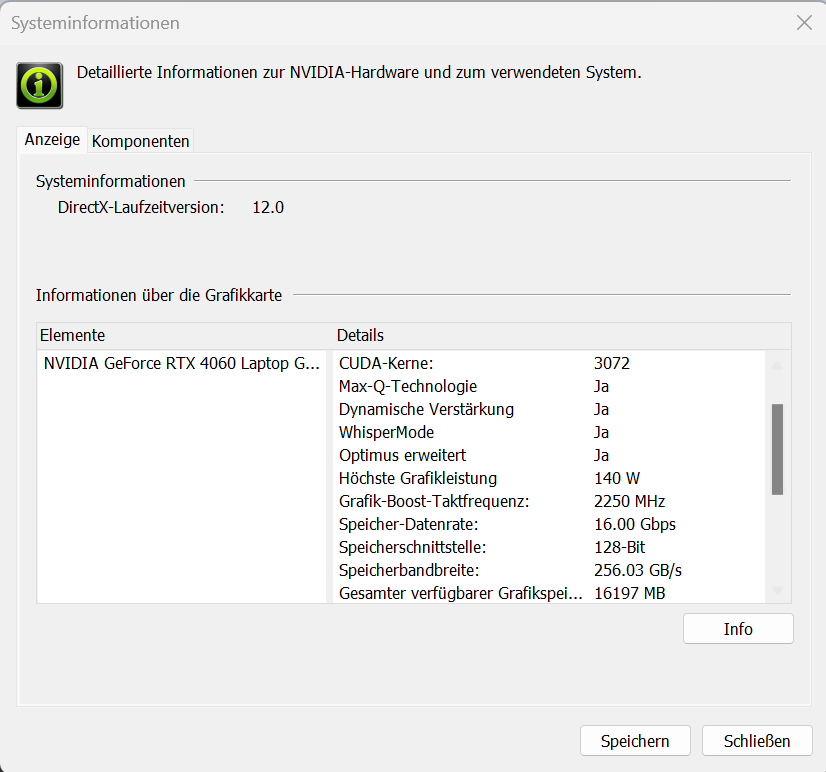
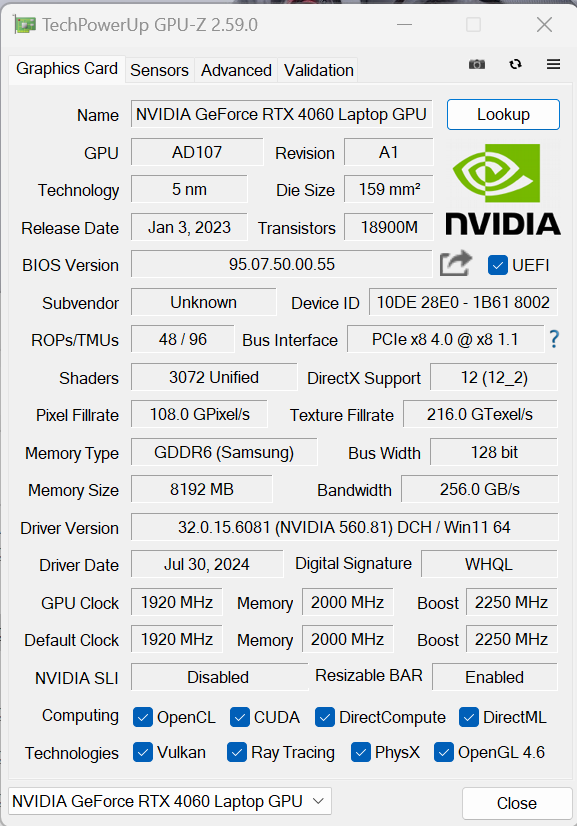
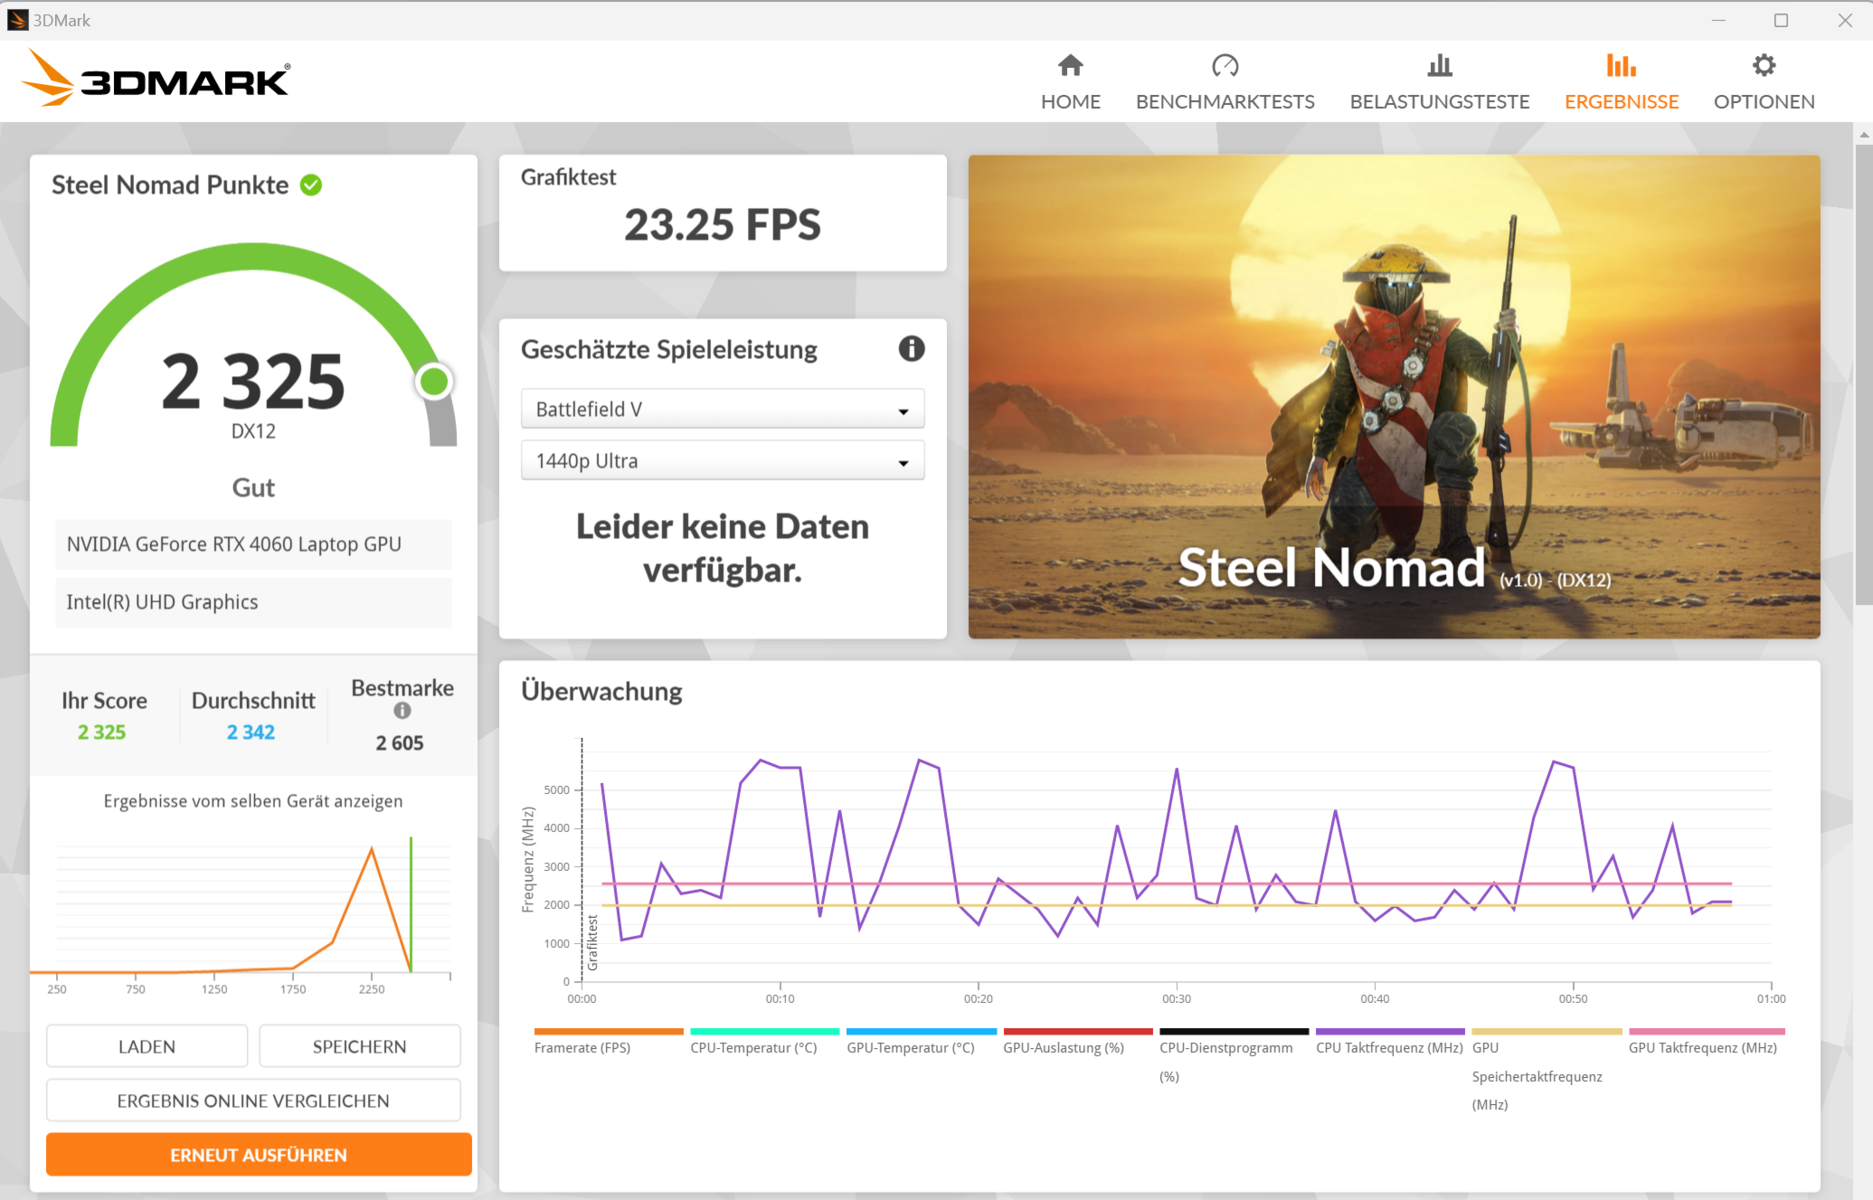
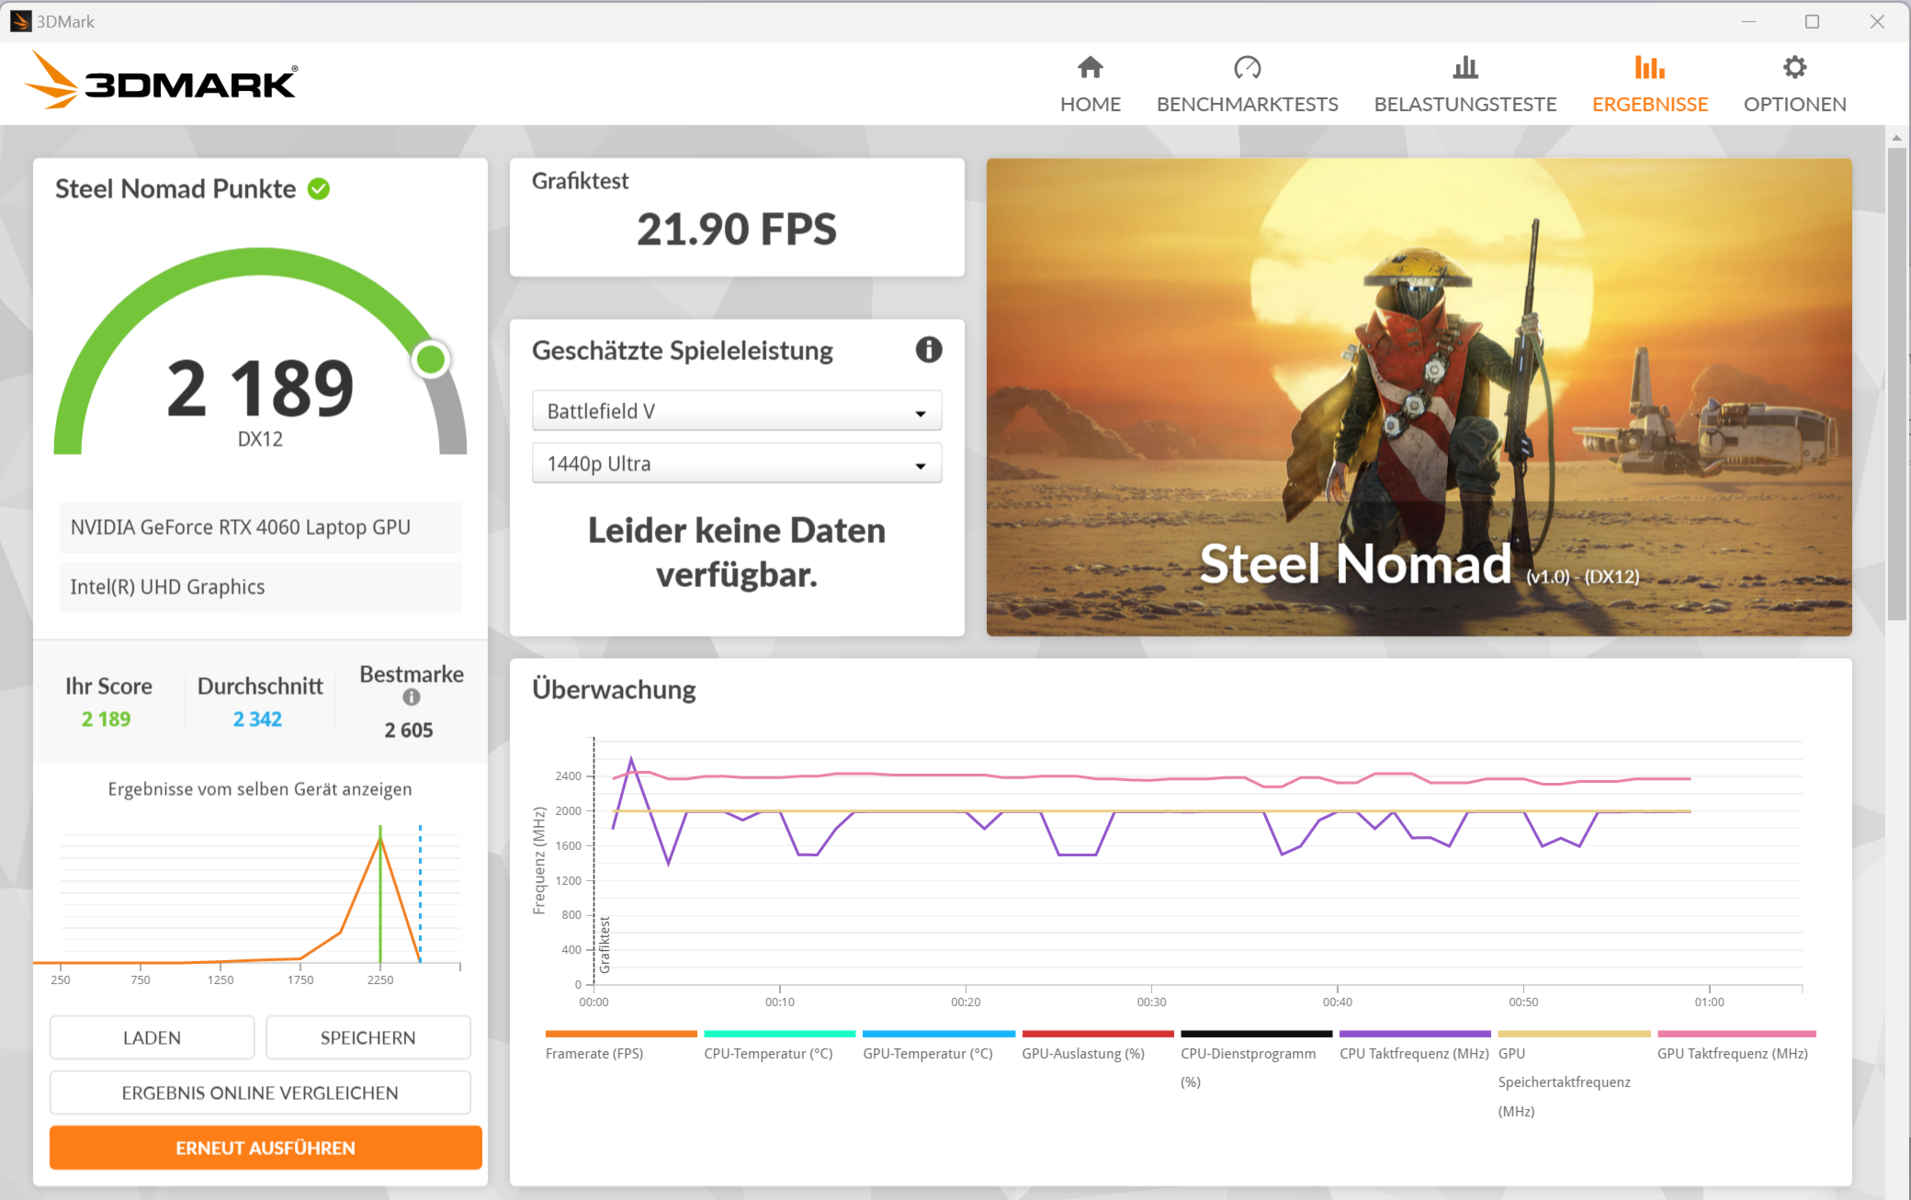
La GeForce RTX 4060 (3.072 shader, bus a 128 bit, 8 GB GDDR6) è attualmente una GPU di gioco di fascia (bassa) media. Nubia le concede un TGP massimo di 140 watt - non è possibile fare di più. I suoi risultati di benchmark sono leggermente superiori alla media di RTX-4060( modalitàbilanciata ). La modalità Gaming non comporta un aumento. Il passaggio tra dGPU e Optimus non richiede un riavvio - Optimus avanzato è supportato.

| 3DMark Performance Rating - Percent | |
| Acer Predator Helios Neo 16 (2024) | |
| Media della classe Gaming | |
| SCHENKER XMG Pro 16 Studio (Mid 24) | |
| Lenovo Legion Pro 5 16IRX9 G9 | |
| Nubia RedMagic Titan 16 Pro | |
| Nubia RedMagic Titan 16 Pro | |
| Gigabyte G6X 9KG (2024) | |
| HP Victus 16 (2024) | |
| Media NVIDIA GeForce RTX 4060 Laptop GPU | |
| 3DMark 11 - 1280x720 Performance GPU | |
| Acer Predator Helios Neo 16 (2024) | |
| Media della classe Gaming (10741 - 72178, n=143, ultimi 2 anni) | |
| SCHENKER XMG Pro 16 Studio (Mid 24) | |
| Lenovo Legion Pro 5 16IRX9 G9 | |
| Nubia RedMagic Titan 16 Pro (Gaming Mode) | |
| Nubia RedMagic Titan 16 Pro | |
| Gigabyte G6X 9KG (2024) | |
| HP Victus 16 (2024) | |
| Media NVIDIA GeForce RTX 4060 Laptop GPU (28136 - 38912, n=57) | |
| 3DMark | |
| 1920x1080 Fire Strike Graphics | |
| Acer Predator Helios Neo 16 (2024) | |
| Media della classe Gaming (2913 - 56116, n=155, ultimi 2 anni) | |
| SCHENKER XMG Pro 16 Studio (Mid 24) | |
| Lenovo Legion Pro 5 16IRX9 G9 | |
| Gigabyte G6X 9KG (2024) | |
| HP Victus 16 (2024) | |
| Nubia RedMagic Titan 16 Pro (Gaming Mode) | |
| Nubia RedMagic Titan 16 Pro | |
| Media NVIDIA GeForce RTX 4060 Laptop GPU (20533 - 29656, n=54) | |
| 2560x1440 Time Spy Graphics | |
| Acer Predator Helios Neo 16 (2024) | |
| Media della classe Gaming (2295 - 24599, n=151, ultimi 2 anni) | |
| SCHENKER XMG Pro 16 Studio (Mid 24) | |
| Lenovo Legion Pro 5 16IRX9 G9 | |
| Nubia RedMagic Titan 16 Pro (Gaming Mode) | |
| Nubia RedMagic Titan 16 Pro | |
| Media NVIDIA GeForce RTX 4060 Laptop GPU (7484 - 11451, n=56) | |
| HP Victus 16 (2024) | |
| Gigabyte G6X 9KG (2024) | |
| 3DMark 06 Standard Score | 55770 punti | |
| 3DMark 11 Performance | 28427 punti | |
| 3DMark Fire Strike Score | 22307 punti | |
| 3DMark Time Spy Score | 10789 punti | |
| 3DMark Steel Nomad Score | 2288 punti | |
Aiuto | ||
| Geekbench 6.4 | |
| GPU OpenCL | |
| Acer Predator Helios Neo 16 (2024) (6.2.1) | |
| Media della classe Gaming (4321 - 234213, n=118, ultimi 2 anni) | |
| SCHENKER XMG Pro 16 Studio (Mid 24) (6.2.1) | |
| Nubia RedMagic Titan 16 Pro (6.2.1, Gaming Mode) | |
| Nubia RedMagic Titan 16 Pro (6.2.1) | |
| Gigabyte G6X 9KG (2024) (6.2.1) | |
| HP Victus 16 (2024) (6.2.1) | |
| Media NVIDIA GeForce RTX 4060 Laptop GPU (4321 - 100831, n=40) | |
| Lenovo Legion Pro 5 16IRX9 G9 (6.2.1) | |
| GPU Vulkan | |
| SCHENKER XMG Pro 16 Studio (Mid 24) (6.2.1) | |
| Nubia RedMagic Titan 16 Pro (6.2.1, Gaming Mode) | |
| Gigabyte G6X 9KG (2024) (6.2.1) | |
| Acer Predator Helios Neo 16 (2024) (6.2.1) | |
| HP Victus 16 (2024) (6.2.1) | |
| Media della classe Gaming (4286 - 231659, n=110, ultimi 2 anni) | |
| Nubia RedMagic Titan 16 Pro (6.2.1) | |
| Lenovo Legion Pro 5 16IRX9 G9 (6.2.1) | |
| Media NVIDIA GeForce RTX 4060 Laptop GPU (4286 - 101001, n=36) | |
| V-Ray Benchmark Next 4.10 | |
| GPU | |
| Media della classe Gaming (54 - 1317, n=122, ultimi 2 anni) | |
| Lenovo Legion Pro 5 16IRX9 G9 (v4.10.07 ) | |
| Acer Predator Helios Neo 16 (2024) (v4.10.07 ) | |
| Gigabyte G6X 9KG (2024) (v4.10.07 ) | |
| Nubia RedMagic Titan 16 Pro (v4.10.07 ) | |
| Nubia RedMagic Titan 16 Pro (v4.10.07, Gaming Mode ) | |
| Media NVIDIA GeForce RTX 4060 Laptop GPU (483 - 715, n=46) | |
| HP Victus 16 (2024) (v4.10.07 ) | |
| SCHENKER XMG Pro 16 Studio (Mid 24) (v4.10.07 ) | |
| CPU | |
| Nubia RedMagic Titan 16 Pro (v4.10.07, Gaming Mode) | |
| Lenovo Legion Pro 5 16IRX9 G9 (v4.10.07 ) | |
| SCHENKER XMG Pro 16 Studio (Mid 24) (v4.10.07 ) | |
| Acer Predator Helios Neo 16 (2024) (v4.10.07 ) | |
| HP Victus 16 (2024) (v4.10.07 ) | |
| Media della classe Gaming (5413 - 44129, n=122, ultimi 2 anni) | |
| Media NVIDIA GeForce RTX 4060 Laptop GPU (12680 - 32360, n=46) | |
| Gigabyte G6X 9KG (2024) (v4.10.07 ) | |
| Nubia RedMagic Titan 16 Pro (v4.10.07 ) | |
* ... Meglio usare valori piccoli
Prestazioni di gioco
La Titan è progettata per i giochi QHD con impostazioni da alte a massime. L'hardware installato genera frame rate leggermente superiori alla media della RTX 4060( modalitàbilanciata ). La modalità Gaming si traduce in un vantaggio quando si eseguono giochi che beneficiano di prestazioni CPU più elevate, come ad esempio Dota 2 Reborn e X-Plane 11. Per il resto, le prestazioni grafiche sono identiche.
| Cyberpunk 2077 2.2 Phantom Liberty - 1920x1080 Ultra Preset (FSR off) | |
| Media della classe Gaming (6.76 - 158, n=90, ultimi 2 anni) | |
| Acer Predator Helios Neo 16 (2024) (2.02) | |
| SCHENKER XMG Pro 16 Studio (Mid 24) (2.12) | |
| Lenovo Legion Pro 5 16IRX9 G9 (2.12) | |
| Nubia RedMagic Titan 16 Pro (2.12, Gaming Mode) | |
| Nubia RedMagic Titan 16 Pro (2.12) | |
| Media NVIDIA GeForce RTX 4060 Laptop GPU (56.4 - 93.1, n=31) | |
| Gigabyte G6X 9KG (2024) (2.02) | |
| HP Victus 16 (2024) (2.02) | |
| Final Fantasy XV Benchmark - 1920x1080 High Quality | |
| Acer Predator Helios Neo 16 (2024) (1.3) | |
| SCHENKER XMG Pro 16 Studio (Mid 24) (1.3) | |
| Media della classe Gaming (19.2 - 201, n=144, ultimi 2 anni) | |
| Lenovo Legion Pro 5 16IRX9 G9 (1.3) | |
| Nubia RedMagic Titan 16 Pro (1.3) | |
| Nubia RedMagic Titan 16 Pro (1.3, Gaming Mode ) | |
| Gigabyte G6X 9KG (2024) (1.3) | |
| HP Victus 16 (2024) (1.3) | |
| Media NVIDIA GeForce RTX 4060 Laptop GPU (75.1 - 109.8, n=51) | |
| Strange Brigade - 1920x1080 ultra AA:ultra AF:16 | |
| Media della classe Gaming (38.9 - 420, n=140, ultimi 2 anni) | |
| Acer Predator Helios Neo 16 (2024) (1.47.22.14 D3D12) | |
| SCHENKER XMG Pro 16 Studio (Mid 24) (1.47.22.14 D3D12) | |
| Lenovo Legion Pro 5 16IRX9 G9 (1.47.22.14 D3D12) | |
| Nubia RedMagic Titan 16 Pro (1.47.22.14 D3D12, Gaming Mode ) | |
| Nubia RedMagic Titan 16 Pro (1.47.22.14 D3D12) | |
| Gigabyte G6X 9KG (2024) (1.47.22.14 D3D12) | |
| Media NVIDIA GeForce RTX 4060 Laptop GPU (135.3 - 210, n=50) | |
| HP Victus 16 (2024) (1.47.22.14 D3D12) | |
| Dota 2 Reborn - 1920x1080 ultra (3/3) best looking | |
| Lenovo Legion Pro 5 16IRX9 G9 | |
| Acer Predator Helios Neo 16 (2024) | |
| Nubia RedMagic Titan 16 Pro (Gaming Mode) | |
| SCHENKER XMG Pro 16 Studio (Mid 24) | |
| HP Victus 16 (2024) | |
| Media della classe Gaming (65.1 - 220, n=148, ultimi 2 anni) | |
| Nubia RedMagic Titan 16 Pro | |
| Media NVIDIA GeForce RTX 4060 Laptop GPU (115 - 183.8, n=53) | |
| Gigabyte G6X 9KG (2024) | |
| X-Plane 11.11 - 1920x1080 high (fps_test=3) | |
| Nubia RedMagic Titan 16 Pro (Gaming Mode) | |
| Lenovo Legion Pro 5 16IRX9 G9 | |
| Acer Predator Helios Neo 16 (2024) | |
| SCHENKER XMG Pro 16 Studio (Mid 24) | |
| Nubia RedMagic Titan 16 Pro | |
| Gigabyte G6X 9KG (2024) | |
| Media della classe Gaming (32.8 - 166.2, n=151, ultimi 2 anni) | |
| Media NVIDIA GeForce RTX 4060 Laptop GPU (60.7 - 141.1, n=54) | |
| HP Victus 16 (2024) | |
| Once Human | |
| 1920x1080 Very High Preset | |
| Nubia RedMagic Titan 16 Pro | |
| Media NVIDIA GeForce RTX 4060 Laptop GPU (88.7 - 94.2, n=2) | |
| Media della classe Gaming (14.2 - 94.2, n=2, ultimi 2 anni) | |
| 2560x1440 Very High Preset | |
| Nubia RedMagic Titan 16 Pro | |
| Media della classe Gaming (n=1ultimi 2 anni) | |
| Media NVIDIA GeForce RTX 4060 Laptop GPU (59.1 - 62.3, n=2) | |
| 2560x1440 Very High Preset + Quality FSR | |
| Nubia RedMagic Titan 16 Pro | |
| Media NVIDIA GeForce RTX 4060 Laptop GPU (n=1) | |
| Media della classe Gaming (n=1ultimi 2 anni) | |
| F1 24 | |
| 1920x1080 Ultra High Preset AA:T AF:16x | |
| Media della classe Gaming (54.1 - 148, n=19, ultimi 2 anni) | |
| SCHENKER XMG Pro 16 Studio (Mid 24) | |
| Lenovo Legion Pro 5 16IRX9 G9 | |
| Nubia RedMagic Titan 16 Pro | |
| Media NVIDIA GeForce RTX 4060 Laptop GPU (47.5 - 61.6, n=10) | |
| 2560x1440 Ultra High Preset AA:T AF:16x | |
| Media della classe Gaming (36.7 - 100, n=16, ultimi 2 anni) | |
| SCHENKER XMG Pro 16 Studio (Mid 24) | |
| Nubia RedMagic Titan 16 Pro | |
| Media NVIDIA GeForce RTX 4060 Laptop GPU (24.3 - 38.8, n=6) | |
| 2560x1440 Ultra High Preset + Quality DLSS AF:16x | |
| Media della classe Gaming (59.2 - 150.4, n=12, ultimi 2 anni) | |
| SCHENKER XMG Pro 16 Studio (Mid 24) | |
| Nubia RedMagic Titan 16 Pro | |
| Media NVIDIA GeForce RTX 4060 Laptop GPU (48.6 - 61, n=3) | |
| Ghost of Tsushima | |
| 1920x1080 Very High Preset AA:T | |
| SCHENKER XMG Pro 16 Studio (Mid 24) | |
| Nubia RedMagic Titan 16 Pro | |
| Media NVIDIA GeForce RTX 4060 Laptop GPU (55.6 - 63.4, n=5) | |
| Media della classe Gaming (28.5 - 73.7, n=7, ultimi 2 anni) | |
| 2560x1440 Very High Preset AA:T | |
| SCHENKER XMG Pro 16 Studio (Mid 24) | |
| Nubia RedMagic Titan 16 Pro | |
| Media NVIDIA GeForce RTX 4060 Laptop GPU (41.1 - 47.7, n=3) | |
| Media della classe Gaming (22.7 - 56.1, n=5, ultimi 2 anni) | |
| 2560x1440 Very High Preset + Quality DLSS | |
| SCHENKER XMG Pro 16 Studio (Mid 24) | |
| Media della classe Gaming (63.6 - 74.2, n=3, ultimi 2 anni) | |
| Nubia RedMagic Titan 16 Pro | |
| Media NVIDIA GeForce RTX 4060 Laptop GPU (n=1) | |
| The First Descendant | |
| 1920x1080 Ultra Preset | |
| SCHENKER XMG Pro 16 Studio (Mid 24) | |
| Nubia RedMagic Titan 16 Pro | |
| Media NVIDIA GeForce RTX 4060 Laptop GPU (67.6 - 69.4, n=3) | |
| Media della classe Gaming (15.4 - 80, n=5, ultimi 2 anni) | |
| 2560x1440 Ultra Preset | |
| SCHENKER XMG Pro 16 Studio (Mid 24) | |
| Media della classe Gaming (43.7 - 51.2, n=3, ultimi 2 anni) | |
| Nubia RedMagic Titan 16 Pro | |
| Media NVIDIA GeForce RTX 4060 Laptop GPU (43.5 - 43.7, n=2) | |
| 2560x1440 Ultra Preset + Ultra Ray Tracing + DLSS Quality | |
| SCHENKER XMG Pro 16 Studio (Mid 24) | |
| Media della classe Gaming (43.3 - 51.8, n=2, ultimi 2 anni) | |
| Nubia RedMagic Titan 16 Pro | |
| Media NVIDIA GeForce RTX 4060 Laptop GPU (n=1) | |
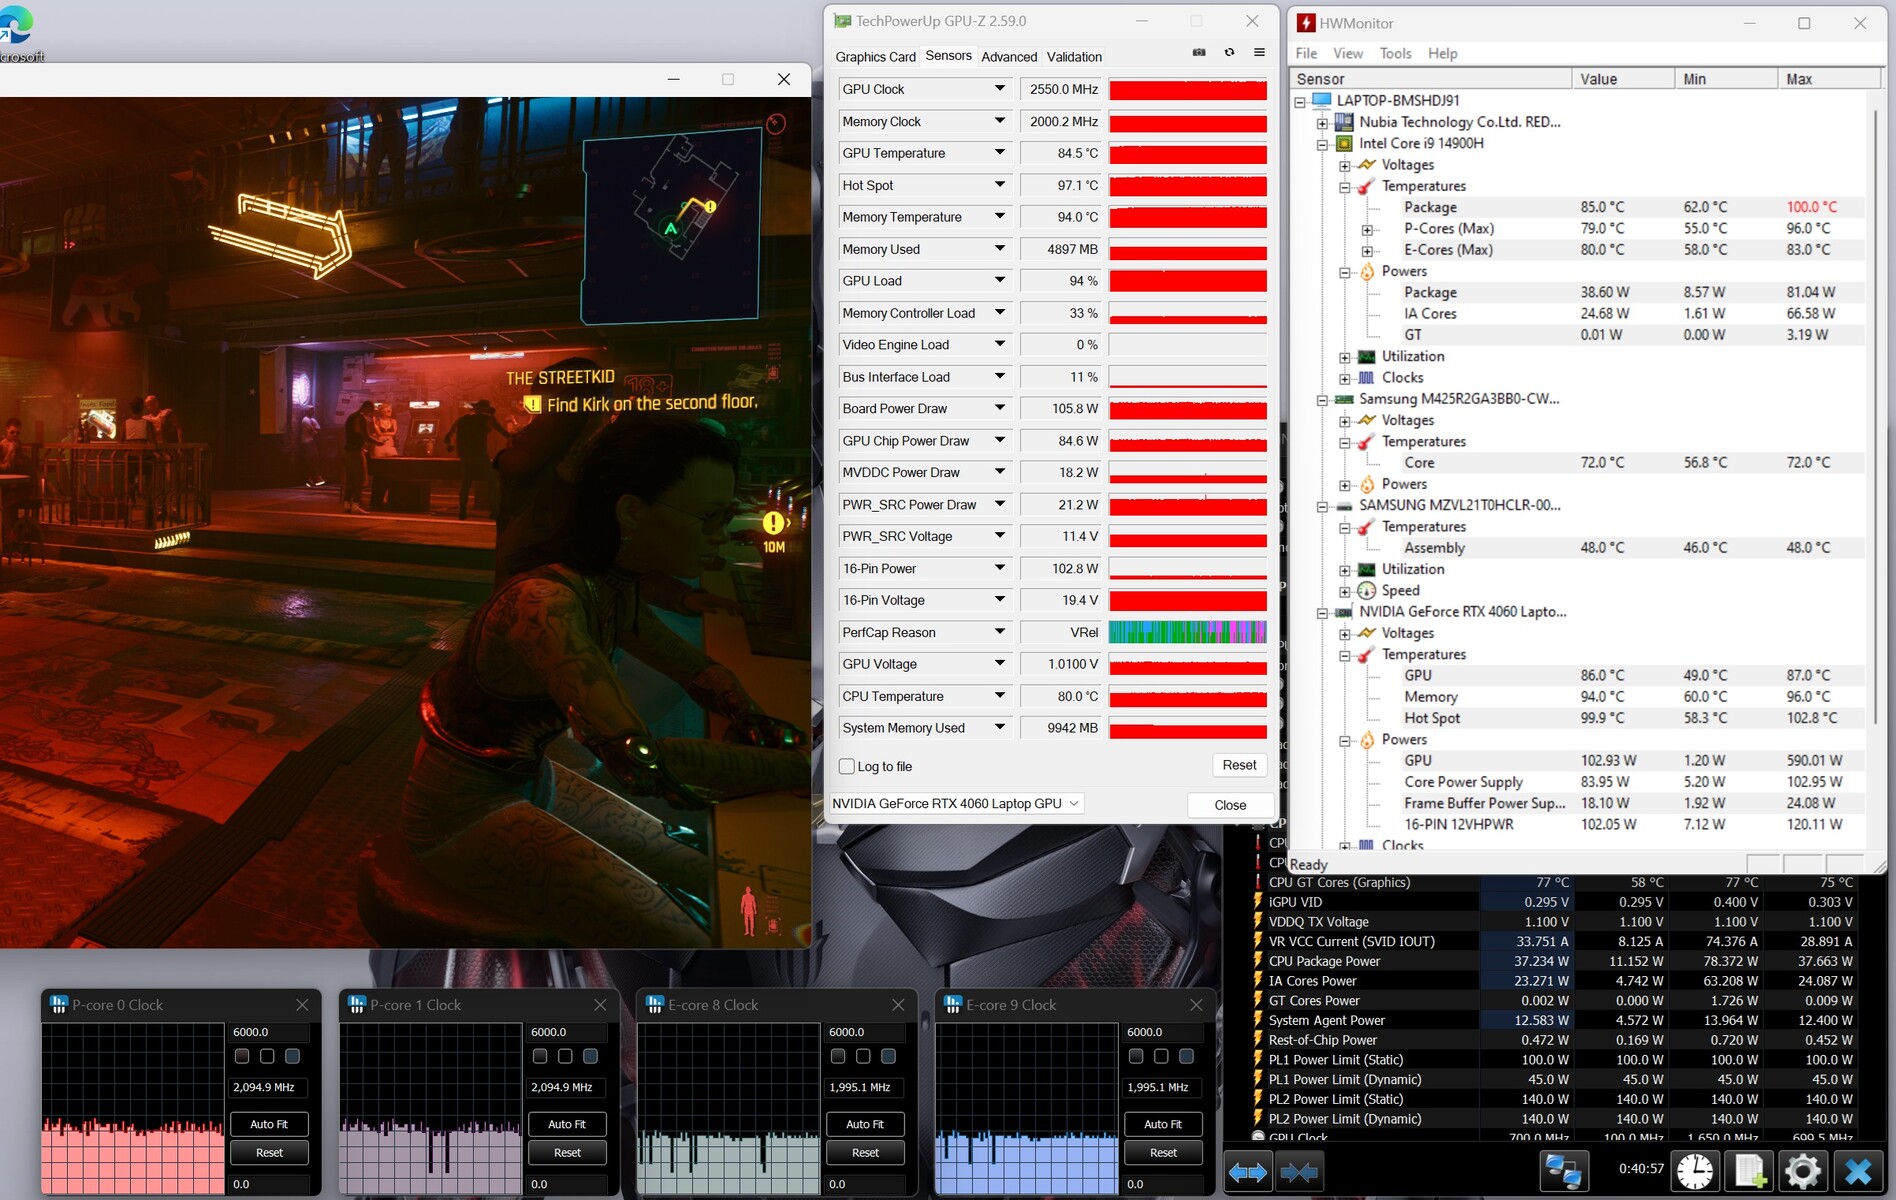
Cyberpunk 2077 Phantom Liberty ha fornito frequenze fotogrammi leggermente fluttuanti ad un livello abbastanza stabile durante il nostro test di 30 minuti (impostazioni massime, FHD). Non abbiamo notato alcun calo notevole delle prestazioni.
Cyberpunk 2077 ultra FPS diagram
| basso | medio | alto | ultra | QHD DLSS | QHD FSR | QHD | |
|---|---|---|---|---|---|---|---|
| GTA V (2015) | 186.1 | 184 | 177.7 | 118.4 | 89.3 | ||
| Dota 2 Reborn (2015) | 206 | 170.9 | 160.2 | 146.9 | |||
| Final Fantasy XV Benchmark (2018) | 199.7 | 146 | 105.4 | 76.9 | |||
| X-Plane 11.11 (2018) | 167 | 142.8 | 117.2 | ||||
| Strange Brigade (2018) | 480 | 277 | 219 | 189.2 | 126.9 | ||
| Baldur's Gate 3 (2023) | 140.3 | 110.8 | 97.5 | 96.5 | 65.9 | ||
| Cyberpunk 2077 2.2 Phantom Liberty (2023) | 121.4 | 101.1 | 86.2 | 74.7 | 46.9 | ||
| Dragon's Dogma 2 (2024) | 71.9 | 67.7 | 52.9 | ||||
| Ghost of Tsushima (2024) | 91.3 | 86.8 | 78.2 | 63.4 | 63.6 | 47.7 | |
| F1 24 (2024) | 243 | 225 | 175.8 | 58.8 | 36.7 | ||
| The First Descendant (2024) | 159 | 100.9 | 80.6 | 69.4 | 43.7 | ||
| Once Human (2024) | 164.8 | 132.9 | 108.3 | 94.2 | 76.5 | 62.3 |
Emissioni - Troppo forte, troppo caldo
Emissioni di rumore
Il Titan non è affatto un portatile silenzioso. Anche in modalità idle, le due ventole sono costantemente udibili. Cyberpunk ha fatto salire il livello a 50 dB(A)( modalitàbilanciata ) o a 53 dB(A)( modalitàgaming ). La modalità Ufficio ha prodotto un valore solo leggermente più moderato di 47 dB(A). Le ventole sono più silenziose in modalità batteria e a volte rimangono ferme.
Rumorosità
| Idle |
| 35 / 36 / 40 dB(A) |
| Sotto carico |
| 49 / 52 dB(A) |
 | ||
30 dB silenzioso 40 dB(A) udibile 50 dB(A) rumoroso |
||
min: | ||
| Nubia RedMagic Titan 16 Pro NVIDIA GeForce RTX 4060 Laptop GPU, i9-14900HX, Samsung PM9A1 MZVL21T0HCLR | Lenovo Legion Pro 5 16IRX9 G9 NVIDIA GeForce RTX 4060 Laptop GPU, i7-14700HX, Samsung PM9A1 MZVL21T0HCLR | HP Victus 16 (2024) NVIDIA GeForce RTX 4060 Laptop GPU, i7-14700HX, Kioxia XG8 KXG80ZNV512G | Acer Predator Helios Neo 16 (2024) NVIDIA GeForce RTX 4070 Laptop GPU, i7-14700HX, Samsung PM9A1a MZVL21T0HDLU | SCHENKER XMG Pro 16 Studio (Mid 24) NVIDIA GeForce RTX 4070 Laptop GPU, i9-14900HX, Samsung 990 Pro 1 TB | Gigabyte G6X 9KG (2024) NVIDIA GeForce RTX 4060 Laptop GPU, i7-13650HX, Gigabyte AG450E1024-SI | |
|---|---|---|---|---|---|---|
| Noise | 17% | 13% | 10% | 5% | 5% | |
| off /ambiente * | 26 | 23 12% | 25 4% | 25.2 3% | 25 4% | 26 -0% |
| Idle Minimum * | 35 | 23 34% | 28 20% | 27.8 21% | 28 20% | 30 14% |
| Idle Average * | 36 | 23 36% | 29 19% | 32 11% | 31 14% | 32 11% |
| Idle Maximum * | 40 | 25 37% | 33 17% | 29.6 26% | 35 12% | 35 12% |
| Load Average * | 49 | 45.18 8% | 45 8% | 45.2 8% | 52 -6% | 51 -4% |
| Cyberpunk 2077 ultra * | 50 | 52.69 -5% | 53 -6% | |||
| Load Maximum * | 52 | 53.13 -2% | 48 8% | 55.8 -7% | 52 -0% | 54 -4% |
| Witcher 3 ultra * | 43 | 51 |
* ... Meglio usare valori piccoli
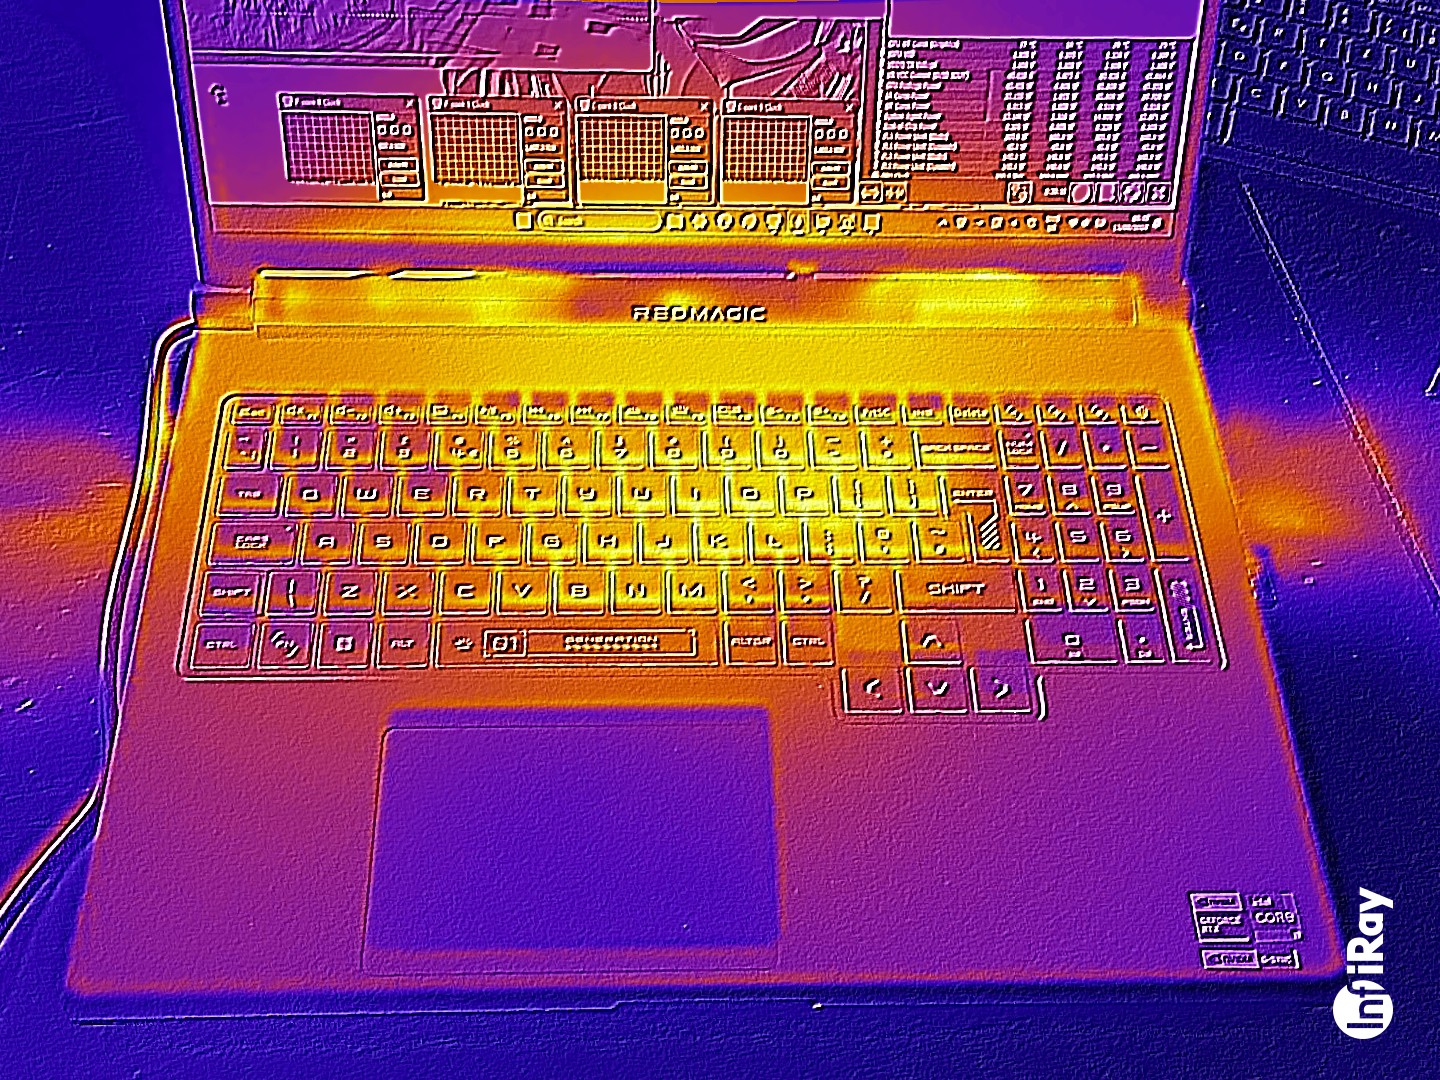
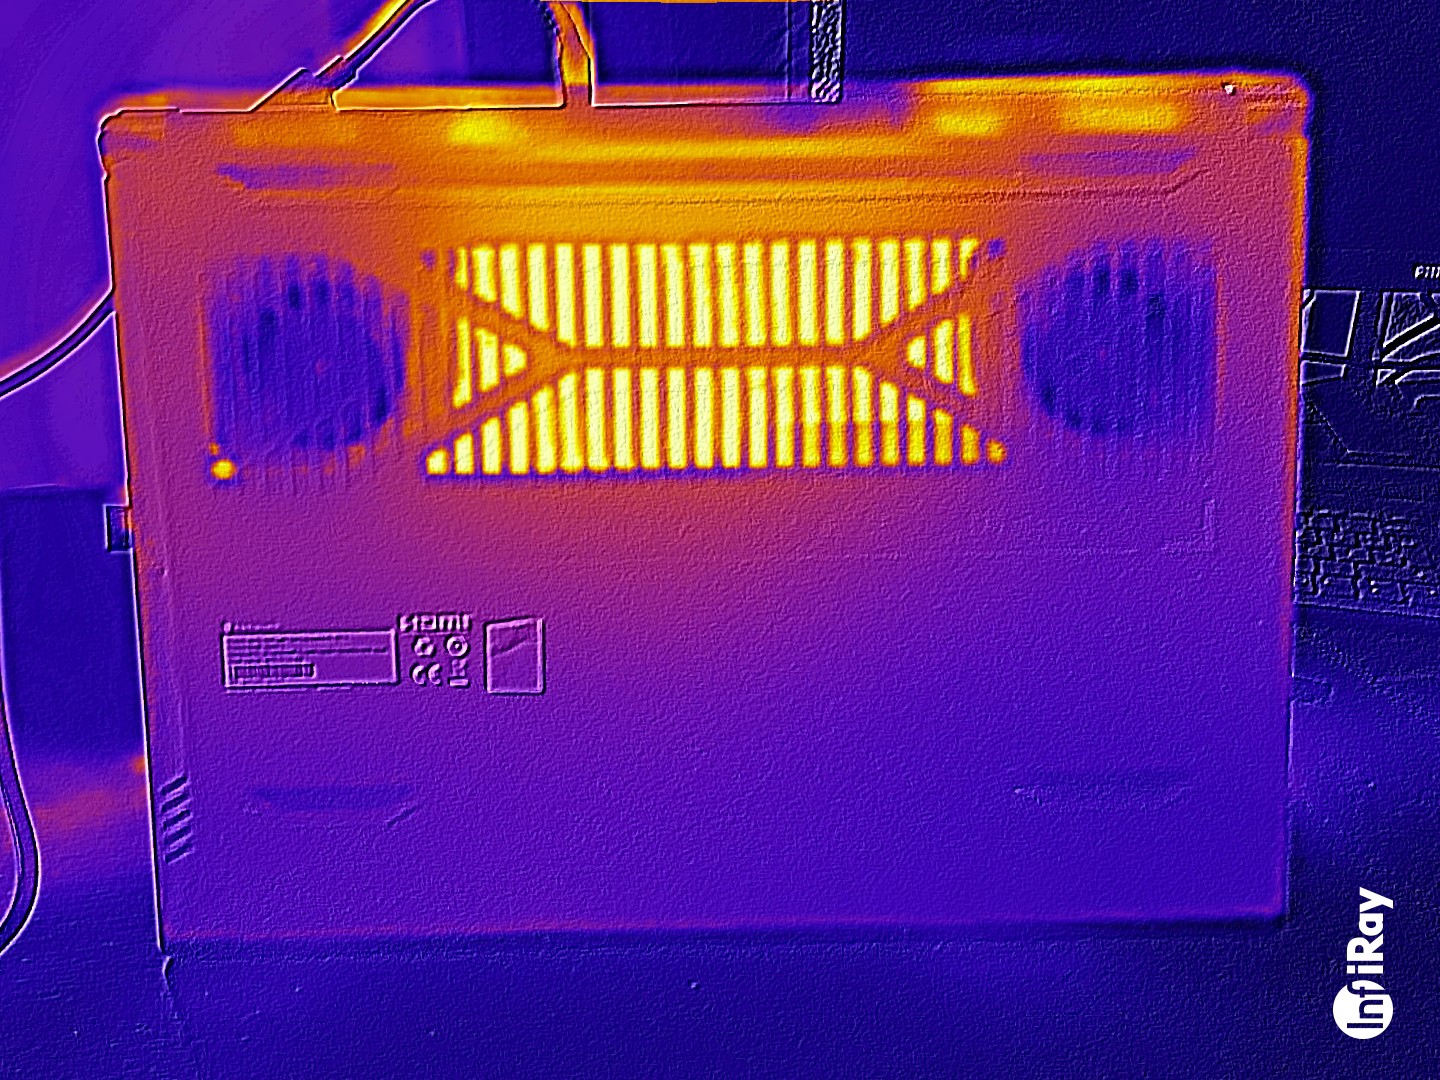
Temperatura
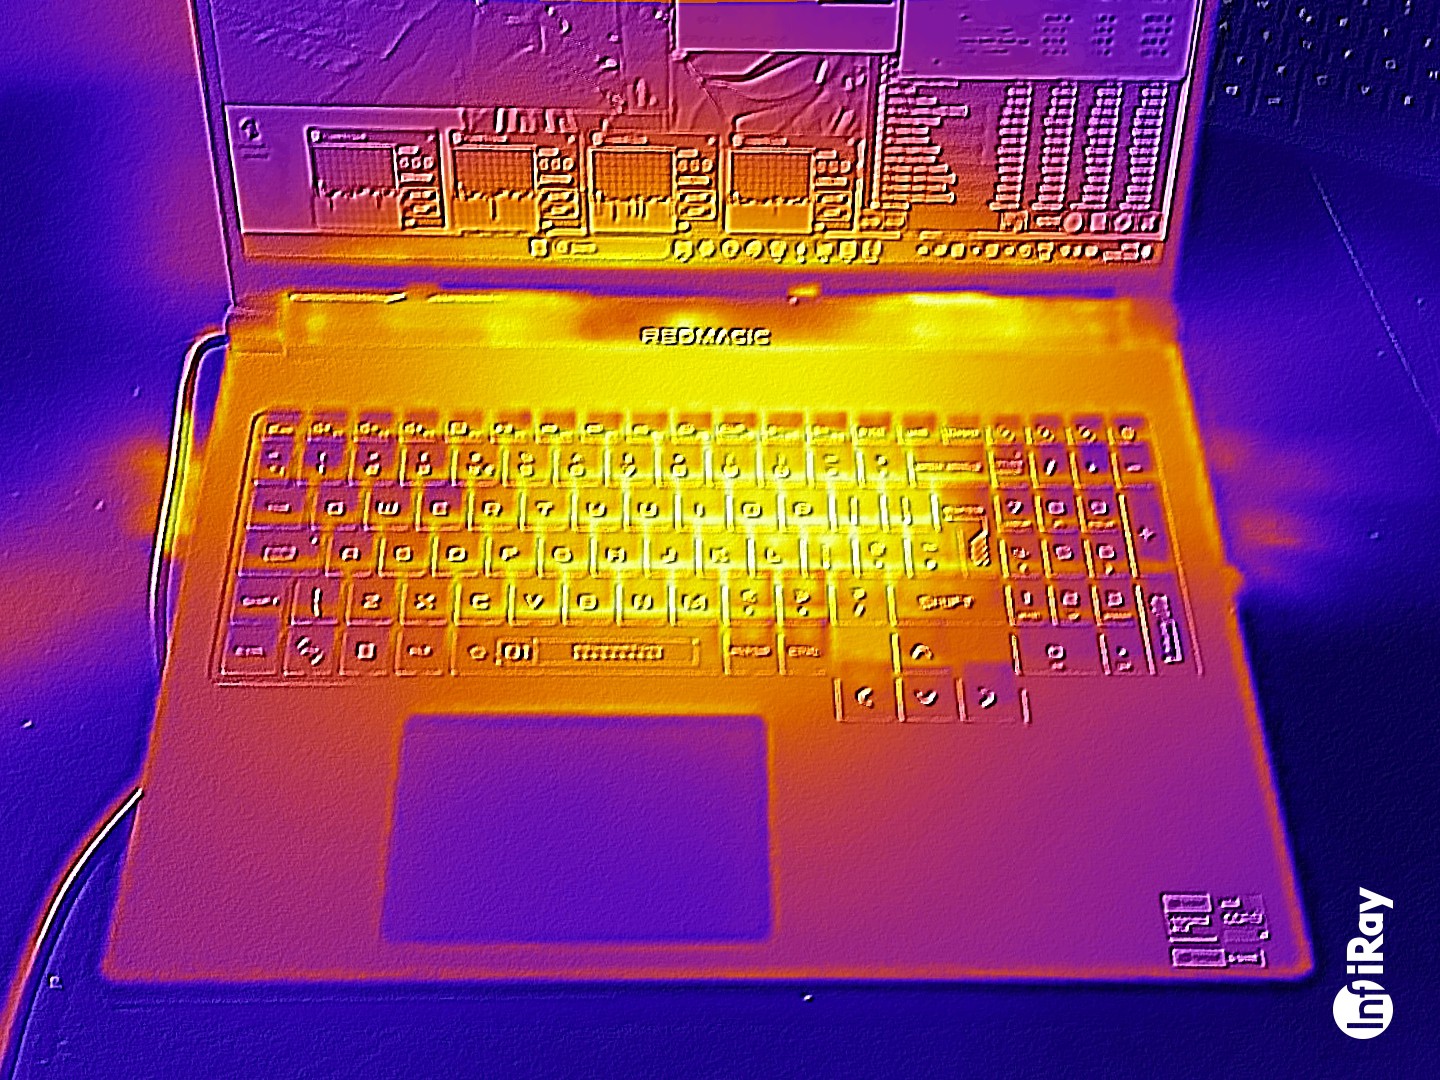
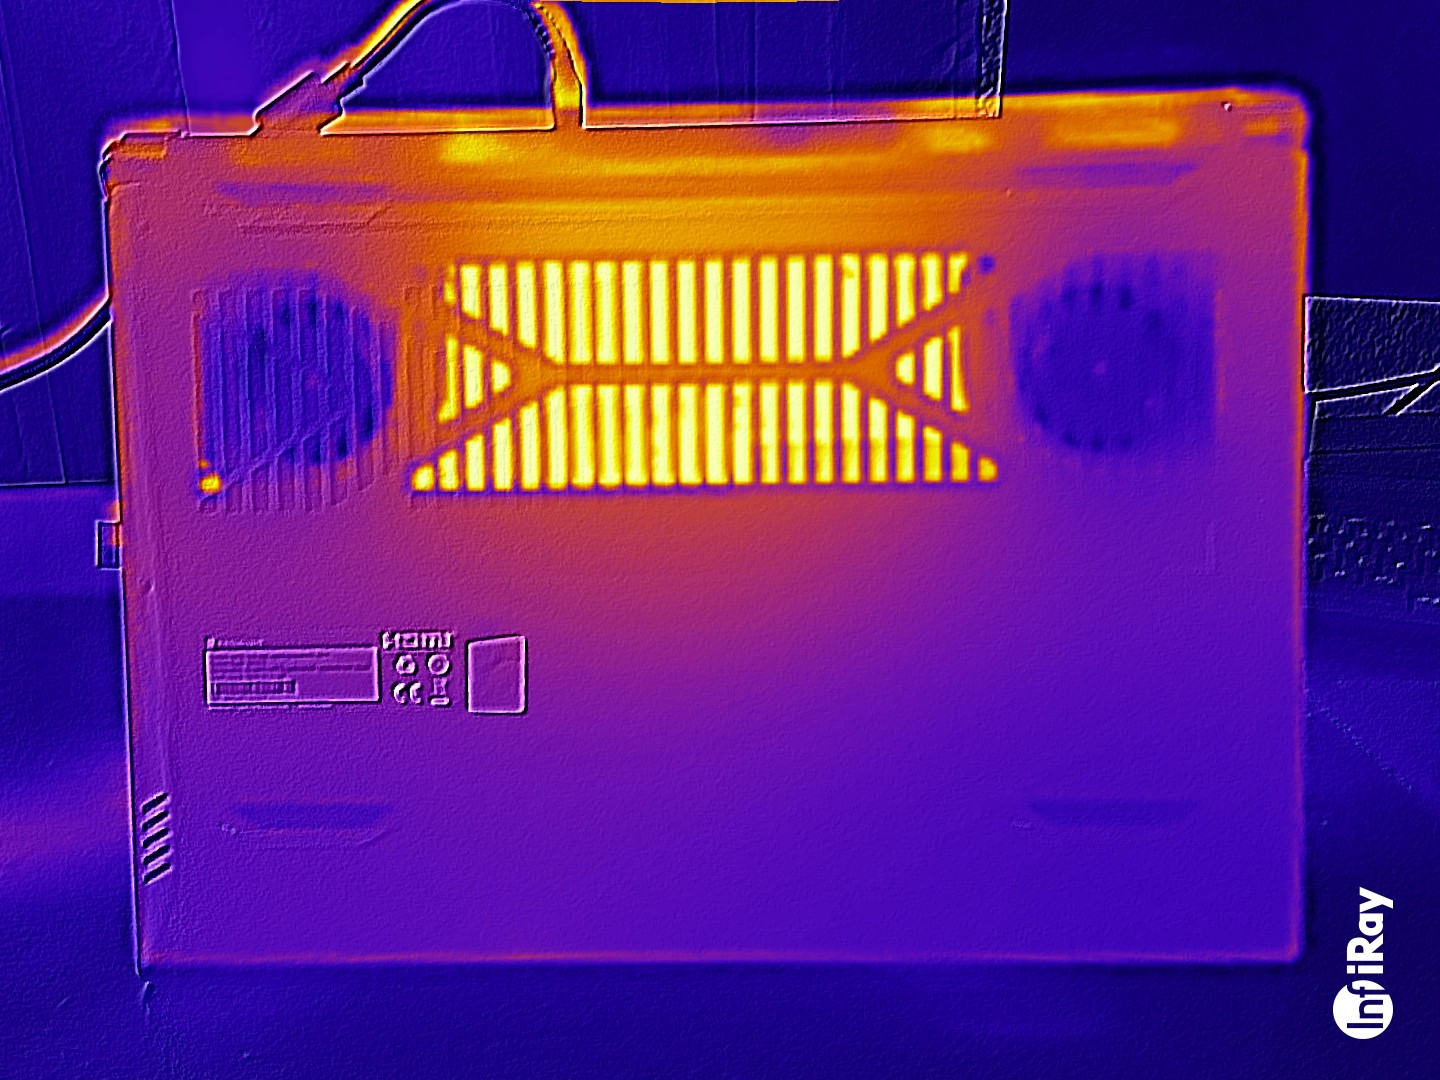
Il portatile si riscalda notevolmente sotto carico: Cyberpunk 2077 e lo stress test hanno causato temperature superiori a 50 gradi Celsius in alcuni punti. Le temperature del palm rest erano talvolta quasi troppo calde. Abbiamo notato anche valori superiori alla media in modalità idle.
(-) La temperatura massima sul lato superiore è di 50 °C / 122 F, rispetto alla media di 40.4 °C / 105 F, che varia da 21.2 a 68.8 °C per questa classe Gaming.
(-) Il lato inferiore si riscalda fino ad un massimo di 58 °C / 136 F, rispetto alla media di 43.2 °C / 110 F
(+) In idle, la temperatura media del lato superiore è di 30.4 °C / 87 F, rispetto alla media deld ispositivo di 33.9 °C / 93 F.
(-) 3: The average temperature for the upper side is 45.1 °C / 113 F, compared to the average of 33.9 °C / 93 F for the class Gaming.
(-) I poggiapolsi e il touchpad possono diventare molto caldi al tatto con un massimo di 40 °C / 104 F.
(-) La temperatura media della zona del palmo della mano di dispositivi simili e'stata di 28.9 °C / 84 F (-11.1 °C / -20 F).
| Nubia RedMagic Titan 16 Pro Intel Core i9-14900HX, NVIDIA GeForce RTX 4060 Laptop GPU | Lenovo Legion Pro 5 16IRX9 G9 Intel Core i7-14700HX, NVIDIA GeForce RTX 4060 Laptop GPU | HP Victus 16 (2024) Intel Core i7-14700HX, NVIDIA GeForce RTX 4060 Laptop GPU | Acer Predator Helios Neo 16 (2024) Intel Core i7-14700HX, NVIDIA GeForce RTX 4070 Laptop GPU | SCHENKER XMG Pro 16 Studio (Mid 24) Intel Core i9-14900HX, NVIDIA GeForce RTX 4070 Laptop GPU | Gigabyte G6X 9KG (2024) Intel Core i7-13650HX, NVIDIA GeForce RTX 4060 Laptop GPU | |
|---|---|---|---|---|---|---|
| Heat | -9% | 13% | -3% | -13% | 6% | |
| Maximum Upper Side * | 50 | 50 -0% | 50 -0% | 58 -16% | 51 -2% | 41 18% |
| Maximum Bottom * | 58 | 57 2% | 50 14% | 45.2 22% | 66 -14% | 43 26% |
| Idle Upper Side * | 31 | 36 -16% | 25 19% | 31.1 -0% | 35 -13% | 32 -3% |
| Idle Bottom * | 32 | 39 -22% | 26 19% | 37.2 -16% | 39 -22% | 37 -16% |
* ... Meglio usare valori piccoli
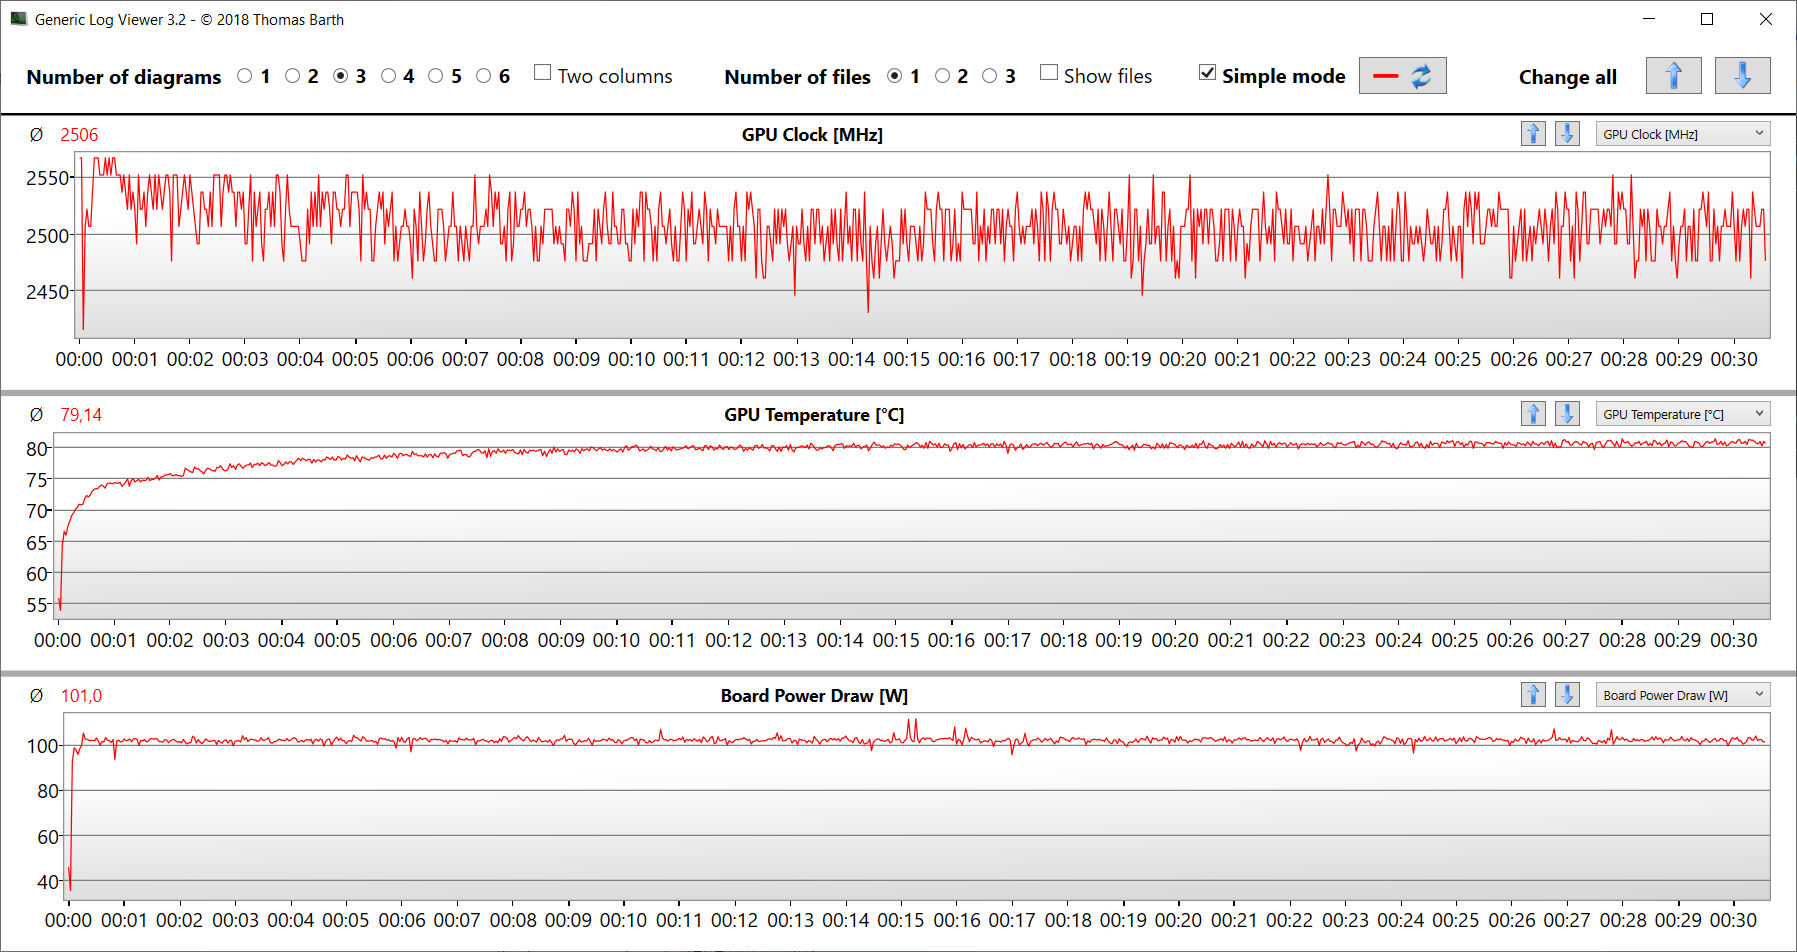
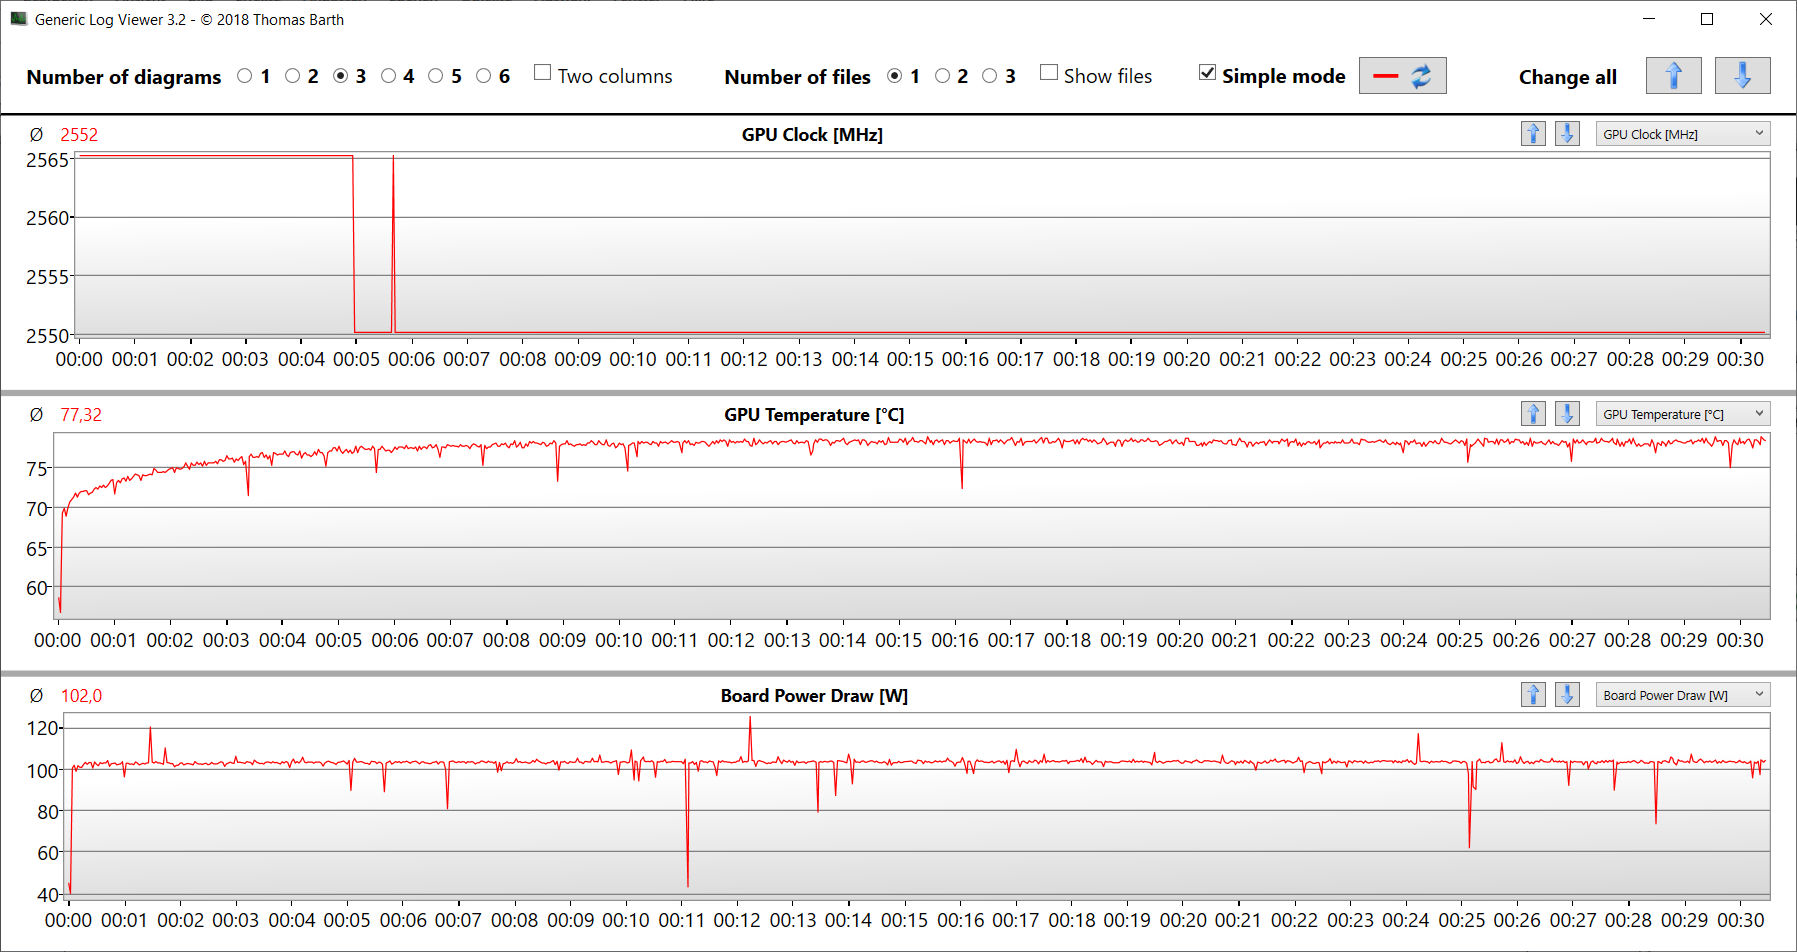
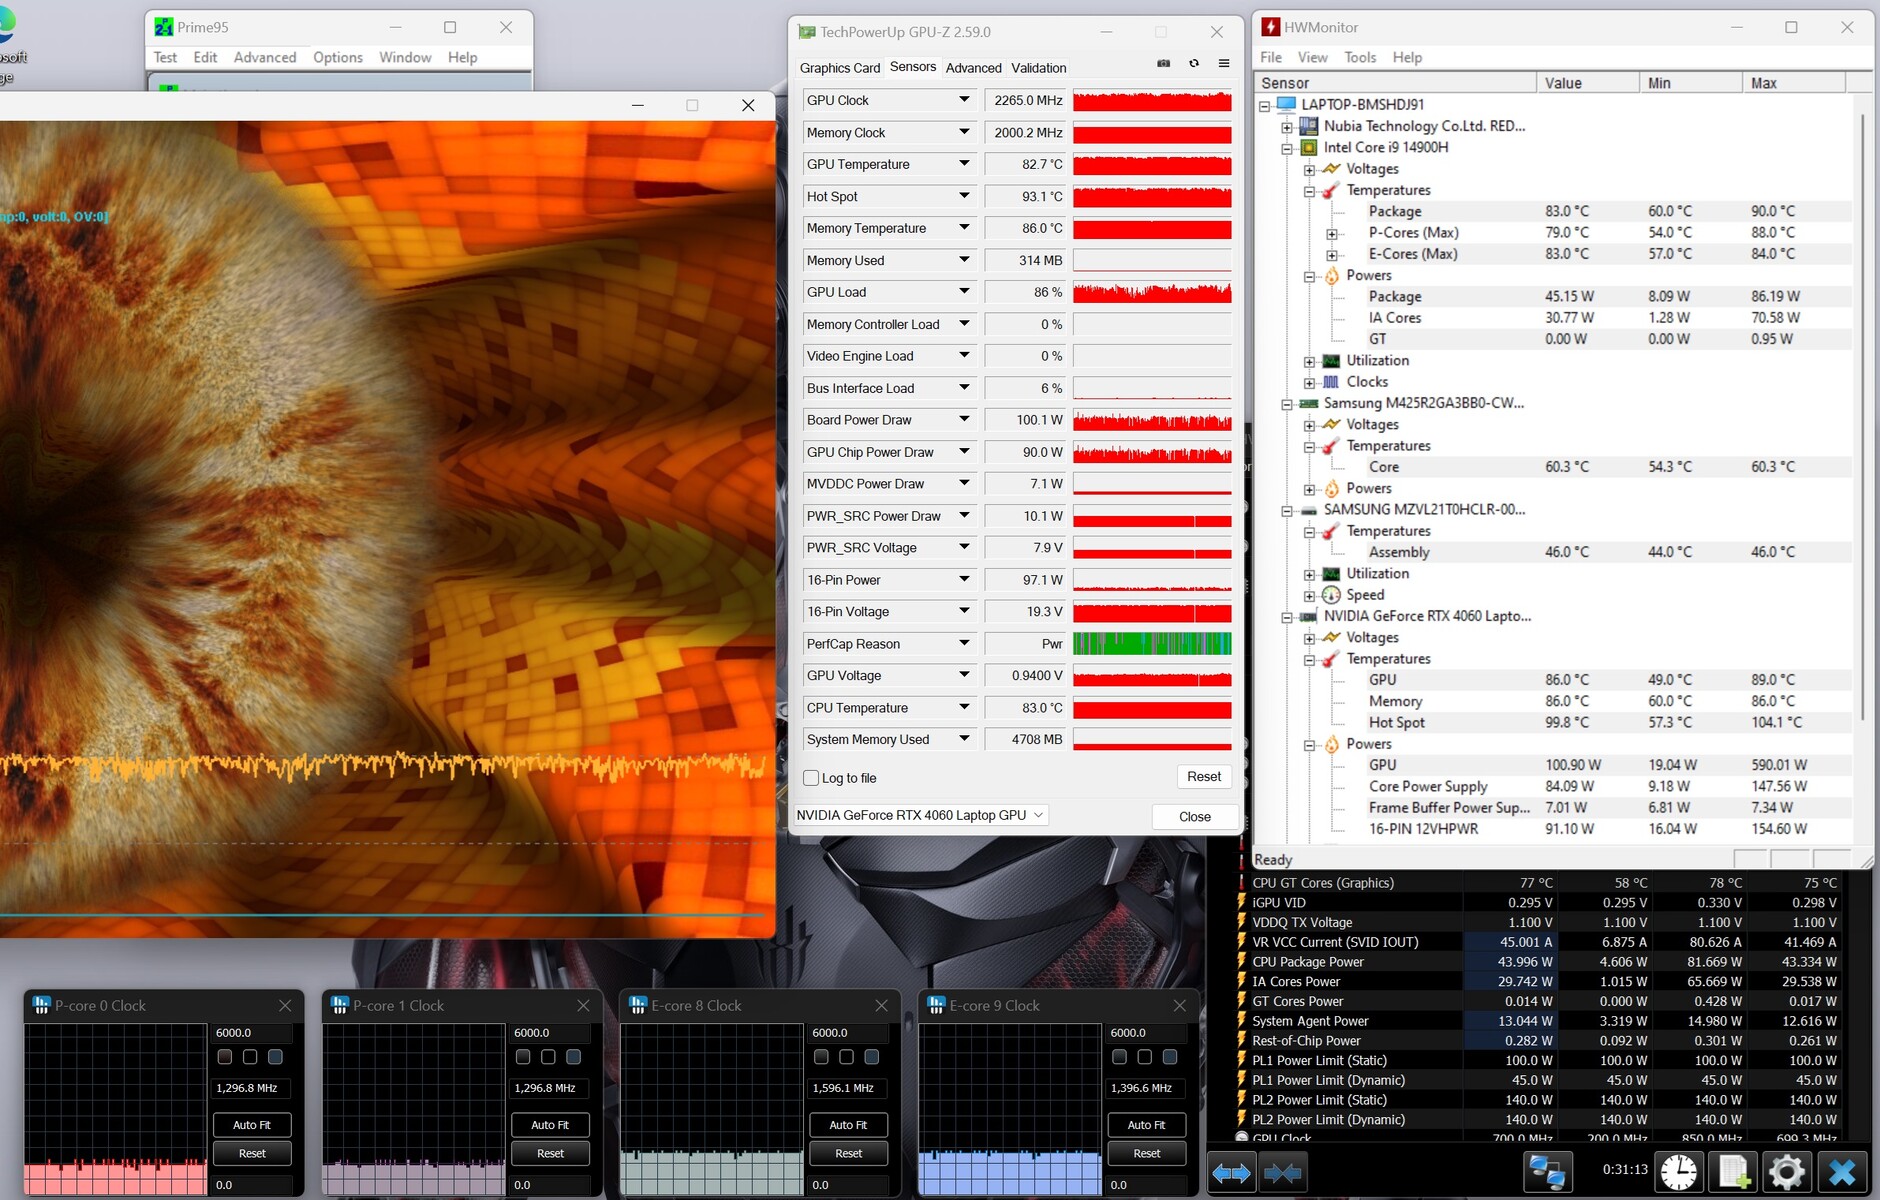
Test da sforzo
Lo scenario di stress test estremo (Prime95 e Furmark in funzionamento continuo) ha verificato la stabilità del sistema a pieno carico. La CPU ha funzionato a velocità di clock elevate all'inizio del test, ma poi è stata strozzata a valori inferiori a 2 GHz. La GPU ha lavorato alla massima potenza.
Altoparlanti
Gli altoparlanti stereo producono un suono abbastanza decente nel complesso. I bassi potrebbero essere un po' più pronunciati.
Nubia RedMagic Titan 16 Pro analisi audio
(+) | gli altoparlanti sono relativamente potenti (84 dB)
Bassi 100 - 315 Hz
(±) | bassi ridotti - in media 14.3% inferiori alla media
(±) | la linearità dei bassi è media (11.3% delta rispetto alla precedente frequenza)
Medi 400 - 2000 Hz
(+) | medi bilanciati - solo only 1.8% rispetto alla media
(+) | medi lineari (4.9% delta rispetto alla precedente frequenza)
Alti 2 - 16 kHz
(+) | Alti bilanciati - appena 2.7% dalla media
(+) | alti lineari (5.4% delta rispetto alla precedente frequenza)
Nel complesso 100 - 16.000 Hz
(+) | suono nel complesso lineare (11.5% differenza dalla media)
Rispetto alla stessa classe
» 9% di tutti i dispositivi testati in questa classe è stato migliore, 3% simile, 88% peggiore
» Il migliore ha avuto un delta di 6%, medio di 18%, peggiore di 132%
Rispetto a tutti i dispositivi testati
» 6% di tutti i dispositivi testati in questa classe è stato migliore, 2% similare, 92% peggiore
» Il migliore ha avuto un delta di 4%, medio di 24%, peggiore di 134%
Lenovo Legion Pro 5 16IRX9 G9 analisi audio
(±) | potenza degli altiparlanti media ma buona (77.13 dB)
Bassi 100 - 315 Hz
(-) | quasi nessun basso - in media 18.3% inferiori alla media
(±) | la linearità dei bassi è media (12% delta rispetto alla precedente frequenza)
Medi 400 - 2000 Hz
(±) | medi elevati - circa 6.9% superiore alla media
(+) | medi lineari (4.9% delta rispetto alla precedente frequenza)
Alti 2 - 16 kHz
(+) | Alti bilanciati - appena 4.5% dalla media
(±) | la linearità degli alti è media (9.5% delta rispetto alla precedente frequenza)
Nel complesso 100 - 16.000 Hz
(±) | la linearità complessiva del suono è media (21.6% di differenza rispetto alla media
Rispetto alla stessa classe
» 76% di tutti i dispositivi testati in questa classe è stato migliore, 5% simile, 19% peggiore
» Il migliore ha avuto un delta di 6%, medio di 18%, peggiore di 132%
Rispetto a tutti i dispositivi testati
» 59% di tutti i dispositivi testati in questa classe è stato migliore, 7% similare, 34% peggiore
» Il migliore ha avuto un delta di 4%, medio di 24%, peggiore di 134%
Gestione dell'energia - Il Titan 16 offre tempi di esecuzione mediocri
Consumo di energia
Il suo consumo energetico è normale per l'hardware installato. Cyberpunk 2077 e lo stress test sono stati eseguiti con un consumo energetico costante. L'alimentatore (280 watt) è di dimensioni sufficienti.
| Off / Standby | |
| Idle | |
| Sotto carico |
|
Leggenda:
min: | |
| Nubia RedMagic Titan 16 Pro i9-14900HX, NVIDIA GeForce RTX 4060 Laptop GPU | Lenovo Legion Pro 5 16IRX9 G9 i7-14700HX, NVIDIA GeForce RTX 4060 Laptop GPU | HP Victus 16 (2024) i7-14700HX, NVIDIA GeForce RTX 4060 Laptop GPU | Acer Predator Helios Neo 16 (2024) i7-14700HX, NVIDIA GeForce RTX 4070 Laptop GPU | SCHENKER XMG Pro 16 Studio (Mid 24) i9-14900HX, NVIDIA GeForce RTX 4070 Laptop GPU | Gigabyte G6X 9KG (2024) i7-13650HX, NVIDIA GeForce RTX 4060 Laptop GPU | Media NVIDIA GeForce RTX 4060 Laptop GPU | Media della classe Gaming | |
|---|---|---|---|---|---|---|---|---|
| Power Consumption | -4% | 16% | -23% | -35% | 17% | 21% | 7% | |
| Idle Minimum * | 16 | 13.7 14% | 9 44% | 26.7 -67% | 31 -94% | 12 25% | 11.5 ? 28% | 13.4 ? 16% |
| Idle Average * | 19 | 17.7 7% | 15 21% | 24.4 -28% | 33 -74% | 13 32% | 16 ? 16% | 18.9 ? 1% |
| Idle Maximum * | 27 | 18.5 31% | 23 15% | 32.7 -21% | 41 -52% | 27 -0% | 20.3 ? 25% | 26.3 ? 3% |
| Load Average * | 123 | 124 -1% | 123 -0% | 122.1 1% | 114 7% | 105 15% | 92.9 ? 24% | 102.7 ? 17% |
| Cyberpunk 2077 ultra external monitor * | 174.2 | 224 -29% | 196.8 -13% | |||||
| Cyberpunk 2077 ultra * | 184.3 | 229 -24% | 218 -18% | |||||
| Load Maximum * | 240 | 297 -24% | 241 -0% | 241 -0% | 250 -4% | 210 12% | 210 ? 12% | 244 ? -2% |
| Witcher 3 ultra * | 143.7 | 190.6 | 167.8 |
* ... Meglio usare valori piccoli
Power consumption Cyberpunk / stress test
Power consumption with external monitor
Tempi di esecuzione
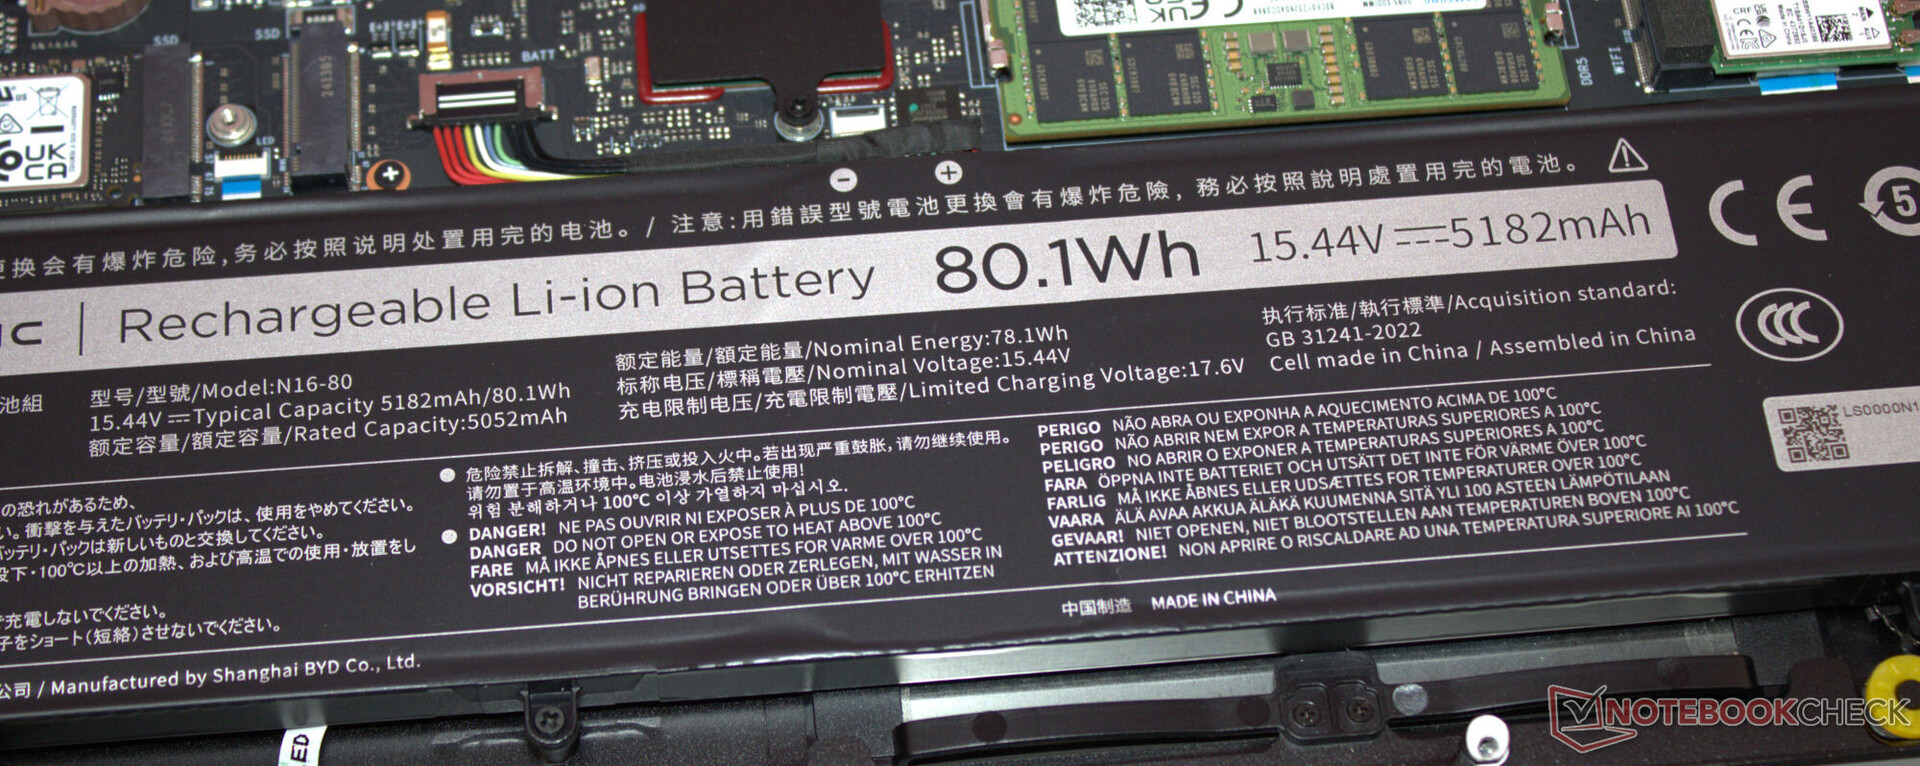
Il dispositivo da 16 pollici ha raggiunto tempi di esecuzione di 4:40 ore durante il test WiFi (accesso a siti web utilizzando uno script) e di 5:16 ore durante il test video (cortometraggio Big Buck Bunny (codifica H.264, FHD) in loop) - non sono valori eccezionali. Alcuni dei suoi concorrenti durano molto di più.
| Nubia RedMagic Titan 16 Pro i9-14900HX, NVIDIA GeForce RTX 4060 Laptop GPU, 80.1 Wh | Lenovo Legion Pro 5 16IRX9 G9 i7-14700HX, NVIDIA GeForce RTX 4060 Laptop GPU, 80 Wh | HP Victus 16 (2024) i7-14700HX, NVIDIA GeForce RTX 4060 Laptop GPU, 83 Wh | Acer Predator Helios Neo 16 (2024) i7-14700HX, NVIDIA GeForce RTX 4070 Laptop GPU, 90.61 Wh | SCHENKER XMG Pro 16 Studio (Mid 24) i9-14900HX, NVIDIA GeForce RTX 4070 Laptop GPU, 73 Wh | Gigabyte G6X 9KG (2024) i7-13650HX, NVIDIA GeForce RTX 4060 Laptop GPU, 73 Wh | Media della classe Gaming | |
|---|---|---|---|---|---|---|---|
| Autonomia della batteria | 16% | 83% | -16% | 20% | 69% | 28% | |
| Reader / Idle | 481 | 356 -26% | 585 ? 22% | ||||
| H.264 | 316 | 312 -1% | 242 -23% | 447 ? 41% | |||
| WiFi v1.3 | 280 | 308 10% | 511 83% | 227 -19% | 337 20% | 474 69% | 387 ? 38% |
| Load | 76 | 105 38% | 79 4% | 84.5 ? 11% |
Pro
Contro
Verdetto - C'è spazio per i miglioramenti
A Core i9-14900HX e una GeForce RTX 4060 assicurano il gioco in QHD con impostazioni da alte a massime. L'hardware installato non viene sfruttato al massimo, in quanto la RAM funziona in modalità a canale singolo. Si consiglia di installare un secondo modulo di memoria.
Il prodotto di debutto di Nubia fa quello per cui è stato progettato: Portare i giochi sul suo schermo in modo fluido. Ma la concorrenza non ha esattamente bisogno di un motivo per avere paura.
I suoi valori di emissione sono estremamente deludenti: Il portatile produce (troppo) rumore nell'intera gamma di carico, e in più si riscalda molto. Il suo schermo IPS luminoso e a colori reali (16 pollici, 2.560 x 1.600 pixel, 240 Hz, G-Sync, DCI-P3) con un rapporto di aspetto 16:10 adatto al lavoro, invece, ci ha lasciato una buona impressione.
La durata della batteria del portatile non lascerà a bocca aperta nessuno. Ci si aspetta (un po') di più da un portatile da gioco con una batteria da 80 Wh. Almeno la porta USB-C installata (Thunderbolt 4) supporta Power Delivery (e la modalità DP Alt). Ciò significa che non dovrà necessariamente portare sempre con sé l'ingombrante alimentatore proprietario.
Un fatto che dovrebbe considerare prima di acquistare il dispositivo: A differenza di produttori affermati come Acer, Lenovo o HP, Nubia non ha una presenza globale. Di conseguenza, non è possibile valutare quale sarà la situazione per quanto riguarda la fornitura di pezzi di ricambio, l'assistenza e le riparazioni.
Il prezzo di 1.699 dollari non depone certo a favore del portatile: Ad esempio, una configurazione quasi identica del Acer Predator Helios Neo 16 (ad eccezione della RAM, che è di 32 GB invece di 16 GB) costa attualmente solo 1.350 dollari. Un'altra alternativa potrebbe essere il XMG Pro 16 Studio (Mid 24). Il prezzo per una versione comparabile di questo dispositivo è di circa 2.000 dollari (con Windows 11) o 1.950 dollari (senza Windows come sistema operativo).
Prezzo e disponibilità
Nubia RedMagic Titan 16 Pro è disponibile dal 29/08/2024 e può essere acquistato a 1.699 dollari tramite il negozio RedMagic.
Attenzione: abbiamo recentemente aggiornato il nostro sistema di valutazione e i risultati della versione 8 non sono confrontabili con quelli della versione 7. Maggiori informazioni sono disponibili su qui.
Nubia RedMagic Titan 16 Pro
- 08/21/2024 v8
Sascha Mölck
 Total Sustainability Score:
 Transparency
La selezione dei dispositivi da recensire viene effettuata dalla nostra redazione. Il campione di prova è stato fornito all'autore come prestito dal produttore o dal rivenditore ai fini di questa recensione. L'istituto di credito non ha avuto alcuna influenza su questa recensione, né il produttore ne ha ricevuto una copia prima della pubblicazione. Non vi era alcun obbligo di pubblicare questa recensione. Non accettiamo mai compensi o pagamenti in cambio delle nostre recensioni. In quanto società mediatica indipendente, Notebookcheck non è soggetta all'autorità di produttori, rivenditori o editori.
Ecco come Notebookcheck esegue i test
Ogni anno, Notebookcheck esamina in modo indipendente centinaia di laptop e smartphone utilizzando procedure standardizzate per garantire che tutti i risultati siano comparabili. Da circa 20 anni sviluppiamo continuamente i nostri metodi di prova e nel frattempo stabiliamo gli standard di settore. Nei nostri laboratori di prova, tecnici ed editori esperti utilizzano apparecchiature di misurazione di alta qualità. Questi test comportano un processo di validazione in più fasi. Il nostro complesso sistema di valutazione si basa su centinaia di misurazioni e parametri di riferimento ben fondati, che mantengono l'obiettività.Price comparison

