

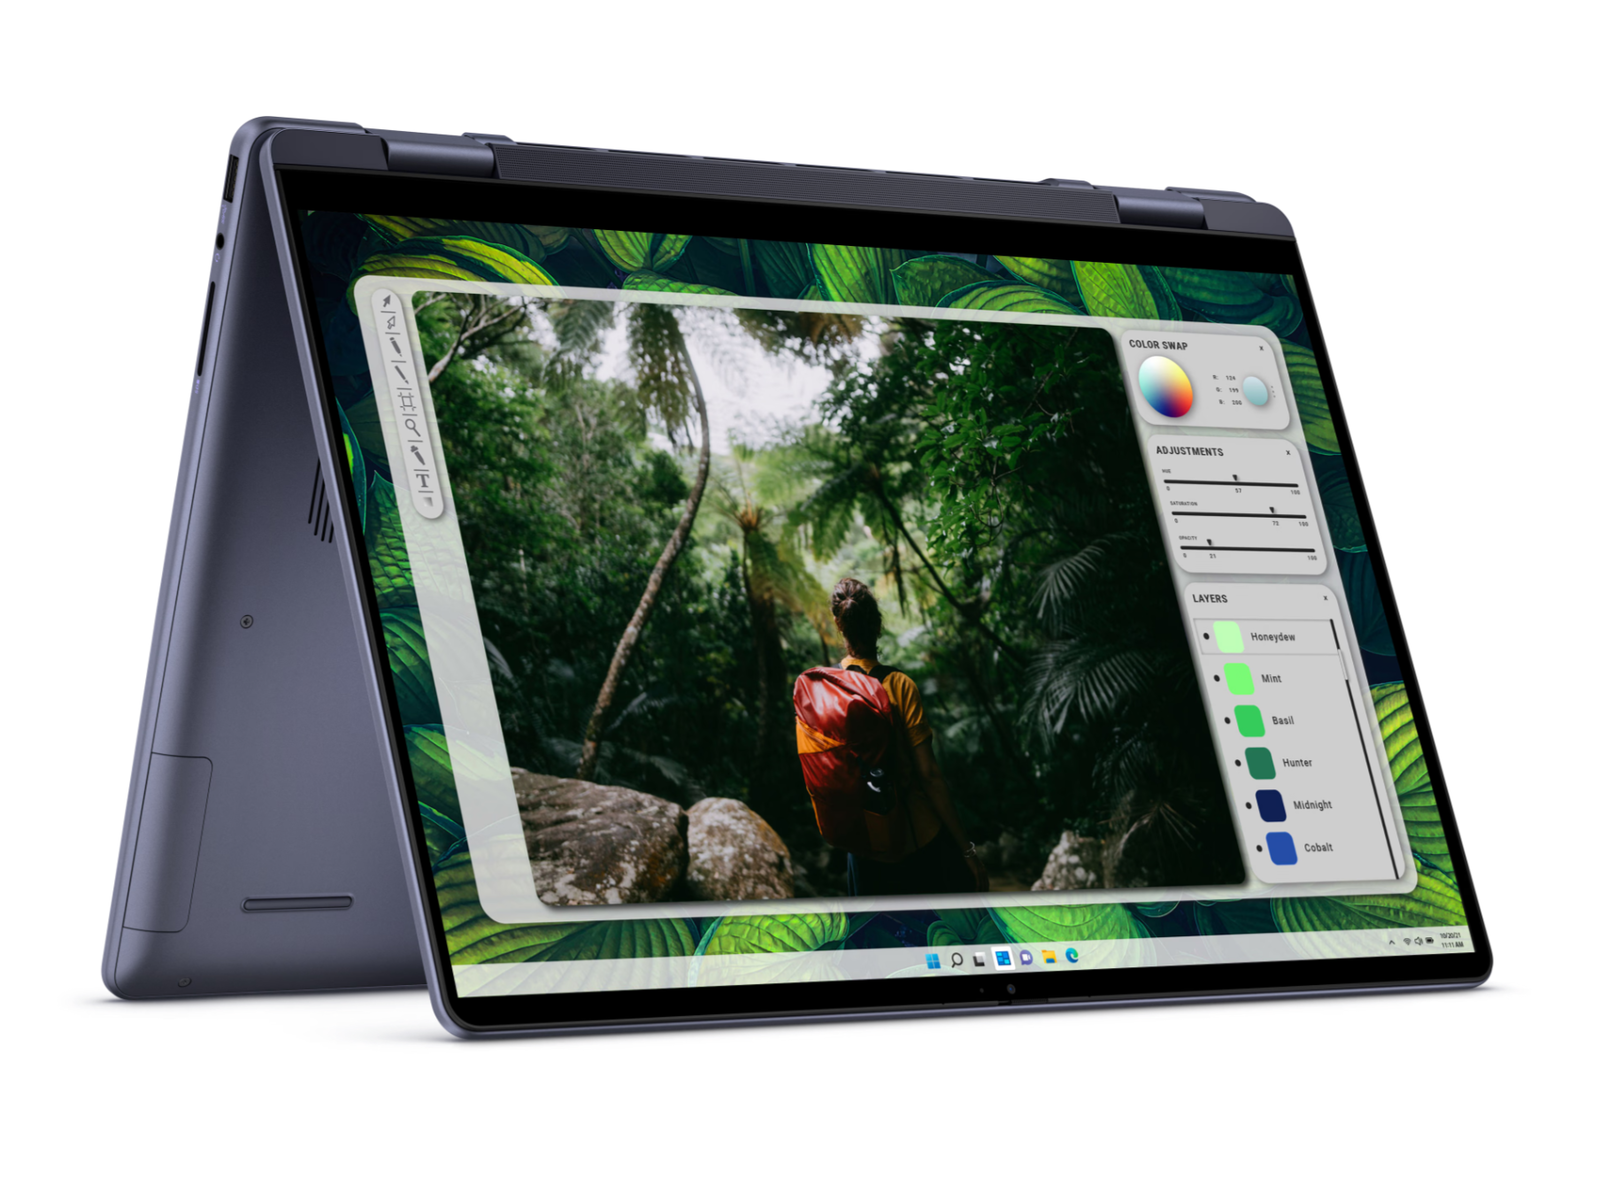
Recensione del Dell Inspiron 16 7640 2-in-1: Mini-LED su un convertibile da 16 pollici

L'Inspiron 16 7640 2-in-1 del 2024 succede all'Inspiron 16 7630 2-in-1 del 2023 con interni aggiornati della 14esima generazione di Intel e diverse modifiche esterne. Forse la cosa più importante è che il modello di quest'anno include un touchscreen mini-LED da 90 Hz e 1600p, che sostituisce il touchscreen OLED da 2400p dell'Inspiron 16 7630 2-in-1. Nel frattempo, il touchscreen IPS da 60 Hz e 1200p dell'Inspiron 16 7635 2-in-1 è tornato su alcune SKU di fascia bassa.
La nostra unità di prova è una configurazione di fascia alta con CPU Meteor Lake-H Core Ultra 7 155H e grafica Arc 8 integrata per circa 1.000 dollari. Un'opzione di fascia bassa con il Core Ultra 5 125U è disponibile con il vecchio pannello IPS a 60 Hz e 1200p per 200 dollari in meno, ma non ci sono opzioni di GPU discreta in entrambi i casi. È interessante notare che l'Inspiron 16 7640 2-in-1 è uno dei pochi convertibili con entrambe le opzioni di processore Core-U e Core-H, dato che la maggior parte offre solo una ma non l'altra.
Non ci sono SKU AMD Zen 4 disponibili al momento in cui scriviamo. Se dovessero essere disponibili in futuro, probabilmente saranno sotto il nome di modello Inspiron 16 7645 2-in-1, che succederebbe all'Inspiron 16 7635 2-in-1 basato su AMD.
Tra i concorrenti dell'Inspiron 16 7640 2-in-1 ci sono altri convertibili da 16 pollici di fascia media o superiore, come l'HP Envy x360 2-in-1 e il modello Inspiron 16 7635 HP Envy x360 2-in-1 16 o Lenovo Yoga 7 2-in-1 16. Dell, tuttavia, è unico con la sua opzione mini-LED.
Altre recensioni di Dell:
Potenziali concorrenti a confrontos
Punteggio | Versione | Data | Modello | Peso | Altezza | Dimensione | Risoluzione | Prezzo |
|---|---|---|---|---|---|---|---|---|
| 82.1 % | v8 | 07/2024 | Dell Inspiron 16 7640 2-in-1 Ultra 7 155H, Arc 8-Core | 2.1 kg | 18.99 mm | 16.00" | 2560x1600 | |
| 83.4 % | v8 | 06/2024 | Dell Inspiron 16 Plus 7640 Ultra 7 155H, NVIDIA GeForce RTX 4060 Laptop GPU | 2.2 kg | 19.9 mm | 16.00" | 2560x1600 | |
| 87.2 % v7 (old) | v7 (old) | 05/2024 | HP Envy x360 2-in-1 16-ad0097nr R7 8840HS, Radeon 780M | 1.8 kg | 18.3 mm | 16.00" | 2880x1800 | |
| 87.9 % v7 (old) | v7 (old) | 05/2024 | Lenovo IdeaPad Pro 5 16IMH G9 Ultra 7 155H, Arc 8-Core | 1.9 kg | 17.5 mm | 16.00" | 2560x1600 | |
| 88.7 % v7 (old) | v7 (old) | 02/2024 | HP Pavilion Plus 16-ab0456tx i7-13700H, GeForce RTX 3050 6GB Laptop GPU | 1.9 kg | 19.9 mm | 16.00" | 2560x1600 | |
| 87.6 % v7 (old) | v7 (old) | 11/2023 | Asus VivoBook Pro 16 K6602VU i9-13900H, NVIDIA GeForce RTX 4050 Laptop GPU | 1.9 kg | 19 mm | 16.00" | 3200x2000 |
Informazioni: Abbiamo aggiornato il nostro sistema di valutazione e i risultati della versione 8 non sono confrontabili con i risultati della versione 7. Altre informazioni sono gerarchicamente verfügbar.
Nota: abbiamo recentemente aggiornato il nostro sistema di valutazione e i risultati della versione 8 non sono confrontabili con quelli della versione 7. Ulteriori informazioni sono disponibili qui .
Custodia - robusta ma pesante
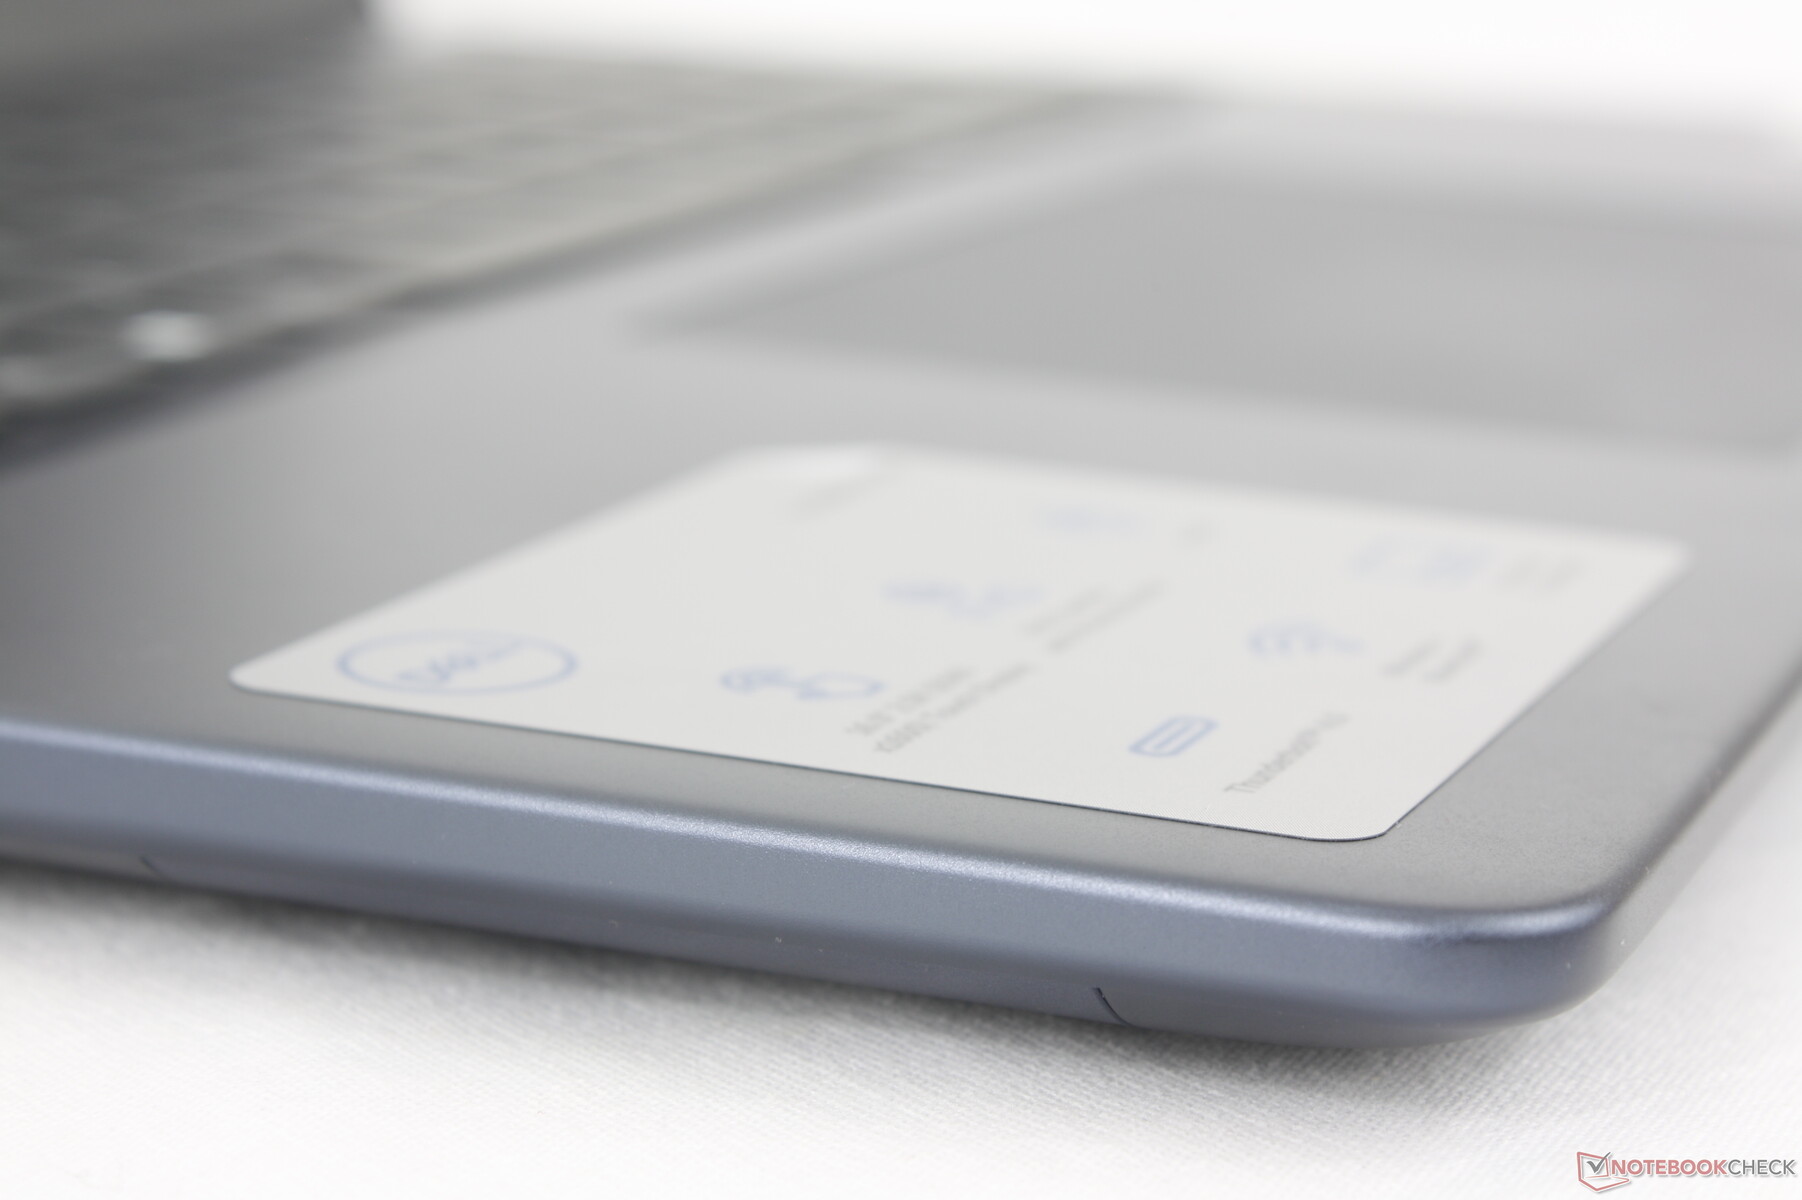
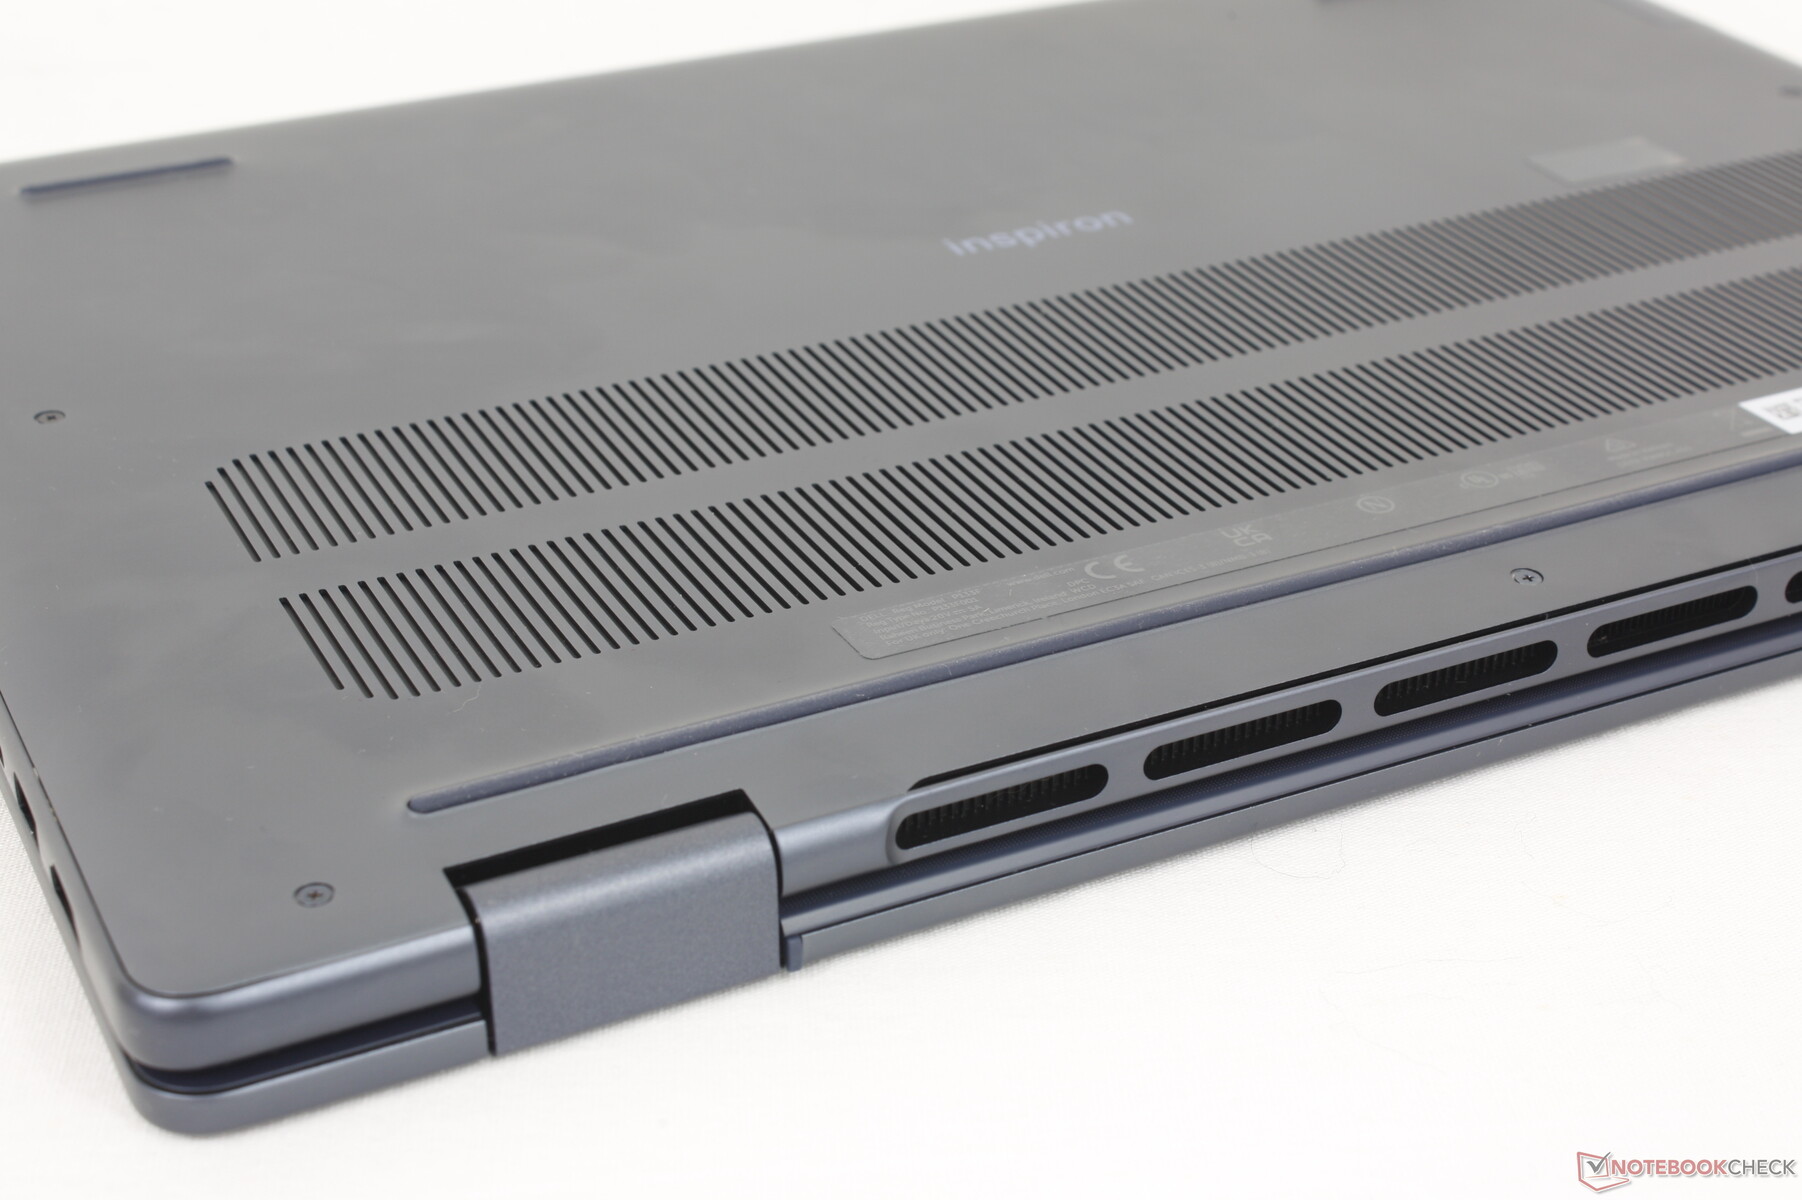
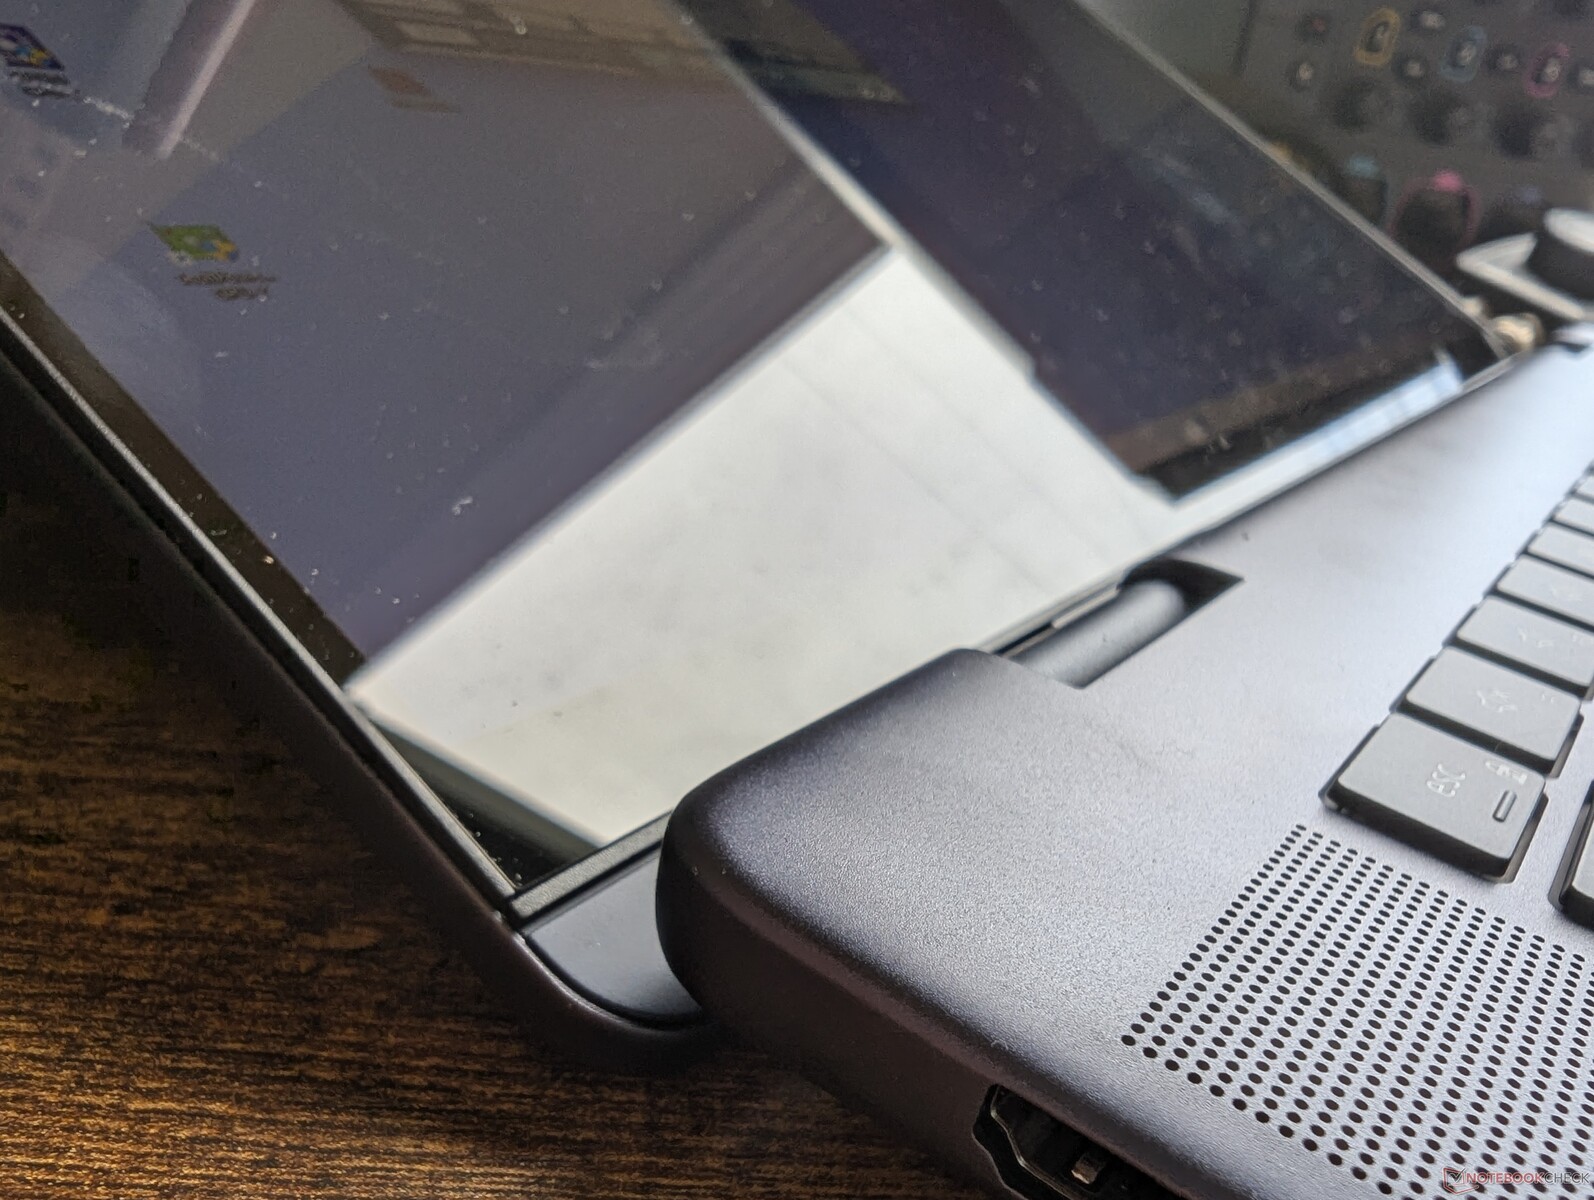
Ci sono diverse modifiche esterne rispetto al modello uscente. In primo luogo, la parte del poggiapolsi non è più rialzata per ottenere un bordo più pulito tra il poggiapolsi e la tastiera. In secondo luogo, le griglie di ventilazione lungo il bordo inferiore e posteriore sono state ridisegnate per essere leggermente più grandi. In terzo luogo, il bordo posteriore stesso è più audace per un aspetto più squadrato.
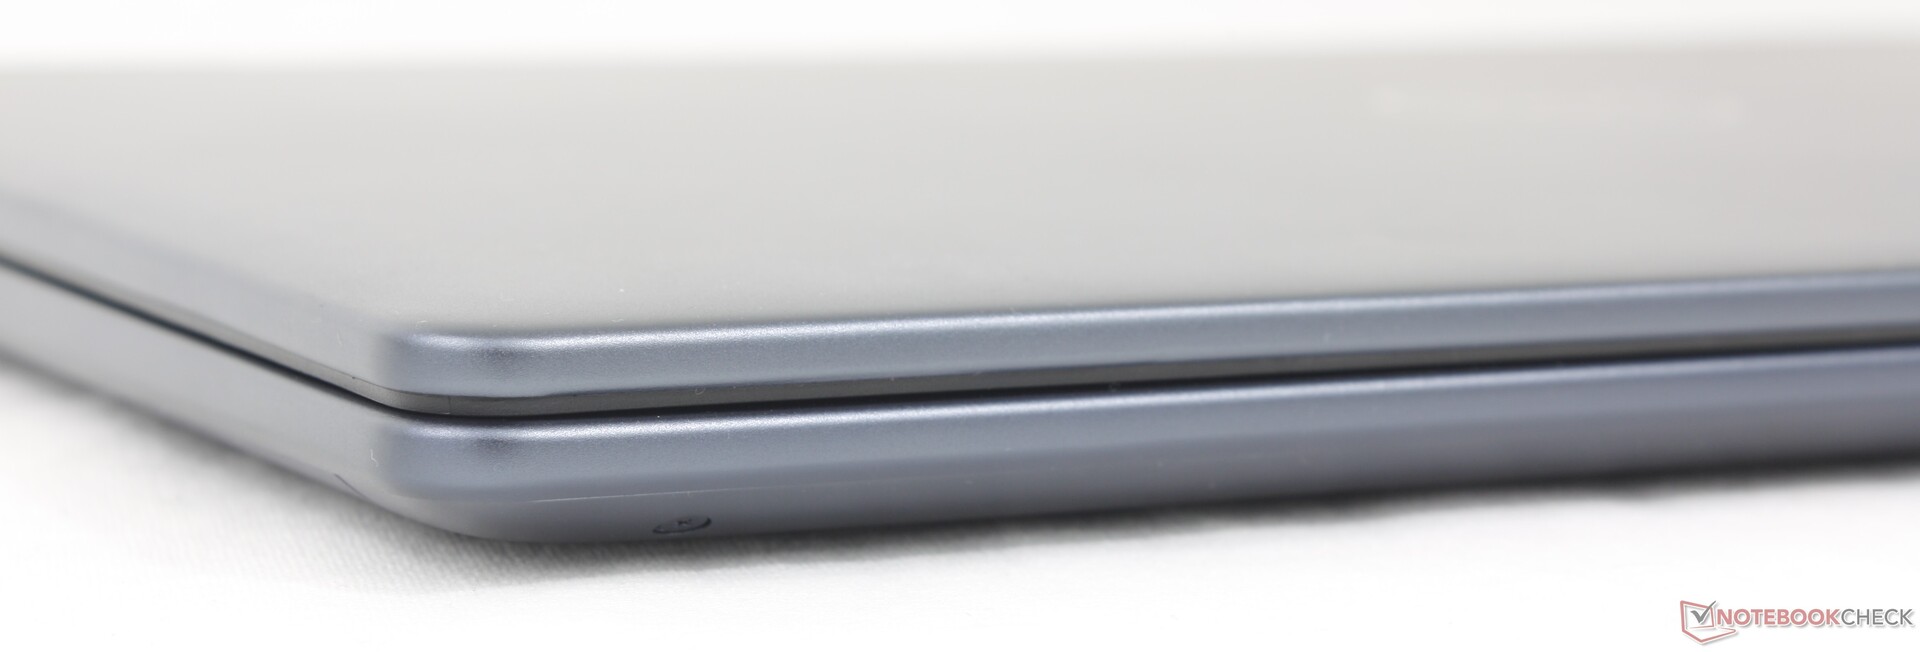
A parte le modifiche estetiche di cui sopra, i materiali dello chassis rimangono gli stessi di prima, senza miglioramenti importanti in termini di rigidità o qualità. Il coperchio e la base sono ancora in alluminio e plastica, rispettivamente, con una buona resistenza alla torsione e alle depressioni per una prima impressione solida, soprattutto per un modello di fascia media. Non ci preoccupa tanto la qualità costruttiva del modello, quanto la sua pesantezza nell'utilizzo in modalità tablet.
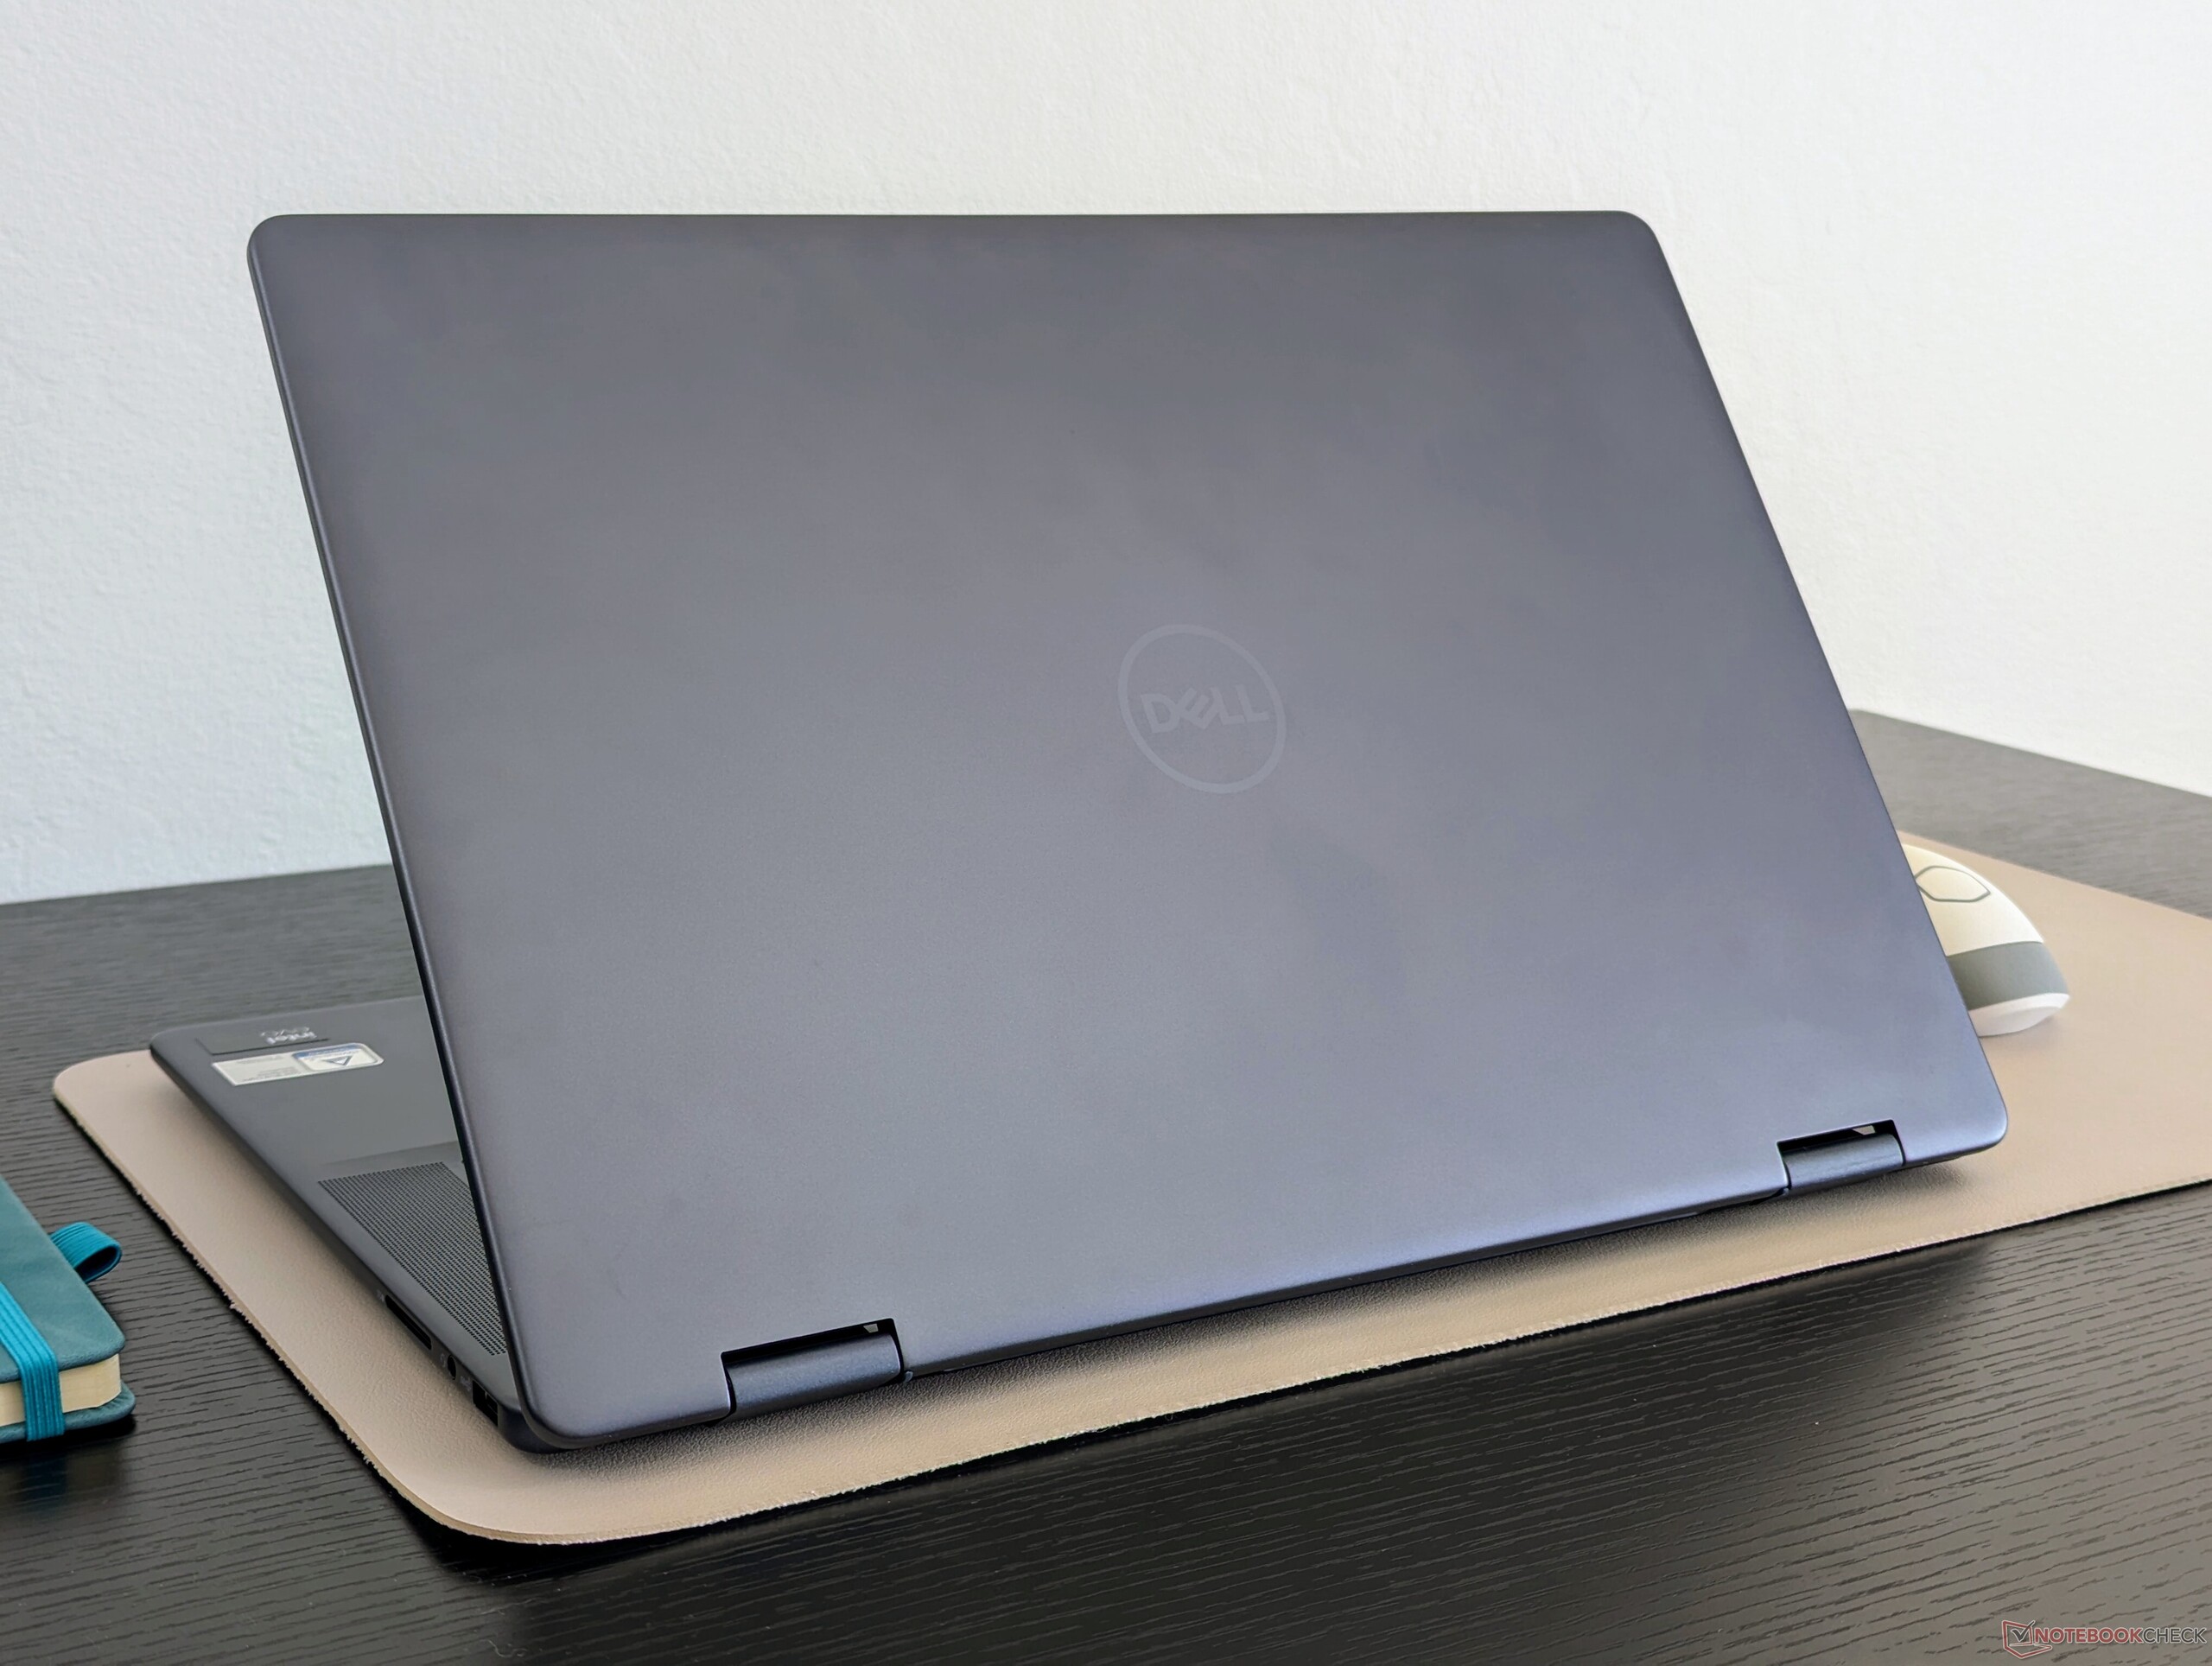
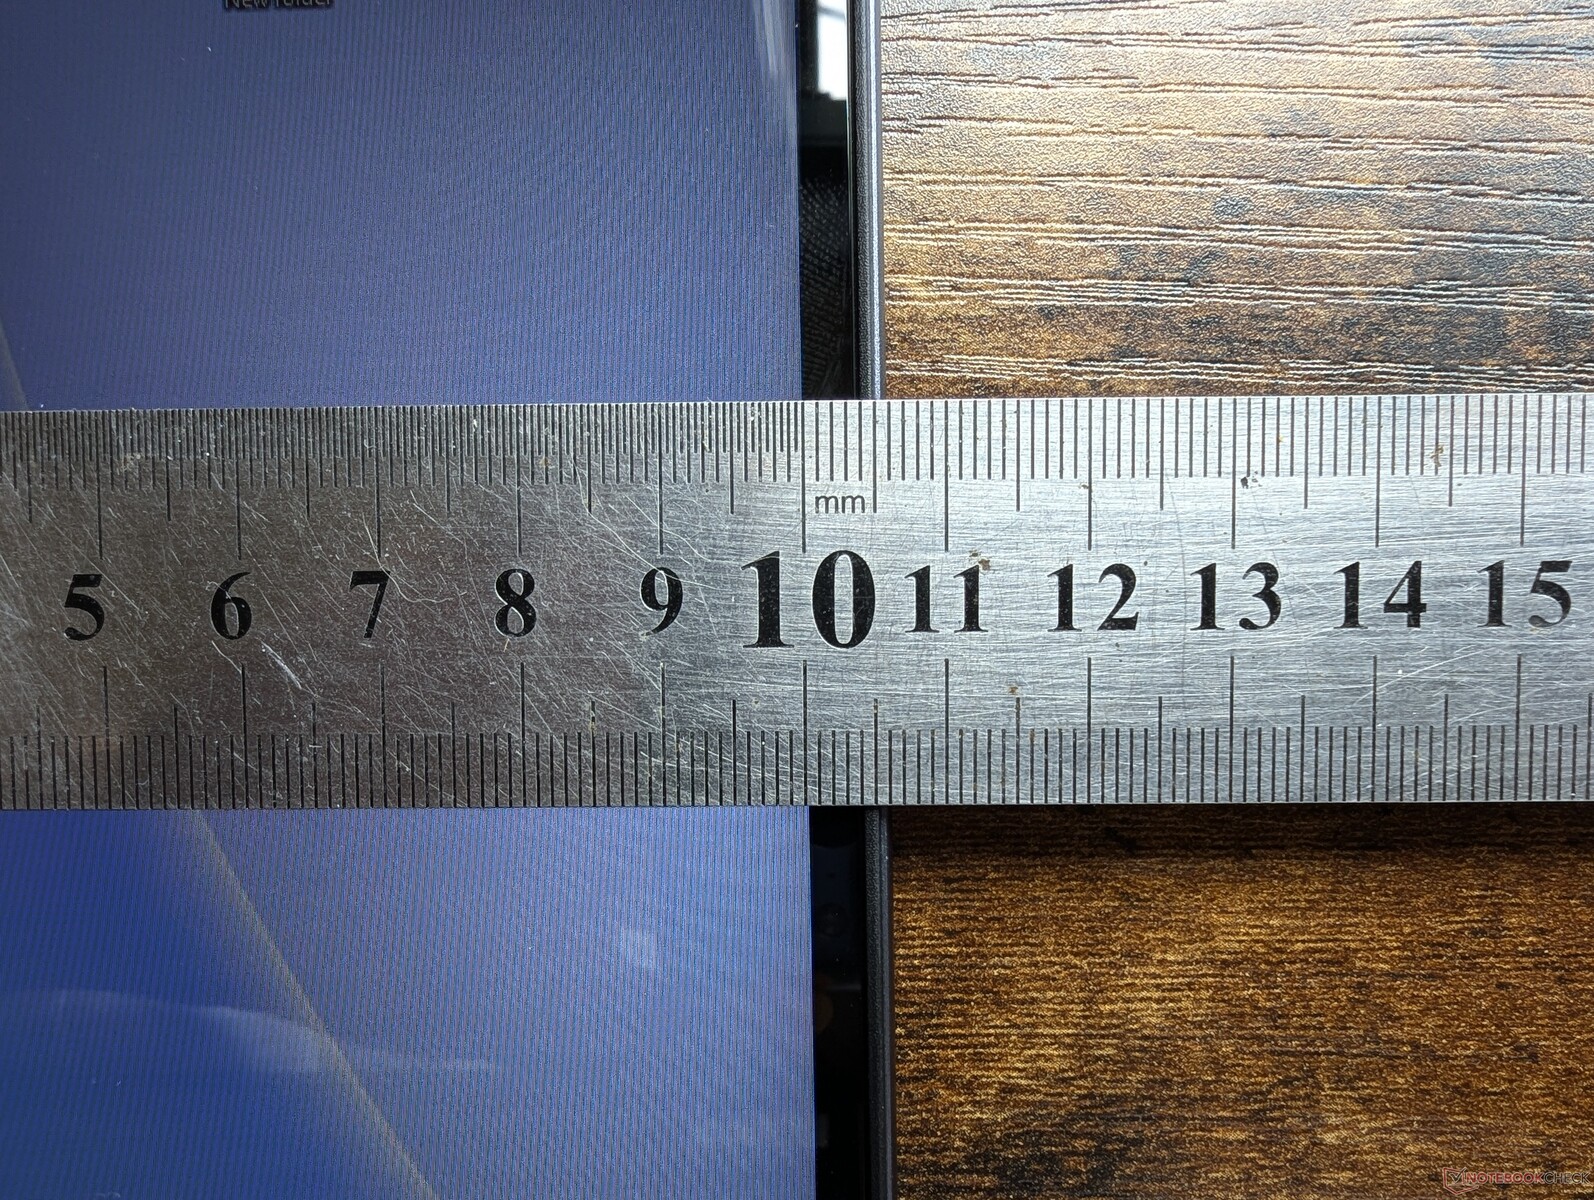
Le dimensioni e il peso sono quasi identici a quelli dei modelli 2023 Inspiron 16 7630 2-in-1 e 2024 Inspiron 16 Plus 7640 a conchiglia 2024 Inspiron 16 Plus 7640 a conchiglia anche se quest'ultimo include un'opzione di GPU discreta. Avremmo preferito un design più leggero, dal momento che l'HP Envy x360 16 da 16 pollici e il Samsung Galaxy Book4 Pro 360 sono tutti notevolmente più leggeri del nostro Dell. Anche se un convertibile da 16 pollici sarà comunque relativamente pesante, l'Inspiron 16 7640 2-in-1 è probabilmente uno dei peggiori del gruppo per i viaggi.


Connettività
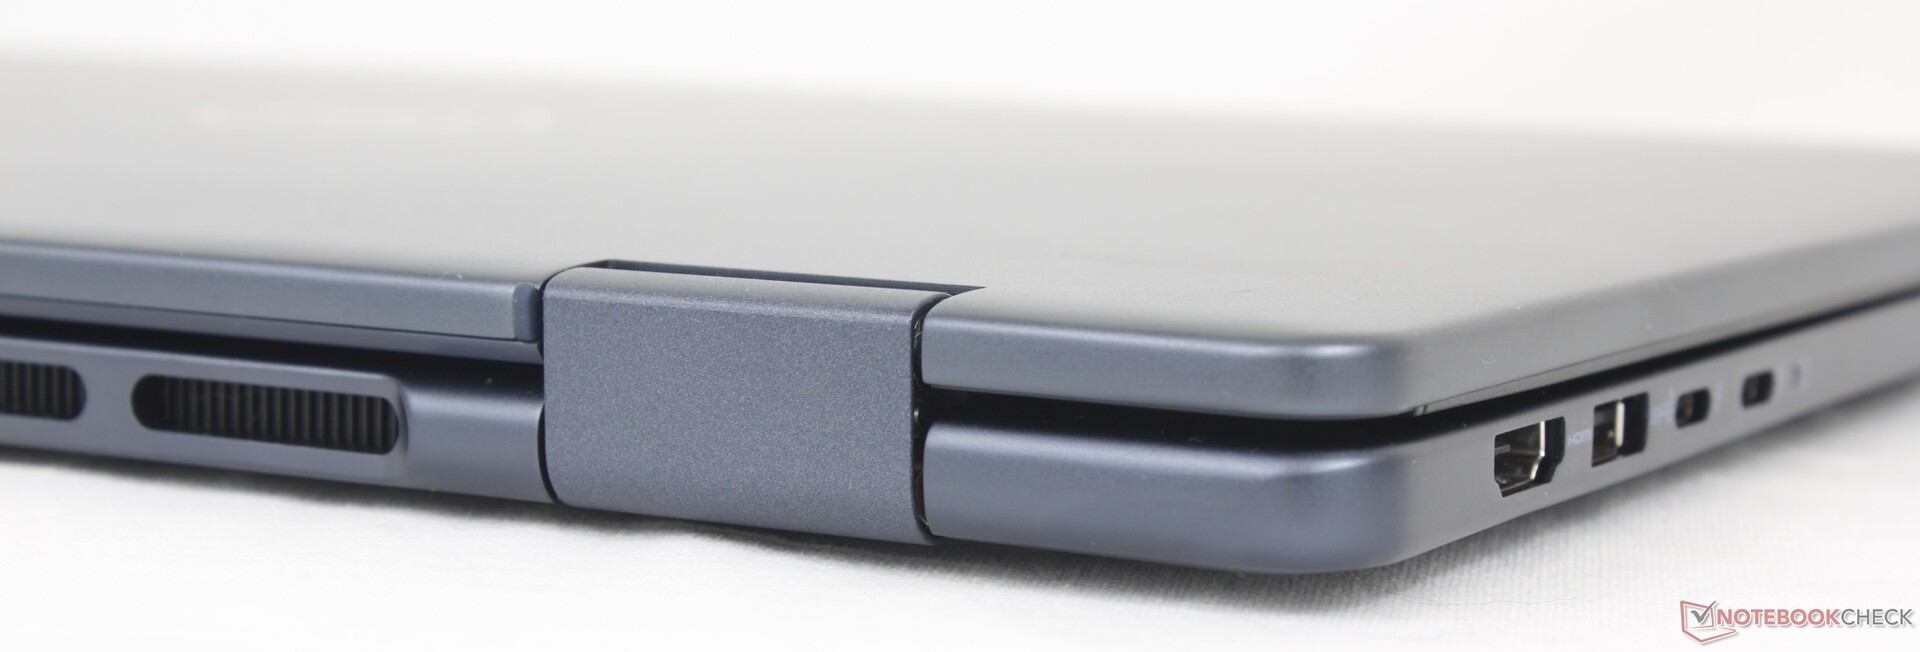
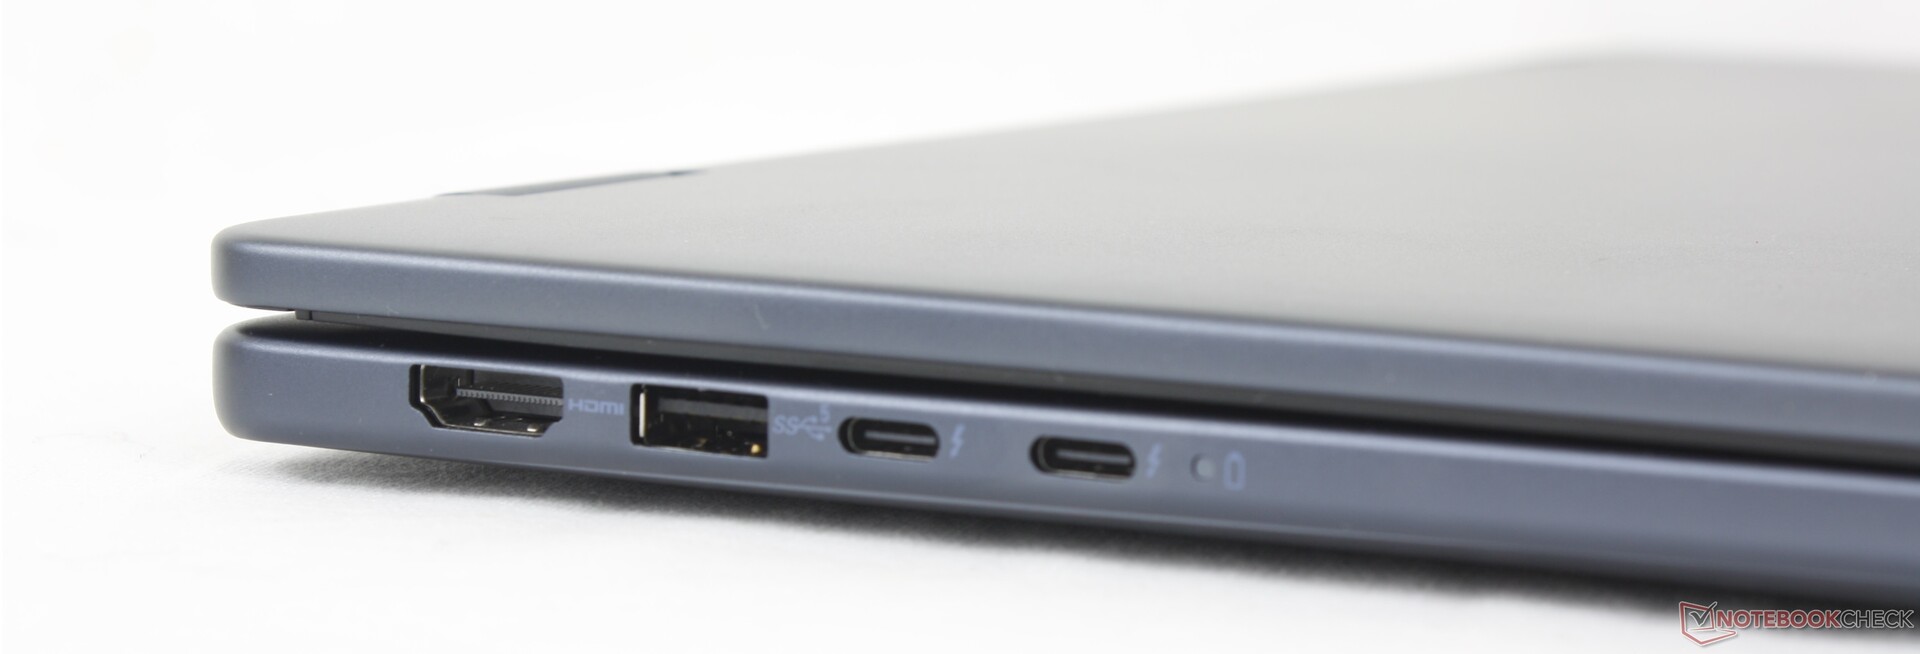
Le opzioni e il posizionamento delle porte rimangono identiche a quelle del modello Inspiron 16 7635 2-in-1 o 7630 2-in-1, nonostante le numerose modifiche esterne. Si noti che Thunderbolt 4 è ancora una volta disponibile solo sulle SKU Intel e che la porta HDMI continua ad essere solo la versione 1.4.
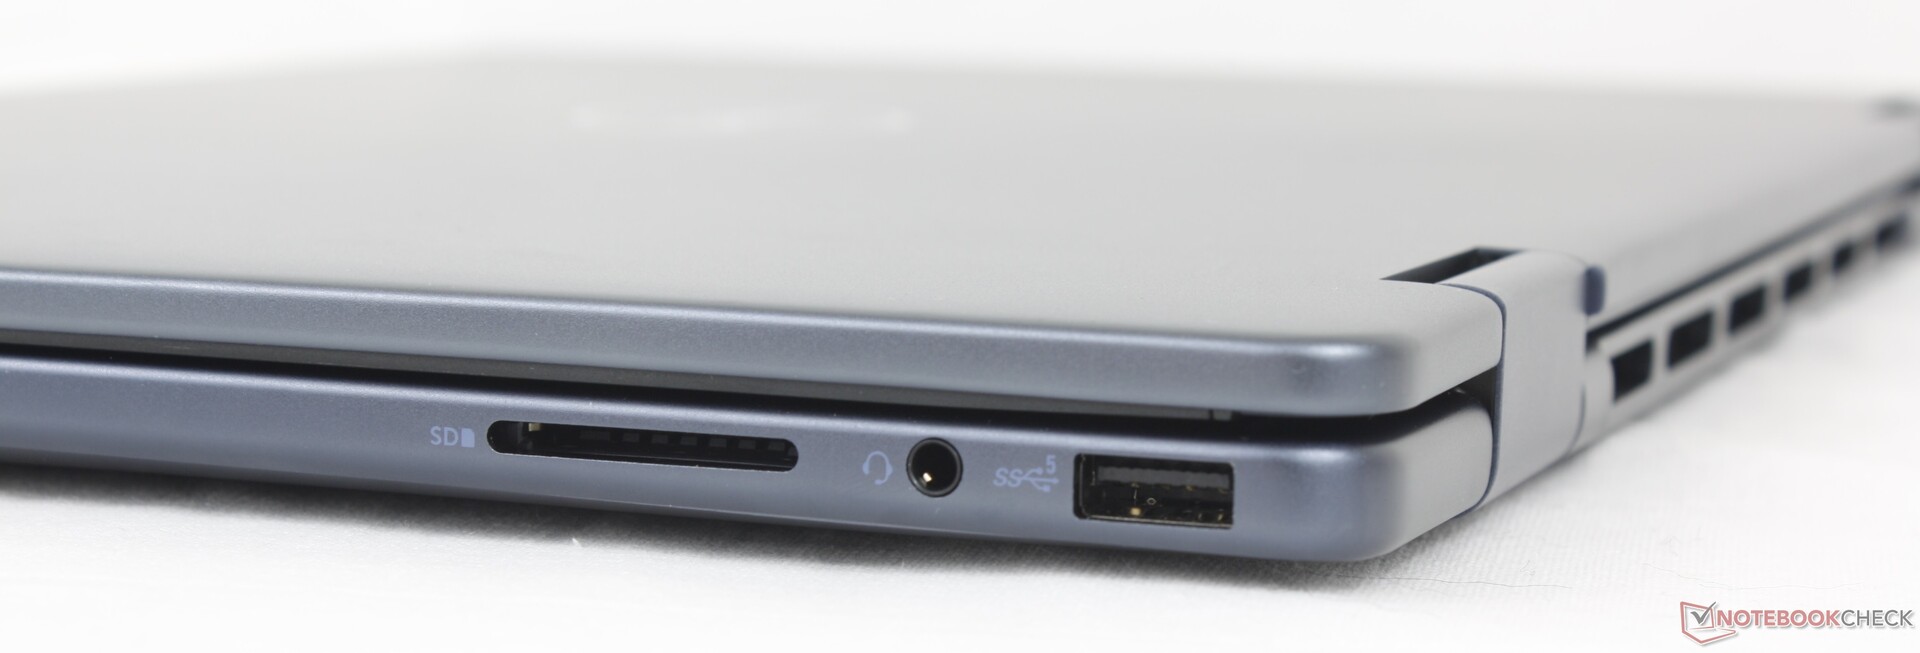
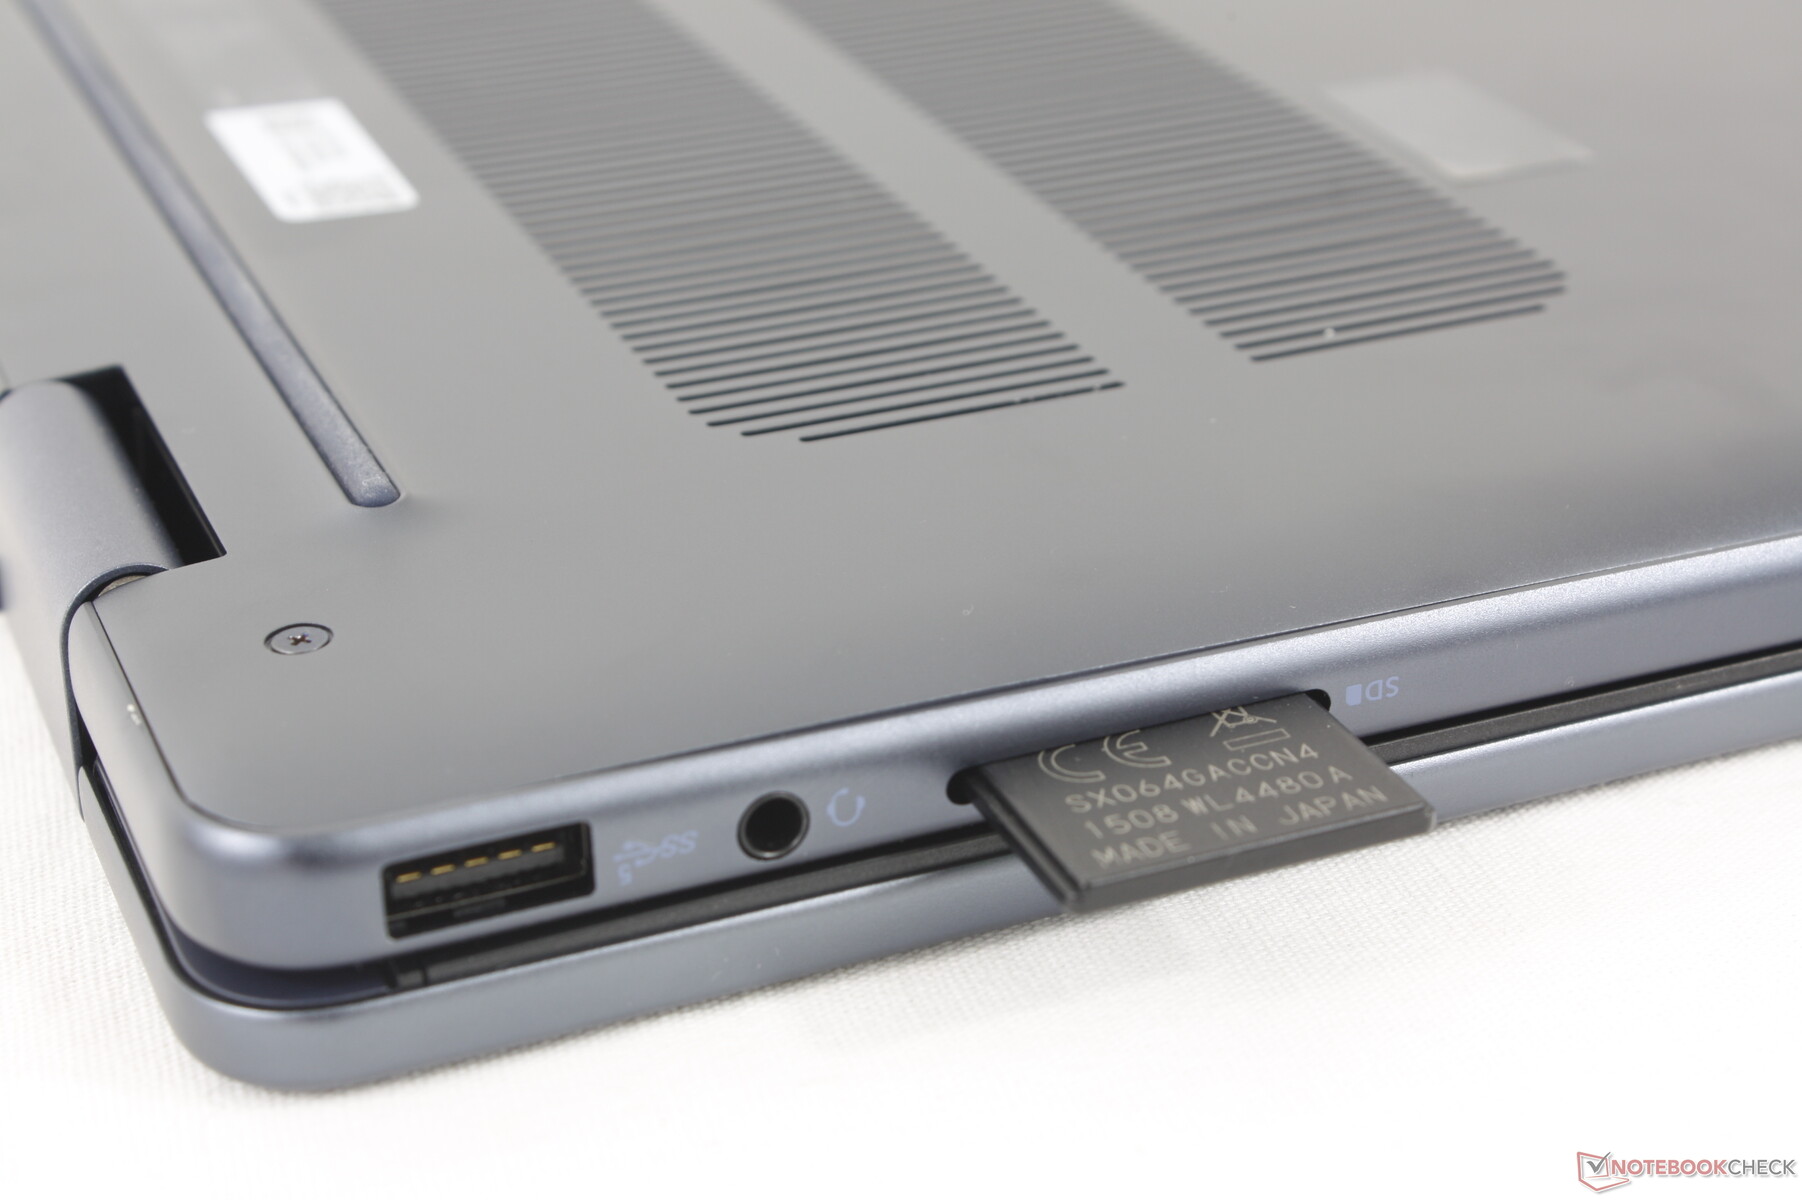
Lettore di schede SD
Le velocità di trasferimento con il lettore di schede SD integrato non sono migliorate rispetto al modello dell'anno scorso, con una velocità di poco inferiore a 30 MB/s. i modelli a conchiglia da 16 pollici, come il Lenovo IdeaPad Pro 5 16, sono più veloci di due volte e l'XPS 16 è più veloce di due volte XPS 16 è ancora più veloce. Gli utenti che si affidano alle schede SD possono apprezzare il pratico lettore di schede integrato nell'Inspiron, ma probabilmente saranno anche delusi dalla bassa velocità.
| SD Card Reader | |
| average JPG Copy Test (av. of 3 runs) | |
| Samsung Galaxy Book4 Pro 360 (Angelbird AV Pro V60) | |
| Lenovo IdeaPad Pro 5 16IMH G9 (Angelbird AV Pro V60) | |
| Dell Inspiron 16 7635 2-in-1 (PNY EliteX-Pro60 V60 256 GB) | |
| Dell Inspiron 16 7640 2-in-1 (Toshiba Exceria Pro SDXC 64 GB UHS-II) | |
| Dell Inspiron 16 Plus 7640 (Angelbird AV Pro V60) | |
| maximum AS SSD Seq Read Test (1GB) | |
| Lenovo IdeaPad Pro 5 16IMH G9 (Angelbird AV Pro V60) | |
| Samsung Galaxy Book4 Pro 360 (Angelbird AV Pro V60) | |
| Dell Inspiron 16 7635 2-in-1 (PNY EliteX-Pro60 V60 256 GB) | |
| Dell Inspiron 16 7640 2-in-1 (Toshiba Exceria Pro SDXC 64 GB UHS-II) | |
| Dell Inspiron 16 Plus 7640 (Angelbird AV Pro V60) | |
Comunicazione
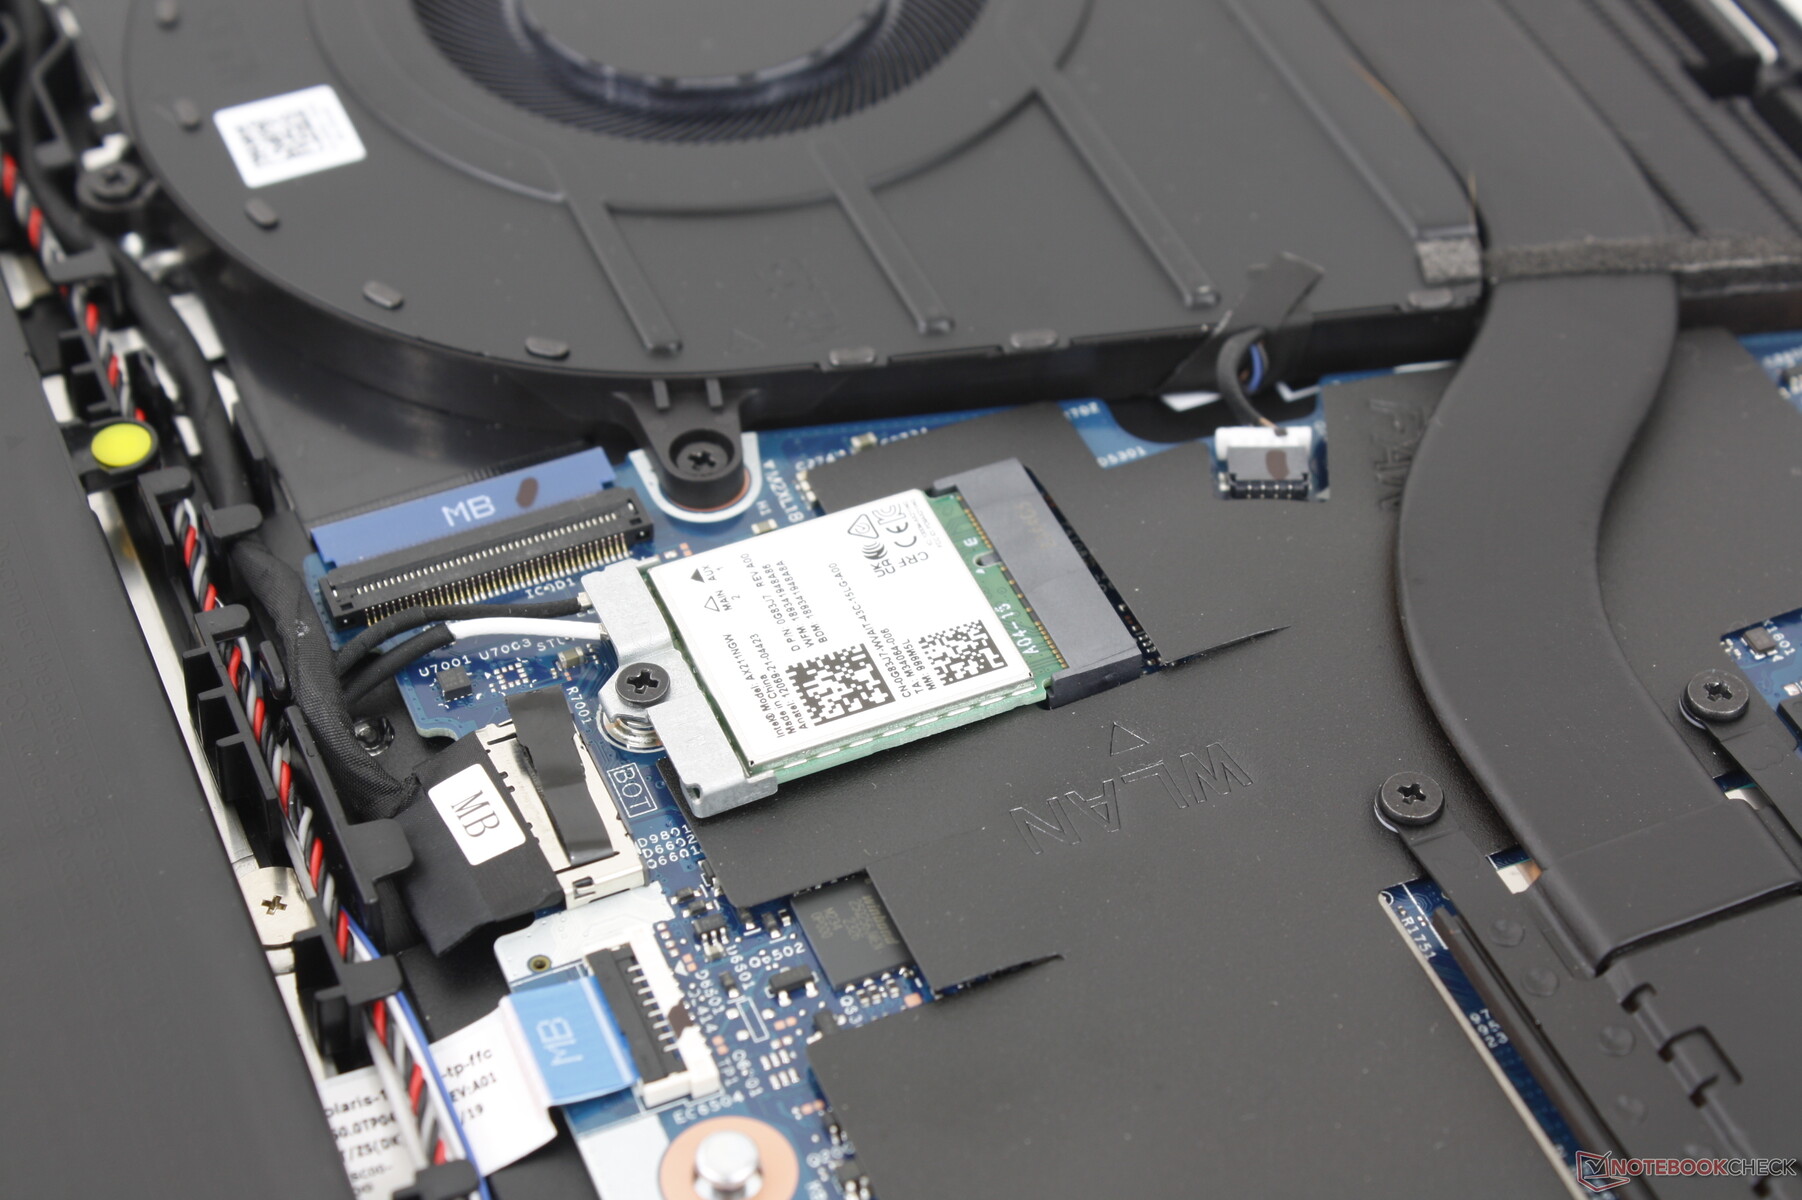
Il modello viene fornito con lo stesso modulo WLAN Intel AX211 presente sul modello Inspiron 16 7640 a conchiglia per la connettività Wi-Fi 6E e Bluetooth 5.3. Le prestazioni sono stabili quando è stato abbinato al nostro router di prova Asus AXE11000, ma la velocità di trasferimento sulla rete a 6 GHz avrebbe potuto essere più veloce.
Webcam
La webcam da 2 MP è di serie ancora una volta con un sensore IR e un otturatore fisico.


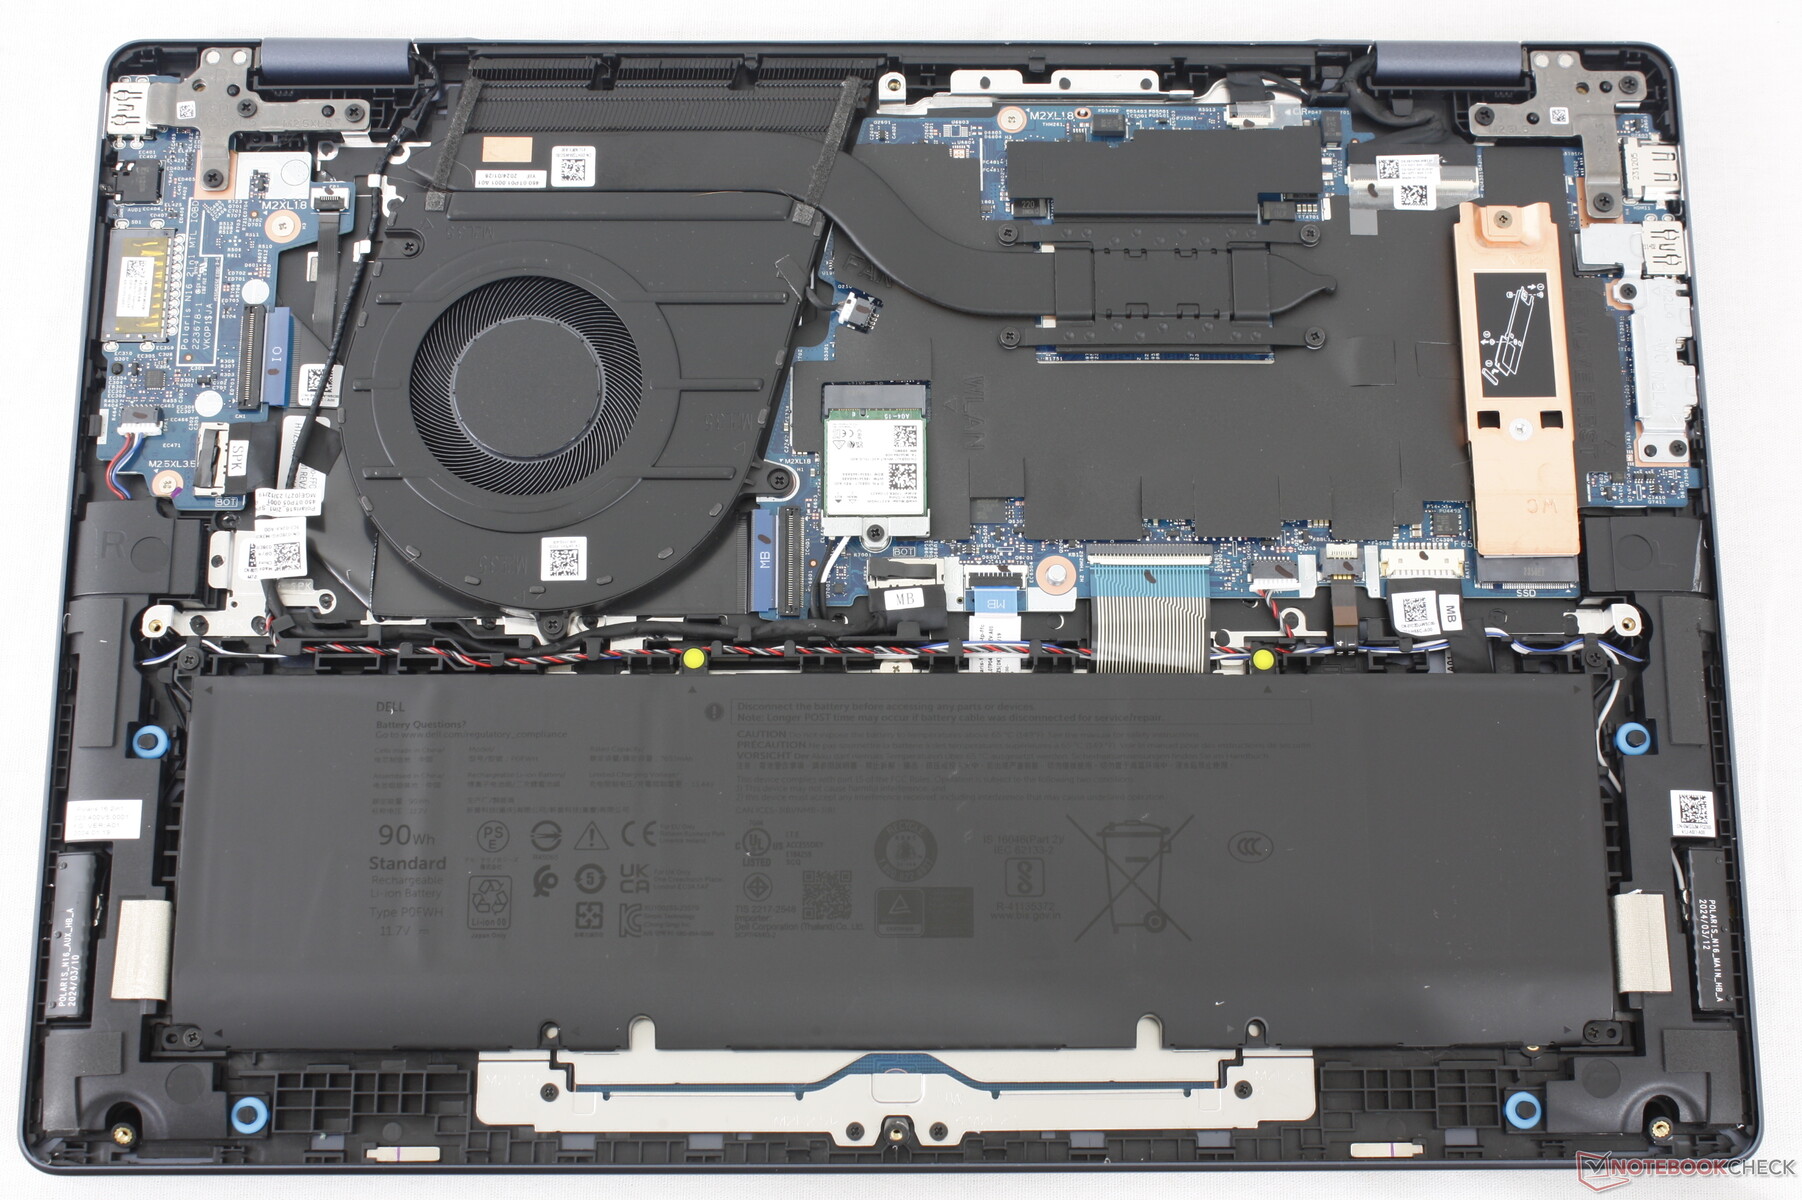
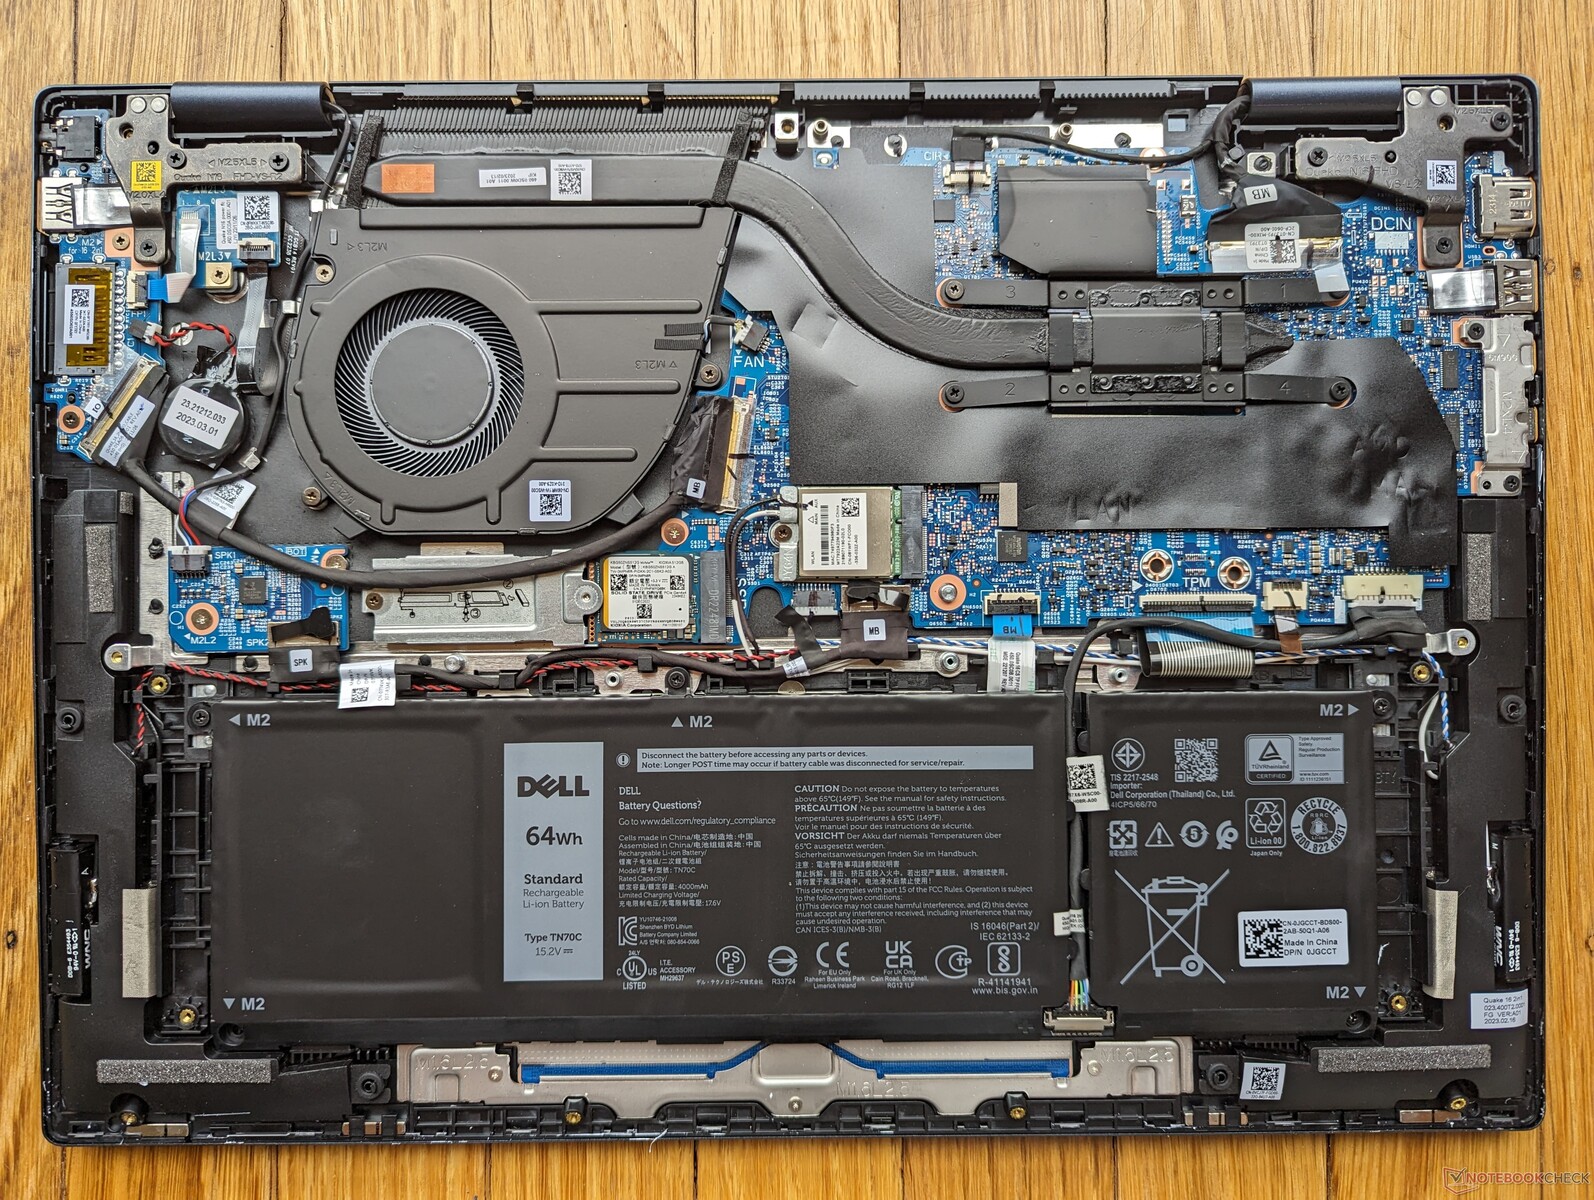
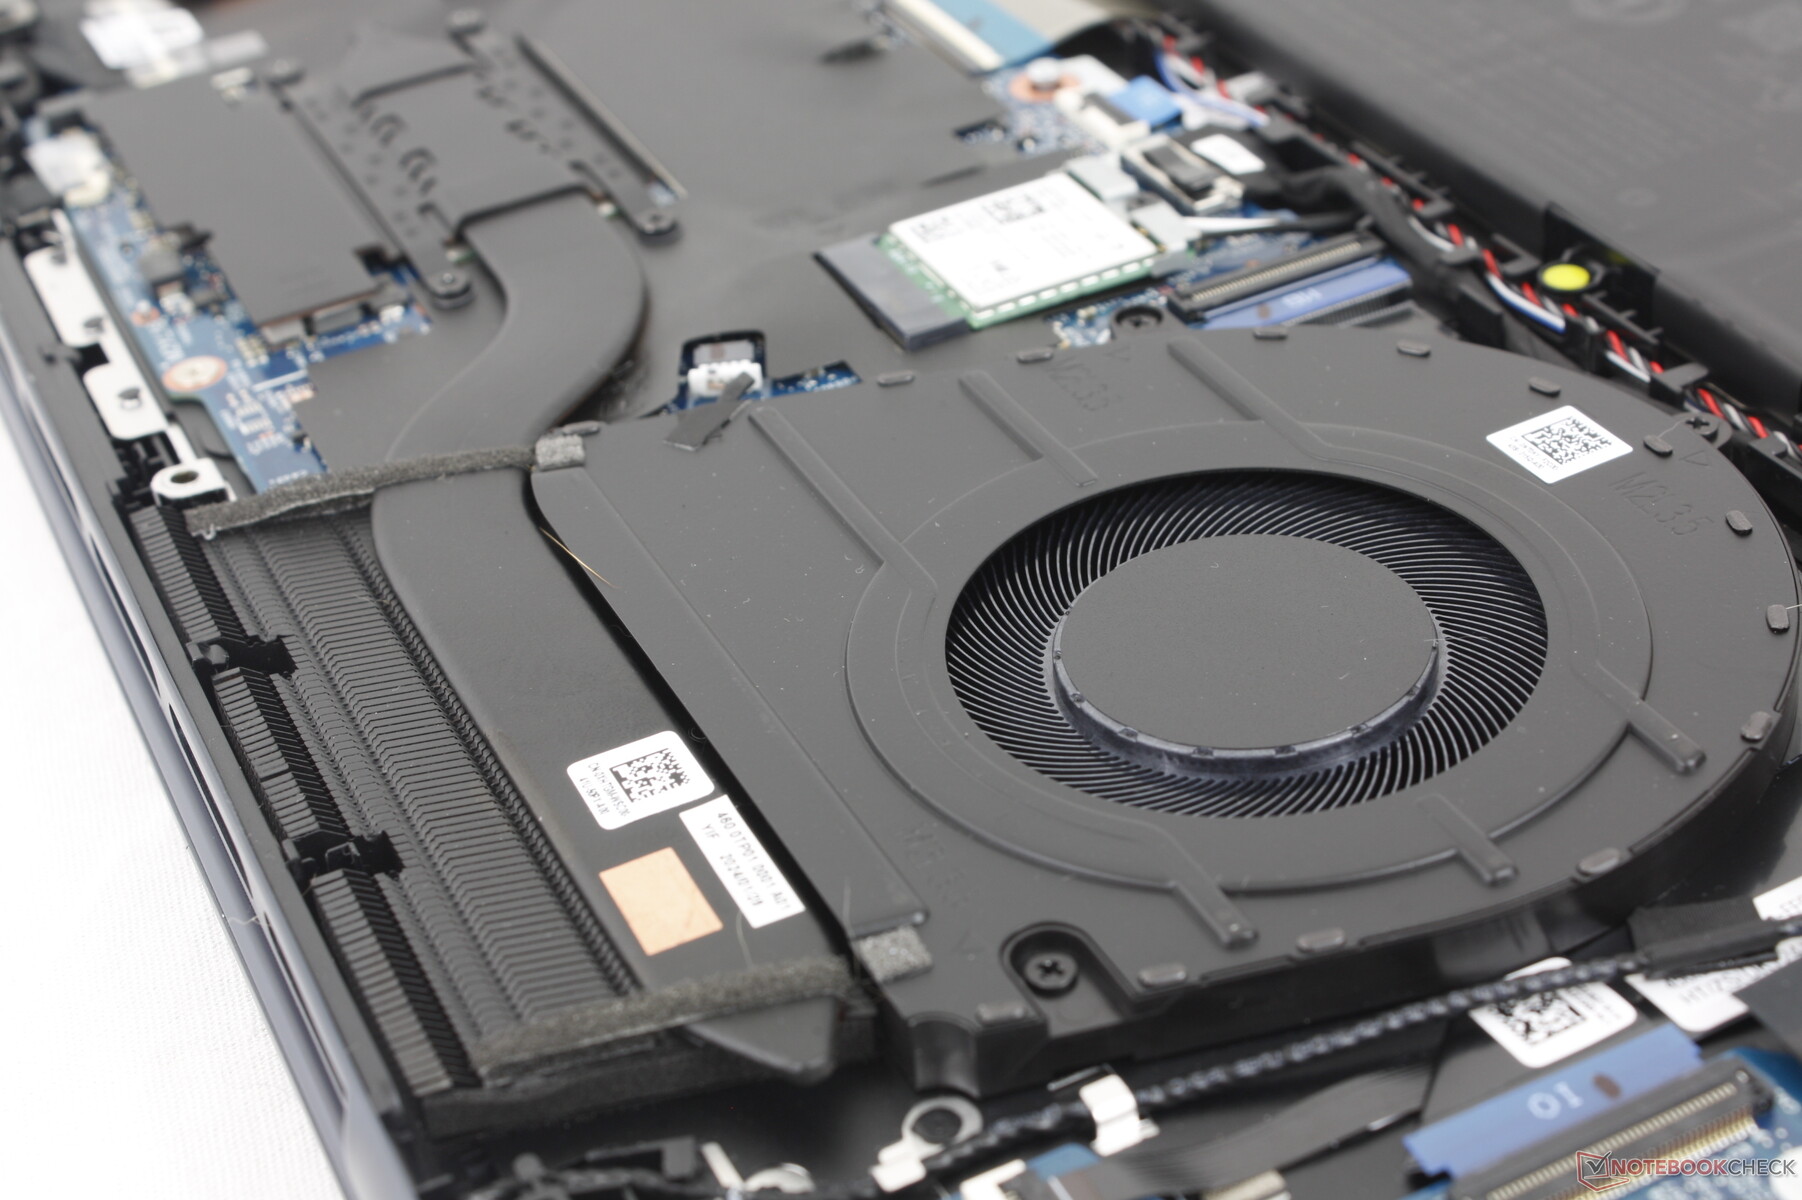
Manutenzione
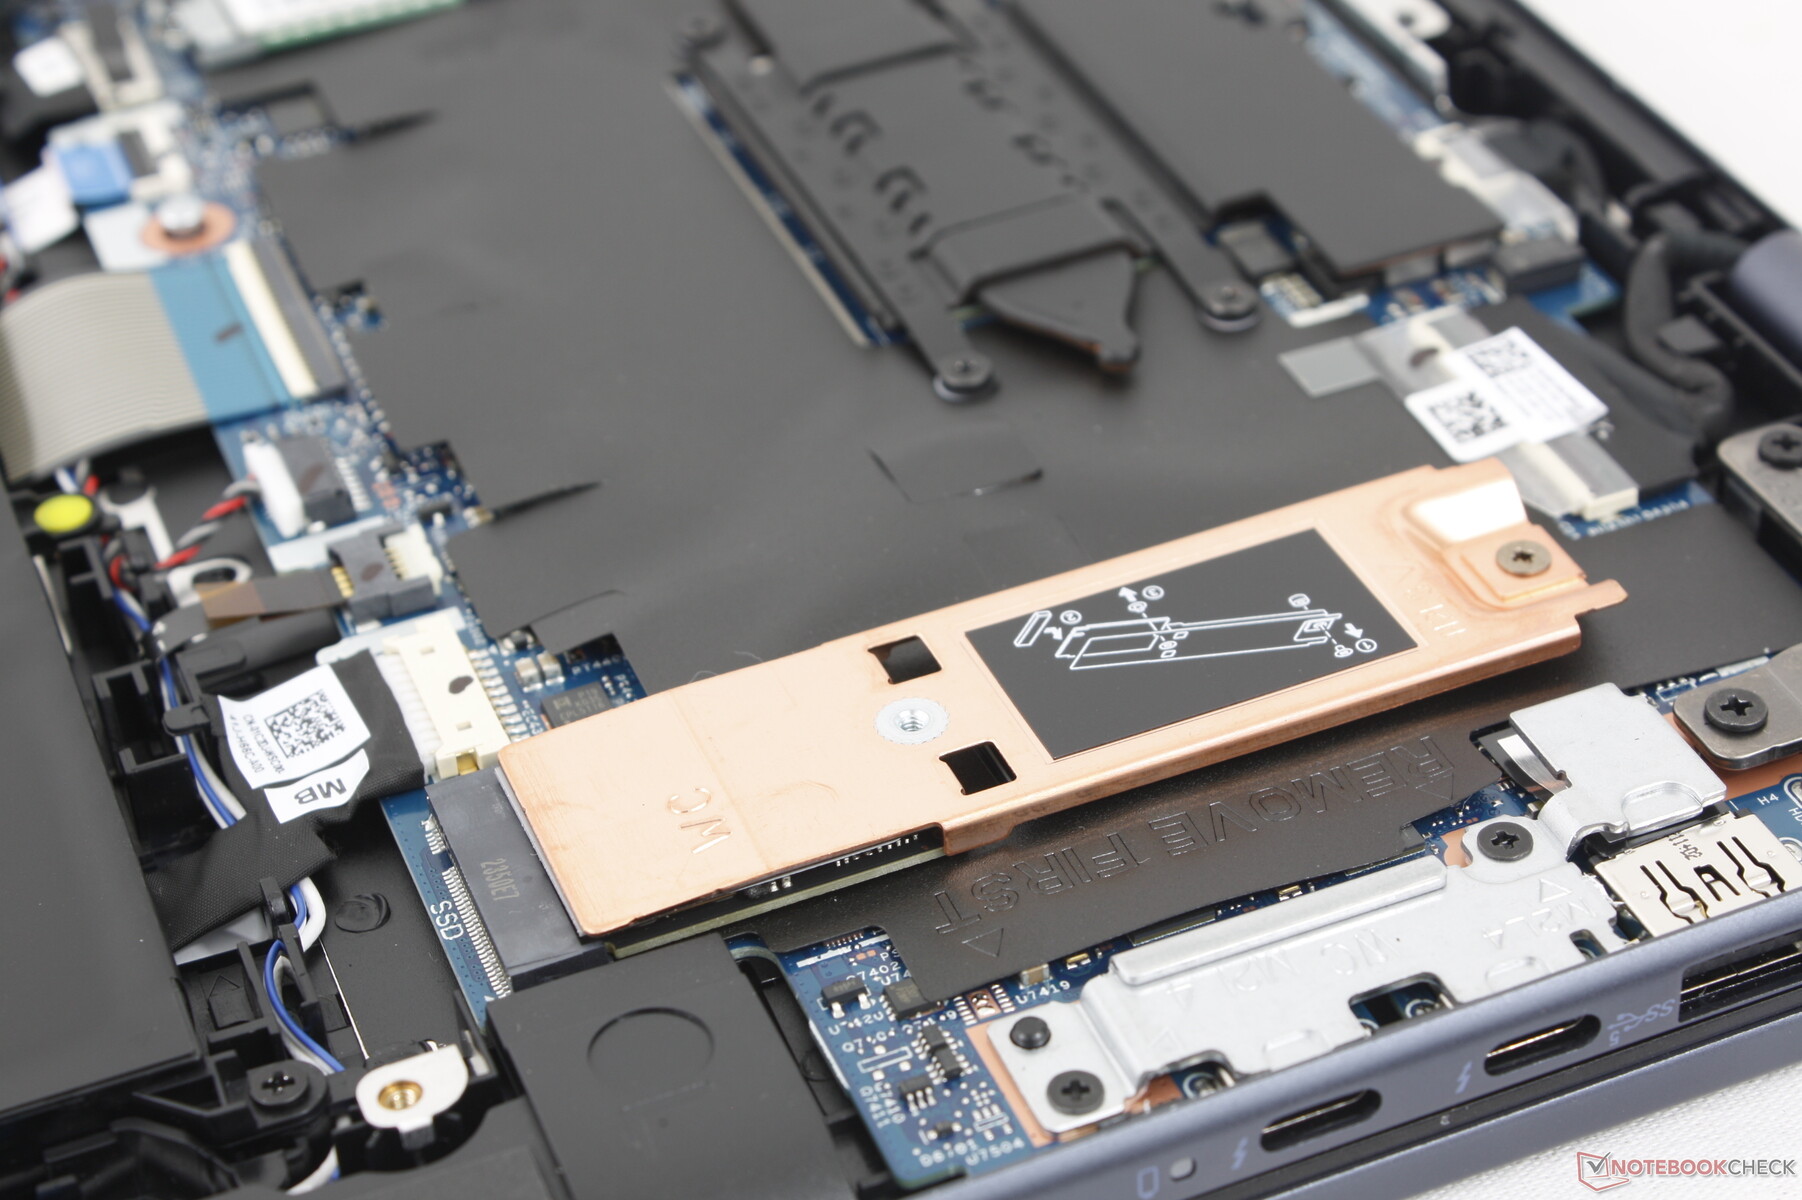
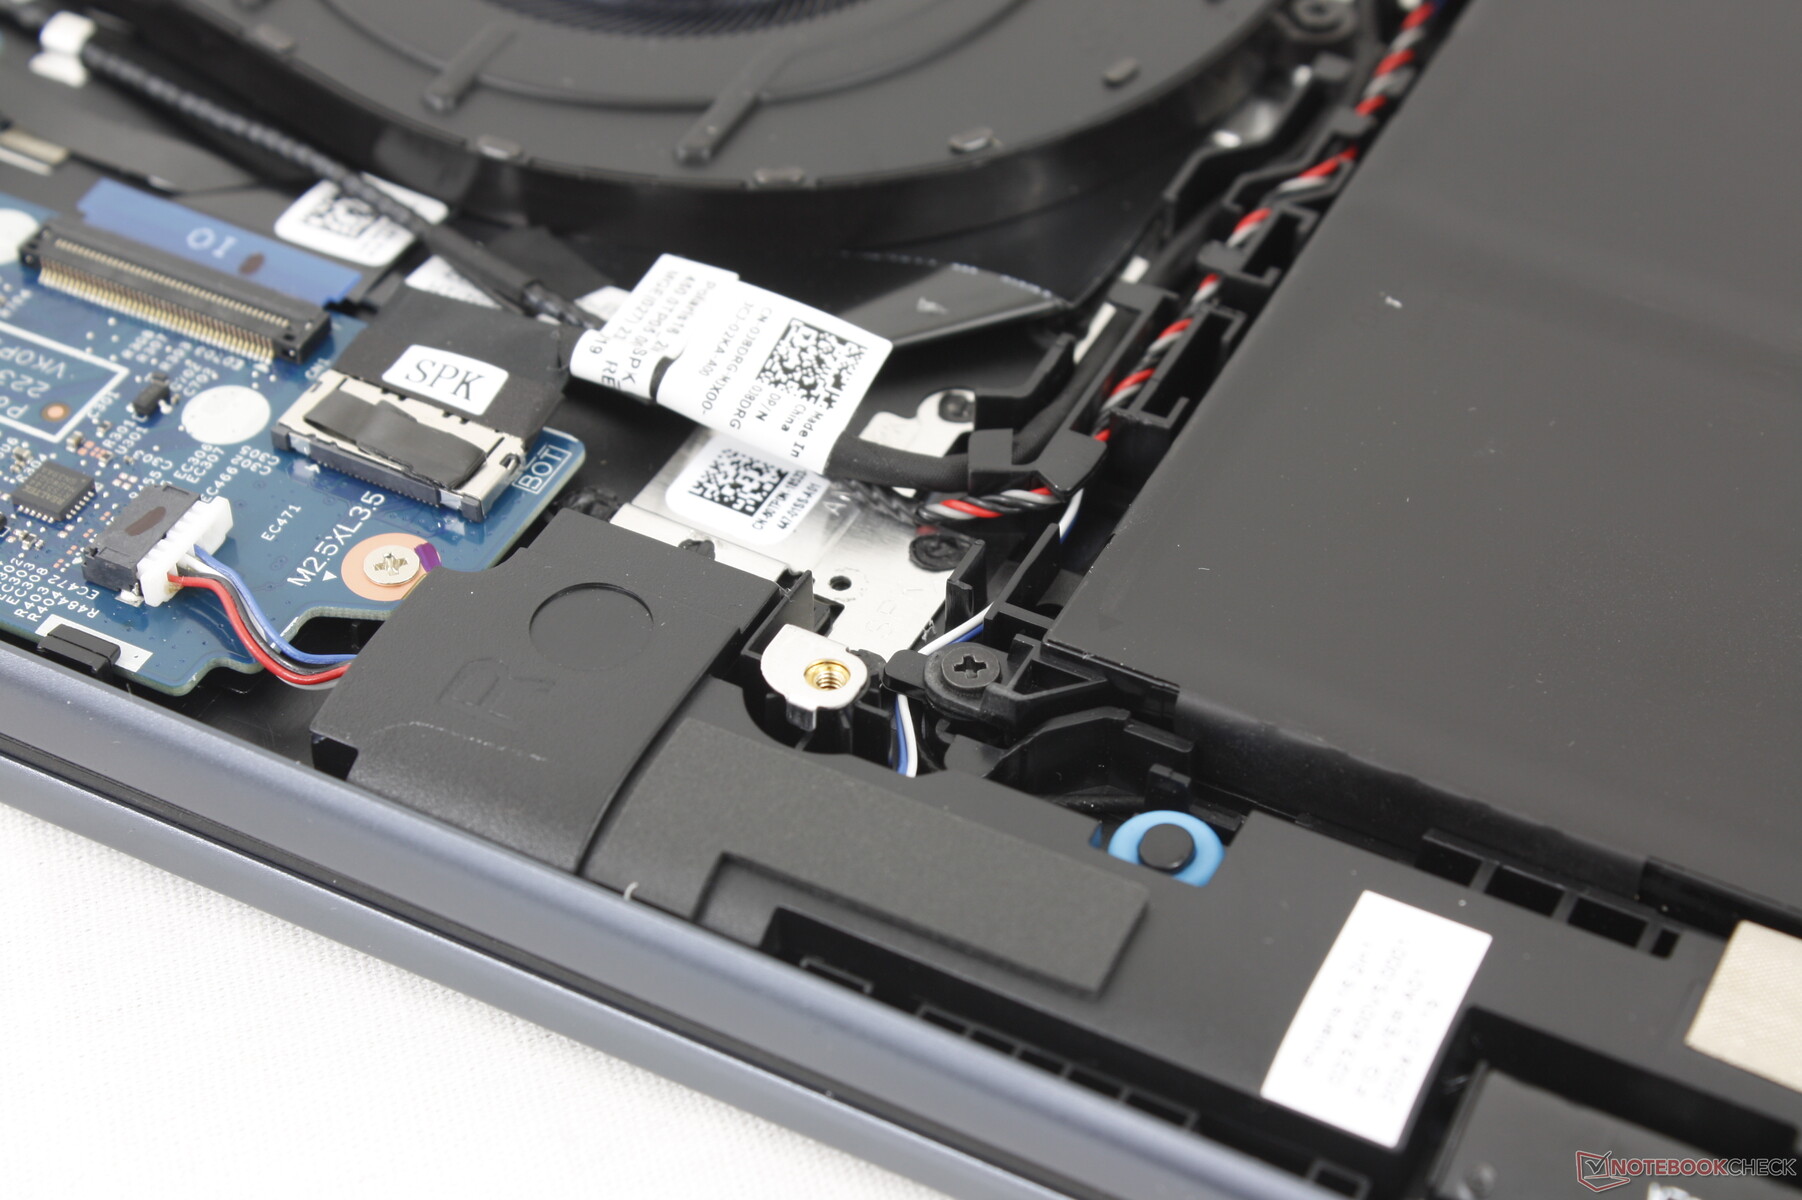
Ci sono diverse differenze interne tra il nostro modello e l'Inspiron 16 7635 2-in-1 dello scorso anno. In particolare, l'SSD è stato riposizionato per fare spazio alla ventola e alla batteria più grandi, mentre il condotto termico è ora leggermente più spesso per compensare la lunghezza inferiore. Le unità SSD secondarie continuano a non essere supportate e la RAM non è aggiornabile dall'utente.
Accessori e garanzia
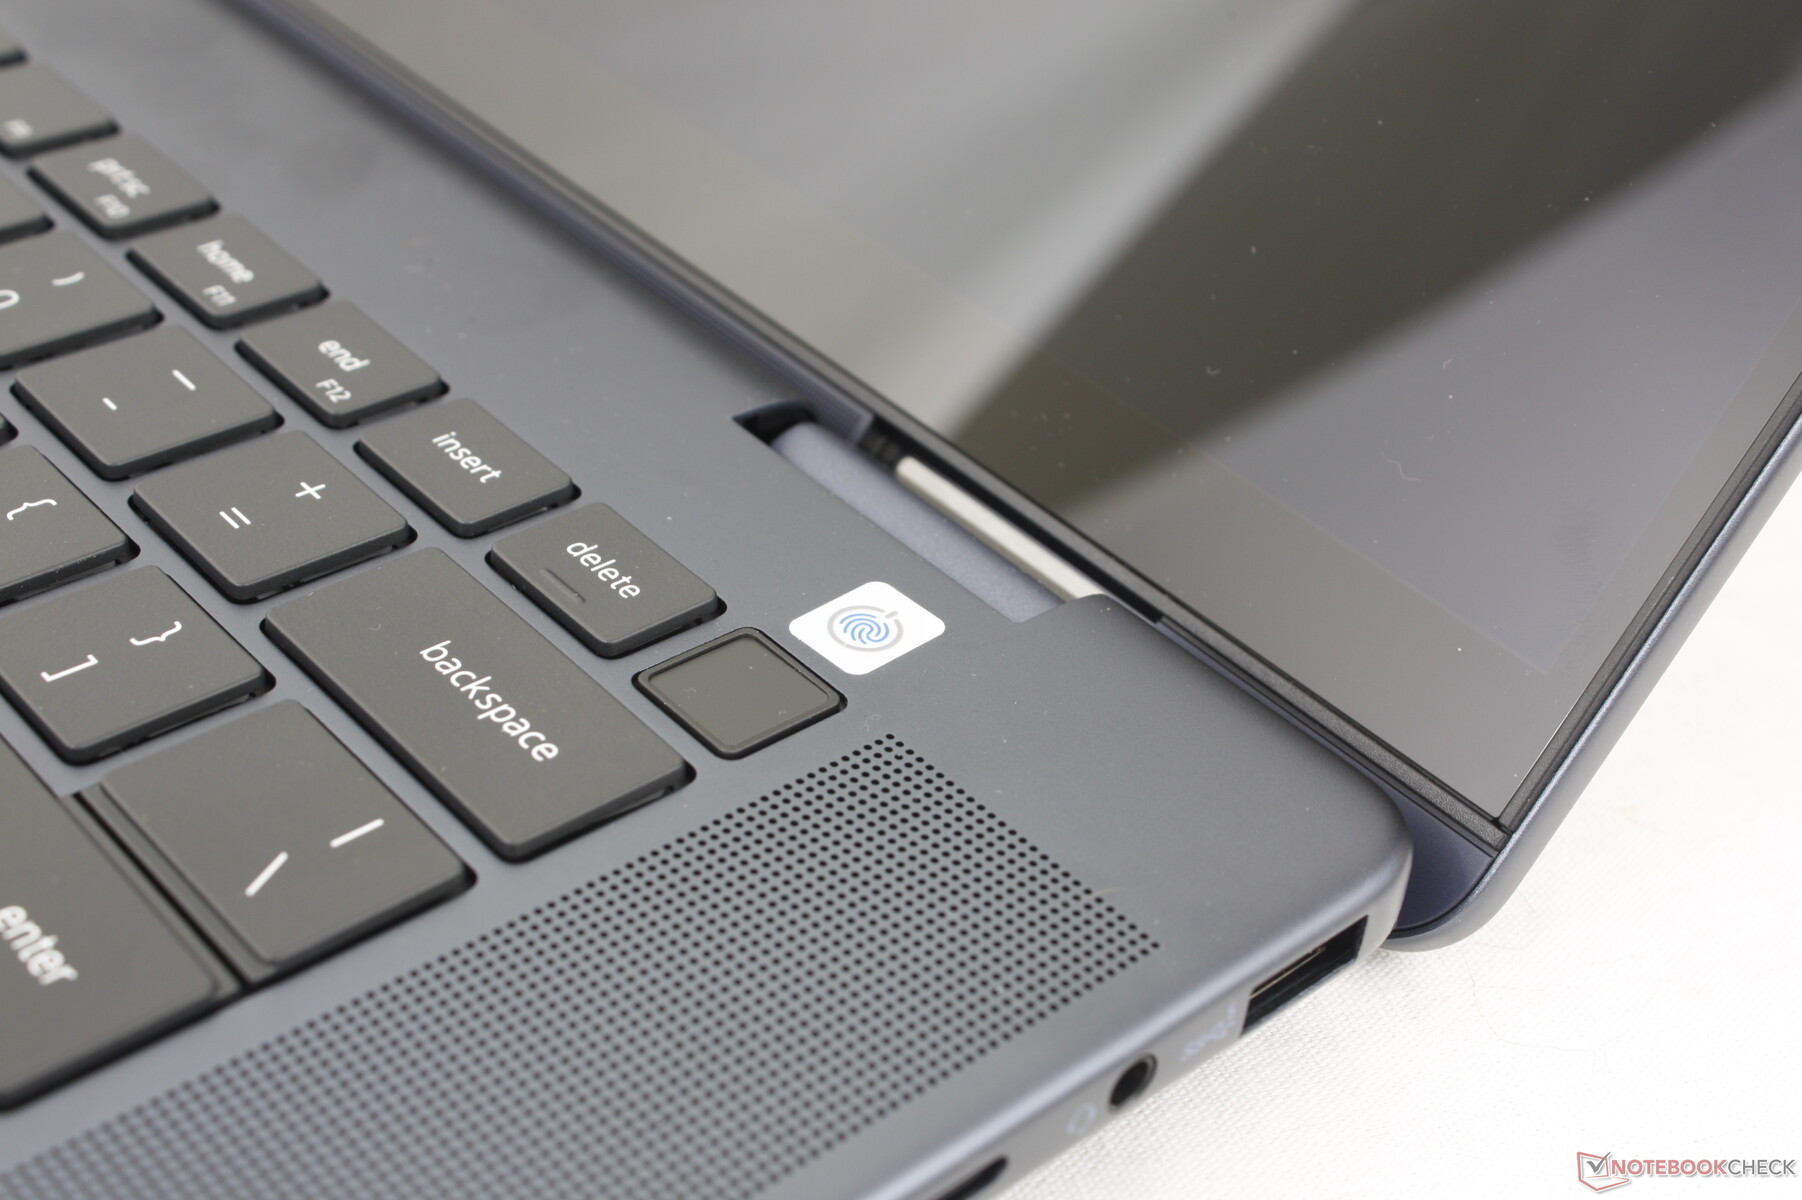
La confezione di vendita include una penna stilo attiva (PN5122W) oltre alla documentazione e all'adattatore CA. La garanzia limitata standard di un anno si applica se acquistata negli Stati Uniti.
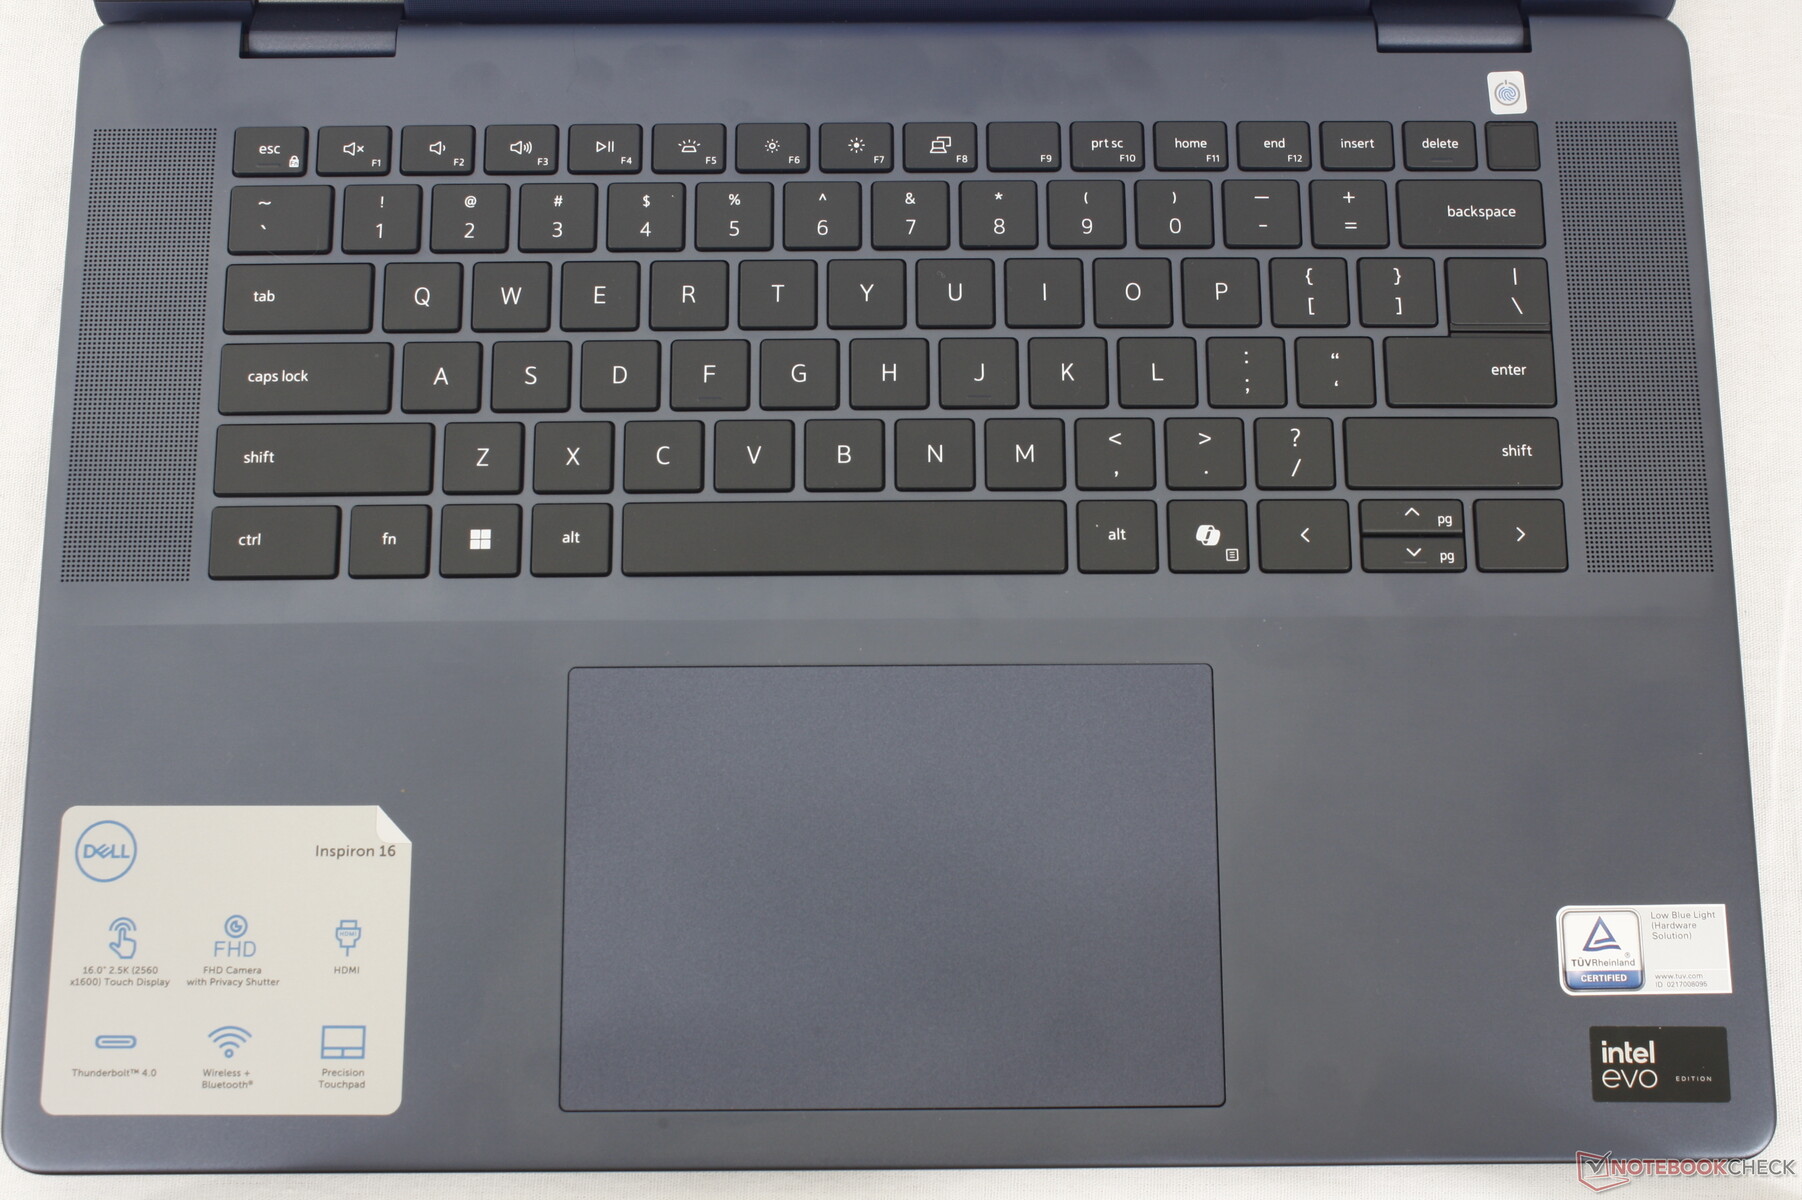
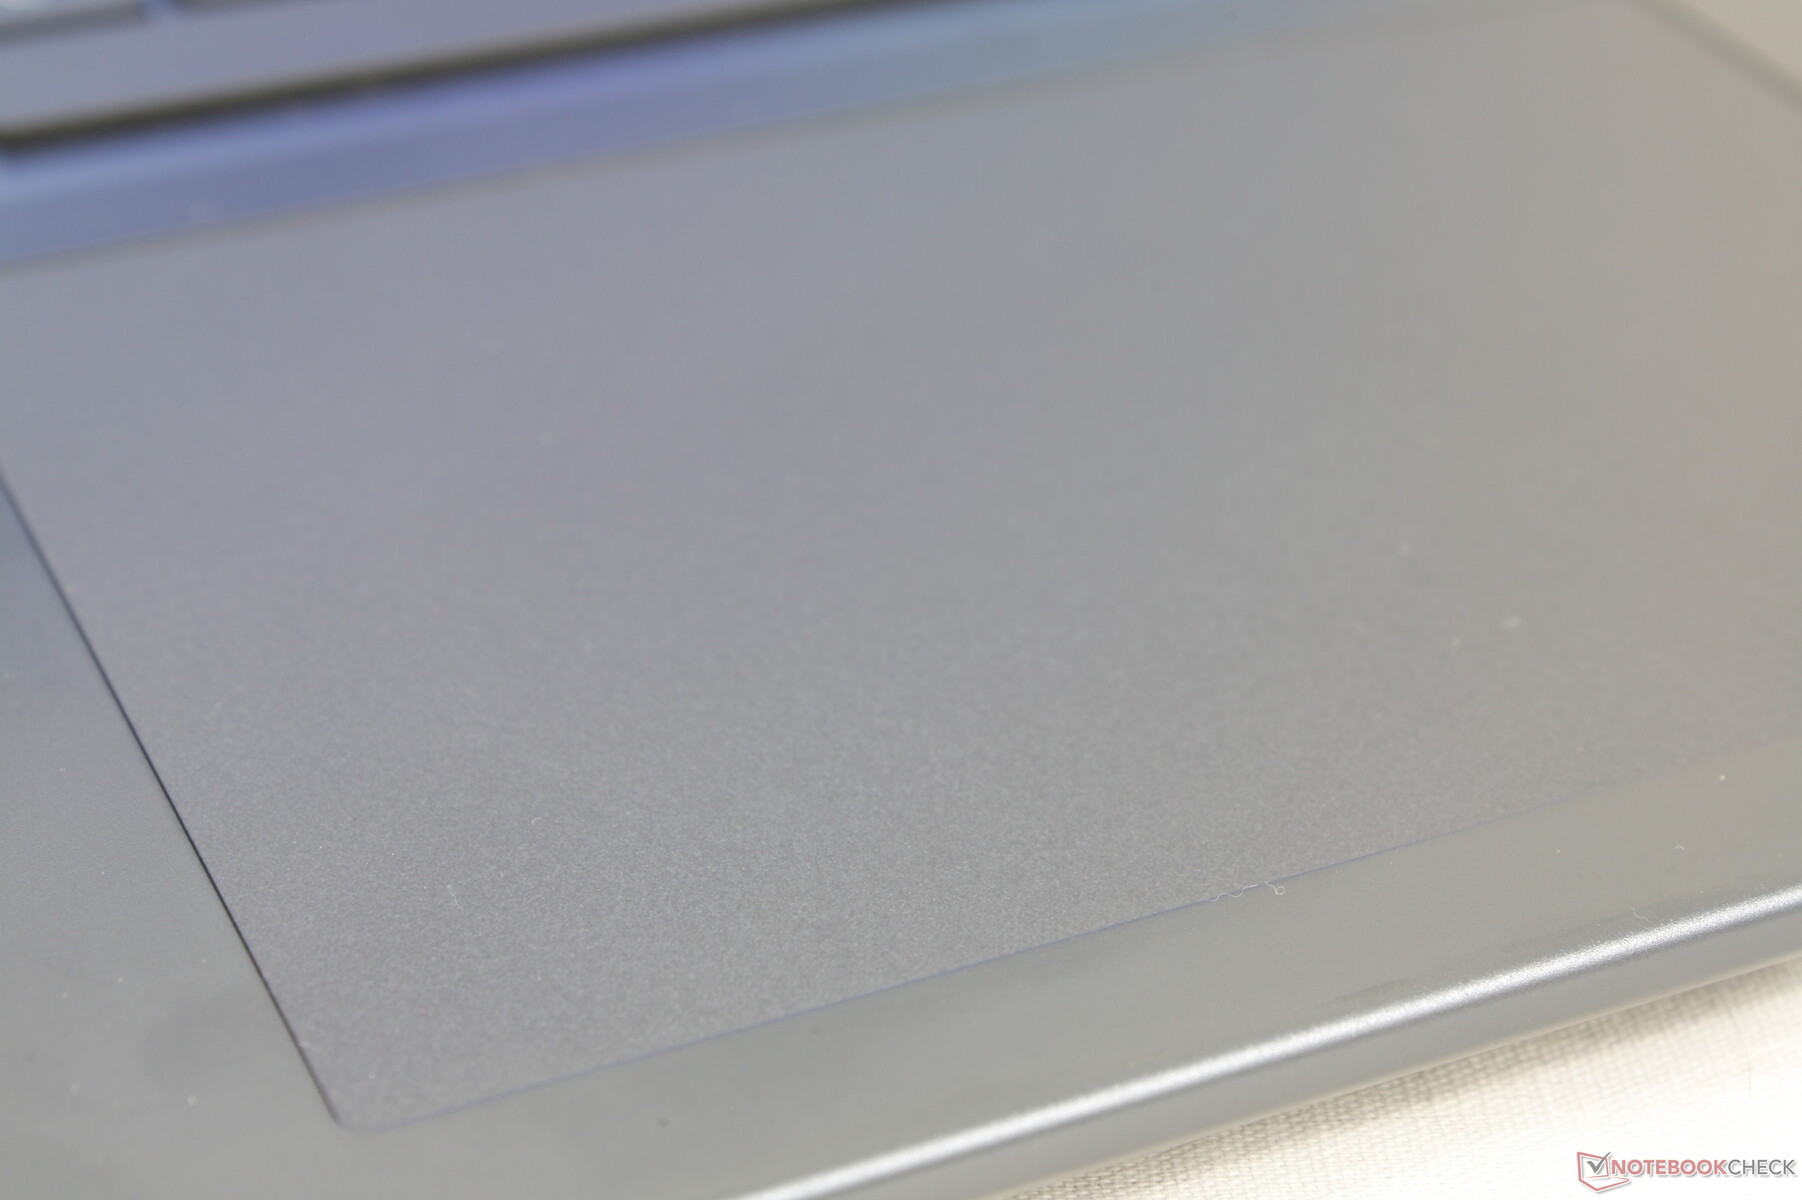
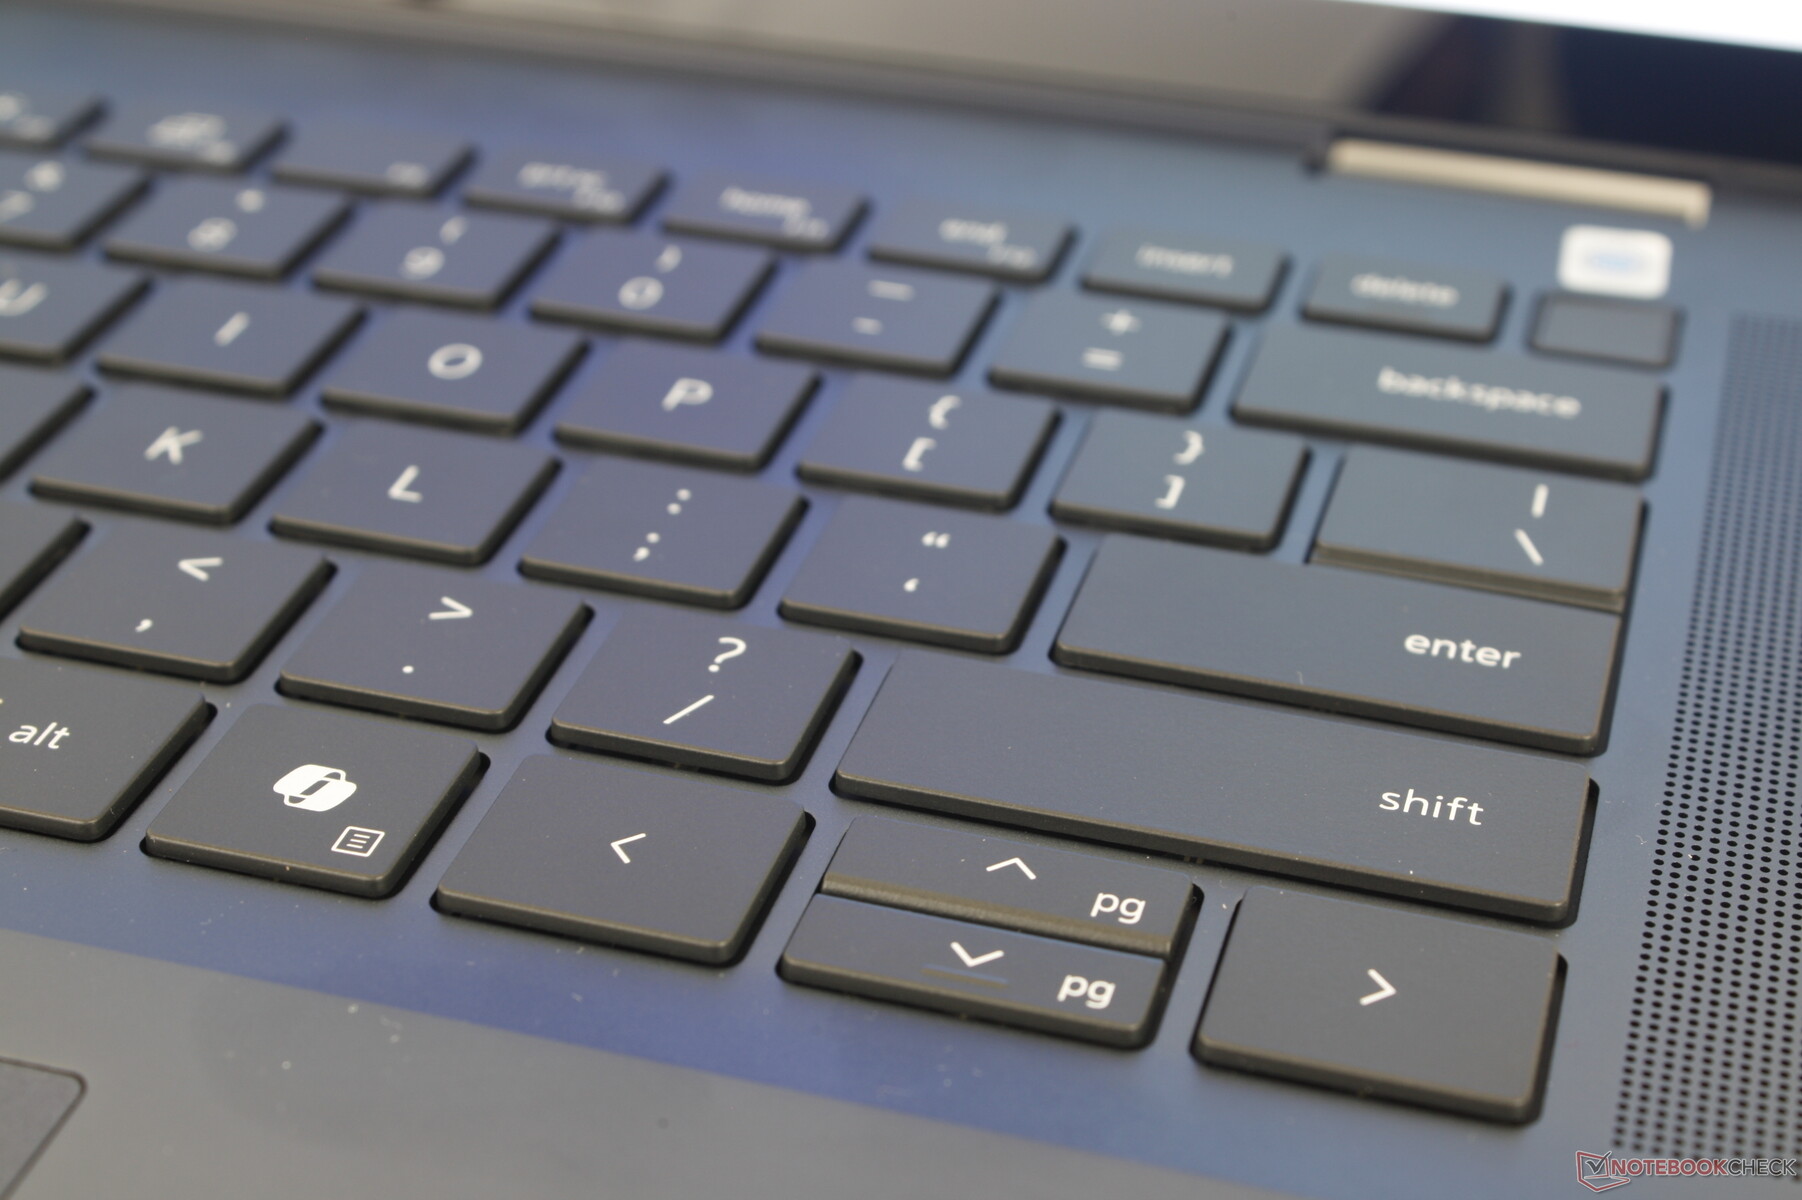
Dispositivi di input - Buoni ma ancora un po' spugnosi
Tastiera e touchpad
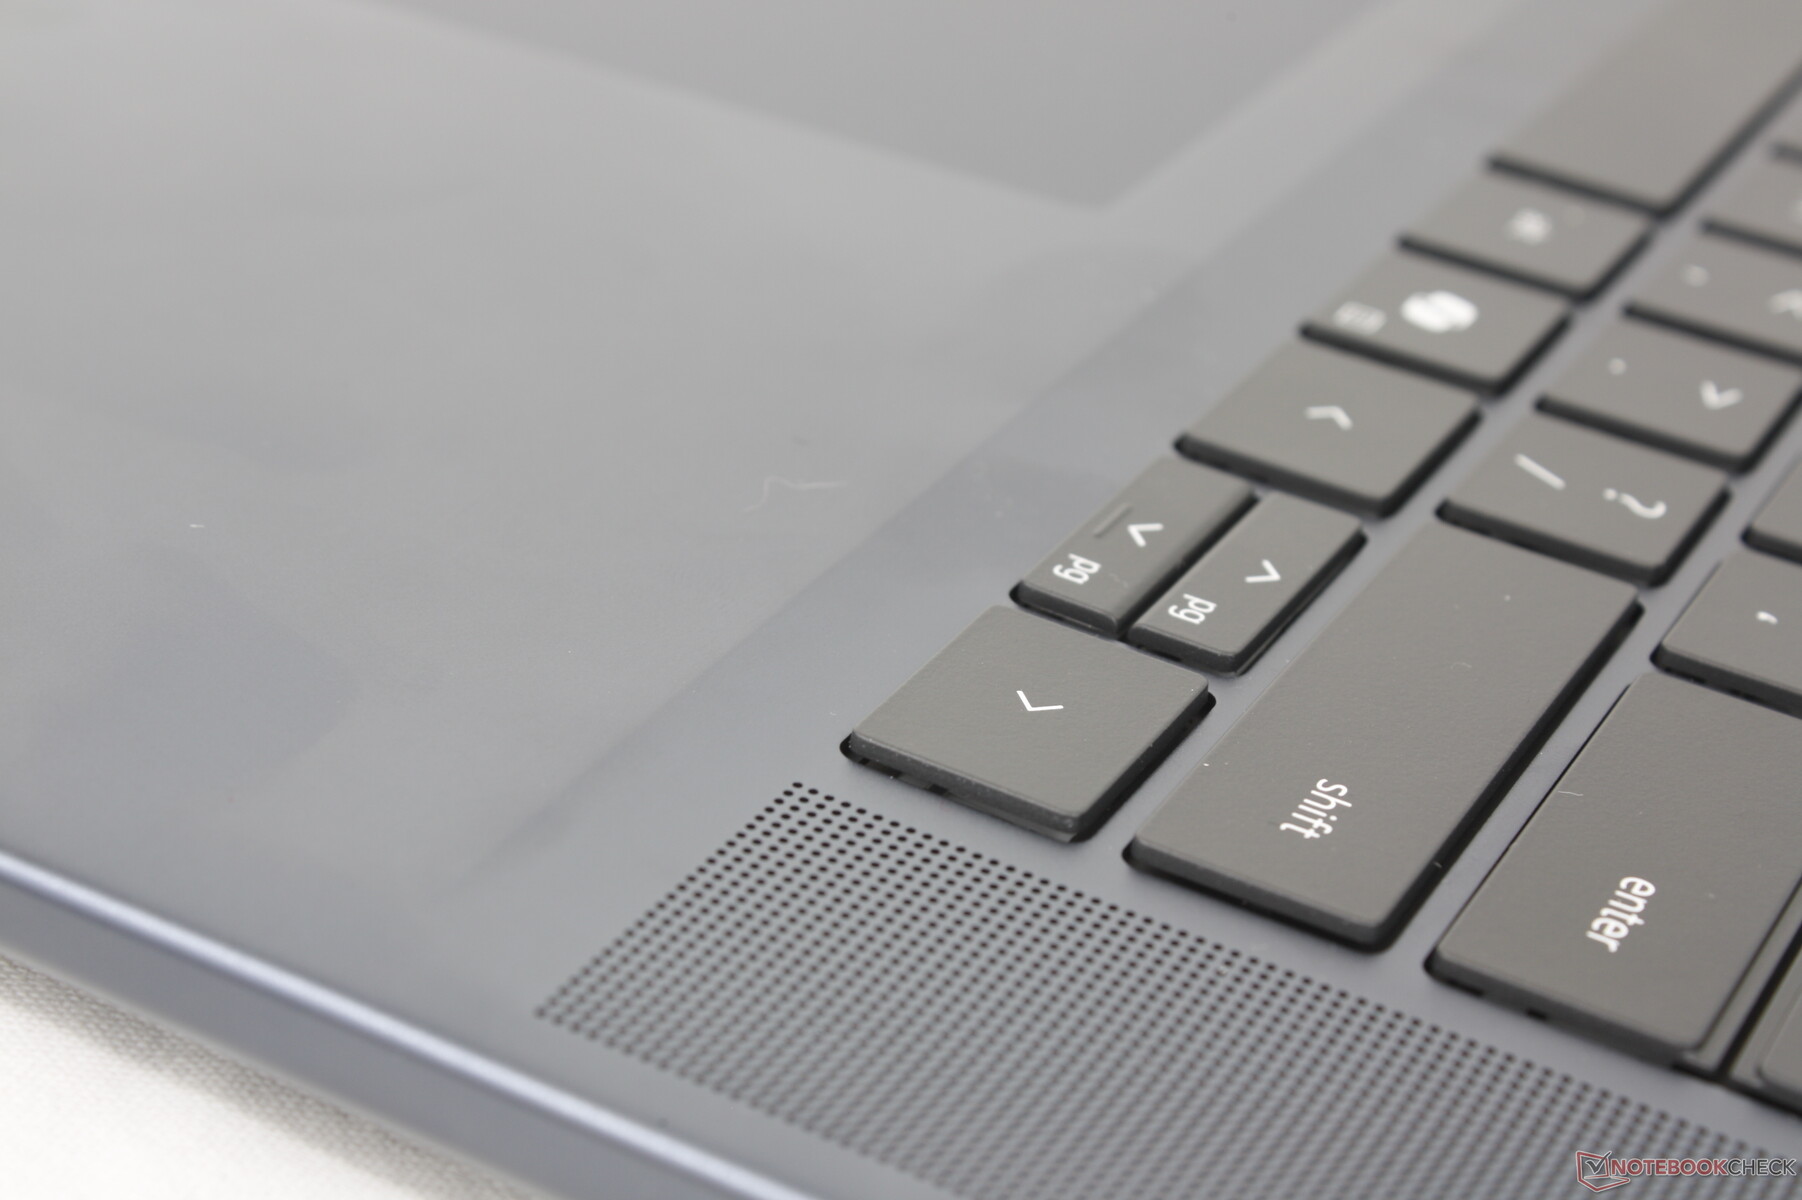
La tastiera e il touchpad non sono cambiati rispetto alla serie Inspiron 7630 2-in-1, nonostante tutte le modifiche fisiche apportate al telaio. Ci sono un paio di differenze minori, come il pulsante di accensione leggermente più piccolo sul nostro modello più recente e l'introduzione del tasto Co-Pilot dedicato, ma tutto, dalle dimensioni del clickpad (13,3 x 9 cm) al feedback dei tasti, è identico al modello dello scorso anno. Sarebbe stato bello vedere dei miglioramenti in questo senso, in quanto riteniamo che i tasti e il clickpad dell'Inspiron siano più spugnosi e con un feedback meno soddisfacente rispetto ai tasti e al clickpad della serie HP Envy.

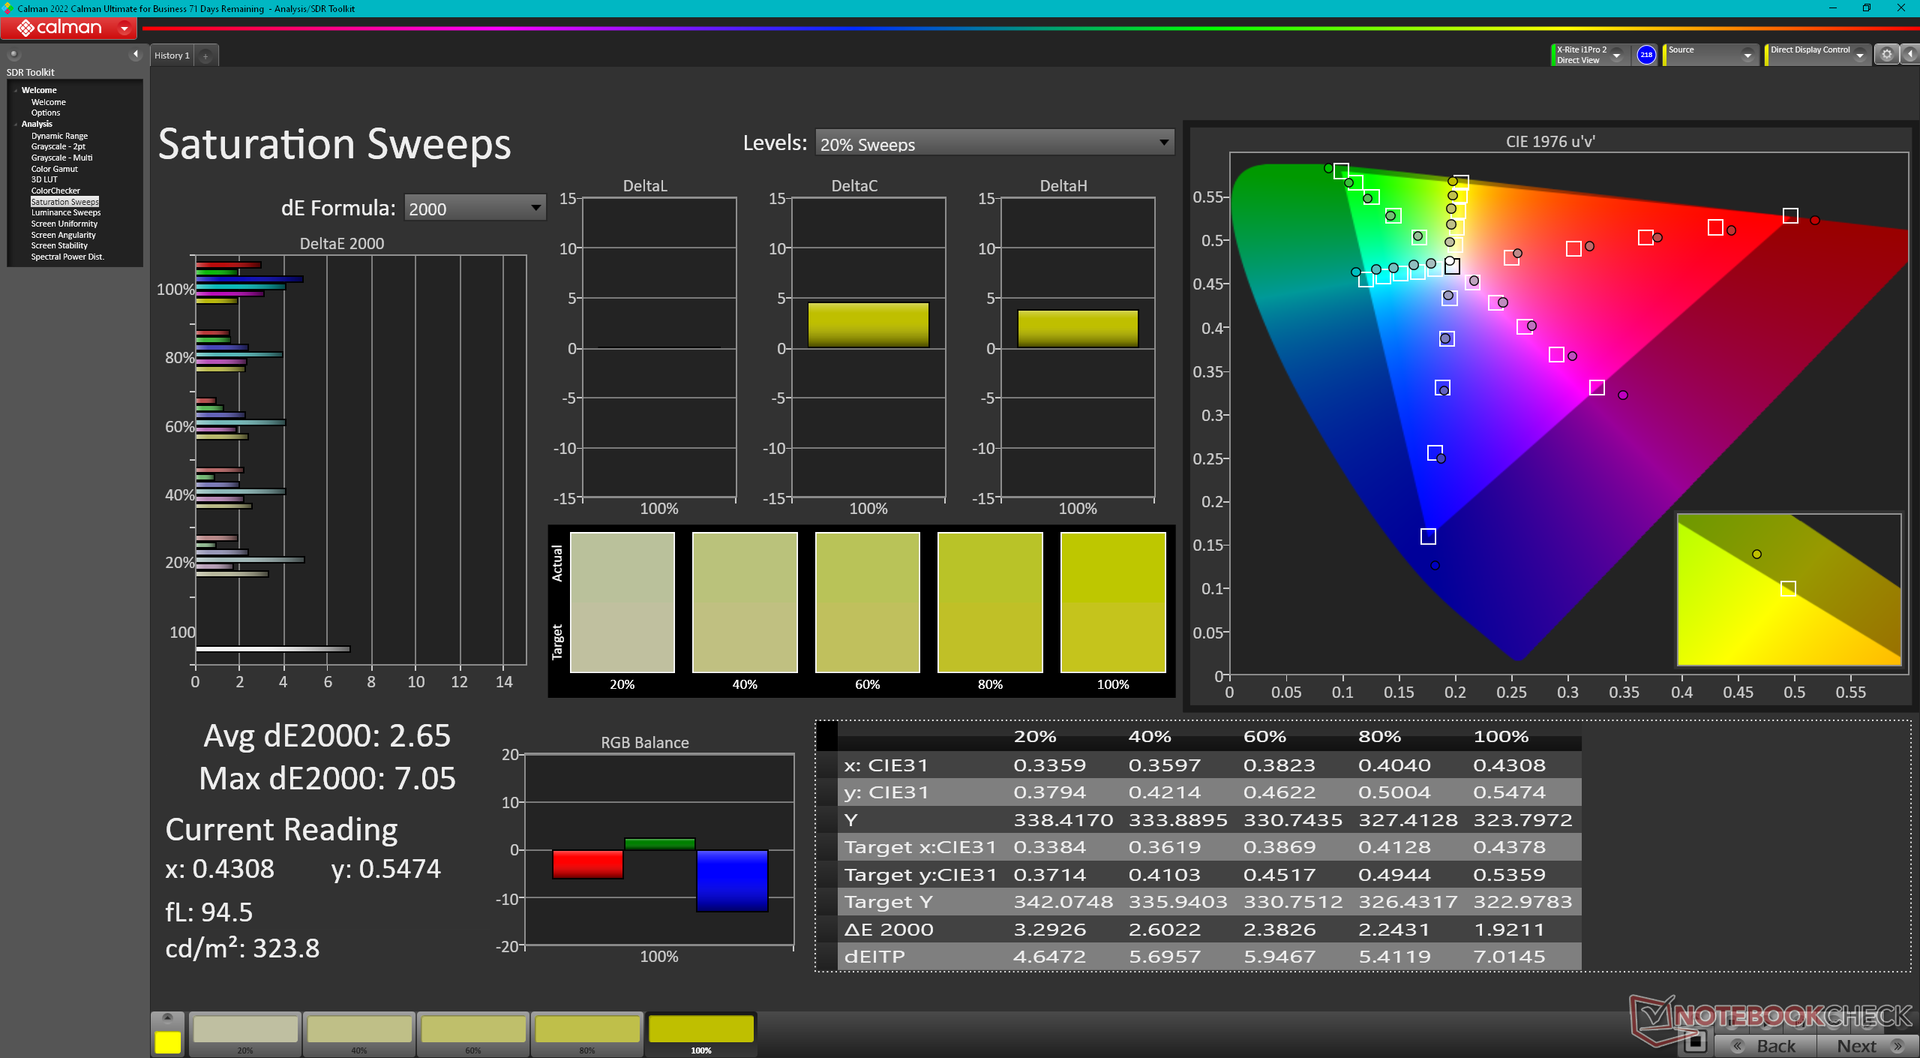
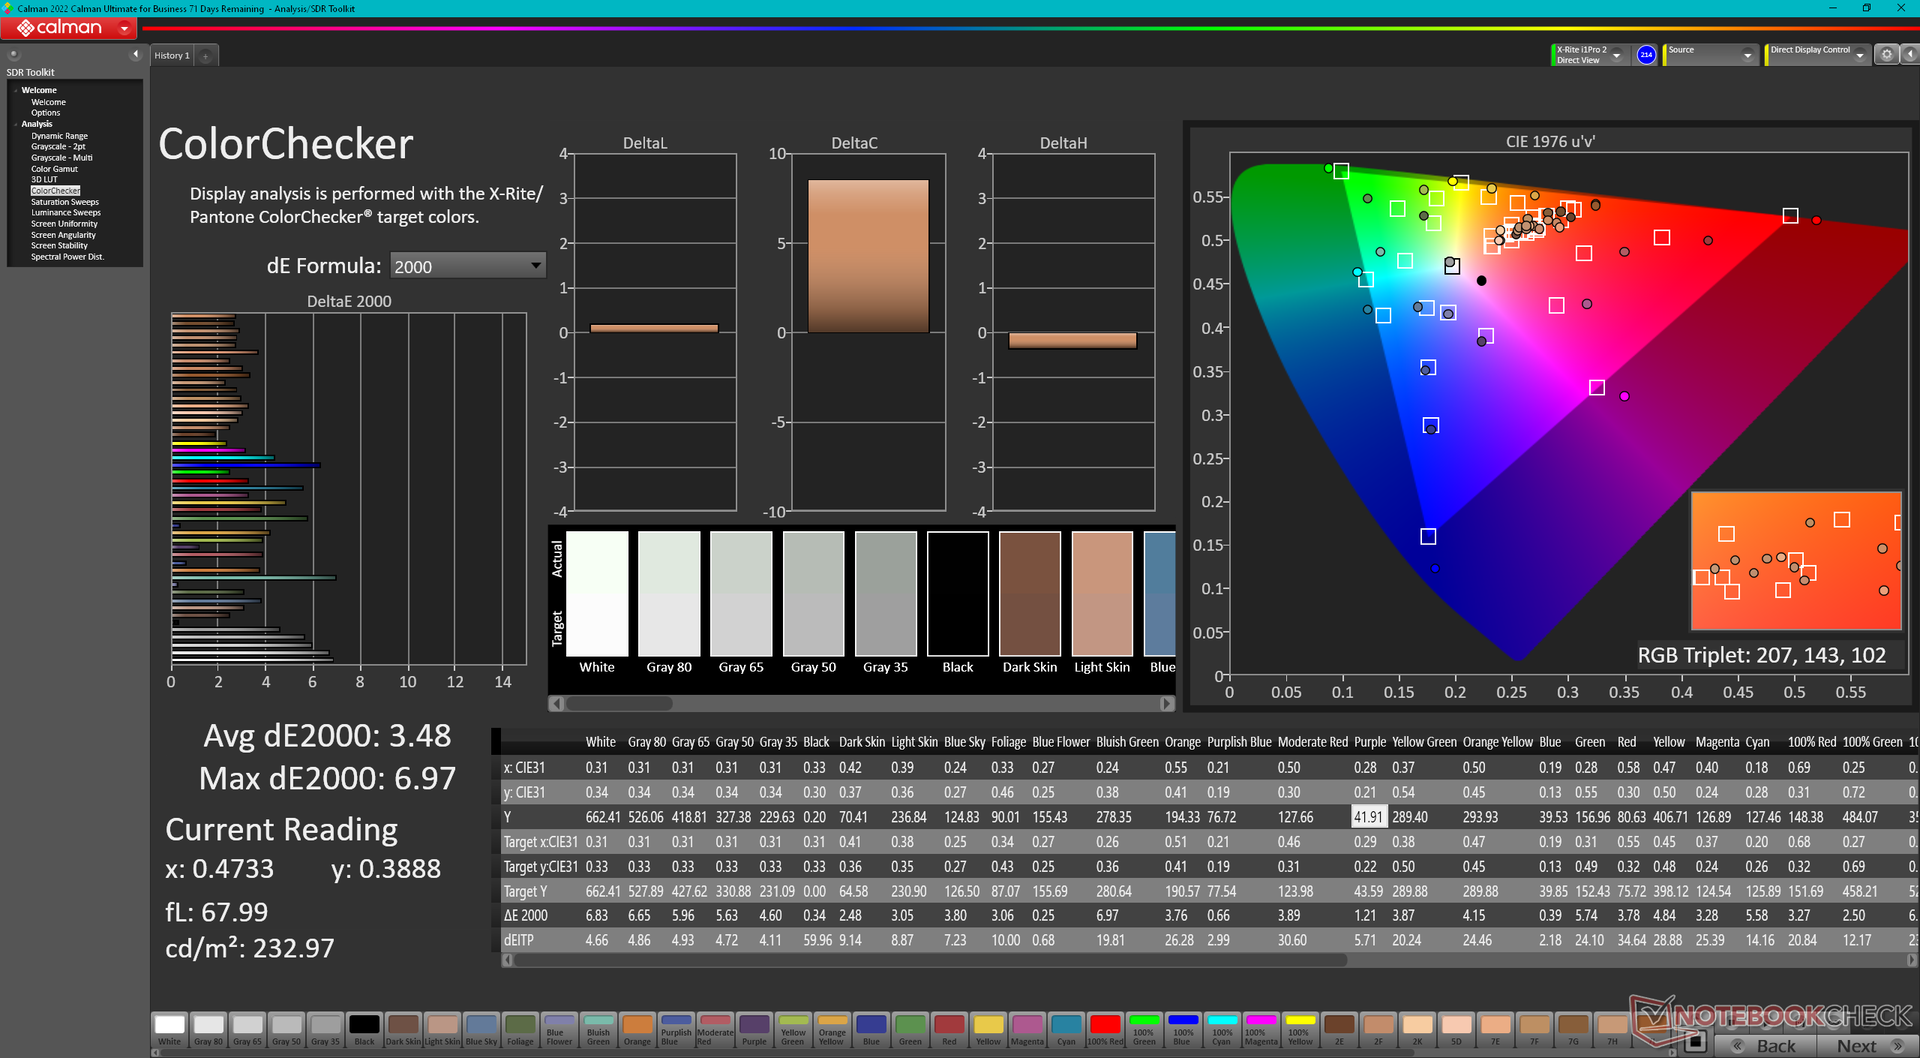
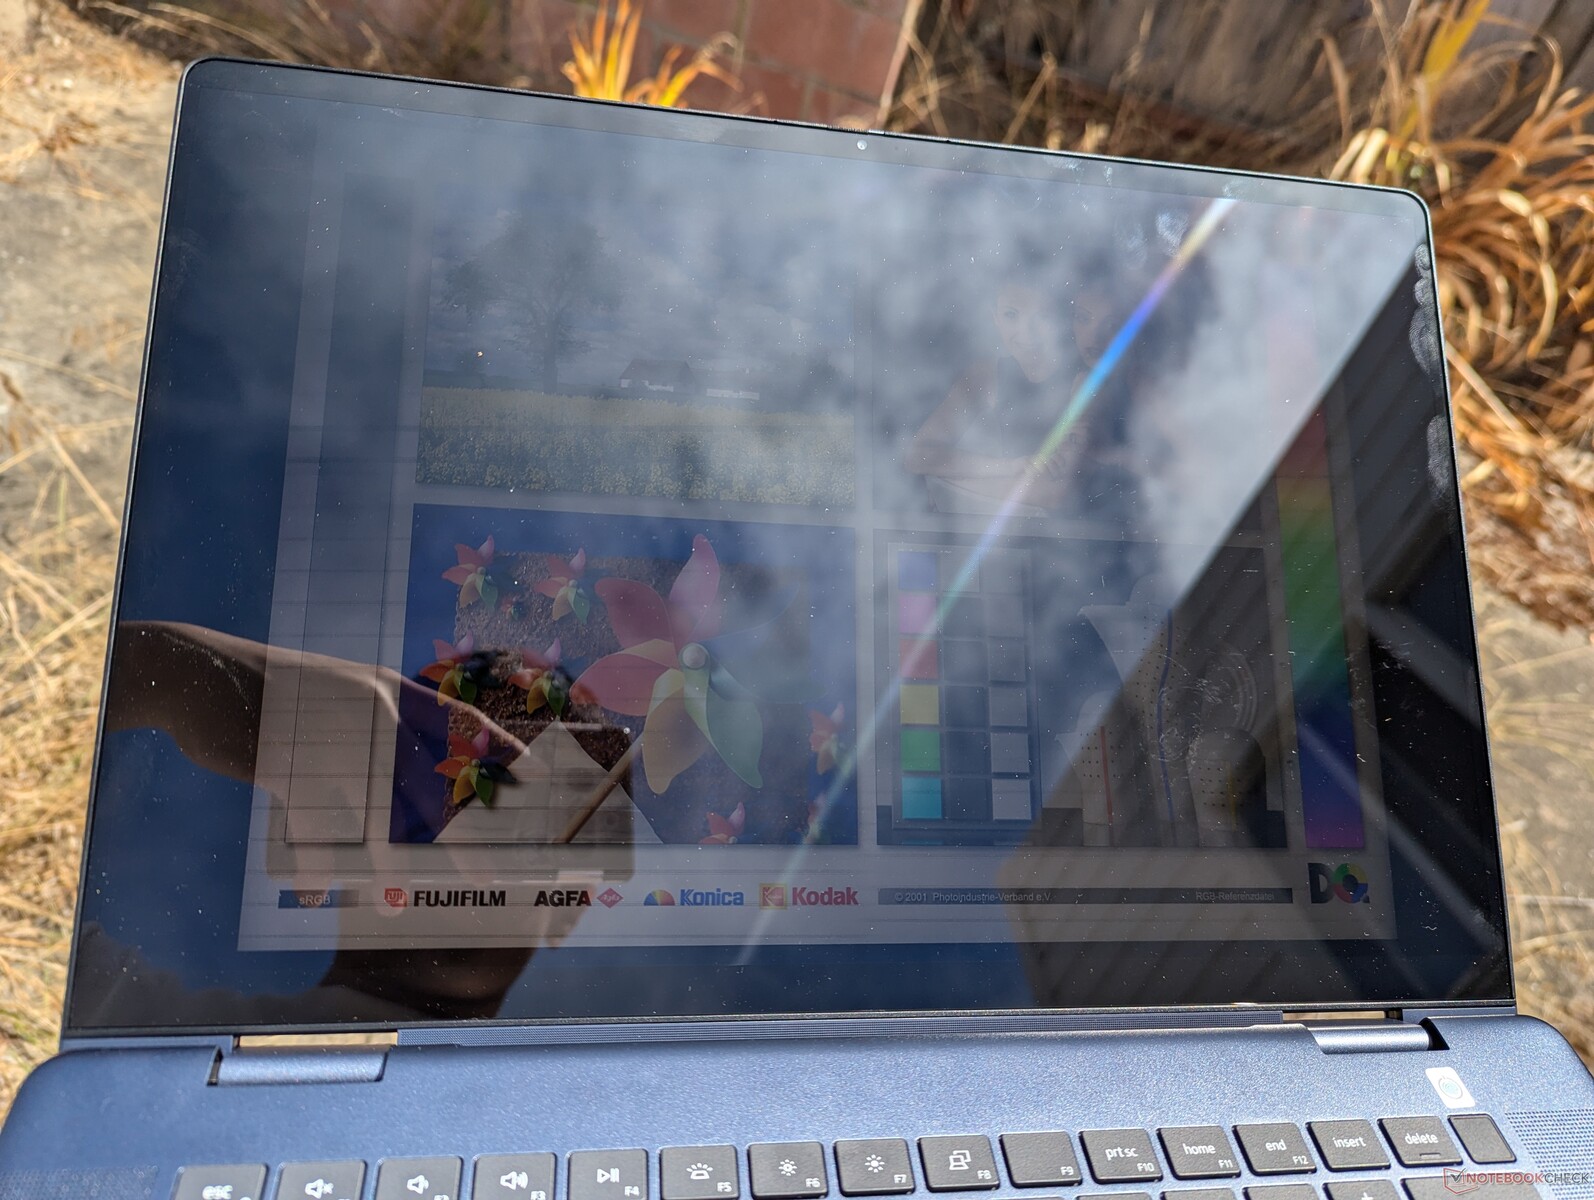
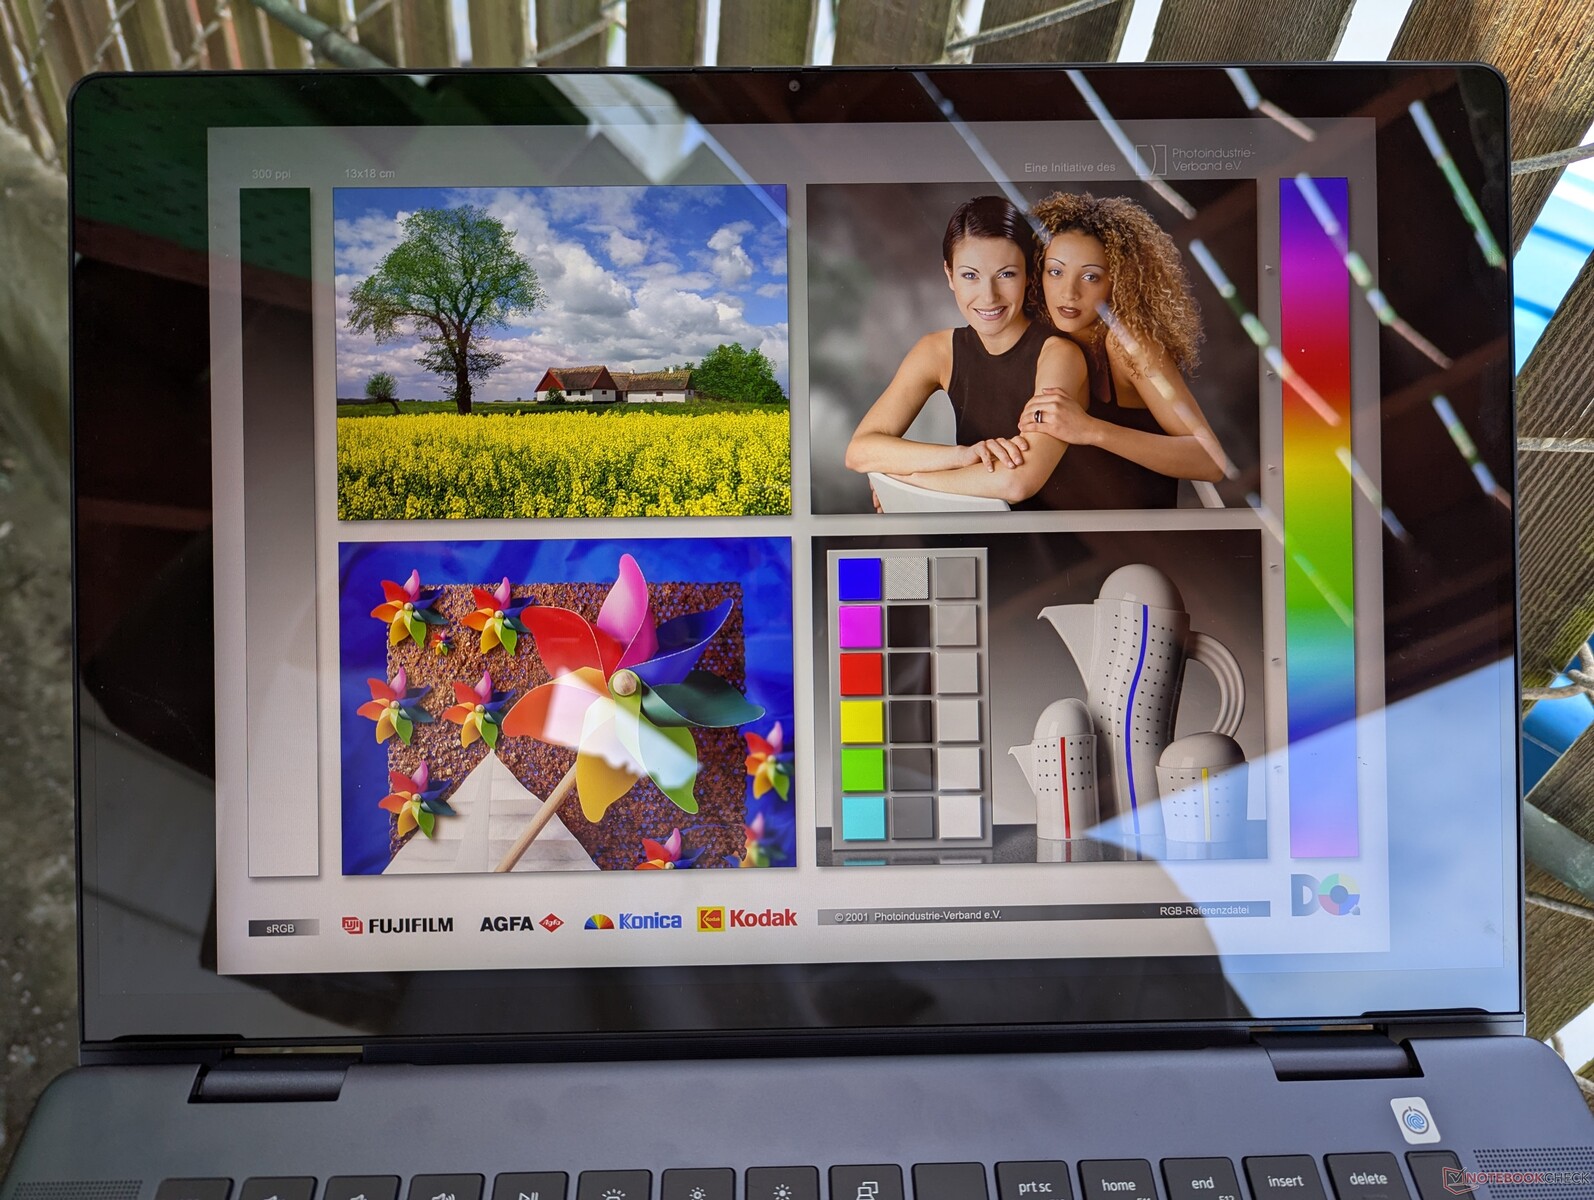
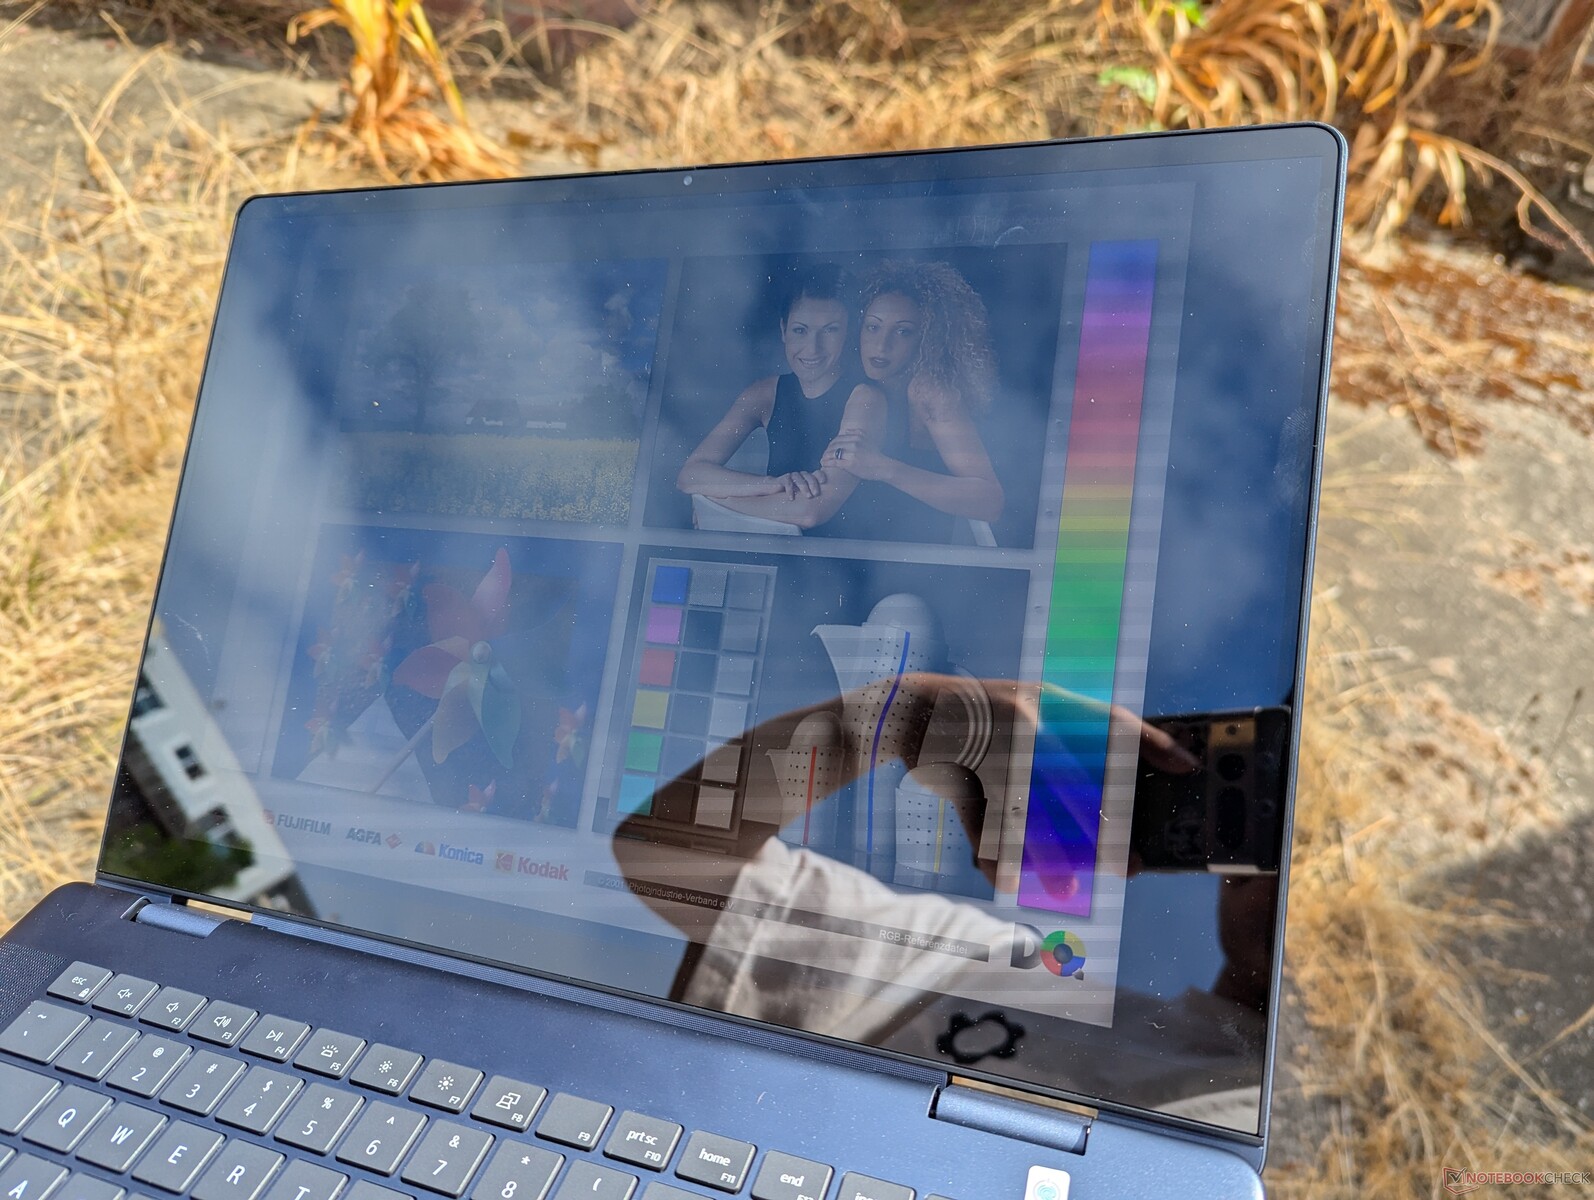
Display - Mini-LED HDR600 da 2,5K
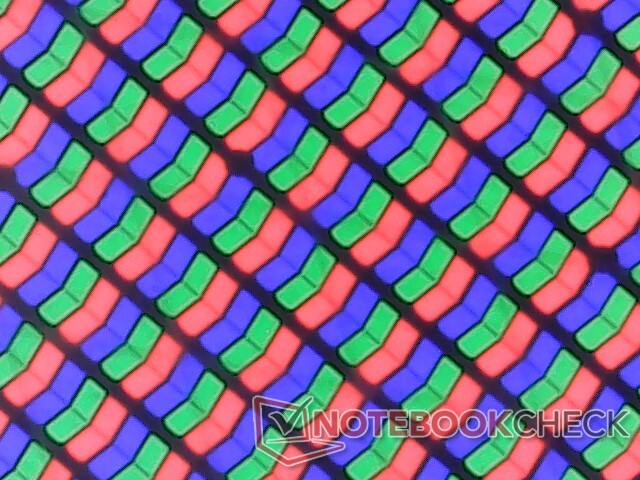
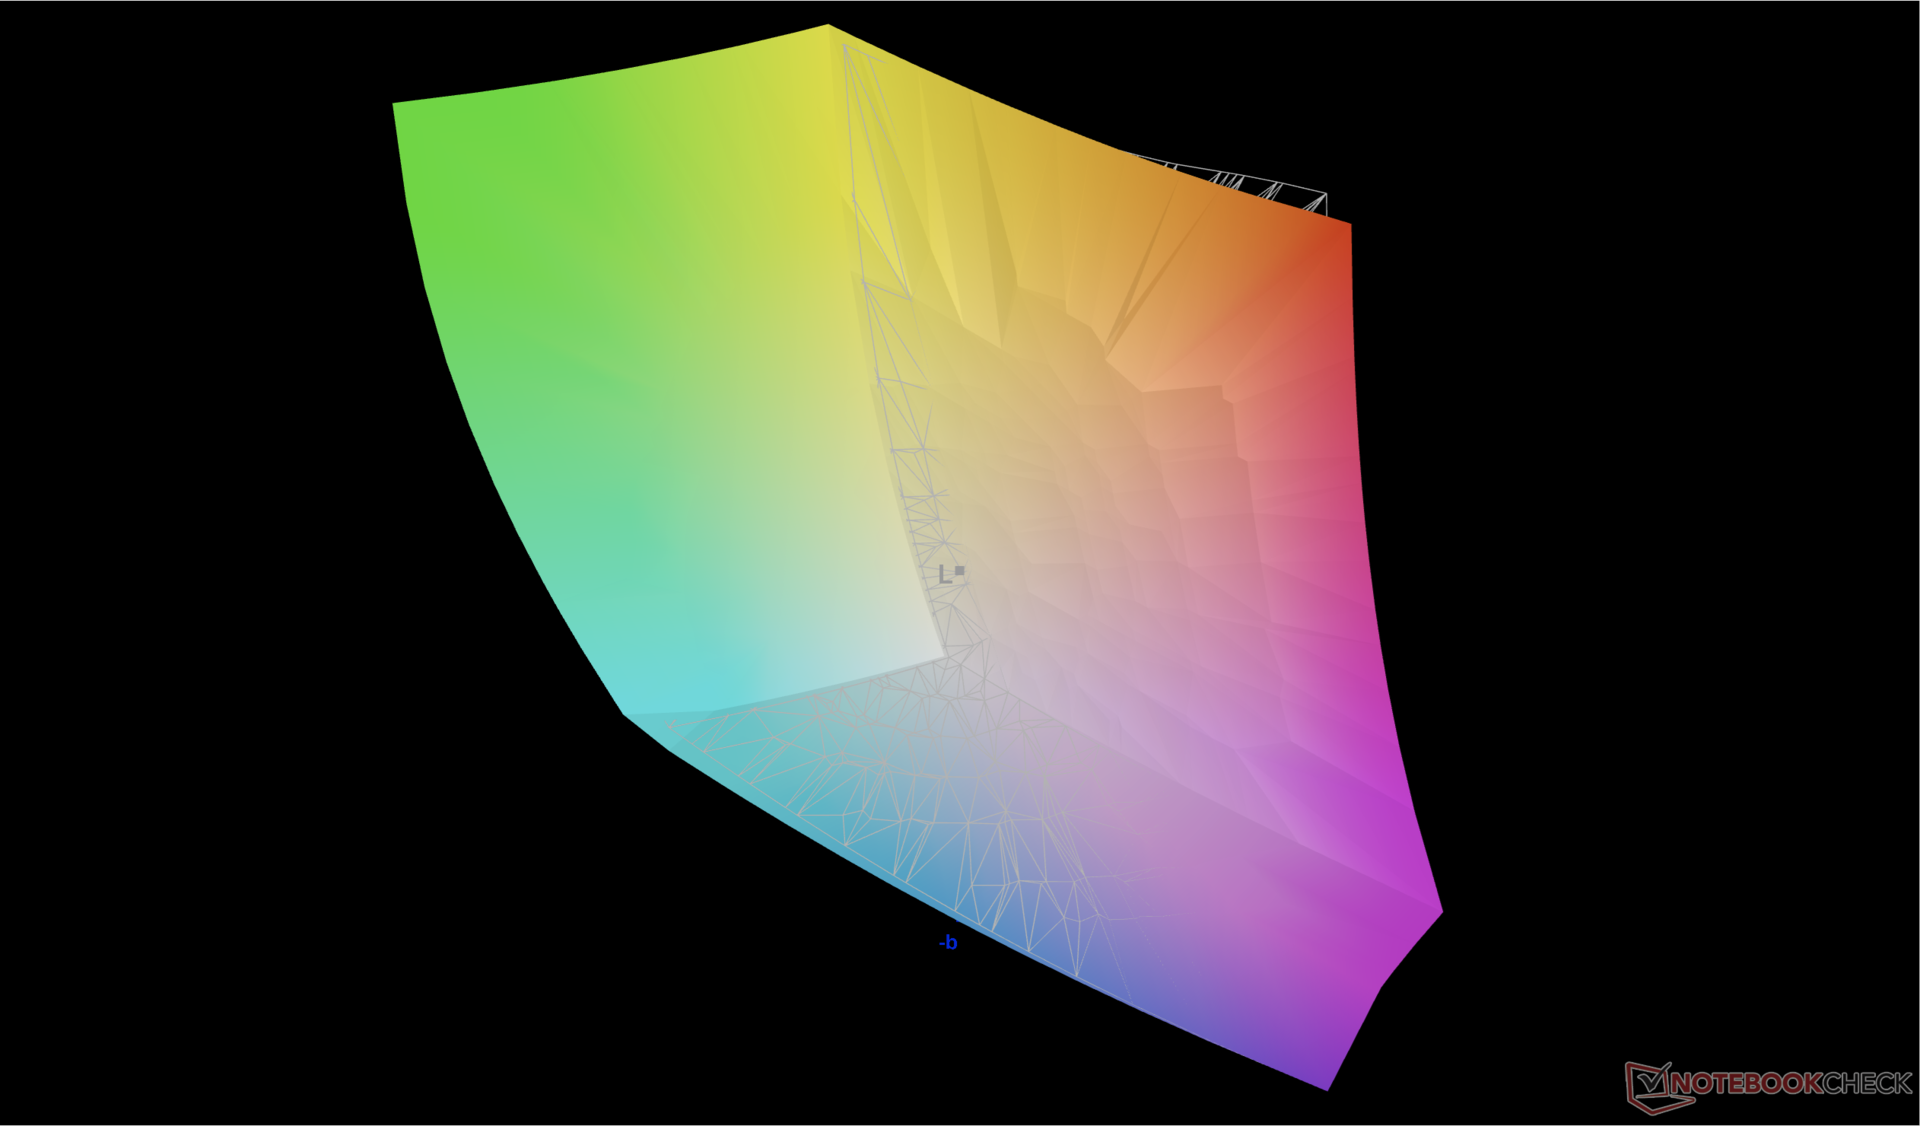
Il pannello Mini-LED opzionale è un punto di forza per l'Inspiron 16 2-in-1 di quest'anno. Anche se non offre il 4K e l'HDR1000 come su alcuni portatili da gioco estremila sua risoluzione di 2,5K e il supporto HDR600 sono comunque impressionanti per un convertibile da 16 pollici venduto al dettaglio a circa 1.000 dollari. Gli utenti continuano a ottenere lo stesso eccellente rapporto di contrasto di 3000:1 e i colori completi DCI-P3 della maggior parte degli altri pannelli mini-LED sui computer portatili più costosi.
Sia i colori che la luminosità sono impostati automaticamente su sRGB e 400 nits massimi, rispettivamente, quando l'HDR è disattivato. Attivando l'HDR, il profilo di colore passa a DCI-P3 e la luminosità massima sale a 663 nits quando si riproducono contenuti HDR.
La frequenza di aggiornamento nativa di 90 Hz è rispettabile, ma il pannello non supporta la sincronizzazione adattiva e la frequenza di aggiornamento variabile di Windows per risparmiare energia.
| |||||||||||||||||||||||||
Distribuzione della luminosità: 97 %
Al centro con la batteria: 413 cd/m²
Contrasto: 2950:1 (Nero: 0.14 cd/m²)
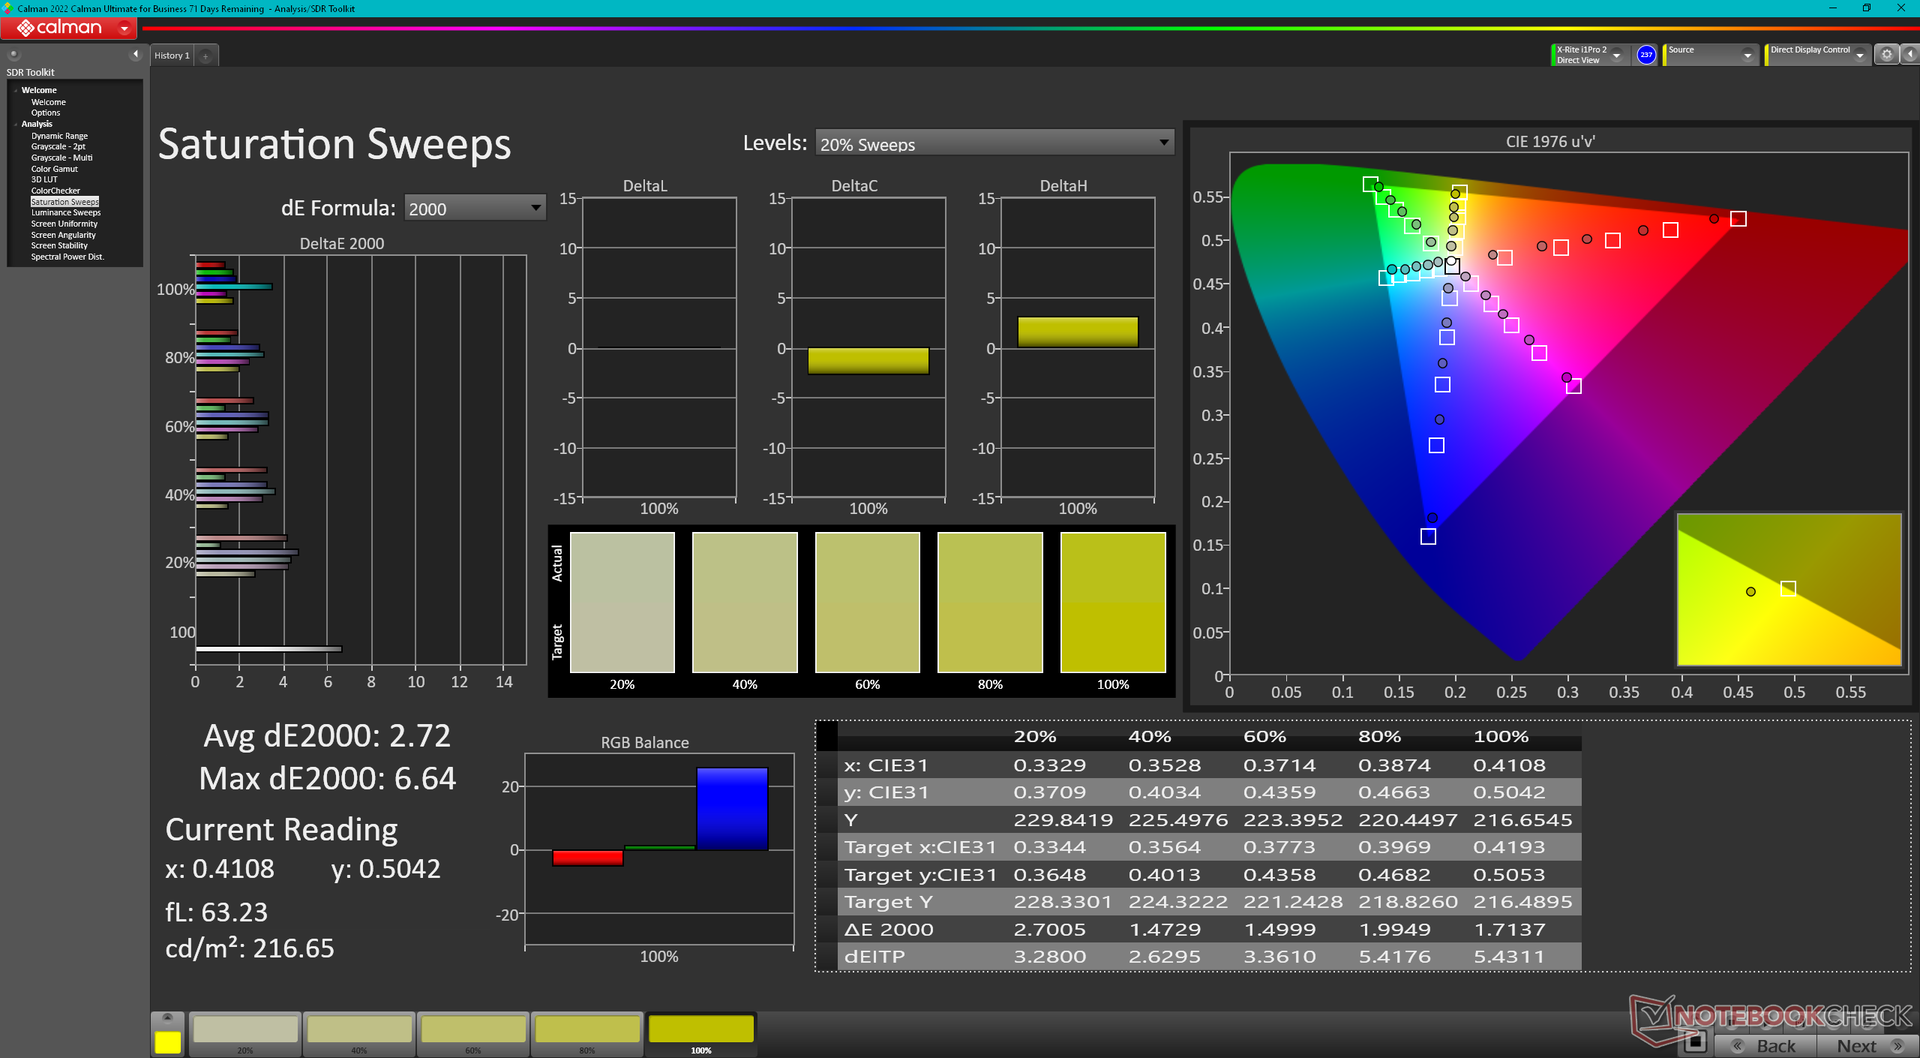
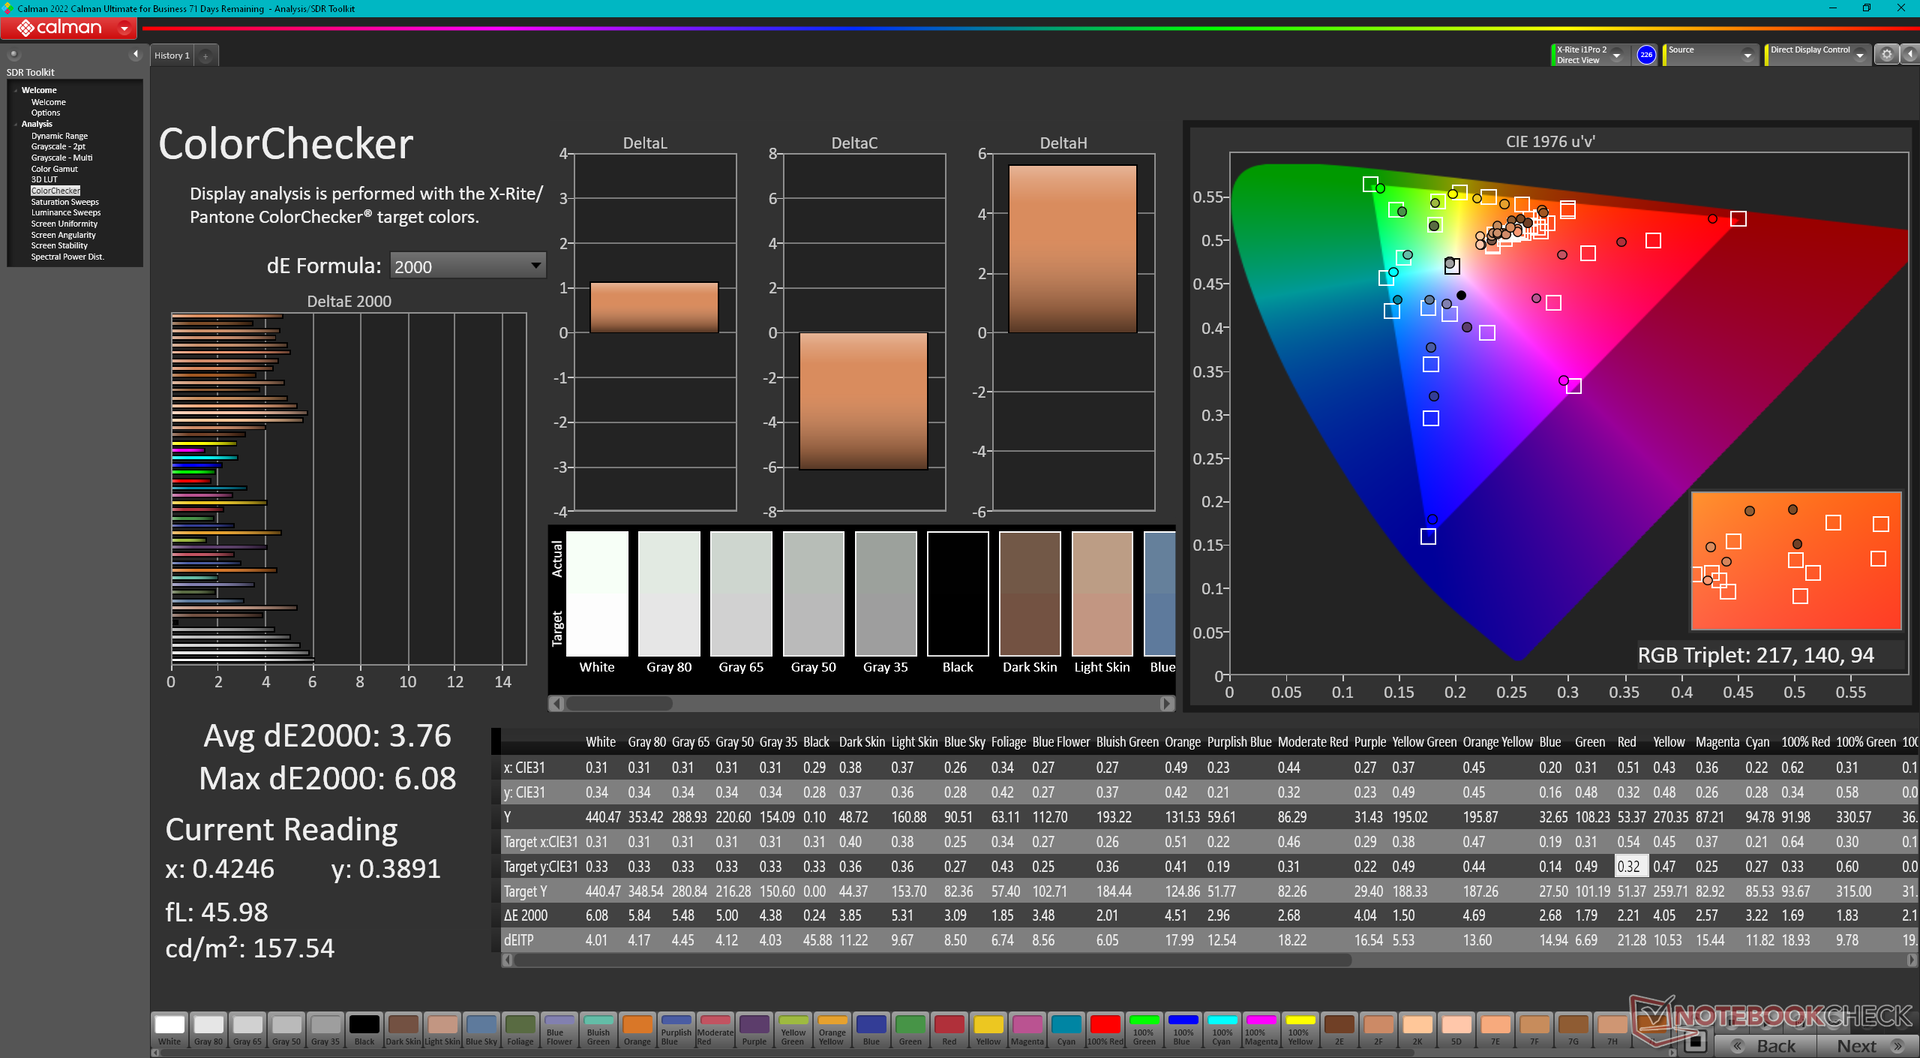
ΔE Color 3.48 | 0.5-29.43 Ø4.87
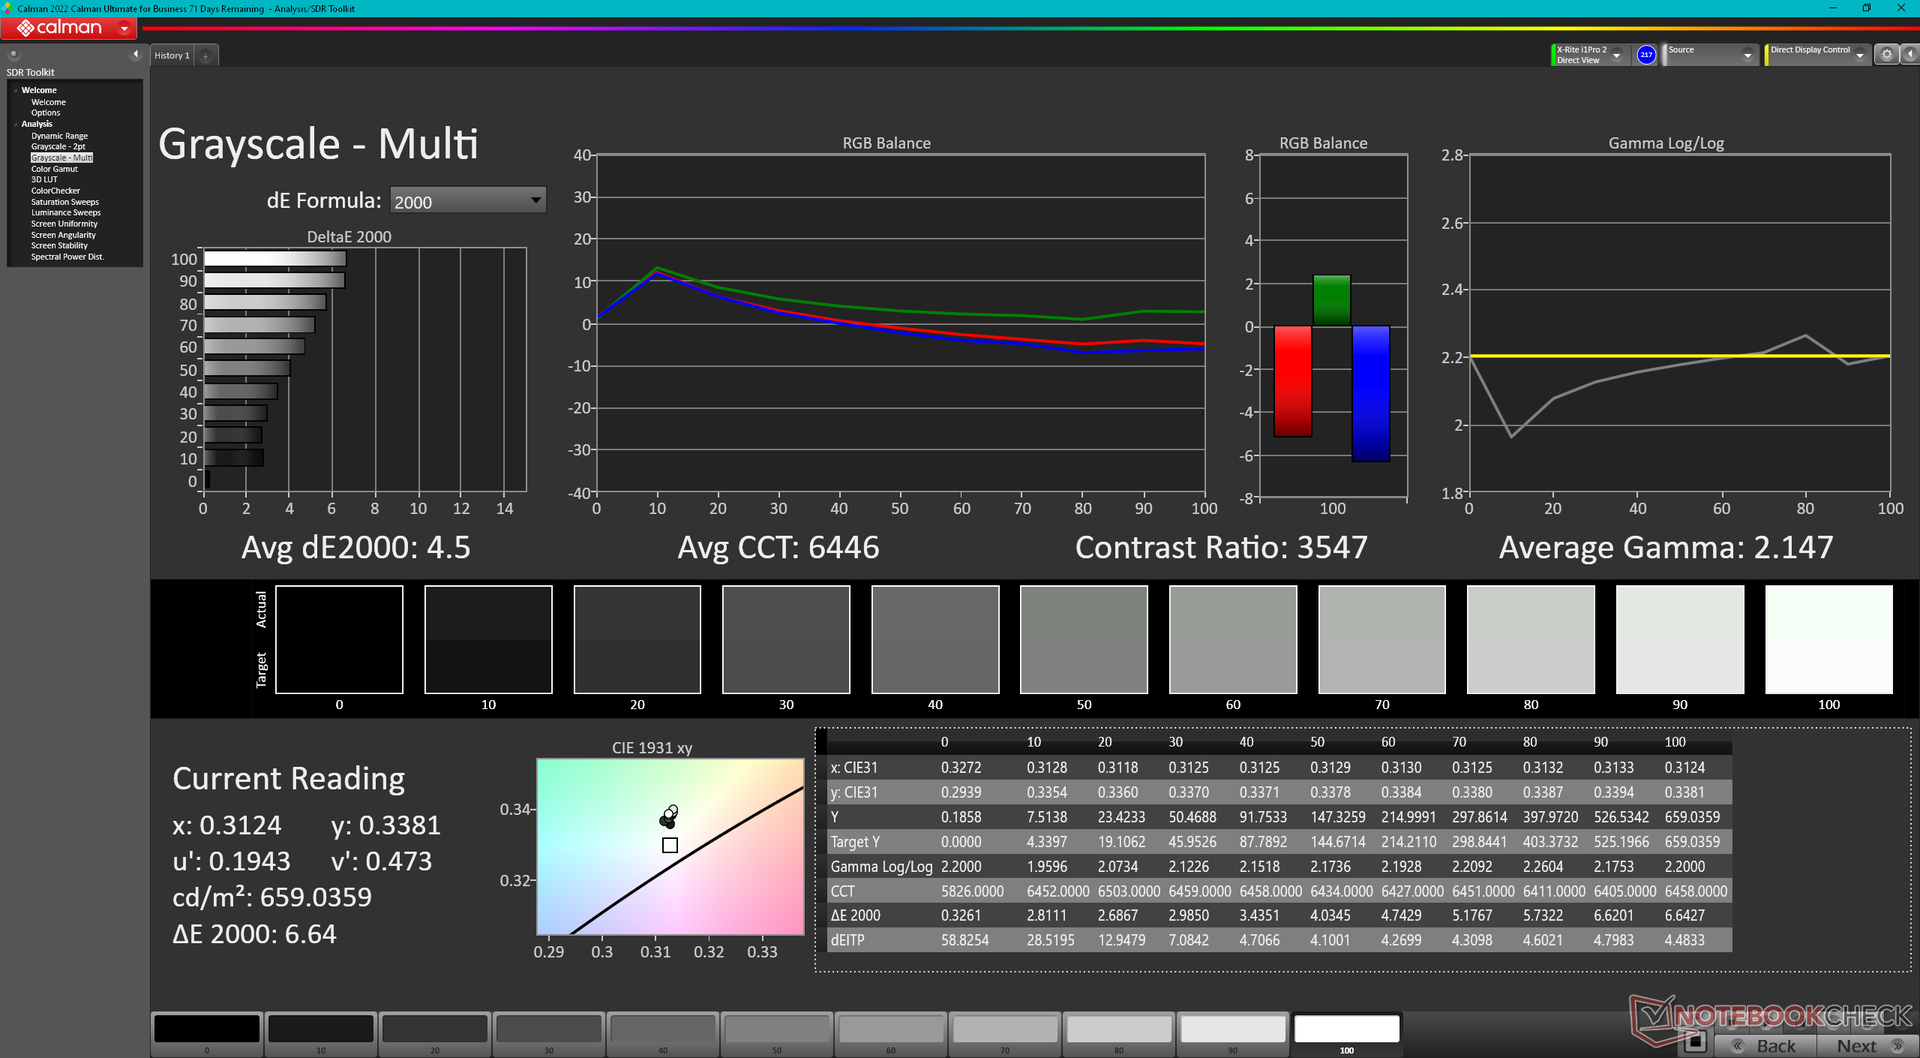
ΔE Greyscale 4.5 | 0.5-98 Ø5.1
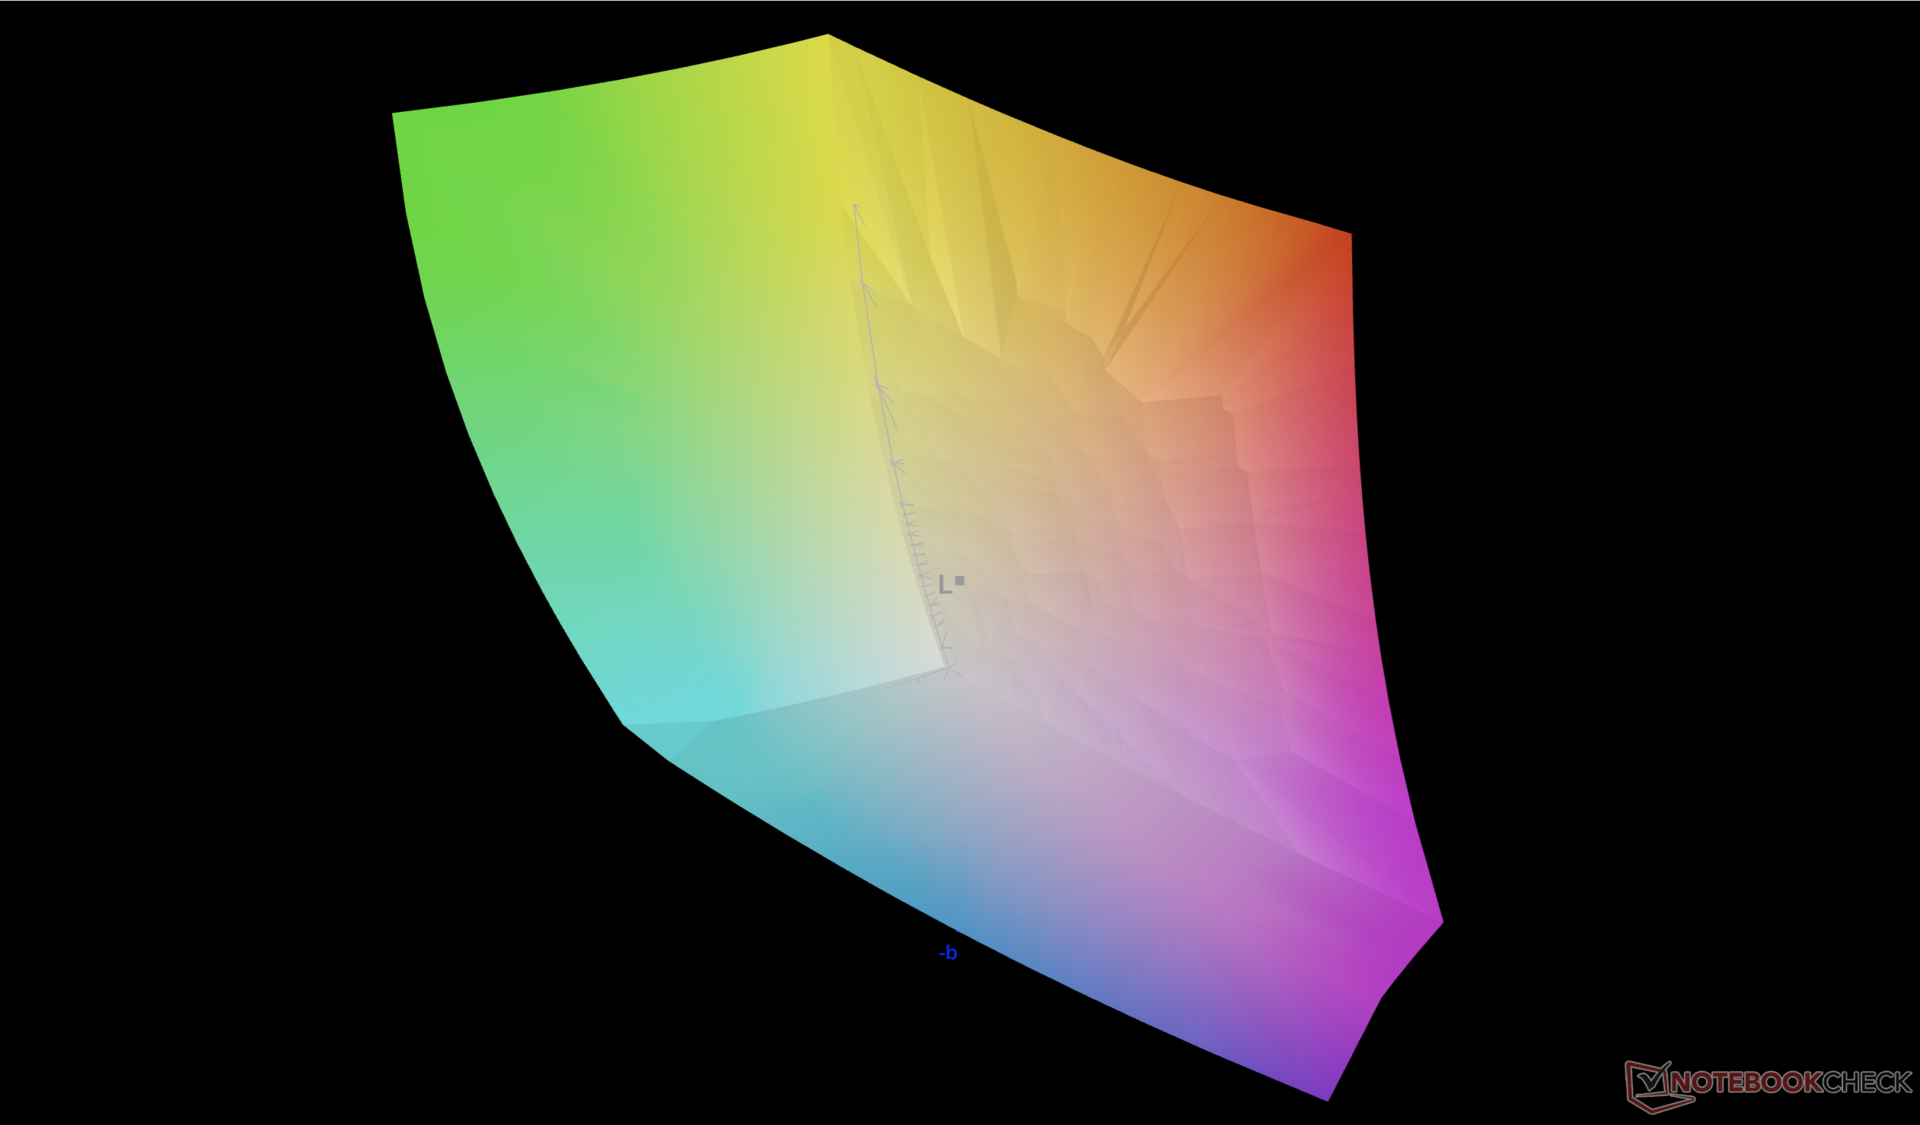
92.5% AdobeRGB 1998 (Argyll 2.2.0 3D)
100% sRGB (Argyll 2.2.0 3D)
99.4% Display P3 (Argyll 2.2.0 3D)
Gamma: 2.15
| Dell Inspiron 16 7640 2-in-1 AU Optronics B160QAT, Mini-LED, 2560x1600, 16", 90 Hz | Dell Inspiron 16 Plus 7640 AU Optronics B160QAN, IPS, 2560x1600, 16", 120 Hz | Dell Inspiron 16 7635 2-in-1 Chi Mei 160JCA, IPS, 1920x1200, 16", 60 Hz | HP Envy x360 2-in-1 16-ad0097nr Samsung SDC41A6, OLED, 2880x1800, 16", 120 Hz | Lenovo IdeaPad Pro 5 16IMH G9 NE160QDM-NY2, IPS, 2560x1600, 16", 120 Hz | Samsung Galaxy Book4 Pro 360 ATNA60CL09-0, OLED, 2880x1800, 16", 120 Hz | |
|---|---|---|---|---|---|---|
| Display | -14% | -20% | 1% | -23% | 2% | |
| Display P3 Coverage | 99.4 | 76 -24% | 67.4 -32% | 99.6 0% | 63.3 -36% | 99.9 1% |
| sRGB Coverage | 100 | 99.8 0% | 98.2 -2% | 100 0% | 95.2 -5% | 100 0% |
| AdobeRGB 1998 Coverage | 92.5 | 76.7 -17% | 69.5 -25% | 96.5 4% | 65.3 -29% | 96.6 4% |
| Response Times | 3% | -5% | 37% | 43% | 35% | |
| Response Time Grey 50% / Grey 80% * | 15.4 ? | 25.6 ? -66% | 27.6 ? -79% | 0.8 ? 95% | 15 ? 3% | 0.49 ? 97% |
| Response Time Black / White * | 60.6 ? | 17.6 ? 71% | 18.2 ? 70% | 0.89 ? 99% | 10.3 ? 83% | 0.67 ? 99% |
| PWM Frequency | 2753.7 ? | 491.8 ? -82% | 240 ? -91% | |||
| Screen | -5% | -25% | 10% | -21% | 33% | |
| Brightness middle | 413 | 314.7 -24% | 301.3 -27% | 399.4 -3% | 368 -11% | 387 -6% |
| Brightness | 409 | 291 -29% | 269 -34% | 405 -1% | 368 -10% | 392 -4% |
| Brightness Distribution | 97 | 89 -8% | 79 -19% | 98 1% | 91 -6% | 98 1% |
| Black Level * | 0.14 | 0.28 -100% | 0.28 -100% | 0.31 -121% | ||
| Contrast | 2950 | 1124 -62% | 1076 -64% | 1187 -60% | ||
| Colorchecker dE 2000 * | 3.48 | 1.62 53% | 3.1 11% | 4.05 -16% | 2.4 31% | 1 71% |
| Colorchecker dE 2000 max. * | 6.97 | 2.94 58% | 5.5 21% | 6.69 4% | 6.5 7% | 1.9 73% |
| Greyscale dE 2000 * | 4.5 | 1.3 71% | 3.9 13% | 1.1 76% | 4.5 -0% | 1.7 62% |
| Gamma | 2.15 102% | 2.26 97% | 2.19 100% | 2.27 97% | 2.21 100% | 2.25 98% |
| CCT | 6446 101% | 6385 102% | 6186 105% | 6419 101% | 6324 103% | 6325 103% |
| Colorchecker dE 2000 calibrated * | 1.08 | 0.49 | 1.02 | 0.8 | ||
| Media totale (Programma / Settaggio) | -5% /
-6% | -17% /
-21% | 16% /
15% | -0% /
-12% | 23% /
26% |
* ... Meglio usare valori piccoli
Il display è ragionevolmente accurato per un PC di fascia media, con valori medi di DeltaE della scala di grigi e del colore di 4,2 e 3,76, rispettivamente. Questi valori rimangono relativamente stabili anche quando si attiva l'HDR, che passa automaticamente il sistema ai colori DCI-P3. In entrambi i casi, la temperatura del colore è leggermente troppo fredda, intorno ai 6500K.

Tempi di risposta del Display
| ↔ Tempi di risposta dal Nero al Bianco | ||
|---|---|---|
| 60.6 ms ... aumenta ↗ e diminuisce ↘ combinato | ↗ 56.2 ms Incremento | 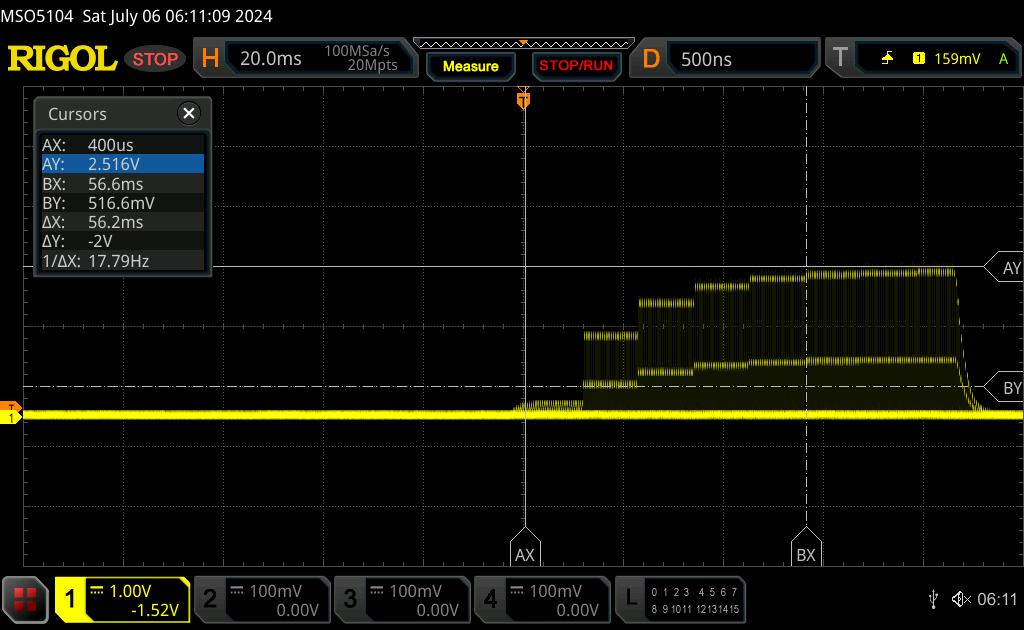 |
| ↘ 4.4 ms Calo | ||
| Lo schermo mostra tempi di risposta lenti nei nostri tests e sarà insoddisfacente per i gamers. In confronto, tutti i dispositivi di test variano da 0.1 (minimo) a 240 (massimo) ms. » 100 % di tutti i dispositivi è migliore. Questo significa che i tempi di risposta rilevati sono peggiori rispetto alla media di tutti i dispositivi testati (20.8 ms). | ||
| ↔ Tempo di risposta dal 50% Grigio all'80% Grigio | ||
| 15.4 ms ... aumenta ↗ e diminuisce ↘ combinato | ↗ 8.6 ms Incremento | 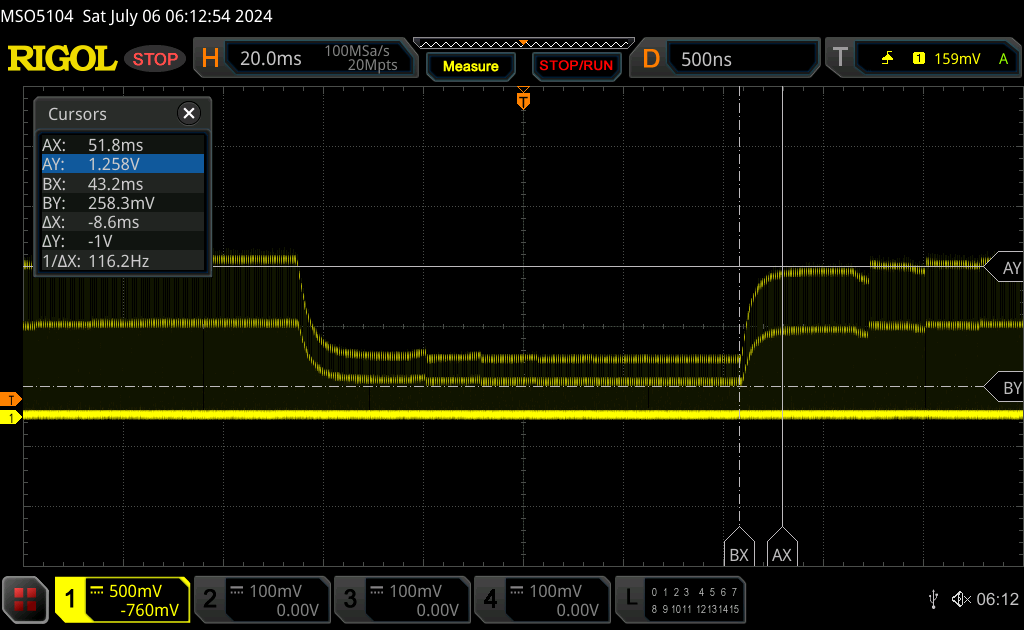 |
| ↘ 6.8 ms Calo | ||
| Lo schermo mostra buoni tempi di risposta durante i nostri tests, ma potrebbe essere troppo lento per i gamers competitivi. In confronto, tutti i dispositivi di test variano da 0.165 (minimo) a 636 (massimo) ms. » 27 % di tutti i dispositivi è migliore. Questo significa che i tempi di risposta rilevati sono migliori rispettto alla media di tutti i dispositivi testati (32.5 ms). | ||
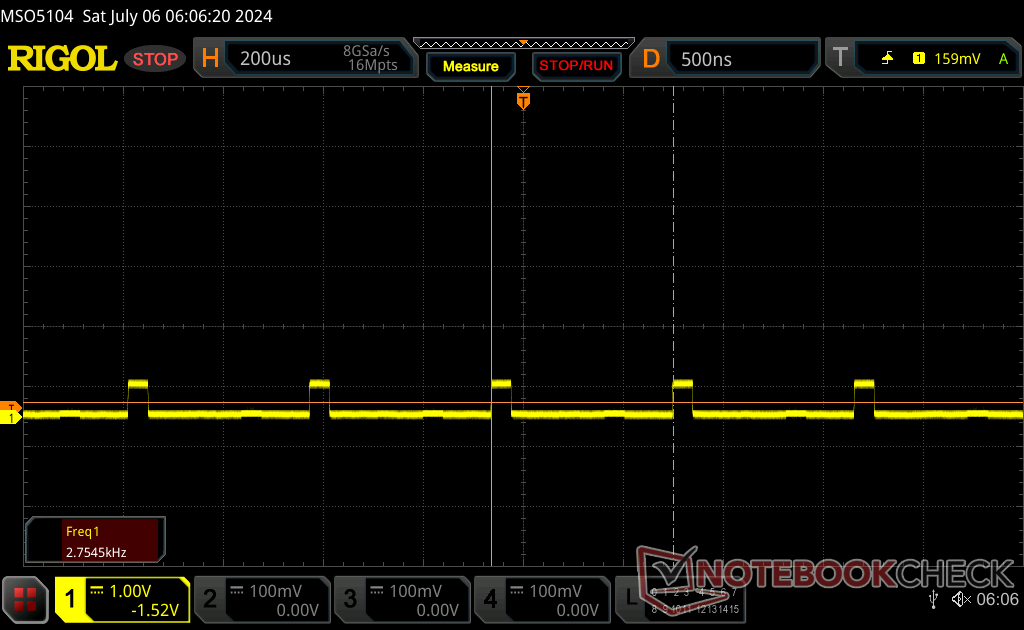
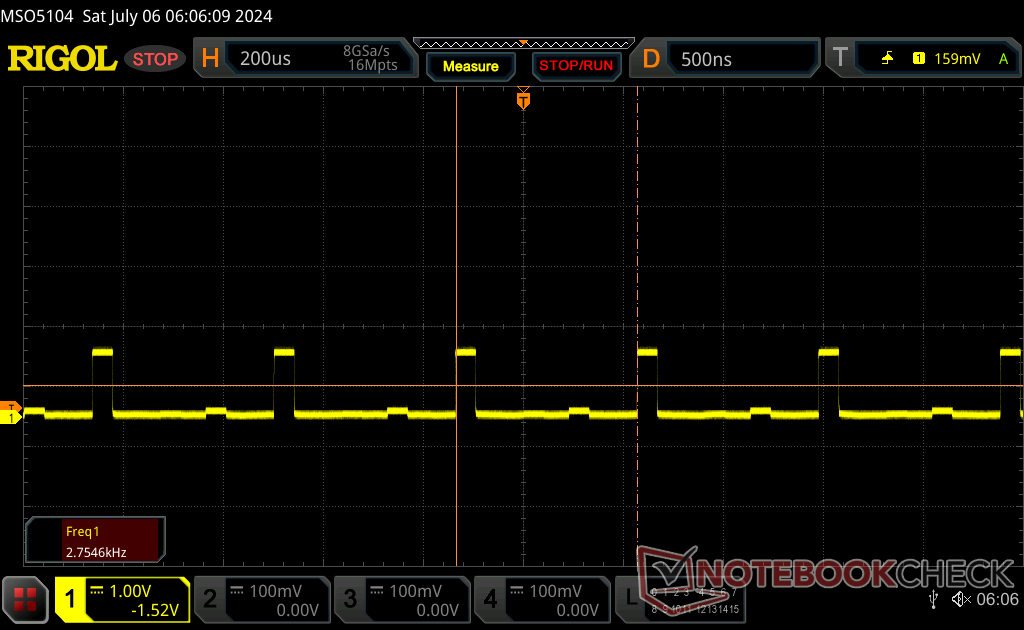
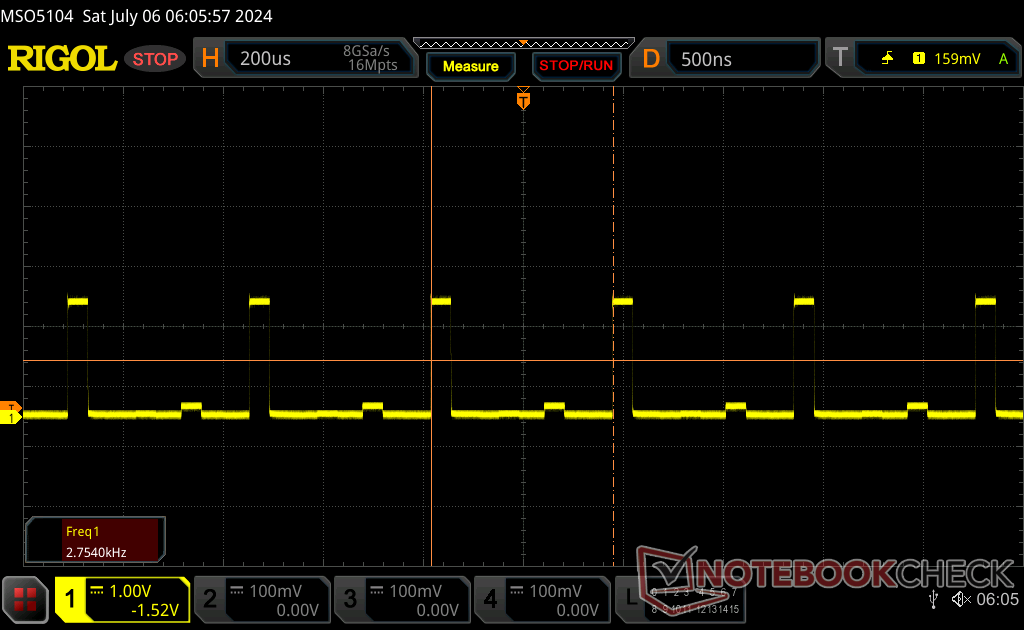
Sfarfallio dello schermo / PWM (Pulse-Width Modulation)
| flickering dello schermo / PWM rilevato | 2753.7 Hz | ≤ 100 % settaggio luminosita' | 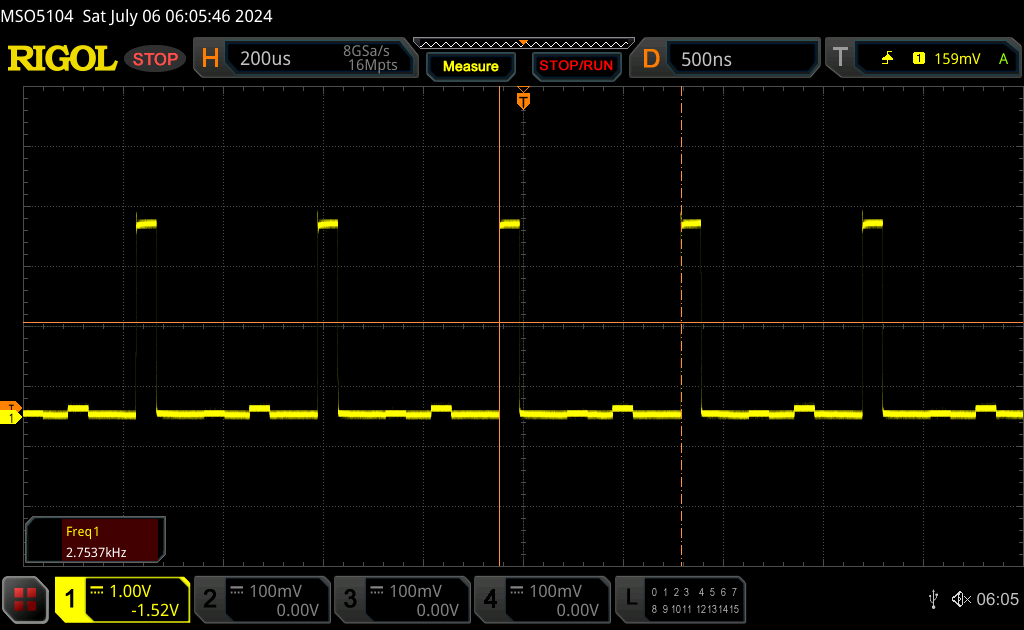 |
Il display sfarfalla a 2753.7 Hz (Probabilmente a causa dell'uso di PWM) Flickering rilevato ad una luminosita' di 100 % o inferiore. Non dovrebbe verificarsi flickering o PWM sopra questo valore di luminosita'. La frequenza di 2753.7 Hz è abbastanza alta, quindi la maggioranza degli utenti sensibili al PWM non dovrebbero notare alcun flickering. In confronto: 53 % di tutti i dispositivi testati non utilizza PWM per ridurre la luminosita' del display. Se è rilevato PWM, una media di 8516 (minimo: 5 - massimo: 343500) Hz è stata rilevata. | |||
La modulazione di larghezza di impulso o sfarfallio è presente su tutti i livelli di luminosità a una frequenza costante di 2753 Hz. Questo comportamento è prevedibile per un pannello mini-LED e la frequenza è fortunatamente abbastanza veloce da non essere percepita dalla maggior parte degli spettatori.

Con 400 nit in modalità SDR o 600 nit in modalità HDR, lo schermo è più luminoso sia dell'opzione IPS di base che dell'opzione OLED del modello uscente. Tuttavia, l'Inspiron 16 2-in-1 non è ancora abbastanza luminoso per le condizioni all'aperto, dove l'abbagliamento diventa rapidamente un problema. Si potrebbe pensare che l'attivazione dell'HDR possa alleviare il problema, in quanto aumenta il limite di luminosità, ma tenga presente che la modalità HDR di Windows non è disponibile a batteria.
Prestazioni: veloci per una cabriolet
Condizioni del test
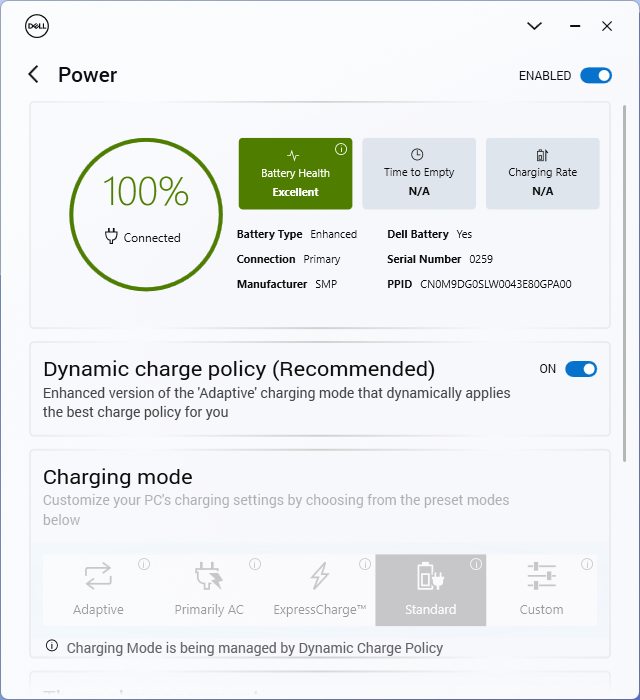
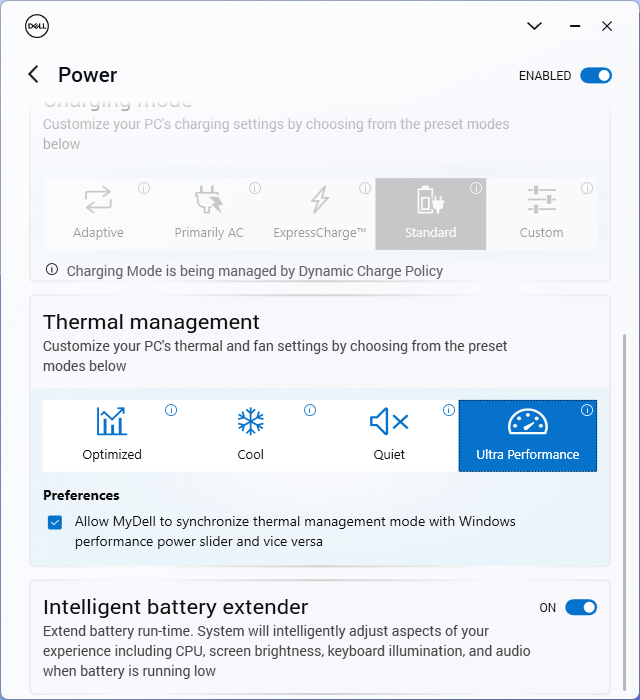
Abbiamo impostato MyDell sulla modalità Prestazioni prima di eseguire i benchmark qui sotto. Il software dispone di una comoda levetta per sincronizzare i profili energetici di Dell con i profili energetici di Windows, per rendere più semplice il passaggio da un'impostazione energetica all'altra.
Processore
Avere una CPU Core serie H in un fattore di forma convertibile a volte può essere preoccupante, perché il produttore potrebbe sottoclockare le sue prestazioni. Fortunatamente, questo non sembra essere il caso dell'Inspiron 16 7640 2-in-1, in quanto il suo Core Ultra 7 155H si attesta entro il 5 percento della media dei PC del nostro database dotati dello stesso processore. Questo rende il modello Dell uno dei convertibili più veloci nella categoria dei 16 pollici, battendo opzioni ad alte prestazioni come il modello Ryzen 7 8840HS nel modello HP Envy x360 16 2-in-1. Vale la pena notare che questa stessa CPU si trova anche in molti computer portatili da gioco, a dimostrazione che questo convertibile Dell non scherza quando si tratta di prestazioni del processore.
La sostenibilità Turbo Boost è buona ma non perfetta. Quando eseguivamo CineBench R15 xT in loop, il nostro punteggio iniziale di 2680 punti si riduceva di circa il 15 percento dopo appena tre esecuzioni. i clamshell da 16 pollici come il Lenovo IdeaPad Pro 5 16 o Inspiron 16 Plus 7640 con la stessa CPU sono in grado di mantenere tassi di clock Turbo Boost più elevati per più tempo, come mostra il grafico sottostante.
Scegliendo il modello di fascia bassa Core Ultra 5 125U dovrebbe avere un impatto significativo sulle prestazioni multi-thread, pari al 40 percento, in base al tempo trascorso con il modello Lenovo Yoga 7 2-in-1 Lenovo Yoga 7 2-in-1 16. Tuttavia, l'opzione Core serie U potrebbe essere ancora ideale per coloro che preferiscono la durata della batteria alle prestazioni grezze.
Cinebench R15 Multi Loop
Cinebench R23: Multi Core | Single Core
Cinebench R20: CPU (Multi Core) | CPU (Single Core)
Cinebench R15: CPU Multi 64Bit | CPU Single 64Bit
Blender: v2.79 BMW27 CPU
7-Zip 18.03: 7z b 4 | 7z b 4 -mmt1
Geekbench 6.4: Multi-Core | Single-Core
Geekbench 5.5: Multi-Core | Single-Core
HWBOT x265 Benchmark v2.2: 4k Preset
LibreOffice : 20 Documents To PDF
R Benchmark 2.5: Overall mean
* ... Meglio usare valori piccoli
AIDA64: FP32 Ray-Trace | FPU Julia | CPU SHA3 | CPU Queen | FPU SinJulia | FPU Mandel | CPU AES | CPU ZLib | FP64 Ray-Trace | CPU PhotoWorxx
| Performance Rating | |
| Lenovo IdeaPad Pro 5 16IMH G9 | |
| HP Envy x360 2-in-1 16-ad0097nr | |
| Dell Inspiron 16 7640 2-in-1 | |
| Dell Inspiron 16 Plus 7640 | |
| Media Intel Core Ultra 7 155H | |
| Dell Inspiron 16 7635 2-in-1 | |
| Samsung Galaxy Book4 Pro 360 | |
| AIDA64 / FP32 Ray-Trace | |
| HP Envy x360 2-in-1 16-ad0097nr | |
| Lenovo IdeaPad Pro 5 16IMH G9 | |
| Dell Inspiron 16 7640 2-in-1 | |
| Dell Inspiron 16 Plus 7640 | |
| Media Intel Core Ultra 7 155H (6670 - 18470, n=50) | |
| Dell Inspiron 16 7635 2-in-1 | |
| Samsung Galaxy Book4 Pro 360 | |
| AIDA64 / FPU Julia | |
| Lenovo IdeaPad Pro 5 16IMH G9 | |
| HP Envy x360 2-in-1 16-ad0097nr | |
| Dell Inspiron 16 7640 2-in-1 | |
| Dell Inspiron 16 Plus 7640 | |
| Media Intel Core Ultra 7 155H (40905 - 93181, n=50) | |
| Dell Inspiron 16 7635 2-in-1 | |
| Samsung Galaxy Book4 Pro 360 | |
| AIDA64 / CPU SHA3 | |
| Lenovo IdeaPad Pro 5 16IMH G9 | |
| HP Envy x360 2-in-1 16-ad0097nr | |
| Dell Inspiron 16 7640 2-in-1 | |
| Dell Inspiron 16 Plus 7640 | |
| Media Intel Core Ultra 7 155H (1940 - 4436, n=50) | |
| Samsung Galaxy Book4 Pro 360 | |
| Dell Inspiron 16 7635 2-in-1 | |
| AIDA64 / CPU Queen | |
| HP Envy x360 2-in-1 16-ad0097nr | |
| Dell Inspiron 16 7640 2-in-1 | |
| Dell Inspiron 16 Plus 7640 | |
| Lenovo IdeaPad Pro 5 16IMH G9 | |
| Media Intel Core Ultra 7 155H (64698 - 94181, n=50) | |
| Samsung Galaxy Book4 Pro 360 | |
| Dell Inspiron 16 7635 2-in-1 | |
| AIDA64 / FPU SinJulia | |
| HP Envy x360 2-in-1 16-ad0097nr | |
| Lenovo IdeaPad Pro 5 16IMH G9 | |
| Dell Inspiron 16 7640 2-in-1 | |
| Dell Inspiron 16 Plus 7640 | |
| Media Intel Core Ultra 7 155H (5639 - 10647, n=50) | |
| Dell Inspiron 16 7635 2-in-1 | |
| Samsung Galaxy Book4 Pro 360 | |
| AIDA64 / FPU Mandel | |
| HP Envy x360 2-in-1 16-ad0097nr | |
| Lenovo IdeaPad Pro 5 16IMH G9 | |
| Dell Inspiron 16 7640 2-in-1 | |
| Dell Inspiron 16 Plus 7640 | |
| Dell Inspiron 16 7635 2-in-1 | |
| Media Intel Core Ultra 7 155H (18236 - 47685, n=50) | |
| Samsung Galaxy Book4 Pro 360 | |
| AIDA64 / CPU AES | |
| Lenovo IdeaPad Pro 5 16IMH G9 | |
| Media Intel Core Ultra 7 155H (45713 - 152179, n=50) | |
| Dell Inspiron 16 7640 2-in-1 | |
| HP Envy x360 2-in-1 16-ad0097nr | |
| Dell Inspiron 16 Plus 7640 | |
| Samsung Galaxy Book4 Pro 360 | |
| Dell Inspiron 16 7635 2-in-1 | |
| AIDA64 / CPU ZLib | |
| Lenovo IdeaPad Pro 5 16IMH G9 | |
| Dell Inspiron 16 Plus 7640 | |
| Dell Inspiron 16 7640 2-in-1 | |
| Media Intel Core Ultra 7 155H (557 - 1250, n=50) | |
| HP Envy x360 2-in-1 16-ad0097nr | |
| Samsung Galaxy Book4 Pro 360 | |
| Dell Inspiron 16 7635 2-in-1 | |
| AIDA64 / FP64 Ray-Trace | |
| HP Envy x360 2-in-1 16-ad0097nr | |
| Lenovo IdeaPad Pro 5 16IMH G9 | |
| Dell Inspiron 16 7640 2-in-1 | |
| Dell Inspiron 16 Plus 7640 | |
| Media Intel Core Ultra 7 155H (3569 - 9802, n=50) | |
| Dell Inspiron 16 7635 2-in-1 | |
| Samsung Galaxy Book4 Pro 360 | |
| AIDA64 / CPU PhotoWorxx | |
| Lenovo IdeaPad Pro 5 16IMH G9 | |
| Media Intel Core Ultra 7 155H (32719 - 54223, n=50) | |
| Samsung Galaxy Book4 Pro 360 | |
| Dell Inspiron 16 7640 2-in-1 | |
| Dell Inspiron 16 Plus 7640 | |
| HP Envy x360 2-in-1 16-ad0097nr | |
| Dell Inspiron 16 7635 2-in-1 | |
Test da sforzo
La CPU saliva a 3,2 GHz e 88 W per pochi secondi, prima di raggiungere una temperatura molto elevata del pacchetto core di 109 C (!). Poi scendeva rapidamente a soli 2,3 GHz e 44 W per mantenere una temperatura del nucleo più fresca di 86 C. Gli intervalli di temperatura sono comunque più caldi di quelli che abbiamo registrato sull'Inspiron 16 7635 2-in-1, in particolare durante l'esecuzione di giochi, dove la CPU si stabilizzava nell'intervallo di 90 C rispetto ai 70 C del vecchio Inspiron 16 7635 2-in-1. Questa differenza contribuisce anche alle temperature superficiali complessivamente più calde, come mostrato nella nostra sezione Temperature. Questa differenza contribuirebbe anche alle temperature superficiali complessivamente più calde, come mostrato nella sezione Temperature qui sotto.
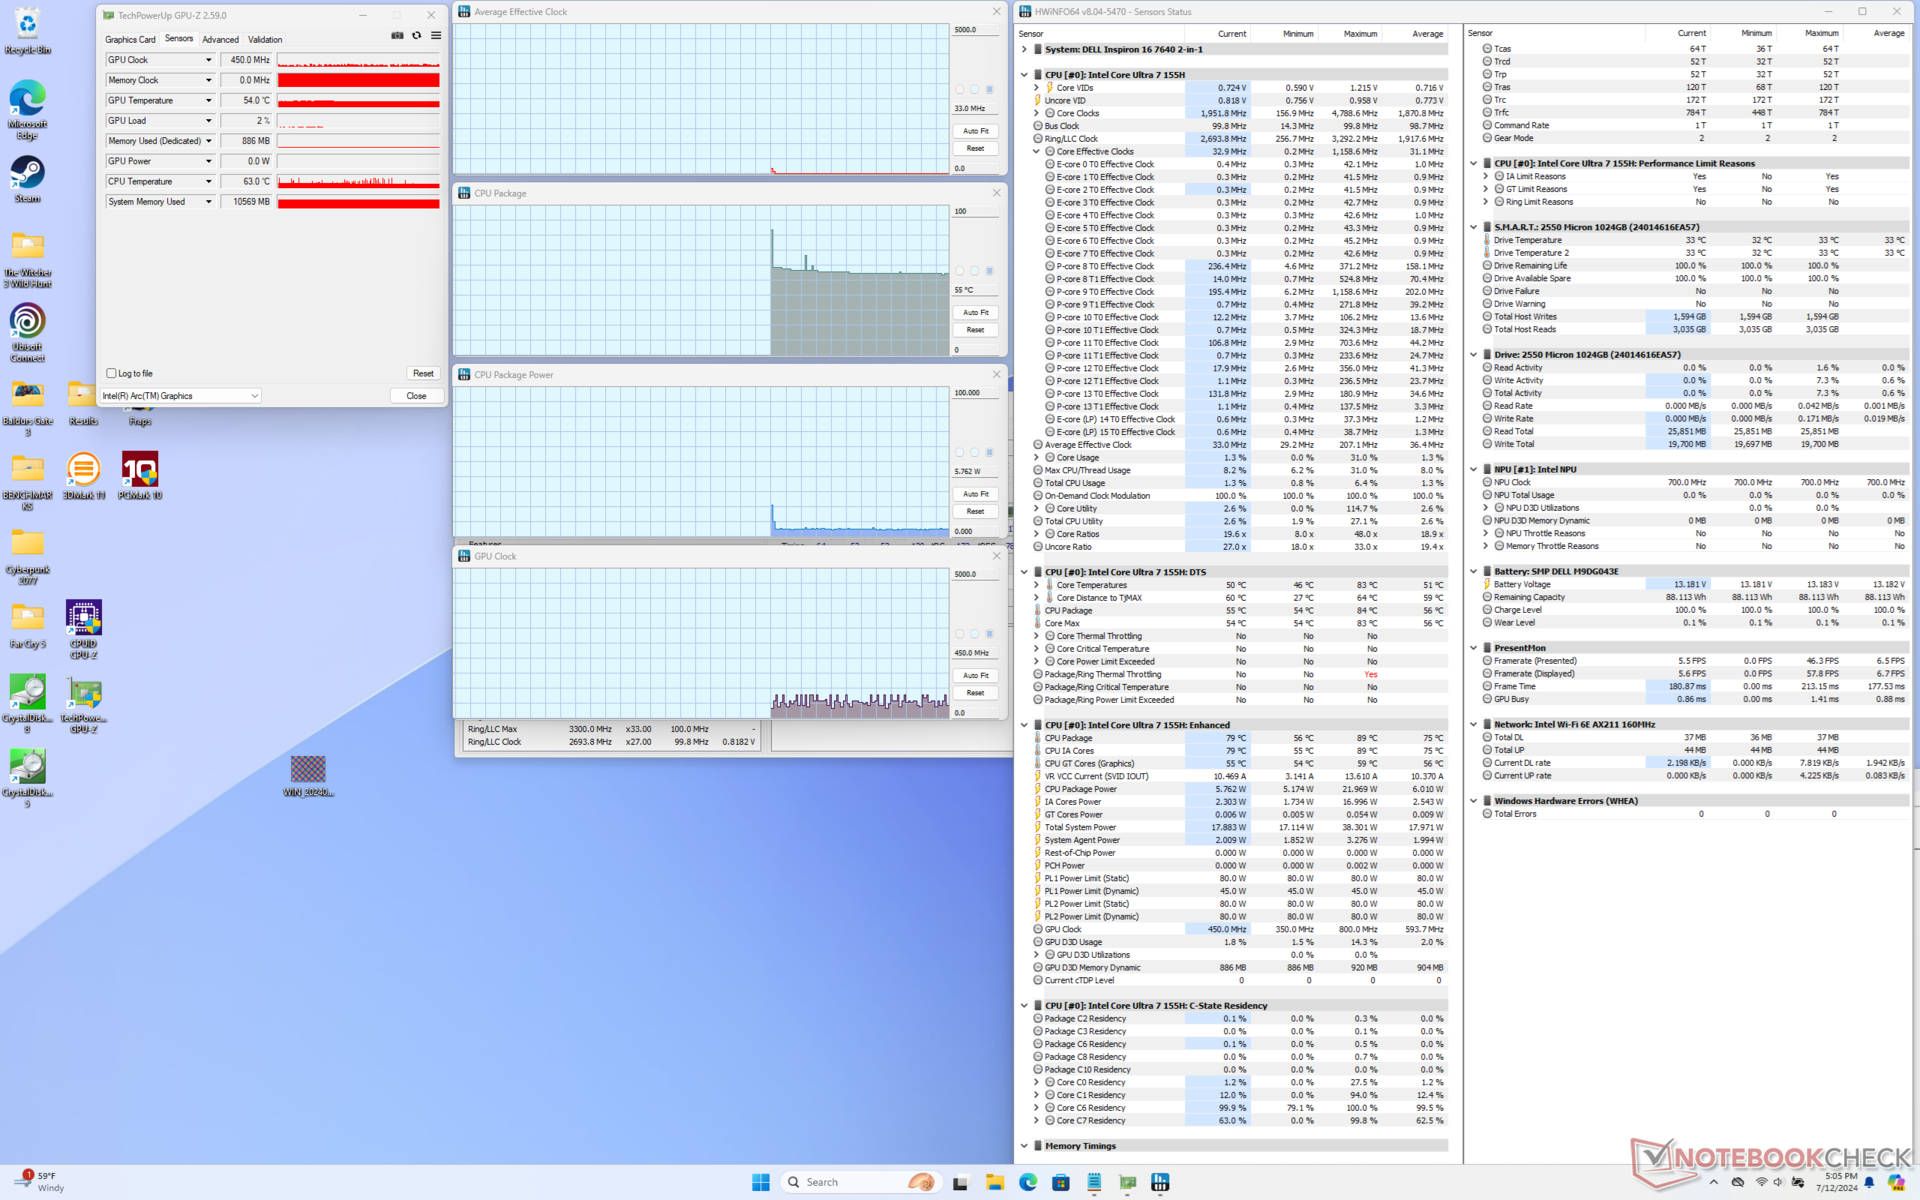
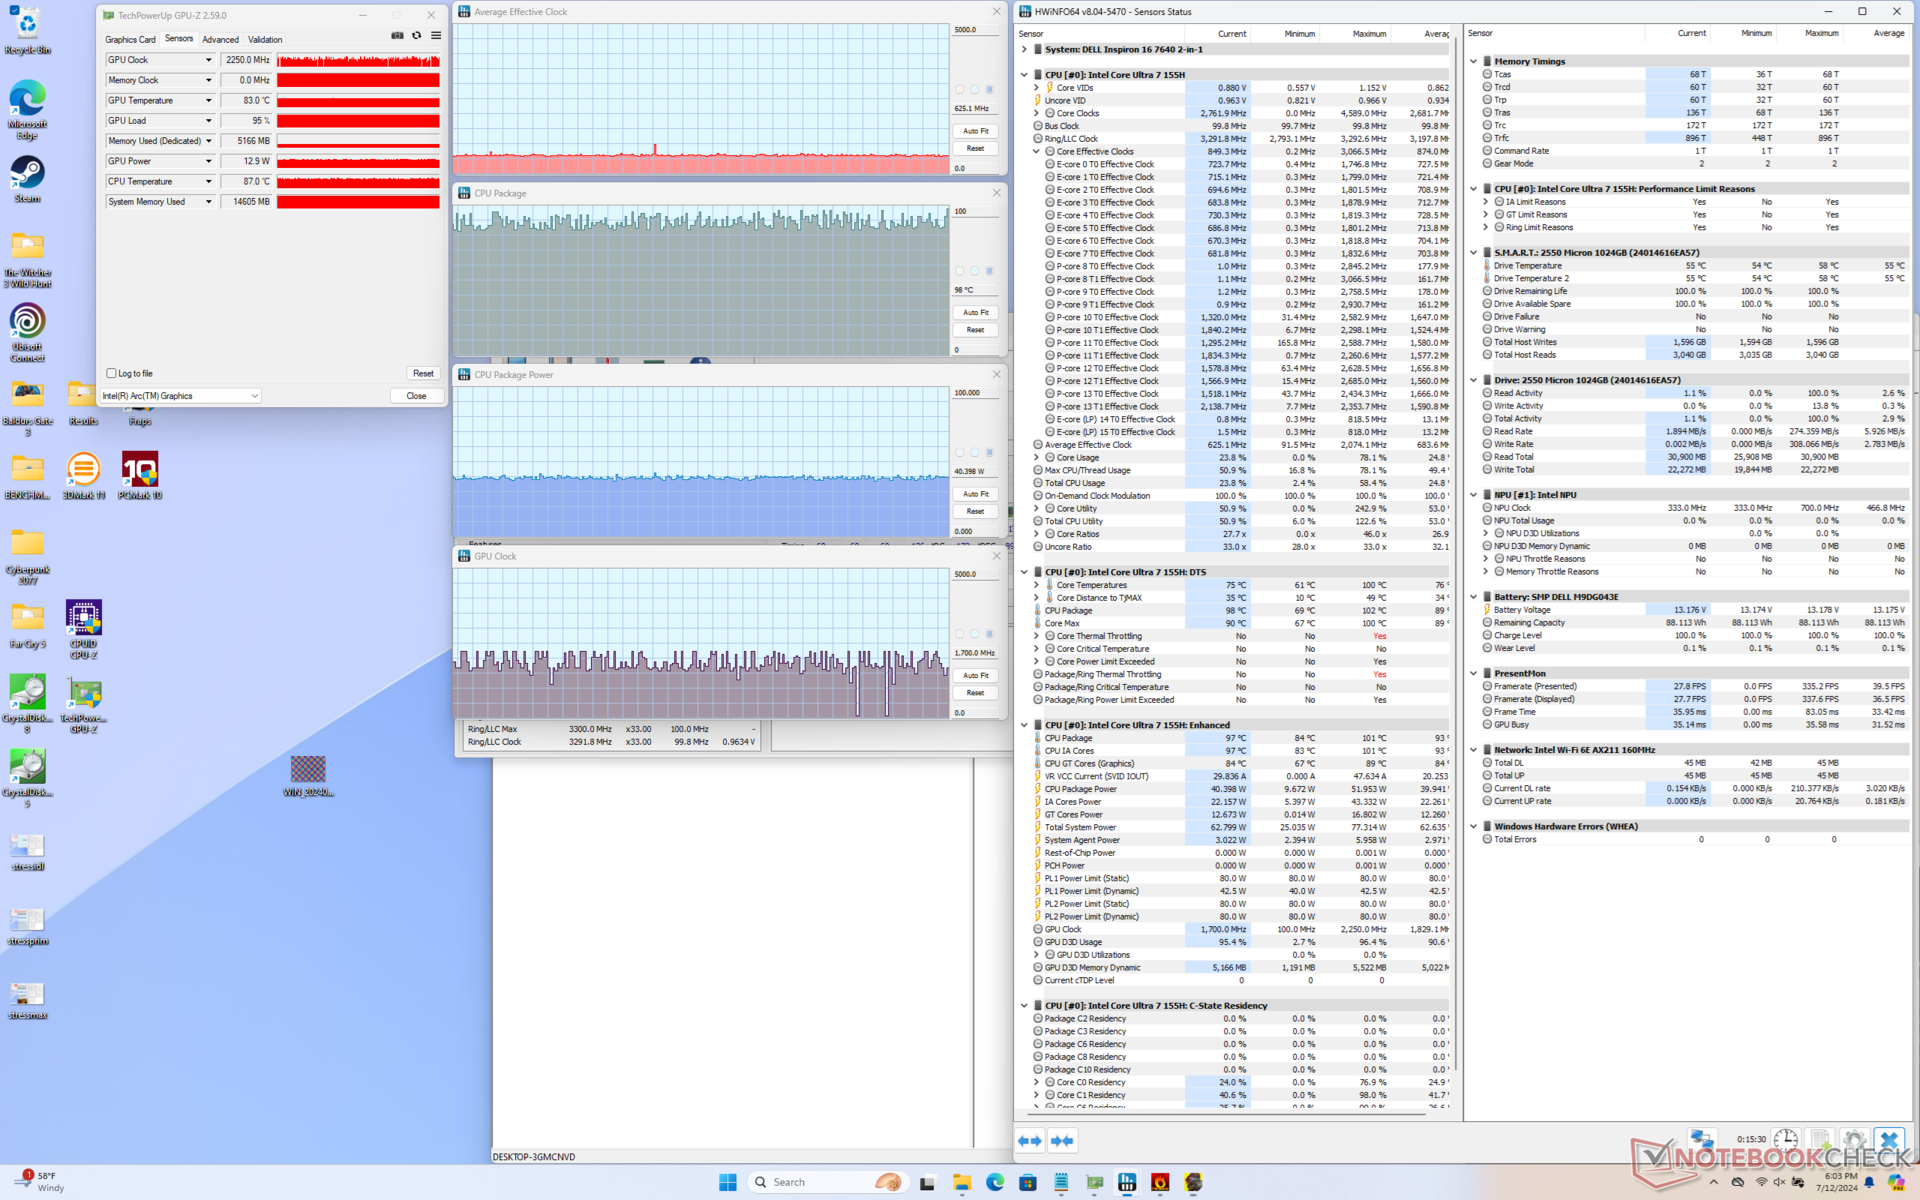
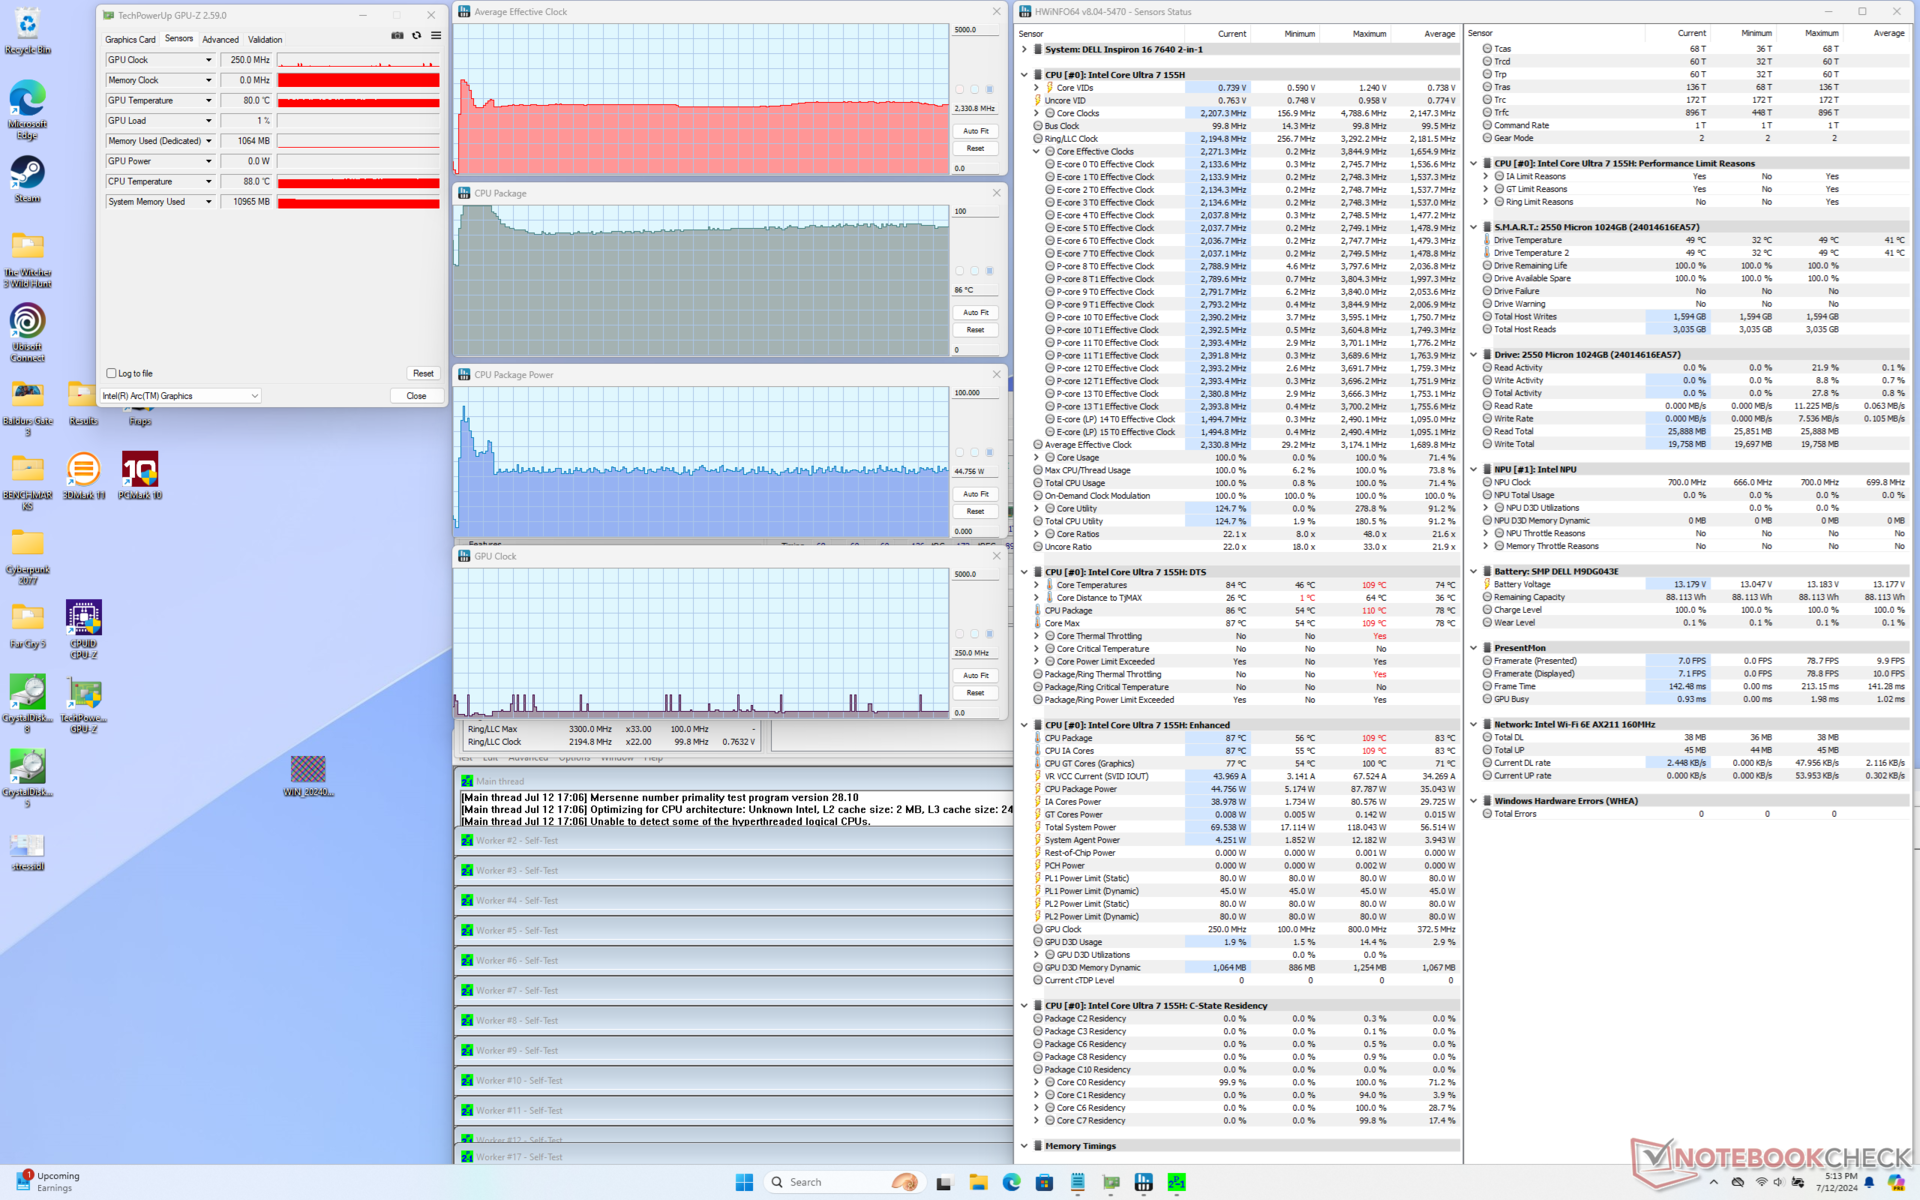
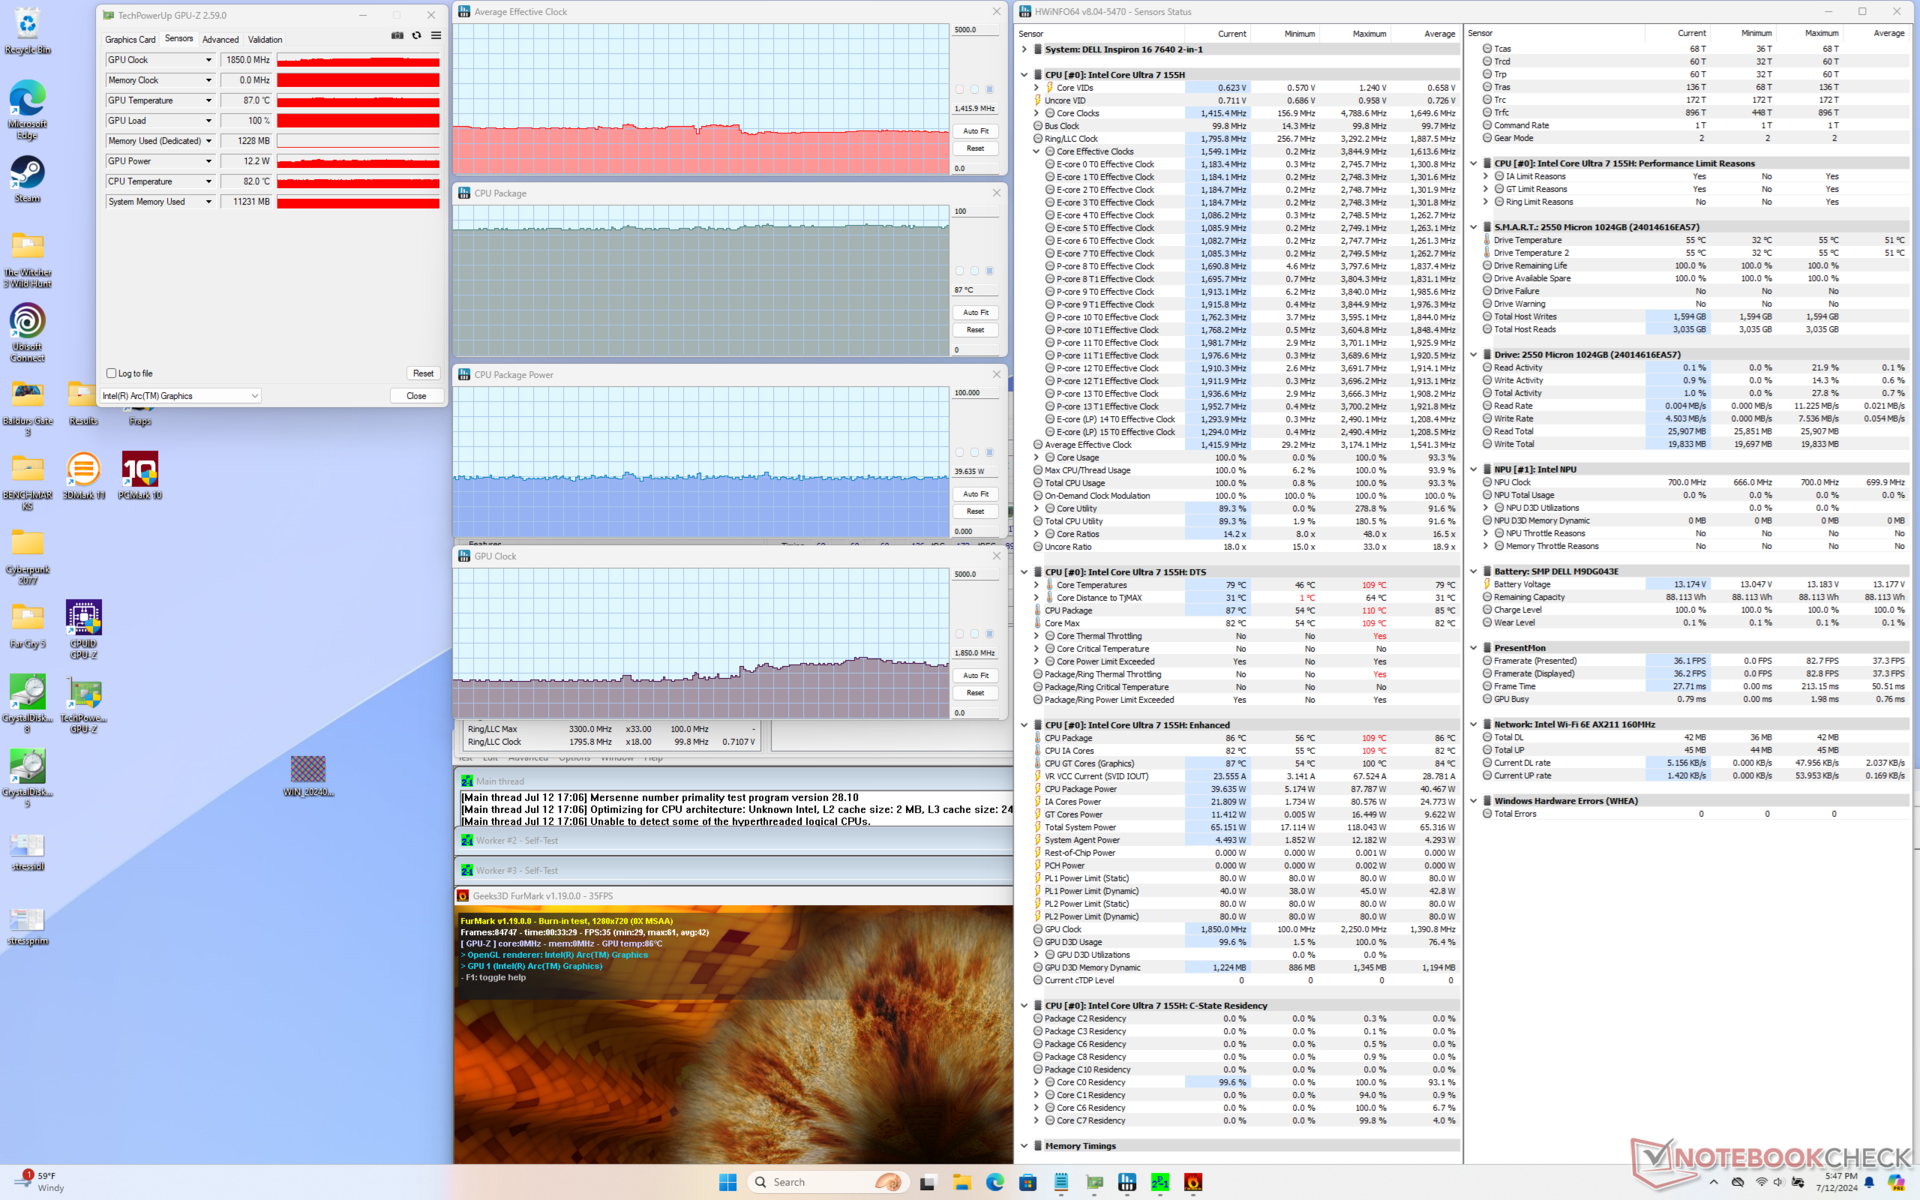
| Clock medio della CPU (GHz) | Clock della GPU (MHz) | Temperatura media della CPU (°C) | |
| Sistema inattivo | -- | -- | 55 |
| Prime95 Stress | 2,3 | -- | 86 |
| Prime95 + FurMark Stress | 1.4 | 1250 - 1850 | 87 |
| Cyberpunk 2077 Stress | 0,6 | 1650 - 2250 | 90 - 98 |
Prestazioni del sistema
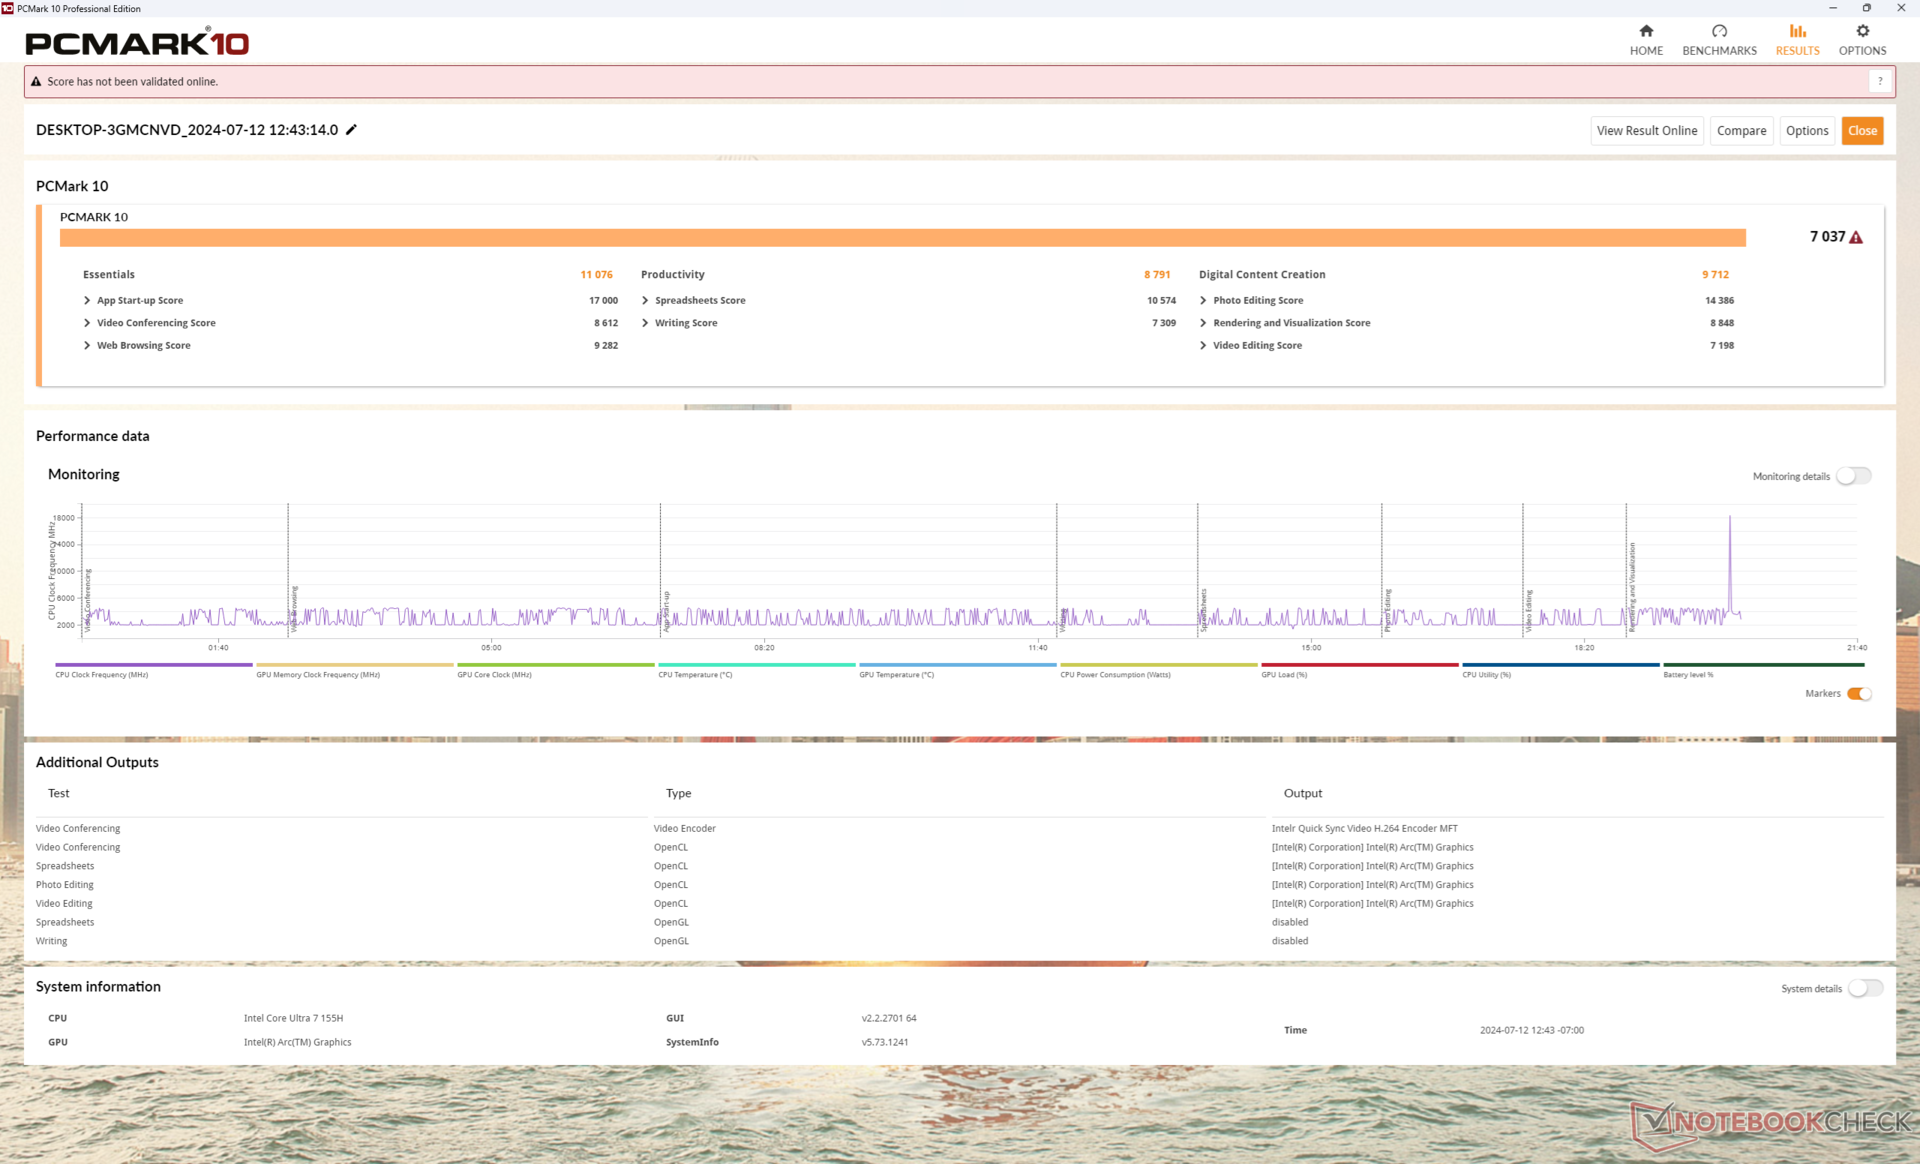
I risultati di PCMark sono eccellenti e paragonabili a quelli di altre macchine del nostro database con la stessa CPU e GPU integrata. Il nostro punteggio medio per Dell è uno dei più alti di tutti i convertibili da 16 pollici, ma le alternative con GPU discreta, come il modello HP Spectre x360 16 offriranno comunque prestazioni grafiche più elevate.
CrossMark: Overall | Productivity | Creativity | Responsiveness
WebXPRT 3: Overall
WebXPRT 4: Overall
Mozilla Kraken 1.1: Total
| PCMark 10 / Score | |
| Lenovo IdeaPad Pro 5 16IMH G9 | |
| Dell Inspiron 16 Plus 7640 | |
| Dell Inspiron 16 7640 2-in-1 | |
| HP Envy x360 2-in-1 16-ad0097nr | |
| Media Intel Core Ultra 7 155H, Intel Arc 8-Core iGPU (4809 - 7529, n=34) | |
| Samsung Galaxy Book4 Pro 360 | |
| Dell Inspiron 16 7635 2-in-1 | |
| PCMark 10 / Essentials | |
| Lenovo IdeaPad Pro 5 16IMH G9 | |
| Dell Inspiron 16 7640 2-in-1 | |
| Dell Inspiron 16 7635 2-in-1 | |
| Samsung Galaxy Book4 Pro 360 | |
| HP Envy x360 2-in-1 16-ad0097nr | |
| Media Intel Core Ultra 7 155H, Intel Arc 8-Core iGPU (7605 - 11289, n=34) | |
| Dell Inspiron 16 Plus 7640 | |
| PCMark 10 / Productivity | |
| HP Envy x360 2-in-1 16-ad0097nr | |
| Dell Inspiron 16 7635 2-in-1 | |
| Lenovo IdeaPad Pro 5 16IMH G9 | |
| Dell Inspiron 16 7640 2-in-1 | |
| Media Intel Core Ultra 7 155H, Intel Arc 8-Core iGPU (6042 - 10591, n=34) | |
| Dell Inspiron 16 Plus 7640 | |
| Samsung Galaxy Book4 Pro 360 | |
| PCMark 10 / Digital Content Creation | |
| Dell Inspiron 16 Plus 7640 | |
| Lenovo IdeaPad Pro 5 16IMH G9 | |
| Dell Inspiron 16 7640 2-in-1 | |
| Media Intel Core Ultra 7 155H, Intel Arc 8-Core iGPU (4985 - 10709, n=34) | |
| HP Envy x360 2-in-1 16-ad0097nr | |
| Samsung Galaxy Book4 Pro 360 | |
| Dell Inspiron 16 7635 2-in-1 | |
| CrossMark / Overall | |
| Dell Inspiron 16 7640 2-in-1 | |
| Dell Inspiron 16 Plus 7640 | |
| Media Intel Core Ultra 7 155H, Intel Arc 8-Core iGPU (1366 - 1903, n=34) | |
| HP Envy x360 2-in-1 16-ad0097nr | |
| Samsung Galaxy Book4 Pro 360 | |
| Lenovo IdeaPad Pro 5 16IMH G9 | |
| Dell Inspiron 16 7635 2-in-1 | |
| CrossMark / Productivity | |
| Dell Inspiron 16 7640 2-in-1 | |
| HP Envy x360 2-in-1 16-ad0097nr | |
| Dell Inspiron 16 Plus 7640 | |
| Media Intel Core Ultra 7 155H, Intel Arc 8-Core iGPU (1291 - 1798, n=33) | |
| Samsung Galaxy Book4 Pro 360 | |
| Lenovo IdeaPad Pro 5 16IMH G9 | |
| Dell Inspiron 16 7635 2-in-1 | |
| CrossMark / Creativity | |
| Dell Inspiron 16 Plus 7640 | |
| Dell Inspiron 16 7640 2-in-1 | |
| Lenovo IdeaPad Pro 5 16IMH G9 | |
| Media Intel Core Ultra 7 155H, Intel Arc 8-Core iGPU (1519 - 1929, n=33) | |
| HP Envy x360 2-in-1 16-ad0097nr | |
| Samsung Galaxy Book4 Pro 360 | |
| Dell Inspiron 16 7635 2-in-1 | |
| CrossMark / Responsiveness | |
| Samsung Galaxy Book4 Pro 360 | |
| Media Intel Core Ultra 7 155H, Intel Arc 8-Core iGPU (939 - 1802, n=33) | |
| Dell Inspiron 16 7640 2-in-1 | |
| HP Envy x360 2-in-1 16-ad0097nr | |
| Dell Inspiron 16 Plus 7640 | |
| Lenovo IdeaPad Pro 5 16IMH G9 | |
| Dell Inspiron 16 7635 2-in-1 | |
| WebXPRT 3 / Overall | |
| HP Envy x360 2-in-1 16-ad0097nr | |
| Dell Inspiron 16 Plus 7640 | |
| Lenovo IdeaPad Pro 5 16IMH G9 | |
| Dell Inspiron 16 7640 2-in-1 | |
| Media Intel Core Ultra 7 155H, Intel Arc 8-Core iGPU (252 - 299, n=34) | |
| Dell Inspiron 16 7635 2-in-1 | |
| Samsung Galaxy Book4 Pro 360 | |
| WebXPRT 4 / Overall | |
| Lenovo IdeaPad Pro 5 16IMH G9 | |
| Dell Inspiron 16 7640 2-in-1 | |
| Dell Inspiron 16 Plus 7640 | |
| Media Intel Core Ultra 7 155H, Intel Arc 8-Core iGPU (166.4 - 309, n=29) | |
| HP Envy x360 2-in-1 16-ad0097nr | |
| Samsung Galaxy Book4 Pro 360 | |
| Dell Inspiron 16 7635 2-in-1 | |
| Mozilla Kraken 1.1 / Total | |
| Dell Inspiron 16 7635 2-in-1 | |
| Samsung Galaxy Book4 Pro 360 | |
| Media Intel Core Ultra 7 155H, Intel Arc 8-Core iGPU (517 - 614, n=35) | |
| HP Envy x360 2-in-1 16-ad0097nr | |
| Dell Inspiron 16 7640 2-in-1 | |
| Dell Inspiron 16 Plus 7640 | |
| Lenovo IdeaPad Pro 5 16IMH G9 | |
* ... Meglio usare valori piccoli
| PCMark 10 Score | 7037 punti | |
Aiuto | ||
| AIDA64 / Memory Copy | |
| Lenovo IdeaPad Pro 5 16IMH G9 | |
| Samsung Galaxy Book4 Pro 360 | |
| Media Intel Core Ultra 7 155H (62397 - 96791, n=50) | |
| Dell Inspiron 16 7640 2-in-1 | |
| HP Envy x360 2-in-1 16-ad0097nr | |
| Dell Inspiron 16 Plus 7640 | |
| Dell Inspiron 16 7635 2-in-1 | |
| AIDA64 / Memory Read | |
| Lenovo IdeaPad Pro 5 16IMH G9 | |
| Media Intel Core Ultra 7 155H (60544 - 90647, n=50) | |
| Dell Inspiron 16 Plus 7640 | |
| Samsung Galaxy Book4 Pro 360 | |
| Dell Inspiron 16 7640 2-in-1 | |
| HP Envy x360 2-in-1 16-ad0097nr | |
| Dell Inspiron 16 7635 2-in-1 | |
| AIDA64 / Memory Write | |
| HP Envy x360 2-in-1 16-ad0097nr | |
| Dell Inspiron 16 7640 2-in-1 | |
| Lenovo IdeaPad Pro 5 16IMH G9 | |
| Media Intel Core Ultra 7 155H (58692 - 93451, n=50) | |
| Samsung Galaxy Book4 Pro 360 | |
| Dell Inspiron 16 Plus 7640 | |
| Dell Inspiron 16 7635 2-in-1 | |
| AIDA64 / Memory Latency | |
| Dell Inspiron 16 7640 2-in-1 | |
| Media Intel Core Ultra 7 155H (116.2 - 233, n=50) | |
| Lenovo IdeaPad Pro 5 16IMH G9 | |
| Samsung Galaxy Book4 Pro 360 | |
| HP Envy x360 2-in-1 16-ad0097nr | |
| Dell Inspiron 16 Plus 7640 | |
| Dell Inspiron 16 7635 2-in-1 | |
* ... Meglio usare valori piccoli
Latenza DPC
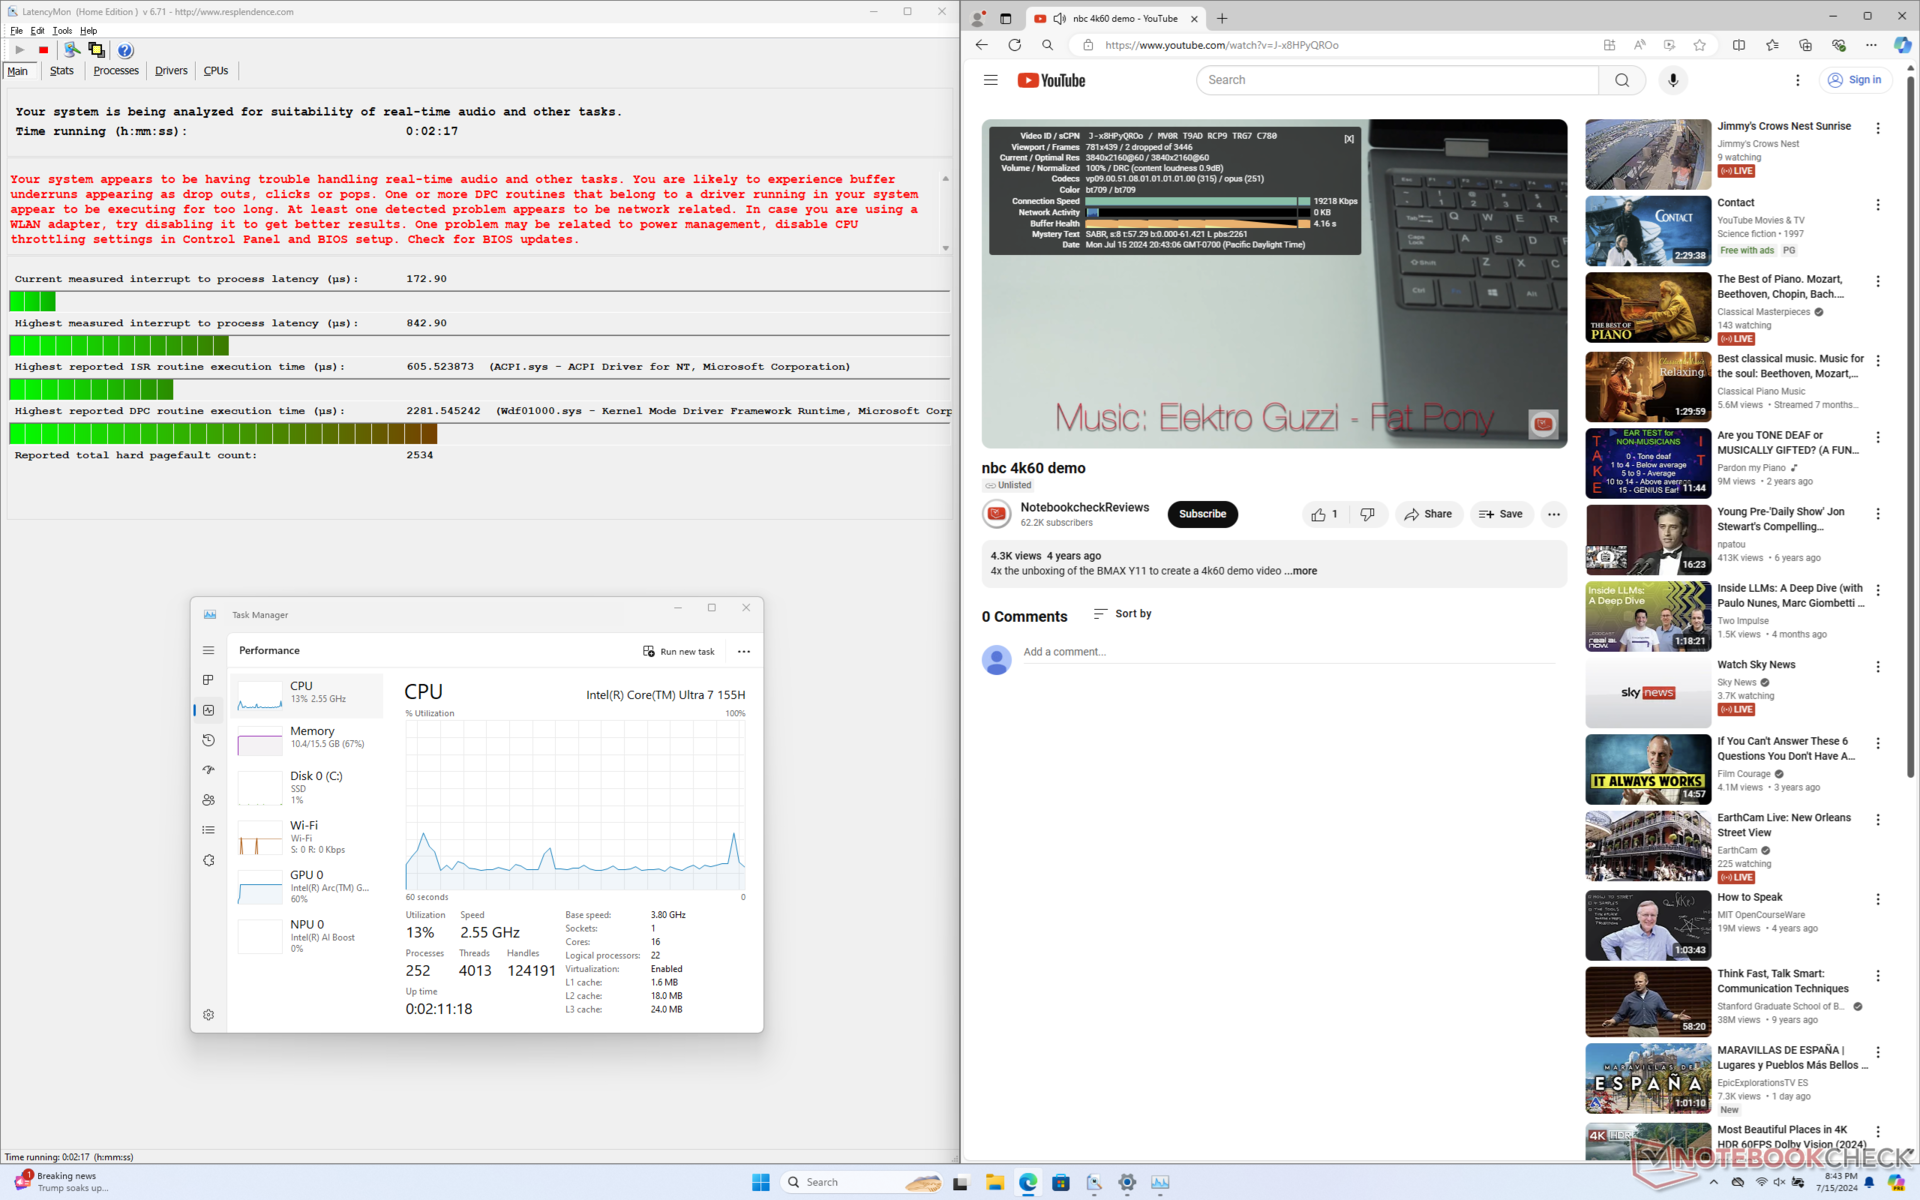
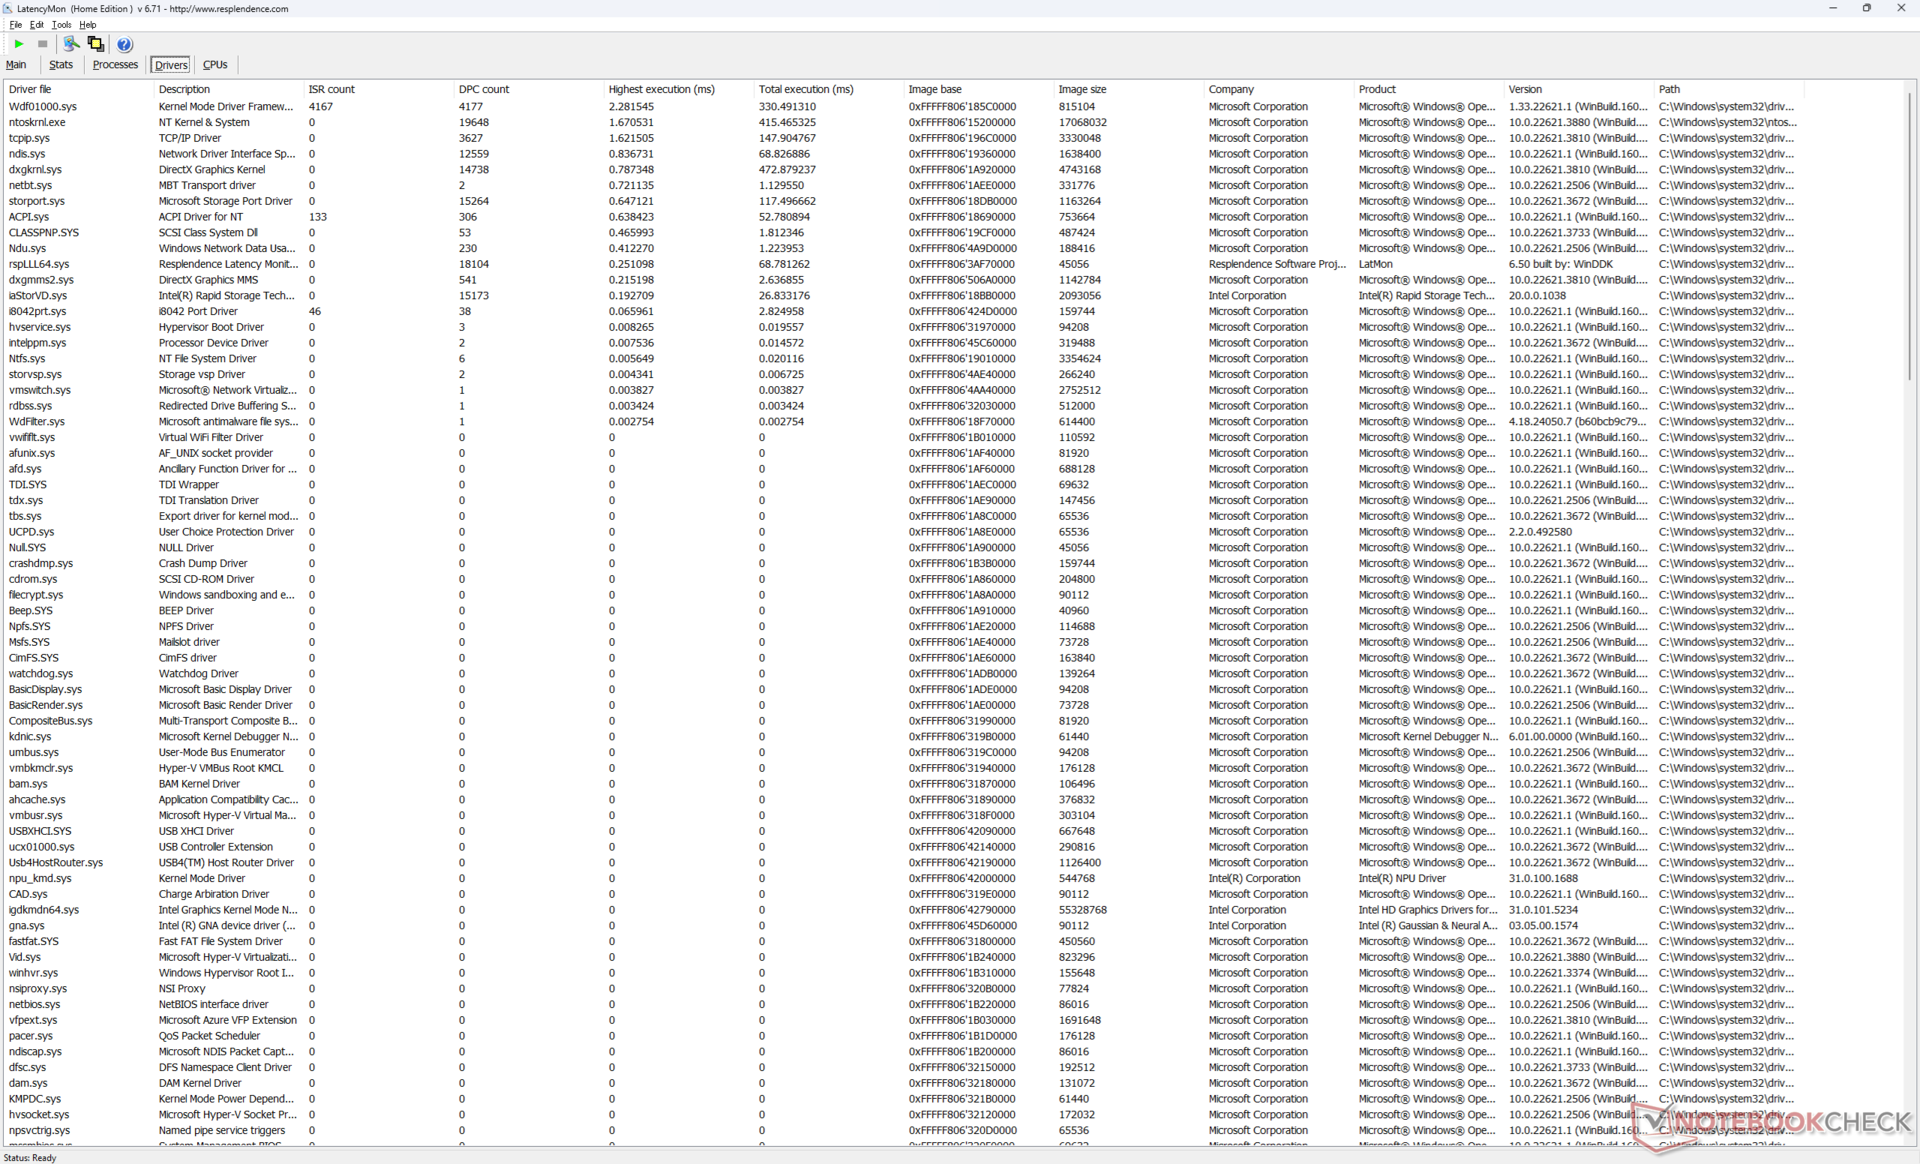
LatencyMon rivela lievi problemi di DPC quando si aprono più schede del browser della nostra homepage. Siamo anche riusciti a registrare 2 fotogrammi caduti durante un test video 4K60 della durata di un minuto, quando idealmente dovrebbero essere 0. Le discrepanze sono fortunatamente abbastanza piccole da essere sostanzialmente impercettibili durante l'uso effettivo.
| DPC Latencies / LatencyMon - interrupt to process latency (max), Web, Youtube, Prime95 | |
| Samsung Galaxy Book4 Pro 360 | |
| HP Envy x360 2-in-1 16-ad0097nr | |
| Dell Inspiron 16 7640 2-in-1 | |
| Lenovo IdeaPad Pro 5 16IMH G9 | |
| Dell Inspiron 16 Plus 7640 | |
| Dell Inspiron 16 7635 2-in-1 | |
* ... Meglio usare valori piccoli
Dispositivi di archiviazione
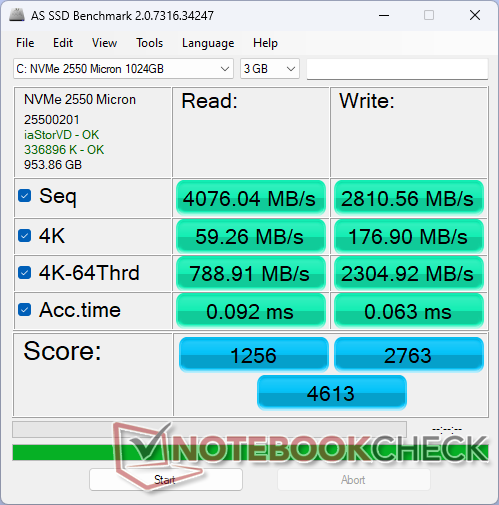
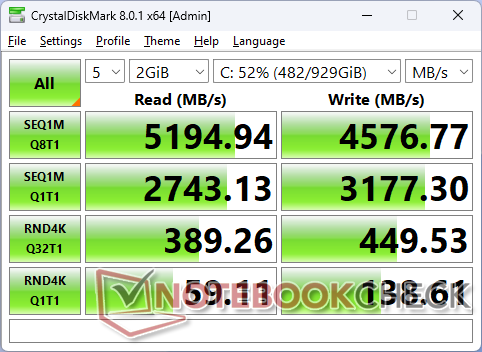
Dell si rifornisce di SSD da diversi fornitori per la sua serie Inspiron, tra cui Kioxia, SK Hynix e Micron. La nostra unità di prova specifica viene fornita con il modello Micron 2550 che è un'unità SSD PCIe4 NVMe di fascia media, in grado di raggiungere velocità di lettura fino a 5200 MB/s. Unità più costose come la Samsung PM9A1 possono raggiungere oltre 7000 MB/s in confronto, ma la Micron 2550 è sufficiente e appropriata per un modello di fascia media come il nostro Inspiron 16 2-in-1.
Le velocità di trasferimento sono nettamente superiori a quelle del Kioxia BG5 nell'Inspiron 16 7635 2-in-1 dello scorso anno, anche dopo aver tenuto conto di eventuali strozzature in caso di stress.

* ... Meglio usare valori piccoli
Disk Throttling: DiskSpd Read Loop, Queue Depth 8
Prestazioni della GPU
Le prestazioni grafiche sono abbastanza buone e tra le più veloci per un convertibile senza ricorrere a opzioni discrete. Il Arc 8 È paragonabile alla Radeon 780M e ben superiore alla vecchia Iris Xe 96 EU o Radeon RX Vega di oltre 2 volte in molti casi. La Radeon RX Vega 7 nell'Inspiron 16 7635 2-in-1 dello scorso anno, ad esempio, è indietro di quasi il 60%.
Gli utenti che esigono prestazioni di livello gaming e accelerazione CUDA possono prendere in considerazione lo Spectre x360 16 con la GeForce RTX 4050 che rappresenta un ulteriore incremento grafico di 2 volte rispetto all'Arc 8. Naturalmente, lo Spectre è anche significativamente più costoso del nostro Dell.
Tenga presente che la GPU Arc 8 è disponibile solo con la configurazione Core Ultra 7 155H. Optando invece per il Core Ultra 5 125U, ci si dovrà accontentare del modello Arc 4 che comporta una diminuzione significativa del 40-45% delle prestazioni grafiche.
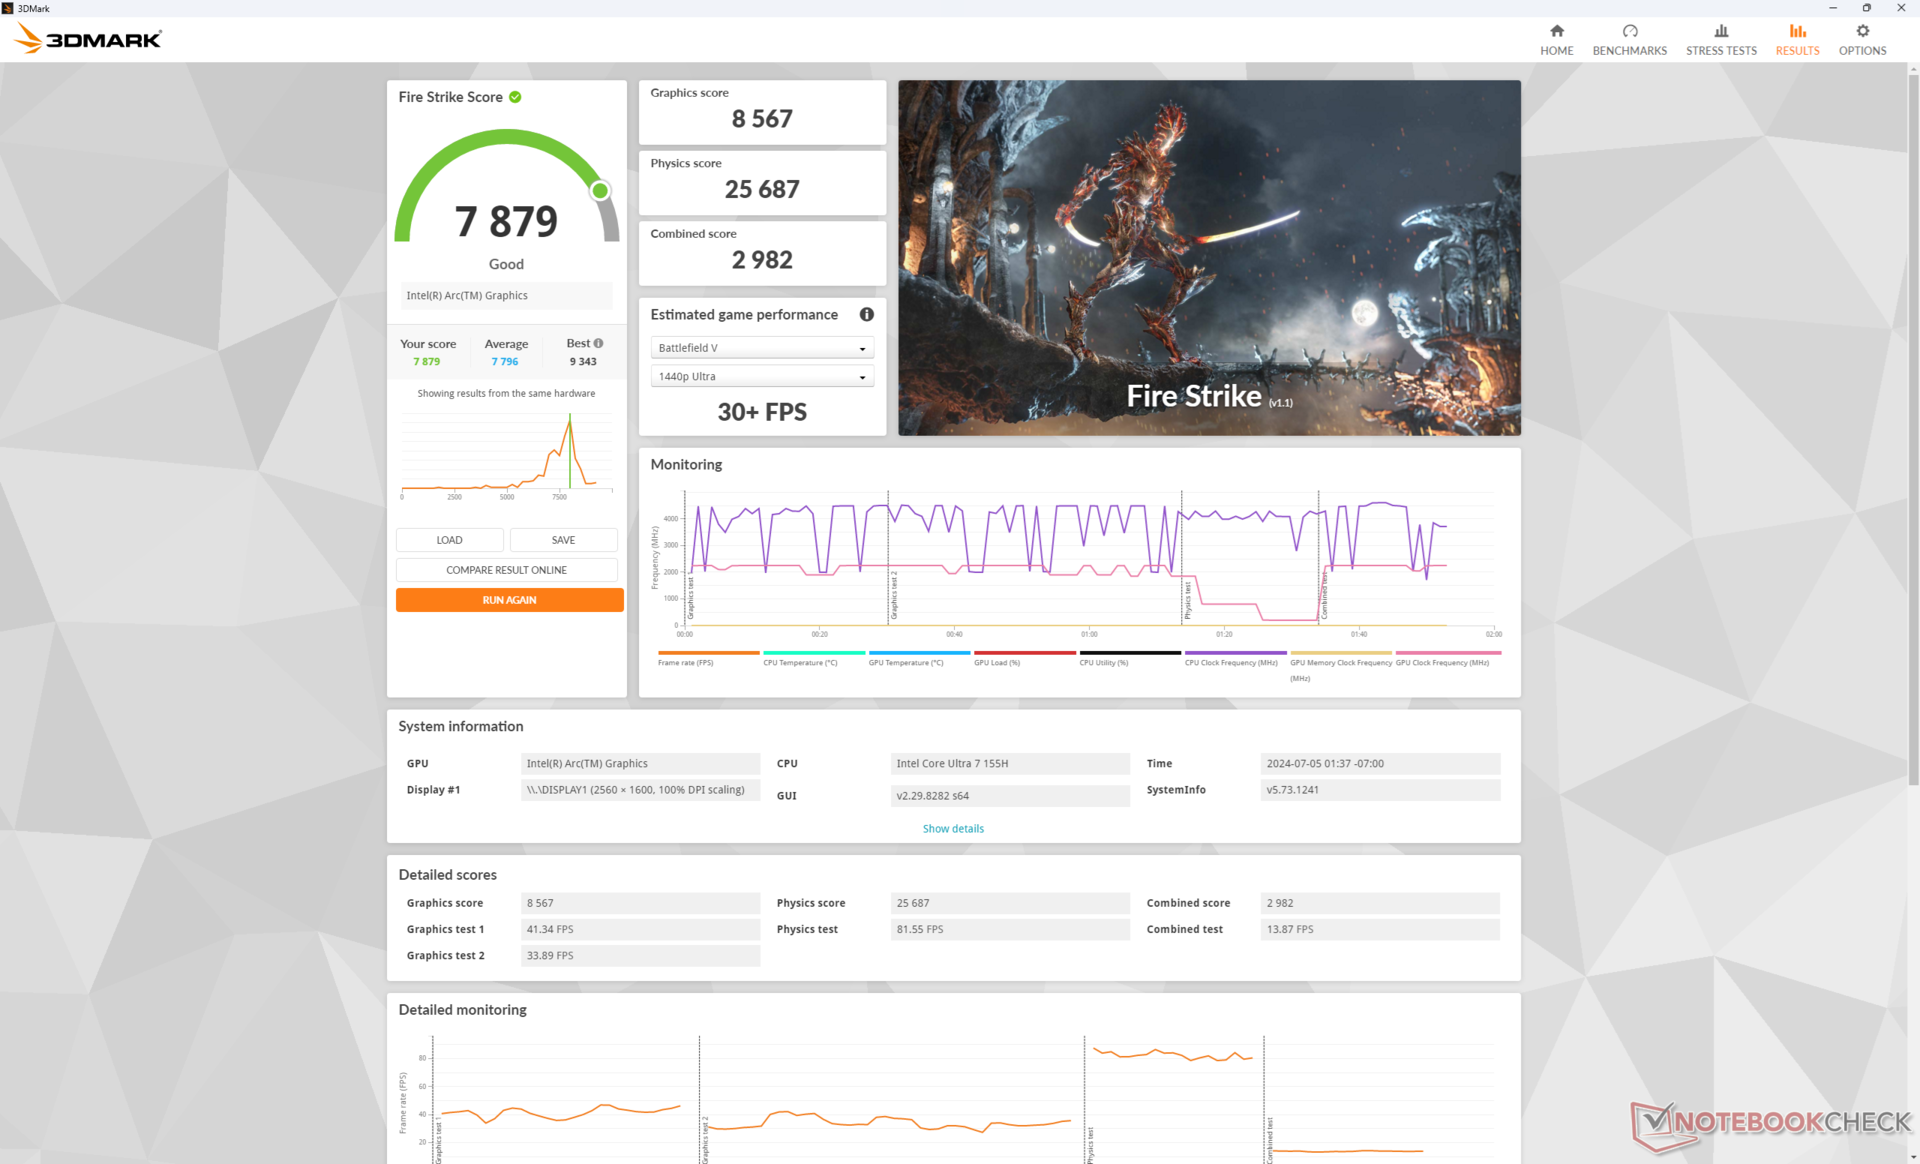
| Profilo di potenza | Fire Strike Punteggio grafico | Fire Strike Punteggio di fisica | Punteggio combinato |
| Modalità Prestazioni | 8567 | 25687 | 2982 |
| Modalità equilibrata | 8640 (-0%) | 26567 (-0%) | 2781 (-7%) |
| Alimentazione a batteria | 7734 (-10%) | 25155 (-2%) | 2886 (-3%) |
L'esecuzione in modalità Bilanciata avrebbe un impatto minimo sulle prestazioni, in base ai risultati di Fire Strike nella tabella precedente. Il deficit di prestazioni con l'alimentazione a batteria è più basso del previsto, solo del 10%, per una buona coerenza tra le diverse modalità di alimentazione.
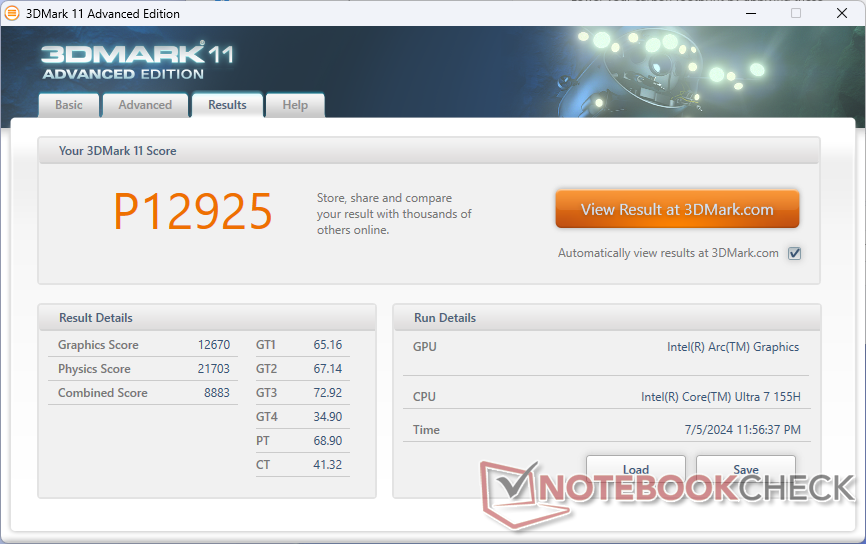
| 3DMark 11 Performance | 12925 punti | |
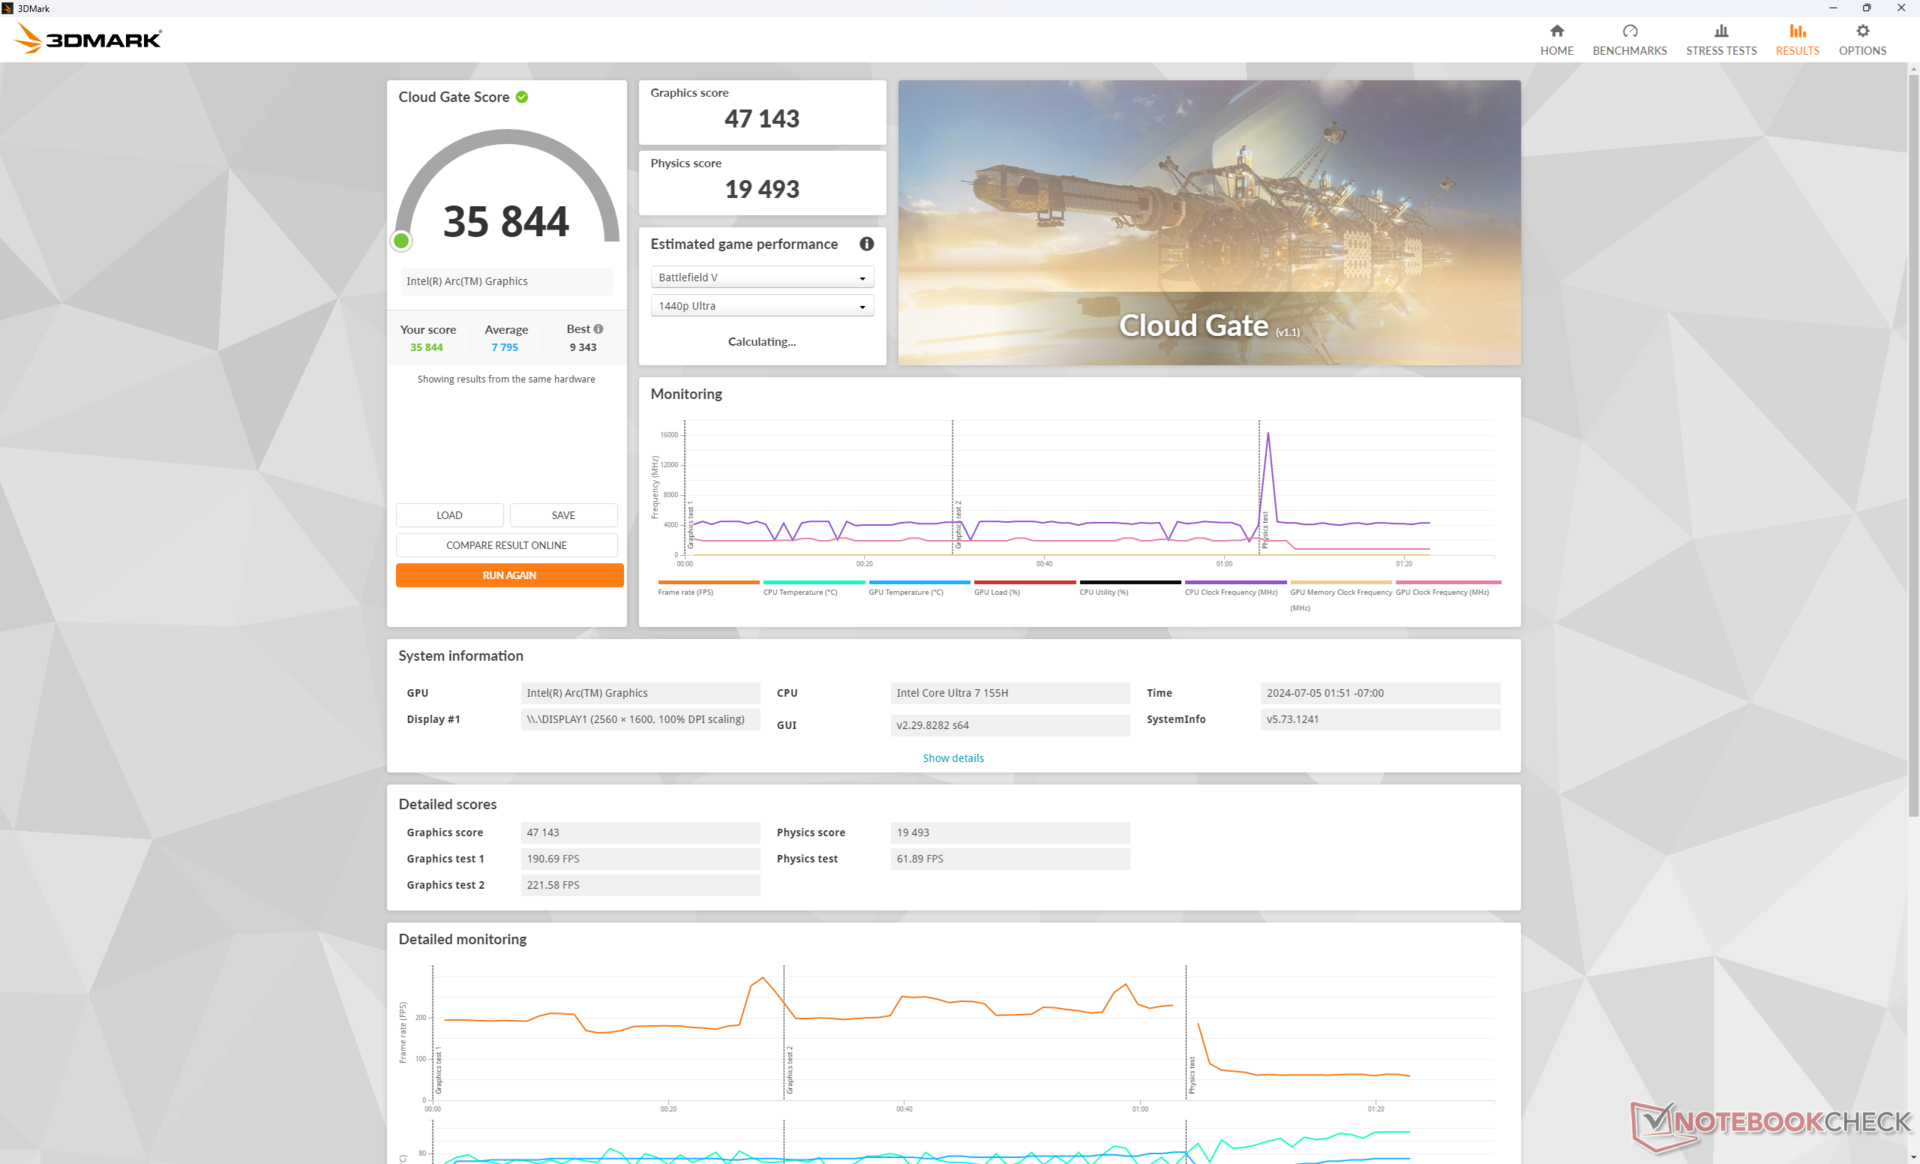
| 3DMark Cloud Gate Standard Score | 35844 punti | |
| 3DMark Fire Strike Score | 7879 punti | |
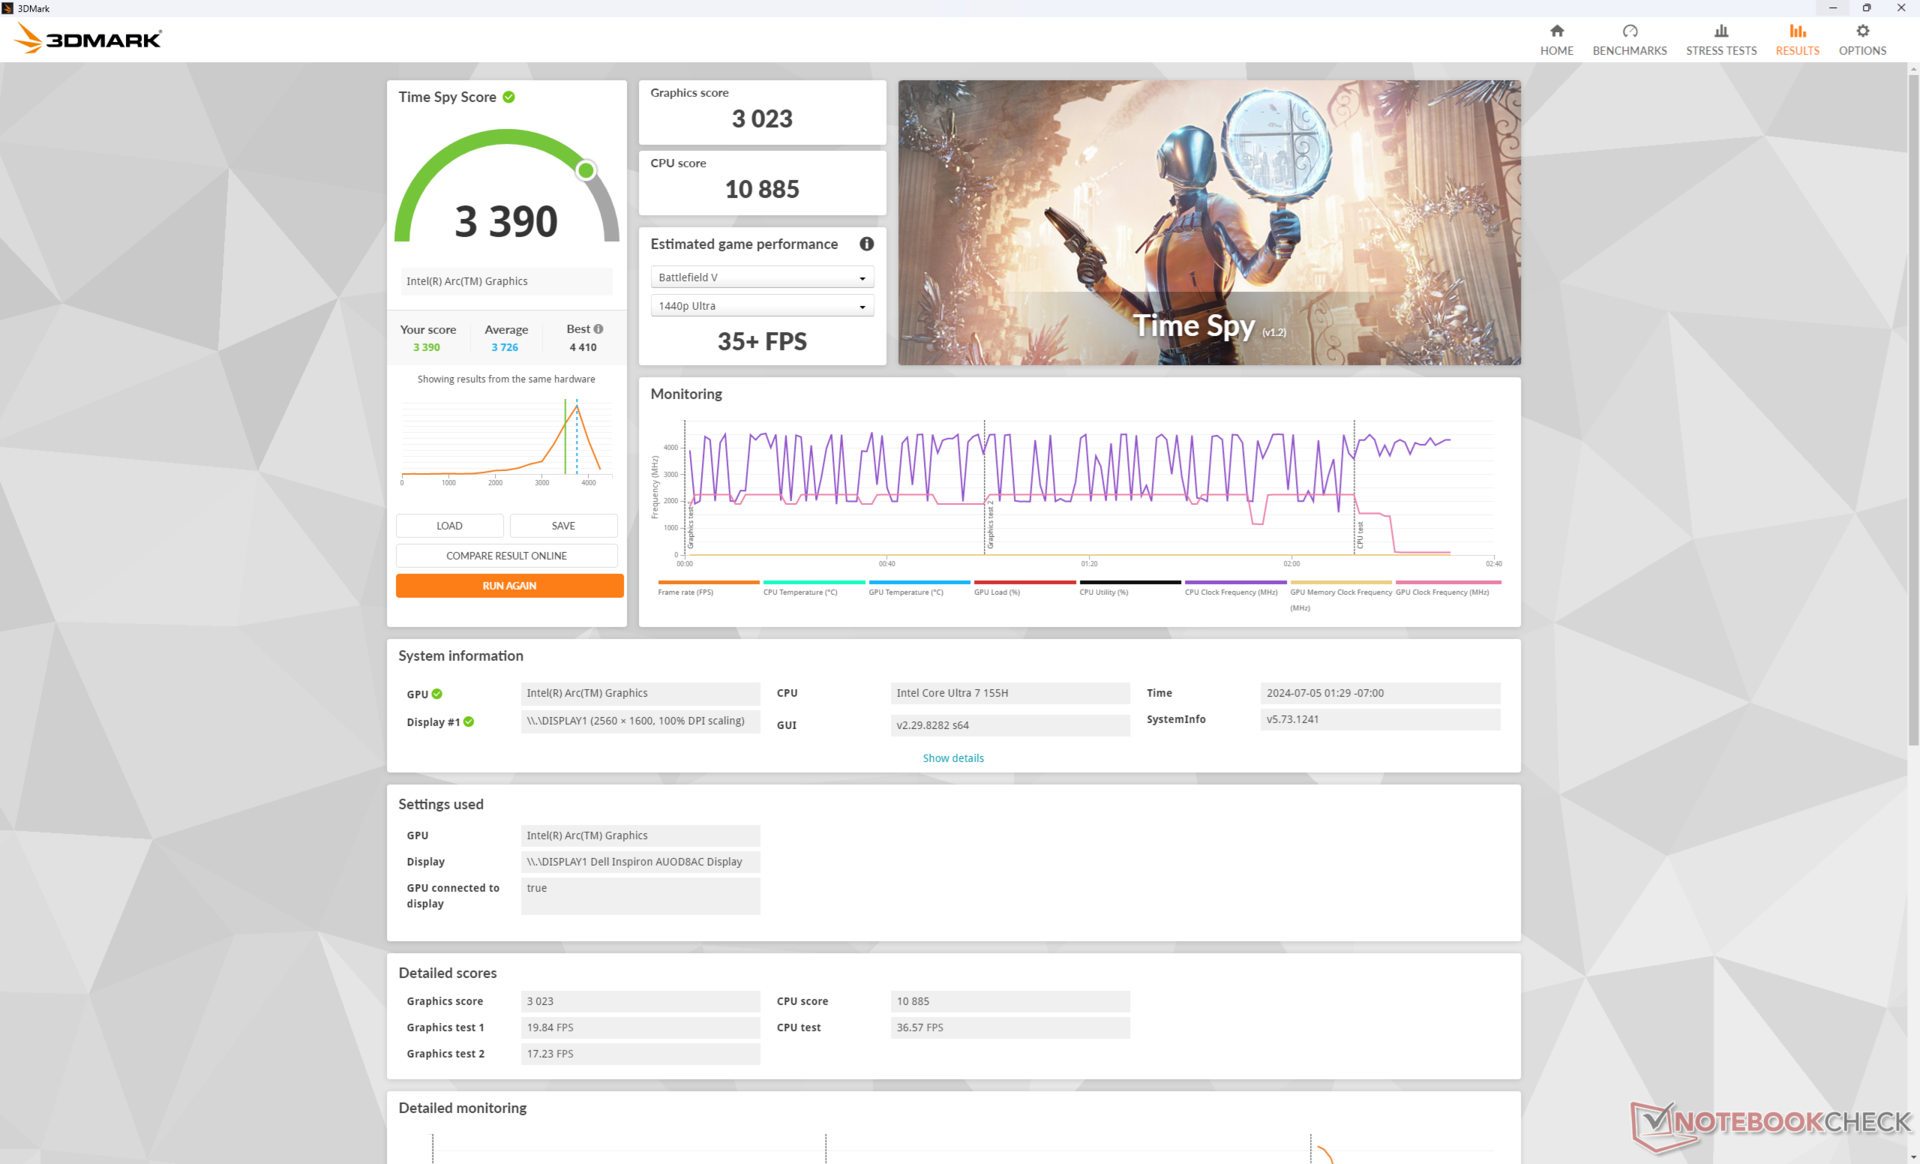
| 3DMark Time Spy Score | 3390 punti | |
Aiuto | ||
* ... Meglio usare valori piccoli
| The Witcher 3 - 1920x1080 Ultra Graphics & Postprocessing (HBAO+) | |
| Dell Inspiron 16 Plus 7640 | |
| HP Envy x360 2-in-1 16-ad0097nr | |
| Lenovo IdeaPad Pro 5 16IMH G9 | |
| Dell Inspiron 16 7640 2-in-1 | |
| Samsung Galaxy Book4 Pro 360 | |
| Dell Inspiron 16 7635 2-in-1 | |
| Final Fantasy XV Benchmark - 1920x1080 High Quality | |
| Dell Inspiron 16 Plus 7640 | |
| Lenovo IdeaPad Pro 5 16IMH G9 | |
| Dell Inspiron 16 7640 2-in-1 | |
| HP Envy x360 2-in-1 16-ad0097nr | |
| Samsung Galaxy Book4 Pro 360 | |
| Dell Inspiron 16 7635 2-in-1 | |
| Strange Brigade - 1920x1080 ultra AA:ultra AF:16 | |
| Dell Inspiron 16 Plus 7640 | |
| Lenovo IdeaPad Pro 5 16IMH G9 | |
| Dell Inspiron 16 7640 2-in-1 | |
| HP Envy x360 2-in-1 16-ad0097nr | |
| Samsung Galaxy Book4 Pro 360 | |
| Dell Inspiron 16 7635 2-in-1 | |
| Dota 2 Reborn - 1920x1080 ultra (3/3) best looking | |
| Dell Inspiron 16 Plus 7640 | |
| Lenovo IdeaPad Pro 5 16IMH G9 | |
| Dell Inspiron 16 7640 2-in-1 | |
| HP Envy x360 2-in-1 16-ad0097nr | |
| Samsung Galaxy Book4 Pro 360 | |
| Dell Inspiron 16 7635 2-in-1 | |
| X-Plane 11.11 - 1920x1080 high (fps_test=3) | |
| Dell Inspiron 16 Plus 7640 | |
| Dell Inspiron 16 7640 2-in-1 | |
| Lenovo IdeaPad Pro 5 16IMH G9 | |
| Samsung Galaxy Book4 Pro 360 | |
| HP Envy x360 2-in-1 16-ad0097nr | |
| Dell Inspiron 16 7635 2-in-1 | |
| Far Cry 5 - 1920x1080 Ultra Preset AA:T | |
| Dell Inspiron 16 Plus 7640 | |
| Lenovo IdeaPad Pro 5 16IMH G9 | |
| Dell Inspiron 16 7640 2-in-1 | |
| HP Envy x360 2-in-1 16-ad0097nr | |
Cyberpunk 2077 ultra FPS Chart
| basso | medio | alto | ultra | |
|---|---|---|---|---|
| The Witcher 3 (2015) | 141.5 | 81.2 | 44.5 | 23.9 |
| Dota 2 Reborn (2015) | 101.5 | 93.3 | 77.8 | 78 |
| Final Fantasy XV Benchmark (2018) | 65 | 36.5 | 26.8 | |
| X-Plane 11.11 (2018) | 50.8 | 40.8 | 40.1 | |
| Far Cry 5 (2018) | 68 | 38 | 36 | 34 |
| Strange Brigade (2018) | 145.6 | 71.8 | 55.4 | 45.4 |
| Tiny Tina's Wonderlands (2022) | 49.2 | 37.3 | 26.4 | 21.2 |
| F1 22 (2022) | 68.8 | 65.6 | ||
| Baldur's Gate 3 (2023) | 30.8 | 27.4 | 23.7 | 22 |
| Cyberpunk 2077 2.2 Phantom Liberty (2023) | 31 | 26.3 | 21.9 |
Emissioni
System Noise - Forte e orgoglioso
Non essendo state apportate modifiche sostanziali alla soluzione di raffreddamento rispetto al modello 2023, nonostante il nostro processore più esigente, la ventola interna dovrà funzionare con lo stesso volume o più forte di prima e questo è esattamente ciò che abbiamo registrato nei nostri test. La ventola dell'Inspiron 16 7640 2-in-1 accelera più facilmente da silenziosa a rumorosa quando vengono introdotti carichi più pesanti. Ad esempio, siamo in grado di registrare un rumore della ventola di 45 dB(A) a meno di metà della prima scena di benchmark di 3DMark 06, mentre l'Inspiron 16 7635 2-in-1 ha registrato un rumore di 45 dB(A) Inspiron 16 7635 2-in-1 avrebbe raggiunto i 40 dB(A). Anche l'esecuzione di giochi avrebbe comportato un rumore della ventola di 45 dB(A), rendendo il nostro Dell uno dei convertibili da 16 pollici più rumorosi sul mercato.

Rumorosità
| Idle |
| 22.9 / 22.9 / 25 dB(A) |
| Sotto carico |
| 45.1 / 44.9 dB(A) |
 | ||
30 dB silenzioso 40 dB(A) udibile 50 dB(A) rumoroso |
||
min: | ||
| Dell Inspiron 16 7640 2-in-1 Arc 8-Core, Ultra 7 155H, Micron 2550 1TB | Dell Inspiron 16 Plus 7640 NVIDIA GeForce RTX 4060 Laptop GPU, Ultra 7 155H, SK hynix BC901 HFS001TEJ4X164N | Dell Inspiron 16 7635 2-in-1 Vega 7, R5 7530U, Kioxia BG5 KBG50ZNS512G | HP Envy x360 2-in-1 16-ad0097nr Radeon 780M, R7 8840HS, KIOXIA BG5 KBG50ZNV1T02 | Lenovo IdeaPad Pro 5 16IMH G9 Arc 8-Core, Ultra 7 155H, Samsung PM9C1a MZAL81T0HDLB | Samsung Galaxy Book4 Pro 360 Arc 7-Core, Ultra 5 125H, Samsung PM9B1 512GB MZVL4512HBLU | |
|---|---|---|---|---|---|---|
| Noise | 2% | 2% | 10% | -4% | 2% | |
| off /ambiente * | 22.9 | 23.8 -4% | 23.6 -3% | 22.9 -0% | 24.1 -5% | 24.1 -5% |
| Idle Minimum * | 22.9 | 24.2 -6% | 23.6 -3% | 23 -0% | 24.1 -5% | 24.1 -5% |
| Idle Average * | 22.9 | 24.2 -6% | 23.6 -3% | 23 -0% | 24.1 -5% | 24.1 -5% |
| Idle Maximum * | 25 | 24.2 3% | 23.6 6% | 23 8% | 28.2 -13% | 26.4 -6% |
| Load Average * | 45.1 | 28.9 36% | 40.3 11% | 23.8 47% | 44.4 2% | 35.2 22% |
| Cyberpunk 2077 ultra * | 44.9 | |||||
| Load Maximum * | 44.9 | 51 -14% | 44.2 2% | 43.8 2% | 44.4 1% | 39.2 13% |
| Witcher 3 ultra * | 51 | 44.2 | 43.8 | 36.5 | 38.5 |
* ... Meglio usare valori piccoli
Temperatura
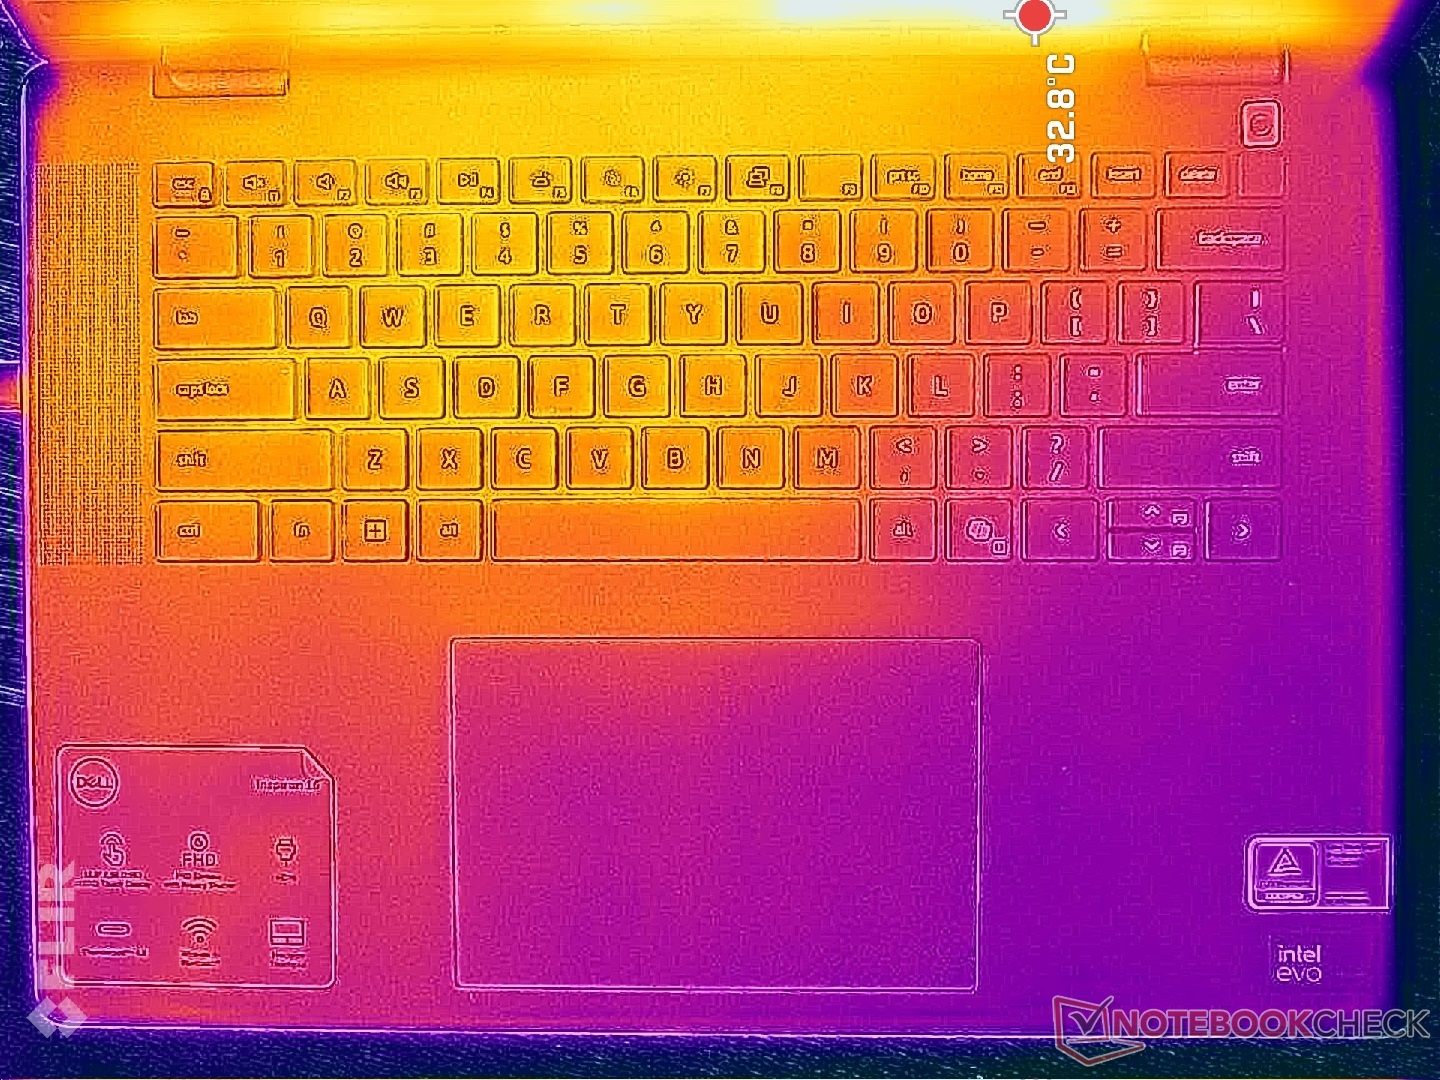
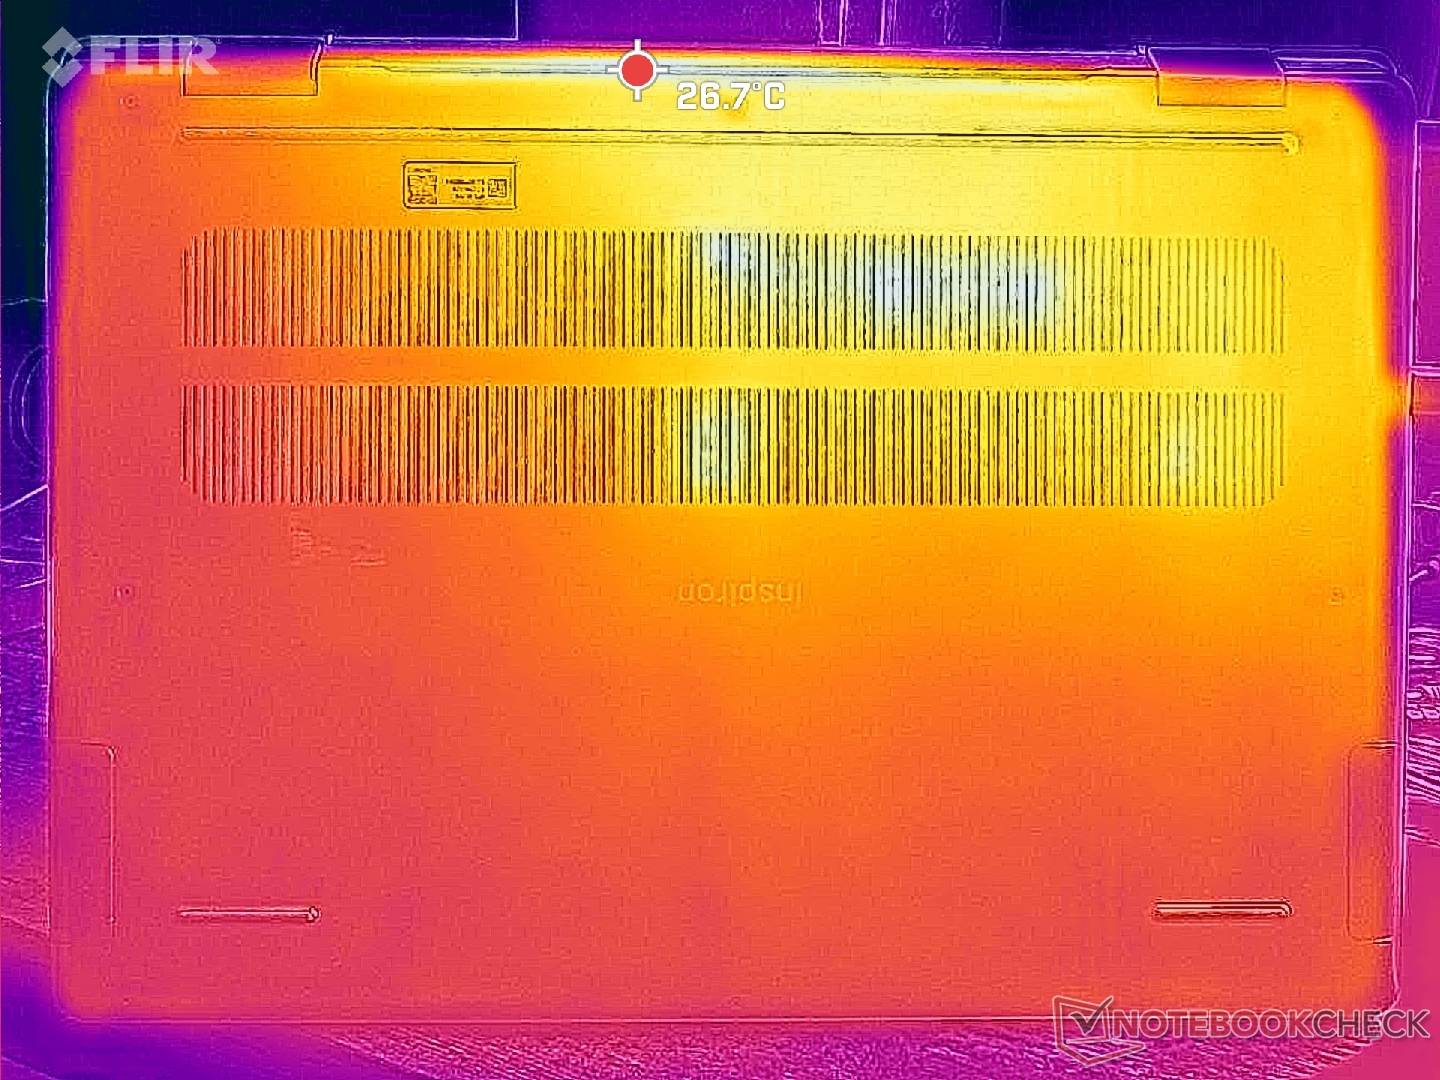
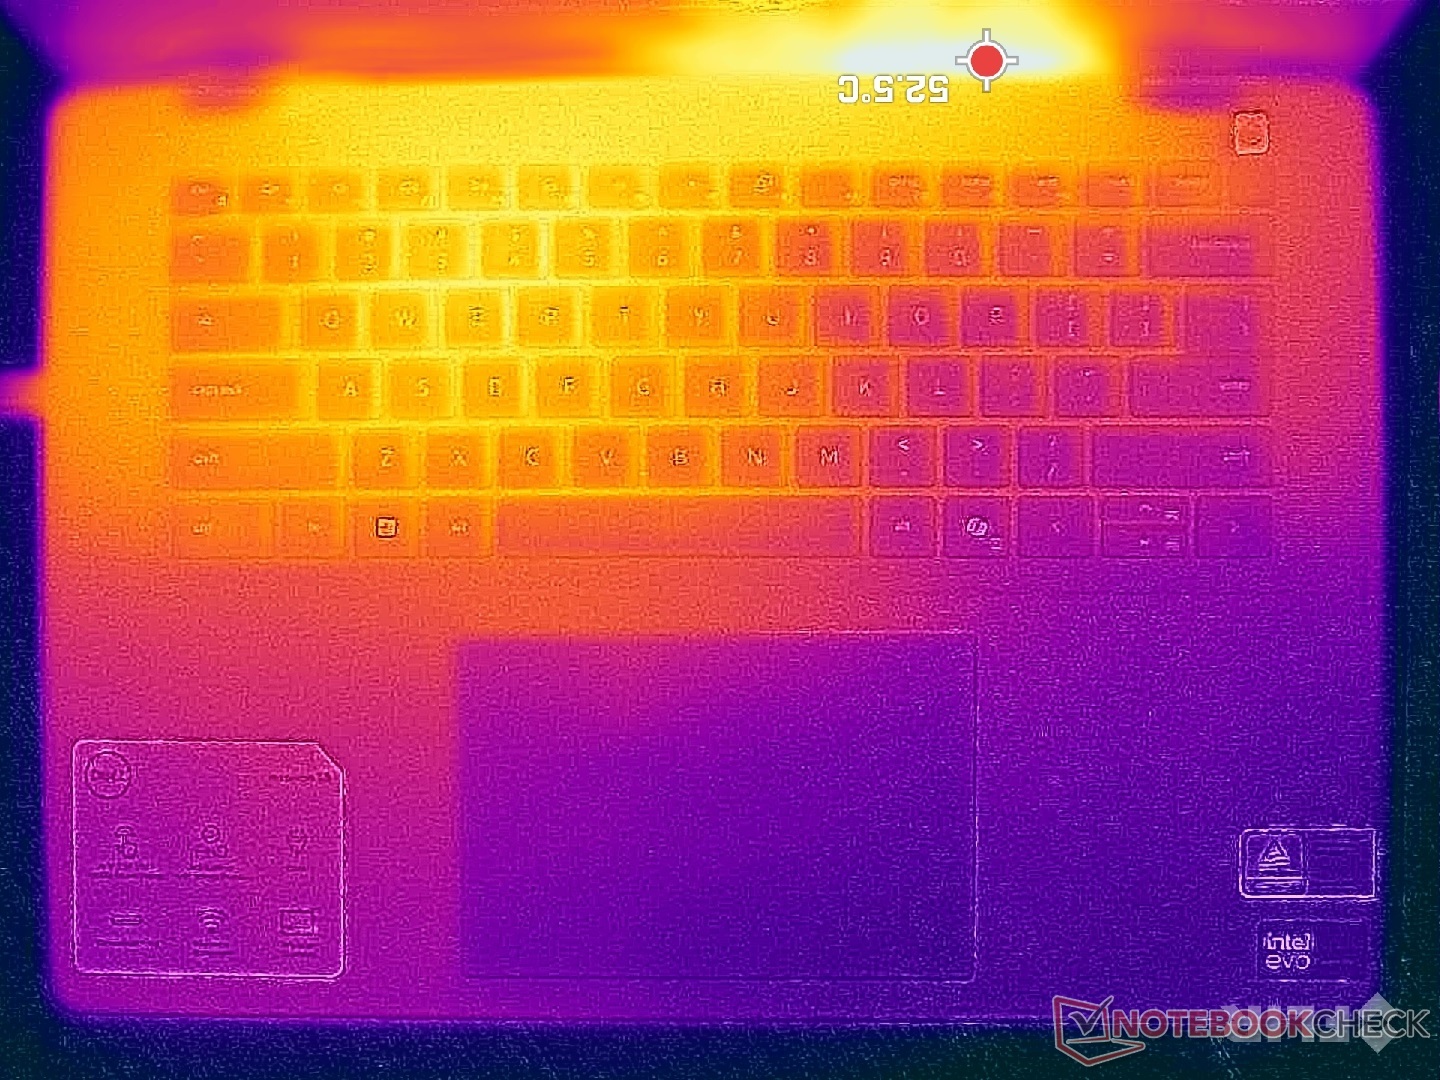
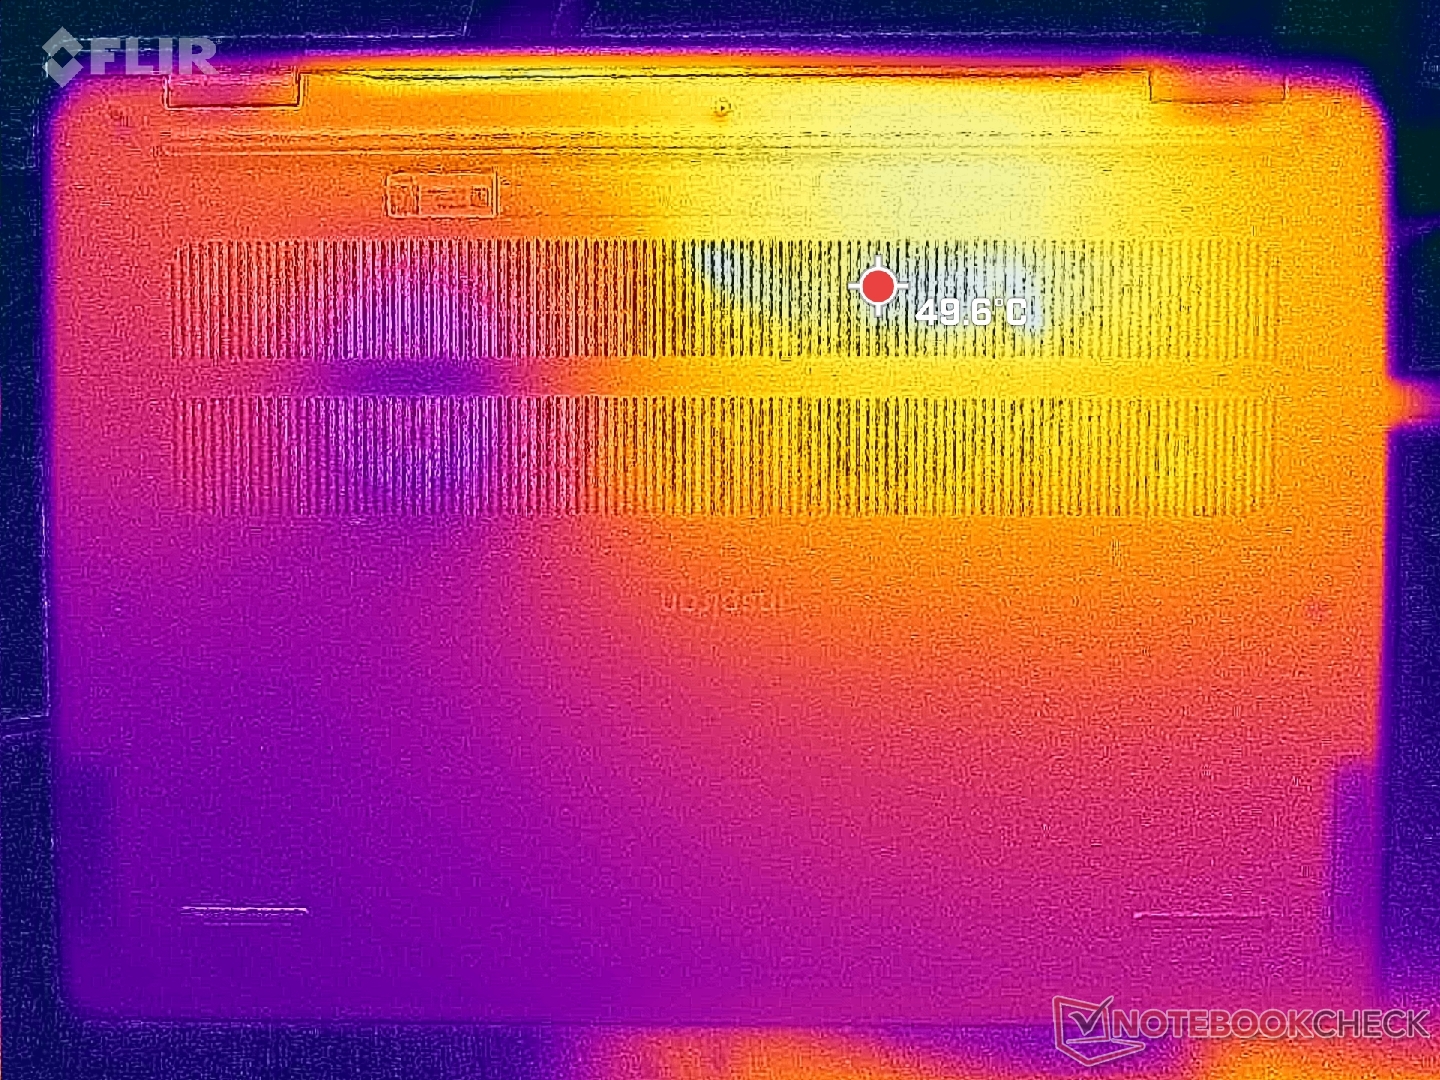
Le temperature di superficie sono di nuovo più calde nella metà sinistra dello chassis rispetto alla destra, a causa della soluzione di raffreddamento asimmetrica. Questa volta, tuttavia, le temperature medie possono essere molto più calde rispetto al passato, a causa della CPU Core serie H più potente. I punti caldi sulla nostra unità, ad esempio, possono raggiungere i 47 C su entrambe le coperture C e D, rispetto ai soli 39 C-42 C del modello dello scorso anno. Questi punti sono fortunatamente verso la parte posteriore dell'unità, dove è meno probabile che si tocchino le dita.
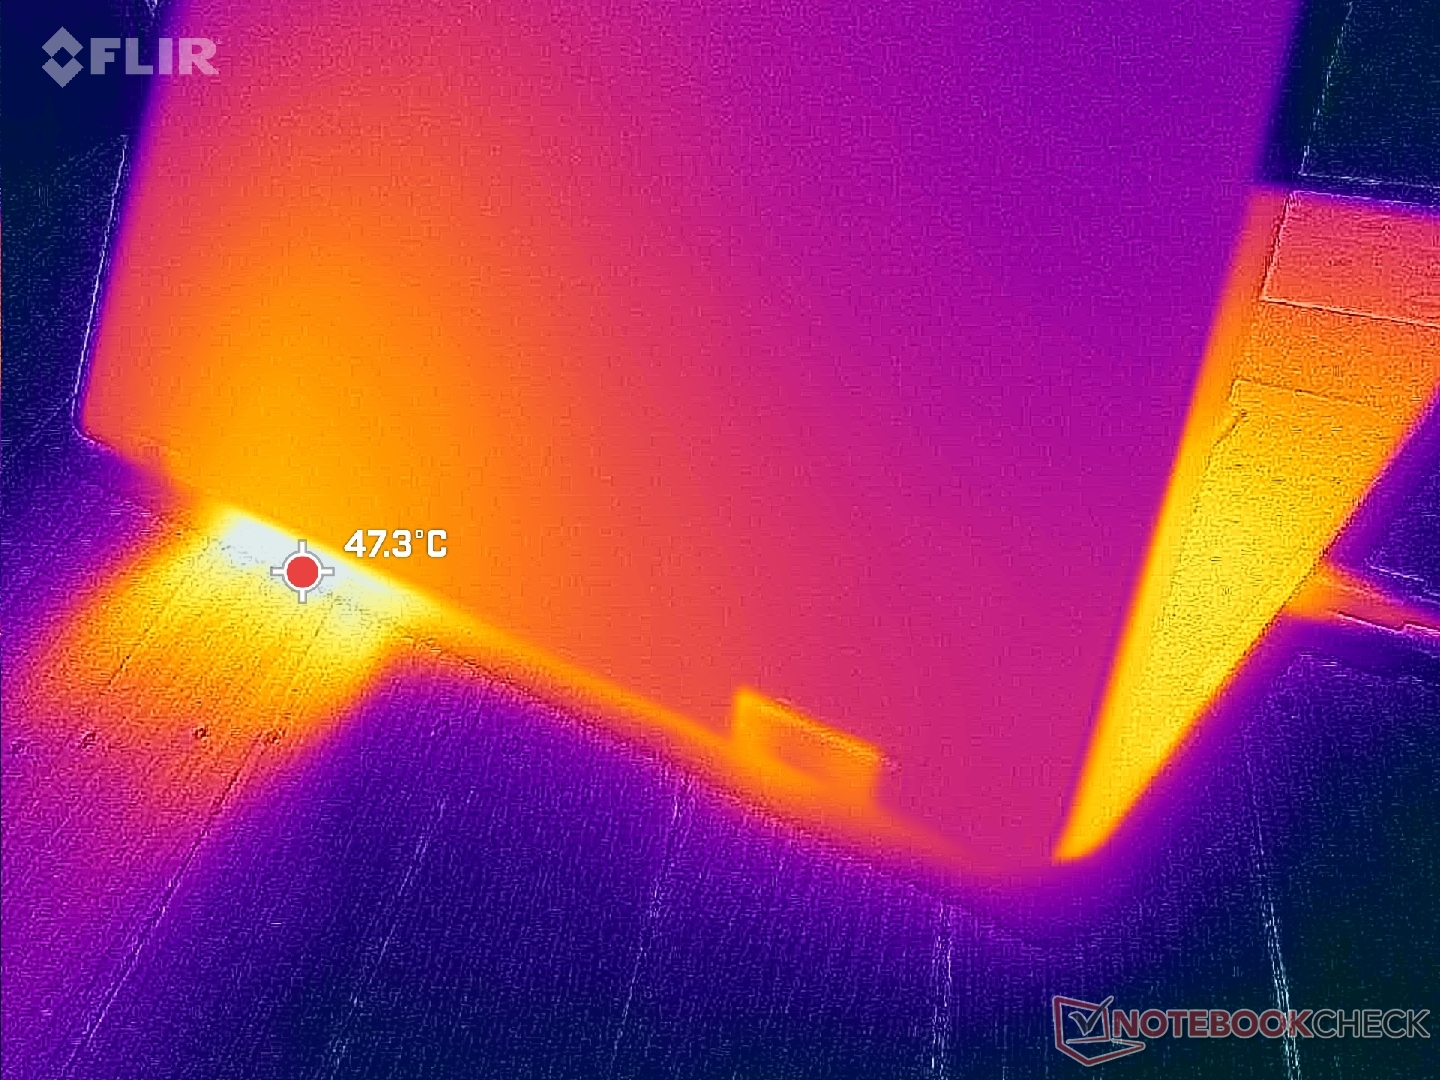
(-) La temperatura massima sul lato superiore è di 46.8 °C / 116 F, rispetto alla media di 35.3 °C / 96 F, che varia da 19.6 a 60 °C per questa classe Convertible.
(-) Il lato inferiore si riscalda fino ad un massimo di 45.6 °C / 114 F, rispetto alla media di 36.8 °C / 98 F
(+) In idle, la temperatura media del lato superiore è di 29.9 °C / 86 F, rispetto alla media deld ispositivo di 30.2 °C / 86 F.
(+) I poggiapolsi e il touchpad raggiungono la temperatura massima della pelle (33.8 °C / 92.8 F) e quindi non sono caldi.
(-) La temperatura media della zona del palmo della mano di dispositivi simili e'stata di 28 °C / 82.4 F (-5.8 °C / -10.4 F).
| Dell Inspiron 16 7640 2-in-1 Intel Core Ultra 7 155H, Intel Arc 8-Core iGPU | Dell Inspiron 16 Plus 7640 Intel Core Ultra 7 155H, NVIDIA GeForce RTX 4060 Laptop GPU | Dell Inspiron 16 7635 2-in-1 AMD Ryzen 5 7530U, AMD Radeon RX Vega 7 | HP Envy x360 2-in-1 16-ad0097nr AMD Ryzen 7 8840HS, AMD Radeon 780M | Lenovo IdeaPad Pro 5 16IMH G9 Intel Core Ultra 7 155H, Intel Arc 8-Core iGPU | Samsung Galaxy Book4 Pro 360 Intel Core Ultra 5 125H, Intel Arc 7-Core iGPU | |
|---|---|---|---|---|---|---|
| Heat | 3% | 11% | 8% | 19% | 18% | |
| Maximum Upper Side * | 46.8 | 43.4 7% | 41.6 11% | 42.6 9% | 36.3 22% | 38.6 18% |
| Maximum Bottom * | 45.6 | 41.6 9% | 39 14% | 47.8 -5% | 39.1 14% | 39.2 14% |
| Idle Upper Side * | 32.2 | 32.8 -2% | 29.4 9% | 27.4 15% | 24.9 23% | 25.2 22% |
| Idle Bottom * | 31.4 | 32.4 -3% | 28.6 9% | 27.8 11% | 26.1 17% | 25.7 18% |
* ... Meglio usare valori piccoli
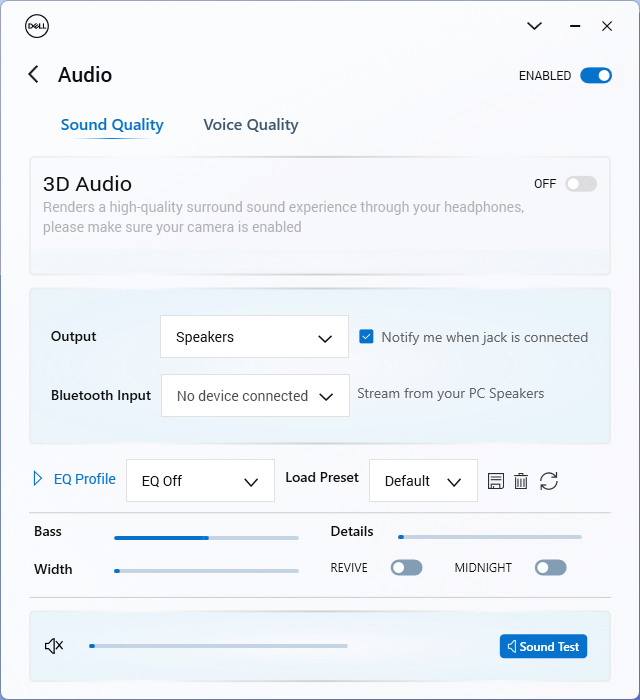
Altoparlanti
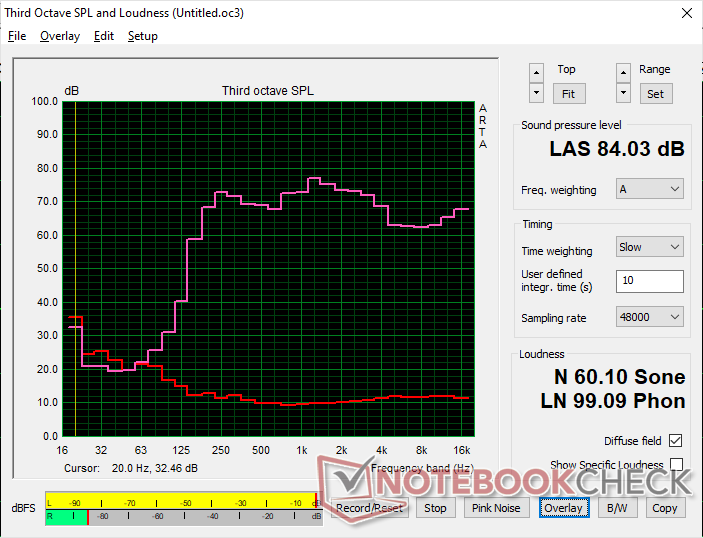
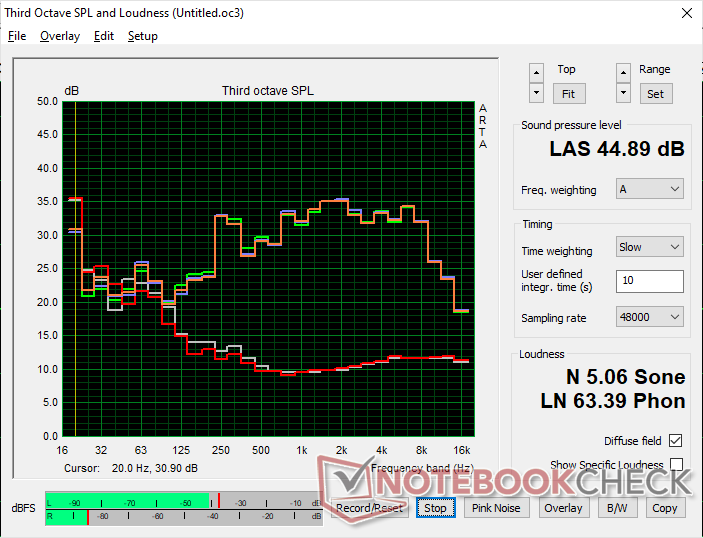
Dell Inspiron 16 7640 2-in-1 analisi audio
(+) | gli altoparlanti sono relativamente potenti (84 dB)
Bassi 100 - 315 Hz
(±) | bassi ridotti - in media 13.9% inferiori alla media
(±) | la linearità dei bassi è media (14% delta rispetto alla precedente frequenza)
Medi 400 - 2000 Hz
(+) | medi bilanciati - solo only 3.6% rispetto alla media
(+) | medi lineari (3.6% delta rispetto alla precedente frequenza)
Alti 2 - 16 kHz
(+) | Alti bilanciati - appena 4.5% dalla media
(+) | alti lineari (2.8% delta rispetto alla precedente frequenza)
Nel complesso 100 - 16.000 Hz
(+) | suono nel complesso lineare (12% differenza dalla media)
Rispetto alla stessa classe
» 11% di tutti i dispositivi testati in questa classe è stato migliore, 4% simile, 85% peggiore
» Il migliore ha avuto un delta di 6%, medio di 20%, peggiore di 57%
Rispetto a tutti i dispositivi testati
» 8% di tutti i dispositivi testati in questa classe è stato migliore, 2% similare, 90% peggiore
» Il migliore ha avuto un delta di 4%, medio di 24%, peggiore di 134%
Apple MacBook Pro 16 2021 M1 Pro analisi audio
(+) | gli altoparlanti sono relativamente potenti (84.7 dB)
Bassi 100 - 315 Hz
(+) | bassi buoni - solo 3.8% dalla media
(+) | bassi in lineaa (5.2% delta rispetto alla precedente frequenza)
Medi 400 - 2000 Hz
(+) | medi bilanciati - solo only 1.3% rispetto alla media
(+) | medi lineari (2.1% delta rispetto alla precedente frequenza)
Alti 2 - 16 kHz
(+) | Alti bilanciati - appena 1.9% dalla media
(+) | alti lineari (2.7% delta rispetto alla precedente frequenza)
Nel complesso 100 - 16.000 Hz
(+) | suono nel complesso lineare (4.6% differenza dalla media)
Rispetto alla stessa classe
» 0% di tutti i dispositivi testati in questa classe è stato migliore, 0% simile, 100% peggiore
» Il migliore ha avuto un delta di 5%, medio di 18%, peggiore di 45%
Rispetto a tutti i dispositivi testati
» 0% di tutti i dispositivi testati in questa classe è stato migliore, 0% similare, 100% peggiore
» Il migliore ha avuto un delta di 4%, medio di 24%, peggiore di 134%
Gestione dell'energia - Core-H e Mini-LED possono essere impegnativi
Consumo di energia
Il funzionamento al minimo sul desktop richiede tra i 6 W e i 14 W a seconda dell'impostazione della luminosità, il che è superiore di diversi watt rispetto a quanto abbiamo registrato sull'Inspiron 16 7635 Inspiron 16 7635 2-in-1. Naturalmente, la CPU serie H più esigente e il pannello mini-LED a risoluzione più elevata sono entrambi responsabili del consumo generalmente più elevato.
Il consumo è di nuovo superiore a quello dell'Inspiron 16 7635 2-in-1 di oltre il 40% quando si eseguono applicazioni più impegnative come i giochi. Con un aumento delle prestazioni della GPU di oltre 2 volte rispetto alla RX Vega 7, tuttavia, l'aumento del consumo dovrebbe valere la pena per la maggior parte degli utenti. Una conclusione simile può essere fatta anche per le attività ad alta intensità di CPU, quando si esegue Prime95. Se la durata della batteria è più desiderabile delle prestazioni, la scelta della configurazione Core Ultra 5 125U, più economica e più lenta, dovrebbe far risparmiare molta energia in questo senso.
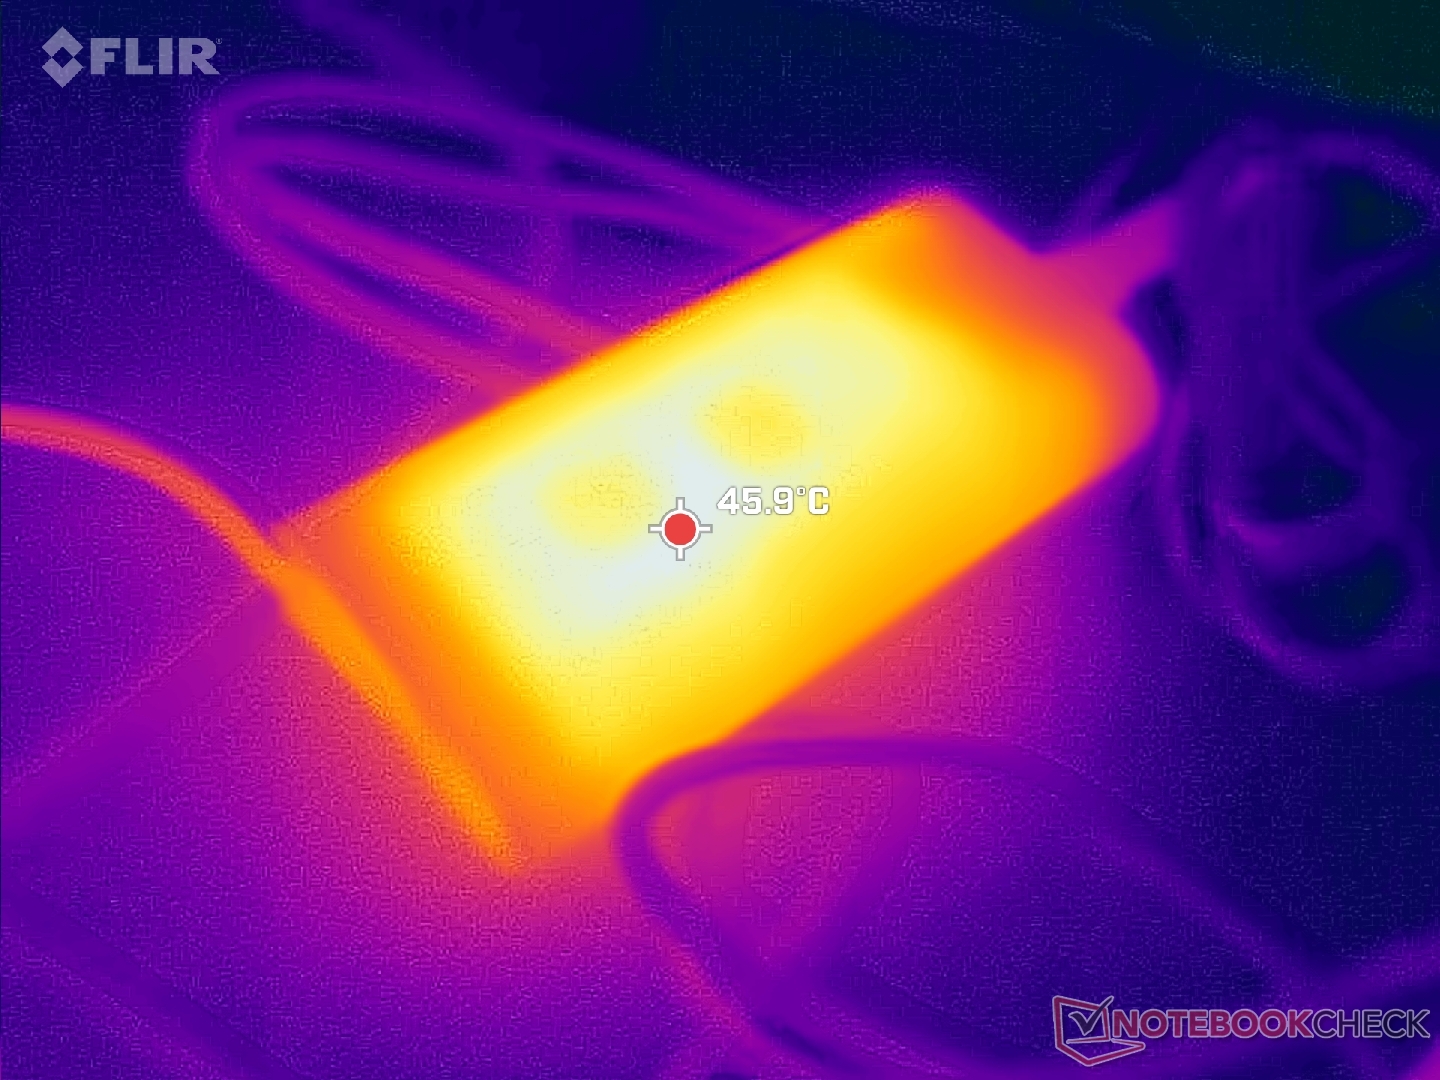
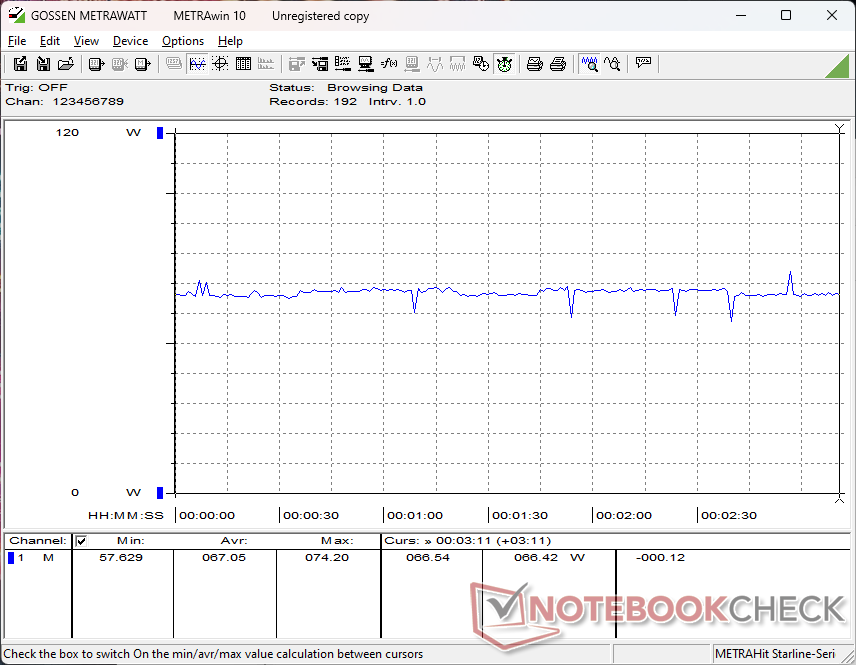
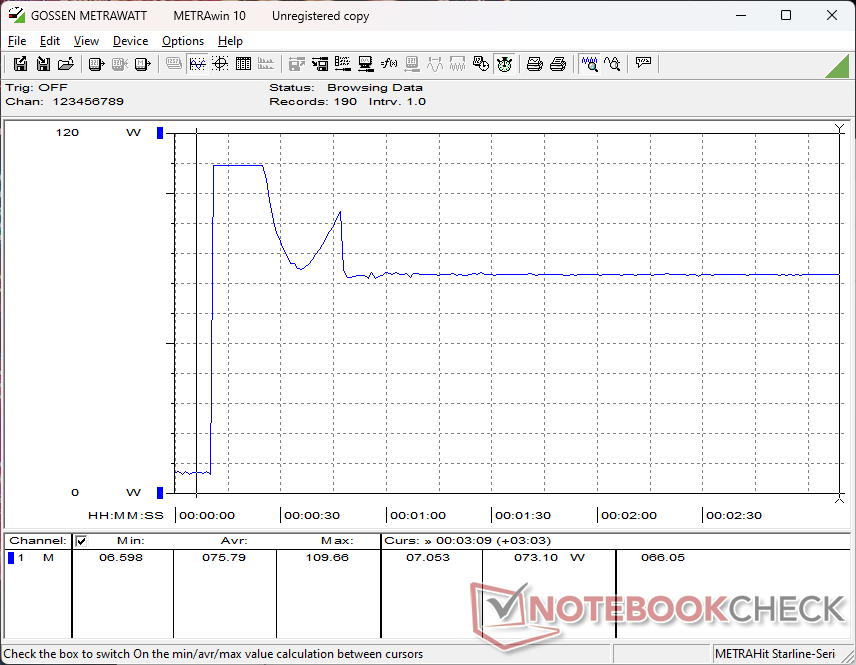
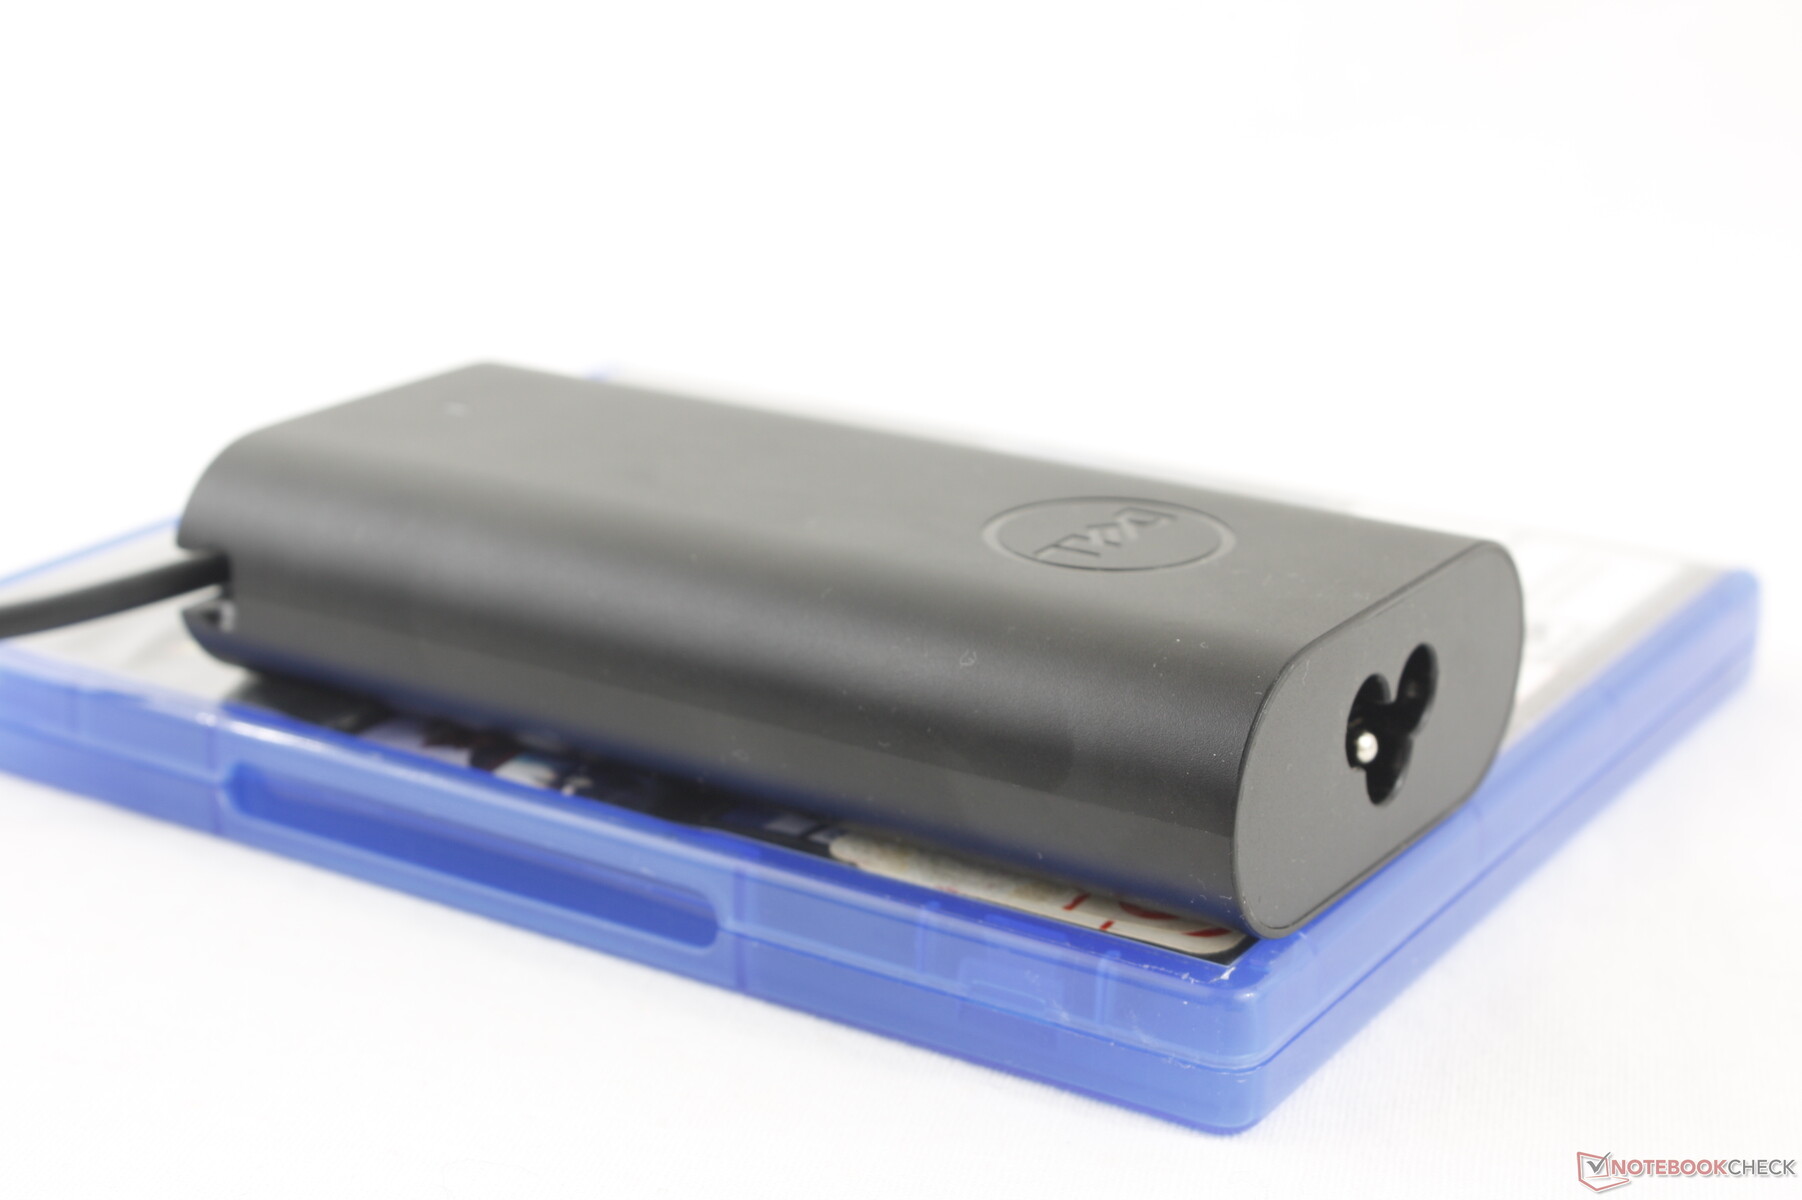
Siamo riusciti a registrare un consumo massimo di 110 W, anche se l'adattatore CA USB-C di dimensioni medio-piccole (~12,2 x 5,9 x 2,7 cm) ha una potenza nominale di soli 100 W. Questo consumo massimo è solo temporaneo, come mostra il nostro grafico sottostante, a causa delle limitazioni termiche. È comunque molto più alto di quello che abbiamo registrato sull'Inspiron 16 7635 2-in-1, grazie al potenziale Turbo Boost più elevato della CPU Core serie H.

| Off / Standby | |
| Idle | |
| Sotto carico |
|
Leggenda:
min: | |
| Dell Inspiron 16 7640 2-in-1 Ultra 7 155H, Arc 8-Core, Micron 2550 1TB, Mini-LED, 2560x1600, 16" | Dell Inspiron 16 Plus 7640 Ultra 7 155H, NVIDIA GeForce RTX 4060 Laptop GPU, SK hynix BC901 HFS001TEJ4X164N, IPS, 2560x1600, 16" | Dell Inspiron 16 7635 2-in-1 R5 7530U, Vega 7, Kioxia BG5 KBG50ZNS512G, IPS, 1920x1200, 16" | HP Envy x360 2-in-1 16-ad0097nr R7 8840HS, Radeon 780M, KIOXIA BG5 KBG50ZNV1T02, OLED, 2880x1800, 16" | Lenovo IdeaPad Pro 5 16IMH G9 Ultra 7 155H, Arc 8-Core, Samsung PM9C1a MZAL81T0HDLB, IPS, 2560x1600, 16" | Samsung Galaxy Book4 Pro 360 Ultra 5 125H, Arc 7-Core, Samsung PM9B1 512GB MZVL4512HBLU, OLED, 2880x1800, 16" | |
|---|---|---|---|---|---|---|
| Power Consumption | 7% | 35% | 26% | 22% | 44% | |
| Idle Minimum * | 6.1 | 4.2 31% | 4.8 21% | 5 18% | 3.5 43% | 3 51% |
| Idle Average * | 13.5 | 6.9 49% | 7.6 44% | 6.2 54% | 9.6 29% | 6.3 53% |
| Idle Maximum * | 13.8 | 15.2 -10% | 8.7 37% | 14.7 -7% | 9.9 28% | 6.5 53% |
| Load Average * | 63.6 | 70.4 -11% | 47.1 26% | 49.9 22% | 62.7 1% | 49.3 22% |
| Cyberpunk 2077 ultra external monitor * | 64.6 | |||||
| Cyberpunk 2077 ultra * | 67 | |||||
| Load Maximum * | 109.7 | 137.4 -25% | 56.4 49% | 65 41% | 101.2 8% | 65.5 40% |
| Witcher 3 ultra * | 115.9 | 46.6 | 54.5 | 55.8 | 45.9 |
* ... Meglio usare valori piccoli
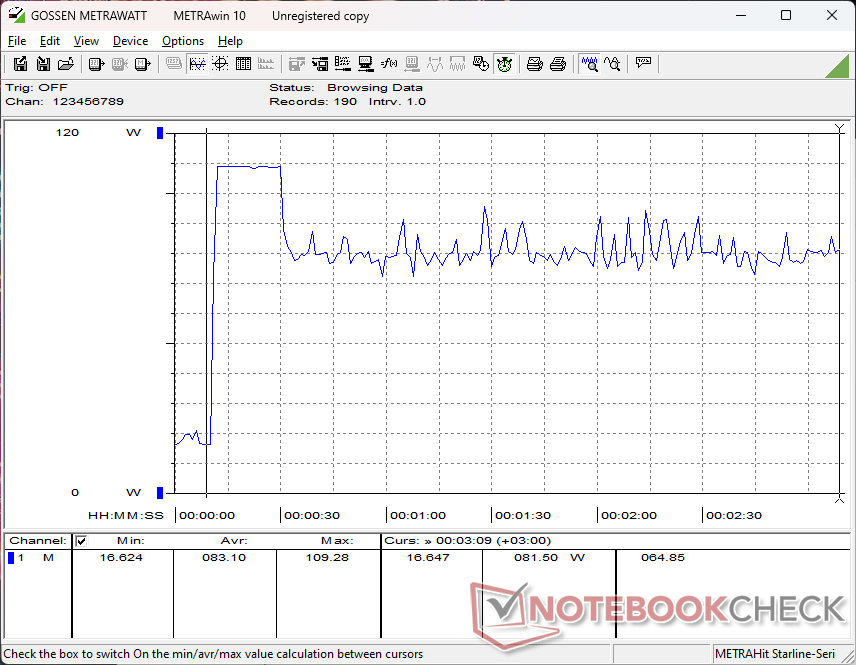
Power Consumption Cyberpunk / Stress Test
Power Consumption external Monitor
Durata della batteria
La batteria da 90 Wh è più grande di quella da 64 Wh dell'Inspiron 16 7635 2-in-1 dello scorso anno. Tuttavia, i tempi di esecuzione sono inferiori di quasi tre ore durante il nostro test di navigazione, a causa del display e della CPU più esigenti, come già detto. Le differenze di autonomia si mantengono anche quando gli schermi sono impostati su un livello di luminosità identico, pari a 150 nits.
La ricarica dell'ampia batteria da vuota a piena capacità è relativamente lenta, circa 2,5 ore rispetto alle 1,5 ore della maggior parte degli altri Ultrabook.
| Dell Inspiron 16 7640 2-in-1 Ultra 7 155H, Arc 8-Core, 90 Wh | Dell Inspiron 16 Plus 7640 Ultra 7 155H, NVIDIA GeForce RTX 4060 Laptop GPU, 90 Wh | Dell Inspiron 16 7635 2-in-1 R5 7530U, Vega 7, 64 Wh | HP Envy x360 2-in-1 16-ad0097nr R7 8840HS, Radeon 780M, 68 Wh | Lenovo IdeaPad Pro 5 16IMH G9 Ultra 7 155H, Arc 8-Core, 84 Wh | Samsung Galaxy Book4 Pro 360 Ultra 5 125H, Arc 7-Core, 76 Wh | |
|---|---|---|---|---|---|---|
| Autonomia della batteria | 16% | 23% | -12% | -9% | 0% | |
| Reader / Idle | 1310 | 1560 19% | 935 -29% | |||
| WiFi v1.3 | 686 | 799 16% | 869 27% | 459 -33% | 756 10% | 531 -23% |
| Load | 93 | 114 23% | 116 25% | 68 -27% | 114 23% | |
| H.264 | 957 | 881 |
Pro
Contro
Verdetto - Grande per dimensioni e prestazioni
L'Inspiron 16 7640 2-in-1 presenta diversi punti di forza. Innanzitutto, le sue prestazioni con il Core Ultra 7 155H sono di alto livello, soprattutto se confrontate con quelle di altri convertibili da 16 pollici con grafica integrata. Si tratta di una CPU di classe gaming senza grossi problemi di throttling e dovrebbe superare brillantemente qualsiasi contenuto o applicazione multi-tasking che si possa proporre alla macchina. In secondo luogo, il pannello mini-LED conferma il modello come lettore multimediale di fascia alta con un pratico fattore di forma 2-in-1 e una penna attiva.
L'Inspiron 16 7640 2-in-1 è grande e potente. Sebbene le sue prestazioni e il suo display siano impressionanti per il prezzo, gli utenti pagano per questo con uno chassis ingombrante e una durata della batteria più breve.
Prestazioni più elevate e display più luminosi hanno il costo prevedibile di un consumo energetico più elevato. I componenti più esigenti generano più calore, con conseguente rumore della ventola e tempi di funzionamento più brevi rispetto al modello dello scorso anno. Le differenze non sono di poco conto, come dimostrano i nostri test e le misurazioni di cui sopra.
Inoltre, le grandi dimensioni e il peso elevato del modello non possono essere ignorati. Sono disponibili convertibili da 16 pollici più leggeri, tra cui il modello LG Gram 16 2-in-1 o Samsung Galaxy Book4 Pro 360 per un'esperienza di viaggio più agevole. Dell è più grande e più pesante anche di HP Spectre x360 16 che però offre una grafica discreta GeForce.
L'Inspiron 16 7640 2-in-1 è comunque interessante nonostante i suoi difetti, grazie al suo prezzo ragionevole di 1.000 dollari. Eccelle in termini di velocità e qualità dell'immagine rispetto ad altri computer portatili della stessa fascia di prezzo.
Prezzo e disponibilità
La configurazione base con il Core Ultra 5 125U e lo schermo touchscreen IPS standard da 1200p parte da 800 dollari, mentre la configurazione Core Ultra 7 155H e mini-LED da 2,5K, come quella recensita, è attualmente in vendita a 1000 dollari.
Informazioni: Abbiamo aggiornato il nostro sistema di valutazione e i risultati della versione 8 non sono confrontabili con i risultati della versione 7. Altre informazioni sono gerarchicamente verfügbar.
Nota: abbiamo recentemente aggiornato il nostro sistema di valutazione e i risultati della versione 8 non sono confrontabili con quelli della versione 7. Ulteriori informazioni sono disponibili qui .
Dell Inspiron 16 7640 2-in-1
- 07/19/2024 v8
Allen Ngo
 Total Sustainability Score:
 Transparency
La selezione dei dispositivi da recensire viene effettuata dalla nostra redazione. Il campione di prova è stato fornito all'autore come prestito dal produttore o dal rivenditore ai fini di questa recensione. L'istituto di credito non ha avuto alcuna influenza su questa recensione, né il produttore ne ha ricevuto una copia prima della pubblicazione. Non vi era alcun obbligo di pubblicare questa recensione. Non accettiamo mai compensi o pagamenti in cambio delle nostre recensioni. In quanto società mediatica indipendente, Notebookcheck non è soggetta all'autorità di produttori, rivenditori o editori.
Ecco come Notebookcheck esegue i test
Ogni anno, Notebookcheck esamina in modo indipendente centinaia di laptop e smartphone utilizzando procedure standardizzate per garantire che tutti i risultati siano comparabili. Da circa 20 anni sviluppiamo continuamente i nostri metodi di prova e nel frattempo stabiliamo gli standard di settore. Nei nostri laboratori di prova, tecnici ed editori esperti utilizzano apparecchiature di misurazione di alta qualità. Questi test comportano un processo di validazione in più fasi. Il nostro complesso sistema di valutazione si basa su centinaia di misurazioni e parametri di riferimento ben fondati, che mantengono l'obiettività.Price comparison

