Recensioni Notebook con Intel Graphics 4-Core iGPU (Arc) la scheda grafica
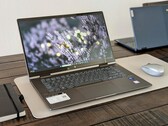
Recensione del convertibile HP Envy x360 15 Core Ultra 7: Deludente per il prezzo
Envy x360 15 è il convertibile di fascia media di HP, ma sembra troppo scarno se si considera il prezzo di $1200 USD. Alcuni aspetti sono lodevoli, ma sono poch...
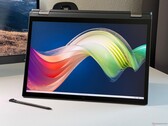
Intel Core Ultra 7 155U | Intel Graphics 4-Core iGPU (Arc) | 15.60" | 1.9 kgRecensione del Lenovo ThinkPad L13 2-in-1 G5 - Un 2-in-1 business con touchscreen opaco
Con il ThinkPad L13 2-in-1, Lenovo offre un 2-in-1 business compatto dotato di uno schermo touchscreen opaco. Lo stilo di accompagnamento è facilmente riponibil...
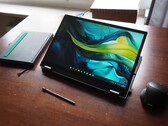
Intel Core Ultra 5 125U | Intel Graphics 4-Core iGPU (Arc) | 13.30" | 1.3 kgRecensione dellAcer Aspire Spin 14: Il folle mondo dei computer portatili 2-in-1
Con Aspire Spin 14, Acer offre un 2-in-1 adatto a diversi scopi. Abbiamo testato a fondo il modello da 14 pollici basato su Intel, riscontrando alcuni punti deb...
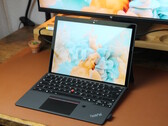
Intel Core Ultra 5 115U | Intel Graphics 4-Core iGPU (Arc) | 14.00" | 1.6 kgRecensione del Lenovo ThinkPad X12 Detachable G2: Il versatile ibrido laptop-tablet per l'uso lavorativo quotidiano
Lenovo ThinkPad X12 G2 business Windows detachable è progettato per essere particolarmente flessibile. Permette agli utenti di lavorare in modalità laptop o sen...
Intel Core Ultra 5 134U | Intel Graphics 4-Core iGPU (Arc) | 12.30" | 1.1 kgRecensione del notebook Lenovo ThinkBook 16 G7 IML: economico ma professionale
Se non ha bisogno di tutte le caratteristiche sofisticate e costose di un ThinkPad tradizionale, il ThinkBook 16 G7 può farle risparmiare un sacco di soldi, sop...
Intel Core Ultra 5 125U | Intel Graphics 4-Core iGPU (Arc) | 16.00" | 1.8 kgLenovo ThinkPad X13 2-in-1 Gen 5: Intel Core Ultra 7 165U, 13.30", 1.3 kg
recensione » Recensione del notebook Lenovo ThinkPad X13 2-in-1 Gen 5: Il successore del convertibile Yoga ad alte prestazioni
Lenovo ThinkPad E14 G6: Intel Core Ultra 7 155U, 14.00", 1.5 kg
recensione » Recensione del portatile Lenovo ThinkPad E14 G6: Risolve molti problemi del modello E14 G5
Lenovo ThinkPad T16 Gen 3 21MN005XGE: Intel Core Ultra 5 125U, 16.00", 2 kg
recensione » Recensione del notebook Lenovo ThinkPad T16 Gen 3: Grande schermo, grande batteria, ma prestazioni non altrettanto buone
Dell Latitude 7450 2-in-1: Intel Core Ultra 7 165U, 14.00", 1.5 kg
recensione » Recensione del portatile 2-in-1 Dell Latitude 7450: Versatile convertibile per il business che offre risultati eccellenti su quasi tutti i fronti
Dell Latitude 7350 Detachable: Intel Core Ultra 7 164U, 13.00", 0.9 kg
recensione » Recensione del Dell Latitude 7350 Detachable: Debutto delle prestazioni del Core Ultra 7 164U
Lenovo ThinkPad T14 G5 21ML005JGE: Intel Core Ultra 7 155U, 14.00", 1.5 kg
recensione » Recensione del portatile Lenovo ThinkPad T14 Gen 5 Intel: La RAM aggiornabile ritorna nella serie T
Lenovo Yoga 7 2-in-1 14IML9: Intel Core Ultra 5 125U, 14.00", 1.6 kg
recensione » Recensione del convertibile Lenovo Yoga 7 2-in-1 14IML9: Di classe per meno di 700 dollari
Lenovo ThinkPad T14s Gen 5 21LS001PGE: Intel Core Ultra 5 125U, 14.00", 1.3 kg
recensione » Recensione del notebook Lenovo ThinkPad T14s Gen 5: Il T-ThinkPad premium con Intel Core Ultra
Dell Latitude 13 7350: Intel Core Ultra 5 135U, 13.30", 1.1 kg
recensione » Recensione del portatile Dell Latitude 13 7350: Debutto delle prestazioni del Core Ultra 5 135U
HP Envy x360 2-in-1 14-fc0078TU: Intel Core Ultra 5 125U, 14.00", 1.4 kg
recensione » Recensione del portatile HP Envy x360 2-in-1 14 (2024): Un'esperienza convertibile quasi premium che ci lascia desiderare di più
Lenovo ThinkPad X1 2in1 G9 21KE004AGE: Intel Core Ultra 7 165U, 14.00", 1.3 kg
recensione » Recensione del Lenovo ThinkPad X1 2in1 G9 - Il convertibile business di fascia alta con OLED a 120 Hz e senza tasti TrackPoint
Lenovo ThinkBook 14 2-in-1 G4 IML: Intel Core Ultra 5 125U, 14.00", 1.6 kg
recensione » Recensione del Lenovo ThinkBook 14 2-in-1 G4 IML: Nuovo look elegante con Meteor Lake-U
Lenovo Yoga 7 2-in-1 16IML9: Intel Core Ultra 5 125U, 16.00", 2.1 kg
recensione » Recensione del convertibile Lenovo Yoga 7 2-in-1 16IML9: Debutto delle prestazioni del Core Ultra 5 125U
Lenovo Yoga Book 9 13IMU9: Intel Core Ultra 7 155U, 13.30", 1.4 kg
recensione » Recensione del Lenovo Yoga Book 9 13IMU9 2-in-1 a doppio schermo: Il Core Ultra 7 155U e l'Arc 4 sono un mix di prodotti
Dell Latitude 9450 2-in-1: Intel Core Ultra 7 165U, 14.00", 1.6 kg
recensione » Recensione di Dell Latitude 9450 2-in-1: Debutto delle prestazioni del Core Ultra 7 165U
Acer Swift Go 14 OLED SFG14-73, Ultra 5 125U: Intel Core Ultra 5 125U, 14.00", 1.3 kg
Recensioni esterne » Acer Swift Go 14 OLED SFG14-73, Ultra 5 125U
Lenovo ThinkPad L13 G5: Intel Core Ultra 5 125U, 13.30", 1.2 kg
Recensioni esterne » Lenovo ThinkPad L13 G5
HP EliteBook 640 G11: Intel Core Ultra 7 155U, 14.00", 1.4 kg
Recensioni esterne » HP EliteBook 640 G11
HP Pavilion 16-af0075ng: Intel Core Ultra 5 125U, 16.00", 1.8 kg
Recensioni esterne » HP Pavilion 16-af0075ng
Lenovo ThinkPad E14 G6: Intel Core Ultra 7 155U, 14.00", 1.5 kg
Recensioni esterne » Lenovo ThinkPad E14 G6
Acer Chromebook Plus Spin 714-1H, Ultra 5 115U: Intel Core Ultra 5 115U, 14.00", 1.5 kg
Recensioni esterne » Acer Chromebook Plus Spin 714-1H, Ultra 5 115U
Asus ExpertBook CX5403, Ultra 5 115U: Intel Core Ultra 5 115U, 14.00", 1.4 kg
Recensioni esterne » Asus ExpertBook CX5403, Ultra 5 115U
Acer Swift Lite 14 AI SFL14-51M, Ultra 5 125U: Intel Core Ultra 5 125U, 14.00", 1.3 kg
Recensioni esterne » Acer Swift Lite 14 AI SFL14-51M, Ultra 5 125U
HP Probook 440 G11: Intel Core Ultra 5 125U, 14.00", 1.4 kg
Recensioni esterne » HP Probook 440 G11
HP Pavilion 16-af0000ng: Intel Core Ultra 5 125U, 16.00", 1.8 kg
Recensioni esterne » HP Pavilion 16-af0000ng
HP EliteBook 830 G11: Intel Core Ultra 7 155U, 13.30", 1.3 kg
Recensioni esterne » HP EliteBook 830 G11
HP EliteBook 840 G11: Intel Core Ultra 7 155U, 14.00", 1.4 kg
Recensioni esterne » HP EliteBook 840 G11
HP EliteBook 660 G11: Intel Core Ultra 7 155U, 16.00", 1.7 kg
Recensioni esterne » HP EliteBook 660 G11
Lenovo ThinkPad T14 G5, Ultra 5 125U: Intel Core Ultra 5 125U, 14.00", 1.4 kg
Recensioni esterne » Lenovo ThinkPad T14 G5, Ultra 5 125U
Lenovo ThinkPad X12 Detachable G2: Intel Core Ultra 5 134U, 12.30", 1.1 kg
Recensioni esterne » Lenovo ThinkPad X12 Detachable G2
Acer TravelMate P4 Spin 14 TMP414RN-54: Intel Core Ultra 5 125U, 14.00", 1.5 kg
Recensioni esterne » Acer TravelMate P4 Spin 14 TMP414RN-54
Lenovo ThinkPad T16 Gen 3 21MN005XGE: Intel Core Ultra 5 125U, 16.00", 2 kg
Recensioni esterne » Lenovo ThinkPad T16 Gen 3 21MN005XGE
Lenovo ThinkBook 14 G7 IML, Ultra 5 125U: Intel Core Ultra 5 125U, 14.00", 1.4 kg
Recensioni esterne » Lenovo ThinkBook 14 G7 IML, Ultra 5 125U
HP ProBook 460 G11: Intel Core Ultra 5 125U, 16.00", 1.7 kg
Recensioni esterne » HP ProBook 460 G11
Lenovo ThinkPad L14 G5: Intel Core Ultra 7 155U, 14.00", 1.4 kg
Recensioni esterne » Lenovo ThinkPad L14 G5
HP EliteBook 860 G11: Intel Core Ultra 7 155U, 16.00", 1.7 kg
Recensioni esterne » HP EliteBook 860 G11
Acer Swift Lite 14 AI SFL14-51M: Intel Core Ultra 7 155U, 14.00", 1.3 kg
Recensioni esterne » Acer Swift Lite 14 AI SFL14-51M
Dell Latitude 7450 2-in-1: Intel Core Ultra 7 155U, 14.00", 1.1 kg
Recensioni esterne » Dell Latitude 7450 2-in-1
Asus ExpertBook CX5403, Ultra 5 125U: Intel Core Ultra 5 125U, 14.00", 1.4 kg
Recensioni esterne » Asus ExpertBook CX5403, Core 5 125U
Lenovo ThinkBook 14 2-in-1 G4 IML, Ultra 7 155U: Intel Core Ultra 7 155U, 14.00", 1.6 kg
Recensioni esterne » Lenovo ThinkBook 14 2-in-1 G4 IML, Ultra 7 155U
Lenovo ThinkPad L16 G1, Ultra 5 125U: Intel Core Ultra 5 125U, 16.00", 1.8 kg
Recensioni esterne » Lenovo ThinkPad L16 G1, Ultra 5 125U
HP Pavilion 16-af0000: Intel Core Ultra 7 155U, 16.00", 1.8 kg
Recensioni esterne » HP Pavilion 16-af0000
Asus ExpertBook B5404CMA: Intel Core Ultra 7 155U, 14.00", 1.4 kg
Recensioni esterne » Asus ExpertBook B5404CMA
Asus Zenbook S 13 UX5304MA: Intel Core Ultra 7 155U, 13.30", 1 kg
Recensioni esterne » Asus Zenbook S 13 UX5304MA
Lenovo ThinkPad X13 2-in-1 G5: Intel Core Ultra 7 155U, 13.30", 1.3 kg
Recensioni esterne » Lenovo ThinkPad X13 2-in-1 G5
Lenovo ThinkPad T14 G5 21ML005JGE: Intel Core Ultra 7 155U, 14.00", 1.5 kg
Recensioni esterne » Lenovo ThinkPad T14 G5 21ML005JGE
Dell Latitude 5450: Intel Core Ultra 7 155U, 14.00", 1.4 kg
Recensioni esterne » Dell Latitude 5450
Dell Latitude 5550: Intel Core Ultra 7 155U, 15.60", 1.6 kg
Recensioni esterne » Dell Latitude 5550
Dell Latitude 9450 2-in-1: Intel Core Ultra 7 165U, 14.00", 1.6 kg
Recensioni esterne » Dell Latitude 9450 2-in-1
Asus ExpertBook CX5403: Intel Core Ultra 7 155U, 14.00", 1.4 kg
Recensioni esterne » Asus ExpertBook CX5403
Dell Latitude 7350 Detachable 2024: Intel Core Ultra 7 164U, 13.30", 0.9 kg
Recensioni esterne » Dell Latitude 7350 Detachable 2024
Dell Latitude 13 7350, Ultra 7 165U: Intel Core Ultra 7 165U, 13.30", 1.3 kg
Recensioni esterne » Dell Latitude 13 7350, Ultra 7 165U
Lenovo ThinkBook 14 2-in-1 G4 IML: Intel Core Ultra 5 125U, 14.00", 1.6 kg
Recensioni esterne » Lenovo ThinkBook 14 2-in-1 G4 IML
Acer Aspire Vero AV16-51P, Ultra 5 125U: Intel Core Ultra 5 125U, 16.00", 1.8 kg
Recensioni esterne » Acer Aspire Vero AV16-51P, Ultra 5 125U
Dell Latitude 7450: Intel Core Ultra 7 165U, 14.00", 1.5 kg
Recensioni esterne » Dell Latitude 7450
Acer Chromebook Plus Spin 714-1H: Intel Core Ultra 5 125U, 14.00", 1.5 kg
Recensioni esterne » Acer Chromebook Plus Spin 714-1H
Dell Latitude 13 7350: Intel Core Ultra 5 135U, 13.30", 1.1 kg
Recensioni esterne » Dell Latitude 13 7350
Lenovo ThinkPad X1 2in1 G9 21KE004AGE: Intel Core Ultra 7 165U, 14.00", 1.3 kg
Recensioni esterne » Lenovo ThinkPad X1 2in1 G9 21KE004AGE
HP Envy x360 14-fc: Intel Core Ultra 7 155U, 14.00", 1.4 kg
Recensioni esterne » HP Envy x360 14-fc
Asus ZenBook S13 OLED UX5304MA: Intel Core Ultra 7 155U, 13.30", 1 kg
Recensioni esterne » Asus ZenBook S13 OLED UX5304MA
Lenovo Yoga 7 16IML9: Intel Core Ultra 5 125U, 16.00", 2 kg
Recensioni esterne » Lenovo Yoga 7 16IML9
Microsoft Surface Pro 10: Intel Core Ultra 5 135U, 13.00", 0.9 kg
Recensioni esterne » Microsoft Surface Pro 10
Lenovo Yoga Book 9 13IMU9: Intel Core Ultra 7 155U, 13.30", 1.4 kg
Recensioni esterne » Lenovo Yoga Book 9 13IMU9
HP Envy x360 14-fc0000: Intel Core Ultra 5 125U, 14.00", 1.4 kg
Recensioni esterne » HP Envy x360 14-fc0000
Lenovo ThinkBook 14 IML G4: Intel Core Ultra 5 125U, 14.00", 1.6 kg
Recensioni esterne » Lenovo ThinkBook 14 IML G4
Acer Aspire Vero AV16-51P: Intel Core Ultra 7 155U, 16.00", 1.8 kg
Recensioni esterne » Acer Aspire Vero AV16-51P
Lenovo ThinkPad T14 G5 21ML005JGE: Intel Core Ultra 7 155U, 14.00", 1.5 kg
» Lenovo ThinkPad T14 G5: un portatile business quasi perfetto