

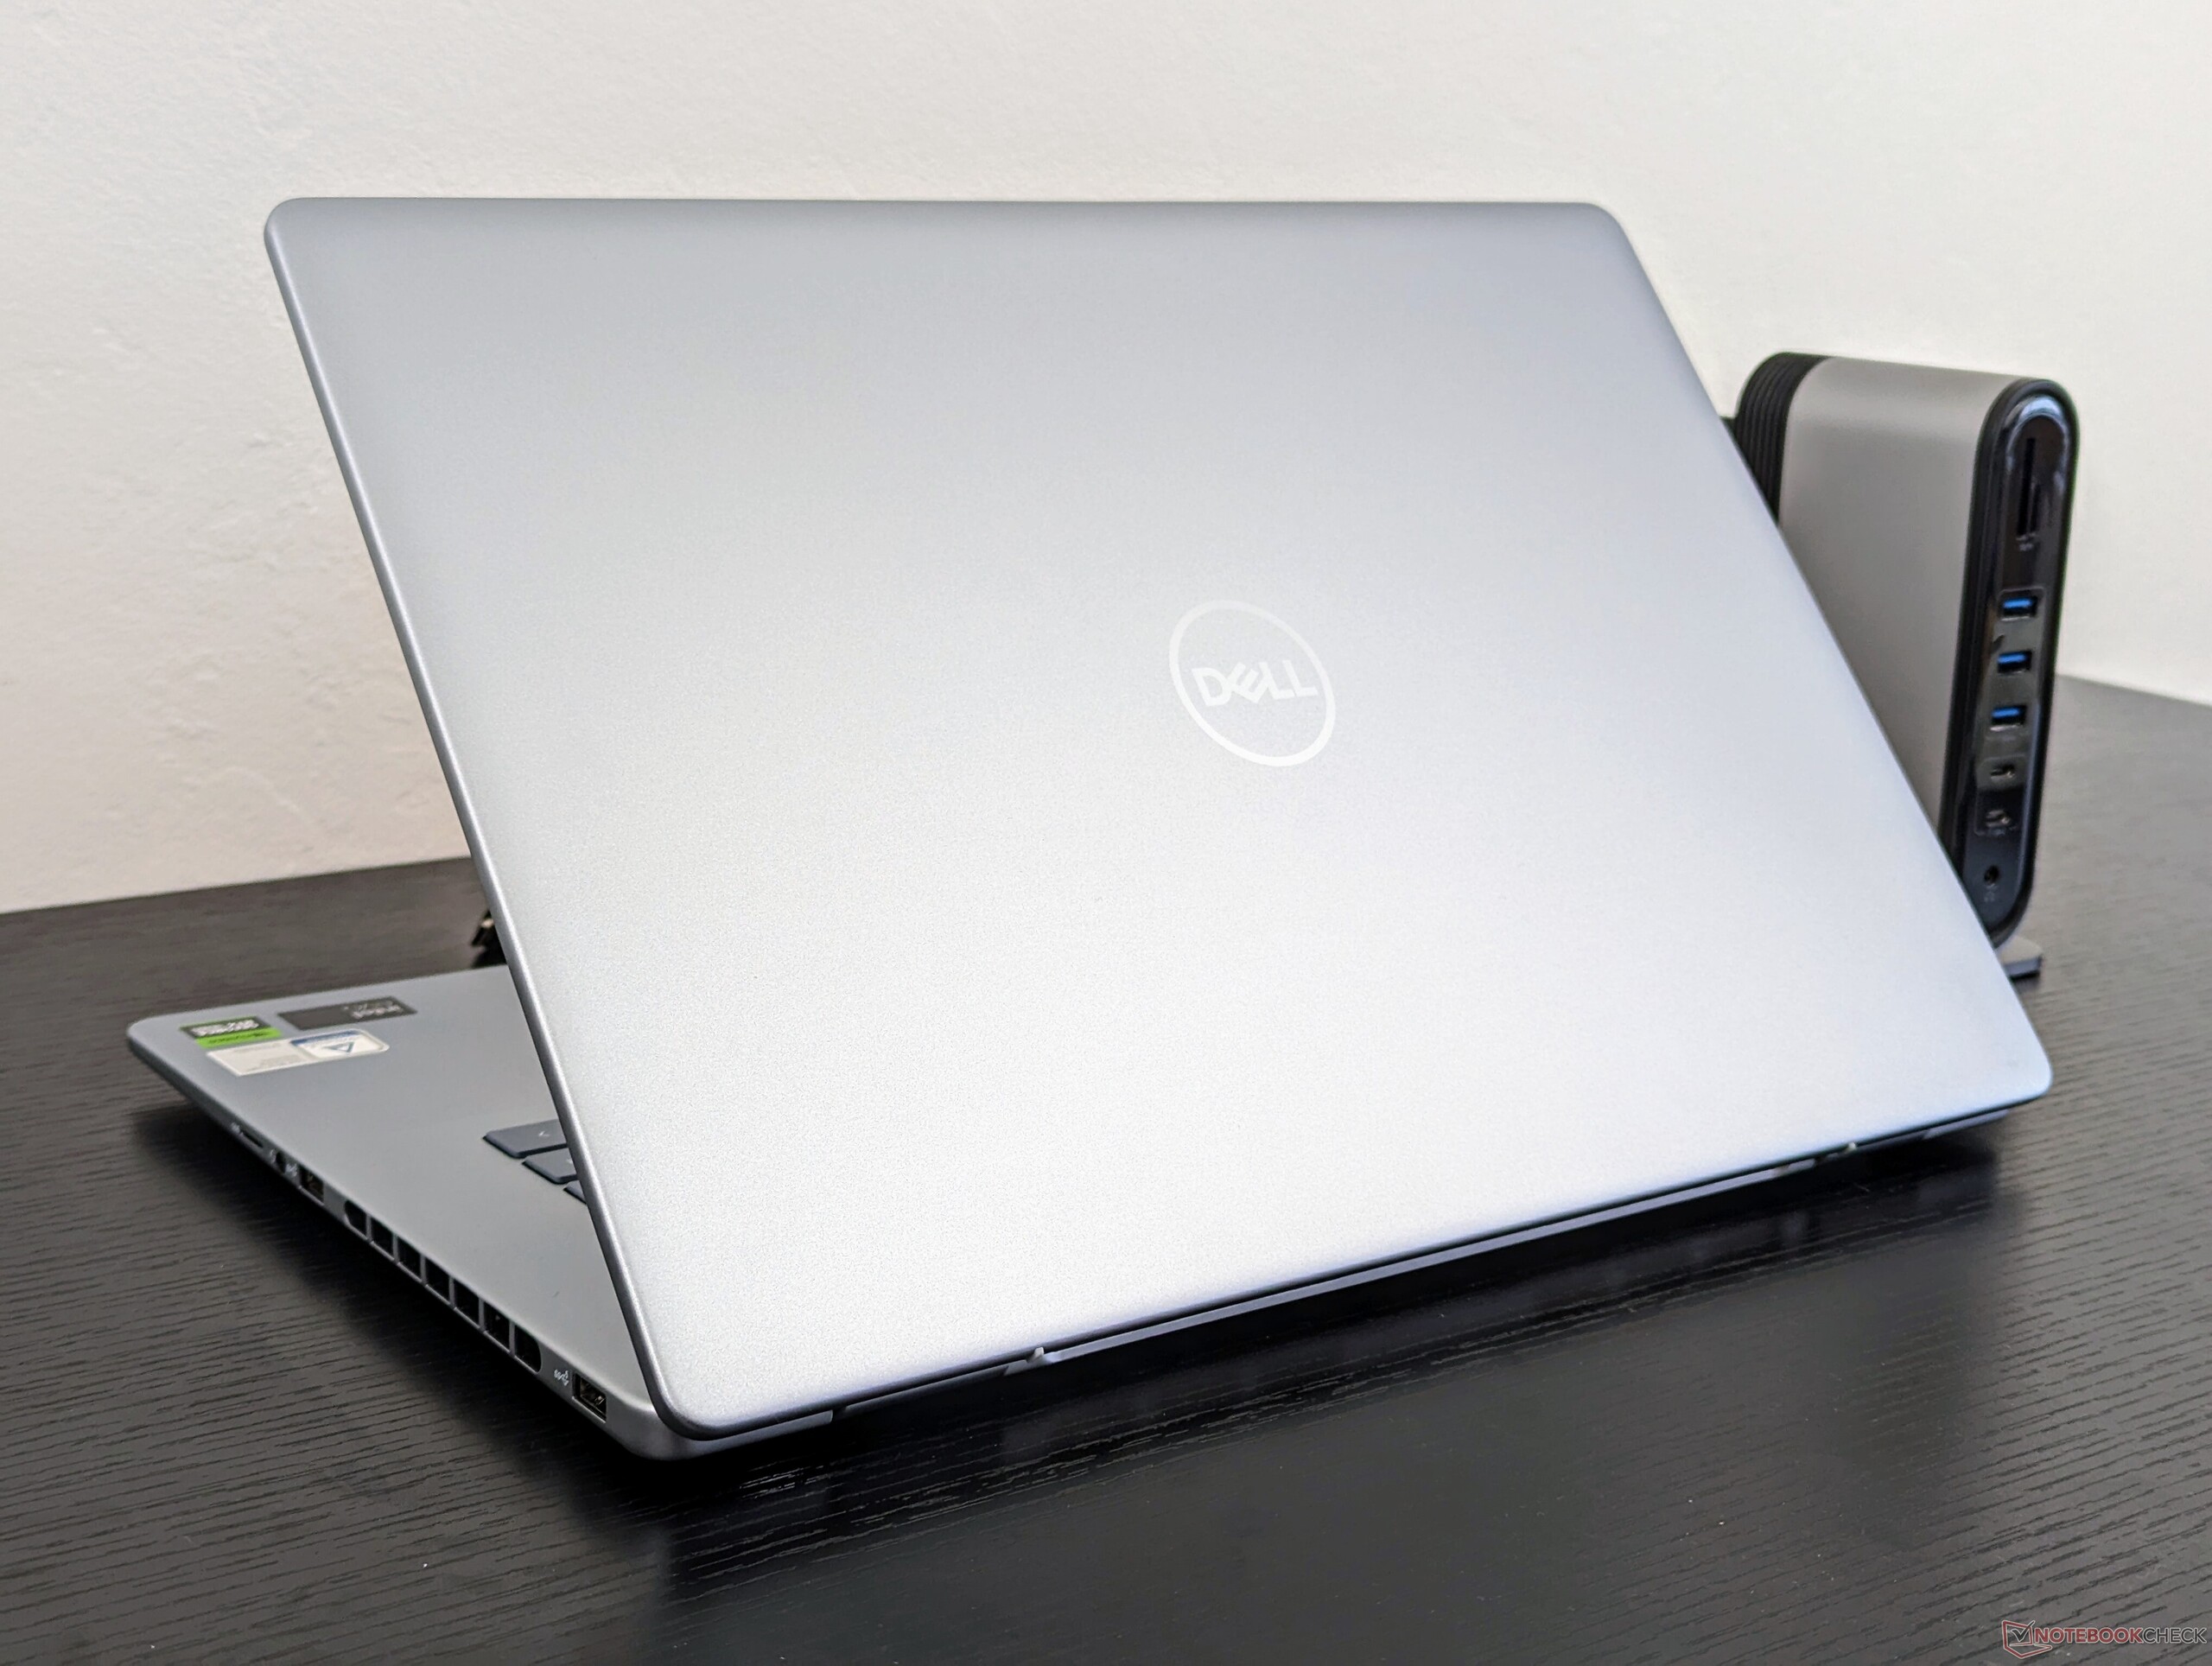
Recensione del laptop Dell Inspiron 16 Plus 7640: Piccoli ma importanti cambiamenti rispetto al modello dello scorso anno

L'Inspiron 16 Plus 7640, dal nome appropriato, sostituisce l'Inspiron 16 Plus 7630 del 2023 con nuovi processori pronti per l'AI invece delle opzioni Raptor Lake-H dello scorso anno. A parte alcune altre modifiche minori all'interno e all'esterno, il modello è in gran parte identico al suo predecessore e quindi consigliamo di consultare la nostra recensione dell'Inspiron 15 Plus 7630 per saperne di più sulle caratteristiche fisiche dell'Inspiron 15 Plus 7640.
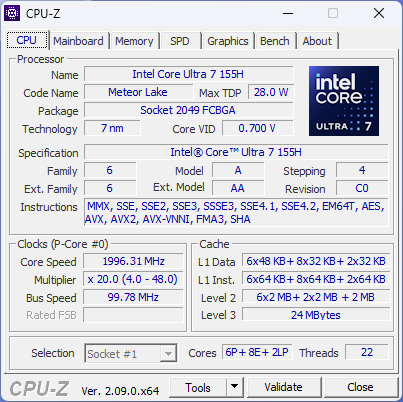
L'Inspiron 16 Plus 7640 è disponibile in molte configurazioni che vanno dal Core i7-13620H di 13esima generazione al Core Ultra 9 185H di 14esima generazione, dalla grafica UHD o Arc integrata alla discreta GeForce RTX 4060, e opzioni di display a 1200p o 1600p. Sono disponibili anche SKU AMD Zen 4 con Ryzen 5 8540U o Ryzen 7 8840U, ma solo per il modello Inspiron 16 7640 non-Plus, senza grafica discreta o opzione 1600p. La nostra unità di prova è una configurazione di fascia alta con Core Ultra 7 155H, display a 1600p e grafica RTX 4060 per circa 1300 dollari al dettaglio.
I concorrenti includono altri computer portatili multimediali da 16 pollici di fascia media, come l' Asus VivoBook Pro 16, Lenovo Yoga 7 2-in-1 16IML9o la serie HP Envy 16.
Altre recensioni di Dell:
Potenziali concorrenti a confrontos
Punteggio | Data | Modello | Peso | Altezza | Dimensione | Risoluzione | Prezzo |
|---|---|---|---|---|---|---|---|
| 83.4 % | 06/2024 | Dell Inspiron 16 Plus 7640 Ultra 7 155H, NVIDIA GeForce RTX 4060 Laptop GPU | 2.2 kg | 19.9 mm | 16.00" | 2560x1600 | |
| 87.1 % v7 (old) | 08/2023 | Dell Inspiron 16 Plus 7630 i7-13700H, NVIDIA GeForce RTX 4060 Laptop GPU | 2.2 kg | 19.95 mm | 16.00" | 2560x1600 | |
| 87.4 % v7 (old) | 08/2022 | Dell Inspiron 16 Plus 7620 i7-12700H, GeForce RTX 3050 Ti Laptop GPU | 2.1 kg | 18.99 mm | 16.00" | 3072x1920 | |
| 90.4 % v7 (old) | 03/2024 | Samsung Galaxy Book4 Ultra Ultra 7 155H, NVIDIA GeForce RTX 4050 Laptop GPU | 1.8 kg | 17 mm | 16.00" | 2880x1800 | |
| 89.1 % v7 (old) | 02/2024 | Lenovo Legion 5 16IRX G9 i7-14650HX, NVIDIA GeForce RTX 4060 Laptop GPU | 2.4 kg | 25.2 mm | 16.00" | 2560x1600 | |
| 87.6 % v7 (old) | 11/2023 | Asus VivoBook Pro 16 K6602VU i9-13900H, NVIDIA GeForce RTX 4050 Laptop GPU | 1.9 kg | 19 mm | 16.00" | 3200x2000 |
Caso - Più bocchette e più grandi
Il modello dispone di un nuovo tasto Co-Pilot dedicato che sostituisce il tasto Ctrl sulla metà destra della tastiera. L'area del palm rest è più piatta, il perimetro della base è più rotondo e le griglie di ventilazione lungo la parte posteriore e i lati sono state ridisegnate per essere più grandi di prima. I materiali del telaio e le porte sono rimasti invariati per una prima impressione e dimensioni simili.
Lettore di schede SD
| SD Card Reader | |
| average JPG Copy Test (av. of 3 runs) | |
| Asus VivoBook Pro 16 K6602VU (Angelbird AV Pro V60) | |
| Samsung Galaxy Book4 Ultra (Angelbird AV Pro V60) | |
| Lenovo Legion 5 16IRX G9 | |
| Dell Inspiron 16 Plus 7620 (Toshiba Exceria Pro SDXC 64 GB UHS-II) | |
| Dell Inspiron 16 Plus 7640 (Angelbird AV Pro V60) | |
| Dell Inspiron 16 Plus 7630 (AV Pro SD microSD 128 GB V60) | |
| maximum AS SSD Seq Read Test (1GB) | |
| Asus VivoBook Pro 16 K6602VU (Angelbird AV Pro V60) | |
| Samsung Galaxy Book4 Ultra (Angelbird AV Pro V60) | |
| Lenovo Legion 5 16IRX G9 | |
| Dell Inspiron 16 Plus 7640 (Angelbird AV Pro V60) | |
| Dell Inspiron 16 Plus 7620 (Toshiba Exceria Pro SDXC 64 GB UHS-II) | |
| Dell Inspiron 16 Plus 7630 (AV Pro SD microSD 128 GB V60) | |
Comunicazione
| Networking | |
| iperf3 transmit AXE11000 | |
| Samsung Galaxy Book4 Ultra | |
| Asus VivoBook Pro 16 K6602VU | |
| Lenovo Legion 5 16IRX G9 | |
| Dell Inspiron 16 Plus 7630 | |
| Dell Inspiron 16 Plus 7640 | |
| iperf3 receive AXE11000 | |
| Samsung Galaxy Book4 Ultra | |
| Asus VivoBook Pro 16 K6602VU | |
| Lenovo Legion 5 16IRX G9 | |
| Dell Inspiron 16 Plus 7630 | |
| Dell Inspiron 16 Plus 7640 | |
| iperf3 transmit AXE11000 6GHz | |
| Dell Inspiron 16 Plus 7630 | |
| Asus VivoBook Pro 16 K6602VU | |
| Dell Inspiron 16 Plus 7620 | |
| Dell Inspiron 16 Plus 7640 | |
| iperf3 receive AXE11000 6GHz | |
| Asus VivoBook Pro 16 K6602VU | |
| Dell Inspiron 16 Plus 7630 | |
| Dell Inspiron 16 Plus 7620 | |
| Dell Inspiron 16 Plus 7640 | |
Webcam
Descriva la qualità della webcam, aggiunga le immagini del grafico di prova.


Manutenzione
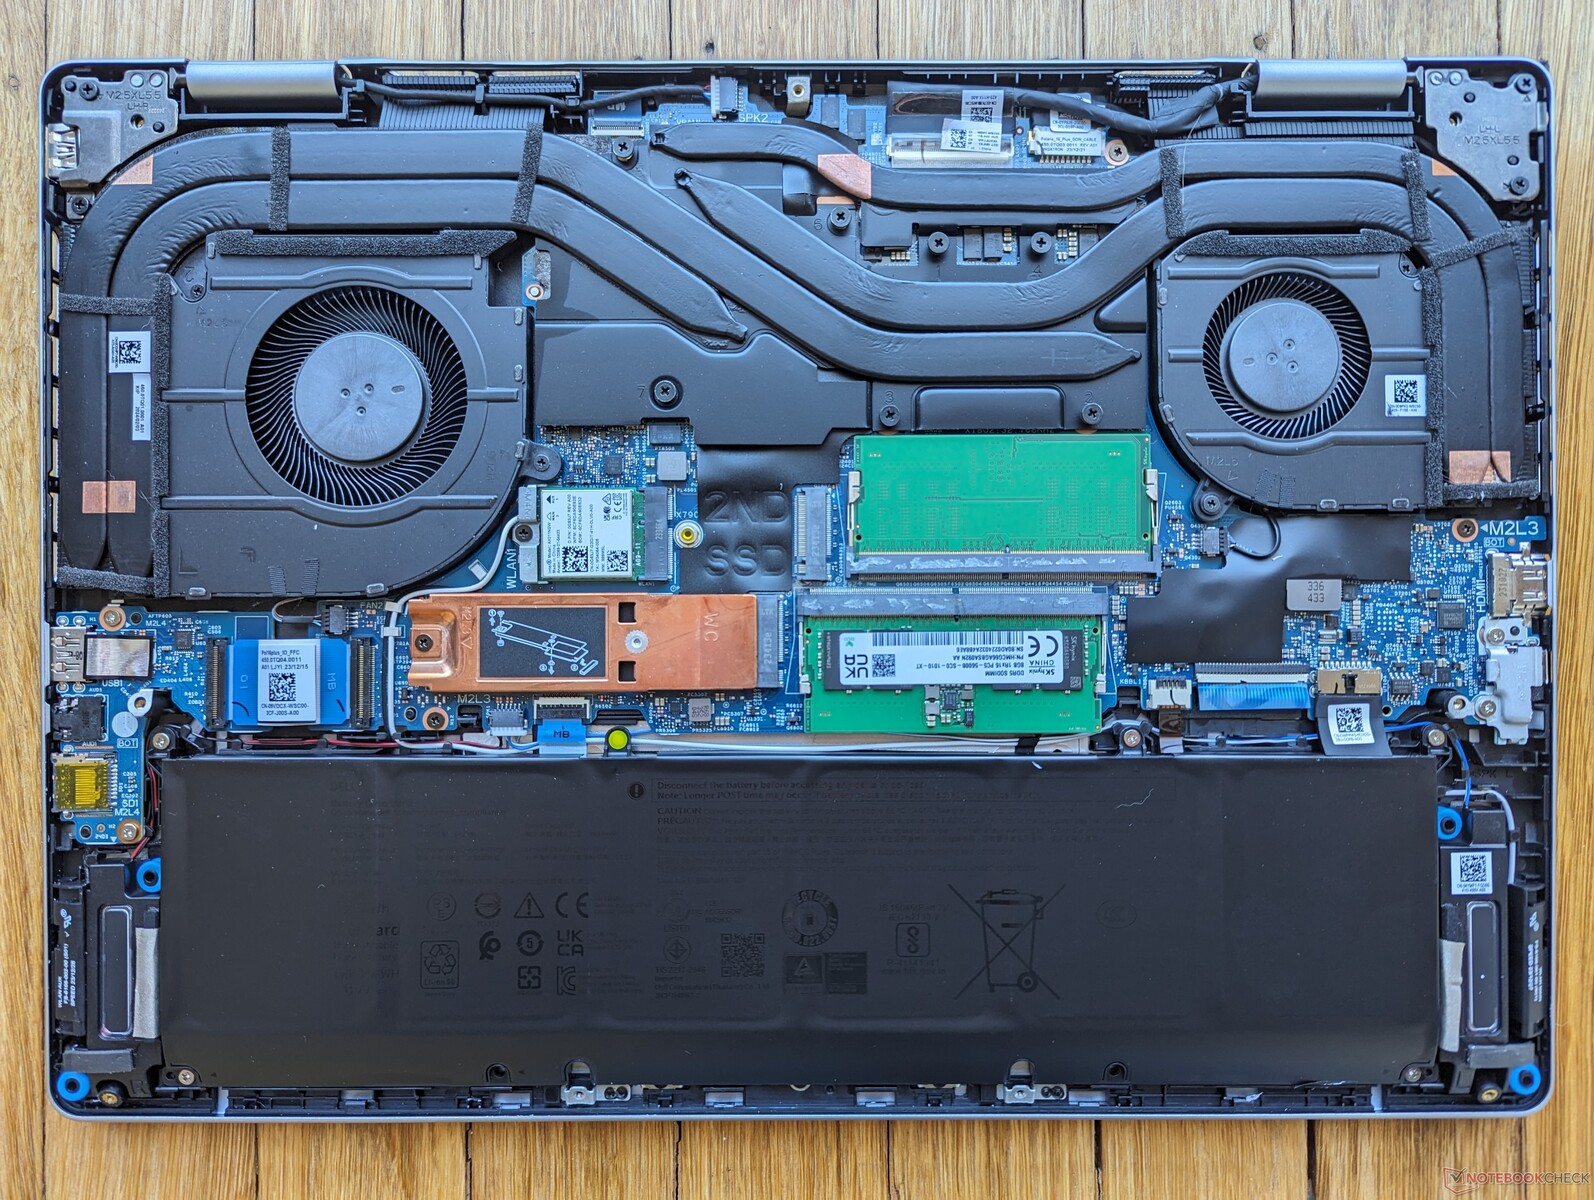
Aprendo il sistema si nota una differenza importante rispetto al suo immediato predecessore: il supporto per un'unità SSD secondaria M.2 2230. Per il resto, tutto sembra essere per lo più identico all'Inspiron 16 Plus 7630, come mostrano le immagini qui sotto.

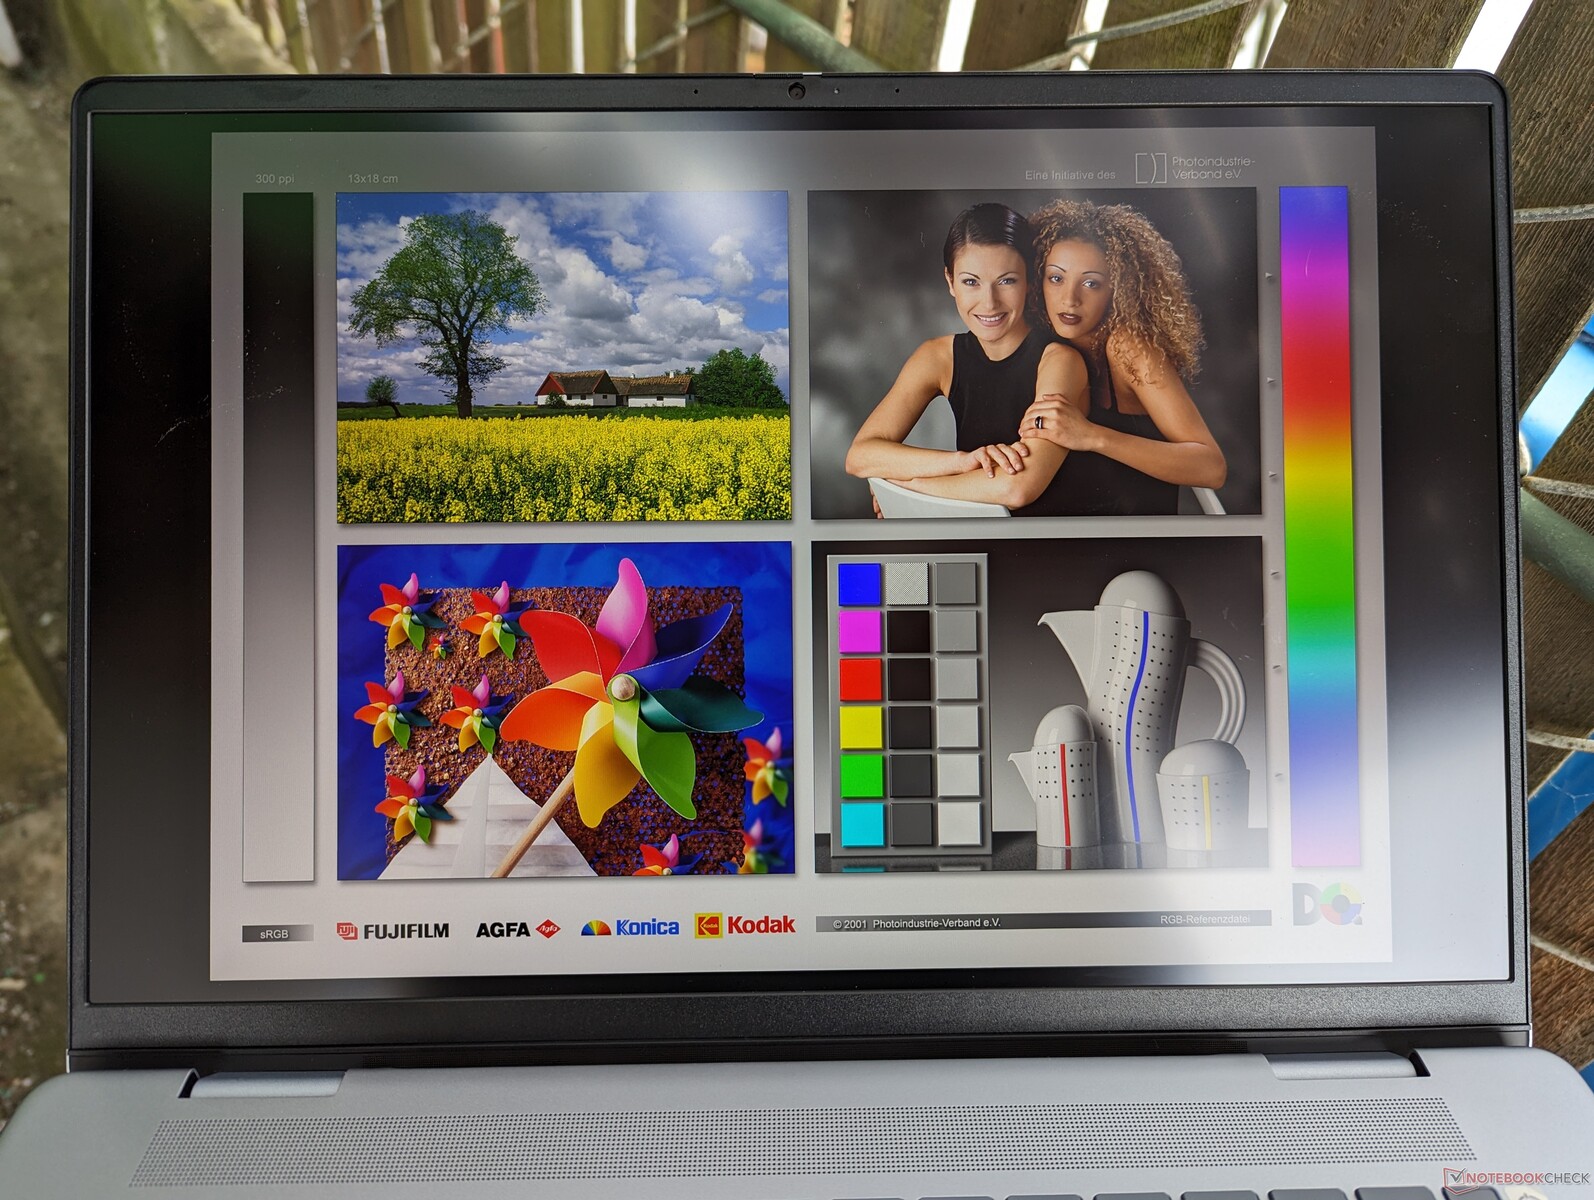
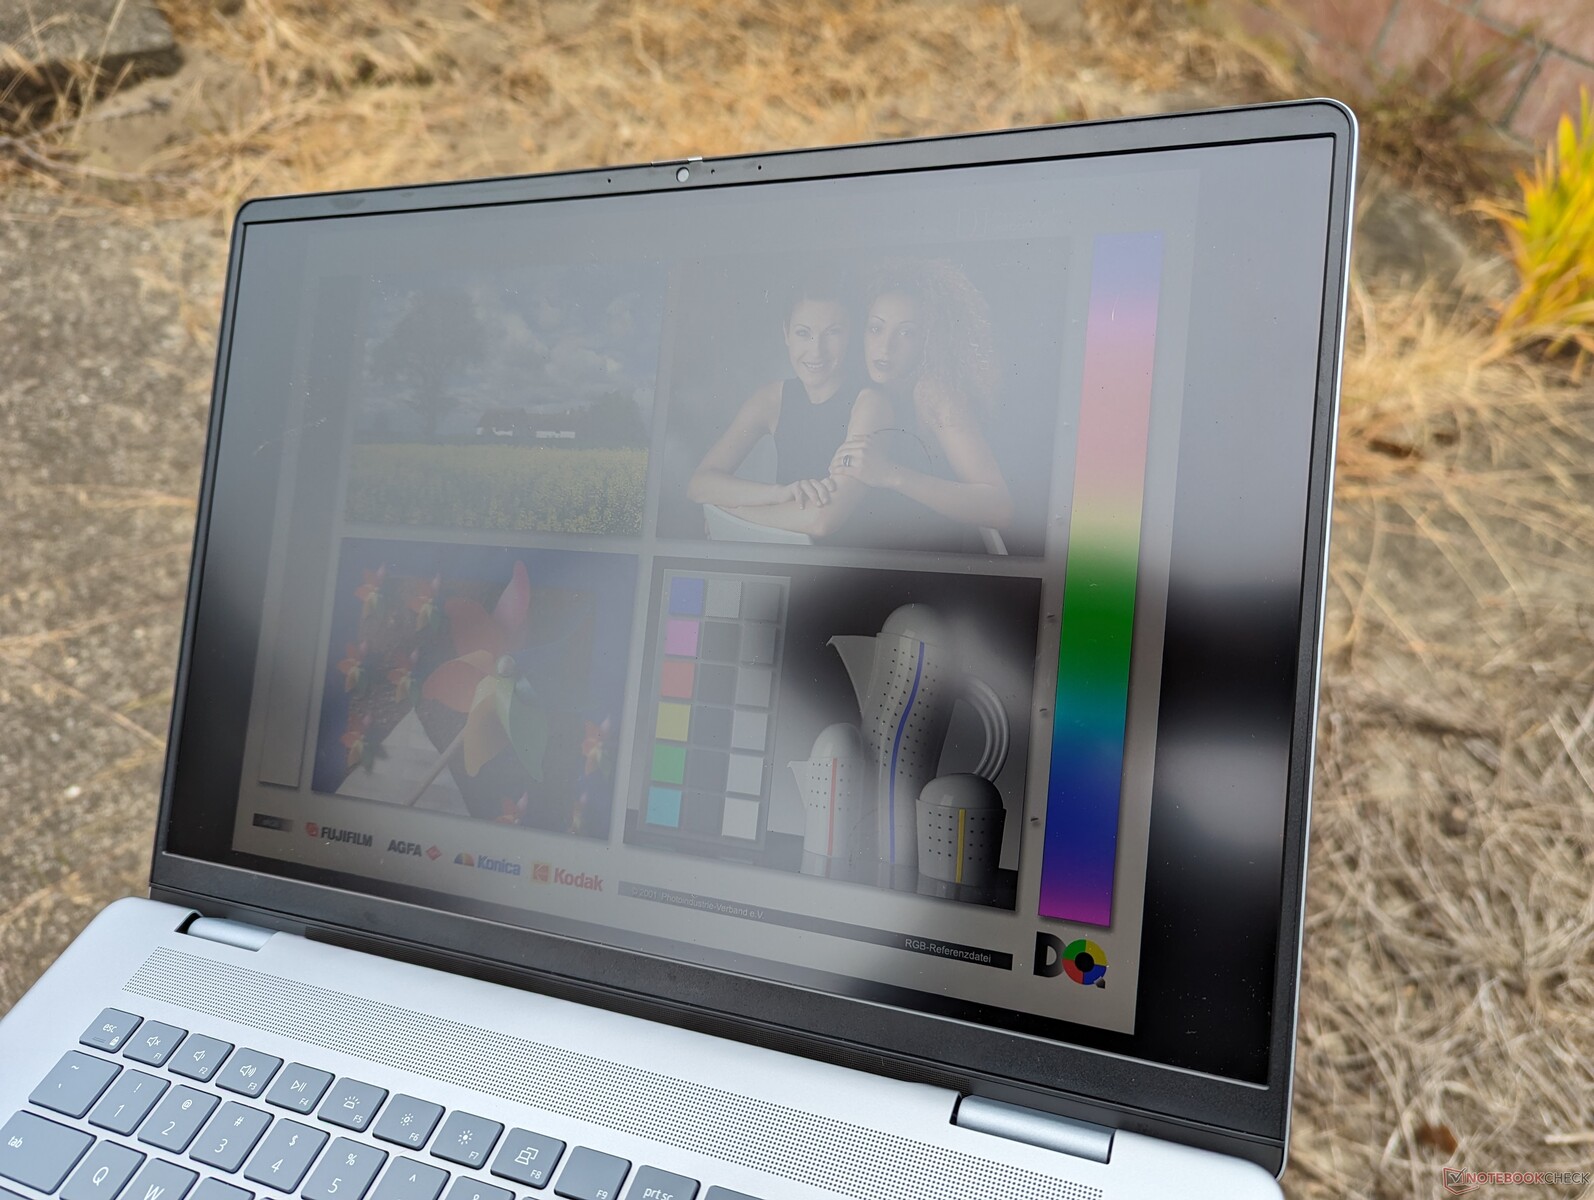
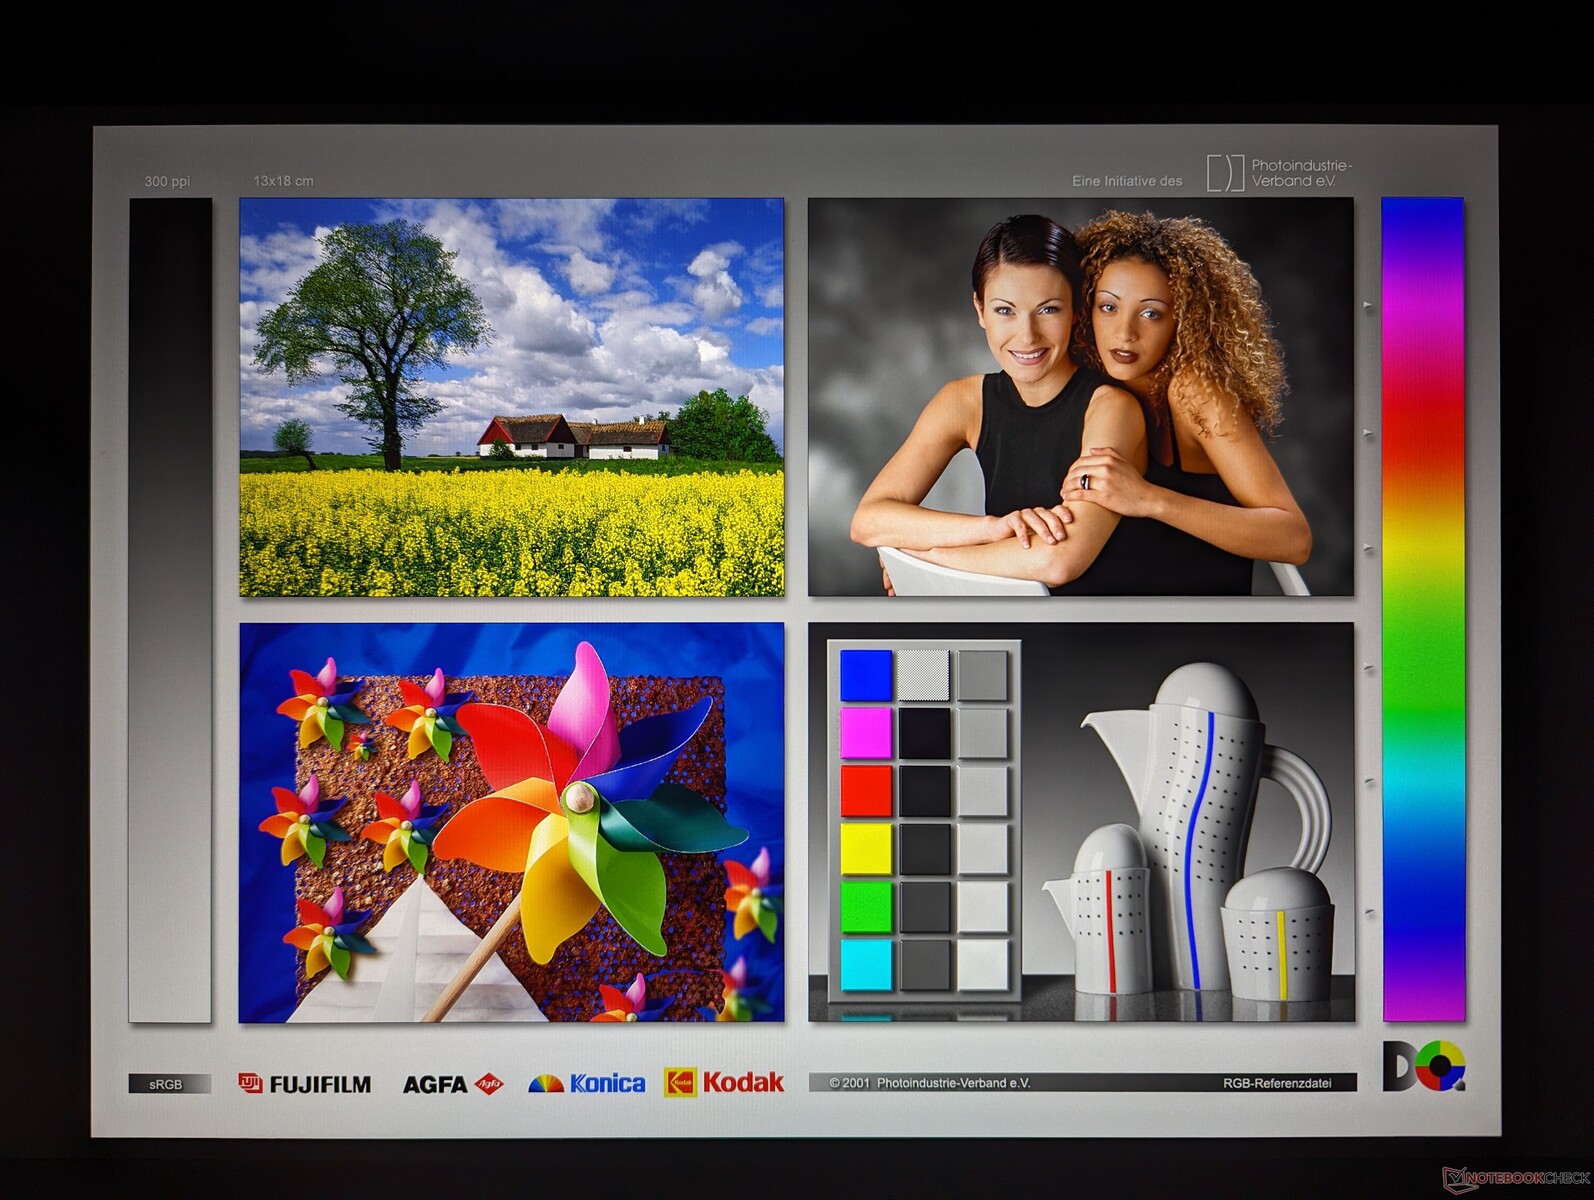
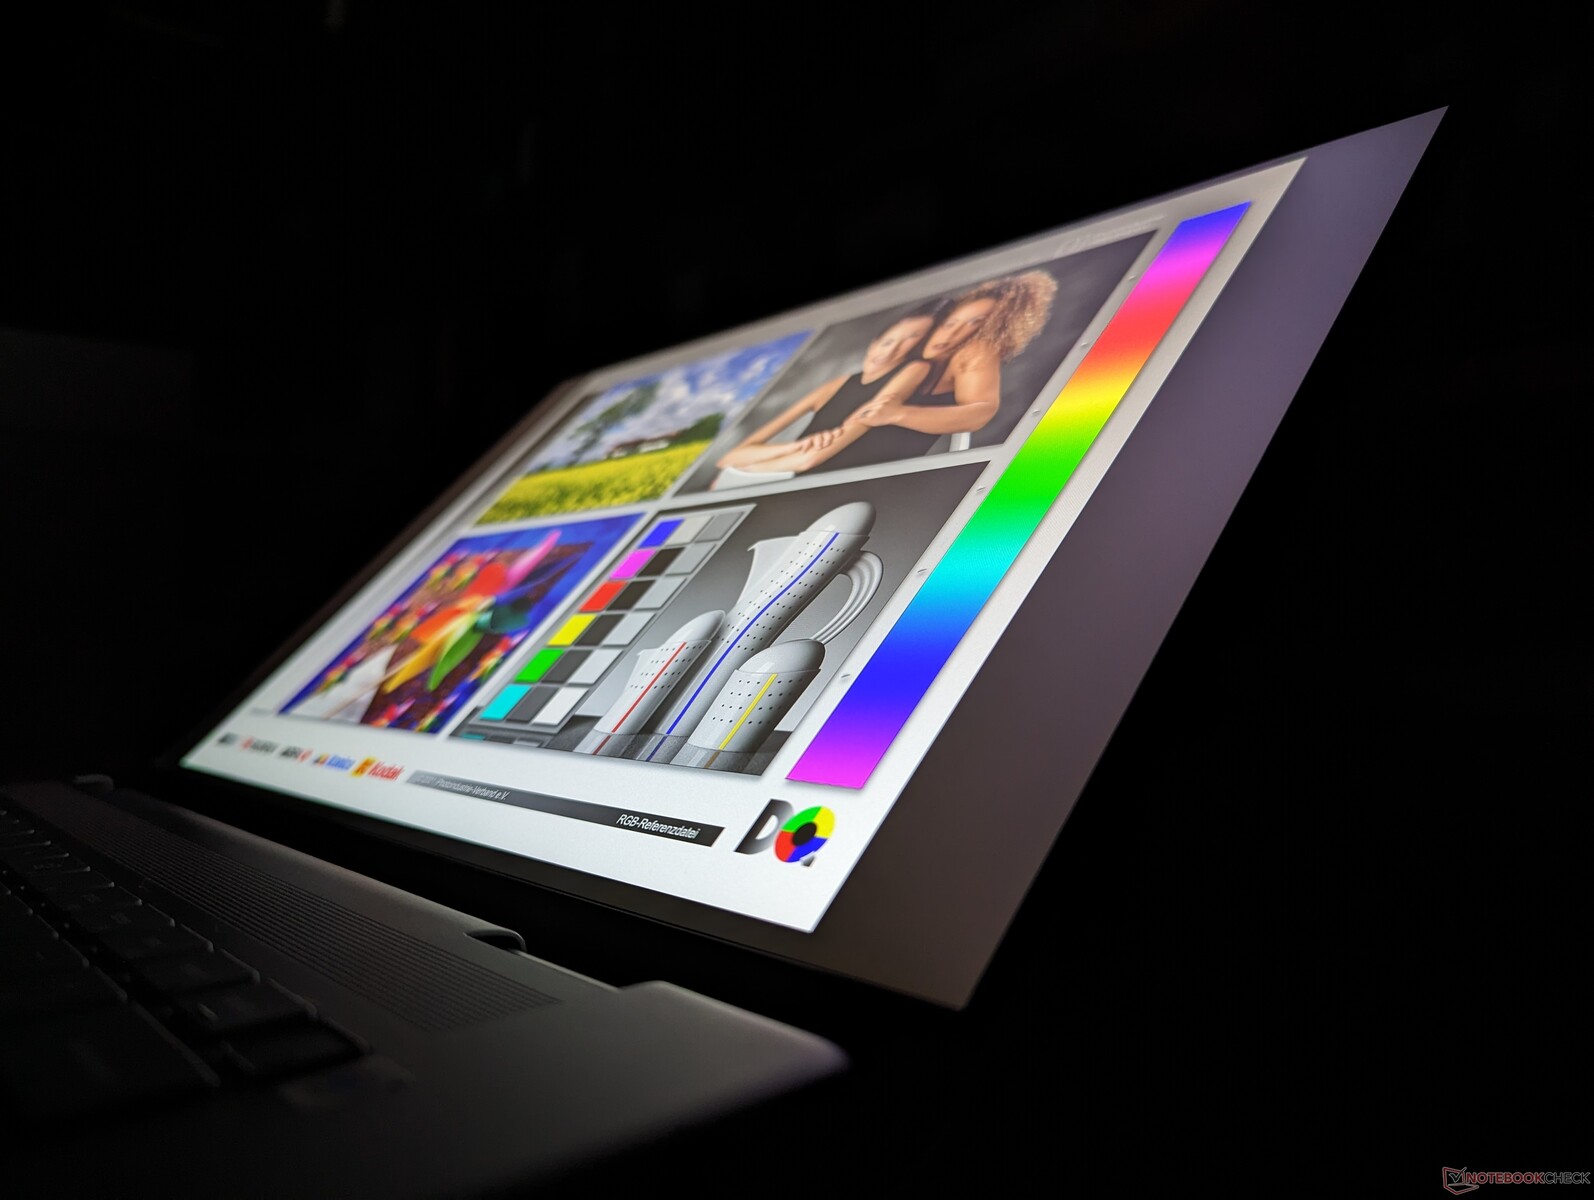
Display - Opzioni FHD+ e QHD+
Sono disponibili due opzioni di visualizzazione, come segue:
- 1920 x 1200, 60 Hz, Touchscreen, Lucido
- 2560 x 1600, 120 Hz, non touchscreen, opaco
La nostra unità viene fornita con il pannello in grassetto qui sopra. Si noti che la pagina ufficiale del prodotto di Dell elenca erroneamente 60 Hz per il pannello 1600p al momento in cui scriviamo; possiamo confermare che questo pannello supporta frequenze di aggiornamento native di 120 Hz e 48 Hz, senza supporto G-Sync, proprio come nell'Inspiron 16 Plus 7630 dello scorso anno.
È interessante notare che Dell ha sostituito i fornitori di pannelli da LG Philips ad AU Optronics per l'Inspiron 16 Plus 7640 di quest'anno. Il nuovo pannello offre tempi di risposta più rapidi per ridurre al minimo il ghosting, pur offrendo colori sRGB, livelli di luminosità e rapporti di contrasto simili a quelli precedenti.
| |||||||||||||||||||||||||
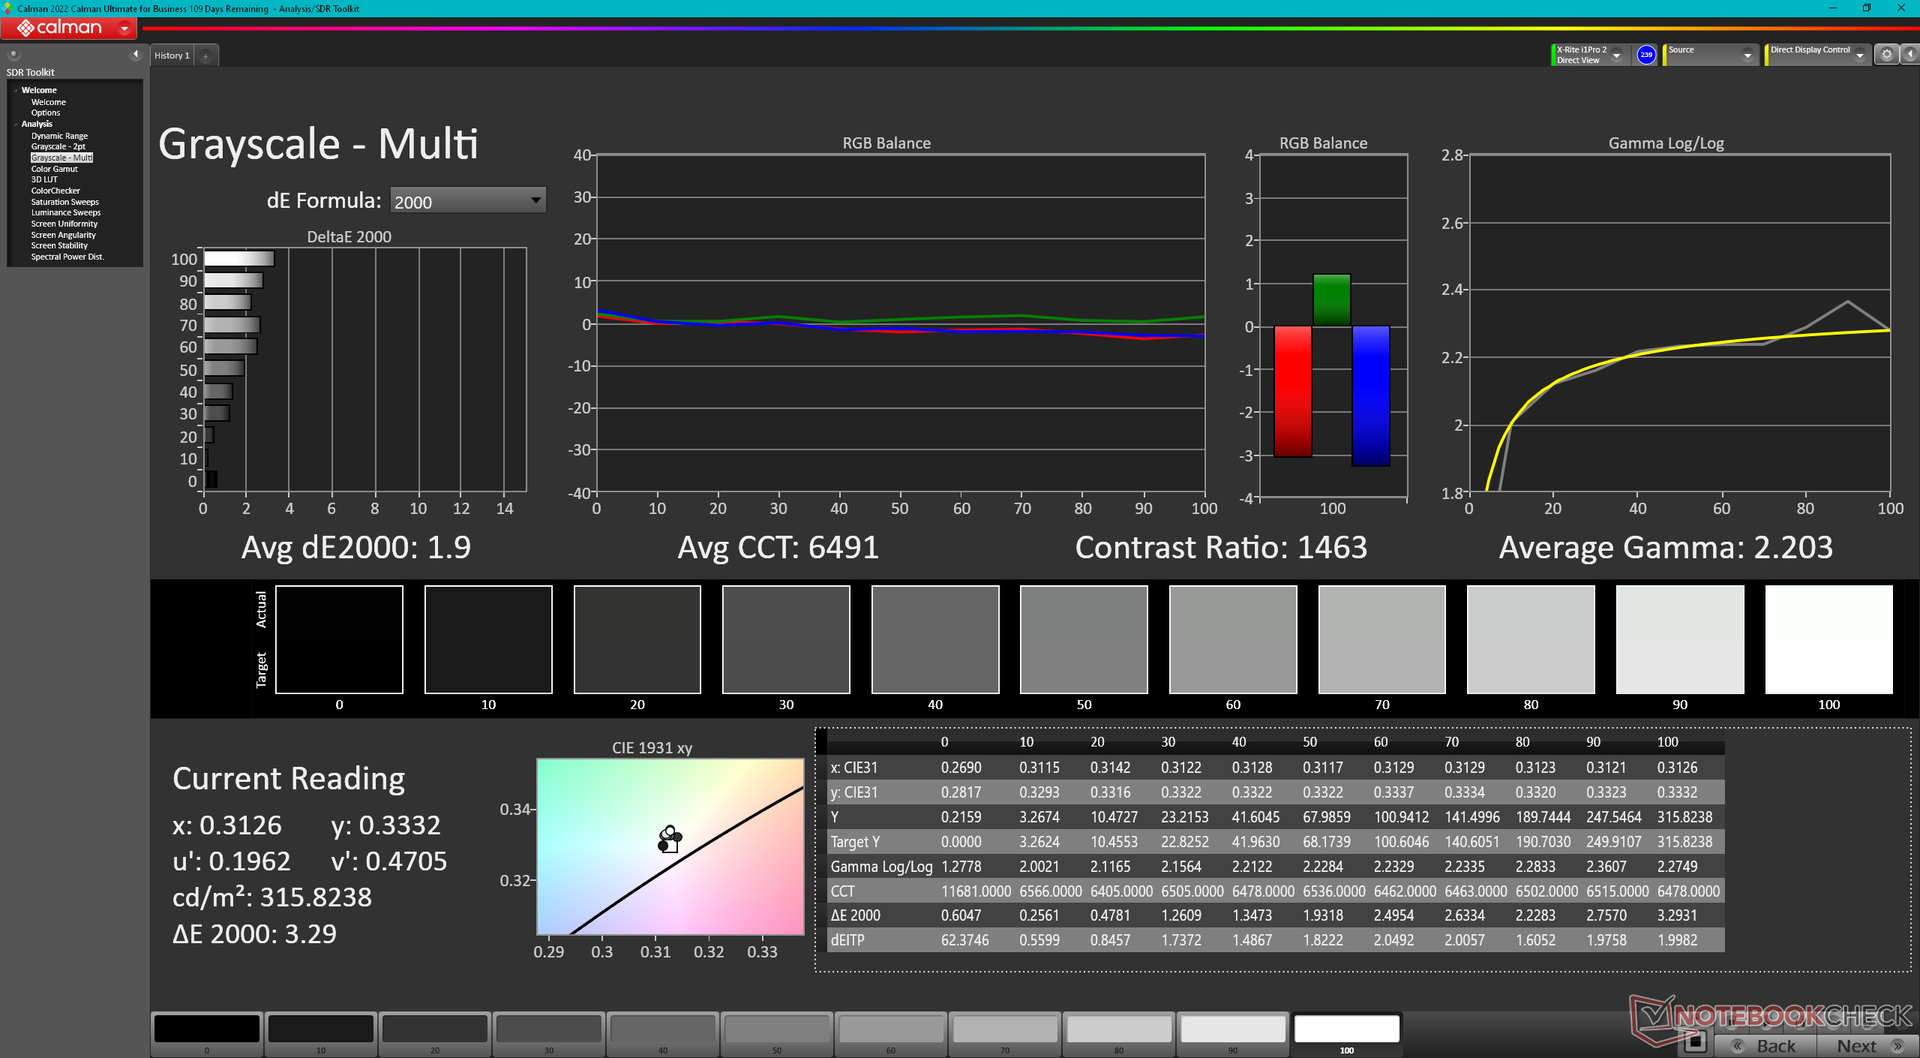
Distribuzione della luminosità: 89 %
Al centro con la batteria: 314.7 cd/m²
Contrasto: 1124:1 (Nero: 0.28 cd/m²)
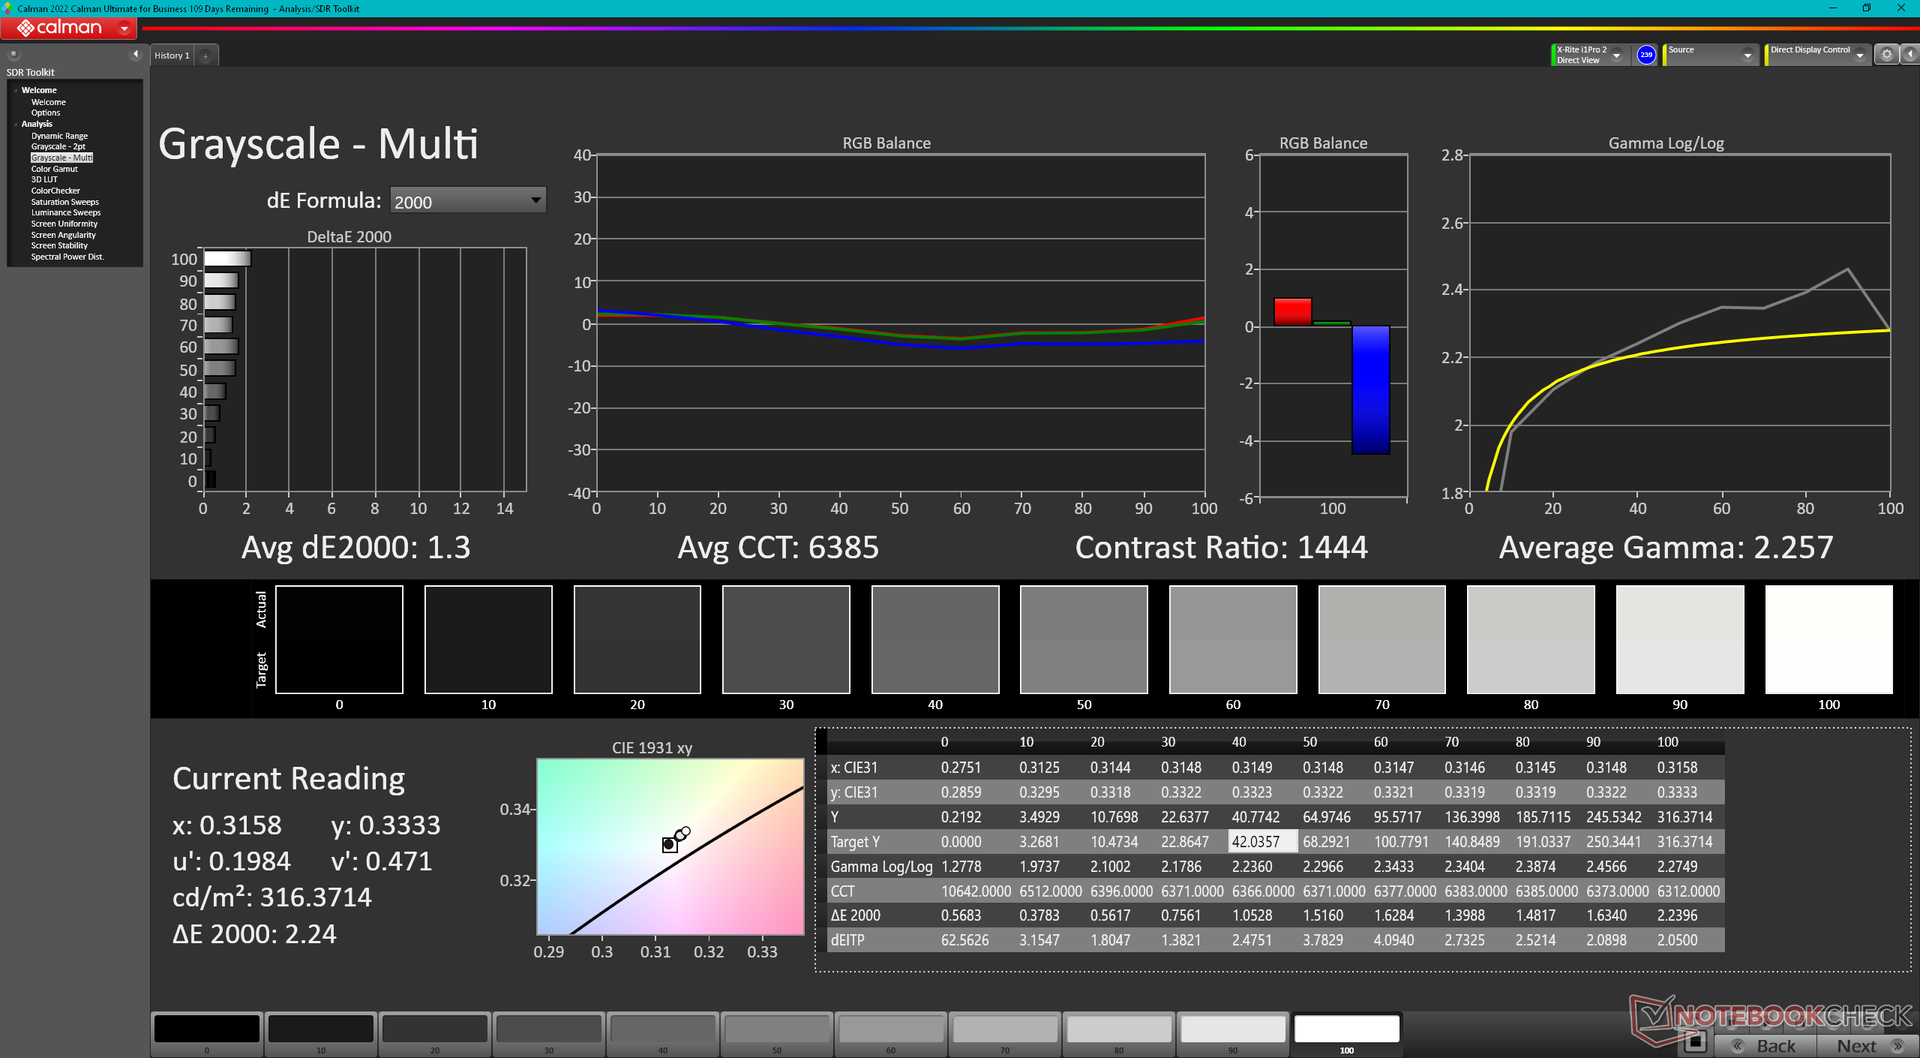
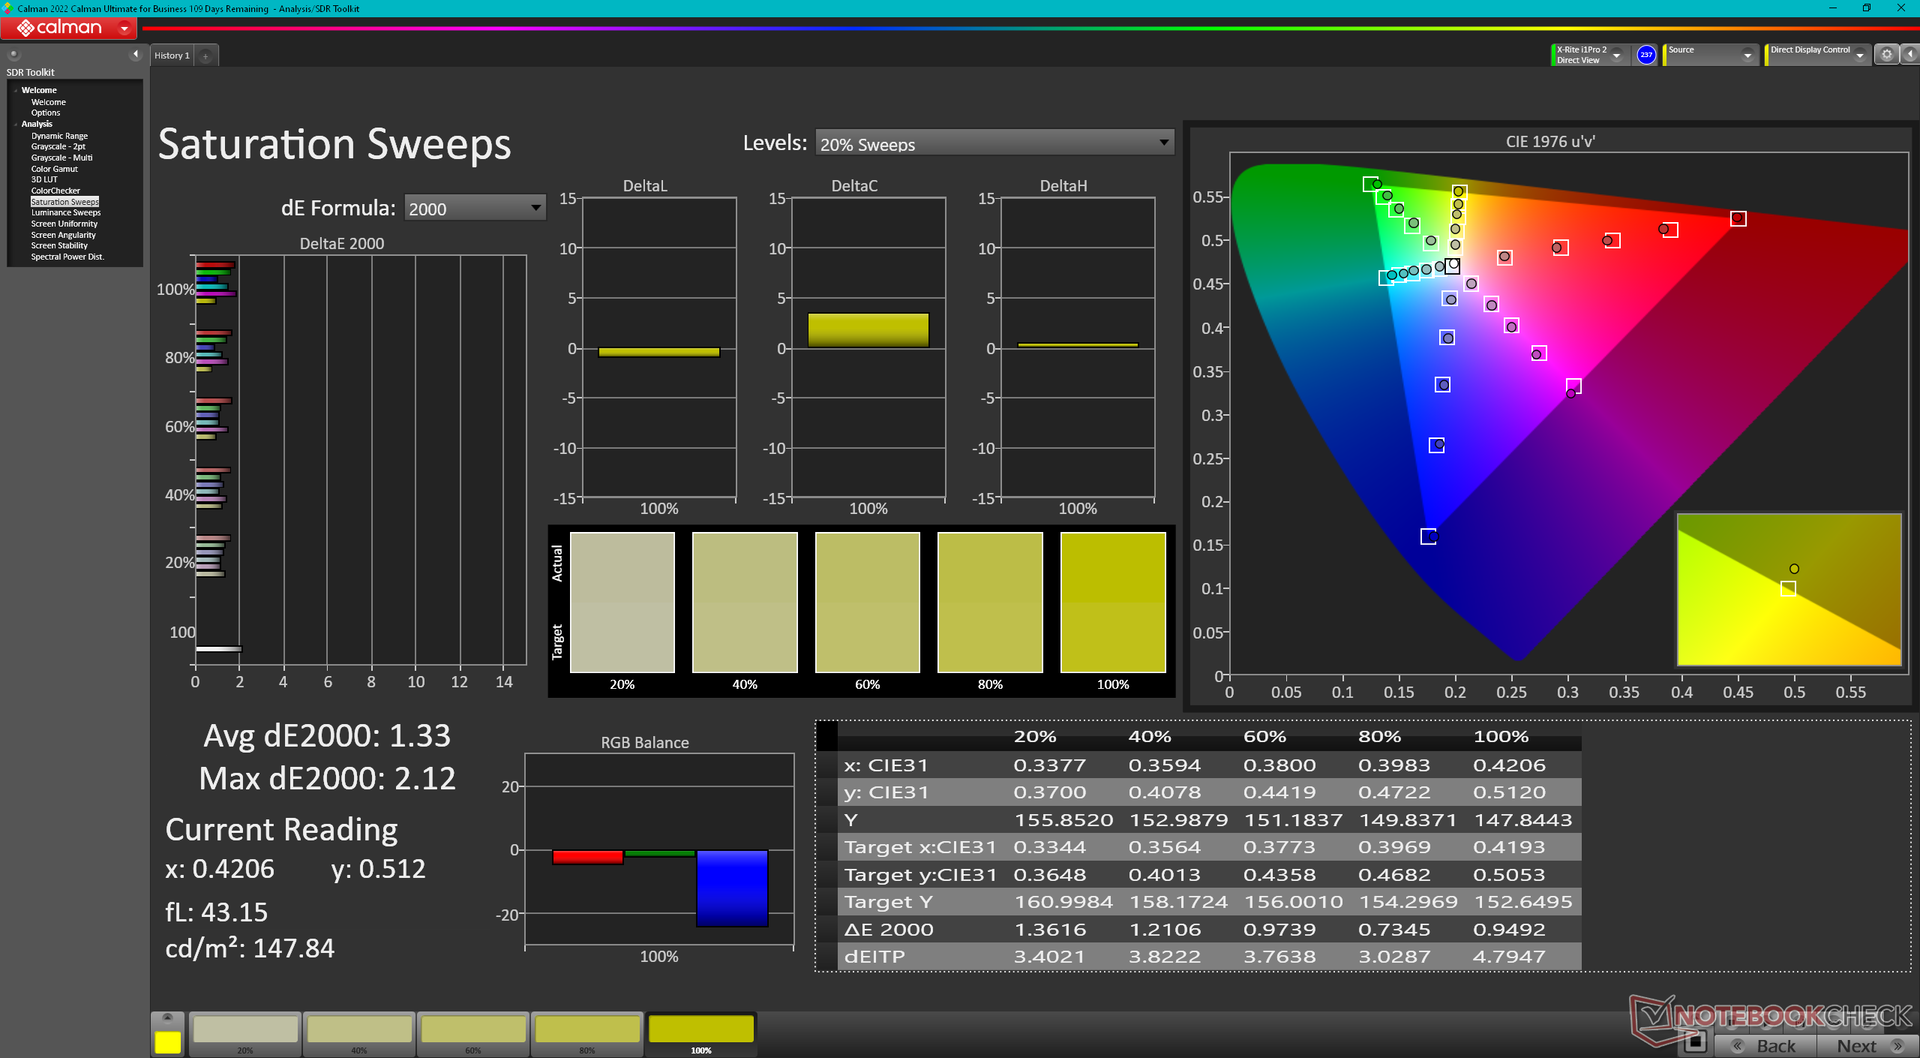
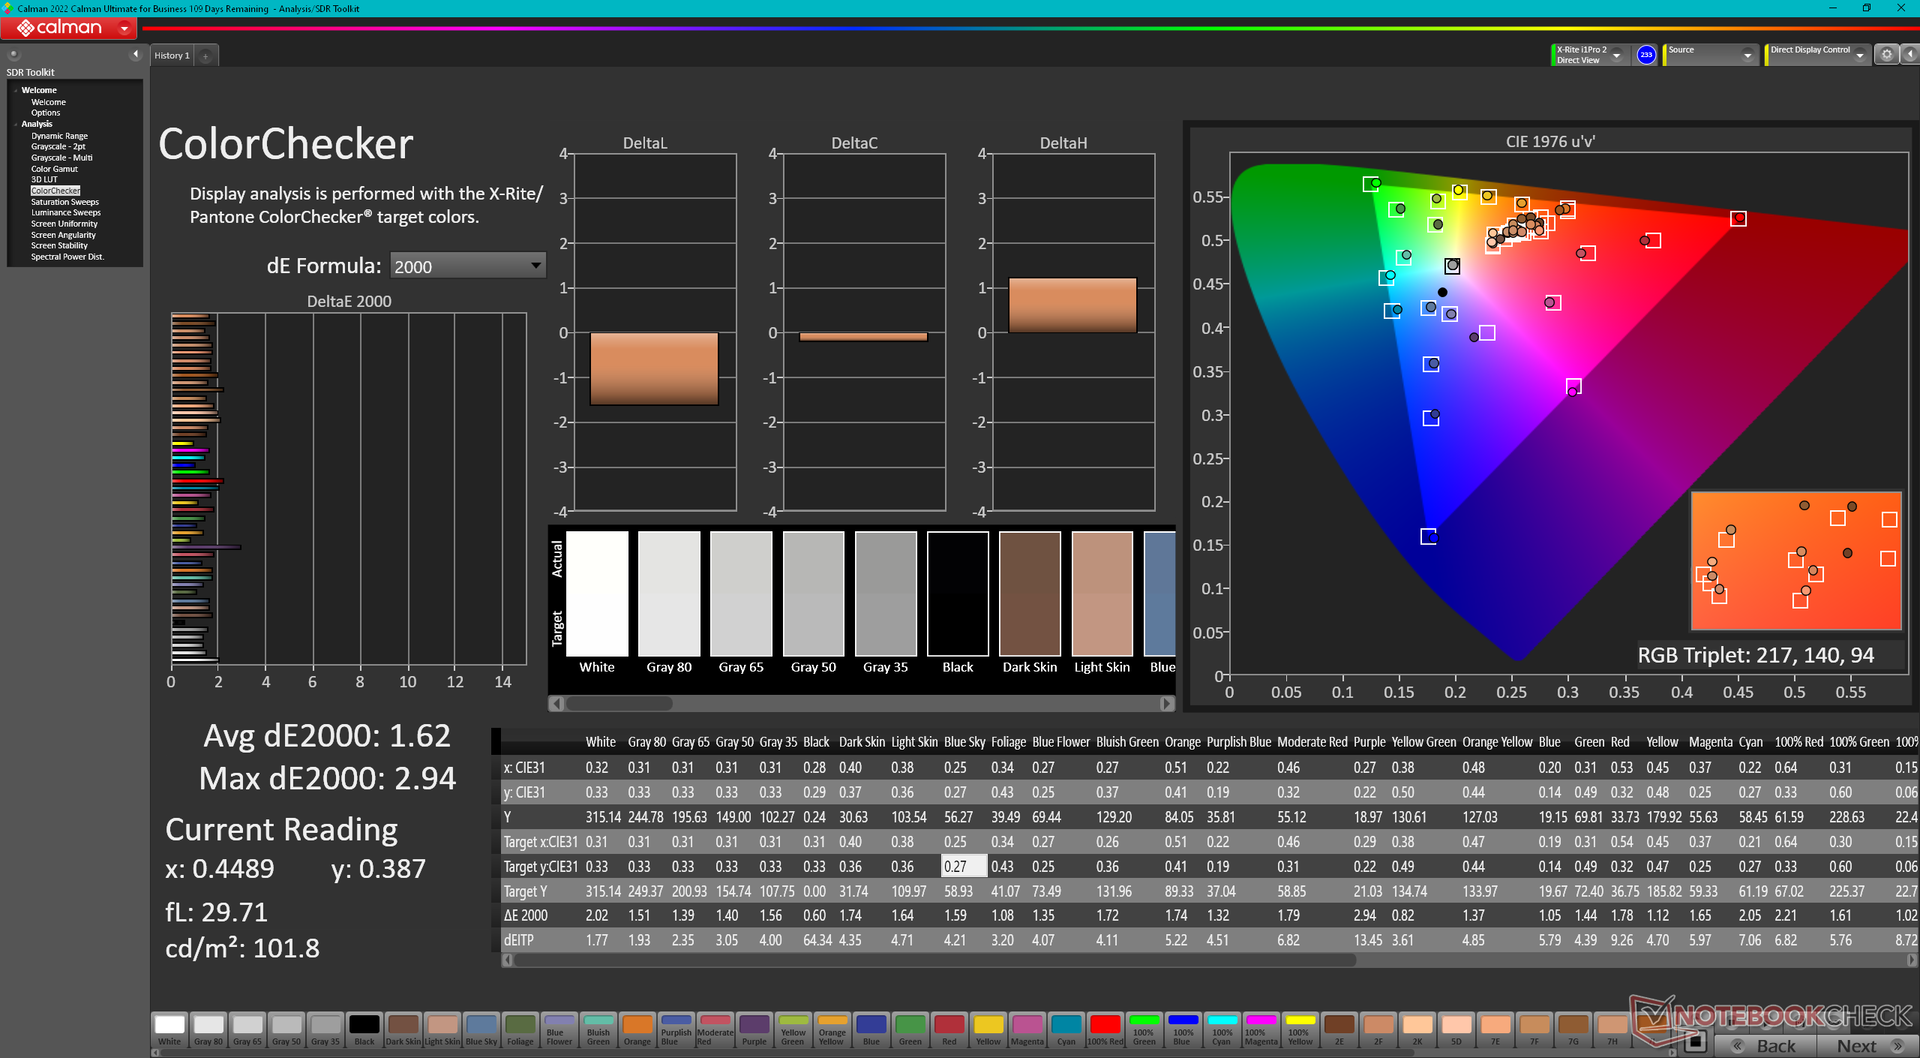
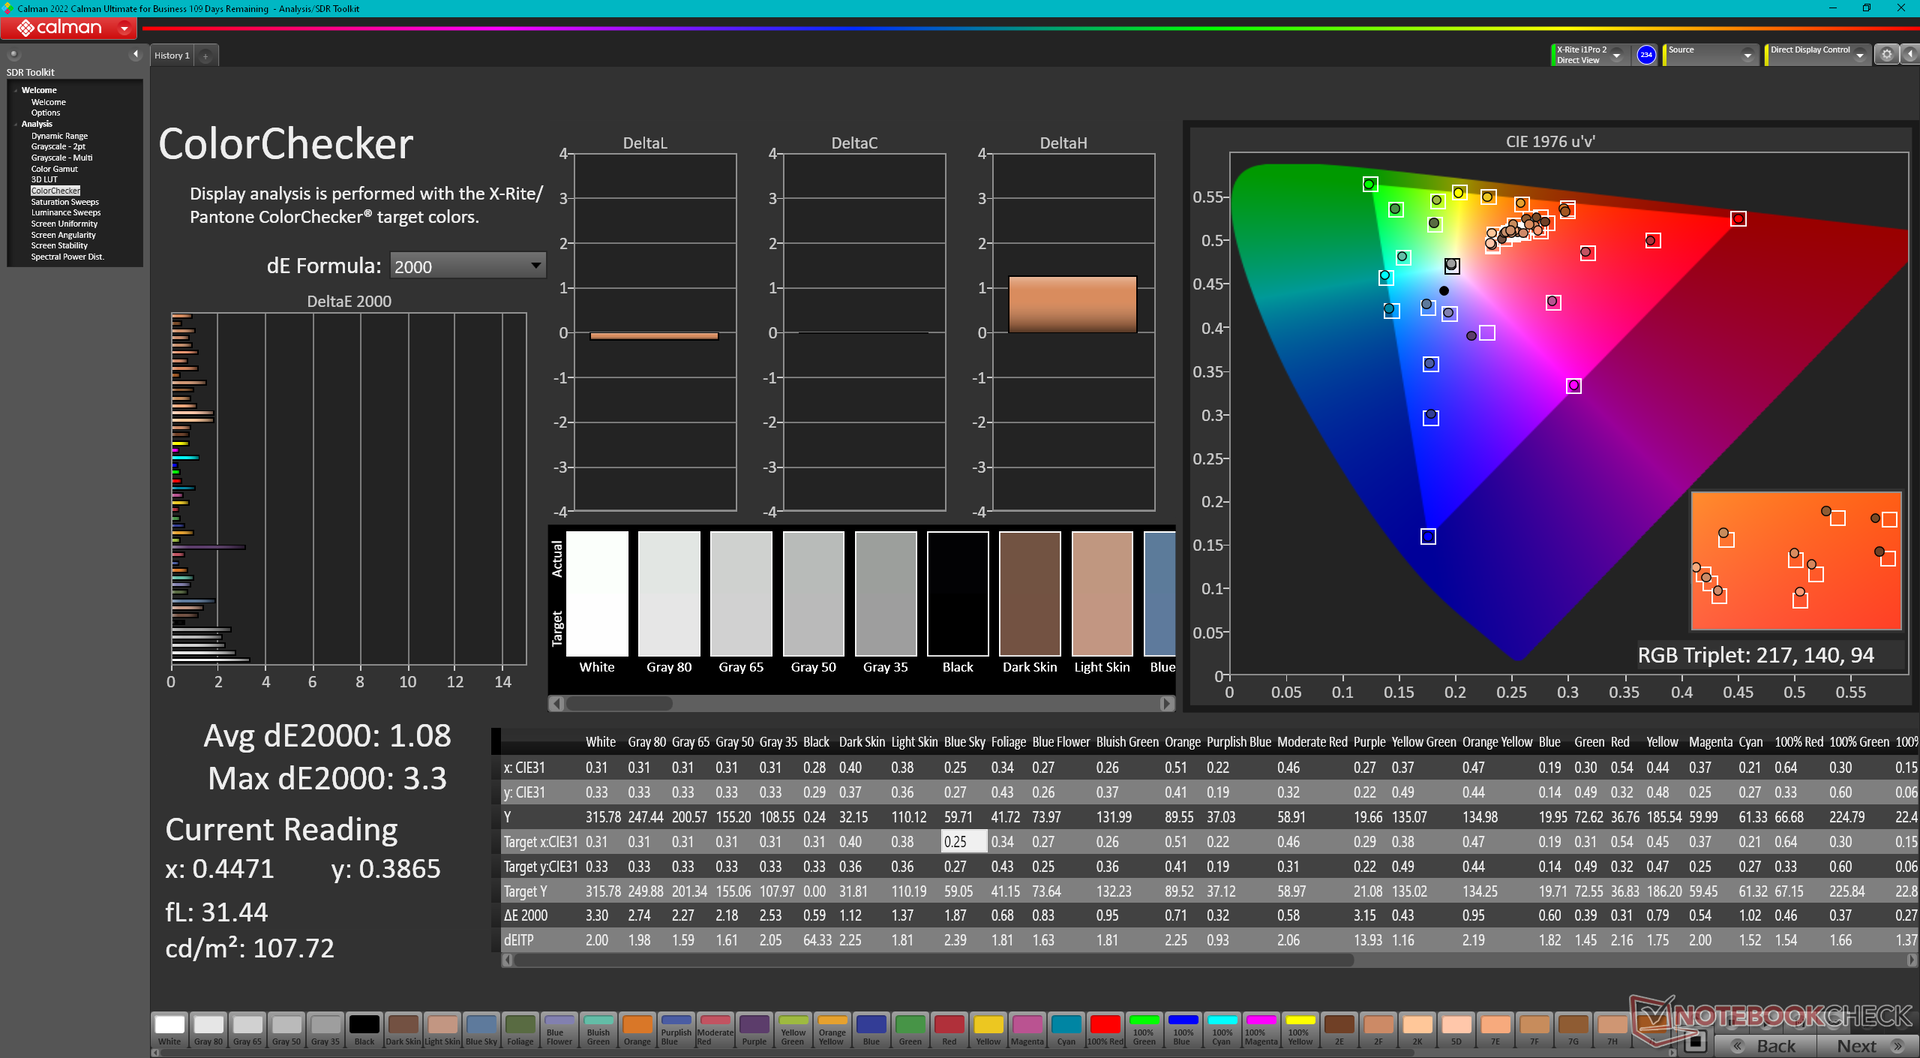
ΔE Color 1.62 | 0.5-29.43 Ø4.87, calibrated: 1.08
ΔE Greyscale 1.3 | 0.5-98 Ø5.1
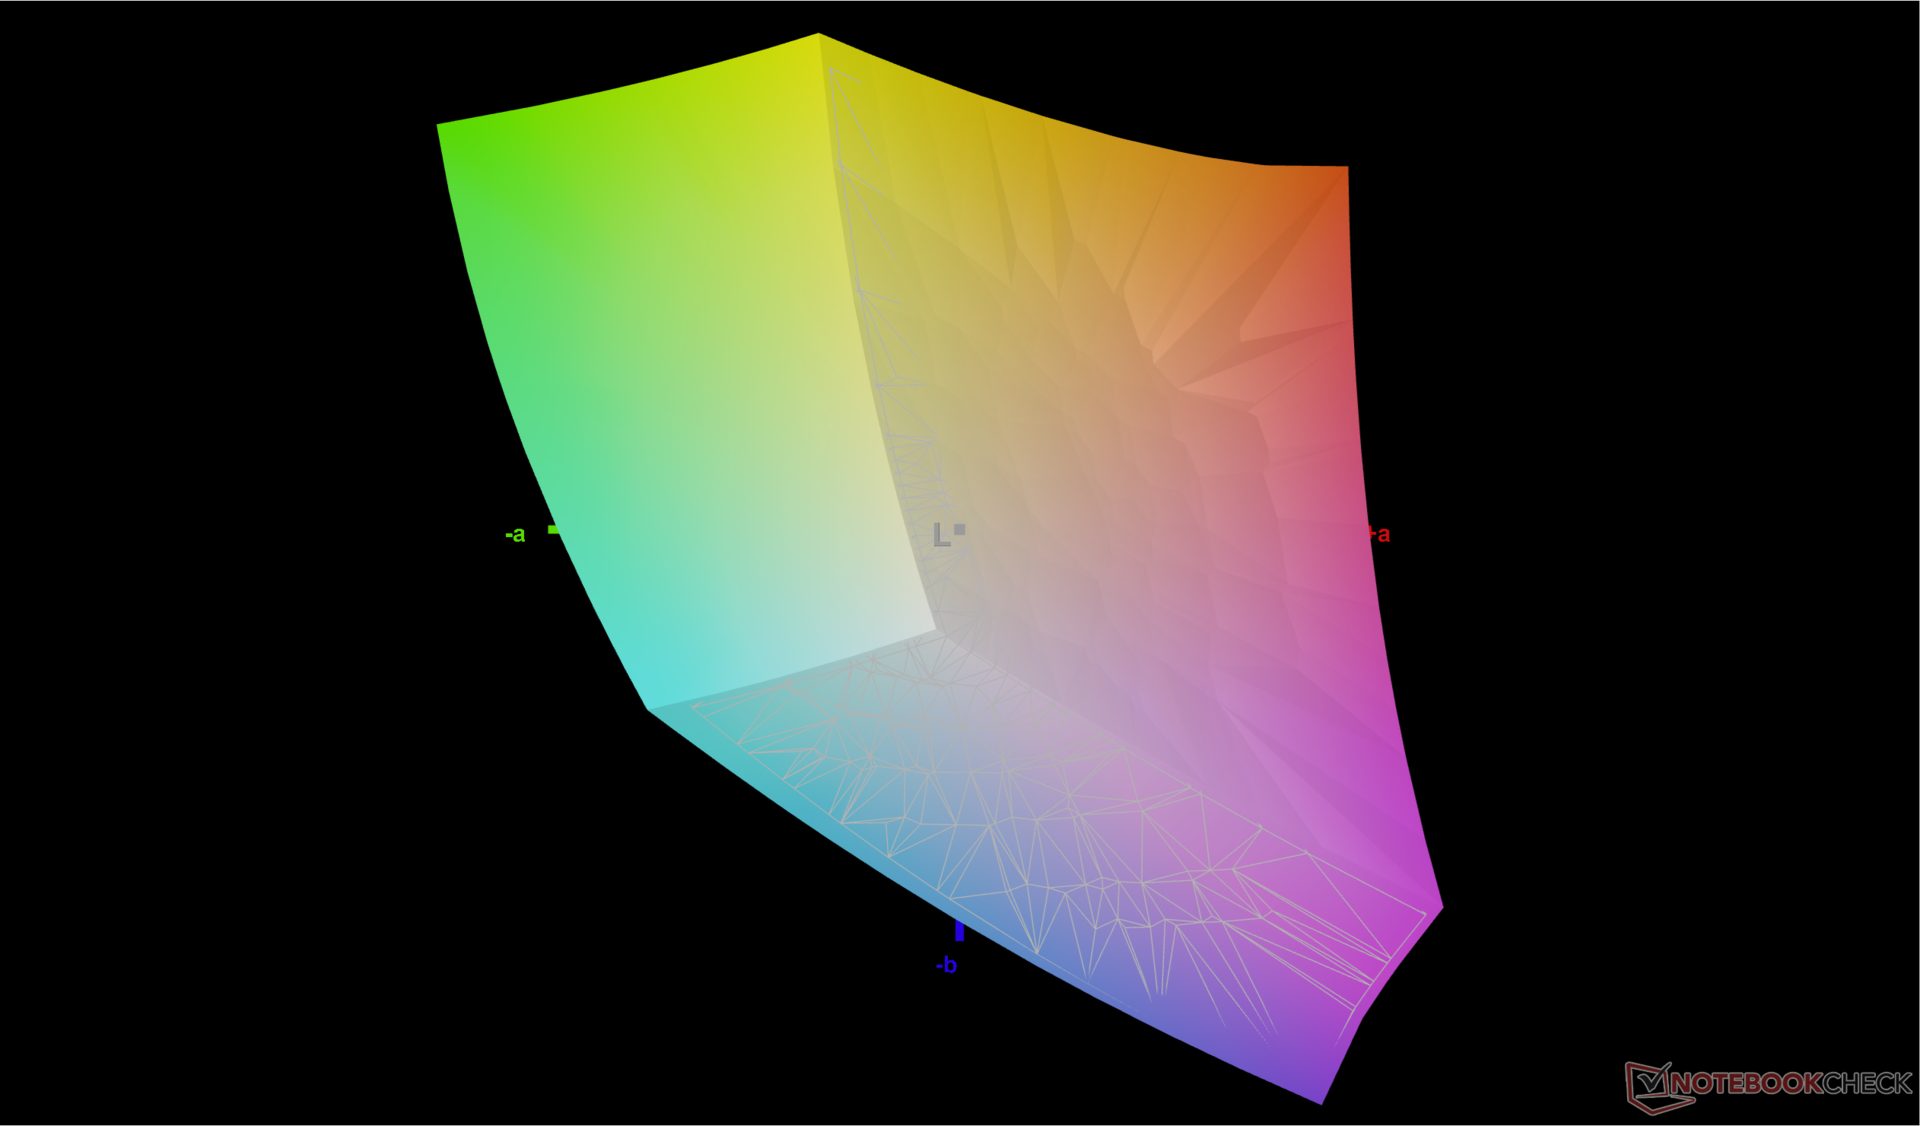
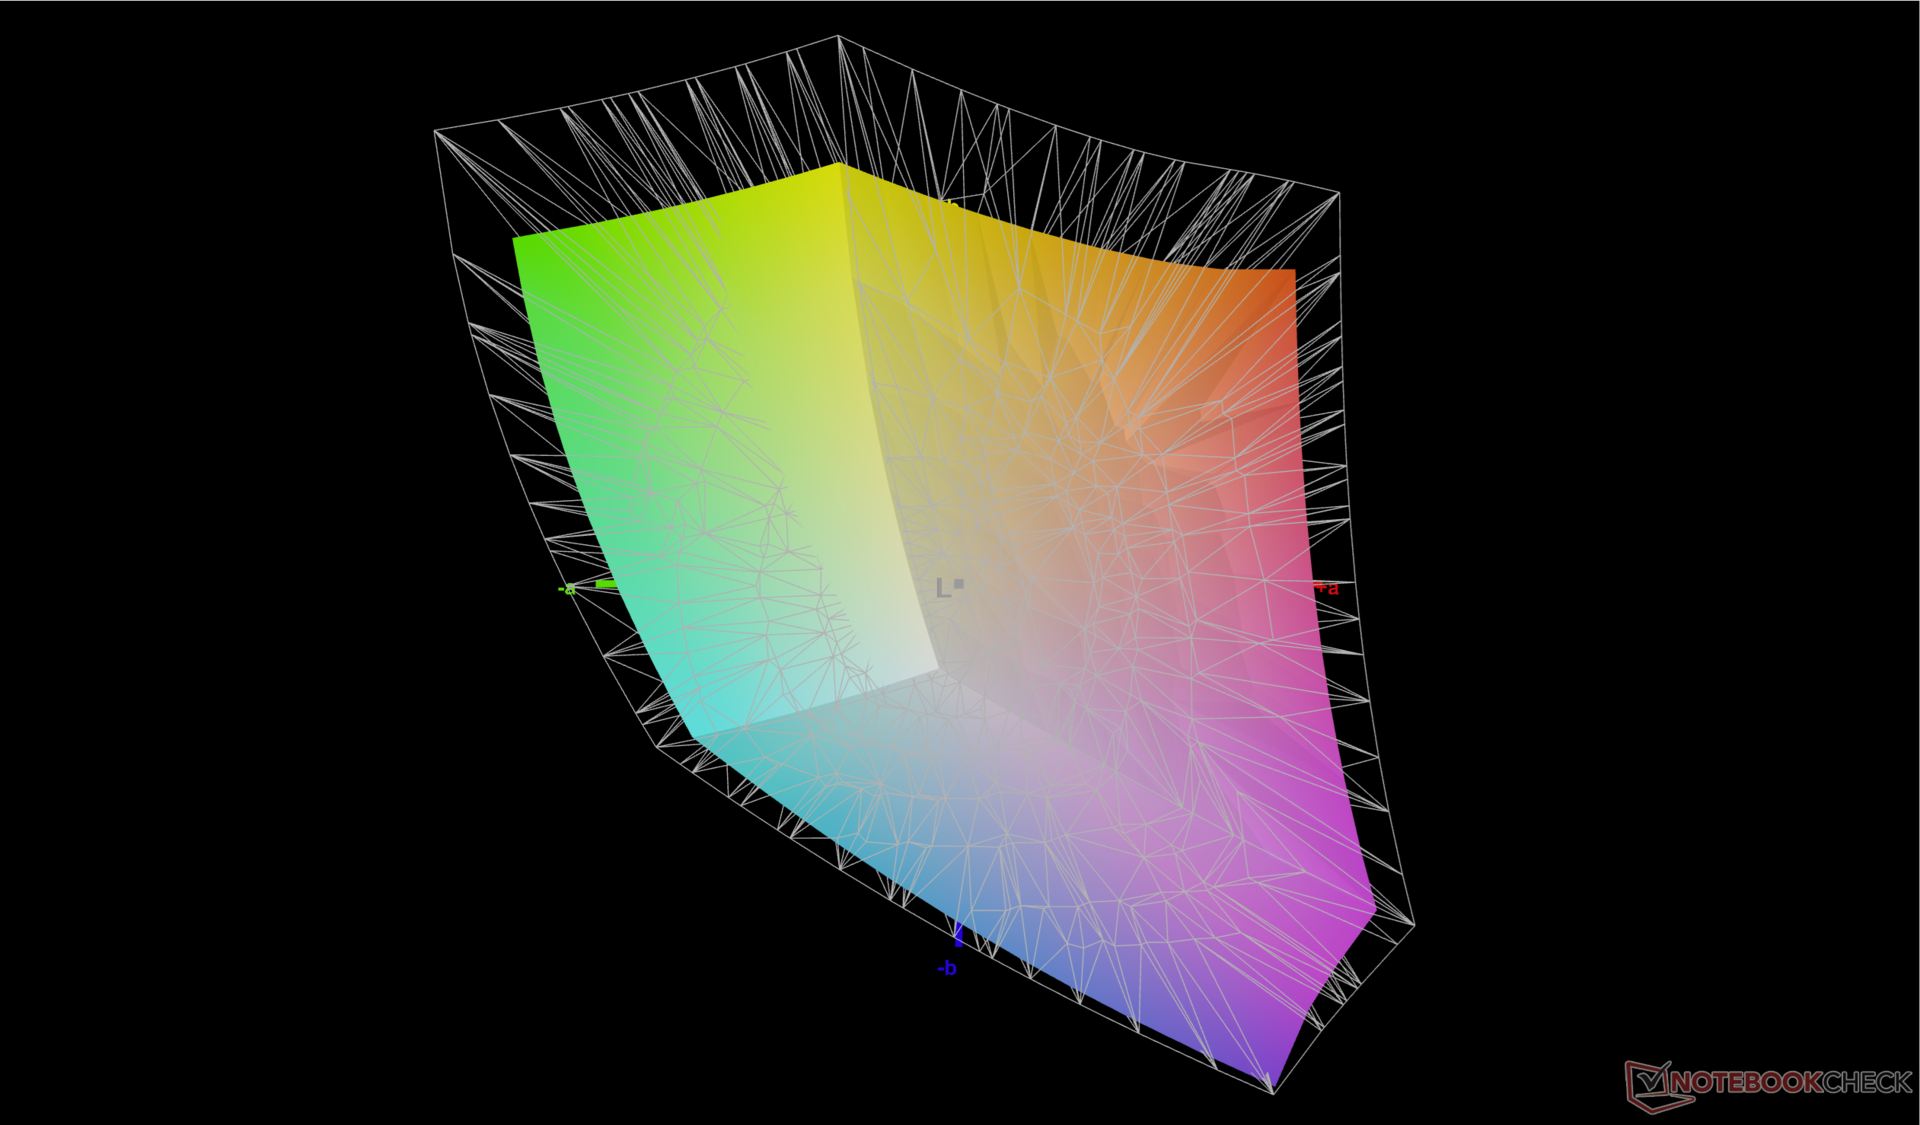
76.7% AdobeRGB 1998 (Argyll 2.2.0 3D)
99.8% sRGB (Argyll 2.2.0 3D)
76% Display P3 (Argyll 2.2.0 3D)
Gamma: 2.26
| Dell Inspiron 16 Plus 7640 AU Optronics B160QAN, IPS, 2560x1600, 16" | Dell Inspiron 16 Plus 7630 LG Philips 160WQ2, IPS, 2560x1600, 16" | Dell Inspiron 16 Plus 7620 BOE NE16N41, IPS, 3072x1920, 16" | Samsung Galaxy Book4 Ultra ATNA60CL07-0, OLED, 2880x1800, 16" | Lenovo Legion 5 16IRX G9 NE160QDM-NZ3, IPS, 2560x1600, 16" | Asus VivoBook Pro 16 K6602VU Samsung ATNA60BX01-1, OLED, 3200x2000, 16" | |
|---|---|---|---|---|---|---|
| Display | -5% | -4% | 15% | -3% | 19% | |
| Display P3 Coverage | 76 | 70.1 -8% | 70.8 -7% | 98.6 30% | 72.4 -5% | 98.7 30% |
| sRGB Coverage | 99.8 | 99.6 0% | 99.5 0% | 99.9 0% | 100 0% | 99.7 0% |
| AdobeRGB 1998 Coverage | 76.7 | 72.3 -6% | 73.2 -5% | 88.5 15% | 74.1 -3% | 96.5 26% |
| Response Times | -38% | -54% | 97% | 51% | 61% | |
| Response Time Grey 50% / Grey 80% * | 25.6 ? | 35 ? -37% | 38 ? -48% | 0.54 ? 98% | 12.5 ? 51% | 0.68 ? 97% |
| Response Time Black / White * | 17.6 ? | 24.2 ? -38% | 28 ? -59% | 0.69 ? 96% | 8.7 ? 51% | 13.2 ? 25% |
| PWM Frequency | 240 ? | 240 ? | ||||
| Screen | -57% | -2% | 5% | 25% | -68% | |
| Brightness middle | 314.7 | 299.4 -5% | 288.9 -8% | 390 24% | 526 67% | 353 12% |
| Brightness | 291 | 290 0% | 276 -5% | 393 35% | 500 72% | 354 22% |
| Brightness Distribution | 89 | 92 3% | 92 3% | 98 10% | 87 -2% | 98 10% |
| Black Level * | 0.28 | 0.21 25% | 0.26 7% | 0.33 -18% | ||
| Contrast | 1124 | 1426 27% | 1111 -1% | 1594 42% | ||
| Colorchecker dE 2000 * | 1.62 | 4.25 -162% | 1.88 -16% | 1.4 14% | 1.2 26% | 4.23 -161% |
| Colorchecker dE 2000 max. * | 2.94 | 6.71 -128% | 4.37 -49% | 2.7 8% | 2.1 29% | 7.13 -143% |
| Colorchecker dE 2000 calibrated * | 1.08 | 0.52 52% | 0.42 61% | 1 7% | 2.42 -124% | |
| Greyscale dE 2000 * | 1.3 | 5.5 -323% | 1.4 -8% | 2.1 -62% | 1.3 -0% | 2.5 -92% |
| Gamma | 2.26 97% | 2.35 94% | 2.3 96% | 2.27 97% | 2.23 99% | 2.4 92% |
| CCT | 6385 102% | 6368 102% | 6634 98% | 6431 101% | 6391 102% | 6642 98% |
| Media totale (Programma / Settaggio) | -33% /
-43% | -20% /
-10% | 39% /
24% | 24% /
23% | 4% /
-25% |
* ... Meglio usare valori piccoli
Il display viene fornito ben calibrato, il che è sorprendente se si considera che la serie Inspiron è tipicamente più economica e meno attenta alla precisione dei colori rispetto alla serie XPS di fascia più alta. Il tentativo di calibrare il pannello da parte nostra avrebbe come risultato solo un leggero miglioramento dei valori medi deltaE, come mostrano gli screenshot qui sotto. Una calibrazione finale non è quindi necessaria per la maggior parte degli utenti.
Tempi di risposta del Display
| ↔ Tempi di risposta dal Nero al Bianco | ||
|---|---|---|
| 17.6 ms ... aumenta ↗ e diminuisce ↘ combinato | ↗ 8.5 ms Incremento | 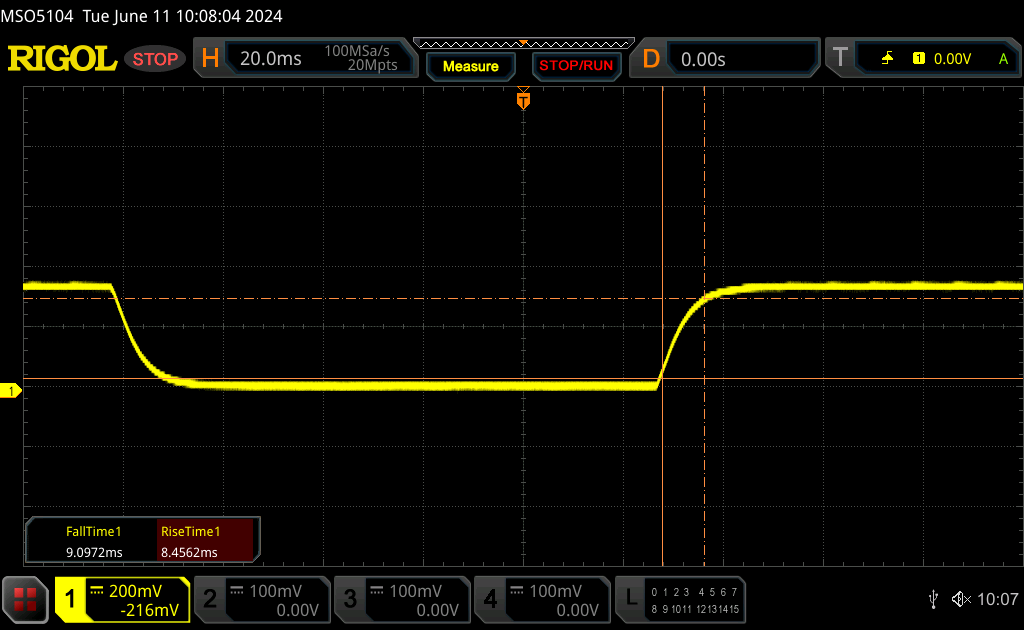 |
| ↘ 9.1 ms Calo | ||
| Lo schermo mostra buoni tempi di risposta durante i nostri tests, ma potrebbe essere troppo lento per i gamers competitivi. In confronto, tutti i dispositivi di test variano da 0.1 (minimo) a 240 (massimo) ms. » 36 % di tutti i dispositivi è migliore. Questo significa che i tempi di risposta rilevati sono migliori rispettto alla media di tutti i dispositivi testati (20.8 ms). | ||
| ↔ Tempo di risposta dal 50% Grigio all'80% Grigio | ||
| 25.6 ms ... aumenta ↗ e diminuisce ↘ combinato | ↗ 12.3 ms Incremento | 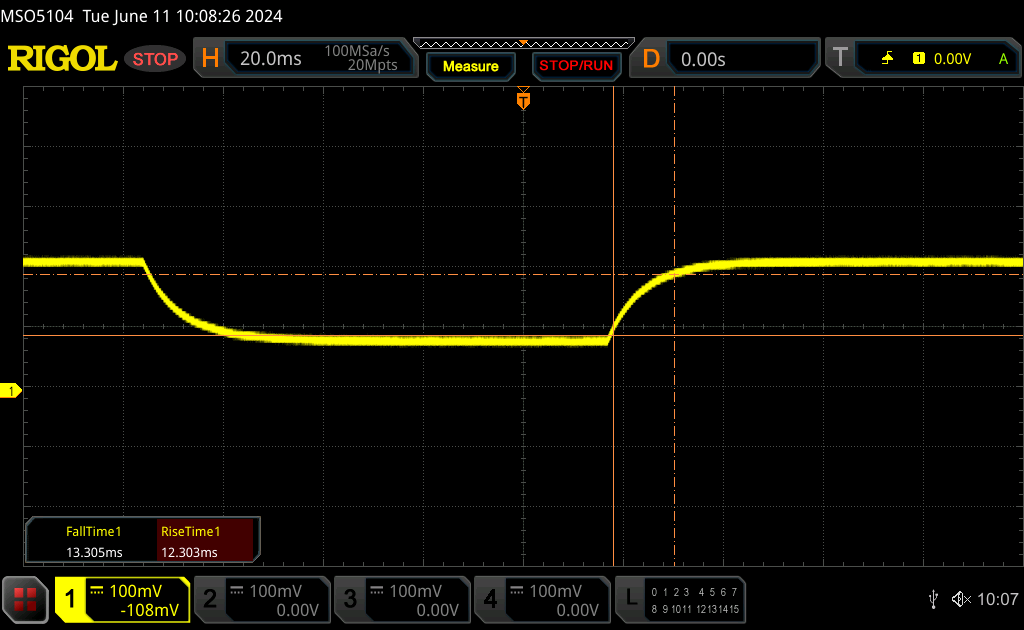 |
| ↘ 13.3 ms Calo | ||
| Lo schermo mostra tempi di risposta relativamente lenti nei nostri tests e potrebbe essere troppo lento per i gamers. In confronto, tutti i dispositivi di test variano da 0.165 (minimo) a 636 (massimo) ms. » 33 % di tutti i dispositivi è migliore. Questo significa che i tempi di risposta rilevati sono migliori rispettto alla media di tutti i dispositivi testati (32.5 ms). | ||
Sfarfallio dello schermo / PWM (Pulse-Width Modulation)
| flickering dello schermo / PWM non rilevato | 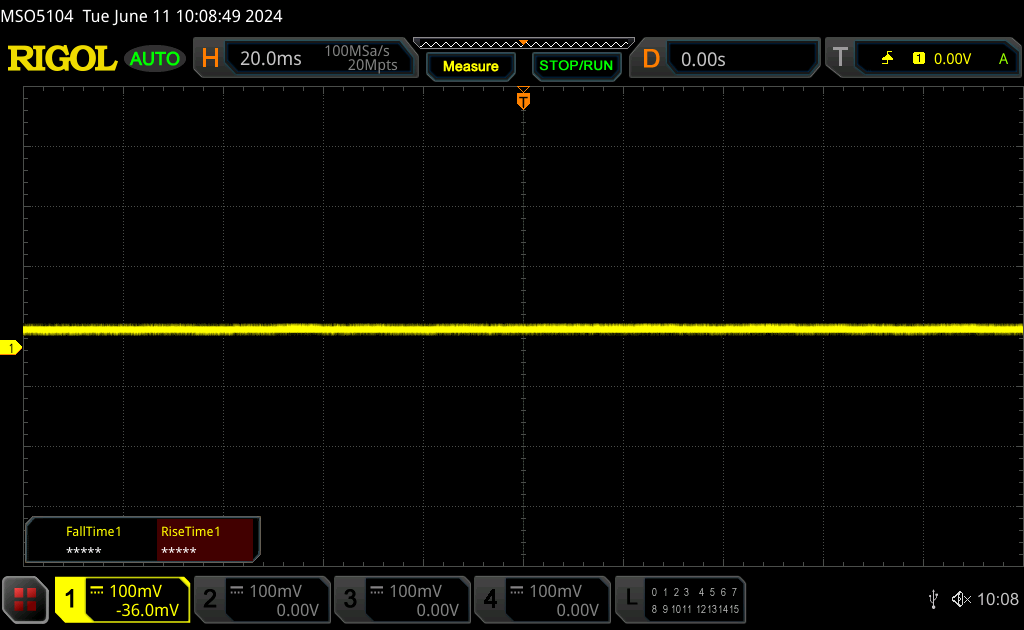 | ||
In confronto: 53 % di tutti i dispositivi testati non utilizza PWM per ridurre la luminosita' del display. Se è rilevato PWM, una media di 8516 (minimo: 5 - massimo: 343500) Hz è stata rilevata. | |||
Prestazioni - Pronti per l'AI
Condizioni del test
Abbiamo impostato Windows in modalità Prestazioni prima di eseguire i benchmark qui sotto.
Processore
Il nostro Core Ultra 7 155H è eccellente, con risultati multi-thread più veloci del 15-20% rispetto ad altri computer portatili con lo stesso processore. Rispetto al Core i7-13700H dell'Inspiron 16 Plus 7630 dello scorso anno, tuttavia, la CPU più recente è più veloce solo del 10 percento circa e non si nota per la maggior parte dei compiti. In effetti, la CPU più vecchia sembra avere un leggero vantaggio quando si tratta di carichi di lavoro a thread singolo.
Naturalmente, il jolly del Core Ultra 7 155H risiede nella sua NPU integrata, che dovrebbe essere utile per le attività accelerate dall'AI, una volta che saranno più facilmente disponibili. Per il resto, la sua utilità è estremamente limitata al momento in cui scriviamo.
Cinebench R15 Multi Loop
Cinebench R23: Multi Core | Single Core
Cinebench R20: CPU (Multi Core) | CPU (Single Core)
Cinebench R15: CPU Multi 64Bit | CPU Single 64Bit
Blender: v2.79 BMW27 CPU
7-Zip 18.03: 7z b 4 | 7z b 4 -mmt1
Geekbench 6.4: Multi-Core | Single-Core
Geekbench 5.5: Multi-Core | Single-Core
HWBOT x265 Benchmark v2.2: 4k Preset
LibreOffice : 20 Documents To PDF
R Benchmark 2.5: Overall mean
* ... Meglio usare valori piccoli
AIDA64: FP32 Ray-Trace | FPU Julia | CPU SHA3 | CPU Queen | FPU SinJulia | FPU Mandel | CPU AES | CPU ZLib | FP64 Ray-Trace | CPU PhotoWorxx
| Performance Rating | |
| Lenovo Legion 5 16IRX G9 | |
| Asus VivoBook Pro 16 K6602VU | |
| Samsung Galaxy Book4 Ultra | |
| Dell Inspiron 16 Plus 7640 | |
| Media Intel Core Ultra 7 155H | |
| Dell Inspiron 16 Plus 7630 | |
| Dell Inspiron 16 Plus 7620 | |
| AIDA64 / FP32 Ray-Trace | |
| Lenovo Legion 5 16IRX G9 | |
| Dell Inspiron 16 Plus 7640 | |
| Dell Inspiron 16 Plus 7630 | |
| Asus VivoBook Pro 16 K6602VU | |
| Samsung Galaxy Book4 Ultra | |
| Media Intel Core Ultra 7 155H (6670 - 18470, n=50) | |
| Dell Inspiron 16 Plus 7620 | |
| AIDA64 / FPU Julia | |
| Lenovo Legion 5 16IRX G9 | |
| Asus VivoBook Pro 16 K6602VU | |
| Samsung Galaxy Book4 Ultra | |
| Dell Inspiron 16 Plus 7640 | |
| Media Intel Core Ultra 7 155H (40905 - 93181, n=50) | |
| Dell Inspiron 16 Plus 7630 | |
| Dell Inspiron 16 Plus 7620 | |
| AIDA64 / CPU SHA3 | |
| Lenovo Legion 5 16IRX G9 | |
| Dell Inspiron 16 Plus 7640 | |
| Asus VivoBook Pro 16 K6602VU | |
| Samsung Galaxy Book4 Ultra | |
| Media Intel Core Ultra 7 155H (1940 - 4436, n=50) | |
| Dell Inspiron 16 Plus 7630 | |
| Dell Inspiron 16 Plus 7620 | |
| AIDA64 / CPU Queen | |
| Dell Inspiron 16 Plus 7630 | |
| Lenovo Legion 5 16IRX G9 | |
| Asus VivoBook Pro 16 K6602VU | |
| Dell Inspiron 16 Plus 7620 | |
| Dell Inspiron 16 Plus 7640 | |
| Samsung Galaxy Book4 Ultra | |
| Media Intel Core Ultra 7 155H (64698 - 94181, n=50) | |
| AIDA64 / FPU SinJulia | |
| Lenovo Legion 5 16IRX G9 | |
| Dell Inspiron 16 Plus 7640 | |
| Samsung Galaxy Book4 Ultra | |
| Media Intel Core Ultra 7 155H (5639 - 10647, n=50) | |
| Dell Inspiron 16 Plus 7630 | |
| Asus VivoBook Pro 16 K6602VU | |
| Dell Inspiron 16 Plus 7620 | |
| AIDA64 / FPU Mandel | |
| Lenovo Legion 5 16IRX G9 | |
| Dell Inspiron 16 Plus 7640 | |
| Samsung Galaxy Book4 Ultra | |
| Media Intel Core Ultra 7 155H (18236 - 47685, n=50) | |
| Asus VivoBook Pro 16 K6602VU | |
| Dell Inspiron 16 Plus 7630 | |
| Dell Inspiron 16 Plus 7620 | |
| AIDA64 / CPU AES | |
| Asus VivoBook Pro 16 K6602VU | |
| Lenovo Legion 5 16IRX G9 | |
| Media Intel Core Ultra 7 155H (45713 - 152179, n=50) | |
| Samsung Galaxy Book4 Ultra | |
| Dell Inspiron 16 Plus 7640 | |
| Dell Inspiron 16 Plus 7620 | |
| Dell Inspiron 16 Plus 7630 | |
| AIDA64 / CPU ZLib | |
| Lenovo Legion 5 16IRX G9 | |
| Dell Inspiron 16 Plus 7640 | |
| Dell Inspiron 16 Plus 7620 | |
| Samsung Galaxy Book4 Ultra | |
| Asus VivoBook Pro 16 K6602VU | |
| Media Intel Core Ultra 7 155H (557 - 1250, n=50) | |
| Dell Inspiron 16 Plus 7630 | |
| AIDA64 / FP64 Ray-Trace | |
| Lenovo Legion 5 16IRX G9 | |
| Asus VivoBook Pro 16 K6602VU | |
| Dell Inspiron 16 Plus 7640 | |
| Dell Inspiron 16 Plus 7630 | |
| Samsung Galaxy Book4 Ultra | |
| Media Intel Core Ultra 7 155H (3569 - 9802, n=50) | |
| Dell Inspiron 16 Plus 7620 | |
| AIDA64 / CPU PhotoWorxx | |
| Samsung Galaxy Book4 Ultra | |
| Media Intel Core Ultra 7 155H (32719 - 54223, n=50) | |
| Dell Inspiron 16 Plus 7640 | |
| Asus VivoBook Pro 16 K6602VU | |
| Dell Inspiron 16 Plus 7630 | |
| Dell Inspiron 16 Plus 7620 | |
| Lenovo Legion 5 16IRX G9 | |
Test da sforzo
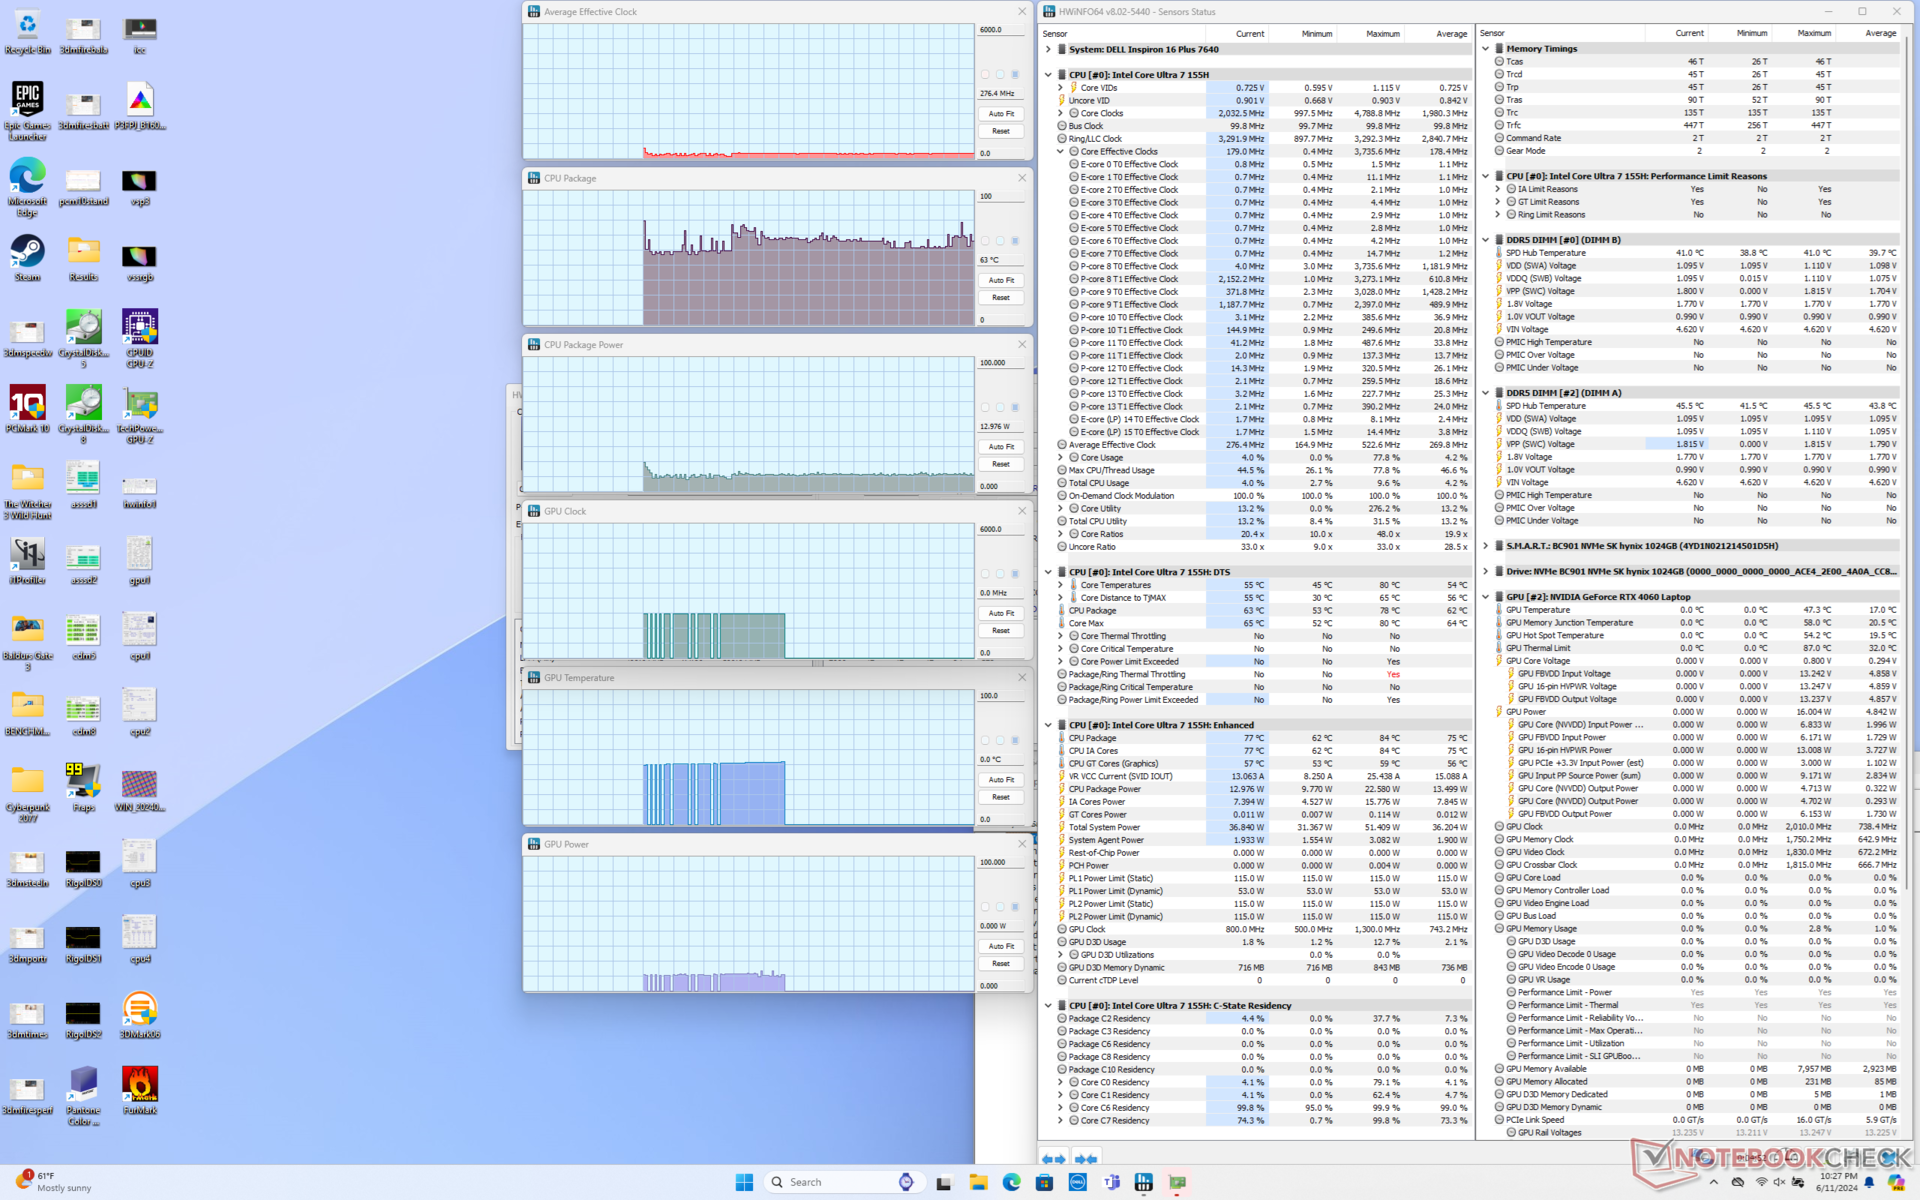
La CPU raggiungeva un boost medio di 3,2 GHz, 97 W e 101 C per circa 25 secondi quando si avviava lo stress Prime95. Successivamente, scendeva a ~2,3 GHz e 44 W per mantenere una temperatura del nucleo più fredda di 83 C. Le prestazioni Turbo Boost sono quindi di breve durata sul sistema, come abbiamo osservato sul modello precedente.
La GPU Nvidia si stabilizzerebbe a 2070 MHz, 76 C e 60 W quando è in funzione Witcher 3 rispetto ai 2250 MHz, 72 C e 69 W del modello dello scorso anno in condizioni di test simili. Questi risultati integrano le prestazioni generalmente più lente nei giochi, come illustrato nella sezione Prestazioni di gioco di seguito. La potenza della GPU sul nuovo modello Dell raggiungeva un tetto di 60 W rispetto ai 70 W del vecchio modello Dell, anche quando era impostato sulla modalità Performance.
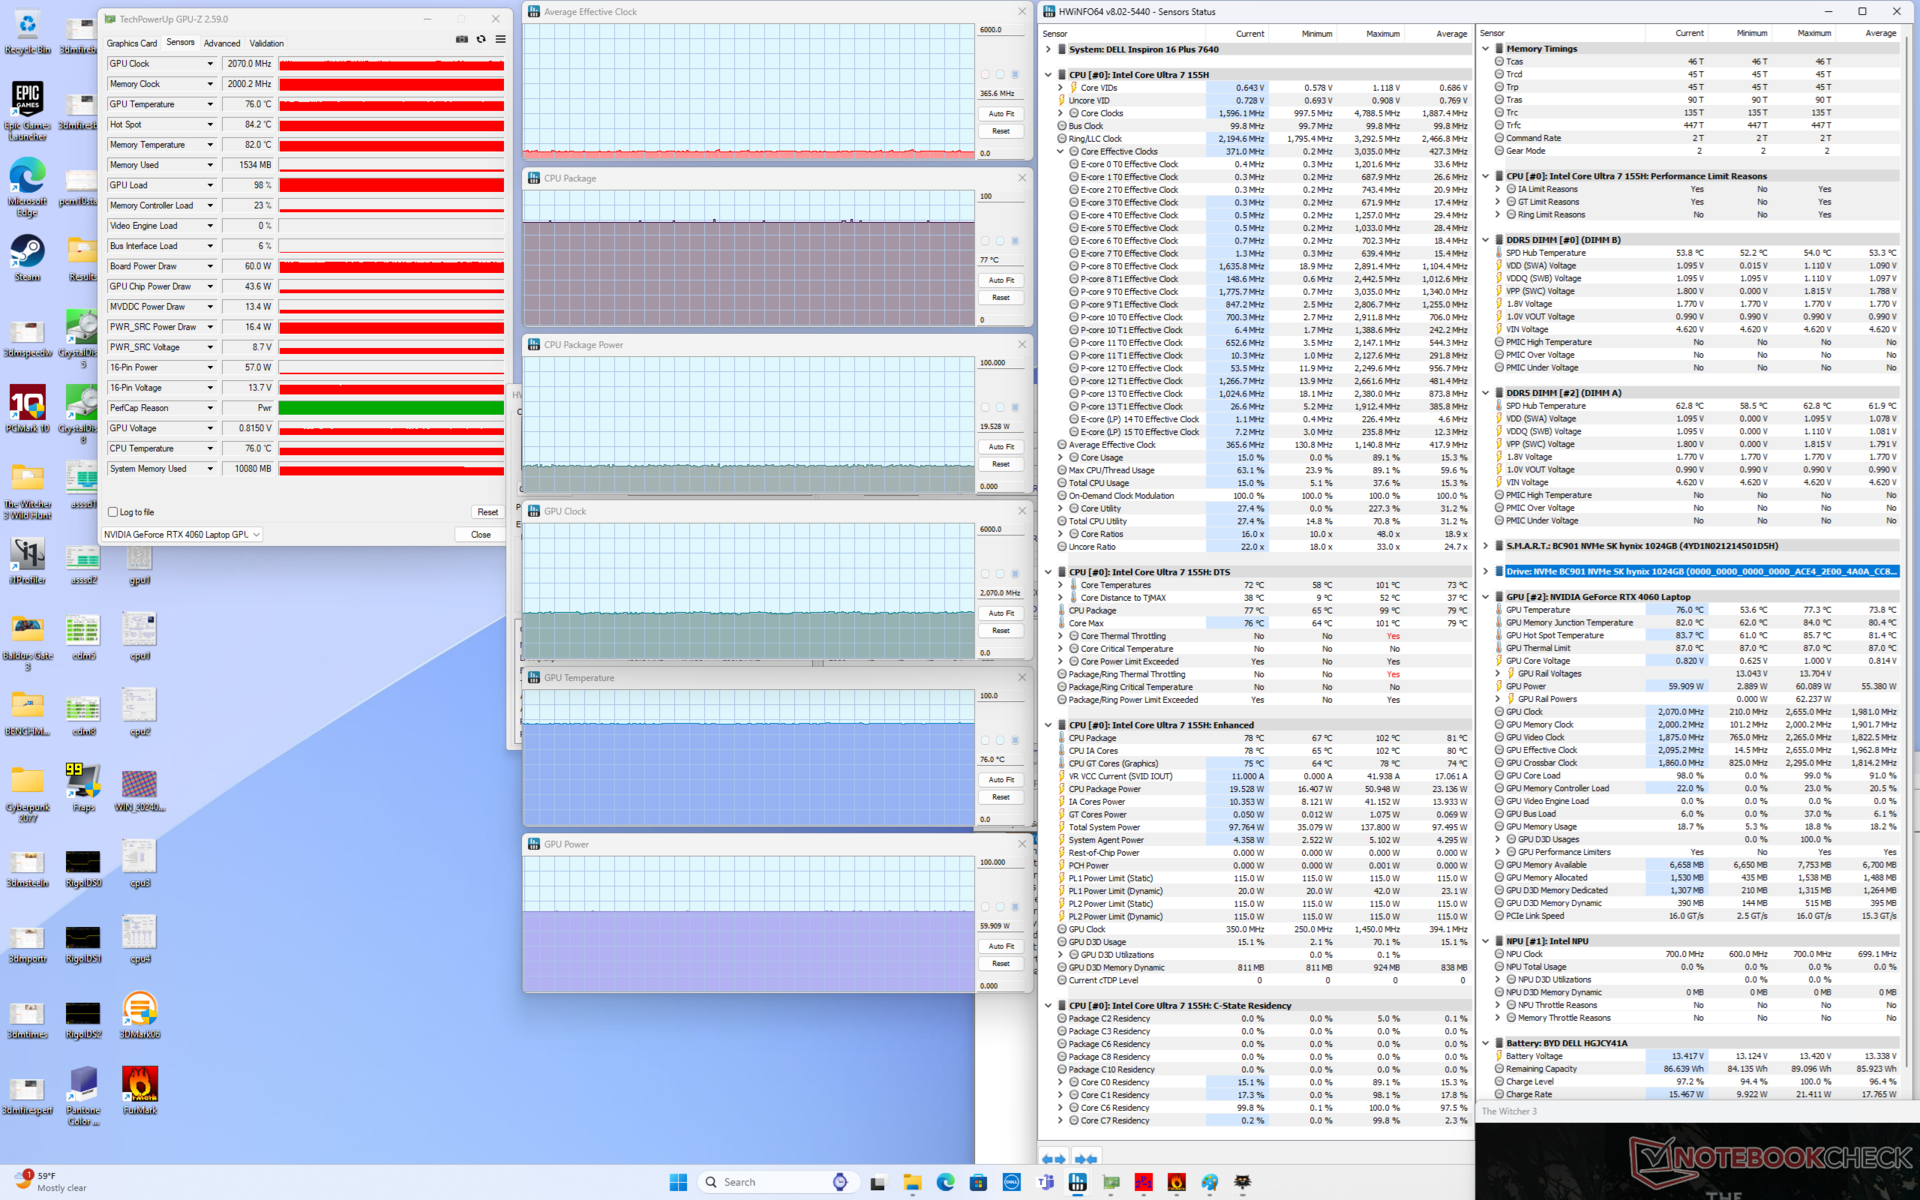

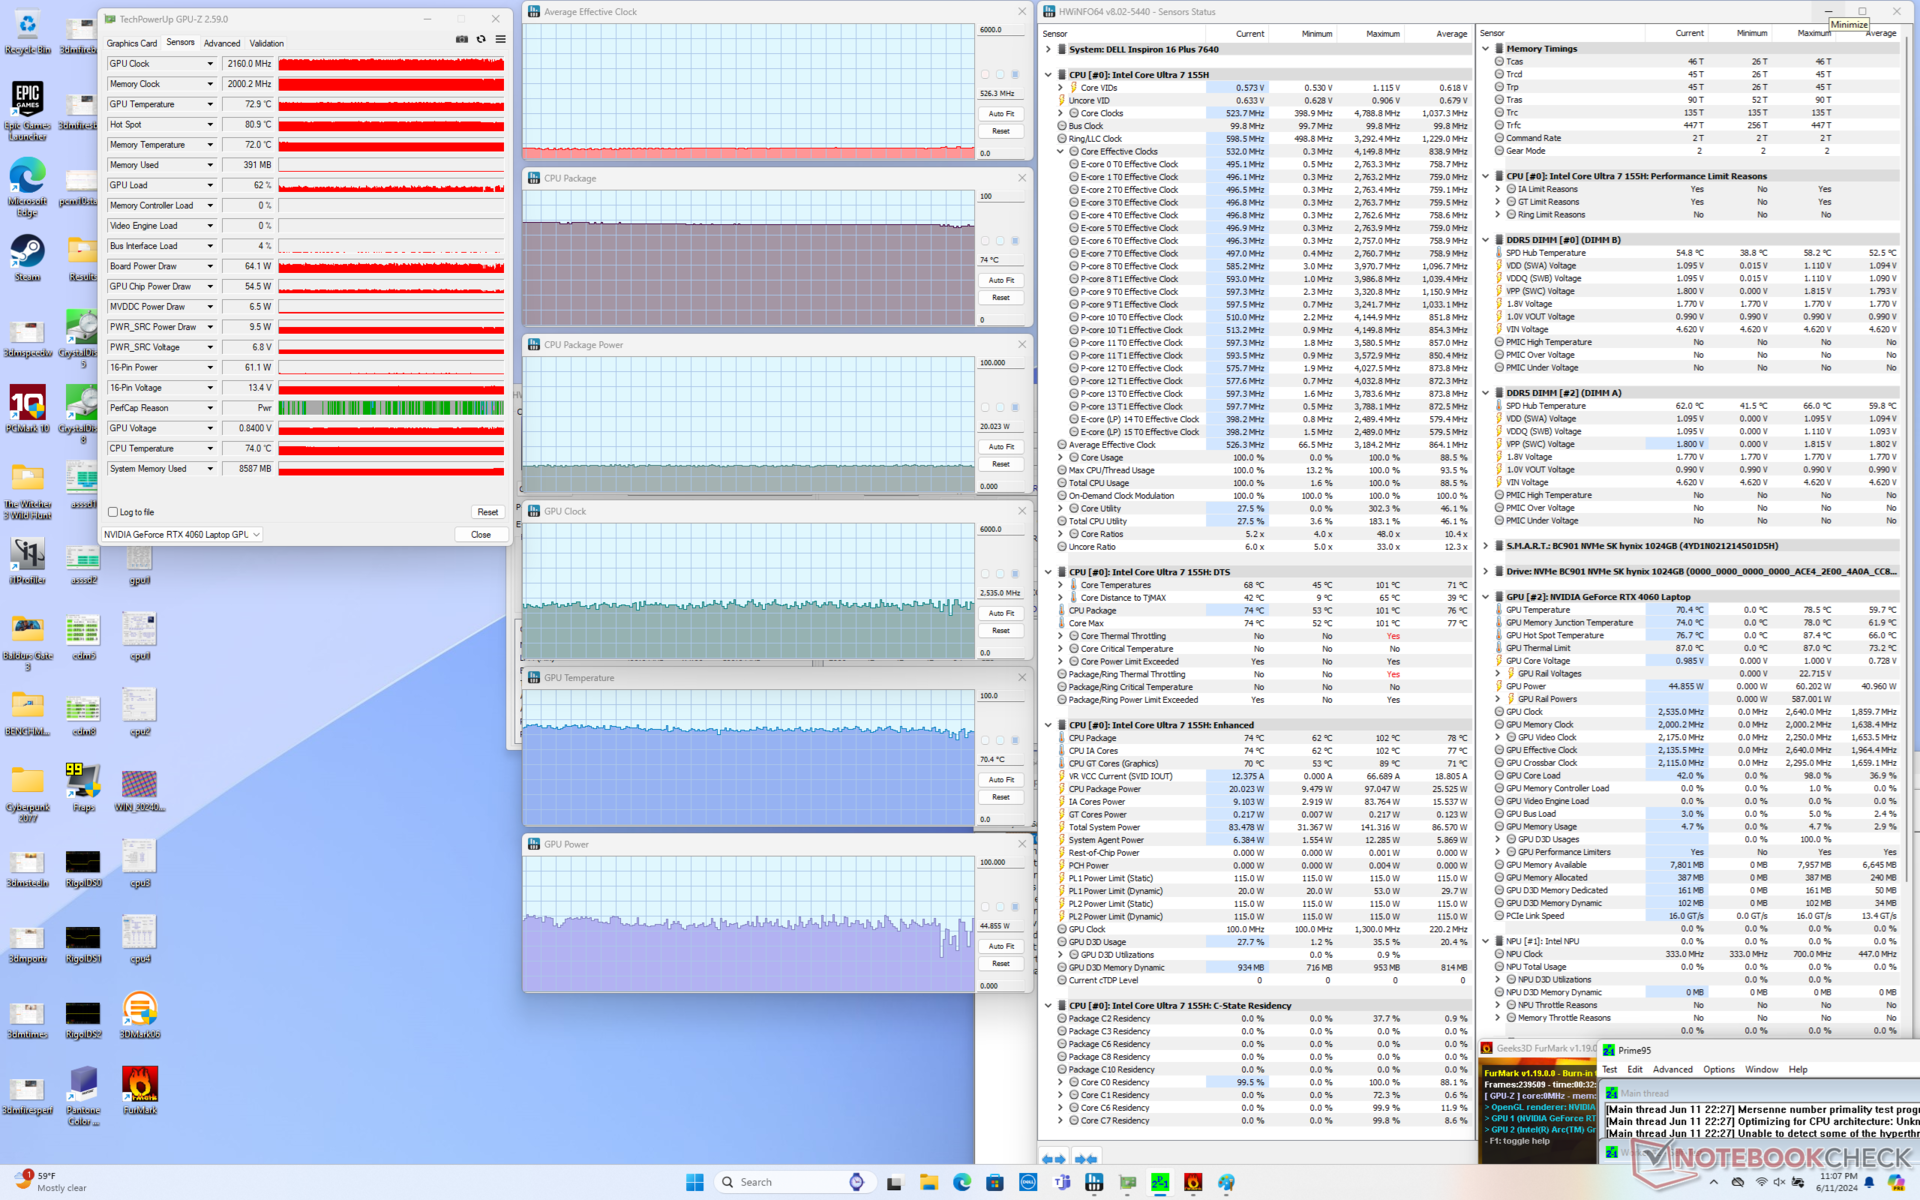
| Clock medio della CPU (GHz) | Clock della GPU (MHz) | Temperatura media della CPU (°C) | Temperatura media della GPU (°C) | |
| Sistema inattivo | -- | -- | 63 | 45 |
| Stress Prime95 | 2,1 - 2,4 | -- | 83 | 56 |
| Prime95 + FurMark Stress | 0,5 | 2160 | 74 | 70 |
| Witcher 3 Stress | 0,4 | 2070 | 77 | 77 |
Prestazioni del sistema
I risultati di PCMark sono paragonabili a quelli del modello dello scorso anno, nonostante l'aggiornamento della CPU, e dimostrano che il modello più recente non è necessariamente più veloce quando si tratta della maggior parte delle operazioni quotidiane.

CrossMark: Overall | Productivity | Creativity | Responsiveness
WebXPRT 3: Overall
WebXPRT 4: Overall
Mozilla Kraken 1.1: Total
| PCMark 10 / Score | |
| Dell Inspiron 16 Plus 7630 | |
| Lenovo Legion 5 16IRX G9 | |
| Asus VivoBook Pro 16 K6602VU | |
| Dell Inspiron 16 Plus 7640 | |
| Media Intel Core Ultra 7 155H, NVIDIA GeForce RTX 4060 Laptop GPU (6751 - 7370, n=5) | |
| Samsung Galaxy Book4 Ultra | |
| Dell Inspiron 16 Plus 7620 | |
| PCMark 10 / Essentials | |
| Dell Inspiron 16 Plus 7630 | |
| Lenovo Legion 5 16IRX G9 | |
| Samsung Galaxy Book4 Ultra | |
| Dell Inspiron 16 Plus 7640 | |
| Asus VivoBook Pro 16 K6602VU | |
| Dell Inspiron 16 Plus 7620 | |
| Media Intel Core Ultra 7 155H, NVIDIA GeForce RTX 4060 Laptop GPU (9476 - 10446, n=5) | |
| PCMark 10 / Productivity | |
| Dell Inspiron 16 Plus 7630 | |
| Lenovo Legion 5 16IRX G9 | |
| Samsung Galaxy Book4 Ultra | |
| Dell Inspiron 16 Plus 7620 | |
| Media Intel Core Ultra 7 155H, NVIDIA GeForce RTX 4060 Laptop GPU (8079 - 9477, n=5) | |
| Asus VivoBook Pro 16 K6602VU | |
| Dell Inspiron 16 Plus 7640 | |
| PCMark 10 / Digital Content Creation | |
| Lenovo Legion 5 16IRX G9 | |
| Dell Inspiron 16 Plus 7630 | |
| Dell Inspiron 16 Plus 7640 | |
| Asus VivoBook Pro 16 K6602VU | |
| Media Intel Core Ultra 7 155H, NVIDIA GeForce RTX 4060 Laptop GPU (9811 - 11620, n=5) | |
| Samsung Galaxy Book4 Ultra | |
| Dell Inspiron 16 Plus 7620 | |
| CrossMark / Overall | |
| Lenovo Legion 5 16IRX G9 | |
| Dell Inspiron 16 Plus 7630 | |
| Dell Inspiron 16 Plus 7620 | |
| Samsung Galaxy Book4 Ultra | |
| Asus VivoBook Pro 16 K6602VU | |
| Dell Inspiron 16 Plus 7640 | |
| Media Intel Core Ultra 7 155H, NVIDIA GeForce RTX 4060 Laptop GPU (1540 - 1746, n=5) | |
| CrossMark / Productivity | |
| Lenovo Legion 5 16IRX G9 | |
| Dell Inspiron 16 Plus 7630 | |
| Asus VivoBook Pro 16 K6602VU | |
| Samsung Galaxy Book4 Ultra | |
| Dell Inspiron 16 Plus 7620 | |
| Media Intel Core Ultra 7 155H, NVIDIA GeForce RTX 4060 Laptop GPU (1436 - 1684, n=5) | |
| Dell Inspiron 16 Plus 7640 | |
| CrossMark / Creativity | |
| Lenovo Legion 5 16IRX G9 | |
| Dell Inspiron 16 Plus 7630 | |
| Samsung Galaxy Book4 Ultra | |
| Dell Inspiron 16 Plus 7640 | |
| Dell Inspiron 16 Plus 7620 | |
| Media Intel Core Ultra 7 155H, NVIDIA GeForce RTX 4060 Laptop GPU (1811 - 1929, n=5) | |
| Asus VivoBook Pro 16 K6602VU | |
| CrossMark / Responsiveness | |
| Lenovo Legion 5 16IRX G9 | |
| Dell Inspiron 16 Plus 7630 | |
| Asus VivoBook Pro 16 K6602VU | |
| Dell Inspiron 16 Plus 7620 | |
| Samsung Galaxy Book4 Ultra | |
| Media Intel Core Ultra 7 155H, NVIDIA GeForce RTX 4060 Laptop GPU (1165 - 1631, n=5) | |
| Dell Inspiron 16 Plus 7640 | |
| WebXPRT 3 / Overall | |
| Dell Inspiron 16 Plus 7630 | |
| Lenovo Legion 5 16IRX G9 | |
| Dell Inspiron 16 Plus 7620 | |
| Dell Inspiron 16 Plus 7640 | |
| Media Intel Core Ultra 7 155H, NVIDIA GeForce RTX 4060 Laptop GPU (274 - 290, n=5) | |
| Samsung Galaxy Book4 Ultra | |
| WebXPRT 4 / Overall | |
| Lenovo Legion 5 16IRX G9 | |
| Dell Inspiron 16 Plus 7630 | |
| Dell Inspiron 16 Plus 7620 | |
| Samsung Galaxy Book4 Ultra | |
| Dell Inspiron 16 Plus 7640 | |
| Media Intel Core Ultra 7 155H, NVIDIA GeForce RTX 4060 Laptop GPU (236 - 262, n=5) | |
| Asus VivoBook Pro 16 K6602VU | |
| Mozilla Kraken 1.1 / Total | |
| Media Intel Core Ultra 7 155H, NVIDIA GeForce RTX 4060 Laptop GPU (519 - 585, n=5) | |
| Asus VivoBook Pro 16 K6602VU | |
| Dell Inspiron 16 Plus 7620 | |
| Dell Inspiron 16 Plus 7640 | |
| Dell Inspiron 16 Plus 7630 | |
| Lenovo Legion 5 16IRX G9 | |
| Samsung Galaxy Book4 Ultra | |
* ... Meglio usare valori piccoli
| PCMark 10 Score | 7042 punti | |
Aiuto | ||
| AIDA64 / Memory Copy | |
| Samsung Galaxy Book4 Ultra | |
| Media Intel Core Ultra 7 155H (62397 - 96791, n=50) | |
| Dell Inspiron 16 Plus 7640 | |
| Lenovo Legion 5 16IRX G9 | |
| Dell Inspiron 16 Plus 7630 | |
| Asus VivoBook Pro 16 K6602VU | |
| Dell Inspiron 16 Plus 7620 | |
| AIDA64 / Memory Read | |
| Samsung Galaxy Book4 Ultra | |
| Media Intel Core Ultra 7 155H (60544 - 90647, n=50) | |
| Dell Inspiron 16 Plus 7640 | |
| Lenovo Legion 5 16IRX G9 | |
| Dell Inspiron 16 Plus 7630 | |
| Asus VivoBook Pro 16 K6602VU | |
| Dell Inspiron 16 Plus 7620 | |
| AIDA64 / Memory Write | |
| Samsung Galaxy Book4 Ultra | |
| Media Intel Core Ultra 7 155H (58692 - 93451, n=50) | |
| Dell Inspiron 16 Plus 7640 | |
| Asus VivoBook Pro 16 K6602VU | |
| Dell Inspiron 16 Plus 7630 | |
| Dell Inspiron 16 Plus 7620 | |
| Lenovo Legion 5 16IRX G9 | |
| AIDA64 / Memory Latency | |
| Media Intel Core Ultra 7 155H (116.2 - 233, n=50) | |
| Samsung Galaxy Book4 Ultra | |
| Dell Inspiron 16 Plus 7640 | |
| Dell Inspiron 16 Plus 7620 | |
| Dell Inspiron 16 Plus 7630 | |
| Asus VivoBook Pro 16 K6602VU | |
| Lenovo Legion 5 16IRX G9 | |
* ... Meglio usare valori piccoli
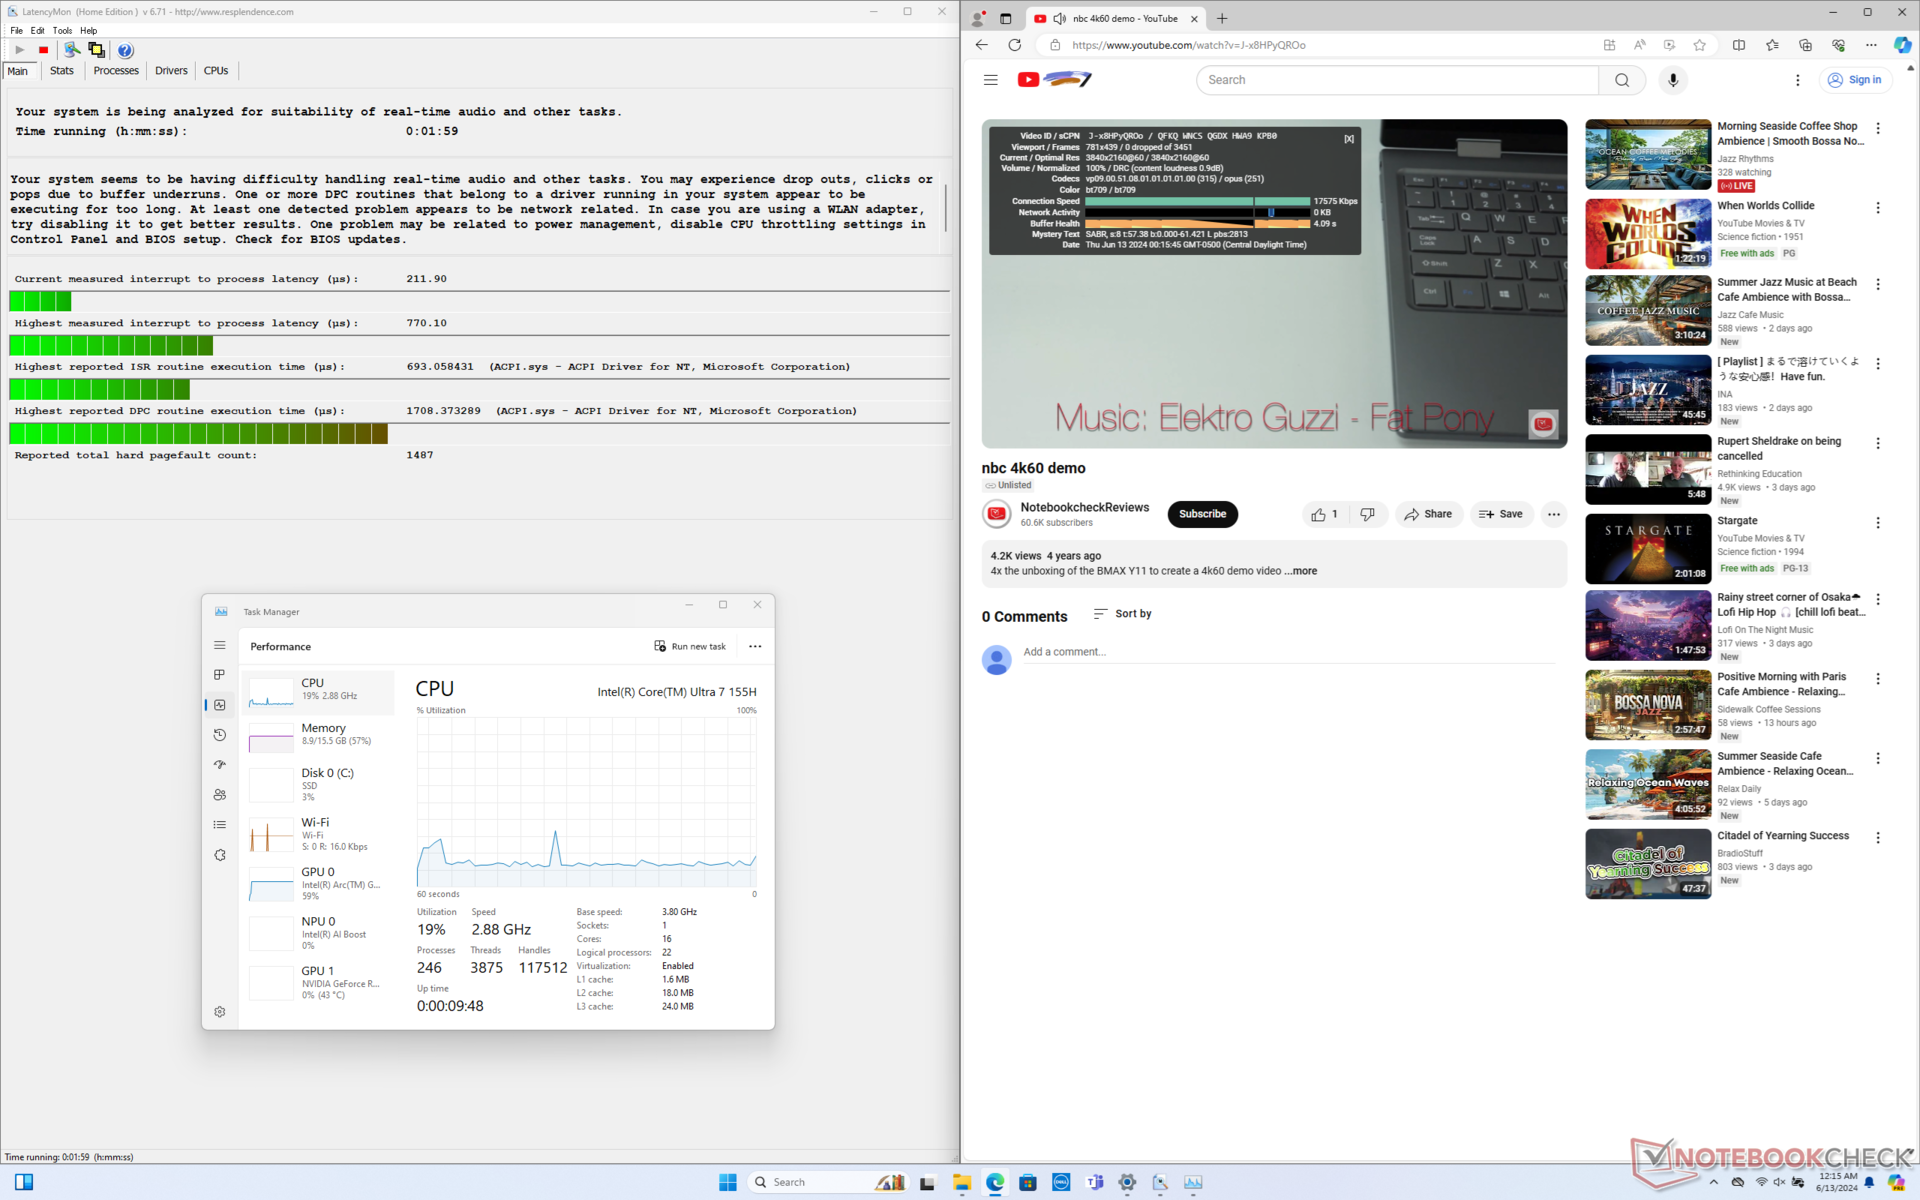
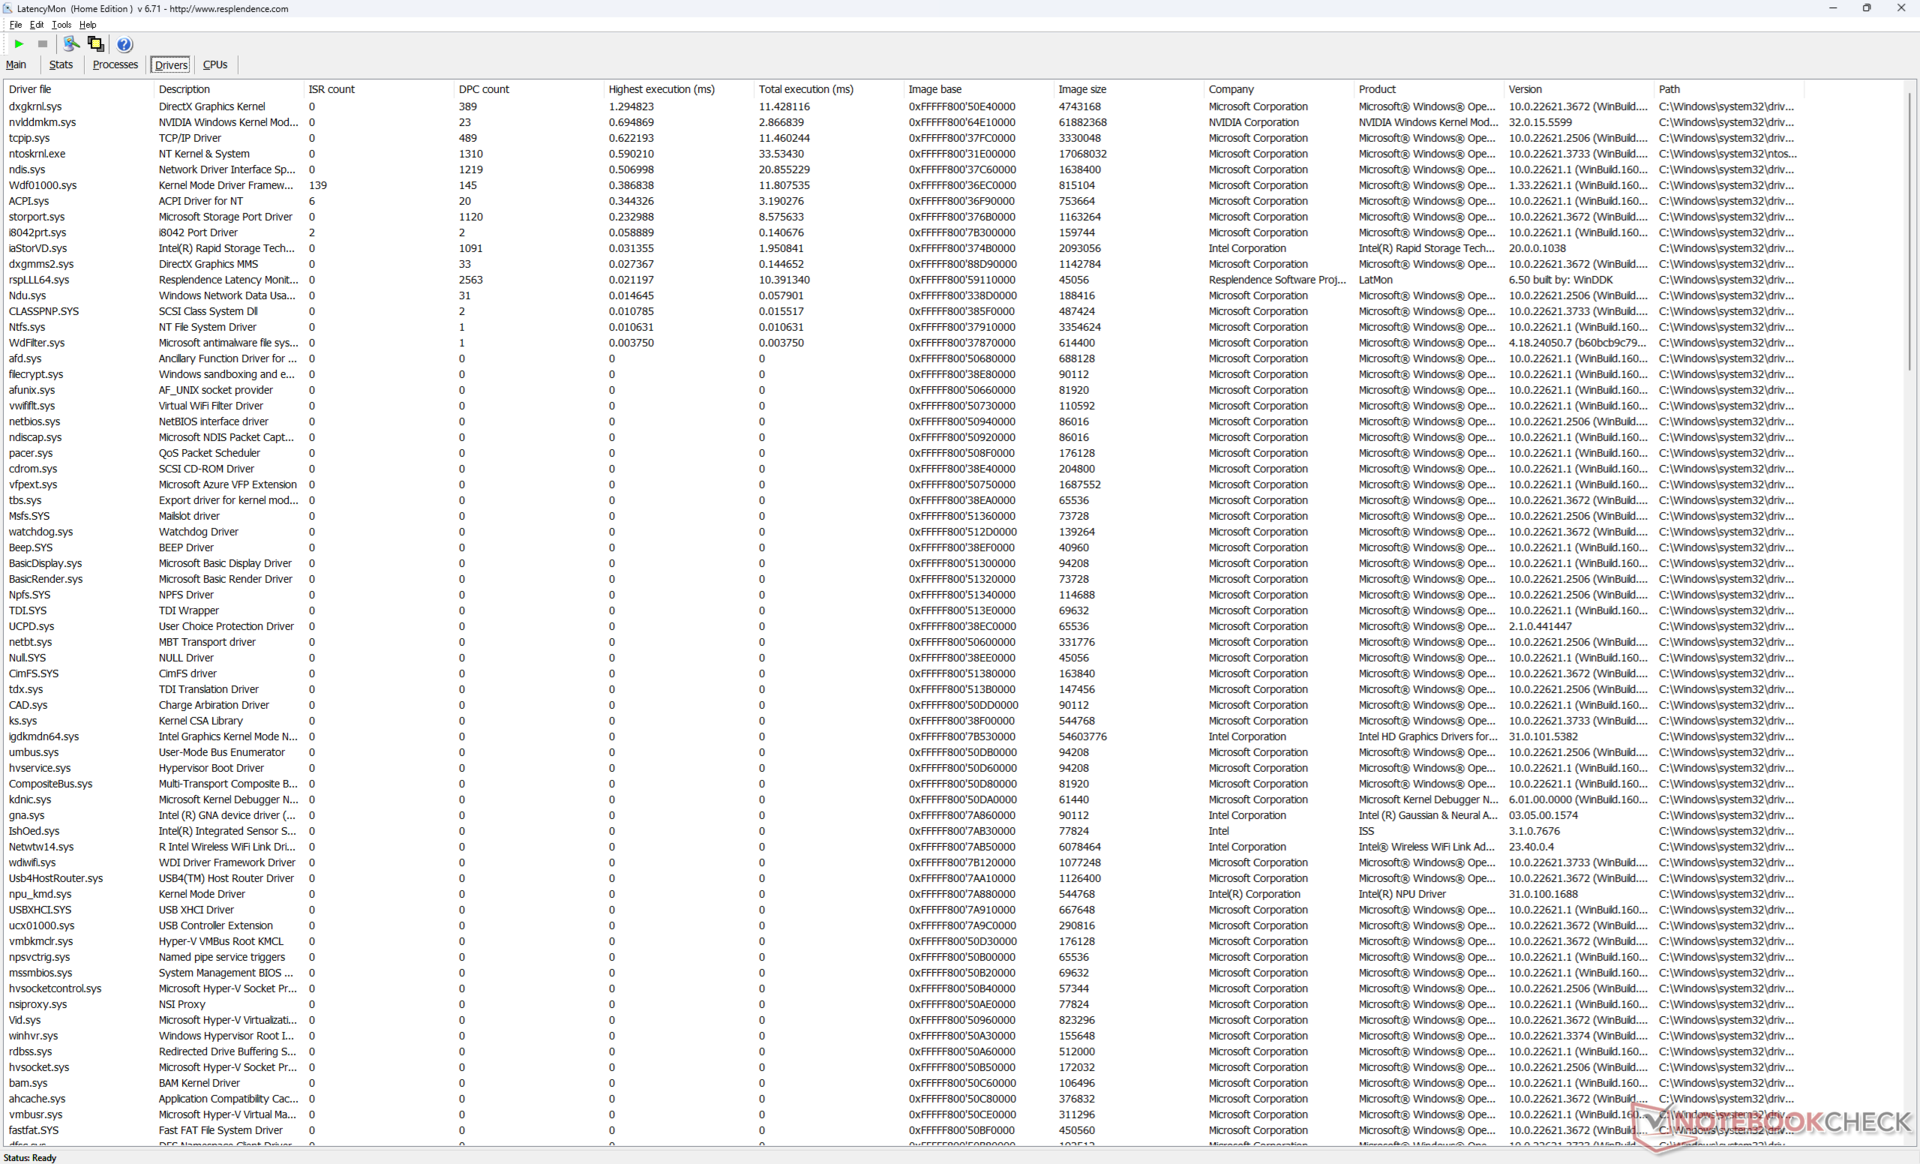
Latenza DPC
LatencyMon rivela solo lievi problemi di DPC quando si aprono più schede del browser della nostra homepage. la riproduzione di video 4K a 60 FPS è perfetta, senza alcuna perdita di fotogrammi.
| DPC Latencies / LatencyMon - interrupt to process latency (max), Web, Youtube, Prime95 | |
| Lenovo Legion 5 16IRX G9 | |
| Asus VivoBook Pro 16 K6602VU | |
| Dell Inspiron 16 Plus 7630 | |
| Dell Inspiron 16 Plus 7620 | |
| Dell Inspiron 16 Plus 7640 | |
| Samsung Galaxy Book4 Ultra | |
* ... Meglio usare valori piccoli
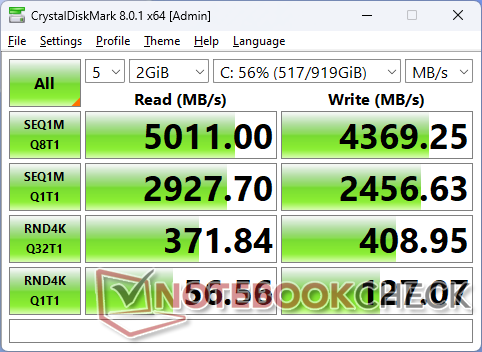
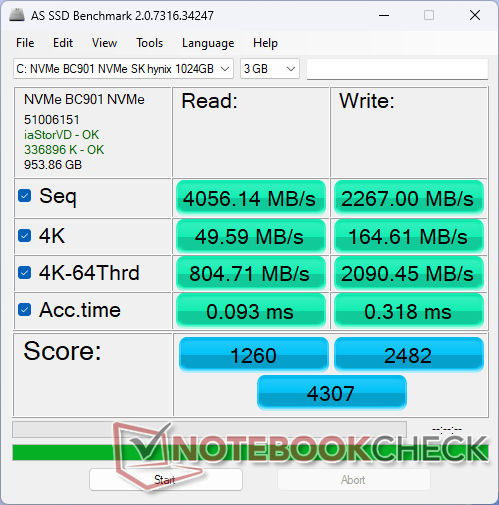
Dispositivi di archiviazione
La nostra unità di prova viene fornita con un unità SK Hynix più lenta al posto dell'unità Western Digital del modello dello scorso anno. L'unità SK Hynix è sensibilmente più lenta, come dimostrano i nostri test di benchmark, ma non soffre di alcun problema di strozzatura delle prestazioni, per una velocità di trasferimento complessivamente più stabile.

| Drive Performance Rating - Percent | |
| Lenovo Legion 5 16IRX G9 | |
| Samsung Galaxy Book4 Ultra | |
| Dell Inspiron 16 Plus 7630 | |
| Asus VivoBook Pro 16 K6602VU | |
| Dell Inspiron 16 Plus 7640 | |
| Dell Inspiron 16 Plus 7620 | |
* ... Meglio usare valori piccoli
Disk Throttling: DiskSpd Read Loop, Queue Depth 8
Prestazioni della GPU
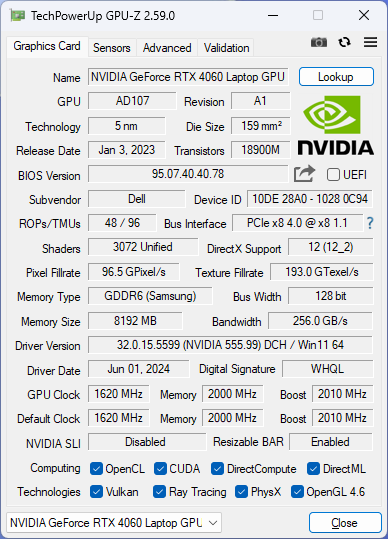
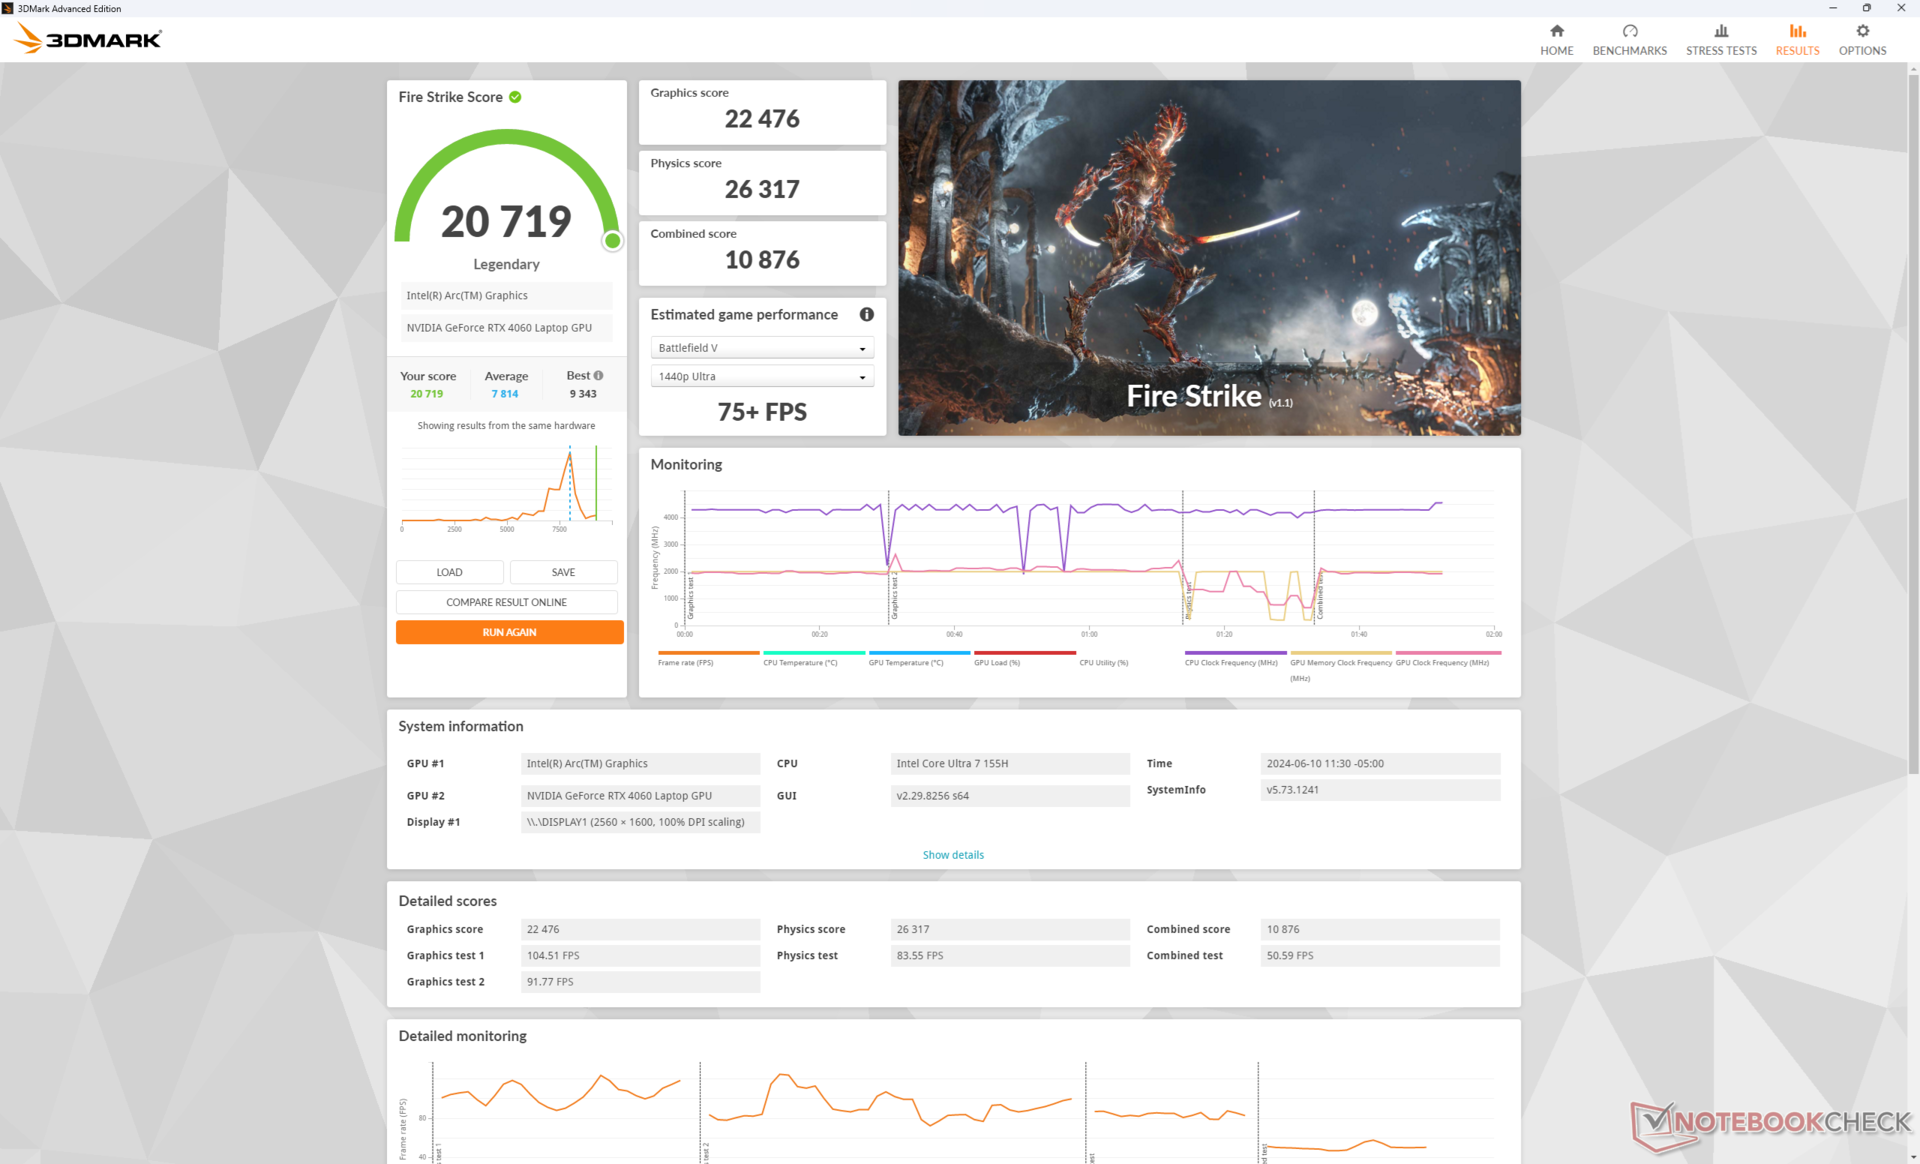
Le opzioni delle GPU Nvidia rimangono invariate con GeForce RTX 4050 e 4060 opzioni. i risultati di 3DMark sono superiori di qualche punto percentuale rispetto a prima, ma questo purtroppo non si traduce in prestazioni di gioco effettive.
Il downgrade alla RTX 4050 dovrebbe avere un impatto sulle prestazioni di appena il 10 percento. Optare per l'assenza di grafica discreta avrà un impatto molto più significativo sulle prestazioni, dal 60 all'80 percento.
| Profilo energetico | Punteggio grafico | Punteggio Fisica | Punteggio combinato |
| Modalità Prestazioni | 22476 | 26317 | 10876 |
| Modalità equilibrata | 22542 (-0%) | 27226 (-0%) | 10829 (-0%) |
| Alimentazione a batteria | 21957 (-2%) | 26817 (-0%) | 9623 (-12%) |
L'esecuzione in modalità Bilanciata invece che in modalità Prestazioni non sembra avere un impatto significativo sulle prestazioni, come mostra la nostra tabella dei risultati Fire Strike qui sopra. Anche l'esecuzione a batteria conserva abbastanza bene le prestazioni.
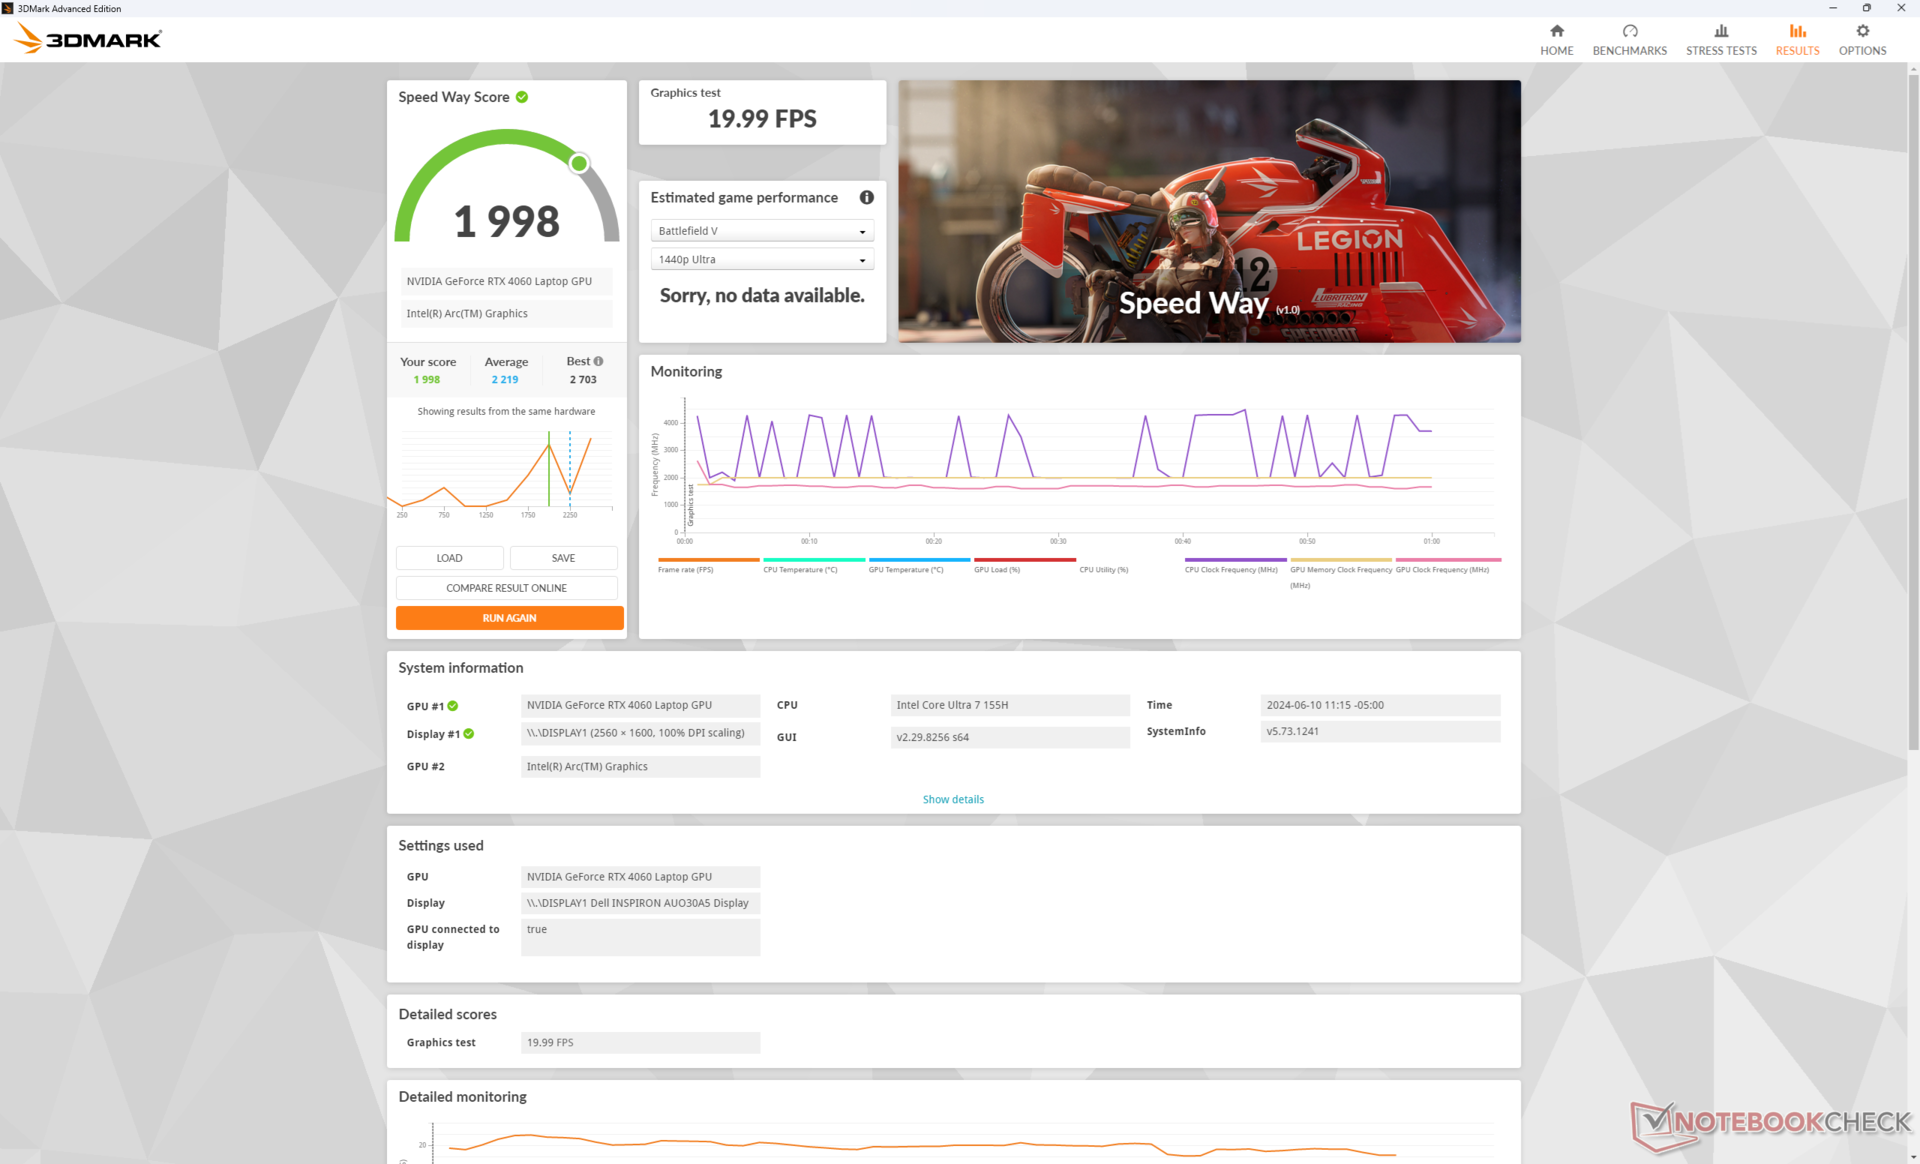

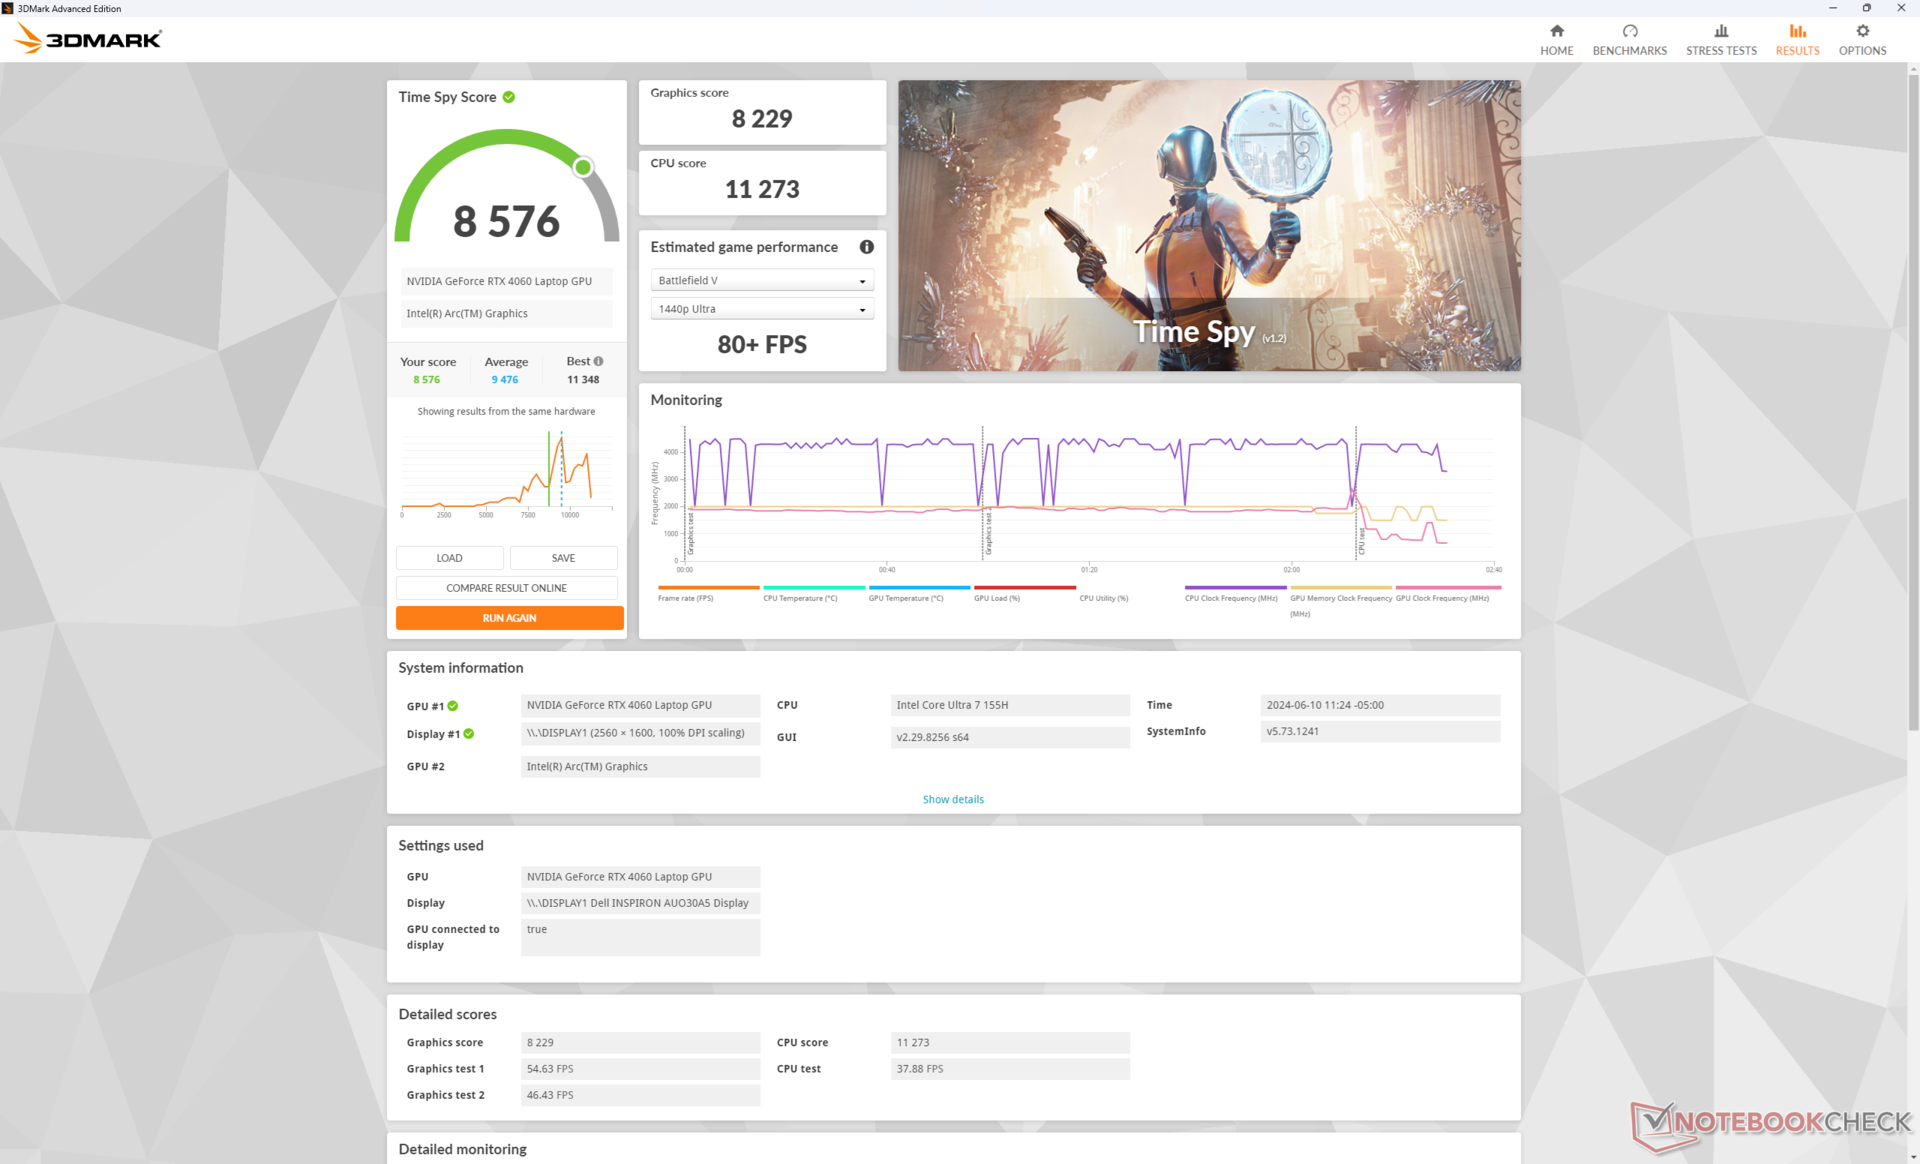
| 3DMark 11 Performance | 21491 punti | |
| 3DMark Fire Strike Score | 20719 punti | |
| 3DMark Time Spy Score | 8576 punti | |
| 3DMark Steel Nomad Score | 1829 punti | |
Aiuto | ||
* ... Meglio usare valori piccoli
Prestazioni di gioco
Le prestazioni nei giochi non sono cambiate e potrebbero addirittura essere leggermente peggiori di prima. Final Fantasy XV, ad esempio, può funzionare il 10 percento più lentamente rispetto all'Inspiron 16 Plus 7630 e si possono osservare deficit minori anche in altri giochi, tra cui F1 22 e Strange Brigade.
| Performance Rating - Percent | |
| Lenovo Legion 5 16IRX G9 | |
| Dell Inspiron 16 Plus 7630 | |
| Dell Inspiron 16 Plus 7640 | |
| Asus VivoBook Pro 16 K6602VU | |
| Dell Inspiron 16 Plus 7620 -1! | |
| Samsung Galaxy Book4 Ultra | |
| The Witcher 3 - 1920x1080 Ultra Graphics & Postprocessing (HBAO+) | |
| Lenovo Legion 5 16IRX G9 | |
| Dell Inspiron 16 Plus 7630 | |
| Dell Inspiron 16 Plus 7640 | |
| Asus VivoBook Pro 16 K6602VU | |
| Dell Inspiron 16 Plus 7620 | |
| Samsung Galaxy Book4 Ultra | |
| Final Fantasy XV Benchmark - 1920x1080 High Quality | |
| Lenovo Legion 5 16IRX G9 | |
| Dell Inspiron 16 Plus 7630 | |
| Dell Inspiron 16 Plus 7640 | |
| Asus VivoBook Pro 16 K6602VU | |
| Samsung Galaxy Book4 Ultra | |
| Dell Inspiron 16 Plus 7620 | |
| Strange Brigade - 1920x1080 ultra AA:ultra AF:16 | |
| Lenovo Legion 5 16IRX G9 | |
| Dell Inspiron 16 Plus 7630 | |
| Dell Inspiron 16 Plus 7640 | |
| Asus VivoBook Pro 16 K6602VU | |
| Samsung Galaxy Book4 Ultra | |
| Dell Inspiron 16 Plus 7620 | |
| Dota 2 Reborn - 1920x1080 ultra (3/3) best looking | |
| Lenovo Legion 5 16IRX G9 | |
| Dell Inspiron 16 Plus 7630 | |
| Dell Inspiron 16 Plus 7620 | |
| Dell Inspiron 16 Plus 7640 | |
| Samsung Galaxy Book4 Ultra | |
| Asus VivoBook Pro 16 K6602VU | |
| X-Plane 11.11 - 1920x1080 high (fps_test=3) | |
| Lenovo Legion 5 16IRX G9 | |
| Dell Inspiron 16 Plus 7630 | |
| Asus VivoBook Pro 16 K6602VU | |
| Dell Inspiron 16 Plus 7620 | |
| Dell Inspiron 16 Plus 7640 | |
| Samsung Galaxy Book4 Ultra | |
| Far Cry 5 - 1920x1080 Ultra Preset AA:T | |
| Lenovo Legion 5 16IRX G9 | |
| Dell Inspiron 16 Plus 7640 | |
| Asus VivoBook Pro 16 K6602VU | |
| Dell Inspiron 16 Plus 7630 | |
| Samsung Galaxy Book4 Ultra | |
| Baldur's Gate 3 | |
| 1920x1080 Low Preset | |
| Media NVIDIA GeForce RTX 4060 Laptop GPU (102.8 - 160.3, n=15) | |
| Dell Inspiron 16 Plus 7640 | |
| Framework Laptop 16 | |
| Lenovo Yoga 7 2-in-1 16IML9 | |
| 1920x1080 Medium Preset | |
| Media NVIDIA GeForce RTX 4060 Laptop GPU (77.5 - 125.7, n=18) | |
| Dell Inspiron 16 Plus 7640 | |
| Framework Laptop 16 | |
| 1920x1080 High Preset | |
| Media NVIDIA GeForce RTX 4060 Laptop GPU (68.7 - 110.7, n=18) | |
| Dell Inspiron 16 Plus 7640 | |
| Framework Laptop 16 | |
| 1920x1080 Ultra Preset | |
| Media NVIDIA GeForce RTX 4060 Laptop GPU (66.5 - 105.5, n=19) | |
| Dell Inspiron 16 Plus 7640 | |
| Framework Laptop 16 | |
| 2560x1440 Ultra Preset | |
| Media NVIDIA GeForce RTX 4060 Laptop GPU (45.2 - 72.2, n=14) | |
| Dell Inspiron 16 Plus 7640 | |
| Framework Laptop 16 | |
| Cyberpunk 2077 2.2 Phantom Liberty | |
| 1920x1080 Low Preset (FSR off) | |
| Lenovo Legion 5 16IRX G9 | |
| Media NVIDIA GeForce RTX 4060 Laptop GPU (96.7 - 136.1, n=22) | |
| Framework Laptop 16 | |
| Dell Inspiron 16 Plus 7640 | |
| Lenovo Yoga 7 2-in-1 16IML9 | |
| 1920x1080 Medium Preset (FSR off) | |
| Lenovo Legion 5 16IRX G9 | |
| Media NVIDIA GeForce RTX 4060 Laptop GPU (77.7 - 110.4, n=23) | |
| Dell Inspiron 16 Plus 7640 | |
| Framework Laptop 16 | |
| Lenovo Yoga 7 2-in-1 16IML9 | |
| 1920x1080 High Preset (FSR off) | |
| Lenovo Legion 5 16IRX G9 | |
| Media NVIDIA GeForce RTX 4060 Laptop GPU (65.2 - 102, n=26) | |
| Dell Inspiron 16 Plus 7640 | |
| Framework Laptop 16 | |
| Lenovo Yoga 7 2-in-1 16IML9 | |
| 1920x1080 Ultra Preset (FSR off) | |
| Lenovo Legion 5 16IRX G9 | |
| Media NVIDIA GeForce RTX 4060 Laptop GPU (56.4 - 93.1, n=31) | |
| Framework Laptop 16 | |
| Dell Inspiron 16 Plus 7640 | |
| Lenovo Yoga 7 2-in-1 16IML9 | |
| 2560x1440 Ultra Preset (FSR off) | |
| Lenovo Legion 5 16IRX G9 | |
| Media NVIDIA GeForce RTX 4060 Laptop GPU (32.9 - 51.8, n=19) | |
| Framework Laptop 16 | |
| Dell Inspiron 16 Plus 7640 | |
Witcher 3 FPS Chart
| basso | medio | alto | ultra | QHD | |
|---|---|---|---|---|---|
| The Witcher 3 (2015) | 375.8 | 276.8 | 160.3 | 84.1 | 61.9 |
| Dota 2 Reborn (2015) | 173.5 | 152.1 | 143.2 | 135.1 | |
| Final Fantasy XV Benchmark (2018) | 137.6 | 98.4 | 78.8 | 58.8 | |
| X-Plane 11.11 (2018) | 123.7 | 109 | 86.5 | ||
| Far Cry 5 (2018) | 138 | 125 | 118 | 110 | 83 |
| Strange Brigade (2018) | 360 | 225 | 178.1 | 153.5 | 105.2 |
| Tiny Tina's Wonderlands (2022) | 177.4 | 116 | 91.9 | 71.1 | 48 |
| F1 22 (2022) | 197 | 184.3 | 151.3 | 51.8 | 32.1 |
| Baldur's Gate 3 (2023) | 111.1 | 93.2 | 82.4 | 76.7 | 53.2 |
| Cyberpunk 2077 2.2 Phantom Liberty (2023) | 96.8 | 83.1 | 69.9 | 59.8 | 36.8 |
Emissioni
Rumore del sistema - Forte quando si gioca
Le ventole interne sono in grado di rimanere più silenziose più a lungo rispetto al modello dello scorso anno. Quando si esegue 3DMark 06, ad esempio, il rumore della ventola si aggira intorno ai 29 dB(A) fino alla fine della prima scena del benchmark, mentre l'Inspiron 16 Plus 7630 diventa molto più rumoroso, con 35 dB(A). I due portatili si stabilizzeranno altrimenti a oltre 50 dB(A) ciascuno quando si eseguono carichi più impegnativi come i giochi per un periodo di tempo più lungo.
Rumorosità
| Idle |
| 24.2 / 24.2 / 24.2 dB(A) |
| Sotto carico |
| 28.9 / 51 dB(A) |
 | ||
30 dB silenzioso 40 dB(A) udibile 50 dB(A) rumoroso |
||
min: | ||
| Dell Inspiron 16 Plus 7640 NVIDIA GeForce RTX 4060 Laptop GPU, Ultra 7 155H, SK hynix BC901 HFS001TEJ4X164N | Dell Inspiron 16 Plus 7630 NVIDIA GeForce RTX 4060 Laptop GPU, i7-13700H, WD PC SN740 SDDPTQD-1T00 | Dell Inspiron 16 Plus 7620 GeForce RTX 3050 Ti Laptop GPU, i7-12700H, Kioxia BG5 KBG50ZNS512G | Samsung Galaxy Book4 Ultra NVIDIA GeForce RTX 4050 Laptop GPU, Ultra 7 155H, Samsung PM9A1 MZVL2512HCJQ | Lenovo Legion 5 16IRX G9 NVIDIA GeForce RTX 4060 Laptop GPU, i7-14650HX, Samsung PM9A1 MZVL21T0HCLR | Asus VivoBook Pro 16 K6602VU NVIDIA GeForce RTX 4050 Laptop GPU, i9-13900H, Micron 2400 MTFDKBA1T0QFM | |
|---|---|---|---|---|---|---|
| Noise | -2% | -13% | 0% | -17% | -11% | |
| off /ambiente * | 23.8 | 23.2 3% | 23.3 2% | 24.2 -2% | 24 -1% | 20.96 12% |
| Idle Minimum * | 24.2 | 23.2 4% | 25.7 -6% | 24.2 -0% | 24 1% | 25.28 -4% |
| Idle Average * | 24.2 | 23.2 4% | 26.1 -8% | 24.2 -0% | 28.8 -19% | 25.28 -4% |
| Idle Maximum * | 24.2 | 23.2 4% | 30.6 -26% | 24.2 -0% | 32 -32% | 25.28 -4% |
| Load Average * | 28.9 | 35.1 -21% | 46.2 -60% | 37.9 -31% | 45.5 -57% | 51.88 -80% |
| Witcher 3 ultra * | 51 | 52.5 -3% | 49.2 4% | 41.7 18% | 53.1 -4% | 49 4% |
| Load Maximum * | 51 | 52.5 -3% | 49.4 3% | 41.7 18% | 55.7 -9% | 51.8 -2% |
* ... Meglio usare valori piccoli
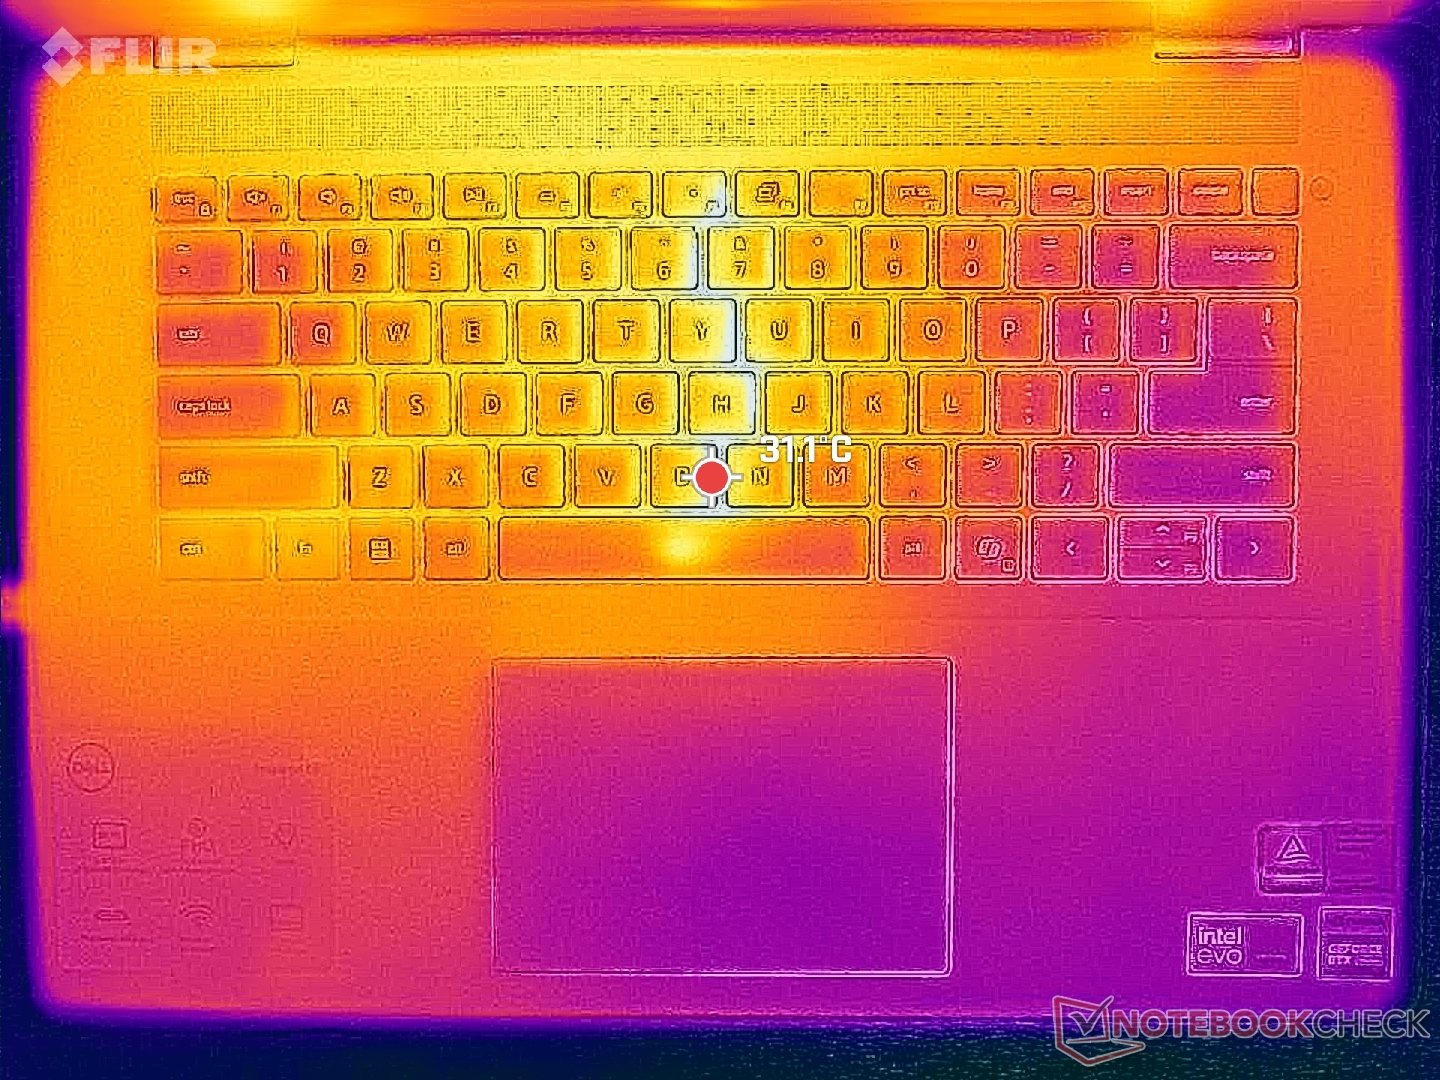
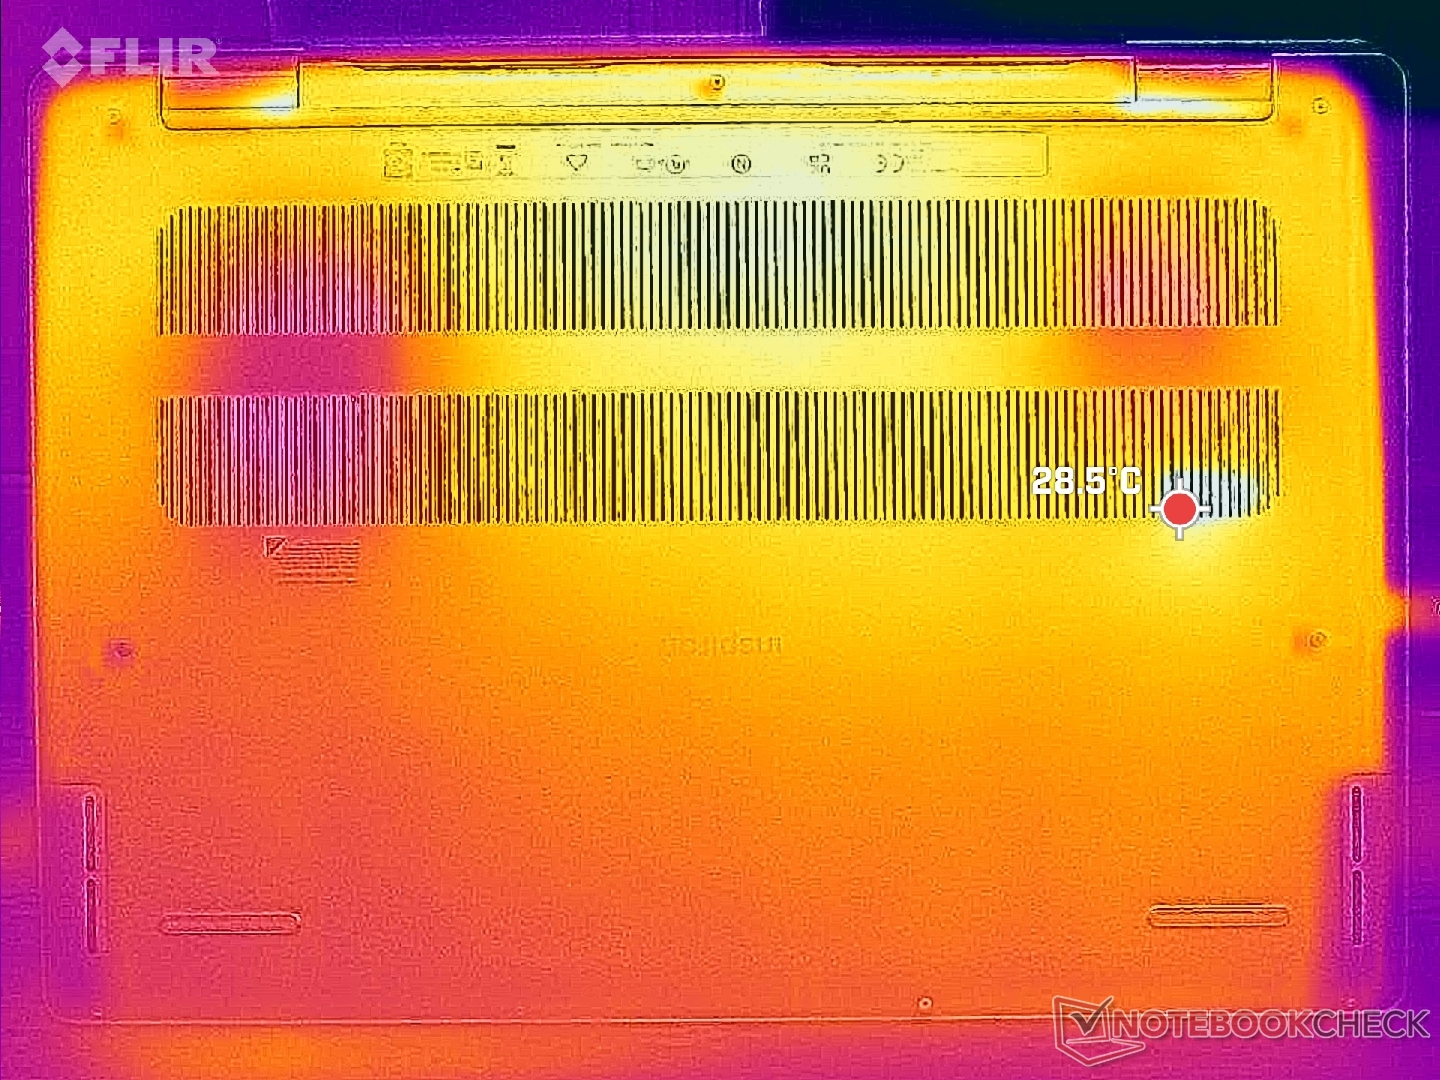
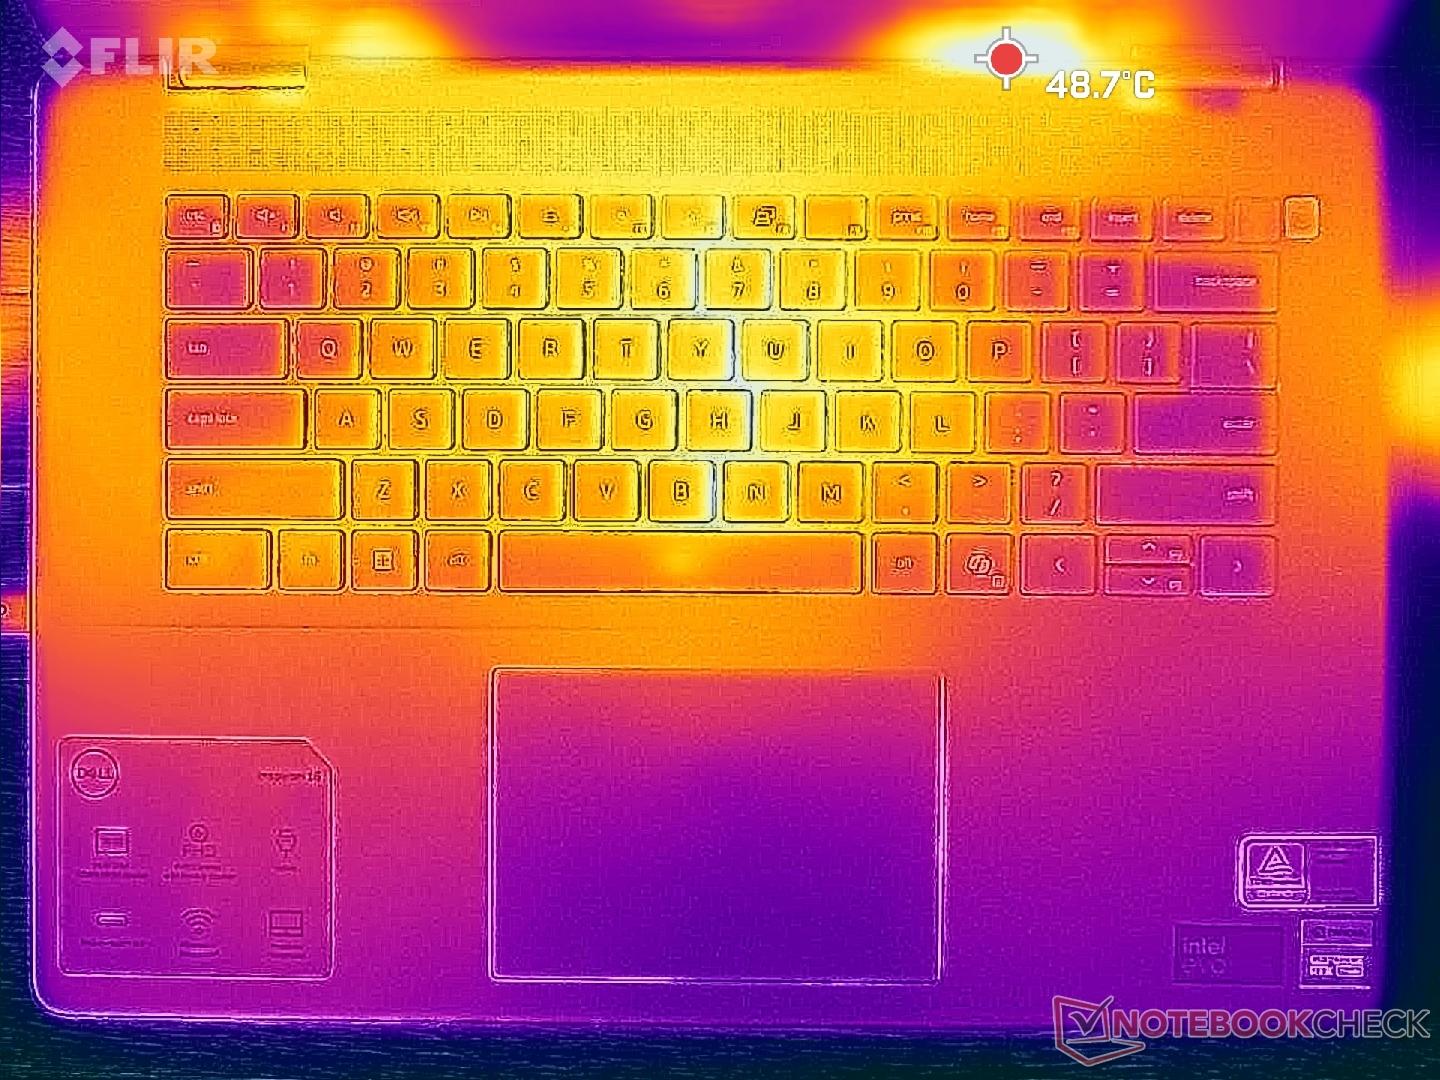
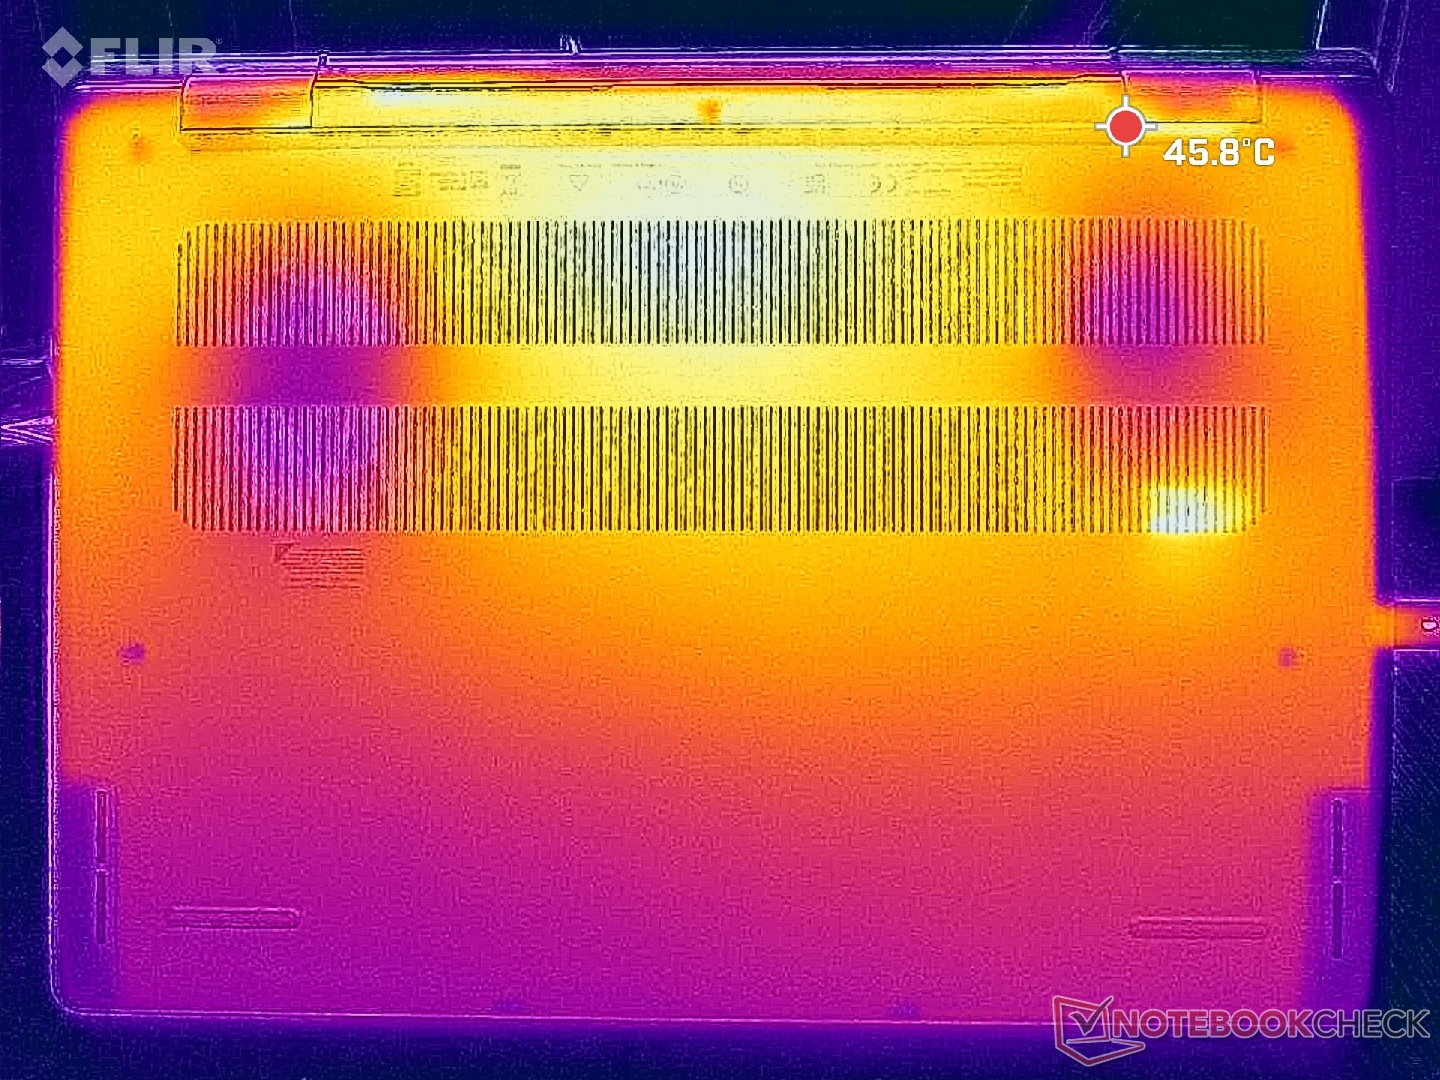
Temperatura
Le temperature di superficie possono diventare piuttosto calde, nonostante le numerose griglie di ventilazione lungo i bordi. I punti caldi durante i giochi possono raggiungere i 43 C su entrambe le coperture C e D dello chassis, per essere paragonabili al Lenovo Legion 5i 16 G9 laptop da gioco.
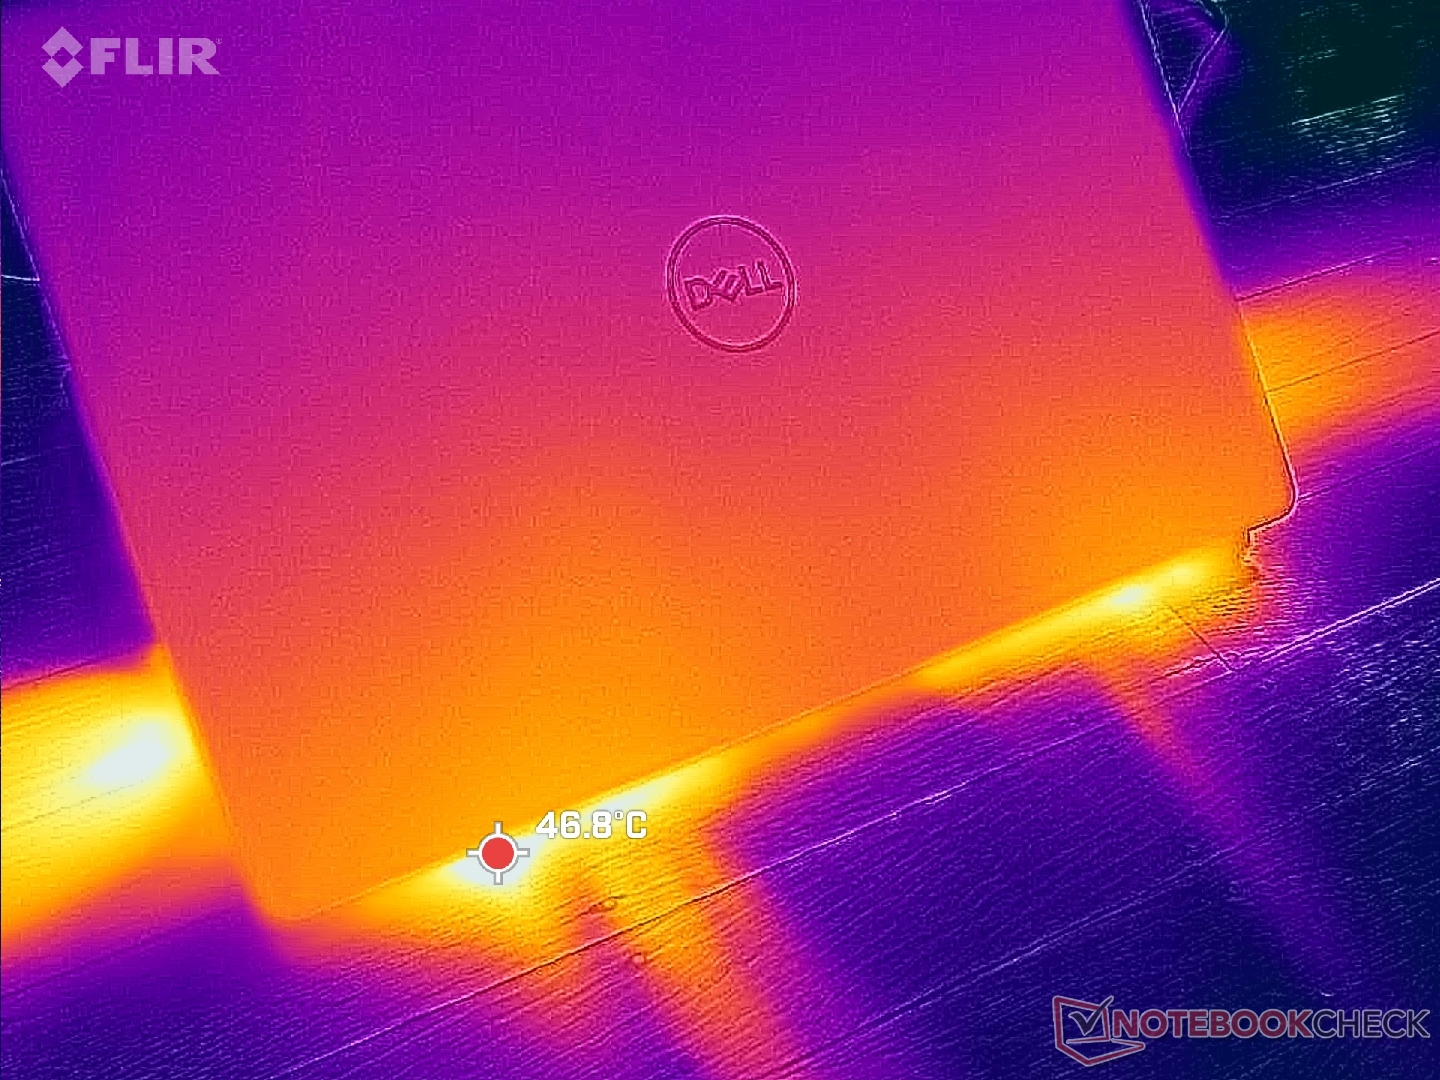
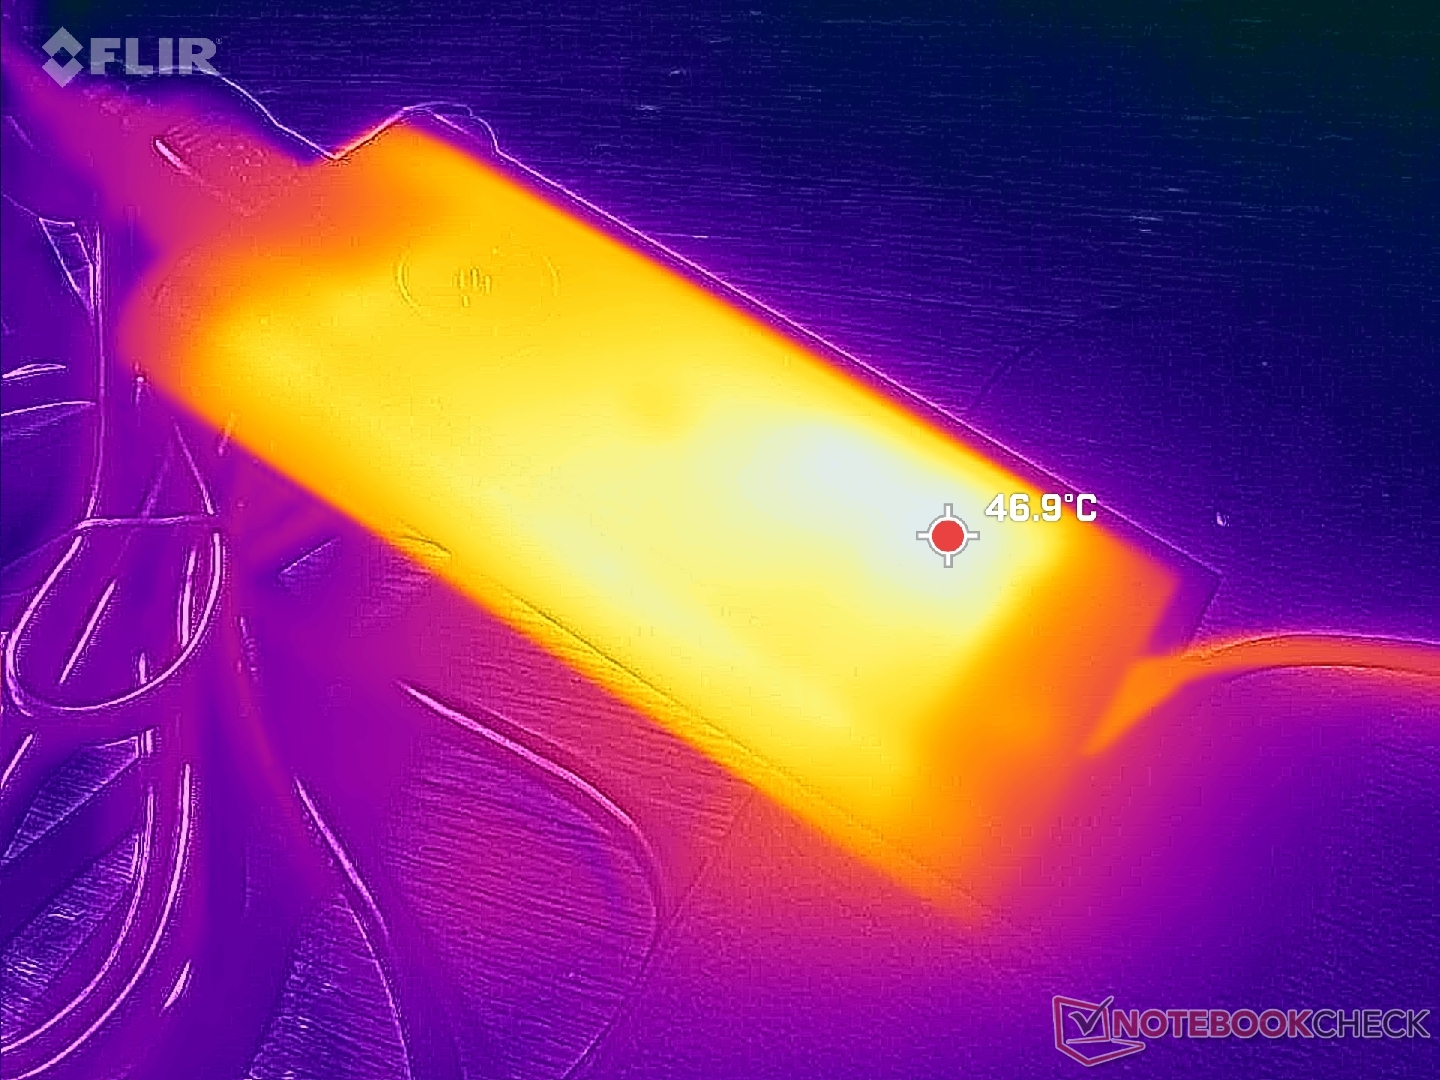
(±) La temperatura massima sul lato superiore è di 43.4 °C / 110 F, rispetto alla media di 36.9 °C / 98 F, che varia da 21.1 a 71 °C per questa classe Multimedia.
(±) Il lato inferiore si riscalda fino ad un massimo di 41.6 °C / 107 F, rispetto alla media di 39.2 °C / 103 F
(+) In idle, la temperatura media del lato superiore è di 29.9 °C / 86 F, rispetto alla media deld ispositivo di 31.3 °C / 88 F.
(+) I poggiapolsi e il touchpad raggiungono la temperatura massima della pelle (35.2 °C / 95.4 F) e quindi non sono caldi.
(-) La temperatura media della zona del palmo della mano di dispositivi simili e'stata di 28.8 °C / 83.8 F (-6.4 °C / -11.6 F).
| Dell Inspiron 16 Plus 7640 Intel Core Ultra 7 155H, NVIDIA GeForce RTX 4060 Laptop GPU | Dell Inspiron 16 Plus 7630 Intel Core i7-13700H, NVIDIA GeForce RTX 4060 Laptop GPU | Dell Inspiron 16 Plus 7620 Intel Core i7-12700H, NVIDIA GeForce RTX 3050 Ti Laptop GPU | Samsung Galaxy Book4 Ultra Intel Core Ultra 7 155H, NVIDIA GeForce RTX 4050 Laptop GPU | Lenovo Legion 5 16IRX G9 Intel Core i7-14650HX, NVIDIA GeForce RTX 4060 Laptop GPU | Asus VivoBook Pro 16 K6602VU Intel Core i9-13900H, NVIDIA GeForce RTX 4050 Laptop GPU | |
|---|---|---|---|---|---|---|
| Heat | -7% | -0% | 17% | 0% | -14% | |
| Maximum Upper Side * | 43.4 | 47.8 -10% | 46 -6% | 38.5 11% | 40.4 7% | 42.6 2% |
| Maximum Bottom * | 41.6 | 42.2 -1% | 45.8 -10% | 41.2 1% | 43.8 -5% | 48.4 -16% |
| Idle Upper Side * | 32.8 | 35.2 -7% | 29.2 11% | 23.5 28% | 30.3 8% | 39.4 -20% |
| Idle Bottom * | 32.4 | 35 -8% | 31 4% | 24.1 26% | 35.3 -9% | 39.8 -23% |
* ... Meglio usare valori piccoli
Altoparlanti
Dell Inspiron 16 Plus 7640 analisi audio
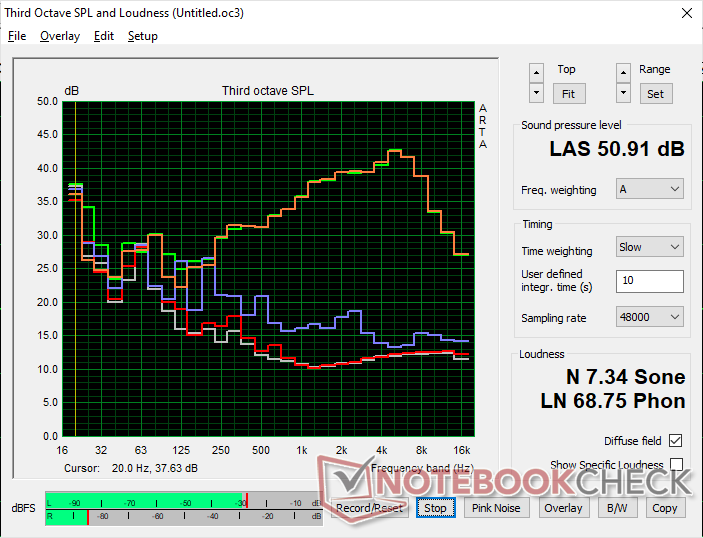
(+) | gli altoparlanti sono relativamente potenti (87.1 dB)
Bassi 100 - 315 Hz
(±) | bassi ridotti - in media 13.9% inferiori alla media
(±) | la linearità dei bassi è media (13.7% delta rispetto alla precedente frequenza)
Medi 400 - 2000 Hz
(+) | medi bilanciati - solo only 3.6% rispetto alla media
(+) | medi lineari (3.4% delta rispetto alla precedente frequenza)
Alti 2 - 16 kHz
(+) | Alti bilanciati - appena 4.3% dalla media
(+) | alti lineari (5.7% delta rispetto alla precedente frequenza)
Nel complesso 100 - 16.000 Hz
(+) | suono nel complesso lineare (11.3% differenza dalla media)
Rispetto alla stessa classe
» 13% di tutti i dispositivi testati in questa classe è stato migliore, 4% simile, 83% peggiore
» Il migliore ha avuto un delta di 5%, medio di 18%, peggiore di 45%
Rispetto a tutti i dispositivi testati
» 6% di tutti i dispositivi testati in questa classe è stato migliore, 2% similare, 92% peggiore
» Il migliore ha avuto un delta di 4%, medio di 24%, peggiore di 134%
Apple MacBook Pro 16 2021 M1 Pro analisi audio
(+) | gli altoparlanti sono relativamente potenti (84.7 dB)
Bassi 100 - 315 Hz
(+) | bassi buoni - solo 3.8% dalla media
(+) | bassi in lineaa (5.2% delta rispetto alla precedente frequenza)
Medi 400 - 2000 Hz
(+) | medi bilanciati - solo only 1.3% rispetto alla media
(+) | medi lineari (2.1% delta rispetto alla precedente frequenza)
Alti 2 - 16 kHz
(+) | Alti bilanciati - appena 1.9% dalla media
(+) | alti lineari (2.7% delta rispetto alla precedente frequenza)
Nel complesso 100 - 16.000 Hz
(+) | suono nel complesso lineare (4.6% differenza dalla media)
Rispetto alla stessa classe
» 0% di tutti i dispositivi testati in questa classe è stato migliore, 0% simile, 100% peggiore
» Il migliore ha avuto un delta di 5%, medio di 18%, peggiore di 45%
Rispetto a tutti i dispositivi testati
» 0% di tutti i dispositivi testati in questa classe è stato migliore, 0% similare, 100% peggiore
» Il migliore ha avuto un delta di 4%, medio di 24%, peggiore di 134%
Gestione dell'energia
Consumo di energia
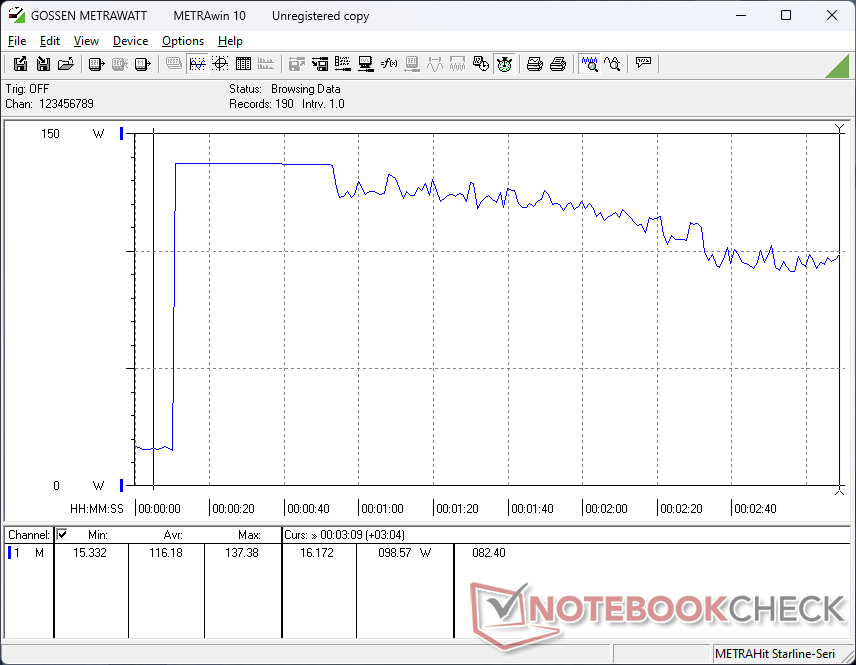
Il consumo di energia è notevolmente inferiore rispetto al modello dello scorso anno quando è al minimo sul desktop, il che può spiegare la durata della batteria generalmente più lunga nella sezione successiva. Il sistema richiede tra i 4 W e i 16 W, rispetto ai 16 W - 21 W dell'Inspiron 16 Plus 7630. Il consumo durante l'esecuzione di applicazioni più impegnative come i giochi è quasi lo stesso, se non leggermente inferiore di qualche watt.
È interessante notare che il modello viene fornito con un adattatore AC USB-C universale da 130 W (~14,3 x 6,5 x 2,2 cm) invece del caricatore AC proprietario da 130 W in dotazione con il modello dello scorso anno. Tuttavia, la porta dell'adattatore CA a barile rimane, il che significa che può ancora ricaricare il sistema tramite un caricatore a barile compatibile. Siamo riusciti a registrare un assorbimento massimo temporaneo di 138 W quando si eseguono Prime95 e FurMark contemporaneamente.
| Off / Standby | |
| Idle | |
| Sotto carico |
|
Leggenda:
min: | |
| Dell Inspiron 16 Plus 7640 Ultra 7 155H, NVIDIA GeForce RTX 4060 Laptop GPU, SK hynix BC901 HFS001TEJ4X164N, IPS, 2560x1600, 16" | Dell Inspiron 16 Plus 7630 i7-13700H, NVIDIA GeForce RTX 4060 Laptop GPU, WD PC SN740 SDDPTQD-1T00, IPS, 2560x1600, 16" | Dell Inspiron 16 Plus 7620 i7-12700H, GeForce RTX 3050 Ti Laptop GPU, Kioxia BG5 KBG50ZNS512G, IPS, 3072x1920, 16" | Samsung Galaxy Book4 Ultra Ultra 7 155H, NVIDIA GeForce RTX 4050 Laptop GPU, Samsung PM9A1 MZVL2512HCJQ, OLED, 2880x1800, 16" | Lenovo Legion 5 16IRX G9 i7-14650HX, NVIDIA GeForce RTX 4060 Laptop GPU, Samsung PM9A1 MZVL21T0HCLR, IPS, 2560x1600, 16" | Asus VivoBook Pro 16 K6602VU i9-13900H, NVIDIA GeForce RTX 4050 Laptop GPU, Micron 2400 MTFDKBA1T0QFM, OLED, 3200x2000, 16" | |
|---|---|---|---|---|---|---|
| Power Consumption | -82% | -30% | 9% | -113% | -116% | |
| Idle Minimum * | 4.2 | 15.6 -271% | 6.8 -62% | 4.8 -14% | 15.4 -267% | 21.06 -401% |
| Idle Average * | 6.9 | 17.7 -157% | 9.6 -39% | 7.5 -9% | 19.7 -186% | 24.27 -252% |
| Idle Maximum * | 15.2 | 20.6 -36% | 17 -12% | 7.9 48% | 20.7 -36% | 25.12 -65% |
| Load Average * | 70.4 | 87.4 -24% | 117.5 -67% | 79.3 -13% | 102.6 -46% | 52.4 26% |
| Witcher 3 ultra * | 115.9 | 121.7 -5% | 113.1 2% | 79.2 32% | 191.3 -65% | 110.2 5% |
| Load Maximum * | 137.4 | 138 -0% | 137.4 -0% | 125 9% | 246.6 -79% | 146 -6% |
* ... Meglio usare valori piccoli
Power Consumption Witcher 3 / Stresstest
Power Consumption external Monitor
Durata della batteria
I tempi di esecuzione sono molto più lunghi rispetto al passato, probabilmente grazie alle ottimizzazioni e al passaggio a una CPU Intel di nuova generazione. Siamo riusciti a registrare una durata della batteria WLAN in condizioni reali di quasi 13,5 ore, rispetto alle 9,5 ore del modello dello scorso anno.
La ricarica da vuoto a piena capacità richiede circa 2 ore con l'adattatore USB-C incluso.
| Dell Inspiron 16 Plus 7640 Ultra 7 155H, NVIDIA GeForce RTX 4060 Laptop GPU, 90 Wh | Dell Inspiron 16 Plus 7630 i7-13700H, NVIDIA GeForce RTX 4060 Laptop GPU, 86 Wh | Dell Inspiron 16 Plus 7620 i7-12700H, GeForce RTX 3050 Ti Laptop GPU, 86 Wh | Samsung Galaxy Book4 Ultra Ultra 7 155H, NVIDIA GeForce RTX 4050 Laptop GPU, 76 Wh | Lenovo Legion 5 16IRX G9 i7-14650HX, NVIDIA GeForce RTX 4060 Laptop GPU, 80 Wh | Asus VivoBook Pro 16 K6602VU i9-13900H, NVIDIA GeForce RTX 4050 Laptop GPU, 96 Wh | |
|---|---|---|---|---|---|---|
| Autonomia della batteria | -29% | -28% | -18% | -44% | -24% | |
| WiFi v1.3 | 799 | 566 -29% | 575 -28% | 656 -18% | 444 -44% | 606 -24% |
| Reader / Idle | 1055 | 1114 | ||||
| Load | 85 | 69 | 78 | 46 | ||
| H.264 | 1076 | 576 | 585 |
Pro
Contro
Verdetto - Ritocco di alcune piccole lacune
Sebbene l'Inspiron 16 Plus 7640 del 2024 possa assomigliare molto alla versione versione 2023ma ha apportato abbastanza novità, oltre al previsto aggiornamento annuale del processore, di cui gli acquirenti interessati potrebbero voler essere a conoscenza. Il nuovo modello supporta fino a due SSD, offre tempi di risposta più rapidi in bianco e nero e in grigio, una maggiore durata della batteria e l'accelerazione AI. Questi cambiamenti sotto il cofano sono importanti per gli appassionati che apprezzano l'espansione dell'archiviazione, i giochi veloci, i viaggi e i programmi assistiti dall'AI come Co-Pilot. A questo proposito, l'Inspiron 16 Plus 7640 diventa una scelta obbligata rispetto al suo predecessore.
L'Inspiron 16 Plus 7640 risolve alcuni degli svantaggi del suo predecessore per essere una macchina multimediale ancora migliore di prima. Le prestazioni della CPU single-thread e le prestazioni di gioco, tuttavia, fanno un piccolo passo indietro.
Purtroppo, le prestazioni di gioco subiscono un colpo con il nuovo modello, in quanto la maggior parte dei giochi tende a girare un po' più lentamente rispetto a prima. I giocatori più accaniti potrebbero trovarlo deludente, ma il deficit non dovrebbe essere sufficiente a scoraggiare i giocatori occasionali, per i quali la serie Inspiron è stata progettata. I giocatori che desiderano davvero ottenere maggiori prestazioni dai loro computer portatili dovranno prendere in considerazione modelli più grandi e più costosi, come quelli della serie Dell G16, Asus Zephyrus G16o Razer Blade serie 16 dove il TGP può spesso raggiungere la tripla cifra.
Prezzo e disponibilità
La nostra configurazione per la recensione con Core Ultra 7, RTX 4060 e 1600p viene attualmente spedita direttamente da Dell a 1300 dollari. Nel frattempo, la SKU Core i7 con UHD Graphics di fascia bassa parte da soli 900 dollari.
Dell Inspiron 16 Plus 7640
- 06/21/2024 v8
Allen Ngo
Transparency
La selezione dei dispositivi da recensire viene effettuata dalla nostra redazione. Il campione di prova è stato fornito all'autore come prestito dal produttore o dal rivenditore ai fini di questa recensione. L'istituto di credito non ha avuto alcuna influenza su questa recensione, né il produttore ne ha ricevuto una copia prima della pubblicazione. Non vi era alcun obbligo di pubblicare questa recensione. Non accettiamo mai compensi o pagamenti in cambio delle nostre recensioni. In quanto società mediatica indipendente, Notebookcheck non è soggetta all'autorità di produttori, rivenditori o editori.
Ecco come Notebookcheck esegue i test
Ogni anno, Notebookcheck esamina in modo indipendente centinaia di laptop e smartphone utilizzando procedure standardizzate per garantire che tutti i risultati siano comparabili. Da circa 20 anni sviluppiamo continuamente i nostri metodi di prova e nel frattempo stabiliamo gli standard di settore. Nei nostri laboratori di prova, tecnici ed editori esperti utilizzano apparecchiature di misurazione di alta qualità. Questi test comportano un processo di validazione in più fasi. Il nostro complesso sistema di valutazione si basa su centinaia di misurazioni e parametri di riferimento ben fondati, che mantengono l'obiettività.Price comparison

