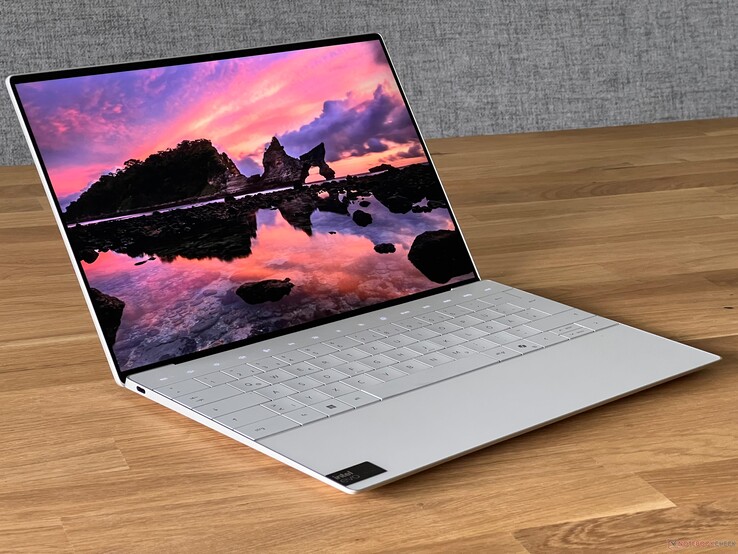
Recensione del computer portatile Dell XPS 13 9340 - subnotebook compatto con buona autonomia e alcuni difetti
Dopo aver testato in precedenza i nuovi modelli da 14 e 16 pollici dell'ultima serie XPS, è ora il momento di dare un'occhiata al compatto Dell XPS 13 9340. Il vecchio XPS 13 Plusche ha ispirato il design dei nuovi modelli, non è più disponibile. Tuttavia, Dell offre un modello più sottile XPS 13 9315 con i vecchi processori Alder Lake e dispositivi di input convenzionali; a parte questo, hanno un case identico.
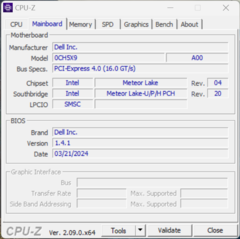
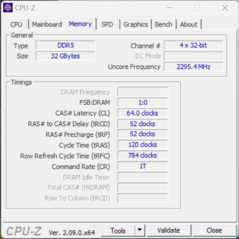
Il nostro dispositivo di prova è dotato del nuovo processore Meteor Lake - Core Ultra 7 155H- oltre a 32 GB di RAM, un SSD PCIe da 512 GB e un pannello Full HD. Il prezzo richiesto da Dell per questa configurazione è di 1.599 dollari (il prezzo di lancio con il Core Ultra 5 e 16 GB di RAM è di 1.149 dollari). È possibile aumentare questo prezzo fino a un massimo di 2.659 dollari (Core Ultra 7, 64 GB di RAM, 2-TB SSD, QHD+).
Potenziali concorrenti a confrontos
Punteggio | Data | Modello | Peso | Altezza | Dimensione | Risoluzione | Prezzo |
|---|---|---|---|---|---|---|---|
| 86.5 % v7 (old) | 05/2024 | Dell XPS 13 9340 Core Ultra 7 Ultra 7 155H, Arc 8-Core | 1.2 kg | 15.3 mm | 13.40" | 1920x1200 | |
| 92.4 % v7 (old) | 03/2024 | Apple MacBook Air 13 M3 10C GPU M3, M3 10-Core GPU | 1.2 kg | 11.3 mm | 13.60" | 2560x1664 | |
| 85.4 % v7 (old) | 05/2023 | Asus ZenBook S13 OLED UX5304 i7-1355U, Iris Xe G7 96EUs | 1 kg | 11.8 mm | 13.30" | 2880x1800 | |
| 89.5 % v7 (old) | 01/2024 | Lenovo ThinkPad Z13 Gen 2 R7 PRO 7840U, Radeon 780M | 1.2 kg | 13.99 mm | 13.30" | 2880x1800 | |
| 91.9 % v7 (old) | 07/2023 | HP Dragonfly G4 i7-1365U, Iris Xe G7 96EUs | 1.1 kg | 16.3 mm | 13.50" | 1920x1280 |
I nostri Top 10
» Top 10 Portatili Multimedia
» Top 10 Portatili Gaming
» Top 10 Portatili Gaming Leggeri
» Top 10 Portatili da Ufficio e Business economici
» Top 10 Portatili Premium da Ufficio/Business
» Top 10 Portatili sotto i 300 Euro
» Top 10 Portatili sotto i 500 Euro
» Top 10 dei Portatili Workstation
» Top 10 Subnotebooks
» Top 10 Ultrabooks
» Top 10 Convertibili
» Top 10 Tablets
» Top 10 Tablets Windows
» Top 10 Smartphones
Custodia - Stabile alluminio
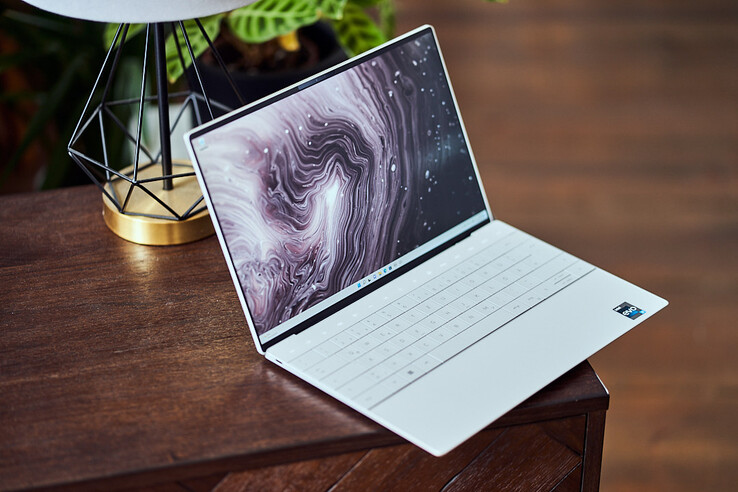
Dell ha introdotto il suo attuale design XPS qualche tempo fa sull'XPS 13 Plus, e ora lo utilizza per l'intera serie. Riteniamo che il design funzioni al meglio sul piccolo XPS 13 9340, in quanto il dispositivo risulta estremamente compatto (soprattutto in confronto all'ingombrante XPS 14). Oltre alla variante argento, il produttore offre anche un modello grigio scuro. Il dispositivo sembra di alta qualità e non abbiamo notato alcun problema di costruzione. Inoltre, non sembra essere una calamita per le impronte digitali.
Il coperchio del display può essere aperto facilmente con una mano e, a parte i suoi dispositivi di input unici (di cui parleremo più avanti), le cornici sottili del portatile catturano immediatamente l'attenzione. Le cerniere sono ben regolate, tuttavia l'angolo di apertura massimo dello schermo è limitato a ~135 gradi. La stabilità dell'unità base è ottima e, anche se abbiamo esercitato una forte pressione, siamo riusciti ad ammaccare la tastiera solo leggermente. Lo stesso si può dire per il coperchio del display, dal quale non siamo riusciti a ricavare alcun errore di immagine.
L'XPS 13 9340 è il dispositivo più compatto del nostro gruppo di confronto e non occupa molto spazio. Questo è utile se si viaggia (treno, aereo), ad esempio. Con un peso di poco superiore a 1,2 kg, tuttavia, non è il modello più leggero. Anche l'alimentatore da 60 watt in dotazione è piuttosto compatto e, insieme al cavo USB-C, aggiunge altri 256 grammi alla bilancia.
Connettività - L'XPS 13 senza jack audio
Rispetto ai suoi due fratelli più grandi, l'XPS 13 deve recuperare molto terreno per quanto riguarda le porte, in quanto sia il lettore di schede che il jack audio sono stati rimossi. Ha solo una porta USB-C con Thunderbolt 4 su ciascun lato. In pratica, è bello poter collegare l'alimentatore su entrambi i lati, ma questo lascia spesso una sola porta libera da utilizzare.
Comunicazione
Il modulo WLAN Intel BE200 supporta già il Wi-Fi 7 e il Bluetooth 5.4. Durante il nostro test WLAN, ha fornito velocità di trasferimento complessivamente elevate e stabili in combinazione con il nostro router di riferimento di Asus. Non abbiamo notato alcun problema durante l'intera fase di test.
| Networking | |
| Dell XPS 13 9340 Core Ultra 7 | |
| iperf3 transmit AXE11000 | |
| iperf3 receive AXE11000 | |
| Apple MacBook Air 13 M3 10C GPU | |
| iperf3 transmit AXE11000 | |
| iperf3 receive AXE11000 | |
| Asus ZenBook S13 OLED UX5304 | |
| iperf3 transmit AXE11000 | |
| iperf3 receive AXE11000 | |
| Lenovo ThinkPad Z13 Gen 2 | |
| iperf3 transmit AXE11000 | |
| iperf3 receive AXE11000 | |
| iperf3 transmit AXE11000 6GHz | |
| iperf3 receive AXE11000 6GHz | |
| HP Dragonfly G4 | |
| iperf3 transmit AXE11000 | |
| iperf3 receive AXE11000 | |
| iperf3 transmit AXE11000 6GHz | |
| iperf3 receive AXE11000 6GHz | |
| Dell XPS 13 Plus 9320 Core i7-1360P | |
| iperf3 transmit AXE11000 | |
| iperf3 receive AXE11000 | |
| iperf3 transmit AXE11000 6GHz | |
| iperf3 receive AXE11000 6GHz | |
Webcam
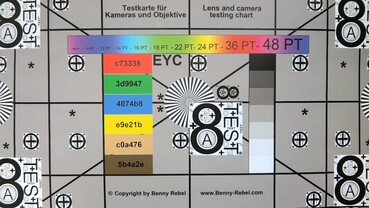
La fotocamera da 1080p installata nel bordo superiore del display scatta foto decenti e, in combinazione con il processore Meteor Lake, si suppone che gli effetti di studio (come il soft focus dello sfondo) facciano parte del sistema operativo del portatile. Inoltre, il dispositivo può utilizzare una telecamera IR per il riconoscimento facciale tramite Windows Hello.

Manutenzione
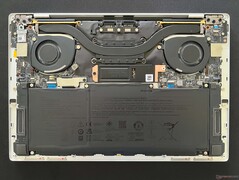
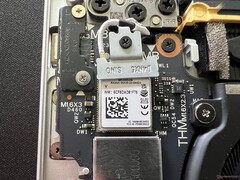
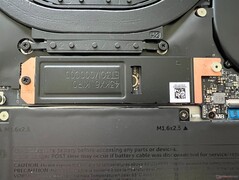
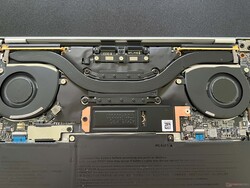
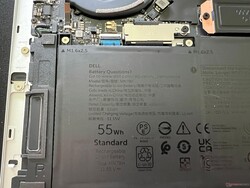
Il coperchio inferiore è fissato con viti Torx (T5) e può essere rimosso facilmente. All'interno, invece, le opzioni di manutenzione si limitano alla pulizia delle ventole e alla sostituzione dell'SSD M.2-2280 che si trova sotto un'ulteriore copertura. La batteria è avvitata e può essere sostituita se necessario.
Dispositivi di input - La tastiera richiede un po' di tempo per abituarsi e i tasti funzione sono fastidiosi
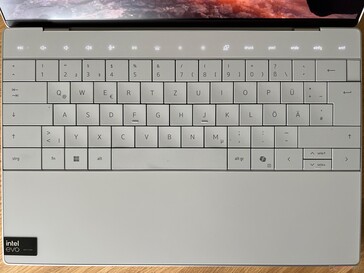
Come sul vecchio XPS 13 Plus, il design della tastiera di questo modello non presenta alcuna spaziatura tra i singoli tasti. I tasti stessi sono leggermente concavi e in generale sono comodi da digitare, in quanto la pressione dei tasti è precisa. Tuttavia, abbiamo notato alcuni problemi: spesso abbiamo toccato il tasto sbagliato per sbaglio e bisogna abituarsi alla tastiera. Abbiamo anche trovato un po' fastidiosi i minuscoli tasti freccia verticali, che si possono colpire a malapena con le dita più grandi. Inoltre, il suono dei tasti più grandi (barra spaziatrice, invio) è notevolmente più forte. Il pulsante di accensione (che include uno scanner di impronte digitali) si trova in alto a destra, dove di solito ci si aspetterebbe che si trovi il tasto Esc, e questo ci porta al nostro prossimo problema.
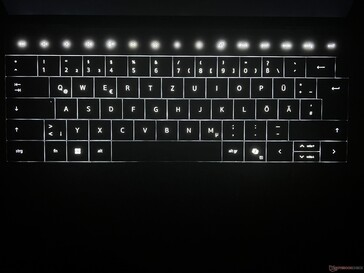
I tasti funzione sono installati come una touchbar che, in pratica, non aggiunge alcun valore agli utenti, anzi è piuttosto fastidiosa. Ciò significa che non può nemmeno premere il tasto Esc alla cieca e deve guardare i tasti ogni volta. Anche la retroilluminazione è un po' un problema, in quanto si spegne immediatamente durante i periodi di inattività, mentre non lo faceva durante ore di riproduzione video senza input. Inoltre, se si disattiva la retroilluminazione della tastiera, non si sa dove si deve premere, il che porta gli utenti a premere potenzialmente i tasti sbagliati prima che la retroilluminazione venga riaccesa. La stessa retroilluminazione bianca viene regolata costantemente tramite un sensore e non è possibile modificarne l'intensità - almeno non siamo riusciti a trovare un'opzione per farlo. Inoltre, il sensore non è interessato a sapere se ha disattivato la retroilluminazione poco prima, perché non appena le condizioni di illuminazione ambientale cambiano, la retroilluminazione viene riattivata.
Il touchpad è completamente integrato nel palm rest e non ci sono confini visibili. Il touchpad utilizza l'intera altezza del palm rest e la sua larghezza si estende dal centro del tasto Alt sinistro fino a poco sotto il nuovo tasto Copilot. In generale, funziona bene, è piacevole e fluido e la sensazione di clic del pad aptico è piacevole. A sua volta, abbiamo riscontrato occasionalmente dei problemi se si lasciava l'area o si iniziavano dei movimenti leggermente vicini all'area del touchpad vero e proprio. A differenza della touchbar, tuttavia, questo è solo un punto critico minore.
Display - L'XPS di base con frequenza di aggiornamento a 120 Hz
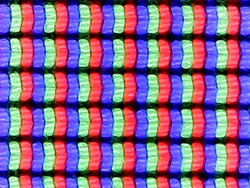
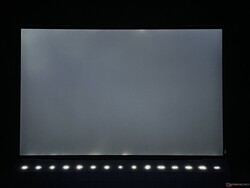
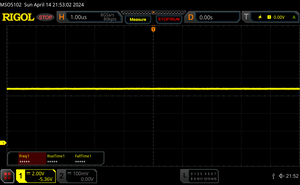
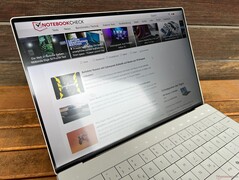
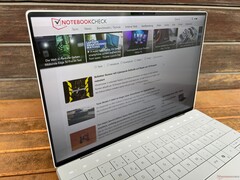
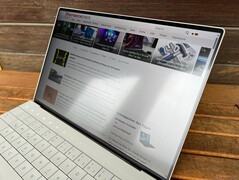
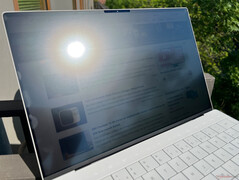
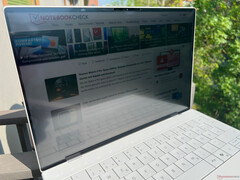
Il nuovo XPS 13 9340 è disponibile con tre diversi display IPS da 13,4 pollici. È possibile scegliere un pannello 3K con una frequenza di aggiornamento di 60 Hz (400 cd/m², supplemento di US$300) e un touchscreen QHD+ con una frequenza di aggiornamento di 120 Hz (500 cd/m², supplemento di US$300). Il nostro campione di prova, tuttavia, è dotato del pannello base con una risoluzione di 1.920 x 1.200 e senza funzione touch. Soggettivamente, la qualità dell'immagine trae vantaggio dalla frequenza più elevata di 120 Hz, e i movimenti appaiono molto fluidi. Inoltre, i contenuti sono rappresentati in modo sufficientemente nitido, ma i colori non appaiono così vividi come nei pannelli OLED. Inoltre, le aree chiare appaiono un po' sgranate. Il display non utilizza lo sfarfallio PWM, ma i suoi tempi di risposta sono un po' lenti. Il bleeding della retroilluminazione non è un problema troppo grande e la luminosità viene regolata automaticamente tramite un sensore.
Dell dichiara una luminosità di 500 cd/m², che il nostro campione di prova non ha raggiunto. Abbiamo misurato un massimo di 429 cd/m² e una media di poco superiore a 400 cd/m². Il suo valore di nero è decente, pari a 0,28, e questo porta almeno a un ottimo rapporto di contrasto massimo di ~1.500:1. Un ulteriore problema è la sua luminosità minima di quasi 45 cd/m², che è semplicemente troppo alta.
| |||||||||||||||||||||||||
Distribuzione della luminosità: 90 %
Al centro con la batteria: 429 cd/m²
Contrasto: 1532:1 (Nero: 0.28 cd/m²)
ΔE Color 2.6 | 0.5-29.43 Ø4.87, calibrated: 1.4
ΔE Greyscale 4 | 0.5-98 Ø5.1
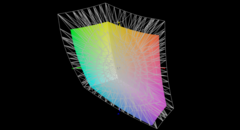
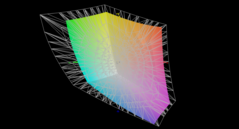
71.7% AdobeRGB 1998 (Argyll 2.2.0 3D)
97.8% sRGB (Argyll 2.2.0 3D)
69.4% Display P3 (Argyll 2.2.0 3D)
Gamma: 2.23
| Dell XPS 13 9340 Core Ultra 7 SHP1593, IPS, 1920x1200, 13.4" | Apple MacBook Air 13 M3 10C GPU IPS, 2560x1664, 13.6" | Asus ZenBook S13 OLED UX5304 SDC417B, OLED, 2880x1800, 13.3" | Lenovo ThinkPad Z13 Gen 2 ATNA33AA02-0, OLED, 2880x1800, 13.3" | HP Dragonfly G4 Chi Mei CMN13C0, IPS, 1920x1280, 13.5" | Dell XPS 13 Plus 9320 Core i7-1360P Samsung 134XK04, OLED, 3456x2160, 13.4" | |
|---|---|---|---|---|---|---|
| Display | 22% | 27% | 27% | -1% | 27% | |
| Display P3 Coverage | 69.4 | 98.4 42% | 99.7 44% | 99.7 44% | 68.4 -1% | 99.7 44% |
| sRGB Coverage | 97.8 | 99.9 2% | 100 2% | 100 2% | 98.3 1% | 100 2% |
| AdobeRGB 1998 Coverage | 71.7 | 87.9 23% | 96.9 35% | 97.3 36% | 70.4 -2% | 96.8 35% |
| Response Times | 11% | 95% | 94% | -13% | 94% | |
| Response Time Grey 50% / Grey 80% * | 43.2 ? | 34.5 ? 20% | 2 ? 95% | 2.1 ? 95% | 48.8 ? -13% | 2.18 ? 95% |
| Response Time Black / White * | 27.6 ? | 27.2 ? 1% | 1.6 ? 94% | 2.2 ? 92% | 31.3 ? -13% | 2.08 ? 92% |
| PWM Frequency | 240 ? | 60.1 ? | 238.6 ? | |||
| Screen | 17% | 30% | 29% | 14% | -39% | |
| Brightness middle | 429 | 525 22% | 361 -16% | 372 -13% | 408.8 -5% | 361.7 -16% |
| Brightness | 407 | 506 24% | 365 -10% | 375 -8% | 399 -2% | 367 -10% |
| Brightness Distribution | 90 | 92 2% | 98 9% | 99 10% | 90 0% | 96 7% |
| Black Level * | 0.28 | 0.42 -50% | 0.32 -14% | |||
| Contrast | 1532 | 1250 -18% | 1278 -17% | |||
| Colorchecker dE 2000 * | 2.6 | 1.4 46% | 1.2 54% | 0.88 66% | 2.02 22% | 4.83 -86% |
| Colorchecker dE 2000 max. * | 6.6 | 2.8 58% | 1.9 71% | 3.22 51% | 3.84 42% | 9.34 -42% |
| Colorchecker dE 2000 calibrated * | 1.4 | 0.61 56% | 3.97 -184% | |||
| Greyscale dE 2000 * | 4 | 2 50% | 1.2 70% | 1.2 70% | 2.3 42% | 1.8 55% |
| Gamma | 2.23 99% | 2.2 100% | 2.27 97% | 2.18 101% | 2.2 100% | 2.33 94% |
| CCT | 7332 89% | 6876 95% | 6486 100% | 6326 103% | 6203 105% | 6438 101% |
| Media totale (Programma / Settaggio) | 17% /
17% | 51% /
41% | 50% /
40% | 0% /
7% | 27% /
-1% |
* ... Meglio usare valori piccoli
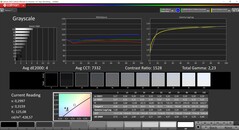
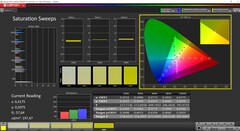
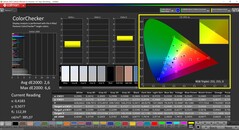
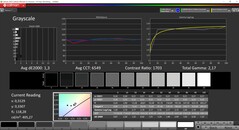
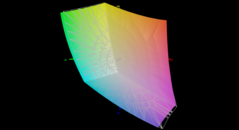
Abbiamo misurato il pannello utilizzando il software professionale CalMAN (X-Rite i1 Pro 2) e subito dopo l'acquisto, la sua calibrazione non è particolarmente buona. Abbiamo notato una notevole tinta blu e la sua temperatura del colore è troppo fredda. Inoltre, le deviazioni della scala di grigi e alcune deviazioni del colore sono superiori al valore target di 3. Utilizzando la nostra calibrazione (il profilo può essere scaricato gratuitamente qui sopra), siamo stati in grado di migliorare notevolmente la sua rappresentazione, ma questo riduce la luminosità massima dello schermo di circa 25 cd/m². Il piccolo spazio di colore sRGB è quasi completamente coperto, quindi può utilizzare il pannello anche per modificare le immagini.
Tempi di risposta del Display
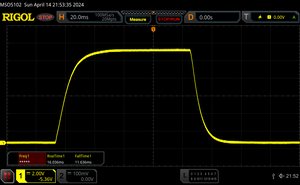
| ↔ Tempi di risposta dal Nero al Bianco | ||
|---|---|---|
| 27.6 ms ... aumenta ↗ e diminuisce ↘ combinato | ↗ 16 ms Incremento | |
| ↘ 11.6 ms Calo | ||
| Lo schermo mostra tempi di risposta relativamente lenti nei nostri tests e potrebbe essere troppo lento per i gamers. In confronto, tutti i dispositivi di test variano da 0.1 (minimo) a 240 (massimo) ms. » 68 % di tutti i dispositivi è migliore. Questo significa che i tempi di risposta rilevati sono peggiori rispetto alla media di tutti i dispositivi testati (20.8 ms). | ||
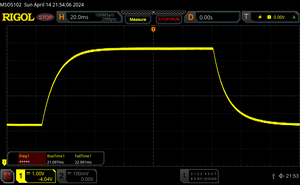
| ↔ Tempo di risposta dal 50% Grigio all'80% Grigio | ||
| 43.2 ms ... aumenta ↗ e diminuisce ↘ combinato | ↗ 21.1 ms Incremento | |
| ↘ 22.1 ms Calo | ||
| Lo schermo mostra tempi di risposta lenti nei nostri tests e sarà insoddisfacente per i gamers. In confronto, tutti i dispositivi di test variano da 0.165 (minimo) a 636 (massimo) ms. » 70 % di tutti i dispositivi è migliore. Questo significa che i tempi di risposta rilevati sono peggiori rispetto alla media di tutti i dispositivi testati (32.5 ms). | ||
Sfarfallio dello schermo / PWM (Pulse-Width Modulation)
| flickering dello schermo / PWM non rilevato | |||
In confronto: 53 % di tutti i dispositivi testati non utilizza PWM per ridurre la luminosita' del display. Se è rilevato PWM, una media di 8516 (minimo: 5 - massimo: 343500) Hz è stata rilevata. | |||
Prestazioni - L'XPS 13 con fino a 64 GB di RAM
Dell offre il nuovo XPS 13 9340 solo con i processori Meteor Lake di Intel (Core Ultra 5/7) e non ci sono schede grafiche dedicate. È possibile scegliere tra 8, 16, 32 o 64 GB di RAM (8 GB solo con il Core Ultra 7 155H, il Core Ultra 5 125H è disponibile solo con 16 GB).
Condizioni di test
All'interno del software MyDell sono disponibili diverse modalità di prestazioni, ma non è possibile passare da una modalità all'altra tramite una combinazione di tasti. Abbiamo utilizzato la modalità ottimizzata per i seguenti test.
Processore - Core Ultra 7 155H
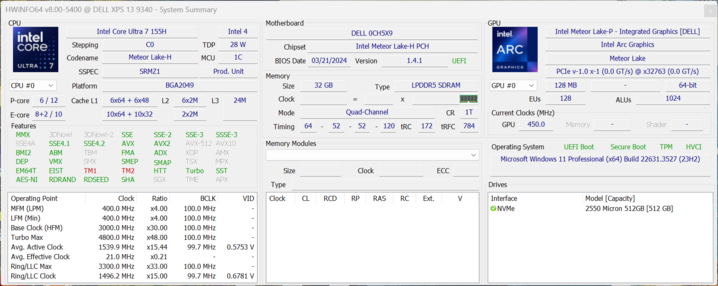
Il Core Ultra 7 155H appartiene all'attuale generazione Meteor Lake di Intel ed è il successore del vecchio Core i7-13700H. All'interno dell'XPS 13, il processore può consumare un massimo di 45 watt in brevi raffiche, ma sotto carico continuo, si bilancia a circa 24 watt dopo 5 minuti (~40% di prestazioni in meno). All'inizio dei test multi-core, le sue prestazioni erano decenti, ma non molto migliori rispetto al vecchio Core i7-1360P con due core di prestazioni in meno. Inoltre, anche le sue prestazioni single-core sono peggiori rispetto al vecchio XPS 13. Apple's SoC M3 era anche molto più veloce durante i test single-core, ma nei test multi-core era più lento. Nell'uso della batteria, il processore può consumare 42 watt per un breve periodo, prima di scendere immediatamente a 20 watt. Ciò significa che le sue prestazioni multi-core lontano da una presa di corrente sono ridotte di circa il 43%. Ulteriori benchmark della CPU sono disponibili nella la nostra sezione tecnica.
Cinebench R15 Multi continuous test
Cinebench R23: Multi Core | Single Core
Cinebench R20: CPU (Multi Core) | CPU (Single Core)
Cinebench R15: CPU Multi 64Bit | CPU Single 64Bit
Blender: v2.79 BMW27 CPU
7-Zip 18.03: 7z b 4 | 7z b 4 -mmt1
Geekbench 6.4: Multi-Core | Single-Core
Geekbench 5.5: Multi-Core | Single-Core
HWBOT x265 Benchmark v2.2: 4k Preset
LibreOffice : 20 Documents To PDF
R Benchmark 2.5: Overall mean
| CPU Performance Rating | |
| Media Intel Core Ultra 7 155H | |
| Lenovo ThinkPad Z13 Gen 2 | |
| Apple MacBook Air 13 M3 10C GPU -9! | |
| Dell XPS 13 9340 Core Ultra 7 | |
| Dell XPS 13 Plus 9320 Core i7-1360P -2! | |
| Media della classe Subnotebook | |
| HP Dragonfly G4 -2! | |
| Asus ZenBook S13 OLED UX5304 -2! | |
| Cinebench R23 / Multi Core | |
| Media Intel Core Ultra 7 155H (9769 - 19007, n=52) | |
| Lenovo ThinkPad Z13 Gen 2 | |
| Dell XPS 13 9340 Core Ultra 7 | |
| Media della classe Subnotebook (1555 - 21812, n=75, ultimi 2 anni) | |
| Dell XPS 13 Plus 9320 Core i7-1360P | |
| Apple MacBook Air 13 M3 10C GPU | |
| HP Dragonfly G4 | |
| Asus ZenBook S13 OLED UX5304 | |
| Cinebench R23 / Single Core | |
| Apple MacBook Air 13 M3 10C GPU | |
| HP Dragonfly G4 | |
| Dell XPS 13 Plus 9320 Core i7-1360P | |
| Asus ZenBook S13 OLED UX5304 | |
| Media Intel Core Ultra 7 155H (1496 - 1815, n=52) | |
| Lenovo ThinkPad Z13 Gen 2 | |
| Dell XPS 13 9340 Core Ultra 7 | |
| Media della classe Subnotebook (358 - 2165, n=75, ultimi 2 anni) | |
| Cinebench R20 / CPU (Multi Core) | |
| Media Intel Core Ultra 7 155H (3798 - 7409, n=50) | |
| Lenovo ThinkPad Z13 Gen 2 | |
| Dell XPS 13 9340 Core Ultra 7 | |
| Media della classe Subnotebook (579 - 8541, n=70, ultimi 2 anni) | |
| Dell XPS 13 Plus 9320 Core i7-1360P | |
| HP Dragonfly G4 | |
| Asus ZenBook S13 OLED UX5304 | |
| Cinebench R20 / CPU (Single Core) | |
| Dell XPS 13 Plus 9320 Core i7-1360P | |
| HP Dragonfly G4 | |
| Asus ZenBook S13 OLED UX5304 | |
| Lenovo ThinkPad Z13 Gen 2 | |
| Media Intel Core Ultra 7 155H (601 - 696, n=50) | |
| Dell XPS 13 9340 Core Ultra 7 | |
| Media della classe Subnotebook (128 - 826, n=70, ultimi 2 anni) | |
| Cinebench R15 / CPU Multi 64Bit | |
| Media Intel Core Ultra 7 155H (1932 - 2880, n=56) | |
| Dell XPS 13 9340 Core Ultra 7 | |
| Lenovo ThinkPad Z13 Gen 2 | |
| Dell XPS 13 Plus 9320 Core i7-1360P | |
| Media della classe Subnotebook (327 - 3345, n=75, ultimi 2 anni) | |
| Asus ZenBook S13 OLED UX5304 | |
| HP Dragonfly G4 | |
| Cinebench R15 / CPU Single 64Bit | |
| Dell XPS 13 Plus 9320 Core i7-1360P | |
| Lenovo ThinkPad Z13 Gen 2 | |
| HP Dragonfly G4 | |
| Dell XPS 13 9340 Core Ultra 7 | |
| Media della classe Subnotebook (72.4 - 322, n=71, ultimi 2 anni) | |
| Media Intel Core Ultra 7 155H (99.6 - 268, n=52) | |
| Asus ZenBook S13 OLED UX5304 | |
| Blender / v2.79 BMW27 CPU | |
| Apple MacBook Air 13 M3 10C GPU | |
| Asus ZenBook S13 OLED UX5304 | |
| Asus ZenBook S13 OLED UX5304 | |
| HP Dragonfly G4 | |
| Media della classe Subnotebook (159 - 2271, n=74, ultimi 2 anni) | |
| Dell XPS 13 Plus 9320 Core i7-1360P | |
| Dell XPS 13 9340 Core Ultra 7 | |
| Lenovo ThinkPad Z13 Gen 2 | |
| Media Intel Core Ultra 7 155H (175 - 381, n=47) | |
| 7-Zip 18.03 / 7z b 4 | |
| Media Intel Core Ultra 7 155H (41739 - 70254, n=50) | |
| Lenovo ThinkPad Z13 Gen 2 | |
| Dell XPS 13 9340 Core Ultra 7 | |
| Dell XPS 13 Plus 9320 Core i7-1360P | |
| Media della classe Subnotebook (11668 - 77867, n=66, ultimi 2 anni) | |
| HP Dragonfly G4 | |
| Asus ZenBook S13 OLED UX5304 | |
| 7-Zip 18.03 / 7z b 4 -mmt1 | |
| HP Dragonfly G4 | |
| Asus ZenBook S13 OLED UX5304 | |
| Lenovo ThinkPad Z13 Gen 2 | |
| Dell XPS 13 Plus 9320 Core i7-1360P | |
| Media della classe Subnotebook (2643 - 6442, n=68, ultimi 2 anni) | |
| Dell XPS 13 9340 Core Ultra 7 | |
| Media Intel Core Ultra 7 155H (4594 - 5621, n=50) | |
| Geekbench 6.4 / Multi-Core | |
| Media Intel Core Ultra 7 155H (7732 - 13656, n=55) | |
| Lenovo ThinkPad Z13 Gen 2 | |
| Apple MacBook Air 13 M3 10C GPU | |
| Dell XPS 13 9340 Core Ultra 7 | |
| Media della classe Subnotebook (2244 - 17489, n=72, ultimi 2 anni) | |
| Geekbench 6.4 / Single-Core | |
| Apple MacBook Air 13 M3 10C GPU | |
| Media della classe Subnotebook (960 - 3655, n=67, ultimi 2 anni) | |
| Lenovo ThinkPad Z13 Gen 2 | |
| Dell XPS 13 9340 Core Ultra 7 | |
| Media Intel Core Ultra 7 155H (1901 - 2473, n=52) | |
| Geekbench 5.5 / Multi-Core | |
| Media Intel Core Ultra 7 155H (10017 - 13556, n=52) | |
| Dell XPS 13 9340 Core Ultra 7 | |
| Lenovo ThinkPad Z13 Gen 2 | |
| Dell XPS 13 Plus 9320 Core i7-1360P | |
| Apple MacBook Air 13 M3 10C GPU | |
| Media della classe Subnotebook (2557 - 17218, n=67, ultimi 2 anni) | |
| HP Dragonfly G4 | |
| Asus ZenBook S13 OLED UX5304 | |
| Geekbench 5.5 / Single-Core | |
| Apple MacBook Air 13 M3 10C GPU | |
| HP Dragonfly G4 | |
| Lenovo ThinkPad Z13 Gen 2 | |
| Dell XPS 13 Plus 9320 Core i7-1360P | |
| Media della classe Subnotebook (726 - 2350, n=67, ultimi 2 anni) | |
| Asus ZenBook S13 OLED UX5304 | |
| Dell XPS 13 9340 Core Ultra 7 | |
| Media Intel Core Ultra 7 155H (1462 - 1824, n=52) | |
| HWBOT x265 Benchmark v2.2 / 4k Preset | |
| Lenovo ThinkPad Z13 Gen 2 | |
| Media Intel Core Ultra 7 155H (9.93 - 21.2, n=50) | |
| Dell XPS 13 9340 Core Ultra 7 | |
| Dell XPS 13 Plus 9320 Core i7-1360P | |
| Media della classe Subnotebook (0.97 - 25.1, n=69, ultimi 2 anni) | |
| HP Dragonfly G4 | |
| Asus ZenBook S13 OLED UX5304 | |
| LibreOffice / 20 Documents To PDF | |
| Media della classe Subnotebook (38.5 - 220, n=67, ultimi 2 anni) | |
| Media Intel Core Ultra 7 155H (37.5 - 79.2, n=49) | |
| Lenovo ThinkPad Z13 Gen 2 | |
| Dell XPS 13 9340 Core Ultra 7 | |
| Asus ZenBook S13 OLED UX5304 | |
| Dell XPS 13 Plus 9320 Core i7-1360P | |
| HP Dragonfly G4 | |
| R Benchmark 2.5 / Overall mean | |
| Media della classe Subnotebook (0.403 - 1.456, n=69, ultimi 2 anni) | |
| Dell XPS 13 9340 Core Ultra 7 | |
| Media Intel Core Ultra 7 155H (0.4457 - 0.53, n=49) | |
| Lenovo ThinkPad Z13 Gen 2 | |
| Asus ZenBook S13 OLED UX5304 | |
| Dell XPS 13 Plus 9320 Core i7-1360P | |
| HP Dragonfly G4 | |
* ... Meglio usare valori piccoli
AIDA64: FP32 Ray-Trace | FPU Julia | CPU SHA3 | CPU Queen | FPU SinJulia | FPU Mandel | CPU AES | CPU ZLib | FP64 Ray-Trace | CPU PhotoWorxx
| Performance Rating | |
| Lenovo ThinkPad Z13 Gen 2 | |
| Media Intel Core Ultra 7 155H | |
| Dell XPS 13 9340 Core Ultra 7 | |
| Media della classe Subnotebook | |
| Dell XPS 13 Plus 9320 Core i7-1360P | |
| HP Dragonfly G4 | |
| Asus ZenBook S13 OLED UX5304 | |
| AIDA64 / FP32 Ray-Trace | |
| Lenovo ThinkPad Z13 Gen 2 | |
| Media Intel Core Ultra 7 155H (6670 - 18470, n=50) | |
| Media della classe Subnotebook (1135 - 32888, n=69, ultimi 2 anni) | |
| Dell XPS 13 9340 Core Ultra 7 | |
| Dell XPS 13 Plus 9320 Core i7-1360P | |
| HP Dragonfly G4 | |
| Asus ZenBook S13 OLED UX5304 | |
| AIDA64 / FPU Julia | |
| Lenovo ThinkPad Z13 Gen 2 | |
| Media Intel Core Ultra 7 155H (40905 - 93181, n=50) | |
| Dell XPS 13 9340 Core Ultra 7 | |
| Media della classe Subnotebook (5218 - 123315, n=69, ultimi 2 anni) | |
| Dell XPS 13 Plus 9320 Core i7-1360P | |
| HP Dragonfly G4 | |
| Asus ZenBook S13 OLED UX5304 | |
| AIDA64 / CPU SHA3 | |
| Lenovo ThinkPad Z13 Gen 2 | |
| Media Intel Core Ultra 7 155H (1940 - 4436, n=50) | |
| Dell XPS 13 9340 Core Ultra 7 | |
| Media della classe Subnotebook (444 - 5287, n=69, ultimi 2 anni) | |
| Dell XPS 13 Plus 9320 Core i7-1360P | |
| HP Dragonfly G4 | |
| Asus ZenBook S13 OLED UX5304 | |
| AIDA64 / CPU Queen | |
| Lenovo ThinkPad Z13 Gen 2 | |
| Dell XPS 13 Plus 9320 Core i7-1360P | |
| Media Intel Core Ultra 7 155H (64698 - 94181, n=50) | |
| Dell XPS 13 9340 Core Ultra 7 | |
| Media della classe Subnotebook (10579 - 115682, n=69, ultimi 2 anni) | |
| HP Dragonfly G4 | |
| Asus ZenBook S13 OLED UX5304 | |
| AIDA64 / FPU SinJulia | |
| Lenovo ThinkPad Z13 Gen 2 | |
| Media Intel Core Ultra 7 155H (5639 - 10647, n=50) | |
| Dell XPS 13 9340 Core Ultra 7 | |
| Media della classe Subnotebook (744 - 18418, n=69, ultimi 2 anni) | |
| Dell XPS 13 Plus 9320 Core i7-1360P | |
| HP Dragonfly G4 | |
| Asus ZenBook S13 OLED UX5304 | |
| AIDA64 / FPU Mandel | |
| Lenovo ThinkPad Z13 Gen 2 | |
| Media Intel Core Ultra 7 155H (18236 - 47685, n=50) | |
| Dell XPS 13 9340 Core Ultra 7 | |
| Media della classe Subnotebook (3341 - 65433, n=69, ultimi 2 anni) | |
| Dell XPS 13 Plus 9320 Core i7-1360P | |
| HP Dragonfly G4 | |
| Asus ZenBook S13 OLED UX5304 | |
| AIDA64 / CPU AES | |
| Media Intel Core Ultra 7 155H (45713 - 152179, n=50) | |
| Lenovo ThinkPad Z13 Gen 2 | |
| Dell XPS 13 9340 Core Ultra 7 | |
| Media della classe Subnotebook (638 - 161430, n=69, ultimi 2 anni) | |
| Dell XPS 13 Plus 9320 Core i7-1360P | |
| HP Dragonfly G4 | |
| Asus ZenBook S13 OLED UX5304 | |
| AIDA64 / CPU ZLib | |
| Media Intel Core Ultra 7 155H (557 - 1250, n=50) | |
| Lenovo ThinkPad Z13 Gen 2 | |
| Dell XPS 13 9340 Core Ultra 7 | |
| Dell XPS 13 Plus 9320 Core i7-1360P | |
| Media della classe Subnotebook (164.9 - 1379, n=69, ultimi 2 anni) | |
| HP Dragonfly G4 | |
| Asus ZenBook S13 OLED UX5304 | |
| AIDA64 / FP64 Ray-Trace | |
| Lenovo ThinkPad Z13 Gen 2 | |
| Media Intel Core Ultra 7 155H (3569 - 9802, n=50) | |
| Media della classe Subnotebook (610 - 17495, n=69, ultimi 2 anni) | |
| Dell XPS 13 9340 Core Ultra 7 | |
| Dell XPS 13 Plus 9320 Core i7-1360P | |
| HP Dragonfly G4 | |
| Asus ZenBook S13 OLED UX5304 | |
| AIDA64 / CPU PhotoWorxx | |
| Dell XPS 13 9340 Core Ultra 7 | |
| Dell XPS 13 Plus 9320 Core i7-1360P | |
| Media Intel Core Ultra 7 155H (32719 - 54223, n=50) | |
| Media della classe Subnotebook (6569 - 64588, n=69, ultimi 2 anni) | |
| Asus ZenBook S13 OLED UX5304 | |
| Lenovo ThinkPad Z13 Gen 2 | |
| HP Dragonfly G4 | |
Prestazioni del sistema
L'XPS 13 è un dispositivo reattivo nell'uso quotidiano e anche i suoi risultati nei benchmark sono buoni. Non abbiamo rilevato alcun problema di stabilità durante il nostro test.
CrossMark: Overall | Productivity | Creativity | Responsiveness
WebXPRT 3: Overall
WebXPRT 4: Overall
Mozilla Kraken 1.1: Total
| PCMark 10 / Score | |
| Lenovo ThinkPad Z13 Gen 2 | |
| Media Intel Core Ultra 7 155H, Intel Arc 8-Core iGPU (4809 - 7529, n=34) | |
| Dell XPS 13 9340 Core Ultra 7 | |
| Media della classe Subnotebook (4993 - 7788, n=58, ultimi 2 anni) | |
| Dell XPS 13 Plus 9320 Core i7-1360P | |
| HP Dragonfly G4 | |
| Asus ZenBook S13 OLED UX5304 | |
| PCMark 10 / Essentials | |
| Dell XPS 13 Plus 9320 Core i7-1360P | |
| Lenovo ThinkPad Z13 Gen 2 | |
| HP Dragonfly G4 | |
| Dell XPS 13 9340 Core Ultra 7 | |
| Asus ZenBook S13 OLED UX5304 | |
| Media della classe Subnotebook (9363 - 11331, n=58, ultimi 2 anni) | |
| Media Intel Core Ultra 7 155H, Intel Arc 8-Core iGPU (7605 - 11289, n=34) | |
| PCMark 10 / Productivity | |
| Lenovo ThinkPad Z13 Gen 2 | |
| Media Intel Core Ultra 7 155H, Intel Arc 8-Core iGPU (6042 - 10591, n=34) | |
| Media della classe Subnotebook (5435 - 10623, n=58, ultimi 2 anni) | |
| Dell XPS 13 9340 Core Ultra 7 | |
| Dell XPS 13 Plus 9320 Core i7-1360P | |
| HP Dragonfly G4 | |
| Asus ZenBook S13 OLED UX5304 | |
| PCMark 10 / Digital Content Creation | |
| Media Intel Core Ultra 7 155H, Intel Arc 8-Core iGPU (4985 - 10709, n=34) | |
| Lenovo ThinkPad Z13 Gen 2 | |
| Media della classe Subnotebook (5305 - 12442, n=58, ultimi 2 anni) | |
| Dell XPS 13 9340 Core Ultra 7 | |
| Dell XPS 13 Plus 9320 Core i7-1360P | |
| HP Dragonfly G4 | |
| Asus ZenBook S13 OLED UX5304 | |
| CrossMark / Overall | |
| Apple MacBook Air 13 M3 10C GPU | |
| Dell XPS 13 Plus 9320 Core i7-1360P | |
| Dell XPS 13 9340 Core Ultra 7 | |
| Media Intel Core Ultra 7 155H, Intel Arc 8-Core iGPU (1366 - 1903, n=34) | |
| HP Dragonfly G4 | |
| Asus ZenBook S13 OLED UX5304 | |
| Media della classe Subnotebook (365 - 2018, n=67, ultimi 2 anni) | |
| Lenovo ThinkPad Z13 Gen 2 | |
| CrossMark / Productivity | |
| Apple MacBook Air 13 M3 10C GPU | |
| Dell XPS 13 Plus 9320 Core i7-1360P | |
| HP Dragonfly G4 | |
| Dell XPS 13 9340 Core Ultra 7 | |
| Media Intel Core Ultra 7 155H, Intel Arc 8-Core iGPU (1291 - 1798, n=33) | |
| Asus ZenBook S13 OLED UX5304 | |
| Media della classe Subnotebook (364 - 1875, n=67, ultimi 2 anni) | |
| Lenovo ThinkPad Z13 Gen 2 | |
| CrossMark / Creativity | |
| Apple MacBook Air 13 M3 10C GPU | |
| Dell XPS 13 Plus 9320 Core i7-1360P | |
| Dell XPS 13 9340 Core Ultra 7 | |
| Lenovo ThinkPad Z13 Gen 2 | |
| Media Intel Core Ultra 7 155H, Intel Arc 8-Core iGPU (1519 - 1929, n=33) | |
| Media della classe Subnotebook (372 - 2396, n=67, ultimi 2 anni) | |
| HP Dragonfly G4 | |
| Asus ZenBook S13 OLED UX5304 | |
| CrossMark / Responsiveness | |
| Dell XPS 13 Plus 9320 Core i7-1360P | |
| Media Intel Core Ultra 7 155H, Intel Arc 8-Core iGPU (939 - 1802, n=33) | |
| Dell XPS 13 9340 Core Ultra 7 | |
| Asus ZenBook S13 OLED UX5304 | |
| HP Dragonfly G4 | |
| Apple MacBook Air 13 M3 10C GPU | |
| Media della classe Subnotebook (312 - 1899, n=67, ultimi 2 anni) | |
| Lenovo ThinkPad Z13 Gen 2 | |
| WebXPRT 3 / Overall | |
| Apple MacBook Air 13 M3 10C GPU | |
| Dell XPS 13 Plus 9320 Core i7-1360P | |
| Media della classe Subnotebook (156 - 479, n=66, ultimi 2 anni) | |
| HP Dragonfly G4 | |
| Lenovo ThinkPad Z13 Gen 2 | |
| Asus ZenBook S13 OLED UX5304 | |
| Media Intel Core Ultra 7 155H, Intel Arc 8-Core iGPU (252 - 299, n=34) | |
| Dell XPS 13 9340 Core Ultra 7 | |
| WebXPRT 4 / Overall | |
| Apple MacBook Air 13 M3 10C GPU | |
| Dell XPS 13 Plus 9320 Core i7-1360P | |
| HP Dragonfly G4 | |
| Media della classe Subnotebook (132 - 348, n=67, ultimi 2 anni) | |
| Dell XPS 13 9340 Core Ultra 7 | |
| Asus ZenBook S13 OLED UX5304 | |
| Media Intel Core Ultra 7 155H, Intel Arc 8-Core iGPU (166.4 - 309, n=29) | |
| Lenovo ThinkPad Z13 Gen 2 | |
| Mozilla Kraken 1.1 / Total | |
| Lenovo ThinkPad Z13 Gen 2 | |
| Media Intel Core Ultra 7 155H, Intel Arc 8-Core iGPU (517 - 614, n=35) | |
| Dell XPS 13 9340 Core Ultra 7 | |
| Asus ZenBook S13 OLED UX5304 | |
| Media della classe Subnotebook (278 - 1104, n=75, ultimi 2 anni) | |
| Dell XPS 13 Plus 9320 Core i7-1360P | |
| HP Dragonfly G4 | |
| Apple MacBook Air 13 M3 10C GPU | |
* ... Meglio usare valori piccoli
| PCMark 10 Score | 6555 punti | |
Aiuto | ||
| AIDA64 / Memory Copy | |
| Dell XPS 13 9340 Core Ultra 7 | |
| Media Intel Core Ultra 7 155H (62397 - 96791, n=50) | |
| Media della classe Subnotebook (14554 - 109035, n=69, ultimi 2 anni) | |
| Dell XPS 13 Plus 9320 Core i7-1360P | |
| Lenovo ThinkPad Z13 Gen 2 | |
| Asus ZenBook S13 OLED UX5304 | |
| HP Dragonfly G4 | |
| AIDA64 / Memory Read | |
| Dell XPS 13 9340 Core Ultra 7 | |
| Media Intel Core Ultra 7 155H (60544 - 90647, n=50) | |
| Media della classe Subnotebook (15948 - 122210, n=69, ultimi 2 anni) | |
| Dell XPS 13 Plus 9320 Core i7-1360P | |
| Lenovo ThinkPad Z13 Gen 2 | |
| Asus ZenBook S13 OLED UX5304 | |
| HP Dragonfly G4 | |
| AIDA64 / Memory Write | |
| Lenovo ThinkPad Z13 Gen 2 | |
| Dell XPS 13 Plus 9320 Core i7-1360P | |
| Media della classe Subnotebook (15709 - 117898, n=69, ultimi 2 anni) | |
| Dell XPS 13 9340 Core Ultra 7 | |
| Media Intel Core Ultra 7 155H (58692 - 93451, n=50) | |
| Asus ZenBook S13 OLED UX5304 | |
| HP Dragonfly G4 | |
| AIDA64 / Memory Latency | |
| Media Intel Core Ultra 7 155H (116.2 - 233, n=50) | |
| Lenovo ThinkPad Z13 Gen 2 | |
| Dell XPS 13 9340 Core Ultra 7 | |
| Media della classe Subnotebook (7.2 - 187.8, n=68, ultimi 2 anni) | |
| Dell XPS 13 Plus 9320 Core i7-1360P | |
| HP Dragonfly G4 | |
| Asus ZenBook S13 OLED UX5304 | |
* ... Meglio usare valori piccoli
Latenze DPC
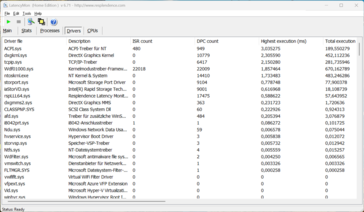
Nel nostro test di latenza standardizzato (navigazione sul web, riproduzione di YouTube in 4K, carico della CPU), il dispositivo di prova con l'attuale versione del BIOS non ha mostrato limitazioni nell'utilizzo di applicazioni audio in tempo reale. Sebbene un driver abbia mostrato una deviazione, l'importante valore "interrupt-to-process-latency" era molto basso.
| DPC Latencies / LatencyMon - interrupt to process latency (max), Web, Youtube, Prime95 | |
| Dell XPS 13 Plus 9320 Core i7-1360P | |
| Lenovo ThinkPad Z13 Gen 2 | |
| Asus ZenBook S13 OLED UX5304 | |
| HP Dragonfly G4 | |
| Dell XPS 13 9340 Core Ultra 7 | |
* ... Meglio usare valori piccoli
Dispositivo di archiviazione
Il nostro dispositivo di prova è dotato di un SSD PCIe 4.0 Micron 2550 con una capacità di 512 GB, di cui 371 GB sono ancora liberi di essere utilizzati dopo l'avvio iniziale. Le sue velocità di trasferimento sono perfette, con un massimo di oltre 4 GB/s, e non si nota alcun calo delle prestazioni, anche in caso di carico prolungato. Altri benchmark SSD sono elencati qui.
* ... Meglio usare valori piccoli
Reading continuous performance: DiskSpd Read Loop, Queue Depth 8
Scheda grafica
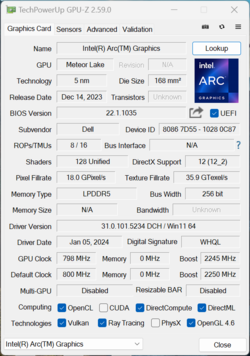
I calcoli grafici sono gestiti dalla nuova Intel Arc Graphicsche è la versione più veloce con 8 core Xe in combinazione con il Core Ultra 7 155H. Le prestazioni della GPU sono in genere significativamente superiori a quelle della vecchia Iris Xe Graphics G7e della veloce AMD Radeon 780M è stata battuta nella maggior parte dei benchmark. Durante i test di gioco, invece, l'iGPU di AMD è generalmente ancora in vantaggio; Intel deve ancora lavorare sui suoi driver.
In linea di massima, le sue prestazioni di gioco sono abbastanza buone per molti giochi vecchi con dettagli medio-alti e non abbiamo notato cali di frame, anche se le prestazioni non sono rimaste stabili. Raggiungendo solo il 70 %, non ha superato il test di stress di Time Spy e il nostro test ha anche mostrato una significativa perdita di prestazioni Witcher 3 test ha mostrato una perdita significativa di prestazioni dopo pochi minuti. Le prestazioni della GPU diminuiscono minimamente in modalità batteria (8 %). Ulteriori benchmark della GPU sono disponibili qui.
| 3DMark 11 Performance | 9575 punti | |
| 3DMark Fire Strike Score | 6900 punti | |
| 3DMark Time Spy Score | 3106 punti | |
Aiuto | ||
* ... Meglio usare valori piccoli
| Performance Rating - Percent | |
| Lenovo ThinkPad Z13 Gen 2 -1! | |
| Media della classe Subnotebook | |
| Dell XPS 13 9340 Core Ultra 7 | |
| Dell XPS 13 Plus 9320 Core i7-1360P | |
| HP Dragonfly G4 | |
| Asus ZenBook S13 OLED UX5304 | |
| The Witcher 3 - 1920x1080 Ultra Graphics & Postprocessing (HBAO+) | |
| Lenovo ThinkPad Z13 Gen 2 | |
| Media della classe Subnotebook (8.5 - 43.7, n=49, ultimi 2 anni) | |
| Dell XPS 13 9340 Core Ultra 7 | |
| Dell XPS 13 Plus 9320 Core i7-1360P | |
| HP Dragonfly G4 | |
| Asus ZenBook S13 OLED UX5304 | |
| GTA V - 1920x1080 Highest Settings possible AA:4xMSAA + FX AF:16x | |
| Media della classe Subnotebook (7.81 - 53, n=66, ultimi 2 anni) | |
| Dell XPS 13 9340 Core Ultra 7 | |
| Dell XPS 13 Plus 9320 Core i7-1360P | |
| HP Dragonfly G4 | |
| Asus ZenBook S13 OLED UX5304 | |
| Final Fantasy XV Benchmark - 1920x1080 High Quality | |
| Lenovo ThinkPad Z13 Gen 2 | |
| Dell XPS 13 9340 Core Ultra 7 | |
| Media della classe Subnotebook (11.9 - 44.2, n=71, ultimi 2 anni) | |
| Dell XPS 13 Plus 9320 Core i7-1360P | |
| HP Dragonfly G4 | |
| Asus ZenBook S13 OLED UX5304 | |
| Strange Brigade - 1920x1080 ultra AA:ultra AF:16 | |
| Lenovo ThinkPad Z13 Gen 2 | |
| Media della classe Subnotebook (17.7 - 70.7, n=70, ultimi 2 anni) | |
| Dell XPS 13 9340 Core Ultra 7 | |
| Dell XPS 13 Plus 9320 Core i7-1360P | |
| HP Dragonfly G4 | |
| Asus ZenBook S13 OLED UX5304 | |
| Dota 2 Reborn - 1920x1080 ultra (3/3) best looking | |
| Lenovo ThinkPad Z13 Gen 2 | |
| Dell XPS 13 9340 Core Ultra 7 | |
| Media della classe Subnotebook (13 - 99.5, n=74, ultimi 2 anni) | |
| Dell XPS 13 Plus 9320 Core i7-1360P | |
| HP Dragonfly G4 | |
| Asus ZenBook S13 OLED UX5304 | |
Witcher 3 FPS diagram
| basso | medio | alto | ultra | |
|---|---|---|---|---|
| GTA V (2015) | 157.8 | 129.8 | 32.8 | 14.7 |
| The Witcher 3 (2015) | 152 | 89 | 47 | 20.8 |
| Dota 2 Reborn (2015) | 106.2 | 89.8 | 72 | 65.2 |
| Final Fantasy XV Benchmark (2018) | 61.3 | 36.2 | 26.4 | |
| X-Plane 11.11 (2018) | 53 | 40.7 | 30.8 | |
| Far Cry 5 (2018) | 57 | 33 | 30 | 28 |
| Strange Brigade (2018) | 156 | 68 | 54 | 41 |
| F1 23 (2023) | 67.9 | 60.5 | 39.5 | 10.7 |
Emissioni - Spesso silenzioso nell'uso quotidiano
Emissioni di rumore
L'unità di raffreddamento dell'XPS 13 è composta da due ventole e da un tubo di calore. In modalità idle e durante le attività semplici, il portatile rimane generalmente silenzioso o molto silenzioso. Non appena si richiede di più al processore o all'iGPU, il raffreddamento diventa rapidamente udibile. Abbiamo misurato tra 37-42 dB(A), ma non c'erano rumori acuti. Nel complesso, l'XPS 13 si comporta in modo simile al suo predecessore sotto questo aspetto ed è uno dei modelli più rumorosi nel campo di confronto. Quando utilizza la modalità performance ultra opzionale, le sue emissioni acustiche salgono a 47 dB(A) e abbiamo notato 32 dB(A) utilizzando la modalità silenziosa. Il nostro dispositivo di prova non ha emesso altri rumori elettronici.
Rumorosità
| Idle |
| 25.1 / 25.1 / 25.1 dB(A) |
| Sotto carico |
| 37.4 / 42.5 dB(A) |
 | ||
30 dB silenzioso 40 dB(A) udibile 50 dB(A) rumoroso |
||
min: | ||
| Dell XPS 13 9340 Core Ultra 7 Arc 8-Core, Ultra 7 155H, Micron 2550 512GB | Apple MacBook Air 13 M3 10C GPU M3 10-Core GPU, M3, Apple SSD AP0512Z | Asus ZenBook S13 OLED UX5304 Iris Xe G7 96EUs, i7-1355U, Samsung PM9A1 MZVL21T0HCLR | Lenovo ThinkPad Z13 Gen 2 Radeon 780M, R7 PRO 7840U, SK hynix BC901 HFS001TEJ4X164N | HP Dragonfly G4 Iris Xe G7 96EUs, i7-1365U, Micron 3400 MTFDKBA512TFH 512GB | Dell XPS 13 Plus 9320 Core i7-1360P Iris Xe G7 96EUs, i7-1360P, Samsung PM9A1 MZVL2512HCJQ | |
|---|---|---|---|---|---|---|
| Noise | 6% | -1% | 11% | 3% | ||
| off /ambiente * | 25.1 | 23.3 7% | 25.1 -0% | 23.3 7% | 23.7 6% | |
| Idle Minimum * | 25.1 | 23.3 7% | 25.8 -3% | 23.5 6% | 24 4% | |
| Idle Average * | 25.1 | 23.3 7% | 25.8 -3% | 23.5 6% | 24 4% | |
| Idle Maximum * | 25.1 | 23.3 7% | 28.3 -13% | 26.8 -7% | 24.4 3% | |
| Load Average * | 37.4 | 37.7 -1% | 28.3 24% | 27.2 27% | 37 1% | |
| Witcher 3 ultra * | 42.5 | 40.1 6% | 44.8 -5% | 32.7 23% | 42.1 1% | |
| Load Maximum * | 42.5 | 40.1 6% | 44.8 -5% | 35 18% | 42 1% |
* ... Meglio usare valori piccoli
Temperatura
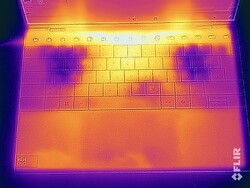
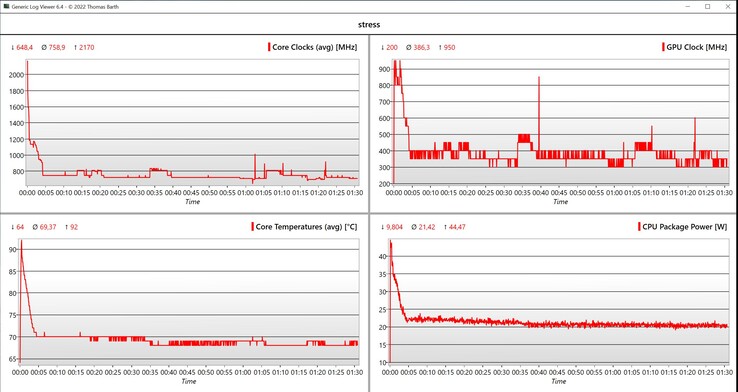
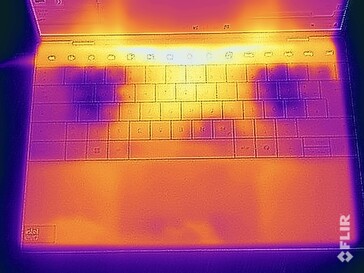
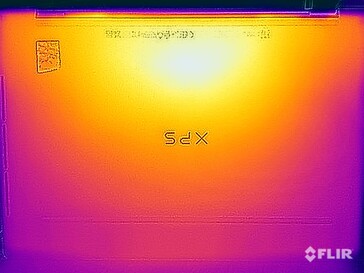
Le superfici dell'XPS 13 rimangono molto fresche in modalità idle e durante le attività semplici, e non abbiamo notato alcun problema. Quando si gioca o si è sotto carico, la parte inferiore del portatile in particolare si scalda notevolmente, a circa 110 °F (44 °C). Tuttavia, non ci sono limitazioni nell'uso del dispositivo e non ci si deve preoccupare nemmeno della tastiera. Solo la touchbar si scalda molto nell'area centrale. Durante lo stress test, il processore ha consumato brevemente fino a 45 watt, per poi scendere rapidamente a circa 24 watt. L'XPS è rimasto in questo intervallo per un po' di tempo, prima che il valore si stabilizzasse a circa 21 watt.
(±) La temperatura massima sul lato superiore è di 41 °C / 106 F, rispetto alla media di 35.9 °C / 97 F, che varia da 21.4 a 59 °C per questa classe Subnotebook.
(±) Il lato inferiore si riscalda fino ad un massimo di 43.5 °C / 110 F, rispetto alla media di 39.3 °C / 103 F
(+) In idle, la temperatura media del lato superiore è di 24.6 °C / 76 F, rispetto alla media deld ispositivo di 30.8 °C / 87 F.
(±) Riproducendo The Witcher 3, la temperatura media per il lato superiore e' di 33.3 °C / 92 F, rispetto alla media del dispositivo di 30.8 °C / 87 F.
(+) I poggiapolsi e il touchpad raggiungono la temperatura massima della pelle (32.5 °C / 90.5 F) e quindi non sono caldi.
(-) La temperatura media della zona del palmo della mano di dispositivi simili e'stata di 28.2 °C / 82.8 F (-4.3 °C / -7.7 F).
| Dell XPS 13 9340 Core Ultra 7 Intel Core Ultra 7 155H, Intel Arc 8-Core iGPU | Apple MacBook Air 13 M3 10C GPU Apple M3, Apple M3 10-Core GPU | Asus ZenBook S13 OLED UX5304 Intel Core i7-1355U, Intel Iris Xe Graphics G7 96EUs | Lenovo ThinkPad Z13 Gen 2 AMD Ryzen 7 PRO 7840U, AMD Radeon 780M | HP Dragonfly G4 Intel Core i7-1365U, Intel Iris Xe Graphics G7 96EUs | Dell XPS 13 Plus 9320 Core i7-1360P Intel Core i7-1360P, Intel Iris Xe Graphics G7 96EUs | |
|---|---|---|---|---|---|---|
| Heat | 4% | -6% | -2% | -3% | -1% | |
| Maximum Upper Side * | 41 | 44.3 -8% | 43.1 -5% | 46.2 -13% | 38.6 6% | 43.8 -7% |
| Maximum Bottom * | 43.5 | 43.4 -0% | 45 -3% | 48.4 -11% | 40.4 7% | 44.4 -2% |
| Idle Upper Side * | 25.3 | 22.3 12% | 27.3 -8% | 23.2 8% | 28.2 -11% | 24 5% |
| Idle Bottom * | 25.5 | 22.1 13% | 27.8 -9% | 23 10% | 29 -14% | 25.2 1% |
* ... Meglio usare valori piccoli
Altoparlanti
L'XPS dispone di un sistema audio con quattro altoparlanti e le sue prestazioni complessive sono piuttosto buone, con i moduli un po' carenti solo per quanto riguarda i bassi. Tuttavia, gli altoparlanti sono di solito sufficienti per la musica di sottofondo o per lo streaming di Netflix.
Dell XPS 13 9340 Core Ultra 7 analisi audio
(+) | gli altoparlanti sono relativamente potenti (83.2 dB)
Bassi 100 - 315 Hz
(-) | quasi nessun basso - in media 17% inferiori alla media
(±) | la linearità dei bassi è media (9.3% delta rispetto alla precedente frequenza)
Medi 400 - 2000 Hz
(+) | medi bilanciati - solo only 2.1% rispetto alla media
(+) | medi lineari (4.7% delta rispetto alla precedente frequenza)
Alti 2 - 16 kHz
(+) | Alti bilanciati - appena 2.5% dalla media
(+) | alti lineari (4.6% delta rispetto alla precedente frequenza)
Nel complesso 100 - 16.000 Hz
(+) | suono nel complesso lineare (11.6% differenza dalla media)
Rispetto alla stessa classe
» 12% di tutti i dispositivi testati in questa classe è stato migliore, 3% simile, 85% peggiore
» Il migliore ha avuto un delta di 5%, medio di 19%, peggiore di 53%
Rispetto a tutti i dispositivi testati
» 7% di tutti i dispositivi testati in questa classe è stato migliore, 2% similare, 91% peggiore
» Il migliore ha avuto un delta di 4%, medio di 24%, peggiore di 134%
Apple MacBook Air 13 M3 10C GPU analisi audio
(+) | gli altoparlanti sono relativamente potenti (83.2 dB)
Bassi 100 - 315 Hz
(±) | bassi ridotti - in media 13.3% inferiori alla media
(±) | la linearità dei bassi è media (11.3% delta rispetto alla precedente frequenza)
Medi 400 - 2000 Hz
(+) | medi bilanciati - solo only 0.4% rispetto alla media
(+) | medi lineari (1.6% delta rispetto alla precedente frequenza)
Alti 2 - 16 kHz
(+) | Alti bilanciati - appena 4.5% dalla media
(+) | alti lineari (1.9% delta rispetto alla precedente frequenza)
Nel complesso 100 - 16.000 Hz
(+) | suono nel complesso lineare (10.7% differenza dalla media)
Rispetto alla stessa classe
» 8% di tutti i dispositivi testati in questa classe è stato migliore, 3% simile, 89% peggiore
» Il migliore ha avuto un delta di 5%, medio di 19%, peggiore di 53%
Rispetto a tutti i dispositivi testati
» 5% di tutti i dispositivi testati in questa classe è stato migliore, 1% similare, 94% peggiore
» Il migliore ha avuto un delta di 4%, medio di 24%, peggiore di 134%
Gestione dell'energia - Lunghi tempi di funzionamento a 60 Hz
Consumo di energia
Con un consumo massimo in idle di meno di 8 watt, il nuovo XPS 13 è molto frugale. Abbiamo misurato un massimo di 62,7 watt, ma questo è il limite dell'alimentatore da 60 watt. Il consumo del portatile può diminuire di nuovo dopo poco tempo, ma nel frattempo la batteria deve compensare questa differenza. Nel corso del test, il consumo si è poi stabilizzato a circa 37 watt.
| Off / Standby | |
| Idle | |
| Sotto carico |
|
Leggenda:
min: | |
| Dell XPS 13 9340 Core Ultra 7 Ultra 7 155H, Arc 8-Core, Micron 2550 512GB, IPS, 1920x1200, 13.4" | Apple MacBook Air 13 M3 10C GPU M3, M3 10-Core GPU, Apple SSD AP0512Z, IPS, 2560x1664, 13.6" | Asus ZenBook S13 OLED UX5304 i7-1355U, Iris Xe G7 96EUs, Samsung PM9A1 MZVL21T0HCLR, OLED, 2880x1800, 13.3" | Lenovo ThinkPad Z13 Gen 2 R7 PRO 7840U, Radeon 780M, SK hynix BC901 HFS001TEJ4X164N, OLED, 2880x1800, 13.3" | HP Dragonfly G4 i7-1365U, Iris Xe G7 96EUs, Micron 3400 MTFDKBA512TFH 512GB, IPS, 1920x1280, 13.5" | Dell XPS 13 Plus 9320 Core i7-1360P i7-1360P, Iris Xe G7 96EUs, Samsung PM9A1 MZVL2512HCJQ, OLED, 3456x2160, 13.4" | Media Intel Arc 8-Core iGPU | Media della classe Subnotebook | |
|---|---|---|---|---|---|---|---|---|
| Power Consumption | 18% | -5% | -18% | 0% | -31% | -33% | -8% | |
| Idle Minimum * | 3.8 | 1.95 49% | 5.8 -53% | 5.8 -53% | 4.1 -8% | 6.9 -82% | 5.34 ? -41% | 4.31 ? -13% |
| Idle Average * | 7 | 8.7 -24% | 8.5 -21% | 6.2 11% | 7.5 -7% | 7.4 -6% | 8.54 ? -22% | 7.33 ? -5% |
| Idle Maximum * | 7.3 | 8.9 -22% | 8.8 -21% | 12.7 -74% | 8.2 -12% | 13.6 -86% | 11.9 ? -63% | 9.09 ? -25% |
| Load Average * | 52.6 | 34.3 35% | 35.1 33% | 27.2 48% | 35.5 33% | 43.5 17% | 54 ? -3% | 44.9 ? 15% |
| Witcher 3 ultra * | 38.3 | 28.6 25% | 27.6 28% | 54.1 -41% | 37.5 2% | 48 -25% | ||
| Load Maximum * | 62.7 | 35.4 44% | 59.5 5% | 61.4 2% | 66.5 -6% | 63.3 -1% | 84.9 ? -35% | 68.7 ? -10% |
* ... Meglio usare valori piccoli
Power consumption Witcher 3 / stress test
Power consumption with external monitor
Tempi di esecuzione
La batteria da 55 Wh del dispositivo consente una buona autonomia. Nel nostro test WLAN a 150 cd/m² (corrisponde al 51% della luminosità massima del nostro dispositivo di prova), abbiamo misurato un'ottima autonomia di quasi 13 ore a 60 Hz (poco meno di 11 ore a 120 Hz), il che significa che l'XPS 13 può essere battuto solo dal MacBook Air 13 M3 e dall'HP Dragonfly G4. Il vecchio XPS 13 con il suo pannello OLED ad alta risoluzione ha ottenuto poco più di 7 ore. Alla massima luminosità, il test WLAN è durato quasi 9 ore (60 Hz) e la frequenza di aggiornamento più elevata non ha influito sui risultati (solo 10 minuti in meno a 120 Hz). Durante il test video a 150 cd/m², il nuovo processore Meteor Lake con il suo design a piastrelle si è fatto notare ancora una volta, poiché i due core di efficienza sulla piastrella SoC hanno svolto tutto il lavoro. Il risultato è un'eccezionale durata di 17,5 ore, che ha persino battuto di poco il MacBook Air 13. Nel peggiore dei casi, il portatile può spegnersi dopo poco più di 2 ore.
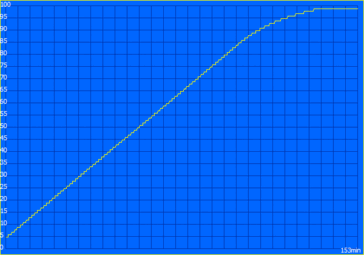
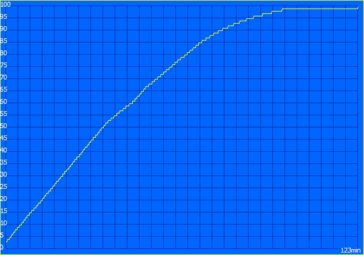
È possibile selezionare diverse modalità di ricarica e, utilizzando l'impostazione standard, sono necessarie 2,5 ore per caricare la batteria da 0 con il dispositivo acceso (80 % dopo 95 minuti). Utilizzando la modalità express, il tempo si riduce a poco meno di 2 ore (80 % dopo 64 minuti).
| Dell XPS 13 9340 Core Ultra 7 Ultra 7 155H, Arc 8-Core, 55 Wh | Apple MacBook Air 13 M3 10C GPU M3, M3 10-Core GPU, 52.6 Wh | Asus ZenBook S13 OLED UX5304 i7-1355U, Iris Xe G7 96EUs, 63 Wh | Lenovo ThinkPad Z13 Gen 2 R7 PRO 7840U, Radeon 780M, 51.5 Wh | HP Dragonfly G4 i7-1365U, Iris Xe G7 96EUs, 68 Wh | Dell XPS 13 Plus 9320 Core i7-1360P i7-1360P, Iris Xe G7 96EUs, 55 Wh | Media della classe Subnotebook | |
|---|---|---|---|---|---|---|---|
| Autonomia della batteria | 16% | -7% | -39% | 36% | -43% | -6% | |
| H.264 | 1053 | 1044 -1% | 829 -21% | 963 ? -9% | |||
| WiFi v1.3 | 769 | 914 19% | 678 -12% | 469 -39% | 954 24% | 436 -43% | 757 ? -2% |
| Load | 131 | 171 31% | 146 11% | 192 47% | 122 ? -7% |
Pro
Contro
Verdetto - L'XPS 13 rimane un compagno compatto, ma il display di base e la touchbar sono deludenti
Il nuovo XPS 13 utilizza il design del vecchio XPS 13 Plus, lo stesso che ora Dell utilizza anche sui più grandi XPS 14 e XPS 16. Soprattutto rispetto al pesante XPS 14, il modello da 13 pollici sembra molto compatto e, grazie alle sue sottili cornici, è anche uno dei dispositivi più sottili nel campo di confronto. In termini di qualità, non abbiamo quasi nulla di cui lamentarci, tuttavia, con 1,2 kg, non è particolarmente leggero. Un ulteriore punto a favore è la grande durata della batteria, almeno in combinazione con il display di base.
È qui che le cose si fanno un po' più difficili per l'XPS 13, poiché il pannello di base non è affatto impressionante. Sebbene l'immagine del pannello IPS opaco appaia buona e la frequenza di aggiornamento di 120 Hz sia utile per il movimento, il pannello del dispositivo di prova ha chiaramente mancato la luminosità dichiarata dal produttore di 500 cd/m² durante il nostro test, e in più non è calibrato troppo bene (tinta blu in stato di consegna). Valori di luminosità più elevati sarebbero utili soprattutto all'esterno. La sua situazione di connettività è altrettanto complicata, in quanto dispone solo di 2 USB-C. La RAM non può essere aggiornata, ma può almeno scegliere l'XPS con un massimo di 64 GB di RAM.
L'XPS 13 9340 convince per le sue dimensioni compatte e i lunghi tempi di esecuzione, almeno in combinazione con il display di base. Tuttavia, le scarse opzioni di connettività sono un problema, così come la fastidiosa touchbar con i tasti funzione.
I dispositivi di input del portatile sono un po' più problematici. Il touchpad senza cornice funziona bene nella pratica, ma la tastiera è un problema maggiore. A causa del suo design che non presenta alcuno spazio tra i tasti, non è possibile percepirli bene, il che porta a molti errori di battitura accidentali. È un peccato, perché a parte questo, la tastiera è abbastanza comoda da digitare. Inoltre, l'intensità della retroilluminazione non può essere regolata e il sensore la attiva al minimo cambiamento di luce, che lo si voglia o no. A sua volta, non possiamo dire nulla di positivo sulla touchbar del dispositivo, in quanto è semplicemente fastidiosa nell'uso quotidiano. Non è possibile utilizzarla alla cieca, non si riesce a capire quale tasto è quello giusto con la retroilluminazione disattivata (che spesso porta a premere quello sbagliato per errore), e i tasti funzione sono rimasti costantemente illuminati durante la riproduzione di video durante il nostro test, il che è super fastidioso.
Le prestazioni della CPU del nuovo processore Meteor Lake sono migliori rispetto al suo predecessore solo in brevi fasi. Anche le prestazioni grafiche mostrano un miglioramento, ma non rimangono stabili, ad esempio durante i giochi. Tuttavia, le sue prestazioni sono del tutto sufficienti per le attività quotidiane. Rispetto ai suoi concorrenti, tuttavia, il nuovo XPS 13 non ha vita facile. Uno dei suoi principali concorrenti è il MacBook Air che continua a stupire per il suo raffreddamento passivo e il maggior numero di porte. Il ThinkPad Z13 con il suo processore AMD offre prestazioni superiori e più stabili. Inoltre, stiamo testando il nuovo ThinkBook 13x G4, un altro concorrente dell'XPS 13 che vanta un display IPS ad alta risoluzione.
Prezzo e disponibilità
Il nuovo XPS 13 9340 può essere acquistato direttamente sul sito web di Dell. I prezzi partono da 1.149 dollari per la variante base.
Dell XPS 13 9340 Core Ultra 7
- 05/14/2024 v7 (old)
Andreas Osthoff
Transparency
La selezione dei dispositivi da recensire viene effettuata dalla nostra redazione. Il campione di prova è stato fornito all'autore come prestito dal produttore o dal rivenditore ai fini di questa recensione. L'istituto di credito non ha avuto alcuna influenza su questa recensione, né il produttore ne ha ricevuto una copia prima della pubblicazione. Non vi era alcun obbligo di pubblicare questa recensione. Non accettiamo mai compensi o pagamenti in cambio delle nostre recensioni. In quanto società mediatica indipendente, Notebookcheck non è soggetta all'autorità di produttori, rivenditori o editori.
Ecco come Notebookcheck esegue i test
Ogni anno, Notebookcheck esamina in modo indipendente centinaia di laptop e smartphone utilizzando procedure standardizzate per garantire che tutti i risultati siano comparabili. Da circa 20 anni sviluppiamo continuamente i nostri metodi di prova e nel frattempo stabiliamo gli standard di settore. Nei nostri laboratori di prova, tecnici ed editori esperti utilizzano apparecchiature di misurazione di alta qualità. Questi test comportano un processo di validazione in più fasi. Il nostro complesso sistema di valutazione si basa su centinaia di misurazioni e parametri di riferimento ben fondati, che mantengono l'obiettività.


