Recensioni Notebook con AMD Radeon 780M la scheda grafica
Recensione del portatile Asus VivoBook 18: Il mostro del display a poco meno di 1.000 dollari
Con il rilascio del VivoBook 18, Asus si è posizionata nella nicchia di mercato dei laptop da 18 pollici, ma a differenza dei suoi concorrenti, non ha una dGPU....
AMD Ryzen 7 260 | AMD Radeon 780M | 18.40" | 2.6 kgRecensione del Minisforum EliteMini UM890 Pro: Un potente mini PC con AMD Ryzen 9 e raffreddamento silenzioso
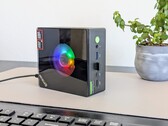
Minisforum ha presentato EliteMini UM890 Pro, un mini PC estremamente potente con Ryzen 9 8945HS e Radeon 780M. È particolarmente impressionante per quanto rigu...
AMD Ryzen 9 8945HS | AMD Radeon 780M | 709 grRecensione del Lenovo IdeaPad Slim 3 14 - Un portatile multimediale economico con molta potenza grazie allo Zen 4
Lenovo IdeaPad Slim 3 14 è un portatile multimediale conveniente, con un processore AMD veloce e una buona durata della batteria. Tuttavia, il suo pannello IPS ...
AMD Ryzen 7 8840HS | AMD Radeon 780M | 14.00" | 1.5 kgRecensione del mini PC GMK NucBox K11: prestazioni elevate con l'AMD Zen 4rispetto al prezzo
Le vecchie CPU Zen 4 stanno diventando un vero affare, soprattutto se confrontate con le alternative Intel. NucBox K11 è uno dei mini PC AMD meno costosi, dotat...
AMD Ryzen 9 8945HS | AMD Radeon 780M | 630 grRecensione del palmare ZOTAC Gaming Zone: Precision controller, OLED brillante e compatto
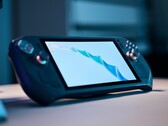
La Zotac Gaming Zone è un concorrente di spicco nel mercato dei portatili. Un display OLED, il potente AMD Ryzen 7 e un eccellente controller lo rendono un sogn...
AMD Ryzen 7 8840U | AMD Radeon 780M | 7.00" | 692 grBOSGAME M2: AMD Ryzen 9 7940HS, 0.8 kg
recensione » Recensione del mini PC BOSGAME M2: Corregge una delle principali lamentele dell'M1 originale
Lenovo ThinkPad P14s G5 21ME000TGE: AMD Ryzen 7 PRO 8840HS, 14.00", 1.4 kg
recensione » Recensione del laptop Lenovo ThinkPad P14s Gen 5 AMD: l'OLED si fa sentire sulla durata della batteria
HP EliteBook 845 G11: AMD Ryzen 7 PRO 8840HS, 14.00", 1.5 kg
recensione » Recensione del portatile HP EliteBook 845 G11 - Nessun cambiamento importante, ma ancora uno dei migliori notebook business
Lenovo ThinkPad T14 Gen 5 21MC003QGE: AMD Ryzen 7 8840U, 14.00", 1.5 kg
recensione » Recensione del portatile Lenovo ThinkPad T14 Gen 5: l'AMD è molto più veloce dell'Intel
Ayaneo Flip KB: AMD Ryzen 7 8840U, 7.00", 0.7 kg
recensione » Recensione dell'Ayaneo Flip KB - console portatile con grandi funzionalità alimentata dal meno efficiente AMD Ryzen 7 8840U
Lenovo Yoga 7 2-in-1 14AHP9: AMD Ryzen 7 8840HS, 14.00", 1.6 kg
recensione » Recensione del Lenovo Yoga 7 2-in-1 14AHP9: Veloce convertibile di fascia media frenato da un display debole
Lenovo IdeaPad 5 2-in-1 14AHP9: AMD Ryzen 7 8845HS, 14.00", 1.6 kg
recensione » Recensione del convertibile IdeaPad 5 2-in-1 14AHP9: Uno dei più economici di Lenovo è anche il più veloce
Ninkear A16 Pro: AMD Ryzen 7 8845HS, 16.00", 1.8 kg
recensione » Recensione del portatile Ninkear A16 Pro: economico, potente e silenzioso durante l'uso
Zotac ZGC-G1A1W-01: AMD Ryzen 7 8840U, 7.00", 0.7 kg
recensione » Recensione dello Zotac Zone: Display ottimo ed ingressi da leader di categoria
Minisforum MS-A1: AMD Ryzen 7 8700G, 1.7 kg
recensione » Recensione del Minisforum MS-A1: La workstation supporta diverse CPU AMD e offre spazio per quattro SSD
SCHENKER XMG Evo 14 (M24): AMD Ryzen 7 8845HS, 14.00", 1.5 kg
recensione » Recensione del portatile Schenker XMG Evo 14 (M24) - Un buon tuttofare con un Ryzen 8000 e fino a 96 GB di RAM
Geekom AX8 Pro: AMD Ryzen 9 8945HS, 0.5 kg
recensione » Recensione del Geekom AX8 Pro AI NUC PC: AMD Ryzen 9 8945HS con 32 GB di RAM DDR5 e 2 TB SSD in uno chassis da 0,47L
Lenovo ThinkPad X13 Gen 4 21J3001VGE: AMD Ryzen 7 PRO 7840U, 13.30", 1.3 kg
recensione » Recensione del laptop Lenovo ThinkPad X13 Gen 4 AMD: Macchina Ryzen compatta con prestazioni mediocri
Asus ROG Ally X: AMD Ryzen Z1 Extreme, 7.00", 0.7 kg
recensione » Recensione dell'Asus ROG Ally X - Il miglior portatile per il gaming grazie alla RAM più veloce e all'enorme batteria da 80 Wh
Geekom AE7: AMD Ryzen 9 7940HS, 0.6 kg
recensione » Recensione del Geekom AE7: Mini-PC NUC con AMD Ryzen 9 7940HS, RAM DDR5, interfacce moderne e un solo problema
SCHENKER VIA 14 Pro (M24): AMD Ryzen 7 8845HS, 14.00", 1.4 kg
recensione » Recensione dello Schenker VIA 14 Pro (M24) - Subnotebook AMD compatto ora con Ryzen 8000 e display più luminoso
Beelink SER8: AMD Ryzen 7 8845HS, 0.8 kg
recensione » Recensione del PC SER8 di Beelink: Design ispirato al Mac Mini con un AMD Ryzen 7 8845HS
Dell Inspiron 14 7445 2-in-1: AMD Ryzen 7 8840HS, 14.00", 1.7 kg
recensione » Recensione del convertibile 2-in-1 Dell Inspiron 14 7445: Passaggio da Ryzen-U a Ryzen-HS
Aoostar GEM12: AMD Ryzen 7 8845HS, 0.7 kg
recensione » Recensione del Mini-PC Aoostar GEM12: AMD Ryzen 7 8845HS con 32 GB di RAM, 1 TB SSD e interfaccia OCuLink
GPD Win Mini 2024 7": AMD Ryzen 7 8840U, 7.00", 0.5 kg
recensione » Recensione del palmare GPD Win Mini Zen 4: Solida alternativa all'Asus ROG Ally
Geekom A8: AMD Ryzen 9 8945HS, 0.4 kg
recensione » Recensione del Geekom A8: Mini-PC premium da 0,5 litri con AMD Ryzen 9 8945HS, 32 GB di RAM DDR5 e 2 TB SSD
Lenovo ThinkPad T16 G2 21K70035GE: AMD Ryzen 7 7840U, 16.00", 1.8 kg
recensione » Recensione del portatile Lenovo ThinkPad T16 G2 AMD: Il grande ThinkPad è ancora migliore con Ryzen 7040
BOSGAME M1: AMD Ryzen 7 7840HS, 0.8 kg
recensione » Recensione del mini PC BOSGAME M1: Ryzen 7 7840HS è ancora una bestia
HP Envy x360 2-in-1 16-ad0097nr: AMD Ryzen 7 8840HS, 16.00", 1.8 kg
recensione » Recensione dell'HP Envy x360 2-in-1 16: Ryzen 7 8840HS batte Core Ultra 7 155U
Asus Zenbook 14 OLED UM3406HA: AMD Ryzen 7 8840HS, 14.00", 1.2 kg
recensione » Recensione dell'Asus Zenbook 14 OLED - La variante AMD dello Zenbook ha ricevuto il più debole schermo OLED 1080p
Minisforum V3: AMD Ryzen 7 8840U, 14.00", 0.9 kg
recensione » Recensione del Minisforum V3 3-in-1: il primo tablet Windows in assoluto con l'APU Hawk Point di AMD, alias AMD Ryzen 7 8840U
Acemagic AM18: AMD Ryzen 7 7840HS, 0.6 kg
recensione » Recensione dell'Acemagic AM18: Mini-PC per il gaming dall'accattivante look cyberpunk con AMD Ryzen 7 7840HS e 32 GB di RAM
GMK NucBox K6: AMD Ryzen 7 7840HS, 0.5 kg
recensione » Recensione del mini PC GMK NucBox K6: Potente come gli ultimi portatili Intel Core Ultra
Lenovo IdeaPad Pro 5 14AHP9: AMD Ryzen 7 8845HS, 14.00", 1.5 kg
recensione » Recensione del portatile Lenovo IdeaPad Pro 5 14AHP9 - Il potente ultraportatile con Ryzen 8000 e OLED a 120 Hz
Minisforum Mercury Series EM780: AMD Ryzen 7 7840U, 0.2 kg
recensione » Recensione Minisforum Mercury Series EM780: Mini-PC estremamente compatto con AMD Ryzen 7 7840U, 32 GB di RAM e 1 TB SSD
Geekom A7: AMD Ryzen 9 7940HS, 0.4 kg
recensione » Recensione del Geekom A7 con case da 0,5l: Mini-PC premium con AMD Ryzen 9 7940HS, 32 GB di RAM DDR5 ed SSD da 2 TB
HP EliteBook 865 G10: AMD Ryzen 9 PRO 7940HS, 16.00", 1.9 kg
recensione » Recensione del laptop HP EliteBook 865 G10 - buon Laptop business capace rovinato dal Sure View
Asus ROG Zephyrus G14 2024 GA403U: AMD Ryzen 9 8945HS
recensione » Test dell'AMD Ryzen 8000 Hawk Point - il refresh della Zen4 supera Meteor Lake nel calcolo dei numeri e nella perfromance della GPU
ONEXPLAYER 2 Pro AR18: AMD Ryzen 7 7840U, 8.40", 0.9 kg
recensione » Recensione del OneXPlayer 2 Pro: palmare gaming, tablet o sganciabile, un dispositivo poliedrico con Ryzen 7
Ayaneo Kun: AMD Ryzen 7 7840U, 8.40", 0.9 kg
recensione » Recensione del palmare gaming Ayaneo Kun: Una bestia da prestazioni per individualisti
Lenovo ThinkPad P16s G2 21K9000CGE: AMD Ryzen 7 PRO 7840U, 16.00", 1.8 kg
recensione » Recensione del Lenovo ThinkPad P16s G2 AMD: Potenza e OLED in questo portatile workstation
Tuxedo Pulse 14 Gen3: AMD Ryzen 7 7840HS, 14.00", 1.4 kg
recensione » Recensione di Tuxedo Pulse 14 Gen3 - L'Ultrabook Linux con AMD Zen4 e un display a 120 Hz
Lenovo ThinkPad P14s G4 21K5000LGE: AMD Ryzen 7 PRO 7840U, 14.00", 1.3 kg
recensione » Recensione del Lenovo ThinkPad P14s G4 AMD: veloce, portatile, lineare
Lenovo ThinkPad Z13 Gen 2: AMD Ryzen 7 PRO 7840U, 13.30", 1.2 kg
recensione » Recensione del portatile ThinkPad Z13 Gen 2: La risposta di Lenovo al Dell XPS 13
Lenovo Legion Go: AMD Ryzen Z1 Extreme, 8.80", 0.8 kg
recensione » Recensione del palmare gaming Lenovo Legion Go: Buona idea, non perfettamente realizzata
Lenovo Yoga Pro 7 14APH G8: AMD Ryzen 7 7840HS, 14.50", 1.5 kg
recensione » Recensione del computer portatile Lenovo Yoga Pro 7 14 G8 - AMD Zen4 non è automaticamente migliore
Lenovo ThinkPad T14 G4 21K4S02000: AMD Ryzen 7 PRO 7840U, 14.00", 1.5 kg
recensione » Recensione del portatile Lenovo ThinkPad T14 G4 AMD: Potenza Ryzen in un compatto ThinkPad
Minisforum EliteMini UM780 XTX: AMD Ryzen 7 7840HS, 0.8 kg
recensione » Recensione del Minisforum EliteMini UM780 XTX: Il mini PC con un AMD Ryzen 7 7840HS e una Radeon 780M è stato dotato di connessioni OCuLink e USB-4
HP Pavilion Plus 14-ey0095cl: AMD Ryzen 7 7840U, 14.00", 1.4 kg
recensione » Recensione del portatile HP Pavilion Plus 14 Ryzen 7: Cambiamenti nei punti giusti
Lenovo ThinkPad T14s G4-21F8002TGE: AMD Ryzen 7 7840U, 14.00", 1.4 kg
recensione » Recensione del Lenovo ThinkPad T14s G4: laptop business migliore con AMD Zen4
Lenovo Yoga Slim 7 14APU G8: AMD Ryzen 7 7840S, 14.50", 1.3 kg
recensione » Recensione del Lenovo Yoga Slim 7 14 G8 AMD - La CPU Zen4 personalizzata incontra un ottimo OLED da 2,9K
Ayaneo Air 1S Retro Power : AMD Ryzen 7 7840U, 5.50", 0.4 kg
recensione » Recensione del palmare gaming Ayaneo Air 1S Retro Power
Acer Swift Edge SFE16 Ryzen 7 7840U: AMD Ryzen 7 7840U, 16.00", 1.2 kg
recensione » Recensione del portatile Acer Swift Edge 16 Ryzen 7 7840U: CPU Zen 4 e OLED da 3,2K 120 Hz
Framework Laptop 13.5 Ryzen 7 7840U: AMD Ryzen 7 7840U, 13.50", 1.3 kg
recensione » Recensione del portatile 13,5 Ryzen 7 7840U: Molto meglio della versione Intel
HP EliteBook 845 G10 5Z4X0ES: AMD Ryzen 7 7840U, 14.00", 1.5 kg
recensione » Recensione di HP EliteBook 845 G10: Il portatile business convince con AMD Ryzen 7 7840U e un prezzo imbattibile
Beelink SER7: AMD Ryzen 7 7840HS, 0.6 kg
recensione » Recensione del mini PC Beelink SER7: Ryzen 7 7840HS con raffreddamento a camera di vapore
HP EliteBook 845 G10 818N0EA: AMD Ryzen 9 PRO 7940HS, 14.00", 1.5 kg
recensione » Recensione dell'HP EliteBook 845 G10: portatile business quasi perfetto con AMD Zen4
recensione » Test delle prestazioni delle iGPU AMD Radeon 780M e 760M con i nuovi driver
Minisforum Venus Series UM790 Pro: AMD Ryzen 9 7940HS, 0.7 kg
recensione » Recensione del Minisforum Venus Series UM790 Pro: Migliore dei suoi concorrenti grazie a un AMD Ryzen 9 7940HS e a una Radeon 780M
Beelink GTR7 7840HS: AMD Ryzen 7 7840HS, 0.9 kg
recensione » Recensione del mini PC Beelink GTR7: Debutto delle prestazioni di AMD Ryzen 7 7840HS
Asus ROG Ally Z1 Extreme: AMD Ryzen Z1 Extreme, 7.00", 0.6 kg
recensione » Recensione dell'Asus ROG Ally Z1 Extreme - Palmare gaming con display da 120 Hz e AMD Zen4
Asus ROG Zephyrus G14 GA402XY: AMD Ryzen 9 7940HS, 14.00"
recensione » Analisi dell'iGPU AMD Radeon 780M - La nuova GPU RDNA-3 di AMD sfida la concorrenza
recensione » Analisi di AMD Ryzen 9 7940HS - Zen4 Phoenix è idealmente efficiente quanto Apple
Lenovo ThinkPad T14 G4 21K4S02000: AMD Ryzen 7 PRO 7840U, 14.00", 1.5 kg
Recensioni esterne » Lenovo ThinkPad T14 G4 21K4S02000
Lenovo IdeaPad 5 16AHP9: AMD Ryzen 7 8845HS, 16.00", 1.9 kg
Recensioni esterne » Lenovo IdeaPad 5 16AHP9
Asus Vivobook S 15 OLED M5506UA: AMD Ryzen 7 8845HS, 15.60", 1.5 kg
Recensioni esterne » Asus Vivobook S 15 OLED M5506UA
Acer Nitro Blaze 11: AMD Ryzen 7 8840HS, 10.95", 1.1 kg
Recensioni esterne » Acer Nitro Blaze 11
Lenovo IdeaPad 5 2-in-1 14AHP9, R7 8845HS: AMD Ryzen 7 8845HS, 14.00", 1.6 kg
Recensioni esterne » Lenovo IdeaPad 5 2-in-1 14AHP9, R7 8845HS
Acer Nitro Blaze 7: AMD Ryzen 7 8840HS, 7.00", 0.7 kg
Recensioni esterne » Acer Nitro Blaze 7
HP EliteBook 845 G11: AMD Ryzen 7 PRO 8840HS, 14.00", 1.5 kg
Recensioni esterne » HP EliteBook 845 G11
Acer Swift Go 14 SFG14-63, R7 8845HS: AMD Ryzen 7 8845HS, 14.00", 1.3 kg
Recensioni esterne » Acer Swift Go 14 SFG14-63, R7 8845HS
Lenovo ThinkPad T14 G5: AMD Ryzen 7 8840U, 14.00", 1.4 kg
Recensioni esterne » Lenovo ThinkPad T14 G5
Acer Aspire 15 A15-41M: AMD Ryzen 7 8840HS, 15.60", 1.7 kg
Recensioni esterne » Acer Aspire 15 A15-41M
Honor MagicBook X16 Plus 2024: AMD Ryzen 7 8845HS, 16.00", 1.8 kg
Recensioni esterne » Honor MagicBook X16 Plus 2024
Acer Swift Edge SFE16-44: AMD Ryzen 7 8840U, 16.00", 1.2 kg
Recensioni esterne » Acer Swift Edge SFE16-44
HP Envy x360 14-fa0000: AMD Ryzen 7 8840HS, 14.00", 1.4 kg
Recensioni esterne » HP Envy x360 14-fa0000
HP Pavilion Aero 13-bg0000: AMD Ryzen 7 8840HS, 13.30", 1 kg
Recensioni esterne » HP Pavilion Aero 13-bg0000
Lenovo Yoga 7 14AHP9: AMD Ryzen 7 8840HS, 14.00", 1.5 kg
Recensioni esterne » Lenovo Yoga 7 14AHP9
Dell Inspiron 14 7445 2-in-1: AMD Ryzen 7 8840HS, 14.00", 1.7 kg
Recensioni esterne » Dell Inspiron 14 7445 2-in-1
Asus Vivobook S 14 OLED M5406UA: AMD Ryzen 7 8845HS, 14.00", 1.3 kg
Recensioni esterne » Asus Vivobook S 14 OLED M5406UA
Asus VivoBook S 14 OLED S5406UA: AMD Ryzen 9 8945HS, 14.00", 1.3 kg
Recensioni esterne » Asus VivoBook S 14 OLED S5406UA
Asus ROG Ally X: AMD Ryzen Z1 Extreme, 7.00", 0.7 kg
Recensioni esterne » Asus ROG Ally X
Lenovo ThinkPad T16 G2 21K70035GE: AMD Ryzen 7 7840U, 16.00", 1.8 kg
Recensioni esterne » Lenovo ThinkPad T16 G2 21K70035GE
HP Envy x360 2-in-1 16-ad0097nr: AMD Ryzen 7 8840HS, 16.00", 1.8 kg
Recensioni esterne » HP Envy x360 2-in-1 16-ad0097nr
HP ZBook Firefly 14 G10, R7 7840HS: AMD Ryzen 7 7840HS, 14.00", 1.5 kg
Recensioni esterne » HP ZBook Firefly 14 G10, R7 7840HS
Asus Zenbook 14 OLED UM3406HA: AMD Ryzen 7 8840HS, 14.00", 1.2 kg
Recensioni esterne » Asus Zenbook 14 OLED UM3406HA
HP EliteBook 865 G10, R7 PRO 7840U: AMD Ryzen 7 PRO 7840U, 16.00", 1.8 kg
Recensioni esterne » HP EliteBook 865 G10, R7 PRO 7840U
Lenovo ThinkPad P14s G4 21K5000LGE: AMD Ryzen 7 PRO 7840U, 14.00", 1.3 kg
Recensioni esterne » Lenovo ThinkPad P14s G4 21K5000LGE
HP EliteBook 865 G10: AMD Ryzen 9 PRO 7940HS, 16.00", 1.9 kg
Recensioni esterne » HP EliteBook 865 G10
Lenovo IdeaPad Pro 5 16APH8: AMD Ryzen 7 7840HS, 16.00", 1.9 kg
Recensioni esterne » Lenovo IdeaPad Pro 5 16APH8
Lenovo IdeaPad Pro 5 14AHP9: AMD Ryzen 7 8845HS, 14.00", 1.5 kg
Recensioni esterne » Lenovo IdeaPad Pro 5 14AHP9
HP EliteBook 845 G10 5Z4X0ES: AMD Ryzen 7 7840U, 14.00", 1.5 kg
Recensioni esterne » HP EliteBook 845 G10 5Z4X0ES
Lenovo ThinkPad Z13 Gen 2: AMD Ryzen 7 PRO 7840U, 13.30", 1.2 kg
Recensioni esterne » Lenovo ThinkPad Z13 Gen 2
HP ZBook Firefly 14 G10: AMD Ryzen 9 PRO 7940HS, 14.00", 1.5 kg
Recensioni esterne » HP ZBook Firefly 14 G10
Asus ROG Ally Z1 Extreme: AMD Ryzen Z1 Extreme, 7.00", 0.6 kg
Recensioni esterne » Asus ROG Ally Z1 Extreme
SCHENKER VIA 14 Pro (L23): AMD Ryzen 7 PRO 7840HS, 14.00", 1.4 kg
Recensioni esterne » SCHENKER VIA 14 Pro (L23)
Lenovo ThinkPad T14s G4-21F8002TGE: AMD Ryzen 7 7840U, 14.00", 1.4 kg
Recensioni esterne » Lenovo ThinkPad T14s G4-21F8002TGE
HP Pavilion Plus 14-ey0095cl: AMD Ryzen 7 7840U, 14.00", 1.4 kg
Recensioni esterne » HP Pavilion Plus 14-ey0095cl
Acer Swift Edge SFE16 Ryzen 7 7840U: AMD Ryzen 7 7840U, 16.00", 1.2 kg
Recensioni esterne » Acer Swift Edge SFE16 Ryzen 7 7840U
Lenovo Yoga Pro 7 14APH G8: AMD Ryzen 7 7840HS, 14.50", 1.5 kg
Recensioni esterne » Lenovo Yoga Pro 7 14APH8
Lenovo IdeaPad 5 Pro 16APH8: AMD Ryzen 7 7840HS, 16.00", 1.9 kg
Recensioni esterne » Lenovo IdeaPad 5 Pro 16APH8
Lenovo Legion Go: AMD Ryzen Z1 Extreme, 8.80", 0.8 kg
Recensioni esterne » Lenovo Legion Go
Xiaomi RedmiBook Pro 15 2023: AMD Ryzen 7 7840HS, 15.60", 1.8 kg
Recensioni esterne » Xiaomi RedmiBook Pro 15 2023
Acer Swift Edge SFE16-43: AMD Ryzen 7 7840U, 16.00", 1.3 kg
Recensioni esterne » Acer Swift Edge SFE16-43
Lenovo Yoga Slim 6 14APU8 7840U: AMD Ryzen 7 7840U, 14.00", 1.4 kg
Recensioni esterne » Lenovo Yoga Slim 6
Minisforum EliteMini UM890 Pro: AMD Ryzen 9 8945HS, 0.7 kg
» Minisforum EliteMini UM890 Pro: Il mini PC perfetto con APU AMD Ryzen 9?
Framework Laptop 13.5 Ryzen 7 7840U: AMD Ryzen 7 7840U, 13.50", 1.3 kg
» Framework 12 è stato annunciato come laptop 2-in-1 'entry-level' riparabile con un design robusto
Lenovo ThinkPad P14s G5 21ME000TGE: AMD Ryzen 7 PRO 8840HS, 14.00", 1.4 kg
» Maturo per Strix Halo: la prossima versione del ThinkPad P14s AMD ha bisogno di Ryzen AI Max
» Disparità di trattamento: Come Lenovo peggiora la variante AMD del ThinkPad P14s Gen 5
Lenovo Legion Go: AMD Ryzen Z1 Extreme, 8.80", 0.8 kg
» I controller Lenovo Legion Go 2 saranno retrocompatibili con Legion Go e saranno disponibili per l'acquisto "presto"
HP EliteBook 845 G11: AMD Ryzen 7 PRO 8840HS, 14.00", 1.5 kg
» L'EliteBook 845 di HP è uno dei migliori computer portatili business, ma le prestazioni di raffreddamento sono ancora un punto debole
Asus Zenbook 14 OLED UM3406HA: AMD Ryzen 7 8840HS, 14.00", 1.2 kg
» 2025 I notebook Asus Zenbook 14 OLED sono ora dotati di APU Intel Core Ultra 200H e Ryzen AI 300
Asus ROG Ally X: AMD Ryzen Z1 Extreme, 7.00", 0.7 kg
» MSI Claw 8 AI+ vs Rog Ally X: Secondo quanto riferito, l'APU Lunar Lake consente a MSI di colmare il divario in termini di prestazioni e durata della batteria
Asus ROG Ally Z1 Extreme: AMD Ryzen Z1 Extreme, 7.00", 0.6 kg
» MSI Claw 8 AI+ vs Rog Ally X: Secondo quanto riferito, l'APU Lunar Lake consente a MSI di colmare il divario in termini di prestazioni e durata della batteria
Lenovo Legion Go: AMD Ryzen Z1 Extreme, 8.80", 0.8 kg
» MSI Claw 8 AI+ vs Rog Ally X: Secondo quanto riferito, l'APU Lunar Lake consente a MSI di colmare il divario in termini di prestazioni e durata della batteria
Ayaneo Air 1S Retro Power : AMD Ryzen 7 7840U, 5.50", 0.4 kg
» Console portatile Ayaneo Flip KB: funzionalità eccellente, prestazioni di fascia media
Ayaneo Flip KB: AMD Ryzen 7 8840U, 7.00", 0.7 kg
» Console portatile Ayaneo Flip KB: funzionalità eccellente, prestazioni di fascia media
Ayaneo Kun: AMD Ryzen 7 7840U, 8.40", 0.9 kg
» Console portatile Ayaneo Flip KB: funzionalità eccellente, prestazioni di fascia media
GPD Win Mini 2024 7": AMD Ryzen 7 8840U, 7.00", 0.5 kg
» GPD svela i prezzi di Pocket 4: In arrivo un portatile ultraportatile alimentato da AMD
Asus ROG Ally X: AMD Ryzen Z1 Extreme, 7.00", 0.7 kg
» SteamOS si avvicina ai palmari di terze parti con il display Asus ROG Ally e il supporto VRR in Gamescope
Framework Laptop 13.5 Ryzen 7 7840U: AMD Ryzen 7 7840U, 13.50", 1.3 kg
» Framework Laptop Brick System espande il notebook con piedini Lego, ruote, supporti per cavi e altro ancora..
Minisforum Mercury Series EM780: AMD Ryzen 7 7840U, 0.2 kg
» Minisforum Mercury Series EM780 racchiude un AMD Ryzen 7 7840U e 32 GB di RAM DDR5 in uno chassis da 1/4 di litro
Lenovo ThinkPad P16s G2 21K9000CGE: AMD Ryzen 7 PRO 7840U, 16.00", 1.8 kg
» Veloce, luminoso, pratico: il Lenovo ThinkPad P16s G2 AMD con Ryzen 7 e una Radeon 780M recensito
Asus ROG Ally Z1 Extreme: AMD Ryzen Z1 Extreme, 7.00", 0.6 kg
» ASUS ROG Ally: l'esecutivo conferma che i gamers possono rinunciare al recente e problematico aggiornamento del BIOS
» ASUS ROG Ally: aperti i preordini, seguirà il modello AMD Ryzen Z1 più economico