Notebookcheck Logo

Recensione del mini PC Beelink GTI12 Ultra EX Docking Station: Più conveniente del previsto
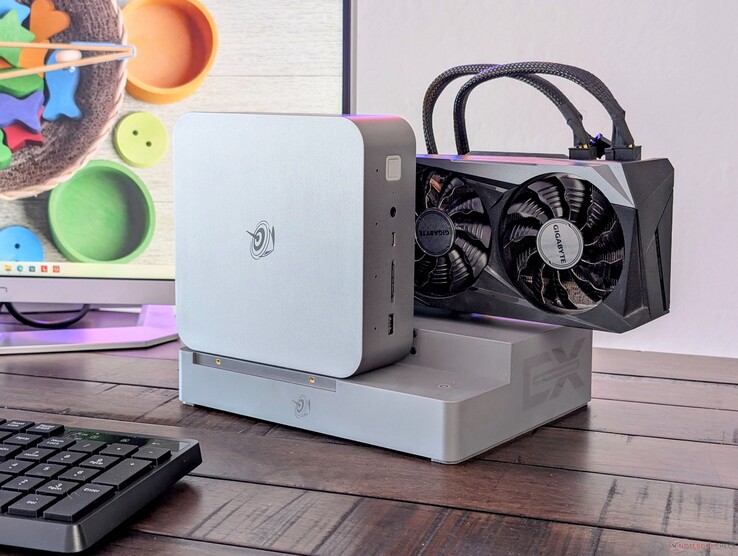
Mini PC ed eGPU pronti per il gioco a meno di 1.000 dollari.

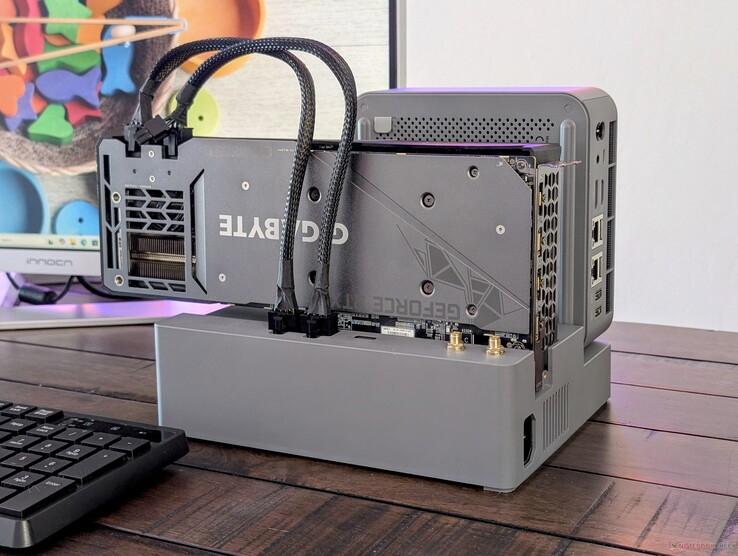
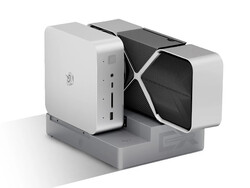
Le docking station per mini PC eGPU erano poco comuni e costose solo qualche anno fa, ma il dock Beelink EX è una delle opzioni meno costose finora, senza dover sacrificare le caratteristiche o la qualità.
Stazione docking Beelink GTI12 Ultra EX

Una delle principali lamentele dei mini PC Beelink finora è che sono tutti dotati solo di grafica integrata. Anche se l'ultima serie GTI Ultra non affronta direttamente questo problema, è comunque la prima incursione di Beelink nel supporto ufficiale delle eGPU tramite la EX Docking Station, per attirare gli utenti più potenti o i giocatori.

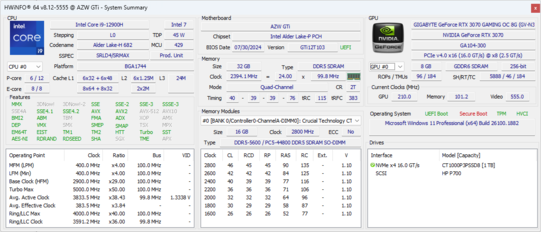
La nostra unità di prova è la GTI12 Ultra equipaggiata con Core i9-12900H, 1 TB di SSD e 32 GB di RAM DDR5-5600 al prezzo di circa 740 dollari USA, se abbinata alla EX Docking Station. Le CPU Meteor Lake più recenti sono disponibili con il nome di modello GTI14 Ultra, visivamente identico al GTI12 Ultra.

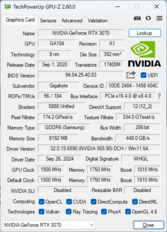
Abbiamo acquistato una GPU Gigabyte GeForce RTX 3070 personale per testare la EX Docking Station, ma il dock stesso può supportare GPU fino alla RTX 4090 a 600 W massimi.

Altre recensioni di Beelink:

Beelink GTI12 Ultra EX Docking Station
Processore
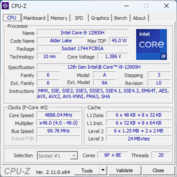
Intel Core i9-12900H 14 x 1.8 - 5 GHz, 70 W PL2 / Short Burst, 60 W PL1 / Sustained, Alder Lake-H
Scheda grafica
NVIDIA GeForce RTX 3070 - 8 GB VRAM, Core: 1815 MHz, RAM: 1750 MHz, 270 W TDP, GDDR6, 565.90
Memoria
32 GB 
, Crucial, DDR5-5600, Dual-Channel, 40-39-39-76
Scheda madre
Intel Alder Lake-P PCH
Harddisk
Crucial P3 Plus CT1000P3PSSD8, 1024 GB 
Scheda audio
Intel Alder Lake-P PCH - cAVS (Audio, Voice, Speech)
Porte di connessione
1 USB 2.0, 6 USB 3.1 Gen 2, 1 USB 4.0 40 Gbps, 1 Thunderbolt, USB-C Power Delivery (PD), 1 HDMI, 2 DisplayPort, Connessioni Audio: 2x 3.5 mm headset, Lettore schede: SD, 1 Lettore impronte digitali, PCIe4 x8
Rete
Intel Ethernet Controller I226-V (10/2500MBit/s), Intel Wi-Fi 6 AX200 (a/b/g/n = Wi-Fi 4/ac = Wi-Fi 5/ax = Wi-Fi 6/), Bluetooth 5.2
Dimensioni
altezza x larghezza x profondità (in mm): 55.8 x 158 x 158
Sistema Operativo
Microsoft Windows 11 Pro
Altre caratteristiche
Casse: Stereo, 12 Mesi Garanzia
Peso
1.316 kg, Alimentazione: 0 gr
Prezzo
740 USD
Nota: il produttore potrebbe usare componenti di fornitori diversi pannelli dei diplay, drive o banchi di memoria con specifiche simili.


Potenziali concorrenti a confrontos

Punteggio
Versione
Data
Modello
Peso
Altezza
Dimensione
Risoluzione
Prezzo
76.5 %v8
10/2024
Beelink GTI12 Ultra EX Docking Station
i9-12900H, NVIDIA GeForce RTX 3070
1.3 kg55.8 mmx
76.7 %v8
10/2024
Minisforum MS-A1
Ryzen 7 8700G, Radeon 780M
1.7 kg48 mmx
67.3 %v8
09/2024
GMK NucBox K9
Ultra 5 125H, Arc 7-Core
528 gr47 mmx
74.7 %v8
08/2024
Asus NUC 14 Pro
Ultra 5 125H, Arc 7-Core
525 gr37 mmx
78.4 %v8
08/2024
Geekom AX8 Pro
R9 8945H, Radeon 780M
548 gr37 mmx
86 %v8
08/2024
Asus ROG NUC 14-90AS0051
Ultra 9 185H, NVIDIA GeForce RTX 4070 Laptop GPU
2.6 kg50 mmx

Caso

Il GTI12 Ultra è essenzialmente un modello ingrandito di SER8 utilizzando gli stessi materiali del telaio in metallo, il fondo in plastica e la finitura liscia e opaca. Internamente, tuttavia, i due modelli sono molto diversi, in quanto GTI12 Ultra integra un alimentatore da 145 W invece di affidarsi a un alimentatore esterno. Integra anche due altoparlanti, per essere uno dei pochissimi mini PC con audio integrato e alimentatore.

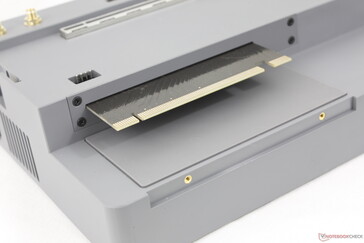
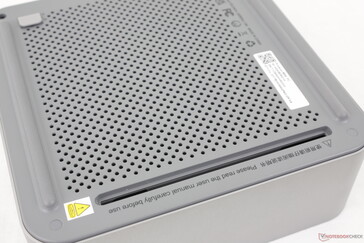
Un'altra caratteristica unica è lo slot PCI x8 sul fondo dell'unità per il collegamento alla Docking Station EX, come mostra l'immagine qui sotto. Apprezziamo il fatto che il connettore non sia proprietario, come nel caso di Asus ROG XG Mobile.

L'unità è notevolmente più grande e più pesante rispetto alla maggior parte degli altri mini PC con grafica integrata, a causa delle caratteristiche uniche sopra menzionate.

Mini PCStazione docking EXMini PC + Docking Station EX
1316 g1419 g2735 g


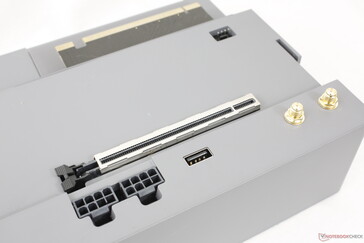
La docking station EX è essenzialmente un riser PCIe, poiché non utilizza porte proprietarie
La piastra rimovibile può essere avvitata nelle due filettature dorate per fissare meglio il mini PC sul dock
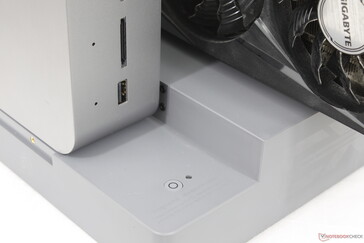
La docking station include un pulsante di accensione e un cavo di alimentazione separati
Il dock fornisce solo una porta USB-A aggiuntiva, nonostante le sue grandi dimensioni
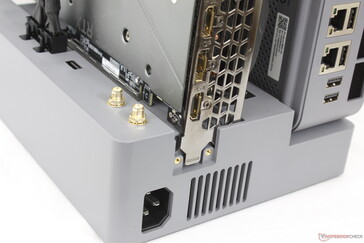
Due connettori a 8 pin con espansione dell'antenna Wi-Fi (venduta separatamente)
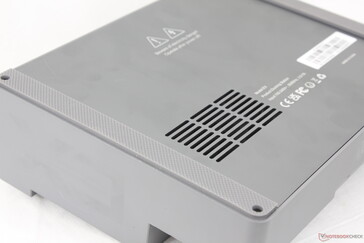
La parte inferiore del bacino è fissata da quattro viti Phillips per facilitare la manutenzione
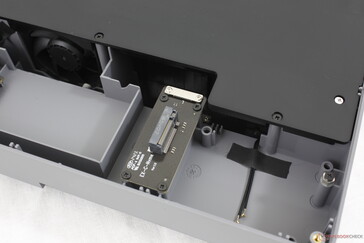
Gli utenti possono installare un SSD M.2 o un modulo Wi-Fi all'interno della docking station, ma non entrambi contemporaneamente
La parte inferiore del mini PC GTI12 Ultra mostra lo slot PCIe per il collegamento alla docking station

Confronto delle dimensioni

270 mm 180 mm 50 mm 2.6 kg189.5 mm 186 mm 48 mm 1.7 kg158 mm 158 mm 55.8 mm 1.3 kg128 mm 126 mm 47 mm 528 g117 mm 112 mm 37 mm 525 g117 mm 112 mm 37 mm 548 g297 mm 210 mm 1 mm 5.7 g

Connettività

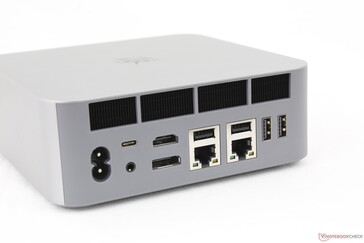
Le opzioni di porte sono superiori a quelle offerte dal SER8 e da molti altri mini PC di dimensioni NUC, poiché il GTI12 Ultra è così grande. Il modello integra un lettore di schede SD, oltre a porte USB-A e porte RJ-45 aggiuntive.

Non c'è un lucchetto Kensington.

Parte anteriore: USB-A 3.0 (10 Gbps), lettore SD, USB-C (10 Gbps), cuffie da 3,5 mm, pulsante di accensione con impronta digitale, array di microfoni quadrupli
Posteriore: Alimentazione AC (senza alimentatore esterno), USB-C Thunderbolt 4 con DisplayPort + Power Delivery, cuffie da 3,5 mm, HDMI (4K@60), DisplayPort 1.4 (4K@144), 2x RJ-45 (2,5 Gbps), 4x USB-A 3.0 (10 Gbps)

Lettore di schede SD

SD Card Reader
average JPG Copy Test (av. of 3 runs)
Asus ROG NUC 14-90AS0051
Intel Core Ultra 9 185H (AV Pro SD microSD 128 GB V60)
88.75 MB/s +323%
Beelink GTI12 Ultra EX Docking Station
Intel Core i9-12900H (Toshiba Exceria Pro SDXC 64 GB UHS-II)
21 MB/s
maximum AS SSD Seq Read Test (1GB)
Asus ROG NUC 14-90AS0051
Intel Core Ultra 9 185H (AV Pro SD microSD 128 GB V60)
91.05 MB/s +338%
Beelink GTI12 Ultra EX Docking Station
Intel Core i9-12900H (Toshiba Exceria Pro SDXC 64 GB UHS-II)
20.8 MB/s

Comunicazione

Wi-Fi 6E e Wi-Fi 7 non sono supportati, probabilmente per risparmiare sui costi.

Networking
iperf3 transmit AXE11000
Asus NUC 14 Pro
Intel Wi-Fi 6E AX211
1331 (1187min - 1442max) MBit/s +24%
Beelink GTI12 Ultra EX Docking Station
Intel Wi-Fi 6 AX200
1075 (555min - 1239max) MBit/s
Asus ROG NUC 14-90AS0051
Killer Wi-Fi 6E AX1690i 160MHz
966 (943min - 999max) MBit/s -10%
Geekom AX8 Pro
MediaTek Wi-Fi 6E MT7922 160MHz Wireless LAN Card
966 (921min - 1008max) MBit/s -10%
Minisforum MS-A1
Intel Wi-Fi 6E AX210
855 (438min - 894max) MBit/s -20%
GMK NucBox K9
Intel Wi-Fi 6 AX201
823 (607min - 901max) MBit/s -23%
iperf3 receive AXE11000
Asus NUC 14 Pro
Intel Wi-Fi 6E AX211
1379 (1016min - 1613max) MBit/s +10%
Beelink GTI12 Ultra EX Docking Station
Intel Wi-Fi 6 AX200
1251 (617min - 1359max) MBit/s
Geekom AX8 Pro
MediaTek Wi-Fi 6E MT7922 160MHz Wireless LAN Card
979 (962min - 989max) MBit/s -22%
Asus ROG NUC 14-90AS0051
Killer Wi-Fi 6E AX1690i 160MHz
947 (855min - 967max) MBit/s -24%
Minisforum MS-A1
Intel Wi-Fi 6E AX210
941 (873min - 964max) MBit/s -25%
GMK NucBox K9
Intel Wi-Fi 6 AX201
764 (635min - 829max) MBit/s -39%
iperf3 transmit AXE11000 6GHz
Geekom AX8 Pro
MediaTek Wi-Fi 6E MT7922 160MHz Wireless LAN Card
1800 (1737min - 1904max) MBit/s
Asus ROG NUC 14-90AS0051
Killer Wi-Fi 6E AX1690i 160MHz
1729 (1634min - 1767max) MBit/s
Minisforum MS-A1
Intel Wi-Fi 6E AX210
1597 (1554min - 1657max) MBit/s
Asus NUC 14 Pro
Intel Wi-Fi 6E AX211
1379 (1299min - 1425max) MBit/s
iperf3 receive AXE11000 6GHz
Minisforum MS-A1
Intel Wi-Fi 6E AX210
1749 (1702min - 1767max) MBit/s
Asus ROG NUC 14-90AS0051
Killer Wi-Fi 6E AX1690i 160MHz
1736 (1706min - 1748max) MBit/s
Asus NUC 14 Pro
Intel Wi-Fi 6E AX211
1729 (1594min - 1755max) MBit/s
Geekom AX8 Pro
MediaTek Wi-Fi 6E MT7922 160MHz Wireless LAN Card
1657 (1619min - 1670max) MBit/s
05010015020025030035040045050055060065070075080085090095010001050110011501200125013001350Tooltip
Beelink GTI12 Ultra EX Docking Station; iperf3 receive AXE11000; iperf 3.1.3: Ø1230 (617-1359)
Beelink GTI12 Ultra EX Docking Station; iperf3 transmit AXE11000; iperf 3.1.3: Ø1056 (555-1239)

Manutenzione

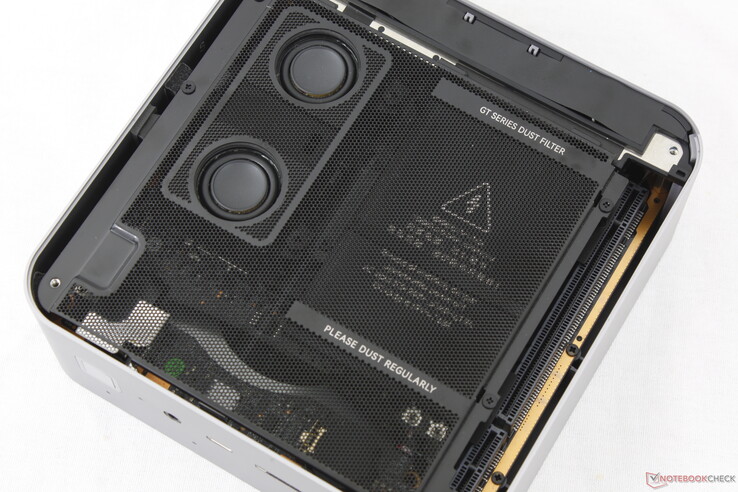
Il GTI12 Ultra è molto più difficile da riparare rispetto ai suoi fratelli minori, perché ha più parti integrate che non si trovano in altri modelli. I diffusori, il filtro antipolvere e l'alimentatore integrato si trovano sopra la scheda madre e ognuno di essi ha viti di dimensioni diverse che rendono la manutenzione ancora più difficile.

L'apertura del pannello inferiore rivela gli altoparlanti, il filtro antipolvere e l'alimentatore integrato, che devono essere rimossi separatamente per accedere agli slot per 2x SODIMM e 2x M.2 PCIe4 2280 SSD

Sostenibilità

Beelink non pubblicizza alcuna misura di sostenibilità adottata per la produzione di GTI12. L'imballaggio è costituito per lo più da carta, con alcuni involucri in LDPE e plastica.

Accessori e garanzia

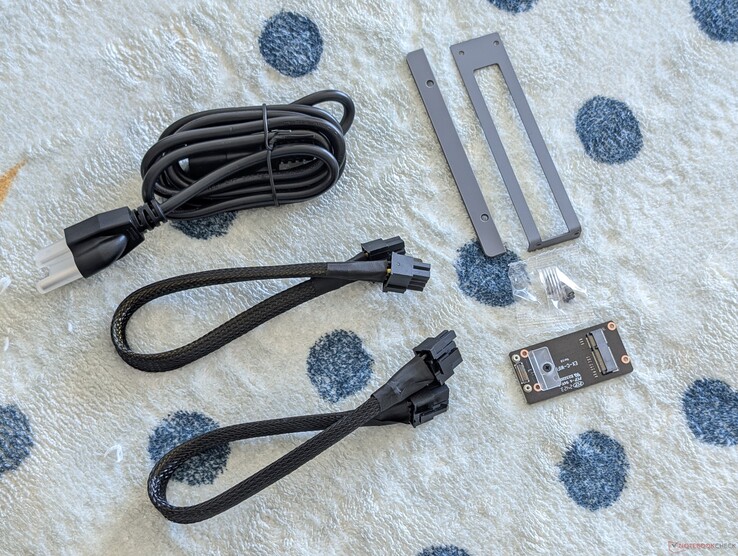
Il dock EX include due cavi di alimentazione a 6+2 pin e due piccole piastre per fissare la GPU e il mini PC sul dock. Lo slot Wi-Fi M.2 e l'antenna sono opzionali per coloro che desiderano installare un modulo WLAN sulla docking station invece che all'interno del mini PC. Praticamente tutti i mini PC sono dotati di WLAN integrata e quindi questa caratteristica specifica del dock può essere ignorata dalla maggior parte degli utenti.

Accessori della Docking Station EX

Prestazioni


Condizioni del test

Abbiamo impostato Windows in modalità Prestazioni prima di eseguire i benchmark qui sotto.

Processore

Il Core i9-12900H è da due a tre generazioni indietro rispetto all'attuale serie Raptor Lake-R e i risultati dei benchmark lo riflettono. Il più recente Core i9-14900HXad esempio, offre quasi il doppio delle prestazioni multi-thread rispetto alla nostra unità Beelink. Anche i mini PC più economici, come il Beelink SER7 possono offrire prestazioni del processore quasi identiche.

Per questo modello, chiamato GTI14, sono disponibili opzioni di processori Meteor Lake Core Ultra più recenti.

Cinebench R15 Multi Loop

02605207801040130015601820208023402600286031203380364039004160442046804940Tooltip
Beelink GTI12 Ultra EX Docking Station Intel Core i9-12900H: Ø2400 (2262.06-2414.15)
Asus ROG NUC 14-90AS0051 Intel Core Ultra 9 185H: Ø2897 (2858.16-2939.02)
Minisforum G7 PT AMD Ryzen 9 7945HX: Ø4926 (4863.22-5192.11)
Acemagic M2A Intel Core i9-12900H: Ø1833 (1798.4-2157.61)
Acemagic Tank03 Intel Core i9-12900H: Ø1779 (1736.94-2045.09)
Asus TUF Gaming A14 FA401WV-WB94 AMD Ryzen AI 9 HX 370: Ø3426 (3408.61-3447.98)
Lenovo IdeaPad Pro 5 16IMH G9 RTX 4050 Intel Core Ultra 9 185H: Ø2769 (2700.88-2896.24)
Lenovo Legion 9 16IRX9, RTX 4090 Intel Core i9-14900HX: Ø4648 (4505.52-4878.64)
CPU Performance Rating: Percent
Cinebench R23: Multi Core | Single Core
Cinebench R20: CPU (Multi Core) | CPU (Single Core)
Cinebench R15: CPU Multi 64Bit | CPU Single 64Bit
Blender: v2.79 BMW27 CPU
7-Zip 18.03: 7z b 4 | 7z b 4 -mmt1
Geekbench 6.3: Multi-Core | Single-Core
Geekbench 5.5: Multi-Core | Single-Core
HWBOT x265 Benchmark v2.2: 4k Preset
LibreOffice : 20 Documents To PDF
R Benchmark 2.5: Overall mean
CPU Performance Rating
Minisforum G7 PT
AMD Ryzen 9 7945HX
85.9 pt
Lenovo Legion 9 16IRX9, RTX 4090
Intel Core i9-14900HX
77.3 pt
Asus TUF Gaming A14 FA401WV-WB94
AMD Ryzen AI 9 HX 370
71.3 pt
Lenovo IdeaPad Pro 5 16IMH G9 RTX 4050
Intel Core Ultra 9 185H
65.7 pt
Beelink SER8
AMD Ryzen 7 8845HS
63.3 pt
Beelink SER7
AMD Ryzen 7 7840HS
62.7 pt
Asus ROG NUC 14-90AS0051
Intel Core Ultra 9 185H
62.3 pt
Beelink GTI12 Ultra EX Docking Station
Intel Core i9-12900H
61.3 pt
Lenovo IdeaCentre Mini 01IRH8
Intel Core i7-13700H
58 pt
Acemagic M2A
Intel Core i9-12900H
57.3 pt
Media Intel Core i9-12900H
 
57.1 pt
Maingear ML-16 MK2
Intel Core Ultra 7 155H
55.7 pt
Acemagic Tank03
Intel Core i9-12900H
53.7 pt
Geekom XT13 Pro
Intel Core i9-13900H
53 pt
MSI GeForce RTX 3070 Ventus 3X -8!
AMD Ryzen 9 5900X
46.1 pt
Beelink SER6 Pro -2!
AMD Ryzen 7 6800H
45.1 pt
Cinebench R23 / Multi Core
Lenovo Legion 9 16IRX9, RTX 4090
Intel Core i9-14900HX
31889 Points +96%
Minisforum G7 PT
AMD Ryzen 9 7945HX
30799 Points +89%
Asus TUF Gaming A14 FA401WV-WB94
AMD Ryzen AI 9 HX 370
23456 (23201.9min - 23456.3max) Points +44%
Lenovo IdeaPad Pro 5 16IMH G9 RTX 4050
Intel Core Ultra 9 185H
19496 (18014.8min - 19496.3max) Points +20%
Asus ROG NUC 14-90AS0051
Intel Core Ultra 9 185H
19249 Points +18%
Maingear ML-16 MK2
Intel Core Ultra 7 155H
17231 (12872.9min - 17231.1max) Points +6%
Beelink SER8
AMD Ryzen 7 8845HS
16661 (16363.9min - 16661max) Points +2%
Beelink GTI12 Ultra EX Docking Station
Intel Core i9-12900H
16270 (15738.9min - 16269.6max) Points
Beelink SER7
AMD Ryzen 7 7840HS
16105 (15785.6min - 16105.2max) Points -1%
Media Intel Core i9-12900H
  (7359 - 19648, n=28)
15133 Points -7%
Lenovo IdeaCentre Mini 01IRH8
Intel Core i7-13700H
14465 (9293.64min - 14465.4max) Points -11%
Acemagic M2A
Intel Core i9-12900H
13899 Points -15%
Acemagic Tank03
Intel Core i9-12900H
13561 Points -17%
Geekom XT13 Pro
Intel Core i9-13900H
11997 Points -26%
Beelink SER6 Pro
AMD Ryzen 7 6800H
11481 (10813.7min - 11481.3max) Points -29%
Cinebench R23 / Single Core
Asus TUF Gaming A14 FA401WV-WB94
AMD Ryzen AI 9 HX 370
1979 Points +3%
Minisforum G7 PT
AMD Ryzen 9 7945HX
1957 Points +1%
Beelink GTI12 Ultra EX Docking Station
Intel Core i9-12900H
1930 Points
Acemagic M2A
Intel Core i9-12900H
1907 Points -1%
Lenovo IdeaCentre Mini 01IRH8
Intel Core i7-13700H
1898 Points -2%
Lenovo IdeaPad Pro 5 16IMH G9 RTX 4050
Intel Core Ultra 9 185H
1887 Points -2%
Media Intel Core i9-12900H
  (1634 - 1930, n=28)
1829 Points -5%
Asus ROG NUC 14-90AS0051
Intel Core Ultra 9 185H
1825 Points -5%
Beelink SER8
AMD Ryzen 7 8845HS
1783 Points -8%
Acemagic Tank03
Intel Core i9-12900H
1781 Points -8%
Beelink SER7
AMD Ryzen 7 7840HS
1774 Points -8%
Lenovo Legion 9 16IRX9, RTX 4090
Intel Core i9-14900HX
1720 Points -11%
Geekom XT13 Pro
Intel Core i9-13900H
1719 Points -11%
Maingear ML-16 MK2
Intel Core Ultra 7 155H
1650 Points -15%
Beelink SER6 Pro
AMD Ryzen 7 6800H
1506 Points -22%
Cinebench R20 / CPU (Multi Core)
Minisforum G7 PT
AMD Ryzen 9 7945HX
12210 Points +95%
Lenovo Legion 9 16IRX9, RTX 4090
Intel Core i9-14900HX
11960 Points +91%
Asus TUF Gaming A14 FA401WV-WB94
AMD Ryzen AI 9 HX 370
9151 Points +46%
Asus ROG NUC 14-90AS0051
Intel Core Ultra 9 185H
7513 Points +20%
Lenovo IdeaPad Pro 5 16IMH G9 RTX 4050
Intel Core Ultra 9 185H
7431 Points +19%
Maingear ML-16 MK2
Intel Core Ultra 7 155H
6789 Points +8%
Beelink SER8
AMD Ryzen 7 8845HS
6431 Points +3%
Beelink SER7
AMD Ryzen 7 7840HS
6344 Points +1%
Beelink GTI12 Ultra EX Docking Station
Intel Core i9-12900H
6267 Points
Lenovo IdeaCentre Mini 01IRH8
Intel Core i7-13700H
5800 Points -7%
Media Intel Core i9-12900H
  (2681 - 7471, n=28)
5717 Points -9%
Acemagic M2A
Intel Core i9-12900H
5472 Points -13%
Acemagic Tank03
Intel Core i9-12900H
5154 Points -18%
Geekom XT13 Pro
Intel Core i9-13900H
4935 Points -21%
Beelink SER6 Pro
AMD Ryzen 7 6800H
4460 Points -29%
Cinebench R20 / CPU (Single Core)
Asus TUF Gaming A14 FA401WV-WB94
AMD Ryzen AI 9 HX 370
782 Points +11%
Minisforum G7 PT
AMD Ryzen 9 7945HX
754 Points +7%
Acemagic M2A
Intel Core i9-12900H
735 Points +4%
Lenovo IdeaPad Pro 5 16IMH G9 RTX 4050
Intel Core Ultra 9 185H
729 Points +3%
Lenovo IdeaCentre Mini 01IRH8
Intel Core i7-13700H
721 Points +2%
Beelink GTI12 Ultra EX Docking Station
Intel Core i9-12900H
707 Points
Media Intel Core i9-12900H
  (624 - 738, n=28)
706 Points 0%
Asus ROG NUC 14-90AS0051
Intel Core Ultra 9 185H
699 Points -1%
Beelink SER7
AMD Ryzen 7 7840HS
698 Points -1%
Beelink SER8
AMD Ryzen 7 8845HS
698 Points -1%
Acemagic Tank03
Intel Core i9-12900H
686 Points -3%
Lenovo Legion 9 16IRX9, RTX 4090
Intel Core i9-14900HX
657 Points -7%
Geekom XT13 Pro
Intel Core i9-13900H
649 Points -8%
Maingear ML-16 MK2
Intel Core Ultra 7 155H
634 Points -10%
Beelink SER6 Pro
AMD Ryzen 7 6800H
584 Points -17%
Cinebench R15 / CPU Multi 64Bit
Minisforum G7 PT
AMD Ryzen 9 7945HX
4998 Points +107%
Lenovo Legion 9 16IRX9, RTX 4090
Intel Core i9-14900HX
4879 (4505.52min - 4878.64max) Points +102%
Asus TUF Gaming A14 FA401WV-WB94
AMD Ryzen AI 9 HX 370
3448 (3408.61min - 3447.98max) Points +43%
Asus ROG NUC 14-90AS0051
Intel Core Ultra 9 185H
2948 Points +22%
Lenovo IdeaPad Pro 5 16IMH G9 RTX 4050
Intel Core Ultra 9 185H
2896 (2700.88min - 2896.24max) Points +20%
Maingear ML-16 MK2
Intel Core Ultra 7 155H
2705 (1976.58min - 2705.26max) Points +12%
Beelink SER8
AMD Ryzen 7 8845HS
2627 (2586.82min - 2626.57max) Points +9%
Beelink SER7
AMD Ryzen 7 7840HS
2565 (2511.62min - 2564.76max) Points +6%
Media Intel Core i9-12900H
  (1395 - 3077, n=28)
2454 Points +2%
Geekom XT13 Pro
Intel Core i9-13900H
2448 Points +1%
Beelink GTI12 Ultra EX Docking Station
Intel Core i9-12900H
2414 (2262.06min - 2414.15max) Points
Lenovo IdeaCentre Mini 01IRH8
Intel Core i7-13700H
2240 (1862.02min - 2240.14max) Points -7%
Acemagic Tank03
Intel Core i9-12900H
2154 Points -11%
Acemagic M2A
Intel Core i9-12900H
2136 Points -12%
Beelink SER6 Pro
AMD Ryzen 7 6800H
1931 (1821.83min - 1930.5max) Points -20%
Cinebench R15 / CPU Single 64Bit
Minisforum G7 PT
AMD Ryzen 9 7945HX
309 Points +13%
Asus TUF Gaming A14 FA401WV-WB94
AMD Ryzen AI 9 HX 370
301 Points +10%
Beelink SER7
AMD Ryzen 7 7840HS
283 Points +4%
Beelink SER8
AMD Ryzen 7 8845HS
283 Points +4%
Lenovo IdeaPad Pro 5 16IMH G9 RTX 4050
Intel Core Ultra 9 185H
276 Points +1%
Beelink GTI12 Ultra EX Docking Station
Intel Core i9-12900H
273 Points
Acemagic M2A
Intel Core i9-12900H
266 Points -3%
Asus ROG NUC 14-90AS0051
Intel Core Ultra 9 185H
263 Points -4%
Media Intel Core i9-12900H
  (235 - 277, n=29)
262 Points -4%
Lenovo IdeaCentre Mini 01IRH8
Intel Core i7-13700H
260 Points -5%
Acemagic Tank03
Intel Core i9-12900H
251 Points -8%
Lenovo Legion 9 16IRX9, RTX 4090
Intel Core i9-14900HX
247 Points -10%
Geekom XT13 Pro
Intel Core i9-13900H
245 Points -10%
Beelink SER6 Pro
AMD Ryzen 7 6800H
242 Points -11%
Maingear ML-16 MK2
Intel Core Ultra 7 155H
242 Points -11%
Blender / v2.79 BMW27 CPU
Beelink SER6 Pro
AMD Ryzen 7 6800H
268 Seconds * -37%
Geekom XT13 Pro
Intel Core i9-13900H
261 Seconds * -34%
Acemagic M2A
Intel Core i9-12900H
254 Seconds * -30%
Acemagic Tank03
Intel Core i9-12900H
253 Seconds * -30%
Media Intel Core i9-12900H
  (160 - 451, n=28)
231 Seconds * -18%
Maingear ML-16 MK2
Intel Core Ultra 7 155H
226 Seconds * -16%
Lenovo IdeaCentre Mini 01IRH8
Intel Core i7-13700H
216 Seconds * -11%
Beelink SER7
AMD Ryzen 7 7840HS
196 Seconds * -1%
Beelink GTI12 Ultra EX Docking Station
Intel Core i9-12900H
195 Seconds *
Beelink SER8
AMD Ryzen 7 8845HS
191 Seconds * +2%
Lenovo IdeaPad Pro 5 16IMH G9 RTX 4050
Intel Core Ultra 9 185H
170 Seconds * +13%
Asus ROG NUC 14-90AS0051
Intel Core Ultra 9 185H
165 Seconds * +15%
MSI GeForce RTX 3070 Ventus 3X
AMD Ryzen 9 5900X
155.9 Seconds * +20%
Asus TUF Gaming A14 FA401WV-WB94
AMD Ryzen AI 9 HX 370
143 Seconds * +27%
Lenovo Legion 9 16IRX9, RTX 4090
Intel Core i9-14900HX
106 Seconds * +46%
Minisforum G7 PT
AMD Ryzen 9 7945HX
99 Seconds * +49%
7-Zip 18.03 / 7z b 4
Minisforum G7 PT
AMD Ryzen 9 7945HX
131378 MIPS +100%
Lenovo Legion 9 16IRX9, RTX 4090
Intel Core i9-14900HX
125676 MIPS +92%
MSI GeForce RTX 3070 Ventus 3X
AMD Ryzen 9 5900X
83552 MIPS +27%
Asus TUF Gaming A14 FA401WV-WB94
AMD Ryzen AI 9 HX 370
80277 MIPS +22%
Lenovo IdeaPad Pro 5 16IMH G9 RTX 4050
Intel Core Ultra 9 185H
74343 MIPS +13%
Asus ROG NUC 14-90AS0051
Intel Core Ultra 9 185H
72894 MIPS +11%
Beelink SER8
AMD Ryzen 7 8845HS
70937 MIPS +8%
Beelink SER7
AMD Ryzen 7 7840HS
69882 MIPS +7%
Beelink GTI12 Ultra EX Docking Station
Intel Core i9-12900H
65594 MIPS
Maingear ML-16 MK2
Intel Core Ultra 7 155H
64182 MIPS -2%
Media Intel Core i9-12900H
  (34684 - 76677, n=28)
60849 MIPS -7%
Geekom XT13 Pro
Intel Core i9-13900H
56068 MIPS -15%
Beelink SER6 Pro
AMD Ryzen 7 6800H
55963 MIPS -15%
Acemagic Tank03
Intel Core i9-12900H
55613 MIPS -15%
Lenovo IdeaCentre Mini 01IRH8
Intel Core i7-13700H
54733 MIPS -17%
Acemagic M2A
Intel Core i9-12900H
52663 MIPS -20%
7-Zip 18.03 / 7z b 4 -mmt1
Minisforum G7 PT
AMD Ryzen 9 7945HX
7609 MIPS +32%
Beelink SER7
AMD Ryzen 7 7840HS
6734 MIPS +17%
Beelink SER8
AMD Ryzen 7 8845HS
6714 MIPS +16%
MSI GeForce RTX 3070 Ventus 3X
AMD Ryzen 9 5900X
6349 MIPS +10%
Asus TUF Gaming A14 FA401WV-WB94
AMD Ryzen AI 9 HX 370
6106 MIPS +6%
Acemagic M2A
Intel Core i9-12900H
6076 MIPS +5%
Lenovo IdeaCentre Mini 01IRH8
Intel Core i7-13700H
6014 MIPS +4%
Media Intel Core i9-12900H
  (5302 - 6289, n=28)
5843 MIPS +1%
Geekom XT13 Pro
Intel Core i9-13900H
5828 MIPS +1%
Beelink GTI12 Ultra EX Docking Station
Intel Core i9-12900H
5774 MIPS
Beelink SER6 Pro
AMD Ryzen 7 6800H
5768 MIPS 0%
Lenovo IdeaPad Pro 5 16IMH G9 RTX 4050
Intel Core Ultra 9 185H
5724 MIPS -1%
Acemagic Tank03
Intel Core i9-12900H
5582 MIPS -3%
Lenovo Legion 9 16IRX9, RTX 4090
Intel Core i9-14900HX
5452 MIPS -6%
Asus ROG NUC 14-90AS0051
Intel Core Ultra 9 185H
5333 MIPS -8%
Maingear ML-16 MK2
Intel Core Ultra 7 155H
5047 MIPS -13%
Geekbench 6.3 / Multi-Core
Lenovo Legion 9 16IRX9, RTX 4090
Intel Core i9-14900HX
17499 Points +38%
Minisforum G7 PT
AMD Ryzen 9 7945HX
16765 Points +33%
Asus TUF Gaming A14 FA401WV-WB94
AMD Ryzen AI 9 HX 370
13799 Points +9%
Lenovo IdeaPad Pro 5 16IMH G9 RTX 4050
Intel Core Ultra 9 185H
13613 Points +8%
Beelink SER8
AMD Ryzen 7 8845HS
13362 Points +6%
Asus ROG NUC 14-90AS0051
Intel Core Ultra 9 185H
13232 Points +5%
Beelink SER7
AMD Ryzen 7 7840HS
12694 Points 0%
Beelink GTI12 Ultra EX Docking Station
Intel Core i9-12900H
12649 Points
Acemagic M2A
Intel Core i9-12900H
12044 Points -5%
Maingear ML-16 MK2
Intel Core Ultra 7 155H
11941 Points -6%
Geekom XT13 Pro
Intel Core i9-13900H
11541 Points -9%
Acemagic Tank03
Intel Core i9-12900H
11247 Points -11%
Media Intel Core i9-12900H
  (9258 - 12649, n=9)
10604 Points -16%
Lenovo IdeaCentre Mini 01IRH8
Intel Core i7-13700H
10362 Points -18%
Geekbench 6.3 / Single-Core
Minisforum G7 PT
AMD Ryzen 9 7945HX
2880 Points +9%
Asus TUF Gaming A14 FA401WV-WB94
AMD Ryzen AI 9 HX 370
2846 Points +7%
Beelink SER8
AMD Ryzen 7 8845HS
2694 Points +2%
Beelink SER7
AMD Ryzen 7 7840HS
2657 Points 0%
Beelink GTI12 Ultra EX Docking Station
Intel Core i9-12900H
2652 Points
Lenovo IdeaCentre Mini 01IRH8
Intel Core i7-13700H
2600 Points -2%
Acemagic M2A
Intel Core i9-12900H
2582 Points -3%
Lenovo IdeaPad Pro 5 16IMH G9 RTX 4050
Intel Core Ultra 9 185H
2568 Points -3%
Asus ROG NUC 14-90AS0051
Intel Core Ultra 9 185H
2485 Points -6%
Lenovo Legion 9 16IRX9, RTX 4090
Intel Core i9-14900HX
2419 Points -9%
Geekom XT13 Pro
Intel Core i9-13900H
2415 Points -9%
Media Intel Core i9-12900H
  (1893 - 2652, n=9)
2375 Points -10%
Acemagic Tank03
Intel Core i9-12900H
2273 Points -14%
Maingear ML-16 MK2
Intel Core Ultra 7 155H
2238 Points -16%
Geekbench 5.5 / Multi-Core
Lenovo Legion 9 16IRX9, RTX 4090
Intel Core i9-14900HX
21642 Points +77%
Minisforum G7 PT
AMD Ryzen 9 7945HX
19836 Points +62%
Asus TUF Gaming A14 FA401WV-WB94
AMD Ryzen AI 9 HX 370
14068 Points +15%
Lenovo IdeaPad Pro 5 16IMH G9 RTX 4050
Intel Core Ultra 9 185H
13496 Points +10%
Asus ROG NUC 14-90AS0051
Intel Core Ultra 9 185H
13339 Points +9%
Beelink GTI12 Ultra EX Docking Station
Intel Core i9-12900H
12237 Points
Maingear ML-16 MK2
Intel Core Ultra 7 155H
12228 Points 0%
Beelink SER8
AMD Ryzen 7 8845HS
12196 Points 0%
Media Intel Core i9-12900H
  (8519 - 14376, n=31)
11913 Points -3%
Geekom XT13 Pro
Intel Core i9-13900H
11536 Points -6%
Beelink SER7
AMD Ryzen 7 7840HS
11423 Points -7%
Acemagic M2A
Intel Core i9-12900H
11406 Points -7%
Acemagic Tank03
Intel Core i9-12900H
11155 Points -9%
Lenovo IdeaCentre Mini 01IRH8
Intel Core i7-13700H
10361 Points -15%
MSI GeForce RTX 3070 Ventus 3X
AMD Ryzen 9 5900X
9960 Points -19%
Beelink SER6 Pro
AMD Ryzen 7 6800H
9218 Points -25%
Geekbench 5.5 / Single-Core
Minisforum G7 PT
AMD Ryzen 9 7945HX
2147 Points +13%
Asus TUF Gaming A14 FA401WV-WB94
AMD Ryzen AI 9 HX 370
2030 Points +7%
Beelink SER8
AMD Ryzen 7 8845HS
2004 Points +6%
Beelink SER7
AMD Ryzen 7 7840HS
1983 Points +5%
Beelink GTI12 Ultra EX Docking Station
Intel Core i9-12900H
1897 Points
Lenovo IdeaPad Pro 5 16IMH G9 RTX 4050
Intel Core Ultra 9 185H
1881 Points -1%
Asus ROG NUC 14-90AS0051
Intel Core Ultra 9 185H
1858 Points -2%
Lenovo IdeaCentre Mini 01IRH8
Intel Core i7-13700H
1842 Points -3%
Acemagic M2A
Intel Core i9-12900H
1842 Points -3%
Media Intel Core i9-12900H
  (1631 - 1897, n=31)
1800 Points -5%
Lenovo Legion 9 16IRX9, RTX 4090
Intel Core i9-14900HX
1729 Points -9%
Geekom XT13 Pro
Intel Core i9-13900H
1708 Points -10%
Acemagic Tank03
Intel Core i9-12900H
1692 Points -11%
Maingear ML-16 MK2
Intel Core Ultra 7 155H
1637 Points -14%
Beelink SER6 Pro
AMD Ryzen 7 6800H
1554 Points -18%
MSI GeForce RTX 3070 Ventus 3X
AMD Ryzen 9 5900X
1485 Points -22%
HWBOT x265 Benchmark v2.2 / 4k Preset
Minisforum G7 PT
AMD Ryzen 9 7945HX
34.6 fps +94%
Lenovo Legion 9 16IRX9, RTX 4090
Intel Core i9-14900HX
30.7 fps +72%
Asus TUF Gaming A14 FA401WV-WB94
AMD Ryzen AI 9 HX 370
26 fps +46%
Lenovo IdeaPad Pro 5 16IMH G9 RTX 4050
Intel Core Ultra 9 185H
22.2 fps +25%
Asus ROG NUC 14-90AS0051
Intel Core Ultra 9 185H
21.8 fps +22%
MSI GeForce RTX 3070 Ventus 3X
AMD Ryzen 9 5900X
21.4 fps +20%
Beelink SER8
AMD Ryzen 7 8845HS
21.1 fps +19%
Beelink SER7
AMD Ryzen 7 7840HS
20.4 fps +15%
Maingear ML-16 MK2
Intel Core Ultra 7 155H
17.9 fps +1%
Beelink GTI12 Ultra EX Docking Station
Intel Core i9-12900H
17.8 fps
Lenovo IdeaCentre Mini 01IRH8
Intel Core i7-13700H
17.6 fps -1%
Media Intel Core i9-12900H
  (8.05 - 22.5, n=28)
17.1 fps -4%
Beelink SER6 Pro
AMD Ryzen 7 6800H
15 fps -16%
Acemagic M2A
Intel Core i9-12900H
15 fps -16%
Acemagic Tank03
Intel Core i9-12900H
14.8 fps -17%
Geekom XT13 Pro
Intel Core i9-13900H
14.7 fps -17%
LibreOffice / 20 Documents To PDF
Asus ROG NUC 14-90AS0051
Intel Core Ultra 9 185H
56.2 s * -39%
MSI GeForce RTX 3070 Ventus 3X
AMD Ryzen 9 5900X
54.6 s * -35%
Lenovo Legion 9 16IRX9, RTX 4090
Intel Core i9-14900HX
53.6 s * -32%
Asus TUF Gaming A14 FA401WV-WB94
AMD Ryzen AI 9 HX 370
51.7 s * -28%
Minisforum G7 PT
AMD Ryzen 9 7945HX
49.7 s * -23%
Beelink SER6 Pro
AMD Ryzen 7 6800H
48.8 s * -20%
Geekom XT13 Pro
Intel Core i9-13900H
46.8 s * -16%
Beelink SER8
AMD Ryzen 7 8845HS
46.1 s * -14%
Maingear ML-16 MK2
Intel Core Ultra 7 155H
43.1 s * -6%
Media Intel Core i9-12900H
  (36.8 - 59.8, n=28)
42.4 s * -5%
Beelink GTI12 Ultra EX Docking Station
Intel Core i9-12900H
40.5 s *
Acemagic M2A
Intel Core i9-12900H
40 s * +1%
Beelink SER7
AMD Ryzen 7 7840HS
39.7 s * +2%
Lenovo IdeaPad Pro 5 16IMH G9 RTX 4050
Intel Core Ultra 9 185H
39 s * +4%
Lenovo IdeaCentre Mini 01IRH8
Intel Core i7-13700H
37.6 s * +7%
Acemagic Tank03
Intel Core i9-12900H
36.8 s * +9%
R Benchmark 2.5 / Overall mean
MSI GeForce RTX 3070 Ventus 3X
AMD Ryzen 9 5900X
0.507 sec * -14%
Acemagic Tank03
Intel Core i9-12900H
0.506 sec * -14%
Maingear ML-16 MK2
Intel Core Ultra 7 155H
0.505 sec * -14%
Beelink SER6 Pro
AMD Ryzen 7 6800H
0.4989 sec * -12%
Lenovo Legion 9 16IRX9, RTX 4090
Intel Core i9-14900HX
0.4859 sec * -9%
Geekom XT13 Pro
Intel Core i9-13900H
0.4693 sec * -6%
Media Intel Core i9-12900H
  (0.4218 - 0.506, n=28)
0.454 sec * -2%
Lenovo IdeaCentre Mini 01IRH8
Intel Core i7-13700H
0.4512 sec * -1%
Asus ROG NUC 14-90AS0051
Intel Core Ultra 9 185H
0.4489 sec * -1%
Beelink GTI12 Ultra EX Docking Station
Intel Core i9-12900H
0.4447 sec *
Beelink SER7
AMD Ryzen 7 7840HS
0.4446 sec * -0%
Lenovo IdeaPad Pro 5 16IMH G9 RTX 4050
Intel Core Ultra 9 185H
0.4411 sec * +1%
Acemagic M2A
Intel Core i9-12900H
0.4347 sec * +2%
Beelink SER8
AMD Ryzen 7 8845HS
0.4336 sec * +2%
Asus TUF Gaming A14 FA401WV-WB94
AMD Ryzen AI 9 HX 370
0.419 sec * +6%
Minisforum G7 PT
AMD Ryzen 9 7945HX
0.406 sec * +9%
CPU Performance Rating: Percent
Cinebench R23: Multi Core | Single Core
Cinebench R20: CPU (Multi Core) | CPU (Single Core)
Cinebench R15: CPU Multi 64Bit | CPU Single 64Bit
Blender: v2.79 BMW27 CPU
7-Zip 18.03: 7z b 4 | 7z b 4 -mmt1
Geekbench 6.3: Multi-Core | Single-Core
Geekbench 5.5: Multi-Core | Single-Core
HWBOT x265 Benchmark v2.2: 4k Preset
LibreOffice : 20 Documents To PDF
R Benchmark 2.5: Overall mean

* ... Meglio usare valori piccoli

Cinebench R15 CPU Multi 64Bit
2414 Points
Cinebench R15 OpenGL 64Bit
258 fps
Cinebench R15 Ref. Match 64Bit
99.6 %
Cinebench R15 CPU Single 64Bit
273 Points
Cinebench R20 CPU (Multi Core)
6267 Points
Cinebench R20 CPU (Single Core)
707 Points
Cinebench R23 Multi Core
16270 Points
Cinebench R23 Single Core
1930 Points
Cinebench 2024 CPU Multi Core
920 Points
Cinebench 2024 CPU Single Core
112 Points
Aiuto
Performance Rating
Minisforum MS-A1
AMD Ryzen 7 8700G, Radeon 780M
97.2 pt
Geekom AX8 Pro
AMD Ryzen 9 8945H, Radeon 780M
90.1 pt
Asus ROG NUC 14-90AS0051
Intel Core Ultra 9 185H, NVIDIA GeForce RTX 4070 Laptop GPU
76.6 pt
Beelink GTI12 Ultra EX Docking Station
Intel Core i9-12900H, NVIDIA GeForce RTX 3070
66.8 pt
Asus NUC 14 Pro
Intel Core Ultra 5 125H, Arc 7-Core
60.4 pt
Media Intel Core i9-12900H
 
57.8 pt
GMK NucBox K9
Intel Core Ultra 5 125H, Arc 7-Core
57.2 pt
AIDA64 / FP32 Ray-Trace
Minisforum MS-A1
AMD Ryzen 7 8700G, Radeon 780M
27384 KRay/s +76%
Geekom AX8 Pro
AMD Ryzen 9 8945H, Radeon 780M
24531 KRay/s +58%
Asus ROG NUC 14-90AS0051
Intel Core Ultra 9 185H, NVIDIA GeForce RTX 4070 Laptop GPU
17631 KRay/s +13%
Beelink GTI12 Ultra EX Docking Station
Intel Core i9-12900H, NVIDIA GeForce RTX 3070
15555 KRay/s
Asus NUC 14 Pro
Intel Core Ultra 5 125H, Arc 7-Core
13347 KRay/s -14%
Media Intel Core i9-12900H
  (4074 - 18289, n=28)
11191 KRay/s -28%
GMK NucBox K9
Intel Core Ultra 5 125H, Arc 7-Core
10755 KRay/s -31%
AIDA64 / FPU Julia
Minisforum MS-A1
AMD Ryzen 7 8700G, Radeon 780M
116071 Points +49%
Geekom AX8 Pro
AMD Ryzen 9 8945H, Radeon 780M
106518 Points +36%
Asus ROG NUC 14-90AS0051
Intel Core Ultra 9 185H, NVIDIA GeForce RTX 4070 Laptop GPU
93160 Points +19%
Beelink GTI12 Ultra EX Docking Station
Intel Core i9-12900H, NVIDIA GeForce RTX 3070
78136 Points
Asus NUC 14 Pro
Intel Core Ultra 5 125H, Arc 7-Core
68551 Points -12%
GMK NucBox K9
Intel Core Ultra 5 125H, Arc 7-Core
58422 Points -25%
Media Intel Core i9-12900H
  (22307 - 93236, n=28)
55458 Points -29%
AIDA64 / CPU SHA3
Minisforum MS-A1
AMD Ryzen 7 8700G, Radeon 780M
5092 MB/s +45%
Geekom AX8 Pro
AMD Ryzen 9 8945H, Radeon 780M
4684 MB/s +34%
Asus ROG NUC 14-90AS0051
Intel Core Ultra 9 185H, NVIDIA GeForce RTX 4070 Laptop GPU
4307 MB/s +23%
Beelink GTI12 Ultra EX Docking Station
Intel Core i9-12900H, NVIDIA GeForce RTX 3070
3507 MB/s
Asus NUC 14 Pro
Intel Core Ultra 5 125H, Arc 7-Core
3323 MB/s -5%
Media Intel Core i9-12900H
  (1378 - 4215, n=28)
3048 MB/s -13%
GMK NucBox K9
Intel Core Ultra 5 125H, Arc 7-Core
2922 MB/s -17%
AIDA64 / CPU Queen
Minisforum MS-A1
AMD Ryzen 7 8700G, Radeon 780M
120159 Points +21%
Geekom AX8 Pro
AMD Ryzen 9 8945H, Radeon 780M
114586 Points +15%
Media Intel Core i9-12900H
  (78172 - 111241, n=28)
100462 Points +1%
Beelink GTI12 Ultra EX Docking Station
Intel Core i9-12900H, NVIDIA GeForce RTX 3070
99243 Points
Asus ROG NUC 14-90AS0051
Intel Core Ultra 9 185H, NVIDIA GeForce RTX 4070 Laptop GPU
94584 Points -5%
Asus NUC 14 Pro
Intel Core Ultra 5 125H, Arc 7-Core
79866 Points -20%
GMK NucBox K9
Intel Core Ultra 5 125H, Arc 7-Core
78797 Points -21%
AIDA64 / FPU SinJulia
Minisforum MS-A1
AMD Ryzen 7 8700G, Radeon 780M
15698 Points +58%
Geekom AX8 Pro
AMD Ryzen 9 8945H, Radeon 780M
14631 Points +47%
Asus ROG NUC 14-90AS0051
Intel Core Ultra 9 185H, NVIDIA GeForce RTX 4070 Laptop GPU
11284 Points +14%
Beelink GTI12 Ultra EX Docking Station
Intel Core i9-12900H, NVIDIA GeForce RTX 3070
9934 Points
Media Intel Core i9-12900H
  (5709 - 10410, n=28)
9016 Points -9%
Asus NUC 14 Pro
Intel Core Ultra 5 125H, Arc 7-Core
7851 Points -21%
GMK NucBox K9
Intel Core Ultra 5 125H, Arc 7-Core
7780 Points -22%
AIDA64 / FPU Mandel
Minisforum MS-A1
AMD Ryzen 7 8700G, Radeon 780M
62263 Points +61%
Geekom AX8 Pro
AMD Ryzen 9 8945H, Radeon 780M
56505 Points +46%
Asus ROG NUC 14-90AS0051
Intel Core Ultra 9 185H, NVIDIA GeForce RTX 4070 Laptop GPU
46028 Points +19%
Beelink GTI12 Ultra EX Docking Station
Intel Core i9-12900H, NVIDIA GeForce RTX 3070
38712 Points
Asus NUC 14 Pro
Intel Core Ultra 5 125H, Arc 7-Core
34225 Points -12%
Media Intel Core i9-12900H
  (11257 - 45581, n=28)
28667 Points -26%
GMK NucBox K9
Intel Core Ultra 5 125H, Arc 7-Core
27972 Points -28%
AIDA64 / CPU AES
Minisforum MS-A1
AMD Ryzen 7 8700G, Radeon 780M
176002 MB/s +154%
Geekom AX8 Pro
AMD Ryzen 9 8945H, Radeon 780M
163032 MB/s +135%
GMK NucBox K9
Intel Core Ultra 5 125H, Arc 7-Core
108402 MB/s +56%
Asus ROG NUC 14-90AS0051
Intel Core Ultra 9 185H, NVIDIA GeForce RTX 4070 Laptop GPU
90629 MB/s +31%
Media Intel Core i9-12900H
  (31935 - 151546, n=28)
85711 MB/s +24%
Beelink GTI12 Ultra EX Docking Station
Intel Core i9-12900H, NVIDIA GeForce RTX 3070
69299 MB/s
Asus NUC 14 Pro
Intel Core Ultra 5 125H, Arc 7-Core
64107 MB/s -7%
AIDA64 / CPU ZLib
Asus ROG NUC 14-90AS0051
Intel Core Ultra 9 185H, NVIDIA GeForce RTX 4070 Laptop GPU
1266 MB/s +22%
Minisforum MS-A1
AMD Ryzen 7 8700G, Radeon 780M
1097 MB/s +6%
Beelink GTI12 Ultra EX Docking Station
Intel Core i9-12900H, NVIDIA GeForce RTX 3070
1039 MB/s
Geekom AX8 Pro
AMD Ryzen 9 8945H, Radeon 780M
976 MB/s -6%
Asus NUC 14 Pro
Intel Core Ultra 5 125H, Arc 7-Core
969 MB/s -7%
Media Intel Core i9-12900H
  (449 - 1193, n=28)
932 MB/s -10%
GMK NucBox K9
Intel Core Ultra 5 125H, Arc 7-Core
844 MB/s -19%
AIDA64 / FP64 Ray-Trace
Minisforum MS-A1
AMD Ryzen 7 8700G, Radeon 780M
14519 KRay/s +72%
Geekom AX8 Pro
AMD Ryzen 9 8945H, Radeon 780M
13609 KRay/s +61%
Asus ROG NUC 14-90AS0051
Intel Core Ultra 9 185H, NVIDIA GeForce RTX 4070 Laptop GPU
9591 KRay/s +14%
Beelink GTI12 Ultra EX Docking Station
Intel Core i9-12900H, NVIDIA GeForce RTX 3070
8449 KRay/s
Asus NUC 14 Pro
Intel Core Ultra 5 125H, Arc 7-Core
6786 KRay/s -20%
Media Intel Core i9-12900H
  (2235 - 10511, n=28)
6205 KRay/s -27%
GMK NucBox K9
Intel Core Ultra 5 125H, Arc 7-Core
5657 KRay/s -33%
AIDA64 / CPU PhotoWorxx
Asus NUC 14 Pro
Intel Core Ultra 5 125H, Arc 7-Core
47377 MPixel/s +15%
GMK NucBox K9
Intel Core Ultra 5 125H, Arc 7-Core
46296 MPixel/s +12%
Asus ROG NUC 14-90AS0051
Intel Core Ultra 9 185H, NVIDIA GeForce RTX 4070 Laptop GPU
44809 MPixel/s +9%
Beelink GTI12 Ultra EX Docking Station
Intel Core i9-12900H, NVIDIA GeForce RTX 3070
41182 MPixel/s
Minisforum MS-A1
AMD Ryzen 7 8700G, Radeon 780M
40404 MPixel/s -2%
Geekom AX8 Pro
AMD Ryzen 9 8945H, Radeon 780M
40114 MPixel/s -3%
Media Intel Core i9-12900H
  (20960 - 48269, n=29)
36660 MPixel/s -11%

Prestazioni del sistema

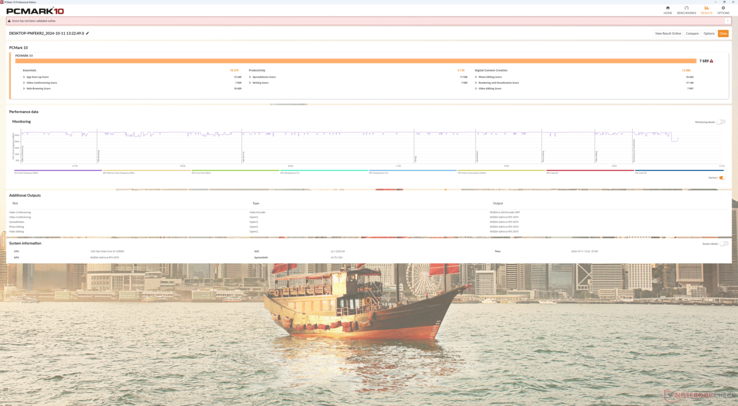
I risultati di PCMark sono paragonabili a quelli dei computer portatili e di altri mini PC con grafica discreta, tra cui l' Asus ROG NUC 14. Il nostro punteggio di produttività è relativamente basso, tuttavia, probabilmente a causa della vecchia CPU Intel di 12° generazione.

PCMark 10 Standard
PCMark 10 Standard
PCMark 10 / Score
Minisforum G7 PT
Radeon RX 7600M XT, R9 7945HX, Kingston OM8PGP41024Q-A0
8930 Points +16%
Lenovo Legion 9 16IRX9, RTX 4090
NVIDIA GeForce RTX 4090 Laptop GPU, i9-14900HX, Micron 3400 2TB MTFDKBA2T0TFH
8239 Points +7%
Asus ROG NUC 14-90AS0051
NVIDIA GeForce RTX 4070 Laptop GPU, Ultra 9 185H, Samsung PM9A1a MZVL21T0HDLU
7761 Points +1%
Acemagic M2A
GeForce RTX 3080 Laptop GPU, i9-12900H, Rayson RS1D0TSSD710 1024 GB PCIe 4.0 NVMe
7730 Points +1%
Maingear ML-16 MK2
NVIDIA GeForce RTX 4070 Laptop GPU, Ultra 7 155H
7704 Points 0%
Beelink GTI12 Ultra EX Docking Station
NVIDIA GeForce RTX 3070, i9-12900H, Crucial P3 Plus CT1000P3PSSD8
7689 Points
Asus TUF Gaming A14 FA401WV-WB94
NVIDIA GeForce RTX 4060 Laptop GPU, Ryzen AI 9 HX 370, WD PC SN560 SDDPNQE-1T00
7645 Points -1%
Lenovo IdeaPad Pro 5 16IMH G9 RTX 4050
NVIDIA GeForce RTX 4050 Laptop GPU, Ultra 9 185H, Samsung PM9C1a MZAL81T0HDLB
7431 Points -3%
Acemagic Tank03
GeForce RTX 3080 Laptop GPU, i9-12900H, BiWin CE480V6D10H-1TB
7326 Points -5%
MSI GeForce RTX 3070 Ventus 3X
NVIDIA GeForce RTX 3070, R9 5900X, Intel Optane 905P 480GB 2.5
7172 Points -7%
PCMark 10 / Essentials
Minisforum G7 PT
Radeon RX 7600M XT, R9 7945HX, Kingston OM8PGP41024Q-A0
11915 Points +16%
Lenovo Legion 9 16IRX9, RTX 4090
NVIDIA GeForce RTX 4090 Laptop GPU, i9-14900HX, Micron 3400 2TB MTFDKBA2T0TFH
11007 Points +7%
Lenovo IdeaPad Pro 5 16IMH G9 RTX 4050
NVIDIA GeForce RTX 4050 Laptop GPU, Ultra 9 185H, Samsung PM9C1a MZAL81T0HDLB
10807 Points +5%
Acemagic M2A
GeForce RTX 3080 Laptop GPU, i9-12900H, Rayson RS1D0TSSD710 1024 GB PCIe 4.0 NVMe
10344 Points +1%
Beelink GTI12 Ultra EX Docking Station
NVIDIA GeForce RTX 3070, i9-12900H, Crucial P3 Plus CT1000P3PSSD8
10279 Points
Maingear ML-16 MK2
NVIDIA GeForce RTX 4070 Laptop GPU, Ultra 7 155H
10274 Points 0%
Asus TUF Gaming A14 FA401WV-WB94
NVIDIA GeForce RTX 4060 Laptop GPU, Ryzen AI 9 HX 370, WD PC SN560 SDDPNQE-1T00
10236 Points 0%
Asus ROG NUC 14-90AS0051
NVIDIA GeForce RTX 4070 Laptop GPU, Ultra 9 185H, Samsung PM9A1a MZVL21T0HDLU
10192 Points -1%
Acemagic Tank03
GeForce RTX 3080 Laptop GPU, i9-12900H, BiWin CE480V6D10H-1TB
10130 Points -1%
MSI GeForce RTX 3070 Ventus 3X
NVIDIA GeForce RTX 3070, R9 5900X, Intel Optane 905P 480GB 2.5
9303 Points -9%
PCMark 10 / Productivity
Acemagic M2A
GeForce RTX 3080 Laptop GPU, i9-12900H, Rayson RS1D0TSSD710 1024 GB PCIe 4.0 NVMe
11014 Points +20%
Acemagic Tank03
GeForce RTX 3080 Laptop GPU, i9-12900H, BiWin CE480V6D10H-1TB
10430 Points +14%
Minisforum G7 PT
Radeon RX 7600M XT, R9 7945HX, Kingston OM8PGP41024Q-A0
10227 Points +12%
Lenovo Legion 9 16IRX9, RTX 4090
NVIDIA GeForce RTX 4090 Laptop GPU, i9-14900HX, Micron 3400 2TB MTFDKBA2T0TFH
10202 Points +11%
Asus TUF Gaming A14 FA401WV-WB94
NVIDIA GeForce RTX 4060 Laptop GPU, Ryzen AI 9 HX 370, WD PC SN560 SDDPNQE-1T00
9925 Points +8%
Lenovo IdeaPad Pro 5 16IMH G9 RTX 4050
NVIDIA GeForce RTX 4050 Laptop GPU, Ultra 9 185H, Samsung PM9C1a MZAL81T0HDLB
9717 Points +6%
Maingear ML-16 MK2
NVIDIA GeForce RTX 4070 Laptop GPU, Ultra 7 155H
9518 Points +4%
Asus ROG NUC 14-90AS0051
NVIDIA GeForce RTX 4070 Laptop GPU, Ultra 9 185H, Samsung PM9A1a MZVL21T0HDLU
9435 Points +3%
Beelink GTI12 Ultra EX Docking Station
NVIDIA GeForce RTX 3070, i9-12900H, Crucial P3 Plus CT1000P3PSSD8
9170 Points
MSI GeForce RTX 3070 Ventus 3X
NVIDIA GeForce RTX 3070, R9 5900X, Intel Optane 905P 480GB 2.5
8795 Points -4%
PCMark 10 / Digital Content Creation
Minisforum G7 PT
Radeon RX 7600M XT, R9 7945HX, Kingston OM8PGP41024Q-A0
15858 Points +21%
Lenovo Legion 9 16IRX9, RTX 4090
NVIDIA GeForce RTX 4090 Laptop GPU, i9-14900HX, Micron 3400 2TB MTFDKBA2T0TFH
13516 Points +3%
Asus TUF Gaming A14 FA401WV-WB94
NVIDIA GeForce RTX 4060 Laptop GPU, Ryzen AI 9 HX 370, WD PC SN560 SDDPNQE-1T00
13395 Points +2%
Asus ROG NUC 14-90AS0051
NVIDIA GeForce RTX 4070 Laptop GPU, Ultra 9 185H, Samsung PM9A1a MZVL21T0HDLU
13194 Points +1%
Beelink GTI12 Ultra EX Docking Station
NVIDIA GeForce RTX 3070, i9-12900H, Crucial P3 Plus CT1000P3PSSD8
13086 Points
Maingear ML-16 MK2
NVIDIA GeForce RTX 4070 Laptop GPU, Ultra 7 155H
12692 Points -3%
MSI GeForce RTX 3070 Ventus 3X
NVIDIA GeForce RTX 3070, R9 5900X, Intel Optane 905P 480GB 2.5
12239 Points -6%
Acemagic M2A
GeForce RTX 3080 Laptop GPU, i9-12900H, Rayson RS1D0TSSD710 1024 GB PCIe 4.0 NVMe
11004 Points -16%
Lenovo IdeaPad Pro 5 16IMH G9 RTX 4050
NVIDIA GeForce RTX 4050 Laptop GPU, Ultra 9 185H, Samsung PM9C1a MZAL81T0HDLB
10607 Points -19%
Acemagic Tank03
GeForce RTX 3080 Laptop GPU, i9-12900H, BiWin CE480V6D10H-1TB
10100 Points -23%
CrossMark / Overall
Minisforum G7 PT
Radeon RX 7600M XT, R9 7945HX, Kingston OM8PGP41024Q-A0
2102 Points +9%
Lenovo Legion 9 16IRX9, RTX 4090
NVIDIA GeForce RTX 4090 Laptop GPU, i9-14900HX, Micron 3400 2TB MTFDKBA2T0TFH
1939 Points +1%
Beelink GTI12 Ultra EX Docking Station
NVIDIA GeForce RTX 3070, i9-12900H, Crucial P3 Plus CT1000P3PSSD8
1922 Points
Lenovo IdeaPad Pro 5 16IMH G9 RTX 4050
NVIDIA GeForce RTX 4050 Laptop GPU, Ultra 9 185H, Samsung PM9C1a MZAL81T0HDLB
1790 Points -7%
Acemagic M2A
GeForce RTX 3080 Laptop GPU, i9-12900H, Rayson RS1D0TSSD710 1024 GB PCIe 4.0 NVMe
1785 Points -7%
Asus TUF Gaming A14 FA401WV-WB94
NVIDIA GeForce RTX 4060 Laptop GPU, Ryzen AI 9 HX 370, WD PC SN560 SDDPNQE-1T00
1710 Points -11%
Maingear ML-16 MK2
NVIDIA GeForce RTX 4070 Laptop GPU, Ultra 7 155H
1687 Points -12%
Asus ROG NUC 14-90AS0051
NVIDIA GeForce RTX 4070 Laptop GPU, Ultra 9 185H, Samsung PM9A1a MZVL21T0HDLU
1663 Points -13%
Acemagic Tank03
GeForce RTX 3080 Laptop GPU, i9-12900H, BiWin CE480V6D10H-1TB
1567 Points -18%
CrossMark / Productivity
Minisforum G7 PT
Radeon RX 7600M XT, R9 7945HX, Kingston OM8PGP41024Q-A0
1938 Points +5%
Beelink GTI12 Ultra EX Docking Station
NVIDIA GeForce RTX 3070, i9-12900H, Crucial P3 Plus CT1000P3PSSD8
1852 Points
Lenovo Legion 9 16IRX9, RTX 4090
NVIDIA GeForce RTX 4090 Laptop GPU, i9-14900HX, Micron 3400 2TB MTFDKBA2T0TFH
1755 Points -5%
Acemagic M2A
GeForce RTX 3080 Laptop GPU, i9-12900H, Rayson RS1D0TSSD710 1024 GB PCIe 4.0 NVMe
1728 Points -7%
Lenovo IdeaPad Pro 5 16IMH G9 RTX 4050
NVIDIA GeForce RTX 4050 Laptop GPU, Ultra 9 185H, Samsung PM9C1a MZAL81T0HDLB
1700 Points -8%
Maingear ML-16 MK2
NVIDIA GeForce RTX 4070 Laptop GPU, Ultra 7 155H
1589 Points -14%
Asus TUF Gaming A14 FA401WV-WB94
NVIDIA GeForce RTX 4060 Laptop GPU, Ryzen AI 9 HX 370, WD PC SN560 SDDPNQE-1T00
1574 Points -15%
Asus ROG NUC 14-90AS0051
NVIDIA GeForce RTX 4070 Laptop GPU, Ultra 9 185H, Samsung PM9A1a MZVL21T0HDLU
1573 Points -15%
Acemagic Tank03
GeForce RTX 3080 Laptop GPU, i9-12900H, BiWin CE480V6D10H-1TB
1483 Points -20%
CrossMark / Creativity
Minisforum G7 PT
Radeon RX 7600M XT, R9 7945HX, Kingston OM8PGP41024Q-A0
2428 Points +23%
Lenovo Legion 9 16IRX9, RTX 4090
NVIDIA GeForce RTX 4090 Laptop GPU, i9-14900HX, Micron 3400 2TB MTFDKBA2T0TFH
2207 Points +12%
Asus TUF Gaming A14 FA401WV-WB94
NVIDIA GeForce RTX 4060 Laptop GPU, Ryzen AI 9 HX 370, WD PC SN560 SDDPNQE-1T00
2077 Points +5%
Lenovo IdeaPad Pro 5 16IMH G9 RTX 4050
NVIDIA GeForce RTX 4050 Laptop GPU, Ultra 9 185H, Samsung PM9C1a MZAL81T0HDLB
2038 Points +3%
Beelink GTI12 Ultra EX Docking Station
NVIDIA GeForce RTX 3070, i9-12900H, Crucial P3 Plus CT1000P3PSSD8
1979 Points
Acemagic M2A
GeForce RTX 3080 Laptop GPU, i9-12900H, Rayson RS1D0TSSD710 1024 GB PCIe 4.0 NVMe
1931 Points -2%
Asus ROG NUC 14-90AS0051
NVIDIA GeForce RTX 4070 Laptop GPU, Ultra 9 185H, Samsung PM9A1a MZVL21T0HDLU
1872 Points -5%
Maingear ML-16 MK2
NVIDIA GeForce RTX 4070 Laptop GPU, Ultra 7 155H
1860 Points -6%
Acemagic Tank03
GeForce RTX 3080 Laptop GPU, i9-12900H, BiWin CE480V6D10H-1TB
1692 Points -15%
CrossMark / Responsiveness
Beelink GTI12 Ultra EX Docking Station
NVIDIA GeForce RTX 3070, i9-12900H, Crucial P3 Plus CT1000P3PSSD8
1969 Points
Lenovo Legion 9 16IRX9, RTX 4090
NVIDIA GeForce RTX 4090 Laptop GPU, i9-14900HX, Micron 3400 2TB MTFDKBA2T0TFH
1769 Points -10%
Minisforum G7 PT
Radeon RX 7600M XT, R9 7945HX, Kingston OM8PGP41024Q-A0
1739 Points -12%
Acemagic M2A
GeForce RTX 3080 Laptop GPU, i9-12900H, Rayson RS1D0TSSD710 1024 GB PCIe 4.0 NVMe
1556 Points -21%
Maingear ML-16 MK2
NVIDIA GeForce RTX 4070 Laptop GPU, Ultra 7 155H
1507 Points -23%
Acemagic Tank03
GeForce RTX 3080 Laptop GPU, i9-12900H, BiWin CE480V6D10H-1TB
1469 Points -25%
Lenovo IdeaPad Pro 5 16IMH G9 RTX 4050
NVIDIA GeForce RTX 4050 Laptop GPU, Ultra 9 185H, Samsung PM9C1a MZAL81T0HDLB
1419 Points -28%
Asus ROG NUC 14-90AS0051
NVIDIA GeForce RTX 4070 Laptop GPU, Ultra 9 185H, Samsung PM9A1a MZVL21T0HDLU
1380 Points -30%
Asus TUF Gaming A14 FA401WV-WB94
NVIDIA GeForce RTX 4060 Laptop GPU, Ryzen AI 9 HX 370, WD PC SN560 SDDPNQE-1T00
1226 Points -38%
WebXPRT 3 / Overall
Minisforum G7 PT
Radeon RX 7600M XT, R9 7945HX, Kingston OM8PGP41024Q-A0
345 Points +17%
Lenovo IdeaPad Pro 5 16IMH G9 RTX 4050
NVIDIA GeForce RTX 4050 Laptop GPU, Ultra 9 185H, Samsung PM9C1a MZAL81T0HDLB
301 Points +2%
Beelink GTI12 Ultra EX Docking Station
NVIDIA GeForce RTX 3070, i9-12900H, Crucial P3 Plus CT1000P3PSSD8
294 Points
Acemagic M2A
GeForce RTX 3080 Laptop GPU, i9-12900H, Rayson RS1D0TSSD710 1024 GB PCIe 4.0 NVMe
293 Points 0%
Asus TUF Gaming A14 FA401WV-WB94
NVIDIA GeForce RTX 4060 Laptop GPU, Ryzen AI 9 HX 370, WD PC SN560 SDDPNQE-1T00
288 Points -2%
Acemagic Tank03
GeForce RTX 3080 Laptop GPU, i9-12900H, BiWin CE480V6D10H-1TB
283 Points -4%
Lenovo Legion 9 16IRX9, RTX 4090
NVIDIA GeForce RTX 4090 Laptop GPU, i9-14900HX, Micron 3400 2TB MTFDKBA2T0TFH
279 Points -5%
Maingear ML-16 MK2
NVIDIA GeForce RTX 4070 Laptop GPU, Ultra 7 155H
264 Points -10%
MSI GeForce RTX 3070 Ventus 3X
NVIDIA GeForce RTX 3070, R9 5900X, Intel Optane 905P 480GB 2.5
242 Points -18%
Asus ROG NUC 14-90AS0051
NVIDIA GeForce RTX 4070 Laptop GPU, Ultra 9 185H, Samsung PM9A1a MZVL21T0HDLU
240 Points -18%
WebXPRT 4 / Overall
Minisforum G7 PT
Radeon RX 7600M XT, R9 7945HX, Kingston OM8PGP41024Q-A0
293 Points +9%
Acemagic M2A
GeForce RTX 3080 Laptop GPU, i9-12900H, Rayson RS1D0TSSD710 1024 GB PCIe 4.0 NVMe
272 Points +1%
Lenovo IdeaPad Pro 5 16IMH G9 RTX 4050
NVIDIA GeForce RTX 4050 Laptop GPU, Ultra 9 185H, Samsung PM9C1a MZAL81T0HDLB
271 Points 0%
Beelink GTI12 Ultra EX Docking Station
NVIDIA GeForce RTX 3070, i9-12900H, Crucial P3 Plus CT1000P3PSSD8
270 Points
Asus TUF Gaming A14 FA401WV-WB94
NVIDIA GeForce RTX 4060 Laptop GPU, Ryzen AI 9 HX 370, WD PC SN560 SDDPNQE-1T00
252 Points -7%
Asus ROG NUC 14-90AS0051
NVIDIA GeForce RTX 4070 Laptop GPU, Ultra 9 185H, Samsung PM9A1a MZVL21T0HDLU
248 Points -8%
Maingear ML-16 MK2
NVIDIA GeForce RTX 4070 Laptop GPU, Ultra 7 155H
247 Points -9%
Lenovo Legion 9 16IRX9, RTX 4090
NVIDIA GeForce RTX 4090 Laptop GPU, i9-14900HX, Micron 3400 2TB MTFDKBA2T0TFH
246 Points -9%
Acemagic Tank03
GeForce RTX 3080 Laptop GPU, i9-12900H, BiWin CE480V6D10H-1TB
242 Points -10%
Mozilla Kraken 1.1 / Total
MSI GeForce RTX 3070 Ventus 3X
NVIDIA GeForce RTX 3070, R9 5900X, Intel Optane 905P 480GB 2.5
643 ms * -26%
Acemagic Tank03
GeForce RTX 3080 Laptop GPU, i9-12900H, BiWin CE480V6D10H-1TB
608 ms * -19%
Maingear ML-16 MK2
NVIDIA GeForce RTX 4070 Laptop GPU, Ultra 7 155H
568 ms * -12%
Lenovo Legion 9 16IRX9, RTX 4090
NVIDIA GeForce RTX 4090 Laptop GPU, i9-14900HX, Micron 3400 2TB MTFDKBA2T0TFH
535 ms * -5%
Asus ROG NUC 14-90AS0051
NVIDIA GeForce RTX 4070 Laptop GPU, Ultra 9 185H, Samsung PM9A1a MZVL21T0HDLU
526 ms * -3%
Beelink GTI12 Ultra EX Docking Station
NVIDIA GeForce RTX 3070, i9-12900H, Crucial P3 Plus CT1000P3PSSD8
509 ms *
Lenovo IdeaPad Pro 5 16IMH G9 RTX 4050
NVIDIA GeForce RTX 4050 Laptop GPU, Ultra 9 185H, Samsung PM9C1a MZAL81T0HDLB
498 ms * +2%
Acemagic M2A
GeForce RTX 3080 Laptop GPU, i9-12900H, Rayson RS1D0TSSD710 1024 GB PCIe 4.0 NVMe
496 ms * +3%
Minisforum G7 PT
Radeon RX 7600M XT, R9 7945HX, Kingston OM8PGP41024Q-A0
456 ms * +10%
Asus TUF Gaming A14 FA401WV-WB94
NVIDIA GeForce RTX 4060 Laptop GPU, Ryzen AI 9 HX 370, WD PC SN560 SDDPNQE-1T00
450 ms * +12%

* ... Meglio usare valori piccoli

PCMark 10 Score
7689 punti
Aiuto
AIDA64 / Memory Copy
Asus ROG NUC 14-90AS0051
Intel Core Ultra 9 185H, NVIDIA GeForce RTX 4070 Laptop GPU
71360 MB/s +14%
Asus NUC 14 Pro
Intel Core Ultra 5 125H, Arc 7-Core
69264 MB/s +10%
Geekom AX8 Pro
AMD Ryzen 9 8945H, Radeon 780M
68924 MB/s +10%
GMK NucBox K9
Intel Core Ultra 5 125H, Arc 7-Core
67482 MB/s +8%
Minisforum MS-A1
AMD Ryzen 7 8700G, Radeon 780M
64990 MB/s +4%
Beelink GTI12 Ultra EX Docking Station
Intel Core i9-12900H, NVIDIA GeForce RTX 3070
62703 MB/s
Media Intel Core i9-12900H
  (34438 - 74264, n=28)
58945 MB/s -6%
AIDA64 / Memory Read
Asus NUC 14 Pro
Intel Core Ultra 5 125H, Arc 7-Core
74415 MB/s +13%
Asus ROG NUC 14-90AS0051
Intel Core Ultra 9 185H, NVIDIA GeForce RTX 4070 Laptop GPU
73604 MB/s +11%
GMK NucBox K9
Intel Core Ultra 5 125H, Arc 7-Core
70520 MB/s +7%
Beelink GTI12 Ultra EX Docking Station
Intel Core i9-12900H, NVIDIA GeForce RTX 3070
66047 MB/s
Media Intel Core i9-12900H
  (36365 - 74642, n=28)
61718 MB/s -7%
Geekom AX8 Pro
AMD Ryzen 9 8945H, Radeon 780M
61624 MB/s -7%
Minisforum MS-A1
AMD Ryzen 7 8700G, Radeon 780M
61504 MB/s -7%
AIDA64 / Memory Write
Geekom AX8 Pro
AMD Ryzen 9 8945H, Radeon 780M
87138 MB/s +32%
Minisforum MS-A1
AMD Ryzen 7 8700G, Radeon 780M
79329 MB/s +20%
Asus NUC 14 Pro
Intel Core Ultra 5 125H, Arc 7-Core
72443 MB/s +10%
GMK NucBox K9
Intel Core Ultra 5 125H, Arc 7-Core
71218 MB/s +8%
Asus ROG NUC 14-90AS0051
Intel Core Ultra 9 185H, NVIDIA GeForce RTX 4070 Laptop GPU
69862 MB/s +6%
Beelink GTI12 Ultra EX Docking Station
Intel Core i9-12900H, NVIDIA GeForce RTX 3070
66097 MB/s
Media Intel Core i9-12900H
  (32276 - 67858, n=28)
59318 MB/s -10%
AIDA64 / Memory Latency
Asus ROG NUC 14-90AS0051
Intel Core Ultra 9 185H, NVIDIA GeForce RTX 4070 Laptop GPU
170 ns * -90%
GMK NucBox K9
Intel Core Ultra 5 125H, Arc 7-Core
140.2 ns * -57%
Asus NUC 14 Pro
Intel Core Ultra 5 125H, Arc 7-Core
127.3 ns * -43%
Geekom AX8 Pro
AMD Ryzen 9 8945H, Radeon 780M
91.4 ns * -2%
Beelink GTI12 Ultra EX Docking Station
Intel Core i9-12900H, NVIDIA GeForce RTX 3070
89.3 ns *
Minisforum MS-A1
AMD Ryzen 7 8700G, Radeon 780M
88.5 ns * +1%
Media Intel Core i9-12900H
  (74.7 - 118.1, n=27)
85.7 ns * +4%

* ... Meglio usare valori piccoli

Latenza DPC

riproduzione video 4k60

la riproduzione di video 4K a 60 FPS è quasi perfetta. Stranamente, ci sono sempre alcuni fotogrammi saltati subito dopo aver premuto il pulsante Play, che normalmente non si verificano su altri PC. Altrimenti, non ci sono fotogrammi saltati durante il resto del video di prova.

LatencyMon è incompatibile con la versione attuale del sistema.

Dispositivi di archiviazione

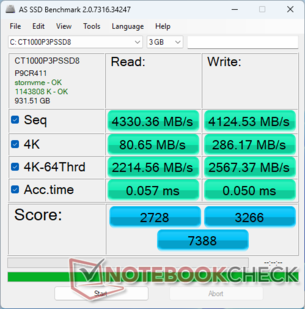
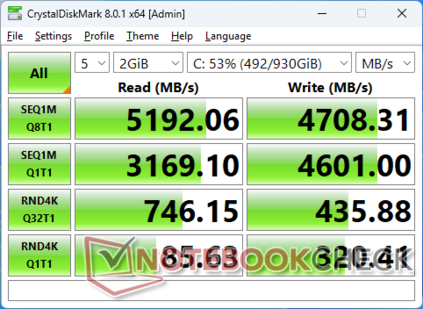
La nostra unità è dotata di un SSD da 1 TB Crucial P3 Plus SSD. Le velocità di trasferimento massime raggiungono 5200 MB/s, prima di scendere a 4800 MB/s dopo alcuni minuti di stress. Il più veloce Samsung PM9A1a nell'Asus NUC 14 può sostenere 6700 MB/s in confronto.

AS SSD
AS SSD
CDM 8
CDM 8
Crucial P3 Plus CT1000P3PSSD8
CDM 5/6 Read Seq Q32T1: 5091 MB/s
CDM 5/6 Write Seq Q32T1: 4699 MB/s
CDM 5/6 Read 4K Q32T1: 745.1 MB/s
CDM 5/6 Write 4K Q32T1: 427.3 MB/s
CDM 5 Read Seq: 3176 MB/s
CDM 5 Write Seq: 4613 MB/s
CDM 5/6 Read 4K: 85.15 MB/s
CDM 5/6 Write 4K: 311.5 MB/s
Drive Performance Rating - Percent
Beelink GTI12 Ultra EX Docking Station
Crucial P3 Plus CT1000P3PSSD8
81.1 pt
GMK NucBox K9
MasonSemi 1TB MC7000
77.7 pt
Minisforum MS-A1
Kingston OM8PGP41024Q-A0
77.4 pt
Geekom AX8 Pro
Acer N7000
63.2 pt
Asus ROG NUC 14-90AS0051
Samsung PM9A1a MZVL21T0HDLU
60.4 pt
Asus NUC 14 Pro
Kingston KC3000 2048G SKC3000D2048G
58.5 pt
DiskSpd
seq read
Geekom AX8 Pro
Acer N7000
3921 (3897.31min - 3920.75max) MB/s +27%
GMK NucBox K9
MasonSemi 1TB MC7000
3783 (3597.81min - 3782.84max) MB/s +22%
Asus NUC 14 Pro
Kingston KC3000 2048G SKC3000D2048G
3706 (3594.04min - 3706.37max) MB/s +20%
Beelink GTI12 Ultra EX Docking Station
Crucial P3 Plus CT1000P3PSSD8
3092 (3065.78min - 3092.25max) MB/s
Asus ROG NUC 14-90AS0051
Samsung PM9A1a MZVL21T0HDLU
3028 (3010.25min - 3027.87max) MB/s -2%
Minisforum MS-A1
Kingston OM8PGP41024Q-A0
2596 (2580.13min - 2596.06max) MB/s -16%
seq write
GMK NucBox K9
MasonSemi 1TB MC7000
5556 (1352.45min - 5556.19max) MB/s +23%
Beelink GTI12 Ultra EX Docking Station
Crucial P3 Plus CT1000P3PSSD8
4499 (4456.97min - 4498.62max) MB/s
Minisforum MS-A1
Kingston OM8PGP41024Q-A0
3913 (3872.62min - 3912.8max) MB/s -13%
Geekom AX8 Pro
Acer N7000
3791 (3695.18min - 3790.57max) MB/s -16%
Asus ROG NUC 14-90AS0051
Samsung PM9A1a MZVL21T0HDLU
3433 (3398.64min - 3432.62max) MB/s -24%
Asus NUC 14 Pro
Kingston KC3000 2048G SKC3000D2048G
2928 (1958.53min - 2927.62max) MB/s -35%
seq q8 t1 read
Asus NUC 14 Pro
Kingston KC3000 2048G SKC3000D2048G
7110 (6058.21min - 7110.02max) MB/s +38%
GMK NucBox K9
MasonSemi 1TB MC7000
7066 (6607.49min - 7066.35max) MB/s +37%
Geekom AX8 Pro
Acer N7000
7012 (5624.01min - 7012.25max) MB/s +36%
Asus ROG NUC 14-90AS0051
Samsung PM9A1a MZVL21T0HDLU
6023 (4949.03min - 6022.72max) MB/s +17%
Beelink GTI12 Ultra EX Docking Station
Crucial P3 Plus CT1000P3PSSD8
5164 (4719.64min - 5163.61max) MB/s
Minisforum MS-A1
Kingston OM8PGP41024Q-A0
4819 (3762.53min - 4819.05max) MB/s -7%
seq q8 t1 write
GMK NucBox K9
MasonSemi 1TB MC7000
6647 (1260.59min - 6647.13max) MB/s +41%
Geekom AX8 Pro
Acer N7000
5685 (5389.6min - 5684.54max) MB/s +21%
Asus ROG NUC 14-90AS0051
Samsung PM9A1a MZVL21T0HDLU
5047 (4973.7min - 5046.77max) MB/s +7%
Asus NUC 14 Pro
Kingston KC3000 2048G SKC3000D2048G
4712 (3064.99min - 4711.88max) MB/s 0%
Beelink GTI12 Ultra EX Docking Station
Crucial P3 Plus CT1000P3PSSD8
4705 (4693.69min - 4704.99max) MB/s
Minisforum MS-A1
Kingston OM8PGP41024Q-A0
3927 (3923.26min - 3927.45max) MB/s -17%
4k q1 t1 read
Beelink GTI12 Ultra EX Docking Station
Crucial P3 Plus CT1000P3PSSD8
82.5 (81.89min - 82.53max) MB/s
GMK NucBox K9
MasonSemi 1TB MC7000
79.5 (78.92min - 79.5max) MB/s -4%
Minisforum MS-A1
Kingston OM8PGP41024Q-A0
63.3 (62.78min - 63.25max) MB/s -23%
Geekom AX8 Pro
Acer N7000
62.2 (61.55min - 62.23max) MB/s -25%
Asus ROG NUC 14-90AS0051
Samsung PM9A1a MZVL21T0HDLU
57.3 (55.83min - 57.3max) MB/s -31%
Asus NUC 14 Pro
Kingston KC3000 2048G SKC3000D2048G
53.4 (49.89min - 53.35max) MB/s -35%
4k q1 t1 write
Beelink GTI12 Ultra EX Docking Station
Crucial P3 Plus CT1000P3PSSD8
343 (339.81min - 342.66max) MB/s
Minisforum MS-A1
Kingston OM8PGP41024Q-A0
206 (204.82min - 206.03max) MB/s -40%
GMK NucBox K9
MasonSemi 1TB MC7000
205 (173.87min - 205.2max) MB/s -40%
Geekom AX8 Pro
Acer N7000
187 (185.73min - 187.04max) MB/s -45%
Asus ROG NUC 14-90AS0051
Samsung PM9A1a MZVL21T0HDLU
132.2 (131.33min - 132.22max) MB/s -61%
Asus NUC 14 Pro
Kingston KC3000 2048G SKC3000D2048G
83.1 (75.3min - 83.11max) MB/s -76%
4k q32 t16 read
Beelink GTI12 Ultra EX Docking Station
Crucial P3 Plus CT1000P3PSSD8
3140 (3129.38min - 3139.65max) MB/s
Minisforum MS-A1
Kingston OM8PGP41024Q-A0
2980 (2975.03min - 2979.83max) MB/s -5%
GMK NucBox K9
MasonSemi 1TB MC7000
2243 (1941.91min - 2243.48max) MB/s -29%
Geekom AX8 Pro
Acer N7000
1644 (1568.76min - 1643.51max) MB/s -48%
Asus ROG NUC 14-90AS0051
Samsung PM9A1a MZVL21T0HDLU
875 (847.6min - 875.38max) MB/s -72%
Asus NUC 14 Pro
Kingston KC3000 2048G SKC3000D2048G
731 (660.89min - 731.29max) MB/s -77%
4k q32 t16 write
Minisforum MS-A1
Kingston OM8PGP41024Q-A0
3784 (3750.18min - 3783.56max) MB/s +31%
GMK NucBox K9
MasonSemi 1TB MC7000
3232 (3002.64min - 3232.41max) MB/s +12%
Beelink GTI12 Ultra EX Docking Station
Crucial P3 Plus CT1000P3PSSD8
2888 (2858.16min - 2887.52max) MB/s
Geekom AX8 Pro
Acer N7000
647 (598.22min - 647.4max) MB/s -78%
Asus ROG NUC 14-90AS0051
Samsung PM9A1a MZVL21T0HDLU
423 (415.61min - 422.66max) MB/s -85%
Asus NUC 14 Pro
Kingston KC3000 2048G SKC3000D2048G
186.7 (155.05min - 186.74max) MB/s -94%
AS SSD
Score Total
Minisforum MS-A1
Kingston OM8PGP41024Q-A0
8405 Points +14%
GMK NucBox K9
MasonSemi 1TB MC7000
7509 Points +2%
Beelink GTI12 Ultra EX Docking Station
Crucial P3 Plus CT1000P3PSSD8
7388 Points
Geekom AX8 Pro
Acer N7000
5512 Points -25%
Asus ROG NUC 14-90AS0051
Samsung PM9A1a MZVL21T0HDLU
5387 Points -27%
Asus NUC 14 Pro
Kingston KC3000 2048G SKC3000D2048G
5131 Points -31%
Score Read
GMK NucBox K9
MasonSemi 1TB MC7000
3258 Points +19%
Minisforum MS-A1
Kingston OM8PGP41024Q-A0
2901 Points +6%
Beelink GTI12 Ultra EX Docking Station
Crucial P3 Plus CT1000P3PSSD8
2728 Points
Geekom AX8 Pro
Acer N7000
1793 Points -34%
Asus ROG NUC 14-90AS0051
Samsung PM9A1a MZVL21T0HDLU
1437 Points -47%
Asus NUC 14 Pro
Kingston KC3000 2048G SKC3000D2048G
1275 Points -53%
Score Write
Minisforum MS-A1
Kingston OM8PGP41024Q-A0
4040 Points +24%
Asus ROG NUC 14-90AS0051
Samsung PM9A1a MZVL21T0HDLU
3324 Points +2%
Asus NUC 14 Pro
Kingston KC3000 2048G SKC3000D2048G
3313 Points +1%
Beelink GTI12 Ultra EX Docking Station
Crucial P3 Plus CT1000P3PSSD8
3266 Points
Geekom AX8 Pro
Acer N7000
2896 Points -11%
GMK NucBox K9
MasonSemi 1TB MC7000
2593 Points -21%
Seq Read
GMK NucBox K9
MasonSemi 1TB MC7000
5766.47 MB/s +33%
Asus ROG NUC 14-90AS0051
Samsung PM9A1a MZVL21T0HDLU
5245 MB/s +21%
Asus NUC 14 Pro
Kingston KC3000 2048G SKC3000D2048G
5158 MB/s +19%
Geekom AX8 Pro
Acer N7000
4902 MB/s +13%
Beelink GTI12 Ultra EX Docking Station
Crucial P3 Plus CT1000P3PSSD8
4330.36 MB/s
Minisforum MS-A1
Kingston OM8PGP41024Q-A0
4159 MB/s -4%
Seq Write
GMK NucBox K9
MasonSemi 1TB MC7000
5653.88 MB/s +37%
Beelink GTI12 Ultra EX Docking Station
Crucial P3 Plus CT1000P3PSSD8
4124.53 MB/s
Minisforum MS-A1
Kingston OM8PGP41024Q-A0
3688 MB/s -11%
Geekom AX8 Pro
Acer N7000
2835 MB/s -31%
Asus ROG NUC 14-90AS0051
Samsung PM9A1a MZVL21T0HDLU
2696 MB/s -35%
Asus NUC 14 Pro
Kingston KC3000 2048G SKC3000D2048G
2646 MB/s -36%
4K Read
Beelink GTI12 Ultra EX Docking Station
Crucial P3 Plus CT1000P3PSSD8
80.65 MB/s
Minisforum MS-A1
Kingston OM8PGP41024Q-A0
75.7 MB/s -6%
Asus ROG NUC 14-90AS0051
Samsung PM9A1a MZVL21T0HDLU
70.6 MB/s -12%
GMK NucBox K9
MasonSemi 1TB MC7000
67.66 MB/s -16%
Asus NUC 14 Pro
Kingston KC3000 2048G SKC3000D2048G
63.6 MB/s -21%
Geekom AX8 Pro
Acer N7000
59.1 MB/s -27%
4K Write
Beelink GTI12 Ultra EX Docking Station
Crucial P3 Plus CT1000P3PSSD8
286.17 MB/s
Geekom AX8 Pro
Acer N7000
181.4 MB/s -37%
Minisforum MS-A1
Kingston OM8PGP41024Q-A0
178.8 MB/s -38%
Asus ROG NUC 14-90AS0051
Samsung PM9A1a MZVL21T0HDLU
178.6 MB/s -38%
Asus NUC 14 Pro
Kingston KC3000 2048G SKC3000D2048G
169.5 MB/s -41%
GMK NucBox K9
MasonSemi 1TB MC7000
148.58 MB/s -48%
4K-64 Read
GMK NucBox K9
MasonSemi 1TB MC7000
2614.06 MB/s +18%
Minisforum MS-A1
Kingston OM8PGP41024Q-A0
2409 MB/s +9%
Beelink GTI12 Ultra EX Docking Station
Crucial P3 Plus CT1000P3PSSD8
2214.56 MB/s
Geekom AX8 Pro
Acer N7000
1244 MB/s -44%
Asus ROG NUC 14-90AS0051
Samsung PM9A1a MZVL21T0HDLU
842 MB/s -62%
Asus NUC 14 Pro
Kingston KC3000 2048G SKC3000D2048G
695 MB/s -69%
4K-64 Write
Minisforum MS-A1
Kingston OM8PGP41024Q-A0
3492 MB/s +36%
Asus NUC 14 Pro
Kingston KC3000 2048G SKC3000D2048G
2878 MB/s +12%
Asus ROG NUC 14-90AS0051
Samsung PM9A1a MZVL21T0HDLU
2876 MB/s +12%
Beelink GTI12 Ultra EX Docking Station
Crucial P3 Plus CT1000P3PSSD8
2567.37 MB/s
Geekom AX8 Pro
Acer N7000
2431 MB/s -5%
GMK NucBox K9
MasonSemi 1TB MC7000
1879.53 MB/s -27%
Access Time Read
Geekom AX8 Pro
Acer N7000
0.079 ms * -39%
Minisforum MS-A1
Kingston OM8PGP41024Q-A0
0.066 ms * -16%
Asus ROG NUC 14-90AS0051
Samsung PM9A1a MZVL21T0HDLU
0.064 ms * -12%
GMK NucBox K9
MasonSemi 1TB MC7000
0.06 ms * -5%
Beelink GTI12 Ultra EX Docking Station
Crucial P3 Plus CT1000P3PSSD8
0.057 ms *
Asus NUC 14 Pro
Kingston KC3000 2048G SKC3000D2048G
0.053 ms * +7%
Access Time Write
GMK NucBox K9
MasonSemi 1TB MC7000
0.195 ms * -290%
Geekom AX8 Pro
Acer N7000
0.064 ms * -28%
Beelink GTI12 Ultra EX Docking Station
Crucial P3 Plus CT1000P3PSSD8
0.05 ms *
Asus NUC 14 Pro
Kingston KC3000 2048G SKC3000D2048G
0.043 ms * +14%
Minisforum MS-A1
Kingston OM8PGP41024Q-A0
0.032 ms * +36%
Asus ROG NUC 14-90AS0051
Samsung PM9A1a MZVL21T0HDLU
0.023 ms * +54%

* ... Meglio usare valori piccoli

Disk Throttling: DiskSpd Read Loop, Queue Depth 8

034068010201360170020402380272030603400374040804420476051005440578061206460Tooltip
Beelink GTI12 Ultra EX Docking Station Crucial P3 Plus CT1000P3PSSD8; diskspd 2.0.17 f: Ø4958 (4279.7-5189.4)
Asus ROG NUC 14-90AS0051 Samsung PM9A1a MZVL21T0HDLU; diskspd 2.0.17 f: Ø6673 (5894.88-6717.19)

Prestazioni della GPU

La GeForce RTX 3070 è stata pesantemente testata e quindi le sue prestazioni non riservano sorprese. Siamo invece interessati a qualsiasi deficit di prestazioni che la nostra RTX 3070 agganciata potrebbe avere rispetto a un PC desktop "vero e proprio" con la RTX 3070. In questo caso, le prestazioni sono essenzialmente alla pari con il nostro PC RTX 3070 desktop di riferimento o addirittura leggermente più veloci di qualche punto percentuale, per non mostrare perdite di prestazioni tangibili. Naturalmente, i risultati possono variare se si installano GPU molto più veloci come la RTX 4090, dove l'interfaccia PCIe x8 può diventare un fattore più limitante.

3DMark 11
3DMark 11
Fire Strike
Fire Strike
Time Spy
Time Spy
Via della velocità
Via della velocità
Nomade d'acciaio
Nomade d'acciaio
 
3DMark Performance Rating - Percent
Lenovo Legion 9 16IRX9, RTX 4090 -2!
NVIDIA GeForce RTX 4090 Laptop GPU, Intel Core i9-14900HX
100 pt
Beelink GTI12 Ultra EX Docking Station
NVIDIA GeForce RTX 3070, Intel Core i9-12900H
81.6 pt
Media NVIDIA GeForce RTX 3070
 
75.8 pt
Asus ROG NUC 14-90AS0051
NVIDIA GeForce RTX 4070 Laptop GPU, Intel Core Ultra 9 185H
68.7 pt
MSI GeForce RTX 3070 Ventus 3X -2!
NVIDIA GeForce RTX 3070, AMD Ryzen 9 5900X
66.7 pt
Maingear ML-16 MK2
NVIDIA GeForce RTX 4070 Laptop GPU, Intel Core Ultra 7 155H
62.4 pt
Minisforum G7 PT
AMD Radeon RX 7600M XT, AMD Ryzen 9 7945HX
61.8 pt
Asus TUF Gaming A14 FA401WV-WB94
NVIDIA GeForce RTX 4060 Laptop GPU, AMD Ryzen AI 9 HX 370
60.7 pt
Acemagic M2A
NVIDIA GeForce RTX 3080 Laptop GPU, Intel Core i9-12900H
59.3 pt
Acemagic Tank03 -1!
NVIDIA GeForce RTX 3080 Laptop GPU, Intel Core i9-12900H
56.9 pt
Lenovo IdeaPad Pro 5 16IMH G9 RTX 4050
NVIDIA GeForce RTX 4050 Laptop GPU, Intel Core Ultra 9 185H
50.5 pt
3DMark 11 - 1280x720 Performance GPU
Lenovo Legion 9 16IRX9, RTX 4090
NVIDIA GeForce RTX 4090 Laptop GPU, Intel Core i9-14900HX
64341 Points +34%
Beelink GTI12 Ultra EX Docking Station
NVIDIA GeForce RTX 3070, Intel Core i9-12900H
47892 Points
Minisforum G7 PT
AMD Radeon RX 7600M XT, AMD Ryzen 9 7945HX
44060 Points -8%
MSI GeForce RTX 3070 Ventus 3X
NVIDIA GeForce RTX 3070, AMD Ryzen 9 5900X
43005 Points -10%
Media NVIDIA GeForce RTX 3070
  (26812 - 47892, n=10)
41541 Points -13%
Asus ROG NUC 14-90AS0051
NVIDIA GeForce RTX 4070 Laptop GPU, Intel Core Ultra 9 185H
40144 Points -16%
Maingear ML-16 MK2
NVIDIA GeForce RTX 4070 Laptop GPU, Intel Core Ultra 7 155H
37263 Points -22%
Asus TUF Gaming A14 FA401WV-WB94
NVIDIA GeForce RTX 4060 Laptop GPU, AMD Ryzen AI 9 HX 370
36372 Points -24%
Acemagic Tank03
NVIDIA GeForce RTX 3080 Laptop GPU, Intel Core i9-12900H
35614 Points -26%
Acemagic M2A
NVIDIA GeForce RTX 3080 Laptop GPU, Intel Core i9-12900H
34924 Points -27%
Lenovo IdeaPad Pro 5 16IMH G9 RTX 4050
NVIDIA GeForce RTX 4050 Laptop GPU, Intel Core Ultra 9 185H
30309 Points -37%
3DMark
1920x1080 Fire Strike Graphics
Lenovo Legion 9 16IRX9, RTX 4090
NVIDIA GeForce RTX 4090 Laptop GPU, Intel Core i9-14900HX
43518 Points +28%
Beelink GTI12 Ultra EX Docking Station
NVIDIA GeForce RTX 3070, Intel Core i9-12900H
34047 Points
MSI GeForce RTX 3070 Ventus 3X
NVIDIA GeForce RTX 3070, AMD Ryzen 9 5900X
31020 Points -9%
Minisforum G7 PT
AMD Radeon RX 7600M XT, AMD Ryzen 9 7945HX
30684 Points -10%
Media NVIDIA GeForce RTX 3070
  (20357 - 34047, n=8)
29587 Points -13%
Asus ROG NUC 14-90AS0051
NVIDIA GeForce RTX 4070 Laptop GPU, Intel Core Ultra 9 185H
29264 Points -14%
Maingear ML-16 MK2
NVIDIA GeForce RTX 4070 Laptop GPU, Intel Core Ultra 7 155H
28464 Points -16%
Asus TUF Gaming A14 FA401WV-WB94
NVIDIA GeForce RTX 4060 Laptop GPU, AMD Ryzen AI 9 HX 370
26679 Points -22%
Acemagic Tank03
NVIDIA GeForce RTX 3080 Laptop GPU, Intel Core i9-12900H
25733 Points -24%
Acemagic M2A
NVIDIA GeForce RTX 3080 Laptop GPU, Intel Core i9-12900H
25433 Points -25%
Lenovo IdeaPad Pro 5 16IMH G9 RTX 4050
NVIDIA GeForce RTX 4050 Laptop GPU, Intel Core Ultra 9 185H
23210 Points -32%
2560x1440 Time Spy Graphics
Lenovo Legion 9 16IRX9, RTX 4090
NVIDIA GeForce RTX 4090 Laptop GPU, Intel Core i9-14900HX
20416 Points +46%
Beelink GTI12 Ultra EX Docking Station
NVIDIA GeForce RTX 3070, Intel Core i9-12900H
13961 Points
MSI GeForce RTX 3070 Ventus 3X
NVIDIA GeForce RTX 3070, AMD Ryzen 9 5900X
13111 Points -6%
Media NVIDIA GeForce RTX 3070
  (11043 - 13961, n=8)
12784 Points -8%
Asus ROG NUC 14-90AS0051
NVIDIA GeForce RTX 4070 Laptop GPU, Intel Core Ultra 9 185H
12040 Points -14%
Minisforum G7 PT
AMD Radeon RX 7600M XT, AMD Ryzen 9 7945HX
10777 Points -23%
Maingear ML-16 MK2
NVIDIA GeForce RTX 4070 Laptop GPU, Intel Core Ultra 7 155H
10691 Points -23%
Asus TUF Gaming A14 FA401WV-WB94
NVIDIA GeForce RTX 4060 Laptop GPU, AMD Ryzen AI 9 HX 370
10397 Points -26%
Acemagic Tank03
NVIDIA GeForce RTX 3080 Laptop GPU, Intel Core i9-12900H
10112 Points -28%
Acemagic M2A
NVIDIA GeForce RTX 3080 Laptop GPU, Intel Core i9-12900H
10108 Points -28%
Lenovo IdeaPad Pro 5 16IMH G9 RTX 4050
NVIDIA GeForce RTX 4050 Laptop GPU, Intel Core Ultra 9 185H
8574 Points -39%
2560x1440 Time Spy Score
Lenovo Legion 9 16IRX9, RTX 4090
NVIDIA GeForce RTX 4090 Laptop GPU, Intel Core i9-14900HX
20099 Points +46%
Beelink GTI12 Ultra EX Docking Station
NVIDIA GeForce RTX 3070, Intel Core i9-12900H
13722 Points
MSI GeForce RTX 3070 Ventus 3X
NVIDIA GeForce RTX 3070, AMD Ryzen 9 5900X
12937 Points -6%
Asus ROG NUC 14-90AS0051
NVIDIA GeForce RTX 4070 Laptop GPU, Intel Core Ultra 9 185H
11963 Points -13%
Media NVIDIA GeForce RTX 3070
  (8113 - 13722, n=8)
11944 Points -13%
Minisforum G7 PT
AMD Radeon RX 7600M XT, AMD Ryzen 9 7945HX
11041 Points -20%
Maingear ML-16 MK2
NVIDIA GeForce RTX 4070 Laptop GPU, Intel Core Ultra 7 155H
10759 Points -22%
Asus TUF Gaming A14 FA401WV-WB94
NVIDIA GeForce RTX 4060 Laptop GPU, AMD Ryzen AI 9 HX 370
10451 Points -24%
Acemagic M2A
NVIDIA GeForce RTX 3080 Laptop GPU, Intel Core i9-12900H
10307 Points -25%
Acemagic Tank03
NVIDIA GeForce RTX 3080 Laptop GPU, Intel Core i9-12900H
10231 Points -25%
Lenovo IdeaPad Pro 5 16IMH G9 RTX 4050
NVIDIA GeForce RTX 4050 Laptop GPU, Intel Core Ultra 9 185H
8963 Points -35%
2560x1440 Speed Way Score
Beelink GTI12 Ultra EX Docking Station
NVIDIA GeForce RTX 3070, Intel Core i9-12900H
3581 Points
Media NVIDIA GeForce RTX 3070
  ()
3581 Points 0%
Asus ROG NUC 14-90AS0051
NVIDIA GeForce RTX 4070 Laptop GPU, Intel Core Ultra 9 185H
2959 Points -17%
Maingear ML-16 MK2
NVIDIA GeForce RTX 4070 Laptop GPU, Intel Core Ultra 7 155H
2620 Points -27%
Asus TUF Gaming A14 FA401WV-WB94
NVIDIA GeForce RTX 4060 Laptop GPU, AMD Ryzen AI 9 HX 370
2611 Points -27%
Acemagic M2A
NVIDIA GeForce RTX 3080 Laptop GPU, Intel Core i9-12900H
2514 Points -30%
Acemagic Tank03
NVIDIA GeForce RTX 3080 Laptop GPU, Intel Core i9-12900H
2495 Points -30%
Lenovo IdeaPad Pro 5 16IMH G9 RTX 4050
NVIDIA GeForce RTX 4050 Laptop GPU, Intel Core Ultra 9 185H
2078 Points -42%
Minisforum G7 PT
AMD Radeon RX 7600M XT, AMD Ryzen 9 7945HX
1975 Points -45%
Steel Nomad Score
Beelink GTI12 Ultra EX Docking Station
NVIDIA GeForce RTX 3070, Intel Core i9-12900H
3247 Points
Media NVIDIA GeForce RTX 3070
  ()
3247 Points 0%
Asus ROG NUC 14-90AS0051
NVIDIA GeForce RTX 4070 Laptop GPU, Intel Core Ultra 9 185H
2651 Points -18%
Acemagic M2A
NVIDIA GeForce RTX 3080 Laptop GPU, Intel Core i9-12900H
2337 Points -28%
Maingear ML-16 MK2
NVIDIA GeForce RTX 4070 Laptop GPU, Intel Core Ultra 7 155H
2329 Points -28%
Asus TUF Gaming A14 FA401WV-WB94
NVIDIA GeForce RTX 4060 Laptop GPU, AMD Ryzen AI 9 HX 370
2283 Points -30%
Minisforum G7 PT
AMD Radeon RX 7600M XT, AMD Ryzen 9 7945HX
2243 Points -31%
Lenovo IdeaPad Pro 5 16IMH G9 RTX 4050
NVIDIA GeForce RTX 4050 Laptop GPU, Intel Core Ultra 9 185H
1873 Points -42%
3DMark 11 Performance
37012 punti
3DMark Cloud Gate Standard Score
57634 punti
3DMark Fire Strike Score
27206 punti
3DMark Time Spy Score
13722 punti
3DMark Steel Nomad Score
3247 punti
Aiuto
Blender
v3.3 Classroom OPTIX/RTX
Lenovo IdeaPad Pro 5 16IMH G9 RTX 4050
NVIDIA GeForce RTX 4050 Laptop GPU, Intel Core Ultra 9 185H
26 Seconds * -13%
Acemagic M2A
NVIDIA GeForce RTX 3080 Laptop GPU, Intel Core i9-12900H
25 Seconds * -9%
Acemagic Tank03
NVIDIA GeForce RTX 3080 Laptop GPU, Intel Core i9-12900H
23 Seconds * -0%
Beelink GTI12 Ultra EX Docking Station
NVIDIA GeForce RTX 3070, Intel Core i9-12900H
23 Seconds *
Media NVIDIA GeForce RTX 3070
  ()
23 Seconds * -0%
Asus TUF Gaming A14 FA401WV-WB94
NVIDIA GeForce RTX 4060 Laptop GPU, AMD Ryzen AI 9 HX 370
22 Seconds * +4%
Asus ROG NUC 14-90AS0051
NVIDIA GeForce RTX 4070 Laptop GPU, Intel Core Ultra 9 185H
19 Seconds * +17%
Lenovo Legion 9 16IRX9, RTX 4090
NVIDIA GeForce RTX 4090 Laptop GPU, Intel Core i9-14900HX
13 Seconds * +43%
v3.3 Classroom CUDA
Lenovo IdeaPad Pro 5 16IMH G9 RTX 4050
NVIDIA GeForce RTX 4050 Laptop GPU, Intel Core Ultra 9 185H
47 Seconds * -31%
Acemagic M2A
NVIDIA GeForce RTX 3080 Laptop GPU, Intel Core i9-12900H
42 Seconds * -17%
Acemagic Tank03
NVIDIA GeForce RTX 3080 Laptop GPU, Intel Core i9-12900H
41 Seconds * -14%
Asus TUF Gaming A14 FA401WV-WB94
NVIDIA GeForce RTX 4060 Laptop GPU, AMD Ryzen AI 9 HX 370
40 Seconds * -11%
Beelink GTI12 Ultra EX Docking Station
NVIDIA GeForce RTX 3070, Intel Core i9-12900H
36 Seconds *
Media NVIDIA GeForce RTX 3070
  ()
36 Seconds * -0%
Lenovo Legion 9 16IRX9, RTX 4090
NVIDIA GeForce RTX 4090 Laptop GPU, Intel Core i9-14900HX
18 Seconds * +50%
v3.3 Classroom CPU
Acemagic M2A
NVIDIA GeForce RTX 3080 Laptop GPU, Intel Core i9-12900H
464 Seconds * -38%
Acemagic Tank03
NVIDIA GeForce RTX 3080 Laptop GPU, Intel Core i9-12900H
447 Seconds * -33%
Beelink GTI12 Ultra EX Docking Station
NVIDIA GeForce RTX 3070, Intel Core i9-12900H
336 Seconds *
Media NVIDIA GeForce RTX 3070
  ()
336 Seconds * -0%
Lenovo IdeaPad Pro 5 16IMH G9 RTX 4050
NVIDIA GeForce RTX 4050 Laptop GPU, Intel Core Ultra 9 185H
298 Seconds * +11%
Asus ROG NUC 14-90AS0051
NVIDIA GeForce RTX 4070 Laptop GPU, Intel Core Ultra 9 185H
280 Seconds * +17%
Asus TUF Gaming A14 FA401WV-WB94
NVIDIA GeForce RTX 4060 Laptop GPU, AMD Ryzen AI 9 HX 370
215 Seconds * +36%
Lenovo Legion 9 16IRX9, RTX 4090
NVIDIA GeForce RTX 4090 Laptop GPU, Intel Core i9-14900HX
193 Seconds * +43%
Minisforum G7 PT
AMD Radeon RX 7600M XT, AMD Ryzen 9 7945HX
160 Seconds * +52%
v3.3 Classroom oneAPI/Intel
Asus ROG NUC 14-90AS0051
NVIDIA GeForce RTX 4070 Laptop GPU, Intel Core Ultra 9 185H
234 Seconds *

* ... Meglio usare valori piccoli

Prestazioni di gioco

Nonostante sia una GPU di quattro anni fa (!), la RTX 3070 di GeForce per desktop è ancora potente, soprattutto se confrontata con i laptop da gioco, dove i consumi sono molto più ridotti. Il nostro GTI12 Ultra e l'eGPU scelta sono in grado di superare facilmente i laptop con GeForce RTX 4070, come ad esempio il modello Maingear ML-16 MK2 Maingear ML-16 MK2 per essere più in linea con la rTX 4080 mobile. Si noti che questo non tiene conto di eventuali metodi di upscaling DLSS e quindi la serie RTX 40 mobile può ancora potenzialmente funzionare meglio se il titolo supporta DLSS 3.

Performance Rating - Percent
Lenovo Legion 9 16IRX9, RTX 4090 -1!
Intel Core i9-14900HX, NVIDIA GeForce RTX 4090 Laptop GPU
100 pt
Beelink GTI12 Ultra EX Docking Station
Intel Core i9-12900H, NVIDIA GeForce RTX 3070
82.1 pt
MSI GeForce RTX 3070 Ventus 3X -2!
AMD Ryzen 9 5900X, NVIDIA GeForce RTX 3070
74.4 pt
Acemagic M2A
Intel Core i9-12900H, NVIDIA GeForce RTX 3080 Laptop GPU
71.2 pt
Asus ROG NUC 14-90AS0051 -1!
Intel Core Ultra 9 185H, NVIDIA GeForce RTX 4070 Laptop GPU
71.1 pt
Minisforum G7 PT
AMD Ryzen 9 7945HX, AMD Radeon RX 7600M XT
69.9 pt
Acemagic Tank03
Intel Core i9-12900H, NVIDIA GeForce RTX 3080 Laptop GPU
69.7 pt
Asus TUF Gaming A14 FA401WV-WB94
AMD Ryzen AI 9 HX 370, NVIDIA GeForce RTX 4060 Laptop GPU
65.1 pt
Lenovo IdeaPad Pro 5 16IMH G9 RTX 4050
Intel Core Ultra 9 185H, NVIDIA GeForce RTX 4050 Laptop GPU
61 pt
Baldur's Gate 3 - 1920x1080 Ultra Preset
Beelink GTI12 Ultra EX Docking Station
Intel Core i9-12900H, NVIDIA GeForce RTX 3070
132.9 fps
Asus ROG NUC 14-90AS0051
Intel Core Ultra 9 185H, NVIDIA GeForce RTX 4070 Laptop GPU
105 (14min, 38P0.1, 71.4P1) fps -21%
Minisforum G7 PT
AMD Ryzen 9 7945HX, AMD Radeon RX 7600M XT
92.9 (59.8min, 61.3P0.1, 80.3P1) fps -30%
Acemagic M2A
Intel Core i9-12900H, NVIDIA GeForce RTX 3080 Laptop GPU
90.2 (59.5min, 71.5P0.1, 76.8P1) fps -32%
Asus TUF Gaming A14 FA401WV-WB94
AMD Ryzen AI 9 HX 370, NVIDIA GeForce RTX 4060 Laptop GPU
90.1 fps -32%
Acemagic Tank03
Intel Core i9-12900H, NVIDIA GeForce RTX 3080 Laptop GPU
88.4 (32.2min, 37.2P0.1, 70.6P1) fps -33%
Lenovo IdeaPad Pro 5 16IMH G9 RTX 4050
Intel Core Ultra 9 185H, NVIDIA GeForce RTX 4050 Laptop GPU
78.6 fps -41%
GTA V - 1920x1080 Highest Settings possible AA:4xMSAA + FX AF:16x
Lenovo Legion 9 16IRX9, RTX 4090
Intel Core i9-14900HX, NVIDIA GeForce RTX 4090 Laptop GPU
136.2 (0.938min, 111.1P1) fps +22%
Acemagic M2A
Intel Core i9-12900H, NVIDIA GeForce RTX 3080 Laptop GPU
114.6 (4.49min, 83.3P1) fps +3%
Beelink GTI12 Ultra EX Docking Station
Intel Core i9-12900H, NVIDIA GeForce RTX 3070
111.3 (4.01min, 71.4P1) fps
Acemagic Tank03
Intel Core i9-12900H, NVIDIA GeForce RTX 3080 Laptop GPU
111.1 (21.2min, 76.9P1) fps 0%
Asus TUF Gaming A14 FA401WV-WB94
AMD Ryzen AI 9 HX 370, NVIDIA GeForce RTX 4060 Laptop GPU
110.8 (3.47min, 71.4P1) fps 0%
MSI GeForce RTX 3070 Ventus 3X
AMD Ryzen 9 5900X, NVIDIA GeForce RTX 3070
108 (4.47min, 71.4P1) fps -3%
Asus ROG NUC 14-90AS0051
Intel Core Ultra 9 185H, NVIDIA GeForce RTX 4070 Laptop GPU
105.6 (5.88min, 71.4P1) fps -5%
Minisforum G7 PT
AMD Ryzen 9 7945HX, AMD Radeon RX 7600M XT
101.6 (8.59min, 66.7P1) fps -9%
Lenovo IdeaPad Pro 5 16IMH G9 RTX 4050
Intel Core Ultra 9 185H, NVIDIA GeForce RTX 4050 Laptop GPU
98.7 (4.28min, 66.7P1) fps -11%
Final Fantasy XV Benchmark - 1920x1080 High Quality
Lenovo Legion 9 16IRX9, RTX 4090
Intel Core i9-14900HX, NVIDIA GeForce RTX 4090 Laptop GPU
165.1 fps +19%
Beelink GTI12 Ultra EX Docking Station
Intel Core i9-12900H, NVIDIA GeForce RTX 3070
138.7 fps
MSI GeForce RTX 3070 Ventus 3X
AMD Ryzen 9 5900X, NVIDIA GeForce RTX 3070
122 fps -12%
Acemagic Tank03
Intel Core i9-12900H, NVIDIA GeForce RTX 3080 Laptop GPU
107.1 fps -23%
Acemagic M2A
Intel Core i9-12900H, NVIDIA GeForce RTX 3080 Laptop GPU
106.6 fps -23%
Asus TUF Gaming A14 FA401WV-WB94
AMD Ryzen AI 9 HX 370, NVIDIA GeForce RTX 4060 Laptop GPU
100.6 fps -27%
Minisforum G7 PT
AMD Ryzen 9 7945HX, AMD Radeon RX 7600M XT
99.8 fps -28%
Lenovo IdeaPad Pro 5 16IMH G9 RTX 4050
Intel Core Ultra 9 185H, NVIDIA GeForce RTX 4050 Laptop GPU
87.8 fps -37%
Strange Brigade - 1920x1080 ultra AA:ultra AF:16
Lenovo Legion 9 16IRX9, RTX 4090
Intel Core i9-14900HX, NVIDIA GeForce RTX 4090 Laptop GPU
369 (5min, 269P1) fps +51%
Beelink GTI12 Ultra EX Docking Station
Intel Core i9-12900H, NVIDIA GeForce RTX 3070
245 (132.6min, 183P1) fps
MSI GeForce RTX 3070 Ventus 3X
AMD Ryzen 9 5900X, NVIDIA GeForce RTX 3070
222 (106min, 167P1) fps -9%
Asus ROG NUC 14-90AS0051
Intel Core Ultra 9 185H, NVIDIA GeForce RTX 4070 Laptop GPU
207 (49.1min, 154.5P1) fps -16%
Asus TUF Gaming A14 FA401WV-WB94
AMD Ryzen AI 9 HX 370, NVIDIA GeForce RTX 4060 Laptop GPU
193.5 (45.4min, 142.5P1) fps -21%
Minisforum G7 PT
AMD Ryzen 9 7945HX, AMD Radeon RX 7600M XT
191.4 (106.1min, 138.9P1) fps -22%
Acemagic Tank03
Intel Core i9-12900H, NVIDIA GeForce RTX 3080 Laptop GPU
186.1 (120.7min, 141.6P1) fps -24%
Acemagic M2A
Intel Core i9-12900H, NVIDIA GeForce RTX 3080 Laptop GPU
184.6 (126.5min, 139.5P1) fps -25%
Lenovo IdeaPad Pro 5 16IMH G9 RTX 4050
Intel Core Ultra 9 185H, NVIDIA GeForce RTX 4050 Laptop GPU
149.4 (44.5min, 115.4P1) fps -39%
Dota 2 Reborn - 1920x1080 ultra (3/3) best looking
Lenovo Legion 9 16IRX9, RTX 4090
Intel Core i9-14900HX, NVIDIA GeForce RTX 4090 Laptop GPU
164.5 (136min) fps +10%
Minisforum G7 PT
AMD Ryzen 9 7945HX, AMD Radeon RX 7600M XT
158.1 (137.1min) fps +6%
Beelink GTI12 Ultra EX Docking Station
Intel Core i9-12900H, NVIDIA GeForce RTX 3070
149.3 (128.8min) fps
Acemagic M2A
Intel Core i9-12900H, NVIDIA GeForce RTX 3080 Laptop GPU
141.2 (123.4min) fps -5%
Acemagic Tank03
Intel Core i9-12900H, NVIDIA GeForce RTX 3080 Laptop GPU
138.7 (120.5min) fps -7%
Lenovo IdeaPad Pro 5 16IMH G9 RTX 4050
Intel Core Ultra 9 185H, NVIDIA GeForce RTX 4050 Laptop GPU
137.4 (115.6min) fps -8%
MSI GeForce RTX 3070 Ventus 3X
AMD Ryzen 9 5900X, NVIDIA GeForce RTX 3070
136.3 (108.9min) fps -9%
Asus TUF Gaming A14 FA401WV-WB94
AMD Ryzen AI 9 HX 370, NVIDIA GeForce RTX 4060 Laptop GPU
135 (117.6min) fps -10%
Asus ROG NUC 14-90AS0051
Intel Core Ultra 9 185H, NVIDIA GeForce RTX 4070 Laptop GPU
133.9 (116.1min) fps -10%
X-Plane 11.11 - 1920x1080 high (fps_test=3)
Lenovo Legion 9 16IRX9, RTX 4090
Intel Core i9-14900HX, NVIDIA GeForce RTX 4090 Laptop GPU
125.6 fps +40%
Acemagic M2A
Intel Core i9-12900H, NVIDIA GeForce RTX 3080 Laptop GPU
109.3 fps +22%
Acemagic Tank03
Intel Core i9-12900H, NVIDIA GeForce RTX 3080 Laptop GPU
102.3 fps +14%
MSI GeForce RTX 3070 Ventus 3X
AMD Ryzen 9 5900X, NVIDIA GeForce RTX 3070
95.4 fps +7%
Beelink GTI12 Ultra EX Docking Station
Intel Core i9-12900H, NVIDIA GeForce RTX 3070
89.5 fps
Minisforum G7 PT
AMD Ryzen 9 7945HX, AMD Radeon RX 7600M XT
89.2 fps 0%
Lenovo IdeaPad Pro 5 16IMH G9 RTX 4050
Intel Core Ultra 9 185H, NVIDIA GeForce RTX 4050 Laptop GPU
89 fps -1%
Asus ROG NUC 14-90AS0051
Intel Core Ultra 9 185H, NVIDIA GeForce RTX 4070 Laptop GPU
84.8 fps -5%
Asus TUF Gaming A14 FA401WV-WB94
AMD Ryzen AI 9 HX 370, NVIDIA GeForce RTX 4060 Laptop GPU
67.3 fps -25%
Cyberpunk 2077 2.1 Phantom Liberty - 1920x1080 Ultra Preset (FSR off)
Lenovo Legion 9 16IRX9, RTX 4090
Intel Core i9-14900HX, NVIDIA GeForce RTX 4090 Laptop GPU
127 (70.6min) fps +24%
Beelink GTI12 Ultra EX Docking Station
Intel Core i9-12900H, NVIDIA GeForce RTX 3070
102.2 (84.9min) fps
Minisforum G7 PT
AMD Ryzen 9 7945HX, AMD Radeon RX 7600M XT
83 (69.1min) fps -19%
Asus ROG NUC 14-90AS0051
Intel Core Ultra 9 185H, NVIDIA GeForce RTX 4070 Laptop GPU
82.5 (68.1min) fps -19%
Acemagic M2A
Intel Core i9-12900H, NVIDIA GeForce RTX 3080 Laptop GPU
74.8 (62.2min) fps -27%
Acemagic Tank03
Intel Core i9-12900H, NVIDIA GeForce RTX 3080 Laptop GPU
74.4 (42.8min) fps -27%
Asus TUF Gaming A14 FA401WV-WB94
AMD Ryzen AI 9 HX 370, NVIDIA GeForce RTX 4060 Laptop GPU
73.3 (60min) fps -28%
Lenovo IdeaPad Pro 5 16IMH G9 RTX 4050
Intel Core Ultra 9 185H, NVIDIA GeForce RTX 4050 Laptop GPU
59.8 (49.3min) fps -41%
Baldur's Gate 3
1920x1080 High Preset
Beelink GTI12 Ultra EX Docking Station
Intel Core i9-12900H, NVIDIA GeForce RTX 3070
137.1 fps
Media NVIDIA GeForce RTX 3070
  (121.6 - 137.1, n=2)
129.4 fps -6%
Maingear ML-16 MK2
Intel Core Ultra 7 155H, NVIDIA GeForce RTX 4070 Laptop GPU
108.2 fps -21%
Asus ROG NUC 14-90AS0051
Intel Core Ultra 9 185H, NVIDIA GeForce RTX 4070 Laptop GPU
107.8 (34.6min, 48.3P0.1, 71.3P1) fps -21%
Minisforum G7 PT
AMD Ryzen 9 7945HX, AMD Radeon RX 7600M XT
95.7 (61.3min, 62.5P0.1, 83.2P1) fps -30%
Acemagic M2A
Intel Core i9-12900H, NVIDIA GeForce RTX 3080 Laptop GPU
91.6 (71.6min, 76.5P0.1, 79.8P1) fps -33%
Asus TUF Gaming A14 FA401WV-WB94
AMD Ryzen AI 9 HX 370, NVIDIA GeForce RTX 4060 Laptop GPU
91 fps -34%
Acemagic Tank03
Intel Core i9-12900H, NVIDIA GeForce RTX 3080 Laptop GPU
90.2 (36.3min, 42.7P0.1, 74.5P1) fps -34%
Lenovo IdeaPad Pro 5 16IMH G9 RTX 4050
Intel Core Ultra 9 185H, NVIDIA GeForce RTX 4050 Laptop GPU
81.3 fps -41%
1920x1080 Ultra Preset
Beelink GTI12 Ultra EX Docking Station
Intel Core i9-12900H, NVIDIA GeForce RTX 3070
132.9 fps
Media NVIDIA GeForce RTX 3070
  (120.8 - 132.9, n=2)
126.9 fps -5%
Maingear ML-16 MK2
Intel Core Ultra 7 155H, NVIDIA GeForce RTX 4070 Laptop GPU
106.8 fps -20%
Asus ROG NUC 14-90AS0051
Intel Core Ultra 9 185H, NVIDIA GeForce RTX 4070 Laptop GPU
105 (14min, 38P0.1, 71.4P1) fps -21%
Minisforum G7 PT
AMD Ryzen 9 7945HX, AMD Radeon RX 7600M XT
92.9 (59.8min, 61.3P0.1, 80.3P1) fps -30%
Acemagic M2A
Intel Core i9-12900H, NVIDIA GeForce RTX 3080 Laptop GPU
90.2 (59.5min, 71.5P0.1, 76.8P1) fps -32%
Asus TUF Gaming A14 FA401WV-WB94
AMD Ryzen AI 9 HX 370, NVIDIA GeForce RTX 4060 Laptop GPU
90.1 fps -32%
Acemagic Tank03
Intel Core i9-12900H, NVIDIA GeForce RTX 3080 Laptop GPU
88.4 (32.2min, 37.2P0.1, 70.6P1) fps -33%
Lenovo IdeaPad Pro 5 16IMH G9 RTX 4050
Intel Core Ultra 9 185H, NVIDIA GeForce RTX 4050 Laptop GPU
78.6 fps -41%
2560x1440 Ultra Preset
Beelink GTI12 Ultra EX Docking Station
Intel Core i9-12900H, NVIDIA GeForce RTX 3070
93.5 fps
Media NVIDIA GeForce RTX 3070
  (82.3 - 93.5, n=2)
87.9 fps -6%
Asus ROG NUC 14-90AS0051
Intel Core Ultra 9 185H, NVIDIA GeForce RTX 4070 Laptop GPU
73.7 (7.13min, 33.4P0.1, 51.1P1) fps -21%
Maingear ML-16 MK2
Intel Core Ultra 7 155H, NVIDIA GeForce RTX 4070 Laptop GPU
70.6 fps -24%
Minisforum G7 PT
AMD Ryzen 9 7945HX, AMD Radeon RX 7600M XT
63.8 (46.2min, 46.7P0.1, 56.7P1) fps -32%
Acemagic M2A
Intel Core i9-12900H, NVIDIA GeForce RTX 3080 Laptop GPU
63 (42.8min, 46.3P0.1, 54.3P1) fps -33%
Asus TUF Gaming A14 FA401WV-WB94
AMD Ryzen AI 9 HX 370, NVIDIA GeForce RTX 4060 Laptop GPU
61.1 fps -35%
Acemagic Tank03
Intel Core i9-12900H, NVIDIA GeForce RTX 3080 Laptop GPU
59.7 (26.2min, 31.4P0.1, 46.7P1) fps -36%
3840x2160 Ultra Preset
Beelink GTI12 Ultra EX Docking Station
Intel Core i9-12900H, NVIDIA GeForce RTX 3070
49.7 fps
Media NVIDIA GeForce RTX 3070
  (44.6 - 49.7, n=2)
47.2 fps -5%
Asus ROG NUC 14-90AS0051
Intel Core Ultra 9 185H, NVIDIA GeForce RTX 4070 Laptop GPU
38.7 (13.6min, 19.7P0.1, 28.6P1) fps -22%
Acemagic M2A
Intel Core i9-12900H, NVIDIA GeForce RTX 3080 Laptop GPU
33.8 (27.1min, 27.8P0.1, 28.2P1) fps -32%
Minisforum G7 PT
AMD Ryzen 9 7945HX, AMD Radeon RX 7600M XT
32.2 (27.5min, 27.8P0.1, 28.4P1) fps -35%
Acemagic Tank03
Intel Core i9-12900H, NVIDIA GeForce RTX 3080 Laptop GPU
32 (25.4min, 26.5P0.1, 27.6P1) fps -36%
GTA V
1920x1080 High/On (Advanced Graphics Off) AA:2xMSAA + FX AF:8x
Minisforum G7 PT
AMD Ryzen 9 7945HX, AMD Radeon RX 7600M XT
184.9 (3.43min, 142.9P1) fps +5%
Lenovo Legion 9 16IRX9, RTX 4090
Intel Core i9-14900HX, NVIDIA GeForce RTX 4090 Laptop GPU
183.3 (2.24min, 125P1) fps +4%
Beelink GTI12 Ultra EX Docking Station
Intel Core i9-12900H, NVIDIA GeForce RTX 3070
176.5 (3.17min, 111.1P1) fps
Maingear ML-16 MK2
Intel Core Ultra 7 155H, NVIDIA GeForce RTX 4070 Laptop GPU
175 (2.95min, 111.1P1) fps -1%
Acemagic M2A
Intel Core i9-12900H, NVIDIA GeForce RTX 3080 Laptop GPU
174.7 (3.63min, 125P1) fps -1%
Acemagic Tank03
Intel Core i9-12900H, NVIDIA GeForce RTX 3080 Laptop GPU
172.2 (4.06min, 111.1P1) fps -2%
MSI GeForce RTX 3070 Ventus 3X
AMD Ryzen 9 5900X, NVIDIA GeForce RTX 3070
170 (3.14min, 100P1) fps -4%
Asus TUF Gaming A14 FA401WV-WB94
AMD Ryzen AI 9 HX 370, NVIDIA GeForce RTX 4060 Laptop GPU
168.6 (3.88min, 100P1) fps -4%
Media NVIDIA GeForce RTX 3070
  (157 - 177.7, n=5)
168.4 fps -5%
Asus ROG NUC 14-90AS0051
Intel Core Ultra 9 185H, NVIDIA GeForce RTX 4070 Laptop GPU
167 (3.83min, 100P1) fps -5%
Lenovo IdeaPad Pro 5 16IMH G9 RTX 4050
Intel Core Ultra 9 185H, NVIDIA GeForce RTX 4050 Laptop GPU
166.9 (3.32min, 111.1P1) fps -5%
1920x1080 Highest Settings possible AA:4xMSAA + FX AF:16x
Lenovo Legion 9 16IRX9, RTX 4090
Intel Core i9-14900HX, NVIDIA GeForce RTX 4090 Laptop GPU
136.2 (0.938min, 111.1P1) fps +22%
Maingear ML-16 MK2
Intel Core Ultra 7 155H, NVIDIA GeForce RTX 4070 Laptop GPU
115.1 (3.8min, 71.4P1) fps +3%
Acemagic M2A
Intel Core i9-12900H, NVIDIA GeForce RTX 3080 Laptop GPU
114.6 (4.49min, 83.3P1) fps +3%
Beelink GTI12 Ultra EX Docking Station
Intel Core i9-12900H, NVIDIA GeForce RTX 3070
111.3 (4.01min, 71.4P1) fps
Acemagic Tank03
Intel Core i9-12900H, NVIDIA GeForce RTX 3080 Laptop GPU
111.1 (21.2min, 76.9P1) fps 0%
Asus TUF Gaming A14 FA401WV-WB94
AMD Ryzen AI 9 HX 370, NVIDIA GeForce RTX 4060 Laptop GPU
110.8 (3.47min, 71.4P1) fps 0%
MSI GeForce RTX 3070 Ventus 3X
AMD Ryzen 9 5900X, NVIDIA GeForce RTX 3070
108 (4.47min, 71.4P1) fps -3%
Media NVIDIA GeForce RTX 3070
  (91.1 - 122.4, n=5)
105.7 fps -5%
Asus ROG NUC 14-90AS0051
Intel Core Ultra 9 185H, NVIDIA GeForce RTX 4070 Laptop GPU
105.6 (5.88min, 71.4P1) fps -5%
Minisforum G7 PT
AMD Ryzen 9 7945HX, AMD Radeon RX 7600M XT
101.6 (8.59min, 66.7P1) fps -9%
Lenovo IdeaPad Pro 5 16IMH G9 RTX 4050
Intel Core Ultra 9 185H, NVIDIA GeForce RTX 4050 Laptop GPU
98.7 (4.28min, 66.7P1) fps -11%
2560x1440 Highest Settings possible AA:4xMSAA + FX AF:16x
Lenovo Legion 9 16IRX9, RTX 4090
Intel Core i9-14900HX, NVIDIA GeForce RTX 4090 Laptop GPU
138.9 (0.96min, 100P1) fps +28%
Beelink GTI12 Ultra EX Docking Station
Intel Core i9-12900H, NVIDIA GeForce RTX 3070
108.8 (4.36min, 66.7P1) fps
Media NVIDIA GeForce RTX 3070
  (86.5 - 113.1, n=5)
99.7 fps -8%
MSI GeForce RTX 3070 Ventus 3X
AMD Ryzen 9 5900X, NVIDIA GeForce RTX 3070
98.3 (6.76min, 62.5P1) fps -10%
Acemagic M2A
Intel Core i9-12900H, NVIDIA GeForce RTX 3080 Laptop GPU
98.2 (17.3min, 66.7P1) fps -10%
Acemagic Tank03
Intel Core i9-12900H, NVIDIA GeForce RTX 3080 Laptop GPU
96.3 (19.4min, 66.7P1) fps -11%
Maingear ML-16 MK2
Intel Core Ultra 7 155H, NVIDIA GeForce RTX 4070 Laptop GPU
90.6 (4.99min, 55.6P1) fps -17%
Asus ROG NUC 14-90AS0051
Intel Core Ultra 9 185H, NVIDIA GeForce RTX 4070 Laptop GPU
88.3 (15.3min, 55.6P1) fps -19%
Asus TUF Gaming A14 FA401WV-WB94
AMD Ryzen AI 9 HX 370, NVIDIA GeForce RTX 4060 Laptop GPU
85.4 (4.49min, 55.6P1) fps -22%
Minisforum G7 PT
AMD Ryzen 9 7945HX, AMD Radeon RX 7600M XT
71.7 (11.5min, 50P1) fps -34%
3840x2160 High/On (Advanced Graphics Off) AA:FX AF:8x
Beelink GTI12 Ultra EX Docking Station
Intel Core i9-12900H, NVIDIA GeForce RTX 3070
129 (4.65min, 90.9P1) fps
Media NVIDIA GeForce RTX 3070
  (110 - 129, n=5)
118.8 fps -8%
MSI GeForce RTX 3070 Ventus 3X
AMD Ryzen 9 5900X, NVIDIA GeForce RTX 3070
117 (9.24min, 76.9P1) fps -9%
Acemagic Tank03
Intel Core i9-12900H, NVIDIA GeForce RTX 3080 Laptop GPU
98.2 (28.3min, 71.4P1) fps -24%
Acemagic M2A
Intel Core i9-12900H, NVIDIA GeForce RTX 3080 Laptop GPU
98 (28.9min, 66.7P1) fps -24%
Lenovo Legion 9 16IRX9, RTX 4090
Intel Core i9-14900HX, NVIDIA GeForce RTX 4090 Laptop GPU
95 (0.921min, 90.9P1) fps -26%
Asus ROG NUC 14-90AS0051
Intel Core Ultra 9 185H, NVIDIA GeForce RTX 4070 Laptop GPU
90.4 (8.8min, 62.5P1) fps -30%
Minisforum G7 PT
AMD Ryzen 9 7945HX, AMD Radeon RX 7600M XT
77 (13.3min, 55.6P1) fps -40%
3840x2160 Highest Settings possible AA:4xMSAA + FX AF:16x
Lenovo Legion 9 16IRX9, RTX 4090
Intel Core i9-14900HX, NVIDIA GeForce RTX 4090 Laptop GPU
82.7 (0.919min, 55.6P1) fps +27%
Beelink GTI12 Ultra EX Docking Station
Intel Core i9-12900H, NVIDIA GeForce RTX 3070
65.2 (4.21min, 45.5P1) fps
Media NVIDIA GeForce RTX 3070
  (57.3 - 65.2, n=5)
60.3 fps -8%
MSI GeForce RTX 3070 Ventus 3X
AMD Ryzen 9 5900X, NVIDIA GeForce RTX 3070
58.7 (4.61min, 40P1) fps -10%
Acemagic Tank03
Intel Core i9-12900H, NVIDIA GeForce RTX 3080 Laptop GPU
52.7 (10.7min, 38.5P1) fps -19%
Acemagic M2A
Intel Core i9-12900H, NVIDIA GeForce RTX 3080 Laptop GPU
52.3 (30.9min, 37P1) fps -20%
Asus ROG NUC 14-90AS0051
Intel Core Ultra 9 185H, NVIDIA GeForce RTX 4070 Laptop GPU
40.6 (4.57min, 27.8P1) fps -38%
Minisforum G7 PT
AMD Ryzen 9 7945HX, AMD Radeon RX 7600M XT
32.4 (1.948min, 23.8P1) fps -50%
Dota 2 Reborn
1920x1080 ultra (3/3) best looking
Lenovo Legion 9 16IRX9, RTX 4090
Intel Core i9-14900HX, NVIDIA GeForce RTX 4090 Laptop GPU
164.5 (136min) fps +10%
Minisforum G7 PT
AMD Ryzen 9 7945HX, AMD Radeon RX 7600M XT
158.1 (137.1min) fps +6%
Beelink GTI12 Ultra EX Docking Station
Intel Core i9-12900H, NVIDIA GeForce RTX 3070
149.3 (128.8min) fps
Acemagic M2A
Intel Core i9-12900H, NVIDIA GeForce RTX 3080 Laptop GPU
141.2 (123.4min) fps -5%
Maingear ML-16 MK2
Intel Core Ultra 7 155H, NVIDIA GeForce RTX 4070 Laptop GPU
139.2 (117.8min) fps -7%
Acemagic Tank03
Intel Core i9-12900H, NVIDIA GeForce RTX 3080 Laptop GPU
138.7 (120.5min) fps -7%
Lenovo IdeaPad Pro 5 16IMH G9 RTX 4050
Intel Core Ultra 9 185H, NVIDIA GeForce RTX 4050 Laptop GPU
137.4 (115.6min) fps -8%
MSI GeForce RTX 3070 Ventus 3X
AMD Ryzen 9 5900X, NVIDIA GeForce RTX 3070
136.3 (108.9min) fps -9%
Asus TUF Gaming A14 FA401WV-WB94
AMD Ryzen AI 9 HX 370, NVIDIA GeForce RTX 4060 Laptop GPU
135 (117.6min) fps -10%
Asus ROG NUC 14-90AS0051
Intel Core Ultra 9 185H, NVIDIA GeForce RTX 4070 Laptop GPU
133.9 (116.1min) fps -10%
Media NVIDIA GeForce RTX 3070
  (92.1 - 149.3, n=7)
123.5 fps -17%
3840x2160 ultra (3/3) best looking
Lenovo Legion 9 16IRX9, RTX 4090
Intel Core i9-14900HX, NVIDIA GeForce RTX 4090 Laptop GPU
160.8 (130.4min) fps +11%
Beelink GTI12 Ultra EX Docking Station
Intel Core i9-12900H, NVIDIA GeForce RTX 3070
144.3 (123min) fps
Asus ROG NUC 14-90AS0051
Intel Core Ultra 9 185H, NVIDIA GeForce RTX 4070 Laptop GPU
133.5 (106.1min) fps -7%
Media NVIDIA GeForce RTX 3070
  (122.7 - 144.3, n=5)
129.3 fps -10%
MSI GeForce RTX 3070 Ventus 3X
AMD Ryzen 9 5900X, NVIDIA GeForce RTX 3070
128.5 (102.9min) fps -11%
Acemagic M2A
Intel Core i9-12900H, NVIDIA GeForce RTX 3080 Laptop GPU
120.4 (104.7min) fps -17%
Acemagic Tank03
Intel Core i9-12900H, NVIDIA GeForce RTX 3080 Laptop GPU
117.1 (101.8min) fps -19%
Minisforum G7 PT
AMD Ryzen 9 7945HX, AMD Radeon RX 7600M XT
102.1 (91.9min) fps -29%
Final Fantasy XV Benchmark
1920x1080 High Quality
Lenovo Legion 9 16IRX9, RTX 4090
Intel Core i9-14900HX, NVIDIA GeForce RTX 4090 Laptop GPU
165.1 fps +19%
Beelink GTI12 Ultra EX Docking Station
Intel Core i9-12900H, NVIDIA GeForce RTX 3070
138.7 fps
Media NVIDIA GeForce RTX 3070
  (112 - 138.7, n=5)
123.5 fps -11%
MSI GeForce RTX 3070 Ventus 3X
AMD Ryzen 9 5900X, NVIDIA GeForce RTX 3070
122 fps -12%
Maingear ML-16 MK2
Intel Core Ultra 7 155H, NVIDIA GeForce RTX 4070 Laptop GPU
110.6 fps -20%
Acemagic Tank03
Intel Core i9-12900H, NVIDIA GeForce RTX 3080 Laptop GPU
107.1 fps -23%
Acemagic M2A
Intel Core i9-12900H, NVIDIA GeForce RTX 3080 Laptop GPU
106.6 fps -23%
Asus TUF Gaming A14 FA401WV-WB94
AMD Ryzen AI 9 HX 370, NVIDIA GeForce RTX 4060 Laptop GPU
100.6 fps -27%
Minisforum G7 PT
AMD Ryzen 9 7945HX, AMD Radeon RX 7600M XT
99.8 fps -28%
Lenovo IdeaPad Pro 5 16IMH G9 RTX 4050
Intel Core Ultra 9 185H, NVIDIA GeForce RTX 4050 Laptop GPU
87.8 fps -37%
2560x1440 High Quality
Lenovo Legion 9 16IRX9, RTX 4090
Intel Core i9-14900HX, NVIDIA GeForce RTX 4090 Laptop GPU
142 fps +35%
Beelink GTI12 Ultra EX Docking Station
Intel Core i9-12900H, NVIDIA GeForce RTX 3070
104.9 fps
Media NVIDIA GeForce RTX 3070
  (89.2 - 104.9, n=5)
96.3 fps -8%
MSI GeForce RTX 3070 Ventus 3X
AMD Ryzen 9 5900X, NVIDIA GeForce RTX 3070
94.1 fps -10%
Maingear ML-16 MK2
Intel Core Ultra 7 155H, NVIDIA GeForce RTX 4070 Laptop GPU
80 fps -24%
Acemagic Tank03
Intel Core i9-12900H, NVIDIA GeForce RTX 3080 Laptop GPU
79.7 fps -24%
Acemagic M2A
Intel Core i9-12900H, NVIDIA GeForce RTX 3080 Laptop GPU
79.2 fps -24%
Asus TUF Gaming A14 FA401WV-WB94
AMD Ryzen AI 9 HX 370, NVIDIA GeForce RTX 4060 Laptop GPU
74.5 fps -29%
Minisforum G7 PT
AMD Ryzen 9 7945HX, AMD Radeon RX 7600M XT
71.2 fps -32%
3840x2160 High Quality
Beelink GTI12 Ultra EX Docking Station
Intel Core i9-12900H, NVIDIA GeForce RTX 3070
61.5 fps
Media NVIDIA GeForce RTX 3070
  (54.8 - 61.5, n=5)
57.8 fps -6%
MSI GeForce RTX 3070 Ventus 3X
AMD Ryzen 9 5900X, NVIDIA GeForce RTX 3070
57.6 fps -6%
Acemagic M2A
Intel Core i9-12900H, NVIDIA GeForce RTX 3080 Laptop GPU
45.2 fps -27%
Acemagic Tank03
Intel Core i9-12900H, NVIDIA GeForce RTX 3080 Laptop GPU
45 fps -27%
Minisforum G7 PT
AMD Ryzen 9 7945HX, AMD Radeon RX 7600M XT
38.4 fps -38%
X-Plane 11.11
1920x1080 med (fps_test=2)
Lenovo Legion 9 16IRX9, RTX 4090
Intel Core i9-14900HX, NVIDIA GeForce RTX 4090 Laptop GPU
166.3 fps +57%
Acemagic M2A
Intel Core i9-12900H, NVIDIA GeForce RTX 3080 Laptop GPU
129.6 fps +22%
Acemagic Tank03
Intel Core i9-12900H, NVIDIA GeForce RTX 3080 Laptop GPU
128.9 fps +21%
Maingear ML-16 MK2
Intel Core Ultra 7 155H, NVIDIA GeForce RTX 4070 Laptop GPU
124.4 fps +17%
MSI GeForce RTX 3070 Ventus 3X
AMD Ryzen 9 5900X, NVIDIA GeForce RTX 3070
123 fps +16%
Lenovo IdeaPad Pro 5 16IMH G9 RTX 4050
Intel Core Ultra 9 185H, NVIDIA GeForce RTX 4050 Laptop GPU
114.1 fps +8%
Asus ROG NUC 14-90AS0051
Intel Core Ultra 9 185H, NVIDIA GeForce RTX 4070 Laptop GPU
112.6 fps +6%
Minisforum G7 PT
AMD Ryzen 9 7945HX, AMD Radeon RX 7600M XT
112.5 fps +6%
Media NVIDIA GeForce RTX 3070
  (55.4 - 137.4, n=7)
107.8 fps +2%
Beelink GTI12 Ultra EX Docking Station
Intel Core i9-12900H, NVIDIA GeForce RTX 3070
106.1 fps
Asus TUF Gaming A14 FA401WV-WB94
AMD Ryzen AI 9 HX 370, NVIDIA GeForce RTX 4060 Laptop GPU
81.8 fps -23%
1920x1080 high (fps_test=3)
Lenovo Legion 9 16IRX9, RTX 4090
Intel Core i9-14900HX, NVIDIA GeForce RTX 4090 Laptop GPU
125.6 fps +40%
Acemagic M2A
Intel Core i9-12900H, NVIDIA GeForce RTX 3080 Laptop GPU
109.3 fps +22%
Acemagic Tank03
Intel Core i9-12900H, NVIDIA GeForce RTX 3080 Laptop GPU
102.3 fps +14%
MSI GeForce RTX 3070 Ventus 3X
AMD Ryzen 9 5900X, NVIDIA GeForce RTX 3070
95.4 fps +7%
Maingear ML-16 MK2
Intel Core Ultra 7 155H, NVIDIA GeForce RTX 4070 Laptop GPU
89.8 fps 0%
Beelink GTI12 Ultra EX Docking Station
Intel Core i9-12900H, NVIDIA GeForce RTX 3070
89.5 fps
Minisforum G7 PT
AMD Ryzen 9 7945HX, AMD Radeon RX 7600M XT
89.2 fps 0%
Media NVIDIA GeForce RTX 3070
  (53.7 - 111.3, n=7)
89.2 fps 0%
Lenovo IdeaPad Pro 5 16IMH G9 RTX 4050
Intel Core Ultra 9 185H, NVIDIA GeForce RTX 4050 Laptop GPU
89 fps -1%
Asus ROG NUC 14-90AS0051
Intel Core Ultra 9 185H, NVIDIA GeForce RTX 4070 Laptop GPU
84.8 fps -5%
Asus TUF Gaming A14 FA401WV-WB94
AMD Ryzen AI 9 HX 370, NVIDIA GeForce RTX 4060 Laptop GPU
67.3 fps -25%
3840x2160 high (fps_test=3)
Lenovo Legion 9 16IRX9, RTX 4090
Intel Core i9-14900HX, NVIDIA GeForce RTX 4090 Laptop GPU
109.6 fps +38%
Acemagic M2A
Intel Core i9-12900H, NVIDIA GeForce RTX 3080 Laptop GPU
88.6 fps +12%
Acemagic Tank03
Intel Core i9-12900H, NVIDIA GeForce RTX 3080 Laptop GPU
88 fps +11%
Media NVIDIA GeForce RTX 3070
  (78.8 - 98.4, n=5)
84.4 fps +6%
MSI GeForce RTX 3070 Ventus 3X
AMD Ryzen 9 5900X, NVIDIA GeForce RTX 3070
84.3 fps +6%
Beelink GTI12 Ultra EX Docking Station
Intel Core i9-12900H, NVIDIA GeForce RTX 3070
79.4 fps
Asus ROG NUC 14-90AS0051
Intel Core Ultra 9 185H, NVIDIA GeForce RTX 4070 Laptop GPU
73 fps -8%
Minisforum G7 PT
AMD Ryzen 9 7945HX, AMD Radeon RX 7600M XT
58.4 fps -26%
Far Cry 5
1920x1080 High Preset AA:T
Lenovo Legion 9 16IRX9, RTX 4090
Intel Core i9-14900HX, NVIDIA GeForce RTX 4090 Laptop GPU
166 fps +12%
MSI GeForce RTX 3070 Ventus 3X
AMD Ryzen 9 5900X, NVIDIA GeForce RTX 3070
154 (124min) fps +4%
Minisforum G7 PT
AMD Ryzen 9 7945HX, AMD Radeon RX 7600M XT
151 (124min) fps +2%
Beelink GTI12 Ultra EX Docking Station
Intel Core i9-12900H, NVIDIA GeForce RTX 3070
148 (117min) fps
Media NVIDIA GeForce RTX 3070
  (126 - 154, n=5)
142.4 fps -4%
Acemagic M2A
Intel Core i9-12900H, NVIDIA GeForce RTX 3080 Laptop GPU
137 (111min) fps -7%
Acemagic Tank03
Intel Core i9-12900H, NVIDIA GeForce RTX 3080 Laptop GPU
135 (109min) fps -9%
Maingear ML-16 MK2
Intel Core Ultra 7 155H, NVIDIA GeForce RTX 4070 Laptop GPU
125 (95min) fps -16%
Asus ROG NUC 14-90AS0051
Intel Core Ultra 9 185H, NVIDIA GeForce RTX 4070 Laptop GPU
124 (95min) fps -16%
Asus TUF Gaming A14 FA401WV-WB94
AMD Ryzen AI 9 HX 370, NVIDIA GeForce RTX 4060 Laptop GPU
121 (91min) fps -18%
Lenovo IdeaPad Pro 5 16IMH G9 RTX 4050
Intel Core Ultra 9 185H, NVIDIA GeForce RTX 4050 Laptop GPU
120 (96min) fps -19%
1920x1080 Ultra Preset AA:T
Lenovo Legion 9 16IRX9, RTX 4090
Intel Core i9-14900HX, NVIDIA GeForce RTX 4090 Laptop GPU
155 fps +9%
MSI GeForce RTX 3070 Ventus 3X
AMD Ryzen 9 5900X, NVIDIA GeForce RTX 3070
143 (108min) fps +1%
Beelink GTI12 Ultra EX Docking Station
Intel Core i9-12900H, NVIDIA GeForce RTX 3070
142 (106min) fps
Minisforum G7 PT
AMD Ryzen 9 7945HX, AMD Radeon RX 7600M XT
140 (111min) fps -1%
Media NVIDIA GeForce RTX 3070
  (117 - 143, n=5)
134 fps -6%
Acemagic M2A
Intel Core i9-12900H, NVIDIA GeForce RTX 3080 Laptop GPU
129 (100min) fps -9%
Acemagic Tank03
Intel Core i9-12900H, NVIDIA GeForce RTX 3080 Laptop GPU
126 (97min) fps -11%
Asus ROG NUC 14-90AS0051
Intel Core Ultra 9 185H, NVIDIA GeForce RTX 4070 Laptop GPU
114 (88min) fps -20%
Asus TUF Gaming A14 FA401WV-WB94
AMD Ryzen AI 9 HX 370, NVIDIA GeForce RTX 4060 Laptop GPU
114 (78min) fps -20%
Maingear ML-16 MK2
Intel Core Ultra 7 155H, NVIDIA GeForce RTX 4070 Laptop GPU
114 (87min) fps -20%
Lenovo IdeaPad Pro 5 16IMH G9 RTX 4050
Intel Core Ultra 9 185H, NVIDIA GeForce RTX 4050 Laptop GPU
113 (86min) fps -20%
2560x1440 Ultra Preset AA:T
Lenovo Legion 9 16IRX9, RTX 4090
Intel Core i9-14900HX, NVIDIA GeForce RTX 4090 Laptop GPU
146 fps +12%
Beelink GTI12 Ultra EX Docking Station
Intel Core i9-12900H, NVIDIA GeForce RTX 3070
130 (110min) fps
MSI GeForce RTX 3070 Ventus 3X
AMD Ryzen 9 5900X, NVIDIA GeForce RTX 3070
125 (105min) fps -4%
Media NVIDIA GeForce RTX 3070
  (112 - 130, n=5)
121 fps -7%
Asus ROG NUC 14-90AS0051
Intel Core Ultra 9 185H, NVIDIA GeForce RTX 4070 Laptop GPU
111 (90min) fps -15%
Minisforum G7 PT
AMD Ryzen 9 7945HX, AMD Radeon RX 7600M XT
108 (94min) fps -17%
Acemagic Tank03
Intel Core i9-12900H, NVIDIA GeForce RTX 3080 Laptop GPU
104 (94min) fps -20%
Acemagic M2A
Intel Core i9-12900H, NVIDIA GeForce RTX 3080 Laptop GPU
104 (95min) fps -20%
Maingear ML-16 MK2
Intel Core Ultra 7 155H, NVIDIA GeForce RTX 4070 Laptop GPU
101 (82min) fps -22%
Asus TUF Gaming A14 FA401WV-WB94
AMD Ryzen AI 9 HX 370, NVIDIA GeForce RTX 4060 Laptop GPU
93 (77min) fps -28%
3840x2160 Ultra Preset AA:T
Lenovo Legion 9 16IRX9, RTX 4090
Intel Core i9-14900HX, NVIDIA GeForce RTX 4090 Laptop GPU
104 fps +39%
Beelink GTI12 Ultra EX Docking Station
Intel Core i9-12900H, NVIDIA GeForce RTX 3070
75 (68min) fps
Media NVIDIA GeForce RTX 3070
  (69 - 75, n=5)
71.2 fps -5%
MSI GeForce RTX 3070 Ventus 3X
AMD Ryzen 9 5900X, NVIDIA GeForce RTX 3070
70 (63min) fps -7%
Asus ROG NUC 14-90AS0051
Intel Core Ultra 9 185H, NVIDIA GeForce RTX 4070 Laptop GPU
59 (53min) fps -21%
Acemagic M2A
Intel Core i9-12900H, NVIDIA GeForce RTX 3080 Laptop GPU
55 (49min) fps -27%
Acemagic Tank03
Intel Core i9-12900H, NVIDIA GeForce RTX 3080 Laptop GPU
54 (49min) fps -28%
Minisforum G7 PT
AMD Ryzen 9 7945HX, AMD Radeon RX 7600M XT
54 (46min) fps -28%
Strange Brigade
1920x1080 high AA:high AF:8
Lenovo Legion 9 16IRX9, RTX 4090
Intel Core i9-14900HX, NVIDIA GeForce RTX 4090 Laptop GPU
387 (5min, 302P1) fps +38%
Beelink GTI12 Ultra EX Docking Station
Intel Core i9-12900H, NVIDIA GeForce RTX 3070
280 (147.8min, 207P1) fps
Media NVIDIA GeForce RTX 3070
  (251 - 280, n=5)
262 fps -6%
MSI GeForce RTX 3070 Ventus 3X
AMD Ryzen 9 5900X, NVIDIA GeForce RTX 3070
251 (118min, 188P1) fps -10%
Asus ROG NUC 14-90AS0051
Intel Core Ultra 9 185H, NVIDIA GeForce RTX 4070 Laptop GPU
244 (76.1min, 178.7P1) fps -13%
Maingear ML-16 MK2
Intel Core Ultra 7 155H, NVIDIA GeForce RTX 4070 Laptop GPU
224 (160.9min, 169.3P1) fps -20%
Minisforum G7 PT
AMD Ryzen 9 7945HX, AMD Radeon RX 7600M XT
222 (139.8min, 160.9P1) fps -21%
Asus TUF Gaming A14 FA401WV-WB94
AMD Ryzen AI 9 HX 370, NVIDIA GeForce RTX 4060 Laptop GPU
222 (103.9min, 154P1) fps -21%
Acemagic Tank03
Intel Core i9-12900H, NVIDIA GeForce RTX 3080 Laptop GPU
213 (87.7min, 159.3P1) fps -24%
Acemagic M2A
Intel Core i9-12900H, NVIDIA GeForce RTX 3080 Laptop GPU
212 (146.5min, 158.2P1) fps -24%
Lenovo IdeaPad Pro 5 16IMH G9 RTX 4050
Intel Core Ultra 9 185H, NVIDIA GeForce RTX 4050 Laptop GPU
172.9 (26.9min, 134.6P1) fps -38%
1920x1080 ultra AA:ultra AF:16
Lenovo Legion 9 16IRX9, RTX 4090
Intel Core i9-14900HX, NVIDIA GeForce RTX 4090 Laptop GPU
369 (5min, 269P1) fps +51%
Beelink GTI12 Ultra EX Docking Station
Intel Core i9-12900H, NVIDIA GeForce RTX 3070
245 (132.6min, 183P1) fps
Media NVIDIA GeForce RTX 3070
  (222 - 245, n=5)
229 fps -7%
MSI GeForce RTX 3070 Ventus 3X
AMD Ryzen 9 5900X, NVIDIA GeForce RTX 3070
222 (106min, 167P1) fps -9%
Asus ROG NUC 14-90AS0051
Intel Core Ultra 9 185H, NVIDIA GeForce RTX 4070 Laptop GPU
207 (49.1min, 154.5P1) fps -16%
Asus TUF Gaming A14 FA401WV-WB94
AMD Ryzen AI 9 HX 370, NVIDIA GeForce RTX 4060 Laptop GPU
193.5 (45.4min, 142.5P1) fps -21%
Maingear ML-16 MK2
Intel Core Ultra 7 155H, NVIDIA GeForce RTX 4070 Laptop GPU
192.8 (84.3min, 146.7P1) fps -21%
Minisforum G7 PT
AMD Ryzen 9 7945HX, AMD Radeon RX 7600M XT
191.4 (106.1min, 138.9P1) fps -22%
Acemagic Tank03
Intel Core i9-12900H, NVIDIA GeForce RTX 3080 Laptop GPU
186.1 (120.7min, 141.6P1) fps -24%
Acemagic M2A
Intel Core i9-12900H, NVIDIA GeForce RTX 3080 Laptop GPU
184.6 (126.5min, 139.5P1) fps -25%
Lenovo IdeaPad Pro 5 16IMH G9 RTX 4050
Intel Core Ultra 9 185H, NVIDIA GeForce RTX 4050 Laptop GPU
149.4 (44.5min, 115.4P1) fps -39%
2560x1440 ultra AA:ultra AF:16
Lenovo Legion 9 16IRX9, RTX 4090
Intel Core i9-14900HX, NVIDIA GeForce RTX 4090 Laptop GPU
290 (38.6min, 219P1) fps +60%
Beelink GTI12 Ultra EX Docking Station
Intel Core i9-12900H, NVIDIA GeForce RTX 3070
181.1 (118.2min, 146.2P1) fps
Media NVIDIA GeForce RTX 3070
  (165 - 181.1, n=5)
170.3 fps -6%
MSI GeForce RTX 3070 Ventus 3X
AMD Ryzen 9 5900X, NVIDIA GeForce RTX 3070
166 (92.5min, 133P1) fps -8%
Acemagic M2A
Intel Core i9-12900H, NVIDIA GeForce RTX 3080 Laptop GPU
137 (99.5min, 109.8P1) fps -24%
Acemagic Tank03
Intel Core i9-12900H, NVIDIA GeForce RTX 3080 Laptop GPU
136.7 (95.7min, 110.3P1) fps -25%
Asus ROG NUC 14-90AS0051
Intel Core Ultra 9 185H, NVIDIA GeForce RTX 4070 Laptop GPU
136.6 (16.1min, 113P1) fps -25%
Asus TUF Gaming A14 FA401WV-WB94
AMD Ryzen AI 9 HX 370, NVIDIA GeForce RTX 4060 Laptop GPU
130.3 (86.5min, 105.6P1) fps -28%
Maingear ML-16 MK2
Intel Core Ultra 7 155H, NVIDIA GeForce RTX 4070 Laptop GPU
127.9 (103.7min, 105.8P1) fps -29%
Minisforum G7 PT
AMD Ryzen 9 7945HX, AMD Radeon RX 7600M XT
124.4 (36.9min, 100.9P1) fps -31%
3840x2160 ultra AA:ultra AF:16
Beelink GTI12 Ultra EX Docking Station
Intel Core i9-12900H, NVIDIA GeForce RTX 3070
104.6 (24.7min, 91.4P1) fps
Media NVIDIA GeForce RTX 3070
  (96.8 - 104.6, n=5)
99 fps -5%
MSI GeForce RTX 3070 Ventus 3X
AMD Ryzen 9 5900X, NVIDIA GeForce RTX 3070
96.8 (66.9min, 82.6P1) fps -7%
Acemagic Tank03
Intel Core i9-12900H, NVIDIA GeForce RTX 3080 Laptop GPU
80.5 (62.2min, 68.8P1) fps -23%
Acemagic M2A
Intel Core i9-12900H, NVIDIA GeForce RTX 3080 Laptop GPU
80.5 (65.1min, 70.1P1) fps -23%
Asus ROG NUC 14-90AS0051
Intel Core Ultra 9 185H, NVIDIA GeForce RTX 4070 Laptop GPU
71.6 (16.2min, 61P1) fps -32%
Minisforum G7 PT
AMD Ryzen 9 7945HX, AMD Radeon RX 7600M XT
66.6 (28.8min, 58.4P1) fps -36%
Tiny Tina's Wonderlands
1920x1080 High Preset (DX12)
Beelink GTI12 Ultra EX Docking Station
Intel Core i9-12900H, NVIDIA GeForce RTX 3070
154.9 fps
Media NVIDIA GeForce RTX 3070
  (145.8 - 155, n=3)
151.9 fps -2%
Asus ROG NUC 14-90AS0051
Intel Core Ultra 9 185H, NVIDIA GeForce RTX 4070 Laptop GPU
132.6 fps -14%
Minisforum G7 PT
AMD Ryzen 9 7945HX, AMD Radeon RX 7600M XT
123 fps -21%
Maingear ML-16 MK2
Intel Core Ultra 7 155H, NVIDIA GeForce RTX 4070 Laptop GPU
119.4 fps -23%
Acemagic M2A
Intel Core i9-12900H, NVIDIA GeForce RTX 3080 Laptop GPU
114 fps -26%
Acemagic Tank03
Intel Core i9-12900H, NVIDIA GeForce RTX 3080 Laptop GPU
113.2 fps -27%
Asus TUF Gaming A14 FA401WV-WB94
AMD Ryzen AI 9 HX 370, NVIDIA GeForce RTX 4060 Laptop GPU
110.6 fps -29%
Lenovo IdeaPad Pro 5 16IMH G9 RTX 4050
Intel Core Ultra 9 185H, NVIDIA GeForce RTX 4050 Laptop GPU
96 fps -38%
1920x1080 Badass Preset (DX12)
Beelink GTI12 Ultra EX Docking Station
Intel Core i9-12900H, NVIDIA GeForce RTX 3070
122.6 fps
Media NVIDIA GeForce RTX 3070
  (113.9 - 122.6, n=3)
119.2 fps -3%
Asus ROG NUC 14-90AS0051
Intel Core Ultra 9 185H, NVIDIA GeForce RTX 4070 Laptop GPU
102.7 fps -16%
Minisforum G7 PT
AMD Ryzen 9 7945HX, AMD Radeon RX 7600M XT
94.5 fps -23%
Maingear ML-16 MK2
Intel Core Ultra 7 155H, NVIDIA GeForce RTX 4070 Laptop GPU
92.9 fps -24%
Acemagic M2A
Intel Core i9-12900H, NVIDIA GeForce RTX 3080 Laptop GPU
88.8 fps -28%
Acemagic Tank03
Intel Core i9-12900H, NVIDIA GeForce RTX 3080 Laptop GPU
88.3 fps -28%
Asus TUF Gaming A14 FA401WV-WB94
AMD Ryzen AI 9 HX 370, NVIDIA GeForce RTX 4060 Laptop GPU
86.1 fps -30%
Lenovo IdeaPad Pro 5 16IMH G9 RTX 4050
Intel Core Ultra 9 185H, NVIDIA GeForce RTX 4050 Laptop GPU
74 fps -40%
2560x1440 Badass Preset (DX12)
Beelink GTI12 Ultra EX Docking Station
Intel Core i9-12900H, NVIDIA GeForce RTX 3070
87.1 fps
Media NVIDIA GeForce RTX 3070
  (80.7 - 87.1, n=3)
84.3 fps -3%
Asus ROG NUC 14-90AS0051
Intel Core Ultra 9 185H, NVIDIA GeForce RTX 4070 Laptop GPU
71.2 fps -18%
Acemagic Tank03
Intel Core i9-12900H, NVIDIA GeForce RTX 3080 Laptop GPU
62.9 fps -28%
Maingear ML-16 MK2
Intel Core Ultra 7 155H, NVIDIA GeForce RTX 4070 Laptop GPU
62.7 fps -28%
Minisforum G7 PT
AMD Ryzen 9 7945HX, AMD Radeon RX 7600M XT
62.6 fps -28%
Acemagic M2A
Intel Core i9-12900H, NVIDIA GeForce RTX 3080 Laptop GPU
62.5 fps -28%
Asus TUF Gaming A14 FA401WV-WB94
AMD Ryzen AI 9 HX 370, NVIDIA GeForce RTX 4060 Laptop GPU
58.9 fps -32%
3840x2160 Badass Preset (DX12)
Beelink GTI12 Ultra EX Docking Station
Intel Core i9-12900H, NVIDIA GeForce RTX 3070
48.9 fps
Media NVIDIA GeForce RTX 3070
  (44.4 - 48.9, n=3)
46.6 fps -5%
Acemagic Tank03
Intel Core i9-12900H, NVIDIA GeForce RTX 3080 Laptop GPU
34 fps -30%
Acemagic M2A
Intel Core i9-12900H, NVIDIA GeForce RTX 3080 Laptop GPU
33.8 fps -31%
Asus ROG NUC 14-90AS0051
Intel Core Ultra 9 185H, NVIDIA GeForce RTX 4070 Laptop GPU
33.8 fps -31%
Minisforum G7 PT
AMD Ryzen 9 7945HX, AMD Radeon RX 7600M XT
23 fps -53%
F1 22
1920x1080 High Preset AA:T AF:16x
Beelink GTI12 Ultra EX Docking Station
Intel Core i9-12900H, NVIDIA GeForce RTX 3070
264 (208min, 155P1) fps
Media NVIDIA GeForce RTX 3070
  (228 - 264, n=2)
246 fps -7%
Minisforum G7 PT
AMD Ryzen 9 7945HX, AMD Radeon RX 7600M XT
231 (186min, 157P1) fps -12%
Maingear ML-16 MK2
Intel Core Ultra 7 155H, NVIDIA GeForce RTX 4070 Laptop GPU
206 (165min, 130P1) fps -22%
Asus ROG NUC 14-90AS0051
Intel Core Ultra 9 185H, NVIDIA GeForce RTX 4070 Laptop GPU
196.3 (147min, 107P1) fps -26%
Acemagic M2A
Intel Core i9-12900H, NVIDIA GeForce RTX 3080 Laptop GPU
195.5 (162min, 122P1) fps -26%
Acemagic Tank03
Intel Core i9-12900H, NVIDIA GeForce RTX 3080 Laptop GPU
195.4 (166min, 117P1) fps -26%
Asus TUF Gaming A14 FA401WV-WB94
AMD Ryzen AI 9 HX 370, NVIDIA GeForce RTX 4060 Laptop GPU
172.8 (138min, 98P1) fps -35%
Lenovo IdeaPad Pro 5 16IMH G9 RTX 4050
Intel Core Ultra 9 185H, NVIDIA GeForce RTX 4050 Laptop GPU
156.6 (137min, 97P1) fps -41%
1920x1080 Ultra High Preset AA:T AF:16x
Beelink GTI12 Ultra EX Docking Station
Intel Core i9-12900H, NVIDIA GeForce RTX 3070
91.8 (78min, 72P1) fps
Media NVIDIA GeForce RTX 3070
  (81 - 91.8, n=2)
86.4 fps -6%
Asus ROG NUC 14-90AS0051
Intel Core Ultra 9 185H, NVIDIA GeForce RTX 4070 Laptop GPU
77.6 (62min, 58P1) fps -15%
Maingear ML-16 MK2
Intel Core Ultra 7 155H, NVIDIA GeForce RTX 4070 Laptop GPU
69.2 (59min, 58P1) fps -25%
Acemagic Tank03
Intel Core i9-12900H, NVIDIA GeForce RTX 3080 Laptop GPU
65.2 (56min, 53P1) fps -29%
Asus TUF Gaming A14 FA401WV-WB94
AMD Ryzen AI 9 HX 370, NVIDIA GeForce RTX 4060 Laptop GPU
64.6 (50min, 45P1) fps -30%
Acemagic M2A
Intel Core i9-12900H, NVIDIA GeForce RTX 3080 Laptop GPU
64.1 (55min, 52P1) fps -30%
Minisforum G7 PT
AMD Ryzen 9 7945HX, AMD Radeon RX 7600M XT
54.5 (39min, 40P1) fps -41%
Lenovo IdeaPad Pro 5 16IMH G9 RTX 4050
Intel Core Ultra 9 185H, NVIDIA GeForce RTX 4050 Laptop GPU
54.1 (45min, 44P1) fps -41%
2560x1440 Ultra High Preset AA:T AF:16x
Beelink GTI12 Ultra EX Docking Station
Intel Core i9-12900H, NVIDIA GeForce RTX 3070
58.8 (49min, 49P1) fps
Media NVIDIA GeForce RTX 3070
  (52 - 58.8, n=2)
55.4 fps -6%
Asus ROG NUC 14-90AS0051
Intel Core Ultra 9 185H, NVIDIA GeForce RTX 4070 Laptop GPU
50.4 (43min, 42P1) fps -14%
Maingear ML-16 MK2
Intel Core Ultra 7 155H, NVIDIA GeForce RTX 4070 Laptop GPU
42.9 (36min, 35P1) fps -27%
Acemagic Tank03
Intel Core i9-12900H, NVIDIA GeForce RTX 3080 Laptop GPU
42 (36min, 33P1) fps -29%
Asus TUF Gaming A14 FA401WV-WB94
AMD Ryzen AI 9 HX 370, NVIDIA GeForce RTX 4060 Laptop GPU
42 (34min, 34P1) fps -29%
Acemagic M2A
Intel Core i9-12900H, NVIDIA GeForce RTX 3080 Laptop GPU
41.8 (36min, 33P1) fps -29%
Minisforum G7 PT
AMD Ryzen 9 7945HX, AMD Radeon RX 7600M XT
28.8 (16min, 16P1) fps -51%
3840x2160 Ultra High Preset AA:T AF:16x
Beelink GTI12 Ultra EX Docking Station
Intel Core i9-12900H, NVIDIA GeForce RTX 3070
28.8 (24min, 23P1) fps
Media NVIDIA GeForce RTX 3070
  (25 - 28.8, n=2)
26.9 fps -7%
Asus ROG NUC 14-90AS0051
Intel Core Ultra 9 185H, NVIDIA GeForce RTX 4070 Laptop GPU
25 (21min, 20P1) fps -13%
Acemagic Tank03
Intel Core i9-12900H, NVIDIA GeForce RTX 3080 Laptop GPU
20.1 (17min, 16P1) fps -30%
Acemagic M2A
Intel Core i9-12900H, NVIDIA GeForce RTX 3080 Laptop GPU
20 (17min, 16P1) fps -31%
Minisforum G7 PT
AMD Ryzen 9 7945HX, AMD Radeon RX 7600M XT
11.3 (8min, 9P1) fps -61%
Cyberpunk 2077 2.1 Phantom Liberty
1920x1080 High Preset (FSR off)
Media NVIDIA GeForce RTX 3070
  (115.3 - 119, n=2)
117.2 fps +2%
Beelink GTI12 Ultra EX Docking Station
Intel Core i9-12900H, NVIDIA GeForce RTX 3070
115.3 (97.2min) fps
Asus ROG NUC 14-90AS0051
Intel Core Ultra 9 185H, NVIDIA GeForce RTX 4070 Laptop GPU
94.3 (79.6min) fps -18%
Minisforum G7 PT
AMD Ryzen 9 7945HX, AMD Radeon RX 7600M XT
93.3 (79.1min) fps -19%
Maingear ML-16 MK2
Intel Core Ultra 7 155H, NVIDIA GeForce RTX 4070 Laptop GPU
88.1 (75min) fps -24%
Acemagic Tank03
Intel Core i9-12900H, NVIDIA GeForce RTX 3080 Laptop GPU
86.3 (42.4min) fps -25%
Acemagic M2A
Intel Core i9-12900H, NVIDIA GeForce RTX 3080 Laptop GPU
86 (72.9min) fps -25%
Asus TUF Gaming A14 FA401WV-WB94
AMD Ryzen AI 9 HX 370, NVIDIA GeForce RTX 4060 Laptop GPU
85.6 (72.6min) fps -26%
Lenovo IdeaPad Pro 5 16IMH G9 RTX 4050
Intel Core Ultra 9 185H, NVIDIA GeForce RTX 4050 Laptop GPU
69.4 (58.9min) fps -40%
1920x1080 Ultra Preset (FSR off)
Lenovo Legion 9 16IRX9, RTX 4090
Intel Core i9-14900HX, NVIDIA GeForce RTX 4090 Laptop GPU
127 (70.6min) fps +24%
Media NVIDIA GeForce RTX 3070
  (102.2 - 107, n=2)
104.6 fps +2%
Beelink GTI12 Ultra EX Docking Station
Intel Core i9-12900H, NVIDIA GeForce RTX 3070
102.2 (84.9min) fps
Minisforum G7 PT
AMD Ryzen 9 7945HX, AMD Radeon RX 7600M XT
83 (69.1min) fps -19%
Asus ROG NUC 14-90AS0051
Intel Core Ultra 9 185H, NVIDIA GeForce RTX 4070 Laptop GPU
82.5 (68.1min) fps -19%
Maingear ML-16 MK2
Intel Core Ultra 7 155H, NVIDIA GeForce RTX 4070 Laptop GPU
76.4 (63.2min) fps -25%
Acemagic M2A
Intel Core i9-12900H, NVIDIA GeForce RTX 3080 Laptop GPU
74.8 (62.2min) fps -27%
Acemagic Tank03
Intel Core i9-12900H, NVIDIA GeForce RTX 3080 Laptop GPU
74.4 (42.8min) fps -27%
Asus TUF Gaming A14 FA401WV-WB94
AMD Ryzen AI 9 HX 370, NVIDIA GeForce RTX 4060 Laptop GPU
73.3 (60min) fps -28%
Lenovo IdeaPad Pro 5 16IMH G9 RTX 4050
Intel Core Ultra 9 185H, NVIDIA GeForce RTX 4050 Laptop GPU
59.8 (49.3min) fps -41%
2560x1440 Ultra Preset (FSR off)
Lenovo Legion 9 16IRX9, RTX 4090
Intel Core i9-14900HX, NVIDIA GeForce RTX 4090 Laptop GPU
86 (70.4min) fps +31%
Media NVIDIA GeForce RTX 3070
  (65.7 - 71, n=2)
68.4 fps +4%
Beelink GTI12 Ultra EX Docking Station
Intel Core i9-12900H, NVIDIA GeForce RTX 3070
65.7 (56min) fps
Minisforum G7 PT
AMD Ryzen 9 7945HX, AMD Radeon RX 7600M XT
51.3 (44.3min) fps -22%
Asus ROG NUC 14-90AS0051
Intel Core Ultra 9 185H, NVIDIA GeForce RTX 4070 Laptop GPU
49.1 (40.7min) fps -25%
Acemagic M2A
Intel Core i9-12900H, NVIDIA GeForce RTX 3080 Laptop GPU
46.6 (39.7min) fps -29%
Acemagic Tank03
Intel Core i9-12900H, NVIDIA GeForce RTX 3080 Laptop GPU
45.8 (33.4min) fps -30%
Maingear ML-16 MK2
Intel Core Ultra 7 155H, NVIDIA GeForce RTX 4070 Laptop GPU
44.3 (37.2min) fps -33%
Asus TUF Gaming A14 FA401WV-WB94
AMD Ryzen AI 9 HX 370, NVIDIA GeForce RTX 4060 Laptop GPU
43.6 (36.8min) fps -34%
3840x2160 Ultra Preset (FSR off)
Media NVIDIA GeForce RTX 3070
  (29.9 - 34.3, n=2)
32.1 fps +7%
Beelink GTI12 Ultra EX Docking Station
Intel Core i9-12900H, NVIDIA GeForce RTX 3070
29.9 (25min) fps
Asus ROG NUC 14-90AS0051
Intel Core Ultra 9 185H, NVIDIA GeForce RTX 4070 Laptop GPU
21.7 (19.1min) fps -27%
Minisforum G7 PT
AMD Ryzen 9 7945HX, AMD Radeon RX 7600M XT
21 (18.3min) fps -30%
Acemagic Tank03
Intel Core i9-12900H, NVIDIA GeForce RTX 3080 Laptop GPU
20.8 (16.1min) fps -30%
Acemagic M2A
Intel Core i9-12900H, NVIDIA GeForce RTX 3080 Laptop GPU
20.7 (18.3min) fps -31%

Cyberpunk 2077 ultra FPS Chart

05101520253035404550556065707580859095Tooltip
Beelink GTI12 Ultra EX Docking Station i9-12900H, NVIDIA GeForce RTX 3070: Ø94.2 (90.2-95.1)
bassomedioaltoultraQHD4K
GTA V (2015) 184.3 178.9 176.5 111.3 108.8 129
Dota 2 Reborn (2015) 175.9 162 158.5 149.3 144.3
Final Fantasy XV Benchmark (2018) 209 184.8 138.7 104.9 61.5
X-Plane 11.11 (2018) 118.2 106.1 89.5 79.4
Far Cry 5 (2018) 170 154 148 142 130 75
Strange Brigade (2018) 459 339 280 245 181.1 104.6
Tiny Tina's Wonderlands (2022) 268.9 216.7 154.9 122.6 87.1 48.9
F1 22 (2022) 282 277 264 91.8 58.8 28.8
Baldur's Gate 3 (2023) 174.5 152.6 137.1 132.9 93.5 49.7
Cyberpunk 2077 2.1 Phantom Liberty (2023) 148.5 133.9 115.3 102.2 65.7 29.9

Emissioni

Rumore del sistema

Il rumore della ventola è sempre presente, poiché la ventola dell'alimentatore interno nel dock EX è sempre attiva, anche se le ventole del mini PC e della GPU sono inattive. I livelli di rumore sono generalmente più alti rispetto alla maggior parte degli altri mini PC, a parità di distanza di registrazione di 15 cm, ma la curva di rumore è più ampia e non così netta come quella a cui siamo abituati. Le frequenze di dB più basse sono meno invadenti e più tollerabili rispetto alle ventole solitamente più acute e rumorose dei computer portatili da gioco.

Profilo del rumore del ventilatore (Bianco: Sfondo, Rosso: Sistema inattivo, Blu: 3DMark 06, Arancione: Cyberpunk 2077, Verde: Prime95+FurMark stress)

Rumorosità

Idle
32.7 / 32.7 / 35.3 dB(A)
Sotto carico
36.8 / 52.9 dB(A)
  red to green bar
 
 
30 dB
silenzioso
40 dB(A)
udibile
50 dB(A)
rumoroso
 
min: dark, med: mid, max: light   Earthworks M23R, Arta (15 cm di distanza)   Rumorosità ambientale: 22.8 dB(A)
dB(A) 0102030405060708090Deep BassMiddle BassHigh BassLower RangeMidsHigher MidsLower HighsMid HighsUpper HighsSuper Highs2040.228.934.132.142.12539.525.129.721.441.13139.922.223.620.944.54043.120.820.117.443.45041.228.928.12843.7634122.221.617.844.98040.224.626.419.944.910038.125.427.219.841.312537.620.822.415.539.516039.922.32215.142.420040.421.723.513.441.525044.625.225.211.545.231543.625.224.91246.84004626.12411.447.150045.725.722.910.547.163044.73026.49.346.680038.927.724.19.242.2100038.725.220.78.941.6125037.427.723.49.440.9160039.127.822.99.642.8200038.327.119.69.942.525003523.315.310.439.2315028.920.515.710.733.340002616.912.711.130.1500023.915.312.211.426.76300201412.111.422.5800018.414.313.212.117.91000017.613.913.312.115.81250018.413.413.611.714.81600016.112.713.910.914SPL50.336.832.722.852.9N72.31.60.48.5median 38.1median 23.3median 22median 11.4median 41.3Delta9.15.15.11.58.3hearing rangehide median Fan NoiseBeelink GTI12 Ultra EX Docking Station
Beelink GTI12 Ultra EX Docking Station
NVIDIA GeForce RTX 3070, i9-12900H, Crucial P3 Plus CT1000P3PSSD8
Minisforum MS-A1
Radeon 780M, Ryzen 7 8700G, Kingston OM8PGP41024Q-A0
GMK NucBox K9
Arc 7-Core, Ultra 5 125H, MasonSemi 1TB MC7000
Asus NUC 14 Pro
Arc 7-Core, Ultra 5 125H, Kingston KC3000 2048G SKC3000D2048G
Geekom AX8 Pro
Radeon 780M, R9 8945H, Acer N7000
Asus ROG NUC 14-90AS0051
NVIDIA GeForce RTX 4070 Laptop GPU, Ultra 9 185H, Samsung PM9A1a MZVL21T0HDLU
Noise
1%
2%
9%
5%
15%
off /ambiente *
22.8
24.8
-9%
23
-1%
24
-5%
24.9
-9%
24.9
-9%
Idle Minimum *
32.7
33.9
-4%
29.8
9%
26
20%
24.9
24%
24.9
24%
Idle Average *
32.7
34
-4%
35.7
-9%
26.2
20%
24.9
24%
24.9
24%
Idle Maximum *
35.3
34
4%
35.7
-1%
26.2
26%
24.9
29%
24.9
29%
Load Average *
36.8
41.1
-12%
41.9
-14%
42.4
-15%
50.1
-36%
37.9
-3%
Cyberpunk 2077 ultra *
50.3
42.2
16%
43.8
13%
47.7
5%
50
1%
38.3
24%
Load Maximum *
52.9
46.2
13%
44
17%
47.8
10%
50.2
5%
44.2
16%

* ... Meglio usare valori piccoli

Temperatura

La superficie superiore del mini PC può raggiungere circa 34 C quando si gioca o oltre 41 C quando la CPU è al 100 percento di utilizzo, risultando più calda di molti altri mini PC. Questo è dovuto principalmente al fatto che l'unità integra l'intera PSU all'interno dello chassis e non include griglie di ventilazione lungo i lati.

Sistema inattivo
Sistema inattivo
Stress da Cyberpunk 2077

Test da sforzo

La CPU ha raggiunto i 3,2 GHz e i 69 W all'avvio dello stress Prime95. Dopo circa uno o due minuti, tuttavia, scendeva a 2,9 GHz e 61 W per mantenere una temperatura ragionevole del nucleo di 78 C. Il Turbo Boost massimo purtroppo non è indefinito, nonostante le grandi dimensioni dello chassis, ma almeno il calo delle prestazioni è relativamente minore.

La temperatura del core si stabilizzerebbe a 83 C durante il gioco, il che è più caldo del previsto per un mini PC.

Sistema inattivo
Sistema inattivo
Stress da Cyberpunk 2077
Stress Prime95
Stress Prime95
Stress di Prime95+FurMark
Clock medio della CPU (GHz) Clock della GPU (MHz) Temperatura media della CPU (°C) Temperatura media della GPU (°C)
Sistema inattivo -- -- 40 43
Stress Prime95 2,9 -- 78 43
Prime95 + FurMark Stress 2,9 1725 85 78
Cyberpunk 2077 Stress 1,8 1950 83 73

Altoparlanti

Gli altoparlanti interni non sono molto rumorosi o impressionanti, proprio come quelli che abbiamo sperimentato nel recente Bosgame recente Bosgame. Sono più adatti a funzioni ausiliarie come le conferenze o le stanze piccole, dove la qualità dell'audio è meno importante. Per qualsiasi tipo di riproduzione multimediale, si consiglia di utilizzare altoparlanti esterni adeguati.

Il rumore rosa al massimo volume mostra una scarsa riproduzione dei bassi
dB(A) 0102030405060708090Deep BassMiddle BassHigh BassLower RangeMidsHigher MidsLower HighsMid HighsUpper HighsSuper Highs2034.134.134.12524.229.724.23124.223.624.24022.320.122.35026.428.126.46324.121.624.18023.226.423.210025.427.225.412533.822.433.816045.62245.620046.923.546.925051.625.251.631555.924.955.940065.42465.450072.322.972.363077.526.477.580073.224.173.2100070.520.770.5125068.423.468.4160064.722.964.7200059.319.659.3250063.115.363.1315060.315.760.3400059.512.759.5500061.612.261.6630060.912.160.9800062.313.262.31000055.813.355.81250055.913.655.91600054.513.954.5SPL79.932.779.9N441.644median 60.3median 22median 60.3Delta6.45.16.426.325.821.422.12624.925.127.622.532.523.448.72655.818.860.922.167.2267019.372.317.674.217.774.319.575.31571.711.871.311.27410.574.21072.710.17210.67210.97511.374.811.671.71269.71269.612.371.112.669.61270.111.269.824.784.70.666.6median 12median 71.73.42.2hearing rangehide median Pink NoiseBeelink GTI12 Ultra EX Docking StationApple MacBook Pro 16 2021 M1 Pro
Diagramma frequenza (le caselle possono essere selezionate/deselezionate per confrontare i dispositivi)
Beelink GTI12 Ultra EX Docking Station analisi audio

(±) | potenza degli altiparlanti media ma buona (79.9 dB)
Bassi 100 - 315 Hz
(-) | quasi nessun basso - in media 17.1% inferiori alla media
(±) | la linearità dei bassi è media (14.3% delta rispetto alla precedente frequenza)
Medi 400 - 2000 Hz
(±) | medi elevati - circa 8.9% superiore alla media
(±) | linearità dei medi adeguata (13% delta rispetto alla precedente frequenza)
Alti 2 - 16 kHz
(+) | Alti bilanciati - appena 1.7% dalla media
(+) | alti lineari (6.7% delta rispetto alla precedente frequenza)
Nel complesso 100 - 16.000 Hz
(±) | la linearità complessiva del suono è media (24.2% di differenza rispetto alla media
Rispetto alla stessa classe
» 50% di tutti i dispositivi testati in questa classe è stato migliore, 13% simile, 38% peggiore
» Il migliore ha avuto un delta di 13%, medio di 26%, peggiore di 64%
Rispetto a tutti i dispositivi testati
» 70% di tutti i dispositivi testati in questa classe è stato migliore, 6% similare, 23% peggiore
» Il migliore ha avuto un delta di 4%, medio di 25%, peggiore di 134%

Apple MacBook Pro 16 2021 M1 Pro analisi audio

(+) | gli altoparlanti sono relativamente potenti (84.7 dB)
Bassi 100 - 315 Hz
(+) | bassi buoni - solo 3.8% dalla media
(+) | bassi in lineaa (5.2% delta rispetto alla precedente frequenza)
Medi 400 - 2000 Hz
(+) | medi bilanciati - solo only 1.3% rispetto alla media
(+) | medi lineari (2.1% delta rispetto alla precedente frequenza)
Alti 2 - 16 kHz
(+) | Alti bilanciati - appena 1.9% dalla media
(+) | alti lineari (2.7% delta rispetto alla precedente frequenza)
Nel complesso 100 - 16.000 Hz
(+) | suono nel complesso lineare (4.6% differenza dalla media)
Rispetto alla stessa classe
» 0% di tutti i dispositivi testati in questa classe è stato migliore, 0% simile, 100% peggiore
» Il migliore ha avuto un delta di 5%, medio di 18%, peggiore di 45%
Rispetto a tutti i dispositivi testati
» 0% di tutti i dispositivi testati in questa classe è stato migliore, 0% similare, 100% peggiore
» Il migliore ha avuto un delta di 4%, medio di 25%, peggiore di 134%

Gestione dell'energia

Consumo di energia

Il GTI12 Ultra e la Docking Station EX sono prevedibilmente molto più esigenti rispetto ad altri mini PC, tra cui il Asus ROG NUC 14 e la sua soluzione docking RTX 4070. L'inattività su un desktop assorbe già oltre il doppio dell'energia rispetto alla maggior parte dei computer portatili, mentre il gioco può richiedere oltre 380 W rispetto ai 336 W di MSI Titan 18 HX che è uno dei portatili da gioco più veloci attualmente disponibili.

Come già accennato, sia il GTI12 Ultra che il dock EX non hanno un alimentatore esterno, a differenza della maggior parte degli altri mini PC e laptop.

consumo 3DMark 06
consumo 3DMark 06
Cyberpunk 2077 1080p Ultra consumo
Il consumo salirebbe a 143 W quando si avvia lo stress Prime95
Lo stress di Prime95+FurMark è iniziato al 10s
Consumo di corrente
Off / Standbydarklight 6 / 10.6 Watt
Idledarkmidlight 35.9 / 35.9 / 36 Watt
Sotto carico midlight 119.5 / 422.9 Watt
 color bar
Leggenda: min: dark, med: mid, max: light        Metrahit Energy
Beelink GTI12 Ultra EX Docking Station
i9-12900H, NVIDIA GeForce RTX 3070, Crucial P3 Plus CT1000P3PSSD8, , x,
Minisforum MS-A1
Ryzen 7 8700G, Radeon 780M, Kingston OM8PGP41024Q-A0, , x,
GMK NucBox K9
Ultra 5 125H, Arc 7-Core, MasonSemi 1TB MC7000, , x,
Asus NUC 14 Pro
Ultra 5 125H, Arc 7-Core, Kingston KC3000 2048G SKC3000D2048G, , x,
Geekom AX8 Pro
R9 8945H, Radeon 780M, Acer N7000, , x,
Asus ROG NUC 14-90AS0051
Ultra 9 185H, NVIDIA GeForce RTX 4070 Laptop GPU, Samsung PM9A1a MZVL21T0HDLU, , x,
Power Consumption
62%
72%
74%
60%
47%
Idle Minimum *
35.9
8.8
75%
10.9
70%
5.1
86%
14
61%
10.6
70%
Idle Average *
35.9
12.6
65%
11
69%
6.4
82%
15.9
56%
14.8
59%
Idle Maximum *
36
14
61%
11.4
68%
14.7
59%
19.5
46%
27.5
24%
Load Average *
119.5
93.2
22%
52.8
56%
55.5
54%
76.4
36%
84.6
29%
Cyberpunk 2077 ultra external monitor *
384
102.1
73%
57.1
85%
59.1
85%
54.3
86%
171.4
55%
Load Maximum *
422.9
105.4
75%
72.2
83%
103.3
76%
99.1
77%
244
42%

* ... Meglio usare valori piccoli

Power Consumption Cyberpunk / Stress Test

0255075100125150175200225250275300325350375400425Tooltip
Beelink GTI12 Ultra EX Docking Station i9-12900H, NVIDIA GeForce RTX 3070: Ø418 (404-428)
Asus ROG NUC 14-90AS0051 Ultra 9 185H, NVIDIA GeForce RTX 4070 Laptop GPU: Ø178.9 (139.7-244)

Power Consumption external Monitor

020406080100120140160180200220240260280300320340360380Tooltip
Beelink GTI12 Ultra EX Docking Station i9-12900H, NVIDIA GeForce RTX 3070; Prime95 V2810 Stress (external Monitor): Ø140.7 (135.3-143.4)
Asus ROG NUC 14-90AS0051 Ultra 9 185H, NVIDIA GeForce RTX 4070 Laptop GPU; Prime95 V2810 Stress (external Monitor): Ø124.6 (119.9-181.8)
Beelink GTI12 Ultra EX Docking Station i9-12900H, NVIDIA GeForce RTX 3070; Cinebench R15 Multi (external Monitor): Ø128.9 (127.6-131.6)
Asus ROG NUC 14-90AS0051 Ultra 9 185H, NVIDIA GeForce RTX 4070 Laptop GPU; Cinebench R15 Multi (external Monitor): Ø122.3 (118.5-148.6)
Beelink GTI12 Ultra EX Docking Station i9-12900H, NVIDIA GeForce RTX 3070; 1280x720 FurMark 1.19 GPU Stress Test (external Monitor): Ø350 (331-365)
Asus ROG NUC 14-90AS0051 Ultra 9 185H, NVIDIA GeForce RTX 4070 Laptop GPU; 1280x720 FurMark 1.19 GPU Stress Test (external Monitor): Ø165.5 (157.7-193.1)
Beelink GTI12 Ultra EX Docking Station i9-12900H, NVIDIA GeForce RTX 3070; Idle 1min (external Monitor): Ø36.3 (35.5-42.3)
Asus ROG NUC 14-90AS0051 Ultra 9 185H, NVIDIA GeForce RTX 4070 Laptop GPU; Idle 1min (external Monitor): Ø17.4 (14.8-27.5)
Beelink GTI12 Ultra EX Docking Station i9-12900H, NVIDIA GeForce RTX 3070; Cyberpunk 2077 FHD ultra no FSR (external Monitor): Ø384 (372-390)
Asus ROG NUC 14-90AS0051 Ultra 9 185H, NVIDIA GeForce RTX 4070 Laptop GPU; Cyberpunk 2077 FHD ultra no FSR (external Monitor): Ø171.4 (166.8-177.5)

Pro

+ il dock include uno spazio di archiviazione M.2 aggiuntivo, un'antenna WLAN e una USB-A
+ alimentatore e altoparlanti integrati; non ci sono mattoni di alimentazione esterni
+ grafica più veloce della maggior parte dei computer portatili
+ costruzione e impressione di alta qualità
+ prezzo di partenza accessibile

Contro

- SSD M.2 e WLAN non possono essere installati contemporaneamente sul dock
- temperatura più bassa dei media durante il gioco
- EX dock compatibile solo con la serie GTI Ultra
- la manutenzione è ingombrante
- lettore SD molto lento

Verdetto - Eccellente qualità costruttiva per il prezzo

In recensione: Stazione docking Beelink GTI12 Ultra EX

GTI12 Ultra è all'altezza del suo nome "Ultra", grazie al design dello chassis allargato e alle caratteristiche aggiuntive rispetto alla serie Beelink GTI o SER. L'alimentatore integrato, in particolare, è qualcosa che ci piacerebbe vedere diventare la norma, dato che alcuni power brick possono essere grandi quasi quanto i mini PC stessi. Anche il design e la qualità del telaio sono di alto livello, come nel caso della serie SER8 SER8.

Lo svantaggio principale diventa evidente quando si deve fare la manutenzione dell'unità. Gli altoparlanti e l'alimentatore devono essere prima rimossi per accedere agli slot M.2 SSD e RAM e quindi il processo è più scomodo rispetto alla maggior parte degli altri mini PC. Inoltre, è più caldo di quanto vorremmo, nonostante sia notevolmente più grande e più pesante di altri della categoria. Il lettore SD integrato, molto lento, è uno schiaffo anche per i creatori di contenuti, soprattutto perché il modello è commercializzato come un mini PC di fascia alta.

Per quanto riguarda la Docking Station EX, si tratta di un design robusto anche se inelegante, con i suoi cavi di alimentazione esposti e gli attacchi per l'antenna, anche se si decide di non utilizzare nessuna delle funzioni WLAN del dock. Il design 'open air' dell'EX attirerà più polvere e capelli visibili rispetto a una soluzione eGPU in scatola come l'Aorus Gaming Box Aorus Gaming Box dove i pre-filtri sono solitamente integrati. L'EX non è nemmeno ideale per mettere in mostra la scheda grafica, in quanto la GPU deve essere installata rivolta verso il mini PC, invece che lontano da esso.

La GTI12 Ultra e la Docking Station EX sono sorprendentemente convenienti, considerando la qualità costruttiva e la concorrenza.

Rimuovendo la funzione Wi-Fi dell'EX, raramente utilizzata, o sostituendola con un maggior numero di porte, si potrebbero ridurre ulteriormente le dimensioni e il prezzo del dock.

Prezzo e disponibilità

Beelink sta attualmente spedendo gTI12 Ultra con SSD da 1 TB, 32 GB di RAM e Docking Station EX come bundle a soli 738 dollari. Le opzioni di CPU Meteor Lake più recenti sono disponibili a partire da 200 dollari in più.

Beelink GTI12 Ultra EX Docking Station - 10/21/2024 v8
Allen Ngo

Chassis
87 / 98 → 89%
Connettività
69 / 81 → 85%
Peso
71%
Prestazioni di gioco
89 / 80 → 100%
Prestazioni Applicazioni
87 / 92 → 94%
Rumorosità
60%
Audio
64%
Media
49%
77%
Mini PC - Media ponderata
CO2 Emissions
No Data
Materials
0%
Packaging
50%
Power Use
28.4%
Repairability
40%
Software Updates
22.3%
Recycle Logo Total Sustainability Score: 23.5%

Transparency

La selezione dei dispositivi da recensire viene effettuata dalla nostra redazione. Il campione di prova è stato fornito all'autore come prestito dal produttore o dal rivenditore ai fini di questa recensione. L'istituto di credito non ha avuto alcuna influenza su questa recensione, né il produttore ne ha ricevuto una copia prima della pubblicazione. Non vi era alcun obbligo di pubblicare questa recensione. Non accettiamo mai compensi o pagamenti in cambio delle nostre recensioni. In quanto società mediatica indipendente, Notebookcheck non è soggetta all'autorità di produttori, rivenditori o editori.

Ecco come Notebookcheck esegue i test

Ogni anno, Notebookcheck esamina in modo indipendente centinaia di laptop e smartphone utilizzando procedure standardizzate per garantire che tutti i risultati siano comparabili. Da circa 20 anni sviluppiamo continuamente i nostri metodi di prova e nel frattempo stabiliamo gli standard di settore. Nei nostri laboratori di prova, tecnici ed editori esperti utilizzano apparecchiature di misurazione di alta qualità. Questi test comportano un processo di validazione in più fasi. Il nostro complesso sistema di valutazione si basa su centinaia di misurazioni e parametri di riferimento ben fondati, che mantengono l'obiettività.

Price comparison

Please share our article, every link counts!
Mail Logo
> Recensioni e prove di notebook, tablets e smartphones > Recensioni e prove > Recensioni e prove > Recensione del mini PC Beelink GTI12 Ultra EX Docking Station: Più conveniente del previsto
Allen Ngo, 2024-10-22 (Update: 2024-10-22)