Notebookcheck Logo
Teaser

Recensione dell'Asus NUC 14 Pro: Mini PC NUC con Intel Core Ultra 5 125H, iGPU Intel Arc veloce e 2x Thunderbolt 4

Non è un'attrazione visiva!

Asus ha rilevato la divisione NUC di Intel e ora offre i popolari mini PC con i processori Meteor Lake di Intel. Questo non solo offre ai piccoli computer desktop una maggiore potenza della CPU, ma può anche aumentare significativamente le prestazioni 3D grazie all'iGPU rivisitata. Abbiamo testato in dettaglio l'Asus NUC 14 Pro con Intel Core Ultra 5 125H e valutato le prestazioni sulla base di numerose misurazioni e benchmark.
Sebastian Bade, 👁 Sebastian Bade (traduzione a cura di DeepL / Ninh Duy) Published 🇺🇸 🇩🇪 ...
Mini PC Desktop Intel 3D Printing Meteor Lake Thunderbolt

La serie NUC (Next Unit of Computing), un tempo lanciata da Intel, è stata ripresa da Asus. Asus offre ora i modelli familiari nello stesso stile, anche se vengono introdotti anche dispositivi più nuovi. Basati su Intel Meteor Lake, le macchine computerizzate compatte ricevono più potenza e, soprattutto, beneficiano dell'iGPU rivista con architettura Arc. L'Asus NUC 14 Pro è disponibile con diversi processori e, come sempre, in una versione piatta e leggermente più spessa, che offre spazio aggiuntivo per un'unità da 2,5 pollici. Abbiamo testato l'Asus NUC 14 Pro nell'opzione slim con un processore Intel Core Ultra 5 125H. Il dispositivo ci è arrivato come barebone, il che significa che abbiamo dovuto installare la RAM e l'SSD prima del test. Anche il sistema operativo non è incluso nella fornitura. Per il nostro campione di prova è necessario mettere sul tavolo un po' più di 500 euro. Rispetto ai suoi concorrenti, è molto se si considera che ci sono costi aggiuntivi dovuti all'opzione barebone. Rispetto agli altri marchi, Asus è più conosciuto e offre un'assistenza migliore.

I concorrenti con cui abbiamo confrontato l'Asus NUC 14 Pro sono elencati nella tabella seguente.

Asus NUC 14 Pro
Processore
Intel Core Ultra 5 125H 14 x 3.6 - 4.5 GHz, 64 W PL2 / Short Burst, 64 W PL1 / Sustained, Meteor Lake-H
Scheda grafica
Intel Arc 7-Core iGPU, Core: 2200 MHz, 32.0.101.5762 DCH
Scheda madre
Intel Meteor Lake-U/P/H PCH
Harddisk
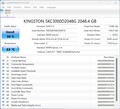
Kingston KC3000 2048G SKC3000D2048G, 2048 GB 
, 1750 GB libera
Scheda audio
Intel Meteor Lake-U/P/H PCH - cAVS (Audio, Voice, Speech)
Porte di connessione
1 USB 2.0, 3 USB 3.0 / 3.1, 1 USB 3.2 Gen 2x2 20Gbps, 2 USB 4.0 40 Gbps, 2 Thunderbolt, USB-C Power Delivery (PD), 2 HDMI, 2 DisplayPort, 1 Kensington Lock
Rete
Intel Ethernet Controller I226-V (10/2500MBit/s), Intel Wi-Fi 6E AX211 (a/b/g/h/n = Wi-Fi 4/ac = Wi-Fi 5/ax = Wi-Fi 6/ Wi-Fi 6E 6 GHz), Bluetooth 5.3
Dimensioni
altezza x larghezza x profondità (in mm): 37 x 117 x 112
Altre caratteristiche
120W power adapter, VESA-Mount, 36 Mesi Garanzia
Peso
525 gr, Alimentazione: 238 gr
Prezzo
500 EUR
Nota: il produttore potrebbe usare componenti di fornitori diversi pannelli dei diplay, drive o banchi di memoria con specifiche simili.


Potenziali concorrenti a confrontos

Punteggio
Version
Data
Modello
Peso
Altezza
Miglior Prezzo
74.7 %v8
08/2024
Asus NUC 14 Pro
Ultra 5 125H, Arc 7-Core
525 gr37 mm
78 %v8
07/2024
Geekom AE7
R9 7940HS, Radeon 780M
578 gr49.2 mm
74.5 %v8
07/2024
Minisforum UH125 Pro
Ultra 5 125H, Arc 7-Core
797 gr49 mm
73.7 %v8
Aoostar GEM10
R7 6800H, Radeon 680M
525 gr60 mm
83.4 %
v7 (old)
v7 (old)
04/2024
Acemagic F2A
Ultra 7 155H, Arc 8-Core
768 gr57 mm
81.2 %
v7 (old)
v7 (old)
10/2023
Geekom A5
R7 5800H, Vega 8
555 gr49.2 mm
Asus NUC 14 Pro
Asus NUC 14 Pro
Asus NUC 14 Pro
Asus NUC 14 Pro
Asus NUC 14 Pro
Asus NUC 14 Pro
Asus NUC 14 Pro
Asus NUC 14 Pro
Asus NUC 14 Pro
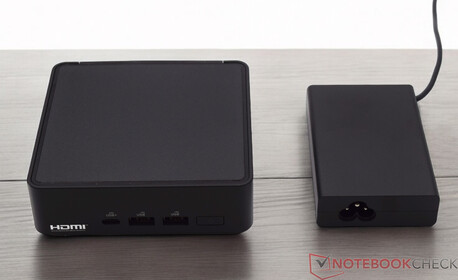
Asus NUC 14 Pro con alimentatore (19 V; 6,32 A)
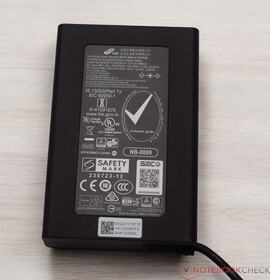
Alimentatore (19 V; 6,32 A)

Custodia - L'involucro di plastica nera copre la gabbia di metallo

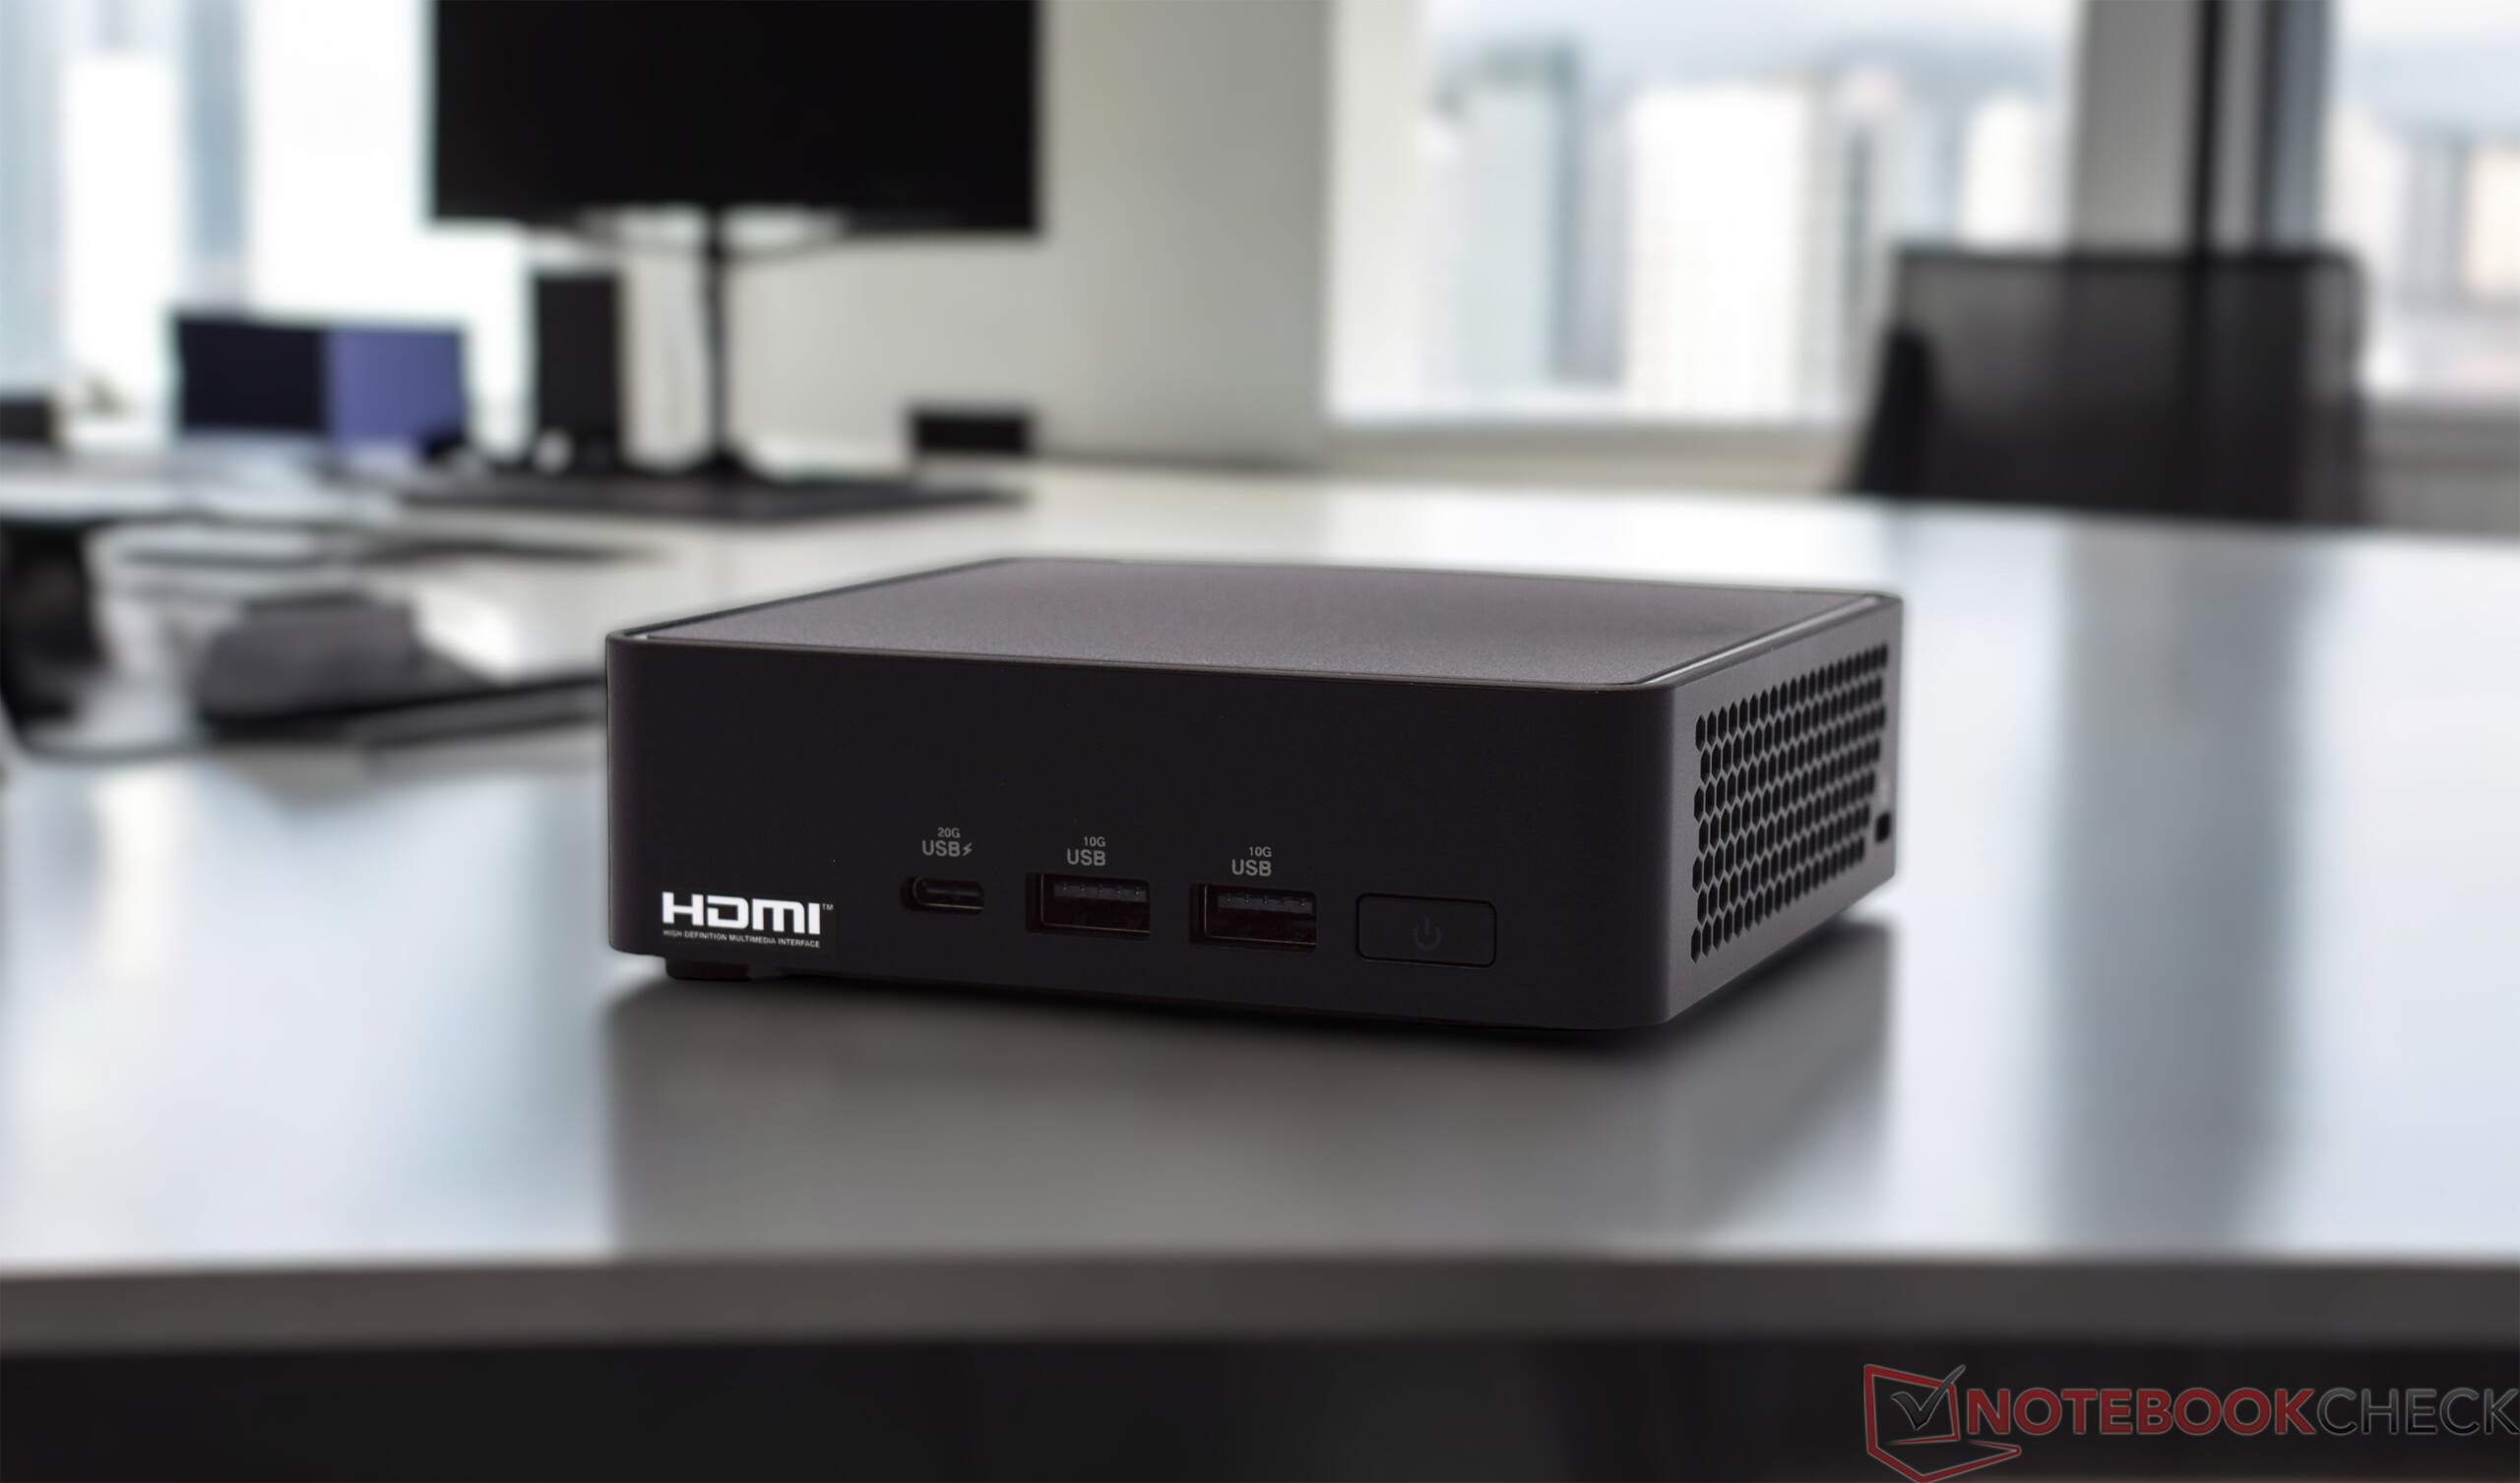
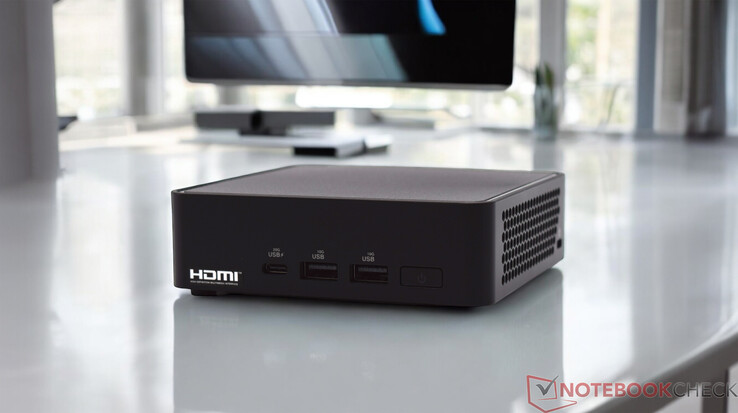
Dal punto di vista visivo, l'Asus NUC 14 Pro ricorda il kit Intel NUC 12 Pro Kit anche se il design è stato leggermente rivisto. Tuttavia, la scelta dei materiali è la stessa. Anche il concetto di base è invariato, in quanto la plastica nera nasconde un robusto telaio in metallo. A livello tattile, l'Asus NUC 14 Pro è inferiore ai Mini PC, che si basano su un alloggiamento in alluminio. Anche dal punto di vista visivo, il dispositivo Asus non è convincente, se per lei è importante. Tuttavia, la lavorazione non dà adito a critiche. La parte inferiore, invece, è stata ridisegnata e include un blocco meccanico per aprire il dispositivo senza attrezzi. La versione slim, che abbiamo testato qui, ha un design molto piatto con un'altezza di 37 millimetri. Con un ingombro quasi quadrato di 11,7 x 11,2 centimetri, il dispositivo occupa poco spazio sulla scrivania. La staffa VESA in dotazione consente anche di montarlo su un monitor.

Confronto delle dimensioni

146 mm 146 mm 57 mm 768 g145 mm 145 mm 49 mm 797 g107 mm 107 mm 60 mm 525 g117 mm 112 mm 49.2 mm 578 g117 mm 112 mm 49.2 mm 555 g117 mm 112 mm 37 mm 525 g210 mm 148 mm 1 mm 2.9 g

Attrezzatura

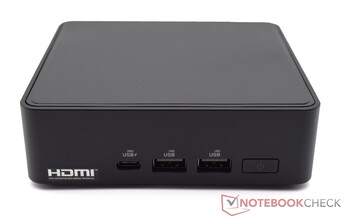
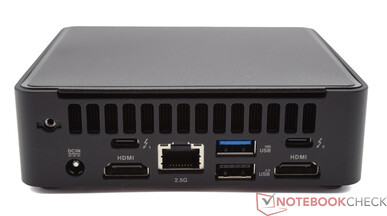
Il Mini PC Asus NUC 14 Pro offre molte interfacce nonostante il suo design compatto. Ci sono un totale di sei porte USB, quattro delle quali sono prese di tipo-A, molto utilizzate, e altre due sono prese di tipo-C. Queste ultime offrono anche il pieno supporto Thunderbolt. Questo distingue l'Asus NUC 14 Pro da altri mini PC, che spesso offrono solo semplici porte USB 4 o porte convenzionali Type-C. Ci sono anche due porte HDMI e una connessione di rete 2.5G.

Anteriore: 1x USB 3.2 Gen2x2 Tipo-C, 2 x USB 3.2 Gen2 Tipo-A
Pannello posteriore: Connettore di alimentazione, 2x Thunderbold (Tipo C), 1x USB 3.2, 1x USB 2.0, LAN 2.5G, 2x HDMI 2.1

Comunicazione

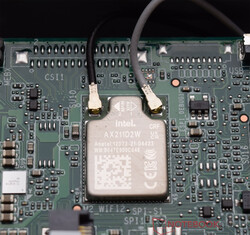
Modulo WLAN
Modulo WLAN

Asus equipaggia il NUC 14 Pro con il modulo Intel Wi-Fi 6E AX211, che offre risultati eccellenti nel test. In combinazione con il router ASUS ROG Rapture GT-AXE11000, abbiamo documentato risultati costantemente migliori rispetto ai dispositivi di confronto.

Networking
iperf3 receive AXE11000 6GHz
Acemagic F2A
Intel Wi-Fi 7 BE200 320MHz
1770 (1584min - 1790max) MBit/s +2%
Minisforum UH125 Pro
Intel Wi-Fi 6E AX210
1755 (1737min - 1766max) MBit/s +2%
Asus NUC 14 Pro
Intel Wi-Fi 6E AX211
1729 (1594min - 1755max) MBit/s
Geekom AE7
MediaTek Wi-Fi 6E MT7922 160MHz Wireless LAN Card
1528 (1495min - 1552max) MBit/s -12%
Media Intel Wi-Fi 6E AX211
  (700 - 1857, n=213)
1493 MBit/s -14%
Media della classe Mini PC
  (684 - 1771, n=55, ultimi 2 anni)
1380 MBit/s -20%
iperf3 transmit AXE11000 6GHz
Geekom AE7
MediaTek Wi-Fi 6E MT7922 160MHz Wireless LAN Card
1699 (1590min - 1792max) MBit/s +23%
Acemagic F2A
Intel Wi-Fi 7 BE200 320MHz
1615 (767min - 1670max) MBit/s +17%
Minisforum UH125 Pro
Intel Wi-Fi 6E AX210
1605 (1238min - 1652max) MBit/s +16%
Asus NUC 14 Pro
Intel Wi-Fi 6E AX211
1379 (1299min - 1425max) MBit/s
Media Intel Wi-Fi 6E AX211
  (385 - 1851, n=214)
1368 MBit/s -1%
Media della classe Mini PC
  (394 - 1800, n=55, ultimi 2 anni)
1330 MBit/s -4%
iperf3 receive AXE11000
Media Intel Wi-Fi 6E AX211
  (582 - 1890, n=242)
1382 MBit/s 0%
Asus NUC 14 Pro
Intel Wi-Fi 6E AX211
1379 (1016min - 1613max) MBit/s
Geekom A5
Realtek RTL8852BE
946 (856min - 970max) MBit/s -31%
Media della classe Mini PC
  (320 - 1796, n=113, ultimi 2 anni)
945 MBit/s -31%
Minisforum UH125 Pro
Intel Wi-Fi 6E AX210
936 (907min - 946max) MBit/s -32%
Acemagic F2A
Intel Wi-Fi 7 BE200 320MHz
838 (728min - 926max) MBit/s -39%
Geekom AE7
MediaTek Wi-Fi 6E MT7922 160MHz Wireless LAN Card
707 (631min - 811max) MBit/s -49%
Aoostar GEM10
Intel Wi-Fi 6 AX200
451 (228min - 466max) MBit/s -67%
iperf3 transmit AXE11000
Asus NUC 14 Pro
Intel Wi-Fi 6E AX211
1331 (1187min - 1442max) MBit/s
Media Intel Wi-Fi 6E AX211
  (64 - 1921, n=242)
1231 MBit/s -8%
Media della classe Mini PC
  (184.1 - 1776, n=113, ultimi 2 anni)
874 MBit/s -34%
Geekom A5
Realtek RTL8852BE
834 (730min - 861max) MBit/s -37%
Minisforum UH125 Pro
Intel Wi-Fi 6E AX210
758 (727min - 793max) MBit/s -43%
Acemagic F2A
Intel Wi-Fi 7 BE200 320MHz
709 (369min - 977max) MBit/s -47%
Geekom AE7
MediaTek Wi-Fi 6E MT7922 160MHz Wireless LAN Card
573 (145min - 972max) MBit/s -57%
Aoostar GEM10
Intel Wi-Fi 6 AX200
429 (325min - 510max) MBit/s -68%
0501001502002503003504004505005506006507007508008509009501000105011001150120012501300135014001450150015501600165017001750Tooltip
Asus NUC 14 Pro Intel Wi-Fi 6E AX211; iperf3 transmit AXE11000 6GHz; iperf 3.1.3: Ø1379 (1299-1425)
Geekom AE7 MediaTek Wi-Fi 6E MT7922 160MHz Wireless LAN Card; iperf3 transmit AXE11000 6GHz; iperf 3.1.3: Ø1700 (1590-1792)
Minisforum UH125 Pro Intel Wi-Fi 6E AX210; iperf3 transmit AXE11000 6GHz; iperf 3.1.3: Ø1605 (1238-1652)
Acemagic F2A Intel Wi-Fi 7 BE200 320MHz; iperf3 transmit AXE11000 6GHz; iperf 3.1.3: Ø1590 (767-1670)
Asus NUC 14 Pro Intel Wi-Fi 6E AX211; iperf3 receive AXE11000 6GHz; iperf 3.1.3: Ø1728 (1594-1755)
Geekom AE7 MediaTek Wi-Fi 6E MT7922 160MHz Wireless LAN Card; iperf3 receive AXE11000 6GHz; iperf 3.1.3: Ø1527 (1495-1552)
Minisforum UH125 Pro Intel Wi-Fi 6E AX210; iperf3 receive AXE11000 6GHz; iperf 3.1.3: Ø1755 (1737-1766)
Acemagic F2A Intel Wi-Fi 7 BE200 320MHz; iperf3 receive AXE11000 6GHz; iperf 3.1.3: Ø1769 (1584-1790)
Asus NUC 14 Pro Intel Wi-Fi 6E AX211; iperf3 receive AXE11000; iperf 3.1.3: Ø1379 (1016-1613)
Geekom AE7 MediaTek Wi-Fi 6E MT7922 160MHz Wireless LAN Card; iperf3 receive AXE11000; iperf 3.1.3: Ø707 (631-811)
Minisforum UH125 Pro Intel Wi-Fi 6E AX210; iperf3 receive AXE11000; iperf 3.1.3: Ø935 (907-946)
Acemagic F2A Intel Wi-Fi 7 BE200 320MHz; iperf3 receive AXE11000; iperf 3.1.3: Ø838 (728-926)
Asus NUC 14 Pro Intel Wi-Fi 6E AX211; iperf3 transmit AXE11000; iperf 3.1.3: Ø1331 (1187-1442)
Geekom AE7 MediaTek Wi-Fi 6E MT7922 160MHz Wireless LAN Card; iperf3 transmit AXE11000; iperf 3.1.3: Ø558 (145-972)
Minisforum UH125 Pro Intel Wi-Fi 6E AX210; iperf3 transmit AXE11000; iperf 3.1.3: Ø758 (727-793)
Acemagic F2A Intel Wi-Fi 7 BE200 320MHz; iperf3 transmit AXE11000; iperf 3.1.3: Ø695 (369-977)

Accessori

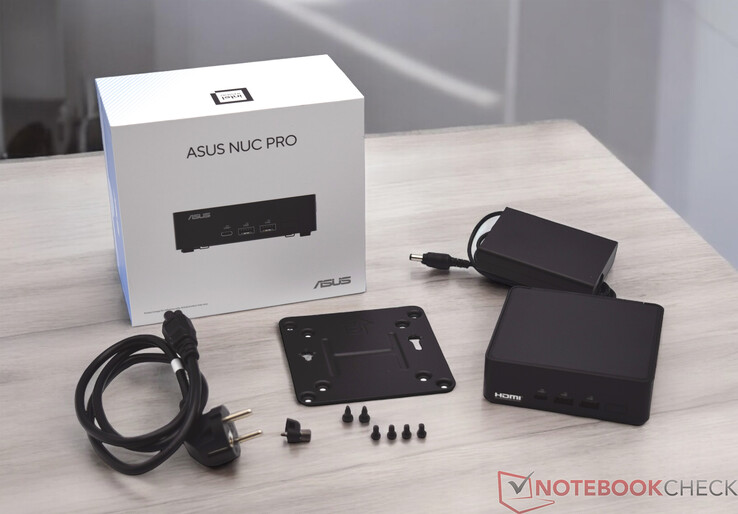
L'Asus NUC 14 Pro viene fornito con un alimentatore da 120 watt e un supporto VESA con materiale di montaggio. Il produttore non include altri accessori come una tastiera o un mouse.

Ambito di consegna dell'Asus NUC 14 Pro

Manutenzione

Abbiamo ricevuto l'Asus NUC 14 Pro in versione barebone, il che significa che la RAM, l'SSD e il sistema operativo non sono inclusi nella fornitura. Di conseguenza, è importante che l'utente possa aprire facilmente il dispositivo per installare da solo i componenti mancanti. Con l'Asus NUC 14 Pro, la piastra di base può essere rimossa facilmente e senza attrezzi. Il produttore ha integrato un piccolo fermo meccanico che lo rende possibile: La RAM e l'SSD possono essere installati rapidamente e il mini PC è pronto per il primo avvio. Nel dispositivo è possibile installare due SSD e per la RAM sono previsti due slot SO-DIMM. Per un funzionamento ottimale, entrambi gli slot SO-DIMM devono essere occupati.

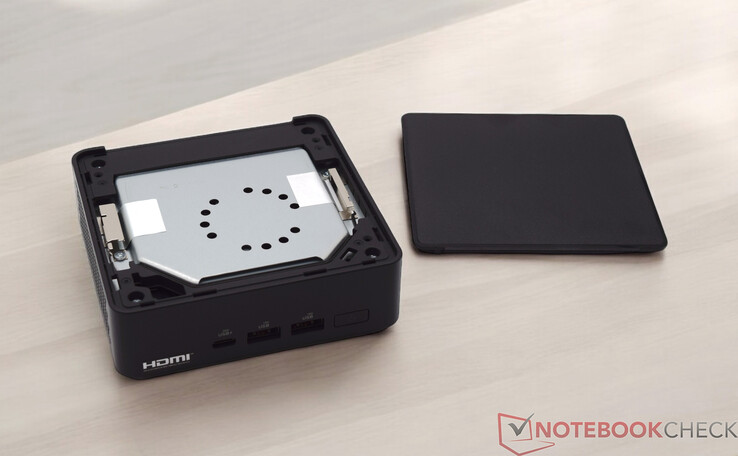
Asus NUC 14 Pro senza copertura dell'alloggiamento
Asus NUC 14 Pro con il lato inferiore aperto
Scheda di circuito con unità di raffreddamento
Asus NUC 14 Pro smontato
Asus NUC 14 Pro senza alloggiamento in plastica
Coperchio di plastica vuoto

Sostenibilità

L'Asus NUC 14 Pro è un mini PC molto compatto, che presenta vantaggi significativi in termini di consumo energetico rispetto a un PC desktop tradizionale. Il dispositivo viene consegnato in una piccola scatola, non eccessivamente grande. Il mini PC stesso è realizzato principalmente in metallo e plastica. Non sappiamo se nel processo di produzione vengano utilizzati materiali appositamente riciclati. Asus riceve elogi per il periodo di garanzia di tre anni.

Prestazioni

Il Intel Core Ultra 5 125H è un solido ma potente SoC di fascia media della serie Meteor Lake di Intel. L'elevato numero di core di calcolo fisici che il SoC porta con sé garantisce in definitiva buone prestazioni multi-thread. Il SoC Meteor Lake dispone anche di una iGPU rivista, che offre prestazioni nettamente superiori rispetto alle iGPU Intel Iris Xe, ormai obsolete, della serie precedente basata sull'architettura Arc. L'Asus NUC 14 Pro è disponibile anche con un Intel Core 3 100U leggermente più debole, nonché con una variante leggermente più potente con SoC Intel Core Ultra 7.

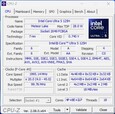
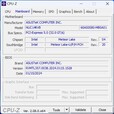
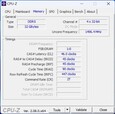
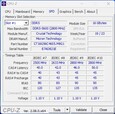
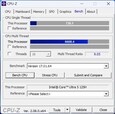
CPU-Z
CPU-Z
CPU-Z
CPU-Z
CPU-Z
CPU-Z
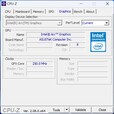
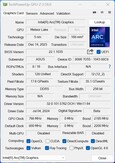
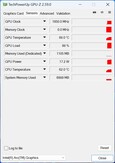
GPU-Z
GPU-Z
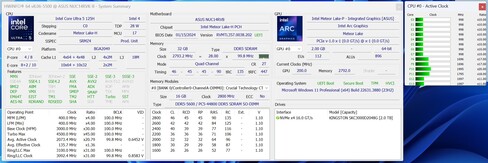
HWiNFO

Condizioni del test

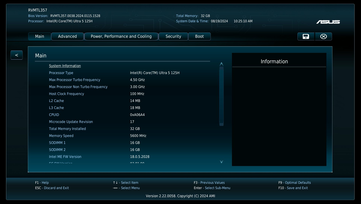
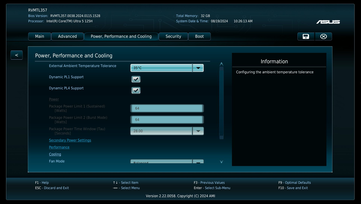
Abbiamo eseguito tutti i test sulle prestazioni con il profilo energetico Bilanciato. Non abbiamo modificato le prestazioni del SoC e lo abbiamo lasciato nel suo stato predefinito secondo le impostazioni del BIOS (Balanced). Le impostazioni del BIOS sono molto ampie. Rispetto ai Mini-PC di Geekom, Minisforum o Acemagic, Asus è chiaramente in vantaggio. Oltre al consumo energetico della CPU, si possono persino disattivare le singole porte USB.

Processore

Nel nostro caso, l'Asus NUC 14 Pro è alimentato da un Intel Core Ultra 5 125H. 14 core con un totale di 18 thread assicurano un'elevata velocità di lavoro, che colloca il nostro campione di prova in un buon terzo posto. Il limite di potenza del processore è di 64 watt e viene raggiunto ripetutamente per brevi periodi. Negli scenari di carico più lunghi, il SoC si blocca solo a causa delle temperature eccessive. Queste superano i 100 °C sotto carico e non sono rare. Asus non sembra rallentare ulteriormente il SoC Intel in questo caso, in quanto il SoC è specificato con una temperatura operativa massima di 110 °C secondo le specifiche. Un confronto diretto con il Minisforum UH125 Pro è vinto dal nostro campione di prova di Asus. Nei singoli test, l'Asus NUC 14 Pro ha un leggero vantaggio con prestazioni single-core costantemente migliori.

Per ulteriori confronti e benchmark, la invitiamo a consultare la nostra Tabella di confronto delle CPU.

Cinebench R15
Cinebench R15
Cinebench R20
Cinebench R20
Cinebench R23
Cinebench R23
Cinebench 2024
Cinebench 2024
Performance Rating - Percent
Geekom AE7
AMD Ryzen 9 7940HS
57 pt
Acemagic F2A
Intel Core Ultra 7 155H
55.3 pt
Asus NUC 14 Pro
Intel Core Ultra 5 125H
50.9 pt
Aoostar GEM10
AMD Ryzen 7 6800H
50.4 pt
Minisforum UH125 Pro
Intel Core Ultra 5 125H
50.1 pt
Geekom A5
AMD Ryzen 7 5800H
48.6 pt
Cinebench 2024
CPU Multi Core
Acemagic F2A
Intel Core Ultra 7 155H
1022 Points +25%
Geekom AE7
AMD Ryzen 9 7940HS
946 Points +16%
Asus NUC 14 Pro
Intel Core Ultra 5 125H
815 Points
Minisforum UH125 Pro
Intel Core Ultra 5 125H
814 Points 0%
Aoostar GEM10
AMD Ryzen 7 6800H
709 Points -13%
Geekom A5
AMD Ryzen 7 5800H
618 Points -24%
CPU Single Core
Geekom AE7
AMD Ryzen 9 7940HS
108 Points +6%
Acemagic F2A
Intel Core Ultra 7 155H
106 Points +4%
Asus NUC 14 Pro
Intel Core Ultra 5 125H
102 Points
Minisforum UH125 Pro
Intel Core Ultra 5 125H
97 Points -5%
Aoostar GEM10
AMD Ryzen 7 6800H
88 Points -14%
Geekom A5
AMD Ryzen 7 5800H
86 Points -16%
Cinebench R23
Multi Core
Acemagic F2A
Intel Core Ultra 7 155H
18497 Points +27%
Geekom AE7
AMD Ryzen 9 7940HS
16099 Points +11%
Minisforum UH125 Pro
Intel Core Ultra 5 125H
14564 Points 0%
Asus NUC 14 Pro
Intel Core Ultra 5 125H
14516 Points
Aoostar GEM10
AMD Ryzen 7 6800H
13117 Points -10%
Geekom A5
AMD Ryzen 7 5800H
10819 Points -25%
Single Core
Geekom AE7
AMD Ryzen 9 7940HS
1788 Points +4%
Acemagic F2A
Intel Core Ultra 7 155H
1771 Points +3%
Asus NUC 14 Pro
Intel Core Ultra 5 125H
1721 Points
Minisforum UH125 Pro
Intel Core Ultra 5 125H
1640 Points -5%
Aoostar GEM10
AMD Ryzen 7 6800H
1542 Points -10%
Geekom A5
AMD Ryzen 7 5800H
1405 Points -18%
Cinebench R20
CPU (Single Core)
Geekom AE7
AMD Ryzen 9 7940HS
700 Points +13%
Acemagic F2A
Intel Core Ultra 7 155H
679 Points +9%
Minisforum UH125 Pro
Intel Core Ultra 5 125H
629 Points +1%
Asus NUC 14 Pro
Intel Core Ultra 5 125H
622 Points
Aoostar GEM10
AMD Ryzen 7 6800H
598 Points -4%
Geekom A5
AMD Ryzen 7 5800H
551 Points -11%
CPU (Multi Core)
Acemagic F2A
Intel Core Ultra 7 155H
7188 Points +28%
Geekom AE7
AMD Ryzen 9 7940HS
6321 Points +13%
Minisforum UH125 Pro
Intel Core Ultra 5 125H
5618 Points 0%
Asus NUC 14 Pro
Intel Core Ultra 5 125H
5617 Points
Aoostar GEM10
AMD Ryzen 7 6800H
5216 Points -7%
Geekom A5
AMD Ryzen 7 5800H
4229 Points -25%
Cinebench R15
CPU Single 64Bit
Geekom AE7
AMD Ryzen 9 7940HS
281 Points +13%
Acemagic F2A
Intel Core Ultra 7 155H
258 Points +4%
Asus NUC 14 Pro
Intel Core Ultra 5 125H
248 Points
Aoostar GEM10
AMD Ryzen 7 6800H
240 Points -3%
Minisforum UH125 Pro
Intel Core Ultra 5 125H
235 Points -5%
Geekom A5
AMD Ryzen 7 5800H
227 Points -8%
CPU Multi 64Bit
Acemagic F2A
Intel Core Ultra 7 155H
2738 Points +28%
Geekom AE7
AMD Ryzen 9 7940HS
2544 Points +19%
Minisforum UH125 Pro
Intel Core Ultra 5 125H
2245 Points +5%
Asus NUC 14 Pro
Intel Core Ultra 5 125H
2141 Points
Aoostar GEM10
AMD Ryzen 7 6800H
2117 Points -1%
Geekom A5
AMD Ryzen 7 5800H
1773 Points -17%
Cinebench R11.5
CPU Single 64Bit
Geekom AE7
AMD Ryzen 9 7940HS
3.38 Points +12%
Acemagic F2A
Intel Core Ultra 7 155H
3.13 Points +3%
Asus NUC 14 Pro
Intel Core Ultra 5 125H
3.03 Points
Aoostar GEM10
AMD Ryzen 7 6800H
2.86 Points -6%
Minisforum UH125 Pro
Intel Core Ultra 5 125H
2.86 Points -6%
Geekom A5
AMD Ryzen 7 5800H
2.69 Points -11%
CPU Multi 64Bit
Acemagic F2A
Intel Core Ultra 7 155H
33.49 Points +24%
Geekom AE7
AMD Ryzen 9 7940HS
30.49 Points +13%
Minisforum UH125 Pro
Intel Core Ultra 5 125H
27.02 Points 0%
Asus NUC 14 Pro
Intel Core Ultra 5 125H
26.92 Points
Aoostar GEM10
AMD Ryzen 7 6800H
24.57 Points -9%
Geekom A5
AMD Ryzen 7 5800H
21.25 Points -21%
Cinebench R10
Rendering Single CPUs 64Bit
Geekom AE7
AMD Ryzen 9 7940HS
14232 Points +7%
Acemagic F2A
Intel Core Ultra 7 155H
13938 Points +5%
Asus NUC 14 Pro
Intel Core Ultra 5 125H
13281 Points
Minisforum UH125 Pro
Intel Core Ultra 5 125H
12858 Points -3%
Aoostar GEM10
AMD Ryzen 7 6800H
12142 Points -9%
Geekom A5
AMD Ryzen 7 5800H
11378 Points -14%
Rendering Multiple CPUs 64Bit
Acemagic F2A
Intel Core Ultra 7 155H
95005 Points +21%
Geekom AE7
AMD Ryzen 9 7940HS
87296 Points +11%
Minisforum UH125 Pro
Intel Core Ultra 5 125H
78817 Points 0%
Asus NUC 14 Pro
Intel Core Ultra 5 125H
78788 Points
Aoostar GEM10
AMD Ryzen 7 6800H
70792 Points -10%
Geekom A5
AMD Ryzen 7 5800H
62312 Points -21%
Blender - v2.79 BMW27 CPU
Geekom A5
AMD Ryzen 7 5800H
293 Seconds * -29%
Aoostar GEM10
AMD Ryzen 7 6800H
259 Seconds * -14%
Minisforum UH125 Pro
Intel Core Ultra 5 125H
230 Seconds * -1%
Asus NUC 14 Pro
Intel Core Ultra 5 125H
228 Seconds *
Geekom AE7
AMD Ryzen 9 7940HS
197 Seconds * +14%
Acemagic F2A
Intel Core Ultra 7 155H
178 Seconds * +22%
wPrime 2.10
32m
Minisforum UH125 Pro
Intel Core Ultra 5 125H
4.48 s * -9%
Asus NUC 14 Pro
Intel Core Ultra 5 125H
4.107 s *
Geekom A5
AMD Ryzen 7 5800H
3.93 s * +4%
Aoostar GEM10
AMD Ryzen 7 6800H
3.55 s * +14%
Acemagic F2A
Intel Core Ultra 7 155H
3.523 s * +14%
Geekom AE7
AMD Ryzen 9 7940HS
2.699 s * +34%
1024m
Minisforum UH125 Pro
Intel Core Ultra 5 125H
246.982 s * -66%
Asus NUC 14 Pro
Intel Core Ultra 5 125H
148.994 s *
Acemagic F2A
Intel Core Ultra 7 155H
139.617 s * +6%
Geekom A5
AMD Ryzen 7 5800H
111.714 s * +25%
Aoostar GEM10
AMD Ryzen 7 6800H
97.298 s * +35%
Geekom AE7
AMD Ryzen 9 7940HS
96.95 s * +35%
X264 HD Benchmark 4.0
Pass 1
Acemagic F2A
Intel Core Ultra 7 155H
325 (323min - 328max) fps +5%
Asus NUC 14 Pro
Intel Core Ultra 5 125H
308.5 (306min - 311max) fps
Minisforum UH125 Pro
Intel Core Ultra 5 125H
304.5 (304min - 306max) fps -1%
Geekom AE7
AMD Ryzen 9 7940HS
288 (287min - 289max) fps -7%
Aoostar GEM10
AMD Ryzen 7 6800H
251.5 (250min - 256max) fps -18%
Geekom A5
AMD Ryzen 7 5800H
244 (242min - 246max) fps -21%
Pass 2
Acemagic F2A
Intel Core Ultra 7 155H
154.15 (153.8min - 154.3max) fps +17%
Geekom AE7
AMD Ryzen 9 7940HS
144.15 (143.5min - 146.6max) fps +9%
Minisforum UH125 Pro
Intel Core Ultra 5 125H
134 (133.7min - 134.5max) fps +1%
Asus NUC 14 Pro
Intel Core Ultra 5 125H
132.3 (129.2min - 135max) fps
Aoostar GEM10
AMD Ryzen 7 6800H
122.2 (120.3min - 126.1max) fps -8%
Geekom A5
AMD Ryzen 7 5800H
104.65 (104.1min - 106.9max) fps -21%
WinRAR - Result
Acemagic F2A
Intel Core Ultra 7 155H
7723 KB/s +22%
Geekom AE7
AMD Ryzen 9 7940HS
7580 KB/s +20%
Geekom A5
AMD Ryzen 7 5800H
7042 KB/s +12%
Asus NUC 14 Pro
Intel Core Ultra 5 125H
6315 KB/s
Aoostar GEM10
AMD Ryzen 7 6800H
5890 KB/s -7%
Minisforum UH125 Pro
Intel Core Ultra 5 125H
5594 KB/s -11%
TrueCrypt
AES Mean 100MB
Geekom AE7
AMD Ryzen 9 7940HS
15.2 GB/s +73%
Aoostar GEM10
AMD Ryzen 7 6800H
13.5 GB/s +53%
Geekom A5
AMD Ryzen 7 5800H
11.5 GB/s +31%
Acemagic F2A
Intel Core Ultra 7 155H
10.6 GB/s +20%
Minisforum UH125 Pro
Intel Core Ultra 5 125H
9 GB/s +2%
Asus NUC 14 Pro
Intel Core Ultra 5 125H
8.8 GB/s
Twofish Mean 100MB
Geekom AE7
AMD Ryzen 9 7940HS
2.1 GB/s +50%
Aoostar GEM10
AMD Ryzen 7 6800H
1.8 GB/s +29%
Acemagic F2A
Intel Core Ultra 7 155H
1.7 GB/s +21%
Geekom A5
AMD Ryzen 7 5800H
1.6 GB/s +14%
Minisforum UH125 Pro
Intel Core Ultra 5 125H
1.4 GB/s 0%
Asus NUC 14 Pro
Intel Core Ultra 5 125H
1.4 GB/s
Serpent Mean 100MB
Geekom AE7
AMD Ryzen 9 7940HS
1.4 GB/s +61%
Aoostar GEM10
AMD Ryzen 7 6800H
1.2 GB/s +38%
Geekom A5
AMD Ryzen 7 5800H
1 GB/s +15%
Acemagic F2A
Intel Core Ultra 7 155H
1 GB/s +15%
Asus NUC 14 Pro
Intel Core Ultra 5 125H
0.869 GB/s
Minisforum UH125 Pro
Intel Core Ultra 5 125H
0.854 GB/s -2%
Geekbench 5.5
Multi-Core
Acemagic F2A
Intel Core Ultra 7 155H
12662 Points +17%
Geekom AE7
AMD Ryzen 9 7940HS
12228 Points +13%
Asus NUC 14 Pro
Intel Core Ultra 5 125H
10856 Points
Minisforum UH125 Pro
Intel Core Ultra 5 125H
10788 Points -1%
Aoostar GEM10
AMD Ryzen 7 6800H
8898 Points -18%
Geekom A5
AMD Ryzen 7 5800H
8823 Points -19%
Single-Core
Geekom AE7
AMD Ryzen 9 7940HS
1986 Points +18%
Acemagic F2A
Intel Core Ultra 7 155H
1746 Points +4%
Asus NUC 14 Pro
Intel Core Ultra 5 125H
1685 Points
Minisforum UH125 Pro
Intel Core Ultra 5 125H
1593 Points -5%
Aoostar GEM10
AMD Ryzen 7 6800H
1552 Points -8%
Geekom A5
AMD Ryzen 7 5800H
1494 Points -11%
Geekbench 5.0
5.0 Multi-Core
Acemagic F2A
Intel Core Ultra 7 155H
12438 Points +16%
Geekom AE7
AMD Ryzen 9 7940HS
12141 Points +13%
Asus NUC 14 Pro
Intel Core Ultra 5 125H
10747 Points
Minisforum UH125 Pro
Intel Core Ultra 5 125H
10676 Points -1%
Aoostar GEM10
AMD Ryzen 7 6800H
8868 Points -17%
Geekom A5
AMD Ryzen 7 5800H
8568 Points -20%
5.0 Single-Core
Geekom AE7
AMD Ryzen 9 7940HS
1905 Points +15%
Acemagic F2A
Intel Core Ultra 7 155H
1708 Points +3%
Asus NUC 14 Pro
Intel Core Ultra 5 125H
1659 Points
Minisforum UH125 Pro
Intel Core Ultra 5 125H
1596 Points -4%
Aoostar GEM10
AMD Ryzen 7 6800H
1509 Points -9%
Geekom A5
AMD Ryzen 7 5800H
1421 Points -14%
Geekbench 4.4
64 Bit Single-Core Score
Geekom AE7
AMD Ryzen 9 7940HS
8125 Points +17%
Asus NUC 14 Pro
Intel Core Ultra 5 125H
6964 Points
Acemagic F2A
Intel Core Ultra 7 155H
6927 Points -1%
Minisforum UH125 Pro
Intel Core Ultra 5 125H
6734 Points -3%
Aoostar GEM10
AMD Ryzen 7 6800H
6341 Points -9%
Geekom A5
AMD Ryzen 7 5800H
6295 Points -10%
64 Bit Multi-Core Score
Geekom AE7
AMD Ryzen 9 7940HS
49341 Points +27%
Acemagic F2A
Intel Core Ultra 7 155H
45250 Points +17%
Asus NUC 14 Pro
Intel Core Ultra 5 125H
38793 Points
Minisforum UH125 Pro
Intel Core Ultra 5 125H
38648 Points 0%
Aoostar GEM10
AMD Ryzen 7 6800H
35898 Points -7%
Geekom A5
AMD Ryzen 7 5800H
34200 Points -12%
3DMark 11 - 1280x720 Performance Physics
Geekom AE7
AMD Ryzen 9 7940HS
22237 Points +26%
Acemagic F2A
Intel Core Ultra 7 155H
20846 Points +18%
Asus NUC 14 Pro
Intel Core Ultra 5 125H
17624 Points
Minisforum UH125 Pro
Intel Core Ultra 5 125H
17138 Points -3%
Geekom A5
AMD Ryzen 7 5800H
16933 Points -4%
Aoostar GEM10
AMD Ryzen 7 6800H
16034 Points -9%
7-Zip 18.03
7z b 4
Geekom AE7
AMD Ryzen 9 7940HS
71631 MIPS
Acemagic F2A
Intel Core Ultra 7 155H
66438 MIPS
Aoostar GEM10
AMD Ryzen 7 6800H
55067 MIPS
Geekom A5
AMD Ryzen 7 5800H
53954 MIPS
Minisforum UH125 Pro
Intel Core Ultra 5 125H
0 MIPS
Asus NUC 14 Pro
Intel Core Ultra 5 125H
0 MIPS
7z b 4 -mmt1
Geekom AE7
AMD Ryzen 9 7940HS
6661 MIPS +30%
Aoostar GEM10
AMD Ryzen 7 6800H
5521 MIPS +7%
Geekom A5
AMD Ryzen 7 5800H
5486 MIPS +7%
Acemagic F2A
Intel Core Ultra 7 155H
5485 MIPS +7%
Asus NUC 14 Pro
Intel Core Ultra 5 125H
5136 MIPS
Minisforum UH125 Pro
Intel Core Ultra 5 125H
4699 MIPS -9%
HWBOT x265 Benchmark v2.2 - 4k Preset
Geekom AE7
AMD Ryzen 9 7940HS
20.9 fps +33%
Acemagic F2A
Intel Core Ultra 7 155H
19.6 fps +25%
Minisforum UH125 Pro
Intel Core Ultra 5 125H
16.7 fps +6%
Asus NUC 14 Pro
Intel Core Ultra 5 125H
15.7 fps
Aoostar GEM10
AMD Ryzen 7 6800H
14.9 fps -5%
Geekom A5
AMD Ryzen 7 5800H
13.3 fps -15%
R Benchmark 2.5 - Overall mean
Geekom A5
AMD Ryzen 7 5800H
0.523 sec * -5%
Aoostar GEM10
AMD Ryzen 7 6800H
0.515 sec * -3%
Minisforum UH125 Pro
Intel Core Ultra 5 125H
0.513 sec * -3%
Asus NUC 14 Pro
Intel Core Ultra 5 125H
0.4982 sec *
Acemagic F2A
Intel Core Ultra 7 155H
0.4652 sec * +7%
Geekom AE7
AMD Ryzen 9 7940HS
0.4346 sec * +13%
LibreOffice - 20 Documents To PDF
Minisforum UH125 Pro
Intel Core Ultra 5 125H
70.9 s * -27%
Asus NUC 14 Pro
Intel Core Ultra 5 125H
55.7 s *
Geekom A5
AMD Ryzen 7 5800H
54.3 s * +3%
Geekom AE7
AMD Ryzen 9 7940HS
53.7 s * +4%
Aoostar GEM10
AMD Ryzen 7 6800H
51.2 s * +8%
Acemagic F2A
Intel Core Ultra 7 155H
44.5 s * +20%
WebXPRT 3 - Overall
Geekom AE7
AMD Ryzen 9 7940HS
323 Points +27%
Acemagic F2A
Intel Core Ultra 7 155H
276 Points +9%
Aoostar GEM10
AMD Ryzen 7 6800H
275 Points +8%
Geekom A5
AMD Ryzen 7 5800H
269 Points +6%
Minisforum UH125 Pro
Intel Core Ultra 5 125H
254 Points 0%
Asus NUC 14 Pro
Intel Core Ultra 5 125H
254 Points
Mozilla Kraken 1.1 - Total
Geekom A5
AMD Ryzen 7 5800H
653 ms * -15%
Minisforum UH125 Pro
Intel Core Ultra 5 125H
595 ms * -5%
Aoostar GEM10
AMD Ryzen 7 6800H
591 ms * -4%
Asus NUC 14 Pro
Intel Core Ultra 5 125H
567 ms *
Acemagic F2A
Intel Core Ultra 7 155H
535 ms * +6%
Geekom AE7
AMD Ryzen 9 7940HS
510 ms * +10%
3DMark
1920x1080 Fire Strike Physics
Geekom AE7
AMD Ryzen 9 7940HS
26617 Points +16%
Acemagic F2A
Intel Core Ultra 7 155H
25043 Points +10%
Aoostar GEM10
AMD Ryzen 7 6800H
23807 Points +4%
Asus NUC 14 Pro
Intel Core Ultra 5 125H
22863 Points
Geekom A5
AMD Ryzen 7 5800H
22433 Points -2%
Minisforum UH125 Pro
Intel Core Ultra 5 125H
21391 Points -6%
2560x1440 Time Spy CPU
Geekom AE7
AMD Ryzen 9 7940HS
11049 Points +27%
Acemagic F2A
Intel Core Ultra 7 155H
10014 Points +15%
Minisforum UH125 Pro
Intel Core Ultra 5 125H
9182 Points +5%
Asus NUC 14 Pro
Intel Core Ultra 5 125H
8719 Points
Geekom A5
AMD Ryzen 7 5800H
8481 Points -3%
Aoostar GEM10
AMD Ryzen 7 6800H
8128 Points -7%
Super Pi mod 1.5 XS 1M - 1M
Geekom A5
AMD Ryzen 7 5800H
9.415 s * -26%
Aoostar GEM10
AMD Ryzen 7 6800H
7.839 s * -5%
Minisforum UH125 Pro
Intel Core Ultra 5 125H
7.744 s * -4%
Asus NUC 14 Pro
Intel Core Ultra 5 125H
7.444 s *
Acemagic F2A
Intel Core Ultra 7 155H
7.168 s * +4%
Geekom AE7
AMD Ryzen 9 7940HS
7.158 s * +4%
Super Pi mod 1.5 XS 2M - 2M
Geekom A5
AMD Ryzen 7 5800H
20.257 s * -23%
Aoostar GEM10
AMD Ryzen 7 6800H
19.101 s * -16%
Geekom AE7
AMD Ryzen 9 7940HS
17.904 s * -9%
Minisforum UH125 Pro
Intel Core Ultra 5 125H
16.967 s * -3%
Asus NUC 14 Pro
Intel Core Ultra 5 125H
16.446 s *
Acemagic F2A
Intel Core Ultra 7 155H
16.125 s * +2%
Super Pi Mod 1.5 XS 32M - 32M
Aoostar GEM10
AMD Ryzen 7 6800H
694.152 s * -76%
Geekom AE7
AMD Ryzen 9 7940HS
653.976 s * -66%
Geekom A5
AMD Ryzen 7 5800H
472.992 s * -20%
Minisforum UH125 Pro
Intel Core Ultra 5 125H
423.565 s * -7%
Acemagic F2A
Intel Core Ultra 7 155H
394.754 s * -0%
Asus NUC 14 Pro
Intel Core Ultra 5 125H
394.697 s *
Affinity Photo 2 - Combined (Multi CPU)
Acemagic F2A
Intel Core Ultra 7 155H
770 Points +30%
Geekom AE7
AMD Ryzen 9 7940HS
623 Points +5%
Minisforum UH125 Pro
Intel Core Ultra 5 125H
615 Points +4%
Asus NUC 14 Pro
Intel Core Ultra 5 125H
594 Points
Aoostar GEM10
AMD Ryzen 7 6800H
513 Points -14%
Geekom A5
AMD Ryzen 7 5800H
439 Points -26%

* ... Meglio usare valori piccoli

Cinebench R10 Rendering Single 32Bit
9561
Cinebench R10 Shading 64Bit
16957 Points
Cinebench R10 Rendering Multiple CPUs 64Bit
78788 Points
Cinebench R10 Rendering Single CPUs 64Bit
13281 Points
Cinebench R10 Shading 32Bit
16752
Cinebench R10 Rendering Multiple CPUs 32Bit
53390
Cinebench R11.5 CPU Single 32Bit
2.66 Points
Cinebench R11.5 CPU Multi 32Bit
24.31 Points
Cinebench R11.5 OpenGL 32Bit
101.29 fps
Cinebench R11.5 CPU Single 64Bit
3.03 Points
Cinebench R11.5 CPU Multi 64Bit
26.92 Points
Cinebench R11.5 OpenGL 64Bit
97.61 fps
Cinebench R15 CPU Single 64Bit
248 Points
Cinebench R15 CPU Multi 64Bit
2141 Points
Cinebench R15 Ref. Match 64Bit
97.8 %
Cinebench R15 OpenGL 64Bit
145.06 fps
Cinebench R20 CPU (Single Core)
622 Points
Cinebench R20 CPU (Multi Core)
5617 Points
Cinebench R23 Multi Core
14516 Points
Cinebench R23 Single Core
1721 Points
Cinebench 2024 CPU Single Core
102 Points
Cinebench 2024 CPU Multi Core
815 Points
Aiuto
Performance Rating
Geekom AE7
AMD Ryzen 9 7940HS, Radeon 780M
97.2 pt
Acemagic F2A
Intel Core Ultra 7 155H, Arc 8-Core
77.3 pt
Aoostar GEM10
AMD Ryzen 7 6800H, Radeon 680M
67.4 pt
Minisforum UH125 Pro
Intel Core Ultra 5 125H, Arc 7-Core
63.1 pt
Asus NUC 14 Pro
Intel Core Ultra 5 125H, Arc 7-Core
62.4 pt
Geekom A5
AMD Ryzen 7 5800H, Vega 8
61.4 pt
Media della classe Mini PC
 
57.1 pt
AIDA64 / FP32 Ray-Trace
Geekom AE7
AMD Ryzen 9 7940HS, Radeon 780M
26514 KRay/s +99%
Acemagic F2A
Intel Core Ultra 7 155H, Arc 8-Core
17544 KRay/s +31%
Aoostar GEM10
AMD Ryzen 7 6800H, Radeon 680M
13726 KRay/s +3%
Minisforum UH125 Pro
Intel Core Ultra 5 125H, Arc 7-Core
13639 KRay/s +2%
Asus NUC 14 Pro
Intel Core Ultra 5 125H, Arc 7-Core
13347 KRay/s
Media della classe Mini PC
  (646 - 51004, n=119, ultimi 2 anni)
12878 KRay/s -4%
Geekom A5
AMD Ryzen 7 5800H, Vega 8
12468 KRay/s -7%
AIDA64 / FPU Julia
Geekom AE7
AMD Ryzen 9 7940HS, Radeon 780M
112419 Points +64%
Acemagic F2A
Intel Core Ultra 7 155H, Arc 8-Core
88829 Points +30%
Aoostar GEM10
AMD Ryzen 7 6800H, Radeon 680M
86223 Points +26%
Geekom A5
AMD Ryzen 7 5800H, Vega 8
77847 Points +14%
Minisforum UH125 Pro
Intel Core Ultra 5 125H, Arc 7-Core
70880 Points +3%
Asus NUC 14 Pro
Intel Core Ultra 5 125H, Arc 7-Core
68551 Points
Media della classe Mini PC
  (3857 - 214250, n=119, ultimi 2 anni)
64921 Points -5%
AIDA64 / CPU SHA3
Geekom AE7
AMD Ryzen 9 7940HS, Radeon 780M
4898 MB/s +47%
Acemagic F2A
Intel Core Ultra 7 155H, Arc 8-Core
4246 MB/s +28%
Minisforum UH125 Pro
Intel Core Ultra 5 125H, Arc 7-Core
3404 MB/s +2%
Asus NUC 14 Pro
Intel Core Ultra 5 125H, Arc 7-Core
3323 MB/s
Aoostar GEM10
AMD Ryzen 7 6800H, Radeon 680M
2953 MB/s -11%
Media della classe Mini PC
  (260 - 9399, n=119, ultimi 2 anni)
2856 MB/s -14%
Geekom A5
AMD Ryzen 7 5800H, Vega 8
2707 MB/s -19%
AIDA64 / CPU Queen
Geekom AE7
AMD Ryzen 9 7940HS, Radeon 780M
119250 Points +49%
Aoostar GEM10
AMD Ryzen 7 6800H, Radeon 680M
98582 Points +23%
Geekom A5
AMD Ryzen 7 5800H, Vega 8
91846 Points +15%
Acemagic F2A
Intel Core Ultra 7 155H, Arc 8-Core
89748 Points +12%
Media della classe Mini PC
  (8172 - 184747, n=119, ultimi 2 anni)
80187 Points 0%
Asus NUC 14 Pro
Intel Core Ultra 5 125H, Arc 7-Core
79866 Points
Minisforum UH125 Pro
Intel Core Ultra 5 125H, Arc 7-Core
78098 Points -2%
AIDA64 / FPU SinJulia
Geekom AE7
AMD Ryzen 9 7940HS, Radeon 780M
14976 Points +91%
Aoostar GEM10
AMD Ryzen 7 6800H, Radeon 680M
12159 Points +55%
Geekom A5
AMD Ryzen 7 5800H, Vega 8
10972 Points +40%
Acemagic F2A
Intel Core Ultra 7 155H, Arc 8-Core
10247 Points +31%
Media della classe Mini PC
  (408 - 29064, n=119, ultimi 2 anni)
8812 Points +12%
Asus NUC 14 Pro
Intel Core Ultra 5 125H, Arc 7-Core
7851 Points
Minisforum UH125 Pro
Intel Core Ultra 5 125H, Arc 7-Core
7842 Points 0%
AIDA64 / FPU Mandel
Geekom AE7
AMD Ryzen 9 7940HS, Radeon 780M
60098 Points +76%
Aoostar GEM10
AMD Ryzen 7 6800H, Radeon 680M
47463 Points +39%
Acemagic F2A
Intel Core Ultra 7 155H, Arc 8-Core
45718 Points +34%
Geekom A5
AMD Ryzen 7 5800H, Vega 8
42543 Points +24%
Minisforum UH125 Pro
Intel Core Ultra 5 125H, Arc 7-Core
35321 Points +3%
Asus NUC 14 Pro
Intel Core Ultra 5 125H, Arc 7-Core
34225 Points
Media della classe Mini PC
  (1987 - 113499, n=119, ultimi 2 anni)
33863 Points -1%
AIDA64 / CPU AES
Geekom AE7
AMD Ryzen 9 7940HS, Radeon 780M
167583 MB/s +161%
Acemagic F2A
Intel Core Ultra 7 155H, Arc 8-Core
144741 MB/s +126%
Aoostar GEM10
AMD Ryzen 7 6800H, Radeon 680M
119681 MB/s +87%
Geekom A5
AMD Ryzen 7 5800H, Vega 8
108262 MB/s +69%
Media della classe Mini PC
  (3691 - 325960, n=119, ultimi 2 anni)
88382 MB/s +38%
Minisforum UH125 Pro
Intel Core Ultra 5 125H, Arc 7-Core
65304 MB/s +2%
Asus NUC 14 Pro
Intel Core Ultra 5 125H, Arc 7-Core
64107 MB/s
AIDA64 / CPU ZLib
Acemagic F2A
Intel Core Ultra 7 155H, Arc 8-Core
1183 MB/s +22%
Geekom AE7
AMD Ryzen 9 7940HS, Radeon 780M
1015 MB/s +5%
Minisforum UH125 Pro
Intel Core Ultra 5 125H, Arc 7-Core
994 MB/s +3%
Asus NUC 14 Pro
Intel Core Ultra 5 125H, Arc 7-Core
969 MB/s
Aoostar GEM10
AMD Ryzen 7 6800H, Radeon 680M
757 MB/s -22%
Media della classe Mini PC
  (74.9 - 2039, n=119, ultimi 2 anni)
740 MB/s -24%
Geekom A5
AMD Ryzen 7 5800H, Vega 8
700 MB/s -28%
AIDA64 / FP64 Ray-Trace
Geekom AE7
AMD Ryzen 9 7940HS, Radeon 780M
14162 KRay/s +109%
Acemagic F2A
Intel Core Ultra 7 155H, Arc 8-Core
9284 KRay/s +37%
Aoostar GEM10
AMD Ryzen 7 6800H, Radeon 680M
7279 KRay/s +7%
Minisforum UH125 Pro
Intel Core Ultra 5 125H, Arc 7-Core
7221 KRay/s +6%
Media della classe Mini PC
  (350 - 26952, n=119, ultimi 2 anni)
6881 KRay/s +1%
Asus NUC 14 Pro
Intel Core Ultra 5 125H, Arc 7-Core
6786 KRay/s
Geekom A5
AMD Ryzen 7 5800H, Vega 8
6380 KRay/s -6%
AIDA64 / CPU PhotoWorxx
Asus NUC 14 Pro
Intel Core Ultra 5 125H, Arc 7-Core
47377 MPixel/s
Minisforum UH125 Pro
Intel Core Ultra 5 125H, Arc 7-Core
45789 MPixel/s -3%
Geekom AE7
AMD Ryzen 9 7940HS, Radeon 780M
40690 MPixel/s -14%
Acemagic F2A
Intel Core Ultra 7 155H, Arc 8-Core
33092 MPixel/s -30%
Media della classe Mini PC
  (4408 - 50500, n=119, ultimi 2 anni)
28301 MPixel/s -40%
Aoostar GEM10
AMD Ryzen 7 6800H, Radeon 680M
26496 MPixel/s -44%
Geekom A5
AMD Ryzen 7 5800H, Vega 8
25113 MPixel/s -47%

Cinebench R15 Multi loop

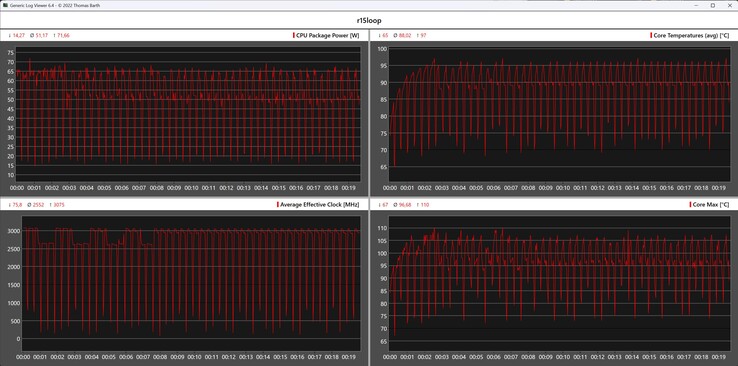
Sfortunatamente, l'Asus NUC 14 Pro non riesce a mantenere le sue prestazioni leggermente migliori della CPU nel ciclo continuo di Cinebench R15 rispetto al Minisforum UH125 Pro. L'aumento delle temperature della CPU causa ripetutamente cali di prestazioni a breve termine, motivo per cui i risultati non sono molto coerenti. Con una media di 2.021 punti, l'Asus NUC 14 Pro non riesce a battere il Minisforum UH125 Pro.

Metriche della CPU durante il ciclo di Cinebench R15
01452904355807258701015116013051450159517401885203021752320246526102755Tooltip
Asus NUC 14 Pro Intel Core Ultra 5 125H, Intel Core Ultra 5 125H: Ø2021 (1900.15-2203.13)
Geekom AE7 AMD Ryzen 9 7940HS, AMD Ryzen 9 7940HS: Ø2563 (2486.79-2630.54)
Minisforum UH125 Pro Intel Core Ultra 5 125H, Intel Core Ultra 5 125H: Ø2186 (2040.4-2248.33)
Aoostar GEM10 AMD Ryzen 7 6800H, AMD Ryzen 7 6800H: Ø1983 (1919.75-2106.82)
Acemagic F2A Intel Core Ultra 7 155H, Intel Core Ultra 7 155H: Ø2759 (2690.7-2800.92)
Geekom A5 AMD Ryzen 7 5800H, AMD Ryzen 7 5800H: Ø1715 (1692.05-1838.74)

Prestazioni del sistema

Le prestazioni del sistema riflettono esattamente ciò che è possibile fare con l' Intel Core Ultra 5 125H. Basato sullo stesso SoC, il Minisforum UH125 Pro è il principale concorrente e offre prestazioni simili all'Asus NUC 14 Pro. Soggettivamente, l'Asus NUC 14 Pro offre eccellenti prestazioni quotidiane e il nostro campione di prova può assicurarsi il secondo posto nei test della RAM.

PCMark 10 / Score
Geekom AE7, AMD Ryzen 9 7940HS
AMD Radeon 780M, Wodposit NVMe SSD 1024 GB
7520 Points +20%
Acemagic F2A, Intel Core Ultra 7 155H
Intel Arc 8-Core iGPU, Kingston OM8SEP1024Q-A0
7120 Points +13%
Aoostar GEM10, AMD Ryzen 7 6800H
AMD Radeon 680M, BIWIN CE980Y28900-1TB
6749 Points +7%
Asus NUC 14 Pro, Intel Core Ultra 5 125H
Intel Arc 7-Core iGPU, Kingston KC3000 2048G SKC3000D2048G
6282 Points
Minisforum UH125 Pro, Intel Core Ultra 5 125H
Intel Arc 7-Core iGPU, Kingston OM8PGP41024Q-A0
6194 Points -1%
Geekom A5, AMD Ryzen 7 5800H
AMD Radeon RX Vega 8 (Ryzen 4000/5000), Lexar NM620 512GB
6149 Points -2%
PCMark 10 / Essentials
Acemagic F2A, Intel Core Ultra 7 155H
Intel Arc 8-Core iGPU, Kingston OM8SEP1024Q-A0
11125 Points +11%
Geekom AE7, AMD Ryzen 9 7940HS
AMD Radeon 780M, Wodposit NVMe SSD 1024 GB
11058 Points +10%
Aoostar GEM10, AMD Ryzen 7 6800H
AMD Radeon 680M, BIWIN CE980Y28900-1TB
10522 Points +5%
Geekom A5, AMD Ryzen 7 5800H
AMD Radeon RX Vega 8 (Ryzen 4000/5000), Lexar NM620 512GB
10356 Points +3%
Asus NUC 14 Pro, Intel Core Ultra 5 125H
Intel Arc 7-Core iGPU, Kingston KC3000 2048G SKC3000D2048G
10050 Points
Minisforum UH125 Pro, Intel Core Ultra 5 125H
Intel Arc 7-Core iGPU, Kingston OM8PGP41024Q-A0
9427 Points -6%
PCMark 10 / Productivity
Geekom AE7, AMD Ryzen 9 7940HS
AMD Radeon 780M, Wodposit NVMe SSD 1024 GB
10717 Points +52%
Aoostar GEM10, AMD Ryzen 7 6800H
AMD Radeon 680M, BIWIN CE980Y28900-1TB
9367 Points +33%
Geekom A5, AMD Ryzen 7 5800H
AMD Radeon RX Vega 8 (Ryzen 4000/5000), Lexar NM620 512GB
9311 Points +32%
Acemagic F2A, Intel Core Ultra 7 155H
Intel Arc 8-Core iGPU, Kingston OM8SEP1024Q-A0
8901 Points +26%
Minisforum UH125 Pro, Intel Core Ultra 5 125H
Intel Arc 7-Core iGPU, Kingston OM8PGP41024Q-A0
7715 Points +10%
Asus NUC 14 Pro, Intel Core Ultra 5 125H
Intel Arc 7-Core iGPU, Kingston KC3000 2048G SKC3000D2048G
7042 Points
CrossMark / Overall
Geekom AE7, AMD Ryzen 9 7940HS
AMD Radeon 780M, Wodposit NVMe SSD 1024 GB
1813 Points +19%
Acemagic F2A, Intel Core Ultra 7 155H
Intel Arc 8-Core iGPU, Kingston OM8SEP1024Q-A0
1802 Points +18%
Aoostar GEM10, AMD Ryzen 7 6800H
AMD Radeon 680M, BIWIN CE980Y28900-1TB
1648 Points +8%
Minisforum UH125 Pro, Intel Core Ultra 5 125H
Intel Arc 7-Core iGPU, Kingston OM8PGP41024Q-A0
1533 Points +1%
Asus NUC 14 Pro, Intel Core Ultra 5 125H
Intel Arc 7-Core iGPU, Kingston KC3000 2048G SKC3000D2048G
1522 Points
Geekom A5, AMD Ryzen 7 5800H
AMD Radeon RX Vega 8 (Ryzen 4000/5000), Lexar NM620 512GB
1429 Points -6%
CrossMark / Responsiveness
Acemagic F2A, Intel Core Ultra 7 155H
Intel Arc 8-Core iGPU, Kingston OM8SEP1024Q-A0
1700 Points +45%
Aoostar GEM10, AMD Ryzen 7 6800H
AMD Radeon 680M, BIWIN CE980Y28900-1TB
1566 Points +34%
Geekom AE7, AMD Ryzen 9 7940HS
AMD Radeon 780M, Wodposit NVMe SSD 1024 GB
1527 Points +30%
Minisforum UH125 Pro, Intel Core Ultra 5 125H
Intel Arc 7-Core iGPU, Kingston OM8PGP41024Q-A0
1332 Points +14%
Geekom A5, AMD Ryzen 7 5800H
AMD Radeon RX Vega 8 (Ryzen 4000/5000), Lexar NM620 512GB
1233 Points +5%
Asus NUC 14 Pro, Intel Core Ultra 5 125H
Intel Arc 7-Core iGPU, Kingston KC3000 2048G SKC3000D2048G
1171 Points
CrossMark / Creativity
Geekom AE7, AMD Ryzen 9 7940HS
AMD Radeon 780M, Wodposit NVMe SSD 1024 GB
2011 Points +14%
Acemagic F2A, Intel Core Ultra 7 155H
Intel Arc 8-Core iGPU, Kingston OM8SEP1024Q-A0
1929 Points +9%
Asus NUC 14 Pro, Intel Core Ultra 5 125H
Intel Arc 7-Core iGPU, Kingston KC3000 2048G SKC3000D2048G
1765 Points
Aoostar GEM10, AMD Ryzen 7 6800H
AMD Radeon 680M, BIWIN CE980Y28900-1TB
1696 Points -4%
Minisforum UH125 Pro, Intel Core Ultra 5 125H
Intel Arc 7-Core iGPU, Kingston OM8PGP41024Q-A0
1683 Points -5%
Geekom A5, AMD Ryzen 7 5800H
AMD Radeon RX Vega 8 (Ryzen 4000/5000), Lexar NM620 512GB
1523 Points -14%
CrossMark / Productivity
Geekom AE7, AMD Ryzen 9 7940HS
AMD Radeon 780M, Wodposit NVMe SSD 1024 GB
1731 Points +21%
Acemagic F2A, Intel Core Ultra 7 155H
Intel Arc 8-Core iGPU, Kingston OM8SEP1024Q-A0
1717 Points +20%
Aoostar GEM10, AMD Ryzen 7 6800H
AMD Radeon 680M, BIWIN CE980Y28900-1TB
1629 Points +14%
Minisforum UH125 Pro, Intel Core Ultra 5 125H
Intel Arc 7-Core iGPU, Kingston OM8PGP41024Q-A0
1463 Points +2%
Asus NUC 14 Pro, Intel Core Ultra 5 125H
Intel Arc 7-Core iGPU, Kingston KC3000 2048G SKC3000D2048G
1432 Points
Geekom A5, AMD Ryzen 7 5800H
AMD Radeon RX Vega 8 (Ryzen 4000/5000), Lexar NM620 512GB
1408 Points -2%
AIDA64 / Memory Copy
Minisforum UH125 Pro
Intel Core Ultra 5 125H, Arc 7-Core
69592 MB/s 0%
Asus NUC 14 Pro
Intel Core Ultra 5 125H, Arc 7-Core
69264 MB/s
Geekom AE7
AMD Ryzen 9 7940HS, Radeon 780M
68449 MB/s -1%
Acemagic F2A
Intel Core Ultra 7 155H, Arc 8-Core
62397 MB/s -10%
Aoostar GEM10
AMD Ryzen 7 6800H, Radeon 680M
50829 MB/s -27%
Media della classe Mini PC
  (6481 - 89287, n=119, ultimi 2 anni)
48357 MB/s -30%
Geekom A5
AMD Ryzen 7 5800H, Vega 8
43870 MB/s -37%
AIDA64 / Memory Read
Asus NUC 14 Pro
Intel Core Ultra 5 125H, Arc 7-Core
74415 MB/s
Minisforum UH125 Pro
Intel Core Ultra 5 125H, Arc 7-Core
72711 MB/s -2%
Acemagic F2A
Intel Core Ultra 7 155H, Arc 8-Core
64323 MB/s -14%
Geekom AE7
AMD Ryzen 9 7940HS, Radeon 780M
61836 MB/s -17%
Media della classe Mini PC
  (6914 - 99171, n=119, ultimi 2 anni)
49177 MB/s -34%
Geekom A5
AMD Ryzen 7 5800H, Vega 8
46241 MB/s -38%
Aoostar GEM10
AMD Ryzen 7 6800H, Radeon 680M
43828 MB/s -41%
AIDA64 / Memory Write
Geekom AE7
AMD Ryzen 9 7940HS, Radeon 780M
87118 MB/s +20%
Asus NUC 14 Pro
Intel Core Ultra 5 125H, Arc 7-Core
72443 MB/s
Minisforum UH125 Pro
Intel Core Ultra 5 125H, Arc 7-Core
71514 MB/s -1%
Acemagic F2A
Intel Core Ultra 7 155H, Arc 8-Core
65057 MB/s -10%
Media della classe Mini PC
  (6862 - 98583, n=119, ultimi 2 anni)
52856 MB/s -27%
Aoostar GEM10
AMD Ryzen 7 6800H, Radeon 680M
51116 MB/s -29%
Geekom A5
AMD Ryzen 7 5800H, Vega 8
46407 MB/s -36%
AIDA64 / Memory Latency
Minisforum UH125 Pro
Intel Core Ultra 5 125H, Arc 7-Core
184.8 ns * -45%
Acemagic F2A
Intel Core Ultra 7 155H, Arc 8-Core
149 ns * -17%
Asus NUC 14 Pro
Intel Core Ultra 5 125H, Arc 7-Core
127.3 ns *
Aoostar GEM10
AMD Ryzen 7 6800H, Radeon 680M
104.1 ns * +18%
Media della classe Mini PC
  (44.9 - 184.8, n=119, ultimi 2 anni)
92.1 ns * +28%
Geekom AE7
AMD Ryzen 9 7940HS, Radeon 780M
90 ns * +29%
Geekom A5
AMD Ryzen 7 5800H, Vega 8
81.4 ns * +36%

* ... Meglio usare valori piccoli

UL Procyon for Windows
Overall Score Integer NPU
Asus NUC 14 Pro
Intel Core Ultra 5 125H, Arc 7-Core
508 Points
Minisforum UH125 Pro
Intel Core Ultra 5 125H, Arc 7-Core
501 Points -1%
Acemagic F2A
Intel Core Ultra 7 155H, Arc 8-Core
499 Points -2%
Overall Score Integer GPU
Asus NUC 14 Pro
Intel Core Ultra 5 125H, Arc 7-Core
741 Points
Acemagic F2A
Intel Core Ultra 7 155H, Arc 8-Core
684 Points -8%
Minisforum UH125 Pro
Intel Core Ultra 5 125H, Arc 7-Core
547 Points -26%

Latenze DPC

Le latenze DPC dell'Asus NUC 14 Pro non sono convincenti. Anche durante la semplice navigazione in Internet, notiamo valori elevati, che peggiorano ulteriormente durante la riproduzione del video di test 4K. I futuri aggiornamenti del BIOS o dei driver potrebbero garantire miglioramenti in questo ambito in futuro.

Latenza massima quando si aprono più schede del browser
Latenza massima durante la riproduzione di materiale video 4K
Latenza massima dopo dieci secondi di Prime95
Driver classificati in base al tempo di esecuzione più lungo
DPC Latencies / LatencyMon - interrupt to process latency (max), Web, Youtube, Prime95
Asus NUC 14 Pro
Arc 7-Core, Ultra 5 125H, Kingston KC3000 2048G SKC3000D2048G
2776 μs *
Acemagic F2A
Arc 8-Core, Ultra 7 155H, Kingston OM8SEP1024Q-A0
2724 μs * +2%
Geekom AE7
Radeon 780M, R9 7940HS, Wodposit NVMe SSD 1024 GB
2198.8 μs * +21%
Minisforum UH125 Pro
Arc 7-Core, Ultra 5 125H, Kingston OM8PGP41024Q-A0
1438 μs * +48%
Geekom A5
Vega 8, R7 5800H, Lexar NM620 512GB
1310.5 μs * +53%
Aoostar GEM10
Radeon 680M, R7 6800H, BIWIN CE980Y28900-1TB
962.8 μs * +65%

* ... Meglio usare valori piccoli

Memoria di massa

Test SSD di Kingston

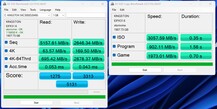
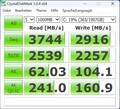
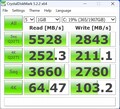
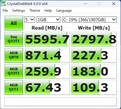
Abbiamo equipaggiato il dispositivo di prova con un SSD Kingston KC3000. Le prestazioni teoriche dell'SSD non possono essere raggiunte nella pratica. Ciononostante, abbiamo registrato risultati relativamente buoni, che hanno significato un buon terzo posto assoluto. Si notano lievi problemi nel test di stress: In combinazione con il Kingston SC3000 utilizzato, le prestazioni di lettura non possono essere mantenute stabilmente allo stesso livello.

Per ulteriori confronti e benchmark, consulti la nostra tabella di confronto Laptop SSD & HDD Benchmarks .

AS SSD
AS SSD
CDM 3
CDM 3
CDM 5
CDM 5
CDM 6
CDM 6
CDI
CDI
Kingston KC3000 2048G SKC3000D2048G
Sequential Read: 3744 MB/s
Sequential Write: 2916 MB/s
512K Read: 2539 MB/s
512K Write: 2257 MB/s
4K Read: 62.03 MB/s
4K Write: 104.1 MB/s
4K QD32 Read: 241 MB/s
4K QD32 Write: 160.9 MB/s
Drive Performance Rating - Percent
Aoostar GEM10
BIWIN CE980Y28900-1TB
86.8 pt
Geekom AE7
Wodposit NVMe SSD 1024 GB
76.3 pt
Asus NUC 14 Pro
Kingston KC3000 2048G SKC3000D2048G
70.6 pt
Media della classe Mini PC
 
60.4 pt
Minisforum UH125 Pro
Kingston OM8PGP41024Q-A0
59.7 pt
Acemagic F2A
Kingston OM8SEP1024Q-A0
59.2 pt
Geekom A5
Lexar NM620 512GB
59 pt
DiskSpd
seq read
Aoostar GEM10
BIWIN CE980Y28900-1TB
4000 (3961.36min - 3999.66max) MB/s +8%
Asus NUC 14 Pro
Kingston KC3000 2048G SKC3000D2048G
3706 (3594.04min - 3706.37max) MB/s
Geekom AE7
Wodposit NVMe SSD 1024 GB
2411 (2346.63min - 2410.89max) MB/s -35%
Geekom A5
Lexar NM620 512GB
2371 (2315.68min - 2370.91max) MB/s -36%
Minisforum UH125 Pro
Kingston OM8PGP41024Q-A0
2351 (2320.68min - 2350.61max) MB/s -37%
Media della classe Mini PC
  (277 - 4357, n=119, ultimi 2 anni)
2333 MB/s -37%
Acemagic F2A
Kingston OM8SEP1024Q-A0
1674 (1242.56min - 1673.54max) MB/s -55%
seq write
Aoostar GEM10
BIWIN CE980Y28900-1TB
4553 (4417.86min - 4552.92max) MB/s +55%
Geekom AE7
Wodposit NVMe SSD 1024 GB
3650 (3239.07min - 3649.71max) MB/s +25%
Minisforum UH125 Pro
Kingston OM8PGP41024Q-A0
3331 (3244.92min - 3330.75max) MB/s +14%
Asus NUC 14 Pro
Kingston KC3000 2048G SKC3000D2048G
2928 (1958.53min - 2927.62max) MB/s
Geekom A5
Lexar NM620 512GB
2668 (292.6min - 2668max) MB/s -9%
Media della classe Mini PC
  (229 - 5595, n=119, ultimi 2 anni)
2509 MB/s -14%
Acemagic F2A
Kingston OM8SEP1024Q-A0
1348 (1117.85min - 1347.87max) MB/s -54%
seq q8 t1 read
Asus NUC 14 Pro
Kingston KC3000 2048G SKC3000D2048G
7110 (6058.21min - 7110.02max) MB/s
Geekom AE7
Wodposit NVMe SSD 1024 GB
4939 (4360.49min - 4938.56max) MB/s -31%
Aoostar GEM10
BIWIN CE980Y28900-1TB
4878 (4476.29min - 4877.98max) MB/s -31%
Minisforum UH125 Pro
Kingston OM8PGP41024Q-A0
4802 (4169.19min - 4801.68max) MB/s -32%
Media della classe Mini PC
  (236 - 8430, n=119, ultimi 2 anni)
3790 MB/s -47%
Geekom A5
Lexar NM620 512GB
3444 (2979.63min - 3443.98max) MB/s -52%
Acemagic F2A
Kingston OM8SEP1024Q-A0
3194 (2810.81min - 3194.17max) MB/s -55%
seq q8 t1 write
Asus NUC 14 Pro
Kingston KC3000 2048G SKC3000D2048G
4712 (3064.99min - 4711.88max) MB/s
Aoostar GEM10
BIWIN CE980Y28900-1TB
4505 (4403.81min - 4505.09max) MB/s -4%
Geekom AE7
Wodposit NVMe SSD 1024 GB
4273 (4238.26min - 4272.58max) MB/s -9%
Minisforum UH125 Pro
Kingston OM8PGP41024Q-A0
3902 (3839.68min - 3901.75max) MB/s -17%
Geekom A5
Lexar NM620 512GB
3117 (3075.4min - 3117.21max) MB/s -34%
Media della classe Mini PC
  (239 - 6669, n=119, ultimi 2 anni)
2810 MB/s -40%
Acemagic F2A
Kingston OM8SEP1024Q-A0
2212 (1222.43min - 2212.27max) MB/s -53%
4k q1 t1 read
Aoostar GEM10
BIWIN CE980Y28900-1TB
61.7 (61.26min - 61.71max) MB/s +16%
Minisforum UH125 Pro
Kingston OM8PGP41024Q-A0
60 (58.44min - 60.02max) MB/s +12%
Media della classe Mini PC
  (6.85 - 86.6, n=119, ultimi 2 anni)
55.3 MB/s +4%
Geekom A5
Lexar NM620 512GB
54.5 (37.15min - 54.54max) MB/s +2%
Asus NUC 14 Pro
Kingston KC3000 2048G SKC3000D2048G
53.4 (49.89min - 53.35max) MB/s
Geekom AE7
Wodposit NVMe SSD 1024 GB
48.1 (43.1min - 48.11max) MB/s -10%
Acemagic F2A
Kingston OM8SEP1024Q-A0
47.3 (47.07min - 47.31max) MB/s -11%
4k q1 t1 write
Aoostar GEM10
BIWIN CE980Y28900-1TB
235 (230.8min - 235.02max) MB/s +183%
Media della classe Mini PC
  (30.4 - 435, n=119, ultimi 2 anni)
196.9 MB/s +137%
Acemagic F2A
Kingston OM8SEP1024Q-A0
187.2 (181.54min - 187.2max) MB/s +125%
Geekom AE7
Wodposit NVMe SSD 1024 GB
184.8 (177.47min - 184.84max) MB/s +122%
Geekom A5
Lexar NM620 512GB
148.4 (147.43min - 148.38max) MB/s +79%
Minisforum UH125 Pro
Kingston OM8PGP41024Q-A0
136.8 (131.56min - 136.81max) MB/s +65%
Asus NUC 14 Pro
Kingston KC3000 2048G SKC3000D2048G
83.1 (75.3min - 83.11max) MB/s
4k q32 t16 read
Aoostar GEM10
BIWIN CE980Y28900-1TB
2004 (2002.37min - 2004.23max) MB/s +174%
Geekom A5
Lexar NM620 512GB
1960 MB/s +168%
Acemagic F2A
Kingston OM8SEP1024Q-A0
1824 (1239.47min - 1824.09max) MB/s +150%
Geekom AE7
Wodposit NVMe SSD 1024 GB
1580 (1549.8min - 1579.65max) MB/s +116%
Media della classe Mini PC
  (26.1 - 4158, n=119, ultimi 2 anni)
1411 MB/s +93%
Asus NUC 14 Pro
Kingston KC3000 2048G SKC3000D2048G
731 (660.89min - 731.29max) MB/s
Minisforum UH125 Pro
Kingston OM8PGP41024Q-A0
698 (691.89min - 697.84max) MB/s -5%
4k q32 t16 write
Aoostar GEM10
BIWIN CE980Y28900-1TB
2681 (2560.18min - 2680.76max) MB/s +1336%
Acemagic F2A
Kingston OM8SEP1024Q-A0
1434 (1410.26min - 1433.71max) MB/s +668%
Geekom A5
Lexar NM620 512GB
1370 (84.65min - 1370.23max) MB/s +634%
Media della classe Mini PC
  (32.6 - 4288, n=119, ultimi 2 anni)
1332 MB/s +613%
Geekom AE7
Wodposit NVMe SSD 1024 GB
627 (618.33min - 627.08max) MB/s +236%
Minisforum UH125 Pro
Kingston OM8PGP41024Q-A0
311 (252.72min - 310.91max) MB/s +67%
Asus NUC 14 Pro
Kingston KC3000 2048G SKC3000D2048G
186.7 (155.05min - 186.74max) MB/s
AS SSD
Score Total
Geekom AE7
Wodposit NVMe SSD 1024 GB
6354 Points +24%
Aoostar GEM10
BIWIN CE980Y28900-1TB
6147 Points +20%
Asus NUC 14 Pro
Kingston KC3000 2048G SKC3000D2048G
5131 Points
Acemagic F2A
Kingston OM8SEP1024Q-A0
4412 Points -14%
Media della classe Mini PC
  (211 - 10021, n=117, ultimi 2 anni)
4244 Points -17%
Geekom A5
Lexar NM620 512GB
4006 Points -22%
Minisforum UH125 Pro
Kingston OM8PGP41024Q-A0
3878 Points -24%
Score Read
Aoostar GEM10
BIWIN CE980Y28900-1TB
2109 Points +65%
Geekom AE7
Wodposit NVMe SSD 1024 GB
1757 Points +38%
Media della classe Mini PC
  (76 - 3741, n=117, ultimi 2 anni)
1578 Points +24%
Acemagic F2A
Kingston OM8SEP1024Q-A0
1561 Points +22%
Geekom A5
Lexar NM620 512GB
1502 Points +18%
Asus NUC 14 Pro
Kingston KC3000 2048G SKC3000D2048G
1275 Points
Minisforum UH125 Pro
Kingston OM8PGP41024Q-A0
1096 Points -14%
Score Write
Geekom AE7
Wodposit NVMe SSD 1024 GB
3759 Points +13%
Asus NUC 14 Pro
Kingston KC3000 2048G SKC3000D2048G
3313 Points
Aoostar GEM10
BIWIN CE980Y28900-1TB
2964 Points -11%
Minisforum UH125 Pro
Kingston OM8PGP41024Q-A0
2306 Points -30%
Acemagic F2A
Kingston OM8SEP1024Q-A0
2082 Points -37%
Media della classe Mini PC
  (88 - 4371, n=117, ultimi 2 anni)
1902 Points -43%
Geekom A5
Lexar NM620 512GB
1739 Points -48%
Seq Read
Asus NUC 14 Pro
Kingston KC3000 2048G SKC3000D2048G
5158 MB/s
Aoostar GEM10
BIWIN CE980Y28900-1TB
4264 MB/s -17%
Geekom AE7
Wodposit NVMe SSD 1024 GB
3891 MB/s -25%
Minisforum UH125 Pro
Kingston OM8PGP41024Q-A0
3808 MB/s -26%
Media della classe Mini PC
  (291 - 6620, n=117, ultimi 2 anni)
3231 MB/s -37%
Geekom A5
Lexar NM620 512GB
3020 MB/s -41%
Acemagic F2A
Kingston OM8SEP1024Q-A0
3010 MB/s -42%
Seq Write
Aoostar GEM10
BIWIN CE980Y28900-1TB
3970 MB/s +50%
Geekom A5
Lexar NM620 512GB
2714 MB/s +3%
Asus NUC 14 Pro
Kingston KC3000 2048G SKC3000D2048G
2646 MB/s
Geekom AE7
Wodposit NVMe SSD 1024 GB
2526 MB/s -5%
Acemagic F2A
Kingston OM8SEP1024Q-A0
2369 MB/s -10%
Media della classe Mini PC
  (242 - 5783, n=117, ultimi 2 anni)
2292 MB/s -13%
Minisforum UH125 Pro
Kingston OM8PGP41024Q-A0
1787 MB/s -32%
4K Read
Aoostar GEM10
BIWIN CE980Y28900-1TB
68.4 MB/s +8%
Asus NUC 14 Pro
Kingston KC3000 2048G SKC3000D2048G
63.6 MB/s
Media della classe Mini PC
  (21.4 - 104.3, n=117, ultimi 2 anni)
59.7 MB/s -6%
Geekom A5
Lexar NM620 512GB
57.7 MB/s -9%
Minisforum UH125 Pro
Kingston OM8PGP41024Q-A0
57.3 MB/s -10%
Geekom AE7
Wodposit NVMe SSD 1024 GB
55.2 MB/s -13%
Acemagic F2A
Kingston OM8SEP1024Q-A0
41.8 MB/s -34%
4K Write
Acemagic F2A
Kingston OM8SEP1024Q-A0
196.9 MB/s +16%
Aoostar GEM10
BIWIN CE980Y28900-1TB
196.5 MB/s +16%
Geekom AE7
Wodposit NVMe SSD 1024 GB
195.5 MB/s +15%
Minisforum UH125 Pro
Kingston OM8PGP41024Q-A0
182.1 MB/s +7%
Media della classe Mini PC
  (30.9 - 366, n=117, ultimi 2 anni)
177.5 MB/s +5%
Asus NUC 14 Pro
Kingston KC3000 2048G SKC3000D2048G
169.5 MB/s
Geekom A5
Lexar NM620 512GB
125.5 MB/s -26%
4K-64 Read
Aoostar GEM10
BIWIN CE980Y28900-1TB
1614 MB/s +132%
Geekom AE7
Wodposit NVMe SSD 1024 GB
1313 MB/s +89%
Acemagic F2A
Kingston OM8SEP1024Q-A0
1218 MB/s +75%
Media della classe Mini PC
  (23.4 - 3220, n=117, ultimi 2 anni)
1195 MB/s +72%
Geekom A5
Lexar NM620 512GB
1143 MB/s +64%
Asus NUC 14 Pro
Kingston KC3000 2048G SKC3000D2048G
695 MB/s
Minisforum UH125 Pro
Kingston OM8PGP41024Q-A0
658 MB/s -5%
4K-64 Write
Geekom AE7
Wodposit NVMe SSD 1024 GB
3311 MB/s +15%
Asus NUC 14 Pro
Kingston KC3000 2048G SKC3000D2048G
2878 MB/s
Aoostar GEM10
BIWIN CE980Y28900-1TB
2370 MB/s -18%
Minisforum UH125 Pro
Kingston OM8PGP41024Q-A0
1945 MB/s -32%
Acemagic F2A
Kingston OM8SEP1024Q-A0
1649 MB/s -43%
Media della classe Mini PC
  (32.8 - 3731, n=117, ultimi 2 anni)
1495 MB/s -48%
Geekom A5
Lexar NM620 512GB
1342 MB/s -53%
Access Time Read
Minisforum UH125 Pro
Kingston OM8PGP41024Q-A0
0.101 ms * -91%
Aoostar GEM10
BIWIN CE980Y28900-1TB
0.098 ms * -85%
Media della classe Mini PC
  (0.022 - 0.489, n=117, ultimi 2 anni)
0.09579 ms * -81%
Geekom A5
Lexar NM620 512GB
0.08 ms * -51%
Geekom AE7
Wodposit NVMe SSD 1024 GB
0.077 ms * -45%
Asus NUC 14 Pro
Kingston KC3000 2048G SKC3000D2048G
0.053 ms *
Acemagic F2A
Kingston OM8SEP1024Q-A0
0.046 ms * +13%
Access Time Write
Geekom A5
Lexar NM620 512GB
0.13 ms * -202%
Acemagic F2A
Kingston OM8SEP1024Q-A0
0.126 ms * -193%
Media della classe Mini PC
  (0.014 - 0.765, n=117, ultimi 2 anni)
0.1133 ms * -163%
Aoostar GEM10
BIWIN CE980Y28900-1TB
0.061 ms * -42%
Asus NUC 14 Pro
Kingston KC3000 2048G SKC3000D2048G
0.043 ms *
Minisforum UH125 Pro
Kingston OM8PGP41024Q-A0
0.024 ms * +44%
Geekom AE7
Wodposit NVMe SSD 1024 GB
0.023 ms * +47%

* ... Meglio usare valori piccoli

Continuous read: DiskSpd Read Loop, Queue Depth 8

036072010801440180021602520288032403600396043204680504054005760612064806840Tooltip
Asus NUC 14 Pro Kingston KC3000 2048G SKC3000D2048G; diskspd 2.0.17 f: Ø6306 (1073.74-7111.48)
Geekom AE7 Wodposit NVMe SSD 1024 GB; diskspd 2.0.17 f: Ø4932 (4634.29-4944.25)
Minisforum UH125 Pro Kingston OM8PGP41024Q-A0; diskspd 2.0.17 f: Ø4790 (4223.81-4803.95)
Aoostar GEM10 BIWIN CE980Y28900-1TB; diskspd 2.0.17 f: Ø4833 (4418.07-4847.99)
Acemagic F2A Kingston OM8SEP1024Q-A0; diskspd 2.0.17 f: Ø1320 (771.89-3141.95)
Geekom A5 Lexar NM620 512GB: Ø3437 (3126.47-3454.22)

Scheda grafica

Le prestazioni 3D dell'Asus NUC 14 Pro sono nettamente migliori rispetto al vecchio Intel Iris Xe G7 con 96 EU, grazie alla nuova architettura Intel Arc. Tuttavia, il Intel Arc 7-core non può tenere il passo con l'AMD Radeon 780M. Ciononostante, l'Asus NUC 14 Pro offre prestazioni eccezionali, dato che il nostro campione di prova vince il confronto con il Acemagic F2A in diversi test.

Ulteriori confronti e benchmark sono disponibili nella nostra tabella di confronto delle GPU Mobile Graphics Cards - Benchmark List .

3DMark Performance Rating - Percent
Geekom AE7
AMD Radeon 780M, AMD Ryzen 9 7940HS
97.6 pt
Asus NUC 14 Pro
Intel Arc 7-Core iGPU, Intel Core Ultra 5 125H
93 pt
Acemagic F2A
Intel Arc 8-Core iGPU, Intel Core Ultra 7 155H
92.9 pt
Aoostar GEM10
AMD Radeon 680M, AMD Ryzen 7 6800H
84.6 pt
Minisforum UH125 Pro
Intel Arc 7-Core iGPU, Intel Core Ultra 5 125H
81.8 pt
Geekom A5
AMD Radeon RX Vega 8 (Ryzen 4000/5000), AMD Ryzen 7 5800H
49.9 pt
3DMark 11 - 1280x720 Performance GPU
Geekom AE7
AMD Radeon 780M, AMD Ryzen 9 7940HS
13824 Points +17%
Acemagic F2A
Intel Arc 8-Core iGPU, Intel Core Ultra 7 155H
12085 Points +3%
Asus NUC 14 Pro
Intel Arc 7-Core iGPU, Intel Core Ultra 5 125H
11785 Points
Aoostar GEM10
AMD Radeon 680M, AMD Ryzen 7 6800H
11668 Points -1%
Minisforum UH125 Pro
Intel Arc 7-Core iGPU, Intel Core Ultra 5 125H
10303 Points -13%
Geekom A5
AMD Radeon RX Vega 8 (Ryzen 4000/5000), AMD Ryzen 7 5800H
7101 Points -40%
3DMark
2560x1440 Time Spy Graphics
Acemagic F2A
Intel Arc 8-Core iGPU, Intel Core Ultra 7 155H
3205 Points 0%
Asus NUC 14 Pro
Intel Arc 7-Core iGPU, Intel Core Ultra 5 125H
3205 Points
Geekom AE7
AMD Radeon 780M, AMD Ryzen 9 7940HS
2970 Points -7%
Minisforum UH125 Pro
Intel Arc 7-Core iGPU, Intel Core Ultra 5 125H
2796 Points -13%
Aoostar GEM10
AMD Radeon 680M, AMD Ryzen 7 6800H
2518 Points -21%
Geekom A5
AMD Radeon RX Vega 8 (Ryzen 4000/5000), AMD Ryzen 7 5800H
1418 Points -56%
1920x1080 Fire Strike Graphics
Geekom AE7
AMD Radeon 780M, AMD Ryzen 9 7940HS
8437 Points +7%
Asus NUC 14 Pro
Intel Arc 7-Core iGPU, Intel Core Ultra 5 125H
7900 Points
Acemagic F2A
Intel Arc 8-Core iGPU, Intel Core Ultra 7 155H
7710 Points -2%
Aoostar GEM10
AMD Radeon 680M, AMD Ryzen 7 6800H
7653 Points -3%
Minisforum UH125 Pro
Intel Arc 7-Core iGPU, Intel Core Ultra 5 125H
7047 Points -11%
Geekom A5
AMD Radeon RX Vega 8 (Ryzen 4000/5000), AMD Ryzen 7 5800H
4567 Points -42%
Unigine Heaven 4.0
Extreme Preset OpenGL
Aoostar GEM10
AMD Radeon 680M, AMD Ryzen 7 6800H
37 fps +11%
Asus NUC 14 Pro
Intel Arc 7-Core iGPU, Intel Core Ultra 5 125H
33.3 fps
Geekom AE7
AMD Radeon 780M, AMD Ryzen 9 7940HS
33.2 fps 0%
Acemagic F2A
Intel Arc 8-Core iGPU, Intel Core Ultra 7 155H
31.6 fps -5%
Minisforum UH125 Pro
Intel Arc 7-Core iGPU, Intel Core Ultra 5 125H
29.6 fps -11%
Geekom A5
AMD Radeon RX Vega 8 (Ryzen 4000/5000), AMD Ryzen 7 5800H
22.8 fps -32%
Extreme Preset DX11
Geekom AE7
AMD Radeon 780M, AMD Ryzen 9 7940HS
36.1 fps +5%
Aoostar GEM10
AMD Radeon 680M, AMD Ryzen 7 6800H
34.7 fps +1%
Asus NUC 14 Pro
Intel Arc 7-Core iGPU, Intel Core Ultra 5 125H
34.5 fps
Acemagic F2A
Intel Arc 8-Core iGPU, Intel Core Ultra 7 155H
32.7 fps -5%
Minisforum UH125 Pro
Intel Arc 7-Core iGPU, Intel Core Ultra 5 125H
31.5 fps -9%
Geekom A5
AMD Radeon RX Vega 8 (Ryzen 4000/5000), AMD Ryzen 7 5800H
22 fps -36%
Unigine Valley 1.0
1920x1080 Extreme HD DirectX AA:x8
Geekom AE7
AMD Radeon 780M, AMD Ryzen 9 7940HS
24.5 fps +30%
Aoostar GEM10
AMD Radeon 680M, AMD Ryzen 7 6800H
23.7 fps +26%
Asus NUC 14 Pro
Intel Arc 7-Core iGPU, Intel Core Ultra 5 125H
18.8 fps
Acemagic F2A
Intel Arc 8-Core iGPU, Intel Core Ultra 7 155H
17.1 fps -9%
Minisforum UH125 Pro
Intel Arc 7-Core iGPU, Intel Core Ultra 5 125H
16.9 fps -10%
Geekom A5
AMD Radeon RX Vega 8 (Ryzen 4000/5000), AMD Ryzen 7 5800H
14.2 fps -24%
1920x1080 Extreme HD Preset OpenGL AA:x8
Aoostar GEM10
AMD Radeon 680M, AMD Ryzen 7 6800H
25.5 fps +26%
Asus NUC 14 Pro
Intel Arc 7-Core iGPU, Intel Core Ultra 5 125H
20.2 fps
Geekom AE7
AMD Radeon 780M, AMD Ryzen 9 7940HS
19.2 fps -5%
Acemagic F2A
Intel Arc 8-Core iGPU, Intel Core Ultra 7 155H
18.3 fps -9%
Minisforum UH125 Pro
Intel Arc 7-Core iGPU, Intel Core Ultra 5 125H
18.3 fps -9%
Geekom A5
AMD Radeon RX Vega 8 (Ryzen 4000/5000), AMD Ryzen 7 5800H
14.7 fps -27%
Unigine Superposition
1280x720 720p Low
Geekom AE7
AMD Radeon 780M, AMD Ryzen 9 7940HS
12146 Points +12%
Aoostar GEM10
AMD Radeon 680M, AMD Ryzen 7 6800H
11940 Points +10%
Asus NUC 14 Pro
Intel Arc 7-Core iGPU, Intel Core Ultra 5 125H
10872 Points
Acemagic F2A
Intel Arc 8-Core iGPU, Intel Core Ultra 7 155H
10491 Points -4%
Minisforum UH125 Pro
Intel Arc 7-Core iGPU, Intel Core Ultra 5 125H
10026 Points -8%
Geekom A5
AMD Radeon RX Vega 8 (Ryzen 4000/5000), AMD Ryzen 7 5800H
7952 Points -27%
1920x1080 1080p High
Geekom AE7
AMD Radeon 780M, AMD Ryzen 9 7940HS
3698 Points +2%
Asus NUC 14 Pro
Intel Arc 7-Core iGPU, Intel Core Ultra 5 125H
3609 Points
Acemagic F2A
Intel Arc 8-Core iGPU, Intel Core Ultra 7 155H
3391 Points -6%
Aoostar GEM10
AMD Radeon 680M, AMD Ryzen 7 6800H
3380 Points -6%
Minisforum UH125 Pro
Intel Arc 7-Core iGPU, Intel Core Ultra 5 125H
3066 Points -15%
Geekom A5
AMD Radeon RX Vega 8 (Ryzen 4000/5000), AMD Ryzen 7 5800H
1949 Points -46%
1920x1080 1080p Extreme
Asus NUC 14 Pro
Intel Arc 7-Core iGPU, Intel Core Ultra 5 125H
1981 Points
Acemagic F2A
Intel Arc 8-Core iGPU, Intel Core Ultra 7 155H
1920 Points -3%
Geekom AE7
AMD Radeon 780M, AMD Ryzen 9 7940HS
1803 Points -9%
Minisforum UH125 Pro
Intel Arc 7-Core iGPU, Intel Core Ultra 5 125H
1686 Points -15%
Aoostar GEM10
AMD Radeon 680M, AMD Ryzen 7 6800H
1424 Points -28%
Geekom A5
AMD Radeon RX Vega 8 (Ryzen 4000/5000), AMD Ryzen 7 5800H
914 Points -54%
ComputeMark v2.1
1024x600 Normal, Score
Geekom AE7
AMD Radeon 780M, AMD Ryzen 9 7940HS
9806 Points +46%
Acemagic F2A
Intel Arc 8-Core iGPU, Intel Core Ultra 7 155H
7480 Points +12%
Aoostar GEM10
AMD Radeon 680M, AMD Ryzen 7 6800H
6763 Points +1%
Asus NUC 14 Pro
Intel Arc 7-Core iGPU, Intel Core Ultra 5 125H
6698 Points
Minisforum UH125 Pro
Intel Arc 7-Core iGPU, Intel Core Ultra 5 125H
5613 Points -16%
Geekom A5
AMD Radeon RX Vega 8 (Ryzen 4000/5000), AMD Ryzen 7 5800H
4020 Points -40%
1024x600 Normal, Fluid 3DTex
Asus NUC 14 Pro
Intel Arc 7-Core iGPU, Intel Core Ultra 5 125H
490 Points
Geekom AE7
AMD Radeon 780M, AMD Ryzen 9 7940HS
481 Points -2%
Minisforum UH125 Pro
Intel Arc 7-Core iGPU, Intel Core Ultra 5 125H
471 Points -4%
Acemagic F2A
Intel Arc 8-Core iGPU, Intel Core Ultra 7 155H
427 Points -13%
Aoostar GEM10
AMD Radeon 680M, AMD Ryzen 7 6800H
427 Points -13%
Geekom A5
AMD Radeon RX Vega 8 (Ryzen 4000/5000), AMD Ryzen 7 5800H
296 Points -40%
1024x600 Normal, Fluid 2DTexArr
Geekom AE7
AMD Radeon 780M, AMD Ryzen 9 7940HS
486 Points +3%
Asus NUC 14 Pro
Intel Arc 7-Core iGPU, Intel Core Ultra 5 125H
472 Points
Aoostar GEM10
AMD Radeon 680M, AMD Ryzen 7 6800H
468 Points -1%
Minisforum UH125 Pro
Intel Arc 7-Core iGPU, Intel Core Ultra 5 125H
439 Points -7%
Acemagic F2A
Intel Arc 8-Core iGPU, Intel Core Ultra 7 155H
422 Points -11%
Geekom A5
AMD Radeon RX Vega 8 (Ryzen 4000/5000), AMD Ryzen 7 5800H
280 Points -41%
1024x600 Normal, Mandel Vector
Geekom AE7
AMD Radeon 780M, AMD Ryzen 9 7940HS
2560 Points +49%
Acemagic F2A
Intel Arc 8-Core iGPU, Intel Core Ultra 7 155H
1961 Points +14%
Aoostar GEM10
AMD Radeon 680M, AMD Ryzen 7 6800H
1900 Points +11%
Asus NUC 14 Pro
Intel Arc 7-Core iGPU, Intel Core Ultra 5 125H
1715 Points
Minisforum UH125 Pro
Intel Arc 7-Core iGPU, Intel Core Ultra 5 125H
1447 Points -16%
Geekom A5
AMD Radeon RX Vega 8 (Ryzen 4000/5000), AMD Ryzen 7 5800H
1236 Points -28%
1024x600 Normal, Mandel Scalar
Geekom AE7
AMD Radeon 780M, AMD Ryzen 9 7940HS
2614 Points +92%
Aoostar GEM10
AMD Radeon 680M, AMD Ryzen 7 6800H
1812 Points +33%
Acemagic F2A
Intel Arc 8-Core iGPU, Intel Core Ultra 7 155H
1594 Points +17%
Asus NUC 14 Pro
Intel Arc 7-Core iGPU, Intel Core Ultra 5 125H
1360 Points
Minisforum UH125 Pro
Intel Arc 7-Core iGPU, Intel Core Ultra 5 125H
1112 Points -18%
Geekom A5
AMD Radeon RX Vega 8 (Ryzen 4000/5000), AMD Ryzen 7 5800H
1062 Points -22%
1024x600 Normal, QJuliaRayTrace
Geekom AE7
AMD Radeon 780M, AMD Ryzen 9 7940HS
3665 Points +38%
Acemagic F2A
Intel Arc 8-Core iGPU, Intel Core Ultra 7 155H
3076 Points +16%
Asus NUC 14 Pro
Intel Arc 7-Core iGPU, Intel Core Ultra 5 125H
2662 Points
Aoostar GEM10
AMD Radeon 680M, AMD Ryzen 7 6800H
2157 Points -19%
Minisforum UH125 Pro
Intel Arc 7-Core iGPU, Intel Core Ultra 5 125H
2143 Points -19%
Geekom A5
AMD Radeon RX Vega 8 (Ryzen 4000/5000), AMD Ryzen 7 5800H
1145 Points -57%
LuxMark v2.0 64Bit
Room GPUs-only
Geekom AE7
AMD Radeon 780M, AMD Ryzen 9 7940HS
1025 Samples/s +28%
Asus NUC 14 Pro
Intel Arc 7-Core iGPU, Intel Core Ultra 5 125H
801 Samples/s
Minisforum UH125 Pro
Intel Arc 7-Core iGPU, Intel Core Ultra 5 125H
710 Samples/s -11%
Aoostar GEM10
AMD Radeon 680M, AMD Ryzen 7 6800H
567 Samples/s -29%
Acemagic F2A
Intel Arc 8-Core iGPU, Intel Core Ultra 7 155H
549 Samples/s -31%
Sala GPUs-only
Asus NUC 14 Pro
Intel Arc 7-Core iGPU, Intel Core Ultra 5 125H
2807 Samples/s
Minisforum UH125 Pro
Intel Arc 7-Core iGPU, Intel Core Ultra 5 125H
2517 Samples/s -10%
Acemagic F2A
Intel Arc 8-Core iGPU, Intel Core Ultra 7 155H
2319 Samples/s -17%
Geekom AE7
AMD Radeon 780M, AMD Ryzen 9 7940HS
2312 Samples/s -18%
Aoostar GEM10
AMD Radeon 680M, AMD Ryzen 7 6800H
1288 Samples/s -54%
Affinity Photo 2 - Combined (Single / Multi GPU)
Minisforum UH125 Pro
Intel Arc 7-Core iGPU, Intel Core Ultra 5 125H
5244 Points +3%
Asus NUC 14 Pro
Intel Arc 7-Core iGPU, Intel Core Ultra 5 125H
5105 Points
Acemagic F2A
Intel Arc 8-Core iGPU, Intel Core Ultra 7 155H
4928 Points -3%
Aoostar GEM10
AMD Radeon 680M, AMD Ryzen 7 6800H
2339 Points -54%
Geekom AE7
AMD Radeon 780M, AMD Ryzen 9 7940HS
1889 Points -63%
Geekom A5
AMD Radeon RX Vega 8 (Ryzen 4000/5000), AMD Ryzen 7 5800H
1683 Points -67%
Asus NUC 14 Pro, Intel Arc 7-Core iGPU
Ultra 5 125H
Geekom AE7, AMD Radeon 780M
R9 7940HS
Minisforum UH125 Pro, Intel Arc 7-Core iGPU
Ultra 5 125H
Aoostar GEM10, AMD Radeon 680M
R7 6800H
Acemagic F2A, Intel Arc 8-Core iGPU
Ultra 7 155H
Geekom A5, AMD Radeon RX Vega 8 (Ryzen 4000/5000)
R7 5800H
Media della classe Mini PC
 
SPECviewperf 2020
236%
-8%
217%
1%
83%
154%
3840x2160 Medical (medical-03)
5.87
12.7
116%
4.8
-18%
10.7
82%
5.05
-14%
4.82
-18%
3840x2160 Energy (energy-03)
3.81
14.4
278%
3.38
-11%
10.6
178%
4.61
21%
5.33
40%
3840x2160 Creo (creo-03)
15.3
30.2
97%
15.4
1%
32
109%
17.9
17%
19.1
25%
3840x2160 CATIA (catia-06)
10.4
23.7
128%
9.7
-7%
22.8
119%
10
-4%
13.1
26%
3840x2160 3ds Max (3dsmax-07)
14.5
20.7
43%
13.2
-9%
18.9
30%
12.9
-11%
11.3
-22%
3840x2160 Siemens NX (snx-04)
5.82
61.3
953%
5.54
-5%
61.4
955%
5.7
-2%
38
553%
3840x2160 Maya (maya-06)
34.7
47.4
37%
32.8
-5%
49.7
43%
35.4
2%
25.8
-26%
3DMark 05 Standard
48550 punti
3DMark 06 Standard Score
40475 punti
3DMark Vantage P Result
39395 punti
3DMark 11 Performance
11870 punti
3DMark Ice Storm Standard Score
126152 punti
3DMark Cloud Gate Standard Score
29960 punti
3DMark Fire Strike Score
7302 punti
3DMark Fire Strike Extreme Score
3819 punti
3DMark Time Spy Score
3540 punti
3DMark Steel Nomad Score
699 punti
3DMark Steel Nomad Light Score
2798 punti
Aiuto

Prestazioni di gioco

L'Asus NUC 14 Pro è adatto ai giochi moderni solo in misura limitata. Rispetto alla vecchia Intel Iris Xe G7 con 96 EU, tuttavia, le prestazioni di gioco possono migliorare sensibilmente. Intel perde il duello con l'iGPU di AMD più chiaramente che nei test sintetici in termini di prestazioni 3D. Per classificare meglio le prestazioni della iGPU, facciamo riferimento alla nostra Elenco di giochi GPU.

GTA V
1024x768 Lowest Settings possible
Geekom AE7
Radeon 780M, R9 7940HS, Wodposit NVMe SSD 1024 GB
168 (6.33min, 125P1) fps +7%
Acemagic F2A
Arc 8-Core, Ultra 7 155H, Kingston OM8SEP1024Q-A0
161 (4.76min, 100P1) fps +3%
Asus NUC 14 Pro
Arc 7-Core, Ultra 5 125H, Kingston KC3000 2048G SKC3000D2048G
156.3 (4.92min, 90.9P1) fps
Aoostar GEM10
Radeon 680M, R7 6800H, BIWIN CE980Y28900-1TB
145.3 (5.31min, 100P1) fps -7%
Geekom A5
Vega 8, R7 5800H, Lexar NM620 512GB
140.1 (17.4min, 90.9P1) fps -10%
Minisforum UH125 Pro
Arc 7-Core, Ultra 5 125H, Kingston OM8PGP41024Q-A0
132.4 (4.93min, 90.9P1) fps -15%
1920x1080 High/On (Advanced Graphics Off) AA:2xMSAA + FX AF:8x
Geekom AE7
Radeon 780M, R9 7940HS, Wodposit NVMe SSD 1024 GB
65.1 (2.93min, 29.4P1) fps +63%
Aoostar GEM10
Radeon 680M, R7 6800H, BIWIN CE980Y28900-1TB
53.9 (3.82min, 38.5P1) fps +35%
Asus NUC 14 Pro
Arc 7-Core, Ultra 5 125H, Kingston KC3000 2048G SKC3000D2048G
39.9 (3.1min, 29.4P1) fps
Minisforum UH125 Pro
Arc 7-Core, Ultra 5 125H, Kingston OM8PGP41024Q-A0
38.9 (3.15min, 28.6P1) fps -3%
Geekom A5
Vega 8, R7 5800H, Lexar NM620 512GB
35.1 (10.8min, 25.6P1) fps -12%
Acemagic F2A
Arc 8-Core, Ultra 7 155H, Kingston OM8SEP1024Q-A0
31.3 (2.94min, 22.7P1) fps -22%
Dota 2 Reborn
1280x720 min (0/3) fastest
Geekom AE7
Radeon 780M, R9 7940HS, Wodposit NVMe SSD 1024 GB
163 (143.1min) fps +68%
Geekom A5
Vega 8, R7 5800H, Lexar NM620 512GB
129.5 (112.6min) fps +33%
Aoostar GEM10
Radeon 680M, R7 6800H, BIWIN CE980Y28900-1TB
124 (8.9min) fps +28%
Acemagic F2A
Arc 8-Core, Ultra 7 155H, Kingston OM8SEP1024Q-A0
103.2 (59.8min) fps +6%
Asus NUC 14 Pro
Arc 7-Core, Ultra 5 125H, Kingston KC3000 2048G SKC3000D2048G
97.1 (61.8min) fps
Minisforum UH125 Pro
Arc 7-Core, Ultra 5 125H, Kingston OM8PGP41024Q-A0
95.5 (63.7min) fps -2%
1920x1080 high (2/3)
Geekom AE7
Radeon 780M, R9 7940HS, Wodposit NVMe SSD 1024 GB
89.8 (75.7min) fps +18%
Aoostar GEM10
Radeon 680M, R7 6800H, BIWIN CE980Y28900-1TB
81.6 (72.3min) fps +8%
Acemagic F2A
Arc 8-Core, Ultra 7 155H, Kingston OM8SEP1024Q-A0
77.3 (52.5min) fps +2%
Asus NUC 14 Pro
Arc 7-Core, Ultra 5 125H, Kingston KC3000 2048G SKC3000D2048G
75.9 (45.7min) fps
Minisforum UH125 Pro
Arc 7-Core, Ultra 5 125H, Kingston OM8PGP41024Q-A0
73.6 (47.5min) fps -3%
Geekom A5
Vega 8, R7 5800H, Lexar NM620 512GB
67.7 (59.9min) fps -11%
Cyberpunk 2077 2.1 Phantom Liberty
1920x1080 Low Preset (FSR off)
Geekom AE7
Radeon 780M, R9 7940HS, Wodposit NVMe SSD 1024 GB
45 (38min) fps +50%
Aoostar GEM10
Radeon 680M, R7 6800H, BIWIN CE980Y28900-1TB
34.8 (29.9min) fps +16%
Asus NUC 14 Pro
Arc 7-Core, Ultra 5 125H, Kingston KC3000 2048G SKC3000D2048G
30.1 (25.8min) fps
Acemagic F2A
Arc 8-Core, Ultra 7 155H, Kingston OM8SEP1024Q-A0
29.5 (24.1min) fps -2%
Minisforum UH125 Pro
Arc 7-Core, Ultra 5 125H, Kingston OM8PGP41024Q-A0
29.5 (25.4min) fps -2%
1920x1080 High Preset (FSR off)
Geekom AE7
Radeon 780M, R9 7940HS, Wodposit NVMe SSD 1024 GB
27.4 (23.1min) fps +26%
Asus NUC 14 Pro
Arc 7-Core, Ultra 5 125H, Kingston KC3000 2048G SKC3000D2048G
21.7 (18.8min) fps
Aoostar GEM10
Radeon 680M, R7 6800H, BIWIN CE980Y28900-1TB
21.3 (18.4min) fps -2%
Minisforum UH125 Pro
Arc 7-Core, Ultra 5 125H, Kingston OM8PGP41024Q-A0
20.6 (17.9min) fps -5%
Acemagic F2A
Arc 8-Core, Ultra 7 155H, Kingston OM8SEP1024Q-A0
20.4 (13.8min) fps -6%
Baldur's Gate 3
1280x720 Low Preset
Geekom AE7
Radeon 780M, R9 7940HS, Wodposit NVMe SSD 1024 GB
67.4 (22.7min, 28.3P0.1, 43.6P1) fps +34%
Asus NUC 14 Pro
Arc 7-Core, Ultra 5 125H, Kingston KC3000 2048G SKC3000D2048G
50.2 (27.7min, 29.7P0.1, 32.6P1) fps
Aoostar GEM10
Radeon 680M, R7 6800H, BIWIN CE980Y28900-1TB
48.9 (16.6min, 29.1P0.1, 36.8P1) fps -3%
Minisforum UH125 Pro
Arc 7-Core, Ultra 5 125H, Kingston OM8PGP41024Q-A0
45 (14.9min, 19.4P0.1, 29P1) fps -10%
1920x1080 High Preset
Geekom AE7
Radeon 780M, R9 7940HS, Wodposit NVMe SSD 1024 GB
25.7 (11min, 11.5P0.1, 14.5P1) fps +15%
Aoostar GEM10
Radeon 680M, R7 6800H, BIWIN CE980Y28900-1TB
23.3 (16.6min, 16.7P0.1, 18.3P1) fps +4%
Asus NUC 14 Pro
Arc 7-Core, Ultra 5 125H, Kingston KC3000 2048G SKC3000D2048G
22.4 (14min, 14.2P0.1, 15.3P1) fps
Minisforum UH125 Pro
Arc 7-Core, Ultra 5 125H, Kingston OM8PGP41024Q-A0
19.5 (9.2min, 10.4P0.1, 12.7P1) fps -13%
F1 24
1920x1080 Low Preset AA:T AF:16x
Geekom AE7
Radeon 780M, R9 7940HS, Wodposit NVMe SSD 1024 GB
94.8 (81min, 64P1) fps +43%
Asus NUC 14 Pro
Arc 7-Core, Ultra 5 125H, Kingston KC3000 2048G SKC3000D2048G
66.2 (56min, 54P1) fps
Minisforum UH125 Pro
Arc 7-Core, Ultra 5 125H, Kingston OM8PGP41024Q-A0
64.3 (55min, 53P1) fps -3%
1920x1080 High Preset AA:T AF:16x
Geekom AE7
Radeon 780M, R9 7940HS, Wodposit NVMe SSD 1024 GB
59.5 (50min, 41P1) fps +37%
Asus NUC 14 Pro
Arc 7-Core, Ultra 5 125H, Kingston KC3000 2048G SKC3000D2048G
43.4 (34min, 35P1) fps
Minisforum UH125 Pro
Arc 7-Core, Ultra 5 125H, Kingston OM8PGP41024Q-A0
41.7 (34min, 34P1) fps -4%

FPS chart

05101520Tooltip
Asus NUC 14 Pro Ultra 5 125H, Arc 7-Core: Ø18.5 (12.6-20.7)
bassomedioaltoultra
GTA V (2015) 156.3 148.8 39.9 16.6
Dota 2 Reborn (2015) 97.1 79.2 75.9 72.9
Final Fantasy XV Benchmark (2018) 60.6 35.4 25.3
X-Plane 11.11 (2018) 47.5 38.5 32.9
Baldur's Gate 3 (2023) 33.5 25.9 22.4 21.5
Cyberpunk 2077 2.1 Phantom Liberty (2023) 30.1 25.2 21.7 19.6
F1 24 (2024) 66.2 57.6 43.4

Verifica delle prestazioni di Asus NUC 14 Pro con una Nvidia GeForce RTX 3060 Ti

Le prestazioni 3D possono essere notevolmente migliorate con una scheda grafica esterna. Tuttavia, gli acceleratori 3D esterni possono essere collegati solo tramite USB-C. Senza influenzare la valutazione complessiva, abbiamo condotto alcuni test in combinazione con il Razer Core X e una scheda grafica Nvidia GeForce RTX 3060 Ti. Abbiamo notato un miglioramento costante delle prestazioni 3D e anche i giochi moderni possono essere giocati senza problemi. Rispetto al modello Minisforum UH125 Pro, l'Asus NUC 14 Pro offre prestazioni identiche.

Performance Rating - Percent
Geekom XT13 Pro (Nvidia GeForce RTX 3060 Ti FE)
Intel Core i9-13900H
99.2 pt
Geekom AX8 Pro (Nvidia GeForce RTX 3060 Ti FE)
AMD Ryzen 9 8945HS
98.6 pt
Asus NUC 14 Pro (Nvidia GeForce RTX 3060 Ti FE)
Intel Core Ultra 5 125H
97.4 pt
Minisforum UH125 Pro (Nvidia GeForce RTX 3060 Ti FE)
Intel Core Ultra 5 125H
96.8 pt
3DMark 11 - 1280x720 Performance GPU
Geekom AX8 Pro (Nvidia GeForce RTX 3060 Ti FE)
AMD Ryzen 9 8945HS
34907 Points +196%
Geekom XT13 Pro (Nvidia GeForce RTX 3060 Ti FE)
Intel Core i9-13900H
33454 Points +184%
Minisforum UH125 Pro (Nvidia GeForce RTX 3060 Ti FE)
Intel Core Ultra 5 125H
32085 Points +172%
Asus NUC 14 Pro (Nvidia GeForce RTX 3060 Ti FE)
Intel Core Ultra 5 125H
31917 Points +171%

11785 Points
3DMark
2560x1440 Time Spy Graphics
Geekom AX8 Pro (Nvidia GeForce RTX 3060 Ti FE)
AMD Ryzen 9 8945HS
11180 Points +249%
Geekom XT13 Pro (Nvidia GeForce RTX 3060 Ti FE)
Intel Core i9-13900H
11118 Points +247%
Minisforum UH125 Pro (Nvidia GeForce RTX 3060 Ti FE)
Intel Core Ultra 5 125H
10935 Points +241%
Asus NUC 14 Pro (Nvidia GeForce RTX 3060 Ti FE)
Intel Core Ultra 5 125H
10932 Points +241%

3205 Points
1920x1080 Fire Strike Graphics
Geekom AX8 Pro (Nvidia GeForce RTX 3060 Ti FE)
AMD Ryzen 9 8945HS
25665 Points +225%
Geekom XT13 Pro (Nvidia GeForce RTX 3060 Ti FE)
Intel Core i9-13900H
25415 Points +222%
Minisforum UH125 Pro (Nvidia GeForce RTX 3060 Ti FE)
Intel Core Ultra 5 125H
24809 Points +214%
Asus NUC 14 Pro (Nvidia GeForce RTX 3060 Ti FE)
Intel Core Ultra 5 125H
24767 Points +214%

7900 Points
3840x2160 Fire Strike Ultra Graphics
Geekom AX8 Pro (Nvidia GeForce RTX 3060 Ti FE)
AMD Ryzen 9 8945HS
7103 Points +274%
Geekom XT13 Pro (Nvidia GeForce RTX 3060 Ti FE)
Intel Core i9-13900H
7046 Points +271%
Asus NUC 14 Pro (Nvidia GeForce RTX 3060 Ti FE)
Intel Core Ultra 5 125H
7024 Points +270%
Minisforum UH125 Pro (Nvidia GeForce RTX 3060 Ti FE)
Intel Core Ultra 5 125H
6997 Points +268%

1899 Points
Unigine Superposition
1280x720 720p Low
Geekom AX8 Pro (Nvidia GeForce RTX 3060 Ti FE)
AMD Ryzen 9 8945HS
33452 Points +208%
Geekom XT13 Pro (Nvidia GeForce RTX 3060 Ti FE)
Intel Core i9-13900H
31986 Points +194%
Asus NUC 14 Pro (Nvidia GeForce RTX 3060 Ti FE)
Intel Core Ultra 5 125H
27554 Points +153%
Minisforum UH125 Pro (Nvidia GeForce RTX 3060 Ti FE)
Intel Core Ultra 5 125H
25121 Points +131%

10872 Points
1920x1080 1080p High
Geekom AX8 Pro (Nvidia GeForce RTX 3060 Ti FE)
AMD Ryzen 9 8945HS
15070 Points +318%
Geekom XT13 Pro (Nvidia GeForce RTX 3060 Ti FE)
Intel Core i9-13900H
14959 Points +314%
Asus NUC 14 Pro (Nvidia GeForce RTX 3060 Ti FE)
Intel Core Ultra 5 125H
14910 Points +313%
Minisforum UH125 Pro (Nvidia GeForce RTX 3060 Ti FE)
Intel Core Ultra 5 125H
14859 Points +312%

3609 Points
1920x1080 1080p Extreme
Geekom AX8 Pro (Nvidia GeForce RTX 3060 Ti FE)
AMD Ryzen 9 8945HS
7117 Points +259%
Asus NUC 14 Pro (Nvidia GeForce RTX 3060 Ti FE)
Intel Core Ultra 5 125H
7111 Points +259%
Geekom XT13 Pro (Nvidia GeForce RTX 3060 Ti FE)
Intel Core i9-13900H
7098 Points +258%
Minisforum UH125 Pro (Nvidia GeForce RTX 3060 Ti FE)
Intel Core Ultra 5 125H
7064 Points +257%

1981 Points
3840x2160 4k Optimized
Geekom XT13 Pro (Nvidia GeForce RTX 3060 Ti FE)
Intel Core i9-13900H
9315 Points
Asus NUC 14 Pro (Nvidia GeForce RTX 3060 Ti FE)
Intel Core Ultra 5 125H
9243 Points
Geekom AX8 Pro (Nvidia GeForce RTX 3060 Ti FE)
AMD Ryzen 9 8945HS
9206 Points
Minisforum UH125 Pro (Nvidia GeForce RTX 3060 Ti FE)
Intel Core Ultra 5 125H
9188 Points
7680x4320 8k Optimized
Geekom XT13 Pro (Nvidia GeForce RTX 3060 Ti FE)
Intel Core i9-13900H
4061 Points
Geekom AX8 Pro (Nvidia GeForce RTX 3060 Ti FE)
AMD Ryzen 9 8945HS
4047 Points
Minisforum UH125 Pro (Nvidia GeForce RTX 3060 Ti FE)
Intel Core Ultra 5 125H
4016 Points
Asus NUC 14 Pro (Nvidia GeForce RTX 3060 Ti FE)
Intel Core Ultra 5 125H
4013 Points
Unigine Valley 1.0
1920x1080 Extreme HD DirectX AA:x8
Geekom XT13 Pro (Nvidia GeForce RTX 3060 Ti FE)
Intel Core i9-13900H
142.2 fps +656%
Geekom AX8 Pro (Nvidia GeForce RTX 3060 Ti FE)
AMD Ryzen 9 8945HS
141.7 fps +654%
Asus NUC 14 Pro (Nvidia GeForce RTX 3060 Ti FE)
Intel Core Ultra 5 125H
137.3 fps +630%
Minisforum UH125 Pro (Nvidia GeForce RTX 3060 Ti FE)
Intel Core Ultra 5 125H
135.9 fps +623%

18.8 fps
1920x1080 Extreme HD Preset OpenGL AA:x8
Geekom XT13 Pro (Nvidia GeForce RTX 3060 Ti FE)
Intel Core i9-13900H
137.6 fps +581%
Geekom AX8 Pro (Nvidia GeForce RTX 3060 Ti FE)
AMD Ryzen 9 8945HS
137.6 fps +581%
Asus NUC 14 Pro (Nvidia GeForce RTX 3060 Ti FE)
Intel Core Ultra 5 125H
133.8 fps +562%
Minisforum UH125 Pro (Nvidia GeForce RTX 3060 Ti FE)
Intel Core Ultra 5 125H
133.5 fps +561%

20.2 fps
Unigine Heaven 4.0
Extreme Preset OpenGL
Geekom AX8 Pro (Nvidia GeForce RTX 3060 Ti FE)
AMD Ryzen 9 8945HS
174.9 fps +425%
Geekom XT13 Pro (Nvidia GeForce RTX 3060 Ti FE)
Intel Core i9-13900H
173.5 fps +421%
Asus NUC 14 Pro (Nvidia GeForce RTX 3060 Ti FE)
Intel Core Ultra 5 125H
172.4 fps +418%
Minisforum UH125 Pro (Nvidia GeForce RTX 3060 Ti FE)
Intel Core Ultra 5 125H
172.3 fps +417%

33.3 fps
Extreme Preset DX11
Geekom XT13 Pro (Nvidia GeForce RTX 3060 Ti FE)
Intel Core i9-13900H
164.2 fps +376%
Geekom AX8 Pro (Nvidia GeForce RTX 3060 Ti FE)
AMD Ryzen 9 8945HS
163.2 fps +373%
Minisforum UH125 Pro (Nvidia GeForce RTX 3060 Ti FE)
Intel Core Ultra 5 125H
158.8 fps +360%
Asus NUC 14 Pro (Nvidia GeForce RTX 3060 Ti FE)
Intel Core Ultra 5 125H
158.7 fps +360%

34.5 fps
ComputeMark v2.1
1024x600 Normal, Score
Geekom XT13 Pro (Nvidia GeForce RTX 3060 Ti FE)
Intel Core i9-13900H
27843 Points +316%
Asus NUC 14 Pro (Nvidia GeForce RTX 3060 Ti FE)
Intel Core Ultra 5 125H
27843 Points +316%
Minisforum UH125 Pro (Nvidia GeForce RTX 3060 Ti FE)
Intel Core Ultra 5 125H
27669 Points +313%
Geekom AX8 Pro (Nvidia GeForce RTX 3060 Ti FE)
AMD Ryzen 9 8945HS
26591 Points +297%

6698 Points
1024x600 Normal, Fluid 3DTex
Minisforum UH125 Pro (Nvidia GeForce RTX 3060 Ti FE)
Intel Core Ultra 5 125H
2708 Points +453%
Geekom AX8 Pro (Nvidia GeForce RTX 3060 Ti FE)
AMD Ryzen 9 8945HS
2683 Points +448%
Geekom XT13 Pro (Nvidia GeForce RTX 3060 Ti FE)
Intel Core i9-13900H
2681 Points +447%
Asus NUC 14 Pro (Nvidia GeForce RTX 3060 Ti FE)
Intel Core Ultra 5 125H
2681 Points +447%

490 Points
1024x600 Normal, Fluid 2DTexArr
Minisforum UH125 Pro (Nvidia GeForce RTX 3060 Ti FE)
Intel Core Ultra 5 125H
2641 Points +460%
Geekom AX8 Pro (Nvidia GeForce RTX 3060 Ti FE)
AMD Ryzen 9 8945HS
2618 Points +455%
Geekom XT13 Pro (Nvidia GeForce RTX 3060 Ti FE)
Intel Core i9-13900H
2614 Points +454%
Asus NUC 14 Pro (Nvidia GeForce RTX 3060 Ti FE)
Intel Core Ultra 5 125H
2614 Points +454%

472 Points
1024x600 Normal, Mandel Vector
Geekom XT13 Pro (Nvidia GeForce RTX 3060 Ti FE)
Intel Core i9-13900H
5726 Points +234%
Asus NUC 14 Pro (Nvidia GeForce RTX 3060 Ti FE)
Intel Core Ultra 5 125H
5726 Points +234%
Minisforum UH125 Pro (Nvidia GeForce RTX 3060 Ti FE)
Intel Core Ultra 5 125H
5652 Points +230%
Geekom AX8 Pro (Nvidia GeForce RTX 3060 Ti FE)
AMD Ryzen 9 8945HS
5358 Points +212%

1715 Points
1024x600 Normal, Mandel Scalar
Geekom XT13 Pro (Nvidia GeForce RTX 3060 Ti FE)
Intel Core i9-13900H
6275 Points +361%
Asus NUC 14 Pro (Nvidia GeForce RTX 3060 Ti FE)
Intel Core Ultra 5 125H
6275 Points +361%
Minisforum UH125 Pro (Nvidia GeForce RTX 3060 Ti FE)
Intel Core Ultra 5 125H
6223 Points +358%
Geekom AX8 Pro (Nvidia GeForce RTX 3060 Ti FE)
AMD Ryzen 9 8945HS
5949 Points +337%

1360 Points
1024x600 Normal, QJuliaRayTrace
Geekom XT13 Pro (Nvidia GeForce RTX 3060 Ti FE)
Intel Core i9-13900H
10548 Points +296%
Asus NUC 14 Pro (Nvidia GeForce RTX 3060 Ti FE)
Intel Core Ultra 5 125H
10548 Points +296%
Minisforum UH125 Pro (Nvidia GeForce RTX 3060 Ti FE)
Intel Core Ultra 5 125H
10445 Points +292%
Geekom AX8 Pro (Nvidia GeForce RTX 3060 Ti FE)
AMD Ryzen 9 8945HS
9982 Points +275%

2662 Points
Performance Rating - Percent
Geekom AX8 Pro (Nvidia GeForce RTX 3060 Ti FE)
AMD Ryzen 9 8945HS
99.5 pt
Geekom XT13 Pro (Nvidia GeForce RTX 3060 Ti FE)
Intel Core i9-13900H
94.6 pt
Minisforum UH125 Pro (Nvidia GeForce RTX 3060 Ti FE)
Intel Core Ultra 5 125H
88.3 pt
Asus NUC 14 Pro (Nvidia GeForce RTX 3060 Ti FE)
Intel Core Ultra 5 125H
88 pt
Cyberpunk 2077 2.1 Phantom Liberty
1280x720 Low Preset (FSR off)
Geekom AX8 Pro (Nvidia GeForce RTX 3060 Ti FE)
AMD Ryzen 9 8945HS
103.1 (80.9min - 132.1max) fps +123%
Geekom XT13 Pro (Nvidia GeForce RTX 3060 Ti FE)
Intel Core i9-13900H
88.7 (68min - 118.2max) fps +92%
Asus NUC 14 Pro (Nvidia GeForce RTX 3060 Ti FE)
Intel Core Ultra 5 125H
72.4 (53.9min - 101max) fps +56%
Minisforum UH125 Pro (Nvidia GeForce RTX 3060 Ti FE)
Intel Core Ultra 5 125H
70.2 (53.5min - 91.7max) fps +52%

46.3 (39.2min - 54.8max) fps
1920x1080 Medium Preset (FSR off)
Geekom AX8 Pro (Nvidia GeForce RTX 3060 Ti FE)
AMD Ryzen 9 8945HS
81.5 (65.7min - 103.4max) fps +223%
Geekom XT13 Pro (Nvidia GeForce RTX 3060 Ti FE)
Intel Core i9-13900H
81.4 (65.1min - 102max) fps +223%
Minisforum UH125 Pro (Nvidia GeForce RTX 3060 Ti FE)
Intel Core Ultra 5 125H
72.2 (55.8min - 97.4max) fps +187%
Asus NUC 14 Pro (Nvidia GeForce RTX 3060 Ti FE)
Intel Core Ultra 5 125H
69.8 (50min - 99.9max) fps +177%

25.2 (22.3min - 29max) fps
1920x1080 Ultra Preset (FSR off)
Geekom XT13 Pro (Nvidia GeForce RTX 3060 Ti FE)
Intel Core i9-13900H
64.4 (49.9min - 85.5max) fps +229%
Geekom AX8 Pro (Nvidia GeForce RTX 3060 Ti FE)
AMD Ryzen 9 8945HS
64.3 (50.9min - 85.8max) fps +228%
Minisforum UH125 Pro (Nvidia GeForce RTX 3060 Ti FE)
Intel Core Ultra 5 125H
60.8 (43.6min - 87max) fps +210%
Asus NUC 14 Pro (Nvidia GeForce RTX 3060 Ti FE)
Intel Core Ultra 5 125H
58.3 (36.6min - 87.8max) fps +197%

19.6 (16.7min - 23.6max) fps
Baldur's Gate 3
1920x1080 Low Preset
Geekom XT13 Pro (Nvidia GeForce RTX 3060 Ti FE)
Intel Core i9-13900H
113 (47.4min, 65.4P0.1, 77.5P1 - 215max) fps +237%
Asus NUC 14 Pro (Nvidia GeForce RTX 3060 Ti FE)
Intel Core Ultra 5 125H
111.6 (57.7min, 64.3P0.1, 75.6P1 - 248max) fps +233%
Geekom AX8 Pro (Nvidia GeForce RTX 3060 Ti FE)
AMD Ryzen 9 8945HS
110.9 (57.4min, 66.9P0.1, 76.7P1 - 233max) fps +231%
Minisforum UH125 Pro (Nvidia GeForce RTX 3060 Ti FE)
Intel Core Ultra 5 125H
109.5 (51.8min, 62.3P0.1, 74.4P1 - 198.7max) fps +227%

33.5 (20.9min, 21P0.1, 23.4P1 - 64.9max) fps
1920x1080 Medium Preset
Geekom XT13 Pro (Nvidia GeForce RTX 3060 Ti FE)
Intel Core i9-13900H
91.3 (51.4min, 53.4P0.1, 61.1P1 - 196.3max) fps +253%
Geekom AX8 Pro (Nvidia GeForce RTX 3060 Ti FE)
AMD Ryzen 9 8945HS
89.4 (43.6min, 53.5P0.1, 60P1 - 201max) fps +245%
Minisforum UH125 Pro (Nvidia GeForce RTX 3060 Ti FE)
Intel Core Ultra 5 125H
87.3 (36.9min, 43.6P0.1, 57.2P1 - 191.9max) fps +237%
Asus NUC 14 Pro (Nvidia GeForce RTX 3060 Ti FE)
Intel Core Ultra 5 125H
86 (30.5min, 43.2P0.1, 55.8P1 - 194.6max) fps +232%

25.9 (5.81min, 8.8P0.1, 15.9P1 - 97.2max) fps
1920x1080 Ultra Preset
Geekom XT13 Pro (Nvidia GeForce RTX 3060 Ti FE)
Intel Core i9-13900H
78.5 (46.2min, 47P0.1, 53.1P1 - 179.1max) fps +265%
Geekom AX8 Pro (Nvidia GeForce RTX 3060 Ti FE)
AMD Ryzen 9 8945HS
78.2 (23.4min, 47.3P0.1, 51.1P1 - 216max) fps +264%
Minisforum UH125 Pro (Nvidia GeForce RTX 3060 Ti FE)
Intel Core Ultra 5 125H
76.3 (41.3min, 43.7P0.1, 50P1 - 176.1max) fps +255%
Asus NUC 14 Pro (Nvidia GeForce RTX 3060 Ti FE)
Intel Core Ultra 5 125H
72.1 (20.2min, 24.7P0.1, 31.8P1 - 189.9max) fps +235%

21.5 (13.6min, 13.7P0.1, 14.1P1 - 66max) fps
F1 24
1920x1080 Low Preset AA:T AF:16x
Geekom AX8 Pro (Nvidia GeForce RTX 3060 Ti FE)
AMD Ryzen 9 8945HS
86.5 (48min, 51P1 - 108max) fps +31%
Geekom XT13 Pro (Nvidia GeForce RTX 3060 Ti FE)
Intel Core i9-13900H
76.9 (42min, 44P1 - 96max) fps +16%
Asus NUC 14 Pro (Nvidia GeForce RTX 3060 Ti FE)
Intel Core Ultra 5 125H
75.3 (42min, 44P1 - 92max) fps +14%
Minisforum UH125 Pro (Nvidia GeForce RTX 3060 Ti FE)
Intel Core Ultra 5 125H
72.6 (41min, 43P1 - 87max) fps +10%

66.2 (56min, 54P1 - 77max) fps
1920x1080 Medium Preset AA:T AF:16x
Geekom AX8 Pro (Nvidia GeForce RTX 3060 Ti FE)
AMD Ryzen 9 8945HS
82.3 (47min, 49P1 - 97max) fps +43%
Geekom XT13 Pro (Nvidia GeForce RTX 3060 Ti FE)
Intel Core i9-13900H
73.1 (42min, 43P1 - 86max) fps +27%
Asus NUC 14 Pro (Nvidia GeForce RTX 3060 Ti FE)
Intel Core Ultra 5 125H
71.7 (41min, 43P1 - 84max) fps +24%
Minisforum UH125 Pro (Nvidia GeForce RTX 3060 Ti FE)
Intel Core Ultra 5 125H
70 (41min, 42P1 - 81max) fps +22%

57.6 (47min, 46P1 - 68max) fps
1920x1080 High Preset AA:T AF:16x
Geekom AX8 Pro (Nvidia GeForce RTX 3060 Ti FE)
AMD Ryzen 9 8945HS
68.7 (40min, 40P1 - 82max) fps +58%
Geekom XT13 Pro (Nvidia GeForce RTX 3060 Ti FE)
Intel Core i9-13900H
60.5 (35min, 37P1 - 74max) fps +39%
Asus NUC 14 Pro (Nvidia GeForce RTX 3060 Ti FE)
Intel Core Ultra 5 125H
59.5 (35min, 35P1 - 72max) fps +37%
Minisforum UH125 Pro (Nvidia GeForce RTX 3060 Ti FE)
Intel Core Ultra 5 125H
58.2 (34min, 36P1 - 71max) fps +34%

43.4 (34min, 35P1 - 51max) fps
Asus NUC 14 Pro (Nvidia GeForce RTX 3060 Ti FE),
Ultra 5 125H
Minisforum UH125 Pro (Nvidia GeForce RTX 3060 Ti FE),
Ultra 5 125H
Geekom AX8 Pro (Nvidia GeForce RTX 3060 Ti FE),
R9 8945HS
Geekom XT13 Pro (Nvidia GeForce RTX 3060 Ti FE),
i9-13900H
Media della classe Mini PC
 
SPECviewperf 2020
290%
126%
304%
300%
154%
3840x2160 Medical (medical-03)
13
121%
10.9
86%
13
121%
13
121%
3840x2160 Energy (energy-03)
20.9
449%
17.8
367%
21
451%
20.9
449%
3840x2160 Creo (creo-03)
68.3
346%
26.6
74%
77.2
405%
74.2
385%
3840x2160 CATIA (catia-06)
37.3
259%
23.6
127%
39.2
277%
39.4
279%
3840x2160 3ds Max (3dsmax-07)
46.5
221%
28.7
98%
46.1
218%
47.2
226%
3840x2160 Siemens NX (snx-04)
16.2
178%
11.4
96%
16.7
187%
16.5
184%
3840x2160 Maya (maya-06)
193
456%
47.5
37%
198
471%
194
459%
bassomedioaltoultraQHD4K
GTA V (2015) 178.7 174 162.9 100.6 90 102.6
Dota 2 Reborn (2015) 159 138.8 131 122.6 104.3
Final Fantasy XV Benchmark (2018) 163.8 141 97.3 75.6 47.4
X-Plane 11.11 (2018) 119.6 107.5 83.7 71.7
Baldur's Gate 3 (2023) 111.6 86 72.8 72.1 57.5 36.4
Cyberpunk 2077 2.1 Phantom Liberty (2023) 72.4 69.8 63.7 58.3 43.5 22.2
F1 24 (2024) 75.3 71.7 59.5 41.1 35.7 16.9

Emissioni

Emissioni di rumore

L'Asus NUC 14 Pro è molto silenzioso per la maggior parte del tempo. Tuttavia, la ventola funziona anche in modalità idle, quindi il funzionamento non è silenzioso. Sotto carico medio, abbiamo registrato un livello di pressione sonora di 42,4 dB(A). Il Minisforum UH125 Pro e l'Aoostar GEM10 si trovano più o meno allo stesso livello. Al massimo carico, il nostro campione di prova raggiunge 47,8 dB(A). Ciò significa che l'Asus NUC 14 Pro è chiaramente udibile, anche se la percezione soggettiva del livello di rumore è leggermente inferiore.

Rumorosità

Idle
26 / 26.2 / 26.2 dB(A)
Sotto carico
42.4 / 47.8 dB(A)
  red to green bar
 
 
30 dB
silenzioso
40 dB(A)
udibile
50 dB(A)
rumoroso
 
min: dark, med: mid, max: light   Earthworks M23R (15 cm di distanza)   Rumorosità ambientale: 24 dB(A)
dB(A) 0102030405060708090Deep BassMiddle BassHigh BassLower RangeMidsHigher MidsLower HighsMid HighsUpper HighsSuper Highs2035.53536.236.836.335.435.52533.235.836.532.935.733.733.23133.435.235.835.937.534.333.44029.224.131.53126.726.629.25032.727.625.426.326.327.732.76330.524.124.125.924.327.730.58023.518.318.920.415.120.523.510020.820.717.91817.822.520.812522.319.218.514.813.816.822.316021.219.611.610.911.315.321.220023.921.111.812.211.912.723.925027.322.512.31211.210.927.331526.223.816.916.517.39.326.240027.523.813.313.312.69.327.55002925.313.713.213.38.72963031.227.71312.512.38.931.280034.130.315.215.615.39.334.1100037.432.81514.914.79.837.412503632.312.812.812.410.936160038.734.411.912.3121138.7200040.733.812.312.512.511.740.7250039.233.113.213.613.112.439.2315035.528.913.413.513.313.235.5400033.826.214.214.114.113.833.8500030.524.314.314.314.41430.5630029.223.11514.814.814.929.2800022.117.515.114.91514.922.11000019.417.815.315.215.214.919.4125002424.217.617.717.716.2241600014.915.114.214.214.314.314.9SPL47.842.426.226.22624.947.8N5.43.60.70.70.70.65.4median 29median 24.2median 14.2median 14.1median 13.8median 12.7median 29Delta6.75.31.21.21.42.26.7hearing rangehide median Fan NoiseAsus NUC 14 Pro
Asus NUC 14 Pro
Ultra 5 125H, Arc 7-Core
Geekom AE7
R9 7940HS, Radeon 780M
Minisforum UH125 Pro
Ultra 5 125H, Arc 7-Core
Aoostar GEM10
R7 6800H, Radeon 680M
Acemagic F2A
Ultra 7 155H, Arc 8-Core
Geekom A5
R7 5800H, Vega 8
Noise
-4%
-12%
-13%
-2%
-7%
off /ambiente *
24
24.4
-2%
24.8
-3%
24.3
-1%
24.9
-4%
25
-4%
Idle Minimum *
26
24.9
4%
35
-35%
36.5
-40%
25.4
2%
28.2
-8%
Idle Average *
26.2
25
5%
35
-34%
36.6
-40%
25.7
2%
28.2
-8%
Idle Maximum *
26.2
25
5%
35
-34%
36.6
-40%
25.7
2%
28.2
-8%
Load Average *
42.4
52
-23%
42.2
-0%
41.7
2%
47.8
-13%
47.8
-13%
Cyberpunk 2077 ultra *
47.7
52
-9%
40.8
14%
40.3
16%
Load Maximum *
47.8
51.4
-8%
43.9
8%
40.8
15%
49
-3%
47.4
1%
Witcher 3 ultra *
40.18
45.23

* ... Meglio usare valori piccoli

Temperatura

Il case dell'Asus NUC 14 Pro si riscalda notevolmente in alcuni punti sotto carico. Abbiamo registrato un massimo di 55,1 °C sulla parte superiore. Non ci sono anomalie degne di nota in modalità idle. Nel test di stress abbiamo raggiunto facilmente valori superiori ai 100 °C per il SoC. Secondo Intel, l'Intel Core Ultra 5 125H è progettato per una temperatura operativa fino a 110 °C. L'abbiamo raggiunta nello stress test, anche se il consumo energetico si è ridotto a circa 50 watt. Il sistema di raffreddamento non è in grado di dissipare in modo permanente i 64 watt definiti come PL1 e PL2.

Stress test Prime95, in solitaria
Test da sforzo FurMark, in solitaria
Test di stress Prime95 e FurMark
Asus NUC 14 Pro durante lo stress test (lato superiore)
Test di stress di Asus NUC 14 Pro (lato inferiore)
Asus NUC 14 Pro durante lo stress test (lato inferiore aperto)
Test di stress di Asus NUC 14 Pro (posteriore)
Carico massimo
 38.3 °C50.5 °C55.1 °C 
 34.9 °C39.3 °C32.9 °C 
 35.1 °C35.9 °C30.5 °C 
Massima: 55.1 °C
Media: 39.2 °C
36.6 °C38.2 °C39.3 °C
33.6 °C36.1 °C37.7 °C
31.1 °C32.7 °C36.6 °C
Massima: 39.3 °C
Media: 35.8 °C
Alimentazione (max)  45.4 °C | Temperatura della stanza 21.4 °C | Fluke t3000FC (calibrated)
(-) La temperatura media del lato superiore sotto carico massimo e' di 39.2 °C / 103 F, rispetto alla media di 32.3 °C / 90 F per i dispositivi di questa classe Mini PC.
(-) La temperatura massima sul lato superiore è di 55.1 °C / 131 F, rispetto alla media di 35.8 °C / 96 F, che varia da 24 a 69.5 °C per questa classe Mini PC.
(+) Il lato inferiore si riscalda fino ad un massimo di 39.3 °C / 103 F, rispetto alla media di 36.1 °C / 97 F
(+) In idle, la temperatura media del lato superiore è di 30.8 °C / 87 F, rispetto alla media deld ispositivo di 32.3 °C / 90 F.

Consumo di energia

Asus tiene relativamente sotto controllo il consumo energetico del NUC 14 Pro. Sotto carico medio, il nostro campione di prova richiede solo 55,5 watt, un po' di più rispetto al Miniforum UH125 Pro. Il motivo è il limite di potenza leggermente più alto che Asus impone al SoC. Abbiamo registrato brevemente 103,3 watt, che l'alimentatore da 120 watt è in grado di gestire senza problemi.

Asus NUC 14 Pro con alimentatore (19 V; 6,32 A)
Alimentatore (19 V; 6,32 A)
Consumo di corrente
Off / Standbydarklight 0.48 / 1 Watt
Idledarkmidlight 5.1 / 6.4 / 14.7 Watt
Sotto carico midlight 55.5 / 103.3 Watt
 color bar
Leggenda: min: dark, med: mid, max: light        Metrahit Energy
Asus NUC 14 Pro
Ultra 5 125H, Arc 7-Core
Geekom AE7
R9 7940HS, Radeon 780M
Minisforum UH125 Pro
Ultra 5 125H, Arc 7-Core
Aoostar GEM10
R7 6800H, Radeon 680M
Acemagic F2A
Ultra 7 155H, Arc 8-Core
Geekom A5
R7 5800H, Vega 8
Media Intel Arc 7-Core iGPU
 
Media della classe Mini PC
 
Power Consumption
3%
-38%
-11%
-29%
-3%
-6%
-36%
Idle Minimum *
5.1
4.5
12%
11.9
-133%
7.3
-43%
9.1
-78%
6.9
-35%
6.88 ?(3 - 11.9, n=6)
-35%
Idle Average *
6.4
4.7
27%
14.6
-128%
8.7
-36%
10.3
-61%
7.9
-23%
9.02 ?(6.3 - 14.6, n=6)
-41%
Idle Maximum *
14.7
8.1
45%
15.4
-5%
10.4
29%
14.4
2%
8.9
39%
12.2 ?(6.5 - 16, n=6)
17%
Load Average *
55.5
81.8
-47%
48.3
13%
67.2
-21%
54.9
1%
60.8
-10%
Cyberpunk 2077 ultra external monitor *
59.1
71.2
-20%
52.7
11%
58.8
1%
Load Maximum *
103.3
100.3
3%
89.8
13%
101.6
2%
110.4
-7%
89.7
13%

* ... Meglio usare valori piccoli

Efficiency

Performance Rating - Percent
Geekom AE7
AMD Ryzen 9 7940HS, Radeon 780M
96.2 pt
Minisforum UH125 Pro
Intel Core Ultra 5 125H, Arc 7-Core
80.9 pt
Asus NUC 14 Pro
Intel Core Ultra 5 125H, Arc 7-Core
80.4 pt
Acemagic F2A
Intel Core Ultra 7 155H, Arc 8-Core
78.5 pt
Power Consumption
Cinebench R23 Multi Power Efficiency - external Monitor
Geekom AE7
AMD Ryzen 9 7940HS, Radeon 780M
238 Points per Watt +45%
Acemagic F2A
Intel Core Ultra 7 155H, Arc 8-Core
183.7 Points per Watt +12%
Minisforum UH125 Pro
Intel Core Ultra 5 125H, Arc 7-Core
181.1 Points per Watt +11%
Asus NUC 14 Pro
Intel Core Ultra 5 125H, Arc 7-Core
163.7 Points per Watt
Cinebench R23 Single Power Efficiency - external Monitor
Asus NUC 14 Pro
Intel Core Ultra 5 125H, Arc 7-Core
69.4 Points per Watt
Geekom AE7
AMD Ryzen 9 7940HS, Radeon 780M
61.4 Points per Watt -12%
Minisforum UH125 Pro
Intel Core Ultra 5 125H, Arc 7-Core
57.1 Points per Watt -18%
Acemagic F2A
Intel Core Ultra 7 155H, Arc 8-Core
54.2 Points per Watt -22%
Cinebench R15 Multi Efficiency (external Monitor)
Geekom AE7
AMD Ryzen 9 7940HS, Radeon 780M
33.2 Points per Watt +38%
Minisforum UH125 Pro
Intel Core Ultra 5 125H, Arc 7-Core
28 Points per Watt +17%
Acemagic F2A
Intel Core Ultra 7 155H, Arc 8-Core
26.6 Points per Watt +11%
Asus NUC 14 Pro
Intel Core Ultra 5 125H, Arc 7-Core
24 Points per Watt

Power consumtion with the external monitor

0102030405060708090100Tooltip
Asus NUC 14 Pro Ultra 5 125H, Arc 7-Core; Idle 1min (external Monitor): Ø6.48 (4.52-12)
Minisforum UH125 Pro Ultra 5 125H, Arc 7-Core; Idle 1min (external Monitor): Ø14.4 (13.7-16.8)
Aoostar GEM10 R7 6800H, Radeon 680M; Idle 1min (external Monitor): Ø9.01 (8.45-10.4)
Aoostar GEM10 R7 6800H, Radeon 680M; 1920x1080 The Witcher 3 ultra (external Monitor): Ø63.2 (61.3-86)
Asus NUC 14 Pro Ultra 5 125H, Arc 7-Core; 1280x720 Prime95 28.10 and Furmark 1.25: Ø90.8 (85.1-98.5)
Minisforum UH125 Pro Ultra 5 125H, Arc 7-Core; 1280x720 Prime95 28.10 and Furmark 1.25: Ø82.9 (81.3-87.6)
Aoostar GEM10 R7 6800H, Radeon 680M; 1280x720 Prime95 28.10 and Furmark 1.25: Ø87.3 (85-101.6)
Asus NUC 14 Pro Ultra 5 125H, Arc 7-Core; Cyberpunk 2077 FHD ultra no FSR (external Monitor): Ø59.1 (55.8-67.9)
Minisforum UH125 Pro Ultra 5 125H, Arc 7-Core; Cyberpunk 2077 FHD ultra no FSR (external Monitor): Ø52.7 (51.9-55.2)
Aoostar GEM10 R7 6800H, Radeon 680M; Cyberpunk 2077 FHD ultra no FSR (external Monitor): Ø58.8 (56.1-62.3)
Asus NUC 14 Pro Ultra 5 125H, Arc 7-Core; 3DMark06 Return To Proxycon: Ø55.5 (51.2-61.4)
Minisforum UH125 Pro Ultra 5 125H, Arc 7-Core; 3DMark06 Return To Proxycon: Ø48.4 (45.1-51.5)
Aoostar GEM10 R7 6800H, Radeon 680M; 3DMark06 Return To Proxycon: Ø67.2 (55.9-76)

Power consumtion with the external monitor

0102030405060708090100Tooltip
Asus NUC 14 Pro Ultra 5 125H, Arc 7-Core; Prime95 V2810 Stress (external Monitor): Ø90.6 (79.2-103.3)
Minisforum UH125 Pro Ultra 5 125H, Arc 7-Core; Prime95 V2810 Stress (external Monitor): Ø83 (67.7-89.8)
Aoostar GEM10 R7 6800H, Radeon 680M; Prime95 V2810 Stress (external Monitor): Ø76.4 (71.4-100.8)
Asus NUC 14 Pro Ultra 5 125H, Arc 7-Core; Cinebench R15 Multi (external Monitor): Ø89.2 (88-90.9)
Minisforum UH125 Pro Ultra 5 125H, Arc 7-Core; Cinebench R15 Multi (external Monitor): Ø80.3 (80-81.4)
Aoostar GEM10 R7 6800H, Radeon 680M; Cinebench R15 Multi (external Monitor): Ø87.9 (81.6-97.1)
Asus NUC 14 Pro Ultra 5 125H, Arc 7-Core; Cinebench R23 Single (external Monitor): Ø24.8 (20.8-58)
Minisforum UH125 Pro Ultra 5 125H, Arc 7-Core; Cinebench R23 Single (external Monitor): Ø28.7 (27-62.8)
Aoostar GEM10 R7 6800H, Radeon 680M; Cinebench R23 Single (external Monitor): Ø30.1 (28.4-45.5)
Asus NUC 14 Pro Ultra 5 125H, Arc 7-Core; Cinebench R23 Multi (external Monitor): Ø88.7 (86.9-91.6)
Minisforum UH125 Pro Ultra 5 125H, Arc 7-Core; Cinebench R23 Multi (external Monitor): Ø80.4 (79.8-81.1)
Aoostar GEM10 R7 6800H, Radeon 680M; Cinebench R23 Multi (external Monitor): Ø78.2 (71.1-95.8)
Asus NUC 14 Pro Ultra 5 125H, Arc 7-Core; 1280x720 FurMark 1.19 GPU Stress Test (external Monitor): Ø56.9 (53.6-63.3)
Minisforum UH125 Pro Ultra 5 125H, Arc 7-Core; 1280x720 FurMark 1.19 GPU Stress Test (external Monitor): Ø48 (46.2-53.5)
Aoostar GEM10 R7 6800H, Radeon 680M; 1280x720 FurMark 1.19 GPU Stress Test (external Monitor): Ø76.4 (69.1-84.4)

Pro

+ alloggiamento robusto e compatto
+ soC moderno con core P ed E
+ buone prestazioni di sistema
+ facile da aprire (senza attrezzi)
+ 2x Thunderbolt
+ wLAN veloce
+ molte impostazioni del BIOS
+ 36 mesi di garanzia

Contro

- udibile sotto carico
- latenze DPC elevate
- L'unità di raffreddamento raggiunge rapidamente il suo limite

Verdetto - Mini PC business con ampie opzioni BIOS

Recensione di Asus NUC 14 Pro: fornita da Asus Germania

I noti mini PC NUC, un tempo commercializzati direttamente da Intel, vengono ora portati avanti da Asus allo stesso modo. Basati sui processori Meteor Lake, i PC compatti ottengono un notevole incremento delle prestazioni in termini di prestazioni 3D.

Non è cambiato molto in termini di design rispetto ai familiari mini PC NUC. Sarebbe auspicabile un involucro interamente in metallo, in quanto l'Asus NUC 14 Pro è inferiore ad alcuni dei suoi concorrenti sotto questo aspetto. In termini di dimensioni, il mini PC è più piccolo di molti altri dispositivi. Purtroppo, questo design porta a un compromesso che tutti i produttori devono fare. Le prestazioni del SoC devono essere dissipate in modo affidabile. L'Asus NUC 14 Pro riesce a farlo abbastanza bene se non ci sono carichi continui. Asus spinge il limite di temperatura del Intel Core Ultra 5 125H che sicuramente farà sudare alcuni utenti. In linea di principio, i processori sono progettati per questi intervalli di temperatura. Nel frattempo, il BIOS offre molte opzioni che influenzano anche il limite di temperatura del processore. Qui è possibile impostare manualmente un limite. Tuttavia, bisogna aspettarsi prestazioni leggermente inferiori. L'eccellente connettività deve essere sottolineata positivamente: a bordo sono presenti molte porte USB e due porte Thunderbolt 4. Sono inclusi anche il Wi-Fi veloce e la LAN 2.5G.

L'Asus NUC 14 Pro è un potente mini PC NUC. La connettività è migliore rispetto alla maggior parte dei concorrenti e le ampie opzioni del BIOS sono un vero punto di forza.

Il prezzo di Asus NUC 14 Pro non è del tutto fuori dal comune. Con 510 euro, il dispositivo barebone non è certo un affare. Tuttavia, i suoi concorrenti possono facilmente costare più di 700 euro, compresi SSD, RAM e sistema operativo. Come consiglio sul rapporto prezzo-prestazioni, il Aoostar GEM10 è già disponibile a 459 dollari USA.

Nota: abbiamo recentemente aggiornato il nostro sistema di valutazione e i risultati della versione 8 non sono paragonabili ai risultati della versione 7. Ulteriori informazioni sono disponibili qui.

Prezzo e disponibilità

L'Asus NUC 14 Pro è disponibile in diverse configurazioni. Il mini PC con Intel Core Ultra 5 125H è attualmente disponibile a 500 euro. Il nostro dispositivo di prova è elencato su Alternate e Notebooksbilliger. L'opzione Tall con lo stesso SoC offre spazio aggiuntivo per un supporto dati da 2,5 pollici e può essere ordinata presso Alternate o Notebooksbilliger. Il prezzo qui è di circa 520 euro.

Asus NUC 14 Pro - 08/26/2024 v8
Sebastian Bade

Chassis
81 / 98 → 83%
Connettività
58 / 81 → 71%
Peso
83%
Prestazioni di gioco
47 / 80 → 59%
Prestazioni Applicazioni
80 / 92 → 87%
Workstation
28%
AI Performance
77%
Temperatura
87%
Rumorosità
80%
Media
54%
75%
Mini PC - Media ponderata
CO2 Emissions
No Data
Materials
25%
Packaging
25%
Power Use
77.5%
Repairability
30%
Software Updates
50%
Recycle Logo Total Sustainability Score: 34.6%

Transparency

The selection of devices to be reviewed is made by our editorial team. The test sample was provided to the author as a loan by the manufacturer or retailer for the purpose of this review. The lender had no influence on this review, nor did the manufacturer receive a copy of this review before publication. There was no obligation to publish this review. We never accept compensation or payment in return for our reviews. As an independent media company, Notebookcheck is not subjected to the authority of manufacturers, retailers or publishers.

This is how Notebookcheck is testing

Every year, Notebookcheck independently reviews hundreds of laptops and smartphones using standardized procedures to ensure that all results are comparable. We have continuously developed our test methods for around 20 years and set industry standards in the process. In our test labs, high-quality measuring equipment is utilized by experienced technicians and editors. These tests involve a multi-stage validation process. Our complex rating system is based on hundreds of well-founded measurements and benchmarks, which maintains objectivity. Further information on our test methods can be found here.

Price comparison

Please share our article, every link counts!
Mail Logo
> Recensioni e prove di notebook, tablets e smartphones > Recensioni e prove > Recensioni e prove > Recensione dell'Asus NUC 14 Pro: Mini PC NUC con Intel Core Ultra 5 125H, iGPU Intel Arc veloce e 2x Thunderbolt 4
Sebastian Bade, 2024-08-30 (Update: 2024-08-31)