Notebookcheck Logo

Recensione del laptop Maingear ML-16 MK2: prestante GeForce RTX 4070 a un prezzo decente
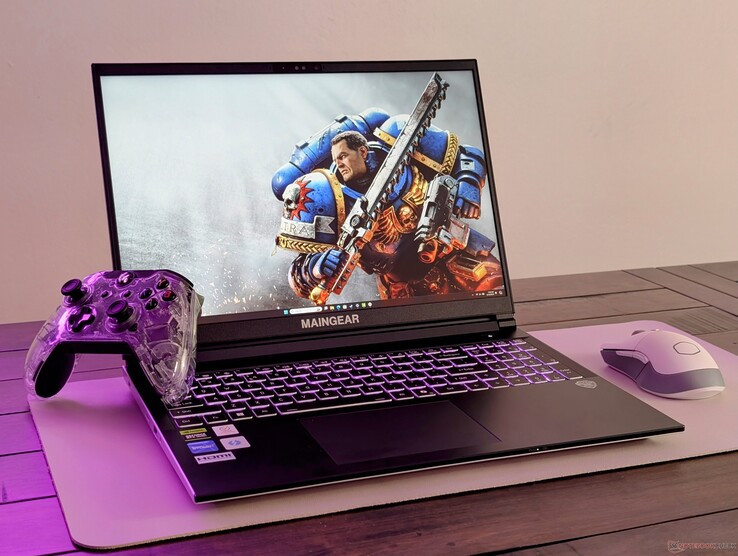
Come Schenker, ma per il Nord America.

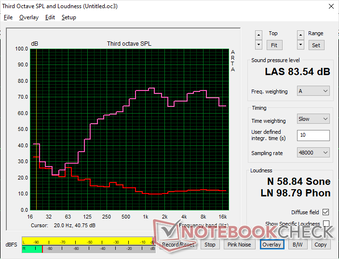
L'ML-16 MK2 enfatizza la potenza della GPU, il prezzo e la sottigliezza per essere un'opzione interessante per i giocatori o i creatori sempre in movimento. Gli svantaggi, tuttavia, sono difficili da ignorare nel senso più letterale del termine, poiché le ventole possono essere piuttosto rumorose.
Maingear ML-16 Mark II

Come Schenker o Eurocom, Maingear è un rivenditore di computer portatili white label ad alte prestazioni, progettati per attirare giocatori e professionisti. Questo approccio è in contrasto con i produttori di PC più noti, come Dell, Lenovo o HP, che progettano i loro computer portatili internamente. L'ultimo modello di Maingear è l'ML-16 MK2, dotato della più recente CPU Intel Meteor Lake e della GPU Nvidia.

La nostra unità di prova è stata completamente configurata con il Core Ultra 7 155H, la RTX 4070 da 105 W GeForce e il display IPS da 240 Hz 1600p per circa 2000 dollari. Le SKU inferiori sono dotate di RTX 4060, ma la CPU e il display rimangono fissi.

I concorrenti dell'ML-16 MK2 includono altri portatili da gioco ultrasottili da 16 pollici come il Razer Blade 16, Alienware x16 R2, Asus ROG Zephyrus G16o il Lenovo Legion Pro 7 16.

Altre recensioni di Maingear:

Maingear ML-16 MK2
Processore
Intel Core Ultra 7 155H 16 x 3.8 - 4.8 GHz, 85 W PL2 / Short Burst, 57 W PL1 / Sustained, Meteor Lake-H
Scheda grafica
NVIDIA GeForce RTX 4070 Laptop GPU - 8 GB VRAM, Core: 1980 MHz, RAM: 2000 MHz, 105 W TDP, GDDR6, 560.81, MUX
Memoria
32 GB 
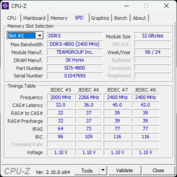
, Team Group, DDR5-4800, 40-39-39-77, Dual-Channel
Schermo
16.00 pollici 16:10, 2560 x 1600 pixel 189 PPI, TL160ADMP11-0, IPS, lucido: no, 240 Hz
Scheda madre
Intel Meteor Lake-U/P/H PCH
Scheda audio
Intel Meteor Lake-U/P/H PCH - cAVS (Audio, Voice, Speech)
Porte di connessione
1 USB 3.0 / 3.1, 3 USB 3.1 Gen 2, 1 Thunderbolt, USB-C Power Delivery (PD), 1 HDMI, 2 DisplayPort, Connessioni Audio: 3.5 mm combo, Lettore schede: MicroSD
Rete
Realtek RTL8168/8111 Gigabit-LAN (10/100/1000MBit/s), Intel Wi-Fi 6E AX211 (a/b/g/h/n = Wi-Fi 4/ac = Wi-Fi 5/ax = Wi-Fi 6/ Wi-Fi 6E 6 GHz), Bluetooth 5.3
Dimensioni
altezza x larghezza x profondità (in mm): 19.9 x 358 x 258.6
Batteria
80 Wh polimeri di litio
Sistema Operativo
Microsoft Windows 11 Pro
Camera
Webcam: 1080p30
Fotocamera Principale: 2.1 MPix
Altre caratteristiche
Casse: Stereo, Tastiera: Chiclet, Illuminazione Tastiera: si, Control Center, 12 Mesi Garanzia
Peso
2.109 kg, Alimentazione: 629 gr
Prezzo
2000 USD
Nota: il produttore potrebbe usare componenti di fornitori diversi pannelli dei diplay, drive o banchi di memoria con specifiche simili.


Potenziali concorrenti a confrontos

Punteggio
Versione
Data
Modello
Peso
Altezza
Dimensione
Risoluzione
Prezzo
80.9 %v8
09/2024
Maingear ML-16 MK2
Ultra 7 155H, NVIDIA GeForce RTX 4070 Laptop GPU
2.1 kg19.9 mm16.00"2560x1600
85.9 %v8
08/2024
Asus ROG Zephyrus G16 GA605WV
Ryzen AI 9 HX 370, NVIDIA GeForce RTX 4060 Laptop GPU
1.8 kg17.2 mm16.00"2560x1600
84.3 %
v7 (old)
v7 (old)
05/2024
HP Victus 16 (2024)
i7-14700HX, NVIDIA GeForce RTX 4060 Laptop GPU
2.4 kg23.9 mm16.10"1920x1080
88.4 %
v7 (old)
v7 (old)
05/2024
Alienware x16 R2 P120F
Ultra 9 185H, NVIDIA GeForce RTX 4080 Laptop GPU
2.7 kg18.57 mm16.00"2560x1600
89.3 %
v7 (old)
v7 (old)
04/2024
Lenovo Legion Pro 5 16IRX9
i9-14900HX, NVIDIA GeForce RTX 4070 Laptop GPU
2.5 kg26.95 mm16.00"2560x1600
91.1 %
v7 (old)
v7 (old)
02/2024
Razer Blade 16 2024, RTX 4090
i9-14900HX, NVIDIA GeForce RTX 4090 Laptop GPU
2.5 kg22 mm16.00"2560x1600

Nota: abbiamo recentemente aggiornato il nostro sistema di valutazione e i risultati della versione 8 non sono paragonabili ai risultati della versione 7. Ulteriori informazioni sono disponibili qui .

Custodia - Sottile e affilata

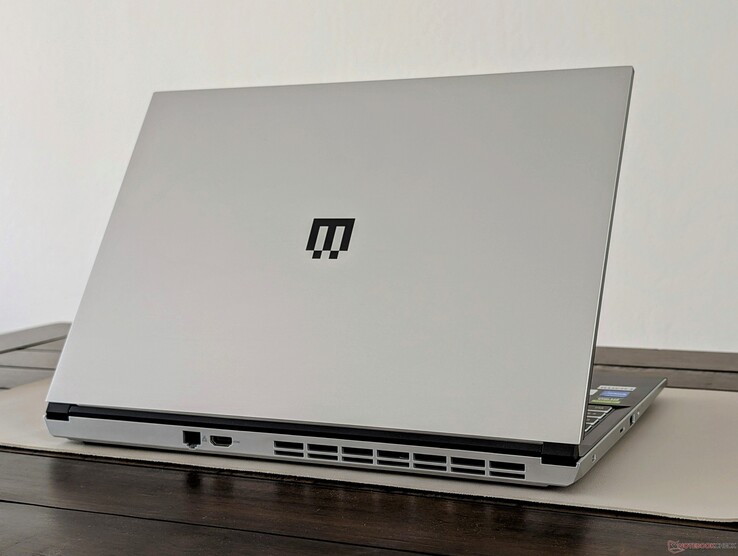
Lo chassis può essere ricondotto a Clevo (V560TNE-S) in base al produttore di origine. È costituito principalmente da alluminio metallico per il coperchio esterno e il fondo, mentre il piano tastiera nero è in plastica. I due colori contrastanti funzionano bene insieme per aiutare a distinguere visivamente il modello dal solito laptop da gioco completamente nero o bianco opaco.

La qualità del telaio, tuttavia, non riflette il prezzo elevato richiesto. Le superfici si deformano più facilmente e non si sentono così rigide come i concorrenti come il Razer Blade 16 o Alienware x16 R2. Ad esempio, premendo con un dito sul centro della tastiera o sul coperchio esterno, le superfici si deprimono sensibilmente. Anche il coperchio traballa più facilmente quando si regolano gli angoli. Dovrà fare più attenzione quando maneggia l'ML-16 MK2, altrimenti rischia di danneggiare le piccole cerniere.

Il peso e lo spessore sono più leggeri e sottili rispetto ai principali concorrenti, tra cui Blade 16 o Lenovo Legion Pro 5 16IRX9. L'Asus ROG Zephyrus G16 è ancora più sottile e leggero del nostro Maingear, ma ha anche un prezzo di vendita superiore di centinaia di dollari.

Design non unificato con parti in alluminio e plastica
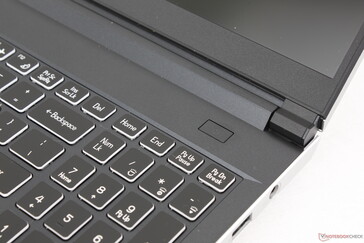
Nessun pulsante di accensione abilitato alle impronte digitali
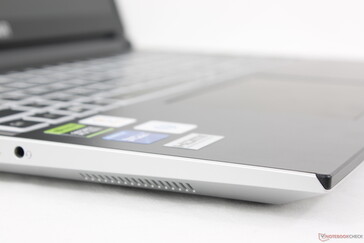
Nessuna ventilazione o griglia sopra la prima fila di tasti della tastiera
I bordi e gli angoli piatti e affilati conferiscono un aspetto più squadrato rispetto alla concorrenza
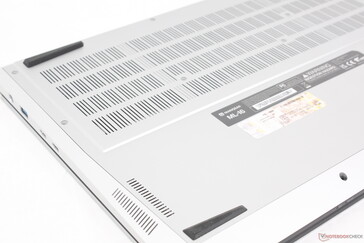
Metà della superficie inferiore è dedicata alla ventilazione
Coperchio aperto all'angolo massimo di ~140 gradi

Confronto delle dimensioni

369 mm 259.4 mm 23.9 mm 2.4 kg363.4 mm 261.75 mm 26.95 mm 2.5 kg364.74 mm 289.81 mm 18.57 mm 2.7 kg358 mm 258.6 mm 19.9 mm 2.1 kg355 mm 244 mm 22 mm 2.5 kg354 mm 246 mm 17.2 mm 1.8 kg297 mm 210 mm 1 mm 5.7 g

Connettività

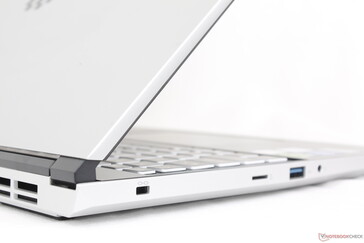
Le porte sono abbondanti, anche se ne mancano un paio. Il Blade 16, ad esempio, include più porte USB-A, mentre l'Alienware x16 R2 include una porta mini-Display. Il posizionamento delle porte è buono e non troppo affollato, a differenza del sistema Alienware citato in precedenza.

Anteriore: Nessuna porta
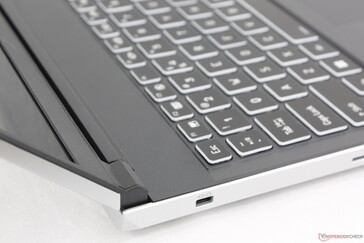
A destra: USB-C 3.2 Gen. 2 con DisplayPort 1.4, USB-C con Thunderbolt 4 + DisplayPort + Power Delivery, USB-A 3.2 Gen. 2, adattatore CA
Posteriore: 1 Gbps RJ-45, HDMI 2.1
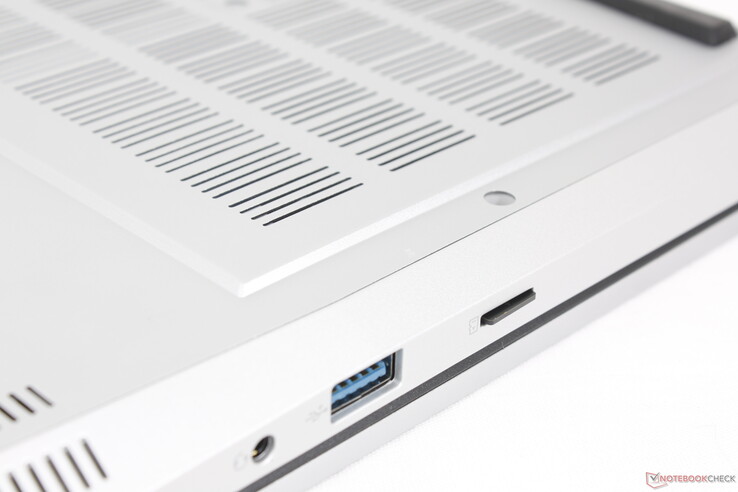
A sinistra: lucchetto Kensington, lettore MicroSD, USB-A 3.2 Gen. 1, cuffie da 3,5 mm,

Lettore di schede SD

Anche se apprezziamo il fatto di avere un piccolo lettore MicroSD invece di non avere alcun lettore SD, quello presente è lento, soprattutto per un portatile da gioco da 16 pollici. Il trasferimento di 1 GB di immagini dalla nostra scheda di test UHS-II richiede circa 25 secondi, rispetto ai soli 6 secondi del Blade 16.

La scheda MicroSD completamente inserita è quasi a filo con il bordo per un trasporto sicuro
SD Card Reader
average JPG Copy Test (av. of 3 runs)
Razer Blade 16 2024, RTX 4090
Intel Core i9-14900HX
171 (169.48min - 194.55max) MB/s +317%
Alienware x16 R2 P120F
Intel Core Ultra 9 185H (AV PRO microSD 128 GB V60)
168.9 MB/s +312%
Maingear ML-16 MK2
Intel Core Ultra 7 155H (AV PRO microSD 128 GB V60)
41 MB/s
maximum AS SSD Seq Read Test (1GB)
Alienware x16 R2 P120F
Intel Core Ultra 9 185H (AV PRO microSD 128 GB V60)
258 MB/s +229%
Razer Blade 16 2024, RTX 4090
Intel Core i9-14900HX
181.81 MB/s +132%
Maingear ML-16 MK2
Intel Core Ultra 7 155H (AV PRO microSD 128 GB V60)
78.4 MB/s

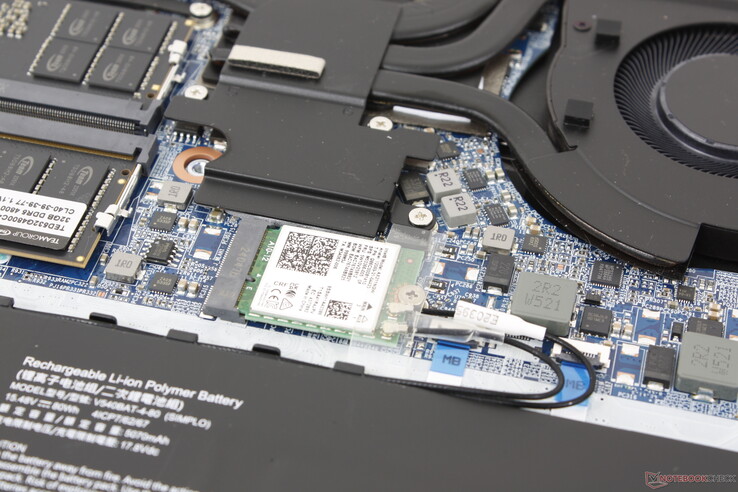
Comunicazione

L'Intel AX211 è dotato di connettività Wi-Fi 6E e Bluetooth 5.3 di serie. Abbiamo riscontrato velocità di trasferimento costanti e nessun problema quando è stato accoppiato al nostro router di prova AXE11000.

Modulo WLAN rimovibile
Networking
iperf3 transmit AXE11000
Asus ROG Zephyrus G16 GA605WV
Mediatek Wi-Fi 7 MT7925 Wireless LAN Card
1843 (1712min - 1964max) MBit/s +198%
Razer Blade 16 2024, RTX 4090
Intel Killer Wi-Fi 7 BE1750W 320 MHz (BE200NGW)
1577 (796min - 1617max) MBit/s +155%
Alienware x16 R2 P120F
Intel Killer Wi-Fi 7 BE1750x BE200NGW
1393 (771min - 1527max) MBit/s +125%
HP Victus 16 (2024)
Realtek RTL8852BE
776 (487min - 929max) MBit/s +25%
Lenovo Legion Pro 5 16IRX9
Intel Wi-Fi 6E AX211
636 (485min - 769max) MBit/s +3%
Maingear ML-16 MK2
Intel Wi-Fi 6E AX211
619 (429min - 751max) MBit/s
iperf3 receive AXE11000
Asus ROG Zephyrus G16 GA605WV
Mediatek Wi-Fi 7 MT7925 Wireless LAN Card
1712 (1678min - 1737max) MBit/s +152%
Razer Blade 16 2024, RTX 4090
Intel Killer Wi-Fi 7 BE1750W 320 MHz (BE200NGW)
1604 (1554min - 1623max) MBit/s +136%
Alienware x16 R2 P120F
Intel Killer Wi-Fi 7 BE1750x BE200NGW
1298 (794min - 1451max) MBit/s +91%
Lenovo Legion Pro 5 16IRX9
Intel Wi-Fi 6E AX211
1040 (739min - 1218max) MBit/s +53%
HP Victus 16 (2024)
Realtek RTL8852BE
978 (960min - 990max) MBit/s +44%
Maingear ML-16 MK2
Intel Wi-Fi 6E AX211
680 (541min - 731max) MBit/s
iperf3 transmit AXE11000 6GHz
Razer Blade 16 2024, RTX 4090
Intel Killer Wi-Fi 7 BE1750W 320 MHz (BE200NGW)
1538 (784min - 1597max) MBit/s +41%
Alienware x16 R2 P120F
Intel Killer Wi-Fi 7 BE1750x BE200NGW
1216 (706min - 1415max) MBit/s +11%
Maingear ML-16 MK2
Intel Wi-Fi 6E AX211
1092 (563min - 1183max) MBit/s
Lenovo Legion Pro 5 16IRX9
Intel Wi-Fi 6E AX211
820 (711min - 921max) MBit/s -25%
iperf3 receive AXE11000 6GHz
Razer Blade 16 2024, RTX 4090
Intel Killer Wi-Fi 7 BE1750W 320 MHz (BE200NGW)
1518 (762min - 1536max) MBit/s +54%
Alienware x16 R2 P120F
Intel Killer Wi-Fi 7 BE1750x BE200NGW
1281 (925min - 1431max) MBit/s +30%
Lenovo Legion Pro 5 16IRX9
Intel Wi-Fi 6E AX211
1205 (1100min - 1317max) MBit/s +22%
Maingear ML-16 MK2
Intel Wi-Fi 6E AX211
988 (495min - 1013max) MBit/s
0501001502002503003504004505005506006507007508008509009501000105011001150Tooltip
Maingear ML-16 MK2; iperf3 transmit AXE11000 6GHz; iperf 3.1.3: Ø1074 (563-1183)
Maingear ML-16 MK2; iperf3 receive AXE11000 6GHz; iperf 3.1.3: Ø971 (495-1013)

Webcam

Una webcam da 2 MP con IR e un otturatore elettronico sono di serie per essere paragonabili ai rivali.
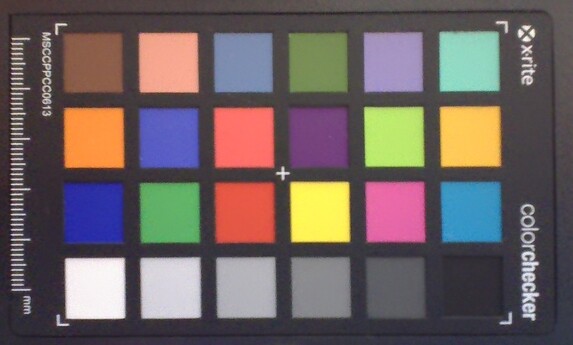
ColorChecker
6.3 ∆E
10.5 ∆E
8.1 ∆E
13.4 ∆E
8.7 ∆E
7.6 ∆E
9.3 ∆E
5.3 ∆E
14.8 ∆E
6.1 ∆E
10.8 ∆E
9.9 ∆E
5.3 ∆E
9.6 ∆E
17.1 ∆E
11.7 ∆E
10.9 ∆E
10.1 ∆E
2.8 ∆E
5.9 ∆E
6.7 ∆E
7.4 ∆E
4.6 ∆E
6.8 ∆E
ColorChecker Maingear ML-16 MK2: 8.74 ∆E min: 2.81 - max: 17.12 ∆E

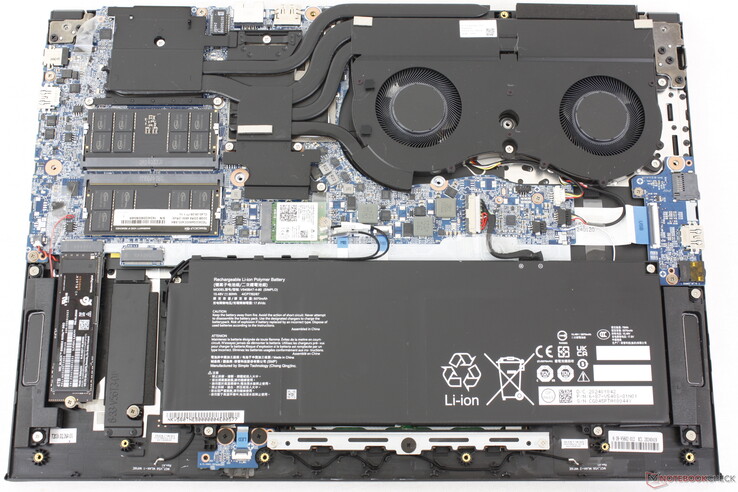
Manutenzione

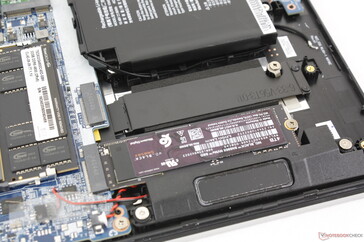
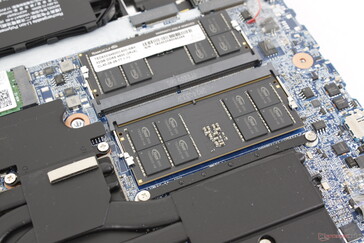
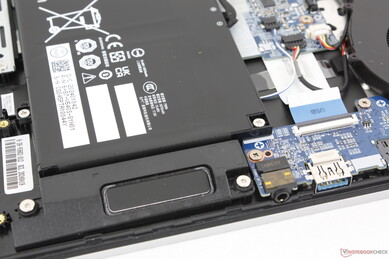
Il pannello inferiore richiede un po' di pazienza per essere rimosso, poiché è fissato da 13 viti Phillips. Per il resto, si toglie senza troppa resistenza per accedere facilmente ai due alloggiamenti M.2 PCIe4 x4 2280, ai due slot SODIMM, alla batteria e al modulo WLAN rimovibile. Queste opzioni sono paragonabili a quelle di Razer Blade 16, pur essendo migliori di quelle di Alienware x16 R2 che non ha alcuna RAM aggiornabile dall'utente.

Maingear ML-16 MK2
Maingear ML-16 MK2

Sostenibilità

Maingear pubblicizza l'assenza di materiali riciclati utilizzati per la produzione del portatile.

L'imballaggio è composto da cartone, involucri di plastica e LDPE non riciclabile.

Accessori e garanzia

La confezione non contiene altri extra oltre all'adattatore CA e alla documentazione cartacea. Se acquistato negli Stati Uniti, si applica la consueta garanzia limitata di un anno del produttore.

Dispositivi di ingresso

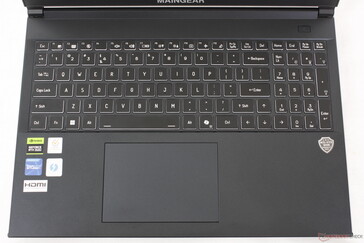
Tastiera

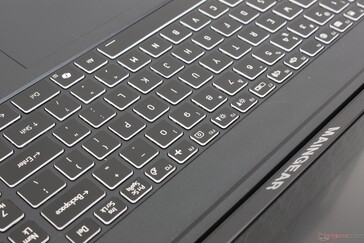
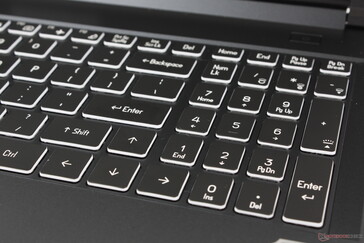
L'esperienza di digitazione è più rumorosa rispetto alla maggior parte degli altri computer portatili, a causa del rumore acuto dei tasti QWERTY principali. Un forte tintinnio di solito significa un feedback più solido e soddisfacente, ma questo non è il caso di ML-16 MK2, poiché la corsa è ancora poco profonda, mentre il feedback morbido non è all'altezza del livello di rumore acuto. Le tastiere di Legion Pro 5 16 o di Victus 16 che risultano più familiari in confronto e a cui è più facile abituarsi.

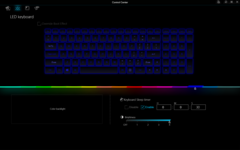
La retroilluminazione RGB a zona singola è standard, senza opzioni RGB per tasto o quadrupla zona.

Touchpad

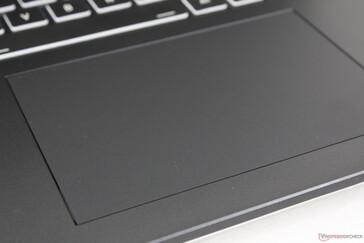
Il clickpad (12,2 x 8,3 cm) è più piccolo di quello del Blade 16 (17 x 9,7 cm) ma più grande di quello di Legion Pro 5 16IRX9 (12 x 7,5 cm). È spazioso, con un feedback solido e cliccabile quando viene premuto. Lo scorrimento, tuttavia, è quasi troppo fluido, soprattutto alle velocità più basse, il che rende più difficili i clic di precisione o le azioni di trascinamento. In confronto, il dito tende ad aderire quando si muove a velocità più basse sulla maggior parte degli altri computer portatili per aiutare la precisione.

Il layout e il carattere della tastiera ricordano i modelli di Schenker o Eurocom
Il touchpad è di dimensioni ragionevoli e restituisce un feedback quando viene premuto, ma è quasi troppo fluido
I tasti sono forti, ma poco profondi, con un feedback morbido, per una sensazione insoddisfacente
I tasti freccia sono a grandezza naturale, mentre i tasti del tastierino numerico sono stretti

Display - IPS da gioco

ML-16 MK2 è il primo modello del nostro database ad essere fornito con il pannello IPS TL160ADMP11-0 da 240 Hz. È paragonabile al pannello BOE B160QAN dell'Alienware x16 R2 in termini di frequenza di aggiornamento, rapporto di contrasto e risoluzione, ma non riesce ad eguagliare il display Dell per quanto riguarda la riproduzione dei colori o i tempi di risposta. Di conseguenza, il display ML-16 MK2 può essere considerato di fascia media, ma è comunque molto adatto per i giochi e per la maggior parte dell'editing grafico amatoriale.

Le funzioni più avanzate come G-Sync o HDR non sono supportate.

Nessuna opzione di vetro edge-to-edge o OLED
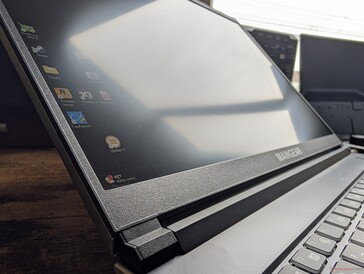
Cornici laterali strette
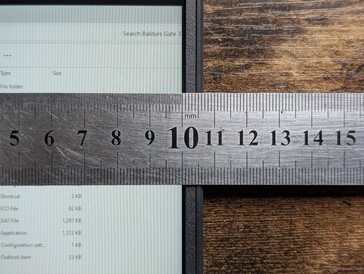
Il pannello opaco è più nitido del previsto, con una granulosità minima quando si guarda da vicino
Leggera perdita di luce irregolare in controluce lungo gli angoli
474.5
cd/m²
467.5
cd/m²
480.6
cd/m²
494
cd/m²
518.2
cd/m²
498.3
cd/m²
467.6
cd/m²
504.1
cd/m²
475.1
cd/m²
Distribuzione della luminosità
TL160ADMP11-0 testato con X-Rite i1Pro 2
Massima: 518.2 cd/m² (Nits) Media: 486.7 cd/m² Minimum: 25.62 cd/m²
Distribuzione della luminosità: 90 %
Al centro con la batteria: 518.2 cd/m²
Contrasto: 1296:1 (Nero: 0.4 cd/m²)
ΔE Color 1.88 | 0.5-29.43 Ø4.9, calibrated: 1.42
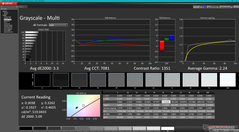
ΔE Greyscale 3.3 | 0.5-98 Ø5.2
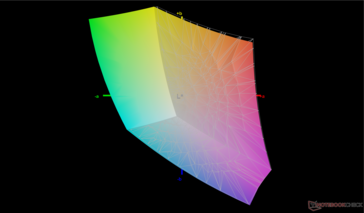
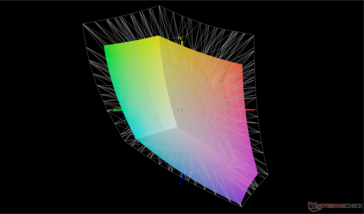
69.2% AdobeRGB 1998 (Argyll 2.2.0 3D)
98.2% sRGB (Argyll 2.2.0 3D)
67.3% Display P3 (Argyll 2.2.0 3D)
Gamma: 2.24
Maingear ML-16 MK2
TL160ADMP11-0, IPS, 2560x1600, 16", 240 Hz
Asus ROG Zephyrus G16 GA605WV
ATNA60DL04-0, OLED, 2560x1600, 16", 240 Hz
HP Victus 16 (2024)
Chi Mei CMN163E, IPS, 1920x1080, 16.1", 144 Hz
Alienware x16 R2 P120F
BOE B160QAN, IPS, 2560x1600, 16", 240 Hz
Lenovo Legion Pro 5 16IRX9
BOE NE160QDM-NYC, IPS, 2560x1600, 16", 165 Hz
Razer Blade 16 2024, RTX 4090
Samsung SDC41AB (ATNA60DL03-0), OLED, 2560x1600, 16", 240 Hz
Display
30%
-38%
25%
2%
29%
Display P3 Coverage
67.3
99.9
48%
41.3
-39%
98.3
46%
69.3
3%
99.1
47%
sRGB Coverage
98.2
100
2%
61.7
-37%
100
2%
99.4
1%
99.9
2%
AdobeRGB 1998 Coverage
69.2
96.9
40%
42.7
-38%
88.8
28%
70.1
1%
95.6
38%
Response Times
98%
-117%
42%
4%
97%
Response Time Grey 50% / Grey 80% *
12.5 ?(5.6, 6.9)
0.22 ?(0.11, 0.11)
98%
28.6 ?(13.3, 15.3)
-129%
3.9 ?(1.7, 2.2)
69%
11.9 ?(5.5, 6.4)
5%
0.24 ?(0.15, 0.09)
98%
Response Time Black / White *
9.1 ?(5, 4.1)
0.25 ?(0.13, 0.12)
97%
18.7 ?(9.6, 9.1)
-105%
7.8 ?(3.9, 3.7)
14%
8.9 ?(4.8, 4.1)
2%
0.4 ?(0.2, 0.2)
96%
PWM Frequency
960
960
Screen
11%
-79%
-3%
14%
193%
Brightness middle
518.2
416
-20%
287
-45%
348.4
-33%
384
-26%
418
-19%
Brightness
487
418
-14%
288
-41%
340
-30%
366
-25%
420
-14%
Brightness Distribution
90
96
7%
86
-4%
90
0%
91
1%
98
9%
Black Level *
0.4
0.19
52%
0.33
17%
0.35
12%
0.02
95%
Contrast
1296
1511
17%
1056
-19%
1097
-15%
20900
1513%
Colorchecker dE 2000 *
1.88
1.6
15%
5.46
-190%
2.68
-43%
0.97
48%
1.07
43%
Colorchecker dE 2000 max. *
4.96
2.1
58%
20.36
-310%
4.14
17%
3.57
28%
4.04
19%
Colorchecker dE 2000 calibrated *
1.42
3.52
-148%
0.42
70%
0.77
46%
1.07
25%
Greyscale dE 2000 *
3.3
2.7
18%
4.8
-45%
3.4
-3%
1.5
55%
1.12
66%
Gamma
2.24 98%
2.16 102%
2.108 104%
2.41 91%
2.24 98%
2.29 96%
CCT
7081 92%
6331 103%
6442 101%
6083 107%
6709 97%
6417 101%
Media totale (Programma / Settaggio)
46% / 32%
-78% / -76%
21% / 10%
7% / 10%
106% / 144%

* ... Meglio usare valori piccoli

rispetto a sRGB
rispetto a sRGB
contro P3
contro P3

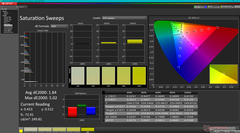
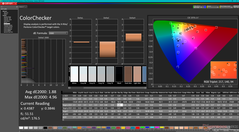
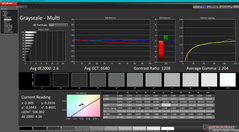
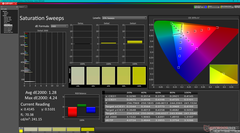
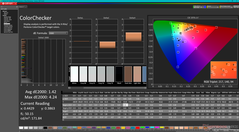
Sebbene il display non sia calibrato in fabbrica, i valori medi del DeltaE della scala di grigi e del colore sono abbastanza buoni, rispettivamente 3,3 e 1,8. La temperatura del colore è leggermente troppo fredda, quasi 7100, ma la calibrazione con il nostro colorimetro X-Rite risolve questo problema e migliora leggermente i valori deltaE medi. Gli utenti possono applicare gratuitamente il nostro profilo ICM calibrato qui sopra.

Scala di grigi prima della calibrazione
Sweep di saturazione prima della calibrazione
ColorChecker prima della calibrazione
Scala di grigi dopo la calibrazione
Sweep di saturazione dopo la calibrazione
ColorChecker dopo la calibrazione

Tempi di risposta del Display

I tempi di risposta del display mostrano quanto sia veloce lo schermo a cambaire da un colore all'altro. Tempi di risposta lenti possono creare sovrapposizioni negloi oggetti in movimento. Specialmente i giocatori patiti del 3D dovrebbero usare uno schermo con tempi di risposta bassi.
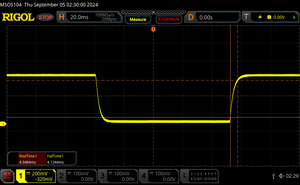
       Tempi di risposta dal Nero al Bianco
9.1 ms ... aumenta ↗ e diminuisce ↘ combinato↗ 5 ms Incremento
↘ 4.1 ms Calo
Lo schermo mostra veloci tempi di risposta durante i nostri tests e dovrebbe esere adatto al gaming
In confronto, tutti i dispositivi di test variano da 0.1 (minimo) a 240 (massimo) ms. » 22 % di tutti i dispositivi è migliore.
Questo significa che i tempi di risposta rilevati sono migliori rispettto alla media di tutti i dispositivi testati (20.9 ms).
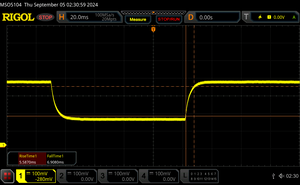
       Tempo di risposta dal 50% Grigio all'80% Grigio
12.5 ms ... aumenta ↗ e diminuisce ↘ combinato↗ 5.6 ms Incremento
↘ 6.9 ms Calo
Lo schermo mostra buoni tempi di risposta durante i nostri tests, ma potrebbe essere troppo lento per i gamers competitivi.
In confronto, tutti i dispositivi di test variano da 0.165 (minimo) a 636 (massimo) ms. » 23 % di tutti i dispositivi è migliore.
Questo significa che i tempi di risposta rilevati sono migliori rispettto alla media di tutti i dispositivi testati (32.8 ms).

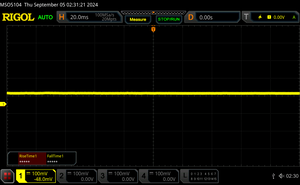
Sfarfallio dello schermo / PWM (Pulse-Width Modulation)

Per ridurre la luminosità dello schermo, alcuni portatili accendono e spengono la retroilluminazione in rapida successione - un metodo chiamato Pulse Width Modulation (PWM). Questa frequenza di ciclo a livello ideale non dovrebbe essere percepibile dall'occhi umano. Se tale frequenza è troppo bassa, gli utenti con occhi sensibili potrebbero stancarsi gli occhi o avere mal di testa o anche notare uno sfarfallio.
flickering dello schermo / PWM non rilevato

In confronto: 53 % di tutti i dispositivi testati non utilizza PWM per ridurre la luminosita' del display. Se è rilevato PWM, una media di 8684 (minimo: 5 - massimo: 343500) Hz è stata rilevata.

La visibilità all'aperto è migliore rispetto alla maggior parte degli altri portatili da gioco da 16 pollici, grazie alla retroilluminazione relativamente luminosa da 500 nit. Il Victus 16, Alienware x16 R2 e Blade 16, ad esempio, raggiungono un massimo di soli 400 nit o anche solo 300 nit per essere sensibilmente più scarsi. Dovrà comunque evitare la luce diretta del sole per preservare il più possibile i colori.

All'aperto, sotto la luce del sole
All'aperto, all'ombra
All'aperto, sotto la luce del sole
Ampi angoli di visione IPS. I colori e il contrasto si degradano con angolazioni estreme

Prestazioni - Aggiornamento Meteor Lake anziché Raptor Lake


Condizioni del test

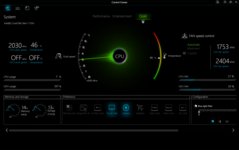
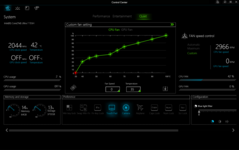
Abbiamo impostato Windows e Control Center sulla modalità Prestazioni prima di eseguire i benchmark qui sotto. I proprietari dovrebbero familiarizzare con il software Control Center preinstallato, in quanto è l'hub per regolare le funzioni chiave, tra cui il comportamento della ventola, l'otturatore elettronico della fotocamera, i tasti RGB e l'interruttore MUX manuale della GPU. Si noti che quest'ultimo è fastidiosamente nascosto in un sottomenu che richiede ulteriori clic per accedervi.

Sono supportati solo Optimus e MUX standard, senza Optimus avanzato. Pertanto, è necessario un riavvio quando si passa dalla modalità dGPU a quella MSHybrid.

Schermata iniziale del Centro di controllo
Impostazioni della tastiera RGB
Impostazioni manuali della curva del ventilatore

Processore

Il Core Ultra 7 155H succede al Core i7-13700Hma l'aumento delle prestazioni è relativamente marginale, tra il 5 e il 15 percento. Ciò è dovuto al fatto che la nuova piattaforma Meteor Lake riserva gran parte dello spazio del die alla nuova NPU integrata e quindi i vantaggi in termini di prestazioni grezze sono passati in secondo piano quest'anno. Il Core i7-14700HX avrebbe aumentato le prestazioni grezze in modo molto più significativo rispetto al Core Ultra 7 155H, ma è anche un processore più avido di energia.

La NPU integrata è purtroppo di uso molto limitato, in quanto non è compatibile con Co-Pilot+; il servizio Microsoft richiede almeno un processore Lunar Lake o l'equivalente AMD/Qualcomm. Anche la maggior parte dei giochi non utilizza ancora la NPU.

Cinebench R15 Multi Loop

0230460690920115013801610184020702300253027602990322034503680391041404370Tooltip
Maingear ML-16 MK2 Intel Core Ultra 7 155H: Ø2134 (1976.58-2705.26)
Asus ROG Zephyrus G16 GA605WV AMD Ryzen AI 9 HX 370: Ø3338 (3327.79-3370.98)
HP Victus 16 (2024) Intel Core i7-14700HX: Ø2658 (2509.88-3812.18)
Alienware x16 R2 P120F Intel Core Ultra 9 185H: Ø2753 (2708.56-2857.35)
Lenovo Legion Pro 5 16IRX9 Intel Core i9-14900HX: Ø4230 (4151.1-4590.84)
Razer Blade 16 2024, RTX 4090 Intel Core i9-14900HX: Ø4396 (4349.72-4455.83)
CPU Performance Rating: Percent
Cinebench R23: Multi Core | Single Core
Cinebench R20: CPU (Multi Core) | CPU (Single Core)
Cinebench R15: CPU Multi 64Bit | CPU Single 64Bit
Blender: v2.79 BMW27 CPU
7-Zip 18.03: 7z b 4 | 7z b 4 -mmt1
Geekbench 6.3: Multi-Core | Single-Core
Geekbench 5.5: Multi-Core | Single-Core
HWBOT x265 Benchmark v2.2: 4k Preset
LibreOffice : 20 Documents To PDF
R Benchmark 2.5: Overall mean
CPU Performance Rating
Razer Blade 16 2024, RTX 4090
Intel Core i9-14900HX
88.5 pt
Asus ROG Zephyrus G16 GA605WV
AMD Ryzen AI 9 HX 370
76 pt
HP Victus 16 (2024)
Intel Core i7-14700HX
69.3 pt
Asus TUF Gaming A16 FA617XS -2!
AMD Ryzen 9 7940HS
65.1 pt
MSI Stealth 16 Mercedes-AMG Motorsport A13VG
Intel Core i9-13900H
64.8 pt
Lenovo Legion Slim 7 16APH8
AMD Ryzen 7 7840HS
62.9 pt
Dell Inspiron 16 Plus 7630
Intel Core i7-13700H
62.9 pt
HP Victus 16-r0076TX -3!
Intel Core i5-13500HX
62.7 pt
Alienware x16 R2 P120F
Intel Core Ultra 9 185H
61.1 pt
Maingear ML-16 MK2
Intel Core Ultra 7 155H
59 pt
Media Intel Core Ultra 7 155H
 
58.4 pt
HP Victus 16-r0077ng
Intel Core i7-13700H
56.9 pt
CSL GameStar Notebook VenomGamer G16
AMD Ryzen 7 7735HS
53.9 pt
HP Omen 16-n0033dx -2!
AMD Ryzen 7 6800H
50.1 pt
Acer Nitro 16 AN16-41-R7YE
AMD Ryzen 5 7535HS
48.1 pt
Cinebench R23 / Multi Core
Razer Blade 16 2024, RTX 4090
Intel Core i9-14900HX
28867 Points +68%
HP Victus 16 (2024)
Intel Core i7-14700HX
23887 Points +39%
Asus ROG Zephyrus G16 GA605WV
AMD Ryzen AI 9 HX 370
22724 Points +32%
MSI Stealth 16 Mercedes-AMG Motorsport A13VG
Intel Core i9-13900H
19907 Points +16%
Alienware x16 R2 P120F
Intel Core Ultra 9 185H
18338 (17139.2min - 18337.8max) Points +6%
HP Victus 16-r0076TX
Intel Core i5-13500HX
18334 Points +6%
Maingear ML-16 MK2
Intel Core Ultra 7 155H
17231 (12872.9min - 17231.1max) Points
Asus TUF Gaming A16 FA617XS
AMD Ryzen 9 7940HS
16907 Points -2%
Lenovo Legion Slim 7 16APH8
AMD Ryzen 7 7840HS
16364 Points -5%
Dell Inspiron 16 Plus 7630
Intel Core i7-13700H
15922 (13533.8min - 15922.1max) Points -8%
HP Victus 16-r0077ng
Intel Core i7-13700H
15410 Points -11%
Media Intel Core Ultra 7 155H
  (9769 - 19007, n=50)
15004 Points -13%
CSL GameStar Notebook VenomGamer G16
AMD Ryzen 7 7735HS
13556 Points -21%
HP Omen 16-n0033dx
AMD Ryzen 7 6800H
13094 (12158.8min - 13093.9max) Points -24%
Acer Nitro 16 AN16-41-R7YE
AMD Ryzen 5 7535HS
10900 Points -37%
Cinebench R23 / Single Core
Razer Blade 16 2024, RTX 4090
Intel Core i9-14900HX
2117 Points +28%
MSI Stealth 16 Mercedes-AMG Motorsport A13VG
Intel Core i9-13900H
2023 Points +23%
Asus ROG Zephyrus G16 GA605WV
AMD Ryzen AI 9 HX 370
1973 Points +20%
Dell Inspiron 16 Plus 7630
Intel Core i7-13700H
1874 Points +14%
Asus TUF Gaming A16 FA617XS
AMD Ryzen 9 7940HS
1791 Points +9%
Lenovo Legion Slim 7 16APH8
AMD Ryzen 7 7840HS
1754 Points +6%
Media Intel Core Ultra 7 155H
  (1496 - 1815, n=50)
1727 Points +5%
HP Victus 16 (2024)
Intel Core i7-14700HX
1702 Points +3%
HP Victus 16-r0076TX
Intel Core i5-13500HX
1689 Points +2%
HP Victus 16-r0077ng
Intel Core i7-13700H
1687 Points +2%
Maingear ML-16 MK2
Intel Core Ultra 7 155H
1650 Points
Alienware x16 R2 P120F
Intel Core Ultra 9 185H
1620 Points -2%
CSL GameStar Notebook VenomGamer G16
AMD Ryzen 7 7735HS
1522 Points -8%
HP Omen 16-n0033dx
AMD Ryzen 7 6800H
1500 Points -9%
Acer Nitro 16 AN16-41-R7YE
AMD Ryzen 5 7535HS
1488 Points -10%
Cinebench R20 / CPU (Multi Core)
Razer Blade 16 2024, RTX 4090
Intel Core i9-14900HX
10968 Points +62%
HP Victus 16 (2024)
Intel Core i7-14700HX
9244 Points +36%
Asus ROG Zephyrus G16 GA605WV
AMD Ryzen AI 9 HX 370
8843 Points +30%
MSI Stealth 16 Mercedes-AMG Motorsport A13VG
Intel Core i9-13900H
7659 Points +13%
Alienware x16 R2 P120F
Intel Core Ultra 9 185H
7081 Points +4%
HP Victus 16-r0076TX
Intel Core i5-13500HX
7021 Points +3%
Maingear ML-16 MK2
Intel Core Ultra 7 155H
6789 Points
Asus TUF Gaming A16 FA617XS
AMD Ryzen 9 7940HS
6571 Points -3%
Lenovo Legion Slim 7 16APH8
AMD Ryzen 7 7840HS
6379 Points -6%
Dell Inspiron 16 Plus 7630
Intel Core i7-13700H
6162 Points -9%
HP Victus 16-r0077ng
Intel Core i7-13700H
5895 Points -13%
Media Intel Core Ultra 7 155H
  (3798 - 7409, n=48)
5823 Points -14%
CSL GameStar Notebook VenomGamer G16
AMD Ryzen 7 7735HS
5224 Points -23%
HP Omen 16-n0033dx
AMD Ryzen 7 6800H
5083 Points -25%
Acer Nitro 16 AN16-41-R7YE
AMD Ryzen 5 7535HS
4224 Points -38%
Cinebench R20 / CPU (Single Core)
Razer Blade 16 2024, RTX 4090
Intel Core i9-14900HX
810 Points +28%
Asus ROG Zephyrus G16 GA605WV
AMD Ryzen AI 9 HX 370
777 Points +23%
MSI Stealth 16 Mercedes-AMG Motorsport A13VG
Intel Core i9-13900H
776 Points +22%
Dell Inspiron 16 Plus 7630
Intel Core i7-13700H
725 Points +14%
Asus TUF Gaming A16 FA617XS
AMD Ryzen 9 7940HS
702 Points +11%
Lenovo Legion Slim 7 16APH8
AMD Ryzen 7 7840HS
672 Points +6%
Media Intel Core Ultra 7 155H
  (601 - 696, n=48)
665 Points +5%
HP Victus 16 (2024)
Intel Core i7-14700HX
651 Points +3%
HP Victus 16-r0077ng
Intel Core i7-13700H
649 Points +2%
HP Victus 16-r0076TX
Intel Core i5-13500HX
648 Points +2%
Maingear ML-16 MK2
Intel Core Ultra 7 155H
634 Points
Alienware x16 R2 P120F
Intel Core Ultra 9 185H
622 Points -2%
HP Omen 16-n0033dx
AMD Ryzen 7 6800H
598 Points -6%
CSL GameStar Notebook VenomGamer G16
AMD Ryzen 7 7735HS
595 Points -6%
Acer Nitro 16 AN16-41-R7YE
AMD Ryzen 5 7535HS
581 Points -8%
Cinebench R15 / CPU Multi 64Bit
Razer Blade 16 2024, RTX 4090
Intel Core i9-14900HX
4456 (4349.72min - 4455.83max) Points +65%
HP Victus 16 (2024)
Intel Core i7-14700HX
3812 Points +41%
Asus ROG Zephyrus G16 GA605WV
AMD Ryzen AI 9 HX 370
3371 (3327.79min - 3370.98max) Points +25%
MSI Stealth 16 Mercedes-AMG Motorsport A13VG
Intel Core i9-13900H
3026 (1537.87min - 3026.18max) Points +12%
HP Victus 16-r0076TX
Intel Core i5-13500HX
2863 (2303.88min - 2863.07max) Points +6%
Alienware x16 R2 P120F
Intel Core Ultra 9 185H
2857 (2708.56min - 2857.35max) Points +6%
Maingear ML-16 MK2
Intel Core Ultra 7 155H
2705 (1976.58min - 2705.26max) Points
Asus TUF Gaming A16 FA617XS
AMD Ryzen 9 7940HS
2666.7 Points -1%
Lenovo Legion Slim 7 16APH8
AMD Ryzen 7 7840HS
2564 (2422.77min - 2563.77max) Points -5%
Media Intel Core Ultra 7 155H
  (1932 - 2880, n=54)
2451 Points -9%
Dell Inspiron 16 Plus 7630
Intel Core i7-13700H
2421 (1806.77min - 2421.45max) Points -10%
HP Victus 16-r0077ng
Intel Core i7-13700H
2317 (2203.13min - 2316.56max) Points -14%
CSL GameStar Notebook VenomGamer G16
AMD Ryzen 7 7735HS
2195 (2121.57min - 2195.39max) Points -19%
HP Omen 16-n0033dx
AMD Ryzen 7 6800H
2151 (2104.6min - 2150.88max) Points -20%
Acer Nitro 16 AN16-41-R7YE
AMD Ryzen 5 7535HS
1757 Points -35%
Cinebench R15 / CPU Single 64Bit
Razer Blade 16 2024, RTX 4090
Intel Core i9-14900HX
311 Points +29%
Asus ROG Zephyrus G16 GA605WV
AMD Ryzen AI 9 HX 370
303 Points +25%
Asus TUF Gaming A16 FA617XS
AMD Ryzen 9 7940HS
283 Points +17%
MSI Stealth 16 Mercedes-AMG Motorsport A13VG
Intel Core i9-13900H
280 Points +16%
Lenovo Legion Slim 7 16APH8
AMD Ryzen 7 7840HS
273 Points +13%
Dell Inspiron 16 Plus 7630
Intel Core i7-13700H
265 Points +10%
CSL GameStar Notebook VenomGamer G16
AMD Ryzen 7 7735HS
251 Points +4%
Media Intel Core Ultra 7 155H
  (99.6 - 268, n=50)
250 Points +3%
HP Victus 16-r0077ng
Intel Core i7-13700H
245 Points +1%
HP Omen 16-n0033dx
AMD Ryzen 7 6800H
243 Points 0%
HP Victus 16-r0076TX
Intel Core i5-13500HX
242 Points 0%
Maingear ML-16 MK2
Intel Core Ultra 7 155H
242 Points
Acer Nitro 16 AN16-41-R7YE
AMD Ryzen 5 7535HS
241 Points 0%
HP Victus 16 (2024)
Intel Core i7-14700HX
238 Points -2%
Alienware x16 R2 P120F
Intel Core Ultra 9 185H
238 Points -2%
Blender / v2.79 BMW27 CPU
Acer Nitro 16 AN16-41-R7YE
AMD Ryzen 5 7535HS
286 Seconds * -27%
HP Omen 16-n0033dx
AMD Ryzen 7 6800H
236 Seconds * -4%
MSI Stealth 16 Mercedes-AMG Motorsport A13VG
Intel Core i9-13900H
231 Seconds * -2%
Media Intel Core Ultra 7 155H
  (175 - 381, n=46)
231 Seconds * -2%
Maingear ML-16 MK2
Intel Core Ultra 7 155H
226 Seconds *
Dell Inspiron 16 Plus 7630
Intel Core i7-13700H
221 Seconds * +2%
HP Victus 16-r0077ng
Intel Core i7-13700H
215 Seconds * +5%
CSL GameStar Notebook VenomGamer G16
AMD Ryzen 7 7735HS
214 Seconds * +5%
Lenovo Legion Slim 7 16APH8
AMD Ryzen 7 7840HS
195 Seconds * +14%
HP Victus 16-r0076TX
Intel Core i5-13500HX
193 Seconds * +15%
Asus TUF Gaming A16 FA617XS
AMD Ryzen 9 7940HS
189 Seconds * +16%
Alienware x16 R2 P120F
Intel Core Ultra 9 185H
178 Seconds * +21%
HP Victus 16 (2024)
Intel Core i7-14700HX
173 Seconds * +23%
Asus ROG Zephyrus G16 GA605WV
AMD Ryzen AI 9 HX 370
145 Seconds * +36%
Razer Blade 16 2024, RTX 4090
Intel Core i9-14900HX
113 Seconds * +50%
7-Zip 18.03 / 7z b 4
Razer Blade 16 2024, RTX 4090
Intel Core i9-14900HX
115695 MIPS +80%
HP Victus 16 (2024)
Intel Core i7-14700HX
84799 MIPS +32%
Asus ROG Zephyrus G16 GA605WV
AMD Ryzen AI 9 HX 370
82463 MIPS +28%
HP Victus 16-r0076TX
Intel Core i5-13500HX
71243 MIPS +11%
Lenovo Legion Slim 7 16APH8
AMD Ryzen 7 7840HS
70243 MIPS +9%
Asus TUF Gaming A16 FA617XS
AMD Ryzen 9 7940HS
70081 MIPS +9%
Alienware x16 R2 P120F
Intel Core Ultra 9 185H
67227 MIPS +5%
HP Victus 16-r0077ng
Intel Core i7-13700H
65405 MIPS +2%
Maingear ML-16 MK2
Intel Core Ultra 7 155H
64182 MIPS
CSL GameStar Notebook VenomGamer G16
AMD Ryzen 7 7735HS
63698 MIPS -1%
Dell Inspiron 16 Plus 7630
Intel Core i7-13700H
59433 MIPS -7%
Media Intel Core Ultra 7 155H
  (41739 - 70254, n=48)
59285 MIPS -8%
HP Omen 16-n0033dx
AMD Ryzen 7 6800H
58798 MIPS -8%
MSI Stealth 16 Mercedes-AMG Motorsport A13VG
Intel Core i9-13900H
57625 MIPS -10%
Acer Nitro 16 AN16-41-R7YE
AMD Ryzen 5 7535HS
48646 MIPS -24%
7-Zip 18.03 / 7z b 4 -mmt1
Razer Blade 16 2024, RTX 4090
Intel Core i9-14900HX
7018 MIPS +39%
Asus TUF Gaming A16 FA617XS
AMD Ryzen 9 7940HS
6621 MIPS +31%
Lenovo Legion Slim 7 16APH8
AMD Ryzen 7 7840HS
6604 MIPS +31%
MSI Stealth 16 Mercedes-AMG Motorsport A13VG
Intel Core i9-13900H
6305 MIPS +25%
Asus ROG Zephyrus G16 GA605WV
AMD Ryzen AI 9 HX 370
6127 MIPS +21%
CSL GameStar Notebook VenomGamer G16
AMD Ryzen 7 7735HS
5792 MIPS +15%
Dell Inspiron 16 Plus 7630
Intel Core i7-13700H
5703 MIPS +13%
Acer Nitro 16 AN16-41-R7YE
AMD Ryzen 5 7535HS
5670 MIPS +12%
HP Omen 16-n0033dx
AMD Ryzen 7 6800H
5669 MIPS +12%
HP Victus 16 (2024)
Intel Core i7-14700HX
5641 MIPS +12%
HP Victus 16-r0077ng
Intel Core i7-13700H
5559 MIPS +10%
HP Victus 16-r0076TX
Intel Core i5-13500HX
5377 MIPS +7%
Media Intel Core Ultra 7 155H
  (4795 - 5621, n=48)
5350 MIPS +6%
Maingear ML-16 MK2
Intel Core Ultra 7 155H
5047 MIPS
Alienware x16 R2 P120F
Intel Core Ultra 9 185H
4502 MIPS -11%
Geekbench 6.3 / Multi-Core
Razer Blade 16 2024, RTX 4090
Intel Core i9-14900HX
17559 Points +47%
Asus ROG Zephyrus G16 GA605WV
AMD Ryzen AI 9 HX 370
15230 Points +28%
HP Victus 16 (2024)
Intel Core i7-14700HX
14807 Points +24%
Dell Inspiron 16 Plus 7630
Intel Core i7-13700H
13406 Points +12%
Lenovo Legion Slim 7 16APH8
AMD Ryzen 7 7840HS
12919 Points +8%
Alienware x16 R2 P120F
Intel Core Ultra 9 185H
12825 Points +7%
Media Intel Core Ultra 7 155H
  (7732 - 13656, n=53)
12293 Points +3%
MSI Stealth 16 Mercedes-AMG Motorsport A13VG
Intel Core i9-13900H
12060 Points +1%
Maingear ML-16 MK2
Intel Core Ultra 7 155H
11941 Points
HP Victus 16-r0077ng
Intel Core i7-13700H
11741 Points -2%
CSL GameStar Notebook VenomGamer G16
AMD Ryzen 7 7735HS
10807 Points -9%
Acer Nitro 16 AN16-41-R7YE
AMD Ryzen 5 7535HS
8960 Points -25%
Geekbench 6.3 / Single-Core
Razer Blade 16 2024, RTX 4090
Intel Core i9-14900HX
2964 Points +32%
Asus ROG Zephyrus G16 GA605WV
AMD Ryzen AI 9 HX 370
2875 Points +28%
MSI Stealth 16 Mercedes-AMG Motorsport A13VG
Intel Core i9-13900H
2765 Points +24%
Dell Inspiron 16 Plus 7630
Intel Core i7-13700H
2638 Points +18%
Lenovo Legion Slim 7 16APH8
AMD Ryzen 7 7840HS
2625 Points +17%
HP Victus 16-r0077ng
Intel Core i7-13700H
2395 Points +7%
HP Victus 16 (2024)
Intel Core i7-14700HX
2378 Points +6%
Media Intel Core Ultra 7 155H
  (1901 - 2473, n=50)
2378 Points +6%
Maingear ML-16 MK2
Intel Core Ultra 7 155H
2238 Points
Alienware x16 R2 P120F
Intel Core Ultra 9 185H
2199 Points -2%
CSL GameStar Notebook VenomGamer G16
AMD Ryzen 7 7735HS
2121 Points -5%
Acer Nitro 16 AN16-41-R7YE
AMD Ryzen 5 7535HS
2056 Points -8%
Geekbench 5.5 / Multi-Core
Razer Blade 16 2024, RTX 4090
Intel Core i9-14900HX
19372 Points +58%
HP Victus 16 (2024)
Intel Core i7-14700HX
16732 Points +37%
Asus ROG Zephyrus G16 GA605WV
AMD Ryzen AI 9 HX 370
14774 Points +21%
Dell Inspiron 16 Plus 7630
Intel Core i7-13700H
12805 Points +5%
Alienware x16 R2 P120F
Intel Core Ultra 9 185H
12759 Points +4%
HP Victus 16-r0076TX
Intel Core i5-13500HX
12683 Points +4%
Maingear ML-16 MK2
Intel Core Ultra 7 155H
12228 Points
Asus TUF Gaming A16 FA617XS
AMD Ryzen 9 7940HS
12111 Points -1%
Media Intel Core Ultra 7 155H
  (10017 - 13556, n=50)
12039 Points -2%
Lenovo Legion Slim 7 16APH8
AMD Ryzen 7 7840HS
11872 Points -3%
HP Victus 16-r0077ng
Intel Core i7-13700H
11504 Points -6%
MSI Stealth 16 Mercedes-AMG Motorsport A13VG
Intel Core i9-13900H
10600 Points -13%
CSL GameStar Notebook VenomGamer G16
AMD Ryzen 7 7735HS
10258 Points -16%
HP Omen 16-n0033dx
AMD Ryzen 7 6800H
9385 Points -23%
Acer Nitro 16 AN16-41-R7YE
AMD Ryzen 5 7535HS
7852 Points -36%
Geekbench 5.5 / Single-Core
Razer Blade 16 2024, RTX 4090
Intel Core i9-14900HX
2131 Points +30%
Asus ROG Zephyrus G16 GA605WV
AMD Ryzen AI 9 HX 370
2104 Points +29%
Asus TUF Gaming A16 FA617XS
AMD Ryzen 9 7940HS
2032 Points +24%
MSI Stealth 16 Mercedes-AMG Motorsport A13VG
Intel Core i9-13900H
1986 Points +21%
Lenovo Legion Slim 7 16APH8
AMD Ryzen 7 7840HS
1943 Points +19%
Dell Inspiron 16 Plus 7630
Intel Core i7-13700H
1906 Points +16%
Media Intel Core Ultra 7 155H
  (1462 - 1824, n=50)
1752 Points +7%
HP Victus 16 (2024)
Intel Core i7-14700HX
1700 Points +4%
Alienware x16 R2 P120F
Intel Core Ultra 9 185H
1700 Points +4%
HP Victus 16-r0076TX
Intel Core i5-13500HX
1688 Points +3%
HP Victus 16-r0077ng
Intel Core i7-13700H
1685 Points +3%
Maingear ML-16 MK2
Intel Core Ultra 7 155H
1637 Points
CSL GameStar Notebook VenomGamer G16
AMD Ryzen 7 7735HS
1575 Points -4%
HP Omen 16-n0033dx
AMD Ryzen 7 6800H
1535 Points -6%
Acer Nitro 16 AN16-41-R7YE
AMD Ryzen 5 7535HS
1502 Points -8%
HWBOT x265 Benchmark v2.2 / 4k Preset
Razer Blade 16 2024, RTX 4090
Intel Core i9-14900HX
30.1 fps +68%
Asus ROG Zephyrus G16 GA605WV
AMD Ryzen AI 9 HX 370
26.5 fps +48%
HP Victus 16 (2024)
Intel Core i7-14700HX
22 fps +23%
Asus TUF Gaming A16 FA617XS
AMD Ryzen 9 7940HS
20.8 fps +16%
Alienware x16 R2 P120F
Intel Core Ultra 9 185H
20.7 fps +16%
HP Victus 16-r0076TX
Intel Core i5-13500HX
20.3 fps +13%
Lenovo Legion Slim 7 16APH8
AMD Ryzen 7 7840HS
20.1 fps +12%
CSL GameStar Notebook VenomGamer G16
AMD Ryzen 7 7735HS
17.9 fps 0%
Maingear ML-16 MK2
Intel Core Ultra 7 155H
17.9 fps
HP Victus 16-r0077ng
Intel Core i7-13700H
16.6 fps -7%
Media Intel Core Ultra 7 155H
  (9.93 - 21.2, n=48)
16.5 fps -8%
HP Omen 16-n0033dx
AMD Ryzen 7 6800H
16.4 fps -8%
Dell Inspiron 16 Plus 7630
Intel Core i7-13700H
15.9 fps -11%
MSI Stealth 16 Mercedes-AMG Motorsport A13VG
Intel Core i9-13900H
14.7 fps -18%
Acer Nitro 16 AN16-41-R7YE
AMD Ryzen 5 7535HS
14.2 fps -21%
LibreOffice / 20 Documents To PDF
Lenovo Legion Slim 7 16APH8
AMD Ryzen 7 7840HS
68.3 s * -58%
CSL GameStar Notebook VenomGamer G16
AMD Ryzen 7 7735HS
63.9 s * -48%
HP Victus 16-r0077ng
Intel Core i7-13700H
61.5 s * -43%
HP Omen 16-n0033dx
AMD Ryzen 7 6800H
59.3 s * -38%
MSI Stealth 16 Mercedes-AMG Motorsport A13VG
Intel Core i9-13900H
57.5 s * -33%
HP Victus 16 (2024)
Intel Core i7-14700HX
55.3 s * -28%
Asus ROG Zephyrus G16 GA605WV
AMD Ryzen AI 9 HX 370
53.8 s * -25%
Media Intel Core Ultra 7 155H
  (37.5 - 79.2, n=47)
48.7 s * -13%
Razer Blade 16 2024, RTX 4090
Intel Core i9-14900HX
47.5 s * -10%
Acer Nitro 16 AN16-41-R7YE
AMD Ryzen 5 7535HS
46.2 s * -7%
Alienware x16 R2 P120F
Intel Core Ultra 9 185H
45.9 s * -6%
Dell Inspiron 16 Plus 7630
Intel Core i7-13700H
45.1 s * -5%
Maingear ML-16 MK2
Intel Core Ultra 7 155H
43.1 s *
Asus TUF Gaming A16 FA617XS
AMD Ryzen 9 7940HS
41.7 s * +3%
R Benchmark 2.5 / Overall mean
Maingear ML-16 MK2
Intel Core Ultra 7 155H
0.505 sec *
HP Victus 16-r0077ng
Intel Core i7-13700H
0.504 sec * -0%
Acer Nitro 16 AN16-41-R7YE
AMD Ryzen 5 7535HS
0.503 sec * -0%
Alienware x16 R2 P120F
Intel Core Ultra 9 185H
0.503 sec * -0%
HP Omen 16-n0033dx
AMD Ryzen 7 6800H
0.501 sec * +1%
HP Victus 16 (2024)
Intel Core i7-14700HX
0.4896 sec * +3%
HP Victus 16-r0076TX
Intel Core i5-13500HX
0.4891 sec * +3%
CSL GameStar Notebook VenomGamer G16
AMD Ryzen 7 7735HS
0.4842 sec * +4%
Media Intel Core Ultra 7 155H
  (0.4457 - 0.53, n=47)
0.4814 sec * +5%
Lenovo Legion Slim 7 16APH8
AMD Ryzen 7 7840HS
0.4431 sec * +12%
Dell Inspiron 16 Plus 7630
Intel Core i7-13700H
0.4338 sec * +14%
MSI Stealth 16 Mercedes-AMG Motorsport A13VG
Intel Core i9-13900H
0.4303 sec * +15%
Asus TUF Gaming A16 FA617XS
AMD Ryzen 9 7940HS
0.4253 sec * +16%
Asus ROG Zephyrus G16 GA605WV
AMD Ryzen AI 9 HX 370
0.4111 sec * +19%
Razer Blade 16 2024, RTX 4090
Intel Core i9-14900HX
0.3789 sec * +25%
CPU Performance Rating: Percent
Cinebench R23: Multi Core | Single Core
Cinebench R20: CPU (Multi Core) | CPU (Single Core)
Cinebench R15: CPU Multi 64Bit | CPU Single 64Bit
Blender: v2.79 BMW27 CPU
7-Zip 18.03: 7z b 4 | 7z b 4 -mmt1
Geekbench 6.3: Multi-Core | Single-Core
Geekbench 5.5: Multi-Core | Single-Core
HWBOT x265 Benchmark v2.2: 4k Preset
LibreOffice : 20 Documents To PDF
R Benchmark 2.5: Overall mean

* ... Meglio usare valori piccoli

Cinebench R15 CPU Multi 64Bit
2705 Points
Cinebench R15 OpenGL 64Bit
183.9 fps
Cinebench R15 Ref. Match 64Bit
99.6 %
Cinebench R15 CPU Single 64Bit
242 Points
Cinebench R20 CPU (Multi Core)
6789 Points
Cinebench R20 CPU (Single Core)
634 Points
Cinebench R23 Single Core
1650 Points
Cinebench R23 Multi Core
17231 Points
Cinebench 2024 CPU Single Core
98.4 Points
Cinebench 2024 CPU Multi Core
789 Points
Aiuto
Performance Rating
Asus ROG Zephyrus G16 GA605WV
AMD Ryzen AI 9 HX 370, NVIDIA GeForce RTX 4060 Laptop GPU
88.3 pt
Razer Blade 16 2024, RTX 4090
Intel Core i9-14900HX, NVIDIA GeForce RTX 4090 Laptop GPU
87.7 pt
Lenovo Legion Pro 5 16IRX9
Intel Core i9-14900HX, NVIDIA GeForce RTX 4070 Laptop GPU
87.3 pt
Alienware x16 R2 P120F
Intel Core Ultra 9 185H, NVIDIA GeForce RTX 4080 Laptop GPU
66.4 pt
HP Victus 16 (2024)
Intel Core i7-14700HX, NVIDIA GeForce RTX 4060 Laptop GPU
62.1 pt
Maingear ML-16 MK2
Intel Core Ultra 7 155H, NVIDIA GeForce RTX 4070 Laptop GPU
59.3 pt
Media Intel Core Ultra 7 155H
 
52 pt
AIDA64 / FP32 Ray-Trace
Asus ROG Zephyrus G16 GA605WV
AMD Ryzen AI 9 HX 370, NVIDIA GeForce RTX 4060 Laptop GPU
36304 KRay/s +147%
Razer Blade 16 2024, RTX 4090
Intel Core i9-14900HX, NVIDIA GeForce RTX 4090 Laptop GPU
25682 KRay/s +75%
Lenovo Legion Pro 5 16IRX9
Intel Core i9-14900HX, NVIDIA GeForce RTX 4070 Laptop GPU
25072 KRay/s +71%
Alienware x16 R2 P120F
Intel Core Ultra 9 185H, NVIDIA GeForce RTX 4080 Laptop GPU
18676 KRay/s +27%
HP Victus 16 (2024)
Intel Core i7-14700HX, NVIDIA GeForce RTX 4060 Laptop GPU
16932 KRay/s +15%
Maingear ML-16 MK2
Intel Core Ultra 7 155H, NVIDIA GeForce RTX 4070 Laptop GPU
14694 KRay/s
Media Intel Core Ultra 7 155H
  (6670 - 18470, n=48)
13201 KRay/s -10%
AIDA64 / FPU Julia
Asus ROG Zephyrus G16 GA605WV
AMD Ryzen AI 9 HX 370, NVIDIA GeForce RTX 4060 Laptop GPU
138436 Points +79%
Lenovo Legion Pro 5 16IRX9
Intel Core i9-14900HX, NVIDIA GeForce RTX 4070 Laptop GPU
129169 Points +67%
Razer Blade 16 2024, RTX 4090
Intel Core i9-14900HX, NVIDIA GeForce RTX 4090 Laptop GPU
127908 Points +65%
Alienware x16 R2 P120F
Intel Core Ultra 9 185H, NVIDIA GeForce RTX 4080 Laptop GPU
96463 Points +25%
HP Victus 16 (2024)
Intel Core i7-14700HX, NVIDIA GeForce RTX 4060 Laptop GPU
86338 Points +11%
Maingear ML-16 MK2
Intel Core Ultra 7 155H, NVIDIA GeForce RTX 4070 Laptop GPU
77477 Points
Media Intel Core Ultra 7 155H
  (40905 - 93181, n=48)
70073 Points -10%
AIDA64 / CPU SHA3
Lenovo Legion Pro 5 16IRX9
Intel Core i9-14900HX, NVIDIA GeForce RTX 4070 Laptop GPU
6285 MB/s +64%
Razer Blade 16 2024, RTX 4090
Intel Core i9-14900HX, NVIDIA GeForce RTX 4090 Laptop GPU
6188 MB/s +62%
Asus ROG Zephyrus G16 GA605WV
AMD Ryzen AI 9 HX 370, NVIDIA GeForce RTX 4060 Laptop GPU
5696 MB/s +49%
Alienware x16 R2 P120F
Intel Core Ultra 9 185H, NVIDIA GeForce RTX 4080 Laptop GPU
4534 MB/s +19%
HP Victus 16 (2024)
Intel Core i7-14700HX, NVIDIA GeForce RTX 4060 Laptop GPU
4008 MB/s +5%
Maingear ML-16 MK2
Intel Core Ultra 7 155H, NVIDIA GeForce RTX 4070 Laptop GPU
3822 MB/s
Media Intel Core Ultra 7 155H
  (1940 - 4436, n=48)
3269 MB/s -14%
AIDA64 / CPU Queen
Lenovo Legion Pro 5 16IRX9
Intel Core i9-14900HX, NVIDIA GeForce RTX 4070 Laptop GPU
142503 Points +51%
Razer Blade 16 2024, RTX 4090
Intel Core i9-14900HX, NVIDIA GeForce RTX 4090 Laptop GPU
138473 Points +47%
HP Victus 16 (2024)
Intel Core i7-14700HX, NVIDIA GeForce RTX 4060 Laptop GPU
129836 Points +38%
Alienware x16 R2 P120F
Intel Core Ultra 9 185H, NVIDIA GeForce RTX 4080 Laptop GPU
94794 Points +1%
Asus ROG Zephyrus G16 GA605WV
AMD Ryzen AI 9 HX 370, NVIDIA GeForce RTX 4060 Laptop GPU
94289 Points 0%
Maingear ML-16 MK2
Intel Core Ultra 7 155H, NVIDIA GeForce RTX 4070 Laptop GPU
94181 Points
Media Intel Core Ultra 7 155H
  (64698 - 94181, n=48)
83471 Points -11%
AIDA64 / FPU SinJulia
Asus ROG Zephyrus G16 GA605WV
AMD Ryzen AI 9 HX 370, NVIDIA GeForce RTX 4060 Laptop GPU
18867 Points +79%
Razer Blade 16 2024, RTX 4090
Intel Core i9-14900HX, NVIDIA GeForce RTX 4090 Laptop GPU
15857 Points +50%
Lenovo Legion Pro 5 16IRX9
Intel Core i9-14900HX, NVIDIA GeForce RTX 4070 Laptop GPU
15401 Points +46%
HP Victus 16 (2024)
Intel Core i7-14700HX, NVIDIA GeForce RTX 4060 Laptop GPU
11704 Points +11%
Alienware x16 R2 P120F
Intel Core Ultra 9 185H, NVIDIA GeForce RTX 4080 Laptop GPU
11095 Points +5%
Maingear ML-16 MK2
Intel Core Ultra 7 155H, NVIDIA GeForce RTX 4070 Laptop GPU
10560 Points
Media Intel Core Ultra 7 155H
  (5639 - 10647, n=48)
9159 Points -13%
AIDA64 / FPU Mandel
Asus ROG Zephyrus G16 GA605WV
AMD Ryzen AI 9 HX 370, NVIDIA GeForce RTX 4060 Laptop GPU
74066 Points +104%
Razer Blade 16 2024, RTX 4090
Intel Core i9-14900HX, NVIDIA GeForce RTX 4090 Laptop GPU
64134 Points +77%
Lenovo Legion Pro 5 16IRX9
Intel Core i9-14900HX, NVIDIA GeForce RTX 4070 Laptop GPU
62567 Points +72%
Alienware x16 R2 P120F
Intel Core Ultra 9 185H, NVIDIA GeForce RTX 4080 Laptop GPU
48020 Points +32%
HP Victus 16 (2024)
Intel Core i7-14700HX, NVIDIA GeForce RTX 4060 Laptop GPU
42125 Points +16%
Maingear ML-16 MK2
Intel Core Ultra 7 155H, NVIDIA GeForce RTX 4070 Laptop GPU
36322 Points
Media Intel Core Ultra 7 155H
  (18236 - 47685, n=48)
34082 Points -6%
AIDA64 / CPU AES
Maingear ML-16 MK2
Intel Core Ultra 7 155H, NVIDIA GeForce RTX 4070 Laptop GPU
148318 MB/s
Razer Blade 16 2024, RTX 4090
Intel Core i9-14900HX, NVIDIA GeForce RTX 4090 Laptop GPU
122937 MB/s -17%
Lenovo Legion Pro 5 16IRX9
Intel Core i9-14900HX, NVIDIA GeForce RTX 4070 Laptop GPU
120213 MB/s -19%
Alienware x16 R2 P120F
Intel Core Ultra 9 185H, NVIDIA GeForce RTX 4080 Laptop GPU
88763 MB/s -40%
HP Victus 16 (2024)
Intel Core i7-14700HX, NVIDIA GeForce RTX 4060 Laptop GPU
82161 MB/s -45%
Asus ROG Zephyrus G16 GA605WV
AMD Ryzen AI 9 HX 370, NVIDIA GeForce RTX 4060 Laptop GPU
80186 MB/s -46%
Media Intel Core Ultra 7 155H
  (45713 - 152179, n=48)
78005 MB/s -47%
AIDA64 / CPU ZLib
Lenovo Legion Pro 5 16IRX9
Intel Core i9-14900HX, NVIDIA GeForce RTX 4070 Laptop GPU
1866 MB/s +57%
Razer Blade 16 2024, RTX 4090
Intel Core i9-14900HX, NVIDIA GeForce RTX 4090 Laptop GPU
1863 MB/s +57%
Asus ROG Zephyrus G16 GA605WV
AMD Ryzen AI 9 HX 370, NVIDIA GeForce RTX 4060 Laptop GPU
1489 MB/s +26%
Alienware x16 R2 P120F
Intel Core Ultra 9 185H, NVIDIA GeForce RTX 4080 Laptop GPU
1298 MB/s +9%
Maingear ML-16 MK2
Intel Core Ultra 7 155H, NVIDIA GeForce RTX 4070 Laptop GPU
1186 MB/s
HP Victus 16 (2024)
Intel Core i7-14700HX, NVIDIA GeForce RTX 4060 Laptop GPU
1177 MB/s -1%
Media Intel Core Ultra 7 155H
  (557 - 1250, n=48)
967 MB/s -18%
AIDA64 / FP64 Ray-Trace
Asus ROG Zephyrus G16 GA605WV
AMD Ryzen AI 9 HX 370, NVIDIA GeForce RTX 4060 Laptop GPU
19629 KRay/s +169%
Razer Blade 16 2024, RTX 4090
Intel Core i9-14900HX, NVIDIA GeForce RTX 4090 Laptop GPU
13993 KRay/s +92%
Lenovo Legion Pro 5 16IRX9
Intel Core i9-14900HX, NVIDIA GeForce RTX 4070 Laptop GPU
13776 KRay/s +89%
Alienware x16 R2 P120F
Intel Core Ultra 9 185H, NVIDIA GeForce RTX 4080 Laptop GPU
10078 KRay/s +38%
HP Victus 16 (2024)
Intel Core i7-14700HX, NVIDIA GeForce RTX 4060 Laptop GPU
9029 KRay/s +24%
Maingear ML-16 MK2
Intel Core Ultra 7 155H, NVIDIA GeForce RTX 4070 Laptop GPU
7295 KRay/s
Media Intel Core Ultra 7 155H
  (3569 - 9802, n=48)
6914 KRay/s -5%
AIDA64 / CPU PhotoWorxx
Alienware x16 R2 P120F
Intel Core Ultra 9 185H, NVIDIA GeForce RTX 4080 Laptop GPU
53242 MPixel/s +57%
Lenovo Legion Pro 5 16IRX9
Intel Core i9-14900HX, NVIDIA GeForce RTX 4070 Laptop GPU
49676 MPixel/s +46%
Razer Blade 16 2024, RTX 4090
Intel Core i9-14900HX, NVIDIA GeForce RTX 4090 Laptop GPU
49616 MPixel/s +46%
Asus ROG Zephyrus G16 GA605WV
AMD Ryzen AI 9 HX 370, NVIDIA GeForce RTX 4060 Laptop GPU
49354 MPixel/s +45%
Media Intel Core Ultra 7 155H
  (32719 - 54223, n=48)
46830 MPixel/s +38%
HP Victus 16 (2024)
Intel Core i7-14700HX, NVIDIA GeForce RTX 4060 Laptop GPU
39448 MPixel/s +16%
Maingear ML-16 MK2
Intel Core Ultra 7 155H, NVIDIA GeForce RTX 4070 Laptop GPU
33939 MPixel/s

Test da sforzo

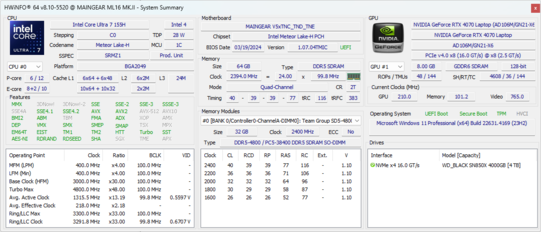
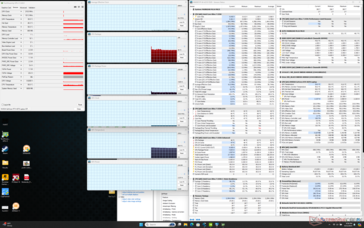
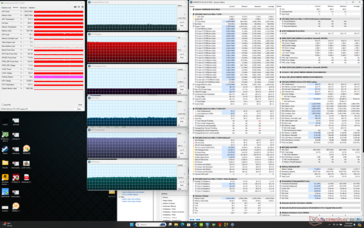
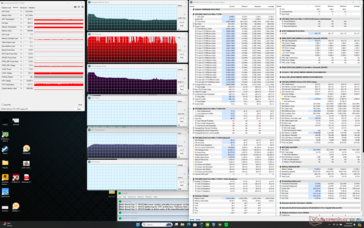
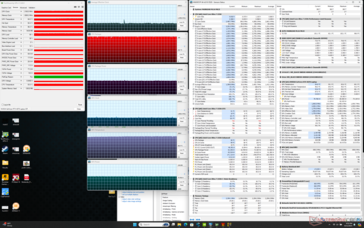
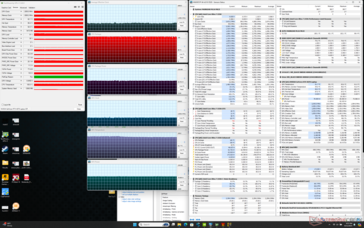
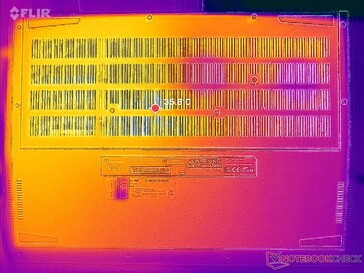
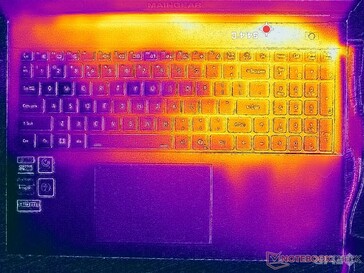
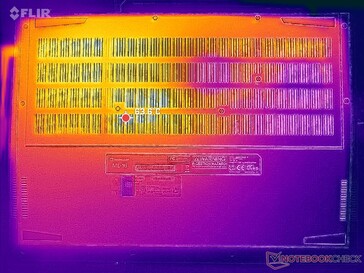
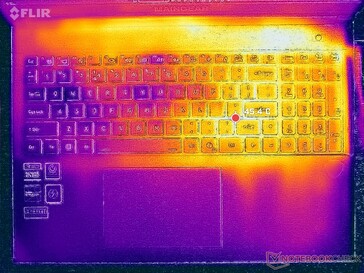
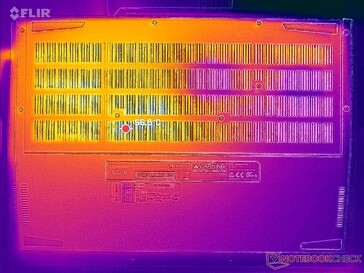
La CPU saliva a 3,2 GHz, 100 C e 85 W quando si avviava lo stress Prime95. Dopo alcuni secondi, tuttavia, la CPU scendeva a 2,6 GHz e 69 W, per poi stabilizzarsi a 2,1 GHz e 57 W. La temperatura del core oscillava tra 73 C e 100 C, con il throttling termico rilevato secondo HWiNFO. Queste temperature elevate del core sono più calde che sul Razer Blade 16 in condizioni simili e sono responsabili anche delle temperature superficiali molto calde.

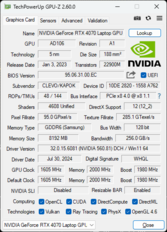
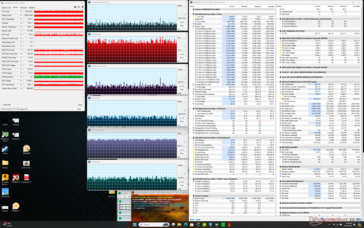
Quando si esegue Cyberpunk 2077 in modalità Performance, la GPU si stabilizza a 2160 MHz, 85 C e 80 W, rispetto ai 2010 MHz, 80 C e 74 W della più tranquilla modalità Balanced. Se il suo gioco non è pesante per la CPU, l'esecuzione in modalità Bilanciata potrebbe essere preferibile, in quanto la GPU non subisce un forte impatto. Si noti che il Pannello di controllo Nvidia indica un TGP di 105 W, ma secondo GPU-Z siamo in grado di raggiungere solo un massimo di 80 W durante il gioco.

Le temperature complessive del core durante il gioco sono molto più calde rispetto a quelle di alternative come il Blade 16. La nostra CPU e GPU si stabilizzerebbero rispettivamente a 101 C e 85 C, rispetto ai 78 C e 75 C del Razer. L'attivazione della modalità ventola massima ridurrebbe le temperature del core solo di pochi gradi C, senza migliorare le prestazioni.

Sistema inattivo
Sistema inattivo
Cyberpunk 2077 (modalità Bilanciata/Intrattenimento)
Stress Prime95
Stress Prime95
Cyberpunk 2077 (modalità Performance con ventola Max disattivata)
Stress di Prime95+FurMark
Cyberpunk 2077 (modalità Performance con ventola Max attivata)
Clock medio della CPU (GHz) Clock della GPU (MHz) Temperatura media della CPU (°C) Temperatura media della GPU (°C)
Sistema inattivo -- -- 48 40
Stress Prime95 2.1 -- 73 - 101 53
Prime95 + FurMark Stress 1.1 - 1.4 ~1785 75 - 95 ~70
Cyberpunk 2077 Stress (modalità bilanciata) 1.2 2010 79 80
Cyberpunk 2077 Stress (modalità Performance con ventola massima disattivata) 1.4 2160 101 85
Cyberpunk 2077 Stress (modalità Performance con ventola massima attivata) 1.5 2055 98 82

Prestazioni del sistema

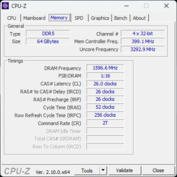
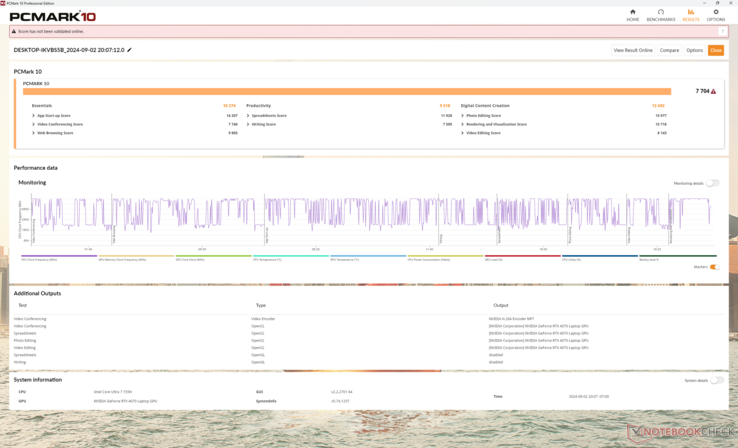
I punteggi di PCMark sono paragonabili a quelli di macchine concorrenti come HP Victus 16 o Asus ROG Zephyrus G16 per dimostrare che la maggior parte delle attività quotidiane non vengono eseguite in modo significativamente più veloce o più lento su Maingear, nonostante le differenze di specifiche. Tuttavia, i risultati di CrossMark e della memoria AIDA64 sono entrambi più bassi del previsto, a causa delle nostre prestazioni CPU grezze relativamente più lente e della RAM DDR5-4800. Concorrenti come il Blade 16 o l'Alienware m16 R2 sono dotati di DDR5-5600 o LPDDR5-7467 più veloci, rispettivamente.

PCMark 10 Standard
PCMark 10 Standard
PCMark 10 / Score
Lenovo Legion Pro 5 16IRX9
NVIDIA GeForce RTX 4070 Laptop GPU, i9-14900HX, Samsung PM9A1 MZVL21T0HCLR
8550 Points +11%
Razer Blade 16 2024, RTX 4090
NVIDIA GeForce RTX 4090 Laptop GPU, i9-14900HX, Samsung PM9A1 MZVL22T0HBLB
8401 Points +9%
Asus ROG Zephyrus G16 GA605WV
NVIDIA GeForce RTX 4060 Laptop GPU, Ryzen AI 9 HX 370, Micron 2400 MTFDKBA1T0QFM
7915 Points +3%
Maingear ML-16 MK2
NVIDIA GeForce RTX 4070 Laptop GPU, Ultra 7 155H
7704 Points
HP Victus 16 (2024)
NVIDIA GeForce RTX 4060 Laptop GPU, i7-14700HX, Kioxia XG8 KXG80ZNV512G
7528 Points -2%
Media Intel Core Ultra 7 155H, NVIDIA GeForce RTX 4070 Laptop GPU
  (7084 - 7761, n=4)
7418 Points -4%
Alienware x16 R2 P120F
NVIDIA GeForce RTX 4080 Laptop GPU, Ultra 9 185H, WDC PC SN810 1TB
7251 Points -6%
PCMark 10 / Essentials
Lenovo Legion Pro 5 16IRX9
NVIDIA GeForce RTX 4070 Laptop GPU, i9-14900HX, Samsung PM9A1 MZVL21T0HCLR
11286 Points +10%
Razer Blade 16 2024, RTX 4090
NVIDIA GeForce RTX 4090 Laptop GPU, i9-14900HX, Samsung PM9A1 MZVL22T0HBLB
10915 Points +6%
HP Victus 16 (2024)
NVIDIA GeForce RTX 4060 Laptop GPU, i7-14700HX, Kioxia XG8 KXG80ZNV512G
10778 Points +5%
Maingear ML-16 MK2
NVIDIA GeForce RTX 4070 Laptop GPU, Ultra 7 155H
10274 Points
Media Intel Core Ultra 7 155H, NVIDIA GeForce RTX 4070 Laptop GPU
  (10038 - 10393, n=4)
10259 Points 0%
Asus ROG Zephyrus G16 GA605WV
NVIDIA GeForce RTX 4060 Laptop GPU, Ryzen AI 9 HX 370, Micron 2400 MTFDKBA1T0QFM
10140 Points -1%
Alienware x16 R2 P120F
NVIDIA GeForce RTX 4080 Laptop GPU, Ultra 9 185H, WDC PC SN810 1TB
10036 Points -2%
PCMark 10 / Productivity
Razer Blade 16 2024, RTX 4090
NVIDIA GeForce RTX 4090 Laptop GPU, i9-14900HX, Samsung PM9A1 MZVL22T0HBLB
11150 Points +17%
Lenovo Legion Pro 5 16IRX9
NVIDIA GeForce RTX 4070 Laptop GPU, i9-14900HX, Samsung PM9A1 MZVL21T0HCLR
10139 Points +7%
Asus ROG Zephyrus G16 GA605WV
NVIDIA GeForce RTX 4060 Laptop GPU, Ryzen AI 9 HX 370, Micron 2400 MTFDKBA1T0QFM
9971 Points +5%
HP Victus 16 (2024)
NVIDIA GeForce RTX 4060 Laptop GPU, i7-14700HX, Kioxia XG8 KXG80ZNV512G
9910 Points +4%
Maingear ML-16 MK2
NVIDIA GeForce RTX 4070 Laptop GPU, Ultra 7 155H
9518 Points
Media Intel Core Ultra 7 155H, NVIDIA GeForce RTX 4070 Laptop GPU
  (9192 - 9518, n=4)
9335 Points -2%
Alienware x16 R2 P120F
NVIDIA GeForce RTX 4080 Laptop GPU, Ultra 9 185H, WDC PC SN810 1TB
7934 Points -17%
PCMark 10 / Digital Content Creation
Lenovo Legion Pro 5 16IRX9
NVIDIA GeForce RTX 4070 Laptop GPU, i9-14900HX, Samsung PM9A1 MZVL21T0HCLR
14827 Points +17%
Asus ROG Zephyrus G16 GA605WV
NVIDIA GeForce RTX 4060 Laptop GPU, Ryzen AI 9 HX 370, Micron 2400 MTFDKBA1T0QFM
13309 Points +5%
Razer Blade 16 2024, RTX 4090
NVIDIA GeForce RTX 4090 Laptop GPU, i9-14900HX, Samsung PM9A1 MZVL22T0HBLB
13219 Points +4%
Alienware x16 R2 P120F
NVIDIA GeForce RTX 4080 Laptop GPU, Ultra 9 185H, WDC PC SN810 1TB
12994 Points +2%
Maingear ML-16 MK2
NVIDIA GeForce RTX 4070 Laptop GPU, Ultra 7 155H
12692 Points
Media Intel Core Ultra 7 155H, NVIDIA GeForce RTX 4070 Laptop GPU
  (10100 - 13035, n=4)
11610 Points -9%
HP Victus 16 (2024)
NVIDIA GeForce RTX 4060 Laptop GPU, i7-14700HX, Kioxia XG8 KXG80ZNV512G
10841 Points -15%
CrossMark / Overall
Razer Blade 16 2024, RTX 4090
NVIDIA GeForce RTX 4090 Laptop GPU, i9-14900HX, Samsung PM9A1 MZVL22T0HBLB
2149 Points +27%
Lenovo Legion Pro 5 16IRX9
NVIDIA GeForce RTX 4070 Laptop GPU, i9-14900HX, Samsung PM9A1 MZVL21T0HCLR
2002 Points +19%
HP Victus 16 (2024)
NVIDIA GeForce RTX 4060 Laptop GPU, i7-14700HX, Kioxia XG8 KXG80ZNV512G
1923 Points +14%
Asus ROG Zephyrus G16 GA605WV
NVIDIA GeForce RTX 4060 Laptop GPU, Ryzen AI 9 HX 370, Micron 2400 MTFDKBA1T0QFM
1819 Points +8%
Media Intel Core Ultra 7 155H, NVIDIA GeForce RTX 4070 Laptop GPU
  (1687 - 1848, n=4)
1755 Points +4%
Maingear ML-16 MK2
NVIDIA GeForce RTX 4070 Laptop GPU, Ultra 7 155H
1687 Points
Alienware x16 R2 P120F
NVIDIA GeForce RTX 4080 Laptop GPU, Ultra 9 185H, WDC PC SN810 1TB
1589 Points -6%
CrossMark / Productivity
Razer Blade 16 2024, RTX 4090
NVIDIA GeForce RTX 4090 Laptop GPU, i9-14900HX, Samsung PM9A1 MZVL22T0HBLB
2007 Points +26%
Lenovo Legion Pro 5 16IRX9
NVIDIA GeForce RTX 4070 Laptop GPU, i9-14900HX, Samsung PM9A1 MZVL21T0HCLR
1827 Points +15%
HP Victus 16 (2024)
NVIDIA GeForce RTX 4060 Laptop GPU, i7-14700HX, Kioxia XG8 KXG80ZNV512G
1782 Points +12%
Media Intel Core Ultra 7 155H, NVIDIA GeForce RTX 4070 Laptop GPU
  (1589 - 1750, n=4)
1662 Points +5%
Asus ROG Zephyrus G16 GA605WV
NVIDIA GeForce RTX 4060 Laptop GPU, Ryzen AI 9 HX 370, Micron 2400 MTFDKBA1T0QFM
1637 Points +3%
Maingear ML-16 MK2
NVIDIA GeForce RTX 4070 Laptop GPU, Ultra 7 155H
1589 Points
Alienware x16 R2 P120F
NVIDIA GeForce RTX 4080 Laptop GPU, Ultra 9 185H, WDC PC SN810 1TB
1584 Points 0%
CrossMark / Creativity
Razer Blade 16 2024, RTX 4090
NVIDIA GeForce RTX 4090 Laptop GPU, i9-14900HX, Samsung PM9A1 MZVL22T0HBLB
2418 Points +30%
Lenovo Legion Pro 5 16IRX9
NVIDIA GeForce RTX 4070 Laptop GPU, i9-14900HX, Samsung PM9A1 MZVL21T0HCLR
2287 Points +23%
Asus ROG Zephyrus G16 GA605WV
NVIDIA GeForce RTX 4060 Laptop GPU, Ryzen AI 9 HX 370, Micron 2400 MTFDKBA1T0QFM
2264 Points +22%
HP Victus 16 (2024)
NVIDIA GeForce RTX 4060 Laptop GPU, i7-14700HX, Kioxia XG8 KXG80ZNV512G
2107 Points +13%
Media Intel Core Ultra 7 155H, NVIDIA GeForce RTX 4070 Laptop GPU
  (1860 - 2014, n=4)
1932 Points +4%
Maingear ML-16 MK2
NVIDIA GeForce RTX 4070 Laptop GPU, Ultra 7 155H
1860 Points
Alienware x16 R2 P120F
NVIDIA GeForce RTX 4080 Laptop GPU, Ultra 9 185H, WDC PC SN810 1TB
1583 Points -15%
CrossMark / Responsiveness
Razer Blade 16 2024, RTX 4090
NVIDIA GeForce RTX 4090 Laptop GPU, i9-14900HX, Samsung PM9A1 MZVL22T0HBLB
1851 Points +23%
HP Victus 16 (2024)
NVIDIA GeForce RTX 4060 Laptop GPU, i7-14700HX, Kioxia XG8 KXG80ZNV512G
1835 Points +22%
Lenovo Legion Pro 5 16IRX9
NVIDIA GeForce RTX 4070 Laptop GPU, i9-14900HX, Samsung PM9A1 MZVL21T0HCLR
1769 Points +17%
Alienware x16 R2 P120F
NVIDIA GeForce RTX 4080 Laptop GPU, Ultra 9 185H, WDC PC SN810 1TB
1621 Points +8%
Media Intel Core Ultra 7 155H, NVIDIA GeForce RTX 4070 Laptop GPU
  (1424 - 1683, n=4)
1548 Points +3%
Maingear ML-16 MK2
NVIDIA GeForce RTX 4070 Laptop GPU, Ultra 7 155H
1507 Points
Asus ROG Zephyrus G16 GA605WV
NVIDIA GeForce RTX 4060 Laptop GPU, Ryzen AI 9 HX 370, Micron 2400 MTFDKBA1T0QFM
1293 Points -14%
WebXPRT 3 / Overall
Razer Blade 16 2024, RTX 4090
NVIDIA GeForce RTX 4090 Laptop GPU, i9-14900HX, Samsung PM9A1 MZVL22T0HBLB
330 Points +25%
Lenovo Legion Pro 5 16IRX9
NVIDIA GeForce RTX 4070 Laptop GPU, i9-14900HX, Samsung PM9A1 MZVL21T0HCLR
322 Points +22%
Media Intel Core Ultra 7 155H, NVIDIA GeForce RTX 4070 Laptop GPU
  (264 - 294, n=4)
281 Points +6%
HP Victus 16 (2024)
NVIDIA GeForce RTX 4060 Laptop GPU, i7-14700HX, Kioxia XG8 KXG80ZNV512G
276 Points +5%
Maingear ML-16 MK2
NVIDIA GeForce RTX 4070 Laptop GPU, Ultra 7 155H
264 Points
Alienware x16 R2 P120F
NVIDIA GeForce RTX 4080 Laptop GPU, Ultra 9 185H, WDC PC SN810 1TB
237 Points -10%
WebXPRT 4 / Overall
Lenovo Legion Pro 5 16IRX9
NVIDIA GeForce RTX 4070 Laptop GPU, i9-14900HX, Samsung PM9A1 MZVL21T0HCLR
291 Points +18%
Asus ROG Zephyrus G16 GA605WV
NVIDIA GeForce RTX 4060 Laptop GPU, Ryzen AI 9 HX 370, Micron 2400 MTFDKBA1T0QFM
259 Points +5%
Media Intel Core Ultra 7 155H, NVIDIA GeForce RTX 4070 Laptop GPU
  (247 - 257, n=4)
254 Points +3%
HP Victus 16 (2024)
NVIDIA GeForce RTX 4060 Laptop GPU, i7-14700HX, Kioxia XG8 KXG80ZNV512G
251 Points +2%
Maingear ML-16 MK2
NVIDIA GeForce RTX 4070 Laptop GPU, Ultra 7 155H
247 Points
Alienware x16 R2 P120F
NVIDIA GeForce RTX 4080 Laptop GPU, Ultra 9 185H, WDC PC SN810 1TB
237 Points -4%
Mozilla Kraken 1.1 / Total
Alienware x16 R2 P120F
NVIDIA GeForce RTX 4080 Laptop GPU, Ultra 9 185H, WDC PC SN810 1TB
594 ms * -5%
Maingear ML-16 MK2
NVIDIA GeForce RTX 4070 Laptop GPU, Ultra 7 155H
568 ms *
Media Intel Core Ultra 7 155H, NVIDIA GeForce RTX 4070 Laptop GPU
  (546 - 568, n=3)
554 ms * +2%
HP Victus 16 (2024)
NVIDIA GeForce RTX 4060 Laptop GPU, i7-14700HX, Kioxia XG8 KXG80ZNV512G
542 ms * +5%
Razer Blade 16 2024, RTX 4090
NVIDIA GeForce RTX 4090 Laptop GPU, i9-14900HX, Samsung PM9A1 MZVL22T0HBLB
450 ms * +21%
Lenovo Legion Pro 5 16IRX9
NVIDIA GeForce RTX 4070 Laptop GPU, i9-14900HX, Samsung PM9A1 MZVL21T0HCLR
449 ms * +21%
Asus ROG Zephyrus G16 GA605WV
NVIDIA GeForce RTX 4060 Laptop GPU, Ryzen AI 9 HX 370, Micron 2400 MTFDKBA1T0QFM
434 ms * +24%

* ... Meglio usare valori piccoli

PCMark 10 Score
7704 punti
Aiuto
AIDA64 / Memory Copy
Alienware x16 R2 P120F
Intel Core Ultra 9 185H, NVIDIA GeForce RTX 4080 Laptop GPU
89701 MB/s +35%
Asus ROG Zephyrus G16 GA605WV
AMD Ryzen AI 9 HX 370, NVIDIA GeForce RTX 4060 Laptop GPU
89564 MB/s +35%
Media Intel Core Ultra 7 155H
  (62397 - 96791, n=48)
83297 MB/s +25%
Lenovo Legion Pro 5 16IRX9
Intel Core i9-14900HX, NVIDIA GeForce RTX 4070 Laptop GPU
78979 MB/s +19%
Razer Blade 16 2024, RTX 4090
Intel Core i9-14900HX, NVIDIA GeForce RTX 4090 Laptop GPU
78799 MB/s +18%
HP Victus 16 (2024)
Intel Core i7-14700HX, NVIDIA GeForce RTX 4060 Laptop GPU
66599 MB/s 0%
Maingear ML-16 MK2
Intel Core Ultra 7 155H, NVIDIA GeForce RTX 4070 Laptop GPU
66526 MB/s
AIDA64 / Memory Read
Asus ROG Zephyrus G16 GA605WV
AMD Ryzen AI 9 HX 370, NVIDIA GeForce RTX 4060 Laptop GPU
99713 MB/s +59%
Razer Blade 16 2024, RTX 4090
Intel Core i9-14900HX, NVIDIA GeForce RTX 4090 Laptop GPU
86387 MB/s +38%
Lenovo Legion Pro 5 16IRX9
Intel Core i9-14900HX, NVIDIA GeForce RTX 4070 Laptop GPU
86376 MB/s +38%
Alienware x16 R2 P120F
Intel Core Ultra 9 185H, NVIDIA GeForce RTX 4080 Laptop GPU
85092 MB/s +36%
HP Victus 16 (2024)
Intel Core i7-14700HX, NVIDIA GeForce RTX 4060 Laptop GPU
81049 MB/s +29%
Media Intel Core Ultra 7 155H
  (60544 - 90647, n=48)
80179 MB/s +28%
Maingear ML-16 MK2
Intel Core Ultra 7 155H, NVIDIA GeForce RTX 4070 Laptop GPU
62637 MB/s
AIDA64 / Memory Write
Asus ROG Zephyrus G16 GA605WV
AMD Ryzen AI 9 HX 370, NVIDIA GeForce RTX 4060 Laptop GPU
98802 MB/s +53%
Lenovo Legion Pro 5 16IRX9
Intel Core i9-14900HX, NVIDIA GeForce RTX 4070 Laptop GPU
77346 MB/s +20%
Razer Blade 16 2024, RTX 4090
Intel Core i9-14900HX, NVIDIA GeForce RTX 4090 Laptop GPU
75421 MB/s +17%
Alienware x16 R2 P120F
Intel Core Ultra 9 185H, NVIDIA GeForce RTX 4080 Laptop GPU
73199 MB/s +14%
Media Intel Core Ultra 7 155H
  (58692 - 93451, n=48)
72637 MB/s +13%
HP Victus 16 (2024)
Intel Core i7-14700HX, NVIDIA GeForce RTX 4060 Laptop GPU
65204 MB/s +1%
Maingear ML-16 MK2
Intel Core Ultra 7 155H, NVIDIA GeForce RTX 4070 Laptop GPU
64451 MB/s
AIDA64 / Memory Latency
Maingear ML-16 MK2
Intel Core Ultra 7 155H, NVIDIA GeForce RTX 4070 Laptop GPU
165.4 ns *
Media Intel Core Ultra 7 155H
  (116.2 - 233, n=48)
142.9 ns * +14%
Alienware x16 R2 P120F
Intel Core Ultra 9 185H, NVIDIA GeForce RTX 4080 Laptop GPU
142.3 ns * +14%
Asus ROG Zephyrus G16 GA605WV
AMD Ryzen AI 9 HX 370, NVIDIA GeForce RTX 4060 Laptop GPU
114.2 ns * +31%
HP Victus 16 (2024)
Intel Core i7-14700HX, NVIDIA GeForce RTX 4060 Laptop GPU
96.4 ns * +42%
Razer Blade 16 2024, RTX 4090
Intel Core i9-14900HX, NVIDIA GeForce RTX 4090 Laptop GPU
83.4 ns * +50%
Lenovo Legion Pro 5 16IRX9
Intel Core i9-14900HX, NVIDIA GeForce RTX 4070 Laptop GPU
83.4 ns * +50%

* ... Meglio usare valori piccoli

Latenza DPC

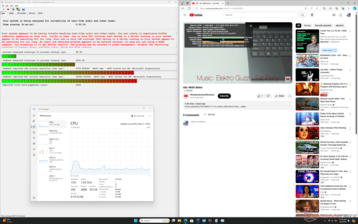
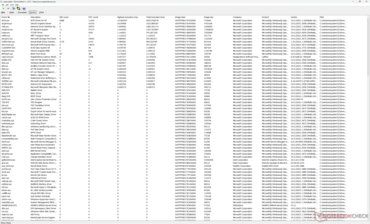
LatencyMon rivela problemi di DPC più grandi del previsto, legati ai driver ACPI, anche quando è in modalità MSHybrid. Inoltre, siamo riusciti a registrare 33 fotogrammi caduti durante un video di test 4K60 di 60 secondi, quando dovrebbero essere zero, soprattutto considerando la CPU Meteor Lake-H all'interno. Queste cadute di fotogrammi si manifestano come balbuzie durante lo streaming di video 4K e suggeriscono un problema di driver sottostante o una cattiva gestione delle attività in background che possono interrompere la finestra principale.

LatenzaMon
LatenzaMon
Elenco dei conducenti
DPC Latencies / LatencyMon - interrupt to process latency (max), Web, Youtube, Prime95
Alienware x16 R2 P120F
NVIDIA GeForce RTX 4080 Laptop GPU, Ultra 9 185H, WDC PC SN810 1TB
16146 μs * -791%
Maingear ML-16 MK2
NVIDIA GeForce RTX 4070 Laptop GPU, Ultra 7 155H
1811.6 μs *
Razer Blade 16 2024, RTX 4090
NVIDIA GeForce RTX 4090 Laptop GPU, i9-14900HX, Samsung PM9A1 MZVL22T0HBLB
1389.7 μs * +23%
Lenovo Legion Pro 5 16IRX9
NVIDIA GeForce RTX 4070 Laptop GPU, i9-14900HX, Samsung PM9A1 MZVL21T0HCLR
989.1 μs * +45%
HP Victus 16 (2024)
NVIDIA GeForce RTX 4060 Laptop GPU, i7-14700HX, Kioxia XG8 KXG80ZNV512G
853.9 μs * +53%
Asus ROG Zephyrus G16 GA605WV
NVIDIA GeForce RTX 4060 Laptop GPU, Ryzen AI 9 HX 370, Micron 2400 MTFDKBA1T0QFM
566.1 μs * +69%

* ... Meglio usare valori piccoli

Dispositivi di archiviazione

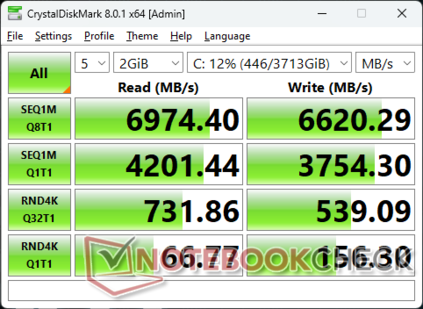
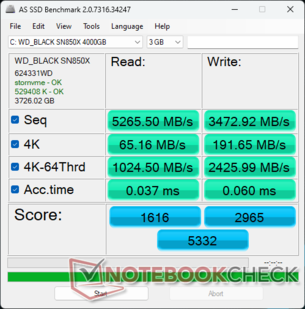
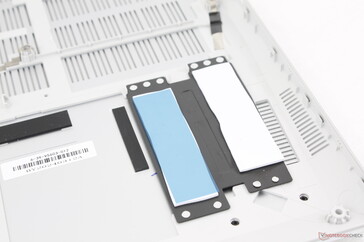
Il Maingear è uno dei pochi sistemi che vengono forniti con 4 TB WD Black SN850X PCIe4 x4 NVMe. Le velocità di trasferimento sono eccellenti, con quasi 7000 MB/s e nessun throttling rilevato quando viene sollecitato. Apprezziamo il fatto che il dissipatore di calore e i pad termici siano forniti di serie per aiutare a dissipare il calore.

CDM 8
CDM 8
AS SSD
AS SSD
Pad termici e dissipatore di calore per i due slot SSD
Gli utenti possono installare fino a due unità SSD M.2 2280
CDM 5/6 Read Seq Q32T1: 6971 MB/s
CDM 5/6 Write Seq Q32T1: 6353 MB/s
CDM 5/6 Read 4K Q32T1: 728.3 MB/s
CDM 5/6 Write 4K Q32T1: 550.3 MB/s
CDM 5 Read Seq: 4232 MB/s
CDM 5 Write Seq: 3877 MB/s
CDM 5/6 Read 4K: 67.61 MB/s
CDM 5/6 Write 4K: 156.6 MB/s
Drive Performance Rating - Percent
Lenovo Legion Pro 5 16IRX9
Samsung PM9A1 MZVL21T0HCLR
92 pt
Alienware x16 R2 P120F
WDC PC SN810 1TB
89.4 pt
Razer Blade 16 2024, RTX 4090
Samsung PM9A1 MZVL22T0HBLB
82.3 pt
HP Victus 16 (2024)
Kioxia XG8 KXG80ZNV512G
78.7 pt
Maingear ML-16 MK2
 
70.2 pt
Asus ROG Zephyrus G16 GA605WV
Micron 2400 MTFDKBA1T0QFM
45.5 pt
DiskSpd
seq read
Alienware x16 R2 P120F
WDC PC SN810 1TB
4224 (3741.6min - 4224.02max) MB/s +4%
Maingear ML-16 MK2
 
4072 (3998.88min - 4072.22max) MB/s
Lenovo Legion Pro 5 16IRX9
Samsung PM9A1 MZVL21T0HCLR
4037 (3964.04min - 4036.7max) MB/s -1%
Razer Blade 16 2024, RTX 4090
Samsung PM9A1 MZVL22T0HBLB
3795 (3693.04min - 3794.8max) MB/s -7%
HP Victus 16 (2024)
Kioxia XG8 KXG80ZNV512G
3469 (3344.35min - 3469.11max) MB/s -15%
Asus ROG Zephyrus G16 GA605WV
Micron 2400 MTFDKBA1T0QFM
2267 (2202.85min - 2267.15max) MB/s -44%
seq write
Alienware x16 R2 P120F
WDC PC SN810 1TB
4899 (4625.25min - 4898.53max) MB/s +29%
Lenovo Legion Pro 5 16IRX9
Samsung PM9A1 MZVL21T0HCLR
4093 (4016.82min - 4092.8max) MB/s +8%
HP Victus 16 (2024)
Kioxia XG8 KXG80ZNV512G
3895 (3747.67min - 3894.8max) MB/s +3%
Maingear ML-16 MK2
 
3800 (3465.53min - 3800.25max) MB/s
Razer Blade 16 2024, RTX 4090
Samsung PM9A1 MZVL22T0HBLB
3794 (3745.51min - 3793.5max) MB/s 0%
Asus ROG Zephyrus G16 GA605WV
Micron 2400 MTFDKBA1T0QFM
2542 (2385.77min - 2541.75max) MB/s -33%
seq q8 t1 read
Maingear ML-16 MK2
 
6972 (6330.54min - 6971.87max) MB/s
HP Victus 16 (2024)
Kioxia XG8 KXG80ZNV512G
6933 (6552.34min - 6933.16max) MB/s -1%
Alienware x16 R2 P120F
WDC PC SN810 1TB
6823 (5715.47min - 6822.87max) MB/s -2%
Razer Blade 16 2024, RTX 4090
Samsung PM9A1 MZVL22T0HBLB
6673 (5801.28min - 6672.72max) MB/s -4%
Lenovo Legion Pro 5 16IRX9
Samsung PM9A1 MZVL21T0HCLR
6636 (6205.02min - 6635.75max) MB/s -5%
Asus ROG Zephyrus G16 GA605WV
Micron 2400 MTFDKBA1T0QFM
4946 (3626.31min - 4945.75max) MB/s -29%
seq q8 t1 write
Maingear ML-16 MK2
 
6566 (6531.01min - 6566.18max) MB/s
Alienware x16 R2 P120F
WDC PC SN810 1TB
5208 (5161.3min - 5208.07max) MB/s -21%
Lenovo Legion Pro 5 16IRX9
Samsung PM9A1 MZVL21T0HCLR
4949 (4932.28min - 4948.61max) MB/s -25%
Razer Blade 16 2024, RTX 4090
Samsung PM9A1 MZVL22T0HBLB
4936 (4909.47min - 4936.28max) MB/s -25%
HP Victus 16 (2024)
Kioxia XG8 KXG80ZNV512G
4392 (3922.93min - 4391.65max) MB/s -33%
Asus ROG Zephyrus G16 GA605WV
Micron 2400 MTFDKBA1T0QFM
3387 (3154.75min - 3386.9max) MB/s -48%
4k q1 t1 read
Lenovo Legion Pro 5 16IRX9
Samsung PM9A1 MZVL21T0HCLR
92.7 (91.49min - 92.68max) MB/s +40%
Alienware x16 R2 P120F
WDC PC SN810 1TB
79.3 (64.25min - 79.25max) MB/s +20%
Razer Blade 16 2024, RTX 4090
Samsung PM9A1 MZVL22T0HBLB
71.4 (66.19min - 71.35max) MB/s +8%
Maingear ML-16 MK2
 
66 (65.15min - 66.01max) MB/s
HP Victus 16 (2024)
Kioxia XG8 KXG80ZNV512G
46.2 (45.32min - 46.24max) MB/s -30%
Asus ROG Zephyrus G16 GA605WV
Micron 2400 MTFDKBA1T0QFM
40.3 (40.03min - 40.33max) MB/s -39%
4k q1 t1 write
Lenovo Legion Pro 5 16IRX9
Samsung PM9A1 MZVL21T0HCLR
251 (249.74min - 251.16max) MB/s +57%
HP Victus 16 (2024)
Kioxia XG8 KXG80ZNV512G
251 (249.24min - 250.87max) MB/s +57%
Alienware x16 R2 P120F
WDC PC SN810 1TB
244 (238.59min - 244.13max) MB/s +52%
Razer Blade 16 2024, RTX 4090
Samsung PM9A1 MZVL22T0HBLB
205 (202.97min - 204.75max) MB/s +28%
Maingear ML-16 MK2
 
160.3 (156.3min - 160.29max) MB/s
Asus ROG Zephyrus G16 GA605WV
Micron 2400 MTFDKBA1T0QFM
93.9 (77.46min - 93.94max) MB/s -41%
4k q32 t16 read
Alienware x16 R2 P120F
WDC PC SN810 1TB
4245 (4210.56min - 4245.12max) MB/s +259%
Lenovo Legion Pro 5 16IRX9
Samsung PM9A1 MZVL21T0HCLR
4055 (4044.11min - 4055.48max) MB/s +243%
Razer Blade 16 2024, RTX 4090
Samsung PM9A1 MZVL22T0HBLB
3726 (3704.12min - 3725.6max) MB/s +215%
HP Victus 16 (2024)
Kioxia XG8 KXG80ZNV512G
3330 (3310.23min - 3329.64max) MB/s +182%
Maingear ML-16 MK2
 
1182 (1152.17min - 1182.3max) MB/s
Asus ROG Zephyrus G16 GA605WV
Micron 2400 MTFDKBA1T0QFM
550 (536.5min - 549.61max) MB/s -53%
4k q32 t16 write
Razer Blade 16 2024, RTX 4090
Samsung PM9A1 MZVL22T0HBLB
3548 (3533.85min - 3548.33max) MB/s +549%
Lenovo Legion Pro 5 16IRX9
Samsung PM9A1 MZVL21T0HCLR
3542 (3491.17min - 3541.69max) MB/s +548%
Alienware x16 R2 P120F
WDC PC SN810 1TB
2907 (2737.8min - 2907.05max) MB/s +431%
HP Victus 16 (2024)
Kioxia XG8 KXG80ZNV512G
2405 (937.07min - 2405.2max) MB/s +340%
Maingear ML-16 MK2
 
547 (529.87min - 547.07max) MB/s
Asus ROG Zephyrus G16 GA605WV
Micron 2400 MTFDKBA1T0QFM
313 (297.37min - 312.94max) MB/s -43%
AS SSD
Score Total
Lenovo Legion Pro 5 16IRX9
Samsung PM9A1 MZVL21T0HCLR
8364 Points +57%
Alienware x16 R2 P120F
WDC PC SN810 1TB
8139 Points +53%
HP Victus 16 (2024)
Kioxia XG8 KXG80ZNV512G
7423 Points +39%
Razer Blade 16 2024, RTX 4090
Samsung PM9A1 MZVL22T0HBLB
7040 Points +32%
Maingear ML-16 MK2
 
5332 Points
Asus ROG Zephyrus G16 GA605WV
Micron 2400 MTFDKBA1T0QFM
3564 Points -33%
Score Read
Lenovo Legion Pro 5 16IRX9
Samsung PM9A1 MZVL21T0HCLR
3233 Points +100%
Alienware x16 R2 P120F
WDC PC SN810 1TB
3204 Points +98%
HP Victus 16 (2024)
Kioxia XG8 KXG80ZNV512G
3007 Points +86%
Razer Blade 16 2024, RTX 4090
Samsung PM9A1 MZVL22T0HBLB
2848 Points +76%
Maingear ML-16 MK2
 
1616 Points
Asus ROG Zephyrus G16 GA605WV
Micron 2400 MTFDKBA1T0QFM
954 Points -41%
Score Write
Lenovo Legion Pro 5 16IRX9
Samsung PM9A1 MZVL21T0HCLR
3543 Points +19%
Alienware x16 R2 P120F
WDC PC SN810 1TB
3341 Points +13%
Maingear ML-16 MK2
 
2965 Points
HP Victus 16 (2024)
Kioxia XG8 KXG80ZNV512G
2919 Points -2%
Razer Blade 16 2024, RTX 4090
Samsung PM9A1 MZVL22T0HBLB
2766 Points -7%
Asus ROG Zephyrus G16 GA605WV
Micron 2400 MTFDKBA1T0QFM
2185 Points -26%
Seq Read
Alienware x16 R2 P120F
WDC PC SN810 1TB
5642.41 MB/s +7%
Lenovo Legion Pro 5 16IRX9
Samsung PM9A1 MZVL21T0HCLR
5355.36 MB/s +2%
Maingear ML-16 MK2
 
5265.5 MB/s
HP Victus 16 (2024)
Kioxia XG8 KXG80ZNV512G
5247.63 MB/s 0%
Razer Blade 16 2024, RTX 4090
Samsung PM9A1 MZVL22T0HBLB
4371 MB/s -17%
Asus ROG Zephyrus G16 GA605WV
Micron 2400 MTFDKBA1T0QFM
3863 MB/s -27%
Seq Write
Alienware x16 R2 P120F
WDC PC SN810 1TB
4787.7 MB/s +38%
HP Victus 16 (2024)
Kioxia XG8 KXG80ZNV512G
4617.83 MB/s +33%
Lenovo Legion Pro 5 16IRX9
Samsung PM9A1 MZVL21T0HCLR
3950.35 MB/s +14%
Razer Blade 16 2024, RTX 4090
Samsung PM9A1 MZVL22T0HBLB
3791 MB/s +9%
Maingear ML-16 MK2
 
3472.92 MB/s
Asus ROG Zephyrus G16 GA605WV
Micron 2400 MTFDKBA1T0QFM
2555 MB/s -26%
4K Read
Lenovo Legion Pro 5 16IRX9
Samsung PM9A1 MZVL21T0HCLR
82.62 MB/s +27%
Alienware x16 R2 P120F
WDC PC SN810 1TB
70.48 MB/s +8%
Maingear ML-16 MK2
 
65.16 MB/s
Razer Blade 16 2024, RTX 4090
Samsung PM9A1 MZVL22T0HBLB
61.1 MB/s -6%
HP Victus 16 (2024)
Kioxia XG8 KXG80ZNV512G
51.41 MB/s -21%
Asus ROG Zephyrus G16 GA605WV
Micron 2400 MTFDKBA1T0QFM
27.8 MB/s -57%
4K Write
HP Victus 16 (2024)
Kioxia XG8 KXG80ZNV512G
218.1 MB/s +14%
Lenovo Legion Pro 5 16IRX9
Samsung PM9A1 MZVL21T0HCLR
213.76 MB/s +12%
Alienware x16 R2 P120F
WDC PC SN810 1TB
213.62 MB/s +11%
Maingear ML-16 MK2
 
191.65 MB/s
Asus ROG Zephyrus G16 GA605WV
Micron 2400 MTFDKBA1T0QFM
185.4 MB/s -3%
Razer Blade 16 2024, RTX 4090
Samsung PM9A1 MZVL22T0HBLB
160.6 MB/s -16%
4K-64 Read
Lenovo Legion Pro 5 16IRX9
Samsung PM9A1 MZVL21T0HCLR
2615.17 MB/s +155%
Alienware x16 R2 P120F
WDC PC SN810 1TB
2569.34 MB/s +151%
HP Victus 16 (2024)
Kioxia XG8 KXG80ZNV512G
2430.71 MB/s +137%
Razer Blade 16 2024, RTX 4090
Samsung PM9A1 MZVL22T0HBLB
2350 MB/s +129%
Maingear ML-16 MK2
 
1024.5 MB/s
Asus ROG Zephyrus G16 GA605WV
Micron 2400 MTFDKBA1T0QFM
539 MB/s -47%
4K-64 Write
Lenovo Legion Pro 5 16IRX9
Samsung PM9A1 MZVL21T0HCLR
2933.74 MB/s +21%
Alienware x16 R2 P120F
WDC PC SN810 1TB
2648.4 MB/s +9%
Maingear ML-16 MK2
 
2425.99 MB/s
HP Victus 16 (2024)
Kioxia XG8 KXG80ZNV512G
2238.92 MB/s -8%
Razer Blade 16 2024, RTX 4090
Samsung PM9A1 MZVL22T0HBLB
2226 MB/s -8%
Asus ROG Zephyrus G16 GA605WV
Micron 2400 MTFDKBA1T0QFM
1744 MB/s -28%
Access Time Read
HP Victus 16 (2024)
Kioxia XG8 KXG80ZNV512G
0.137 ms * -270%
Alienware x16 R2 P120F
WDC PC SN810 1TB
0.09 ms * -143%
Lenovo Legion Pro 5 16IRX9
Samsung PM9A1 MZVL21T0HCLR
0.042 ms * -14%
Maingear ML-16 MK2
 
0.037 ms *
Razer Blade 16 2024, RTX 4090
Samsung PM9A1 MZVL22T0HBLB
0.033 ms * +11%
Asus ROG Zephyrus G16 GA605WV
Micron 2400 MTFDKBA1T0QFM
0.027 ms * +27%
Access Time Write
Asus ROG Zephyrus G16 GA605WV
Micron 2400 MTFDKBA1T0QFM
0.139 ms * -132%
Maingear ML-16 MK2
 
0.06 ms *
Lenovo Legion Pro 5 16IRX9
Samsung PM9A1 MZVL21T0HCLR
0.059 ms * +2%
Alienware x16 R2 P120F
WDC PC SN810 1TB
0.055 ms * +8%
Razer Blade 16 2024, RTX 4090
Samsung PM9A1 MZVL22T0HBLB
0.025 ms * +58%
HP Victus 16 (2024)
Kioxia XG8 KXG80ZNV512G
0.019 ms * +68%

* ... Meglio usare valori piccoli

Disk Throttling: DiskSpd Read Loop, Queue Depth 8

035070010501400175021002450280031503500385042004550490052505600595063006650Tooltip
Maingear ML-16 MK2; diskspd 2.0.17 f: Ø6943 (5802.4-6977.43)

Prestazioni della GPU

Il mobile GeForce RTX 4070 ha prestazioni di pochi punti percentuali più lente rispetto al laptop medio del nostro database con la stessa opzione GPU. Le prestazioni complessive sono migliori solo del 5-15% rispetto alla GPU di base RTX 4060 o circa il 15 percento in più rispetto alla più vecchia RTX 3070 Ti. Il divario diventa molto più ampio quando si confronta la RTX 4070 mobile con la RTX 4080 mobile rTX 4080 mobilema quest'ultima non è configurabile su questo modello.

Tenga presente che la RTX 4070 mobile è molto più lenta della sua controparte desktop di circa il 35-40%.

Profilo di potenzaPunteggio graficoPunteggio di fisicaPunteggio combinato
Modalità prestazioni28464268979495
Modalità equilibrata28238 (-0%)16060 (-40%)8049 (-15%)
Potenza della batteria5539 (-81%)12186 (-55%)1715 (-82%)

L'esecuzione in modalità Bilanciata invece che in modalità Prestazioni ha un impatto significativo sulle prestazioni della CPU, mentre le prestazioni grafiche rimangono inalterate, secondo la nostra tabella dei risultati Fire Strike qui sopra. Ciò è in linea con le nostre osservazioni nella sezione Stress Test di cui sopra. Il funzionamento a batteria ha un ulteriore impatto sulle prestazioni complessive, anche quando è impostato sulla modalità Prestazioni.

3DMark 11
3DMark 11
Fire Strike
Fire Strike
Time Spy
Time Spy
Via della velocità
Via della velocità
Nomade d'acciaio
Nomade d'acciaio
 
3DMark Performance Rating - Percent
Razer Blade 16 2024, RTX 4090 -1!
NVIDIA GeForce RTX 4090 Laptop GPU, Intel Core i9-14900HX
100 pt
KFA2 GeForce RTX 4070 EX Gamer
NVIDIA GeForce RTX 4070, AMD Ryzen 9 7950X
93.1 pt
Alienware x16 R2 P120F
NVIDIA GeForce RTX 4080 Laptop GPU, Intel Core Ultra 9 185H
92.6 pt
Lenovo Yoga Pro 9 16IMH9 -1!
NVIDIA GeForce RTX 4070 Laptop GPU, Intel Core Ultra 9 185H
63.5 pt
Media NVIDIA GeForce RTX 4070 Laptop GPU
 
61 pt
Maingear ML-16 MK2
NVIDIA GeForce RTX 4070 Laptop GPU, Intel Core Ultra 7 155H
57 pt
HP Victus 16 (2024) -1!
NVIDIA GeForce RTX 4060 Laptop GPU, Intel Core i7-14700HX
54.3 pt
HP Omen 16-b0085ng -1!
NVIDIA GeForce RTX 3070 Laptop GPU, Intel Core i7-11800H
52.3 pt
CSL GameStar Notebook VenomGamer G16 -1!
AMD Radeon RX 7600M, AMD Ryzen 7 7735HS
50.8 pt
Asus ROG Zephyrus M16 GU603Z -1!
NVIDIA GeForce RTX 3070 Ti Laptop GPU, Intel Core i9-12900H
50.4 pt
Asus TUF Gaming A16 FA617XS
AMD Radeon RX 7600S, AMD Ryzen 9 7940HS
48 pt
HP Victus 16-r0076TX
NVIDIA GeForce RTX 4050 Laptop GPU, Intel Core i5-13500HX
46.5 pt
HP Omen 16-n0033dx
AMD Radeon RX 6650M, AMD Ryzen 7 6800H
45.3 pt
Acer Nitro 16 AN16-41-R7YE
NVIDIA GeForce RTX 4050 Laptop GPU, AMD Ryzen 5 7535HS
44.7 pt
Lenovo Legion C7 15IMH05 82EH0030GE -1!
NVIDIA GeForce RTX 2070 Max-Q, Intel Core i7-10875H
38 pt
3DMark 11 - 1280x720 Performance GPU
Razer Blade 16 2024, RTX 4090
NVIDIA GeForce RTX 4090 Laptop GPU, Intel Core i9-14900HX
65956 Points +77%
KFA2 GeForce RTX 4070 EX Gamer
NVIDIA GeForce RTX 4070, AMD Ryzen 9 7950X
60428 Points +62%
Alienware x16 R2 P120F
NVIDIA GeForce RTX 4080 Laptop GPU, Intel Core Ultra 9 185H
56772 Points +52%
Lenovo Yoga Pro 9 16IMH9
NVIDIA GeForce RTX 4070 Laptop GPU, Intel Core Ultra 9 185H
40646 Points +9%
Media NVIDIA GeForce RTX 4070 Laptop GPU
  (24229 - 46434, n=65)
40385 Points +8%
Maingear ML-16 MK2
NVIDIA GeForce RTX 4070 Laptop GPU, Intel Core Ultra 7 155H
37263 Points
CSL GameStar Notebook VenomGamer G16
AMD Radeon RX 7600M, AMD Ryzen 7 7735HS
35101 Points -6%
HP Victus 16 (2024)
NVIDIA GeForce RTX 4060 Laptop GPU, Intel Core i7-14700HX
35045 Points -6%
HP Omen 16-b0085ng
NVIDIA GeForce RTX 3070 Laptop GPU, Intel Core i7-11800H
34644 Points -7%
Asus TUF Gaming A16 FA617XS
AMD Radeon RX 7600S, AMD Ryzen 9 7940HS
33037 Points -11%
HP Omen 16-n0033dx
AMD Radeon RX 6650M, AMD Ryzen 7 6800H
32846 Points -12%
Asus ROG Zephyrus M16 GU603Z
NVIDIA GeForce RTX 3070 Ti Laptop GPU, Intel Core i9-12900H
32236 Points -13%
HP Victus 16-r0076TX
NVIDIA GeForce RTX 4050 Laptop GPU, Intel Core i5-13500HX
31571 Points -15%
Acer Nitro 16 AN16-41-R7YE
NVIDIA GeForce RTX 4050 Laptop GPU, AMD Ryzen 5 7535HS
30717 Points -18%
Lenovo Legion C7 15IMH05 82EH0030GE
NVIDIA GeForce RTX 2070 Max-Q, Intel Core i7-10875H
24040 Points -35%
3DMark
1920x1080 Fire Strike Graphics
Razer Blade 16 2024, RTX 4090
NVIDIA GeForce RTX 4090 Laptop GPU, Intel Core i9-14900HX
46527 Points +63%
KFA2 GeForce RTX 4070 EX Gamer
NVIDIA GeForce RTX 4070, AMD Ryzen 9 7950X
44065 Points +55%
Alienware x16 R2 P120F
NVIDIA GeForce RTX 4080 Laptop GPU, Intel Core Ultra 9 185H
42558 Points +50%
Lenovo Yoga Pro 9 16IMH9
NVIDIA GeForce RTX 4070 Laptop GPU, Intel Core Ultra 9 185H
30874 Points +8%
Media NVIDIA GeForce RTX 4070 Laptop GPU
  (12242 - 33451, n=69)
29068 Points +2%
Maingear ML-16 MK2
NVIDIA GeForce RTX 4070 Laptop GPU, Intel Core Ultra 7 155H
28464 Points
HP Victus 16 (2024)
NVIDIA GeForce RTX 4060 Laptop GPU, Intel Core i7-14700HX
26844 Points -6%
Asus TUF Gaming A16 FA617XS
AMD Radeon RX 7600S, AMD Ryzen 9 7940HS
26154 Points -8%
HP Omen 16-n0033dx
AMD Radeon RX 6650M, AMD Ryzen 7 6800H
25739 Points -10%
CSL GameStar Notebook VenomGamer G16
AMD Radeon RX 7600M, AMD Ryzen 7 7735HS
25679 Points -10%
Asus ROG Zephyrus M16 GU603Z
NVIDIA GeForce RTX 3070 Ti Laptop GPU, Intel Core i9-12900H
24618 Points -14%
HP Omen 16-b0085ng
NVIDIA GeForce RTX 3070 Laptop GPU, Intel Core i7-11800H
24384 Points -14%
HP Victus 16-r0076TX
NVIDIA GeForce RTX 4050 Laptop GPU, Intel Core i5-13500HX
23524 Points -17%
Acer Nitro 16 AN16-41-R7YE
NVIDIA GeForce RTX 4050 Laptop GPU, AMD Ryzen 5 7535HS
23204 Points -18%
Lenovo Legion C7 15IMH05 82EH0030GE
NVIDIA GeForce RTX 2070 Max-Q, Intel Core i7-10875H
18684 Points -34%
2560x1440 Time Spy Graphics
Razer Blade 16 2024, RTX 4090
NVIDIA GeForce RTX 4090 Laptop GPU, Intel Core i9-14900HX
19878 Points +86%
Alienware x16 R2 P120F
NVIDIA GeForce RTX 4080 Laptop GPU, Intel Core Ultra 9 185H
18627 Points +74%
KFA2 GeForce RTX 4070 EX Gamer
NVIDIA GeForce RTX 4070, AMD Ryzen 9 7950X
17827 Points +67%
Lenovo Yoga Pro 9 16IMH9
NVIDIA GeForce RTX 4070 Laptop GPU, Intel Core Ultra 9 185H
12181 Points +14%
Media NVIDIA GeForce RTX 4070 Laptop GPU
  (5012 - 13391, n=67)
11602 Points +9%
Maingear ML-16 MK2
NVIDIA GeForce RTX 4070 Laptop GPU, Intel Core Ultra 7 155H
10691 Points
HP Omen 16-b0085ng
NVIDIA GeForce RTX 3070 Laptop GPU, Intel Core i7-11800H
10019 Points -6%
HP Victus 16 (2024)
NVIDIA GeForce RTX 4060 Laptop GPU, Intel Core i7-14700HX
9937 Points -7%
Asus ROG Zephyrus M16 GU603Z
NVIDIA GeForce RTX 3070 Ti Laptop GPU, Intel Core i9-12900H
9421 Points -12%
Asus TUF Gaming A16 FA617XS
AMD Radeon RX 7600S, AMD Ryzen 9 7940HS
9203 Points -14%
CSL GameStar Notebook VenomGamer G16
AMD Radeon RX 7600M, AMD Ryzen 7 7735HS
9097 Points -15%
HP Omen 16-n0033dx
AMD Radeon RX 6650M, AMD Ryzen 7 6800H
8700 Points -19%
HP Victus 16-r0076TX
NVIDIA GeForce RTX 4050 Laptop GPU, Intel Core i5-13500HX
8621 Points -19%
Acer Nitro 16 AN16-41-R7YE
NVIDIA GeForce RTX 4050 Laptop GPU, AMD Ryzen 5 7535HS
8363 Points -22%
Lenovo Legion C7 15IMH05 82EH0030GE
NVIDIA GeForce RTX 2070 Max-Q, Intel Core i7-10875H
7093 Points -34%
2560x1440 Time Spy Score
Razer Blade 16 2024, RTX 4090
NVIDIA GeForce RTX 4090 Laptop GPU, Intel Core i9-14900HX
18732 Points +74%
KFA2 GeForce RTX 4070 EX Gamer
NVIDIA GeForce RTX 4070, AMD Ryzen 9 7950X
17690 Points +64%
Alienware x16 R2 P120F
NVIDIA GeForce RTX 4080 Laptop GPU, Intel Core Ultra 9 185H
17164 Points +60%
Lenovo Yoga Pro 9 16IMH9
NVIDIA GeForce RTX 4070 Laptop GPU, Intel Core Ultra 9 185H
12105 Points +13%
Media NVIDIA GeForce RTX 4070 Laptop GPU
  (5339 - 13871, n=67)
11735 Points +9%
Maingear ML-16 MK2
NVIDIA GeForce RTX 4070 Laptop GPU, Intel Core Ultra 7 155H
10759 Points
HP Victus 16 (2024)
NVIDIA GeForce RTX 4060 Laptop GPU, Intel Core i7-14700HX
10542 Points -2%
HP Omen 16-b0085ng
NVIDIA GeForce RTX 3070 Laptop GPU, Intel Core i7-11800H
10126 Points -6%
Asus ROG Zephyrus M16 GU603Z
NVIDIA GeForce RTX 3070 Ti Laptop GPU, Intel Core i9-12900H
9841 Points -9%
Asus TUF Gaming A16 FA617XS
AMD Radeon RX 7600S, AMD Ryzen 9 7940HS
9530 Points -11%
CSL GameStar Notebook VenomGamer G16
AMD Radeon RX 7600M, AMD Ryzen 7 7735HS
9172 Points -15%
HP Victus 16-r0076TX
NVIDIA GeForce RTX 4050 Laptop GPU, Intel Core i5-13500HX
9069 Points -16%
HP Omen 16-n0033dx
AMD Radeon RX 6650M, AMD Ryzen 7 6800H
8869 Points -18%
Acer Nitro 16 AN16-41-R7YE
NVIDIA GeForce RTX 4050 Laptop GPU, AMD Ryzen 5 7535HS
8227 Points -24%
Lenovo Legion C7 15IMH05 82EH0030GE
NVIDIA GeForce RTX 2070 Max-Q, Intel Core i7-10875H
7411 Points -31%
2560x1440 Speed Way Score
Alienware x16 R2 P120F
NVIDIA GeForce RTX 4080 Laptop GPU, Intel Core Ultra 9 185H
4688 Points +79%
KFA2 GeForce RTX 4070 EX Gamer
NVIDIA GeForce RTX 4070, AMD Ryzen 9 7950X
4445 Points +70%
Media NVIDIA GeForce RTX 4070 Laptop GPU
  (1333 - 3166, n=32)
2823 Points +8%
Maingear ML-16 MK2
NVIDIA GeForce RTX 4070 Laptop GPU, Intel Core Ultra 7 155H
2620 Points
HP Victus 16-r0076TX
NVIDIA GeForce RTX 4050 Laptop GPU, Intel Core i5-13500HX
1987 Points -24%
Acer Nitro 16 AN16-41-R7YE
NVIDIA GeForce RTX 4050 Laptop GPU, AMD Ryzen 5 7535HS
1928 Points -26%
Asus TUF Gaming A16 FA617XS
AMD Radeon RX 7600S, AMD Ryzen 9 7940HS
1705 Points -35%
HP Omen 16-n0033dx
AMD Radeon RX 6650M, AMD Ryzen 7 6800H
1418 Points -46%
3DMark 11 Performance
31266 punti
3DMark Cloud Gate Standard Score
57717 punti
3DMark Fire Strike Score
23552 punti
3DMark Time Spy Score
10759 punti
3DMark Steel Nomad Score
2329 punti
Aiuto
Blender
v3.3 Classroom HIP/AMD
Media NVIDIA GeForce RTX 4070 Laptop GPU
  ()
330 Seconds *
CSL GameStar Notebook VenomGamer G16
AMD Radeon RX 7600M, AMD Ryzen 7 7735HS
63 Seconds *
v3.3 Classroom OPTIX/RTX
Asus ROG Zephyrus M16 GU603Z
NVIDIA GeForce RTX 3070 Ti Laptop GPU, Intel Core i9-12900H
28 Seconds * -33%
HP Victus 16-r0076TX
NVIDIA GeForce RTX 4050 Laptop GPU, Intel Core i5-13500HX
28 Seconds * -33%
Acer Nitro 16 AN16-41-R7YE
NVIDIA GeForce RTX 4050 Laptop GPU, AMD Ryzen 5 7535HS
26 Seconds * -24%
MSI Stealth 16 Mercedes-AMG Motorsport A13VG
NVIDIA GeForce RTX 4070 Laptop GPU, Intel Core i9-13900H
23 Seconds * -10%
HP Victus 16 (2024)
NVIDIA GeForce RTX 4060 Laptop GPU, Intel Core i7-14700HX
22 Seconds * -5%
Media NVIDIA GeForce RTX 4070 Laptop GPU
  (18 - 30, n=66)
21.5 Seconds * -2%
Maingear ML-16 MK2
NVIDIA GeForce RTX 4070 Laptop GPU, Intel Core Ultra 7 155H
21 Seconds *
Alienware x16 R2 P120F
NVIDIA GeForce RTX 4080 Laptop GPU, Intel Core Ultra 9 185H
15 Seconds * +29%
KFA2 GeForce RTX 4070 EX Gamer
NVIDIA GeForce RTX 4070, AMD Ryzen 9 7950X
14 Seconds * +33%
Razer Blade 16 2024, RTX 4090
NVIDIA GeForce RTX 4090 Laptop GPU, Intel Core i9-14900HX
12 Seconds * +43%
v3.3 Classroom CUDA
Acer Nitro 16 AN16-41-R7YE
NVIDIA GeForce RTX 4050 Laptop GPU, AMD Ryzen 5 7535HS
50 Seconds * -47%
HP Victus 16-r0076TX
NVIDIA GeForce RTX 4050 Laptop GPU, Intel Core i5-13500HX
50 Seconds * -47%
Asus ROG Zephyrus M16 GU603Z
NVIDIA GeForce RTX 3070 Ti Laptop GPU, Intel Core i9-12900H
45 Seconds * -32%
HP Victus 16 (2024)
NVIDIA GeForce RTX 4060 Laptop GPU, Intel Core i7-14700HX
41 Seconds * -21%
Media NVIDIA GeForce RTX 4070 Laptop GPU
  (32 - 181, n=68)
40.1 Seconds * -18%
MSI Stealth 16 Mercedes-AMG Motorsport A13VG
NVIDIA GeForce RTX 4070 Laptop GPU, Intel Core i9-13900H
36 Seconds * -6%
Maingear ML-16 MK2
NVIDIA GeForce RTX 4070 Laptop GPU, Intel Core Ultra 7 155H
34 Seconds *
Alienware x16 R2 P120F
NVIDIA GeForce RTX 4080 Laptop GPU, Intel Core Ultra 9 185H
22 Seconds * +35%
Razer Blade 16 2024, RTX 4090
NVIDIA GeForce RTX 4090 Laptop GPU, Intel Core i9-14900HX
18 Seconds * +47%
v3.3 Classroom CPU
Acer Nitro 16 AN16-41-R7YE
NVIDIA GeForce RTX 4050 Laptop GPU, AMD Ryzen 5 7535HS
481 Seconds * -18%
Maingear ML-16 MK2
NVIDIA GeForce RTX 4070 Laptop GPU, Intel Core Ultra 7 155H
408 Seconds *
MSI Stealth 16 Mercedes-AMG Motorsport A13VG
NVIDIA GeForce RTX 4070 Laptop GPU, Intel Core i9-13900H
399 Seconds * +2%
HP Omen 16-n0033dx
AMD Radeon RX 6650M, AMD Ryzen 7 6800H
394 Seconds * +3%
CSL GameStar Notebook VenomGamer G16
AMD Radeon RX 7600M, AMD Ryzen 7 7735HS
355 Seconds * +13%
HP Victus 16-r0076TX
NVIDIA GeForce RTX 4050 Laptop GPU, Intel Core i5-13500HX
339 Seconds * +17%
Asus ROG Zephyrus M16 GU603Z
NVIDIA GeForce RTX 3070 Ti Laptop GPU, Intel Core i9-12900H
329 Seconds * +19%
HP Victus 16 (2024)
NVIDIA GeForce RTX 4060 Laptop GPU, Intel Core i7-14700HX
312 Seconds * +24%
Alienware x16 R2 P120F
NVIDIA GeForce RTX 4080 Laptop GPU, Intel Core Ultra 9 185H
305 Seconds * +25%
Asus TUF Gaming A16 FA617XS
AMD Radeon RX 7600S, AMD Ryzen 9 7940HS
301 Seconds * +26%
Media NVIDIA GeForce RTX 4070 Laptop GPU
  (158 - 440, n=65)
289 Seconds * +29%
Razer Blade 16 2024, RTX 4090
NVIDIA GeForce RTX 4090 Laptop GPU, Intel Core i9-14900HX
202 Seconds * +50%

* ... Meglio usare valori piccoli

Prestazioni di gioco

La RTX 4070 mobile è abbastanza potente da far girare i titoli moderni con le impostazioni massime alla risoluzione nativa QHD+. Anche titoli più impegnativi come Cyberpunk 2077 sono possibili, sebbene richiedano DLSS per raggiungere 60 FPS o più. Eseguendo il benchmark in-game con impostazioni Ultra RT e 1600p nativi, ad esempio, si otterrebbe un frame rate medio di soli 20,2 contro 63,1 con DLSS 3 Balanced attivato.

Performance Rating - Percent
Razer Blade 16 2024, RTX 4090
Intel Core i9-14900HX, NVIDIA GeForce RTX 4090 Laptop GPU
96.5 pt
Lenovo Legion Pro 5 16IRX9
Intel Core i9-14900HX, NVIDIA GeForce RTX 4070 Laptop GPU
90.6 pt
Alienware x16 R2 P120F -1!
Intel Core Ultra 9 185H, NVIDIA GeForce RTX 4080 Laptop GPU
77.1 pt
Maingear ML-16 MK2
Intel Core Ultra 7 155H, NVIDIA GeForce RTX 4070 Laptop GPU
70.6 pt
HP Victus 16 (2024) -1!
Intel Core i7-14700HX, NVIDIA GeForce RTX 4060 Laptop GPU
69.6 pt
Asus ROG Zephyrus G16 GA605WV
AMD Ryzen AI 9 HX 370, NVIDIA GeForce RTX 4060 Laptop GPU
62.7 pt
GTA V - 1920x1080 Highest Settings possible AA:4xMSAA + FX AF:16x
Razer Blade 16 2024, RTX 4090
Intel Core i9-14900HX, NVIDIA GeForce RTX 4090 Laptop GPU
138.1 (4.19min, 83.3P1) fps +20%
Lenovo Legion Pro 5 16IRX9
Intel Core i9-14900HX, NVIDIA GeForce RTX 4070 Laptop GPU
127.2 (5.17min, 83.3P1) fps +11%
Maingear ML-16 MK2
Intel Core Ultra 7 155H, NVIDIA GeForce RTX 4070 Laptop GPU
115.1 (3.8min, 71.4P1) fps
HP Victus 16 (2024)
Intel Core i7-14700HX, NVIDIA GeForce RTX 4060 Laptop GPU
110.2 (8.03min, 76.9P1) fps -4%
Asus ROG Zephyrus G16 GA605WV
AMD Ryzen AI 9 HX 370, NVIDIA GeForce RTX 4060 Laptop GPU
100.1 (4.02min, 66.7P1) fps -13%
Final Fantasy XV Benchmark - 1920x1080 High Quality
Alienware x16 R2 P120F
Intel Core Ultra 9 185H, NVIDIA GeForce RTX 4080 Laptop GPU
139.8 fps +26%
Razer Blade 16 2024, RTX 4090
Intel Core i9-14900HX, NVIDIA GeForce RTX 4090 Laptop GPU
137.5 fps +24%
Lenovo Legion Pro 5 16IRX9
Intel Core i9-14900HX, NVIDIA GeForce RTX 4070 Laptop GPU
131 fps +18%
Maingear ML-16 MK2
Intel Core Ultra 7 155H, NVIDIA GeForce RTX 4070 Laptop GPU
110.6 fps
HP Victus 16 (2024)
Intel Core i7-14700HX, NVIDIA GeForce RTX 4060 Laptop GPU
98.1 fps -11%
Asus ROG Zephyrus G16 GA605WV
AMD Ryzen AI 9 HX 370, NVIDIA GeForce RTX 4060 Laptop GPU
90.7 fps -18%
Strange Brigade - 1920x1080 ultra AA:ultra AF:16
Razer Blade 16 2024, RTX 4090
Intel Core i9-14900HX, NVIDIA GeForce RTX 4090 Laptop GPU
359.8 (30.2min, 253P1) fps +87%
Alienware x16 R2 P120F
Intel Core Ultra 9 185H, NVIDIA GeForce RTX 4080 Laptop GPU
293 (38.3min, 184.1P1) fps +52%
Lenovo Legion Pro 5 16IRX9
Intel Core i9-14900HX, NVIDIA GeForce RTX 4070 Laptop GPU
234 (27.8min, 175.8P1) fps +21%
Maingear ML-16 MK2
Intel Core Ultra 7 155H, NVIDIA GeForce RTX 4070 Laptop GPU
192.8 (84.3min, 146.7P1) fps
HP Victus 16 (2024)
Intel Core i7-14700HX, NVIDIA GeForce RTX 4060 Laptop GPU
179 (76.4min, 130.3P1) fps -7%
Asus ROG Zephyrus G16 GA605WV
AMD Ryzen AI 9 HX 370, NVIDIA GeForce RTX 4060 Laptop GPU
174.9 (77.7min, 128P1) fps -9%
Dota 2 Reborn - 1920x1080 ultra (3/3) best looking
Razer Blade 16 2024, RTX 4090
Intel Core i9-14900HX, NVIDIA GeForce RTX 4090 Laptop GPU
188.1 (155.2min) fps +35%
Lenovo Legion Pro 5 16IRX9
Intel Core i9-14900HX, NVIDIA GeForce RTX 4070 Laptop GPU
185.3 (161min) fps +33%
HP Victus 16 (2024)
Intel Core i7-14700HX, NVIDIA GeForce RTX 4060 Laptop GPU
149.7 (130.4min) fps +8%
Asus ROG Zephyrus G16 GA605WV
AMD Ryzen AI 9 HX 370, NVIDIA GeForce RTX 4060 Laptop GPU
139.2 (118.4min) fps 0%
Maingear ML-16 MK2
Intel Core Ultra 7 155H, NVIDIA GeForce RTX 4070 Laptop GPU
139.2 (117.8min) fps
Alienware x16 R2 P120F
Intel Core Ultra 9 185H, NVIDIA GeForce RTX 4080 Laptop GPU
133 (114.6min) fps -4%
X-Plane 11.11 - 1920x1080 high (fps_test=3)
Razer Blade 16 2024, RTX 4090
Intel Core i9-14900HX, NVIDIA GeForce RTX 4090 Laptop GPU
146.2 fps +63%
Lenovo Legion Pro 5 16IRX9
Intel Core i9-14900HX, NVIDIA GeForce RTX 4070 Laptop GPU
137.6 fps +53%
HP Victus 16 (2024)
Intel Core i7-14700HX, NVIDIA GeForce RTX 4060 Laptop GPU
100.3 fps +12%
Maingear ML-16 MK2
Intel Core Ultra 7 155H, NVIDIA GeForce RTX 4070 Laptop GPU
89.8 fps
Alienware x16 R2 P120F
Intel Core Ultra 9 185H, NVIDIA GeForce RTX 4080 Laptop GPU
89.3 fps -1%
Asus ROG Zephyrus G16 GA605WV
AMD Ryzen AI 9 HX 370, NVIDIA GeForce RTX 4060 Laptop GPU
66.5 fps -26%
Far Cry 5 - 1920x1080 Ultra Preset AA:T
Lenovo Legion Pro 5 16IRX9
Intel Core i9-14900HX, NVIDIA GeForce RTX 4070 Laptop GPU
158 (121min) fps +39%
Razer Blade 16 2024, RTX 4090
Intel Core i9-14900HX, NVIDIA GeForce RTX 4090 Laptop GPU
127 fps +11%
Alienware x16 R2 P120F
Intel Core Ultra 9 185H, NVIDIA GeForce RTX 4080 Laptop GPU
114 (89min) fps 0%
Maingear ML-16 MK2
Intel Core Ultra 7 155H, NVIDIA GeForce RTX 4070 Laptop GPU
114 (87min) fps
Asus ROG Zephyrus G16 GA605WV
AMD Ryzen AI 9 HX 370, NVIDIA GeForce RTX 4060 Laptop GPU
112 fps -2%
Baldur's Gate 3
1920x1080 High Preset
Alienware x16 R2 P120F
Intel Core Ultra 9 185H, NVIDIA GeForce RTX 4080 Laptop GPU
161.2 fps +49%
Lenovo Yoga Pro 9 16IMH9
Intel Core Ultra 9 185H, NVIDIA GeForce RTX 4070 Laptop GPU
119.9 fps +11%
Maingear ML-16 MK2
Intel Core Ultra 7 155H, NVIDIA GeForce RTX 4070 Laptop GPU
108.2 fps
Media NVIDIA GeForce RTX 4070 Laptop GPU
  (72.7 - 129.3, n=25)
104.1 fps -4%
CSL GameStar Notebook VenomGamer G16
AMD Ryzen 7 7735HS, AMD Radeon RX 7600M
71 (48.1min, 59P0.1, 63.1P1) fps -34%
1920x1080 Ultra Preset
Alienware x16 R2 P120F
Intel Core Ultra 9 185H, NVIDIA GeForce RTX 4080 Laptop GPU
159.4 fps +49%
Lenovo Yoga Pro 9 16IMH9
Intel Core Ultra 9 185H, NVIDIA GeForce RTX 4070 Laptop GPU
117.7 fps +10%
Maingear ML-16 MK2
Intel Core Ultra 7 155H, NVIDIA GeForce RTX 4070 Laptop GPU
106.8 fps
Media NVIDIA GeForce RTX 4070 Laptop GPU
  (66.7 - 128.5, n=26)
101 fps -5%
CSL GameStar Notebook VenomGamer G16
AMD Ryzen 7 7735HS, AMD Radeon RX 7600M
68.9 (56.8min, 58.8P0.1, 62P1) fps -35%
2560x1440 Ultra Preset
Alienware x16 R2 P120F
Intel Core Ultra 9 185H, NVIDIA GeForce RTX 4080 Laptop GPU
124.3 fps +76%
Lenovo Yoga Pro 9 16IMH9
Intel Core Ultra 9 185H, NVIDIA GeForce RTX 4070 Laptop GPU
79.8 fps +13%
Media NVIDIA GeForce RTX 4070 Laptop GPU
  (54.4 - 89.6, n=22)
73 fps +3%
Maingear ML-16 MK2
Intel Core Ultra 7 155H, NVIDIA GeForce RTX 4070 Laptop GPU
70.6 fps
CSL GameStar Notebook VenomGamer G16
AMD Ryzen 7 7735HS, AMD Radeon RX 7600M
47.2 (41.5min, 42.1P0.1, 42.9P1) fps -33%
GTA V
1920x1080 Normal/Off AF:4x
KFA2 GeForce RTX 4070 EX Gamer
AMD Ryzen 9 7950X, NVIDIA GeForce RTX 4070
187.8 (2.92min, 200P1) fps +4%
Asus ROG Zephyrus M16 GU603Z
Intel Core i9-12900H, NVIDIA GeForce RTX 3070 Ti Laptop GPU
183.9 (3.13min, 142.9P1) fps +1%
Razer Blade 16 2024, RTX 4090
Intel Core i9-14900HX, NVIDIA GeForce RTX 4090 Laptop GPU
183.7 (1.84min, 76.9P1) fps +1%
Maingear ML-16 MK2
Intel Core Ultra 7 155H, NVIDIA GeForce RTX 4070 Laptop GPU
181.3 (2.62min, 111.1P1) fps
Asus TUF Gaming A16 FA617XS
AMD Ryzen 9 7940HS, AMD Radeon RX 7600S
180.8 (2.93min, 142.9P1) fps 0%
HP Victus 16 (2024)
Intel Core i7-14700HX, NVIDIA GeForce RTX 4060 Laptop GPU
180.8 (2.03min, 125P1) fps 0%
Media NVIDIA GeForce RTX 4070 Laptop GPU
  (159.9 - 187.5, n=37)
179.8 fps -1%
HP Omen 16-b0085ng
Intel Core i7-11800H, NVIDIA GeForce RTX 3070 Laptop GPU
178 (3.02min, 143P1) fps -2%
CSL GameStar Notebook VenomGamer G16
AMD Ryzen 7 7735HS, AMD Radeon RX 7600M
168.4 (5.18min, 125P1) fps -7%
1920x1080 High/On (Advanced Graphics Off) AA:2xMSAA + FX AF:8x
KFA2 GeForce RTX 4070 EX Gamer
AMD Ryzen 9 7950X, NVIDIA GeForce RTX 4070
187.4 (2.62min, 166.7P1) fps +7%
Razer Blade 16 2024, RTX 4090
Intel Core i9-14900HX, NVIDIA GeForce RTX 4090 Laptop GPU
181.6 (2.3min, 90.9P1) fps +4%
HP Victus 16 (2024)
Intel Core i7-14700HX, NVIDIA GeForce RTX 4060 Laptop GPU
176.1 (3.36min, 125P1) fps +1%
Maingear ML-16 MK2
Intel Core Ultra 7 155H, NVIDIA GeForce RTX 4070 Laptop GPU
175 (2.95min, 111.1P1) fps
HP Omen 16-b0085ng
Intel Core i7-11800H, NVIDIA GeForce RTX 3070 Laptop GPU
172 (3.01min, 111P1) fps -2%
Asus TUF Gaming A16 FA617XS
AMD Ryzen 9 7940HS, AMD Radeon RX 7600S
171.7 (5.08min, 125P1) fps -2%
Media NVIDIA GeForce RTX 4070 Laptop GPU
  (134.3 - 186.4, n=55)
171.5 fps -2%
Asus ROG Zephyrus M16 GU603Z
Intel Core i9-12900H, NVIDIA GeForce RTX 3070 Ti Laptop GPU
171.4 (3.71min, 111.1P1) fps -2%
Lenovo Yoga Pro 9 16IMH9
Intel Core Ultra 9 185H, NVIDIA GeForce RTX 4070 Laptop GPU
171.4 (3.71min, 111.1P1) fps -2%
CSL GameStar Notebook VenomGamer G16
AMD Ryzen 7 7735HS, AMD Radeon RX 7600M
145.2 (7min, 83.3P1) fps -17%
1920x1080 Highest Settings possible AA:4xMSAA + FX AF:16x
KFA2 GeForce RTX 4070 EX Gamer
AMD Ryzen 9 7950X, NVIDIA GeForce RTX 4070
160.9 (3.73min, 111.1P1) fps +40%
Razer Blade 16 2024, RTX 4090
Intel Core i9-14900HX, NVIDIA GeForce RTX 4090 Laptop GPU
138.1 (4.19min, 83.3P1) fps +20%
Maingear ML-16 MK2
Intel Core Ultra 7 155H, NVIDIA GeForce RTX 4070 Laptop GPU
115.1 (3.8min, 71.4P1) fps
Media NVIDIA GeForce RTX 4070 Laptop GPU
  (48.3 - 141.6, n=61)
111.1 fps -3%
Lenovo Yoga Pro 9 16IMH9
Intel Core Ultra 9 185H, NVIDIA GeForce RTX 4070 Laptop GPU
110.9 (3.51min, 71.4P1) fps -4%
HP Victus 16 (2024)
Intel Core i7-14700HX, NVIDIA GeForce RTX 4060 Laptop GPU
110.2 (8.03min, 76.9P1) fps -4%
Asus ROG Zephyrus M16 GU603Z
Intel Core i9-12900H, NVIDIA GeForce RTX 3070 Ti Laptop GPU
108.1 (4.18min, 76.9P1) fps -6%
HP Omen 16-b0085ng
Intel Core i7-11800H, NVIDIA GeForce RTX 3070 Laptop GPU
103 (6.42min, 71.4P1) fps -11%
Asus TUF Gaming A16 FA617XS
AMD Ryzen 9 7940HS, AMD Radeon RX 7600S
92.9 (26.7min, 62.5P1) fps -19%
CSL GameStar Notebook VenomGamer G16
AMD Ryzen 7 7735HS, AMD Radeon RX 7600M
77.7 (7.64min, 50P1) fps -32%
2560x1440 Highest Settings possible AA:4xMSAA + FX AF:16x
KFA2 GeForce RTX 4070 EX Gamer
AMD Ryzen 9 7950X, NVIDIA GeForce RTX 4070
136.2 (8.88min, 90.9P1) fps +50%
Razer Blade 16 2024, RTX 4090
Intel Core i9-14900HX, NVIDIA GeForce RTX 4090 Laptop GPU
126.9 (3.16min, 83.3P1) fps +40%
Maingear ML-16 MK2
Intel Core Ultra 7 155H, NVIDIA GeForce RTX 4070 Laptop GPU
90.6 (4.99min, 55.6P1) fps
Lenovo Yoga Pro 9 16IMH9
Intel Core Ultra 9 185H, NVIDIA GeForce RTX 4070 Laptop GPU
90.4 (4.07min, 58.8P1) fps 0%
Media NVIDIA GeForce RTX 4070 Laptop GPU
  (36.9 - 102.2, n=50)
86.8 fps -4%
Dota 2 Reborn
1920x1080 high (2/3)
KFA2 GeForce RTX 4070 EX Gamer
AMD Ryzen 9 7950X, NVIDIA GeForce RTX 4070
253.4 (213.5min) fps +74%
Razer Blade 16 2024, RTX 4090
Intel Core i9-14900HX, NVIDIA GeForce RTX 4090 Laptop GPU
201 (172.2min) fps +38%
Asus ROG Zephyrus M16 GU603Z
Intel Core i9-12900H, NVIDIA GeForce RTX 3070 Ti Laptop GPU
170.2 (149.7min) fps +17%
HP Victus 16 (2024)
Intel Core i7-14700HX, NVIDIA GeForce RTX 4060 Laptop GPU
168.4 (142.9min) fps +16%
HP Victus 16-r0076TX
Intel Core i5-13500HX, NVIDIA GeForce RTX 4050 Laptop GPU
159 (132.4min) fps +9%
Media NVIDIA GeForce RTX 4070 Laptop GPU
  (88.2 - 210, n=65)
158.1 fps +9%
Lenovo Yoga Pro 9 16IMH9
Intel Core Ultra 9 185H, NVIDIA GeForce RTX 4070 Laptop GPU
148.1 (129min) fps +2%
Maingear ML-16 MK2
Intel Core Ultra 7 155H, NVIDIA GeForce RTX 4070 Laptop GPU
145.3 (120.9min) fps
HP Omen 16-b0085ng
Intel Core i7-11800H, NVIDIA GeForce RTX 3070 Laptop GPU
145 (127.4min) fps 0%
Alienware x16 R2 P120F
Intel Core Ultra 9 185H, NVIDIA GeForce RTX 4080 Laptop GPU
139.2 (114.4min) fps -4%
Asus TUF Gaming A16 FA617XS
AMD Ryzen 9 7940HS, AMD Radeon RX 7600S
132.2 (114.1min) fps -9%
Acer Nitro 16 AN16-41-R7YE
AMD Ryzen 5 7535HS, NVIDIA GeForce RTX 4050 Laptop GPU
132.1 (115.6min) fps -9%
Lenovo Legion C7 15IMH05 82EH0030GE
Intel Core i7-10875H, NVIDIA GeForce RTX 2070 Max-Q
131 (114.9min) fps -10%
CSL GameStar Notebook VenomGamer G16
AMD Ryzen 7 7735HS, AMD Radeon RX 7600M
125.7 (108.9min) fps -13%
HP Omen 16-n0033dx
AMD Ryzen 7 6800H, AMD Radeon RX 6650M
118 (102.7min) fps -19%
1920x1080 ultra (3/3) best looking
KFA2 GeForce RTX 4070 EX Gamer
AMD Ryzen 9 7950X, NVIDIA GeForce RTX 4070
238.05 (199.8min) fps +71%
Razer Blade 16 2024, RTX 4090
Intel Core i9-14900HX, NVIDIA GeForce RTX 4090 Laptop GPU
188.1 (155.2min) fps +35%
Asus ROG Zephyrus M16 GU603Z
Intel Core i9-12900H, NVIDIA GeForce RTX 3070 Ti Laptop GPU
160.5 (140.4min) fps +15%
HP Victus 16 (2024)
Intel Core i7-14700HX, NVIDIA GeForce RTX 4060 Laptop GPU
149.7 (130.4min) fps +8%
Media NVIDIA GeForce RTX 4070 Laptop GPU
  (89.7 - 191.2, n=65)
147.9 fps +6%
HP Victus 16-r0076TX
Intel Core i5-13500HX, NVIDIA GeForce RTX 4050 Laptop GPU
145 (125.6min) fps +4%
Maingear ML-16 MK2
Intel Core Ultra 7 155H, NVIDIA GeForce RTX 4070 Laptop GPU
139.2 (117.8min) fps
Lenovo Yoga Pro 9 16IMH9
Intel Core Ultra 9 185H, NVIDIA GeForce RTX 4070 Laptop GPU
139 (119.7min) fps 0%
HP Omen 16-b0085ng
Intel Core i7-11800H, NVIDIA GeForce RTX 3070 Laptop GPU
137 (118.7min) fps -2%
Alienware x16 R2 P120F
Intel Core Ultra 9 185H, NVIDIA GeForce RTX 4080 Laptop GPU
133 (114.6min) fps -4%
Acer Nitro 16 AN16-41-R7YE
AMD Ryzen 5 7535HS, NVIDIA GeForce RTX 4050 Laptop GPU
125.2 (109.9min) fps -10%
Lenovo Legion C7 15IMH05 82EH0030GE
Intel Core i7-10875H, NVIDIA GeForce RTX 2070 Max-Q
125 (108.6min) fps -10%
Asus TUF Gaming A16 FA617XS
AMD Ryzen 9 7940HS, AMD Radeon RX 7600S
121.6 (100.8min) fps -13%
CSL GameStar Notebook VenomGamer G16
AMD Ryzen 7 7735HS, AMD Radeon RX 7600M
113 (96.3min) fps -19%
HP Omen 16-n0033dx
AMD Ryzen 7 6800H, AMD Radeon RX 6650M
100 (82.7min) fps -28%
Final Fantasy XV Benchmark
1920x1080 Standard Quality
KFA2 GeForce RTX 4070 EX Gamer
AMD Ryzen 9 7950X, NVIDIA GeForce RTX 4070
236 fps +61%
Alienware x16 R2 P120F
Intel Core Ultra 9 185H, NVIDIA GeForce RTX 4080 Laptop GPU
169.3 fps +16%
Lenovo Yoga Pro 9 16IMH9
Intel Core Ultra 9 185H, NVIDIA GeForce RTX 4070 Laptop GPU
156.2 fps +7%
Razer Blade 16 2024, RTX 4090
Intel Core i9-14900HX, NVIDIA GeForce RTX 4090 Laptop GPU
155.7 fps +6%
Media NVIDIA GeForce RTX 4070 Laptop GPU
  (84 - 185.9, n=55)
152.3 fps +4%
Maingear ML-16 MK2
Intel Core Ultra 7 155H, NVIDIA GeForce RTX 4070 Laptop GPU
146.3 fps
HP Victus 16 (2024)
Intel Core i7-14700HX, NVIDIA GeForce RTX 4060 Laptop GPU
135.3 fps -8%
Asus ROG Zephyrus M16 GU603Z
Intel Core i9-12900H, NVIDIA GeForce RTX 3070 Ti Laptop GPU
123.8 fps -15%
HP Victus 16-r0076TX
Intel Core i5-13500HX, NVIDIA GeForce RTX 4050 Laptop GPU
120.3 fps -18%
Asus TUF Gaming A16 FA617XS
AMD Ryzen 9 7940HS, AMD Radeon RX 7600S
117.2 fps -20%
Acer Nitro 16 AN16-41-R7YE
AMD Ryzen 5 7535HS, NVIDIA GeForce RTX 4050 Laptop GPU
116.2 fps -21%
HP Omen 16-n0033dx
AMD Ryzen 7 6800H, AMD Radeon RX 6650M
113.3 fps -23%
CSL GameStar Notebook VenomGamer G16
AMD Ryzen 7 7735HS, AMD Radeon RX 7600M
102.3 fps -30%
1920x1080 High Quality
KFA2 GeForce RTX 4070 EX Gamer
AMD Ryzen 9 7950X, NVIDIA GeForce RTX 4070
182.6 fps +65%
Alienware x16 R2 P120F
Intel Core Ultra 9 185H, NVIDIA GeForce RTX 4080 Laptop GPU
139.8 fps +26%
Razer Blade 16 2024, RTX 4090
Intel Core i9-14900HX, NVIDIA GeForce RTX 4090 Laptop GPU
137.5 fps +24%
Lenovo Yoga Pro 9 16IMH9
Intel Core Ultra 9 185H, NVIDIA GeForce RTX 4070 Laptop GPU
115.7 fps +5%
Media NVIDIA GeForce RTX 4070 Laptop GPU
  (41 - 131.9, n=63)
110.9 fps 0%
Maingear ML-16 MK2
Intel Core Ultra 7 155H, NVIDIA GeForce RTX 4070 Laptop GPU
110.6 fps
HP Victus 16 (2024)
Intel Core i7-14700HX, NVIDIA GeForce RTX 4060 Laptop GPU
98.1 fps -11%
Asus ROG Zephyrus M16 GU603Z
Intel Core i9-12900H, NVIDIA GeForce RTX 3070 Ti Laptop GPU
94.8 fps -14%
Asus TUF Gaming A16 FA617XS
AMD Ryzen 9 7940HS, AMD Radeon RX 7600S
85.2 fps -23%
HP Victus 16-r0076TX
Intel Core i5-13500HX, NVIDIA GeForce RTX 4050 Laptop GPU
84.8 fps -23%
Acer Nitro 16 AN16-41-R7YE
AMD Ryzen 5 7535HS, NVIDIA GeForce RTX 4050 Laptop GPU
83.5 fps -25%
HP Omen 16-n0033dx
AMD Ryzen 7 6800H, AMD Radeon RX 6650M
83.2 fps -25%
CSL GameStar Notebook VenomGamer G16
AMD Ryzen 7 7735HS, AMD Radeon RX 7600M
70.3 fps -36%
2560x1440 High Quality
KFA2 GeForce RTX 4070 EX Gamer
AMD Ryzen 9 7950X, NVIDIA GeForce RTX 4070
135.2 fps +69%
Razer Blade 16 2024, RTX 4090
Intel Core i9-14900HX, NVIDIA GeForce RTX 4090 Laptop GPU
126.8 fps +59%
Alienware x16 R2 P120F
Intel Core Ultra 9 185H, NVIDIA GeForce RTX 4080 Laptop GPU
120.8 fps +51%
Lenovo Yoga Pro 9 16IMH9
Intel Core Ultra 9 185H, NVIDIA GeForce RTX 4070 Laptop GPU
85.6 fps +7%
Media NVIDIA GeForce RTX 4070 Laptop GPU
  (32.5 - 119.9, n=56)
82.4 fps +3%
Maingear ML-16 MK2
Intel Core Ultra 7 155H, NVIDIA GeForce RTX 4070 Laptop GPU
80 fps
Asus ROG Zephyrus M16 GU603Z
Intel Core i9-12900H, NVIDIA GeForce RTX 3070 Ti Laptop GPU
72.1 fps -10%
X-Plane 11.11
1920x1080 med (fps_test=2)
KFA2 GeForce RTX 4070 EX Gamer
AMD Ryzen 9 7950X, NVIDIA GeForce RTX 4070
189.1 fps +52%
Razer Blade 16 2024, RTX 4090
Intel Core i9-14900HX, NVIDIA GeForce RTX 4090 Laptop GPU
182.3 fps +47%
Asus ROG Zephyrus M16 GU603Z
Intel Core i9-12900H, NVIDIA GeForce RTX 3070 Ti Laptop GPU
145.7 fps +17%
HP Victus 16-r0076TX
Intel Core i5-13500HX, NVIDIA GeForce RTX 4050 Laptop GPU
138.8 fps +12%
Media NVIDIA GeForce RTX 4070 Laptop GPU
  (74.7 - 191.1, n=65)
132.5 fps +7%
HP Victus 16 (2024)
Intel Core i7-14700HX, NVIDIA GeForce RTX 4060 Laptop GPU
129.2 fps +4%
Maingear ML-16 MK2
Intel Core Ultra 7 155H, NVIDIA GeForce RTX 4070 Laptop GPU
124.4 fps
HP Omen 16-b0085ng
Intel Core i7-11800H, NVIDIA GeForce RTX 3070 Laptop GPU
121 fps -3%
Lenovo Yoga Pro 9 16IMH9
Intel Core Ultra 9 185H, NVIDIA GeForce RTX 4070 Laptop GPU
118.7 fps -5%
Alienware x16 R2 P120F
Intel Core Ultra 9 185H, NVIDIA GeForce RTX 4080 Laptop GPU
117.4 fps -6%
Acer Nitro 16 AN16-41-R7YE
AMD Ryzen 5 7535HS, NVIDIA GeForce RTX 4050 Laptop GPU
101.6 fps -18%
Lenovo Legion C7 15IMH05 82EH0030GE
Intel Core i7-10875H, NVIDIA GeForce RTX 2070 Max-Q
101 fps -19%
CSL GameStar Notebook VenomGamer G16
AMD Ryzen 7 7735HS, AMD Radeon RX 7600M
76 fps -39%
Asus TUF Gaming A16 FA617XS
AMD Ryzen 9 7940HS, AMD Radeon RX 7600S
72 fps -42%
HP Omen 16-n0033dx
AMD Ryzen 7 6800H, AMD Radeon RX 6650M
52.7 fps -58%
1920x1080 high (fps_test=3)
KFA2 GeForce RTX 4070 EX Gamer
AMD Ryzen 9 7950X, NVIDIA GeForce RTX 4070
150 fps +67%
Razer Blade 16 2024, RTX 4090
Intel Core i9-14900HX, NVIDIA GeForce RTX 4090 Laptop GPU
146.2 fps +63%
Asus ROG Zephyrus M16 GU603Z
Intel Core i9-12900H, NVIDIA GeForce RTX 3070 Ti Laptop GPU
115 fps +28%
HP Victus 16-r0076TX
Intel Core i5-13500HX, NVIDIA GeForce RTX 4050 Laptop GPU
106.5 fps +19%
Media NVIDIA GeForce RTX 4070 Laptop GPU
  (52.1 - 147.9, n=67)
104.4 fps +16%
HP Victus 16 (2024)
Intel Core i7-14700HX, NVIDIA GeForce RTX 4060 Laptop GPU
100.3 fps +12%
HP Omen 16-b0085ng
Intel Core i7-11800H, NVIDIA GeForce RTX 3070 Laptop GPU
96.7 fps +8%
Lenovo Yoga Pro 9 16IMH9
Intel Core Ultra 9 185H, NVIDIA GeForce RTX 4070 Laptop GPU
90.5 fps +1%
Maingear ML-16 MK2
Intel Core Ultra 7 155H, NVIDIA GeForce RTX 4070 Laptop GPU
89.8 fps
Alienware x16 R2 P120F
Intel Core Ultra 9 185H, NVIDIA GeForce RTX 4080 Laptop GPU
89.3 fps -1%
Lenovo Legion C7 15IMH05 82EH0030GE
Intel Core i7-10875H, NVIDIA GeForce RTX 2070 Max-Q
84.4 fps -6%
Acer Nitro 16 AN16-41-R7YE
AMD Ryzen 5 7535HS, NVIDIA GeForce RTX 4050 Laptop GPU
81.4 fps -9%
CSL GameStar Notebook VenomGamer G16
AMD Ryzen 7 7735HS, AMD Radeon RX 7600M
62.1 fps -31%
Asus TUF Gaming A16 FA617XS
AMD Ryzen 9 7940HS, AMD Radeon RX 7600S
57.3 fps -36%
HP Omen 16-n0033dx
AMD Ryzen 7 6800H, AMD Radeon RX 6650M
46.4 fps -48%
Far Cry 5
1920x1080 High Preset AA:T
KFA2 GeForce RTX 4070 EX Gamer
AMD Ryzen 9 7950X, NVIDIA GeForce RTX 4070
204 (158min) fps +63%
Media NVIDIA GeForce RTX 4070 Laptop GPU
  (98 - 170, n=35)
135.9 fps +9%
Razer Blade 16 2024, RTX 4090
Intel Core i9-14900HX, NVIDIA GeForce RTX 4090 Laptop GPU
134 fps +7%
Lenovo Yoga Pro 9 16IMH9
Intel Core Ultra 9 185H, NVIDIA GeForce RTX 4070 Laptop GPU
130 fps +4%
Asus ROG Zephyrus M16 GU603Z
Intel Core i9-12900H, NVIDIA GeForce RTX 3070 Ti Laptop GPU
128 fps +2%
Maingear ML-16 MK2
Intel Core Ultra 7 155H, NVIDIA GeForce RTX 4070 Laptop GPU
125 (95min) fps
HP Omen 16-b0085ng
Intel Core i7-11800H, NVIDIA GeForce RTX 3070 Laptop GPU
123 fps -2%
Alienware x16 R2 P120F
Intel Core Ultra 9 185H, NVIDIA GeForce RTX 4080 Laptop GPU
122 (97min) fps -2%
Asus TUF Gaming A16 FA617XS
AMD Ryzen 9 7940HS, AMD Radeon RX 7600S
115 (88min) fps -8%
HP Victus 16-r0076TX
Intel Core i5-13500HX, NVIDIA GeForce RTX 4050 Laptop GPU
110 (88min) fps -12%
CSL GameStar Notebook VenomGamer G16
AMD Ryzen 7 7735HS, AMD Radeon RX 7600M
110 (89min) fps -12%
Acer Nitro 16 AN16-41-R7YE
AMD Ryzen 5 7535HS, NVIDIA GeForce RTX 4050 Laptop GPU
108 (82min) fps -14%
Lenovo Legion C7 15IMH05 82EH0030GE
Intel Core i7-10875H, NVIDIA GeForce RTX 2070 Max-Q
105 (87min) fps -16%
1920x1080 Ultra Preset AA:T
KFA2 GeForce RTX 4070 EX Gamer
AMD Ryzen 9 7950X, NVIDIA GeForce RTX 4070
189 (137min) fps +66%
Media NVIDIA GeForce RTX 4070 Laptop GPU
  (92 - 158, n=36)
127.3 fps +12%
Razer Blade 16 2024, RTX 4090
Intel Core i9-14900HX, NVIDIA GeForce RTX 4090 Laptop GPU
127 fps +11%
Asus ROG Zephyrus M16 GU603Z
Intel Core i9-12900H, NVIDIA GeForce RTX 3070 Ti Laptop GPU
124 fps +9%
Lenovo Yoga Pro 9 16IMH9
Intel Core Ultra 9 185H, NVIDIA GeForce RTX 4070 Laptop GPU
116 fps +2%
HP Omen 16-b0085ng
Intel Core i7-11800H, NVIDIA GeForce RTX 3070 Laptop GPU
115 fps +1%
Alienware x16 R2 P120F
Intel Core Ultra 9 185H, NVIDIA GeForce RTX 4080 Laptop GPU
114 (89min) fps 0%
Maingear ML-16 MK2
Intel Core Ultra 7 155H, NVIDIA GeForce RTX 4070 Laptop GPU
114 (87min) fps
HP Victus 16-r0076TX
Intel Core i5-13500HX, NVIDIA GeForce RTX 4050 Laptop GPU
109 (84min) fps -4%
Asus TUF Gaming A16 FA617XS
AMD Ryzen 9 7940HS, AMD Radeon RX 7600S
108 (77min) fps -5%
CSL GameStar Notebook VenomGamer G16
AMD Ryzen 7 7735HS, AMD Radeon RX 7600M
103 (82min) fps -10%
Acer Nitro 16 AN16-41-R7YE
AMD Ryzen 5 7535HS, NVIDIA GeForce RTX 4050 Laptop GPU
102 (70min) fps -11%
Lenovo Legion C7 15IMH05 82EH0030GE
Intel Core i7-10875H, NVIDIA GeForce RTX 2070 Max-Q
99 (89min) fps -13%
2560x1440 Ultra Preset AA:T
KFA2 GeForce RTX 4070 EX Gamer
AMD Ryzen 9 7950X, NVIDIA GeForce RTX 4070
171 (138min) fps +69%
Razer Blade 16 2024, RTX 4090
Intel Core i9-14900HX, NVIDIA GeForce RTX 4090 Laptop GPU
125 fps +24%
Alienware x16 R2 P120F
Intel Core Ultra 9 185H, NVIDIA GeForce RTX 4080 Laptop GPU
114 (84min) fps +13%
Lenovo Yoga Pro 9 16IMH9
Intel Core Ultra 9 185H, NVIDIA GeForce RTX 4070 Laptop GPU
109 fps +8%
Media NVIDIA GeForce RTX 4070 Laptop GPU
  (79 - 128, n=33)
108.9 fps +8%
Maingear ML-16 MK2
Intel Core Ultra 7 155H, NVIDIA GeForce RTX 4070 Laptop GPU
101 (82min) fps
Asus ROG Zephyrus M16 GU603Z
Intel Core i9-12900H, NVIDIA GeForce RTX 3070 Ti Laptop GPU
90 fps -11%
Strange Brigade
1920x1080 high AA:high AF:8
KFA2 GeForce RTX 4070 EX Gamer
AMD Ryzen 9 7950X, NVIDIA GeForce RTX 4070
376 (50.3min, 269P1) fps +68%
Razer Blade 16 2024, RTX 4090
Intel Core i9-14900HX, NVIDIA GeForce RTX 4090 Laptop GPU
368 (5min, 238P1) fps +64%
Alienware x16 R2 P120F
Intel Core Ultra 9 185H, NVIDIA GeForce RTX 4080 Laptop GPU
317 (105.9min, 203P1) fps +42%
Lenovo Yoga Pro 9 16IMH9
Intel Core Ultra 9 185H, NVIDIA GeForce RTX 4070 Laptop GPU
244 fps +9%
Media NVIDIA GeForce RTX 4070 Laptop GPU
  (136.6 - 268, n=54)
227 fps +1%
Maingear ML-16 MK2
Intel Core Ultra 7 155H, NVIDIA GeForce RTX 4070 Laptop GPU
224 (160.9min, 169.3P1) fps
HP Omen 16-b0085ng
Intel Core i7-11800H, NVIDIA GeForce RTX 3070 Laptop GPU
205 (42.7min, 153P1) fps -8%
HP Victus 16 (2024)
Intel Core i7-14700HX, NVIDIA GeForce RTX 4060 Laptop GPU
205 (68.3min, 145.6P1) fps -8%
Asus TUF Gaming A16 FA617XS
AMD Ryzen 9 7940HS, AMD Radeon RX 7600S
190.8 (17.3min, 137P1) fps -15%
HP Omen 16-n0033dx
AMD Ryzen 7 6800H, AMD Radeon RX 6650M
190 (123.2min, 140.4P1) fps -15%
Asus ROG Zephyrus M16 GU603Z
Intel Core i9-12900H, NVIDIA GeForce RTX 3070 Ti Laptop GPU
187.9 (72.5min, 138.2P1) fps -16%
CSL GameStar Notebook VenomGamer G16
AMD Ryzen 7 7735HS, AMD Radeon RX 7600M
185 (122.6min, 138.3P1) fps -17%
HP Victus 16-r0076TX
Intel Core i5-13500HX, NVIDIA GeForce RTX 4050 Laptop GPU
171.8 (75.5min, 130.9P1) fps -23%
Acer Nitro 16 AN16-41-R7YE
AMD Ryzen 5 7535HS, NVIDIA GeForce RTX 4050 Laptop GPU
169.3 (91.4min, 130.3P1) fps -24%
1920x1080 ultra AA:ultra AF:16
Razer Blade 16 2024, RTX 4090
Intel Core i9-14900HX, NVIDIA GeForce RTX 4090 Laptop GPU
359.8 (30.2min, 253P1) fps +87%
KFA2 GeForce RTX 4070 EX Gamer
AMD Ryzen 9 7950X, NVIDIA GeForce RTX 4070
322 (130.7min, 237P1) fps +67%
Alienware x16 R2 P120F
Intel Core Ultra 9 185H, NVIDIA GeForce RTX 4080 Laptop GPU
293 (38.3min, 184.1P1) fps +52%
Lenovo Yoga Pro 9 16IMH9
Intel Core Ultra 9 185H, NVIDIA GeForce RTX 4070 Laptop GPU
213 fps +10%
Media NVIDIA GeForce RTX 4070 Laptop GPU
  (76.3 - 234, n=62)
196.3 fps +2%
Maingear ML-16 MK2
Intel Core Ultra 7 155H, NVIDIA GeForce RTX 4070 Laptop GPU
192.8 (84.3min, 146.7P1) fps
HP Victus 16 (2024)
Intel Core i7-14700HX, NVIDIA GeForce RTX 4060 Laptop GPU
179 (76.4min, 130.3P1) fps -7%
HP Omen 16-b0085ng
Intel Core i7-11800H, NVIDIA GeForce RTX 3070 Laptop GPU
178 (45.3min, 135P1) fps -8%
HP Omen 16-n0033dx
AMD Ryzen 7 6800H, AMD Radeon RX 6650M
167.2 (61.1min, 120.8P1) fps -13%
Asus ROG Zephyrus M16 GU603Z
Intel Core i9-12900H, NVIDIA GeForce RTX 3070 Ti Laptop GPU
163.8 (35.9min, 125.2P1) fps -15%
Asus TUF Gaming A16 FA617XS
AMD Ryzen 9 7940HS, AMD Radeon RX 7600S
163.3 (16.3min, 119.3P1) fps -15%
CSL GameStar Notebook VenomGamer G16
AMD Ryzen 7 7735HS, AMD Radeon RX 7600M
157.2 (109min, 117.9P1) fps -18%
HP Victus 16-r0076TX
Intel Core i5-13500HX, NVIDIA GeForce RTX 4050 Laptop GPU
149.3 (13.3min, 115.1P1) fps -23%
Acer Nitro 16 AN16-41-R7YE
AMD Ryzen 5 7535HS, NVIDIA GeForce RTX 4050 Laptop GPU
146.8 (93.6min, 114.3P1) fps -24%
2560x1440 ultra AA:ultra AF:16
Razer Blade 16 2024, RTX 4090
Intel Core i9-14900HX, NVIDIA GeForce RTX 4090 Laptop GPU
279 (62.1min, 203P1) fps +118%
Alienware x16 R2 P120F
Intel Core Ultra 9 185H, NVIDIA GeForce RTX 4080 Laptop GPU
226 (45.4min, 170.9P1) fps +77%
KFA2 GeForce RTX 4070 EX Gamer
AMD Ryzen 9 7950X, NVIDIA GeForce RTX 4070
222 (48.6min, 176.9P1) fps +74%
Lenovo Yoga Pro 9 16IMH9
Intel Core Ultra 9 185H, NVIDIA GeForce RTX 4070 Laptop GPU
139 fps +9%
Media NVIDIA GeForce RTX 4070 Laptop GPU
  (52.8 - 150.9, n=54)
130.2 fps +2%
Maingear ML-16 MK2
Intel Core Ultra 7 155H, NVIDIA GeForce RTX 4070 Laptop GPU
127.9 (103.7min, 105.8P1) fps
Tiny Tina's Wonderlands
1920x1080 High Preset (DX12)
KFA2 GeForce RTX 4070 EX Gamer
AMD Ryzen 9 7950X, NVIDIA GeForce RTX 4070
196 fps +64%
Alienware x16 R2 P120F
Intel Core Ultra 9 185H, NVIDIA GeForce RTX 4080 Laptop GPU
166.7 fps +40%
Media NVIDIA GeForce RTX 4070 Laptop GPU
  (74.3 - 151.4, n=13)
129.6 fps +9%
Maingear ML-16 MK2
Intel Core Ultra 7 155H, NVIDIA GeForce RTX 4070 Laptop GPU
119.4 fps
Asus TUF Gaming A16 FA617XS
AMD Ryzen 9 7940HS, AMD Radeon RX 7600S
105.7 fps -11%
1920x1080 Badass Preset (DX12)
KFA2 GeForce RTX 4070 EX Gamer
AMD Ryzen 9 7950X, NVIDIA GeForce RTX 4070
153.9 fps +66%
Alienware x16 R2 P120F
Intel Core Ultra 9 185H, NVIDIA GeForce RTX 4080 Laptop GPU
144.5 fps +56%
Media NVIDIA GeForce RTX 4070 Laptop GPU
  (58.6 - 115.9, n=16)
99.9 fps +8%
Maingear ML-16 MK2
Intel Core Ultra 7 155H, NVIDIA GeForce RTX 4070 Laptop GPU
92.9 fps
Asus TUF Gaming A16 FA617XS
AMD Ryzen 9 7940HS, AMD Radeon RX 7600S
82.2 fps -12%
2560x1440 Badass Preset (DX12)
KFA2 GeForce RTX 4070 EX Gamer
AMD Ryzen 9 7950X, NVIDIA GeForce RTX 4070
106.9 fps +70%
Alienware x16 R2 P120F
Intel Core Ultra 9 185H, NVIDIA GeForce RTX 4080 Laptop GPU
99 fps +58%
Media NVIDIA GeForce RTX 4070 Laptop GPU
  (49.8 - 79.5, n=16)
69.6 fps +11%
Maingear ML-16 MK2
Intel Core Ultra 7 155H, NVIDIA GeForce RTX 4070 Laptop GPU
62.7 fps
F1 22
1920x1080 High Preset AA:T AF:16x
KFA2 GeForce RTX 4070 EX Gamer
AMD Ryzen 9 7950X, NVIDIA GeForce RTX 4070
309 (262min, 183P1) fps +50%
Maingear ML-16 MK2
Intel Core Ultra 7 155H, NVIDIA GeForce RTX 4070 Laptop GPU
206 (165min, 130P1) fps
Media NVIDIA GeForce RTX 4070 Laptop GPU
  (109 - 245, n=31)
190.1 fps -8%
Asus TUF Gaming A16 FA617XS
AMD Ryzen 9 7940HS, AMD Radeon RX 7600S
190 (164min, 130P1) fps -8%
Alienware x16 R2 P120F
Intel Core Ultra 9 185H, NVIDIA GeForce RTX 4080 Laptop GPU
185.7 (5min, 132P1) fps -10%
HP Omen 16-n0033dx
AMD Ryzen 7 6800H, AMD Radeon RX 6650M
178.2 (151min, 121P1) fps -13%
Acer Nitro 16 AN16-41-R7YE
AMD Ryzen 5 7535HS, NVIDIA GeForce RTX 4050 Laptop GPU
166.8 (144min, 110P1) fps -19%
HP Victus 16-r0076TX
Intel Core i5-13500HX, NVIDIA GeForce RTX 4050 Laptop GPU
154.4 (135min, 87P1) fps -25%
1920x1080 Ultra High Preset AA:T AF:16x
KFA2 GeForce RTX 4070 EX Gamer
AMD Ryzen 9 7950X, NVIDIA GeForce RTX 4070
113.3 (99min, 92P1) fps +64%
Alienware x16 R2 P120F
Intel Core Ultra 9 185H, NVIDIA GeForce RTX 4080 Laptop GPU
108.5 (86min, 76P1) fps +57%
Media NVIDIA GeForce RTX 4070 Laptop GPU
  (39.2 - 88.7, n=31)
73.8 fps +7%
Maingear ML-16 MK2
Intel Core Ultra 7 155H, NVIDIA GeForce RTX 4070 Laptop GPU
69.2 (59min, 58P1) fps
HP Victus 16-r0076TX
Intel Core i5-13500HX, NVIDIA GeForce RTX 4050 Laptop GPU
54.1 (45min, 37P1) fps -22%
Acer Nitro 16 AN16-41-R7YE
AMD Ryzen 5 7535HS, NVIDIA GeForce RTX 4050 Laptop GPU
52.9 (43min, 44P1) fps -24%
Asus TUF Gaming A16 FA617XS
AMD Ryzen 9 7940HS, AMD Radeon RX 7600S
50.5 (36min, 36P1) fps -27%
HP Omen 16-n0033dx
AMD Ryzen 7 6800H, AMD Radeon RX 6650M
40.6 (31min, 31P1) fps -41%
2560x1440 Ultra High Preset AA:T AF:16x
KFA2 GeForce RTX 4070 EX Gamer
AMD Ryzen 9 7950X, NVIDIA GeForce RTX 4070
73.7 (63min, 62P1) fps +72%
Alienware x16 R2 P120F
Intel Core Ultra 9 185H, NVIDIA GeForce RTX 4080 Laptop GPU
65.6 (56P1) fps +53%
Media NVIDIA GeForce RTX 4070 Laptop GPU
  (10.6 - 58.8, n=30)
47.4 fps +10%
Maingear ML-16 MK2
Intel Core Ultra 7 155H, NVIDIA GeForce RTX 4070 Laptop GPU
42.9 (36min, 35P1) fps
Cyberpunk 2077 2.1 Phantom Liberty
1920x1080 Medium Preset (FSR off)
Alienware x16 R2 P120F
Intel Core Ultra 9 185H, NVIDIA GeForce RTX 4080 Laptop GPU
118.7 (9.5min) fps +12%
Media NVIDIA GeForce RTX 4070 Laptop GPU
  (81.6 - 124.5, n=28)
108.6 fps +2%
Lenovo Yoga Pro 9 16IMH9
Intel Core Ultra 9 185H, NVIDIA GeForce RTX 4070 Laptop GPU
106.8 (53.2min) fps +1%
Maingear ML-16 MK2
Intel Core Ultra 7 155H, NVIDIA GeForce RTX 4070 Laptop GPU
106.1 (91.6min) fps
HP Victus 16 (2024)
Intel Core i7-14700HX, NVIDIA GeForce RTX 4060 Laptop GPU
90 (47.2min) fps -15%
CSL GameStar Notebook VenomGamer G16
AMD Ryzen 7 7735HS, AMD Radeon RX 7600M
73.8 (50min) fps -30%
1920x1080 High Preset (FSR off)
Alienware x16 R2 P120F
Intel Core Ultra 9 185H, NVIDIA GeForce RTX 4080 Laptop GPU
109 (41min) fps +24%
Media NVIDIA GeForce RTX 4070 Laptop GPU
  (74.7 - 103.6, n=29)
92.1 fps +5%
Lenovo Yoga Pro 9 16IMH9
Intel Core Ultra 9 185H, NVIDIA GeForce RTX 4070 Laptop GPU
90.5 (40.2min) fps +3%
Maingear ML-16 MK2
Intel Core Ultra 7 155H, NVIDIA GeForce RTX 4070 Laptop GPU
88.1 (75min) fps
HP Victus 16 (2024)
Intel Core i7-14700HX, NVIDIA GeForce RTX 4060 Laptop GPU
76.9 (24min) fps -13%
CSL GameStar Notebook VenomGamer G16
AMD Ryzen 7 7735HS, AMD Radeon RX 7600M
62.3 (40min) fps -29%
1920x1080 Ultra Preset (FSR off)
Alienware x16 R2 P120F
Intel Core Ultra 9 185H, NVIDIA GeForce RTX 4080 Laptop GPU
99.7 (13.5min) fps +30%
Razer Blade 16 2024, RTX 4090
Intel Core i9-14900HX, NVIDIA GeForce RTX 4090 Laptop GPU
95.35 (70.51min) fps +25%
Media NVIDIA GeForce RTX 4070 Laptop GPU
  (30.7 - 90.7, n=36)
79.1 fps +4%
Lenovo Yoga Pro 9 16IMH9
Intel Core Ultra 9 185H, NVIDIA GeForce RTX 4070 Laptop GPU
76.9 (18min) fps +1%
Maingear ML-16 MK2
Intel Core Ultra 7 155H, NVIDIA GeForce RTX 4070 Laptop GPU
76.4 (63.2min) fps
HP Victus 16 (2024)
Intel Core i7-14700HX, NVIDIA GeForce RTX 4060 Laptop GPU
67.1 (20.8min) fps -12%
CSL GameStar Notebook VenomGamer G16
AMD Ryzen 7 7735HS, AMD Radeon RX 7600M
57.1 (39min) fps -25%
2560x1440 Ultra Preset (FSR off)
Razer Blade 16 2024, RTX 4090
Intel Core i9-14900HX, NVIDIA GeForce RTX 4090 Laptop GPU
83.39 (67.14min) fps +88%
Alienware x16 R2 P120F
Intel Core Ultra 9 185H, NVIDIA GeForce RTX 4080 Laptop GPU
75.4 (25.4min) fps +70%
Media NVIDIA GeForce RTX 4070 Laptop GPU
  (24.8 - 57.1, n=34)
49 fps +11%
Lenovo Yoga Pro 9 16IMH9
Intel Core Ultra 9 185H, NVIDIA GeForce RTX 4070 Laptop GPU
47.8 (31.2min) fps +8%
Maingear ML-16 MK2
Intel Core Ultra 7 155H, NVIDIA GeForce RTX 4070 Laptop GPU
44.3 (37.2min) fps
CSL GameStar Notebook VenomGamer G16
AMD Ryzen 7 7735HS, AMD Radeon RX 7600M
36.6 (28min) fps -17%

Cyberpunk 2077 ultra FPS Chart

0510152025303540455055606570Tooltip
Maingear ML-16 MK2 Ultra 7 155H, NVIDIA GeForce RTX 4070 Laptop GPU: Ø69.5 (62.8-72.4)
bassomedioaltoultraQHD
GTA V (2015) 183.3 180.4 175 115.1 90.6
Dota 2 Reborn (2015) 173.4 152.8 145.3 139.2
Final Fantasy XV Benchmark (2018) 187.6 146.3 110.6 80
X-Plane 11.11 (2018) 139.9 124.4 89.8
Far Cry 5 (2018) 125 125 114 101
Strange Brigade (2018) 477 284 224 192.8 127.9
Tiny Tina's Wonderlands (2022) 218.7 180.9 119.4 92.9 62.7
F1 22 (2022) 252 250 206 69.2 42.9
Baldur's Gate 3 (2023) 152 125.9 108.2 106.8 70.6
Cyberpunk 2077 2.1 Phantom Liberty (2023) 130 106.1 88.1 76.4 44.3

Emissioni - Calde e rumorose

Rumore del sistema

Il rumore della ventola durante la navigazione o lo streaming video tende a raggiungere i 27 dB(A) contro uno sfondo silenzioso di 23 dB(A), per essere percepibile ma tollerabile quando si imposta la modalità Quiet. Se si gioca in modalità Performance, il rumore della ventola diventa molto forte, con un valore di poco superiore a 55 dB(A), più forte di quello di concorrenti come Victus 16, Alienware x16 R2o Legion Pro 5 16. Abilitando il rumore massimo della ventola, il rumore della ventola aumenterebbe ulteriormente fino a quasi 58 dB(A).

La soluzione di raffreddamento consiste in due ventole da ~50 mm e 4 tubi di calore in rame
Possiamo notare un leggerissimo rumore elettronico o un fruscio della bobina dalla nostra unità di prova
Soluzione di raffreddamento asimmetrica a differenza della maggior parte degli altri portatili da gioco
Slot accessibili 2x DDR5 SODIMM
Profilo del rumore del ventilatore (Bianco: Sfondo, Rosso: Sistema inattivo, Blu: 3DMark 06, Arancione: Cyberpunk 2077 stress, Verde: Prime95+FurMark stress Modalità ventola massima)

Rumorosità

Idle
24.1 / 24.1 / 25.6 dB(A)
Sotto carico
44.3 / 57.8 dB(A)
  red to green bar
 
 
30 dB
silenzioso
40 dB(A)
udibile
50 dB(A)
rumoroso
 
min: dark, med: mid, max: light   Earthworks M23R, Arta (15 cm di distanza)   Rumorosità ambientale: 23 dB(A)
dB(A) 0102030405060708090Deep BassMiddle BassHigh BassLower RangeMidsHigher MidsLower HighsMid HighsUpper HighsSuper Highs2038.435.332.831.640.42528.73226.12232.13127.525.325.820.127.44026.421.521.618.125.45026.125.220.719.223.96328.528.526.41727.88027.824.220.918.226.410030.221.618.515.827.812527.12319.119.629.716029.324.114.813.530.220031.724.414.713.331.225034.327.214.413.335.331535.228.81713.936.840038.329.815.511.94050039.432.113.711.241.763038.13013.69.639.580039.631.511.29.441.1100041.632.3109.343.412504332.59.89.245.1160043.932.9109.445.9200044.834.210.39.947.3250047.635.311.310.449.9315046.635.811.810.649.2400043.731.411.711.346.2500041.228.112.112.143.9630039.62712.311.842.8800041.127.712.411.844.11000040.325.912.21243.51250037.621.112.312.441.41600032.61812.112.136.9SPL55.444.324.12357.8N104.60.50.411.7median 39.6median 28.8median 12.3median 11.8median 41.7Delta54.11.71.54.7hearing rangehide median Fan NoiseMaingear ML-16 MK2
Maingear ML-16 MK2
NVIDIA GeForce RTX 4070 Laptop GPU, Ultra 7 155H
Asus ROG Zephyrus G16 GA605WV
NVIDIA GeForce RTX 4060 Laptop GPU, Ryzen AI 9 HX 370, Micron 2400 MTFDKBA1T0QFM
HP Victus 16 (2024)
NVIDIA GeForce RTX 4060 Laptop GPU, i7-14700HX, Kioxia XG8 KXG80ZNV512G
Alienware x16 R2 P120F
NVIDIA GeForce RTX 4080 Laptop GPU, Ultra 9 185H, WDC PC SN810 1TB
Lenovo Legion Pro 5 16IRX9
NVIDIA GeForce RTX 4070 Laptop GPU, i9-14900HX, Samsung PM9A1 MZVL21T0HCLR
Razer Blade 16 2024, RTX 4090
NVIDIA GeForce RTX 4090 Laptop GPU, i9-14900HX, Samsung PM9A1 MZVL22T0HBLB
Noise
-4%
-10%
2%
-3%
3%
off /ambiente *
23
24.6
-7%
25
-9%
23.4
-2%
23.9
-4%
23
-0%
Idle Minimum *
24.1
28.6
-19%
28
-16%
23.8
1%
24.3
-1%
23
5%
Idle Average *
24.1
28.6
-19%
29
-20%
28.5
-18%
24.3
-1%
23
5%
Idle Maximum *
25.6
28.6
-12%
33
-29%
28.5
-11%
28.9
-13%
27.66
-8%
Load Average *
44.3
42.8
3%
45
-2%
28.8
35%
45.8
-3%
43.76
1%
Cyberpunk 2077 ultra *
55.4
48.3
13%
Load Maximum *
57.8
48.3
16%
48
17%
54.2
6%
56.6
2%
50.37
13%
Witcher 3 ultra *
43
49.5
51
46.81

* ... Meglio usare valori piccoli

Temperatura

Le temperature di funzionamento molto calde, come menzionato in precedenza, portano a temperature superficiali più calde della media. I punti caldi durante il gioco possono raggiungere oltre 54 C e 56 C sulla parte superiore e inferiore, rispettivamente, rispetto agli appena 40 C del Blade 16 o 47 C su Legion Pro 5 16IRX9.

Inoltre, la soluzione di raffreddamento asimmetrica significa che la metà destra dello chassis o della tastiera sarà molto più calda della parte sinistra. Questo è in contrasto con la maggior parte degli altri computer portatili da gioco, dove le soluzioni di raffreddamento simmetriche sono comuni. Questo non è un grosso problema, dato che la maggior parte dei giochi utilizza solo i tasti WASD sulla metà sinistra della tastiera, ma può aspettarsi un palmo sudato se il gioco richiede input dal tastierino numerico.

Scarico posteriore
Scarico posteriore
L'adattatore CA raggiunge oltre 55 C quando si utilizzano carichi impegnativi
Carico massimo
 35.2 °C40.6 °C45.2 °C 
 31.8 °C44.4 °C44.4 °C 
 26.8 °C28.2 °C33.2 °C 
Massima: 45.2 °C
Media: 36.6 °C
48.6 °C41 °C34.8 °C
48.8 °C46 °C31.8 °C
33.4 °C33.8 °C28.6 °C
Massima: 48.8 °C
Media: 38.5 °C
Alimentazione (max)  45 °C | Temperatura della stanza 20 °C | Fluke 62 Mini IR Thermometer
(±) La temperatura media del lato superiore sotto carico massimo e' di 36.6 °C / 98 F, rispetto alla media di 33.9 °C / 93 F per i dispositivi di questa classe Gaming.
(-) La temperatura massima sul lato superiore è di 45.2 °C / 113 F, rispetto alla media di 40.5 °C / 105 F, che varia da 21.2 a 68.8 °C per questa classe Gaming.
(-) Il lato inferiore si riscalda fino ad un massimo di 48.8 °C / 120 F, rispetto alla media di 43.2 °C / 110 F
(+) In idle, la temperatura media del lato superiore è di 31.9 °C / 89 F, rispetto alla media deld ispositivo di 33.9 °C / 93 F.
(-) 3: The average temperature for the upper side is 40 °C / 104 F, compared to the average of 33.9 °C / 93 F for the class Gaming.
(+) I poggiapolsi e il touchpad raggiungono la temperatura massima della pelle (34.6 °C / 94.3 F) e quindi non sono caldi.
(-) La temperatura media della zona del palmo della mano di dispositivi simili e'stata di 28.9 °C / 84 F (-5.7 °C / -10.3 F).
Sistema inattivo (coperchio C)
Sistema inattivo (coperchio D)
Cyberpunk 2077 stress (copertina C)
Cyberpunk 2077 stress (copertina D)
Stress Prime95+FurMark (copertura C)
Stress Prime95+FurMark (copertura D)
Maingear ML-16 MK2
Intel Core Ultra 7 155H, NVIDIA GeForce RTX 4070 Laptop GPU
Asus ROG Zephyrus G16 GA605WV
AMD Ryzen AI 9 HX 370, NVIDIA GeForce RTX 4060 Laptop GPU
HP Victus 16 (2024)
Intel Core i7-14700HX, NVIDIA GeForce RTX 4060 Laptop GPU
Alienware x16 R2 P120F
Intel Core Ultra 9 185H, NVIDIA GeForce RTX 4080 Laptop GPU
Lenovo Legion Pro 5 16IRX9
Intel Core i9-14900HX, NVIDIA GeForce RTX 4070 Laptop GPU
Razer Blade 16 2024, RTX 4090
Intel Core i9-14900HX, NVIDIA GeForce RTX 4090 Laptop GPU
Heat
8%
12%
-4%
0%
12%
Maximum Upper Side *
45.2
48.2
-7%
50
-11%
51
-13%
43.8
3%
45
-0%
Maximum Bottom *
48.8
51.3
-5%
50
-2%
50.8
-4%
55.4
-14%
45
8%
Idle Upper Side *
34.8
28
20%
25
28%
36.6
-5%
32.8
6%
29
17%
Idle Bottom *
38.2
28.8
25%
26
32%
35.2
8%
36
6%
30
21%

* ... Meglio usare valori piccoli

Altoparlanti

Altoparlanti stereo con apertura verso il basso vicino agli angoli anteriori
Il rumore rosa mostra un volume massimo decente, ma una scarsa riproduzione dei bassi
dB(A) 0102030405060708090Deep BassMiddle BassHigh BassLower RangeMidsHigher MidsLower HighsMid HighsUpper HighsSuper Highs2040.832.840.8253026.1303126.825.826.84021.921.621.95024.920.724.9632926.4298028.920.928.910036.318.536.312543.919.143.916053.614.853.620056.314.756.325058.814.458.831559.41759.440060.815.560.850064.413.764.463069.113.669.180073.911.273.91000741074125075.59.875.5160072.11072.1200069.810.369.8250064.311.364.3315067.411.867.4400067.411.767.4500072.412.172.4630073.512.373.580007412.4741000069.512.269.51250069.612.369.61600064.512.164.5SPL83.524.183.5N58.80.558.8median 67.4median 12.3median 67.4Delta6.21.76.226.325.821.422.12624.925.127.622.532.523.448.72655.818.860.922.167.2267019.372.317.674.217.774.319.575.31571.711.871.311.27410.574.21072.710.17210.67210.97511.374.811.671.71269.71269.612.371.112.669.61270.111.269.824.784.70.666.6median 12median 71.73.42.2hearing rangehide median Pink NoiseMaingear ML-16 MK2Apple MacBook Pro 16 2021 M1 Pro
Diagramma frequenza (le caselle possono essere selezionate/deselezionate per confrontare i dispositivi)
Maingear ML-16 MK2 analisi audio

(+) | gli altoparlanti sono relativamente potenti (83.5 dB)
Bassi 100 - 315 Hz
(-) | quasi nessun basso - in media 16.1% inferiori alla media
(±) | la linearità dei bassi è media (9.2% delta rispetto alla precedente frequenza)
Medi 400 - 2000 Hz
(+) | medi bilanciati - solo only 4.9% rispetto alla media
(+) | medi lineari (4.9% delta rispetto alla precedente frequenza)
Alti 2 - 16 kHz
(+) | Alti bilanciati - appena 3.3% dalla media
(+) | alti lineari (5.1% delta rispetto alla precedente frequenza)
Nel complesso 100 - 16.000 Hz
(+) | suono nel complesso lineare (13.7% differenza dalla media)
Rispetto alla stessa classe
» 20% di tutti i dispositivi testati in questa classe è stato migliore, 6% simile, 74% peggiore
» Il migliore ha avuto un delta di 6%, medio di 18%, peggiore di 132%
Rispetto a tutti i dispositivi testati
» 13% di tutti i dispositivi testati in questa classe è stato migliore, 3% similare, 84% peggiore
» Il migliore ha avuto un delta di 4%, medio di 25%, peggiore di 134%

Apple MacBook Pro 16 2021 M1 Pro analisi audio

(+) | gli altoparlanti sono relativamente potenti (84.7 dB)
Bassi 100 - 315 Hz
(+) | bassi buoni - solo 3.8% dalla media
(+) | bassi in lineaa (5.2% delta rispetto alla precedente frequenza)
Medi 400 - 2000 Hz
(+) | medi bilanciati - solo only 1.3% rispetto alla media
(+) | medi lineari (2.1% delta rispetto alla precedente frequenza)
Alti 2 - 16 kHz
(+) | Alti bilanciati - appena 1.9% dalla media
(+) | alti lineari (2.7% delta rispetto alla precedente frequenza)
Nel complesso 100 - 16.000 Hz
(+) | suono nel complesso lineare (4.6% differenza dalla media)
Rispetto alla stessa classe
» 0% di tutti i dispositivi testati in questa classe è stato migliore, 0% simile, 100% peggiore
» Il migliore ha avuto un delta di 5%, medio di 18%, peggiore di 45%
Rispetto a tutti i dispositivi testati
» 0% di tutti i dispositivi testati in questa classe è stato migliore, 0% similare, 100% peggiore
» Il migliore ha avuto un delta di 4%, medio di 25%, peggiore di 134%

Gestione dell'energia

Consumo di energia

Il consumo energetico al minimo varia da 7 W a 27 W a seconda dell'impostazione della GPU e del livello di luminosità, un intervallo più ampio rispetto ai concorrenti. Questo spiegherebbe anche la durata relativamente breve della batteria nella sezione successiva. Abilitando semplicemente la modalità dGPU e la luminosità massima del display, il consumo passa da 7 W a 23 W. Per questo motivo si consiglia di utilizzare la modalità MSHybrid se la durata della batteria è importante.

Il gioco richiede circa 179 W in media dall'adattatore CA di medie dimensioni (~14,4 x 7,5 x 2,3 cm) da 180 W. Ciò significa che la velocità di carica rallenterà fino a scomparire se si eseguono giochi simultaneamente e suggerisce anche che le prestazioni avrebbero potuto essere più rapide se il modello fosse stato fornito con un adattatore CA da 230 W più grande. In effetti, siamo in grado di registrare un assorbimento massimo di 203 W quando la CPU e la GPU sono al massimo dell'utilizzo, per dimostrare che il sistema può richiedere più di quanto l'adattatore CA possa fornire in modo sicuro. Questo è simile a quanto abbiamo osservato sul Lenovo Yoga Pro 9i 16 G9 dove abbiamo trovato che il suo adattatore CA da 170 W era troppo piccolo per la CPU Core Ultra H e la GPU RTX 4070.

consumo 3DMark 06
consumo 3DMark 06
Cyberpunk 2077 1080p Ultra consumo
Il consumo saliva a 154 W quando si avviava lo stress Prime95, per poi scendere a 113 W 20 secondi dopo, a causa delle limitazioni termiche
Lo stress di Prime95+FurMark è iniziato al 10s
Consumo di corrente
Off / Standbydarklight 0.28 / 1.2 Watt
Idledarkmidlight 7.7 / 22.9 / 26.7 Watt
Sotto carico midlight 77.5 / 202.6 Watt
 color bar
Leggenda: min: dark, med: mid, max: light        Metrahit Energy
Maingear ML-16 MK2
Ultra 7 155H, NVIDIA GeForce RTX 4070 Laptop GPU, , IPS, 2560x1600, 16"
Asus ROG Zephyrus G16 GA605WV
Ryzen AI 9 HX 370, NVIDIA GeForce RTX 4060 Laptop GPU, Micron 2400 MTFDKBA1T0QFM, OLED, 2560x1600, 16"
HP Victus 16 (2024)
i7-14700HX, NVIDIA GeForce RTX 4060 Laptop GPU, Kioxia XG8 KXG80ZNV512G, IPS, 1920x1080, 16.1"
Alienware x16 R2 P120F
Ultra 9 185H, NVIDIA GeForce RTX 4080 Laptop GPU, WDC PC SN810 1TB, IPS, 2560x1600, 16"
Lenovo Legion Pro 5 16IRX9
i9-14900HX, NVIDIA GeForce RTX 4070 Laptop GPU, Samsung PM9A1 MZVL21T0HCLR, IPS, 2560x1600, 16"
Razer Blade 16 2024, RTX 4090
i9-14900HX, NVIDIA GeForce RTX 4090 Laptop GPU, Samsung PM9A1 MZVL22T0HBLB, OLED, 2560x1600, 16"
Power Consumption
24%
-9%
-20%
-29%
-39%
Idle Minimum *
7.7
6.9
10%
9
-17%
9.9
-29%
12.5
-62%
16.9
-119%
Idle Average *
22.9
12.6
45%
15
34%
14.5
37%
24.6
-7%
17.8
22%
Idle Maximum *
26.7
13
51%
23
14%
33.5
-25%
24.8
7%
19.6
27%
Load Average *
77.5
84.1
-9%
123
-59%
97.5
-26%
109.6
-41%
128
-65%
Cyberpunk 2077 ultra external monitor *
178.9
124.5
30%
Cyberpunk 2077 ultra *
178.6
127.2
29%
Load Maximum *
202.6
177.6
12%
241
-19%
315.2
-56%
284.9
-41%
328
-62%
Witcher 3 ultra *
143.7
230
218
243

* ... Meglio usare valori piccoli

Power Consumption Cyberpunk / Stress Test

0153045607590105120135150165180195210225Tooltip
Maingear ML-16 MK2 Ultra 7 155H, NVIDIA GeForce RTX 4070 Laptop GPU; 1280x720 Prime95 28.10 and Furmark 1.25: Ø171.6 (131.1-203)
Lenovo Legion 7 16 IRX G9 i9-14900HX, NVIDIA GeForce RTX 4070 Laptop GPU; 1280x720 Prime95 28.10 and Furmark 1.25: Ø213 (182.5-239)
Maingear ML-16 MK2 Ultra 7 155H, NVIDIA GeForce RTX 4070 Laptop GPU; Idle 150cd/m2: Ø8.5 (6.76-11.5)
Lenovo Legion 7 16 IRX G9 i9-14900HX, NVIDIA GeForce RTX 4070 Laptop GPU; Idle 150cd/m2: Ø18.7 (18.2-20.7)
Maingear ML-16 MK2 Ultra 7 155H, NVIDIA GeForce RTX 4070 Laptop GPU; Cyberpunk 2077 FHD ultra no FSR 150cd: Ø178.6 (168.6-185.6)

Power Consumption external Monitor

0153045607590105120135150165180195210225Tooltip
Maingear ML-16 MK2 Ultra 7 155H, NVIDIA GeForce RTX 4070 Laptop GPU; Prime95 V2810 Stress (external Monitor): Ø122.6 (106.9-154.1)
Lenovo Legion 7 16 IRX G9 i9-14900HX, NVIDIA GeForce RTX 4070 Laptop GPU; Prime95 V2810 Stress (external Monitor): Ø146.4 (130-234)
Maingear ML-16 MK2 Ultra 7 155H, NVIDIA GeForce RTX 4070 Laptop GPU; Cinebench R15 Multi (external Monitor): Ø130.4 (74-136.1)
Lenovo Legion 7 16 IRX G9 i9-14900HX, NVIDIA GeForce RTX 4070 Laptop GPU; Cinebench R15 Multi (external Monitor): Ø219 (193.6-231)
Maingear ML-16 MK2 Ultra 7 155H, NVIDIA GeForce RTX 4070 Laptop GPU; 1280x720 FurMark 1.19 GPU Stress Test (external Monitor): Ø133.3 (126.7-136.7)
Lenovo Legion 7 16 IRX G9 i9-14900HX, NVIDIA GeForce RTX 4070 Laptop GPU; 1280x720 FurMark 1.19 GPU Stress Test (external Monitor): Ø162.8 (154.1-200)
Maingear ML-16 MK2 Ultra 7 155H, NVIDIA GeForce RTX 4070 Laptop GPU; Idle 1min (external Monitor): Ø7.65 (5.35-12)
Lenovo Legion 7 16 IRX G9 i9-14900HX, NVIDIA GeForce RTX 4070 Laptop GPU; Idle 1min (external Monitor): Ø15.5 (15.1-16.4)
Maingear ML-16 MK2 Ultra 7 155H, NVIDIA GeForce RTX 4070 Laptop GPU; Cyberpunk 2077 FHD ultra no FSR (external Monitor): Ø178.9 (169.7-186)

Durata della batteria

adattatore CA da 180 W

La capacità della batteria di 80 Wh è nella media per le dimensioni dello schermo da 16 pollici. I tempi di esecuzione, tuttavia, sono inferiori alla media per un portatile da gioco. Siamo riusciti a registrare solo poco più di 3,5 ore di navigazione WLAN nel mondo reale, anche quando è stato impostato il profilo energetico Bilanciato con MSHybrid attivo, rispetto a oltre il doppio di quanto registrato dal modello Asus ROG Zephyrus G16 o HP Victus 16.

La ricarica da vuoto a pieno regime è relativamente veloce, da 1 a 1,5 ore. Il sistema può essere ricaricato anche tramite adattatori CA USB-C di terze parti, anche se a un ritmo più lento. Tenga presente che solo una delle due porte USB-C supporta la ricarica.

Autonomia della batteria
Idle (senza WLAN, min luminosità)
10ore 51minuti
WiFi Websurfing
3ore 38minuti
Sotto carico (max luminosità)
1ore 38minuti
Maingear ML-16 MK2
Ultra 7 155H, NVIDIA GeForce RTX 4070 Laptop GPU, 80 Wh
Asus ROG Zephyrus G16 GA605WV
Ryzen AI 9 HX 370, NVIDIA GeForce RTX 4060 Laptop GPU, 90 Wh
HP Victus 16 (2024)
i7-14700HX, NVIDIA GeForce RTX 4060 Laptop GPU, 83 Wh
Alienware x16 R2 P120F
Ultra 9 185H, NVIDIA GeForce RTX 4080 Laptop GPU, 90 Wh
Lenovo Legion Pro 5 16IRX9
i9-14900HX, NVIDIA GeForce RTX 4070 Laptop GPU, 80 Wh
Razer Blade 16 2024, RTX 4090
i9-14900HX, NVIDIA GeForce RTX 4090 Laptop GPU, 95.2 Wh
Autonomia della batteria
62%
134%
-11%
-13%
16%
Reader / Idle
651
403
-38%
WiFi v1.3
218
478
119%
511
134%
193
-11%
290
33%
329
51%
Load
98
103
5%
65
-34%
79
-19%
H.264
824
456

Pro

+ luminoso display IPS da 500 nit con colori sRGB completi
+ relativamente leggero per le dimensioni
+ interni accessibili
+ tastierino numerico integrato
+ nessuna strozzatura dell'SSD

Contro

- temperature del nucleo molto calde durante il gioco
- niente Advanced Optimus o G-Sync
- la rigidità del telaio potrebbe essere migliore
- nessuna opzione P3, OLED o HDR
- forte rumore della ventola durante il gioco

Verdetto - Sorprendentemente leggero, ma un po' troppo caldo

In recensione: Maingear ML-16 MK2

Il Maingear ML-16 MK2 ha alcuni punti a suo favore rispetto ai grandi concorrenti. I più importanti sono la sua leggerezza e il display relativamente luminoso, per aiutare gli utenti che non giocano sempre a casa. Nel frattempo, il tastierino numerico integrato può rivelarsi utile per alcuni tipi di giochi e fogli di calcolo, mentre la facilità di manutenzione è sempre apprezzata dagli appassionati.

Purtroppo, il modello soffre di un lungo elenco di svantaggi. Per prima cosa, la sua soluzione di raffreddamento è relativamente piccola e non è così efficiente come quella dei portatili da gioco da 16 pollici della concorrenza. Le temperature del core, le temperature della superficie e il rumore della ventola sono quindi più calde e più rumorose rispetto alle alternative come il più pesante Razer Blade 16 o Lenovo Legion Pro. Anche la rigidità del telaio è più debole rispetto ai concorrenti, per una prima impressione peggiore. Questi inconvenienti possono essere in parte attribuiti al peso ridotto, poiché di conseguenza sono stati fatti dei tagli allo chassis e alla soluzione di raffreddamento. In altre parole, dovrà fare alcuni sacrifici fondamentali per un peso più leggero e portatile.

Maingear ML-16 MK2 è più leggero e più luminoso di quanto ci aspettassimo. Tuttavia, manca di diverse funzioni avanzate, mentre le temperature e il rumore della ventola avrebbero potuto essere migliori.

Altre funzioni avanzate come Optimus 2.0, HDR, OLED, illuminazione RGB per tasto, raffreddamento a camera di vapore e interfaccia in metallo liquido non sono disponibili su ML-16 MK2. Queste omissioni possono essere accettabili in una fascia di prezzo di 1500 dollari, ma ci aspettavamo un po' di più considerando il prezzo di 2000 dollari richiesto per la nostra configurazione RTX 4070.

Prezzo e disponibilità

Maingear sta spedendo mL-16 Mark 2 a 1.800 dollari con GeForce RTX 4060 o a 2.000 dollari con RTX 4070, come da recensione.

Nota: abbiamo recentemente aggiornato il nostro sistema di valutazione e i risultati della versione 8 non sono paragonabili ai risultati della versione 7. Ulteriori informazioni sono disponibili qui .

Maingear ML-16 MK2 - 09/17/2024 v8
Allen Ngo

Chassis
79 / 98 → 80%
Tastiera
82%
Dispositivo di puntamento
78%
Connettività
67 / 80 → 84%
Peso
62 / 10-68 → 90%
Batteria
56 / 95 → 59%
Display
84%
Prestazioni di gioco
83%
Prestazioni Applicazioni
80%
Temperatura
82 / 95 → 86%
Rumorosità
67 / 90 → 74%
Audio
79%
Fotocamera
36 / 75 → 48%
Media
57%
81%
Gaming - Media ponderata
CO2 Emissions
No Data
Materials
0%
Packaging
25%
Power Use
78.7%
Repairability
50%
Software Updates
22.3%
Recycle Logo Total Sustainability Score: 29.3%

Transparency

La selezione dei dispositivi da recensire viene effettuata dalla nostra redazione. Il campione di prova è stato fornito all'autore come prestito dal produttore o dal rivenditore ai fini di questa recensione. L'istituto di credito non ha avuto alcuna influenza su questa recensione, né il produttore ne ha ricevuto una copia prima della pubblicazione. Non vi era alcun obbligo di pubblicare questa recensione. Non accettiamo mai compensi o pagamenti in cambio delle nostre recensioni. In quanto società mediatica indipendente, Notebookcheck non è soggetta all'autorità di produttori, rivenditori o editori.

Ecco come Notebookcheck esegue i test

Ogni anno, Notebookcheck esamina in modo indipendente centinaia di laptop e smartphone utilizzando procedure standardizzate per garantire che tutti i risultati siano comparabili. Da circa 20 anni sviluppiamo continuamente i nostri metodi di prova e nel frattempo stabiliamo gli standard di settore. Nei nostri laboratori di prova, tecnici ed editori esperti utilizzano apparecchiature di misurazione di alta qualità. Questi test comportano un processo di validazione in più fasi. Il nostro complesso sistema di valutazione si basa su centinaia di misurazioni e parametri di riferimento ben fondati, che mantengono l'obiettività.

Price comparison

Please share our article, every link counts!
Mail Logo
> Recensioni e prove di notebook, tablets e smartphones > Recensioni e prove > Recensioni e prove > Recensione del laptop Maingear ML-16 MK2: prestante GeForce RTX 4070 a un prezzo decente
Allen Ngo, 2024-09-20 (Update: 2024-09-27)