

Recensione del mini PC GMK NucBox K9: Core Ultra 5 125H con grafica Arc 7

Dopo aver recensito la GMK NucBox K6 qualche mese fa, siamo ora pronti ad affrontare la NucBox K9 completa del nuovo processore Meteor Lake-H abilitato all'AI. A parte il passaggio della CPU da AMD a Intel, tuttavia, il telaio rimane identico tra i due modelli, per cui le consigliamo di consultare la nostra recensione del NucBox K6 NucBox K6 per saperne di più sulle caratteristiche fisiche del sistema.
La nostra unità di prova è dotata di CPU Core Ultra 5 125H, SSD da 1 TB e 32 GB di RAM per circa 860 dollari o 570 dollari se in offerta. Gli utenti possono configurare il sistema senza RAM o SSD, per un'impostazione essenziale, ma la CPU Core Ultra 5 è fissa in tutte le opzioni.
Le alternative includono altri mini PC ad alte prestazioni, come il modello Beelink SER8, Bosgame M1o Geekom AX8 Pro.
Altre recensioni di GMKtec:
Potenziali concorrenti a confrontos
Punteggio | Versione | Data | Modello | Peso | Altezza | Dimensione | Risoluzione | Prezzo |
|---|---|---|---|---|---|---|---|---|
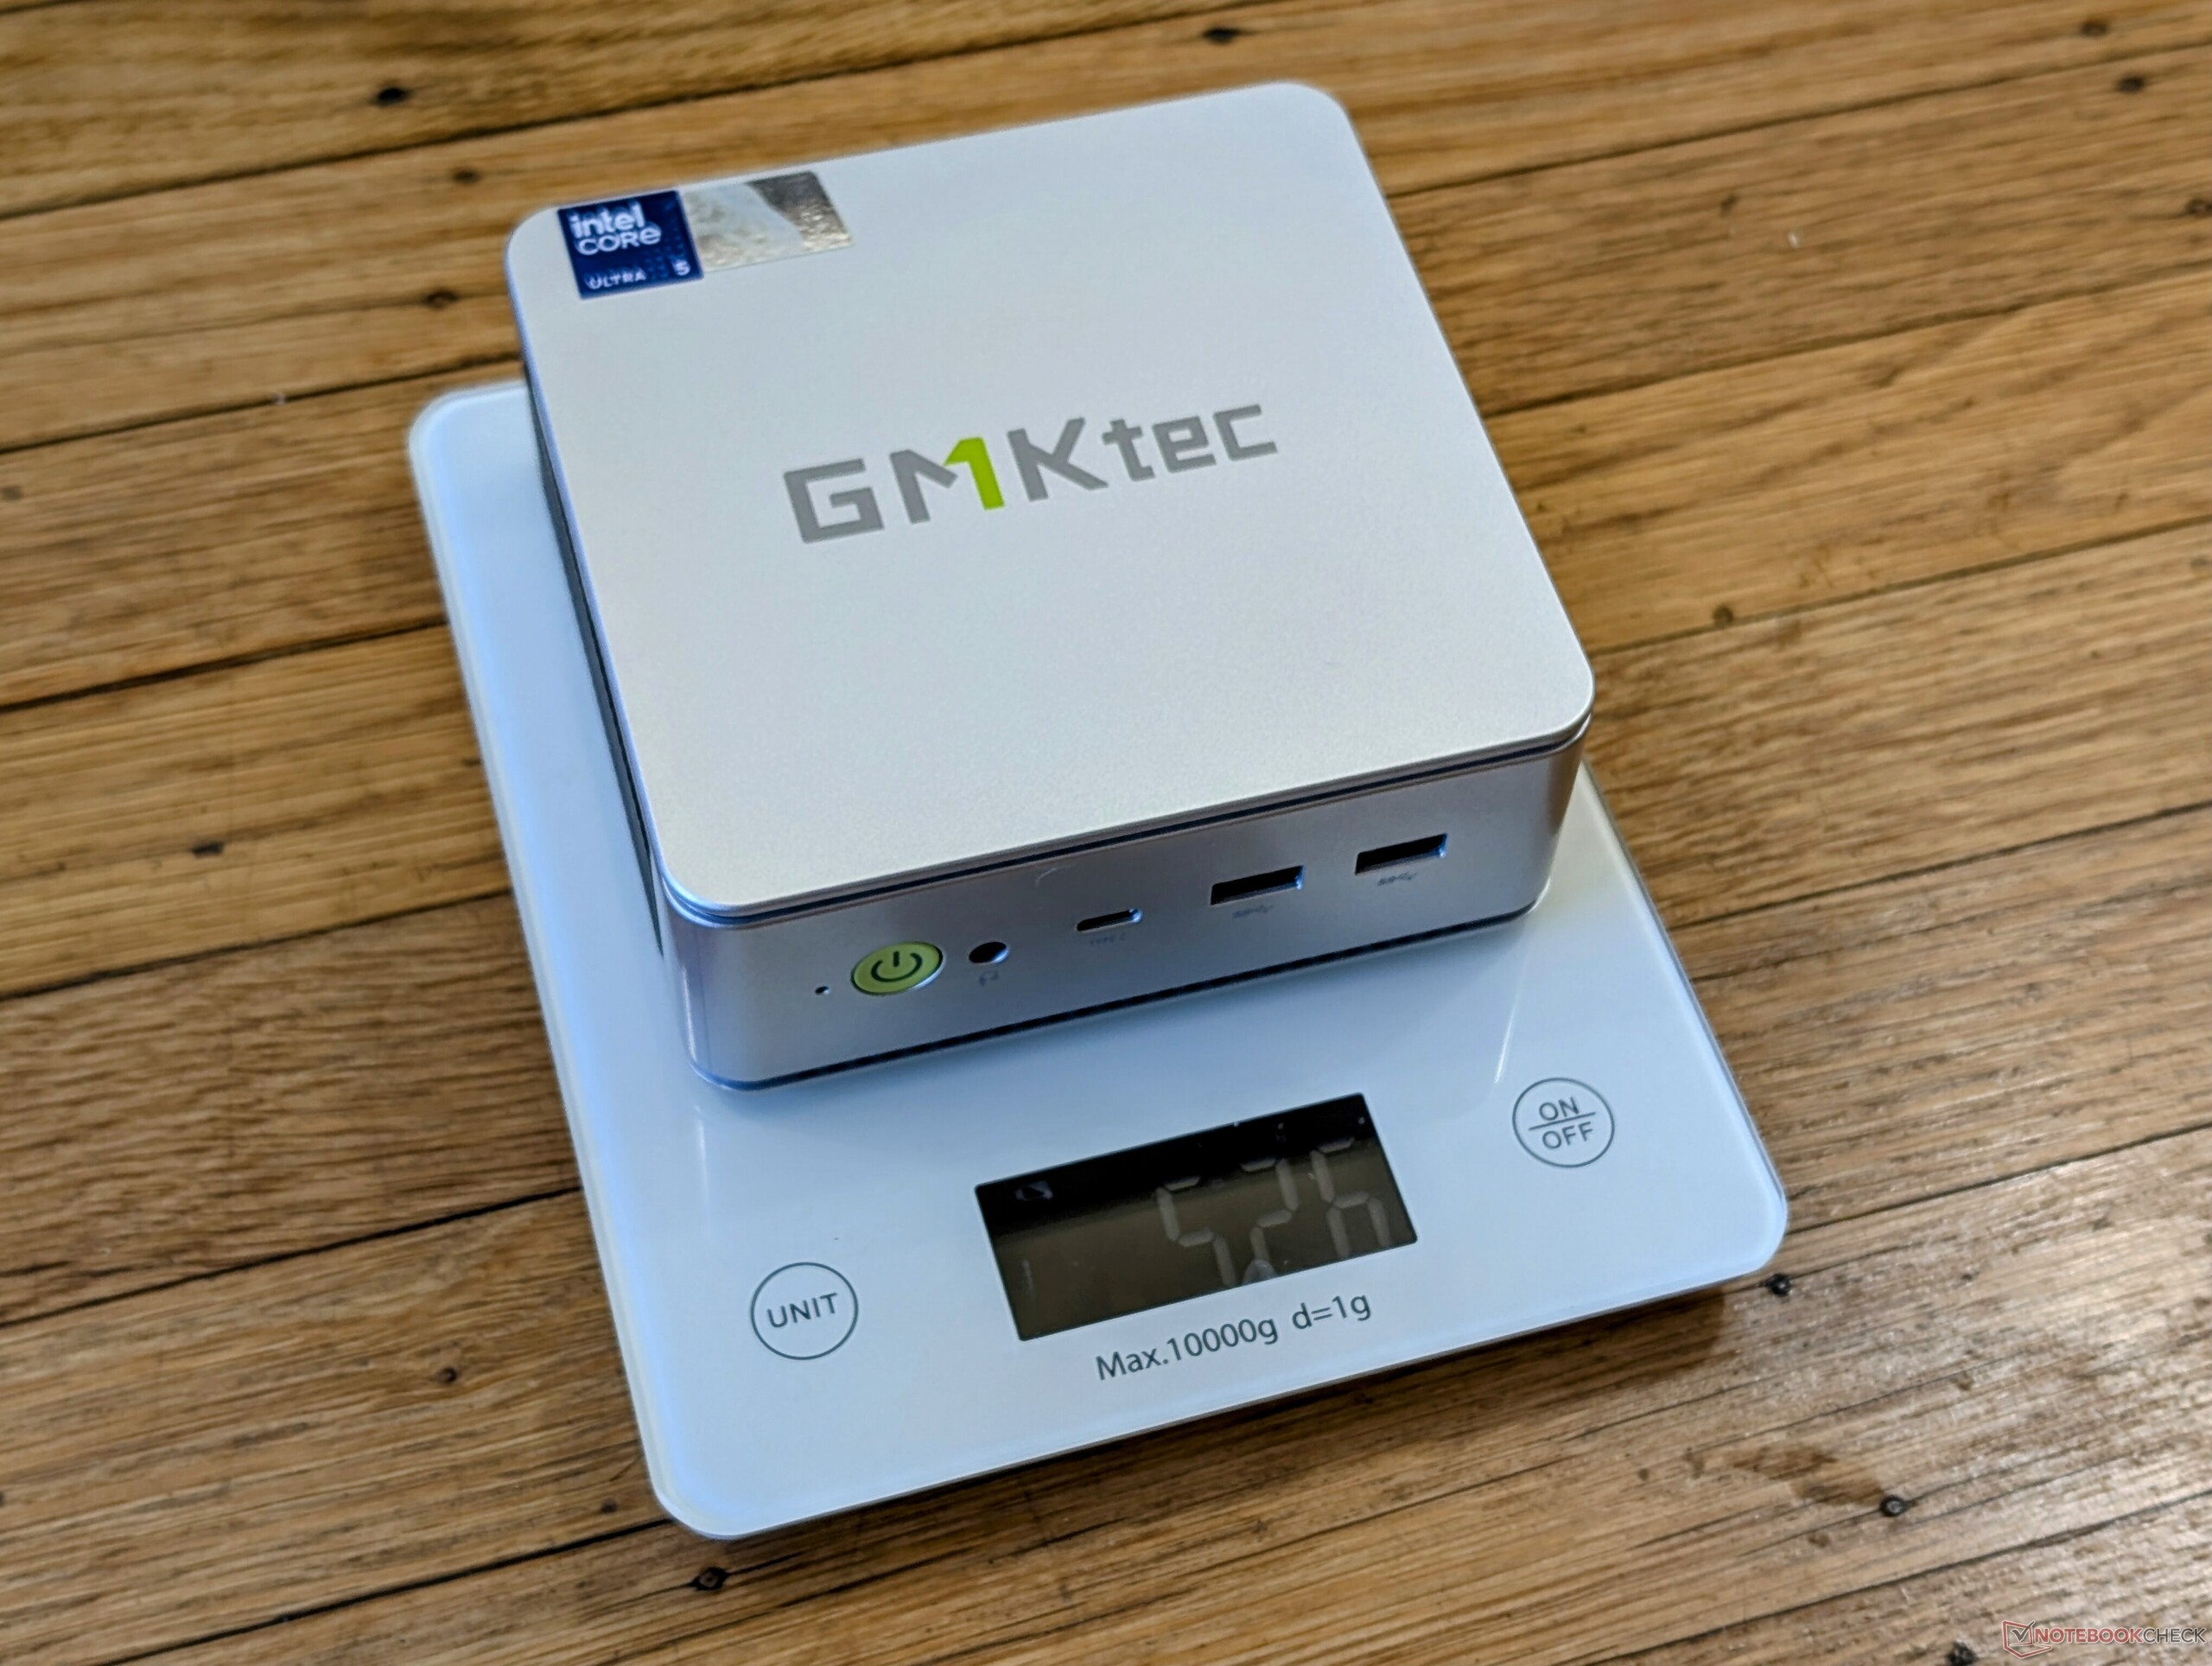
| 67.3 % | v8 | 09/2024 | GMK NucBox K9 Ultra 5 125H, Arc 7-Core | 528 gr | 47 mm | x | ||
| 83.6 % v7 (old) | v7 (old) | 04/2024 | GMK NucBox K6 R7 7840HS, Radeon 780M | 514 gr | 47 mm | x | ||
| 63.6 % | v8 | 07/2024 | GMK NucBox M6 R5 6600H, Radeon 660M | 526 gr | 48 mm | x | ||
| 74.9 % | v8 | 07/2024 | Beelink SER8 R7 8845HS, Radeon 780M | 776 gr | 44.7 mm | x | ||
v (old) | 12/2022 | Beelink SEi12 Core i5-1235U i5-1235U, Iris Xe G7 80EUs | 465 gr | 42 mm | x | |||
| 84.5 % v7 (old) | v7 (old) | 05/2024 | BOSGAME M1 R7 7840HS, Radeon 780M | 766 gr | 51 mm | x |
Nota: abbiamo recentemente aggiornato il nostro sistema di valutazione e i risultati della versione 8 non sono paragonabili ai risultati della versione 7. Ulteriori informazioni sono disponibili qui .
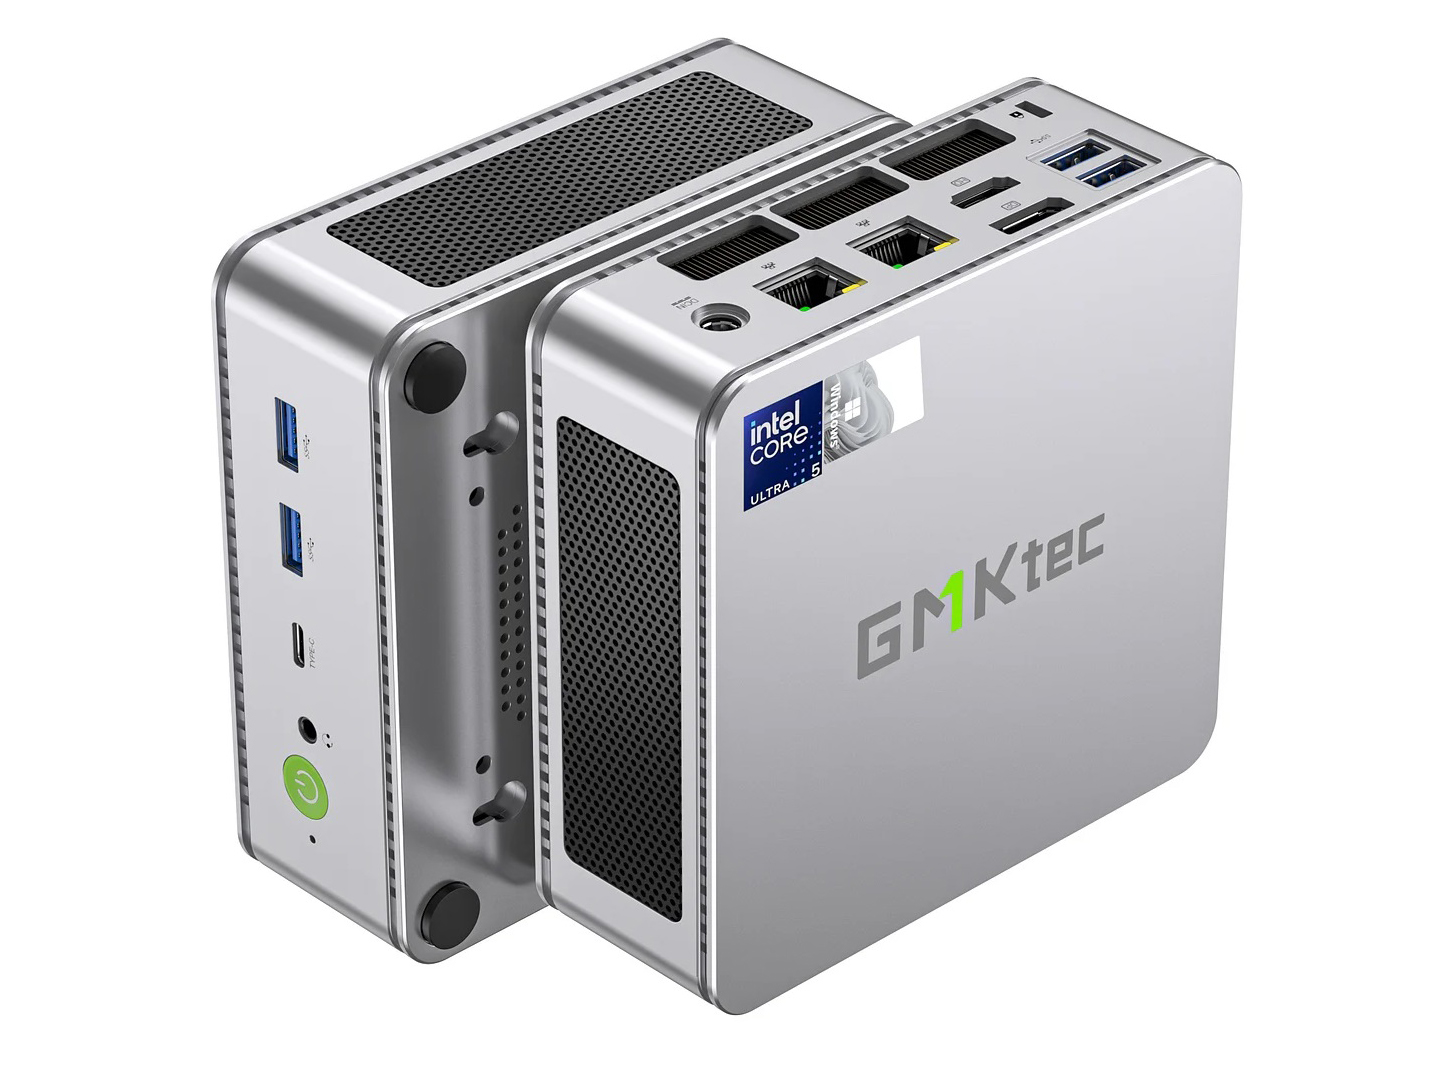
Caso - Un cambio di colore
Il telaio in plastica e metallo rimane identico a quello della NucBox K6 con motore AMD, anche se in un colore grigio opaco/argento.
Connettività - Porte USB più veloci
Mentre le opzioni e il posizionamento delle porte non sono cambiati rispetto a NucBox K6, le porte USB sono state aggiornate. Tutte le porte USB-A sono ora USB4, anziché 2.0 o 3.2. Nel frattempo, la porta USB-C supporta ufficialmente Thunderbolt 4.
Gli adattatori CA USB-C di terze parti possono alimentare il sistema al posto dell'adattatore CA a barile, se sono in grado di fornire energia sufficiente. Le prestazioni e la compatibilità con tutti gli adattatori USB-C, tuttavia, non sono garantite.
Comunicazione
L'Intel AX201 è di serie al posto del MediaTek RZ616 per la connettività Wi-Fi 6 e Bluetooth 5.2. Il Wi-Fi 6E e il Wi-Fi 7 non sono inclusi per risparmiare sui costi.
| Networking | |
| iperf3 transmit AXE11000 | |
| GMK NucBox M6 | |
| Beelink SEi12 Core i5-1235U | |
| BOSGAME M1 | |
| GMK NucBox K9 | |
| Beelink SER8 | |
| GMK NucBox K6 | |
| iperf3 receive AXE11000 | |
| BOSGAME M1 | |
| GMK NucBox M6 | |
| Beelink SEi12 Core i5-1235U | |
| GMK NucBox K6 | |
| Beelink SER8 | |
| GMK NucBox K9 | |
| iperf3 transmit AXE11000 6GHz | |
| BOSGAME M1 | |
| GMK NucBox K6 | |
| GMK NucBox M6 | |
| iperf3 receive AXE11000 6GHz | |
| BOSGAME M1 | |
| GMK NucBox K6 | |
| GMK NucBox M6 | |
Manutenzione
I componenti aggiornabili sono identici a quelli di NucBox K6.
Sostenibilità
Il produttore pubblicizza un sistema "Sustainably made", senza entrare nel dettaglio di ciò che questo implica. La confezione stessa è per lo più di cartone con un po' di involucro di plastica.
Accessori e garanzia
La confezione di vendita include una staffa di montaggio VESA e un cavo HDMI, oltre alla solita documentazione e all'adattatore CA. Se acquistato negli Stati Uniti, si applica una garanzia del produttore di un anno.
Prestazioni - Standard Meteor Lake
Condizioni del test
Abbiamo impostato Windows in modalità Prestazioni prima di eseguire i benchmark qui sotto.
Processore
Le prestazioni della CPU sono quelle che ci aspettiamo che siano rispetto ad altri PC del nostro database con lo stesso Core Ultra 5 125H processore. La CPU Meteor Lake è in grado di competere con il Core i9-13900H di ultima generazione Core i9-13900H il che sembra ottimo sulla carta, finché non si ricorda che il NucBox K6 alimentato da AMD con il più vecchio Ryzen 7 7840HS è ancora più veloce di entrambe le soluzioni Intel. Pertanto, la mancanza di un'opzione Core Ultra 7 è strana, considerando che la NucBox K9 è la scatola più recente.
Sebbene sia inclusa un'intelligenza artificiale integrata, non è compatibile con Co-Pilot+.
Cinebench R15 Multi Loop
Cinebench R23: Multi Core | Single Core
Cinebench R20: CPU (Multi Core) | CPU (Single Core)
Cinebench R15: CPU Multi 64Bit | CPU Single 64Bit
Blender: v2.79 BMW27 CPU
7-Zip 18.03: 7z b 4 | 7z b 4 -mmt1
Geekbench 6.4: Multi-Core | Single-Core
Geekbench 5.5: Multi-Core | Single-Core
HWBOT x265 Benchmark v2.2: 4k Preset
LibreOffice : 20 Documents To PDF
R Benchmark 2.5: Overall mean
* ... Meglio usare valori piccoli
AIDA64: FP32 Ray-Trace | FPU Julia | CPU SHA3 | CPU Queen | FPU SinJulia | FPU Mandel | CPU AES | CPU ZLib | FP64 Ray-Trace | CPU PhotoWorxx
| Performance Rating | |
| Beelink SER8 | |
| BOSGAME M1 | |
| GMK NucBox K6 | |
| GMK NucBox M6 | |
| GMK NucBox K9 | |
| Media Intel Core Ultra 5 125H | |
| Beelink SEi12 Core i5-1235U | |
| AIDA64 / FP32 Ray-Trace | |
| Beelink SER8 | |
| BOSGAME M1 | |
| GMK NucBox K6 | |
| GMK NucBox M6 | |
| Media Intel Core Ultra 5 125H (8430 - 13639, n=7) | |
| GMK NucBox K9 | |
| Beelink SEi12 Core i5-1235U | |
| AIDA64 / FPU Julia | |
| Beelink SER8 | |
| BOSGAME M1 | |
| GMK NucBox K6 | |
| GMK NucBox M6 | |
| GMK NucBox K9 | |
| Media Intel Core Ultra 5 125H (43652 - 70880, n=7) | |
| Beelink SEi12 Core i5-1235U | |
| AIDA64 / CPU SHA3 | |
| Beelink SER8 | |
| BOSGAME M1 | |
| GMK NucBox K6 | |
| GMK NucBox K9 | |
| Media Intel Core Ultra 5 125H (2047 - 3404, n=7) | |
| GMK NucBox M6 | |
| Beelink SEi12 Core i5-1235U | |
| AIDA64 / CPU Queen | |
| BOSGAME M1 | |
| Beelink SER8 | |
| GMK NucBox K6 | |
| GMK NucBox M6 | |
| GMK NucBox K9 | |
| Media Intel Core Ultra 5 125H (76983 - 79986, n=7) | |
| Beelink SEi12 Core i5-1235U | |
| AIDA64 / FPU SinJulia | |
| Beelink SER8 | |
| BOSGAME M1 | |
| GMK NucBox K6 | |
| GMK NucBox M6 | |
| GMK NucBox K9 | |
| Media Intel Core Ultra 5 125H (6588 - 7851, n=7) | |
| Beelink SEi12 Core i5-1235U | |
| AIDA64 / FPU Mandel | |
| Beelink SER8 | |
| BOSGAME M1 | |
| GMK NucBox K6 | |
| GMK NucBox M6 | |
| Media Intel Core Ultra 5 125H (21210 - 35321, n=7) | |
| GMK NucBox K9 | |
| Beelink SEi12 Core i5-1235U | |
| AIDA64 / CPU AES | |
| Beelink SER8 | |
| BOSGAME M1 | |
| GMK NucBox K6 | |
| GMK NucBox K9 | |
| GMK NucBox M6 | |
| Beelink SEi12 Core i5-1235U | |
| Media Intel Core Ultra 5 125H (45524 - 108402, n=7) | |
| AIDA64 / CPU ZLib | |
| Beelink SER8 | |
| BOSGAME M1 | |
| GMK NucBox K6 | |
| GMK NucBox K9 | |
| Media Intel Core Ultra 5 125H (594 - 994, n=7) | |
| GMK NucBox M6 | |
| Beelink SEi12 Core i5-1235U | |
| AIDA64 / FP64 Ray-Trace | |
| Beelink SER8 | |
| BOSGAME M1 | |
| GMK NucBox K6 | |
| GMK NucBox M6 | |
| Media Intel Core Ultra 5 125H (4345 - 7221, n=7) | |
| GMK NucBox K9 | |
| Beelink SEi12 Core i5-1235U | |
| AIDA64 / CPU PhotoWorxx | |
| GMK NucBox K9 | |
| Media Intel Core Ultra 5 125H (23499 - 49844, n=7) | |
| BOSGAME M1 | |
| GMK NucBox K6 | |
| Beelink SER8 | |
| GMK NucBox M6 | |
| Beelink SEi12 Core i5-1235U | |
Test da sforzo
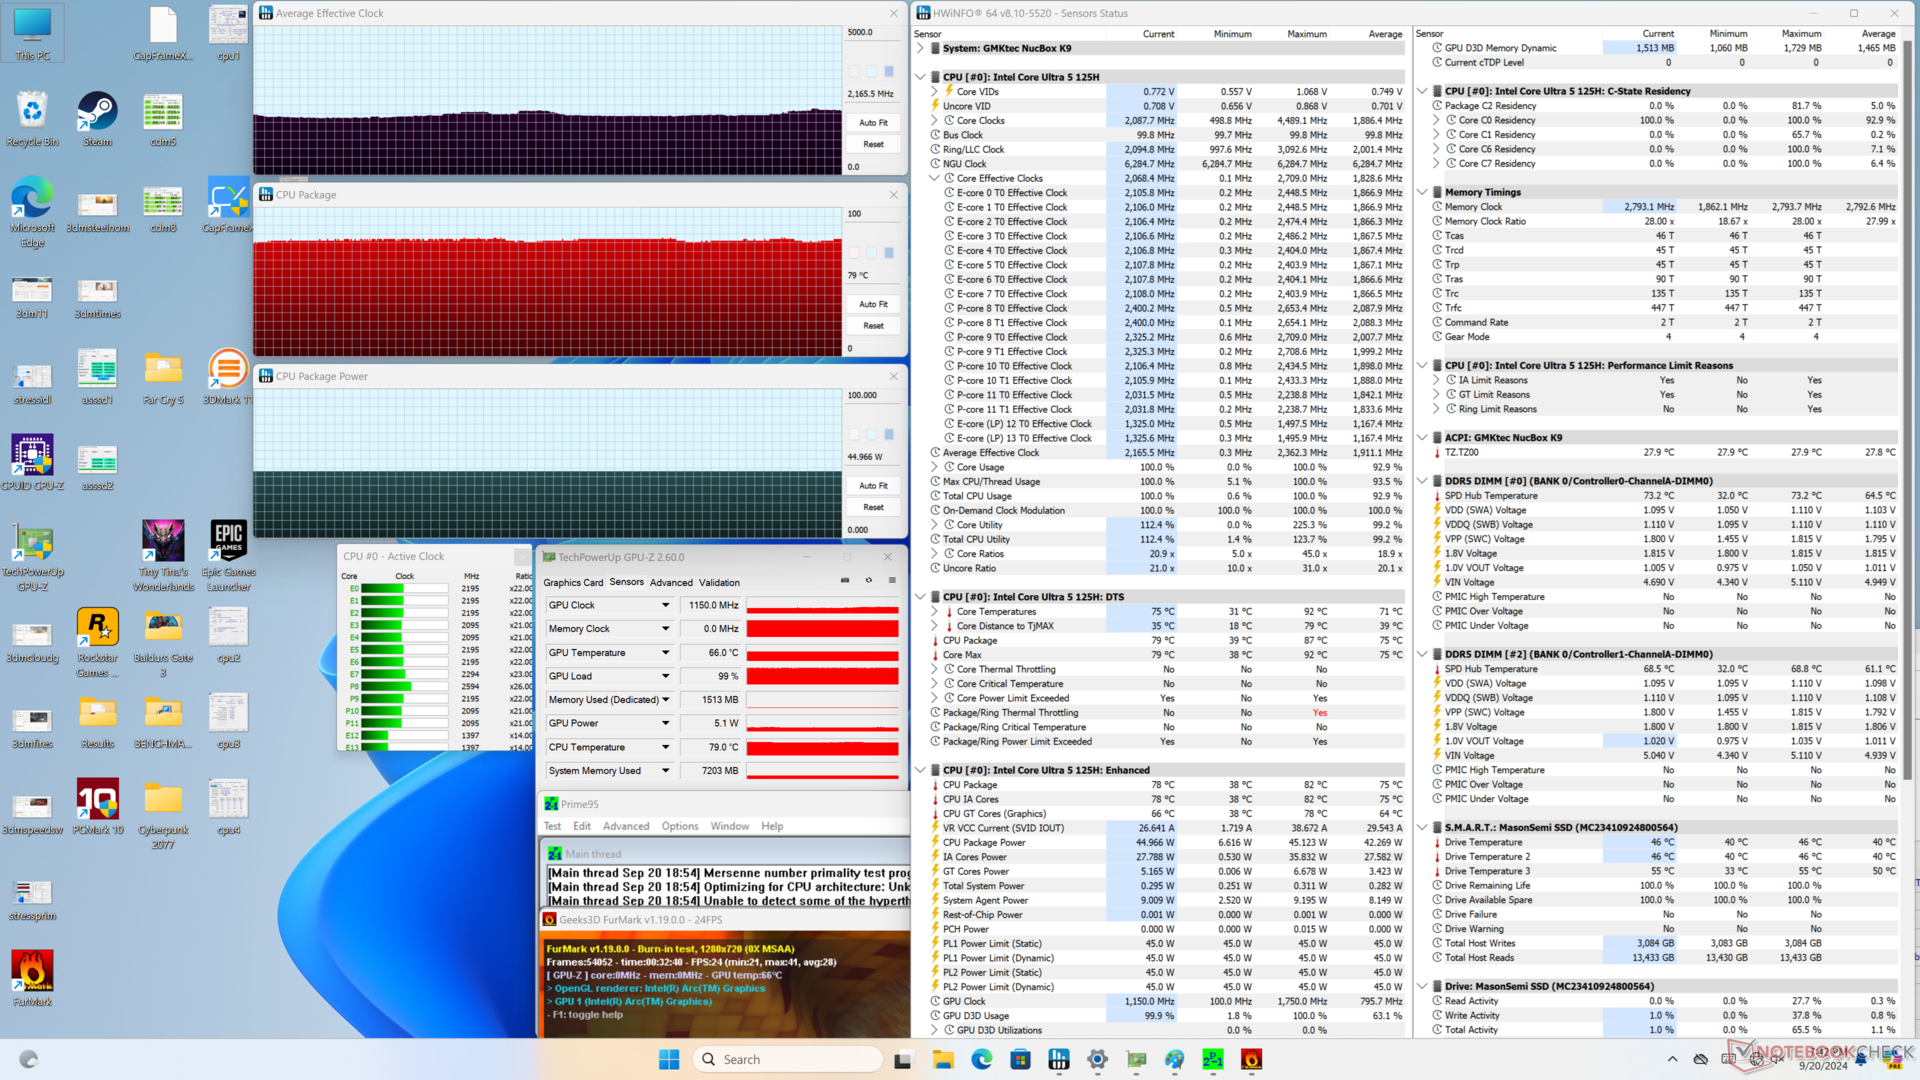
Quando si avvia lo stress Prime95, la CPU sale a 2,3 GHz e 45 W e mantiene questi valori per tutta la durata del test di stress. La temperatura del core si stabilizzava a 80 C, leggermente più fredda di quella registrata sul più veloce NucBox K6 con motore AMD.
Quando si esegue Cyberpunk 2077 per rappresentare lo stress da gioco, la temperatura del nucleo si stabilizza a 72 C, simile a quella di NucBox K6, anche se NucBox K9 esegue i giochi più lentamente, come mostrerà la nostra sezione Prestazioni di gioco.

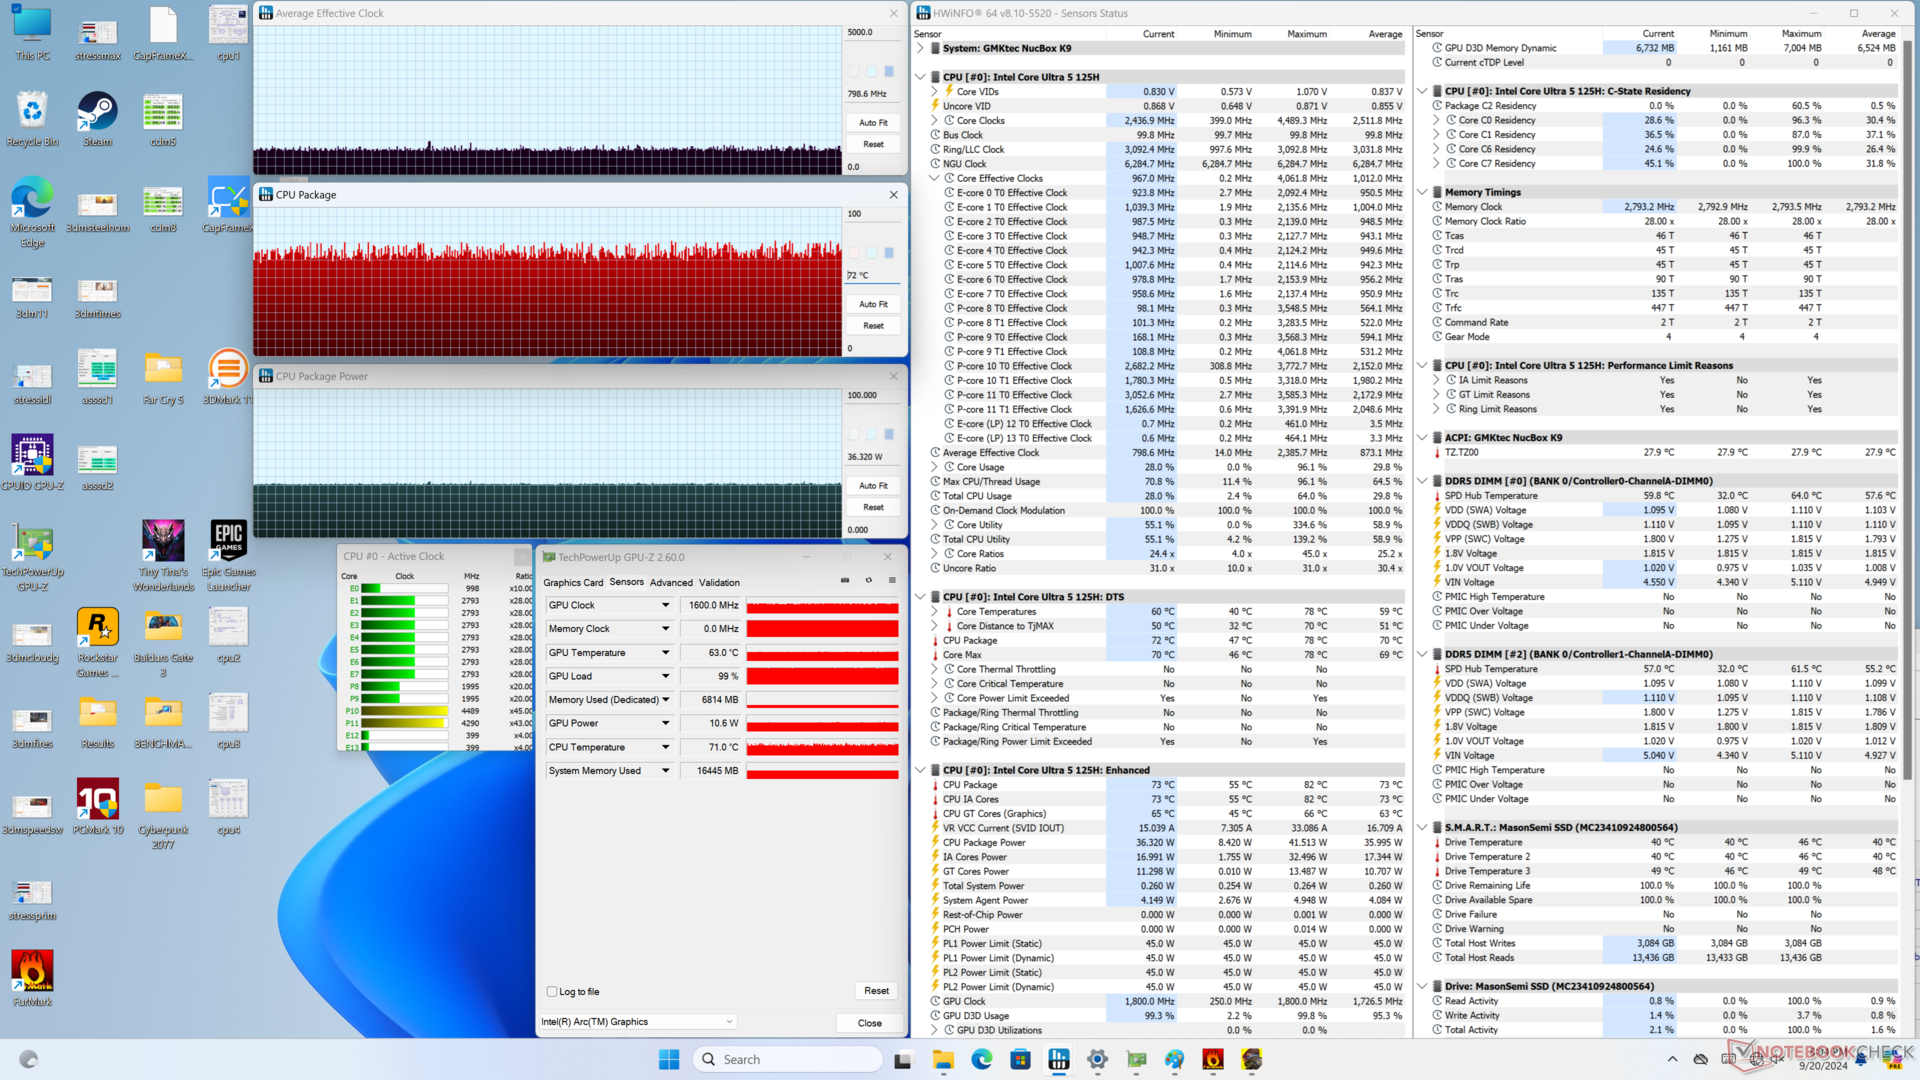
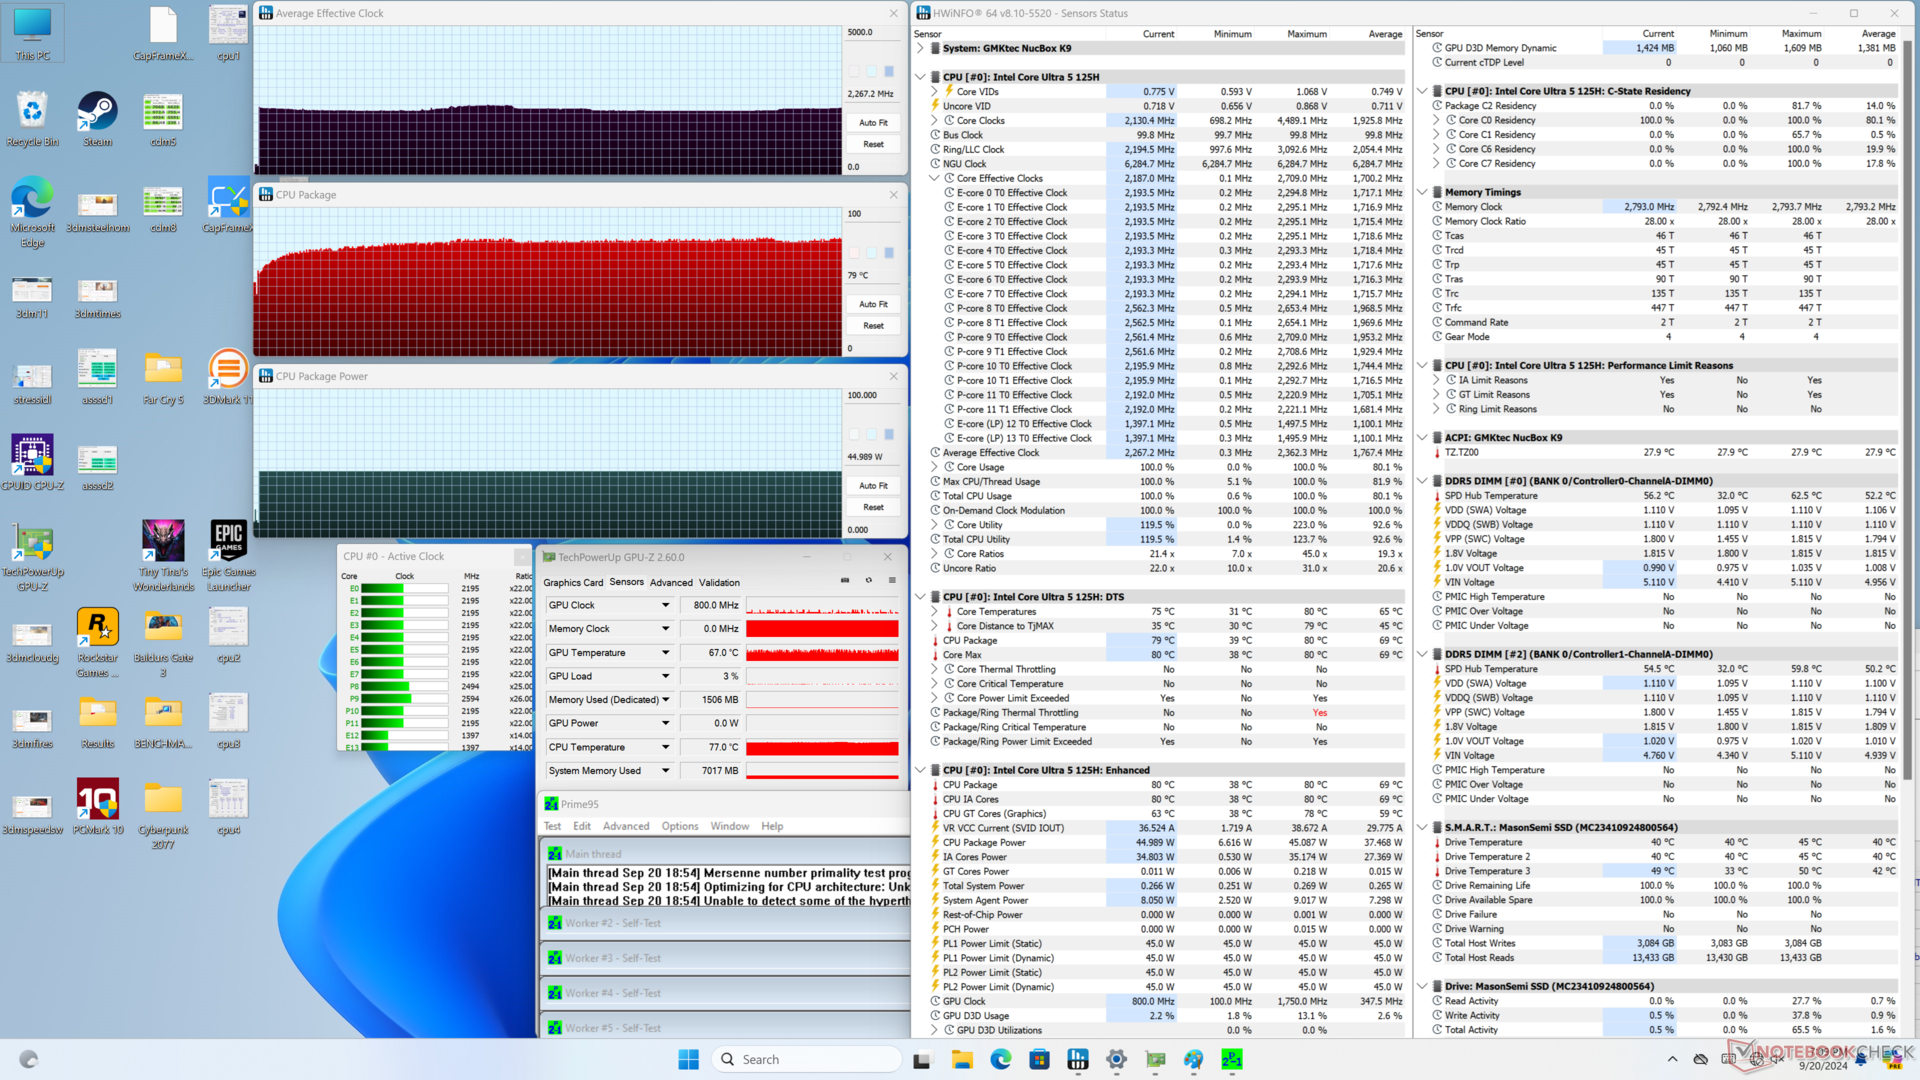
| Clock medio della CPU (GHz) | Clock della GPU (MHz) | Temperatura media della CPU (°C) | |
| Sistema inattivo | -- | -- | 40 |
| Prime95 Stress | 2.3 | -- | 79 |
| Prime95 + FurMark Stress | 2.2 | 1150 | 79 |
| Cyberpunk 2077 Stress | 0,9 | 1600 | 72 |
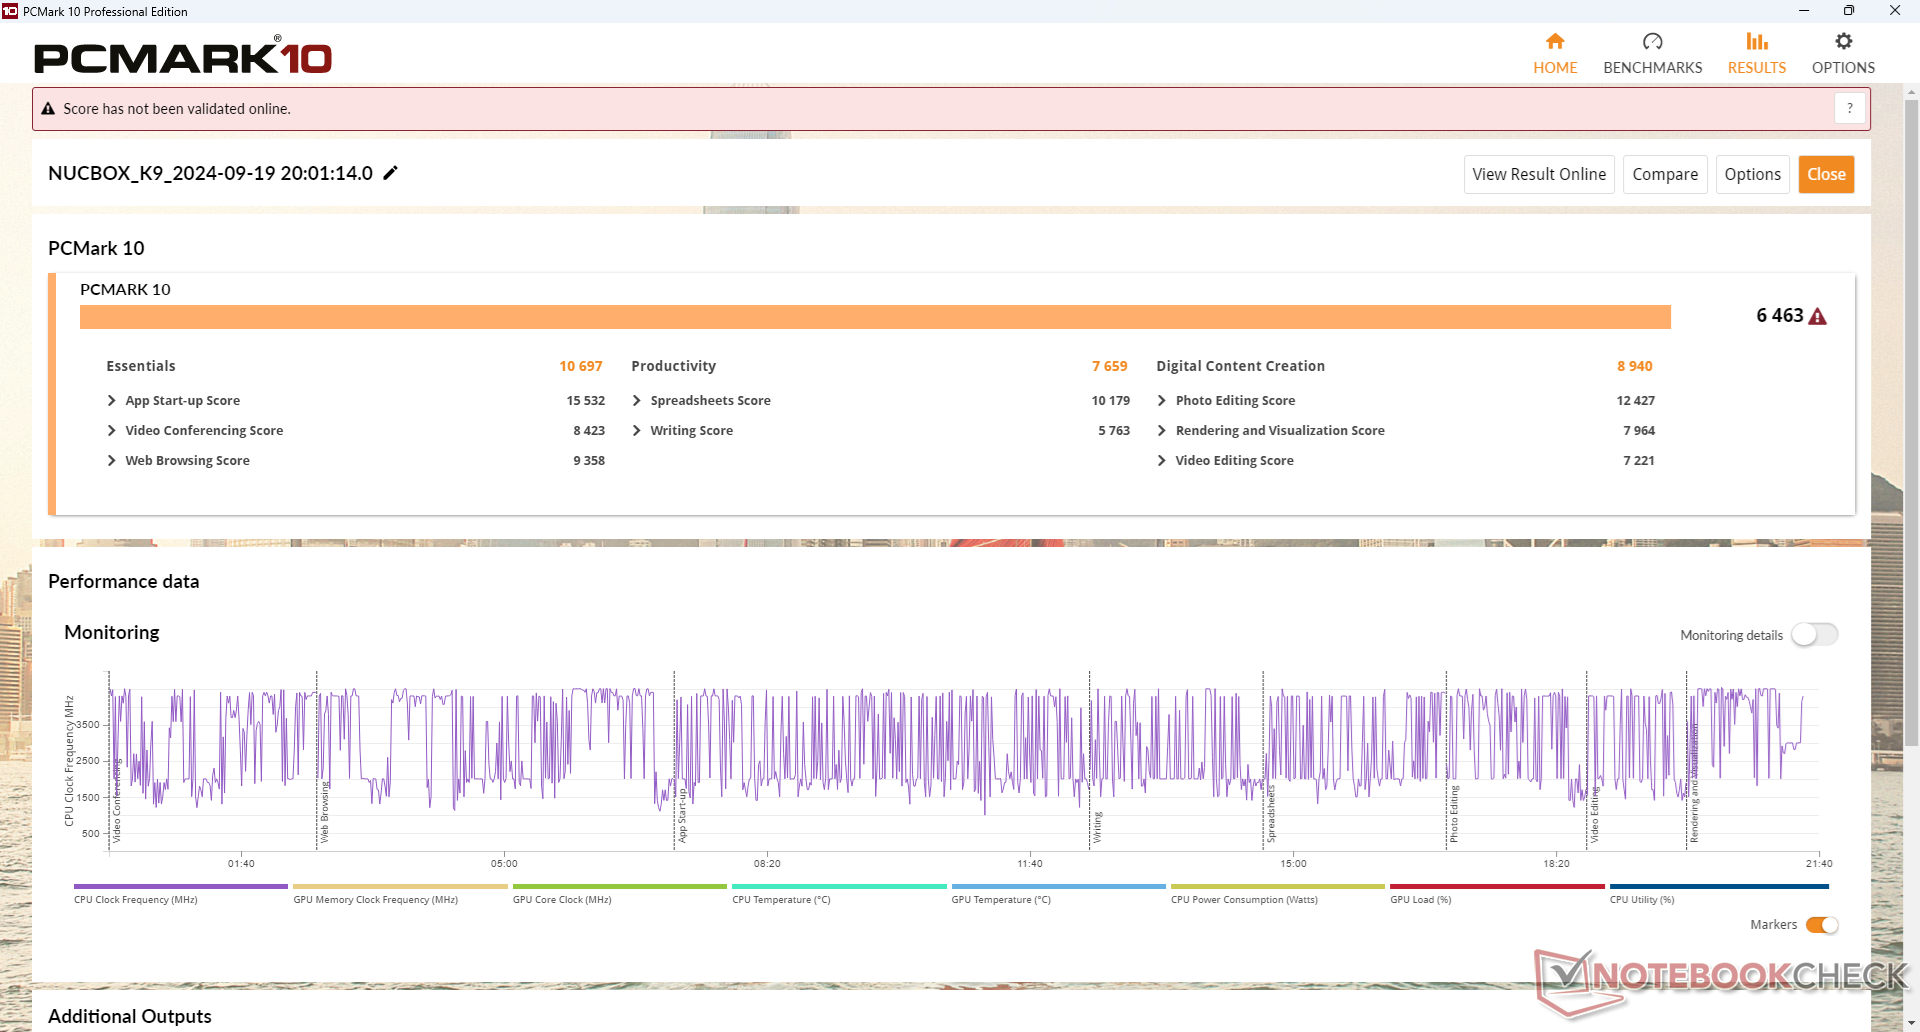
Prestazioni del sistema
CrossMark: Overall | Productivity | Creativity | Responsiveness
WebXPRT 3: Overall
WebXPRT 4: Overall
Mozilla Kraken 1.1: Total
| PCMark 10 / Score | |
| Beelink SER8 | |
| GMK NucBox K6 | |
| BOSGAME M1 | |
| GMK NucBox K9 | |
| Media Intel Core Ultra 5 125H, Intel Arc 7-Core iGPU (6024 - 6463, n=7) | |
| GMK NucBox M6 | |
| Beelink SEi12 Core i5-1235U | |
| PCMark 10 / Essentials | |
| Beelink SER8 | |
| GMK NucBox K6 | |
| BOSGAME M1 | |
| Beelink SEi12 Core i5-1235U | |
| GMK NucBox K9 | |
| GMK NucBox M6 | |
| Media Intel Core Ultra 5 125H, Intel Arc 7-Core iGPU (9427 - 10697, n=7) | |
| PCMark 10 / Productivity | |
| GMK NucBox K6 | |
| Beelink SER8 | |
| BOSGAME M1 | |
| GMK NucBox M6 | |
| Media Intel Core Ultra 5 125H, Intel Arc 7-Core iGPU (7042 - 8000, n=7) | |
| GMK NucBox K9 | |
| Beelink SEi12 Core i5-1235U | |
| PCMark 10 / Digital Content Creation | |
| Beelink SER8 | |
| BOSGAME M1 | |
| GMK NucBox K6 | |
| GMK NucBox K9 | |
| Media Intel Core Ultra 5 125H, Intel Arc 7-Core iGPU (8149 - 9506, n=7) | |
| GMK NucBox M6 | |
| Beelink SEi12 Core i5-1235U | |
| CrossMark / Overall | |
| BOSGAME M1 | |
| Beelink SER8 | |
| GMK NucBox K6 | |
| Beelink SEi12 Core i5-1235U | |
| GMK NucBox K9 | |
| Media Intel Core Ultra 5 125H, Intel Arc 7-Core iGPU (1480 - 1633, n=6) | |
| GMK NucBox M6 | |
| CrossMark / Productivity | |
| BOSGAME M1 | |
| GMK NucBox K6 | |
| Beelink SER8 | |
| Beelink SEi12 Core i5-1235U | |
| GMK NucBox K9 | |
| GMK NucBox M6 | |
| Media Intel Core Ultra 5 125H, Intel Arc 7-Core iGPU (1432 - 1594, n=6) | |
| CrossMark / Creativity | |
| BOSGAME M1 | |
| Beelink SER8 | |
| GMK NucBox K6 | |
| GMK NucBox K9 | |
| Media Intel Core Ultra 5 125H, Intel Arc 7-Core iGPU (1520 - 1765, n=6) | |
| GMK NucBox M6 | |
| Beelink SEi12 Core i5-1235U | |
| CrossMark / Responsiveness | |
| Beelink SEi12 Core i5-1235U | |
| BOSGAME M1 | |
| Beelink SER8 | |
| GMK NucBox K6 | |
| GMK NucBox K9 | |
| GMK NucBox M6 | |
| Media Intel Core Ultra 5 125H, Intel Arc 7-Core iGPU (1171 - 1520, n=6) | |
| WebXPRT 3 / Overall | |
| Beelink SER8 | |
| GMK NucBox K6 | |
| BOSGAME M1 | |
| Beelink SEi12 Core i5-1235U | |
| GMK NucBox K9 | |
| Media Intel Core Ultra 5 125H, Intel Arc 7-Core iGPU (245 - 263, n=7) | |
| GMK NucBox M6 | |
| WebXPRT 4 / Overall | |
| GMK NucBox K6 | |
| Beelink SER8 | |
| BOSGAME M1 | |
| Beelink SEi12 Core i5-1235U | |
| GMK NucBox K9 | |
| Media Intel Core Ultra 5 125H, Intel Arc 7-Core iGPU (222 - 240, n=6) | |
| GMK NucBox M6 | |
| Mozilla Kraken 1.1 / Total | |
| GMK NucBox M6 | |
| Beelink SEi12 Core i5-1235U | |
| Media Intel Core Ultra 5 125H, Intel Arc 7-Core iGPU (560 - 607, n=7) | |
| GMK NucBox K9 | |
| GMK NucBox K6 | |
| BOSGAME M1 | |
| Beelink SER8 | |
* ... Meglio usare valori piccoli
| PCMark 10 Score | 6463 punti | |
Aiuto | ||
| AIDA64 / Memory Copy | |
| Media Intel Core Ultra 5 125H (37664 - 87473, n=7) | |
| BOSGAME M1 | |
| GMK NucBox K6 | |
| Beelink SER8 | |
| GMK NucBox K9 | |
| GMK NucBox M6 | |
| Beelink SEi12 Core i5-1235U | |
| AIDA64 / Memory Read | |
| GMK NucBox K9 | |
| Media Intel Core Ultra 5 125H (41700 - 76803, n=7) | |
| Beelink SER8 | |
| BOSGAME M1 | |
| GMK NucBox K6 | |
| GMK NucBox M6 | |
| Beelink SEi12 Core i5-1235U | |
| AIDA64 / Memory Write | |
| BOSGAME M1 | |
| GMK NucBox K6 | |
| Beelink SER8 | |
| GMK NucBox K9 | |
| Media Intel Core Ultra 5 125H (35730 - 72443, n=7) | |
| GMK NucBox M6 | |
| Beelink SEi12 Core i5-1235U | |
| AIDA64 / Memory Latency | |
| Media Intel Core Ultra 5 125H (127.3 - 184.8, n=7) | |
| GMK NucBox K9 | |
| Beelink SEi12 Core i5-1235U | |
| BOSGAME M1 | |
| Beelink SER8 | |
| GMK NucBox K6 | |
| GMK NucBox M6 | |
* ... Meglio usare valori piccoli
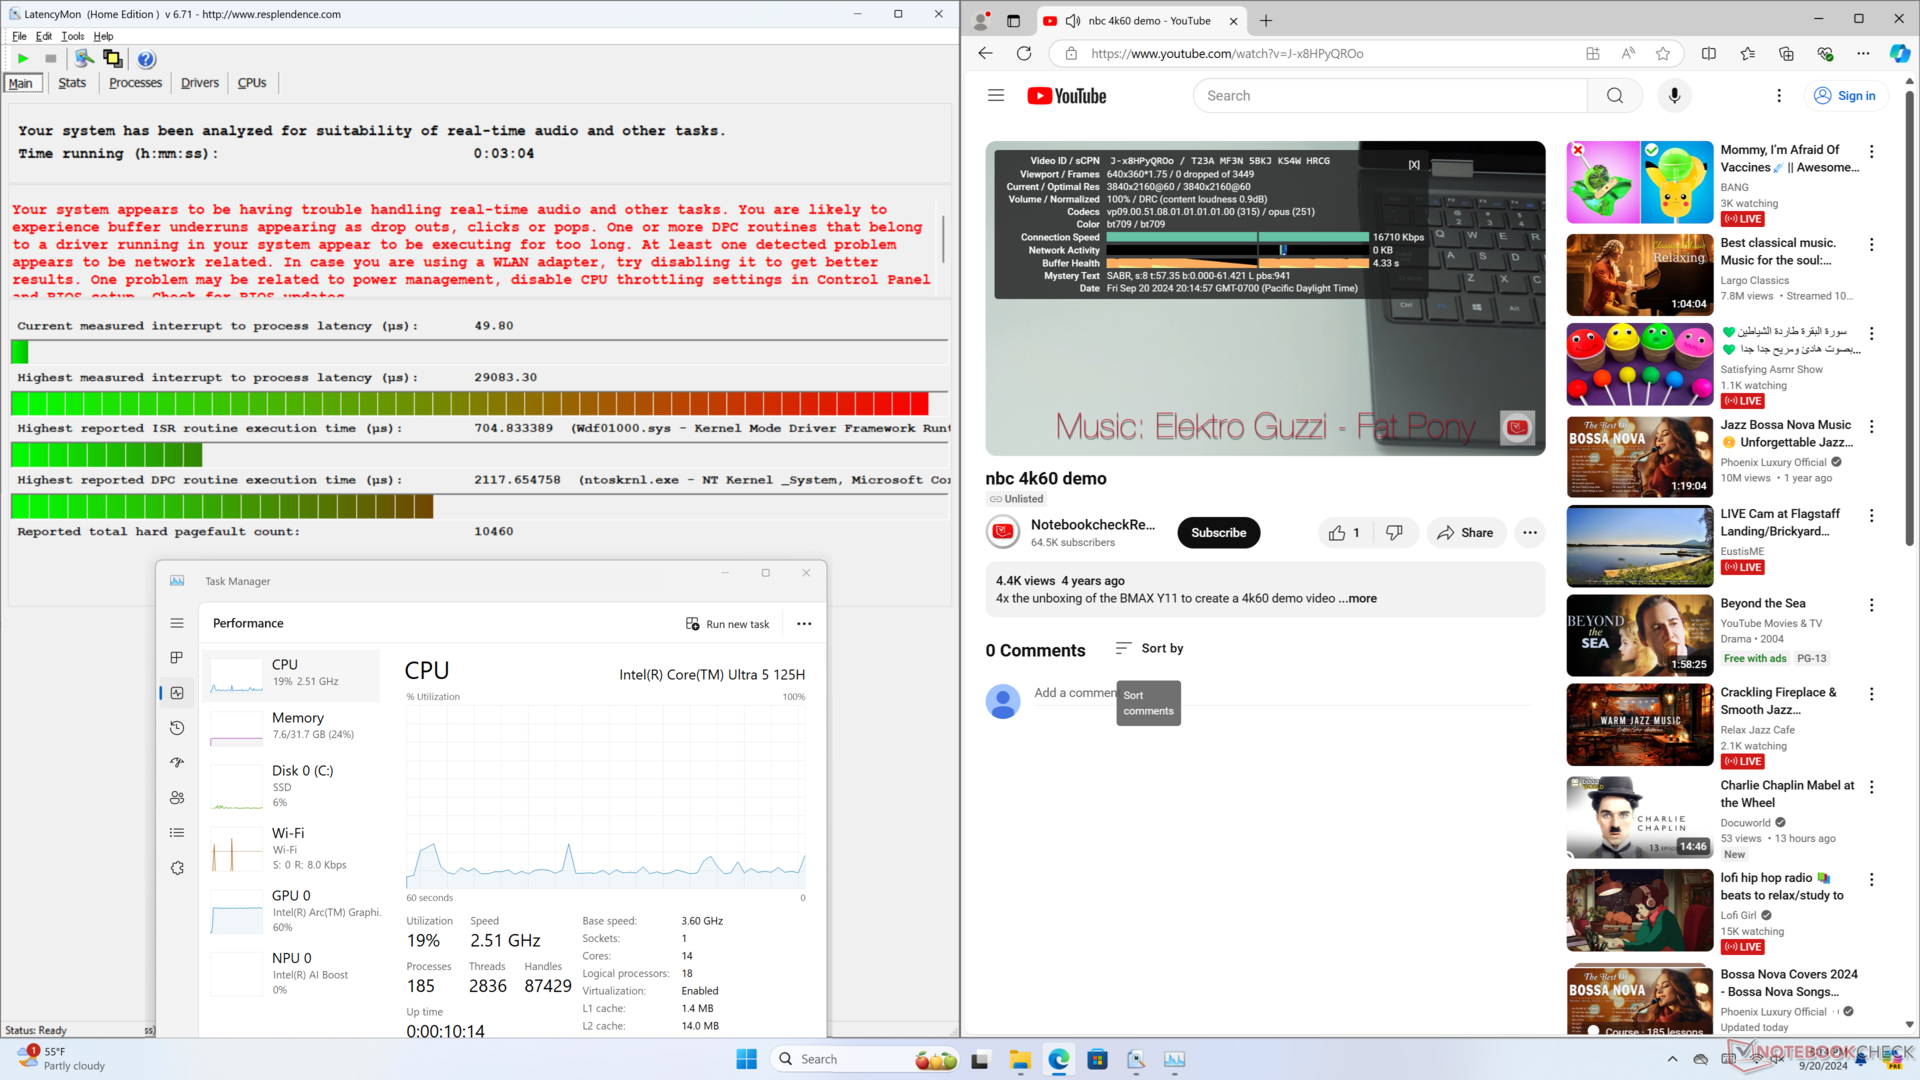
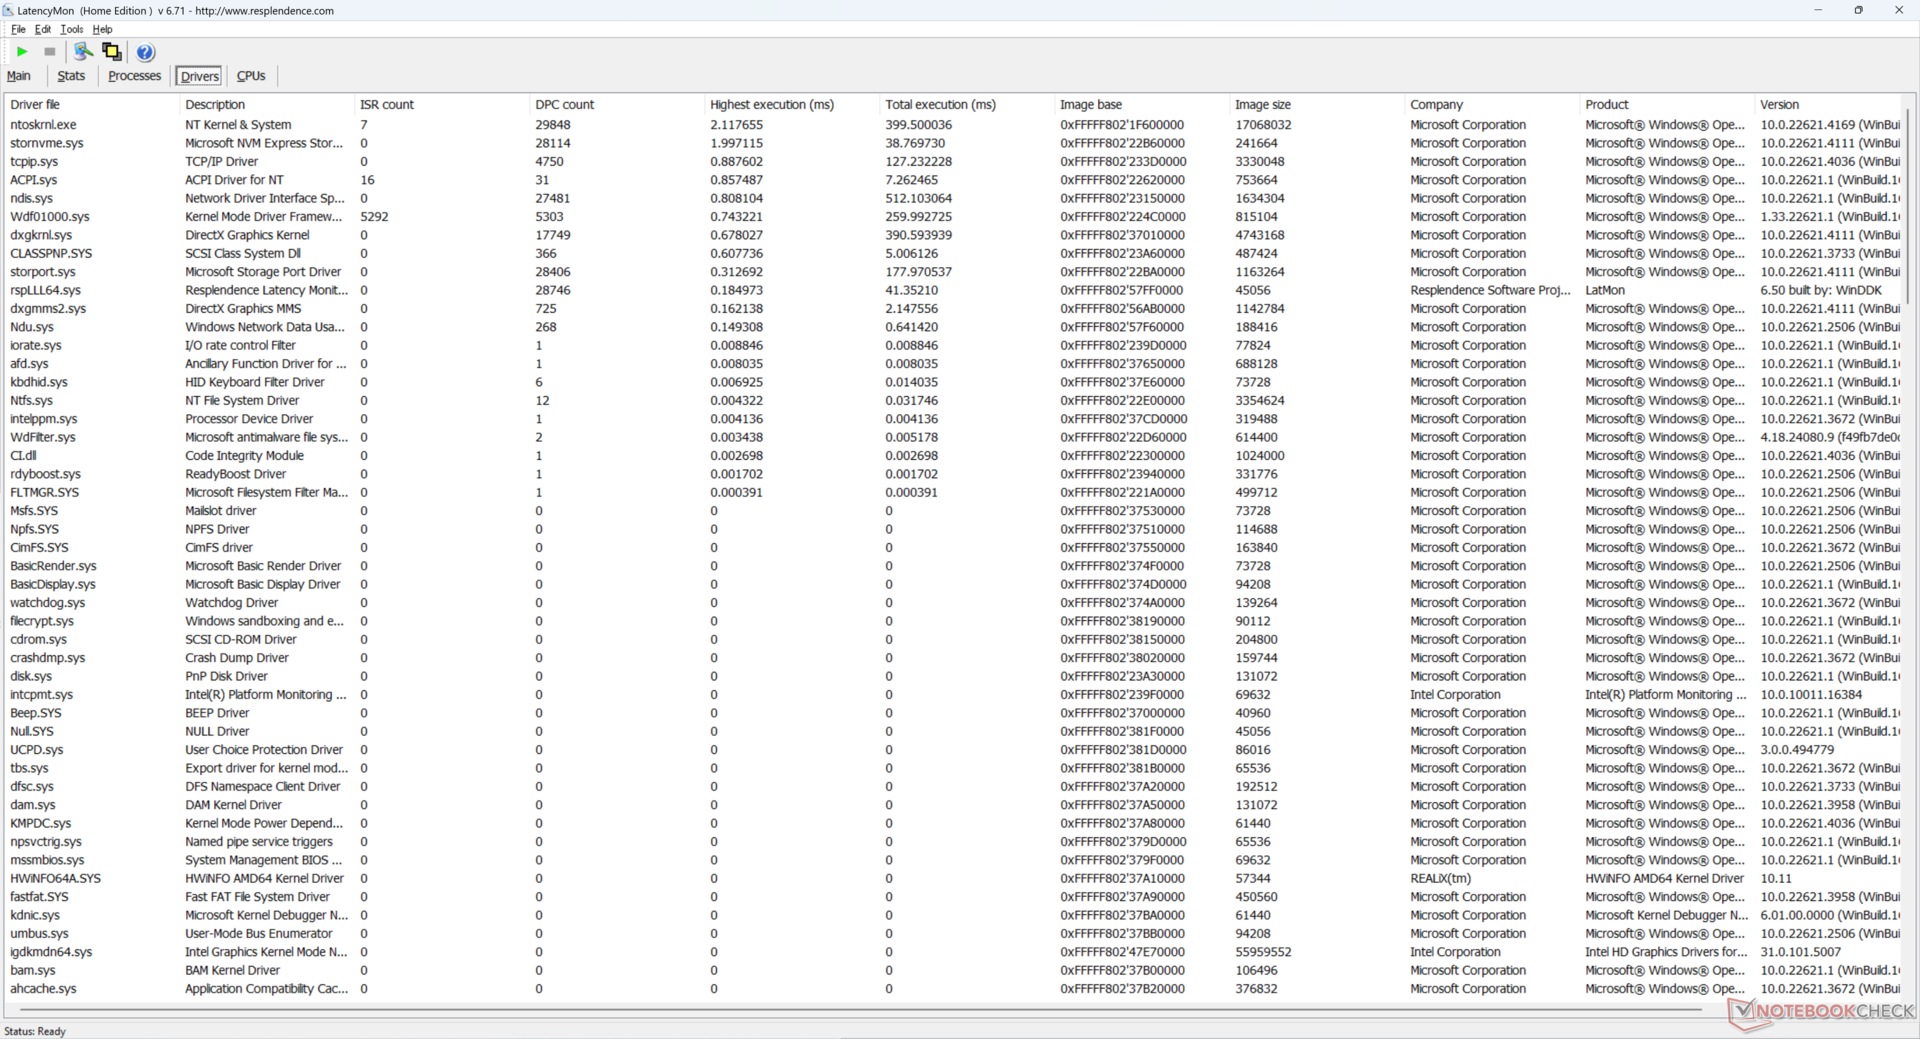
Latenza DPC
LatencyMon rivela problemi DPC legati a ntoskrnl.exe quando si aprono più schede della nostra homepage. la riproduzione di video 4K a 60 FPS è invece perfetta, senza alcuna perdita di fotogrammi.
| DPC Latencies / LatencyMon - interrupt to process latency (max), Web, Youtube, Prime95 | |
| GMK NucBox K9 | |
| GMK NucBox M6 | |
| GMK NucBox K6 | |
| BOSGAME M1 | |
| Beelink SER8 | |
| Beelink SEi12 Core i5-1235U | |
* ... Meglio usare valori piccoli
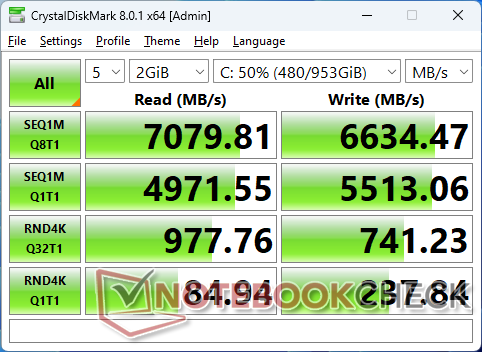
Dispositivi di archiviazione
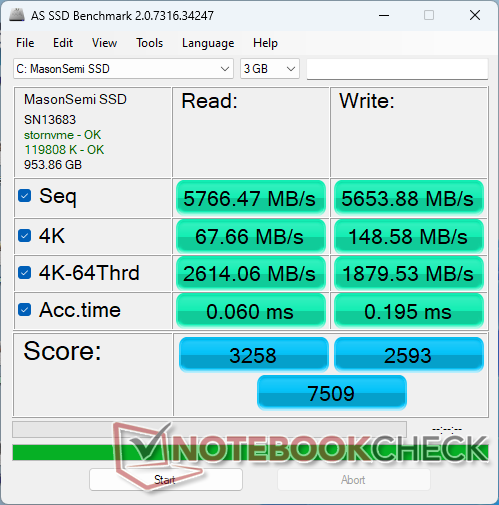
GMK utilizza lo stesso sistema da 1 TB MasonSemi MC7000 PCIe4 x4 NVMe per entrambi i modelli NucBox K6 e K9. Le prestazioni sono veloci e paragonabili alla serie Samsung PM9A1, comunemente presente nei PC di fascia alta, nonostante il marchio meno conosciuto. Non si nota alcun rallentamento delle prestazioni quando si esegue DiskSpd in loop.

| Drive Performance Rating - Percent | |
| GMK NucBox K6 | |
| GMK NucBox K9 | |
| Beelink SEi12 Core i5-1235U | |
| Beelink SER8 | |
| BOSGAME M1 | |
| GMK NucBox M6 | |
* ... Meglio usare valori piccoli
Disk Throttling: DiskSpd Read Loop, Queue Depth 8
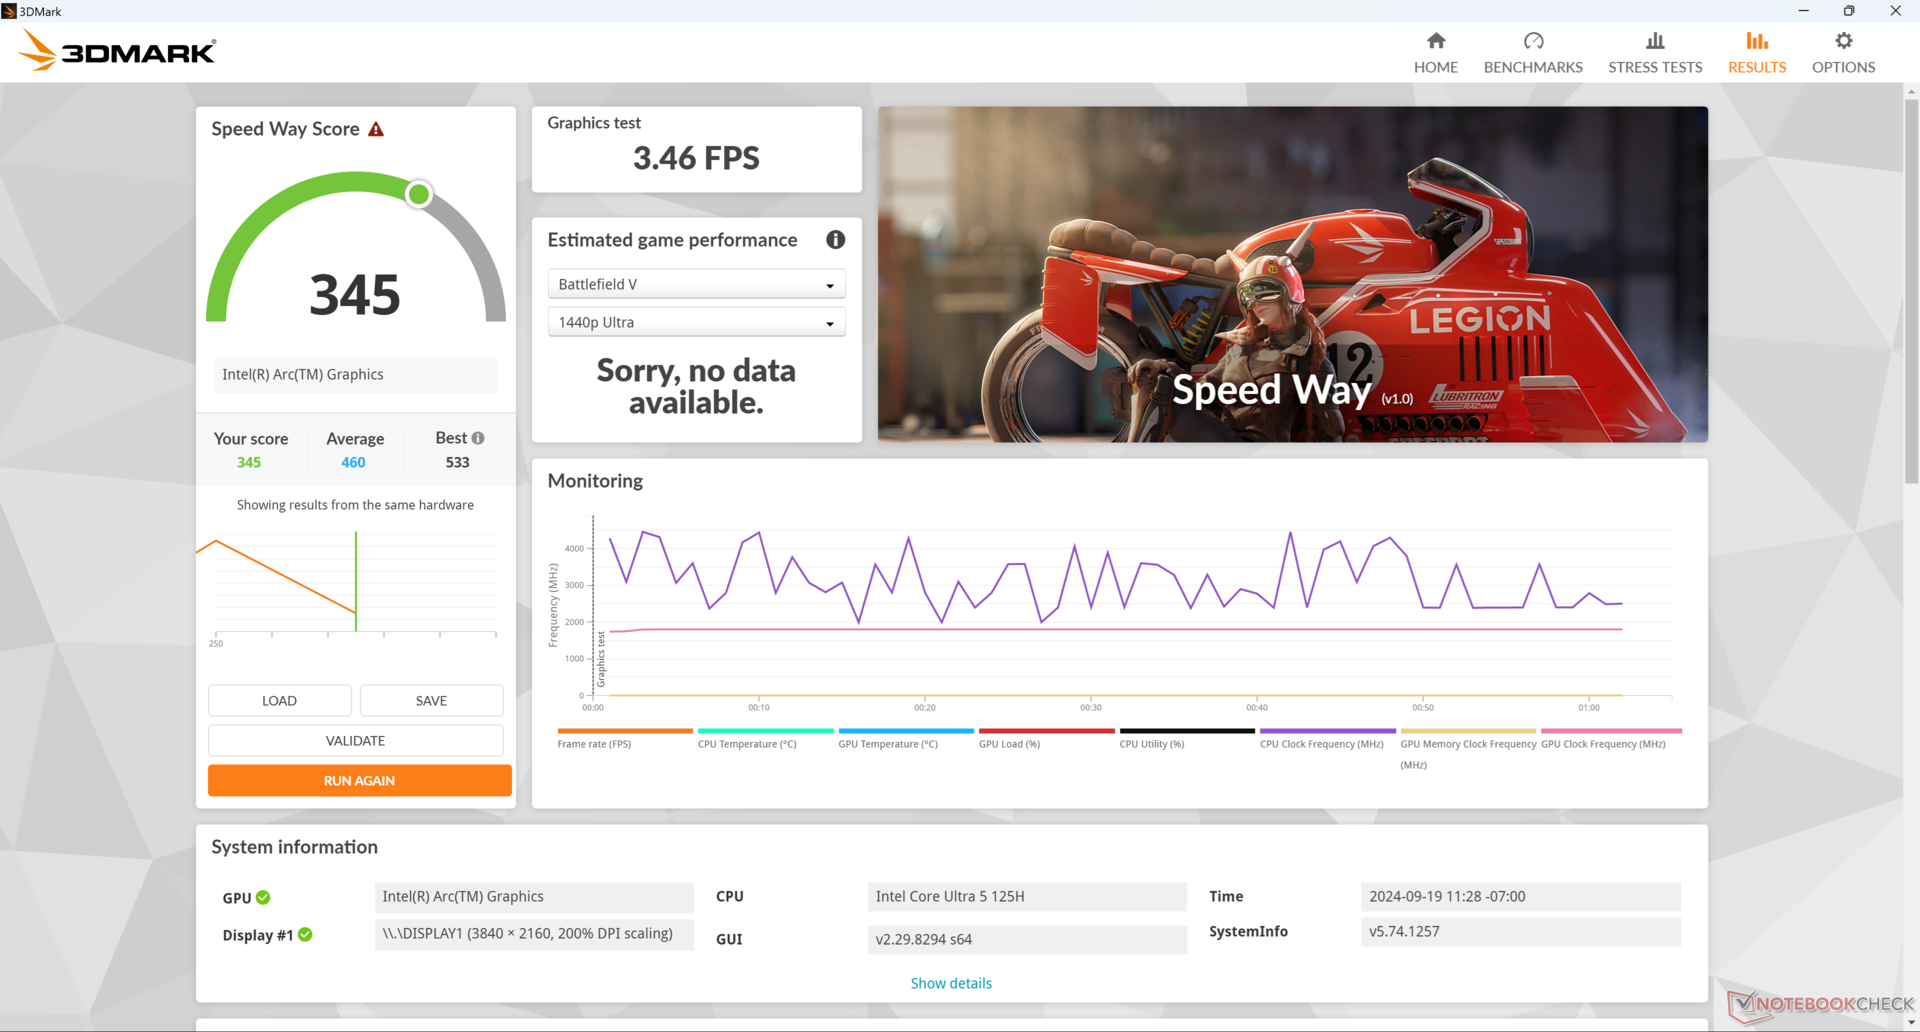
Prestazioni della GPU
Le prestazioni grafiche sono leggermente più lente rispetto alla media dei PC del nostro database con lo stesso sistema di gPU Arc 7 integrata Di circa il 5 percento. La GPU Arc 8 integrata nei processori Core Ultra 7-H e Core Ultra 9-H di fascia alta è più veloce della nostra soluzione Arc 7 di circa il 15%, ma purtroppo non ci sono SKU di questo tipo disponibili con NucBox K9. Tuttavia, le prestazioni complessive sono paragonabili a quelle della soluzione concorrente di ultima generazione Radeon 780M secondo i benchmark 3DMark.
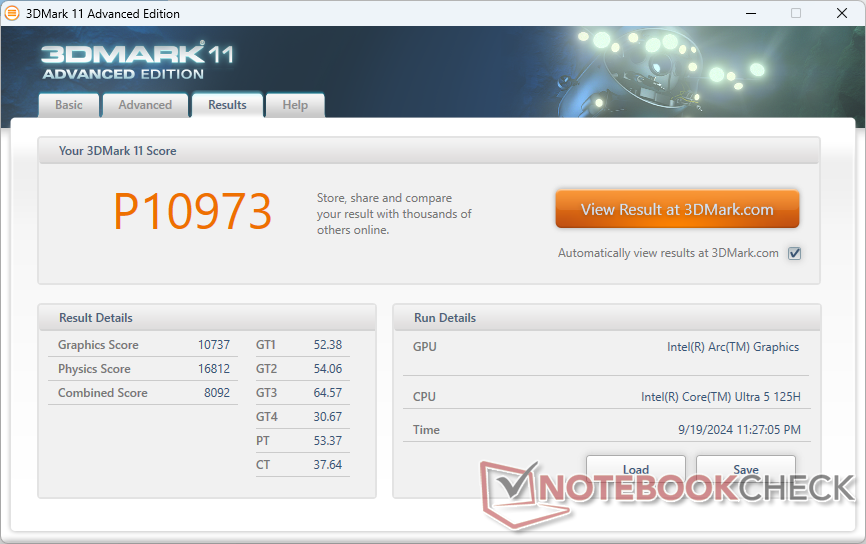
| 3DMark 11 Performance | 10973 punti | |
| 3DMark Cloud Gate Standard Score | 28997 punti | |
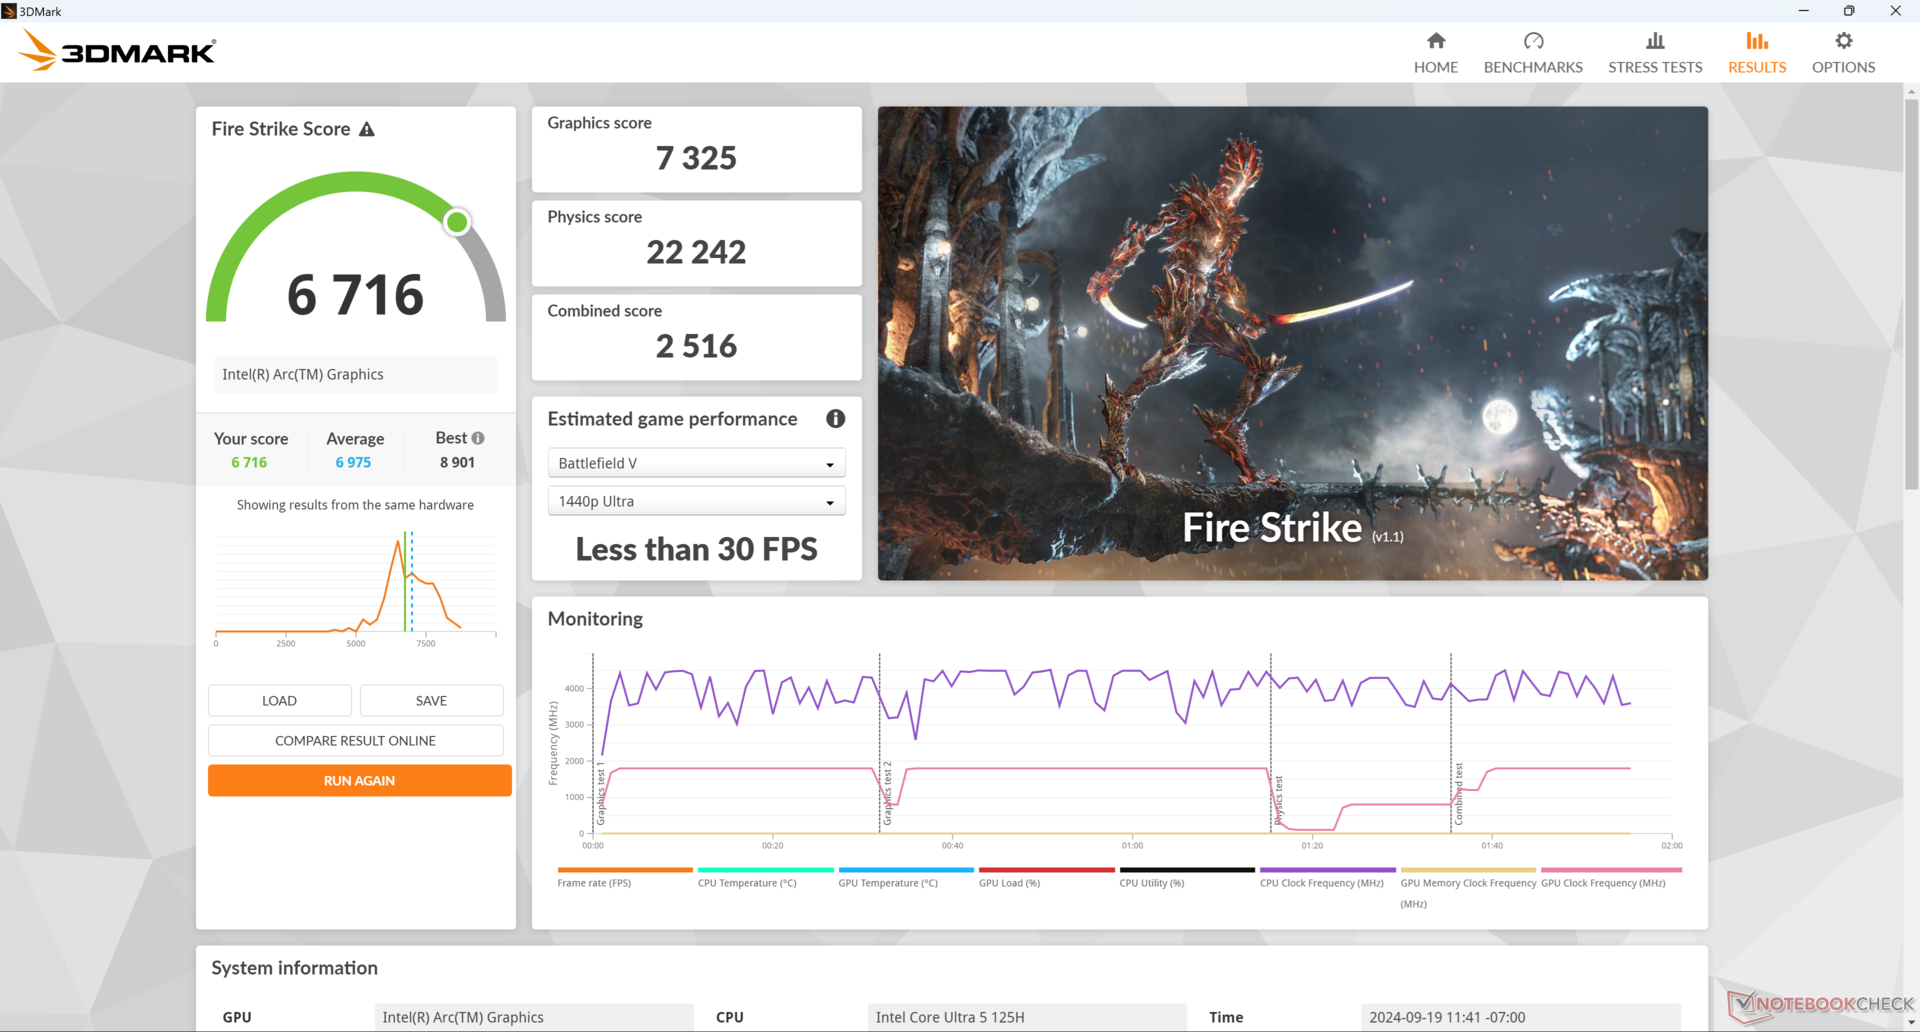
| 3DMark Fire Strike Score | 6716 punti | |
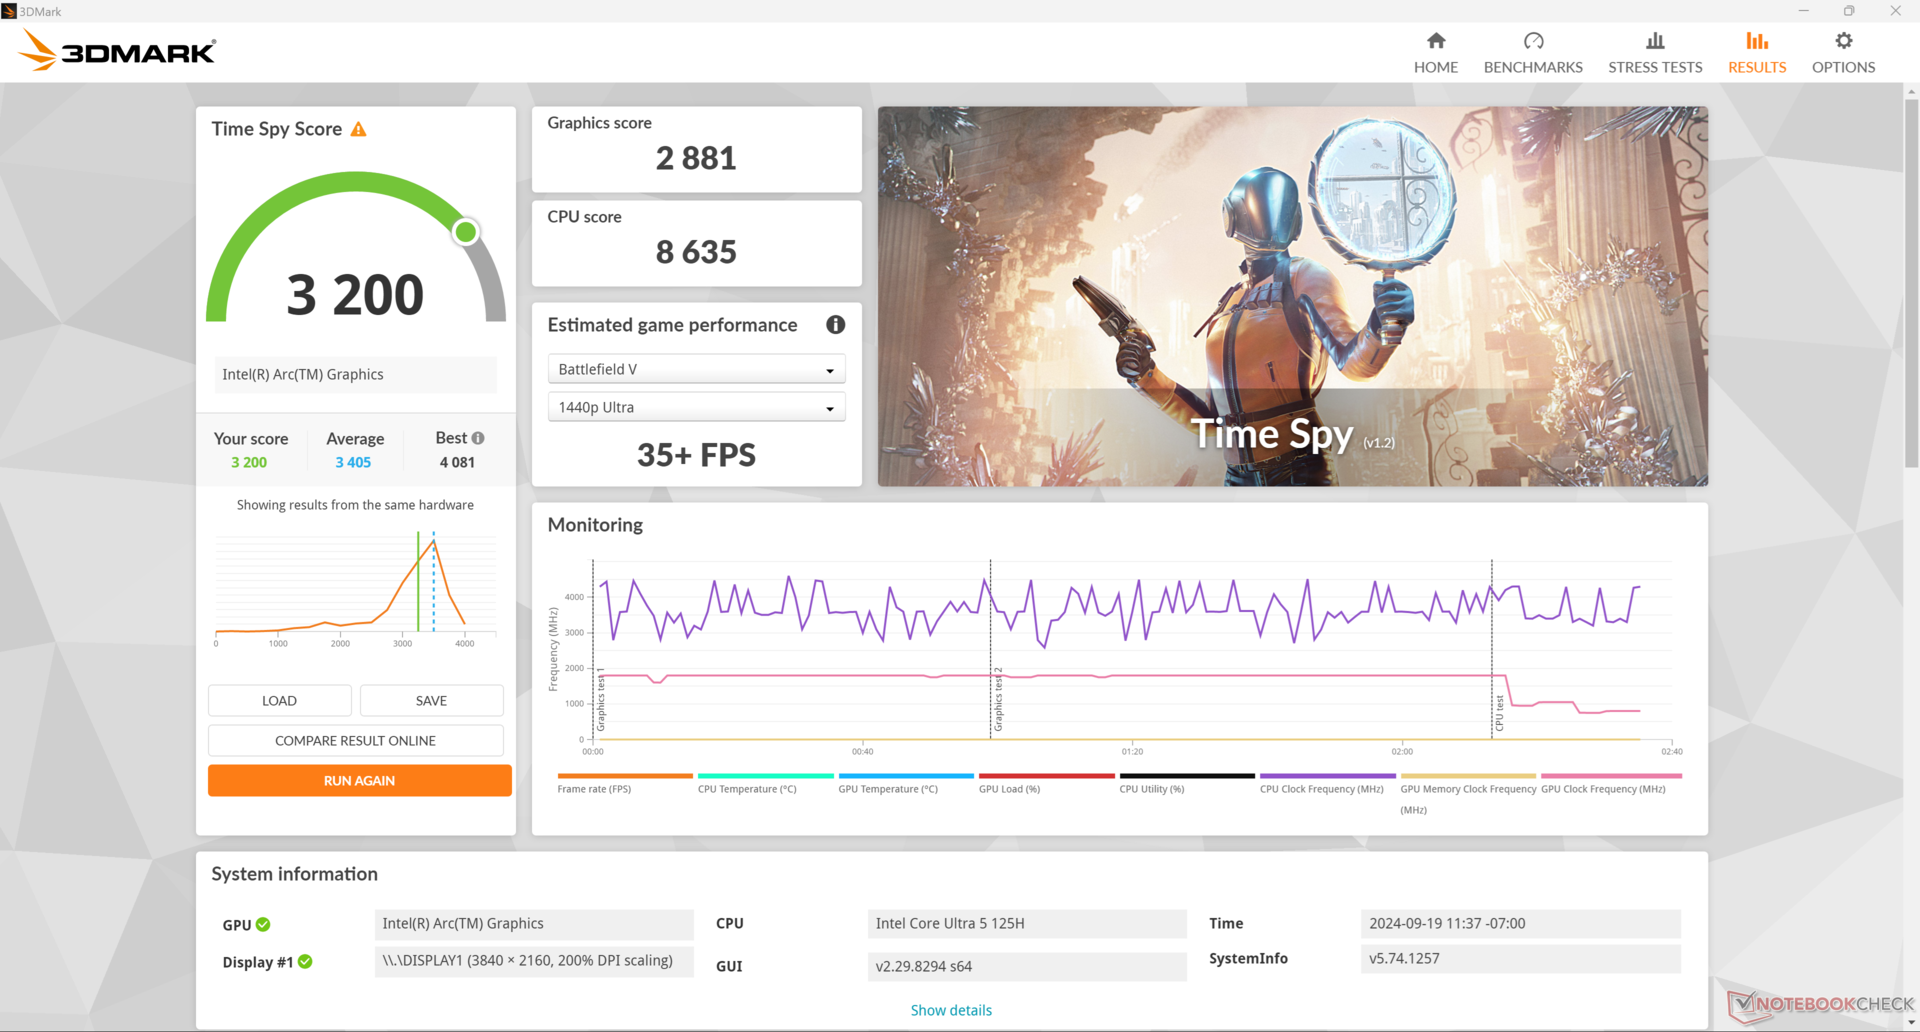
| 3DMark Time Spy Score | 3200 punti | |
| 3DMark Steel Nomad Score | 581 punti | |
Aiuto | ||
* ... Meglio usare valori piccoli
Prestazioni di gioco
Purtroppo, le prestazioni di gioco sono molto più lente rispetto alla NucBox K6, anche se i risultati di 3DMark sopra riportati suggeriscono il contrario. La maggior parte dei titoli testati, tra cui GTA V, DOTA 2 Reborn, Final Fantasy XV, F1 22 e Baldur's Gate 3 , sono stati eseguiti tra il 10 e il 40% più lentamente sul nostro NucBox K9 con processore Intel. Anche le frequenze dei fotogrammi si bloccano quando sono al minimo su Cyberpunk 2077, come mostra il nostro grafico qui sotto.
| Performance Rating - Percent | |
| BOSGAME M1 -1! | |
| Beelink SER8 -1! | |
| GMK NucBox K6 | |
| GMK NucBox K9 | |
| GMK NucBox M6 -1! | |
| Beelink SEi12 Core i5-1235U -1! | |
| GTA V - 1920x1080 Highest Settings possible AA:4xMSAA + FX AF:16x | |
| GMK NucBox K6 | |
| GMK NucBox K9 | |
| Beelink SEi12 Core i5-1235U | |
| Final Fantasy XV Benchmark - 1920x1080 High Quality | |
| BOSGAME M1 | |
| Beelink SER8 | |
| GMK NucBox K6 | |
| GMK NucBox K9 | |
| GMK NucBox M6 | |
| Beelink SEi12 Core i5-1235U | |
| Strange Brigade - 1920x1080 ultra AA:ultra AF:16 | |
| BOSGAME M1 | |
| Beelink SER8 | |
| GMK NucBox K6 | |
| GMK NucBox K9 | |
| GMK NucBox M6 | |
| Beelink SEi12 Core i5-1235U | |
| Dota 2 Reborn - 1920x1080 ultra (3/3) best looking | |
| Beelink SER8 | |
| BOSGAME M1 | |
| GMK NucBox K6 | |
| GMK NucBox K9 | |
| GMK NucBox M6 | |
| Beelink SEi12 Core i5-1235U | |
| X-Plane 11.11 - 1920x1080 high (fps_test=3) | |
| GMK NucBox K6 | |
| Beelink SER8 | |
| BOSGAME M1 | |
| GMK NucBox K9 | |
| GMK NucBox M6 | |
| Beelink SEi12 Core i5-1235U | |
| Far Cry 5 - 1920x1080 Ultra Preset AA:T | |
| BOSGAME M1 | |
| Beelink SER8 | |
| GMK NucBox K6 | |
| GMK NucBox K9 | |
| GMK NucBox M6 | |
| F1 22 | |
| 1280x720 Ultra Low Preset AA:T AF:16x | |
| GMK NucBox K6 | |
| Beelink SER8 | |
| GMK NucBox K9 | |
| Media Intel Arc 7-Core iGPU (n=1) | |
| Framework Laptop 13.5 Core Ultra 7 155H | |
| GMK NucBox M6 | |
| 1920x1080 Low Preset AA:T AF:16x | |
| GMK NucBox K6 | |
| Beelink SER8 | |
| GMK NucBox K9 | |
| Media Intel Arc 7-Core iGPU (n=1) | |
| Framework Laptop 13.5 Core Ultra 7 155H | |
| GMK NucBox M6 | |
| 1920x1080 Medium Preset AA:T AF:16x | |
| GMK NucBox K6 | |
| Beelink SER8 | |
| GMK NucBox K9 | |
| Media Intel Arc 7-Core iGPU (n=1) | |
| Framework Laptop 13.5 Core Ultra 7 155H | |
| GMK NucBox M6 | |
| 1920x1080 High Preset AA:T AF:16x | |
| GMK NucBox K6 | |
| Beelink SER8 | |
| Framework Laptop 13.5 Core Ultra 7 155H | |
| GMK NucBox K9 | |
| Media Intel Arc 7-Core iGPU (n=1) | |
| GMK NucBox M6 | |
Cyberpunk 2077 ultra FPS Chart
| basso | medio | alto | ultra | |
|---|---|---|---|---|
| GTA V (2015) | 143.6 | 125.5 | 33.6 | 12.7 |
| Dota 2 Reborn (2015) | 97.7 | 83.1 | 75.6 | 73.3 |
| Final Fantasy XV Benchmark (2018) | 59.6 | 33.3 | 22.3 | |
| X-Plane 11.11 (2018) | 57 | 44.8 | 37.3 | |
| Far Cry 5 (2018) | 71 | 40 | 37 | 35 |
| Strange Brigade (2018) | 148.6 | 63.9 | 53.5 | 43.5 |
| Tiny Tina's Wonderlands (2022) | 50.7 | 39.4 | 26.8 | 22.4 |
| F1 22 (2022) | 79.4 | 71.9 | 52.9 | |
| Baldur's Gate 3 (2023) | 33.7 | 27.9 | 24.2 | 23.1 |
| Cyberpunk 2077 2.2 Phantom Liberty (2023) | 30.9 | 25.2 | 21.3 | 18.8 |
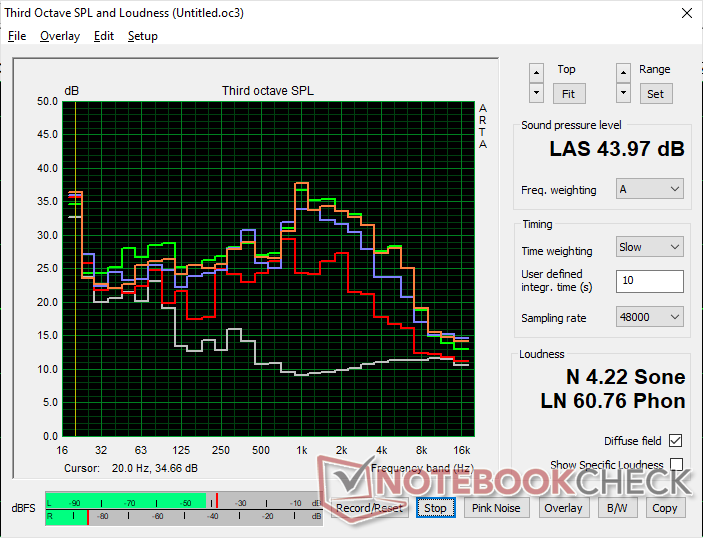
Emissioni - Le ventole sono sempre accese
Rumore del sistema
Il rumore della ventola è sempre presente sull'unità, indipendentemente dal carico sullo schermo, proprio come abbiamo registrato su NucBox K6. Il semplice funzionamento al minimo sul desktop è già da 30 a 36 dB(A) contro uno sfondo silenzioso di 23 dB(A), anche quando è impostato sulla modalità Risparmio energetico. Tuttavia, il rumore della ventola quando si gioca o si eseguono altri carichi impegnativi sembra essere più silenzioso su NucBox K9, con circa 44 dB(A) rispetto ai quasi 48 dB(A) di NucBox K6.
Rumorosità
| Idle |
| 29.8 / 35.7 / 35.7 dB(A) |
| Sotto carico |
| 41.9 / 44 dB(A) |
 | ||
30 dB silenzioso 40 dB(A) udibile 50 dB(A) rumoroso |
||
min: | ||
| GMK NucBox K9 Arc 7-Core, Ultra 5 125H, MasonSemi 1TB MC7000 | GMK NucBox K6 Radeon 780M, R7 7840HS, MasonSemi 1TB MC7000 | GMK NucBox M6 Radeon 660M, R5 6600H, AirDisk APF 10-512G | Beelink SER8 Radeon 780M, R7 8845HS, Crucial P3 Plus CT1000P3PSSD8 | Beelink SEi12 Core i5-1235U Iris Xe G7 80EUs, i5-1235U, Kingston NV1 SNVS/500GCN | BOSGAME M1 Radeon 780M, R7 7840HS | |
|---|---|---|---|---|---|---|
| Noise | -2% | -4% | 14% | 14% | 4% | |
| off /ambiente * | 23 | 23.2 -1% | 24.2 -5% | 23.6 -3% | 23.3 -1% | 23.2 -1% |
| Idle Minimum * | 29.8 | 31.3 -5% | 31.9 -7% | 28.8 3% | 27.8 7% | 32 -7% |
| Idle Average * | 35.7 | 31.3 12% | 32 10% | 28.8 19% | 27.8 22% | 32 10% |
| Idle Maximum * | 35.7 | 33.4 6% | 33.8 5% | 30.5 15% | 27.8 22% | 32 10% |
| Load Average * | 41.9 | 47.5 -13% | 48.5 -16% | 34.6 17% | 32 24% | 38.7 8% |
| Cyberpunk 2077 ultra * | 43.8 | 34.1 22% | ||||
| Load Maximum * | 44 | 47.7 -8% | 48.5 -10% | 34.5 22% | 39.2 11% | 42 5% |
| Witcher 3 ultra * | 43.6 | 48.5 | 34.1 | 41.7 |
* ... Meglio usare valori piccoli
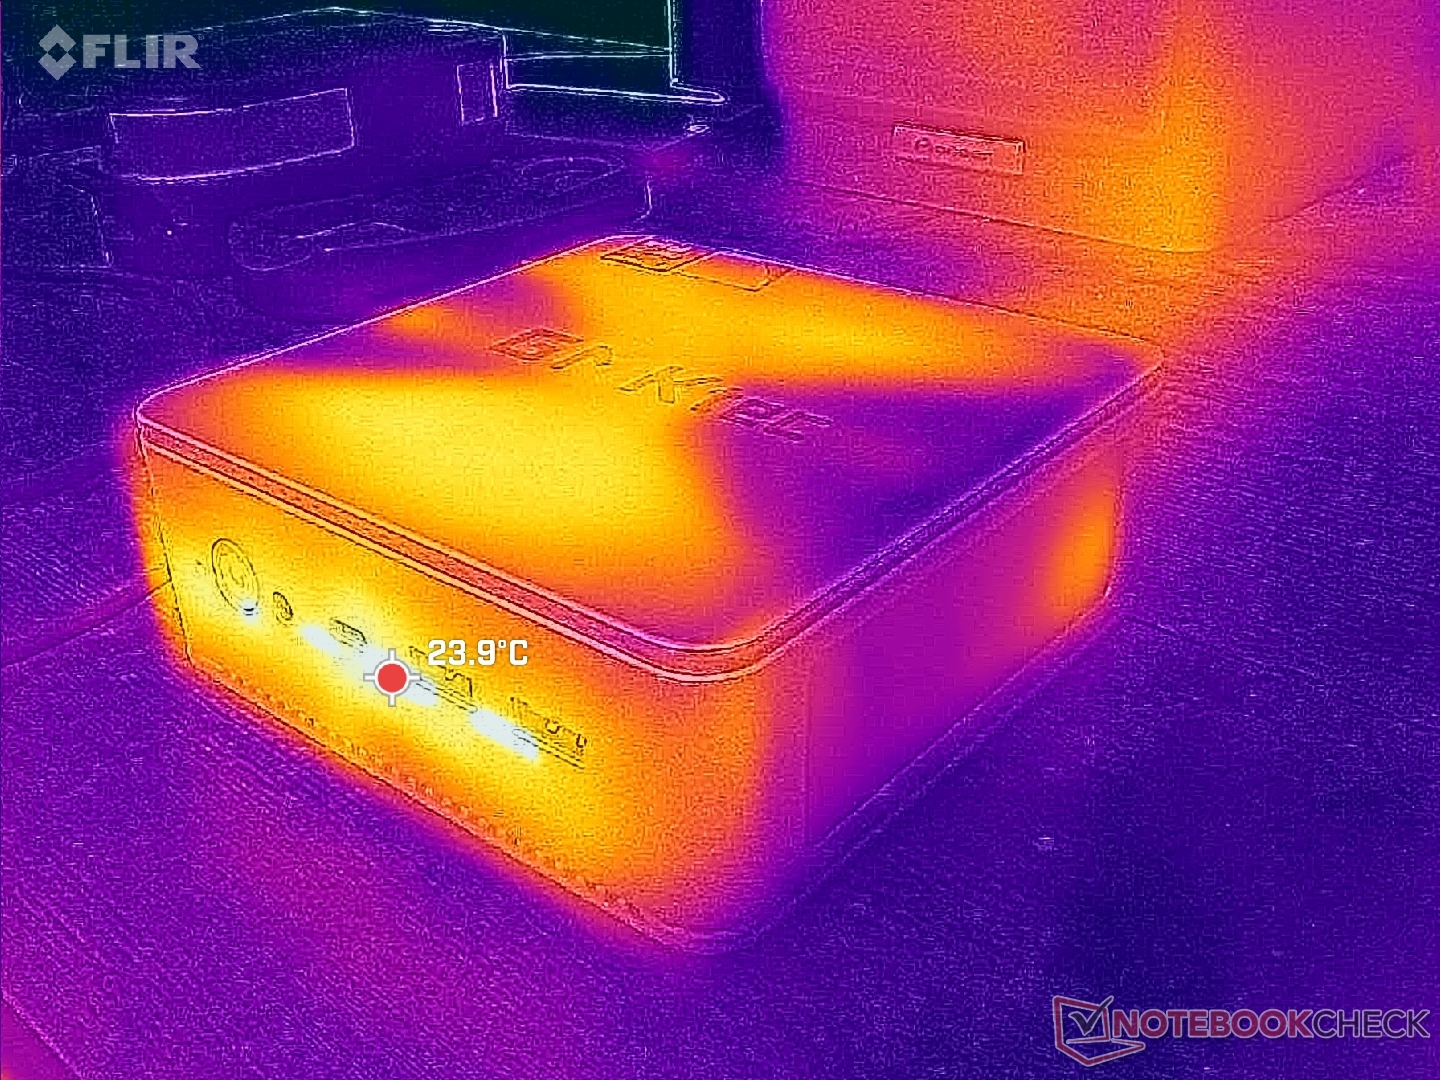
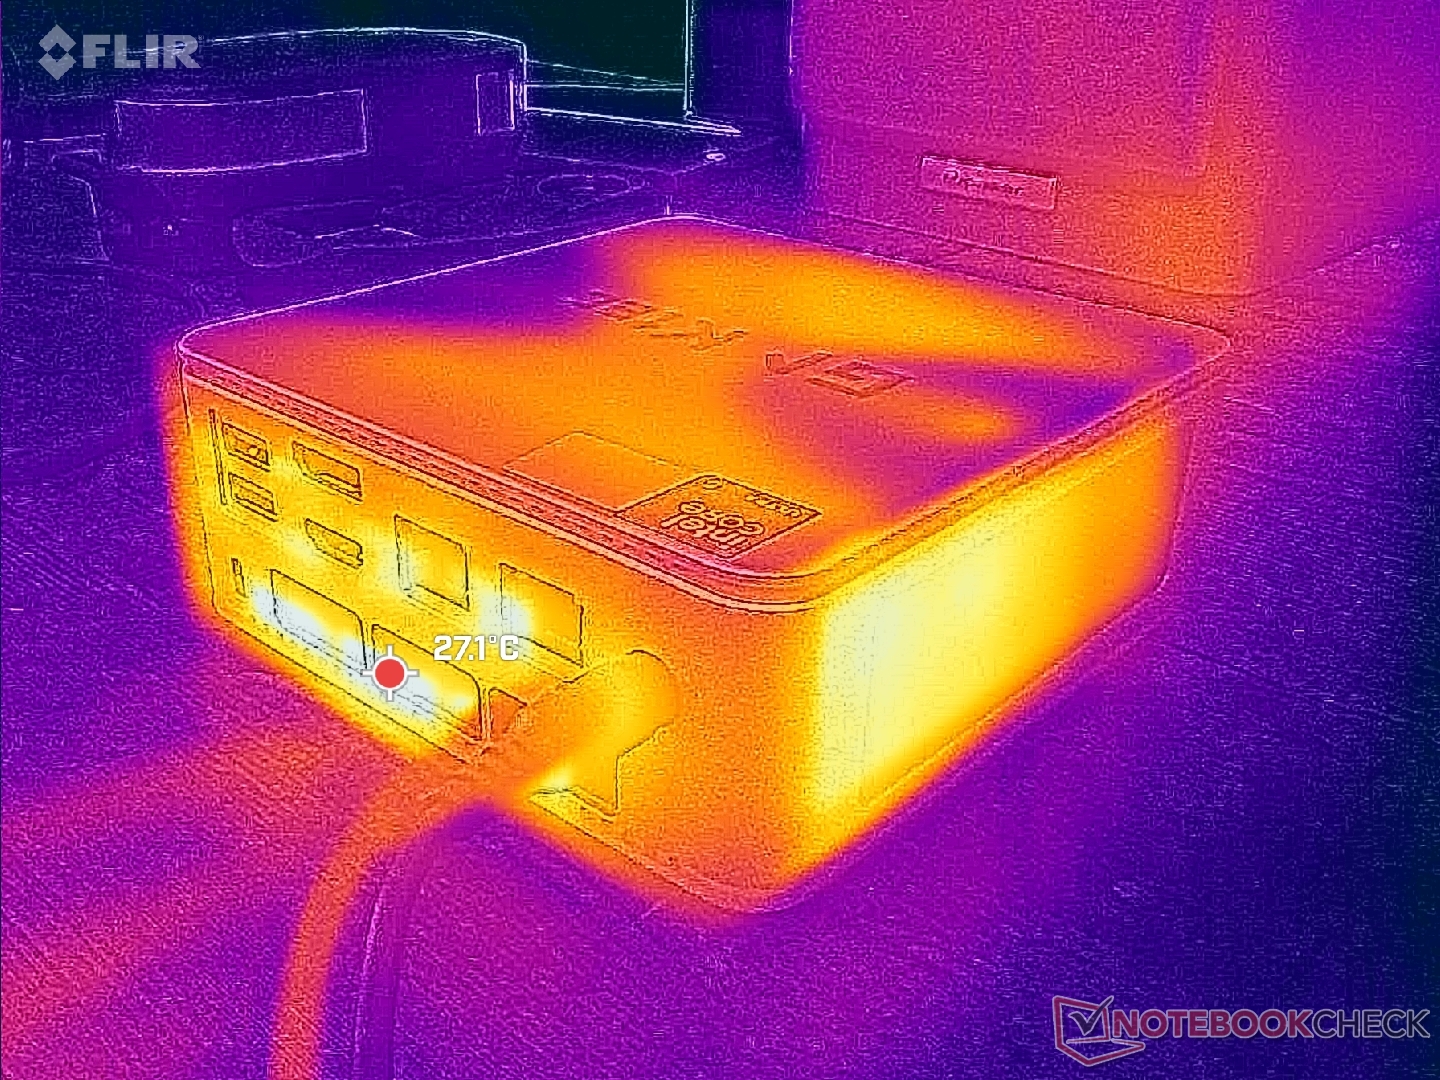
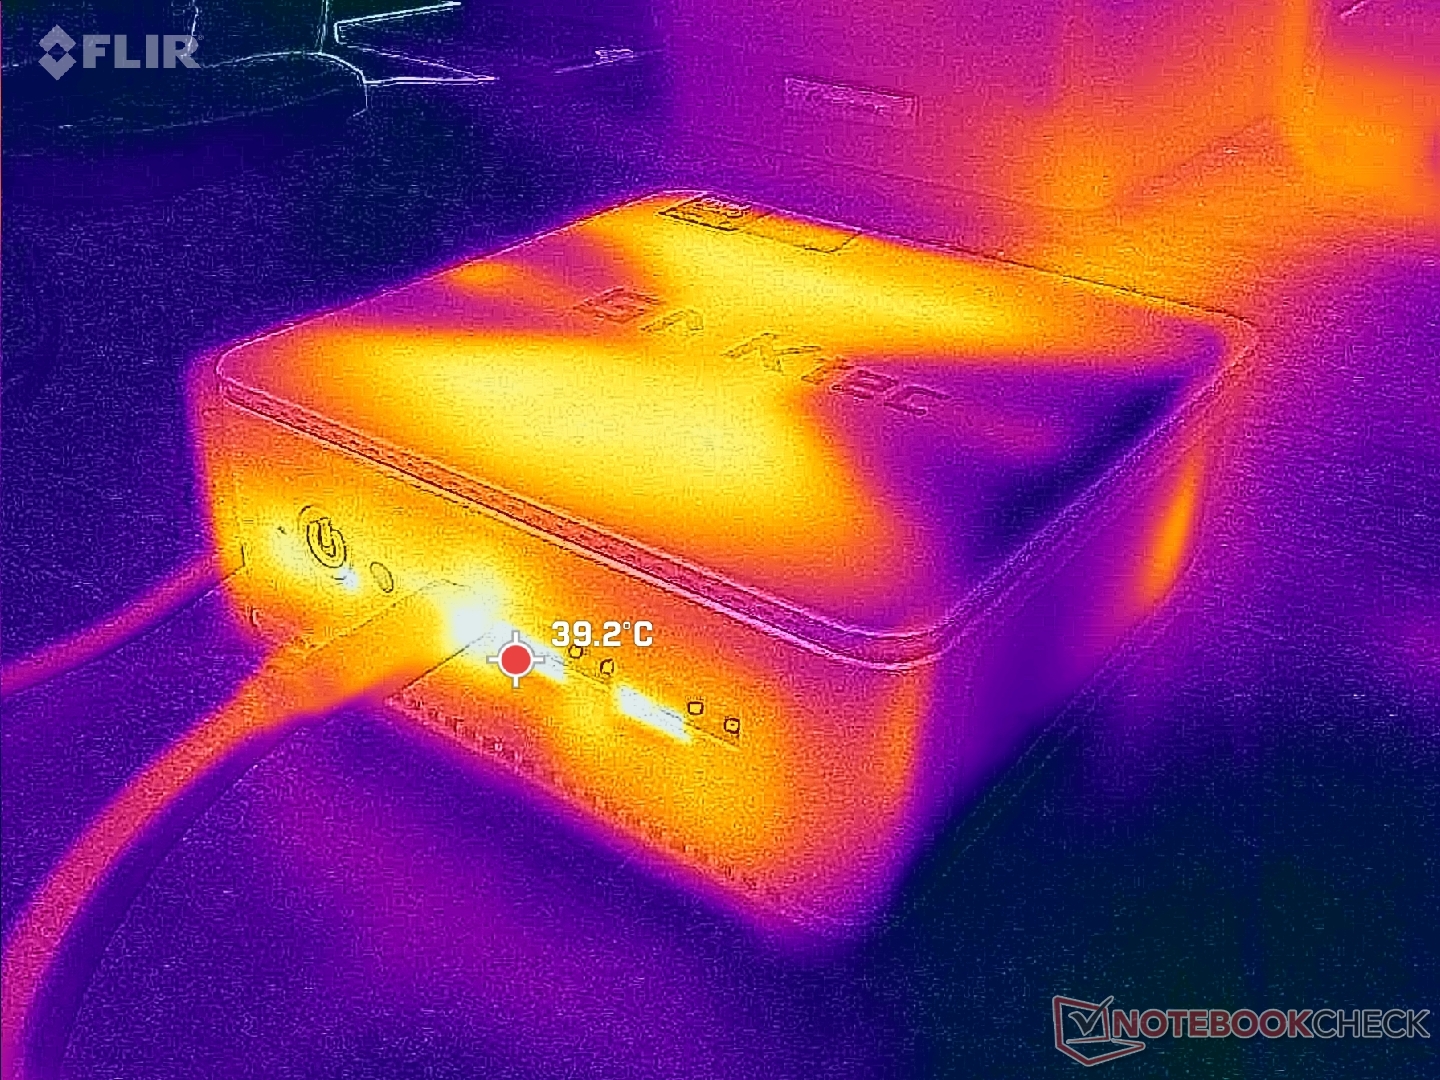
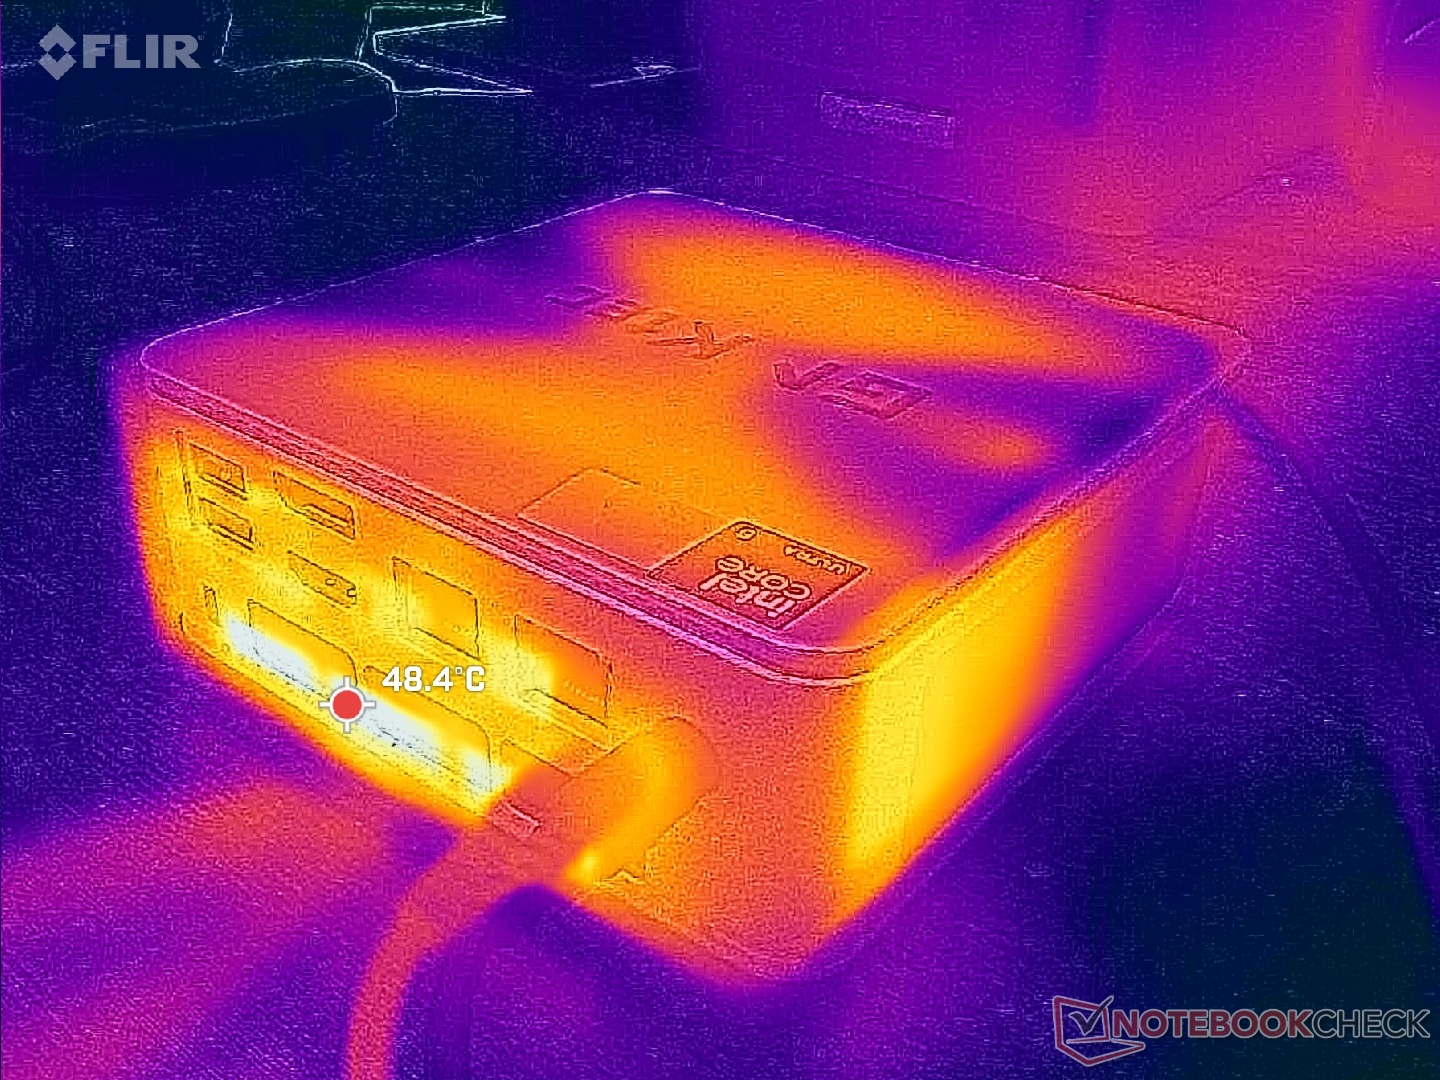
Temperatura
Le temperature di superficie non sono un problema. Le griglie di ventilazione si trovano su ogni lato del dispositivo, ad eccezione della superficie superiore, il che significa che è sicuro posizionare notebook e altri piccoli oggetti sulla parte superiore senza ostacolare il flusso d'aria.
Gestione dell'energia
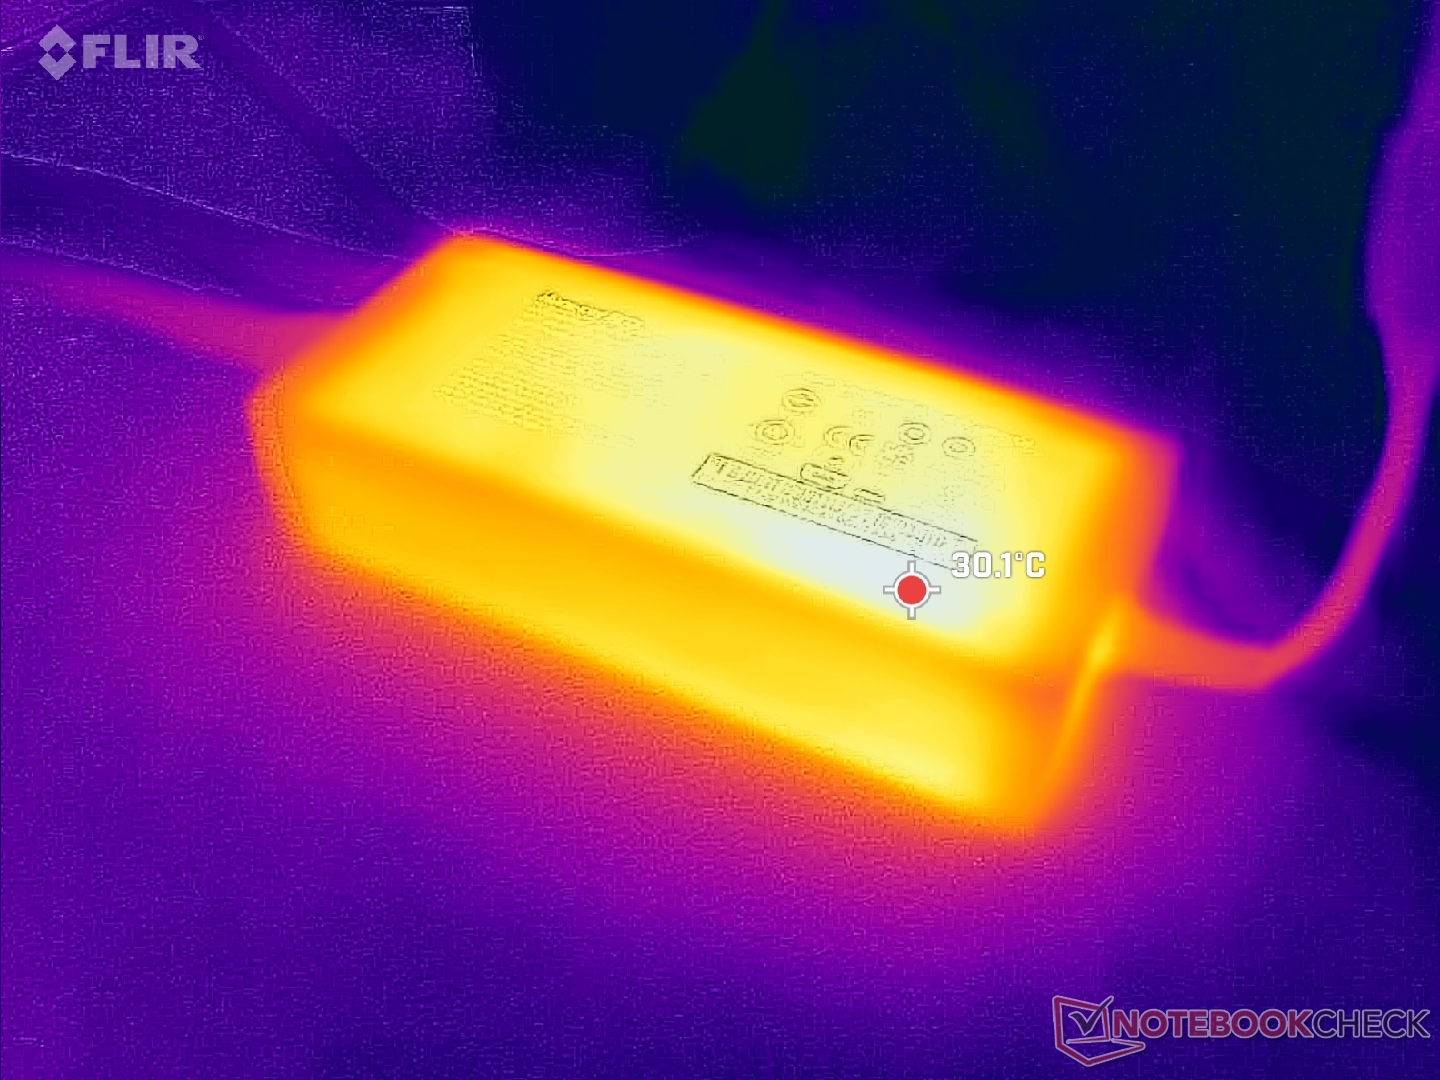
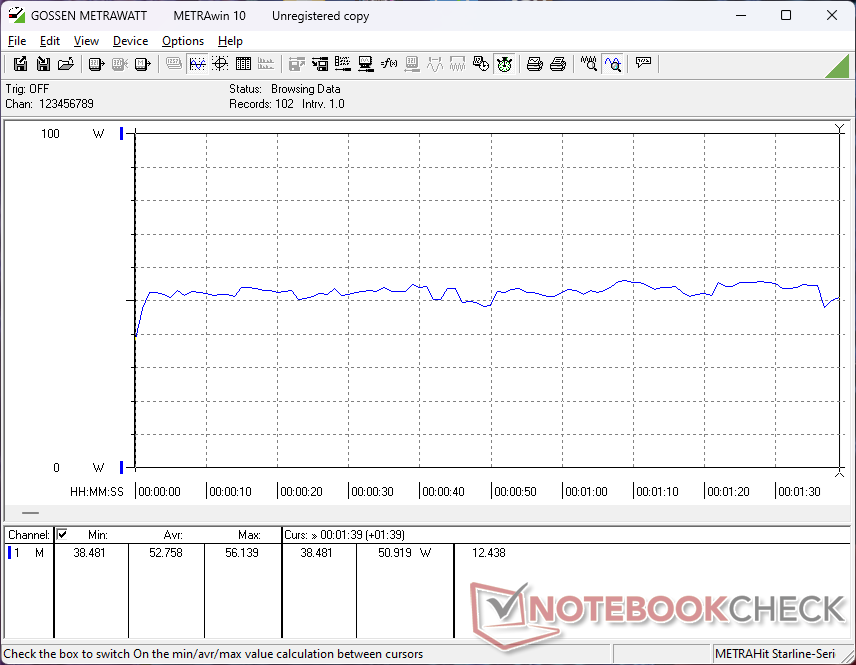
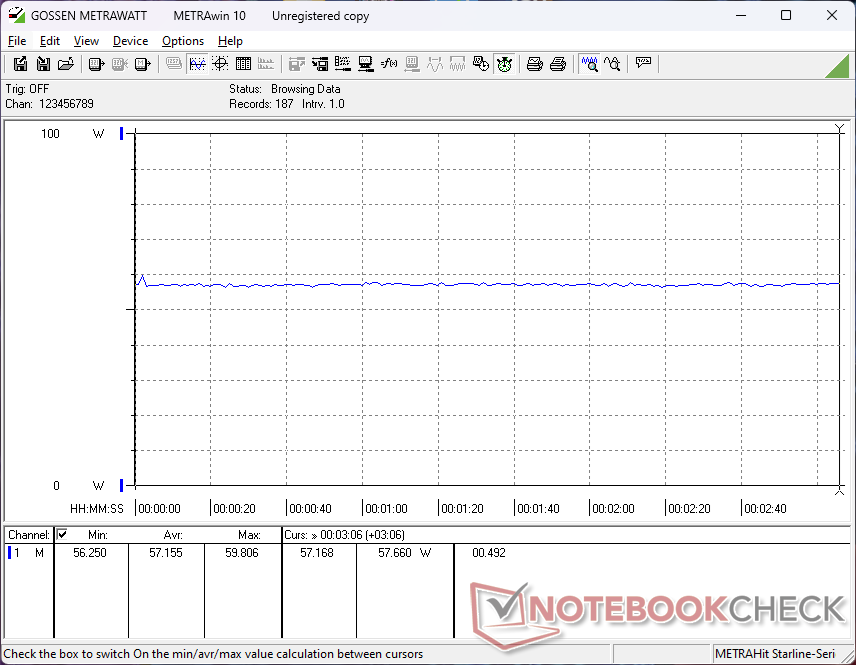
Consumo di energia
Il consumo quando è al minimo sul desktop è più alto del previsto: circa 11 W anche in modalità Risparmio energetico, rispetto ai 6-8 W di altri modelli come NucBox M6 o Beelink SER8 Beelink SER8. Quando si eseguono carichi più impegnativi come 3DMark 06 o Cyberpunk 2077, tuttavia, il consumo è notevolmente inferiore rispetto al più veloce NucBox K6.
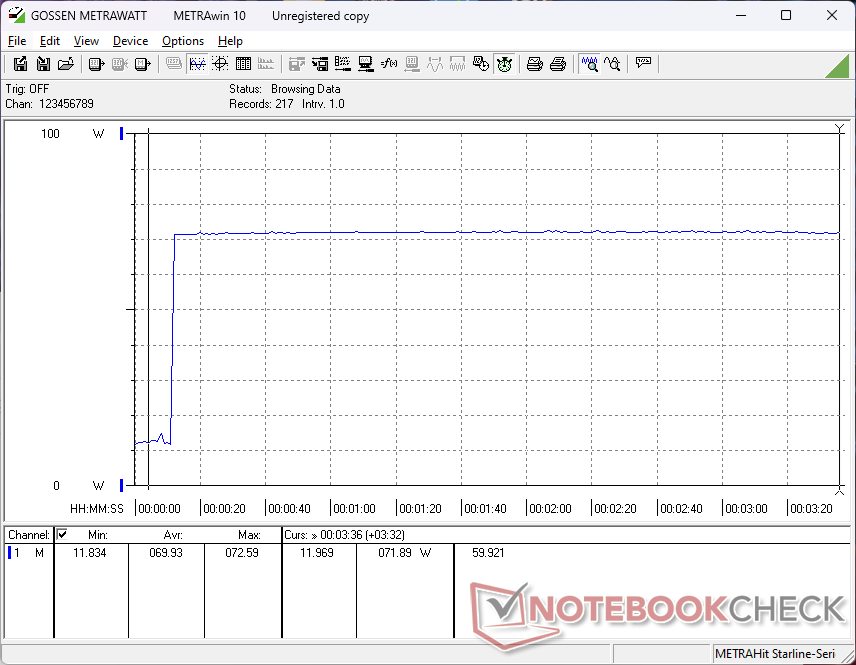
Siamo riusciti a registrare un consumo massimo di 73 W dall'adattatore CA a botte da 120 W, di dimensioni medio-piccole (~14,5 x 6,4 x 3 cm). Il grande sovraccarico può essere attribuito alla porta Thunderbolt 4, nel caso in cui i monitor o gli accessori collegati richiedano un'alimentazione supplementare.
| Off / Standby | |
| Idle | |
| Sotto carico |
|
Leggenda:
min: | |
| GMK NucBox K9 Ultra 5 125H, Arc 7-Core, MasonSemi 1TB MC7000, , x, | GMK NucBox K6 R7 7840HS, Radeon 780M, MasonSemi 1TB MC7000, , x, | GMK NucBox M6 R5 6600H, Radeon 660M, AirDisk APF 10-512G, , x, | Beelink SER8 R7 8845HS, Radeon 780M, Crucial P3 Plus CT1000P3PSSD8, , x, | Beelink SEi12 Core i5-1235U i5-1235U, Iris Xe G7 80EUs, Kingston NV1 SNVS/500GCN, , x, | BOSGAME M1 R7 7840HS, Radeon 780M, , , x, | |
|---|---|---|---|---|---|---|
| Power Consumption | 10% | 10% | 9% | -43% | 4% | |
| Idle Minimum * | 10.9 | 6.7 39% | 7.9 28% | 7.3 33% | 15.8 -45% | 7.3 33% |
| Idle Average * | 11 | 7 36% | 8 27% | 7.3 34% | 16.8 -53% | 7.3 34% |
| Idle Maximum * | 11.4 | 7.6 33% | 8.3 27% | 8.4 26% | 17 -49% | 8.4 26% |
| Load Average * | 52.8 | 74.3 -41% | 61.5 -16% | 68.2 -29% | 54.4 -3% | 72.7 -38% |
| Cyberpunk 2077 ultra external monitor * | 57.1 | |||||
| Load Maximum * | 72.2 | 85.7 -19% | 84.6 -17% | 84.3 -17% | 119.1 -65% | 99.1 -37% |
| Witcher 3 ultra * | 75 | 47.3 | 75.1 | 50.7 | 80.5 |
* ... Meglio usare valori piccoli
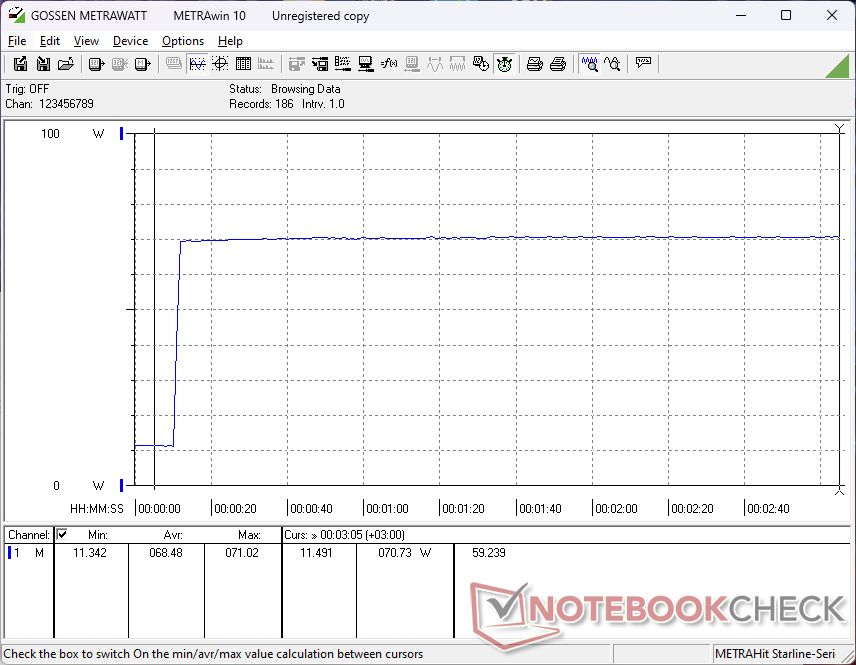
Power Consumption Prime95+FurMark Stress Test
Power Consumption external Monitor
Pro
Contro
Verdetto - Più nuovo, ma non più veloce
Al prezzo di 570 dollari in vendita, con 32 GB di RAM e 1 TB di spazio di archiviazione, NucBox K9 rappresenta un buon valore rispetto a Beelink SER8 che attualmente è più costoso a 630 dollari su Amazon. Il più grande nemico di GMK è probabilmente GMK stessa, in quanto modelli come NucBox K6 sono più economici e più veloci di NucBox K9 in quello che è essenzialmente lo stesso design di telaio con le stesse caratteristiche fisiche. In questo scenario, non c'è quasi alcun motivo per acquistare il NucBox K9 rispetto al K6, a meno che non si dia priorità alla NPU integrata rispetto alla potenza della CPU e della GPU grezze. Anche il concorrente Bosgame M1 è attualmente più economico e più veloce a 500 dollari. È vero che il NucBox K9 è un po' più silenzioso, ma è solo perché il modello è anche un po' più lento in partenza.
NucBox K9 non è assolutamente un mini PC scadente, ma il suo prezzo più alto e le prestazioni più lente rispetto al vecchio NucBox K6 confonderanno molti acquirenti, soprattutto quelli che non sono interessati all'accelerazione AI.
Oltre alle disparità di prezzo e di prestazioni tra i modelli NucBox K6 e K9, il design della serie comincia a mostrare la sua età. Concorrenti come Bosgame hanno telai in metallo più resistenti, mentre Beelink ha recentemente ridisegnato la sua serie SER per essere molto più professionale e persino lussuosa. Il NucBox GMK, per lo più in plastica, funziona abbastanza bene, ma potrebbe essere giunto il momento di una revisione con materiali di qualità superiore o con una manutenzione potenzialmente senza attrezzi.
Prezzo e disponibilità
GMKtec NucBox K9 è ora in vendita, come configurato in questa recensione , su Amazon a 720 dollari (dopo il coupon) o direttamente dal produttore per 570 dollari. È disponibile anche una SKU "barebones" a 400 dollari.
Nota: abbiamo recentemente aggiornato il nostro sistema di valutazione e i risultati della versione 8 non sono paragonabili ai risultati della versione 7. Ulteriori informazioni sono disponibili qui .
GMK NucBox K9
- 10/30/2024 v8
Allen Ngo
 Total Sustainability Score:
 Transparency
La selezione dei dispositivi da recensire viene effettuata dalla nostra redazione. Il campione di prova è stato fornito all'autore come prestito dal produttore o dal rivenditore ai fini di questa recensione. L'istituto di credito non ha avuto alcuna influenza su questa recensione, né il produttore ne ha ricevuto una copia prima della pubblicazione. Non vi era alcun obbligo di pubblicare questa recensione. Non accettiamo mai compensi o pagamenti in cambio delle nostre recensioni. In quanto società mediatica indipendente, Notebookcheck non è soggetta all'autorità di produttori, rivenditori o editori.
Ecco come Notebookcheck esegue i test
Ogni anno, Notebookcheck esamina in modo indipendente centinaia di laptop e smartphone utilizzando procedure standardizzate per garantire che tutti i risultati siano comparabili. Da circa 20 anni sviluppiamo continuamente i nostri metodi di prova e nel frattempo stabiliamo gli standard di settore. Nei nostri laboratori di prova, tecnici ed editori esperti utilizzano apparecchiature di misurazione di alta qualità. Questi test comportano un processo di validazione in più fasi. Il nostro complesso sistema di valutazione si basa su centinaia di misurazioni e parametri di riferimento ben fondati, che mantengono l'obiettività.Price comparison

