

Recensione del GMK NucBox M6: Un mini PC equilibrato che costa meno di 300 dollari

NucBox M6 è la versione più veloce di NucBox M5. GMK ha sostituito il Ryzen 7 5700U della serie U nell'M5 con il più recente Ryzen 5 6600H della serie H nell'M6. Il design del telaio e le caratteristiche fisiche sono per il resto invariate, per cui le consigliamo di consultare la la nostra recensione dell'M5 per saperne di più sulla serie.
La nostra configurazione di recensione viene venduta a 300 dollari, completa di 16 GB di RAM, 512 GB di SSD e Windows 11 Pro. Il prezzo di partenza può essere ancora più basso, a soli 230 dollari, per un kit "barebone". Tutte le SKU hanno la stessa opzione di colore nero e lo stesso processore Ryzen 5 6600H.
Tra i concorrenti di NucBox M6 ci sono altri mini PC economici come il Beelink SER5, Maxtang MTN-FP750o Geekom Mini IT12.
Altre recensioni di GMK:
Potenziali concorrenti a confrontos
Punteggio | Versione | Data | Modello | Peso | Altezza | Dimensione | Risoluzione | Prezzo |
|---|---|---|---|---|---|---|---|---|
| 63.6 % | v8 | 07/2024 | GMK NucBox M6 R5 6600H, Radeon 660M | 526 gr | 48 mm | x | ||
| 78.9 % v7 (old) | v7 (old) | 04/2024 | GMK NucBox M5 R7 5700U, Vega 8 | 505 gr | 48 mm | x | ||
| 83.6 % v7 (old) | v7 (old) | 04/2024 | GMK NucBox K6 R7 7840HS, Radeon 780M | 514 gr | 47 mm | x | ||
| 84.5 % v7 (old) | v7 (old) | 05/2024 | BOSGAME M1 R7 7840HS, Radeon 780M | 766 gr | 51 mm | x | ||
| 82.1 % v7 (old) | v7 (old) | 11/2023 | Beelink SER5 R5 5560U, Vega 6 | 439 gr | 42 mm | x | ||
| 80.8 % v7 (old) | v7 (old) | 04/2023 | Intel NUC 13 Pro Kit NUC13ANK i7-1360P, Iris Xe G7 96EUs | 538 gr | 37 mm | x |
Informazioni: Abbiamo aggiornato il nostro sistema di valutazione e i risultati della versione 8 non sono confrontabili con i risultati della versione 7. Altre informazioni sono gerarchicamente verfügbar.
Nota: abbiamo recentemente aggiornato il nostro sistema di valutazione e i risultati della versione 8 non sono confrontabili con quelli della versione 7. Ulteriori informazioni sono disponibili qui .
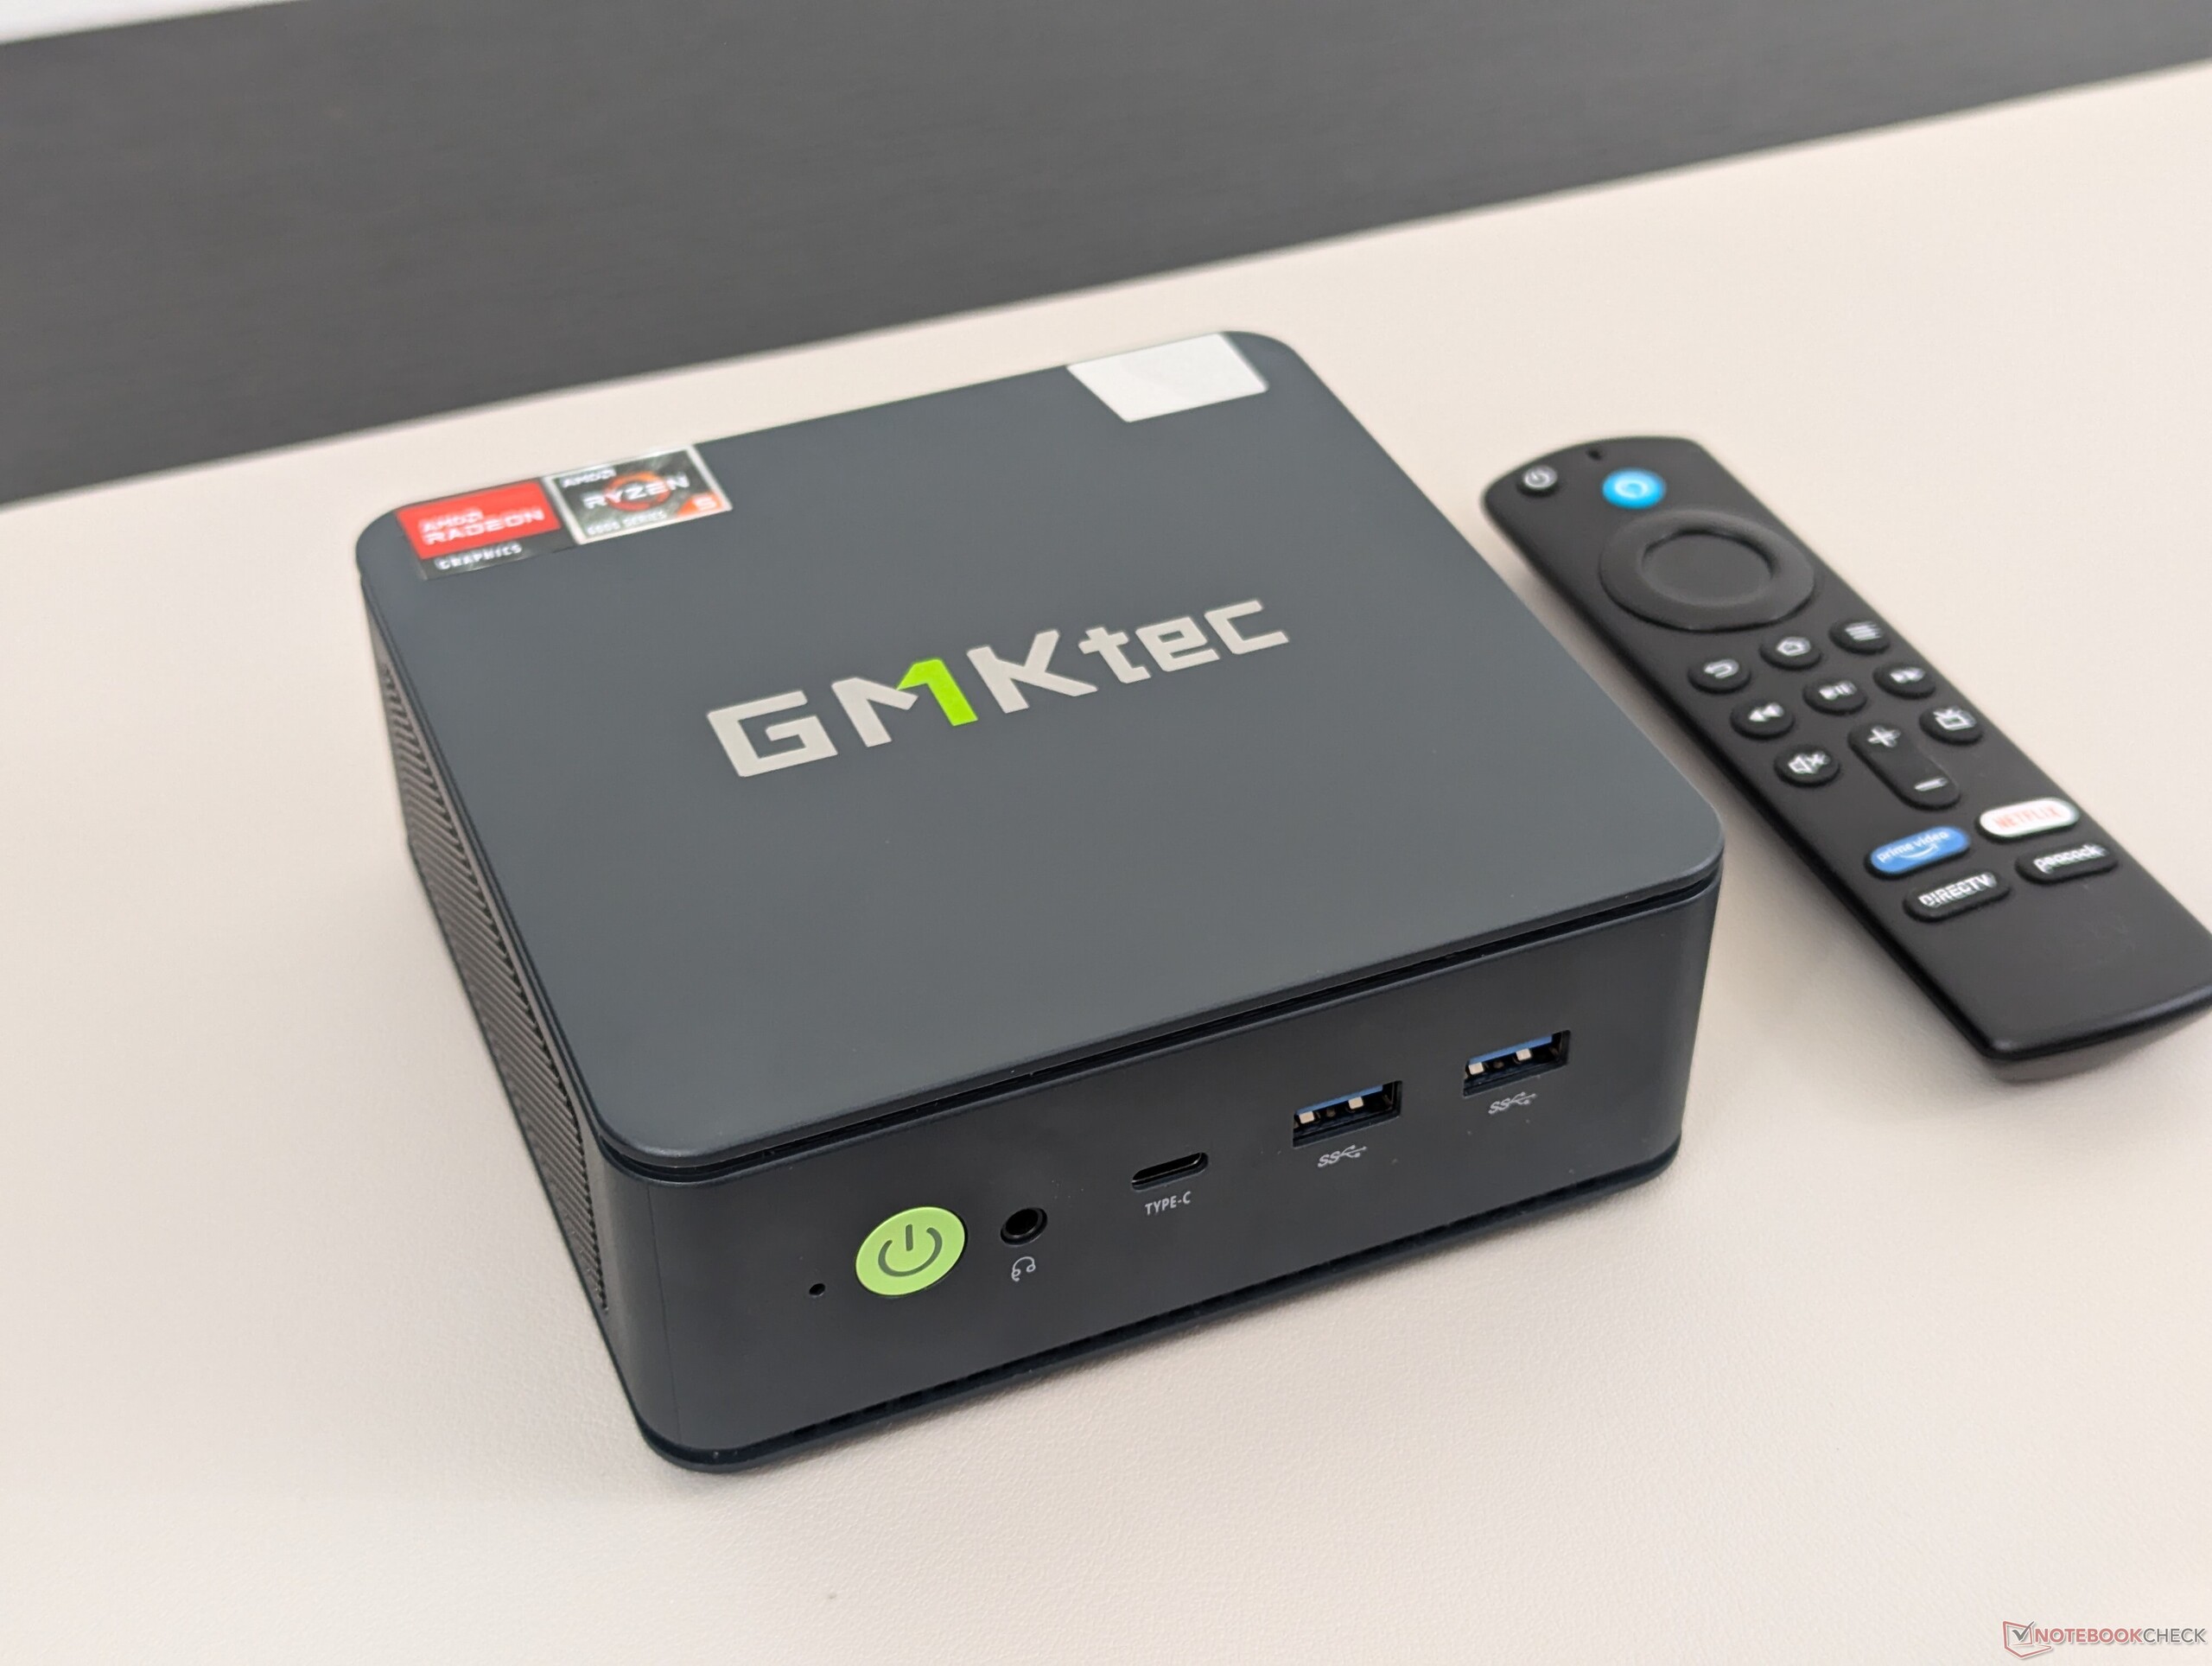
Custodia - Design familiare in plastica
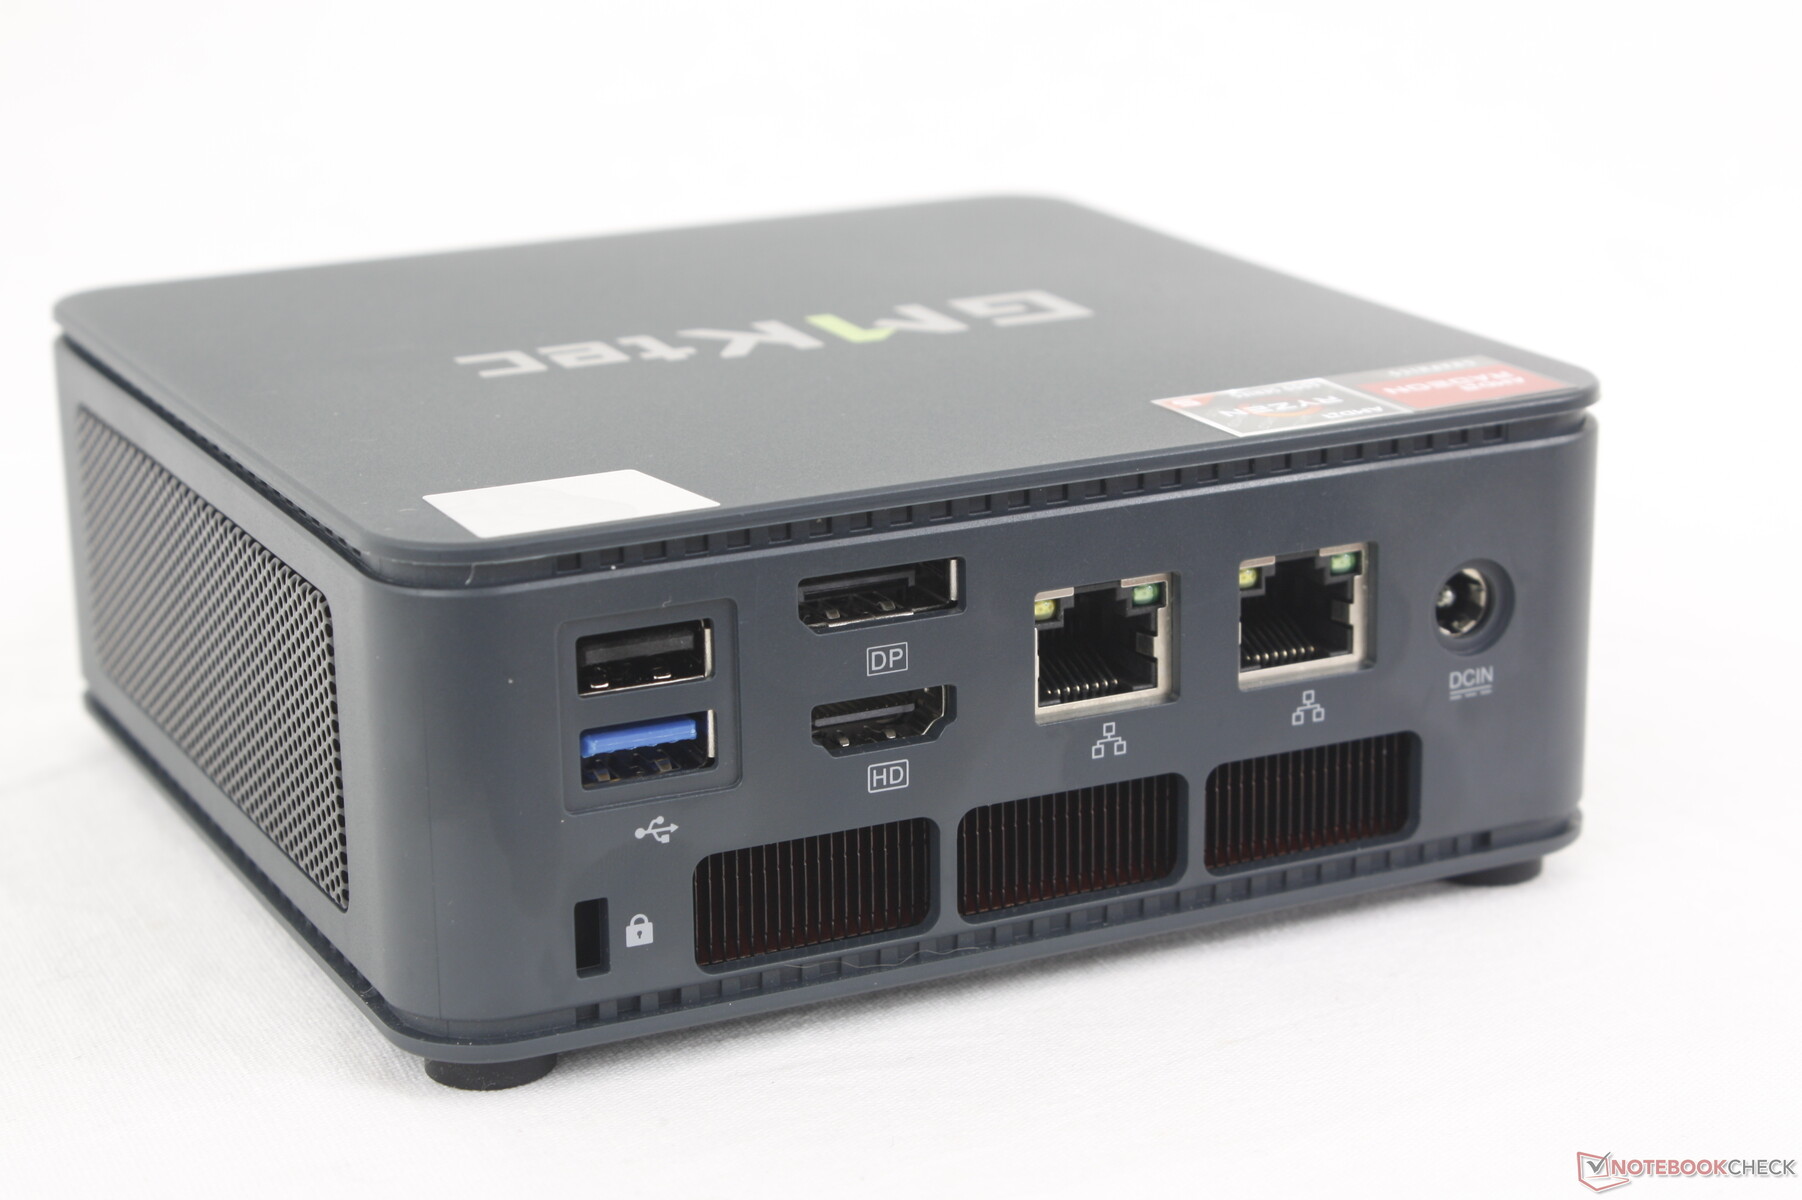
Connettività
Mentre le opzioni delle porte sono identiche a quelle del NucBox M5, è importante notare che l'M6 non supporta l'USB4, nonostante il marketing del produttore. Gestione dispositivi elenca solo il supporto USB 3.2 e non USB4. Power Delivery e DisplayPort via USB-C sono fortunatamente ancora supportati.

Comunicazione
I nostri test WiFi mostrano che le prestazioni sono più veloci su Wi-Fi 6 che su Wi-Fi 6E, anche dopo molteplici tentativi. Le velocità del Wi-Fi 6E sono anormalmente lente e suggeriscono possibili problemi di antenna con il modulo MediaTek MT7922 nella nostra unità di test.
| Networking | |
| iperf3 transmit AXE11000 | |
| GMK NucBox M6 | |
| BOSGAME M1 | |
| GMK NucBox M5 | |
| Beelink SER5 | |
| Intel NUC 13 Pro Kit NUC13ANK | |
| GMK NucBox K6 | |
| iperf3 receive AXE11000 | |
| BOSGAME M1 | |
| GMK NucBox M6 | |
| Beelink SER5 | |
| GMK NucBox M5 | |
| GMK NucBox K6 | |
| Intel NUC 13 Pro Kit NUC13ANK | |
| iperf3 transmit AXE11000 6GHz | |
| Intel NUC 13 Pro Kit NUC13ANK | |
| GMK NucBox M5 | |
| BOSGAME M1 | |
| GMK NucBox K6 | |
| GMK NucBox M6 | |
| iperf3 receive AXE11000 6GHz | |
| Intel NUC 13 Pro Kit NUC13ANK | |
| GMK NucBox M5 | |
| BOSGAME M1 | |
| GMK NucBox K6 | |
| GMK NucBox M6 | |
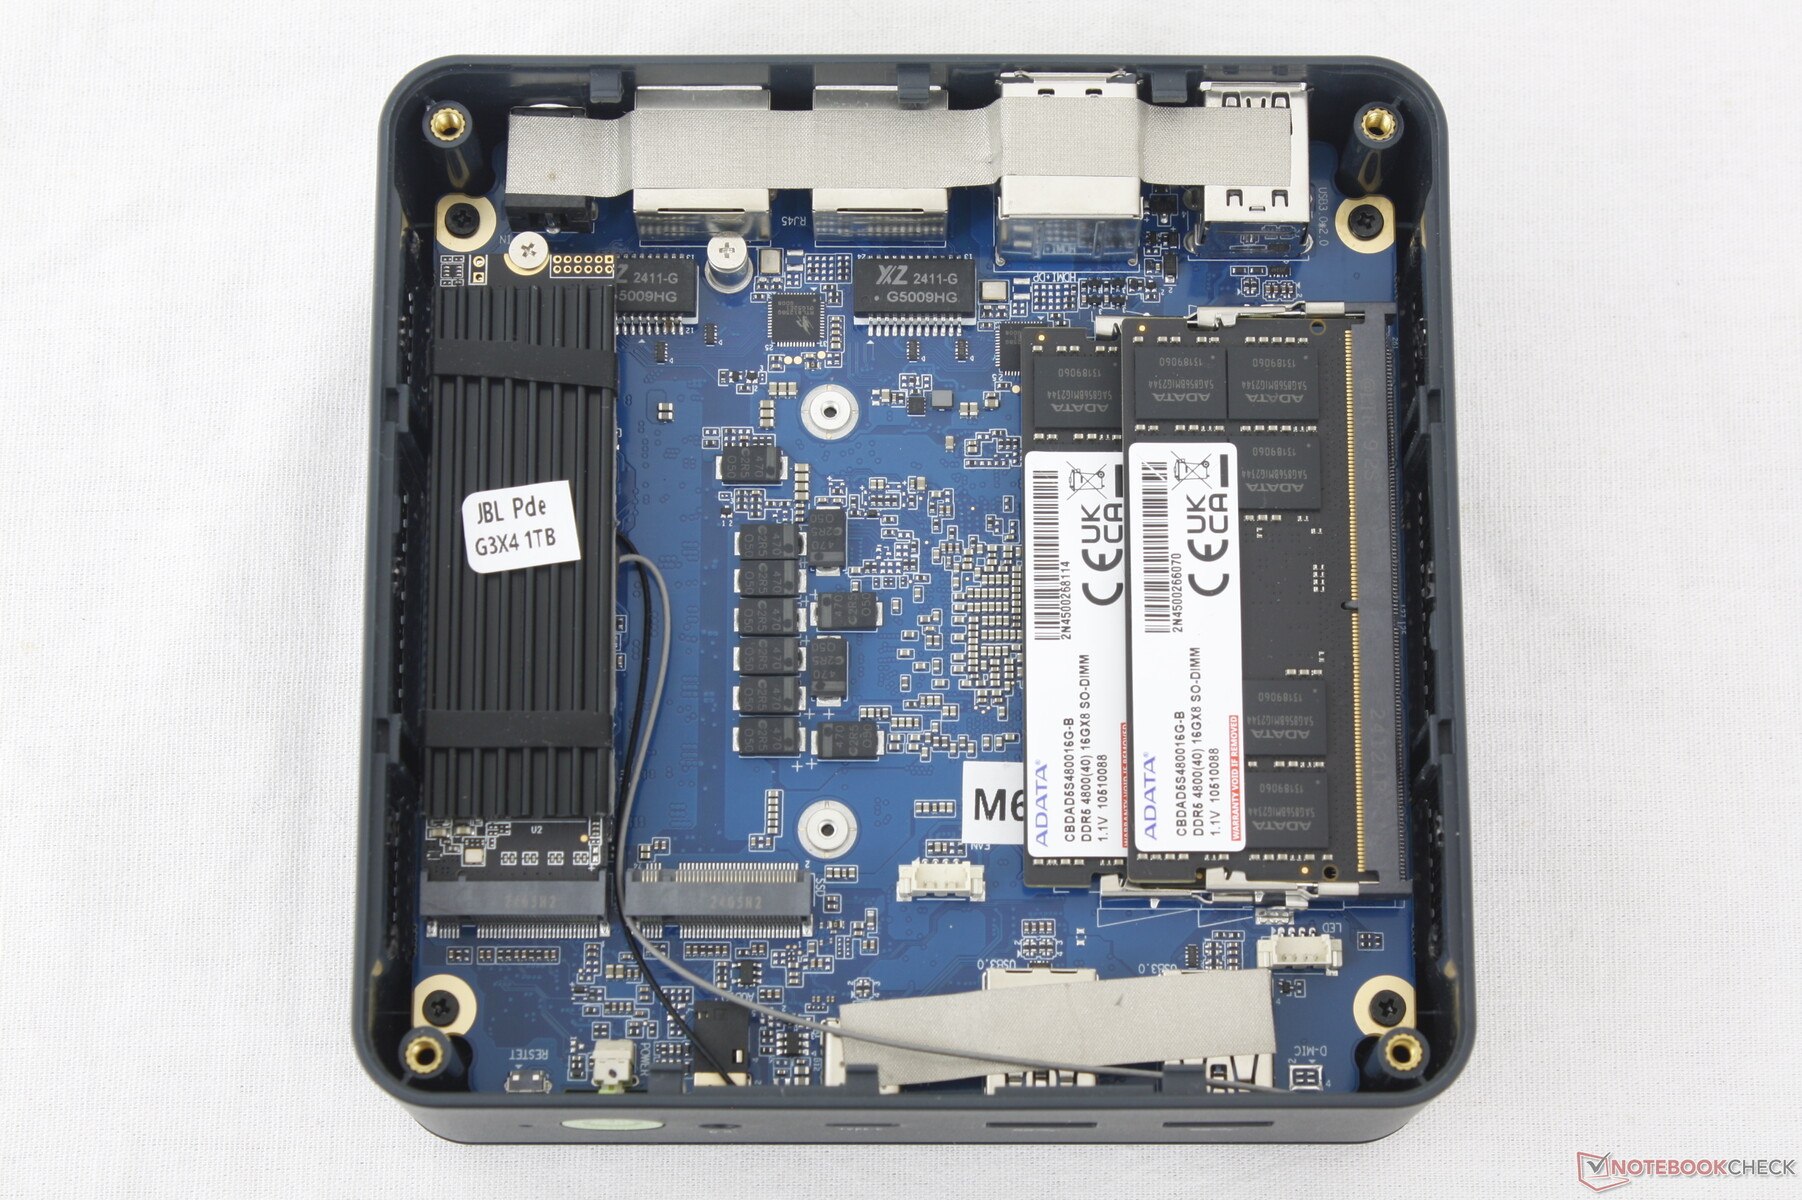
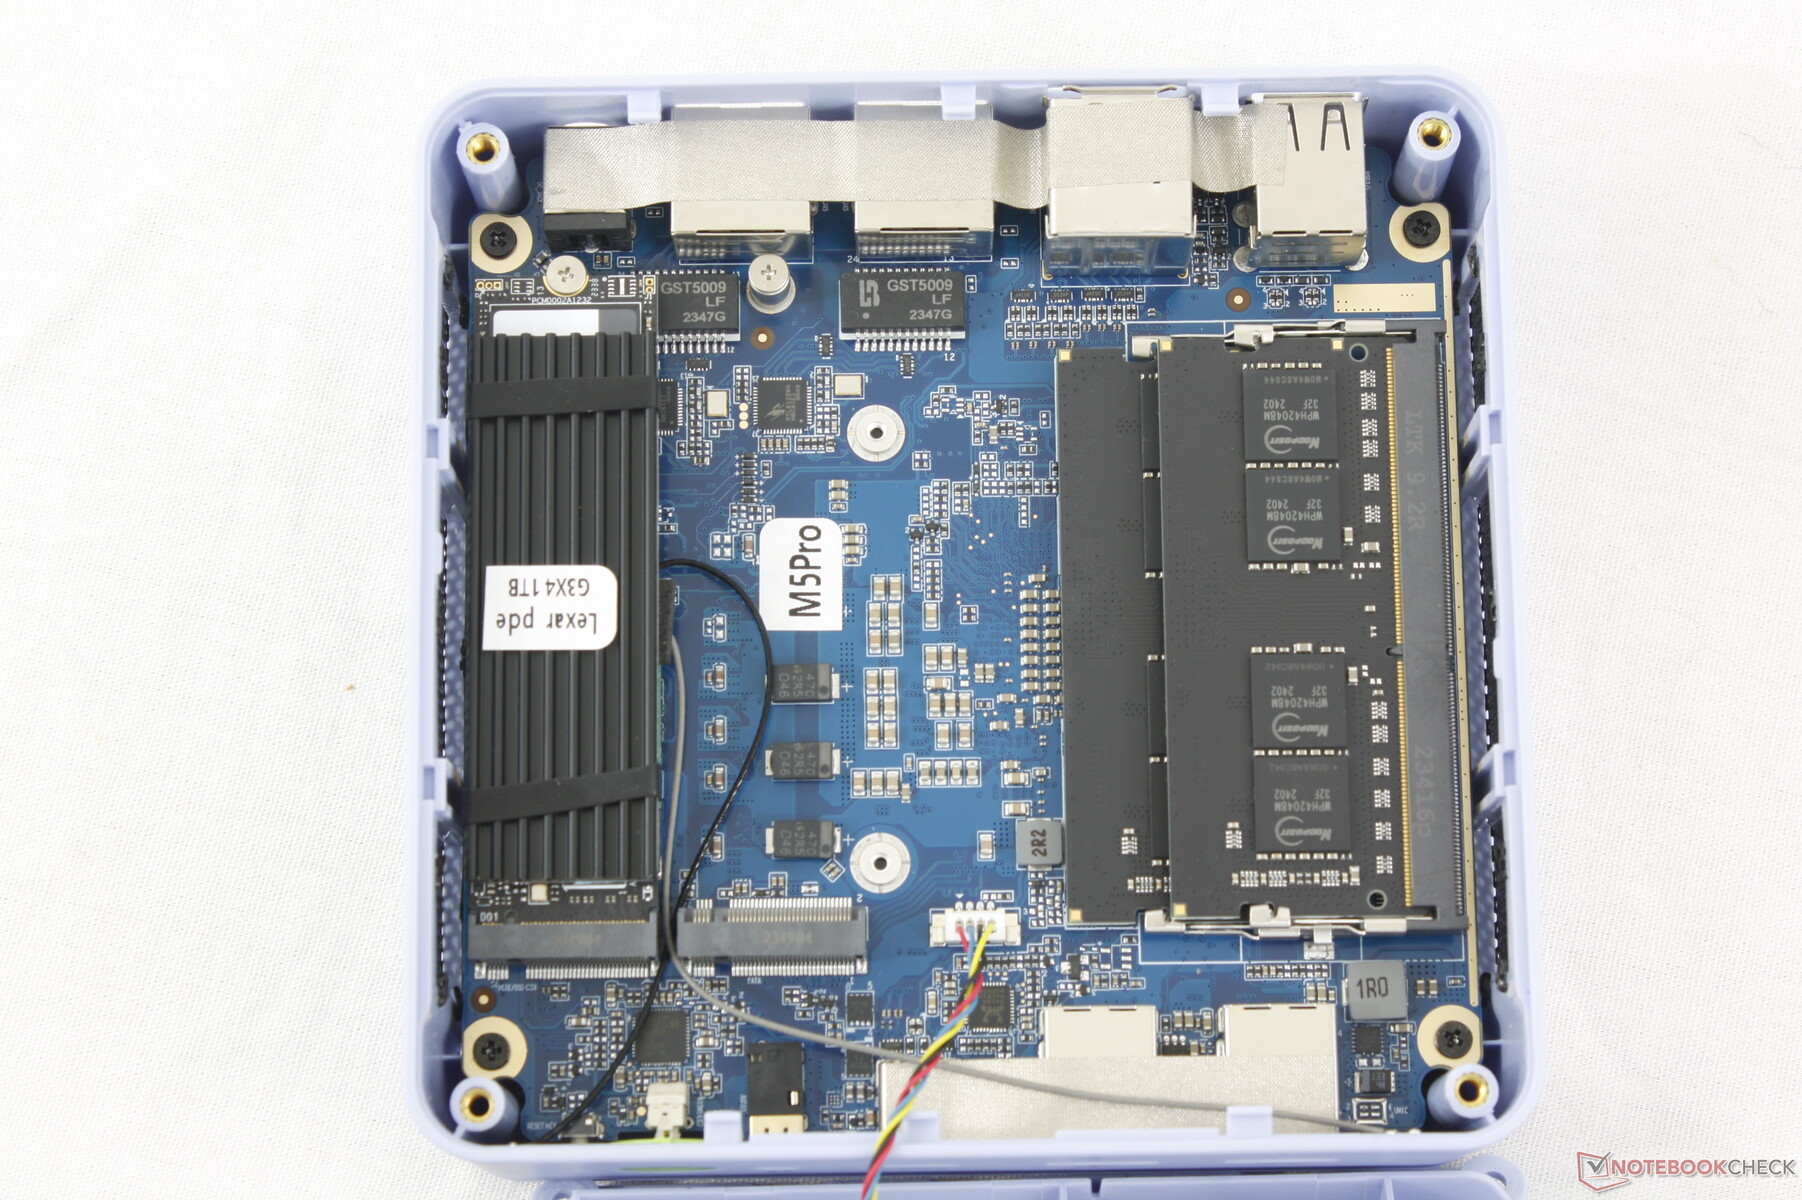
Manutenzione
Per rimuovere il pannello superiore è sufficiente un cacciavite Phillips, per facilitare la manutenzione.
Accessori e garanzia
La scatola di vendita include un supporto VESA rimovibile e un cavo HDMI, oltre ai consueti manuali e all'adattatore CA. Si noti che è possibile utilizzare anche adattatori CA USB-C di terze parti, se soddisfano i requisiti di alimentazione del mini PC.
Se acquistato negli Stati Uniti, si applica la consueta garanzia limitata di un anno del produttore.
Prestazioni - Buona CPU per il prezzo
Condizioni del test
Abbiamo impostato Windows in modalità Prestazioni prima di eseguire i benchmark qui sotto.
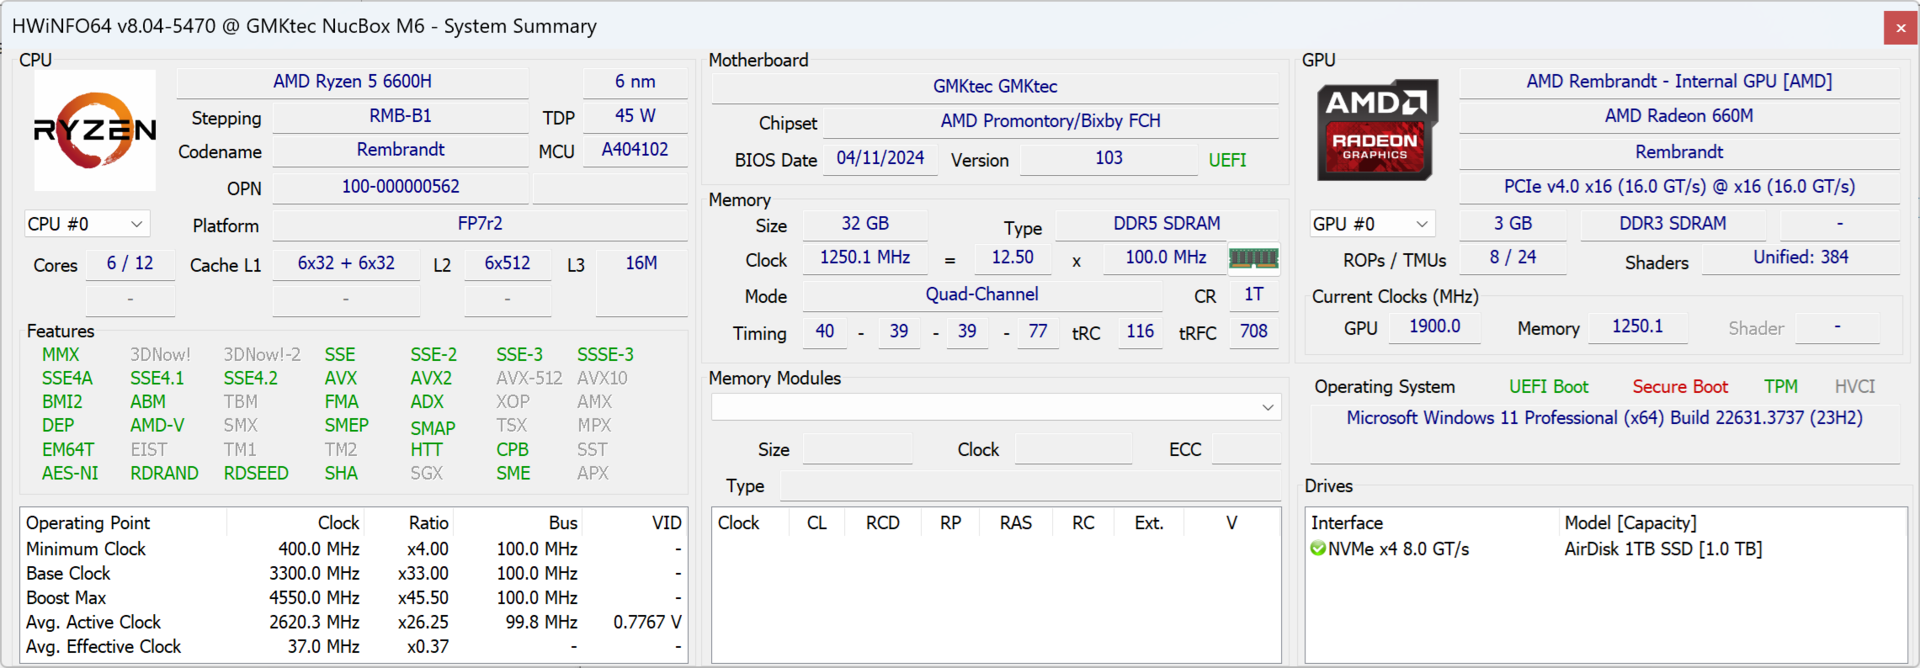
Processore
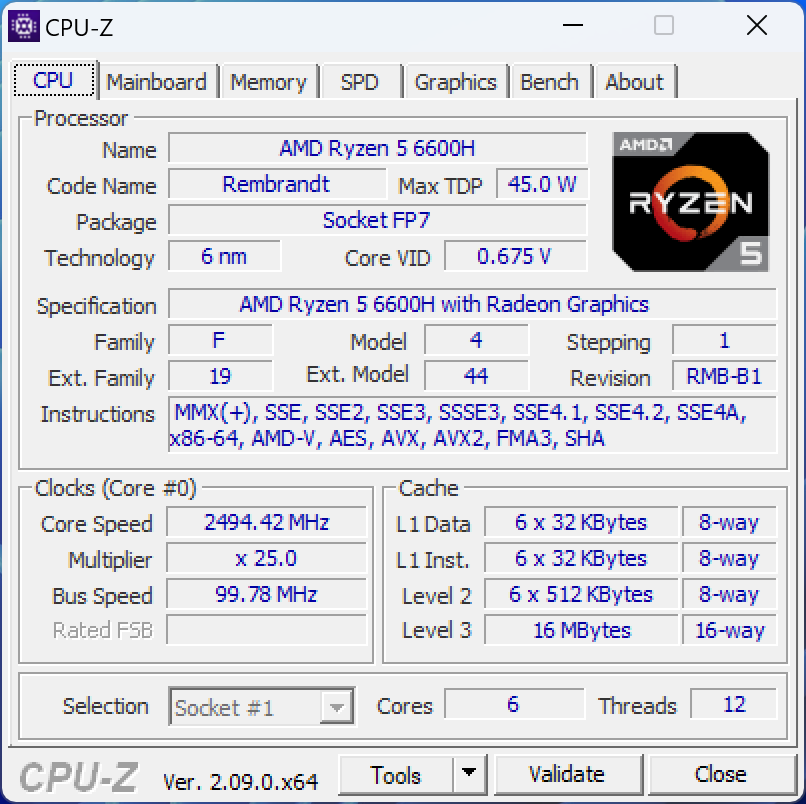
Per un processore di fascia media del 2022, il Ryzen 5 6600H ha ancora una buona potenza, con risultati multi-thread che si collocano tra quelli del concorrente Core i5-12450H e Core i5-12500H. Gli utenti che non riescono a decidere tra NucBox M5 o M6 scopriranno che Ryzen 5 6600H è più veloce di Ryzen 7 5700U Ryzen 7 5700U di circa il 60 percento.
Cinebench R15 Multi Loop
Cinebench R23: Multi Core | Single Core
Cinebench R20: CPU (Multi Core) | CPU (Single Core)
Cinebench R15: CPU Multi 64Bit | CPU Single 64Bit
Blender: v2.79 BMW27 CPU
7-Zip 18.03: 7z b 4 | 7z b 4 -mmt1
Geekbench 6.4: Multi-Core | Single-Core
Geekbench 5.5: Multi-Core | Single-Core
HWBOT x265 Benchmark v2.2: 4k Preset
LibreOffice : 20 Documents To PDF
R Benchmark 2.5: Overall mean
| CPU Performance Rating | |
| Minisforum AtomMan X7 Ti | |
| Aoostar GEM12 | |
| BOSGAME M1 | |
| Acemagic F2A | |
| HP Elite Mini 800 G9-5M9T9EA | |
| Geekom GT13 Pro | |
| Intel NUC 13 Pro Kit NUC13ANK -2! | |
| Geekom XT12 Pro | |
| Aorus 15 YE5-54DEB34SH | |
| Aoostar GEM10 | |
| GMK NucBox M6 | |
| Maxtang MTN-FP750 | |
| Media AMD Ryzen 5 6600H | |
| Geekom Mini IT12 | |
| Acemagic AD15 | |
| GMK NucBox M5 | |
| Intel NUC11TNKi5 -2! | |
| Cinebench R20 / CPU (Multi Core) | |
| Minisforum AtomMan X7 Ti | |
| Acemagic F2A | |
| BOSGAME M1 | |
| Aoostar GEM12 | |
| HP Elite Mini 800 G9-5M9T9EA | |
| Aoostar GEM10 | |
| Aorus 15 YE5-54DEB34SH | |
| Geekom GT13 Pro | |
| Intel NUC 13 Pro Kit NUC13ANK | |
| Maxtang MTN-FP750 | |
| Geekom XT12 Pro | |
| GMK NucBox M6 | |
| Media AMD Ryzen 5 6600H (3965 - 4141, n=3) | |
| Geekom Mini IT12 | |
| Acemagic AD15 | |
| GMK NucBox M5 | |
| Intel NUC11TNKi5 | |
| Cinebench R20 / CPU (Single Core) | |
| Intel NUC 13 Pro Kit NUC13ANK | |
| Minisforum AtomMan X7 Ti | |
| Geekom XT12 Pro | |
| Aoostar GEM12 | |
| HP Elite Mini 800 G9-5M9T9EA | |
| BOSGAME M1 | |
| Acemagic F2A | |
| Geekom GT13 Pro | |
| Aorus 15 YE5-54DEB34SH | |
| Geekom Mini IT12 | |
| Maxtang MTN-FP750 | |
| Aoostar GEM10 | |
| GMK NucBox M6 | |
| Media AMD Ryzen 5 6600H (564 - 584, n=3) | |
| Acemagic AD15 | |
| Intel NUC11TNKi5 | |
| GMK NucBox M5 | |
| Cinebench R15 / CPU Multi 64Bit | |
| Minisforum AtomMan X7 Ti | |
| Acemagic F2A | |
| BOSGAME M1 | |
| Aoostar GEM12 | |
| HP Elite Mini 800 G9-5M9T9EA | |
| Aorus 15 YE5-54DEB34SH | |
| Geekom GT13 Pro | |
| Geekom XT12 Pro | |
| Aoostar GEM10 | |
| Intel NUC 13 Pro Kit NUC13ANK | |
| Maxtang MTN-FP750 | |
| GMK NucBox M6 | |
| Media AMD Ryzen 5 6600H (1626 - 1740, n=3) | |
| Acemagic AD15 | |
| Geekom Mini IT12 | |
| GMK NucBox M5 | |
| Intel NUC11TNKi5 | |
| Cinebench R15 / CPU Single 64Bit | |
| Aoostar GEM12 | |
| BOSGAME M1 | |
| Intel NUC 13 Pro Kit NUC13ANK | |
| Minisforum AtomMan X7 Ti | |
| Acemagic F2A | |
| HP Elite Mini 800 G9-5M9T9EA | |
| Geekom XT12 Pro | |
| Aorus 15 YE5-54DEB34SH | |
| Maxtang MTN-FP750 | |
| Geekom GT13 Pro | |
| GMK NucBox M6 | |
| Aoostar GEM10 | |
| Geekom Mini IT12 | |
| Media AMD Ryzen 5 6600H (231 - 243, n=3) | |
| Acemagic AD15 | |
| Intel NUC11TNKi5 | |
| GMK NucBox M5 | |
| Geekbench 6.4 / Multi-Core | |
| Minisforum AtomMan X7 Ti | |
| BOSGAME M1 | |
| Aoostar GEM12 | |
| Acemagic F2A | |
| Geekom GT13 Pro | |
| Aorus 15 YE5-54DEB34SH | |
| HP Elite Mini 800 G9-5M9T9EA | |
| Geekom XT12 Pro | |
| Aoostar GEM10 | |
| GMK NucBox M6 | |
| Media AMD Ryzen 5 6600H (n=1) | |
| Geekom Mini IT12 | |
| Acemagic AD15 | |
| Maxtang MTN-FP750 | |
| GMK NucBox M5 | |
| Geekbench 6.4 / Single-Core | |
| Aoostar GEM12 | |
| BOSGAME M1 | |
| Geekom GT13 Pro | |
| Minisforum AtomMan X7 Ti | |
| HP Elite Mini 800 G9-5M9T9EA | |
| Geekom XT12 Pro | |
| Acemagic F2A | |
| Aorus 15 YE5-54DEB34SH | |
| Geekom Mini IT12 | |
| Acemagic AD15 | |
| Maxtang MTN-FP750 | |
| Aoostar GEM10 | |
| GMK NucBox M6 | |
| Media AMD Ryzen 5 6600H (n=1) | |
| GMK NucBox M5 | |
| HWBOT x265 Benchmark v2.2 / 4k Preset | |
| Minisforum AtomMan X7 Ti | |
| Aoostar GEM12 | |
| BOSGAME M1 | |
| Acemagic F2A | |
| HP Elite Mini 800 G9-5M9T9EA | |
| Aorus 15 YE5-54DEB34SH | |
| Aoostar GEM10 | |
| Intel NUC 13 Pro Kit NUC13ANK | |
| Geekom GT13 Pro | |
| GMK NucBox M6 | |
| Media AMD Ryzen 5 6600H (11.5 - 14.2, n=3) | |
| Maxtang MTN-FP750 | |
| Geekom XT12 Pro | |
| Geekom Mini IT12 | |
| Acemagic AD15 | |
| GMK NucBox M5 | |
| Intel NUC11TNKi5 | |
| LibreOffice / 20 Documents To PDF | |
| Aorus 15 YE5-54DEB34SH | |
| GMK NucBox M5 | |
| Media AMD Ryzen 5 6600H (52.4 - 60, n=3) | |
| Maxtang MTN-FP750 | |
| Geekom Mini IT12 | |
| HP Elite Mini 800 G9-5M9T9EA | |
| GMK NucBox M6 | |
| Intel NUC11TNKi5 | |
| Aoostar GEM10 | |
| Minisforum AtomMan X7 Ti | |
| Aoostar GEM12 | |
| BOSGAME M1 | |
| Acemagic F2A | |
| Intel NUC 13 Pro Kit NUC13ANK | |
| Acemagic AD15 | |
| Geekom XT12 Pro | |
| Geekom GT13 Pro | |
| R Benchmark 2.5 / Overall mean | |
| Intel NUC11TNKi5 | |
| GMK NucBox M5 | |
| Acemagic AD15 | |
| Aorus 15 YE5-54DEB34SH | |
| Aoostar GEM10 | |
| Media AMD Ryzen 5 6600H (0.4995 - 0.532, n=3) | |
| Maxtang MTN-FP750 | |
| Geekom Mini IT12 | |
| GMK NucBox M6 | |
| Acemagic F2A | |
| Geekom XT12 Pro | |
| Minisforum AtomMan X7 Ti | |
| HP Elite Mini 800 G9-5M9T9EA | |
| Intel NUC 13 Pro Kit NUC13ANK | |
| BOSGAME M1 | |
| Geekom GT13 Pro | |
| Aoostar GEM12 | |
Cinebench R23: Multi Core | Single Core
Cinebench R20: CPU (Multi Core) | CPU (Single Core)
Cinebench R15: CPU Multi 64Bit | CPU Single 64Bit
Blender: v2.79 BMW27 CPU
7-Zip 18.03: 7z b 4 | 7z b 4 -mmt1
Geekbench 6.4: Multi-Core | Single-Core
Geekbench 5.5: Multi-Core | Single-Core
HWBOT x265 Benchmark v2.2: 4k Preset
LibreOffice : 20 Documents To PDF
R Benchmark 2.5: Overall mean
* ... Meglio usare valori piccoli
AIDA64: FP32 Ray-Trace | FPU Julia | CPU SHA3 | CPU Queen | FPU SinJulia | FPU Mandel | CPU AES | CPU ZLib | FP64 Ray-Trace | CPU PhotoWorxx
| Performance Rating | |
| BOSGAME M1 | |
| GMK NucBox K6 | |
| GMK NucBox M6 | |
| Media AMD Ryzen 5 6600H | |
| Intel NUC 13 Pro Kit NUC13ANK | |
| Beelink SER5 | |
| GMK NucBox M5 | |
| AIDA64 / FP32 Ray-Trace | |
| BOSGAME M1 | |
| GMK NucBox K6 | |
| Media AMD Ryzen 5 6600H (12156 - 12871, n=3) | |
| GMK NucBox M6 | |
| Intel NUC 13 Pro Kit NUC13ANK | |
| Beelink SER5 | |
| GMK NucBox M5 | |
| AIDA64 / FPU Julia | |
| BOSGAME M1 | |
| GMK NucBox K6 | |
| GMK NucBox M6 | |
| Media AMD Ryzen 5 6600H (75025 - 78277, n=3) | |
| Beelink SER5 | |
| Intel NUC 13 Pro Kit NUC13ANK | |
| GMK NucBox M5 | |
| AIDA64 / CPU SHA3 | |
| BOSGAME M1 | |
| GMK NucBox K6 | |
| Intel NUC 13 Pro Kit NUC13ANK | |
| GMK NucBox M6 | |
| Media AMD Ryzen 5 6600H (2606 - 2689, n=3) | |
| Beelink SER5 | |
| GMK NucBox M5 | |
| AIDA64 / CPU Queen | |
| BOSGAME M1 | |
| GMK NucBox K6 | |
| Intel NUC 13 Pro Kit NUC13ANK | |
| GMK NucBox M6 | |
| Media AMD Ryzen 5 6600H (78765 - 82119, n=3) | |
| GMK NucBox M5 | |
| Beelink SER5 | |
| AIDA64 / FPU SinJulia | |
| BOSGAME M1 | |
| GMK NucBox K6 | |
| GMK NucBox M5 | |
| GMK NucBox M6 | |
| Media AMD Ryzen 5 6600H (9184 - 9739, n=3) | |
| Beelink SER5 | |
| Intel NUC 13 Pro Kit NUC13ANK | |
| AIDA64 / FPU Mandel | |
| BOSGAME M1 | |
| GMK NucBox K6 | |
| GMK NucBox M6 | |
| Media AMD Ryzen 5 6600H (41153 - 43222, n=3) | |
| Beelink SER5 | |
| Intel NUC 13 Pro Kit NUC13ANK | |
| GMK NucBox M5 | |
| AIDA64 / CPU AES | |
| BOSGAME M1 | |
| GMK NucBox K6 | |
| GMK NucBox M6 | |
| Media AMD Ryzen 5 6600H (100609 - 104138, n=3) | |
| Intel NUC 13 Pro Kit NUC13ANK | |
| Beelink SER5 | |
| GMK NucBox M5 | |
| AIDA64 / CPU ZLib | |
| BOSGAME M1 | |
| GMK NucBox K6 | |
| Intel NUC 13 Pro Kit NUC13ANK | |
| GMK NucBox M6 | |
| Media AMD Ryzen 5 6600H (634 - 660, n=3) | |
| GMK NucBox M5 | |
| Beelink SER5 | |
| AIDA64 / FP64 Ray-Trace | |
| BOSGAME M1 | |
| GMK NucBox K6 | |
| Media AMD Ryzen 5 6600H (6545 - 6911, n=3) | |
| GMK NucBox M6 | |
| Intel NUC 13 Pro Kit NUC13ANK | |
| Beelink SER5 | |
| GMK NucBox M5 | |
| AIDA64 / CPU PhotoWorxx | |
| BOSGAME M1 | |
| GMK NucBox K6 | |
| GMK NucBox M6 | |
| Intel NUC 13 Pro Kit NUC13ANK | |
| GMK NucBox M5 | |
| Media AMD Ryzen 5 6600H (16218 - 29621, n=3) | |
| Beelink SER5 | |
Test da sforzo
La CPU ha raggiunto 4,1 GHz, 54 W e 78 C durante l'esecuzione dello stress Prime95, prima di scendere rapidamente e stabilizzarsi a 3,9 GHz e 50 W pochi secondi dopo. Anche se le prestazioni massime del Turbo Core non sono indefinite, il calo è sorprendentemente marginale.
La temperatura del core si stabilizzerebbe a soli 64 C quando si eseguono Witcher 3 per rappresentare i carichi di gioco tipici, il che è paragonabile al più lento NucBox M5.
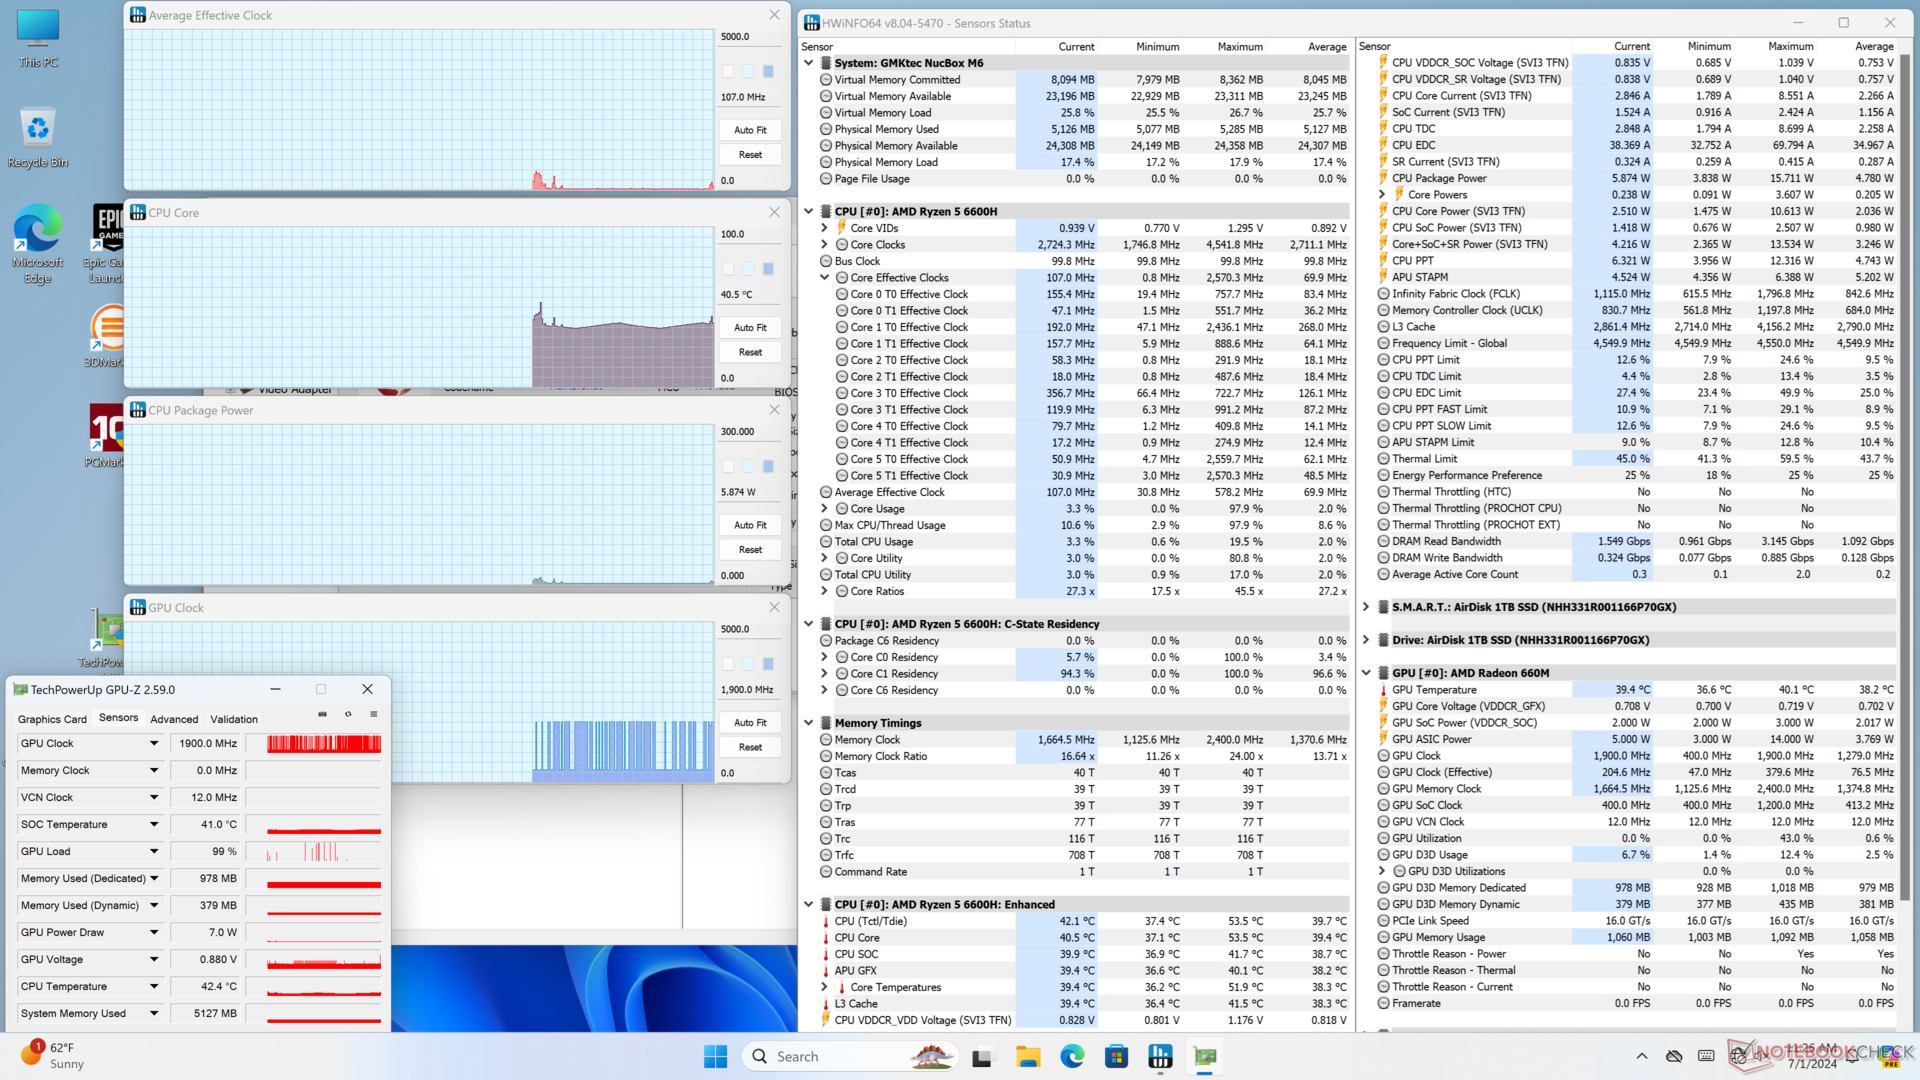
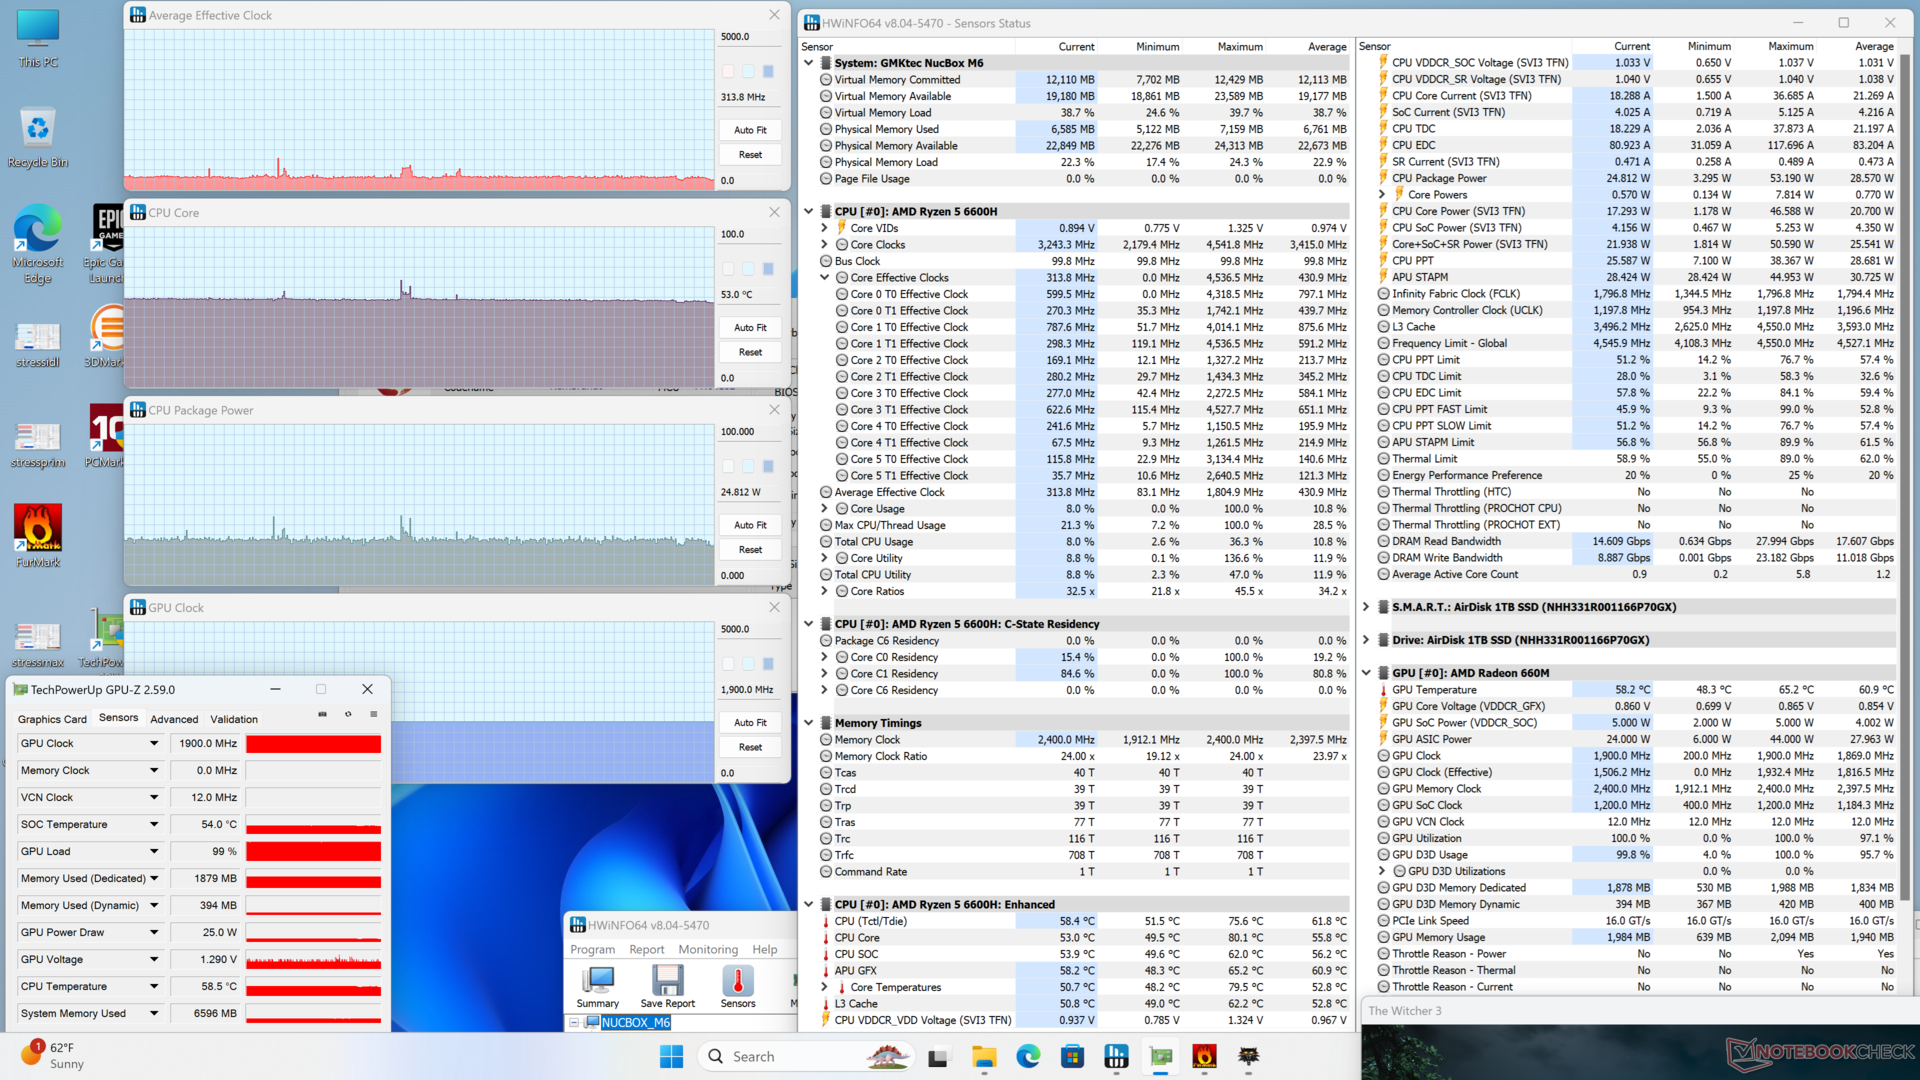

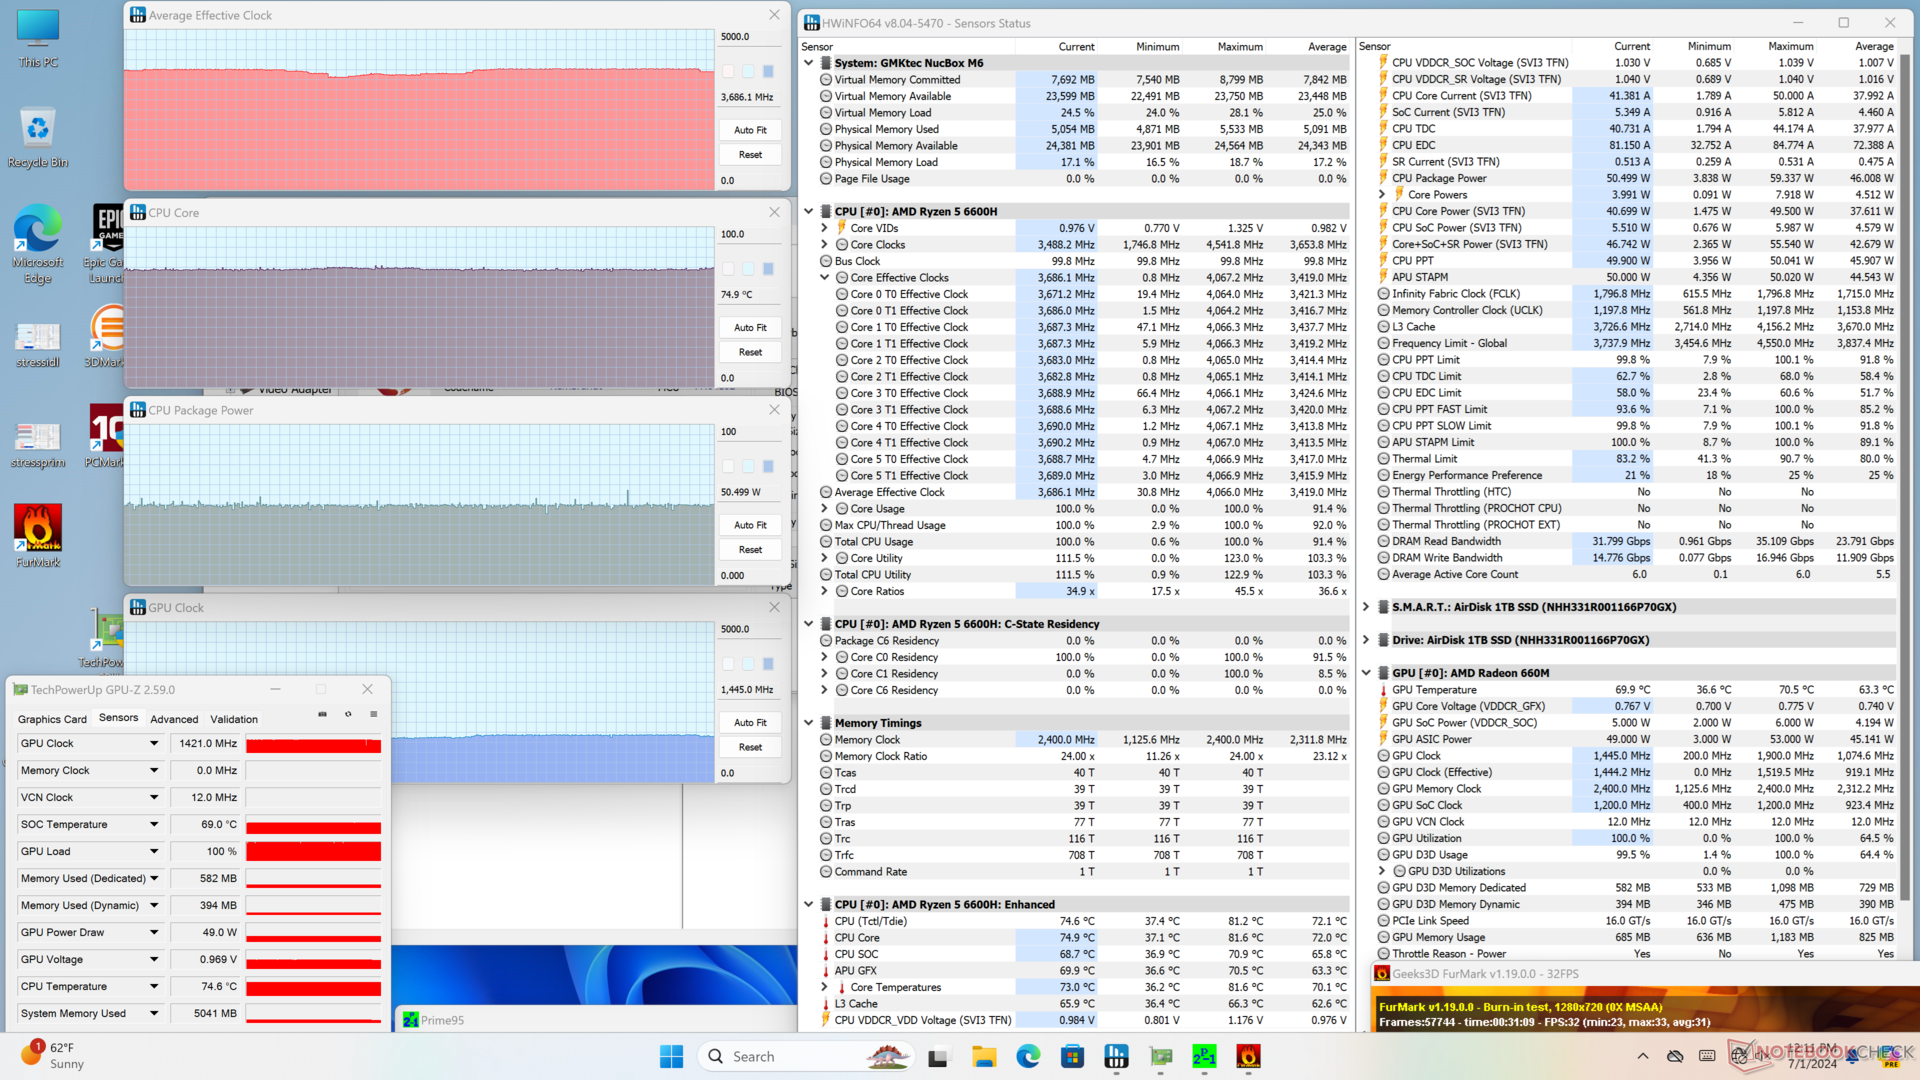
| Clock medio della CPU (GHz) | Clock della GPU (MHz) | Temperatura media della CPU (°C) | |
| Sistema inattivo | -- | -- | 40 |
| Stress Prime95 | ~3,9 | -- | 80 |
| Prime95 + FurMark Stress | ~3,7 | 1421 | 75 |
| Witcher 3 Stress | ~0,3 | 1900 | 54 |
Prestazioni del sistema
CrossMark: Overall | Productivity | Creativity | Responsiveness
WebXPRT 3: Overall
WebXPRT 4: Overall
Mozilla Kraken 1.1: Total
| PCMark 10 / Score | |
| GMK NucBox K6 | |
| BOSGAME M1 | |
| Intel NUC 13 Pro Kit NUC13ANK | |
| GMK NucBox M6 | |
| Media AMD Ryzen 5 6600H, AMD Radeon 660M (n=1) | |
| Beelink SER5 | |
| GMK NucBox M5 | |
| PCMark 10 / Essentials | |
| Intel NUC 13 Pro Kit NUC13ANK | |
| GMK NucBox K6 | |
| BOSGAME M1 | |
| GMK NucBox M6 | |
| Media AMD Ryzen 5 6600H, AMD Radeon 660M (n=1) | |
| GMK NucBox M5 | |
| Beelink SER5 | |
| PCMark 10 / Productivity | |
| GMK NucBox K6 | |
| BOSGAME M1 | |
| GMK NucBox M6 | |
| Media AMD Ryzen 5 6600H, AMD Radeon 660M (n=1) | |
| Beelink SER5 | |
| GMK NucBox M5 | |
| Intel NUC 13 Pro Kit NUC13ANK | |
| PCMark 10 / Digital Content Creation | |
| BOSGAME M1 | |
| GMK NucBox K6 | |
| Intel NUC 13 Pro Kit NUC13ANK | |
| GMK NucBox M6 | |
| Media AMD Ryzen 5 6600H, AMD Radeon 660M (n=1) | |
| Beelink SER5 | |
| GMK NucBox M5 | |
| CrossMark / Overall | |
| BOSGAME M1 | |
| GMK NucBox K6 | |
| Intel NUC 13 Pro Kit NUC13ANK | |
| GMK NucBox M6 | |
| Media AMD Ryzen 5 6600H, AMD Radeon 660M (n=1) | |
| Beelink SER5 | |
| GMK NucBox M5 | |
| CrossMark / Productivity | |
| BOSGAME M1 | |
| GMK NucBox K6 | |
| Intel NUC 13 Pro Kit NUC13ANK | |
| GMK NucBox M6 | |
| Media AMD Ryzen 5 6600H, AMD Radeon 660M (n=1) | |
| Beelink SER5 | |
| GMK NucBox M5 | |
| CrossMark / Creativity | |
| BOSGAME M1 | |
| GMK NucBox K6 | |
| Intel NUC 13 Pro Kit NUC13ANK | |
| GMK NucBox M6 | |
| Media AMD Ryzen 5 6600H, AMD Radeon 660M (n=1) | |
| Beelink SER5 | |
| GMK NucBox M5 | |
| CrossMark / Responsiveness | |
| BOSGAME M1 | |
| GMK NucBox K6 | |
| Intel NUC 13 Pro Kit NUC13ANK | |
| GMK NucBox M6 | |
| Media AMD Ryzen 5 6600H, AMD Radeon 660M (n=1) | |
| Beelink SER5 | |
| GMK NucBox M5 | |
| WebXPRT 3 / Overall | |
| GMK NucBox K6 | |
| BOSGAME M1 | |
| Intel NUC 13 Pro Kit NUC13ANK | |
| Beelink SER5 | |
| GMK NucBox M6 | |
| Media AMD Ryzen 5 6600H, AMD Radeon 660M (n=1) | |
| GMK NucBox M5 | |
| WebXPRT 4 / Overall | |
| Intel NUC 13 Pro Kit NUC13ANK | |
| GMK NucBox K6 | |
| BOSGAME M1 | |
| GMK NucBox M6 | |
| Media AMD Ryzen 5 6600H, AMD Radeon 660M (n=1) | |
| Beelink SER5 | |
| GMK NucBox M5 | |
| Mozilla Kraken 1.1 / Total | |
| GMK NucBox M5 | |
| Beelink SER5 | |
| GMK NucBox M6 | |
| Media AMD Ryzen 5 6600H, AMD Radeon 660M (n=1) | |
| GMK NucBox K6 | |
| BOSGAME M1 | |
| Intel NUC 13 Pro Kit NUC13ANK | |
* ... Meglio usare valori piccoli
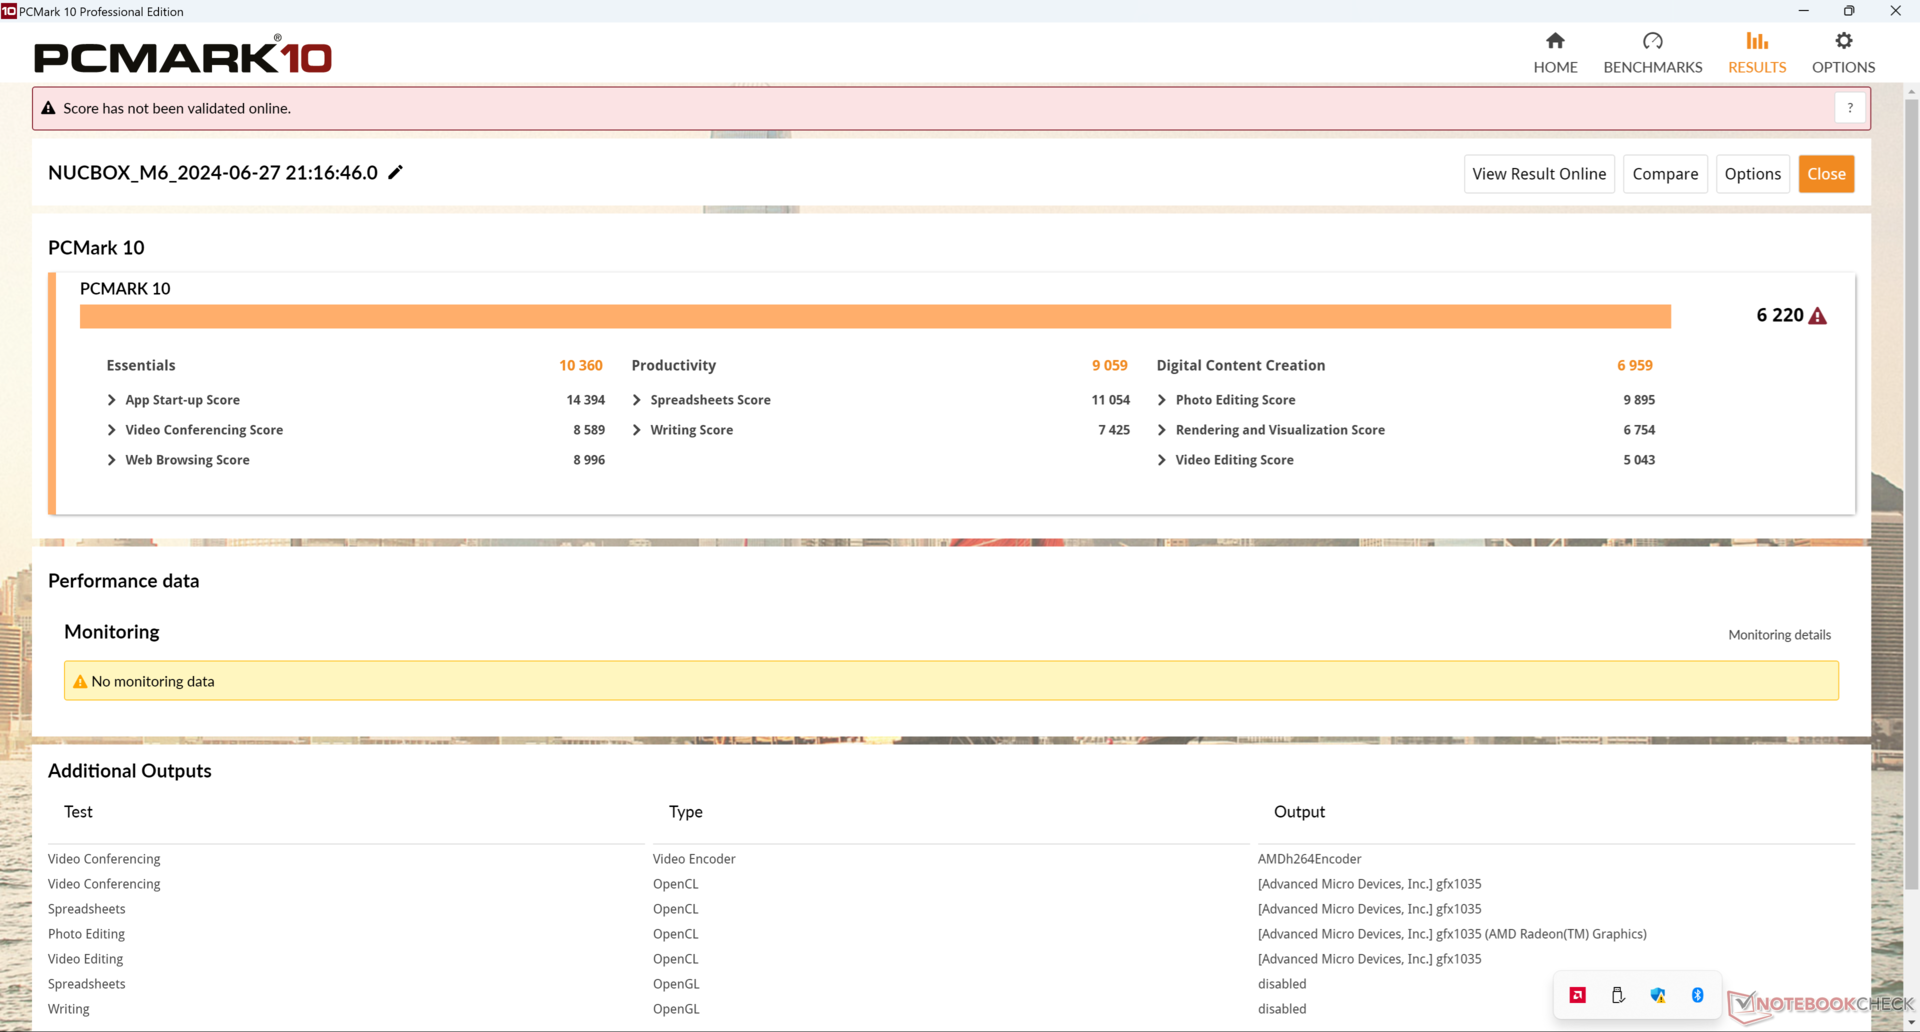
| PCMark 10 Score | 6220 punti | |
Aiuto | ||
| AIDA64 / Memory Copy | |
| BOSGAME M1 | |
| GMK NucBox K6 | |
| GMK NucBox M6 | |
| Intel NUC 13 Pro Kit NUC13ANK | |
| Media AMD Ryzen 5 6600H (28335 - 50886, n=3) | |
| GMK NucBox M5 | |
| Beelink SER5 | |
| AIDA64 / Memory Read | |
| BOSGAME M1 | |
| GMK NucBox K6 | |
| GMK NucBox M6 | |
| GMK NucBox M5 | |
| Intel NUC 13 Pro Kit NUC13ANK | |
| Media AMD Ryzen 5 6600H (34300 - 51684, n=3) | |
| Beelink SER5 | |
| AIDA64 / Memory Write | |
| BOSGAME M1 | |
| GMK NucBox K6 | |
| GMK NucBox M6 | |
| Media AMD Ryzen 5 6600H (31788 - 55160, n=3) | |
| GMK NucBox M5 | |
| Intel NUC 13 Pro Kit NUC13ANK | |
| Beelink SER5 | |
| AIDA64 / Memory Latency | |
| GMK NucBox M5 | |
| Intel NUC 13 Pro Kit NUC13ANK | |
| Beelink SER5 | |
| BOSGAME M1 | |
| GMK NucBox K6 | |
| GMK NucBox M6 | |
| Media AMD Ryzen 5 6600H (81.7 - 89.8, n=3) | |
* ... Meglio usare valori piccoli
Latenza DPC
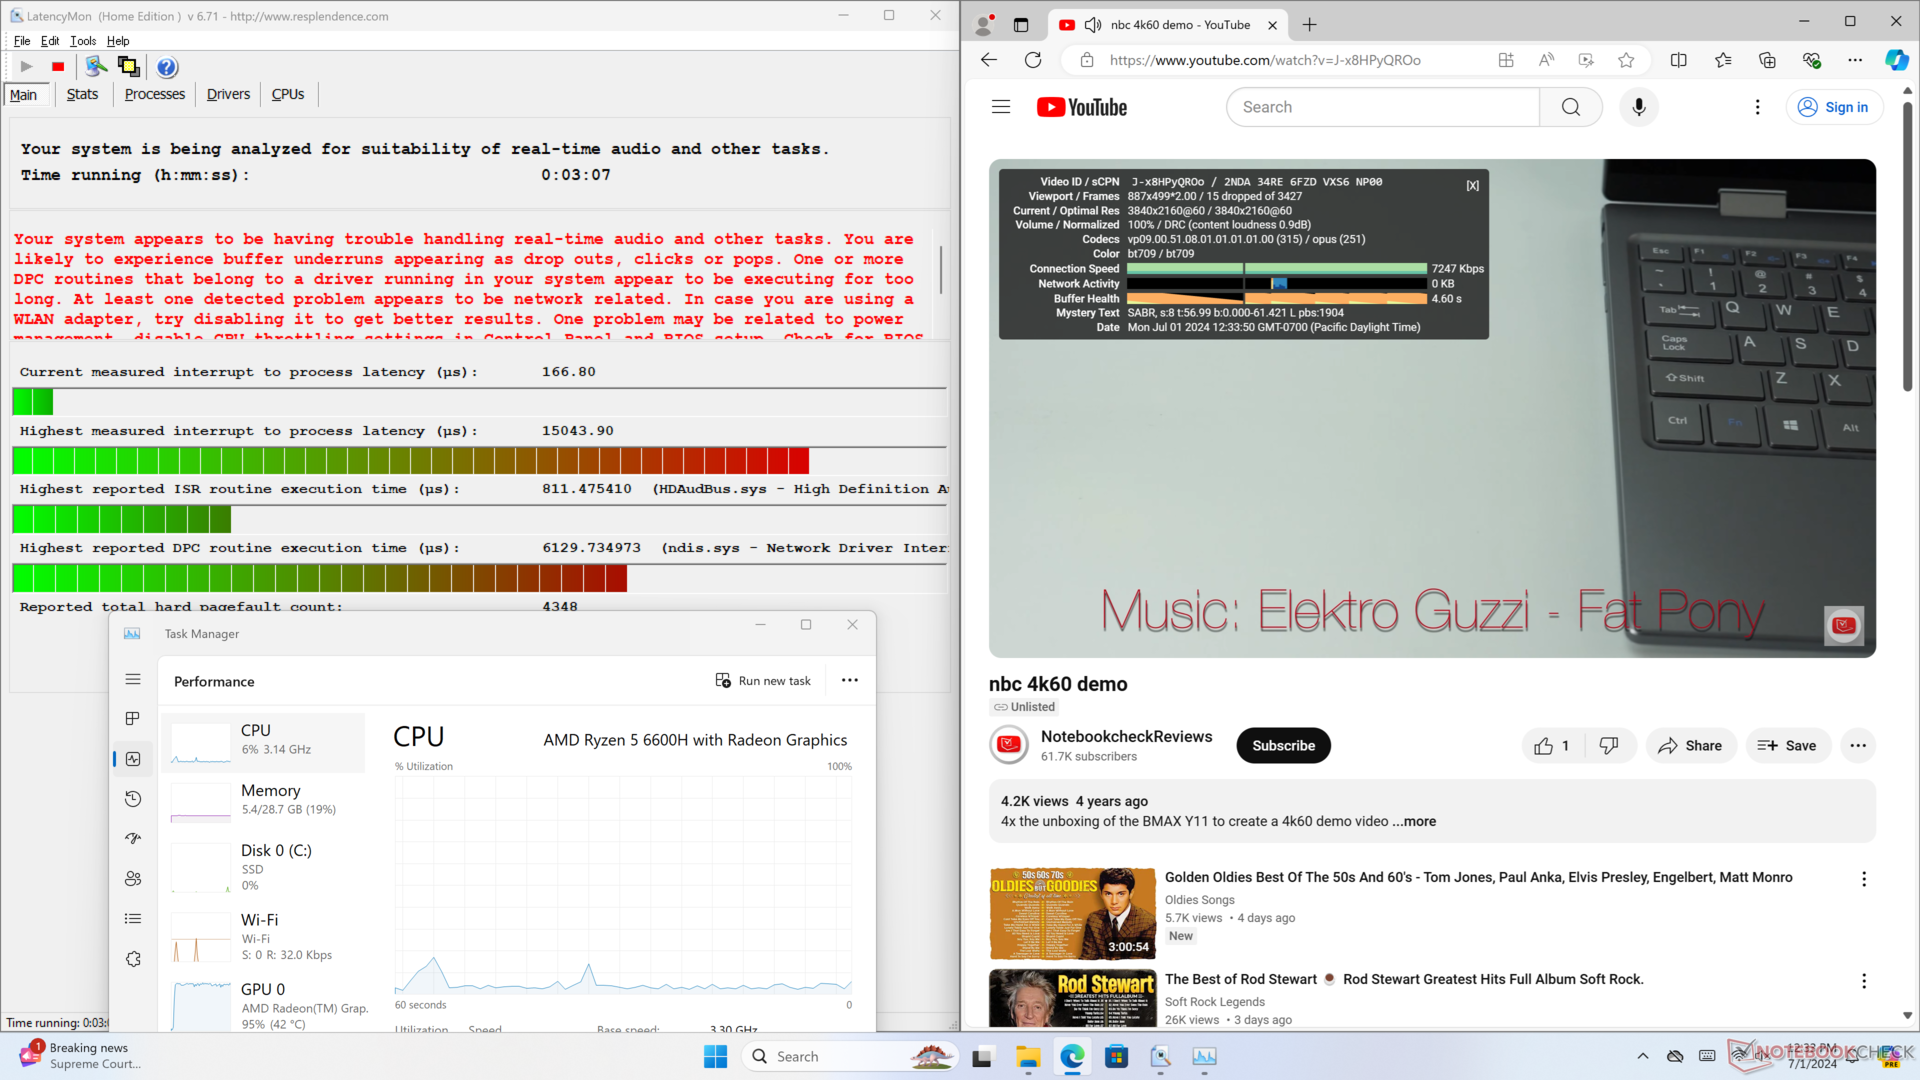
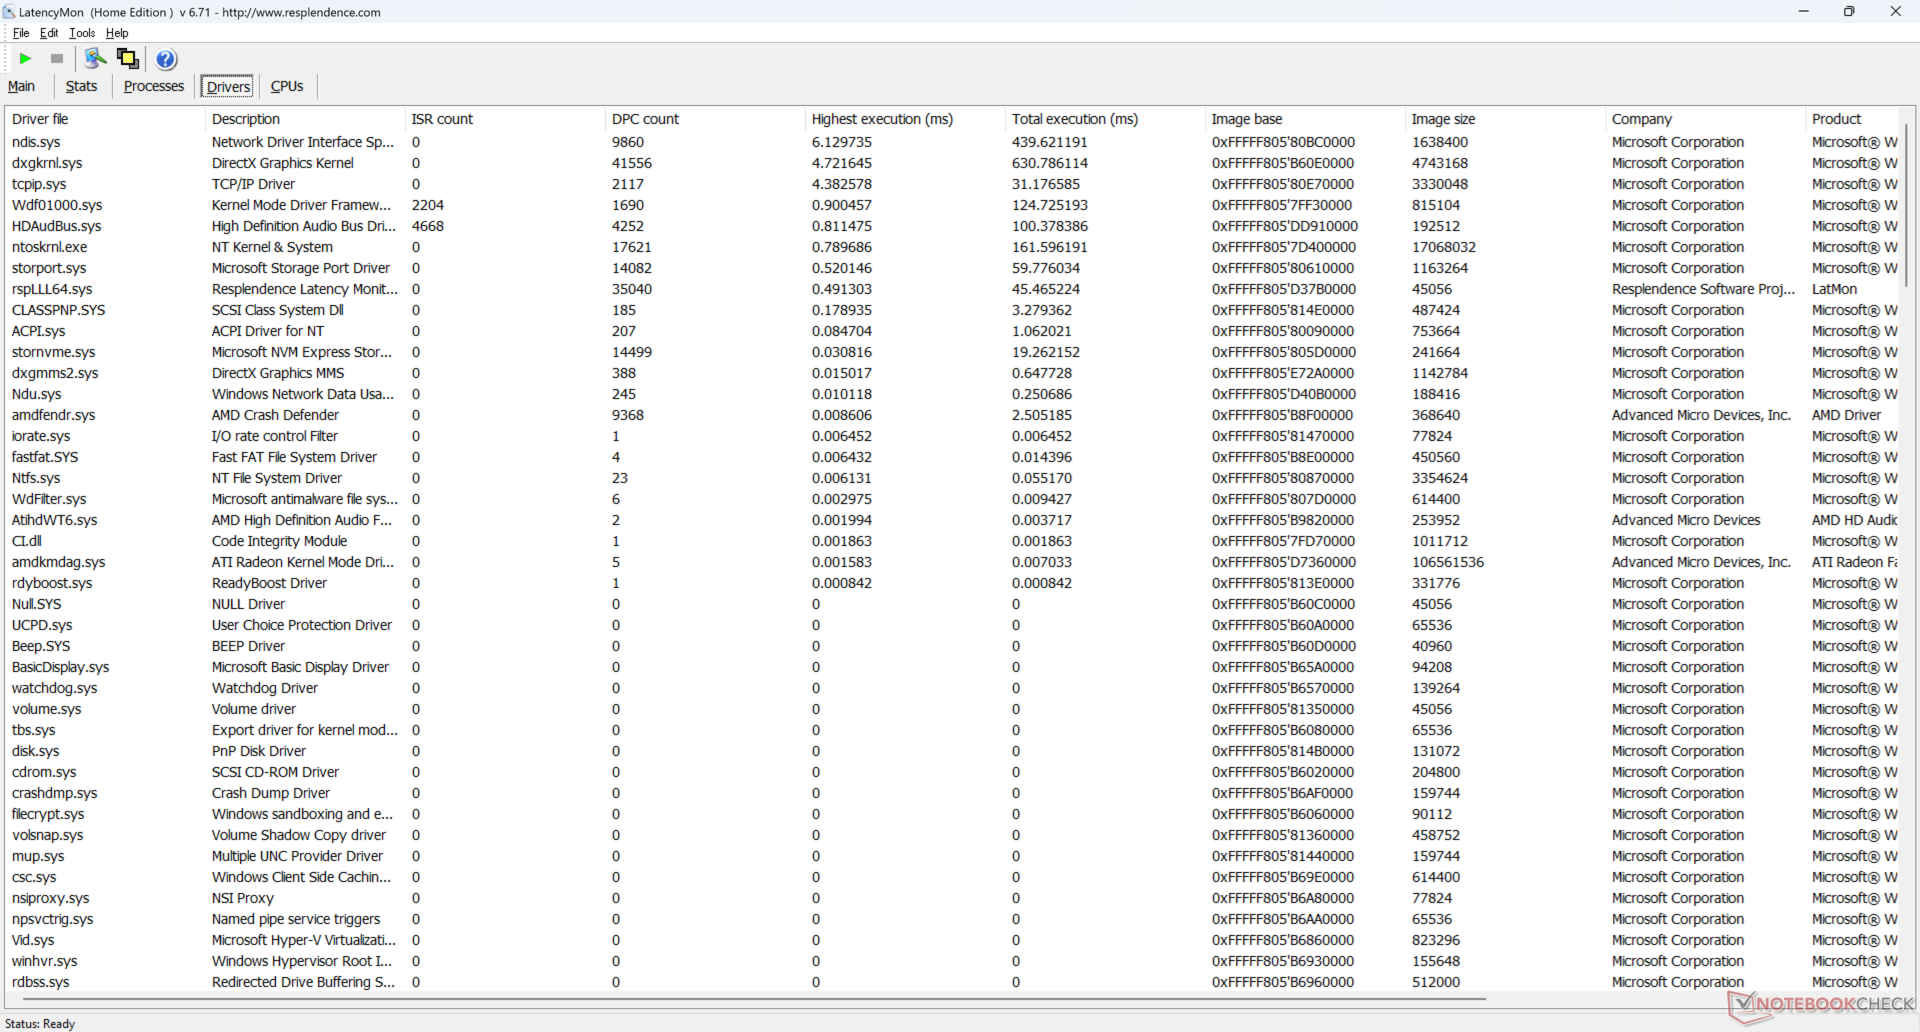
LatencyMon rivela gravi problemi di DPC quando si aprono più schede del browser della nostra homepage, anche dopo diversi test. anche la riproduzione di video in 4K a 60 FPS è problematica, con 15 fotogrammi caduti registrati in un periodo di 60 secondi. Questi problemi persistono nonostante l'aggiornamento dei driver di Windows e AMD alle loro ultime versioni al momento della recensione.
| DPC Latencies / LatencyMon - interrupt to process latency (max), Web, Youtube, Prime95 | |
| GMK NucBox M6 | |
| GMK NucBox K6 | |
| GMK NucBox M5 | |
| BOSGAME M1 | |
| Intel NUC 13 Pro Kit NUC13ANK | |
| Beelink SER5 | |
* ... Meglio usare valori piccoli
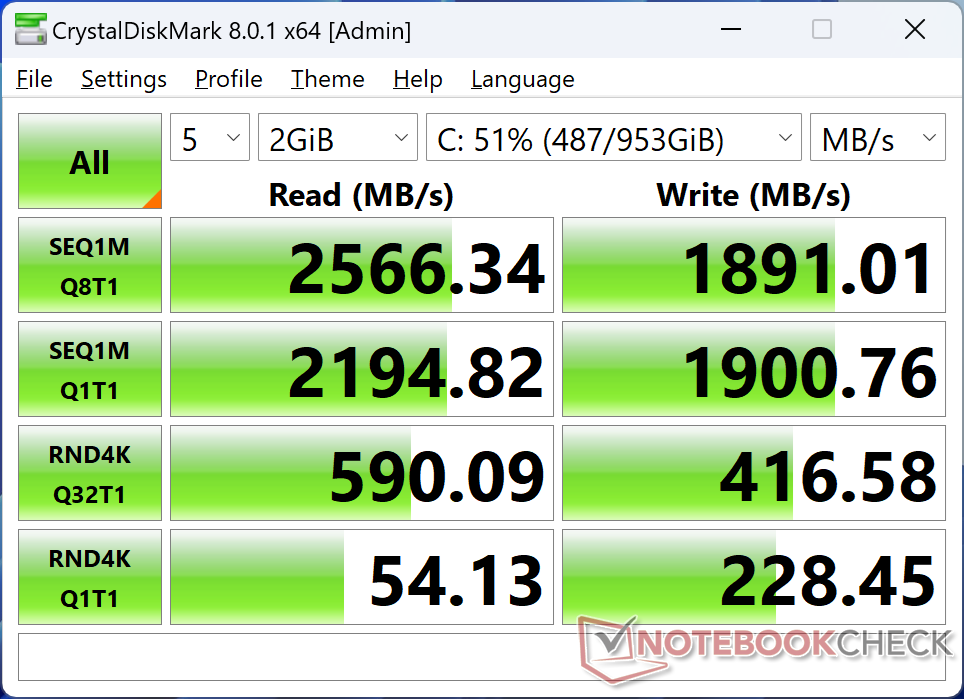
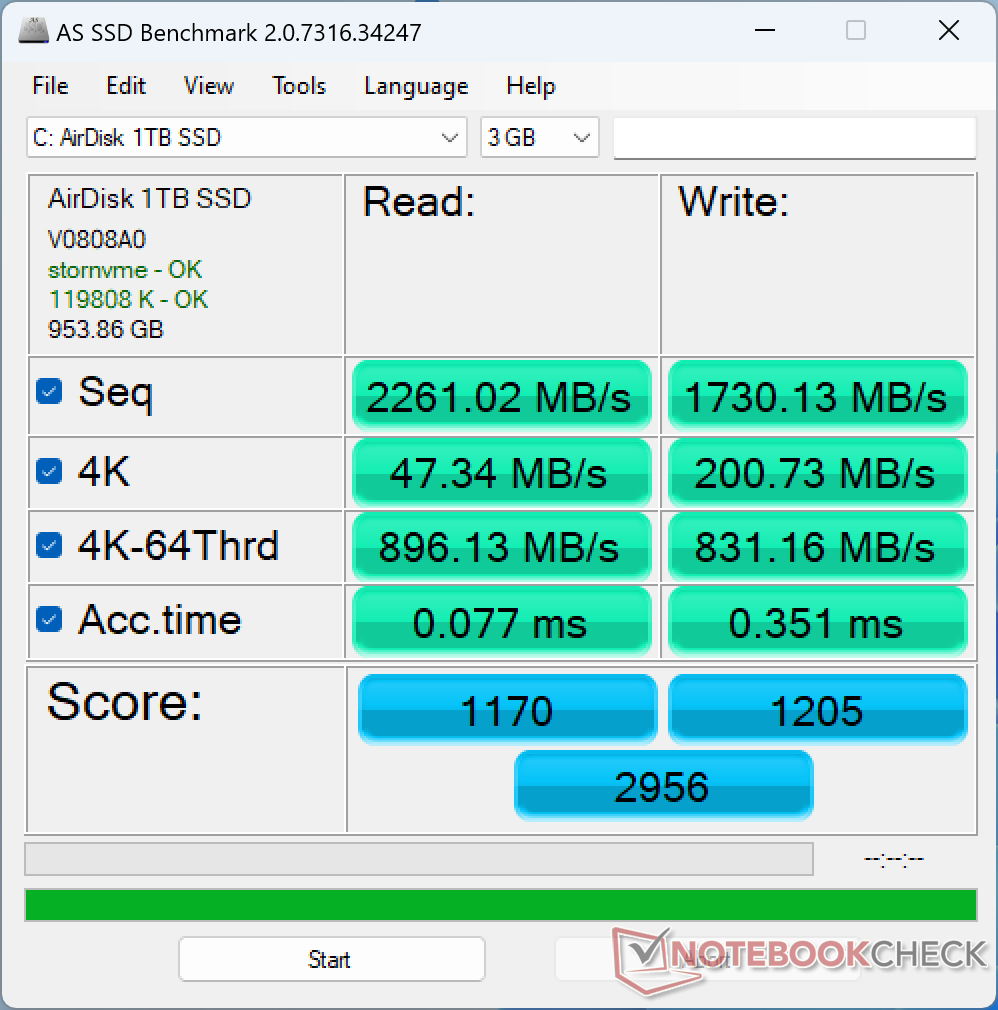
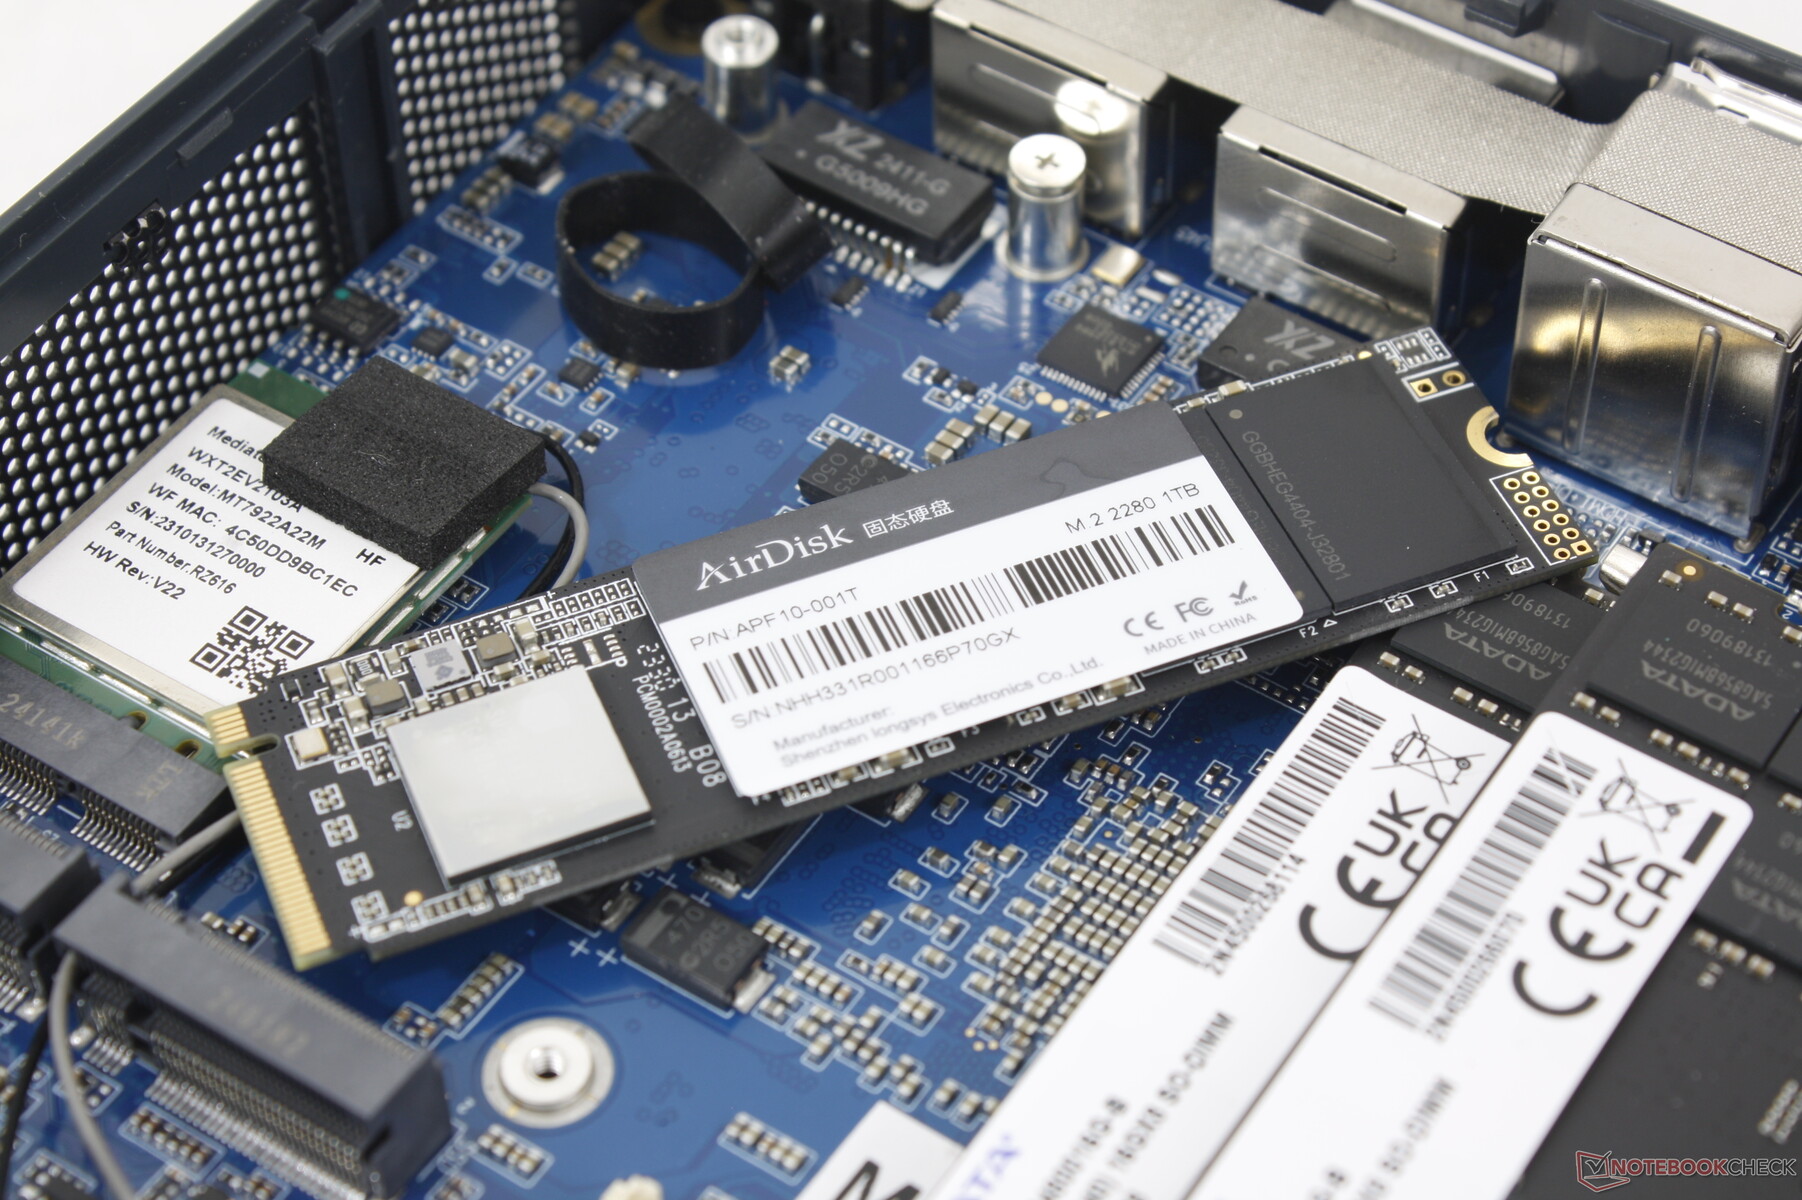
Dispositivi di archiviazione
Il sistema viene fornito con un SSD PCIe3 x4 NVMe di AirDisk invece della più comune unità PCIe4, probabilmente per risparmiare sui costi. L'SSD di fascia media offre una velocità di lettura stabile di 2600 MB/s, sufficiente considerando la CPU a cui è abbinato.

| Drive Performance Rating - Percent | |
| GMK NucBox K6 | |
| Intel NUC 13 Pro Kit NUC13ANK | |
| Beelink SER5 | |
| BOSGAME M1 | |
| GMK NucBox M5 | |
| GMK NucBox M6 | |
* ... Meglio usare valori piccoli
Disk Throttling: DiskSpd Read Loop, Queue Depth 8
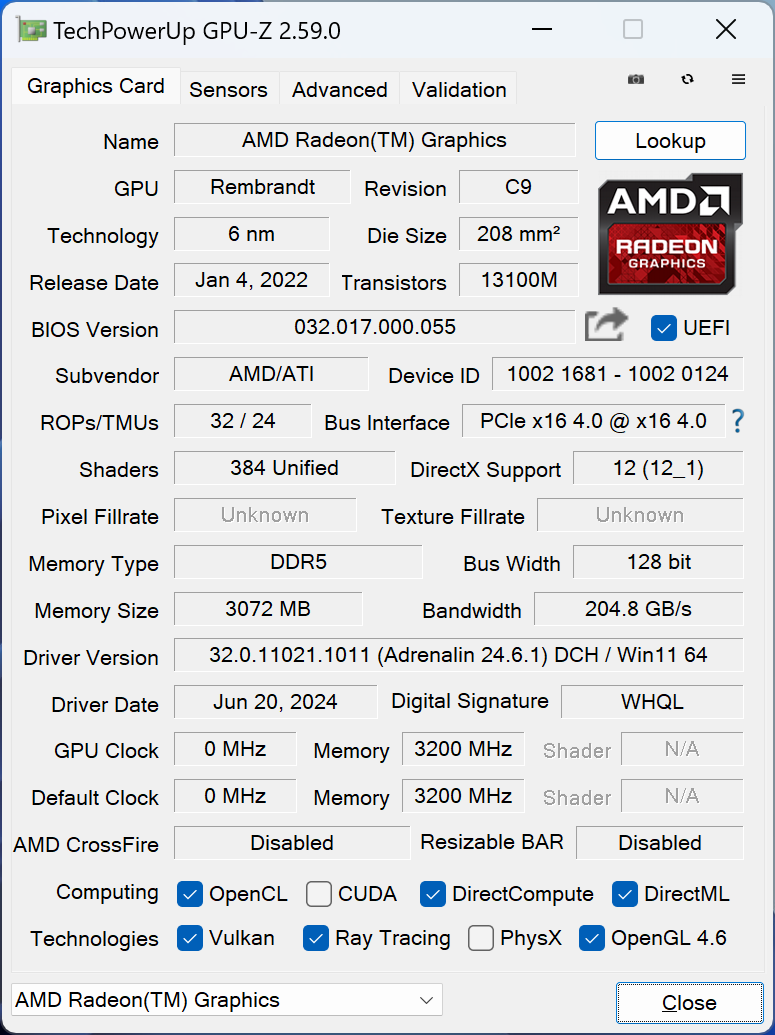
Prestazioni della GPU - La Radeon 660M fa fatica nella maggior parte dei giochi
La Radeon 660M è circa il 35% più lenta della Radeon 680M per essere più o meno alla pari con la più comune Iris Xe 96 EU. Anche se non è particolarmente adatta alla maggior parte dei giochi, è almeno un salto rispettabile rispetto alla Radeon RX Vega 8 sui processori Zen di vecchia generazione.
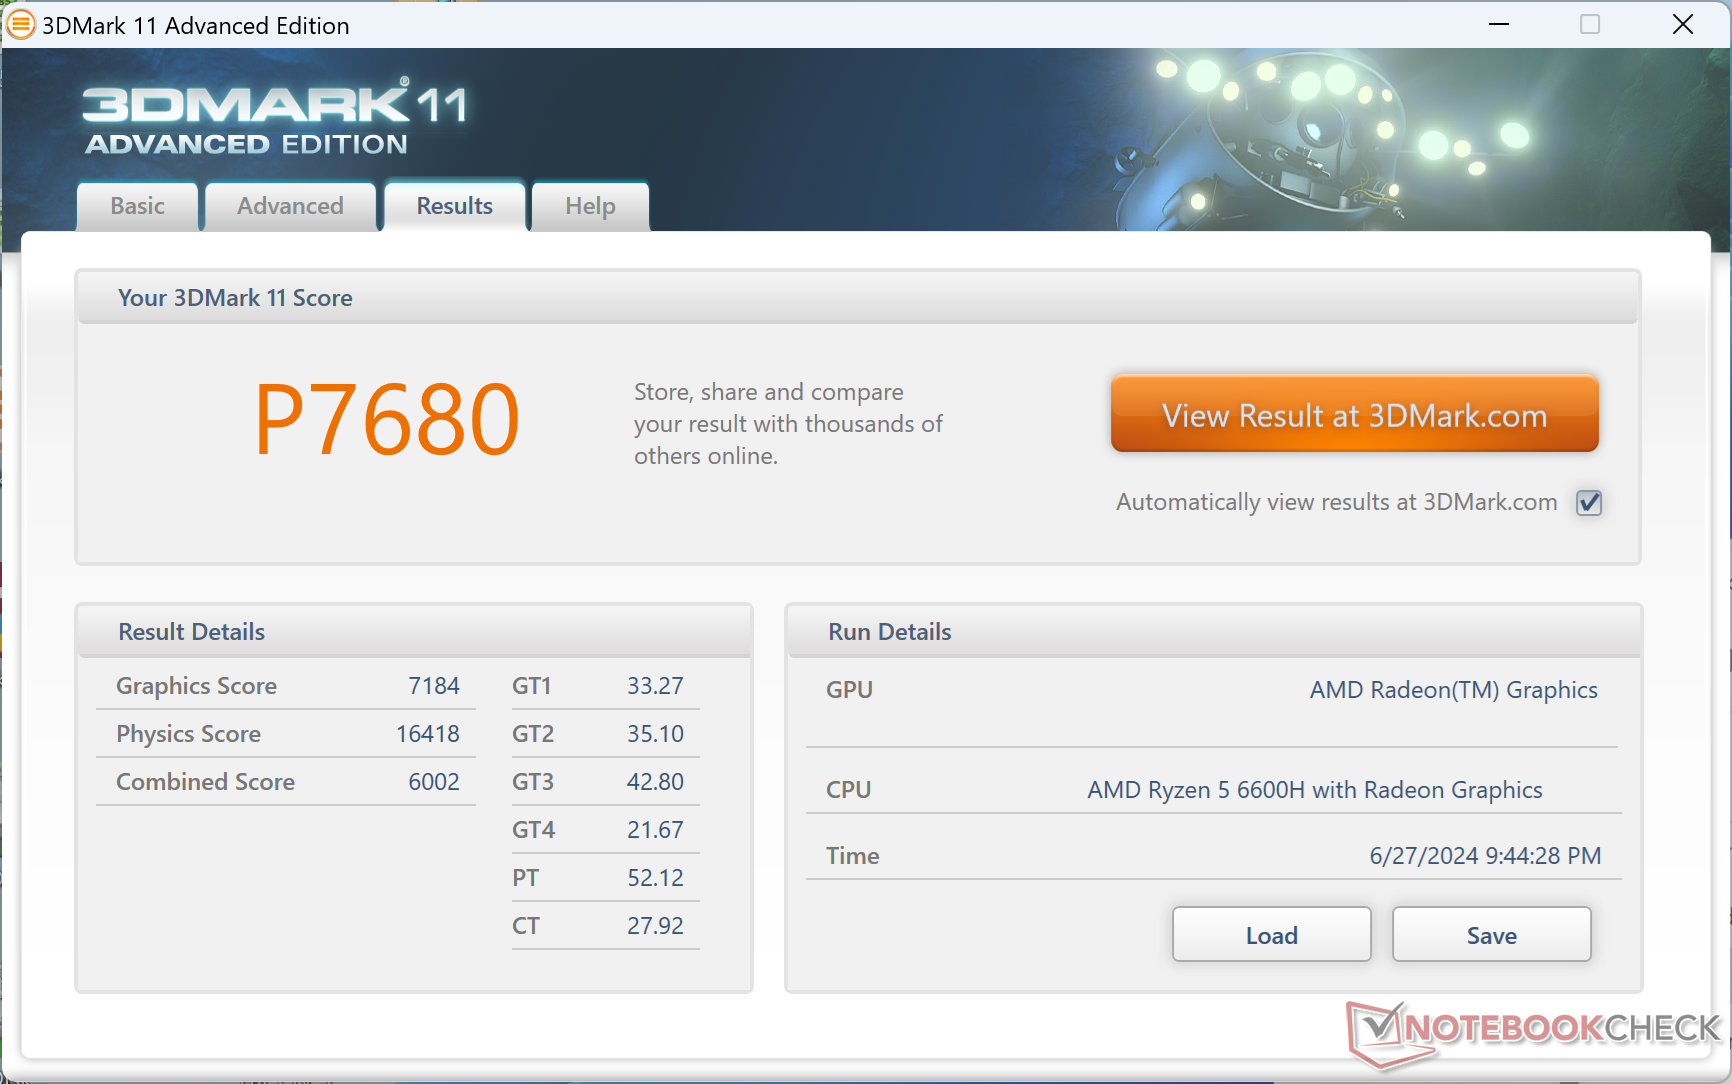
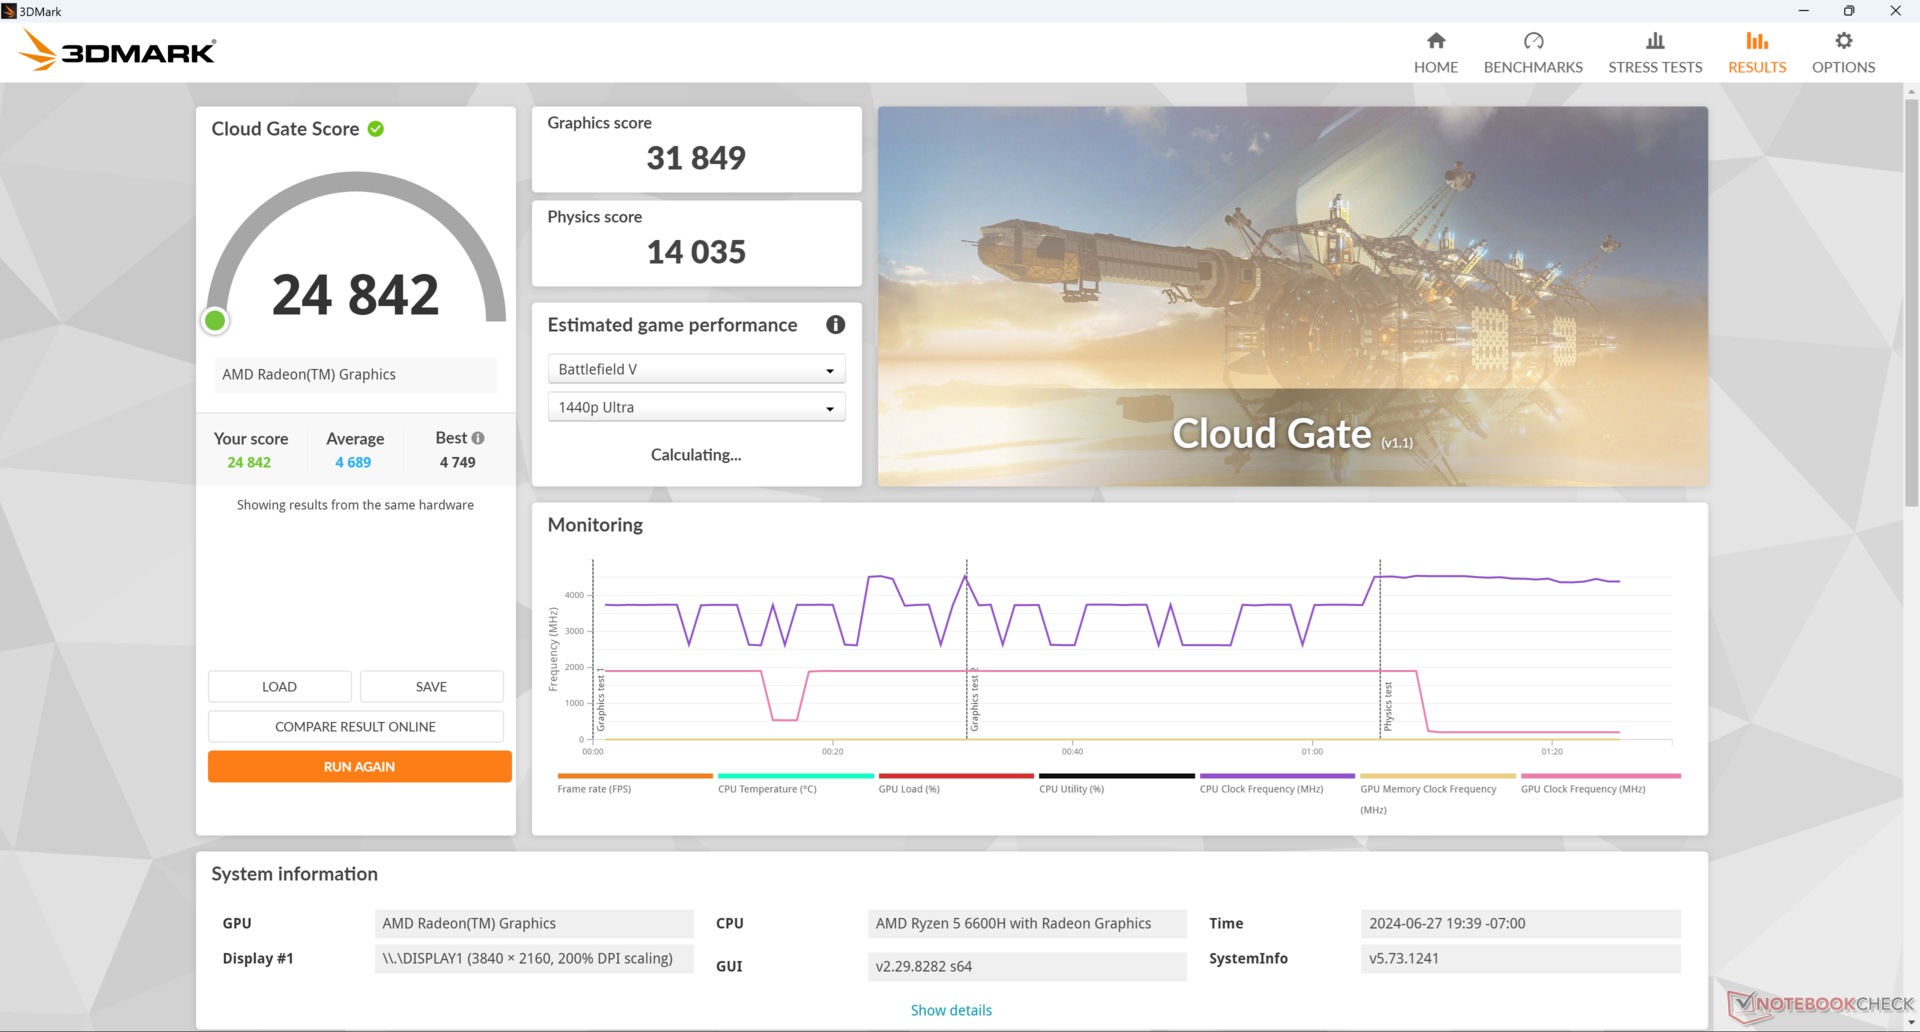
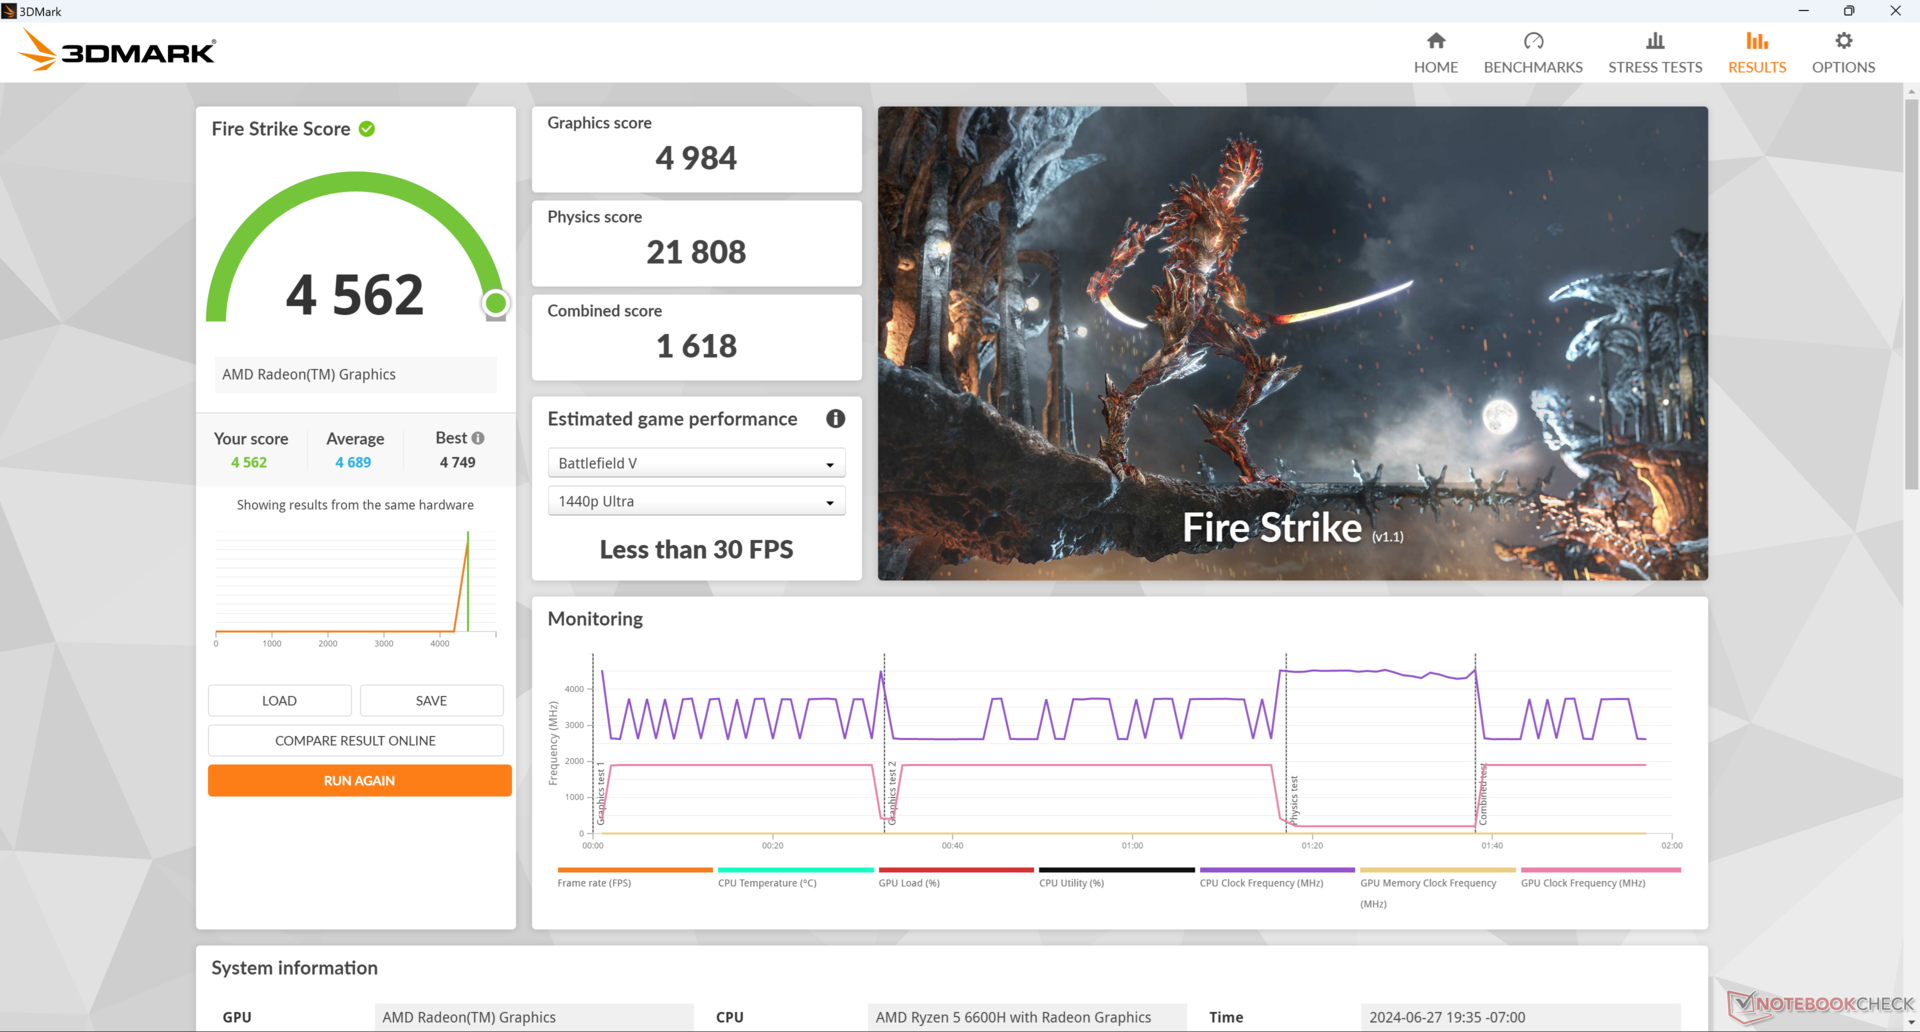
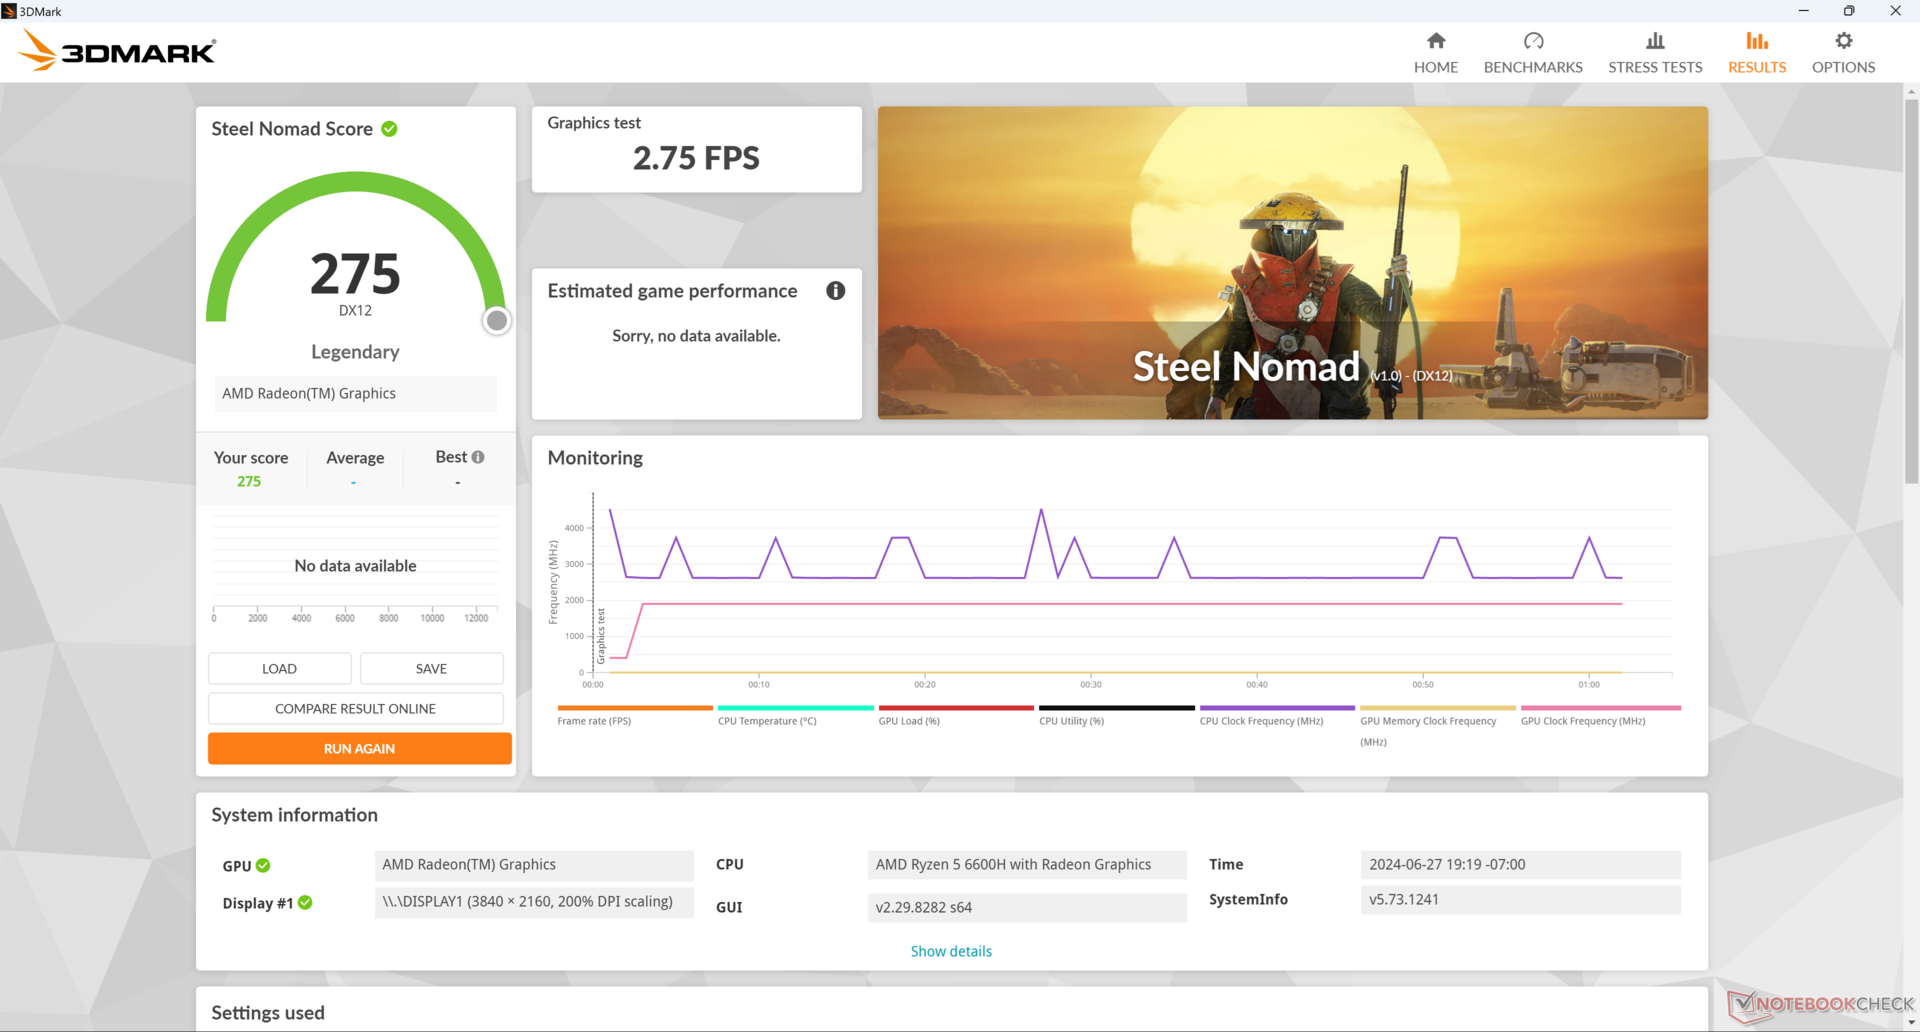
| 3DMark 11 Performance | 7680 punti | |
| 3DMark Cloud Gate Standard Score | 24842 punti | |
| 3DMark Fire Strike Score | 4562 punti | |
| 3DMark Time Spy Score | 1793 punti | |
| 3DMark Steel Nomad Score | 275 punti | |
Aiuto | ||
| Blender | |
| v3.3 Classroom HIP/AMD | |
| Media AMD Radeon 660M (438 - 755, n=8) | |
| Maxtang MTN-FP750 | |
| Aoostar GEM10 | |
| v3.3 Classroom CPU | |
| GMK NucBox M5 | |
| Acemagic AD15 | |
| Media AMD Radeon 660M (323 - 968, n=10) | |
| Geekom XT12 Pro | |
| GMK NucBox M6 | |
| Geekom GT13 Pro | |
| Intel NUC 13 Pro Kit NUC13ANK | |
| Maxtang MTN-FP750 | |
| Aoostar GEM10 | |
| HP Elite Mini 800 G9-5M9T9EA | |
| Aoostar GEM12 | |
| BOSGAME M1 | |
| Acemagic F2A | |
| Minisforum AtomMan X7 Ti | |
| v3.3 Classroom oneAPI/Intel | |
| Minisforum AtomMan X7 Ti | |
* ... Meglio usare valori piccoli
| Performance Rating - Percent | |
| BOSGAME M1 | |
| GMK NucBox K6 | |
| GMK NucBox M6 | |
| Intel NUC 13 Pro Kit NUC13ANK -2! | |
| GMK NucBox M5 | |
| Beelink SER5 | |
| The Witcher 3 - 1920x1080 Ultra Graphics & Postprocessing (HBAO+) | |
| BOSGAME M1 | |
| GMK NucBox K6 | |
| GMK NucBox M6 | |
| Intel NUC 13 Pro Kit NUC13ANK | |
| GMK NucBox M5 | |
| Beelink SER5 | |
| Final Fantasy XV Benchmark - 1920x1080 High Quality | |
| BOSGAME M1 | |
| GMK NucBox K6 | |
| GMK NucBox M6 | |
| GMK NucBox M5 | |
| Beelink SER5 | |
| Strange Brigade - 1920x1080 ultra AA:ultra AF:16 | |
| BOSGAME M1 | |
| GMK NucBox K6 | |
| GMK NucBox M6 | |
| Intel NUC 13 Pro Kit NUC13ANK | |
| GMK NucBox M5 | |
| Beelink SER5 | |
| Dota 2 Reborn - 1920x1080 ultra (3/3) best looking | |
| BOSGAME M1 | |
| GMK NucBox K6 | |
| Intel NUC 13 Pro Kit NUC13ANK | |
| GMK NucBox M6 | |
| GMK NucBox M5 | |
| Beelink SER5 | |
| X-Plane 11.11 - 1920x1080 high (fps_test=3) | |
| GMK NucBox K6 | |
| BOSGAME M1 | |
| GMK NucBox M6 | |
| GMK NucBox M5 | |
| Beelink SER5 | |
| Tiny Tina's Wonderlands - 1920x1080 Badass Preset (DX12) | |
| BOSGAME M1 | |
| GMK NucBox K6 | |
| GMK NucBox M6 | |
| Intel NUC 13 Pro Kit NUC13ANK | |
| GMK NucBox M5 | |
| Beelink SER5 | |
| The Witcher 3 | |
| 1024x768 Low Graphics & Postprocessing | |
| BOSGAME M1 | |
| GMK NucBox K6 | |
| Intel NUC 13 Pro Kit NUC13ANK | |
| GMK NucBox M6 | |
| Media AMD Radeon 660M (32.2 - 98.2, n=8) | |
| GMK NucBox M5 | |
| Beelink SER5 | |
| 1366x768 Medium Graphics & Postprocessing | |
| BOSGAME M1 | |
| GMK NucBox K6 | |
| GMK NucBox M6 | |
| Media AMD Radeon 660M (40.2 - 58.5, n=7) | |
| GMK NucBox M5 | |
| Beelink SER5 | |
| 1920x1080 High Graphics & Postprocessing (Nvidia HairWorks Off) | |
| BOSGAME M1 | |
| GMK NucBox K6 | |
| Intel NUC 13 Pro Kit NUC13ANK | |
| GMK NucBox M6 | |
| Media AMD Radeon 660M (18.5 - 28.6, n=8) | |
| GMK NucBox M5 | |
| Beelink SER5 | |
| 1920x1080 Ultra Graphics & Postprocessing (HBAO+) | |
| BOSGAME M1 | |
| GMK NucBox K6 | |
| GMK NucBox M6 | |
| Intel NUC 13 Pro Kit NUC13ANK | |
| Media AMD Radeon 660M (12.3 - 17.9, n=8) | |
| GMK NucBox M5 | |
| Beelink SER5 | |
| Far Cry 5 | |
| 1280x720 Low Preset AA:T | |
| BOSGAME M1 | |
| GMK NucBox K6 | |
| GMK NucBox M6 | |
| Media AMD Radeon 660M (38 - 71, n=6) | |
| Intel NUC 13 Pro Kit NUC13ANK | |
| Beelink SER5 | |
| GMK NucBox M5 | |
| 1920x1080 Medium Preset AA:T | |
| BOSGAME M1 | |
| GMK NucBox K6 | |
| GMK NucBox M6 | |
| Media AMD Radeon 660M (18 - 33, n=6) | |
| Intel NUC 13 Pro Kit NUC13ANK | |
| Beelink SER5 | |
| GMK NucBox M5 | |
| 1920x1080 High Preset AA:T | |
| BOSGAME M1 | |
| GMK NucBox K6 | |
| GMK NucBox M6 | |
| Intel NUC 13 Pro Kit NUC13ANK | |
| Media AMD Radeon 660M (16 - 30, n=6) | |
| Beelink SER5 | |
| GMK NucBox M5 | |
| 1920x1080 Ultra Preset AA:T | |
| BOSGAME M1 | |
| GMK NucBox K6 | |
| GMK NucBox M6 | |
| Media AMD Radeon 660M (16 - 27, n=5) | |
| Intel NUC 13 Pro Kit NUC13ANK | |
| Beelink SER5 | |
| GMK NucBox M5 | |
| Final Fantasy XV Benchmark | |
| 1280x720 Lite Quality | |
| BOSGAME M1 | |
| GMK NucBox K6 | |
| GMK NucBox M6 | |
| Media AMD Radeon 660M (33.1 - 53.4, n=10) | |
| GMK NucBox M5 | |
| Beelink SER5 | |
| 1920x1080 Standard Quality | |
| BOSGAME M1 | |
| GMK NucBox K6 | |
| GMK NucBox M6 | |
| Media AMD Radeon 660M (16 - 24.7, n=10) | |
| GMK NucBox M5 | |
| Beelink SER5 | |
| 1920x1080 High Quality | |
| BOSGAME M1 | |
| GMK NucBox K6 | |
| GMK NucBox M6 | |
| Media AMD Radeon 660M (11.1 - 17.9, n=10) | |
| GMK NucBox M5 | |
| Beelink SER5 | |
| Cyberpunk 2077 2.2 Phantom Liberty | |
| 1280x720 Low Preset (FSR off) | |
| BOSGAME M1 | |
| GMK NucBox K6 | |
| Media AMD Radeon 660M (27.5 - 34.1, n=2) | |
| GMK NucBox M5 | |
| 1920x1080 Low Preset (FSR off) | |
| BOSGAME M1 | |
| GMK NucBox K6 | |
| GMK NucBox M6 | |
| Media AMD Radeon 660M (14.9 - 24.3, n=4) | |
| GMK NucBox M5 | |
| 1920x1080 Medium Preset (FSR off) | |
| BOSGAME M1 | |
| GMK NucBox K6 | |
| GMK NucBox M6 | |
| Media AMD Radeon 660M (11.5 - 18.1, n=4) | |
| GMK NucBox M5 | |
| 1920x1080 High Preset (FSR off) | |
| BOSGAME M1 | |
| GMK NucBox K6 | |
| GMK NucBox M6 | |
| Media AMD Radeon 660M (8.85 - 13.2, n=5) | |
| GMK NucBox M5 | |
| 1920x1080 Ultra Preset (FSR off) | |
| BOSGAME M1 | |
| GMK NucBox K6 | |
| Media AMD Radeon 660M (7.77 - 11.2, n=3) | |
| Strange Brigade | |
| 1280x720 lowest AF:1 | |
| BOSGAME M1 | |
| GMK NucBox K6 | |
| GMK NucBox M6 | |
| Media AMD Radeon 660M (70.2 - 120.7, n=9) | |
| Intel NUC 13 Pro Kit NUC13ANK | |
| GMK NucBox M5 | |
| Beelink SER5 | |
| 1920x1080 medium AA:medium AF:4 | |
| BOSGAME M1 | |
| GMK NucBox K6 | |
| GMK NucBox M6 | |
| Media AMD Radeon 660M (26.8 - 44.5, n=9) | |
| Intel NUC 13 Pro Kit NUC13ANK | |
| GMK NucBox M5 | |
| Beelink SER5 | |
| 1920x1080 high AA:high AF:8 | |
| BOSGAME M1 | |
| GMK NucBox K6 | |
| GMK NucBox M6 | |
| Media AMD Radeon 660M (21.4 - 35.9, n=9) | |
| Intel NUC 13 Pro Kit NUC13ANK | |
| GMK NucBox M5 | |
| Beelink SER5 | |
| 1920x1080 ultra AA:ultra AF:16 | |
| BOSGAME M1 | |
| GMK NucBox K6 | |
| GMK NucBox M6 | |
| Media AMD Radeon 660M (18.4 - 29.7, n=9) | |
| Intel NUC 13 Pro Kit NUC13ANK | |
| GMK NucBox M5 | |
| Beelink SER5 | |
| Tiny Tina's Wonderlands | |
| 1280x720 Lowest Preset (DX12) | |
| BOSGAME M1 | |
| GMK NucBox K6 | |
| GMK NucBox M6 | |
| Media AMD Radeon 660M (56.3 - 80.8, n=2) | |
| Intel NUC 13 Pro Kit NUC13ANK | |
| GMK NucBox M5 | |
| Beelink SER5 | |
| 1920x1080 Low Preset (DX12) | |
| BOSGAME M1 | |
| GMK NucBox K6 | |
| GMK NucBox M6 | |
| Media AMD Radeon 660M (26.9 - 40, n=3) | |
| Intel NUC 13 Pro Kit NUC13ANK | |
| GMK NucBox M5 | |
| Beelink SER5 | |
| 1920x1080 Medium Preset (DX12) | |
| BOSGAME M1 | |
| GMK NucBox K6 | |
| GMK NucBox M6 | |
| Media AMD Radeon 660M (19.7 - 31.3, n=3) | |
| Intel NUC 13 Pro Kit NUC13ANK | |
| GMK NucBox M5 | |
| Beelink SER5 | |
| 1920x1080 High Preset (DX12) | |
| BOSGAME M1 | |
| GMK NucBox K6 | |
| GMK NucBox M6 | |
| Media AMD Radeon 660M (12.6 - 20.5, n=3) | |
| Intel NUC 13 Pro Kit NUC13ANK | |
| GMK NucBox M5 | |
| Beelink SER5 | |
| 1920x1080 Badass Preset (DX12) | |
| BOSGAME M1 | |
| GMK NucBox K6 | |
| GMK NucBox M6 | |
| Intel NUC 13 Pro Kit NUC13ANK | |
| Media AMD Radeon 660M (9.57 - 15.6, n=2) | |
| GMK NucBox M5 | |
| Beelink SER5 | |
| F1 22 | |
| 1280x720 Ultra Low Preset AA:T AF:16x | |
| BOSGAME M1 | |
| GMK NucBox K6 | |
| GMK NucBox M6 | |
| Media AMD Radeon 660M (72.1 - 107.3, n=3) | |
| Intel NUC 13 Pro Kit NUC13ANK | |
| GMK NucBox M5 | |
| Beelink SER5 | |
| 1920x1080 Low Preset AA:T AF:16x | |
| BOSGAME M1 | |
| GMK NucBox K6 | |
| GMK NucBox M6 | |
| Media AMD Radeon 660M (42.4 - 58.3, n=4) | |
| Intel NUC 13 Pro Kit NUC13ANK | |
| GMK NucBox M5 | |
| Beelink SER5 | |
| 1920x1080 Medium Preset AA:T AF:16x | |
| BOSGAME M1 | |
| GMK NucBox K6 | |
| GMK NucBox M6 | |
| Intel NUC 13 Pro Kit NUC13ANK | |
| Media AMD Radeon 660M (37 - 52.3, n=4) | |
| GMK NucBox M5 | |
| Beelink SER5 | |
| 1920x1080 High Preset AA:T AF:16x | |
| BOSGAME M1 | |
| GMK NucBox K6 | |
| GMK NucBox M6 | |
| Intel NUC 13 Pro Kit NUC13ANK | |
| Media AMD Radeon 660M (26.2 - 37.2, n=4) | |
| GMK NucBox M5 | |
| Beelink SER5 | |
| 1920x1080 Ultra High Preset AA:T AF:16x | |
| Intel NUC 13 Pro Kit NUC13ANK | |
| BOSGAME M1 | |
| GMK NucBox K6 | |
| GMK NucBox M5 | |
| Beelink SER5 | |
| GMK NucBox M6 | |
| Media AMD Radeon 660M (5.13 - 8.43, n=3) | |
| Baldur's Gate 3 | |
| 1280x720 Low Preset | |
| BOSGAME M1 | |
| GMK NucBox M6 | |
| Media AMD Radeon 660M (26.6 - 37.3, n=2) | |
| GMK NucBox M5 | |
| 1920x1080 Low Preset | |
| BOSGAME M1 | |
| GMK NucBox K6 | |
| GMK NucBox M6 | |
| Media AMD Radeon 660M (16.5 - 22.9, n=4) | |
| GMK NucBox M5 | |
| 1920x1080 Medium Preset | |
| BOSGAME M1 | |
| GMK NucBox K6 | |
| GMK NucBox M6 | |
| Media AMD Radeon 660M (12.8 - 15.1, n=4) | |
| 1920x1080 High Preset | |
| BOSGAME M1 | |
| GMK NucBox K6 | |
| GMK NucBox M6 | |
| Media AMD Radeon 660M (10.2 - 13.3, n=4) | |
| 1920x1080 Ultra Preset | |
| BOSGAME M1 | |
| GMK NucBox K6 | |
| GMK NucBox M6 | |
| Media AMD Radeon 660M (9.97 - 12.6, n=3) | |
| X-Plane 11.11 | |
| 1280x720 low (fps_test=1) | |
| GMK NucBox K6 | |
| BOSGAME M1 | |
| GMK NucBox M6 | |
| Media AMD Radeon 660M (34.8 - 51.8, n=10) | |
| GMK NucBox M5 | |
| Beelink SER5 | |
| 1920x1080 med (fps_test=2) | |
| GMK NucBox K6 | |
| BOSGAME M1 | |
| GMK NucBox M6 | |
| Media AMD Radeon 660M (24.2 - 38.5, n=10) | |
| Beelink SER5 | |
| GMK NucBox M5 | |
| 1920x1080 high (fps_test=3) | |
| GMK NucBox K6 | |
| BOSGAME M1 | |
| GMK NucBox M6 | |
| Media AMD Radeon 660M (22.1 - 33.8, n=10) | |
| GMK NucBox M5 | |
| Beelink SER5 | |
L'inattività su Witcher 3 rivela problemi nel mantenere costanti le frequenze dei fotogrammi, suggerendo una cattiva gestione delle attività in background o driver scadenti. Come mostra il nostro grafico qui sotto, le frequenze dei fotogrammi occasionalmente scendevano bruscamente da ~30 FPS a ~24 FPS senza apparentemente alcun motivo, mentre dovevano rimanere costanti per tutto il tempo.
Witcher 3 FPS Chart
| basso | medio | alto | ultra | |
|---|---|---|---|---|
| The Witcher 3 (2015) | 98.2 | 52.6 | 25.7 | 17.8 |
| Dota 2 Reborn (2015) | 144.9 | 107.9 | 70 | 60.8 |
| Final Fantasy XV Benchmark (2018) | 48.3 | 24.7 | 17.9 | |
| X-Plane 11.11 (2018) | 51.8 | 38.5 | 33.2 | |
| Far Cry 5 (2018) | 71 | 33 | 30 | 27 |
| Strange Brigade (2018) | 120.2 | 43 | 35.9 | 29.6 |
| Tiny Tina's Wonderlands (2022) | 40 | 31.3 | 20.5 | 15.6 |
| F1 22 (2022) | 58.3 | 52.3 | 37.2 | 8.43 |
| Baldur's Gate 3 (2023) | 22.9 | 15.1 | 13.3 | 12.6 |
| Cyberpunk 2077 2.2 Phantom Liberty (2023) | 24.3 | 18.1 | 11.6 |
Emissioni
Rumore del sistema
Il rumore della ventola è più forte di quello che abbiamo registrato su NucBox M5. Se si considera che l'M6 utilizza una CPU più esigente senza modifiche alla soluzione di raffreddamento, il rumore più forte non è una sorpresa. Anche carichi medi come 3DMark 06 possono far sì che la ventola raggiunga il suo massimo RPM dopo soli 30 secondi dal test, rispetto ai soli 37 dB(A) del più lento M5. Le pulsazioni della ventola sono
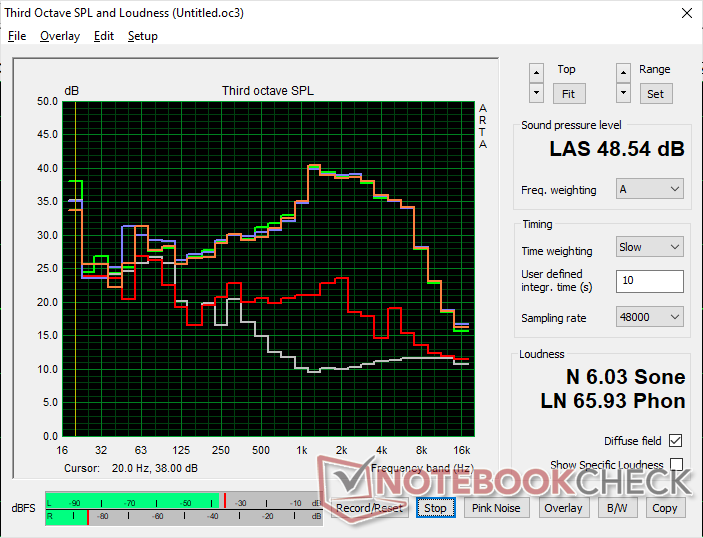
Rumorosità
| Idle |
| 31.9 / 32 / 33.8 dB(A) |
| Sotto carico |
| 48.5 / 48.5 dB(A) |
 | ||
30 dB silenzioso 40 dB(A) udibile 50 dB(A) rumoroso |
||
min: | ||
| GMK NucBox M6 Radeon 660M, R5 6600H, AirDisk APF 10-512G | GMK NucBox M5 Vega 8, R7 5700U, Lexar 1024GB LNM6A1X001T-HNNNG | GMK NucBox K6 Radeon 780M, R7 7840HS, MasonSemi 1TB MC7000 | BOSGAME M1 Radeon 780M, R7 7840HS | Beelink SER5 Vega 6, R5 5560U, Crucial P3 Plus CT1000P3PSSD8 | Intel NUC 13 Pro Kit NUC13ANK Iris Xe G7 96EUs, i7-1360P, Samsung PM9A1 MZVL2512HCJQ | |
|---|---|---|---|---|---|---|
| Noise | 9% | 3% | 8% | 28% | 4% | |
| off /ambiente * | 24.2 | 23.4 3% | 23.2 4% | 23.2 4% | 23.7 2% | 29.8 -23% |
| Idle Minimum * | 31.9 | 33.8 -6% | 31.3 2% | 32 -0% | 23.9 25% | 30.2 5% |
| Idle Average * | 32 | 33.8 -6% | 31.3 2% | 32 -0% | 23.9 25% | 31.1 3% |
| Idle Maximum * | 33.8 | 33.8 -0% | 33.4 1% | 32 5% | 23.9 29% | 31.9 6% |
| Load Average * | 48.5 | 36.5 25% | 47.5 2% | 38.7 20% | 28 42% | 40 18% |
| Witcher 3 ultra * | 48.5 | 36.8 24% | 43.6 10% | 41.7 14% | 27.6 43% | |
| Load Maximum * | 48.5 | 36.9 24% | 47.7 2% | 42 13% | 32.8 32% | 40.5 16% |
* ... Meglio usare valori piccoli
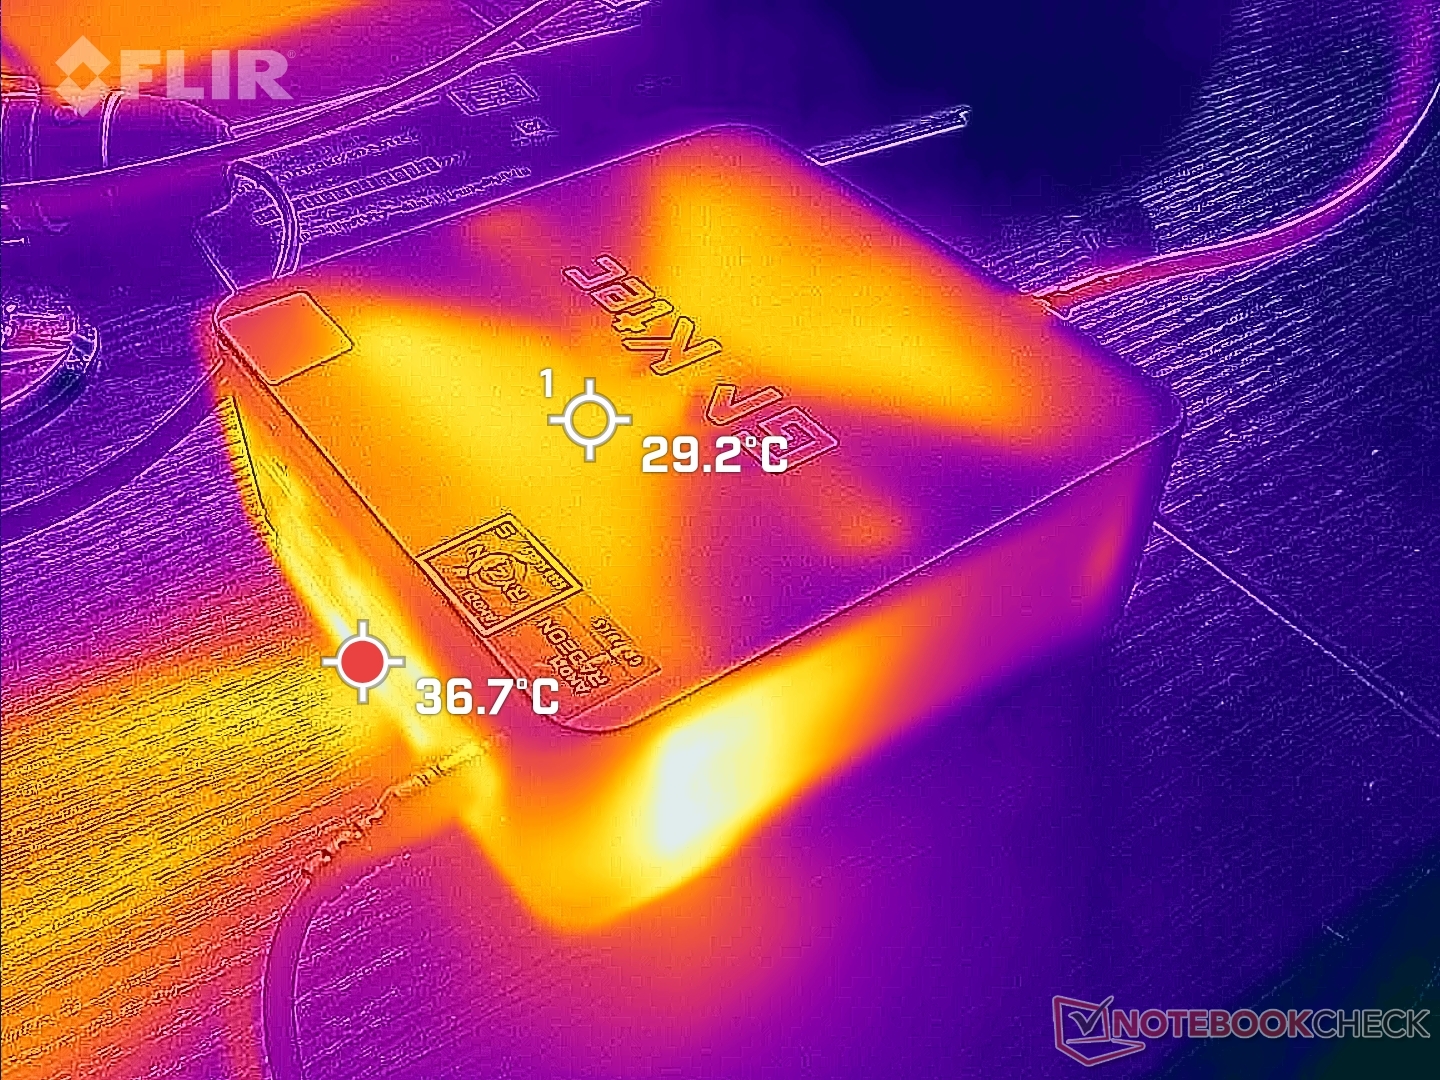
Temperatura
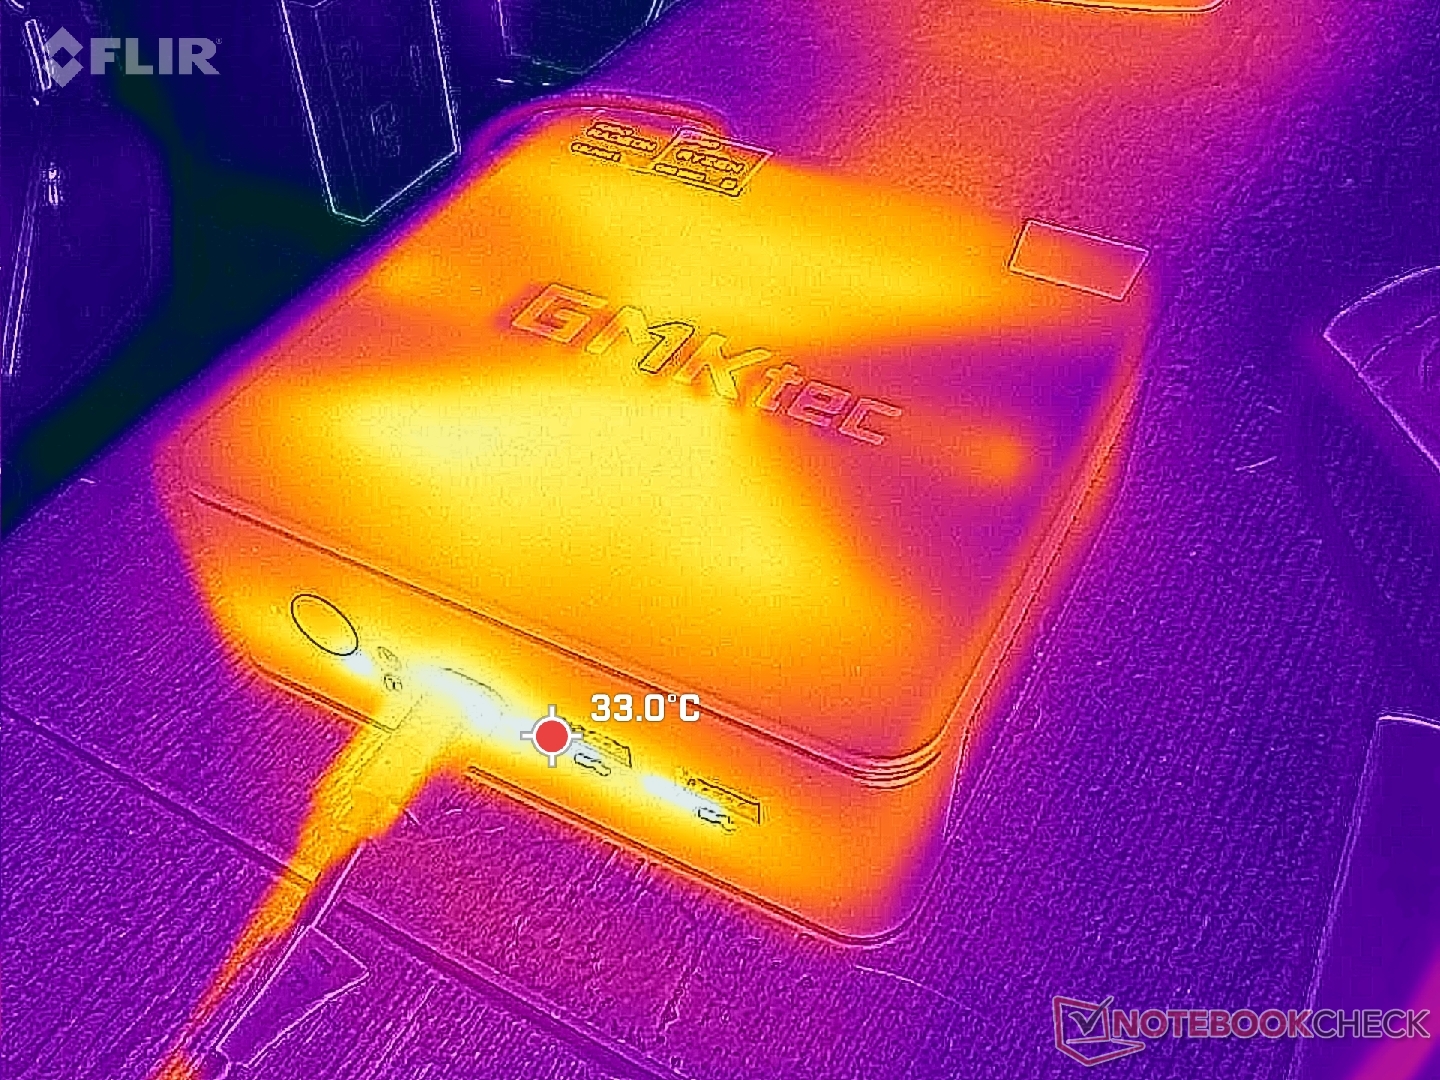
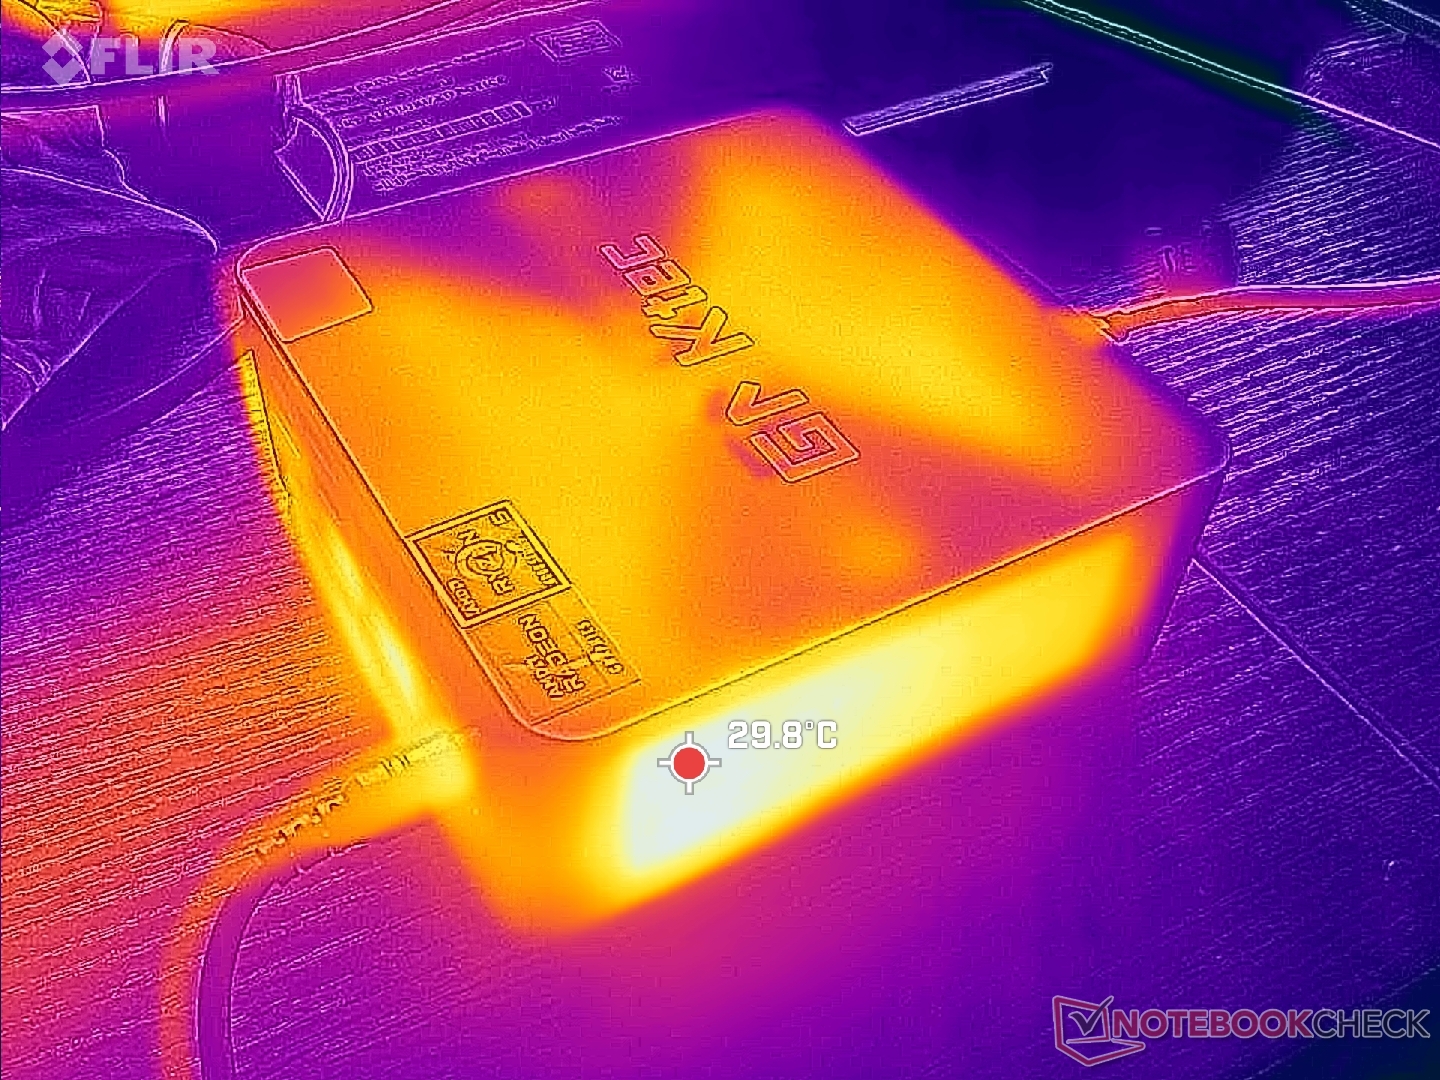
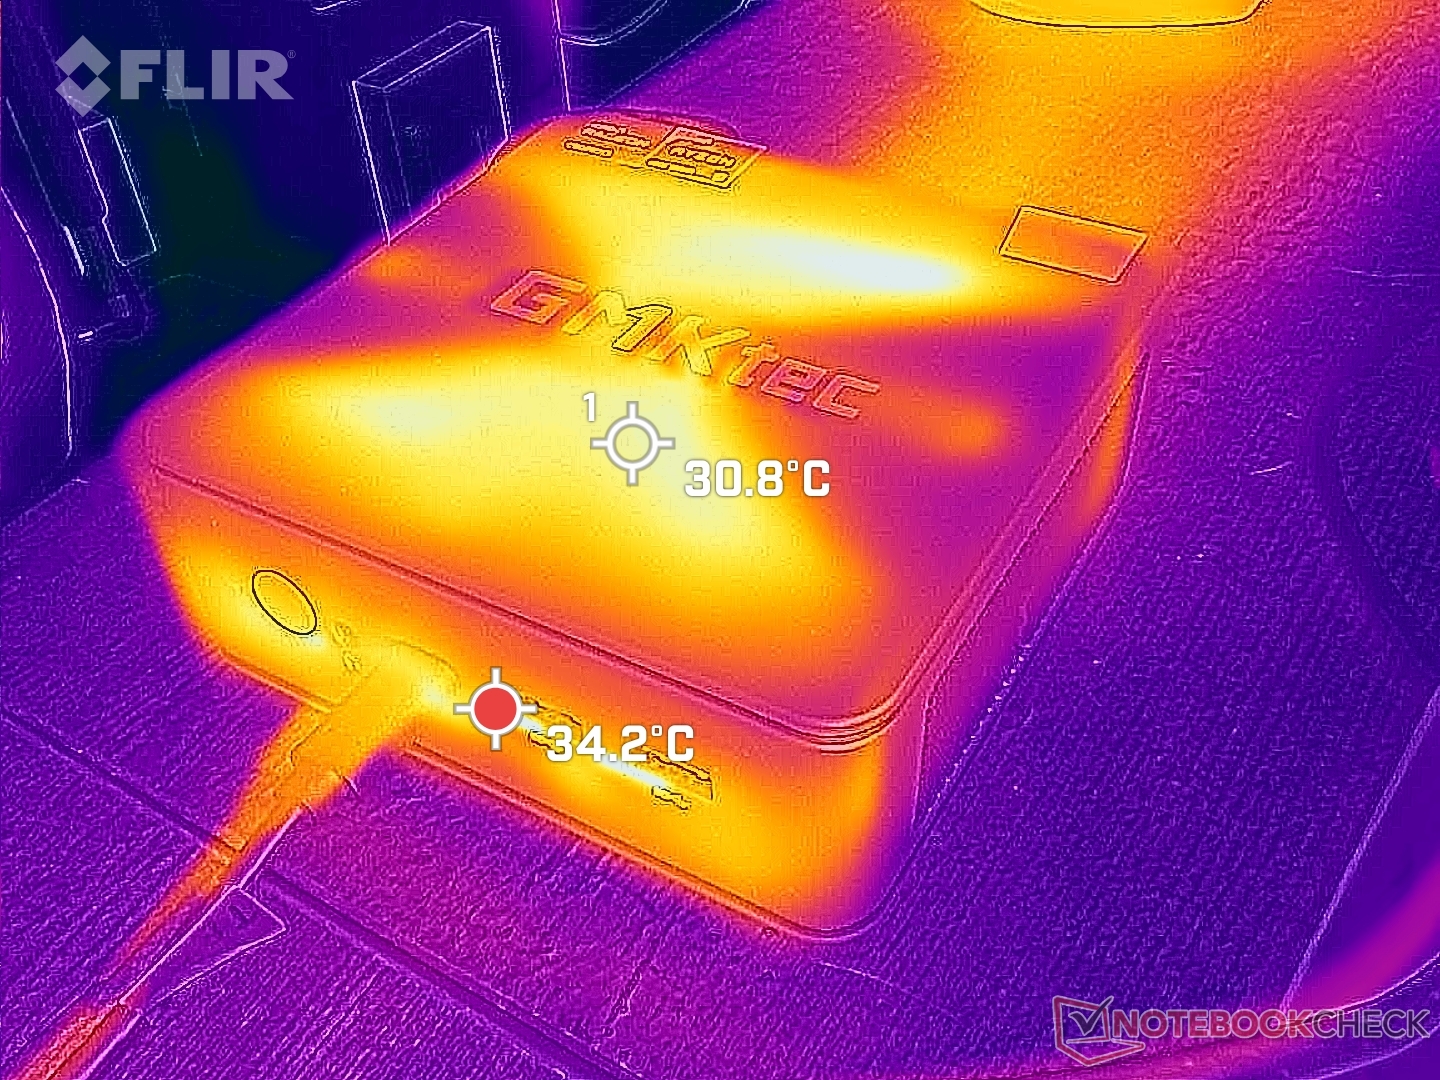
Le temperature di superficie non sono mai fastidiosamente calde. A differenza di alcuni modelli Beelink, NucBox M6 non ha griglie sulla superficie superiore, ma aspira l'aria fresca attraverso strette fessure lungo il perimetro. Il posizionamento dell'unità in verticale è sicuro, anche se alcune griglie di ventilazione saranno bloccate.
Gestione dell'energia - Prestazioni più elevate, consumi più elevati
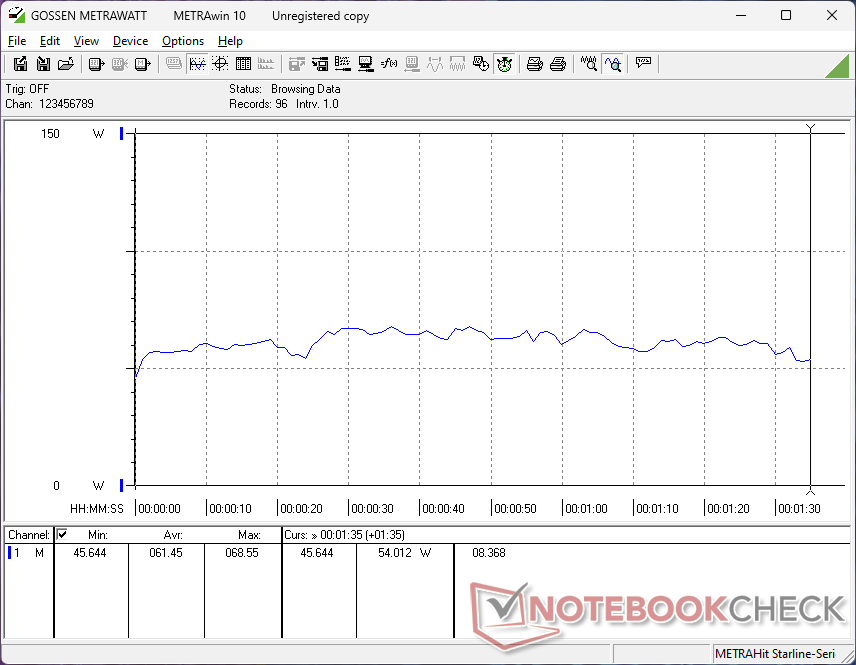
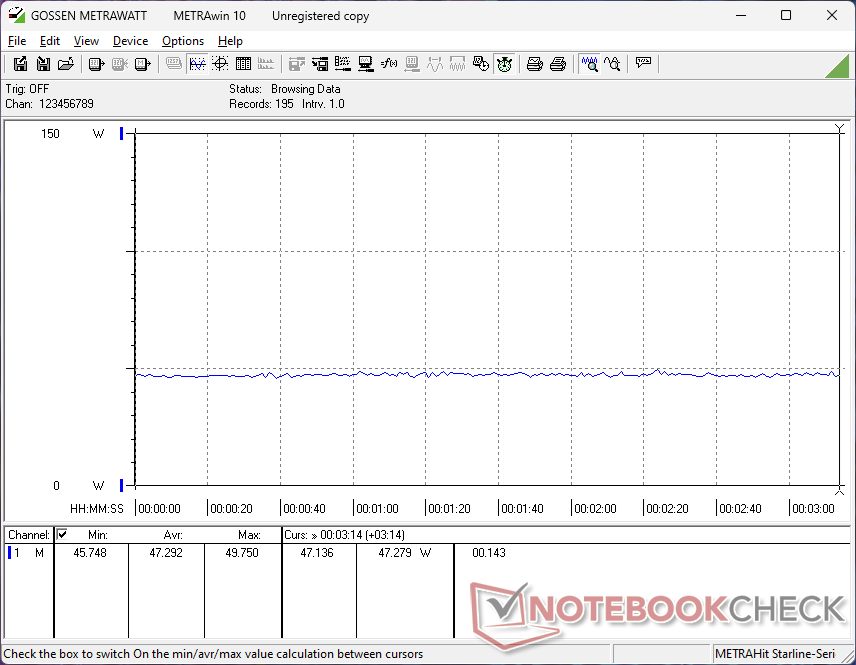
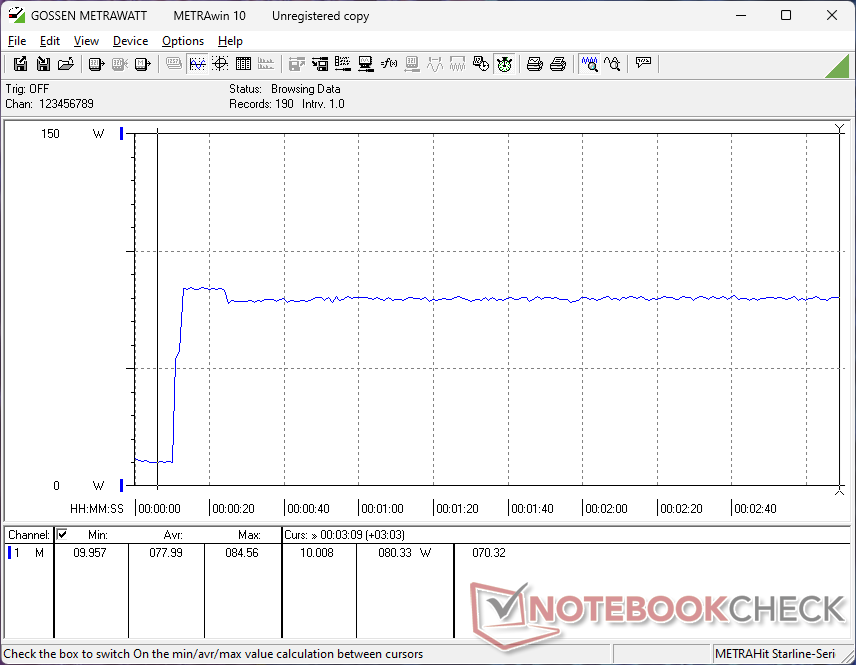
Consumo di energia
Il sistema è molto più esigente rispetto a NucBox M5, a causa del passaggio a una CPU di serie H. L'esecuzione Witcher 3, ad esempio, richiederebbe il 75% di energia in più, mentre Prime95 richiederebbe oltre 2,5 volte l'energia. Ryzen 5 6600H è certamente più veloce di Ryzen 7 5700U nella NucBox M5, ma le prestazioni per watt favoriscono ancora la M5 con ampi margini.
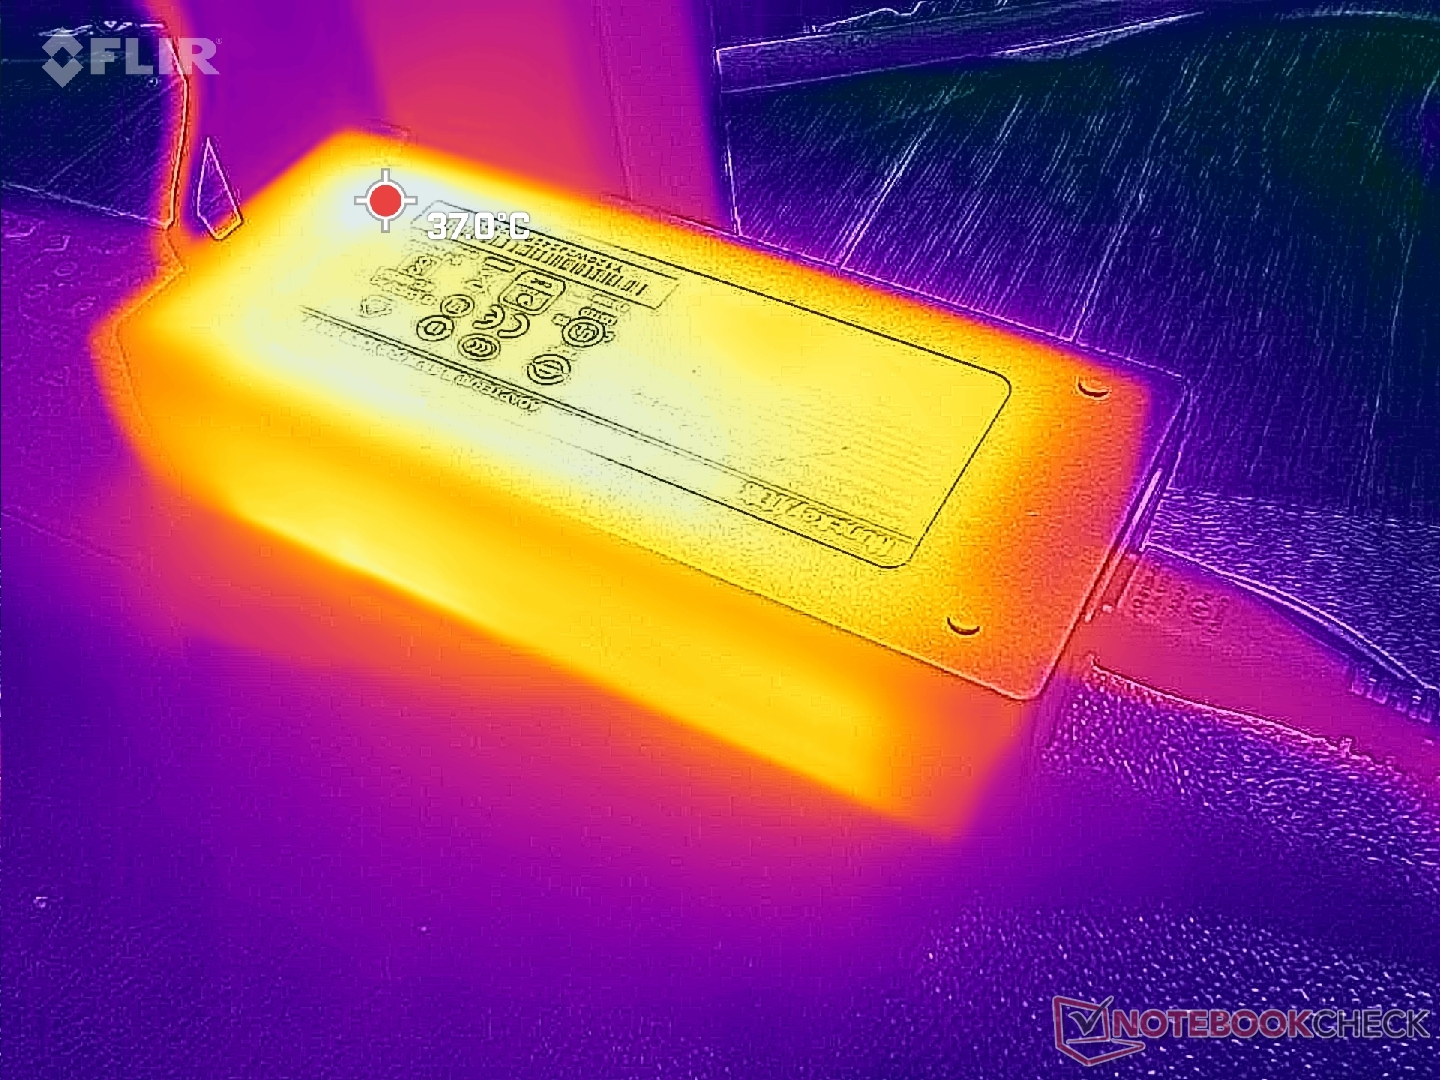
Siamo in grado di registrare un consumo massimo di 85 W dall'adattatore CA di medie dimensioni (~14,5 x 6,4 x 3,2 cm) da 120 W, quando la CPU è completamente sollecitata. Si noti che questo adattatore è più grande dell'adattatore CA da 65 W fornito con NucBox M5, a causa del processore più esigente di NucBox M6.

| Off / Standby | |
| Idle | |
| Sotto carico |
|
Leggenda:
min: | |
| GMK NucBox M6 R5 6600H, Radeon 660M, AirDisk APF 10-512G, , x, | GMK NucBox M5 R7 5700U, Vega 8, Lexar 1024GB LNM6A1X001T-HNNNG, , x, | GMK NucBox K6 R7 7840HS, Radeon 780M, MasonSemi 1TB MC7000, , x, | BOSGAME M1 R7 7840HS, Radeon 780M, , , x, | Beelink SER5 R5 5560U, Vega 6, Crucial P3 Plus CT1000P3PSSD8, , x, | Intel NUC 13 Pro Kit NUC13ANK i7-1360P, Iris Xe G7 96EUs, Samsung PM9A1 MZVL2512HCJQ, , x, | |
|---|---|---|---|---|---|---|
| Power Consumption | 39% | -8% | -15% | 43% | 0% | |
| Idle Minimum * | 7.9 | 5.9 25% | 6.7 15% | 7.3 8% | 4.4 44% | 5.1 35% |
| Idle Average * | 8 | 6.2 22% | 7 12% | 7.3 9% | 5 37% | 5.8 27% |
| Idle Maximum * | 8.3 | 6.4 23% | 7.6 8% | 8.4 -1% | 5.3 36% | 10.2 -23% |
| Load Average * | 61.5 | 28.2 54% | 74.3 -21% | 72.7 -18% | 29.8 52% | 68.1 -11% |
| Witcher 3 ultra * | 47.3 | 27.5 42% | 75 -59% | 80.5 -70% | 28.8 39% | |
| Load Maximum * | 84.6 | 29.5 65% | 85.7 -1% | 99.1 -17% | 40.4 52% | 108.3 -28% |
* ... Meglio usare valori piccoli
Power Consumption Witcher 3 / Stresstest
Power Consumption external Monitor
Pro
Contro
Verdetto - Grande valore per il prezzo e le dimensioni
Proprio come il resto della linea, NucBox M6 è un'ottima scelta per quanto riguarda le prestazioni al prezzo di un dollaro. Il Ryzen 5 6600H fa il giro di tutti i Core i3 o Celeron che si trovano comunemente nella fascia di prezzo inferiore ai 300 dollari. Gli utenti di HTPC che desiderano massimizzare le prestazioni senza spendere troppo vorranno prendere in considerazione NucBox M5.
Il NucBox M6 di GMKtec punta al valore senza accontentarsi delle CPU serie U più lente delle famiglie Core i3 o Celeron. Il rumore della ventola, tuttavia, può essere un po' troppo forte per un mini PC.
Ci sono alcuni svantaggi, tra cui la mancanza di supporto USB4 e il rumore più forte della ventola associato alla CPU serie H più veloce. La compatibilità con il Wi-Fi 6E, pur essendo piacevole, può presentare problemi di prestazioni e lo stesso si può dire quando si riproducono contenuti video 4K a 60 FPS. Questi ultimi problemi, in particolare, possono mostrare una mancanza di cura per i piccoli dettagli del modello. Tuttavia, per il pubblico target di utenti domestici e per le attività di streaming HTPC di base, è più probabile che si noti il rumore della ventola che altro.
Prezzo e disponibilità
NucBox M6 è ora disponibile su direttamente dal produttore al prezzo di 230 dollari come kit completo o a 300 dollari con 16 GB di RAM, 512 GB di SSD e Windows 11 Pro. Il modello è disponibile anche su Amazon a prezzi di partenza più alti.
Informazioni: Abbiamo aggiornato il nostro sistema di valutazione e i risultati della versione 8 non sono confrontabili con i risultati della versione 7. Altre informazioni sono gerarchicamente verfügbar.
Nota: abbiamo recentemente aggiornato il nostro sistema di valutazione e i risultati della versione 8 non sono confrontabili con quelli della versione 7. Ulteriori informazioni sono disponibili qui .
GMK NucBox M6
- 07/04/2024 v8
Allen Ngo
 Total Sustainability Score:
 Transparency
La selezione dei dispositivi da recensire viene effettuata dalla nostra redazione. Il campione di prova è stato fornito all'autore come prestito dal produttore o dal rivenditore ai fini di questa recensione. L'istituto di credito non ha avuto alcuna influenza su questa recensione, né il produttore ne ha ricevuto una copia prima della pubblicazione. Non vi era alcun obbligo di pubblicare questa recensione. Non accettiamo mai compensi o pagamenti in cambio delle nostre recensioni. In quanto società mediatica indipendente, Notebookcheck non è soggetta all'autorità di produttori, rivenditori o editori.
Ecco come Notebookcheck esegue i test
Ogni anno, Notebookcheck esamina in modo indipendente centinaia di laptop e smartphone utilizzando procedure standardizzate per garantire che tutti i risultati siano comparabili. Da circa 20 anni sviluppiamo continuamente i nostri metodi di prova e nel frattempo stabiliamo gli standard di settore. Nei nostri laboratori di prova, tecnici ed editori esperti utilizzano apparecchiature di misurazione di alta qualità. Questi test comportano un processo di validazione in più fasi. Il nostro complesso sistema di valutazione si basa su centinaia di misurazioni e parametri di riferimento ben fondati, che mantengono l'obiettività.Price comparison

