

Recensione del computer portatile Alienware x16 R2: Un passo indietro rispetto al modello x16 R1

La serie ultrasottile Alienware x16 è stata lanciata alla fine dello scorso anno con il debutto di Alienware x16 R1. Per il 2024, la serie è stata rinnovata con il modello x16 R2. Il nuovo modello sostituisce le vecchie opzioni di processore Raptor Lake-H con opzioni Meteor Lake-H pronte per l'AI, mentre tutto il resto rimane essenzialmente uguale al design originale dell'x16 R1. Consigliamo quindi di consultare la nostra recensione della x16 R1 in quanto la maggior parte dei nostri commenti sono ancora validi per l'x16 R2, visivamente identico. Tutte le differenze degne di nota saranno annotate in questa recensione.
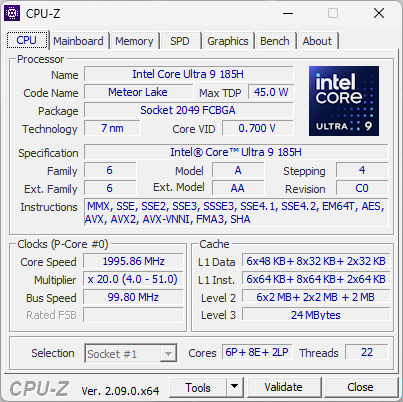
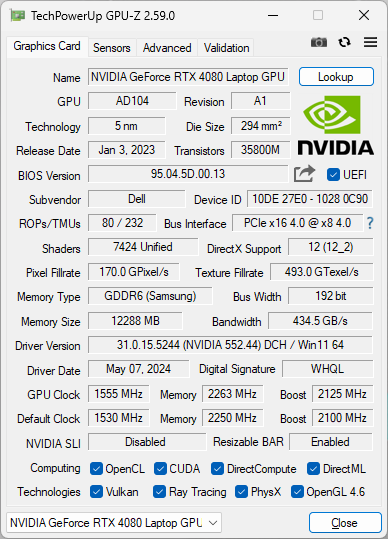
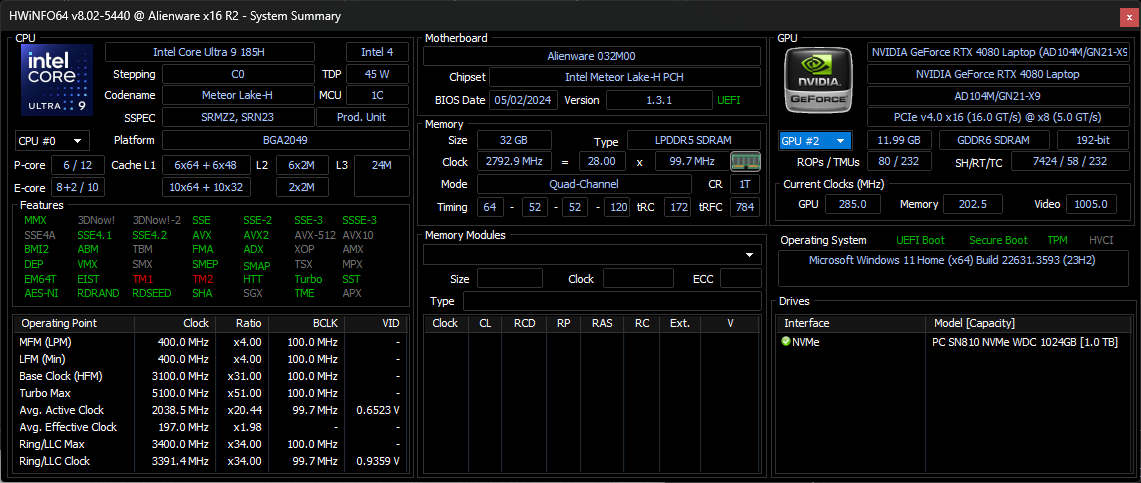
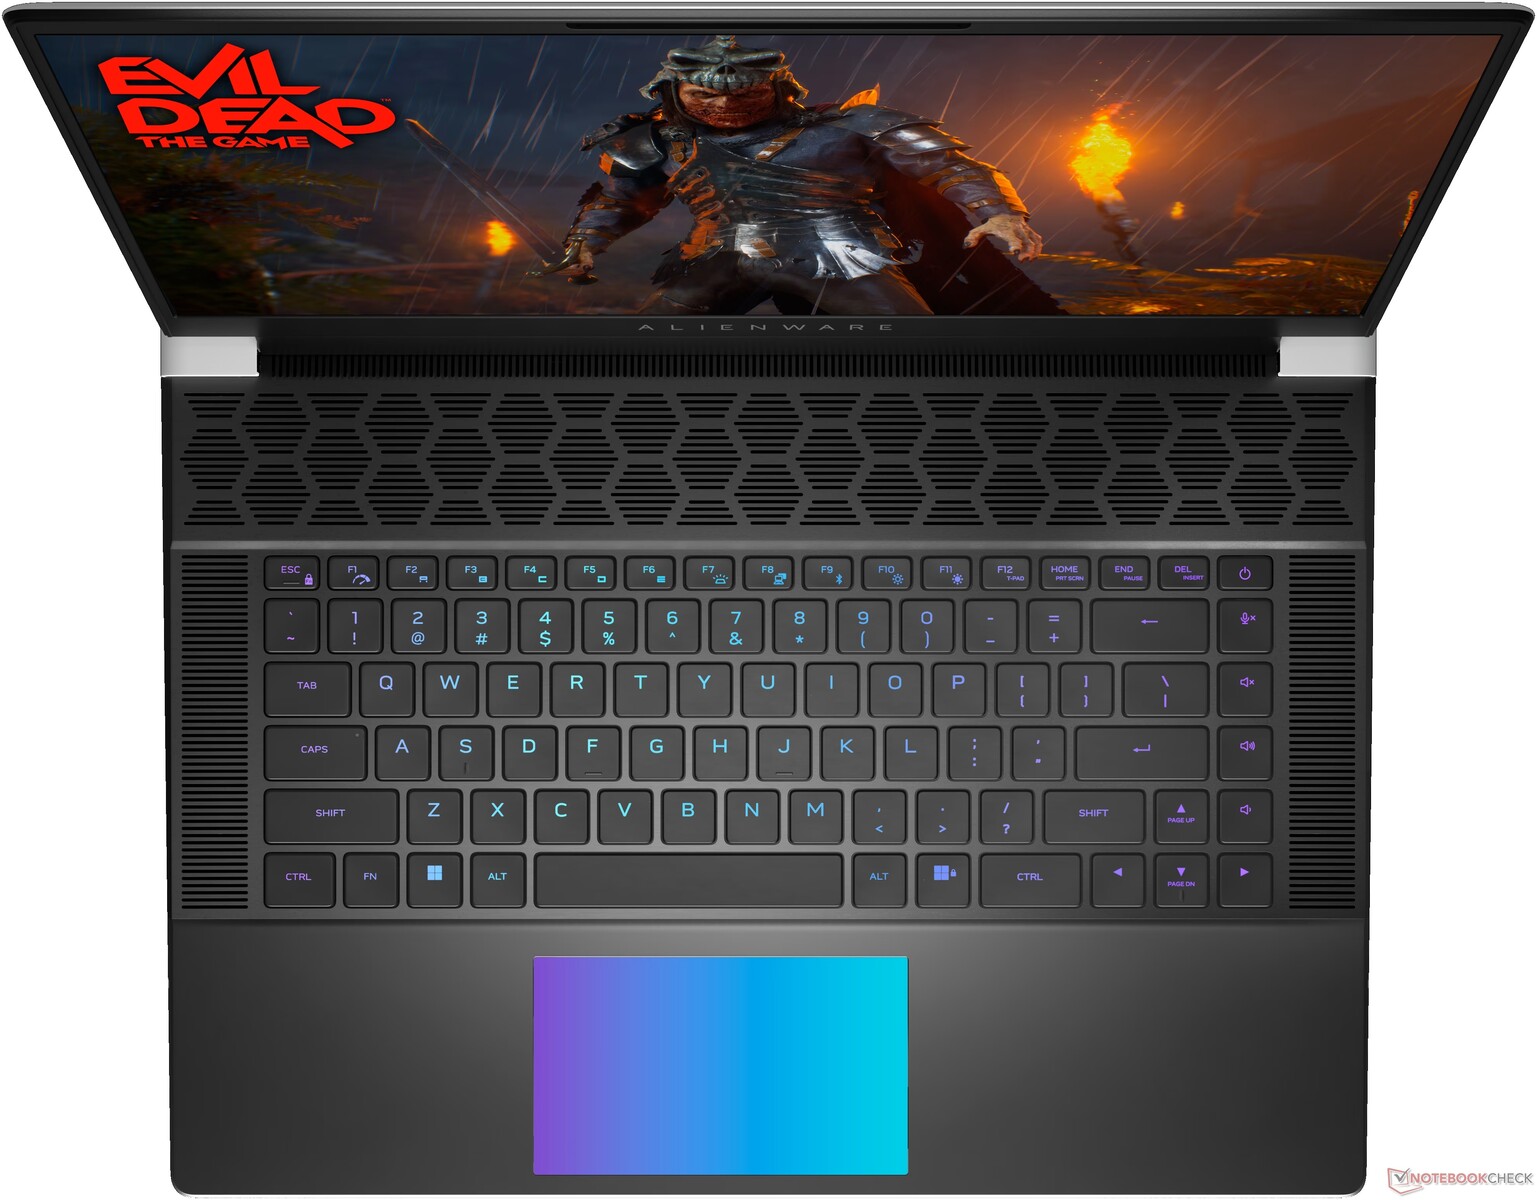
La nostra unità in recensione è una configurazione di fascia alta con CPU Core Ultra 9 185H, GPU GeForce RTX 4080 da 175 W, display 1600p 240 Hz e tasti meccanici CherryMX a bassissimo profilo per circa 3.200 dollari. Altre SKU includono i normali tasti a membrana e il Core Ultra 7 155H con grafica GeForce RTX 4060, 4070 o 4090 e display IPS da 1200p 480 Hz.
Le alternative all'Alienware x16 R2 includono altri computer portatili da gioco di fascia alta da 16 pollici come il Razer Blade 16,Asus ROG Strix Scar 16,Lenovo Legion Pro 7 16o MSI Vector 16 HX.
Altre recensioni di Dell:
Potenziali concorrenti a confrontos
Punteggio | Data | Modello | Peso | Altezza | Dimensione | Risoluzione | Prezzo |
|---|---|---|---|---|---|---|---|
| 88.4 % v7 (old) | 05/2024 | Alienware x16 R2 P120F Ultra 9 185H, NVIDIA GeForce RTX 4080 Laptop GPU | 2.7 kg | 18.57 mm | 16.00" | 2560x1600 | |
| 88.4 % v7 (old) | 06/2023 | Alienware x16 R1 i9-13900HK, NVIDIA GeForce RTX 4080 Laptop GPU | 2.6 kg | 18.57 mm | 16.00" | 2560x1600 | |
| 90.2 % v7 (old) | 03/2024 | Alienware m16 R2 Ultra 7 155H, NVIDIA GeForce RTX 4070 Laptop GPU | 2.5 kg | 23.5 mm | 16.00" | 2560x1600 | |
| 87.6 % v7 (old) | 04/2024 | Asus ROG Strix Scar 16 G634JZR i9-14900HX, NVIDIA GeForce RTX 4080 Laptop GPU | 2.7 kg | 30.4 mm | 16.00" | 2560x1600 | |
| 89.5 % v7 (old) | 03/2024 | Lenovo Legion Pro 7 16IRX9H i9-14900HX, NVIDIA GeForce RTX 4080 Laptop GPU | 2.7 kg | 21.95 mm | 16.00" | 2560x1600 | |
| 88 % v7 (old) | 02/2024 | MSI Vector 16 HX A14V i9-14900HX, NVIDIA GeForce RTX 4080 Laptop GPU | 2.7 kg | 28.55 mm | 16.00" | 2560x1600 |
Caso - Nessuna modifica esterna

Connettività


Lettore di schede SD
È interessante notare che il lettore MicroSD sul nostro x16 R2 non presenta nessuno dei problemi di velocità di trasferimento che abbiamo riscontrato sul x16 R1 dello scorso anno.
| SD Card Reader | |
| average JPG Copy Test (av. of 3 runs) | |
| Alienware x16 R2 P120F (AV PRO microSD 128 GB V60) | |
| MSI Vector 16 HX A14V (Toshiba Exceria Pro SDXC 64 GB UHS-II) | |
| Alienware m16 R2 (AV PRO microSD 128 GB V60) | |
| Alienware x16 R1 (AV PRO microSD 128 GB V60) | |
| maximum AS SSD Seq Read Test (1GB) | |
| Alienware x16 R2 P120F (AV PRO microSD 128 GB V60) | |
| Alienware x16 R1 (AV PRO microSD 128 GB V60) | |
| Alienware m16 R2 (AV PRO microSD 128 GB V60) | |
| MSI Vector 16 HX A14V (Toshiba Exceria Pro SDXC 64 GB UHS-II) | |
Comunicazione
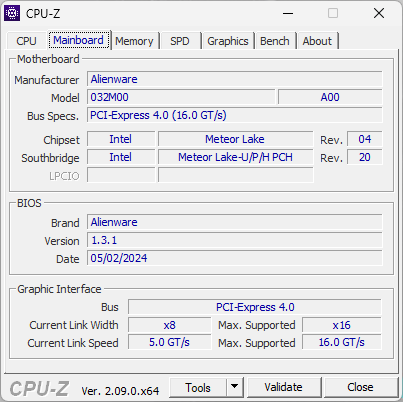
Per il refresh di quest'anno, Dell ha aggiornato il modulo WLAN per supportare il Wi-Fi 7.
Webcam


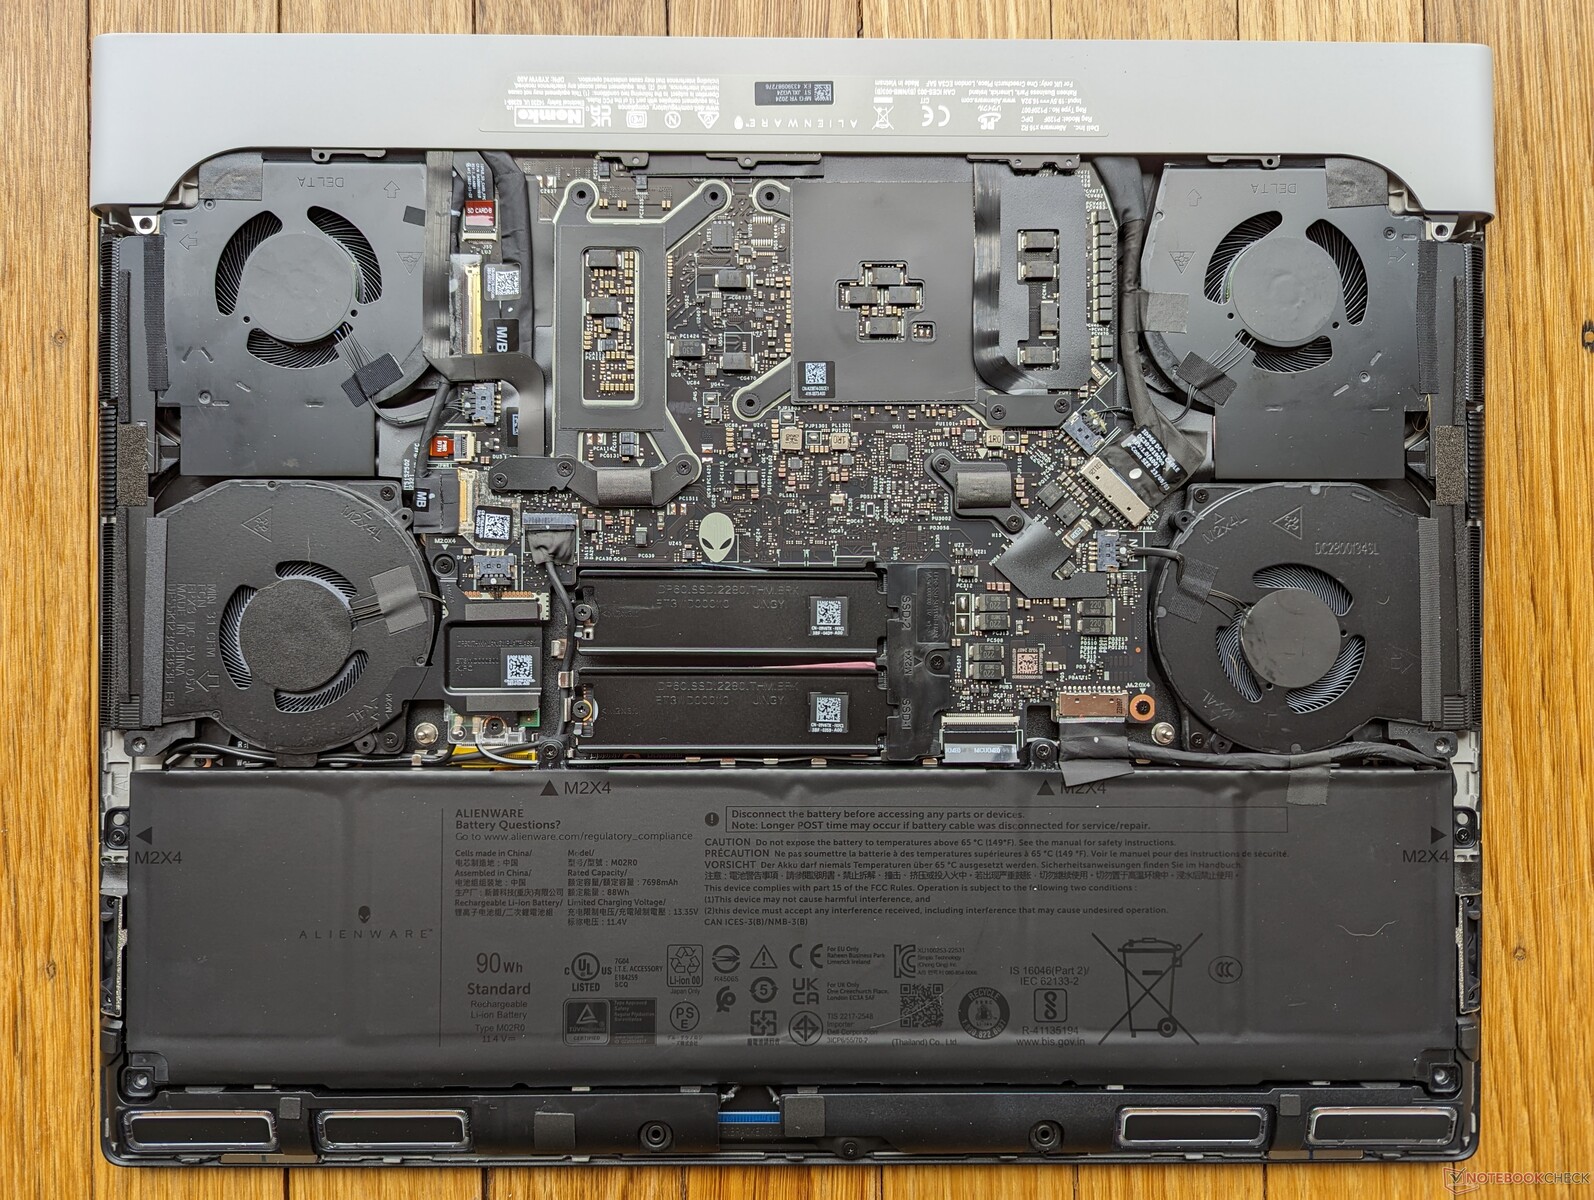
Manutenzione

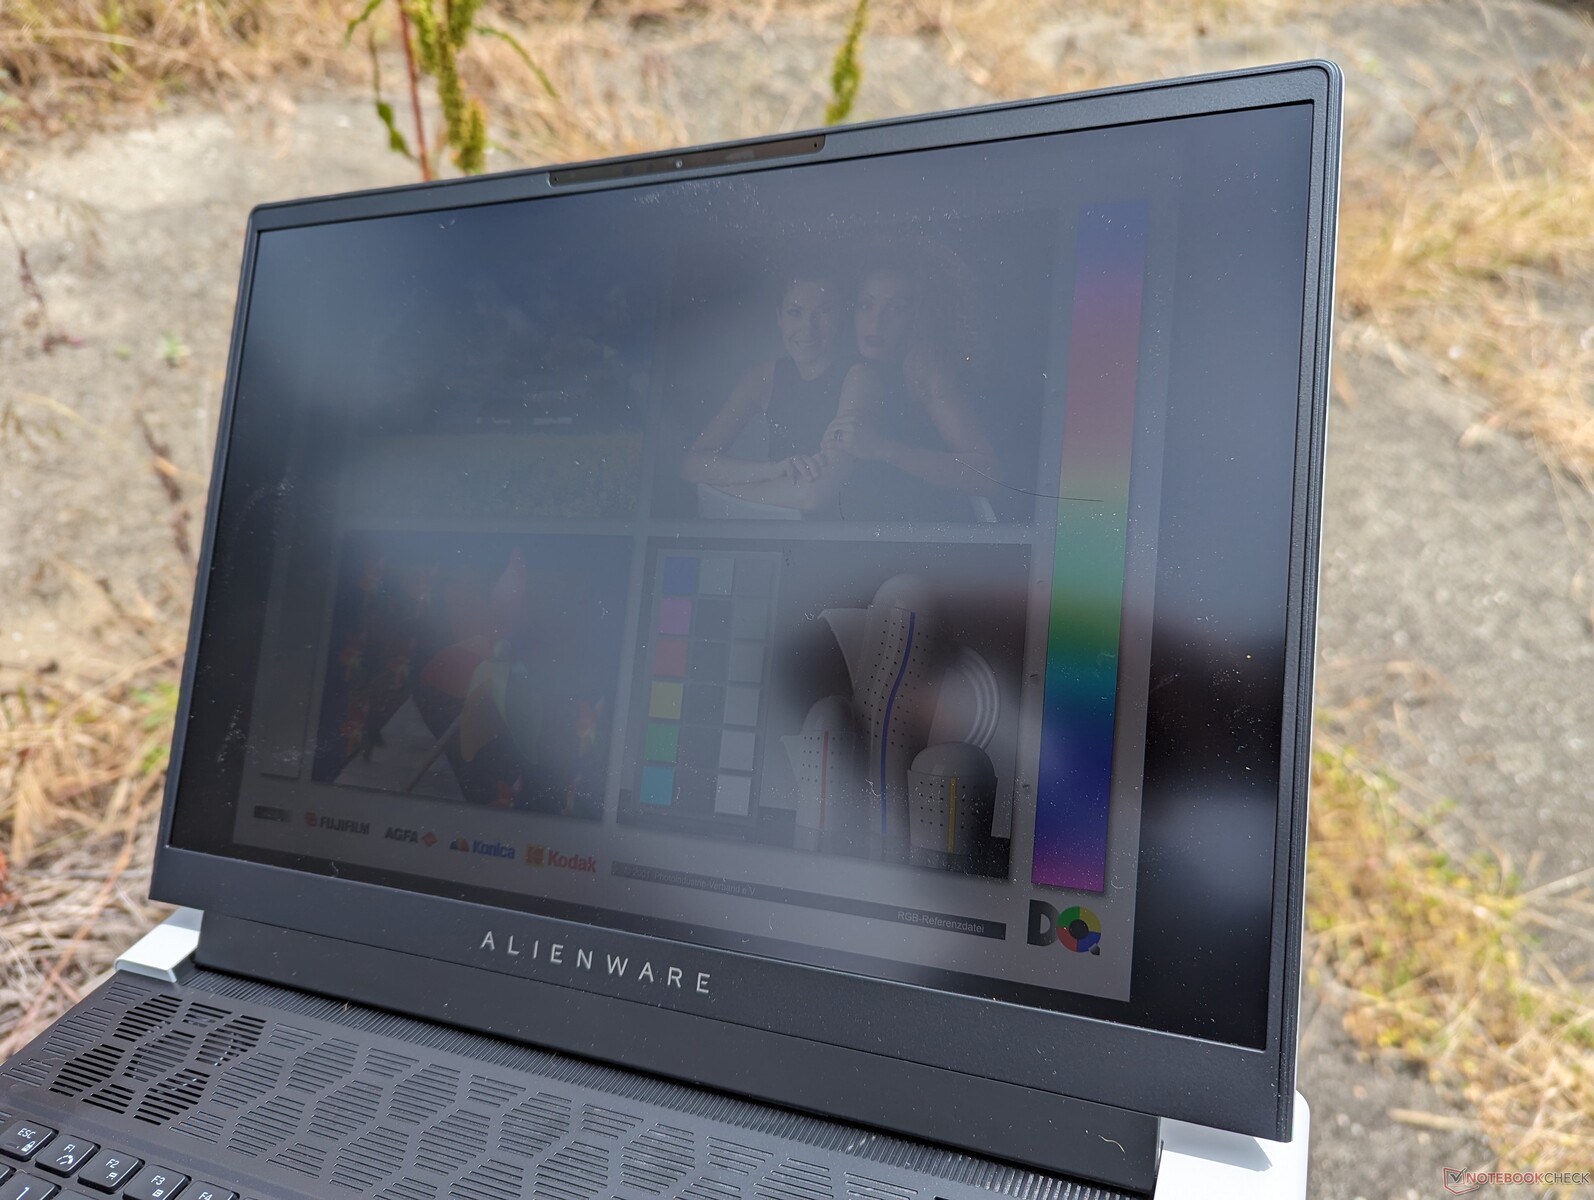
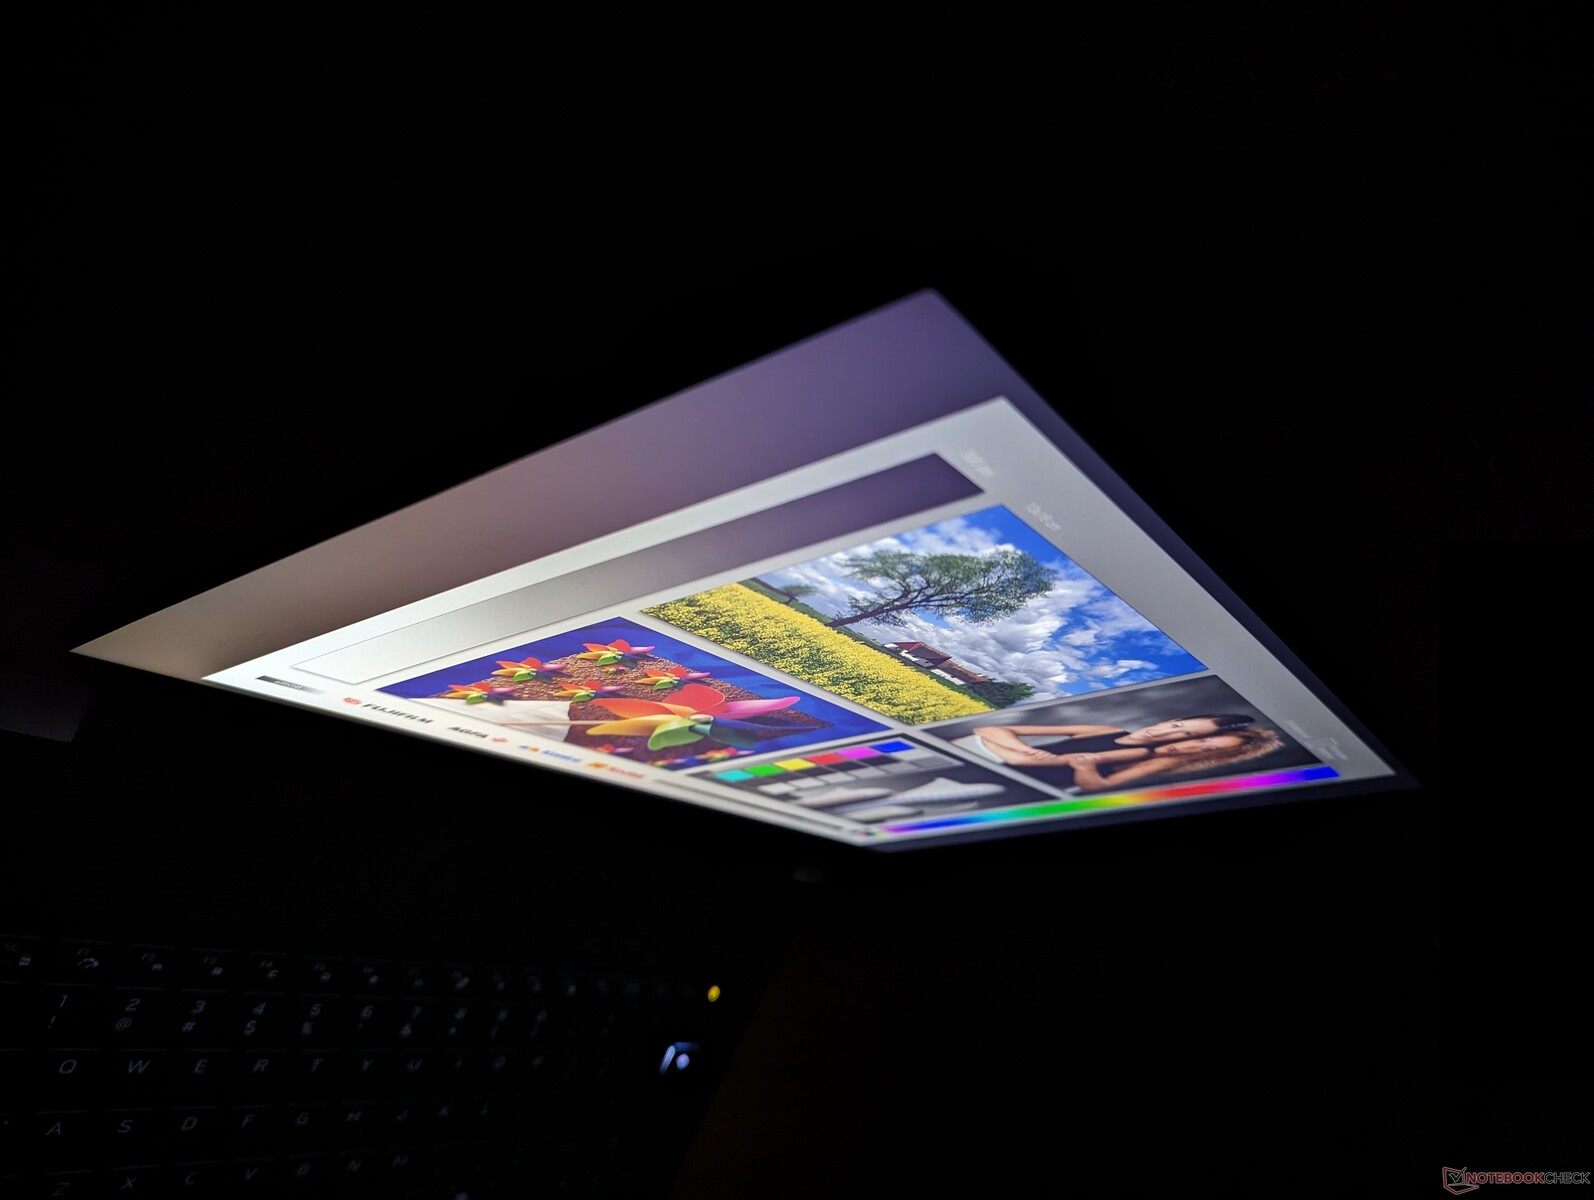
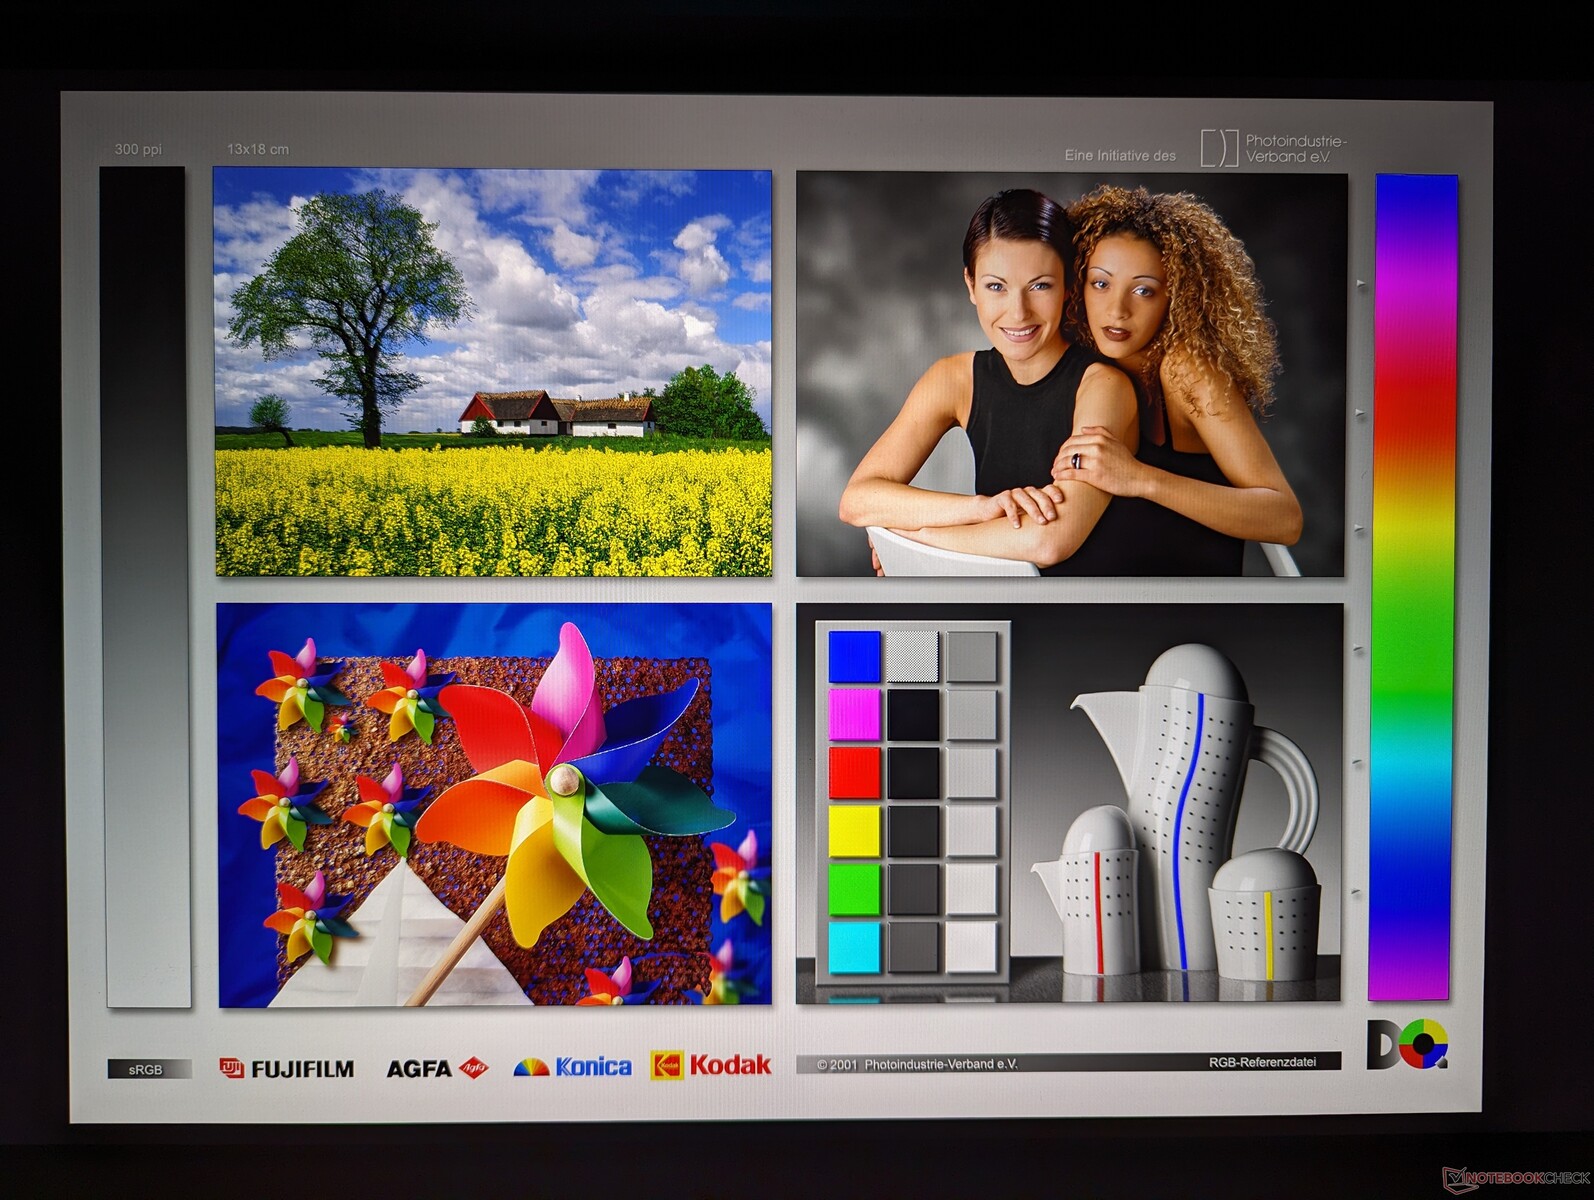
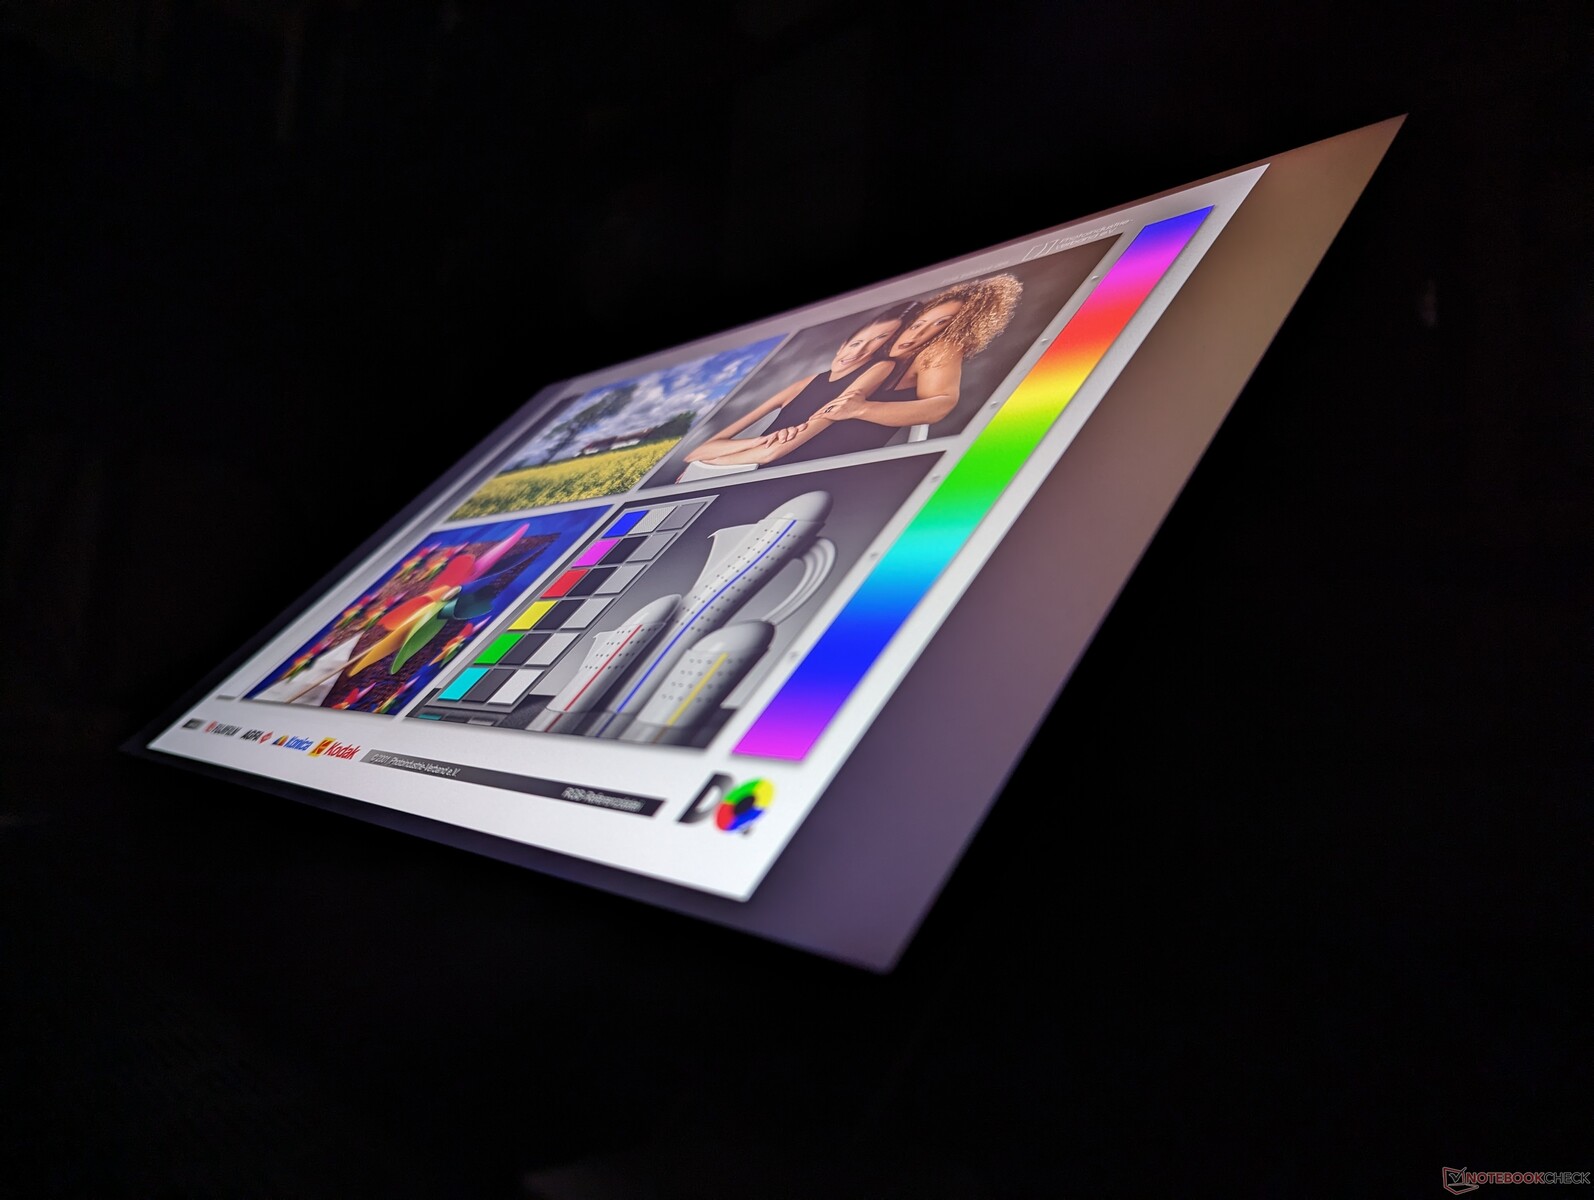
Display - Niente più opzione 165 Hz
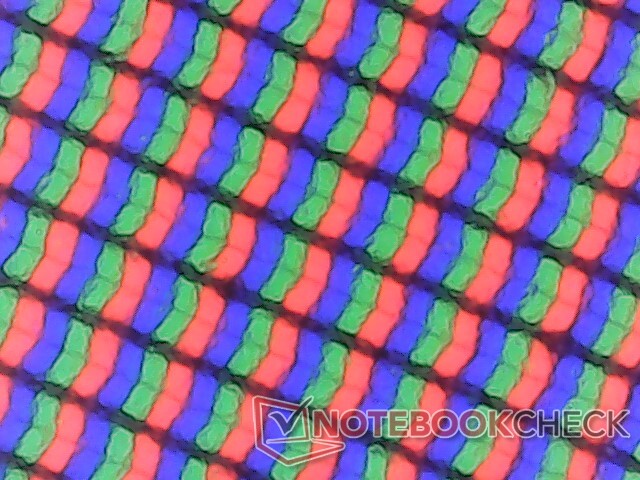
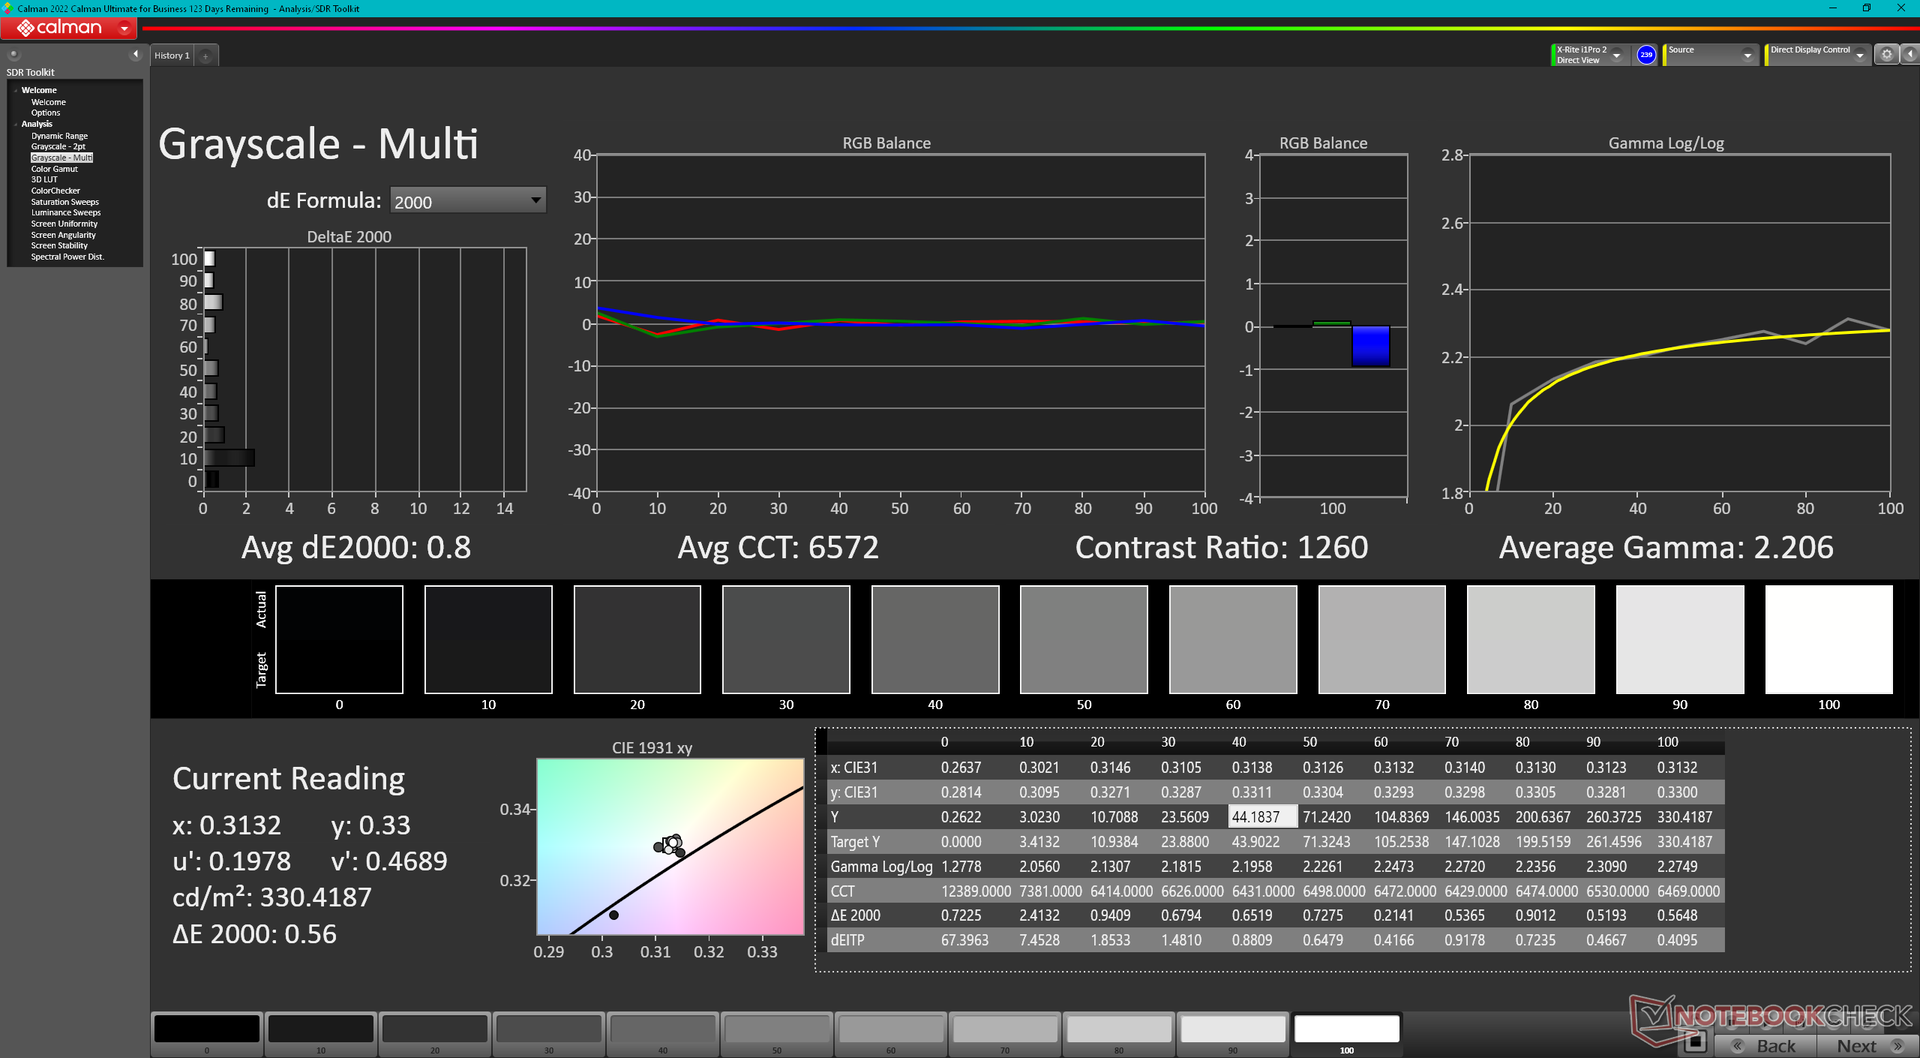
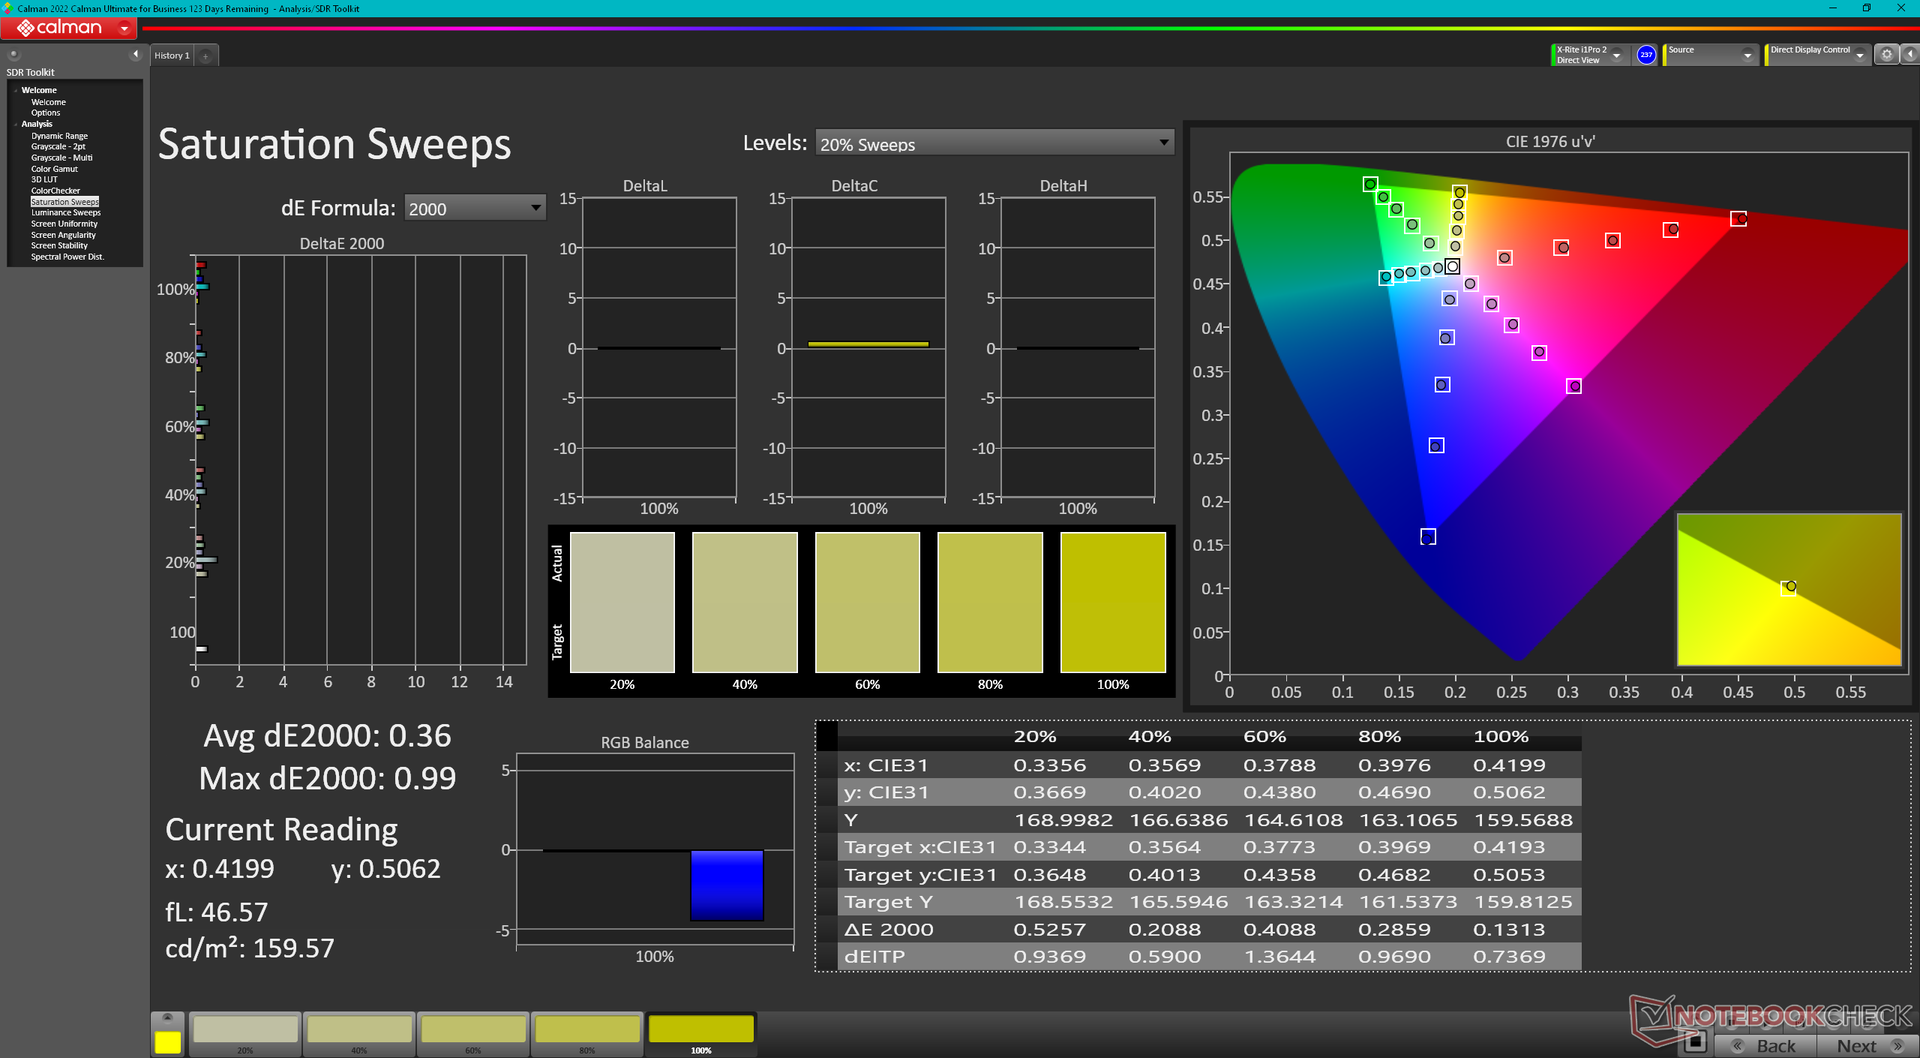
Dell ha sostituito il pannello BOE NE16NZ4 del modello x16 R1 dello scorso anno con il BOE B160QAN del modello x16 R2 di quest'anno. Tuttavia, i due pannelli sono quasi identici in termini di riproduzione dei colori, tempi di risposta, livelli di luminosità e contrasto, per un'esperienza visiva sostanzialmente identica.
La frequenza di aggiornamento nativa può essere impostata su 240 Hz o 60 Hz, senza opzioni variabili. G-Sync è supportato solo se impostato sulla modalità dGPU e non sulla modalità Optimus.
Gli utenti possono configurare due display come mostrato di seguito, mentre il modello x16 R1 ne aveva tre:
- 2560 x 1600, 240 Hz, 100% DCI-P3, G-Sync, Optimus avanzato
- 1920 x 1200, 480 Hz, 100% DCI-P3, G-Sync, Advanced Optimus
| |||||||||||||||||||||||||
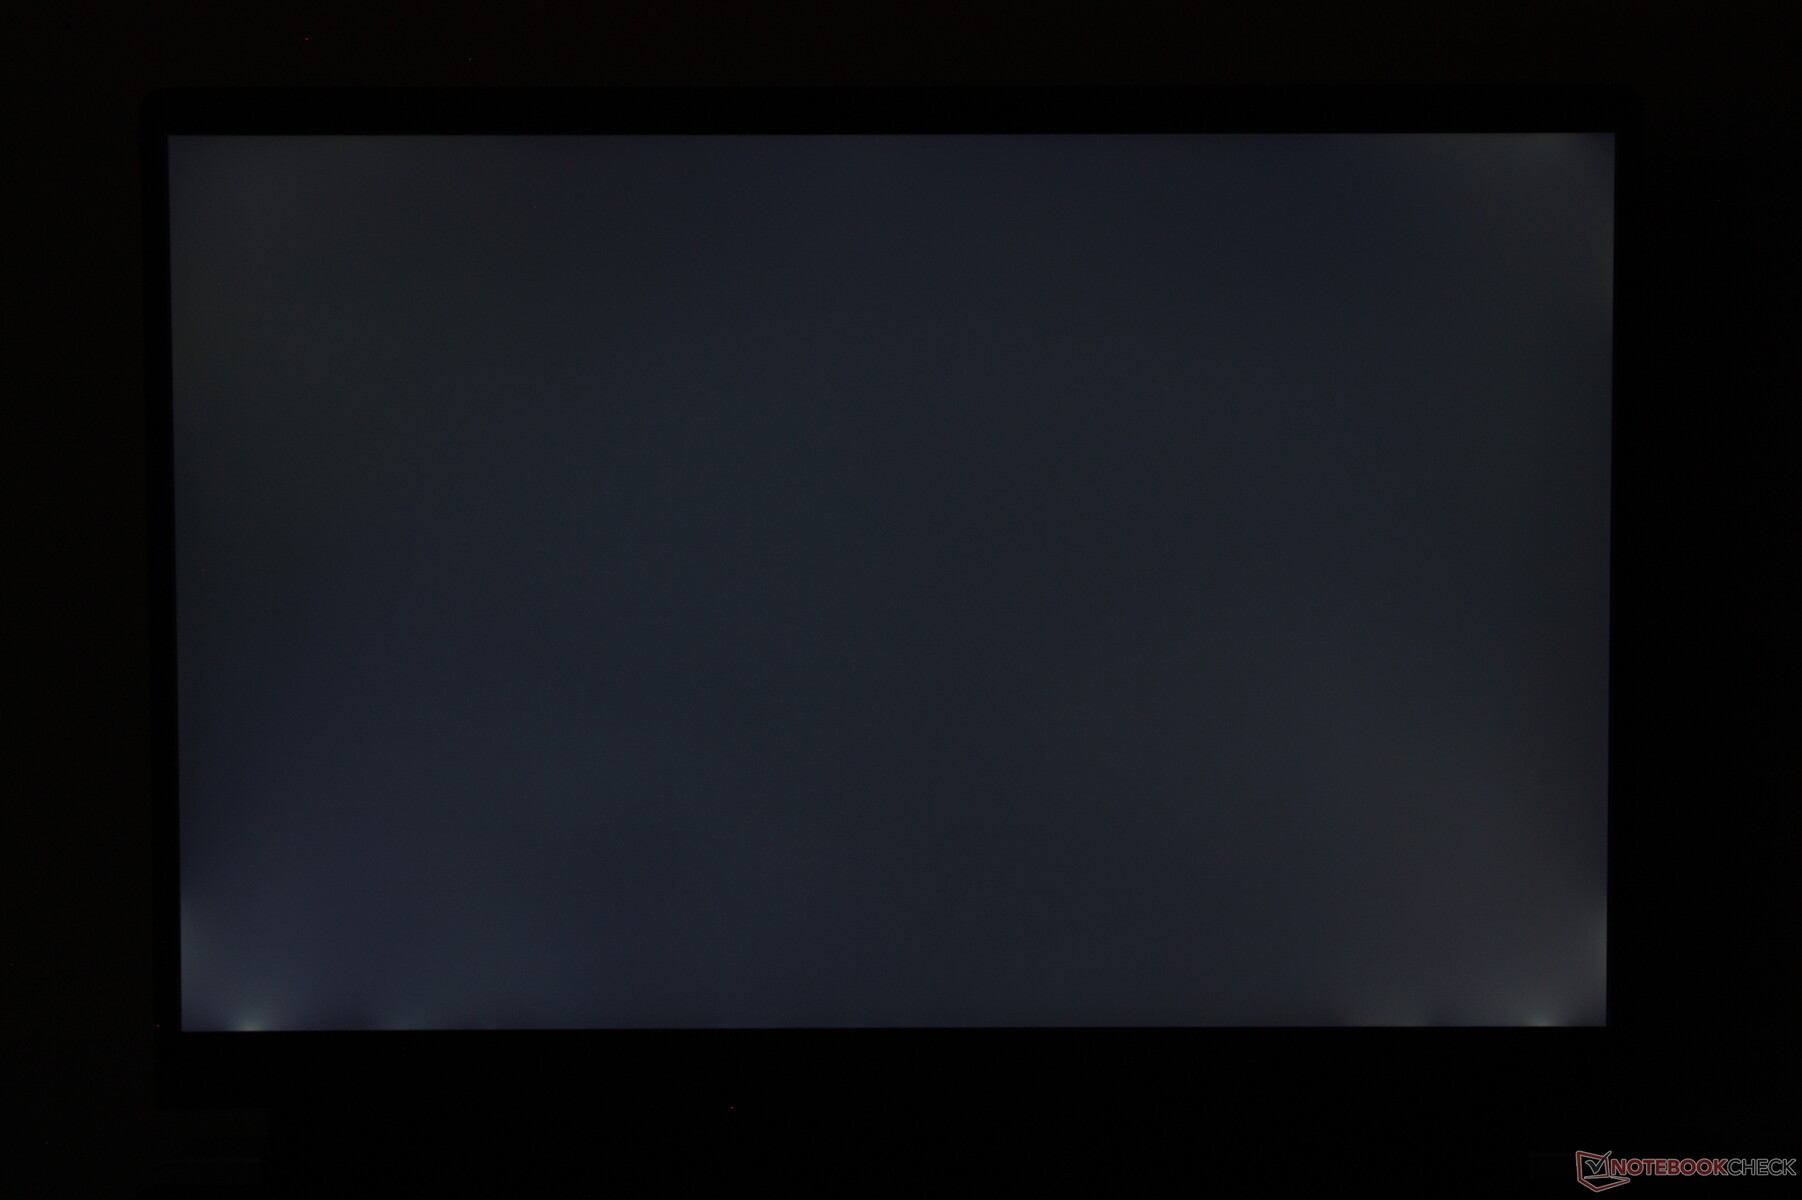
Distribuzione della luminosità: 90 %
Al centro con la batteria: 348.4 cd/m²
Contrasto: 1056:1 (Nero: 0.33 cd/m²)
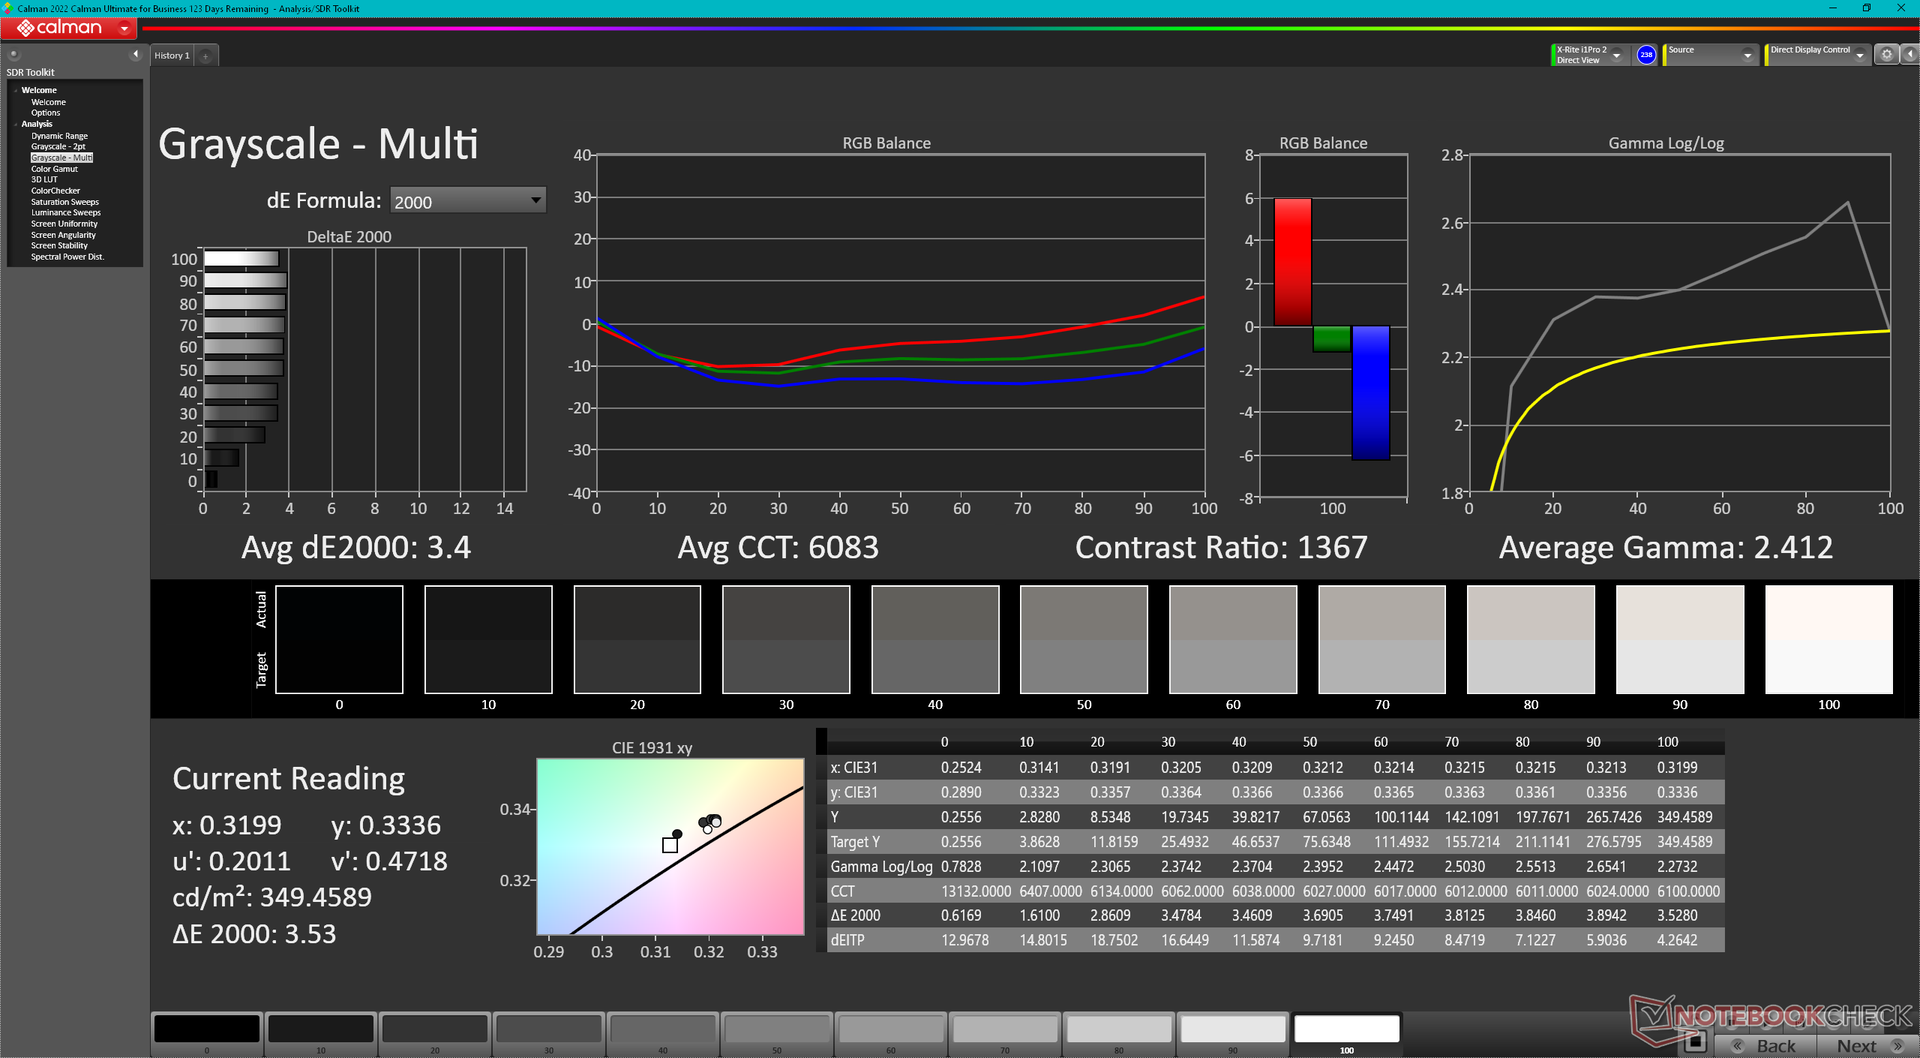
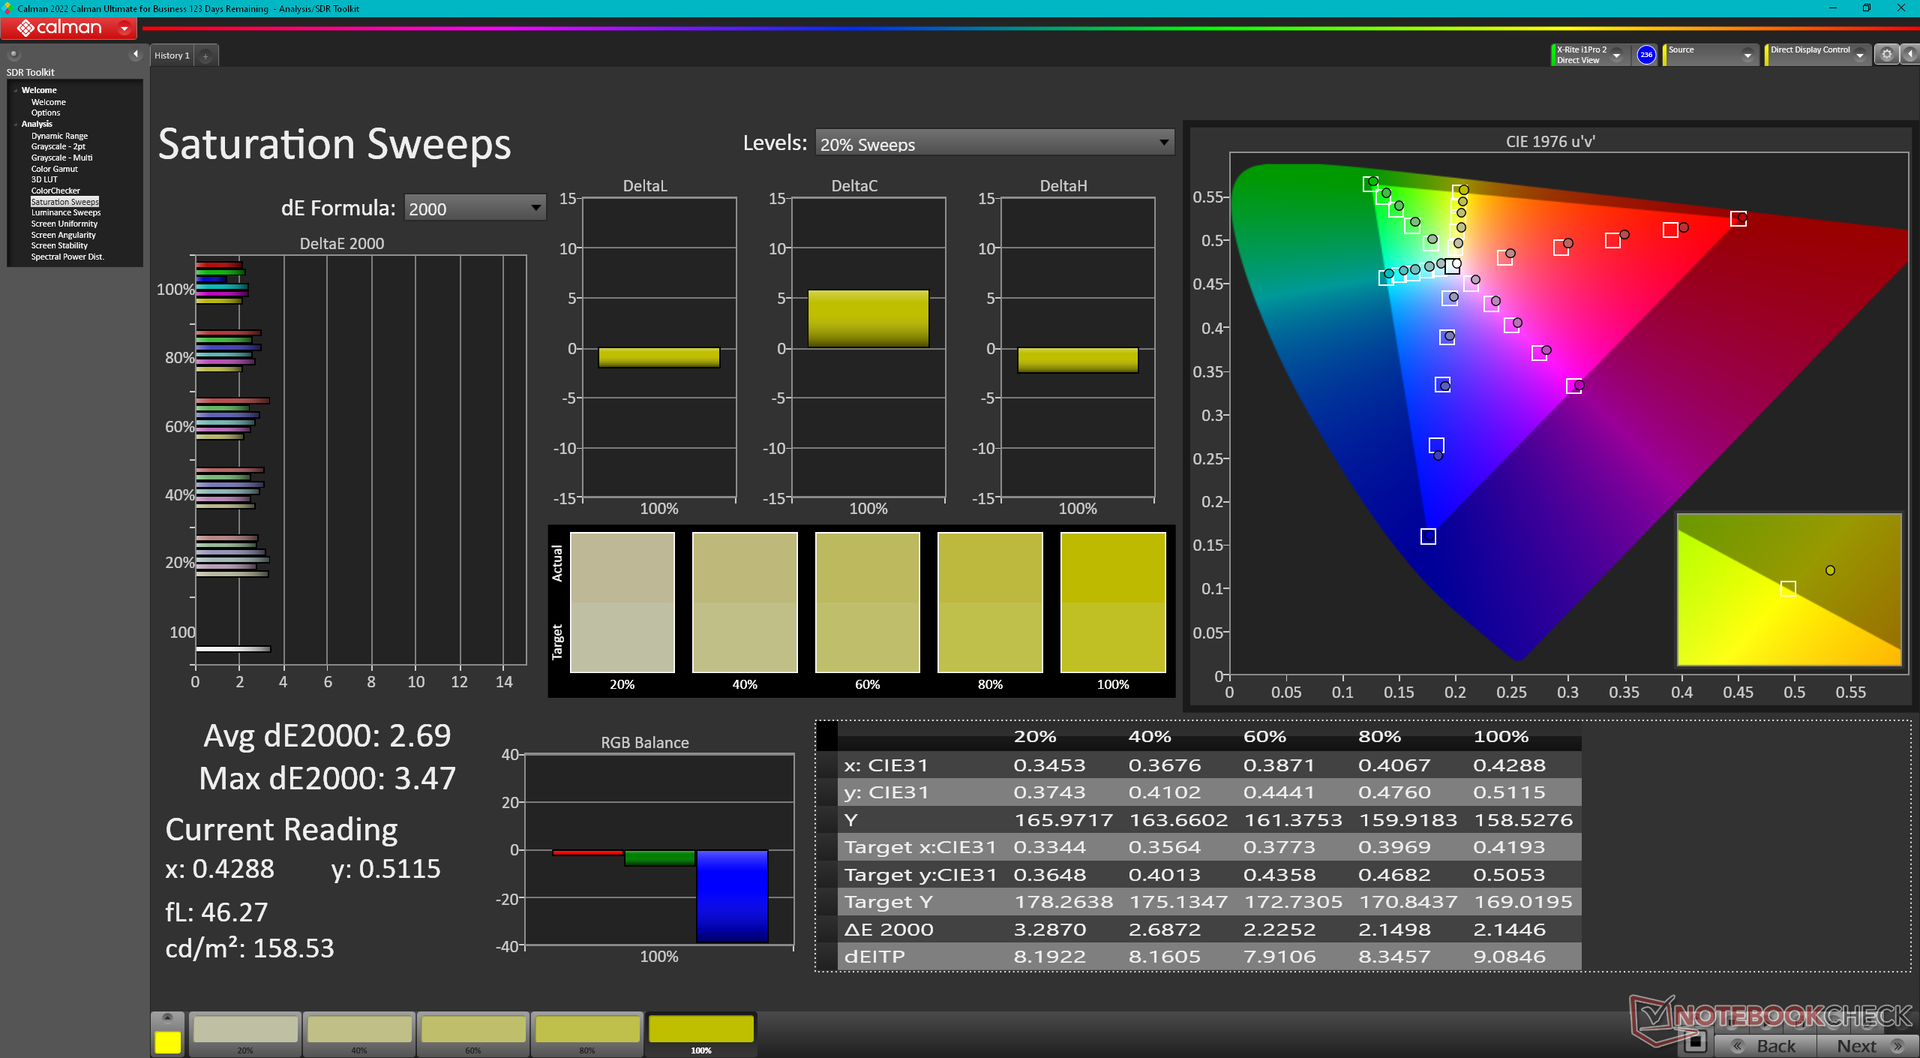
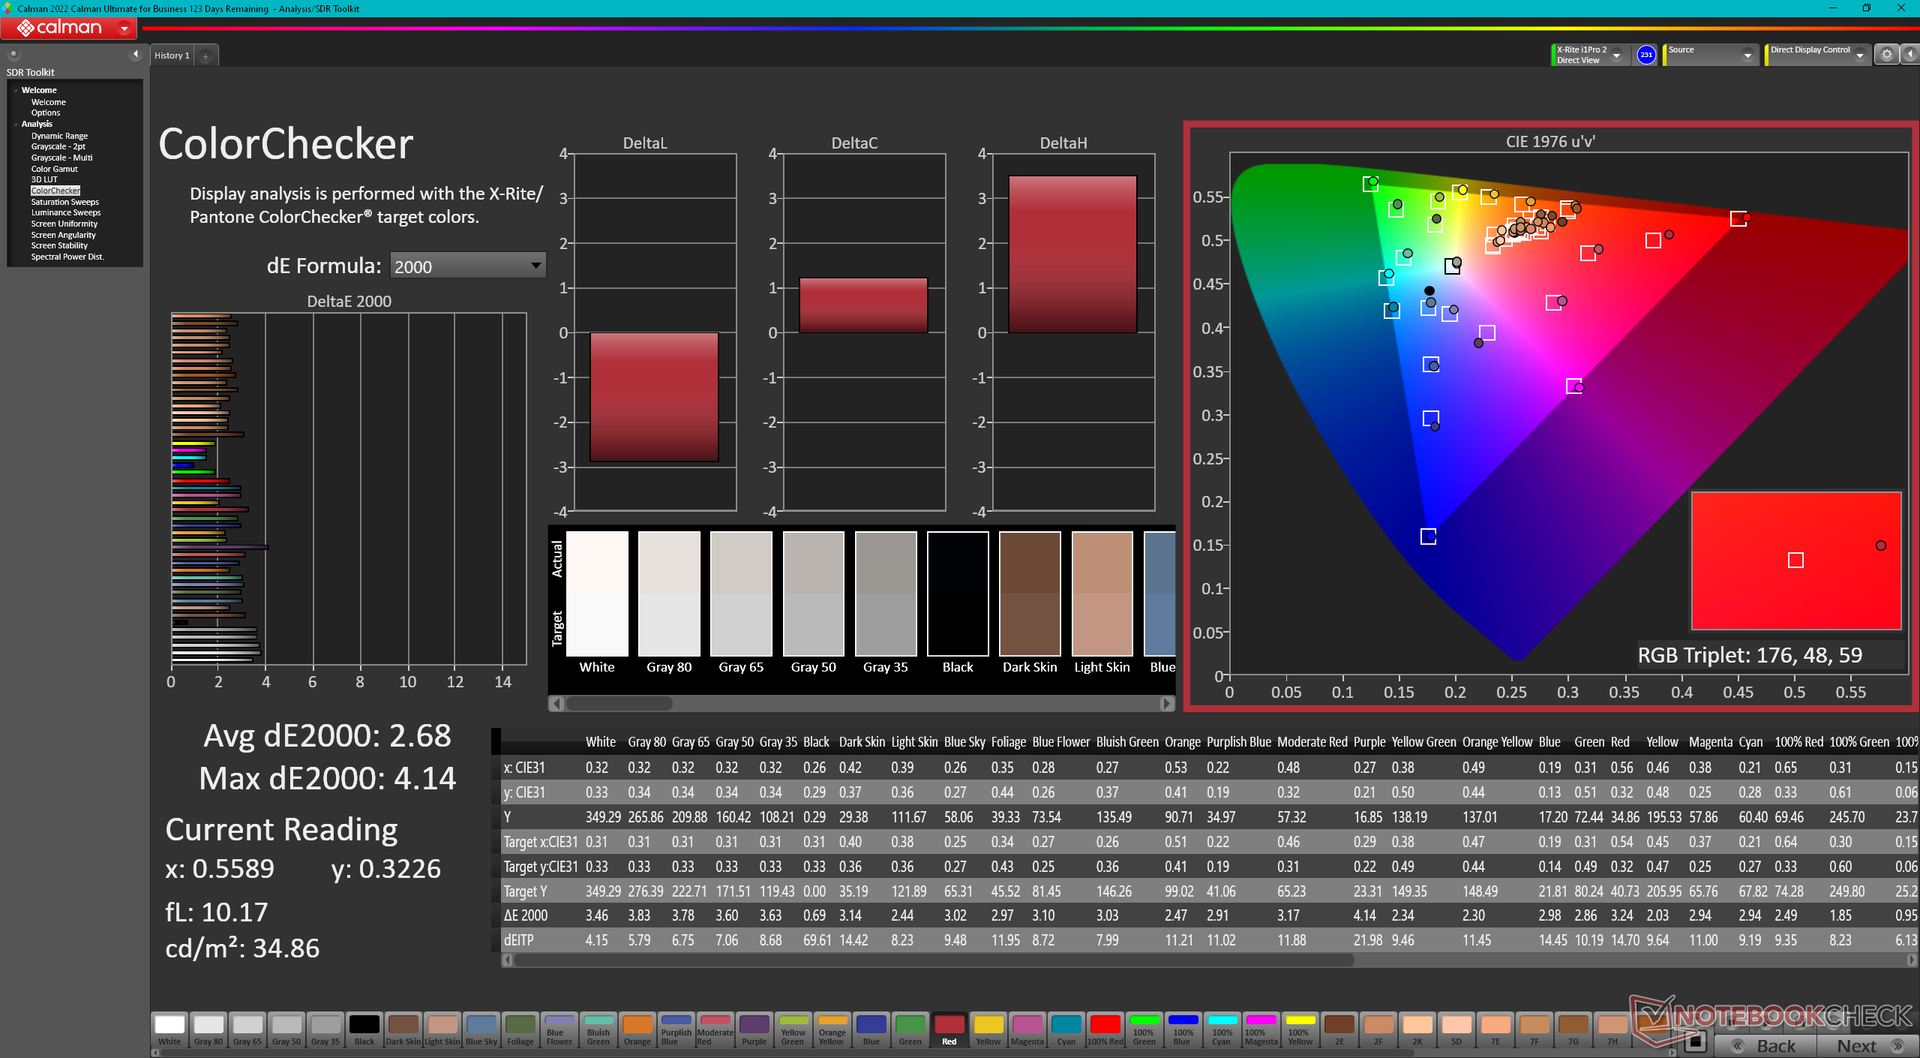
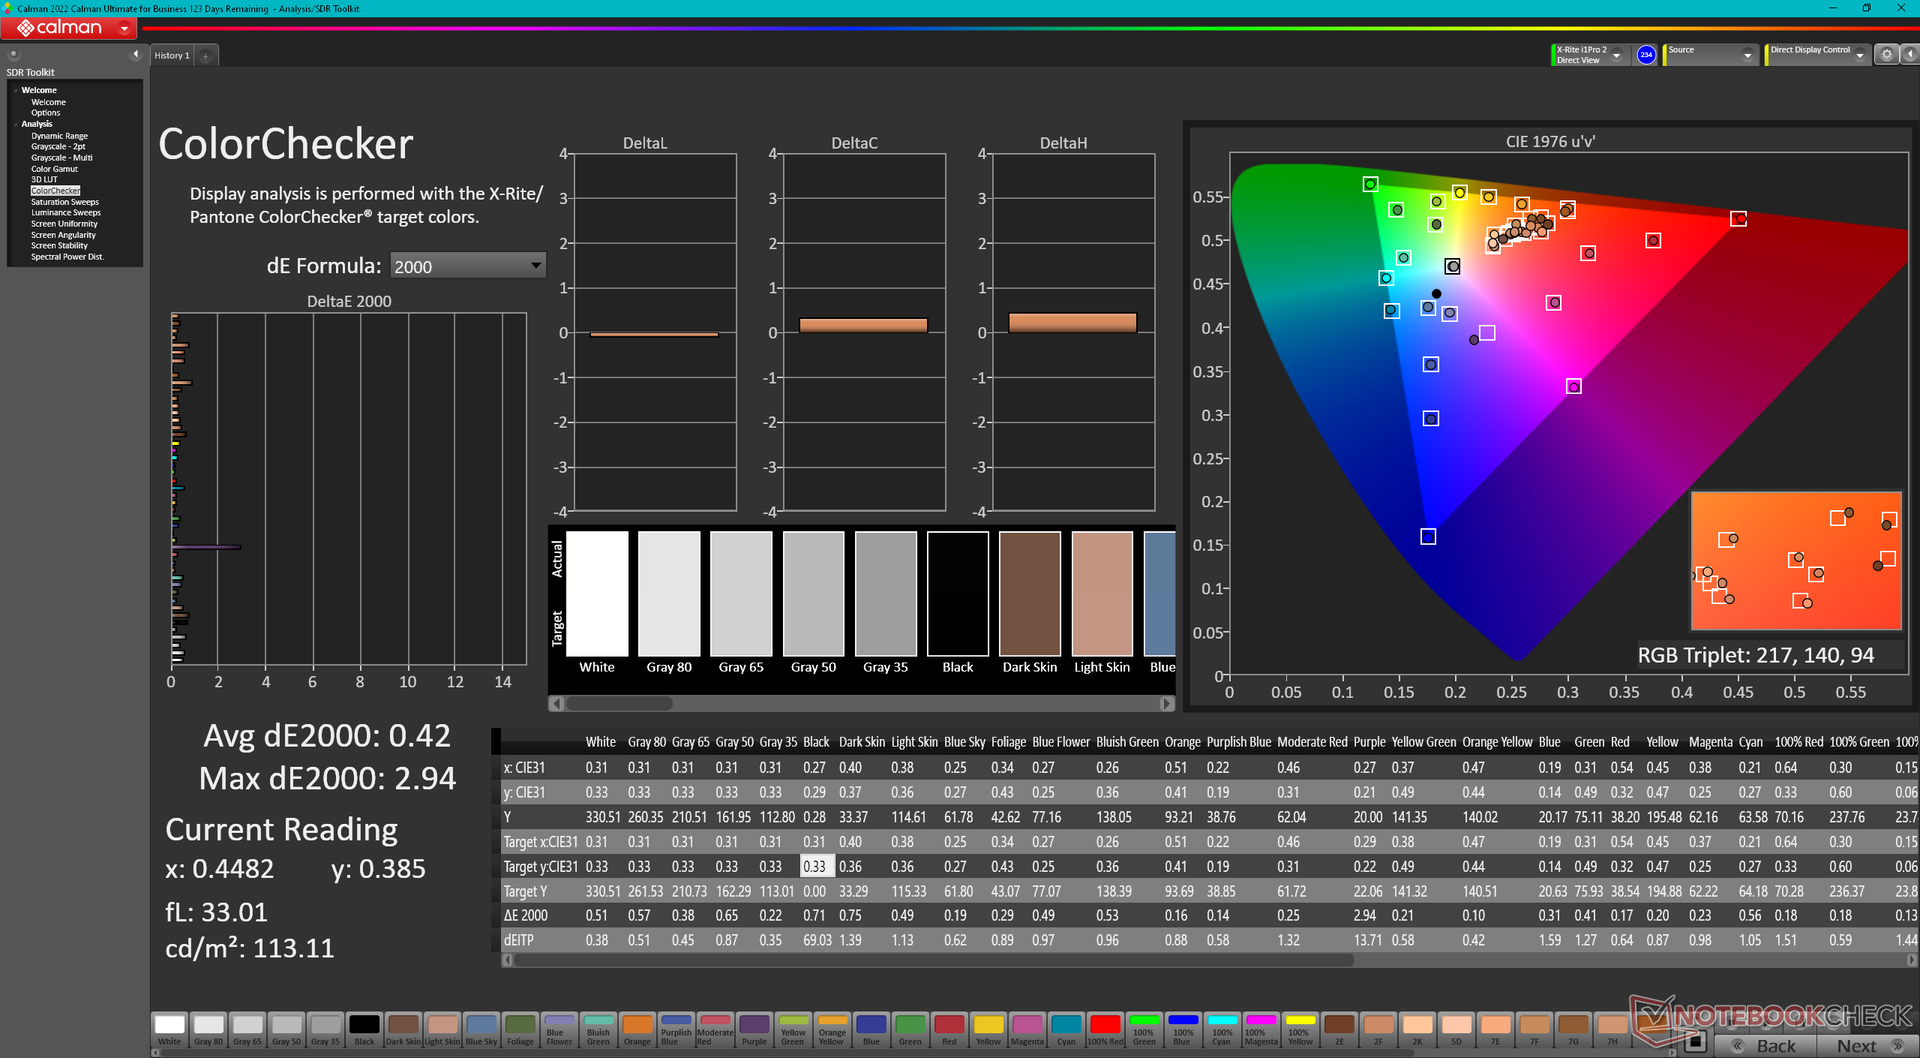
ΔE Color 2.68 | 0.5-29.43 Ø4.87, calibrated: 0.42
ΔE Greyscale 3.4 | 0.5-98 Ø5.1
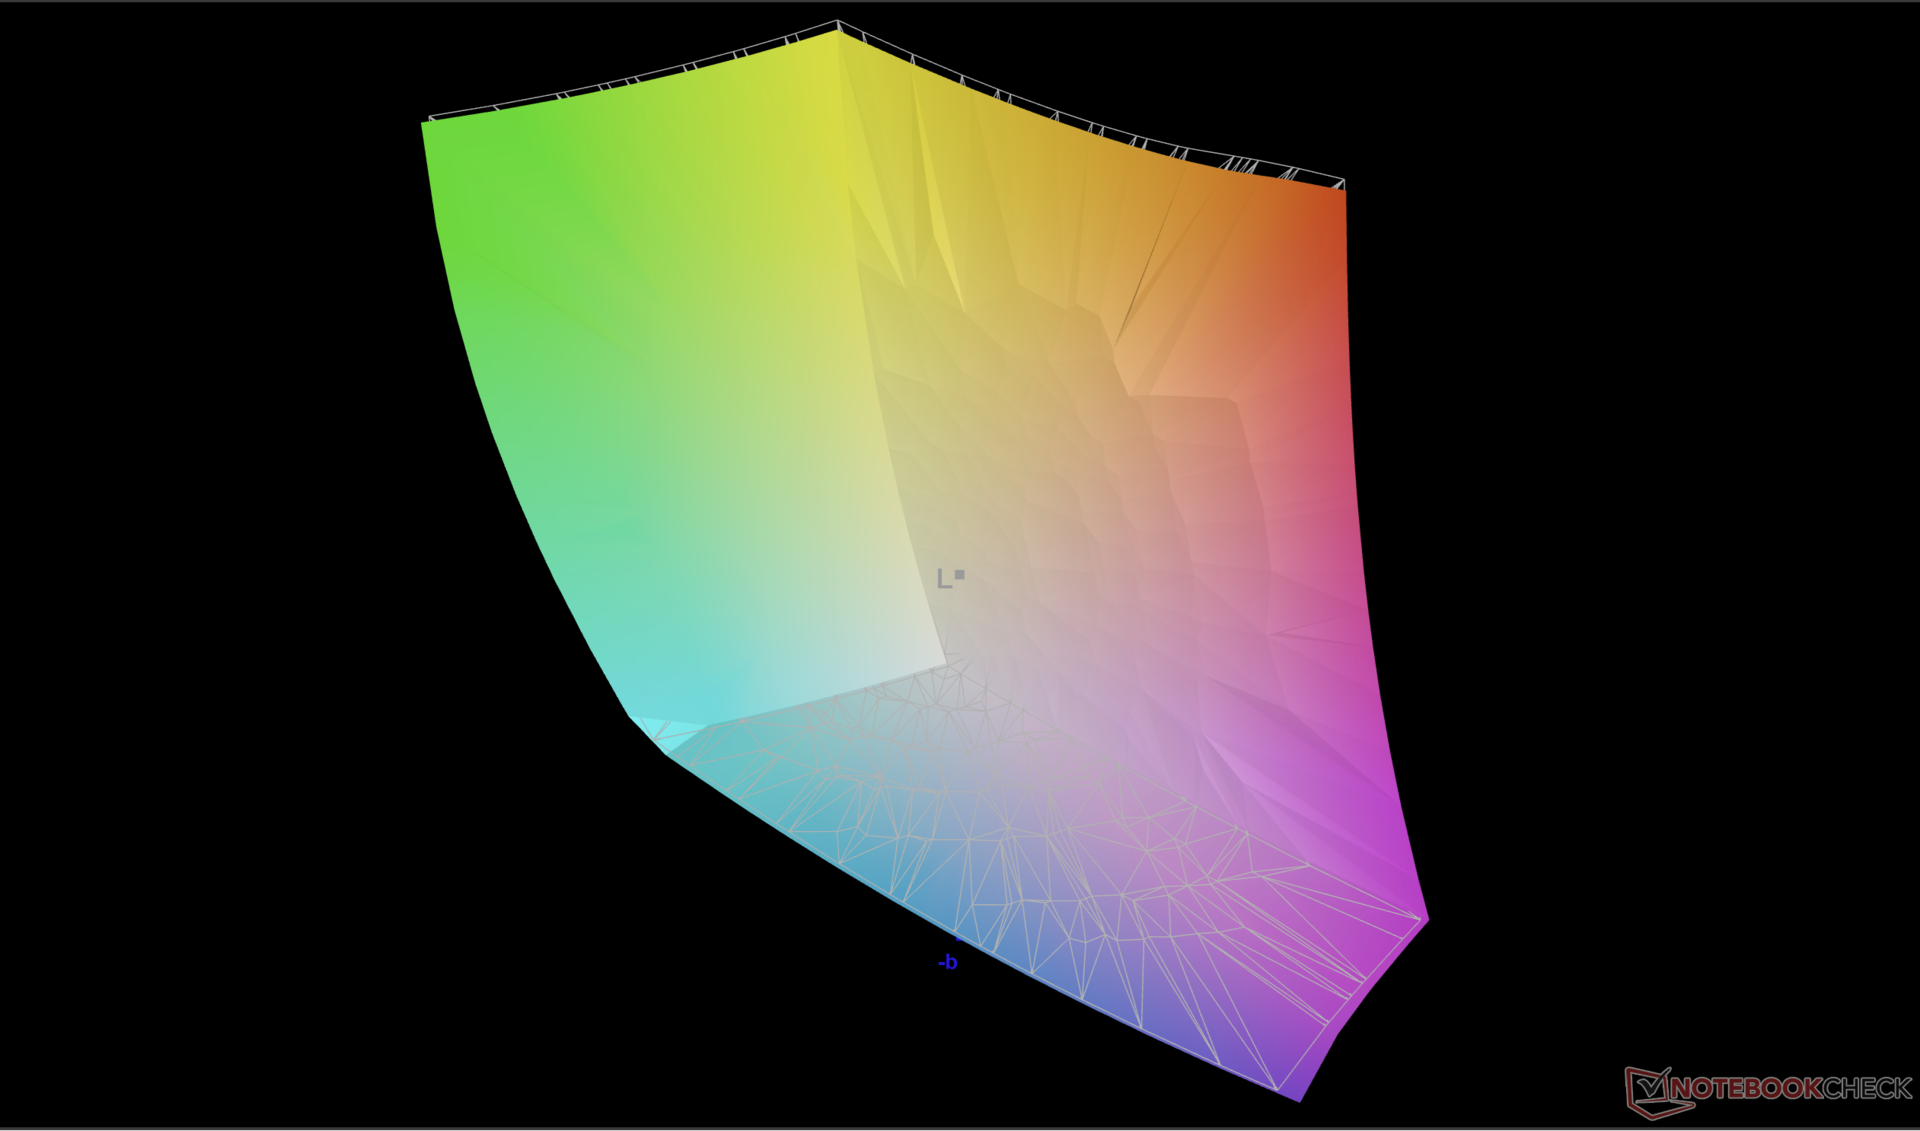
88.8% AdobeRGB 1998 (Argyll 2.2.0 3D)
100% sRGB (Argyll 2.2.0 3D)
98.3% Display P3 (Argyll 2.2.0 3D)
Gamma: 2.41
| Alienware x16 R2 P120F BOE B160QAN, IPS, 2560x1600, 16" | Alienware x16 R1 BOE NE16NZ4, IPS, 2560x1600, 16" | Alienware m16 R2 BOE NE16NYH, IPS, 2560x1600, 16" | Asus ROG Strix Scar 16 G634JZR BOE NE160QDM-NM7, Mini LED, 2560x1600, 16" | Lenovo Legion Pro 7 16IRX9H BOE CQ NE16QDM-NZB, IPS, 2560x1600, 16" | MSI Vector 16 HX A14V Chi Mei N160GME-GTB, IPS, 2560x1600, 16" | |
|---|---|---|---|---|---|---|
| Display | 0% | -16% | 1% | -1% | -2% | |
| Display P3 Coverage | 98.3 | 99.2 1% | 71 -28% | 99.8 2% | 98.5 0% | 95.4 -3% |
| sRGB Coverage | 100 | 100 0% | 100 0% | 100 0% | 99.9 0% | 99.7 0% |
| AdobeRGB 1998 Coverage | 88.8 | 88.6 0% | 71.4 -20% | 90.8 2% | 86.7 -2% | 85.4 -4% |
| Response Times | -32% | -29% | -31% | -99% | -46% | |
| Response Time Grey 50% / Grey 80% * | 3.9 ? | 5.1 ? -31% | 5.7 ? -46% | 5 ? -28% | 12.6 ? -223% | 5.7 ? -46% |
| Response Time Black / White * | 7.8 ? | 10.3 ? -32% | 8.7 ? -12% | 10.4 ? -33% | 5.8 ? 26% | 11.4 ? -46% |
| PWM Frequency | 2040 ? | |||||
| Screen | -13% | 5% | 16% | 21% | -27% | |
| Brightness middle | 348.4 | 302.2 -13% | 345.8 -1% | 490 41% | 487 40% | 557.2 60% |
| Brightness | 340 | 285 -16% | 337 -1% | 487 43% | 460 35% | 506 49% |
| Brightness Distribution | 90 | 89 -1% | 87 -3% | 94 4% | 88 -2% | 83 -8% |
| Black Level * | 0.33 | 0.26 21% | 0.3 9% | 0.4 -21% | 0.42 -27% | 0.41 -24% |
| Contrast | 1056 | 1162 10% | 1153 9% | 1225 16% | 1160 10% | 1359 29% |
| Colorchecker dE 2000 * | 2.68 | 1.63 39% | 1.99 26% | 1.08 60% | 1.12 58% | 2.91 -9% |
| Colorchecker dE 2000 max. * | 4.14 | 4.13 -0% | 3.52 15% | 2.38 43% | 2.26 45% | 5.94 -43% |
| Colorchecker dE 2000 calibrated * | 0.42 | 1.17 -179% | 0.62 -48% | 0.9 -114% | 0.54 -29% | 1.63 -288% |
| Greyscale dE 2000 * | 3.4 | 2.5 26% | 2.1 38% | 1.1 68% | 1.4 59% | 3.8 -12% |
| Gamma | 2.41 91% | 2.23 99% | 2.32 95% | 2.13 103% | 2.242 98% | 2.23 99% |
| CCT | 6083 107% | 6590 99% | 6369 102% | 6724 97% | 6809 95% | 6408 101% |
| Media totale (Programma / Settaggio) | -15% /
-13% | -13% /
-4% | -5% /
6% | -26% /
-1% | -25% /
-25% |
* ... Meglio usare valori piccoli
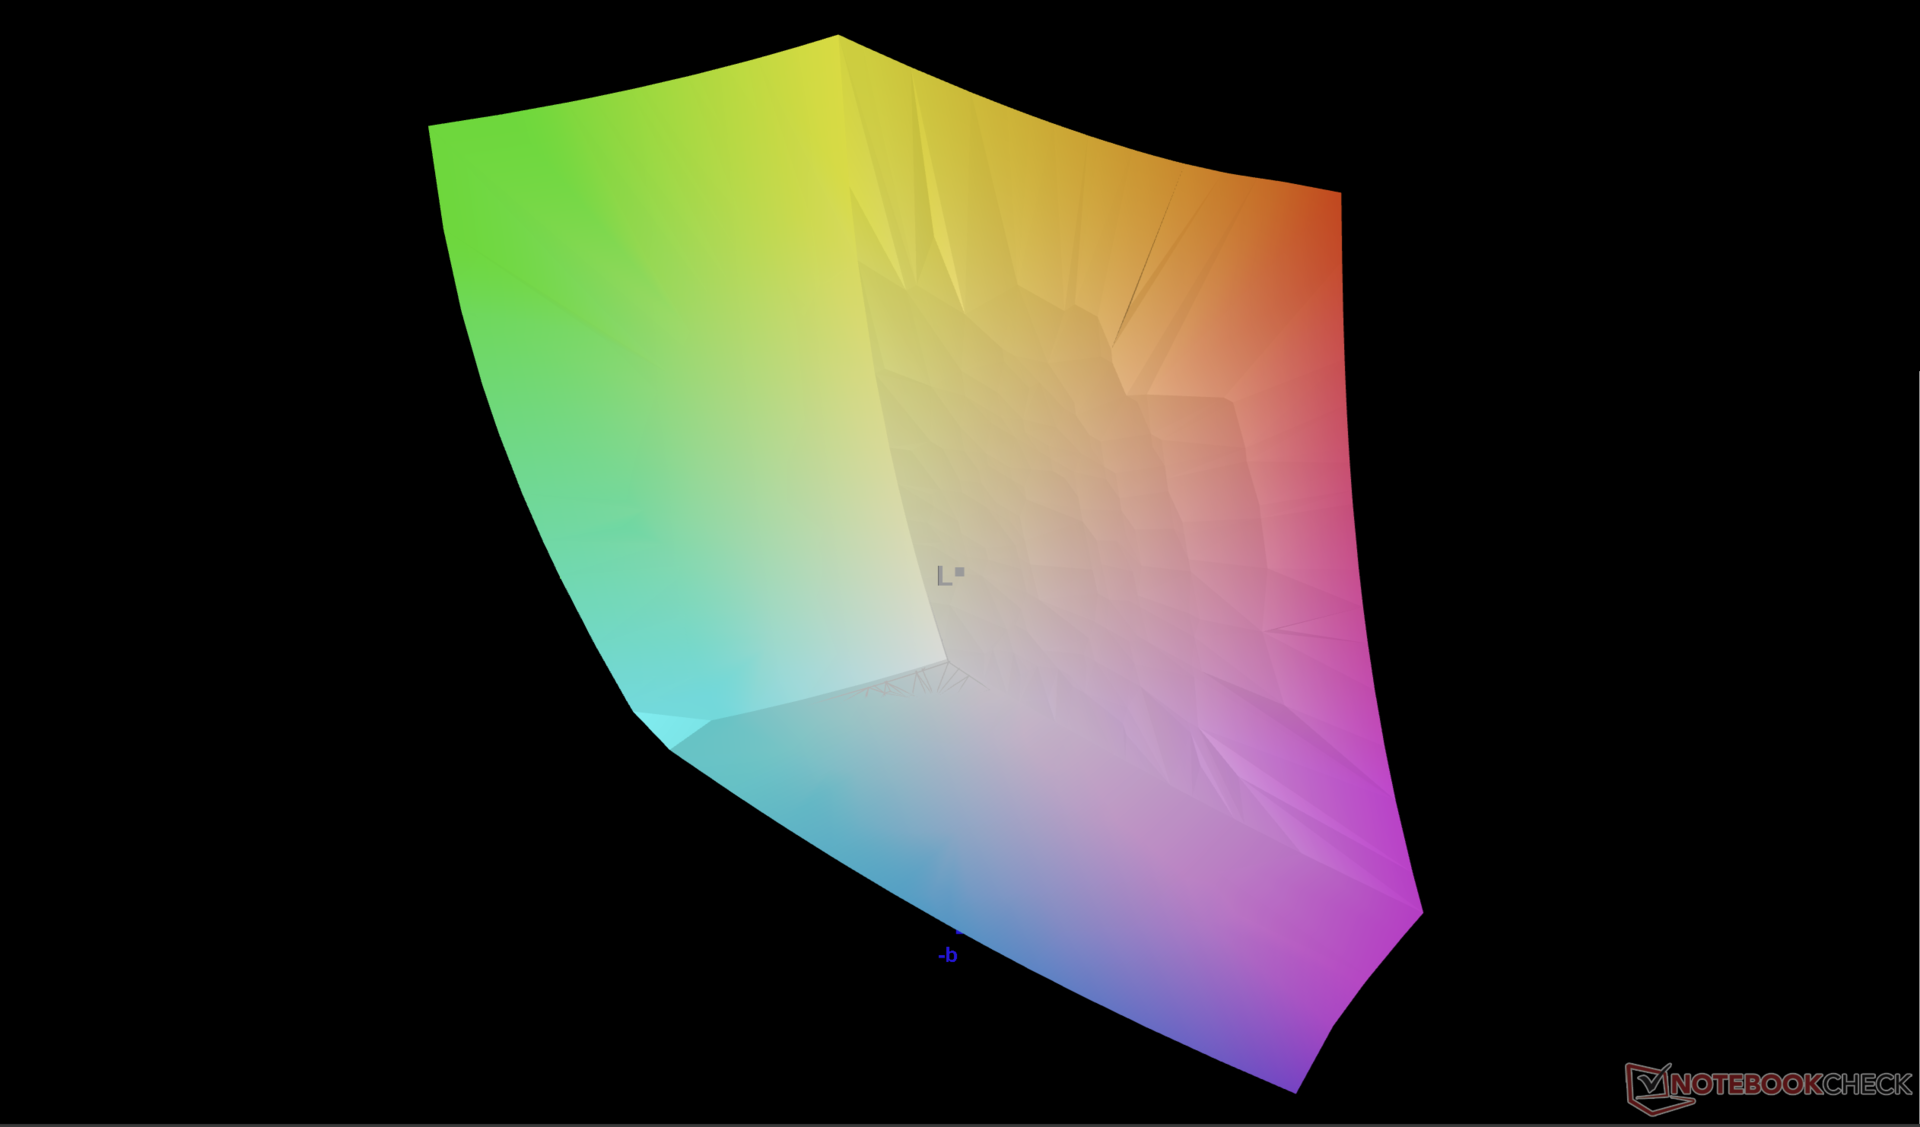
Il display è impostato di default su sRGB, anche se supporta i colori P3 completi. Tuttavia, la calibrazione è decente, anche se la temperatura del colore è leggermente troppo calda.
Tempi di risposta del Display
| ↔ Tempi di risposta dal Nero al Bianco | ||
|---|---|---|
| 7.8 ms ... aumenta ↗ e diminuisce ↘ combinato | ↗ 3.9 ms Incremento | 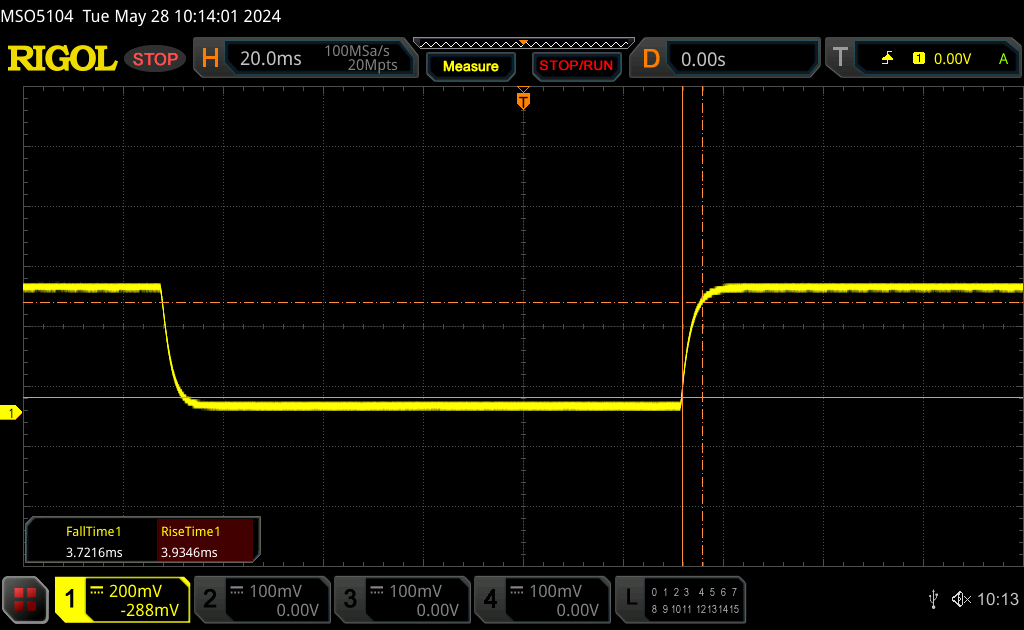 |
| ↘ 3.7 ms Calo | ||
| Lo schermo ha mostrato valori di risposta molto veloci nei nostri tests ed è molto adatto per i gaming veloce. In confronto, tutti i dispositivi di test variano da 0.1 (minimo) a 240 (massimo) ms. » 19 % di tutti i dispositivi è migliore. Questo significa che i tempi di risposta rilevati sono migliori rispettto alla media di tutti i dispositivi testati (20.7 ms). | ||
| ↔ Tempo di risposta dal 50% Grigio all'80% Grigio | ||
| 3.9 ms ... aumenta ↗ e diminuisce ↘ combinato | ↗ 1.7 ms Incremento | 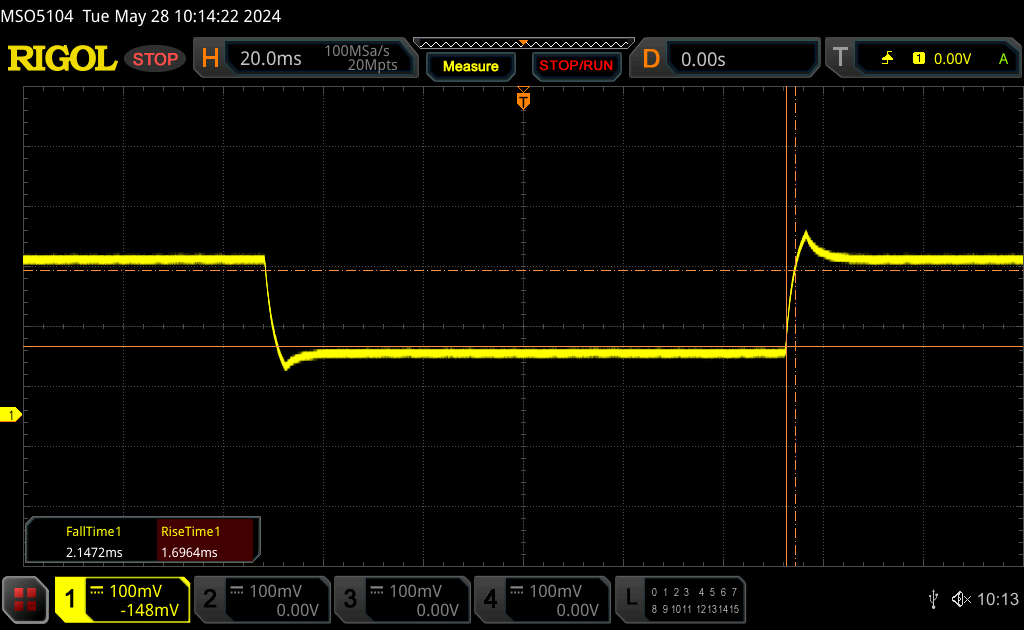 |
| ↘ 2.2 ms Calo | ||
| Lo schermo ha mostrato valori di risposta molto veloci nei nostri tests ed è molto adatto per i gaming veloce. In confronto, tutti i dispositivi di test variano da 0.165 (minimo) a 636 (massimo) ms. » 12 % di tutti i dispositivi è migliore. Questo significa che i tempi di risposta rilevati sono migliori rispettto alla media di tutti i dispositivi testati (32.5 ms). | ||
Sfarfallio dello schermo / PWM (Pulse-Width Modulation)
| flickering dello schermo / PWM non rilevato | 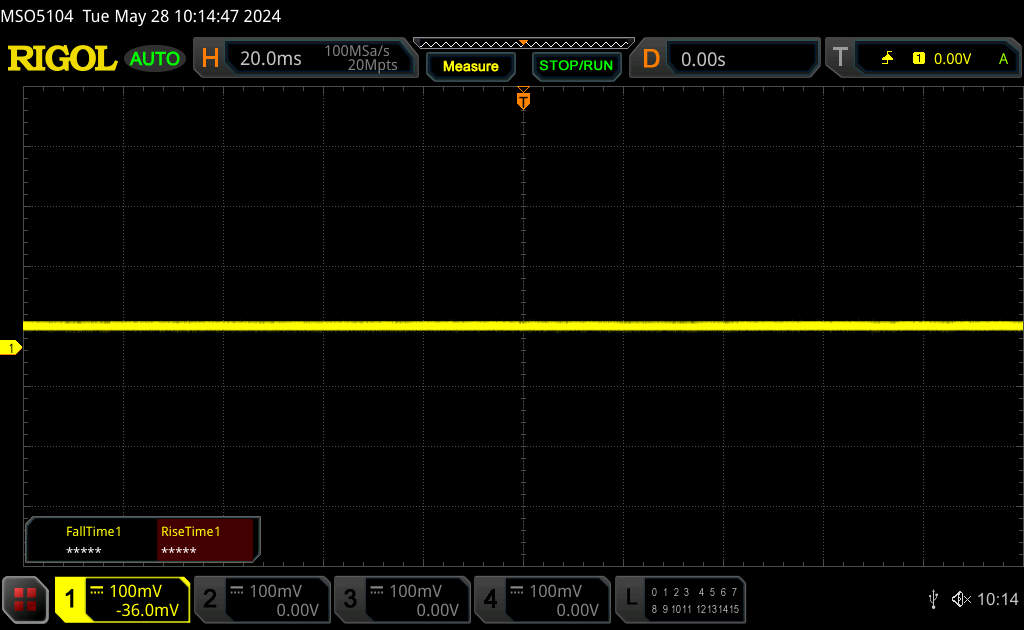 | ||
In confronto: 53 % di tutti i dispositivi testati non utilizza PWM per ridurre la luminosita' del display. Se è rilevato PWM, una media di 8492 (minimo: 5 - massimo: 343500) Hz è stata rilevata. | |||
Prestazioni - Core Ultra 9 185H vs. Core i9-13900HK
Condizioni del test
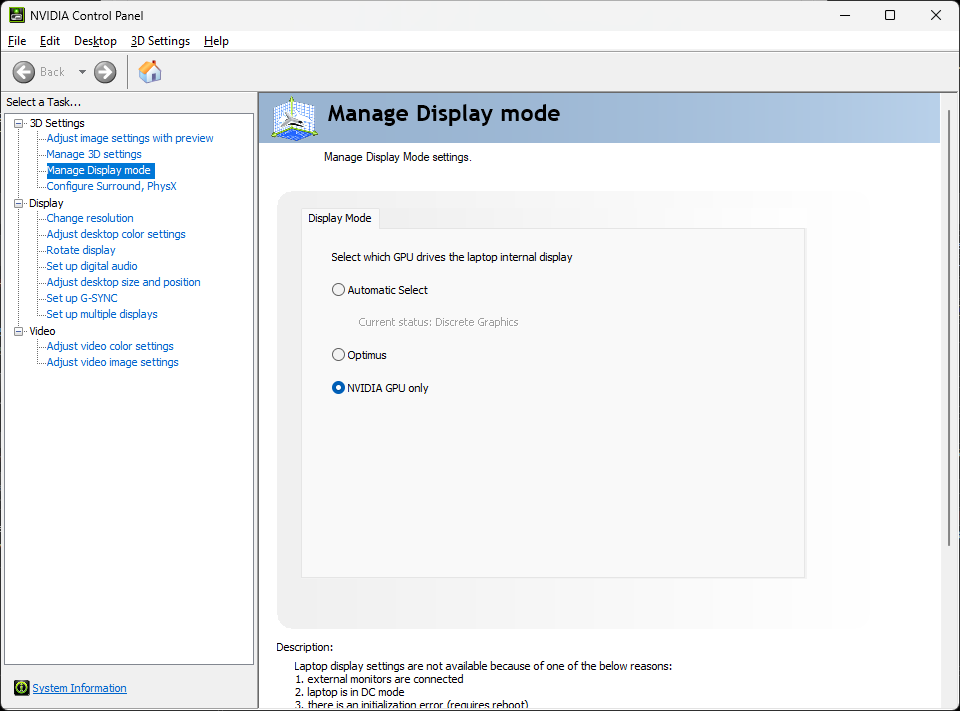
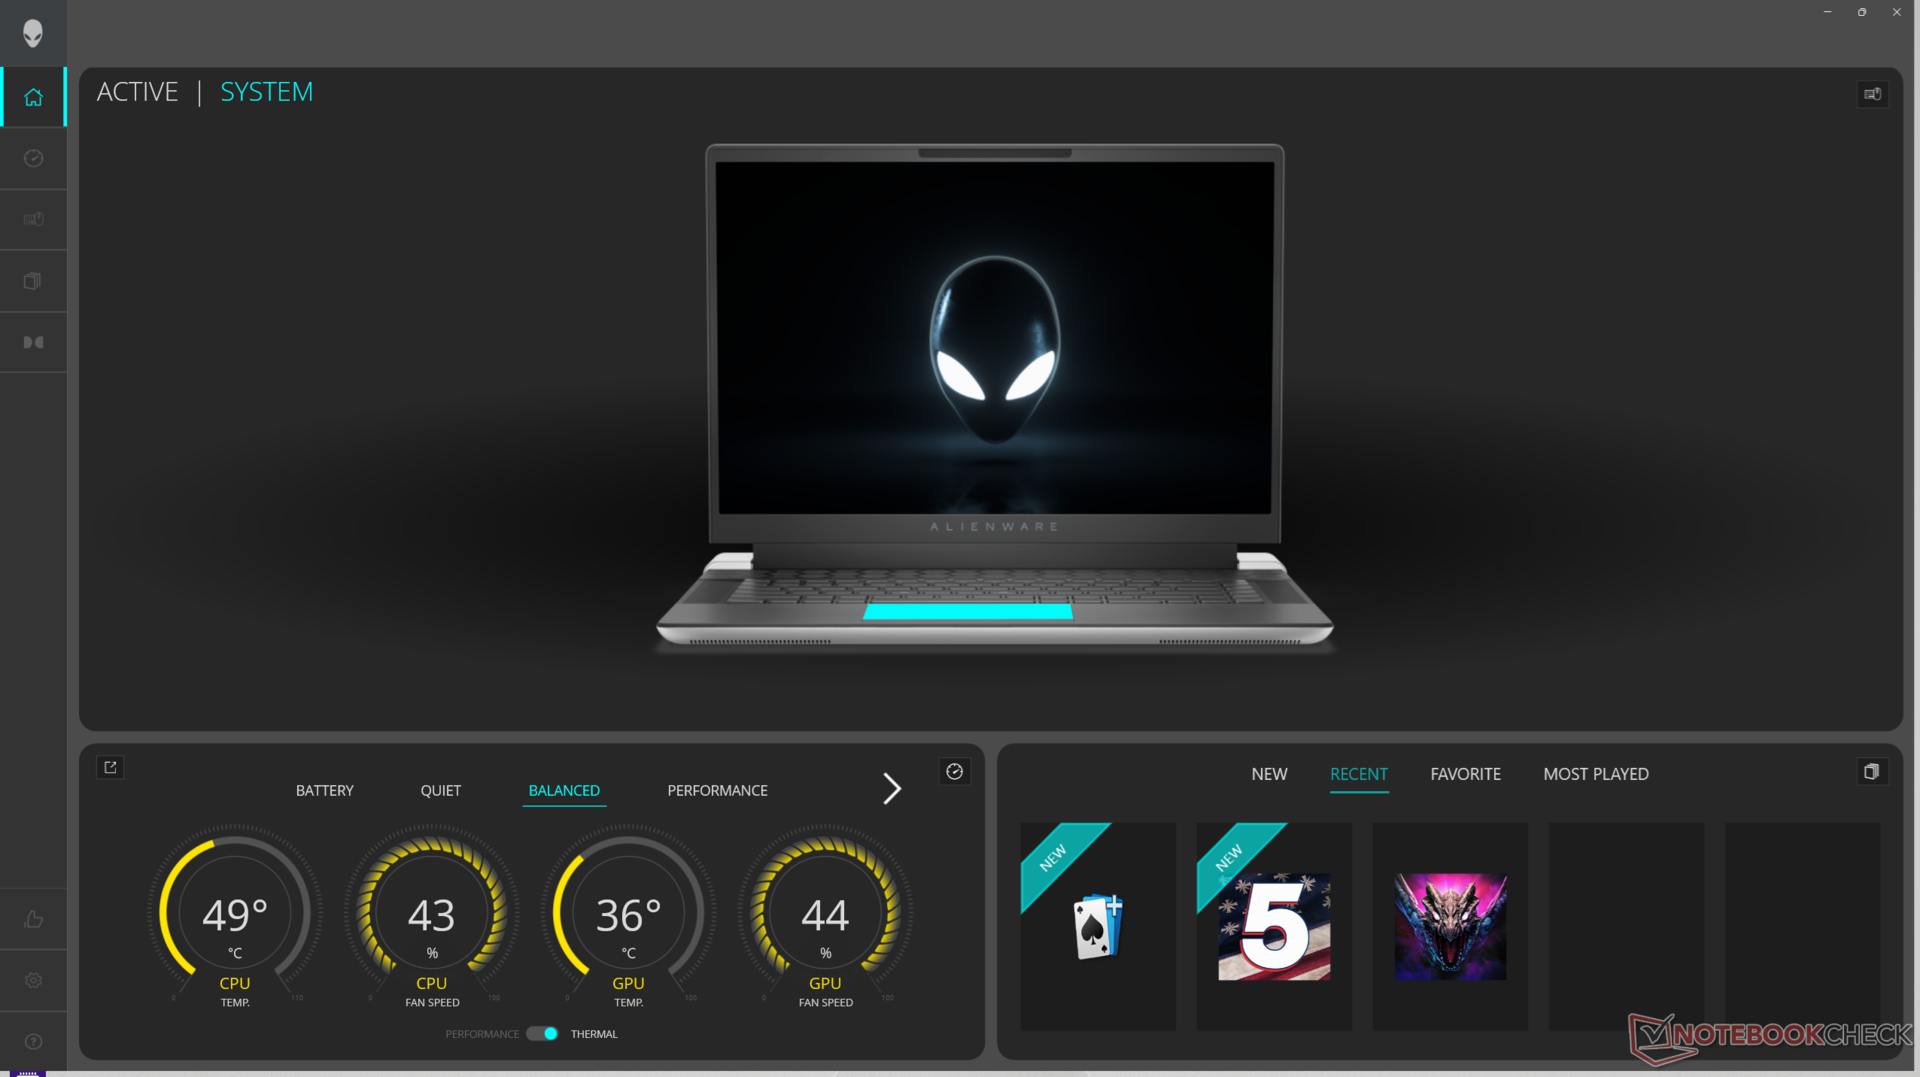
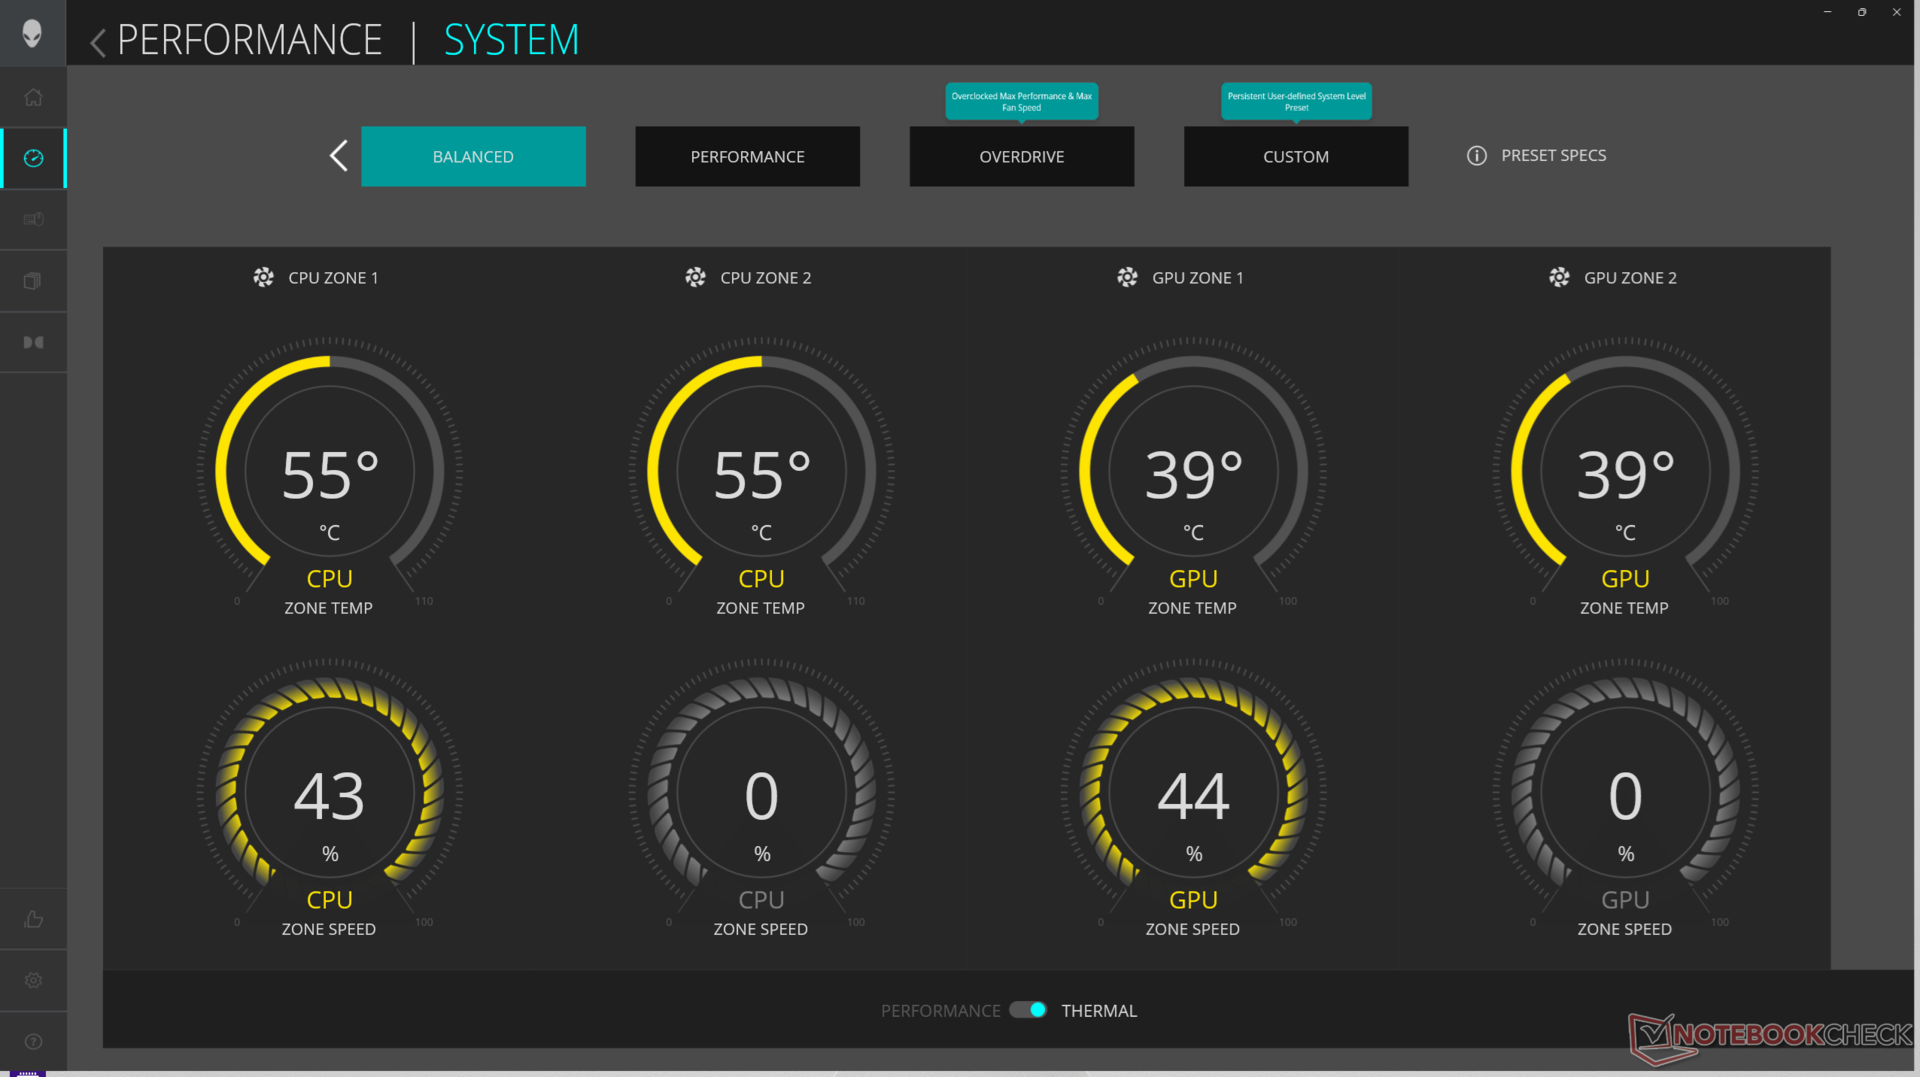
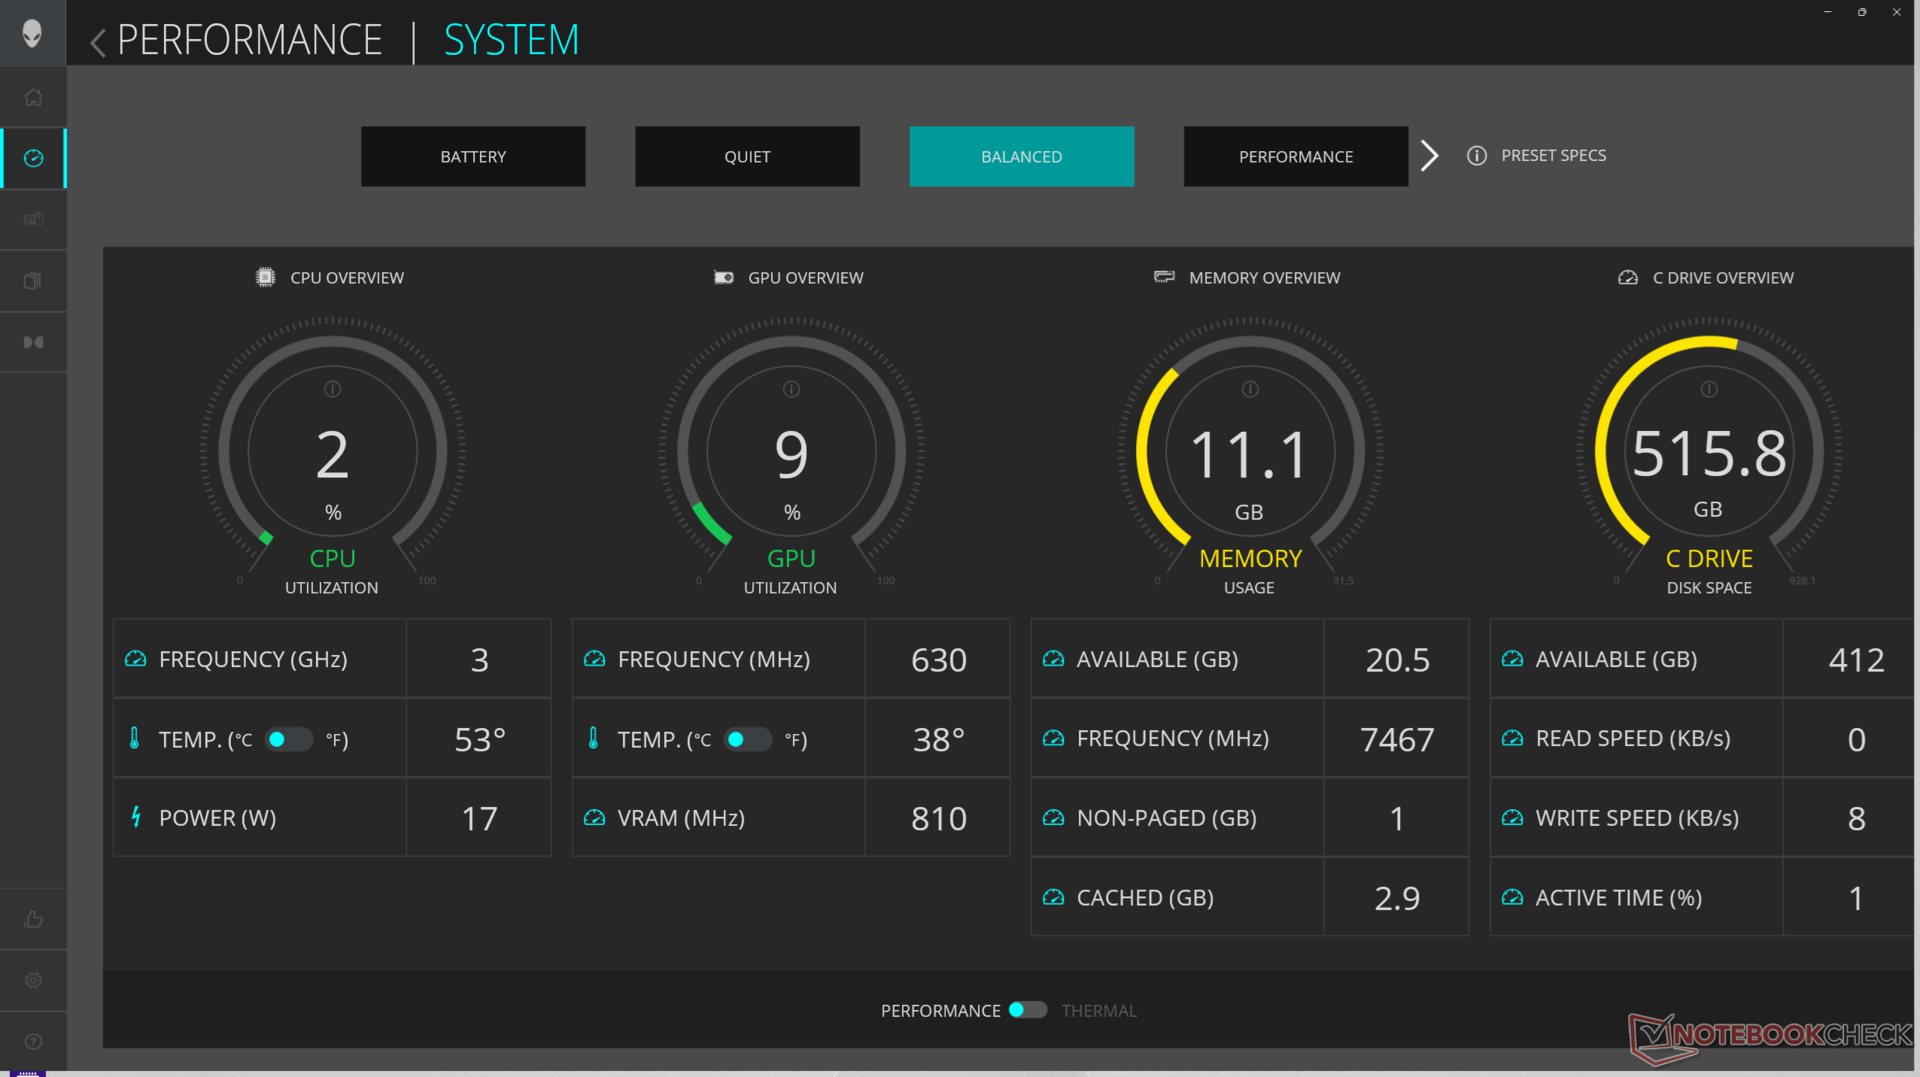
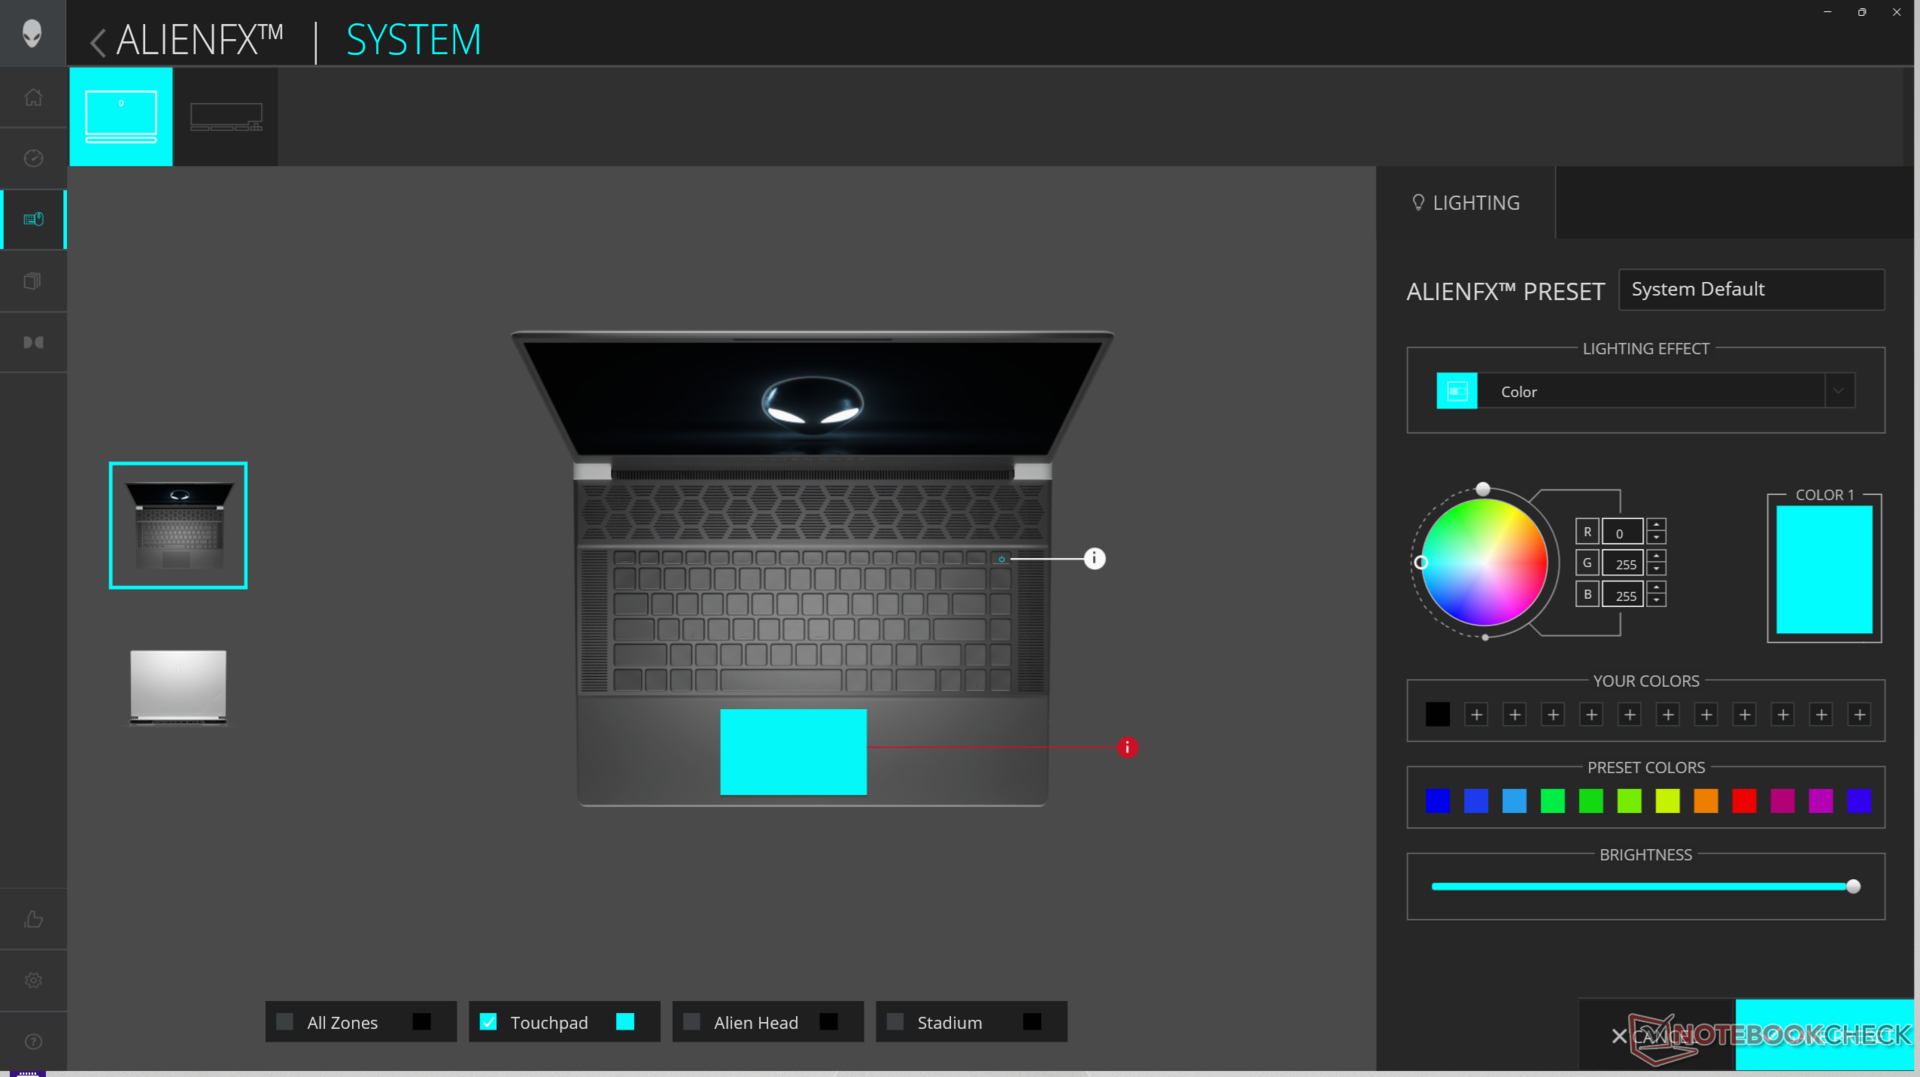
Abbiamo impostato Alienware Command Center sulla modalità Overdrive e la grafica sulla modalità dGPU per ottenere i migliori risultati di benchmark possibili. I proprietari sono invitati a familiarizzare con Command Center, in quanto è l'hub per regolare gli effetti di illuminazione RGB e i profili delle prestazioni.
Il Pannello di controllo Nvidia non offre una modalità "solo iGPU", come mostra lo screenshot qui sopra.
Processore
Il Core Ultra 9 185H è più lento del 5-10% e del 15-20% rispetto al Core i9-13900HK nell'R1 x16 dello scorso anno, rispettivamente nelle applicazioni multi-threaded e single-threaded. È interessante notare che il downgrade al Core Ultra 7 155H non dovrebbe avere un impatto significativo sulle prestazioni durante il nostro tempo trascorso con l'Alienware m16 R2 Alienware m16 R2 come dimostra il grafico di confronto qui sotto.
Le opzioni Raptor Lake-HX come il Core i9-14900HX non sono disponibili sulla serie Alienware x16, probabilmente a causa di limitazioni termiche, dato che questi processori richiedono più energia rispetto alla serie Meteor Lake-H. Tali opzioni avrebbero offerto prestazioni significativamente più elevate rispetto al Core i9-13900HK o al Core Ultra 9 185H.
Cinebench R15 Multi Loop
Cinebench R23: Multi Core | Single Core
Cinebench R20: CPU (Multi Core) | CPU (Single Core)
Cinebench R15: CPU Multi 64Bit | CPU Single 64Bit
Blender: v2.79 BMW27 CPU
7-Zip 18.03: 7z b 4 | 7z b 4 -mmt1
Geekbench 6.4: Multi-Core | Single-Core
Geekbench 5.5: Multi-Core | Single-Core
HWBOT x265 Benchmark v2.2: 4k Preset
LibreOffice : 20 Documents To PDF
R Benchmark 2.5: Overall mean
* ... Meglio usare valori piccoli
AIDA64: FP32 Ray-Trace | FPU Julia | CPU SHA3 | CPU Queen | FPU SinJulia | FPU Mandel | CPU AES | CPU ZLib | FP64 Ray-Trace | CPU PhotoWorxx
| Performance Rating | |
| MSI Vector 16 HX A14V | |
| Lenovo Legion Pro 7 16IRX9H | |
| Asus ROG Strix Scar 16 G634JZR | |
| Alienware x16 R2 P120F | |
| Alienware x16 R1 | |
| Alienware m16 R2 | |
| Media Intel Core Ultra 9 185H | |
| AIDA64 / FP32 Ray-Trace | |
| MSI Vector 16 HX A14V | |
| Lenovo Legion Pro 7 16IRX9H | |
| Asus ROG Strix Scar 16 G634JZR | |
| Alienware x16 R2 P120F | |
| Alienware m16 R2 | |
| Alienware x16 R1 | |
| Media Intel Core Ultra 9 185H (9220 - 18676, n=19) | |
| AIDA64 / FPU Julia | |
| MSI Vector 16 HX A14V | |
| Lenovo Legion Pro 7 16IRX9H | |
| Asus ROG Strix Scar 16 G634JZR | |
| Alienware x16 R2 P120F | |
| Alienware m16 R2 | |
| Alienware x16 R1 | |
| Media Intel Core Ultra 9 185H (48865 - 96463, n=19) | |
| AIDA64 / CPU SHA3 | |
| Lenovo Legion Pro 7 16IRX9H | |
| MSI Vector 16 HX A14V | |
| Asus ROG Strix Scar 16 G634JZR | |
| Alienware x16 R2 P120F | |
| Alienware m16 R2 | |
| Alienware x16 R1 | |
| Media Intel Core Ultra 9 185H (2394 - 4534, n=19) | |
| AIDA64 / CPU Queen | |
| Asus ROG Strix Scar 16 G634JZR | |
| Lenovo Legion Pro 7 16IRX9H | |
| MSI Vector 16 HX A14V | |
| Alienware x16 R1 | |
| Alienware x16 R2 P120F | |
| Media Intel Core Ultra 9 185H (66785 - 95241, n=19) | |
| Alienware m16 R2 | |
| AIDA64 / FPU SinJulia | |
| Lenovo Legion Pro 7 16IRX9H | |
| MSI Vector 16 HX A14V | |
| Asus ROG Strix Scar 16 G634JZR | |
| Alienware x16 R1 | |
| Alienware x16 R2 P120F | |
| Alienware m16 R2 | |
| Media Intel Core Ultra 9 185H (7255 - 11392, n=19) | |
| AIDA64 / FPU Mandel | |
| MSI Vector 16 HX A14V | |
| Lenovo Legion Pro 7 16IRX9H | |
| Asus ROG Strix Scar 16 G634JZR | |
| Alienware x16 R2 P120F | |
| Alienware m16 R2 | |
| Alienware x16 R1 | |
| Media Intel Core Ultra 9 185H (24004 - 48020, n=19) | |
| AIDA64 / CPU AES | |
| Asus ROG Strix Scar 16 G634JZR | |
| Lenovo Legion Pro 7 16IRX9H | |
| MSI Vector 16 HX A14V | |
| Media Intel Core Ultra 9 185H (53116 - 154066, n=19) | |
| Alienware x16 R2 P120F | |
| Alienware m16 R2 | |
| Alienware x16 R1 | |
| AIDA64 / CPU ZLib | |
| Lenovo Legion Pro 7 16IRX9H | |
| MSI Vector 16 HX A14V | |
| Asus ROG Strix Scar 16 G634JZR | |
| Alienware x16 R2 P120F | |
| Alienware x16 R1 | |
| Alienware m16 R2 | |
| Media Intel Core Ultra 9 185H (678 - 1341, n=19) | |
| AIDA64 / FP64 Ray-Trace | |
| MSI Vector 16 HX A14V | |
| Lenovo Legion Pro 7 16IRX9H | |
| Asus ROG Strix Scar 16 G634JZR | |
| Alienware x16 R2 P120F | |
| Alienware x16 R1 | |
| Alienware m16 R2 | |
| Media Intel Core Ultra 9 185H (4428 - 10078, n=19) | |
| AIDA64 / CPU PhotoWorxx | |
| Alienware x16 R2 P120F | |
| Asus ROG Strix Scar 16 G634JZR | |
| Alienware x16 R1 | |
| MSI Vector 16 HX A14V | |
| Media Intel Core Ultra 9 185H (44547 - 53918, n=19) | |
| Lenovo Legion Pro 7 16IRX9H | |
| Alienware m16 R2 | |
Test da sforzo
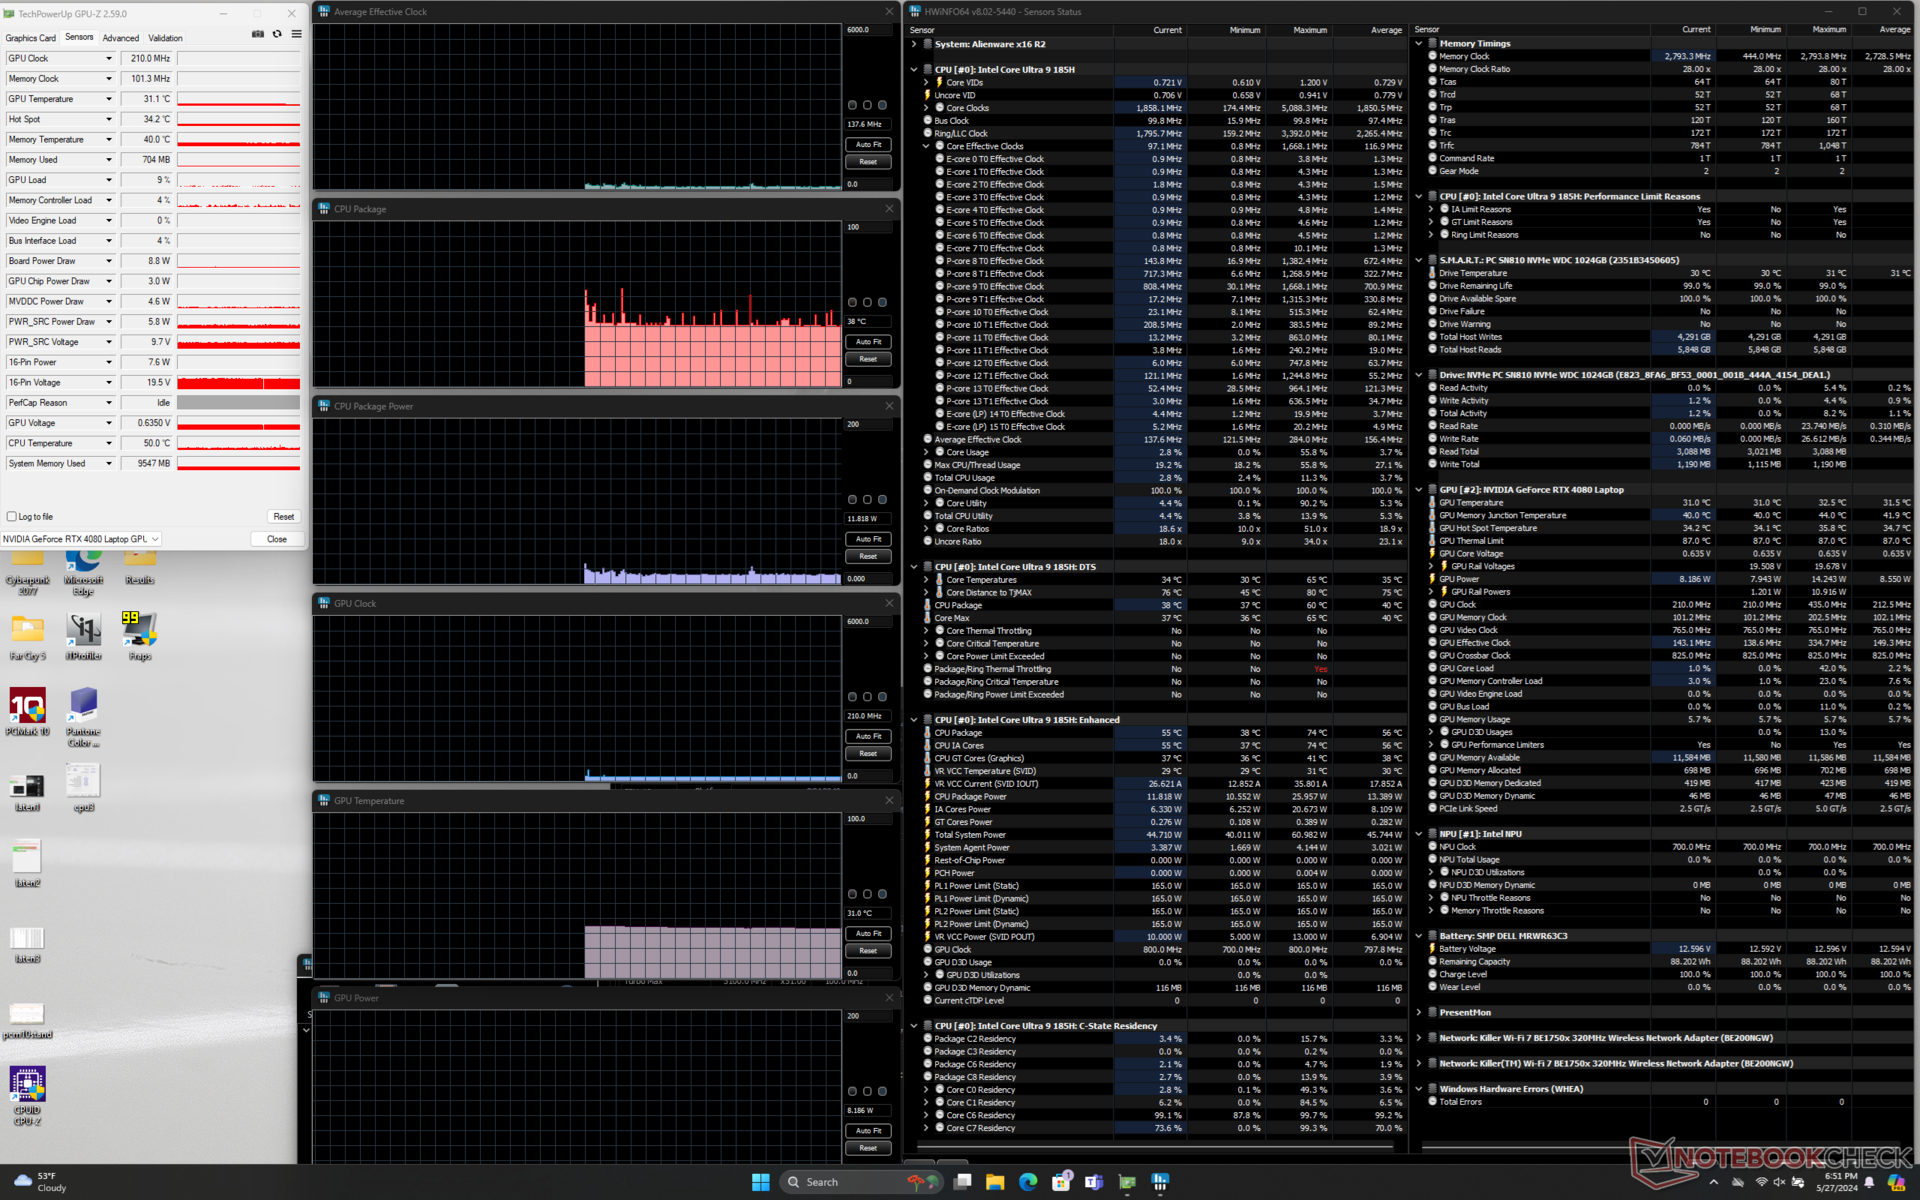
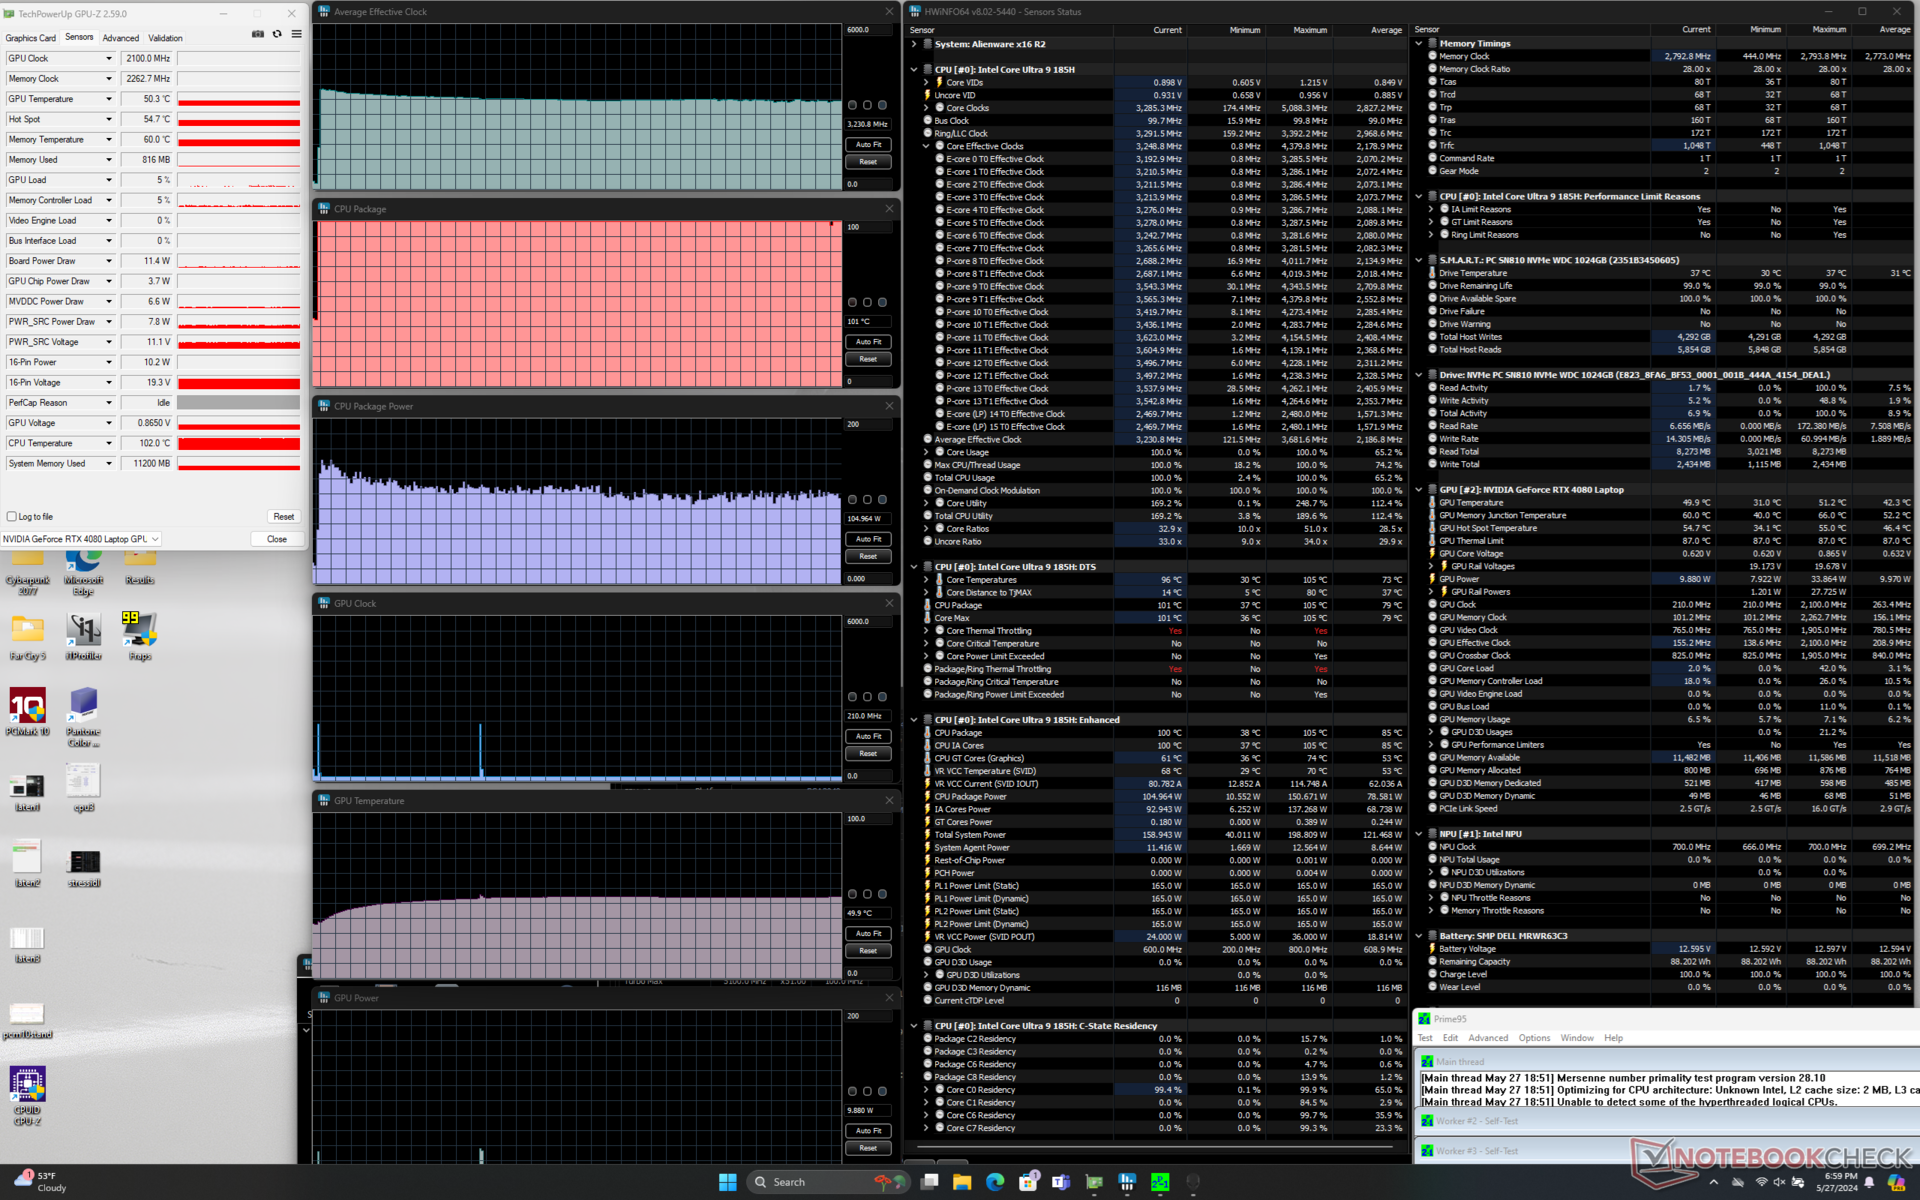
Le temperature del core tra la CPU e la GPU sono altrettanto calde di quelle registrate sull'R1 x16. La CPU in particolare si stabilizza ancora a quasi 100 C (!) quando si esegue Prime95, mentre la GPU si stabilizza a metà degli 80 C quando si esegue Witcher 3. È interessante notare che la velocità di clock della GPU è diminuita su tutta la linea rispetto alla x16 R1. La GPU oscilla tra 2100 e 2325 MHz a seconda del profilo di alimentazione, rispetto ai 2460 MHz dell'x16 R1 originale. Anche l'assorbimento di potenza della scheda sarebbe inferiore sul modello x16 R2 più recente (150 W contro 165 W). Questi risultati sono correlati alle prestazioni grafiche generalmente più lente nella sezione Prestazioni della GPU qui sotto.
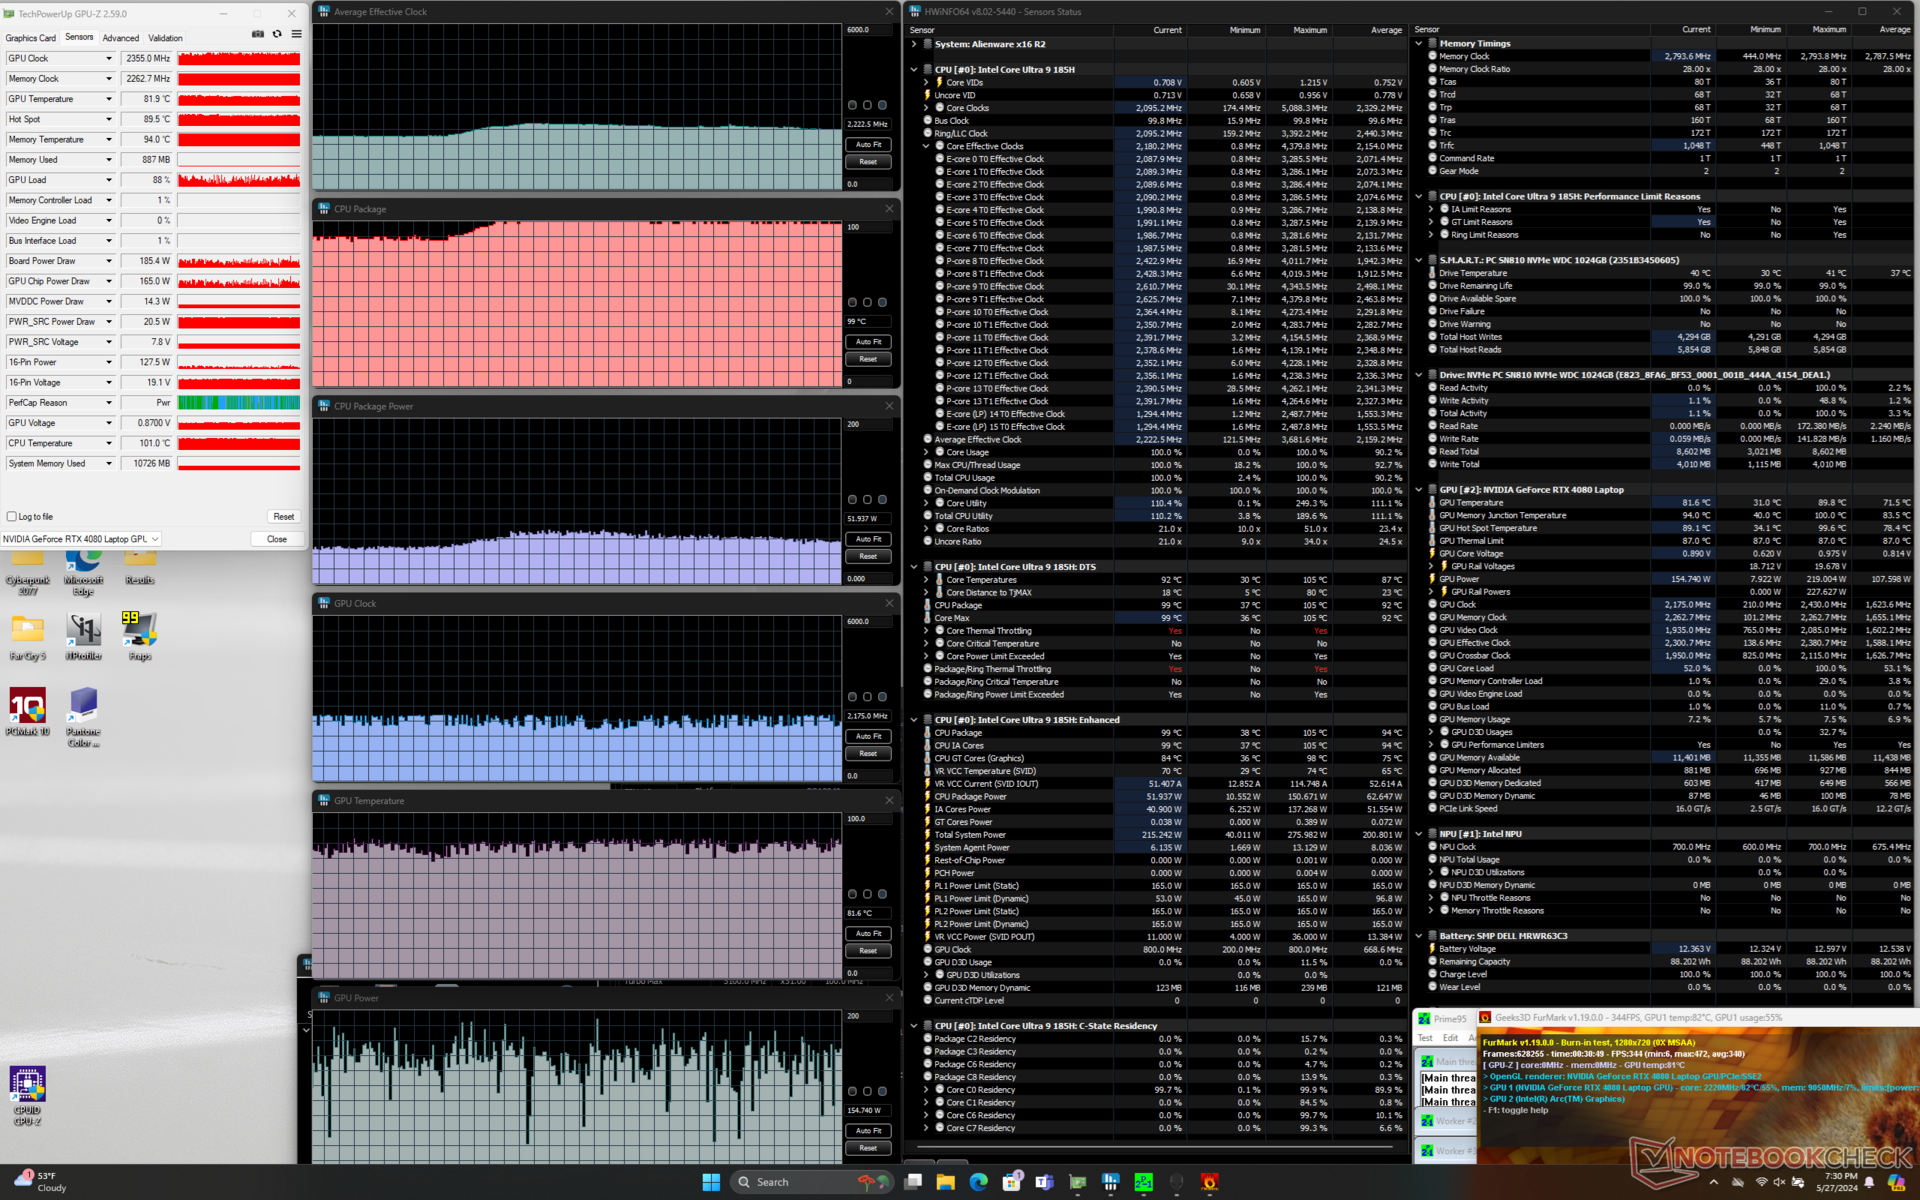
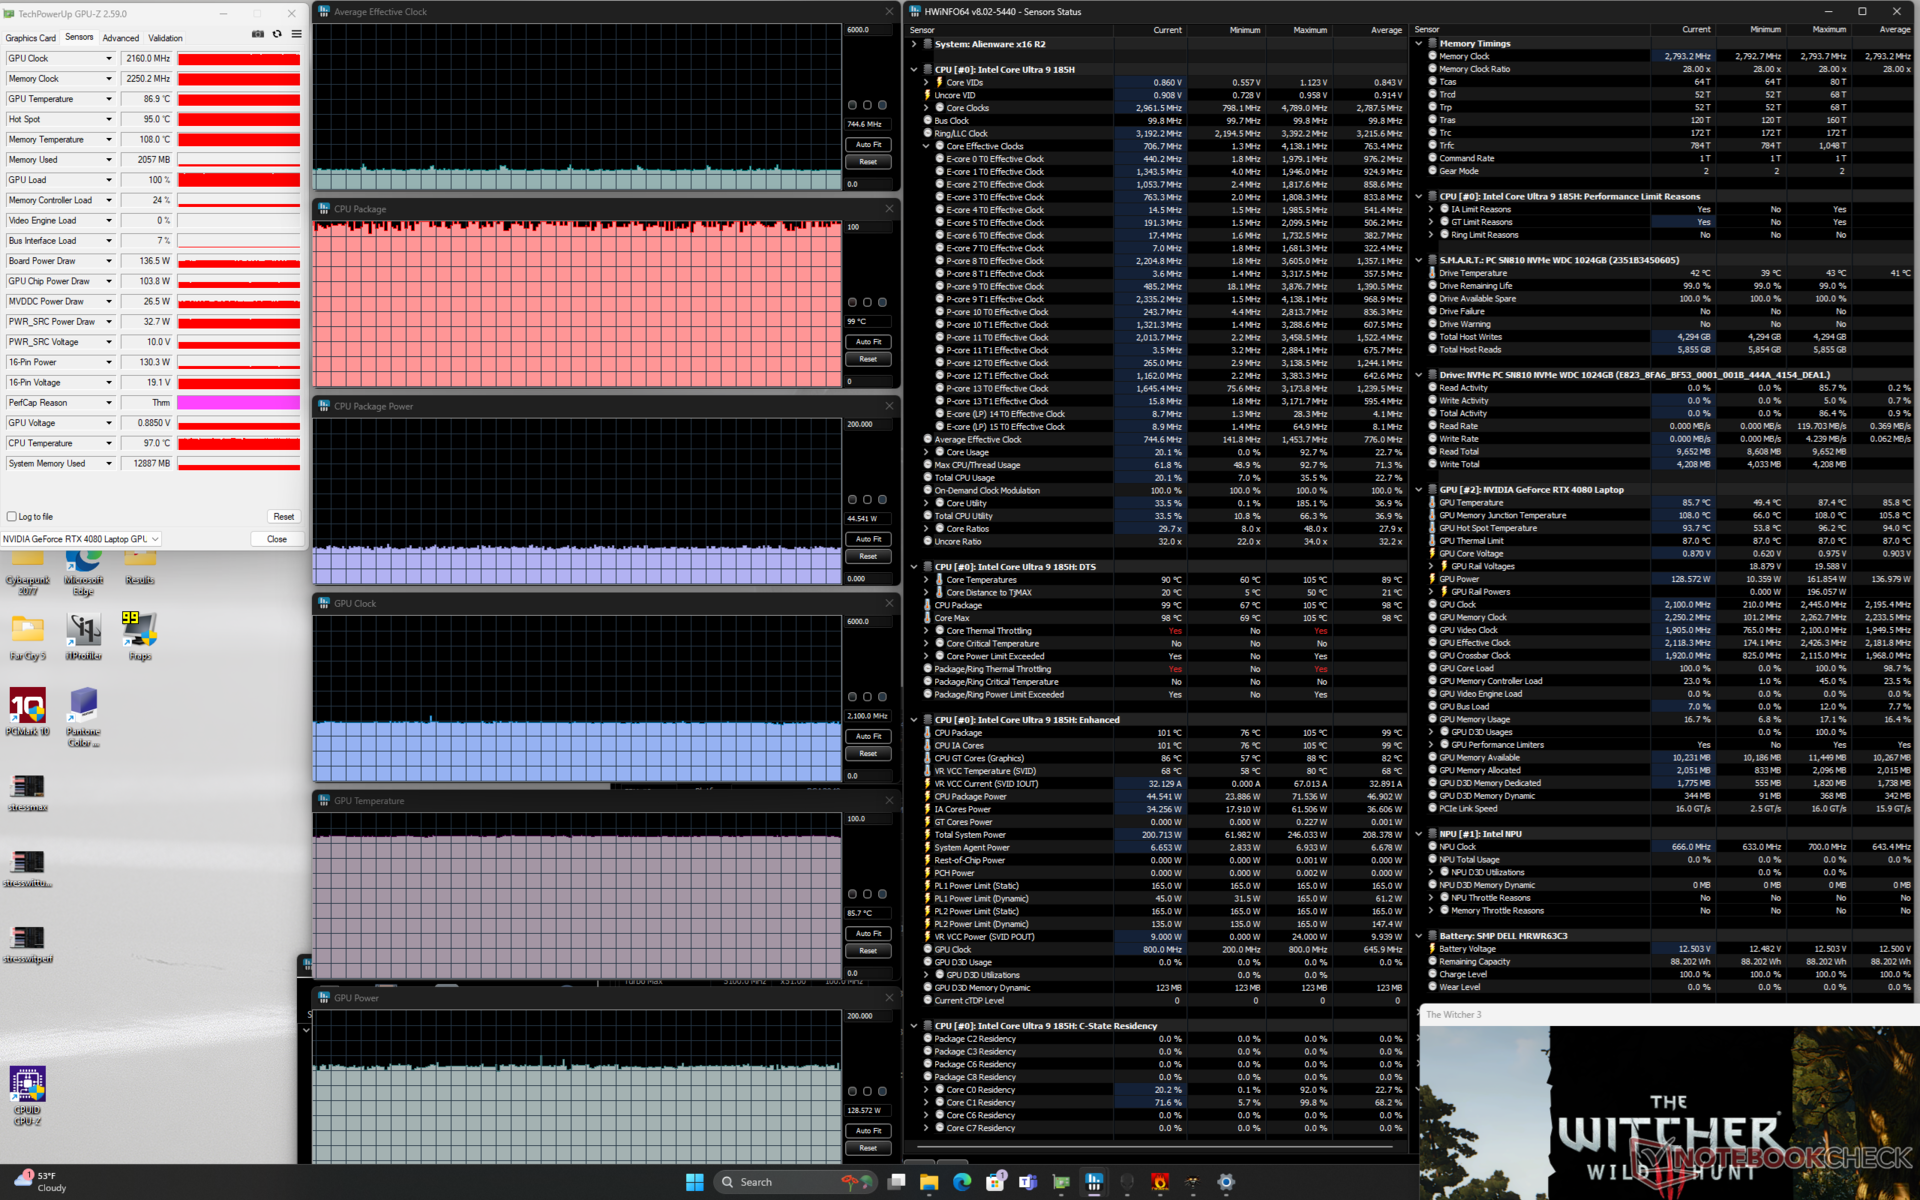
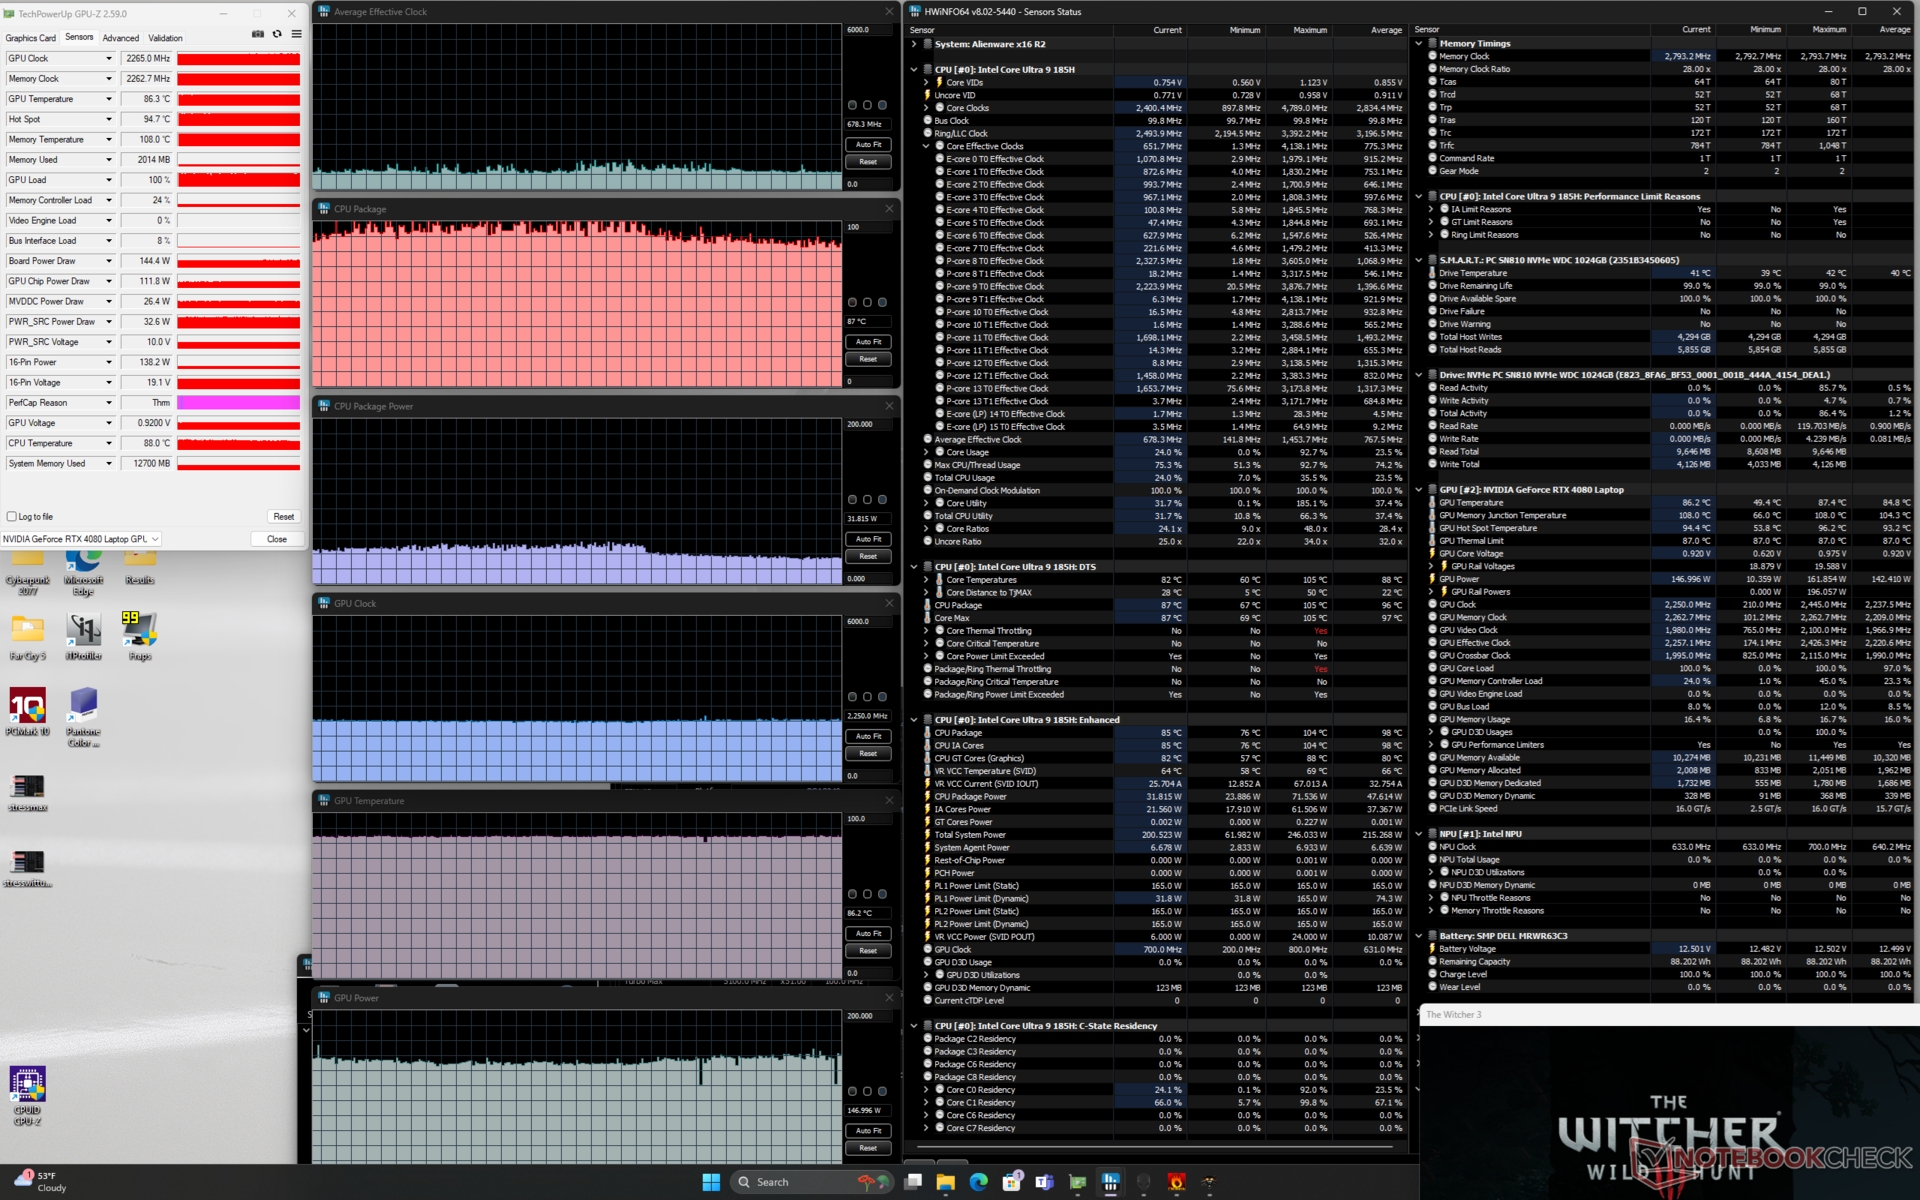
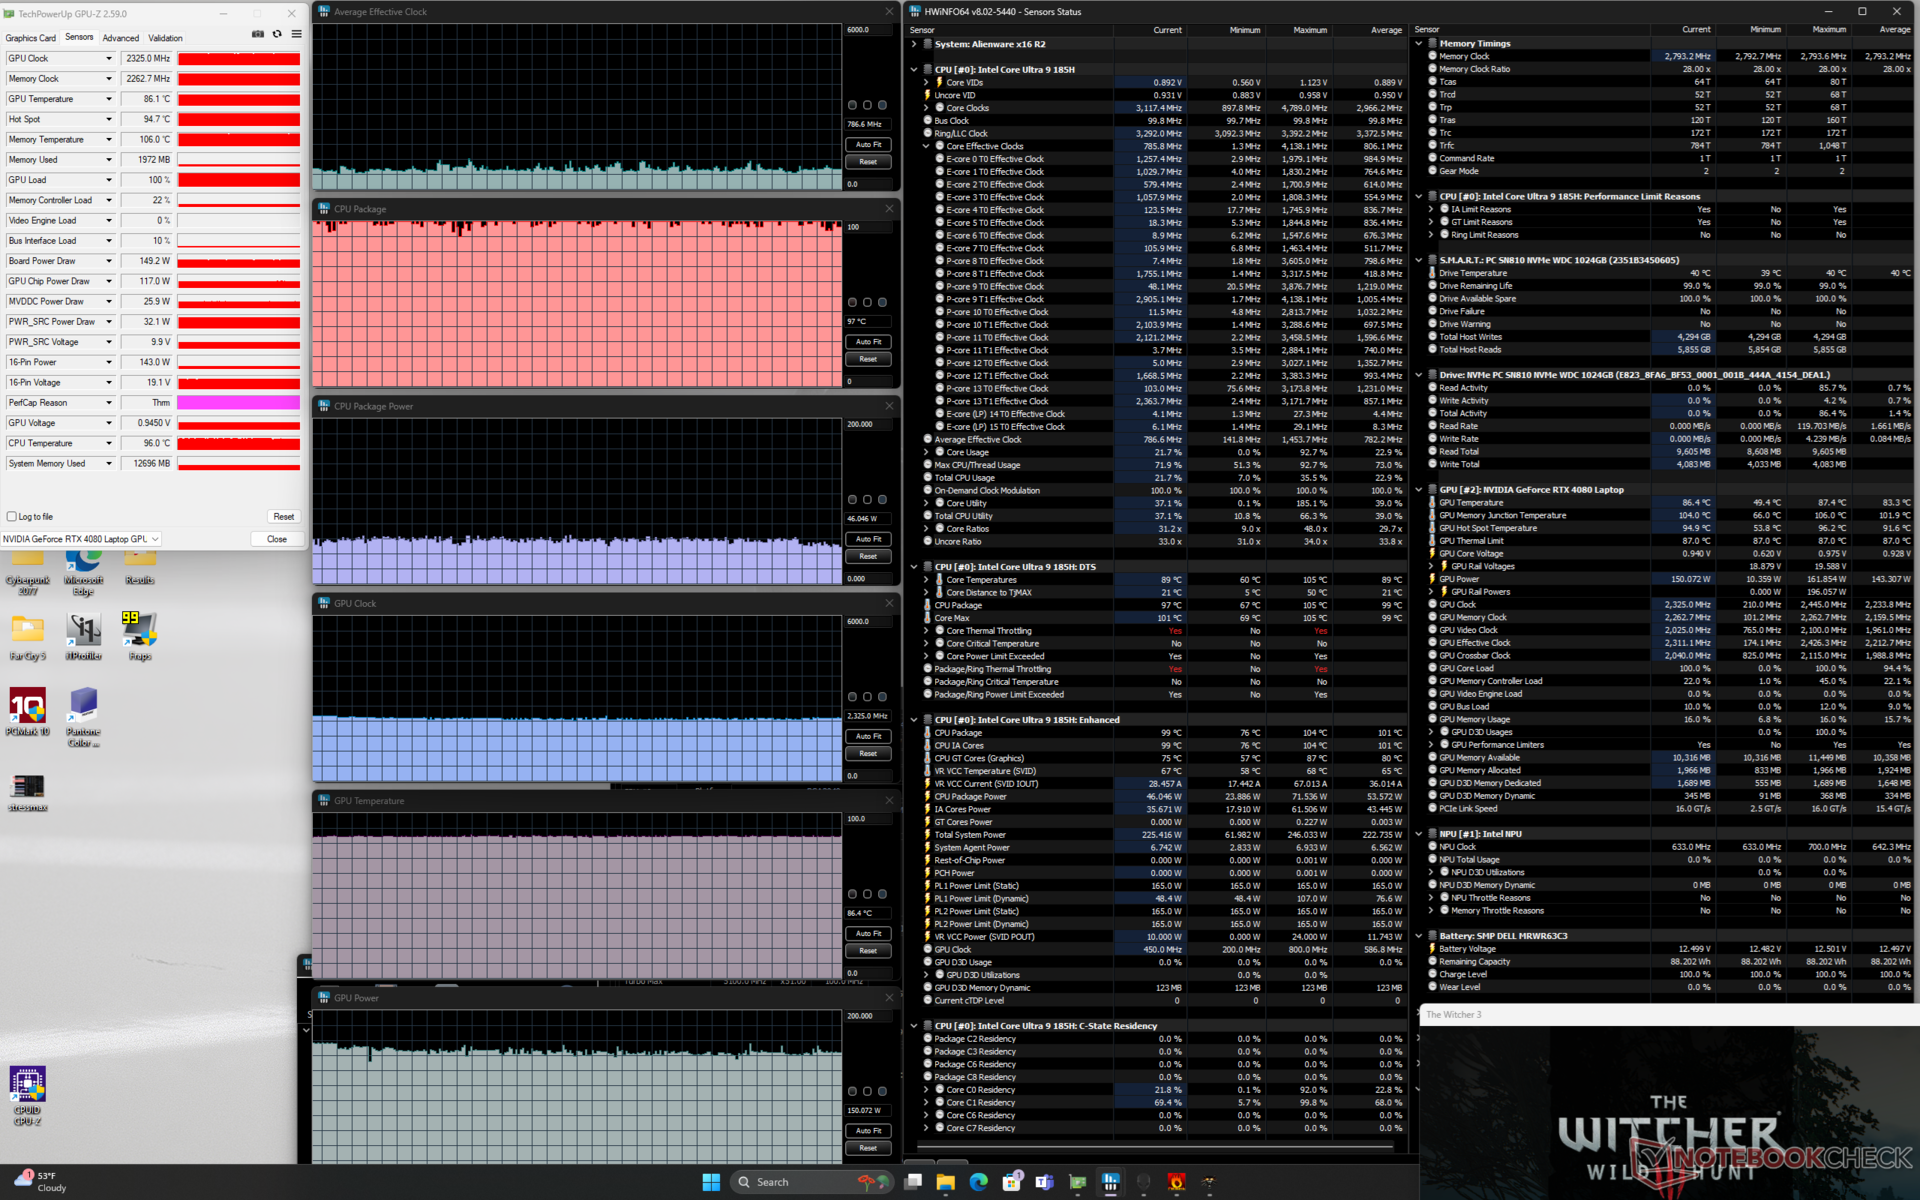
| Clock medio della CPU (GHz) | Clock della GPU (MHz) | Temperatura media della CPU (°C) | Temperatura media della GPU (°C) | |
| Sistema inattivo | -- | -- | 38 | 31 |
| Stress Prime95 | 3,2 | -- | 101 | 50 |
| Prime95 + FurMark Stress | 2,2 | 2175 | 99 | 82 |
| Witcher 3 Stress (modalità bilanciata) | 0,7 | 2100 | 99 | 86 |
| Witcher 3 Stress (modalità Performance) | 0,7 | 2250 | 87 | 86 |
| Witcher 3 Stress (modalità Overdrive) | 0,8 | 2325 | 97 | 86 |
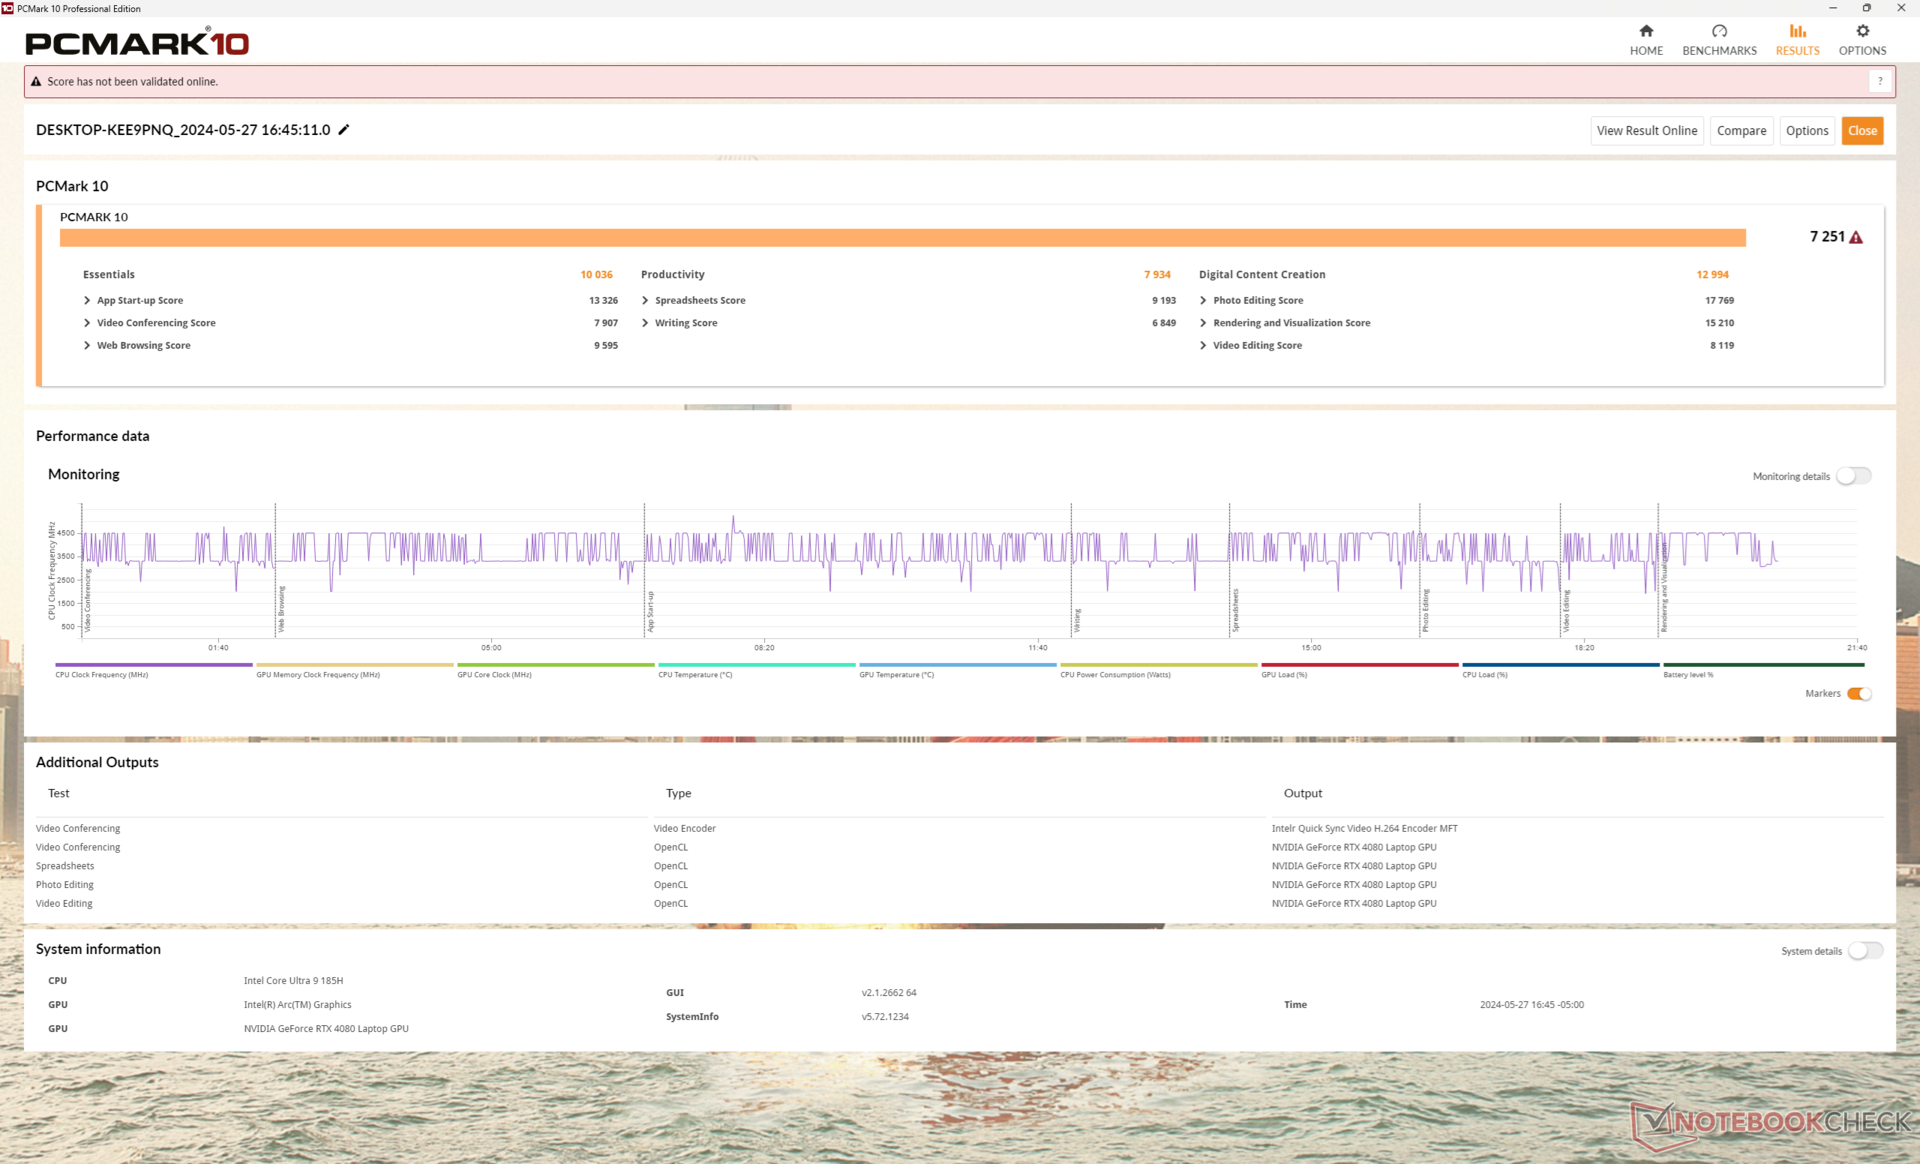
Prestazioni del sistema
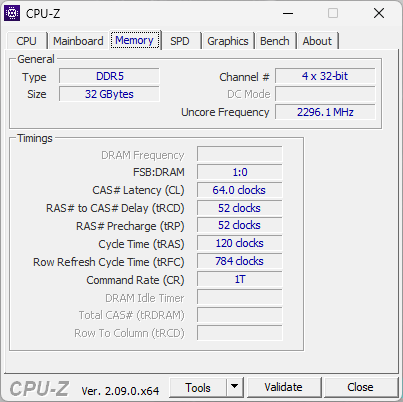
I risultati di PCMark sono circa gli stessi, se non inferiori, rispetto al passato. Nel frattempo, la RAM è leggermente più veloce quest'anno (7467 MT/s contro 6000 MT/s) per risultati di copia/lettura AIDA64 leggermente superiori, ma risultati di scrittura e latenza più lenti.
CrossMark: Overall | Productivity | Creativity | Responsiveness
WebXPRT 3: Overall
WebXPRT 4: Overall
Mozilla Kraken 1.1: Total
| PCMark 10 / Score | |
| Lenovo Legion Pro 7 16IRX9H | |
| MSI Vector 16 HX A14V | |
| Alienware x16 R1 | |
| Alienware m16 R2 | |
| Asus ROG Strix Scar 16 G634JZR | |
| Alienware x16 R2 P120F | |
| Media Intel Core Ultra 9 185H, NVIDIA GeForce RTX 4080 Laptop GPU (n=1) | |
| PCMark 10 / Essentials | |
| Lenovo Legion Pro 7 16IRX9H | |
| Asus ROG Strix Scar 16 G634JZR | |
| MSI Vector 16 HX A14V | |
| Alienware x16 R1 | |
| Alienware m16 R2 | |
| Alienware x16 R2 P120F | |
| Media Intel Core Ultra 9 185H, NVIDIA GeForce RTX 4080 Laptop GPU (n=1) | |
| PCMark 10 / Productivity | |
| Lenovo Legion Pro 7 16IRX9H | |
| Alienware x16 R1 | |
| MSI Vector 16 HX A14V | |
| Alienware m16 R2 | |
| Alienware x16 R2 P120F | |
| Media Intel Core Ultra 9 185H, NVIDIA GeForce RTX 4080 Laptop GPU (n=1) | |
| Asus ROG Strix Scar 16 G634JZR | |
| PCMark 10 / Digital Content Creation | |
| Asus ROG Strix Scar 16 G634JZR | |
| MSI Vector 16 HX A14V | |
| Lenovo Legion Pro 7 16IRX9H | |
| Alienware x16 R1 | |
| Alienware m16 R2 | |
| Alienware x16 R2 P120F | |
| Media Intel Core Ultra 9 185H, NVIDIA GeForce RTX 4080 Laptop GPU (n=1) | |
| CrossMark / Overall | |
| Lenovo Legion Pro 7 16IRX9H | |
| MSI Vector 16 HX A14V | |
| Asus ROG Strix Scar 16 G634JZR | |
| Alienware x16 R1 | |
| Alienware m16 R2 | |
| Alienware x16 R2 P120F | |
| Media Intel Core Ultra 9 185H, NVIDIA GeForce RTX 4080 Laptop GPU (n=1) | |
| CrossMark / Productivity | |
| Lenovo Legion Pro 7 16IRX9H | |
| MSI Vector 16 HX A14V | |
| Asus ROG Strix Scar 16 G634JZR | |
| Alienware x16 R1 | |
| Alienware m16 R2 | |
| Alienware x16 R2 P120F | |
| Media Intel Core Ultra 9 185H, NVIDIA GeForce RTX 4080 Laptop GPU (n=1) | |
| CrossMark / Creativity | |
| Lenovo Legion Pro 7 16IRX9H | |
| MSI Vector 16 HX A14V | |
| Asus ROG Strix Scar 16 G634JZR | |
| Alienware x16 R1 | |
| Alienware m16 R2 | |
| Alienware x16 R2 P120F | |
| Media Intel Core Ultra 9 185H, NVIDIA GeForce RTX 4080 Laptop GPU (n=1) | |
| CrossMark / Responsiveness | |
| Lenovo Legion Pro 7 16IRX9H | |
| MSI Vector 16 HX A14V | |
| Alienware x16 R1 | |
| Asus ROG Strix Scar 16 G634JZR | |
| Alienware x16 R2 P120F | |
| Media Intel Core Ultra 9 185H, NVIDIA GeForce RTX 4080 Laptop GPU (n=1) | |
| Alienware m16 R2 | |
| WebXPRT 3 / Overall | |
| Lenovo Legion Pro 7 16IRX9H | |
| MSI Vector 16 HX A14V | |
| Asus ROG Strix Scar 16 G634JZR | |
| Alienware x16 R1 | |
| Alienware m16 R2 | |
| Alienware x16 R2 P120F | |
| Media Intel Core Ultra 9 185H, NVIDIA GeForce RTX 4080 Laptop GPU (n=1) | |
| WebXPRT 4 / Overall | |
| Lenovo Legion Pro 7 16IRX9H | |
| Asus ROG Strix Scar 16 G634JZR | |
| MSI Vector 16 HX A14V | |
| Alienware x16 R1 | |
| Alienware m16 R2 | |
| Alienware x16 R2 P120F | |
| Media Intel Core Ultra 9 185H, NVIDIA GeForce RTX 4080 Laptop GPU (n=1) | |
| Mozilla Kraken 1.1 / Total | |
| Alienware x16 R2 P120F | |
| Media Intel Core Ultra 9 185H, NVIDIA GeForce RTX 4080 Laptop GPU (n=1) | |
| Alienware m16 R2 | |
| Alienware x16 R1 | |
| MSI Vector 16 HX A14V | |
| Asus ROG Strix Scar 16 G634JZR | |
| Lenovo Legion Pro 7 16IRX9H | |
* ... Meglio usare valori piccoli
| PCMark 10 Score | 7251 punti | |
Aiuto | ||
| AIDA64 / Memory Copy | |
| Alienware x16 R2 P120F | |
| Media Intel Core Ultra 9 185H (69929 - 95718, n=19) | |
| Asus ROG Strix Scar 16 G634JZR | |
| Lenovo Legion Pro 7 16IRX9H | |
| MSI Vector 16 HX A14V | |
| Alienware x16 R1 | |
| Alienware m16 R2 | |
| AIDA64 / Memory Read | |
| Asus ROG Strix Scar 16 G634JZR | |
| Lenovo Legion Pro 7 16IRX9H | |
| MSI Vector 16 HX A14V | |
| Alienware x16 R2 P120F | |
| Media Intel Core Ultra 9 185H (64619 - 87768, n=19) | |
| Alienware m16 R2 | |
| Alienware x16 R1 | |
| AIDA64 / Memory Write | |
| Alienware x16 R1 | |
| Asus ROG Strix Scar 16 G634JZR | |
| MSI Vector 16 HX A14V | |
| Alienware x16 R2 P120F | |
| Media Intel Core Ultra 9 185H (51114 - 93871, n=19) | |
| Lenovo Legion Pro 7 16IRX9H | |
| Alienware m16 R2 | |
| AIDA64 / Memory Latency | |
| Media Intel Core Ultra 9 185H (121.4 - 259, n=19) | |
| Alienware x16 R2 P120F | |
| Alienware m16 R2 | |
| Alienware x16 R1 | |
| MSI Vector 16 HX A14V | |
| Asus ROG Strix Scar 16 G634JZR | |
| Lenovo Legion Pro 7 16IRX9H | |
* ... Meglio usare valori piccoli
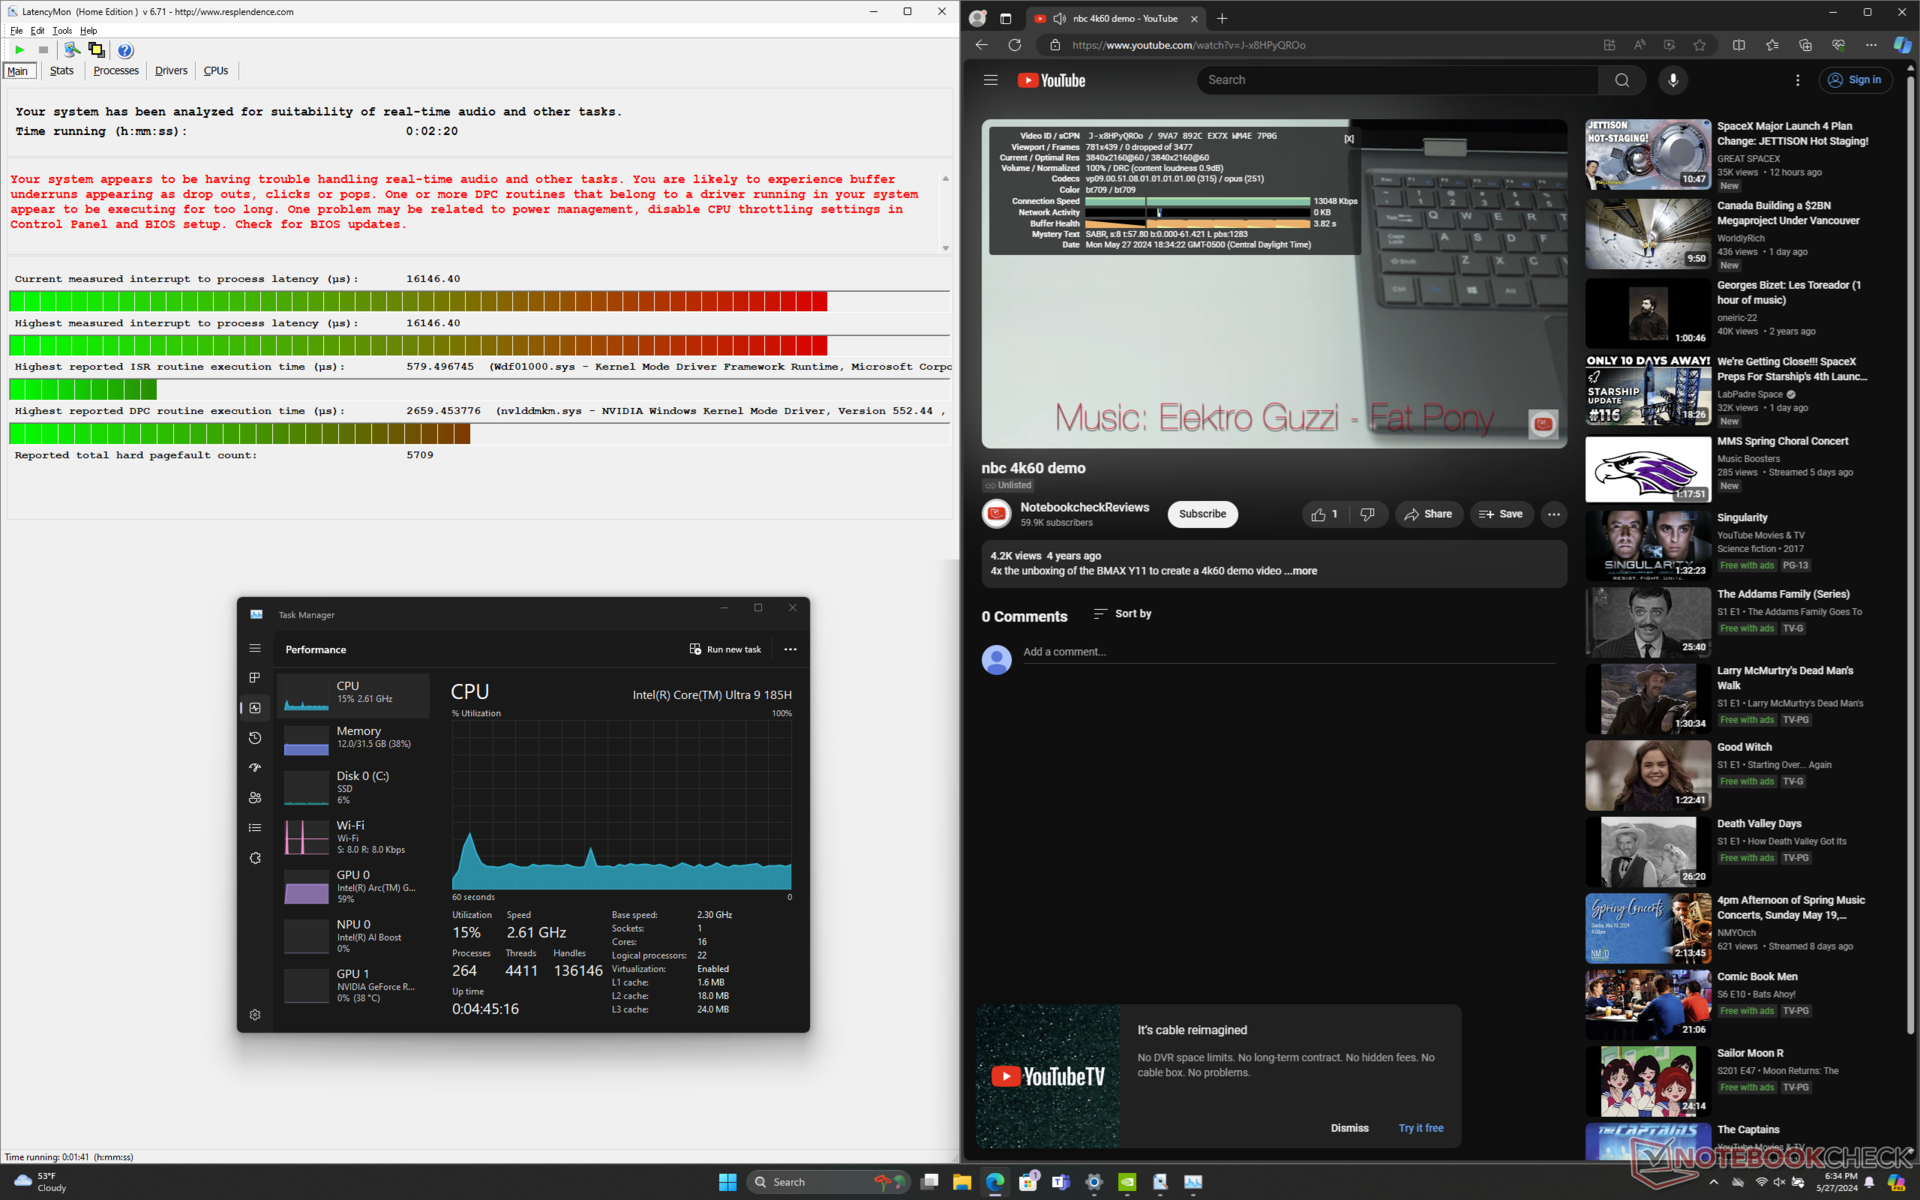
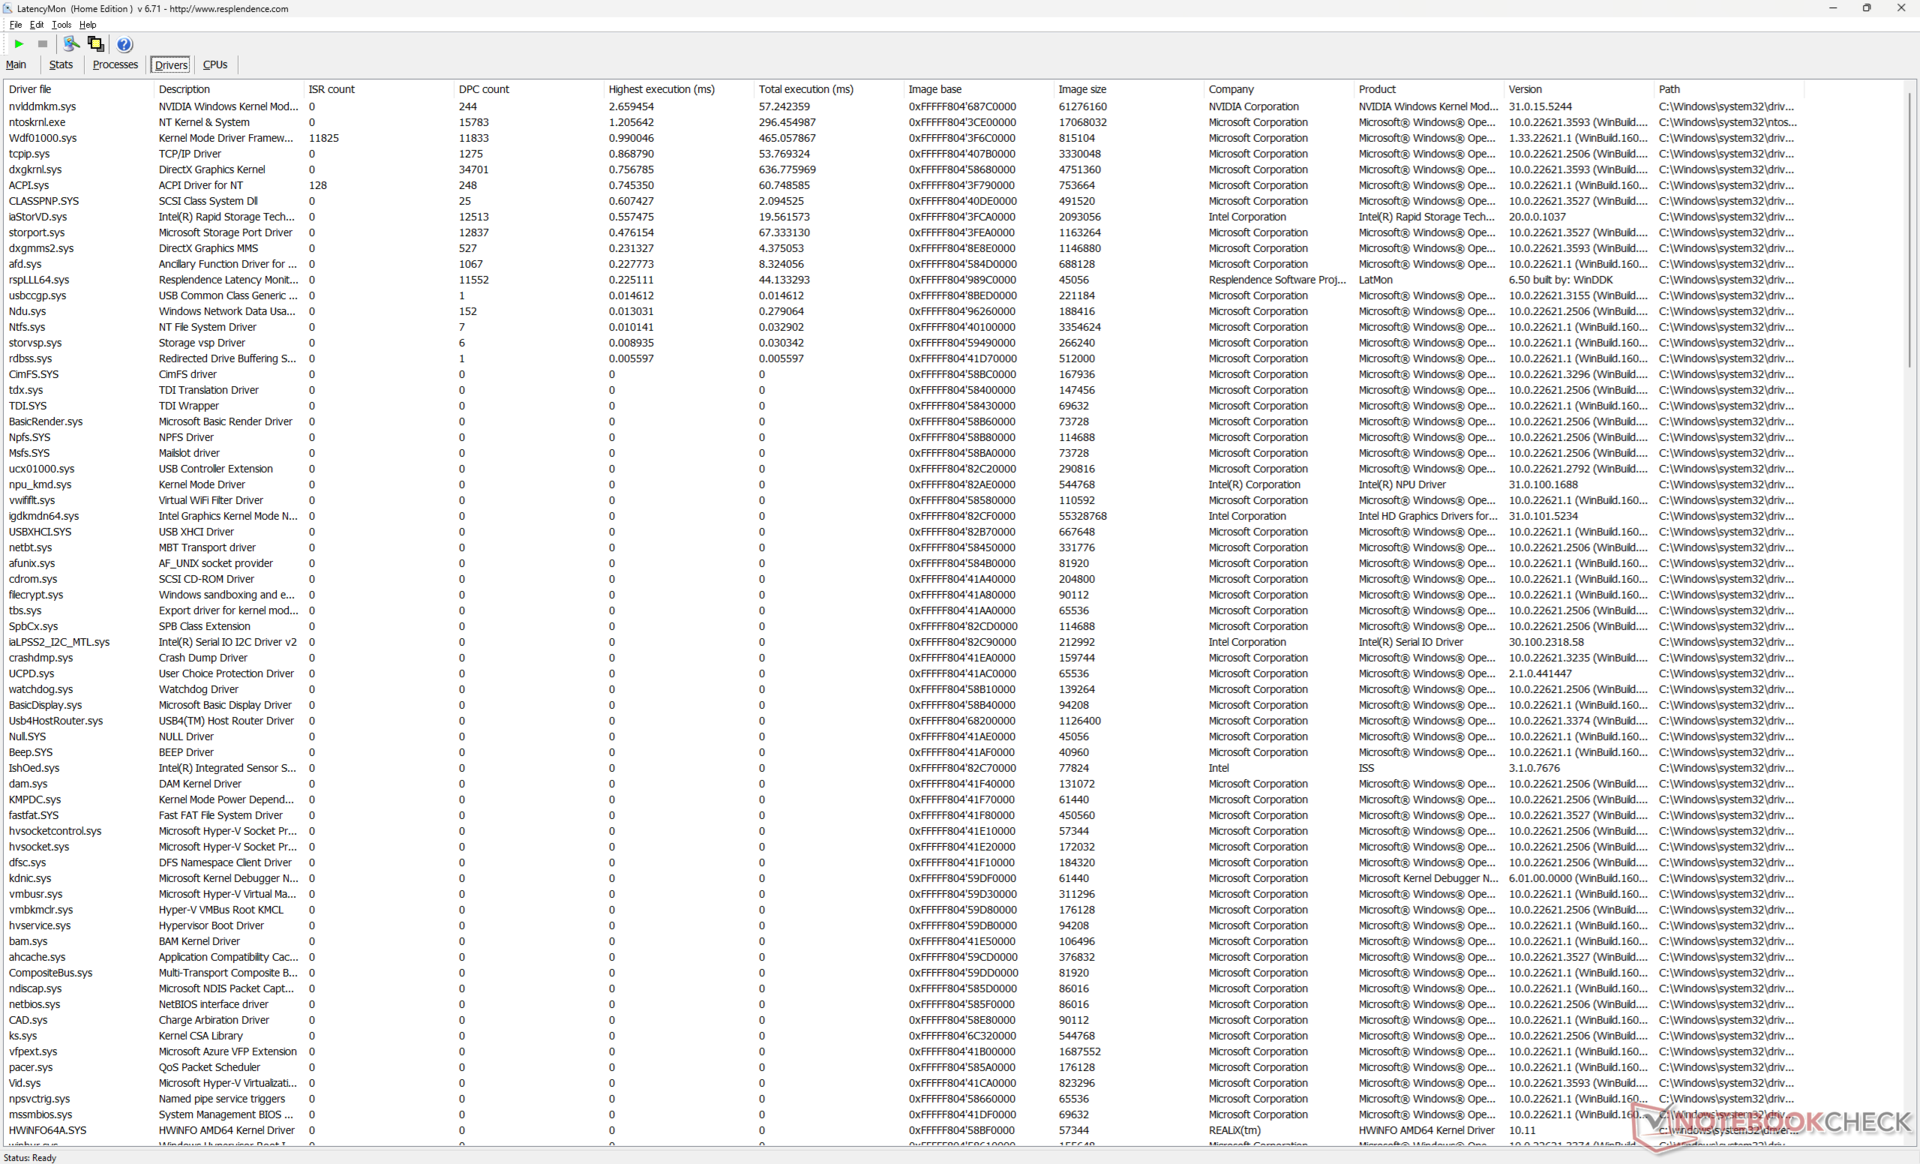
Latenza DPC
LatencyMon rivela notevoli problemi di DPC quando si aprono più schede del browser della nostra homepage, anche dopo vari tentativi in modalità Optimus. Non abbiamo riscontrato tali problemi con l'R1 x16 originale. la riproduzione di video 4K a 60 FPS è perfetta, senza alcuna perdita di fotogrammi.
| DPC Latencies / LatencyMon - interrupt to process latency (max), Web, Youtube, Prime95 | |
| Alienware x16 R2 P120F | |
| Asus ROG Strix Scar 16 G634JZR | |
| Alienware m16 R2 | |
| MSI Vector 16 HX A14V | |
| Alienware x16 R1 | |
| Lenovo Legion Pro 7 16IRX9H | |
* ... Meglio usare valori piccoli
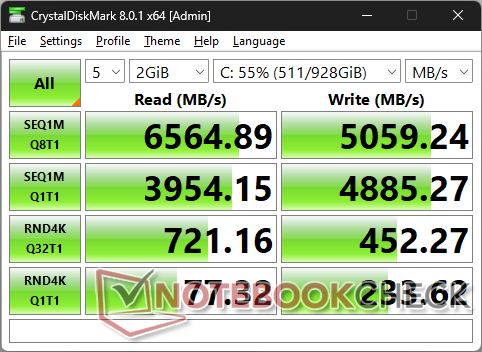
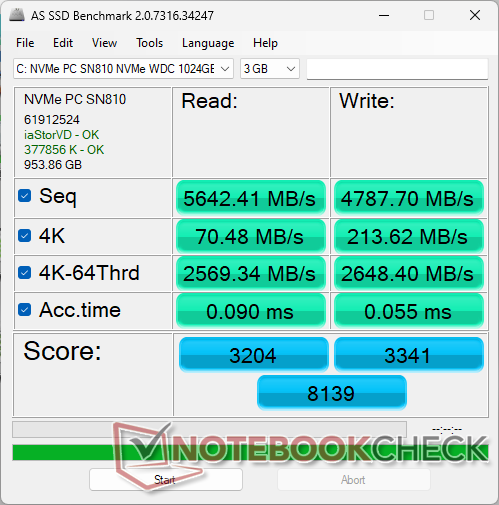
Dispositivi di archiviazione
La nostra unità di prova viene fornita con il WDC PC SN810 invece del modello SK Hynix PC801 dello scorso anno. L'unità Western Digital è in grado di sostenere le velocità di trasferimento massime più a lungo rispetto a SK Hynix, come mostra il nostro grafico DiskSpd loop qui sotto, ma le velocità di scrittura sono generalmente più lente.

| Drive Performance Rating - Percent | |
| Lenovo Legion Pro 7 16IRX9H | |
| Alienware x16 R1 | |
| Alienware x16 R2 P120F | |
| Alienware m16 R2 | |
| Asus ROG Strix Scar 16 G634JZR | |
| MSI Vector 16 HX A14V | |
* ... Meglio usare valori piccoli
Disk Throttling: DiskSpd Read Loop, Queue Depth 8
Prestazioni della GPU
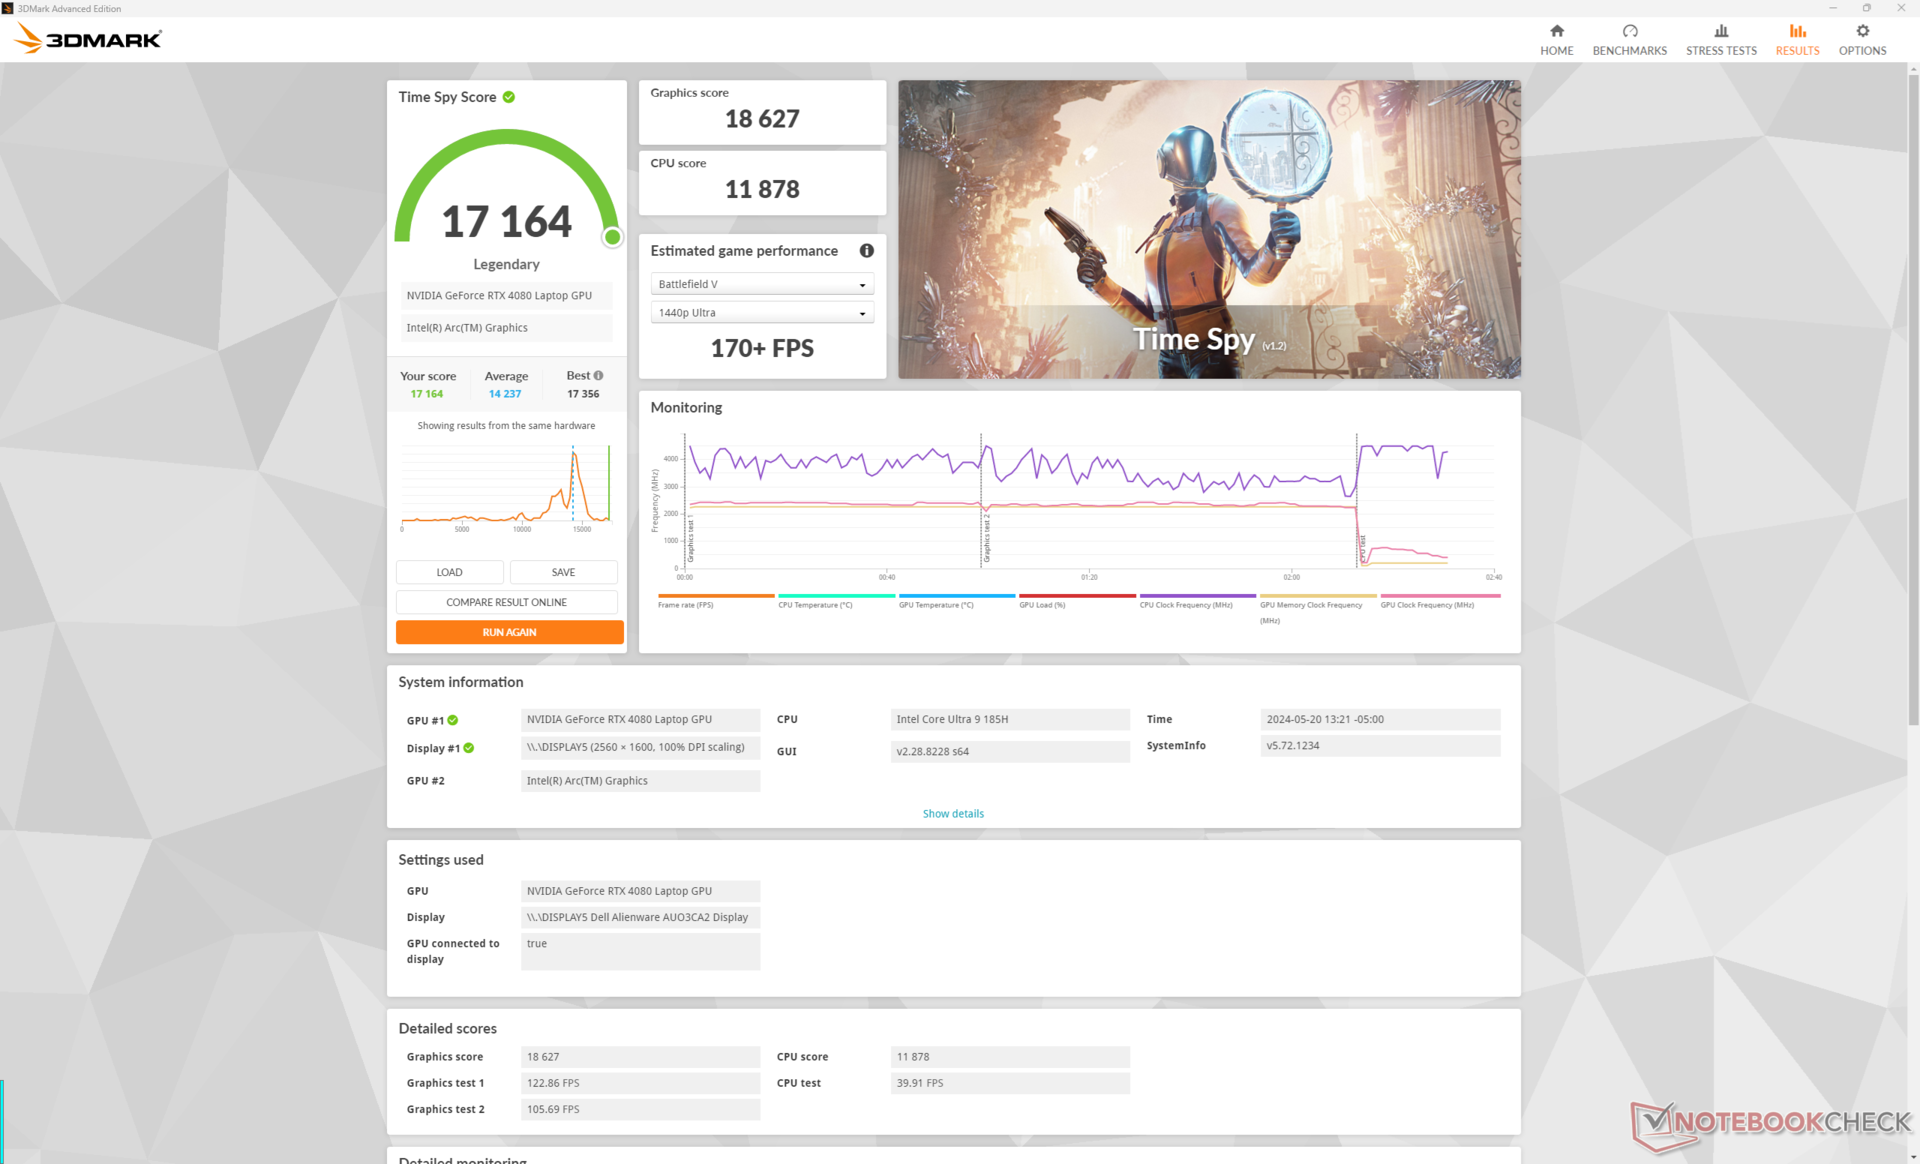
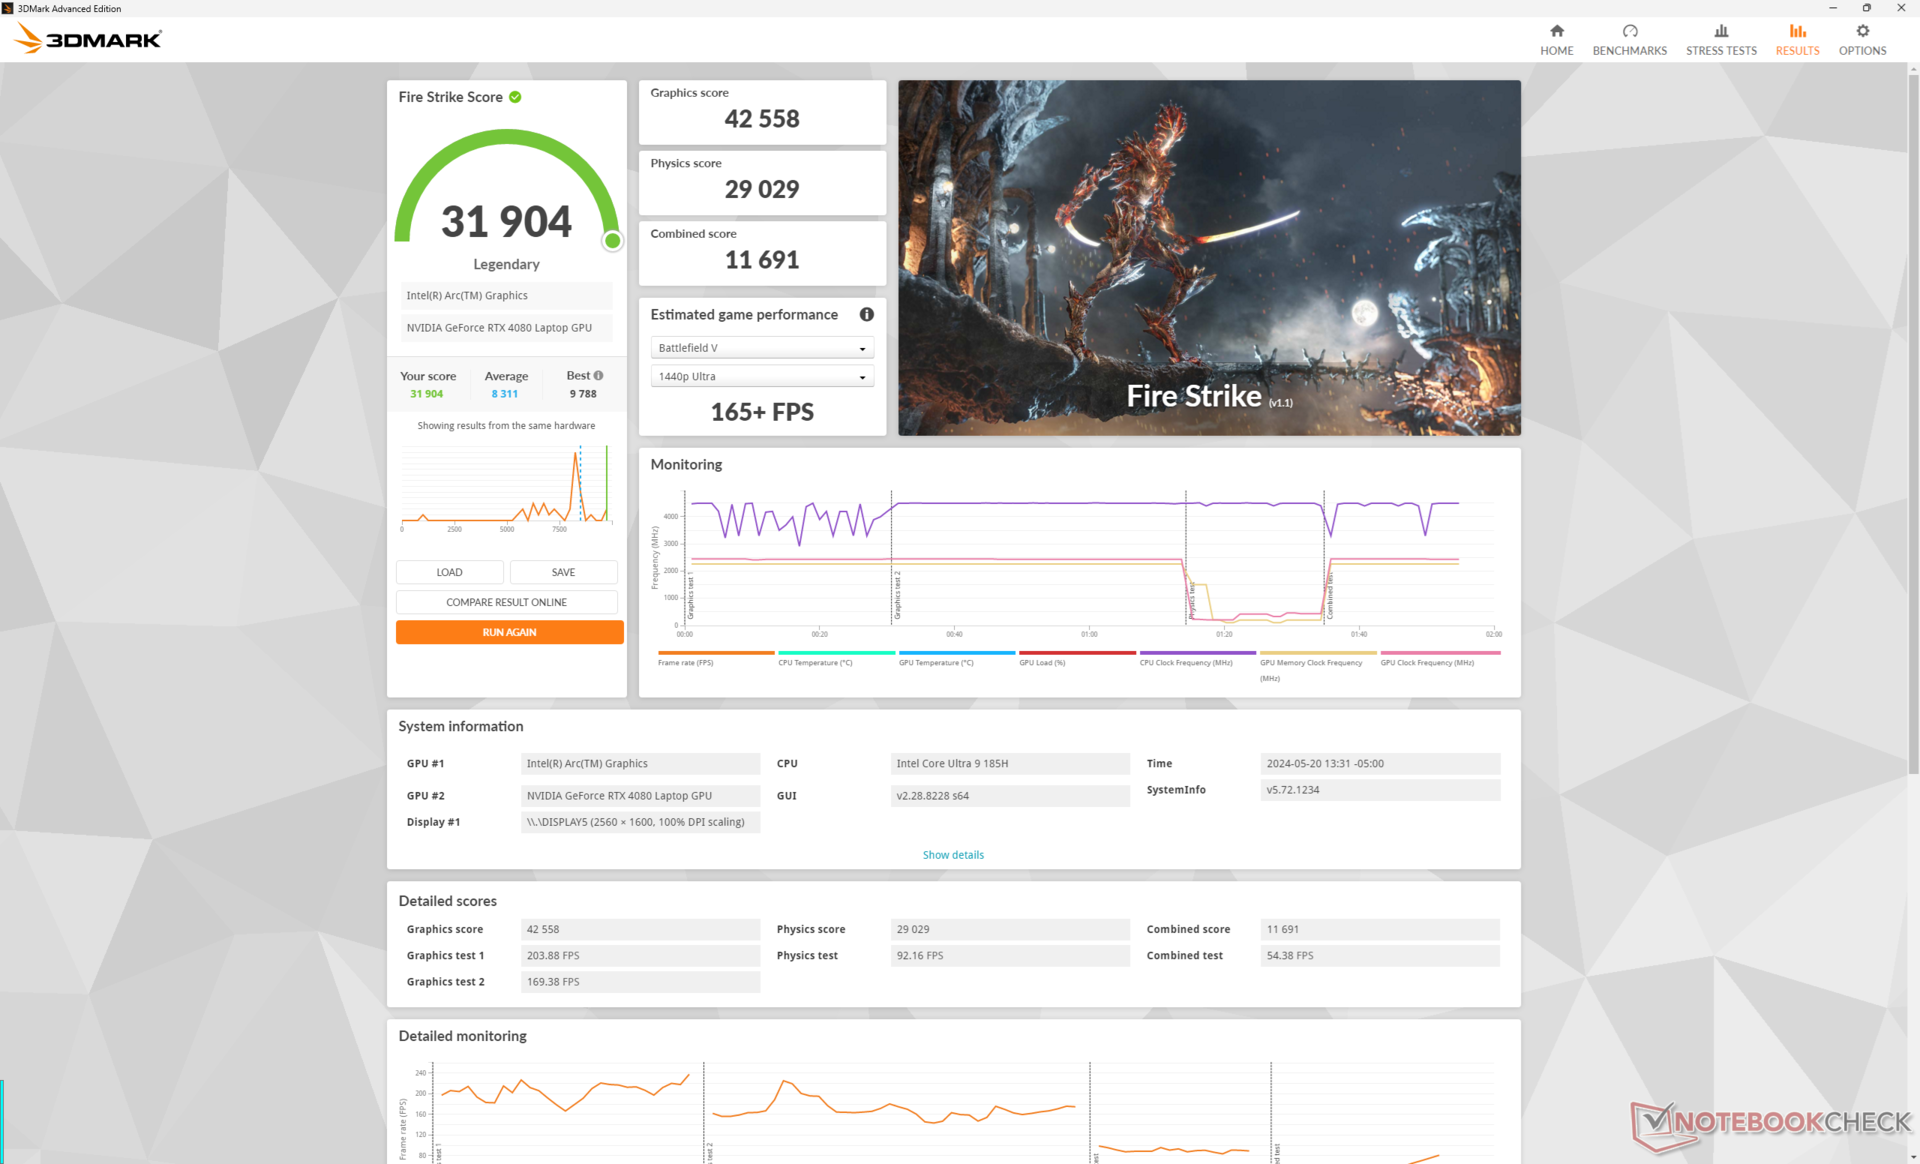
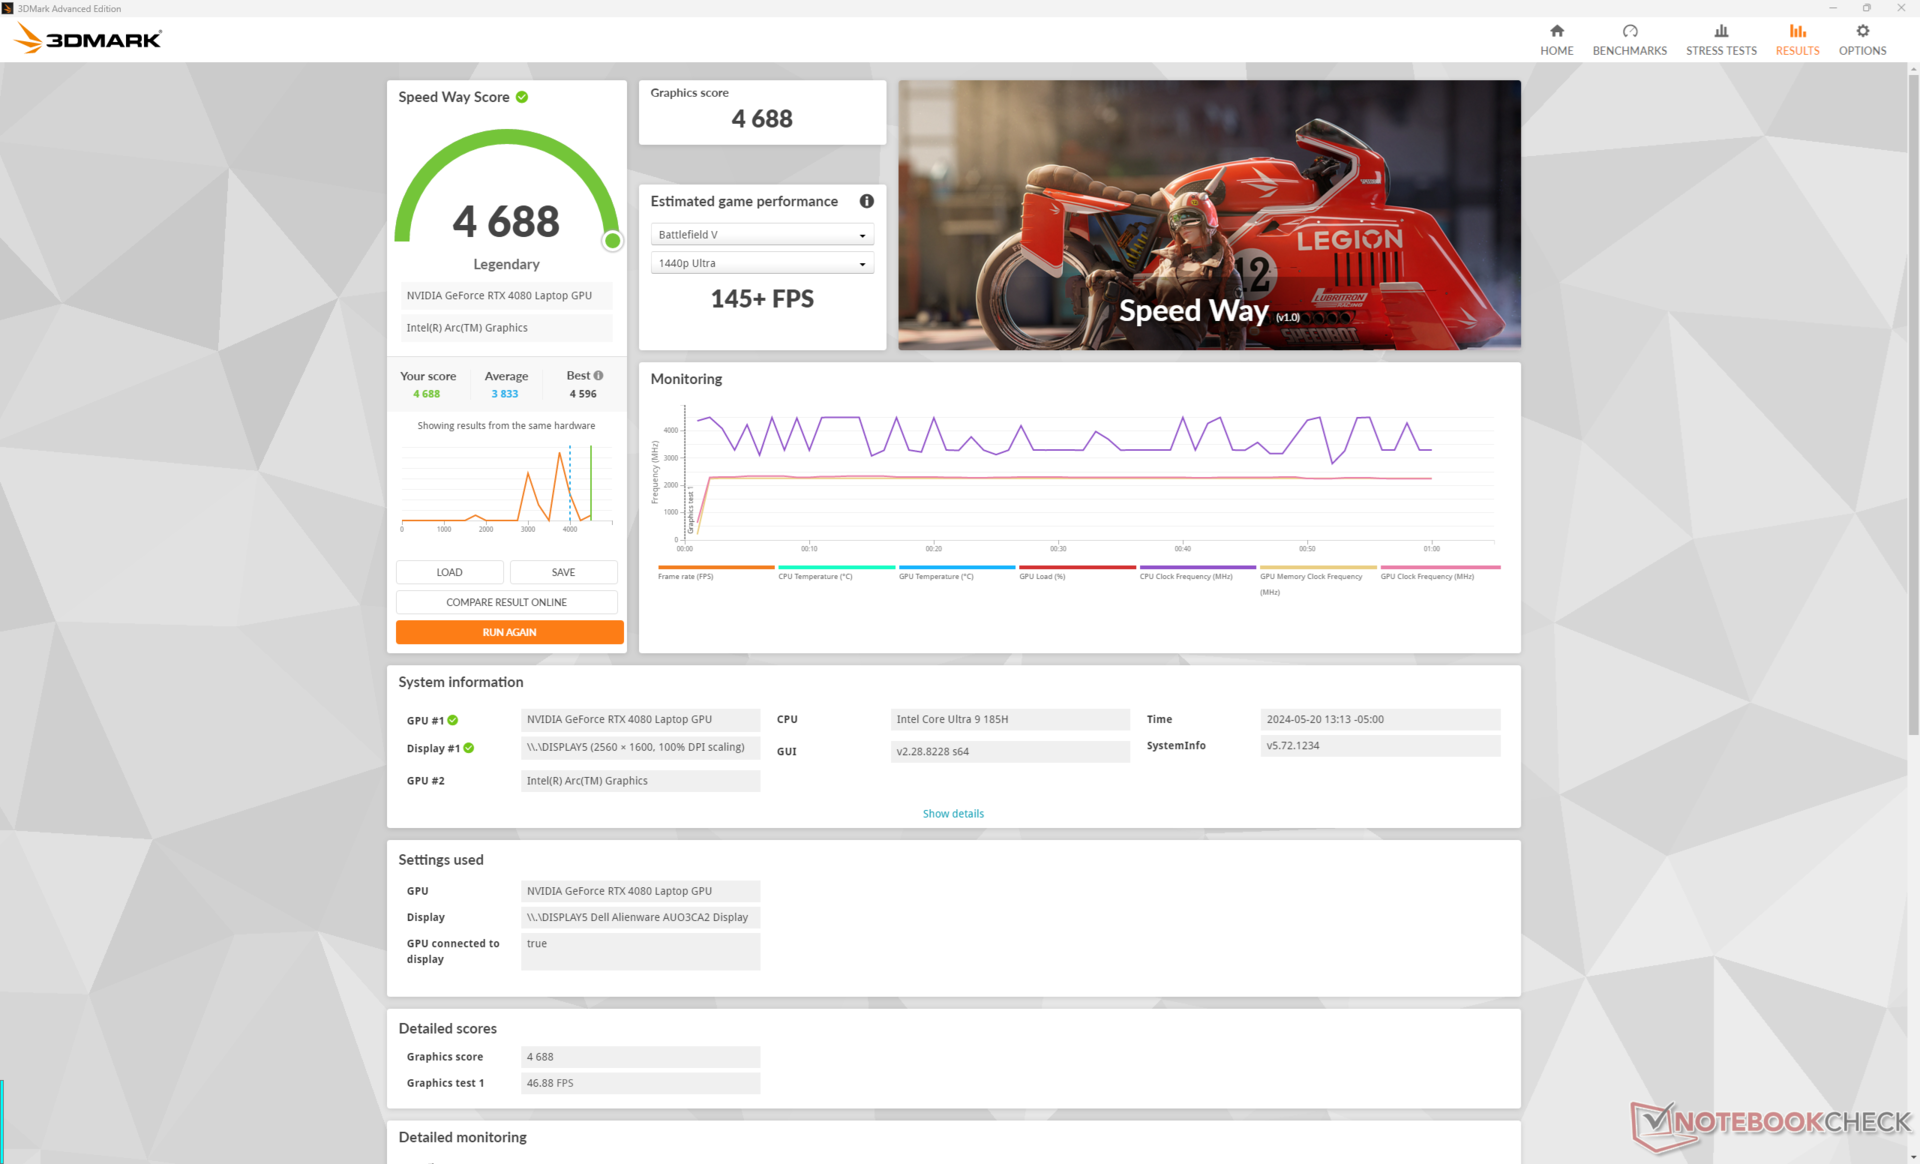
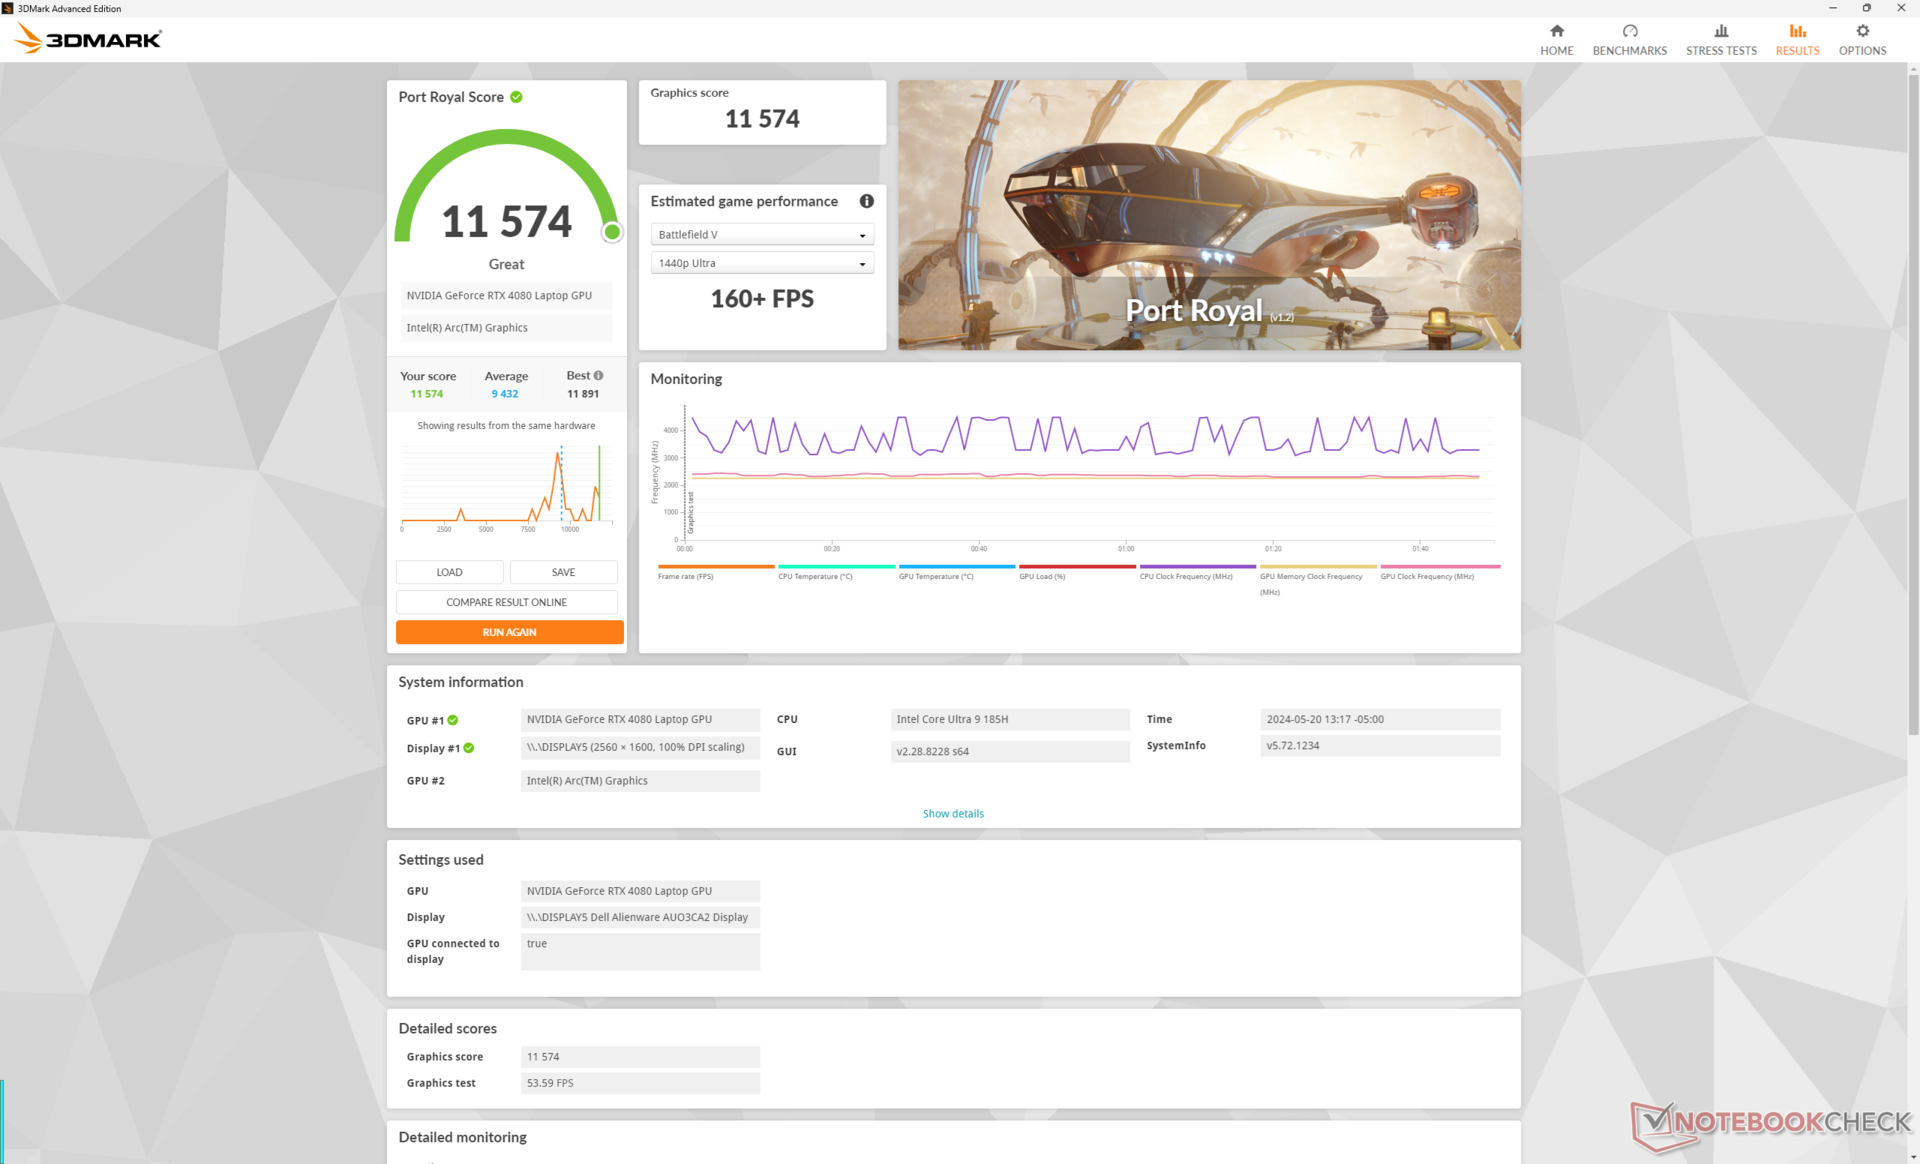
La 175 W mobile GeForce RTX 4080 Rimane la stessa, anche se con punteggi 3DMark più lenti di circa il 5 percento rispetto a quelli registrati su x16 R1. L'aggiornamento alla RTX 4090 dovrebbe migliorare le prestazioni di appena il 5-15 percento, mentre il downgrade alla GPU RTX 4070 o 4060 ridurrà le prestazioni rispettivamente del 30 e del 45 percento.
| Profilo di potenza | Punteggio grafico | Punteggio Fisica | Punteggio combinato |
| Modalità Overdrive | 42558 | 29029 | 11691 |
| Modalità Performance | 40773 (-4%) | 26070 (-10%) | 12450 (-7%) |
| Modalità Bilanciata | 40593 (-5%) | 26746 (-8%) | 12237 (-5%) |
| Alimentazione a batteria | 21754 (-49%) | 25880 (-11%) | 9863 (-16%) |
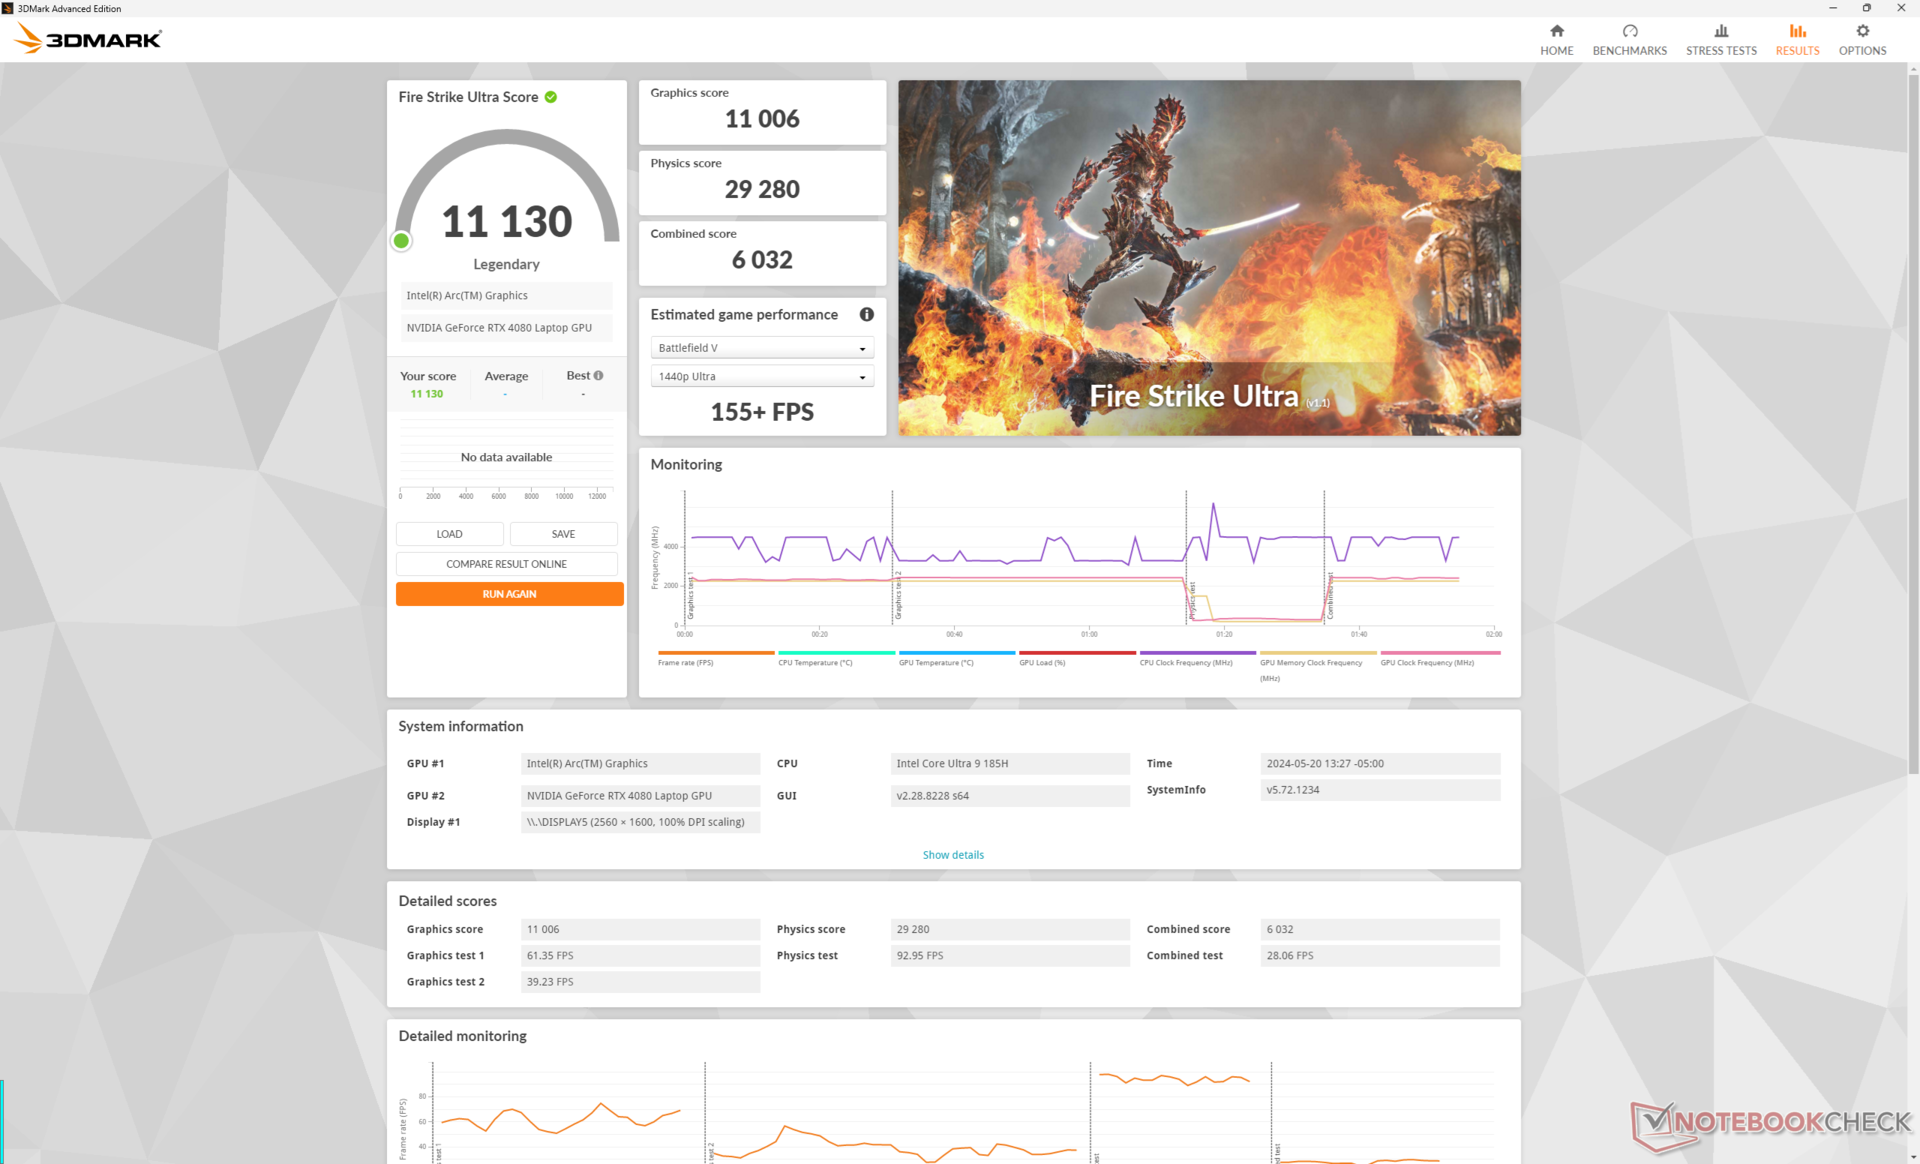
L'esecuzione del sistema in modalità Performance invece che in modalità Overdrive avrà un impatto sulle prestazioni complessive, come mostra la tabella dei risultati di Fire Strike qui sopra. È interessante notare che la differenza tra le modalità Prestazioni e Bilanciato è relativamente molto più piccola.
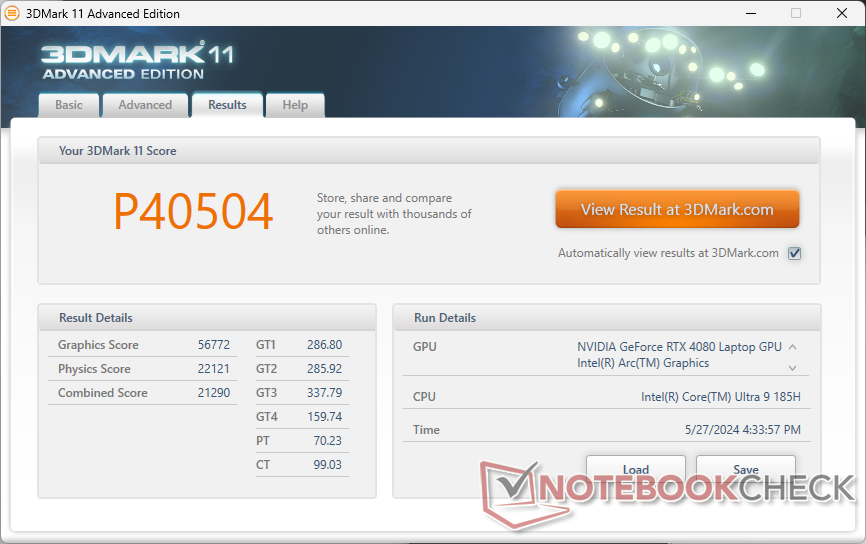
| 3DMark 11 Performance | 40504 punti | |
| 3DMark Fire Strike Score | 31904 punti | |
| 3DMark Time Spy Score | 17164 punti | |
Aiuto | ||
* ... Meglio usare valori piccoli
Prestazioni di gioco
Deludentemente, le prestazioni nei giochi sono risultate costantemente più lente rispetto a quelle registrate su x16 R1 di circa il 5-15 percento. I delta più ampi si sarebbero verificati a risoluzioni più basse, mentre i delta più piccoli si sarebbero verificati a risoluzioni più alte, il che è coerente con i risultati più lenti delle prestazioni grezze della CPU rispetto al Core i9-14900HK, come abbiamo notato sopra.
| Baldur's Gate 3 | |
| 1920x1080 Ultra Preset | |
| Alienware x16 R2 P120F | |
| Media NVIDIA GeForce RTX 4080 Laptop GPU (111.8 - 181.2, n=6) | |
| Alienware m16 R2 | |
| Framework Laptop 16 | |
| 2560x1440 Ultra Preset | |
| Alienware x16 R2 P120F | |
| Media NVIDIA GeForce RTX 4080 Laptop GPU (88.3 - 129.3, n=6) | |
| Alienware m16 R2 | |
| Framework Laptop 16 | |
| 3840x2160 Ultra Preset | |
| Alienware x16 R2 P120F | |
| Media NVIDIA GeForce RTX 4080 Laptop GPU (48.8 - 68.4, n=4) | |
| Alienware m16 R2 | |
| Framework Laptop 16 | |
| 3840x2160 Ultra Preset + Quality DLSS | |
| Alienware x16 R2 P120F | |
| Media NVIDIA GeForce RTX 4080 Laptop GPU (90.9 - 104.4, n=2) | |
| Cyberpunk 2077 2.2 Phantom Liberty | |
| 1920x1080 Ultra Preset (FSR off) | |
| Media NVIDIA GeForce RTX 4080 Laptop GPU (83.9 - 127.1, n=13) | |
| Alienware x16 R2 P120F | |
| Alienware m16 R2 | |
| Framework Laptop 16 | |
| 2560x1440 Ultra Preset (FSR off) | |
| Media NVIDIA GeForce RTX 4080 Laptop GPU (56.2 - 86.3, n=17) | |
| Alienware x16 R2 P120F | |
| Alienware m16 R2 | |
| Framework Laptop 16 | |
| 3840x2160 Ultra Preset (FSR off) | |
| Media NVIDIA GeForce RTX 4080 Laptop GPU (25.8 - 39.8, n=7) | |
| Alienware x16 R2 P120F | |
| Alienware m16 R2 | |
| Framework Laptop 16 | |
| 1920x1080 Ray Tracing Ultra Preset (DLSS off) | |
| Alienware x16 R2 P120F | |
| Media NVIDIA GeForce RTX 4080 Laptop GPU (43.8 - 67.2, n=12) | |
| Alienware m16 R2 | |
| Framework Laptop 16 | |
| 3840x2160 Ray Tracing Ultra Preset (DLSS off, no Path Tracing) | |
| Media NVIDIA GeForce RTX 4080 Laptop GPU (16 - 20, n=4) | |
| Alienware x16 R2 P120F | |
| Alienware m16 R2 | |
Witcher 3 FPS Chart
| basso | medio | alto | ultra | QHD | 4K DLSS | 4K | |
|---|---|---|---|---|---|---|---|
| The Witcher 3 (2015) | 364.4 | 340.7 | 292.1 | 166.3 | 118.5 | ||
| Dota 2 Reborn (2015) | 155.7 | 142 | 139.2 | 133 | 127.9 | ||
| Final Fantasy XV Benchmark (2018) | 188 | 169.3 | 139.8 | 120.8 | 70.2 | ||
| X-Plane 11.11 (2018) | 134 | 117.4 | 89.3 | 78 | |||
| Far Cry 5 (2018) | 137 | 127 | 122 | 114 | 114 | 91 | |
| Strange Brigade (2018) | 427 | 336 | 317 | 293 | 226 | 112.9 | |
| Tiny Tina's Wonderlands (2022) | 220.8 | 199.6 | 166.7 | 144.5 | 99 | 50.1 | |
| F1 22 (2022) | 219 | 211 | 185.7 | 108.5 | 65.6 | 36.6 | |
| Baldur's Gate 3 (2023) | 186.8 | 172.9 | 161.2 | 159.4 | 124.3 | 104.4 | 65 |
| Cyberpunk 2077 2.2 Phantom Liberty (2023) | 121.5 | 118.7 | 109 | 99.7 | 75.4 | 32.5 |
Emissioni
Rumore del sistema
Le ventole dell'x16 R2 sono in grado di rimanere più silenziose per periodi più lunghi prima di dover aumentare la velocità e il rumore. Per il resto, il limite di rumorosità è simile a quello che abbiamo registrato sull'x16 R1, circa 50 dB(A) e 54 dB(A) quando si gioca in modalità Performance e Overdrive, rispettivamente. Si noti che il rumore della ventola quando si gioca in modalità Bilanciata sarebbe esattamente lo stesso della modalità Prestazioni, il che corrisponde ai risultati del 3DMark di cui sopra.
Rumorosità
| Idle |
| 23.8 / 28.5 / 28.5 dB(A) |
| Sotto carico |
| 28.8 / 54.2 dB(A) |
 | ||
30 dB silenzioso 40 dB(A) udibile 50 dB(A) rumoroso |
||
min: | ||
| Alienware x16 R2 P120F NVIDIA GeForce RTX 4080 Laptop GPU, Ultra 9 185H, WDC PC SN810 1TB | Alienware x16 R1 NVIDIA GeForce RTX 4080 Laptop GPU, i9-13900HK, SK hynix PC801 HFS001TEJ9X101N | Alienware m16 R2 NVIDIA GeForce RTX 4070 Laptop GPU, Ultra 7 155H, Samsung PM9A1 MZVL21T0HCLR | Asus ROG Strix Scar 16 G634JZR NVIDIA GeForce RTX 4080 Laptop GPU, i9-14900HX, SK hynix PC801 HFS002TEJ9X101N | Lenovo Legion Pro 7 16IRX9H NVIDIA GeForce RTX 4080 Laptop GPU, i9-14900HX, SK Hynix HFS001TEJ9X115N | MSI Vector 16 HX A14V NVIDIA GeForce RTX 4080 Laptop GPU, i9-14900HX, WD PC SN560 SDDPNQE-1T00 | |
|---|---|---|---|---|---|---|
| Noise | -2% | -3% | -20% | -22% | -28% | |
| off /ambiente * | 23.4 | 22.7 3% | 24.7 -6% | 21.07 10% | 24 -3% | 23.2 1% |
| Idle Minimum * | 23.8 | 23.1 3% | 25.3 -6% | 29.75 -25% | 25 -5% | 33.5 -41% |
| Idle Average * | 28.5 | 25.8 9% | 25.3 11% | 29.75 -4% | 30 -5% | 33.5 -18% |
| Idle Maximum * | 28.5 | 25.8 9% | 25.3 11% | 29.75 -4% | 45 -58% | 33.5 -18% |
| Load Average * | 28.8 | 39.3 -36% | 31.7 -10% | 54.85 -90% | 50 -74% | 52.1 -81% |
| Witcher 3 ultra * | 49.5 | 49.9 -1% | 53.8 -9% | 57.8 -17% | 54 -9% | 62 -25% |
| Load Maximum * | 54.2 | 54.8 -1% | 62 -14% | 58 -7% | 56 -3% | 62 -14% |
* ... Meglio usare valori piccoli
Temperatura
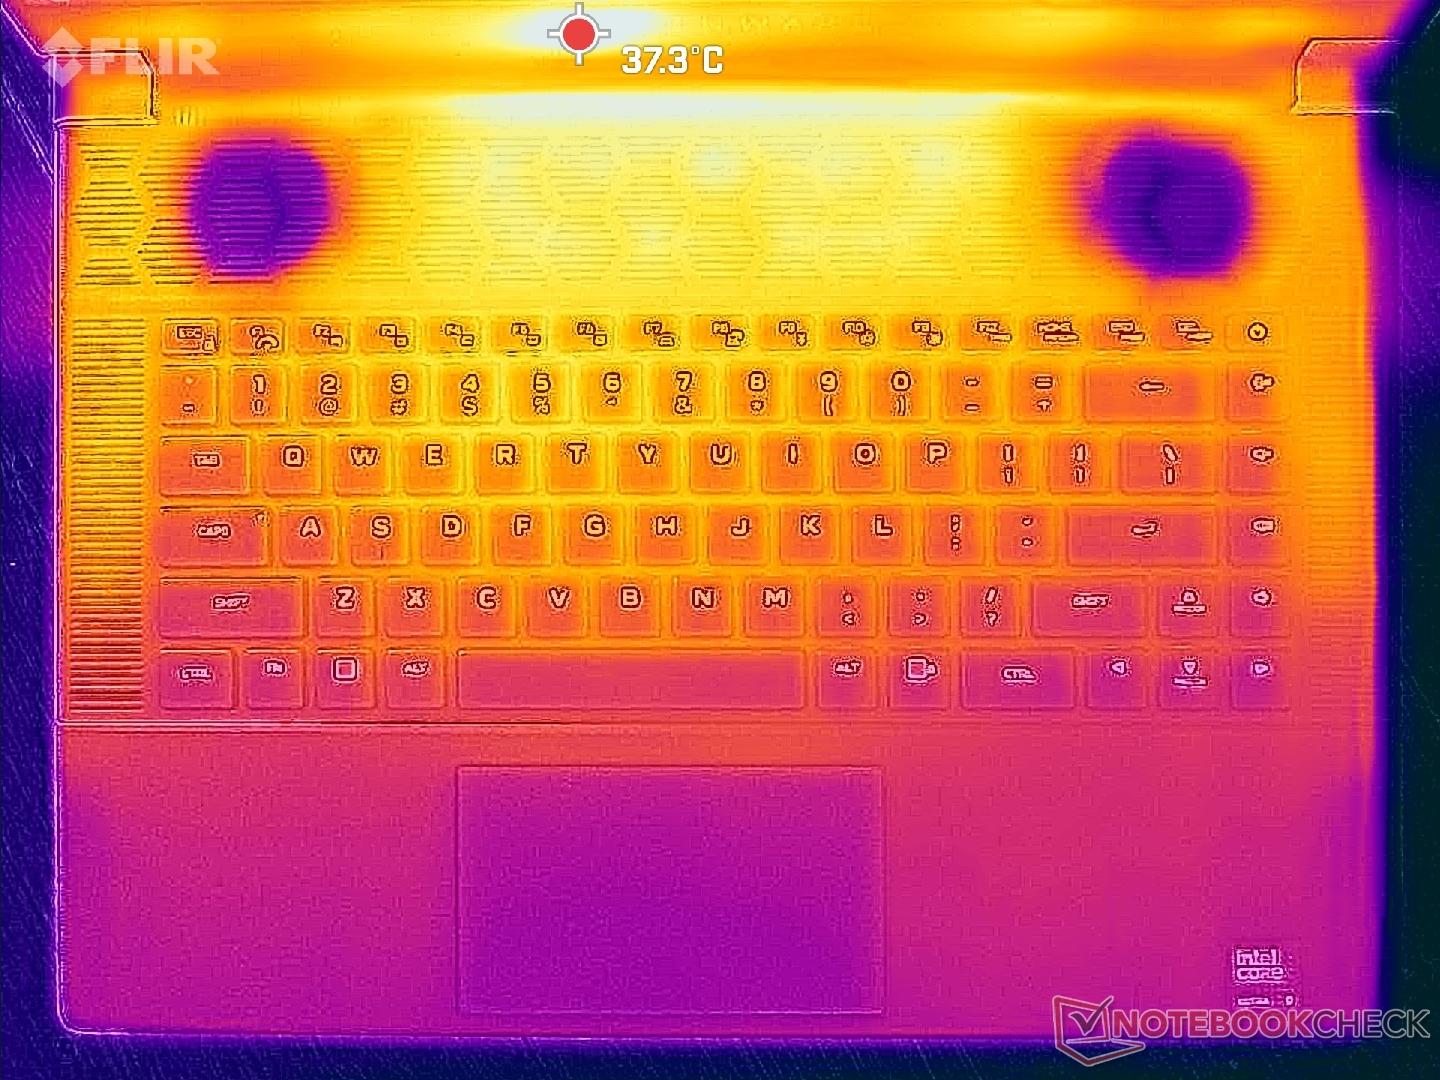
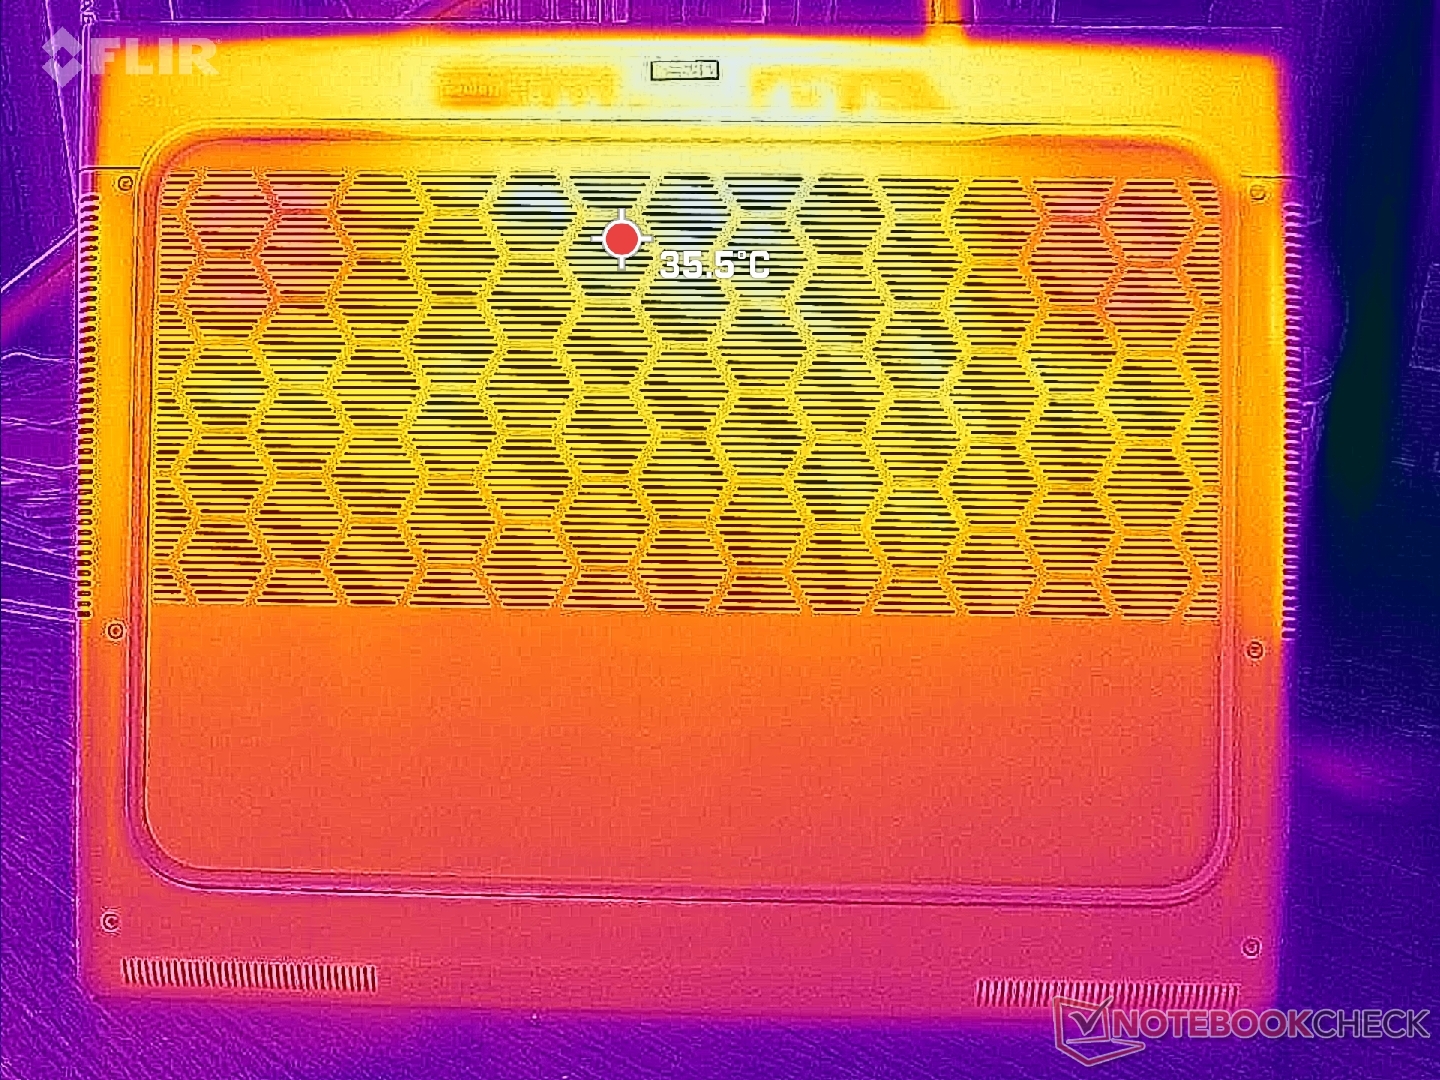
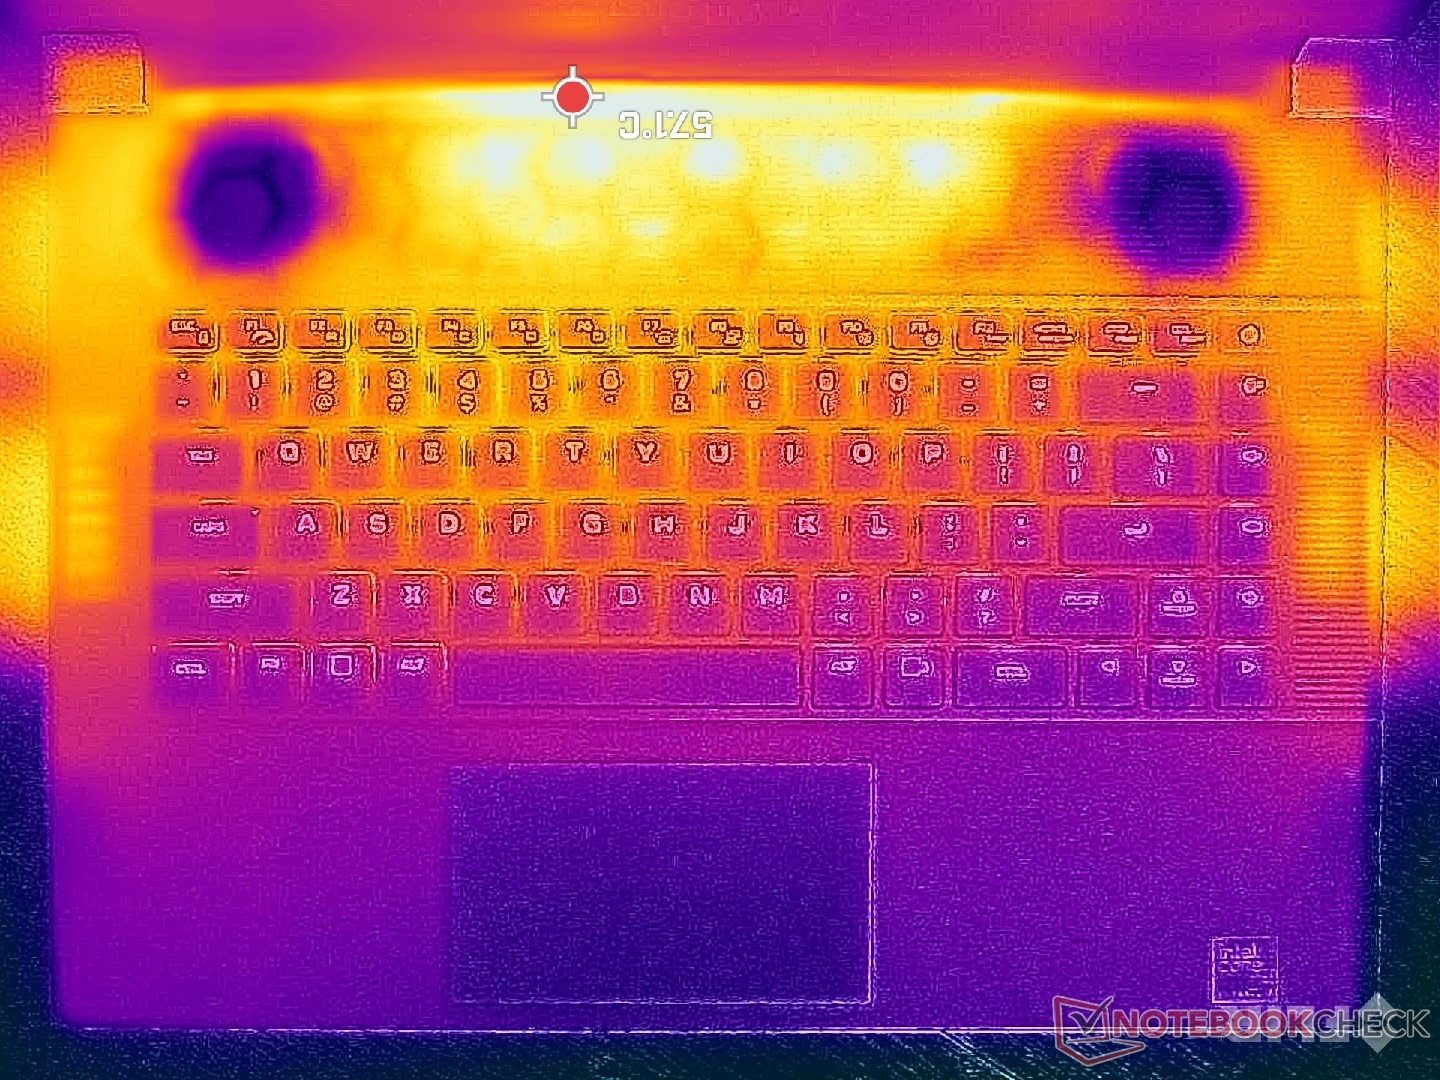
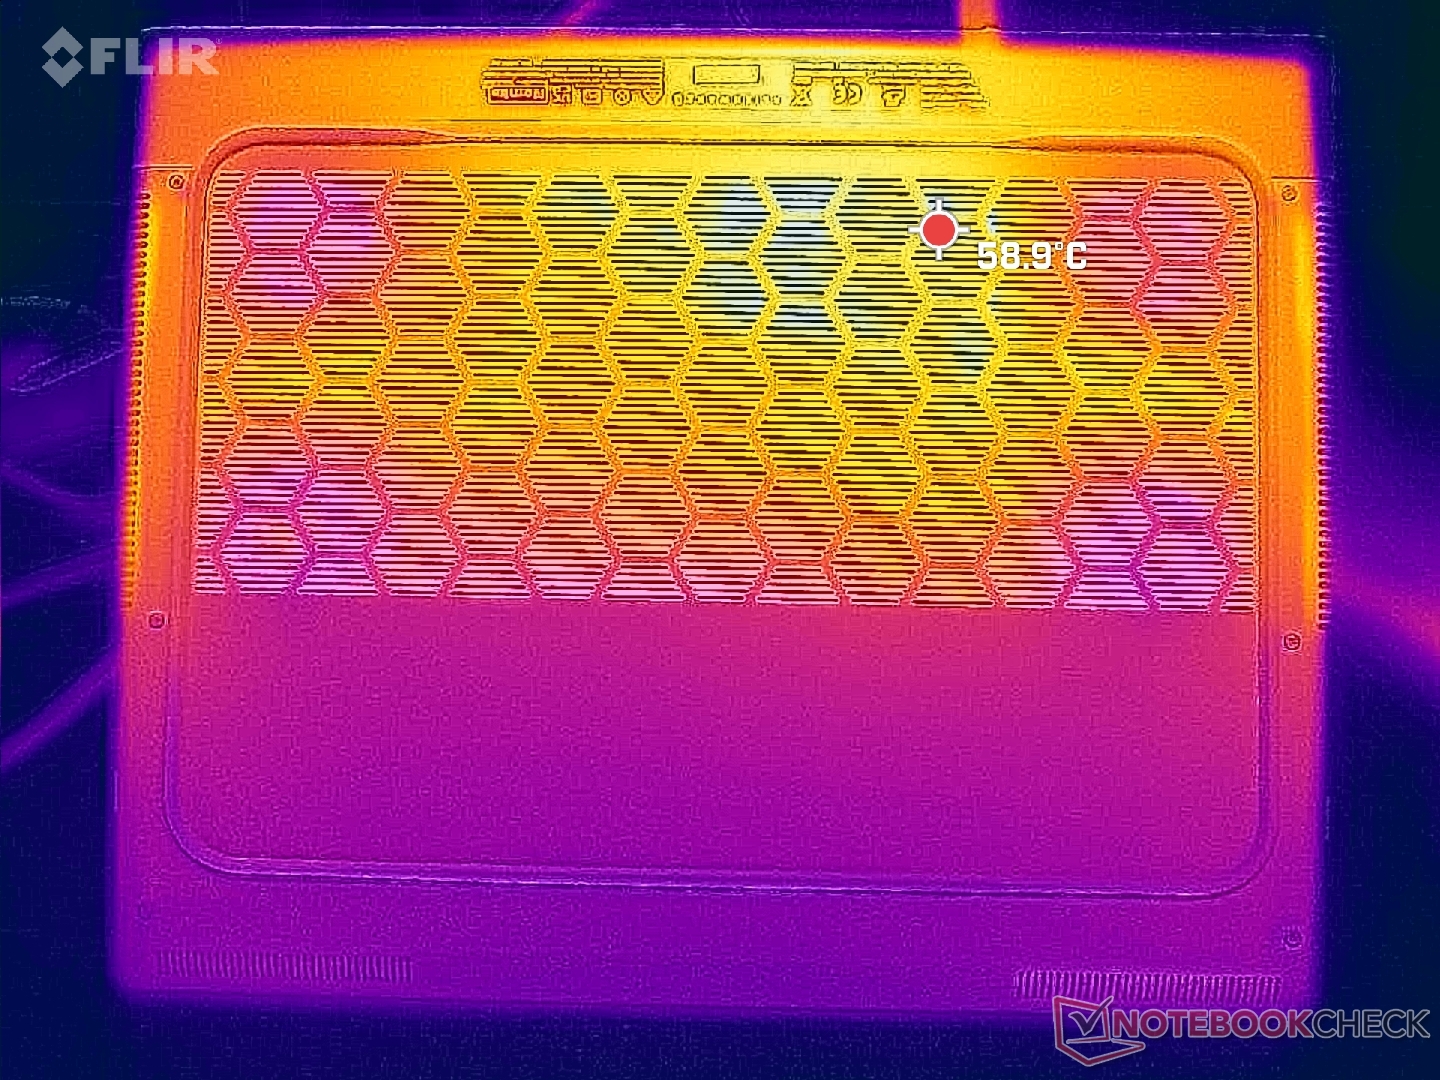
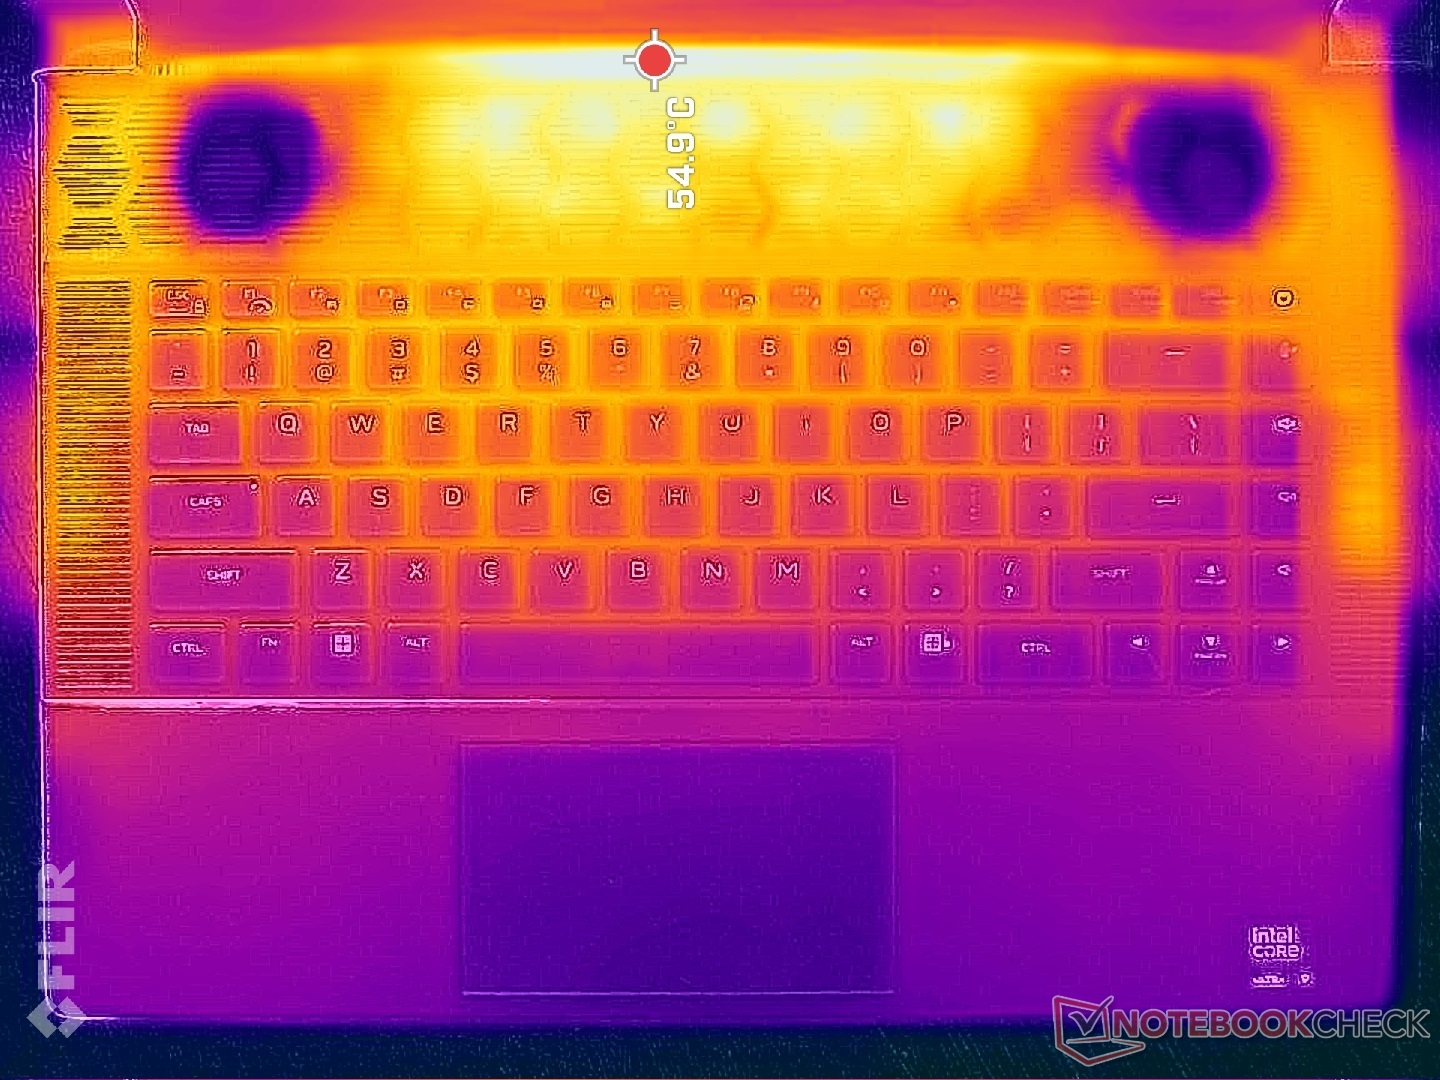
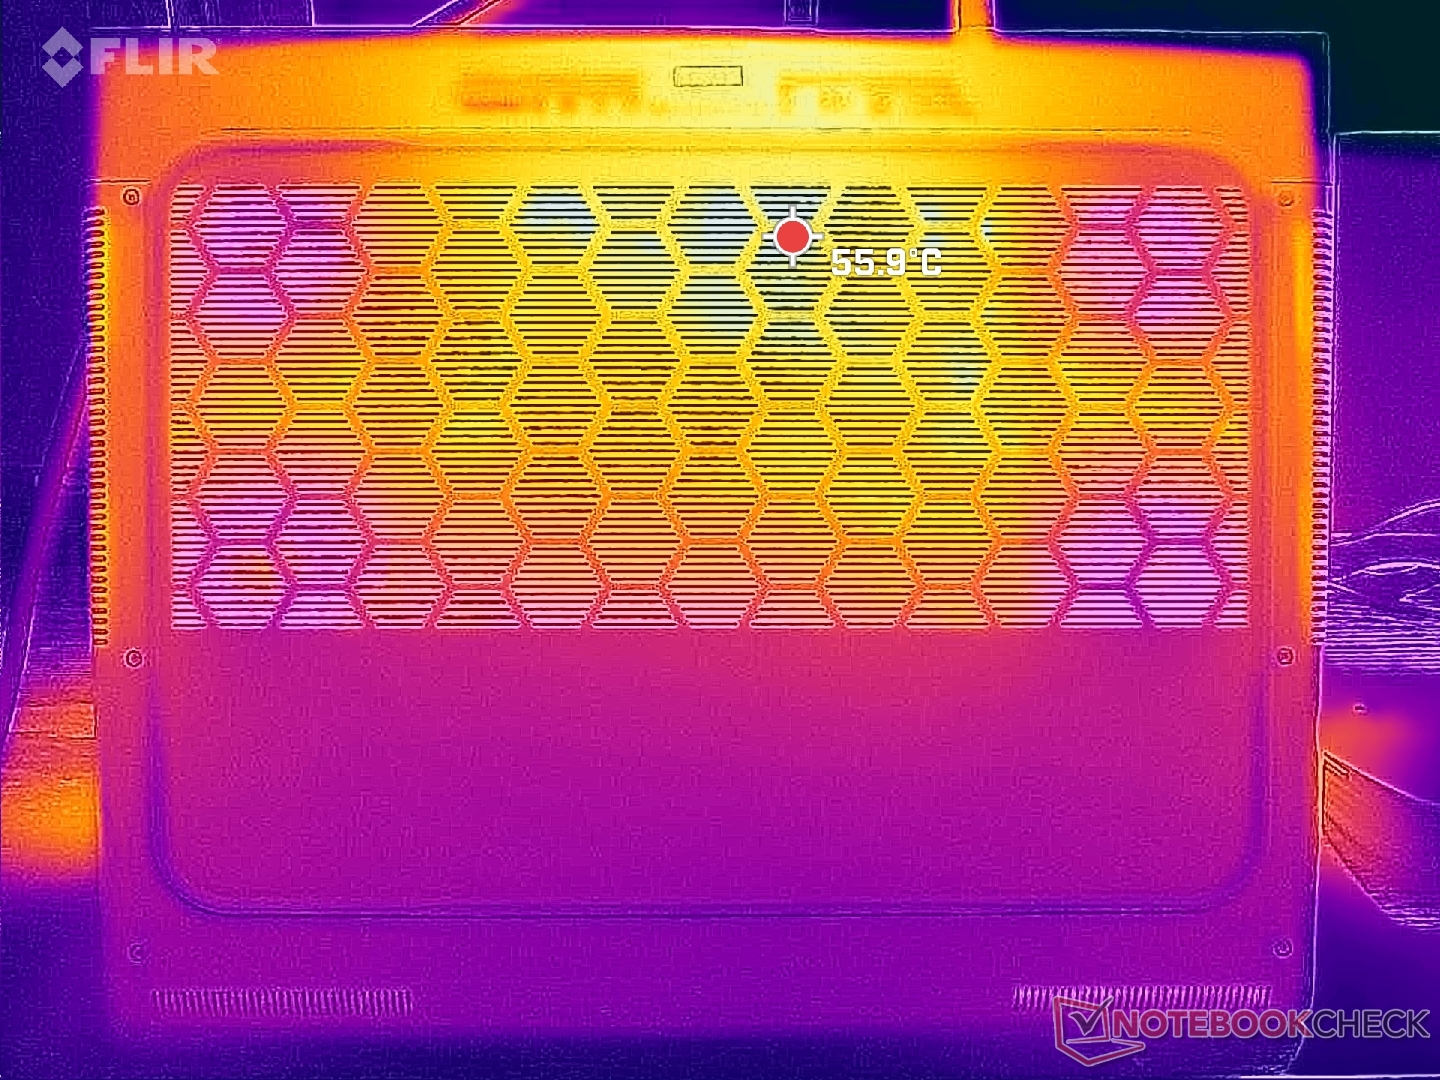
Le temperature di superficie sono molto calde verso la metà posteriore dello chassis, mentre la parte anteriore è notevolmente più fresca per i palmi e le dita. La serie Alienware x16 utilizza più griglie di ventilazione rispetto alla serie m16, per necessità, poiché il design x16 è definito dalla sua sottigliezza.
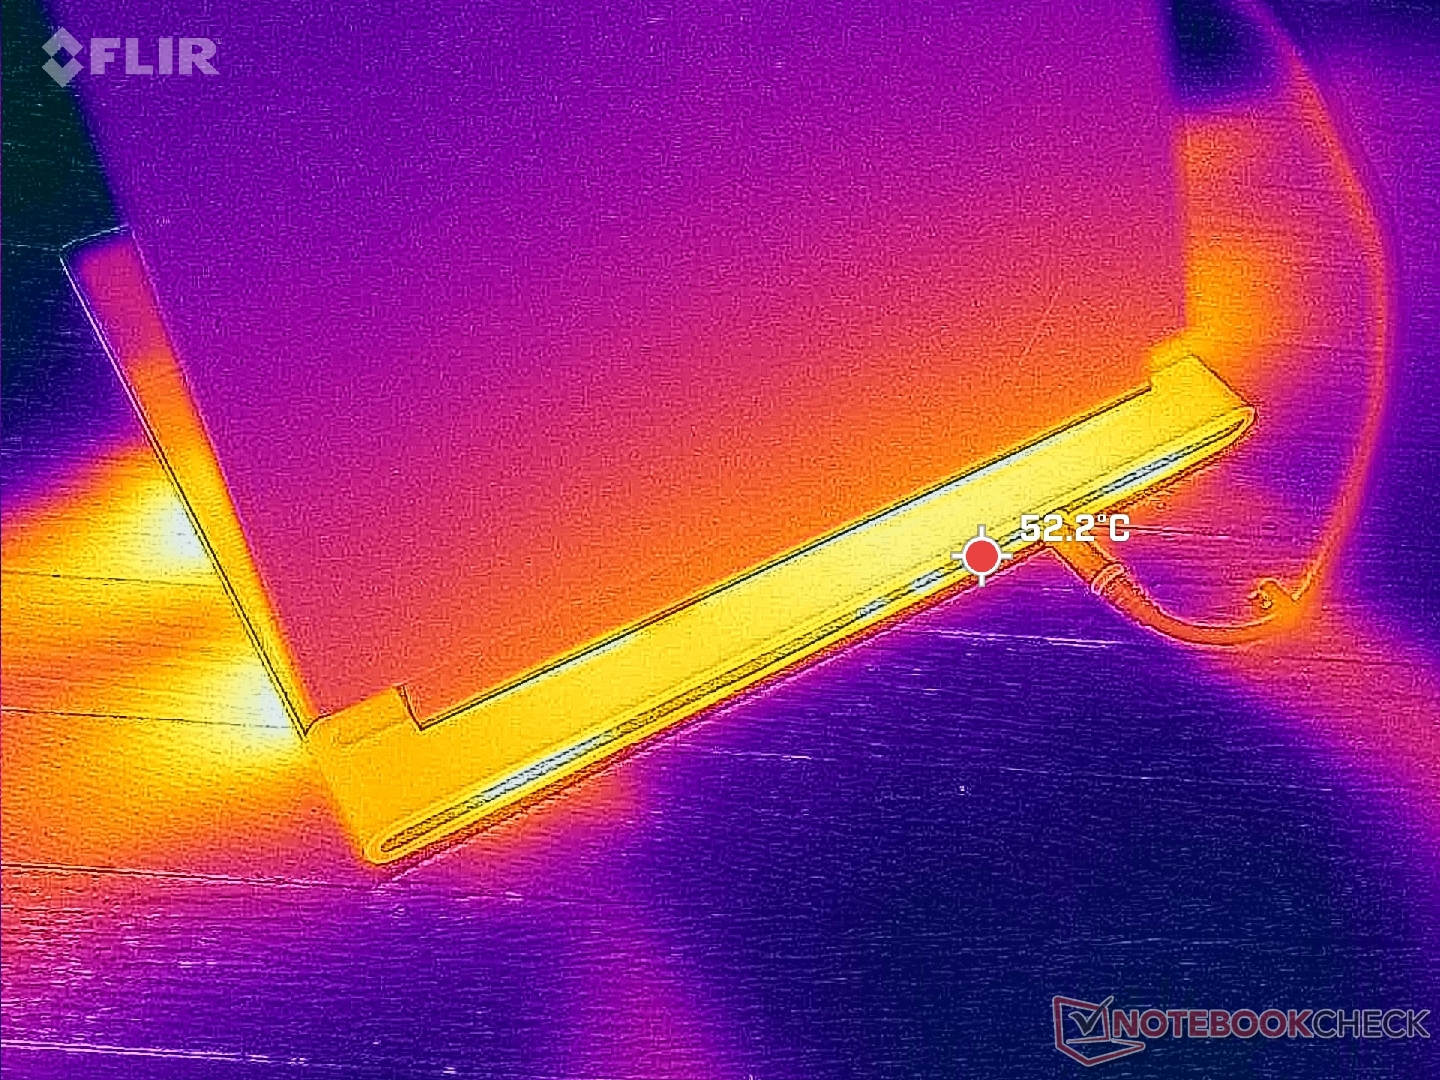
(-) La temperatura massima sul lato superiore è di 51 °C / 124 F, rispetto alla media di 40.4 °C / 105 F, che varia da 21.2 a 68.8 °C per questa classe Gaming.
(-) Il lato inferiore si riscalda fino ad un massimo di 50.8 °C / 123 F, rispetto alla media di 43.2 °C / 110 F
(+) In idle, la temperatura media del lato superiore è di 31.3 °C / 88 F, rispetto alla media deld ispositivo di 33.9 °C / 93 F.
(-) Riproducendo The Witcher 3, la temperatura media per il lato superiore e' di 42.4 °C / 108 F, rispetto alla media del dispositivo di 33.9 °C / 93 F.
(+) I poggiapolsi e il touchpad raggiungono la temperatura massima della pelle (33.2 °C / 91.8 F) e quindi non sono caldi.
(-) La temperatura media della zona del palmo della mano di dispositivi simili e'stata di 28.9 °C / 84 F (-4.3 °C / -7.8 F).
| Alienware x16 R2 P120F Intel Core Ultra 9 185H, NVIDIA GeForce RTX 4080 Laptop GPU | Alienware x16 R1 Intel Core i9-13900HK, NVIDIA GeForce RTX 4080 Laptop GPU | Alienware m16 R2 Intel Core Ultra 7 155H, NVIDIA GeForce RTX 4070 Laptop GPU | Asus ROG Strix Scar 16 G634JZR Intel Core i9-14900HX, NVIDIA GeForce RTX 4080 Laptop GPU | Lenovo Legion Pro 7 16IRX9H Intel Core i9-14900HX, NVIDIA GeForce RTX 4080 Laptop GPU | MSI Vector 16 HX A14V Intel Core i9-14900HX, NVIDIA GeForce RTX 4080 Laptop GPU | |
|---|---|---|---|---|---|---|
| Heat | 3% | -1% | 5% | 1% | 27% | |
| Maximum Upper Side * | 51 | 47.2 7% | 44.8 12% | 47.8 6% | 46 10% | 36.4 29% |
| Maximum Bottom * | 50.8 | 47.8 6% | 48 6% | 52.2 -3% | 49 4% | 35.6 30% |
| Idle Upper Side * | 36.6 | 36.8 -1% | 37.2 -2% | 32.4 11% | 38 -4% | 26.6 27% |
| Idle Bottom * | 35.2 | 35.8 -2% | 42 -19% | 33 6% | 37 -5% | 27 23% |
* ... Meglio usare valori piccoli
Altoparlanti

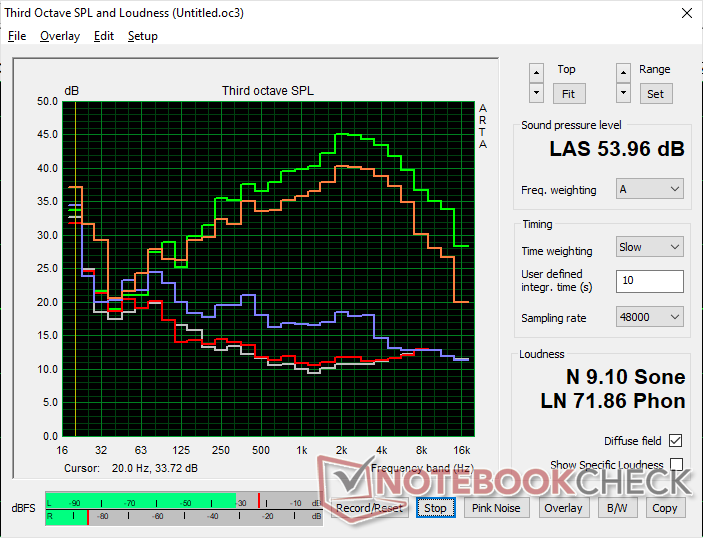
Alienware x16 R2 P120F analisi audio
(+) | gli altoparlanti sono relativamente potenti (89.9 dB)
Bassi 100 - 315 Hz
(±) | bassi ridotti - in media 7.4% inferiori alla media
(±) | la linearità dei bassi è media (7.6% delta rispetto alla precedente frequenza)
Medi 400 - 2000 Hz
(+) | medi bilanciati - solo only 2.6% rispetto alla media
(+) | medi lineari (3.6% delta rispetto alla precedente frequenza)
Alti 2 - 16 kHz
(+) | Alti bilanciati - appena 3.4% dalla media
(+) | alti lineari (2.8% delta rispetto alla precedente frequenza)
Nel complesso 100 - 16.000 Hz
(+) | suono nel complesso lineare (8.2% differenza dalla media)
Rispetto alla stessa classe
» 1% di tutti i dispositivi testati in questa classe è stato migliore, 1% simile, 98% peggiore
» Il migliore ha avuto un delta di 6%, medio di 18%, peggiore di 132%
Rispetto a tutti i dispositivi testati
» 1% di tutti i dispositivi testati in questa classe è stato migliore, 1% similare, 98% peggiore
» Il migliore ha avuto un delta di 4%, medio di 24%, peggiore di 134%
Apple MacBook Pro 16 2021 M1 Pro analisi audio
(+) | gli altoparlanti sono relativamente potenti (84.7 dB)
Bassi 100 - 315 Hz
(+) | bassi buoni - solo 3.8% dalla media
(+) | bassi in lineaa (5.2% delta rispetto alla precedente frequenza)
Medi 400 - 2000 Hz
(+) | medi bilanciati - solo only 1.3% rispetto alla media
(+) | medi lineari (2.1% delta rispetto alla precedente frequenza)
Alti 2 - 16 kHz
(+) | Alti bilanciati - appena 1.9% dalla media
(+) | alti lineari (2.7% delta rispetto alla precedente frequenza)
Nel complesso 100 - 16.000 Hz
(+) | suono nel complesso lineare (4.6% differenza dalla media)
Rispetto alla stessa classe
» 0% di tutti i dispositivi testati in questa classe è stato migliore, 0% simile, 100% peggiore
» Il migliore ha avuto un delta di 5%, medio di 18%, peggiore di 45%
Rispetto a tutti i dispositivi testati
» 0% di tutti i dispositivi testati in questa classe è stato migliore, 0% similare, 100% peggiore
» Il migliore ha avuto un delta di 4%, medio di 24%, peggiore di 134%
Gestione dell'energia
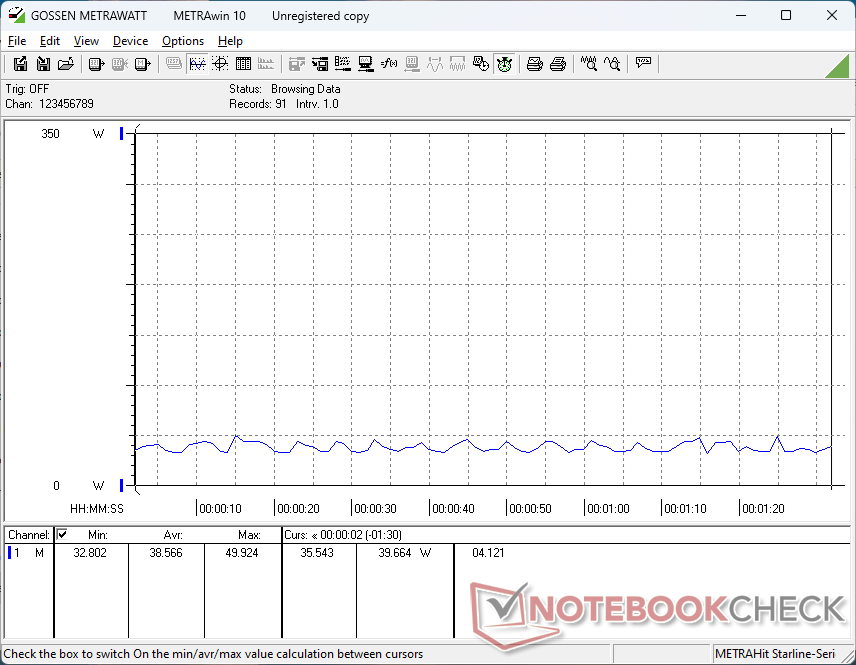
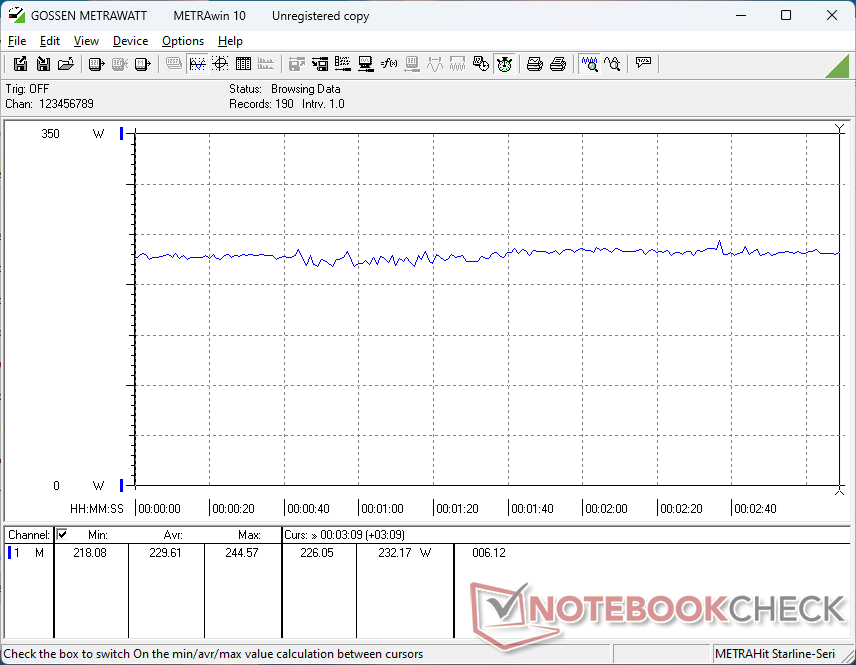
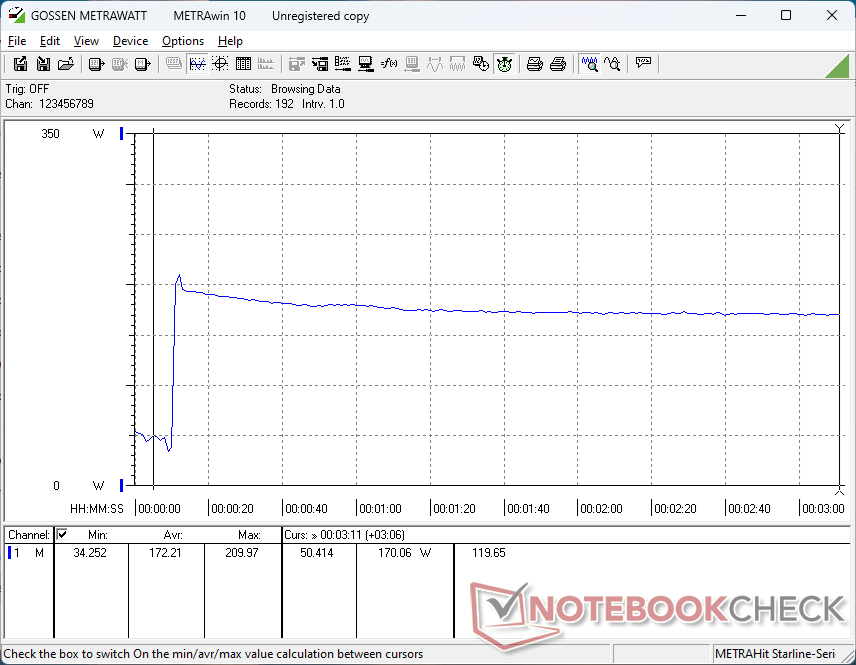
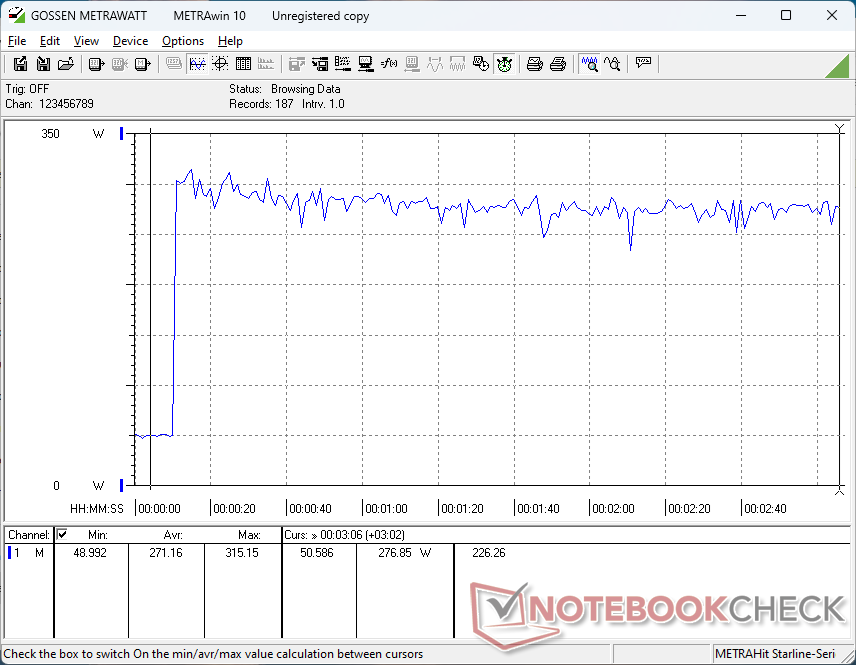
Consumo di energia
Il consumo complessivo è generalmente inferiore a quello che abbiamo registrato sull'R1 x16 di circa il 10-15 percento quando si eseguono carichi impegnativi come i giochi o lo stress Prime95. Tuttavia, questo deficit si accompagna ai risultati della CPU e della GPU più lenti, come già notato in precedenza. Le prestazioni per watt sono quindi circa le stesse rispetto all'anno precedente, nonostante il cambiamento della CPU.
Abbiamo riscontrato un bug durante la modalità Standby. Se impostata su Optimus, la modalità Standby funzionava normalmente con un basso consumo energetico <1 watt. Se impostata sulla modalità dGPU e su Overdrive, tuttavia, la modalità Standby richiedeva fino a 39 W, con un conseguente surriscaldamento del portatile e un elevato consumo della batteria.
| Off / Standby | |
| Idle | |
| Sotto carico |
|
Leggenda:
min: | |
| Alienware x16 R2 P120F Ultra 9 185H, NVIDIA GeForce RTX 4080 Laptop GPU, WDC PC SN810 1TB, IPS, 2560x1600, 16" | Alienware x16 R1 i9-13900HK, NVIDIA GeForce RTX 4080 Laptop GPU, SK hynix PC801 HFS001TEJ9X101N, IPS, 2560x1600, 16" | Alienware m16 R2 Ultra 7 155H, NVIDIA GeForce RTX 4070 Laptop GPU, Samsung PM9A1 MZVL21T0HCLR, IPS, 2560x1600, 16" | Asus ROG Strix Scar 16 G634JZR i9-14900HX, NVIDIA GeForce RTX 4080 Laptop GPU, SK hynix PC801 HFS002TEJ9X101N, Mini LED, 2560x1600, 16" | Lenovo Legion Pro 7 16IRX9H i9-14900HX, NVIDIA GeForce RTX 4080 Laptop GPU, SK Hynix HFS001TEJ9X115N, IPS, 2560x1600, 16" | MSI Vector 16 HX A14V i9-14900HX, NVIDIA GeForce RTX 4080 Laptop GPU, WD PC SN560 SDDPNQE-1T00, IPS, 2560x1600, 16" | |
|---|---|---|---|---|---|---|
| Power Consumption | -55% | 11% | -10% | -30% | -27% | |
| Idle Minimum * | 9.9 | 25.2 -155% | 8.1 18% | 10.71 -8% | 16 -62% | 15.8 -60% |
| Idle Average * | 14.5 | 29.9 -106% | 13 10% | 14.75 -2% | 21 -45% | 23.3 -61% |
| Idle Maximum * | 33.5 | 49.8 -49% | 40.3 -20% | 30 10% | 36 -7% | 30 10% |
| Load Average * | 97.5 | 105.4 -8% | 79 19% | 135 -38% | 132 -35% | 123.9 -27% |
| Witcher 3 ultra * | 230 | 263 -14% | 188.1 18% | 286 -24% | 267 -16% | 285 -24% |
| Load Maximum * | 315.2 | 313.8 -0% | 254.9 19% | 307 3% | 360 -14% | 306 3% |
* ... Meglio usare valori piccoli
Power Consumption Witcher 3 / Stresstest
Power Consumption external Monitor
Durata della batteria
I tempi di esecuzione sono un po' più lunghi questa volta, probabilmente a causa del consumo energetico complessivamente inferiore notato in precedenza. Siamo riusciti a registrare un tempo di esecuzione WLAN di oltre 40 minuti in più rispetto al modello x16 R1, ma la maggior parte degli altri computer portatili da gioco sono ancora in grado di durare molto di più, compreso il modello Dell Alienware m16 R2.
| Alienware x16 R2 P120F Ultra 9 185H, NVIDIA GeForce RTX 4080 Laptop GPU, 90 Wh | Alienware x16 R1 i9-13900HK, NVIDIA GeForce RTX 4080 Laptop GPU, 90 Wh | Alienware m16 R2 Ultra 7 155H, NVIDIA GeForce RTX 4070 Laptop GPU, 90 Wh | Asus ROG Strix Scar 16 G634JZR i9-14900HX, NVIDIA GeForce RTX 4080 Laptop GPU, 90 Wh | Lenovo Legion Pro 7 16IRX9H i9-14900HX, NVIDIA GeForce RTX 4080 Laptop GPU, 99.9 Wh | MSI Vector 16 HX A14V i9-14900HX, NVIDIA GeForce RTX 4080 Laptop GPU, 90 Wh | |
|---|---|---|---|---|---|---|
| Autonomia della batteria | -23% | 150% | 125% | 93% | 72% | |
| WiFi v1.3 | 193 | 149 -23% | 483 150% | 434 125% | 373 93% | 332 72% |
| Reader / Idle | 436 | 758 | 641 | |||
| Load | 44 | 60 | 51 | 84 | ||
| H.264 | 451 | |||||
| Witcher 3 ultra | 57 |
Pro
Contro
Verdetto - Alienware x16 R1 è più veloce per il gioco puro
Il grande vantaggio di Alienware x16 R2 rispetto a x16 R1 è la NPU integrata per accelerare le attività AI di Windows. Si prevede che tali funzioni diventeranno comuni nel prossimo anno o giù di lì, grazie a Microsoft Co-Pilot e ad altre applicazioni Ai-driven di prossima uscita. Per i giochi, tuttavia, la NPU non apporta nulla per migliorare l'esperienza a partire dal 2024. Anzi, è probabilmente dannoso, in quanto le prestazioni grezze della CPU sono diminuite rispetto al Core i9-13900HK del modello x16 R1 dello scorso anno, in quanto lo spazio prezioso del die è stato riservato al nuovo processore neurale.
L'Alienware x16 R2 introduce le nuove CPU Meteor Lake-H con una NPU integrata per la compatibilità con le future funzioni AI di Windows. Purtroppo, le prestazioni di gioco grezze ne hanno risentito.
Le prestazioni generalmente più lente hanno anche portato a un consumo energetico inferiore e a tempi di esecuzione più lunghi rispetto al modello di lancio originale. Tuttavia, il target di appassionati di giochi che amano acquistare Alienware probabilmente non è molto entusiasta di barattare le prestazioni con la durata della batteria. Una mossa del genere sarebbe stata più accettabile sul modello di fascia bassa Dell serie G invece.
Consigliamo di prendere in considerazione l'originale Alienware x16 R1 poiché il modello x16 R2 non offre nuove opzioni di GPU, opzioni di display e nemmeno colori dello chassis o modifiche esterne. L'aggiornamento della CPU è auspicabile solo per coloro che desiderano "proteggere il proprio spazio di lavoro dal futuro" con la NPU integrata.
Prezzo e disponibilità
Dell distribuisce ora l'Alienware x16 R2 a partire da 2100 dollari per la configurazione Core Ultra 7, GeForce RTX 4060, tastiera standard e 1600p240 IPS, oppure fino a 3500 dollari se configurato con Core Ultra 9, RTX 4090 e tastiera meccanica.
Alienware x16 R2 P120F
- 05/29/2024 v7 (old)
Allen Ngo
Transparency
La selezione dei dispositivi da recensire viene effettuata dalla nostra redazione. Il campione di prova è stato fornito all'autore come prestito dal produttore o dal rivenditore ai fini di questa recensione. L'istituto di credito non ha avuto alcuna influenza su questa recensione, né il produttore ne ha ricevuto una copia prima della pubblicazione. Non vi era alcun obbligo di pubblicare questa recensione. Non accettiamo mai compensi o pagamenti in cambio delle nostre recensioni. In quanto società mediatica indipendente, Notebookcheck non è soggetta all'autorità di produttori, rivenditori o editori.
Ecco come Notebookcheck esegue i test
Ogni anno, Notebookcheck esamina in modo indipendente centinaia di laptop e smartphone utilizzando procedure standardizzate per garantire che tutti i risultati siano comparabili. Da circa 20 anni sviluppiamo continuamente i nostri metodi di prova e nel frattempo stabiliamo gli standard di settore. Nei nostri laboratori di prova, tecnici ed editori esperti utilizzano apparecchiature di misurazione di alta qualità. Questi test comportano un processo di validazione in più fasi. Il nostro complesso sistema di valutazione si basa su centinaia di misurazioni e parametri di riferimento ben fondati, che mantengono l'obiettività.Price comparison

