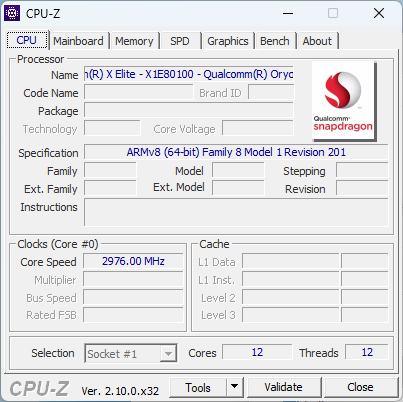
Recensione del Dell XPS 13 9345 Snapdragon X Elite: conferma l'Intel Core Ultra 7

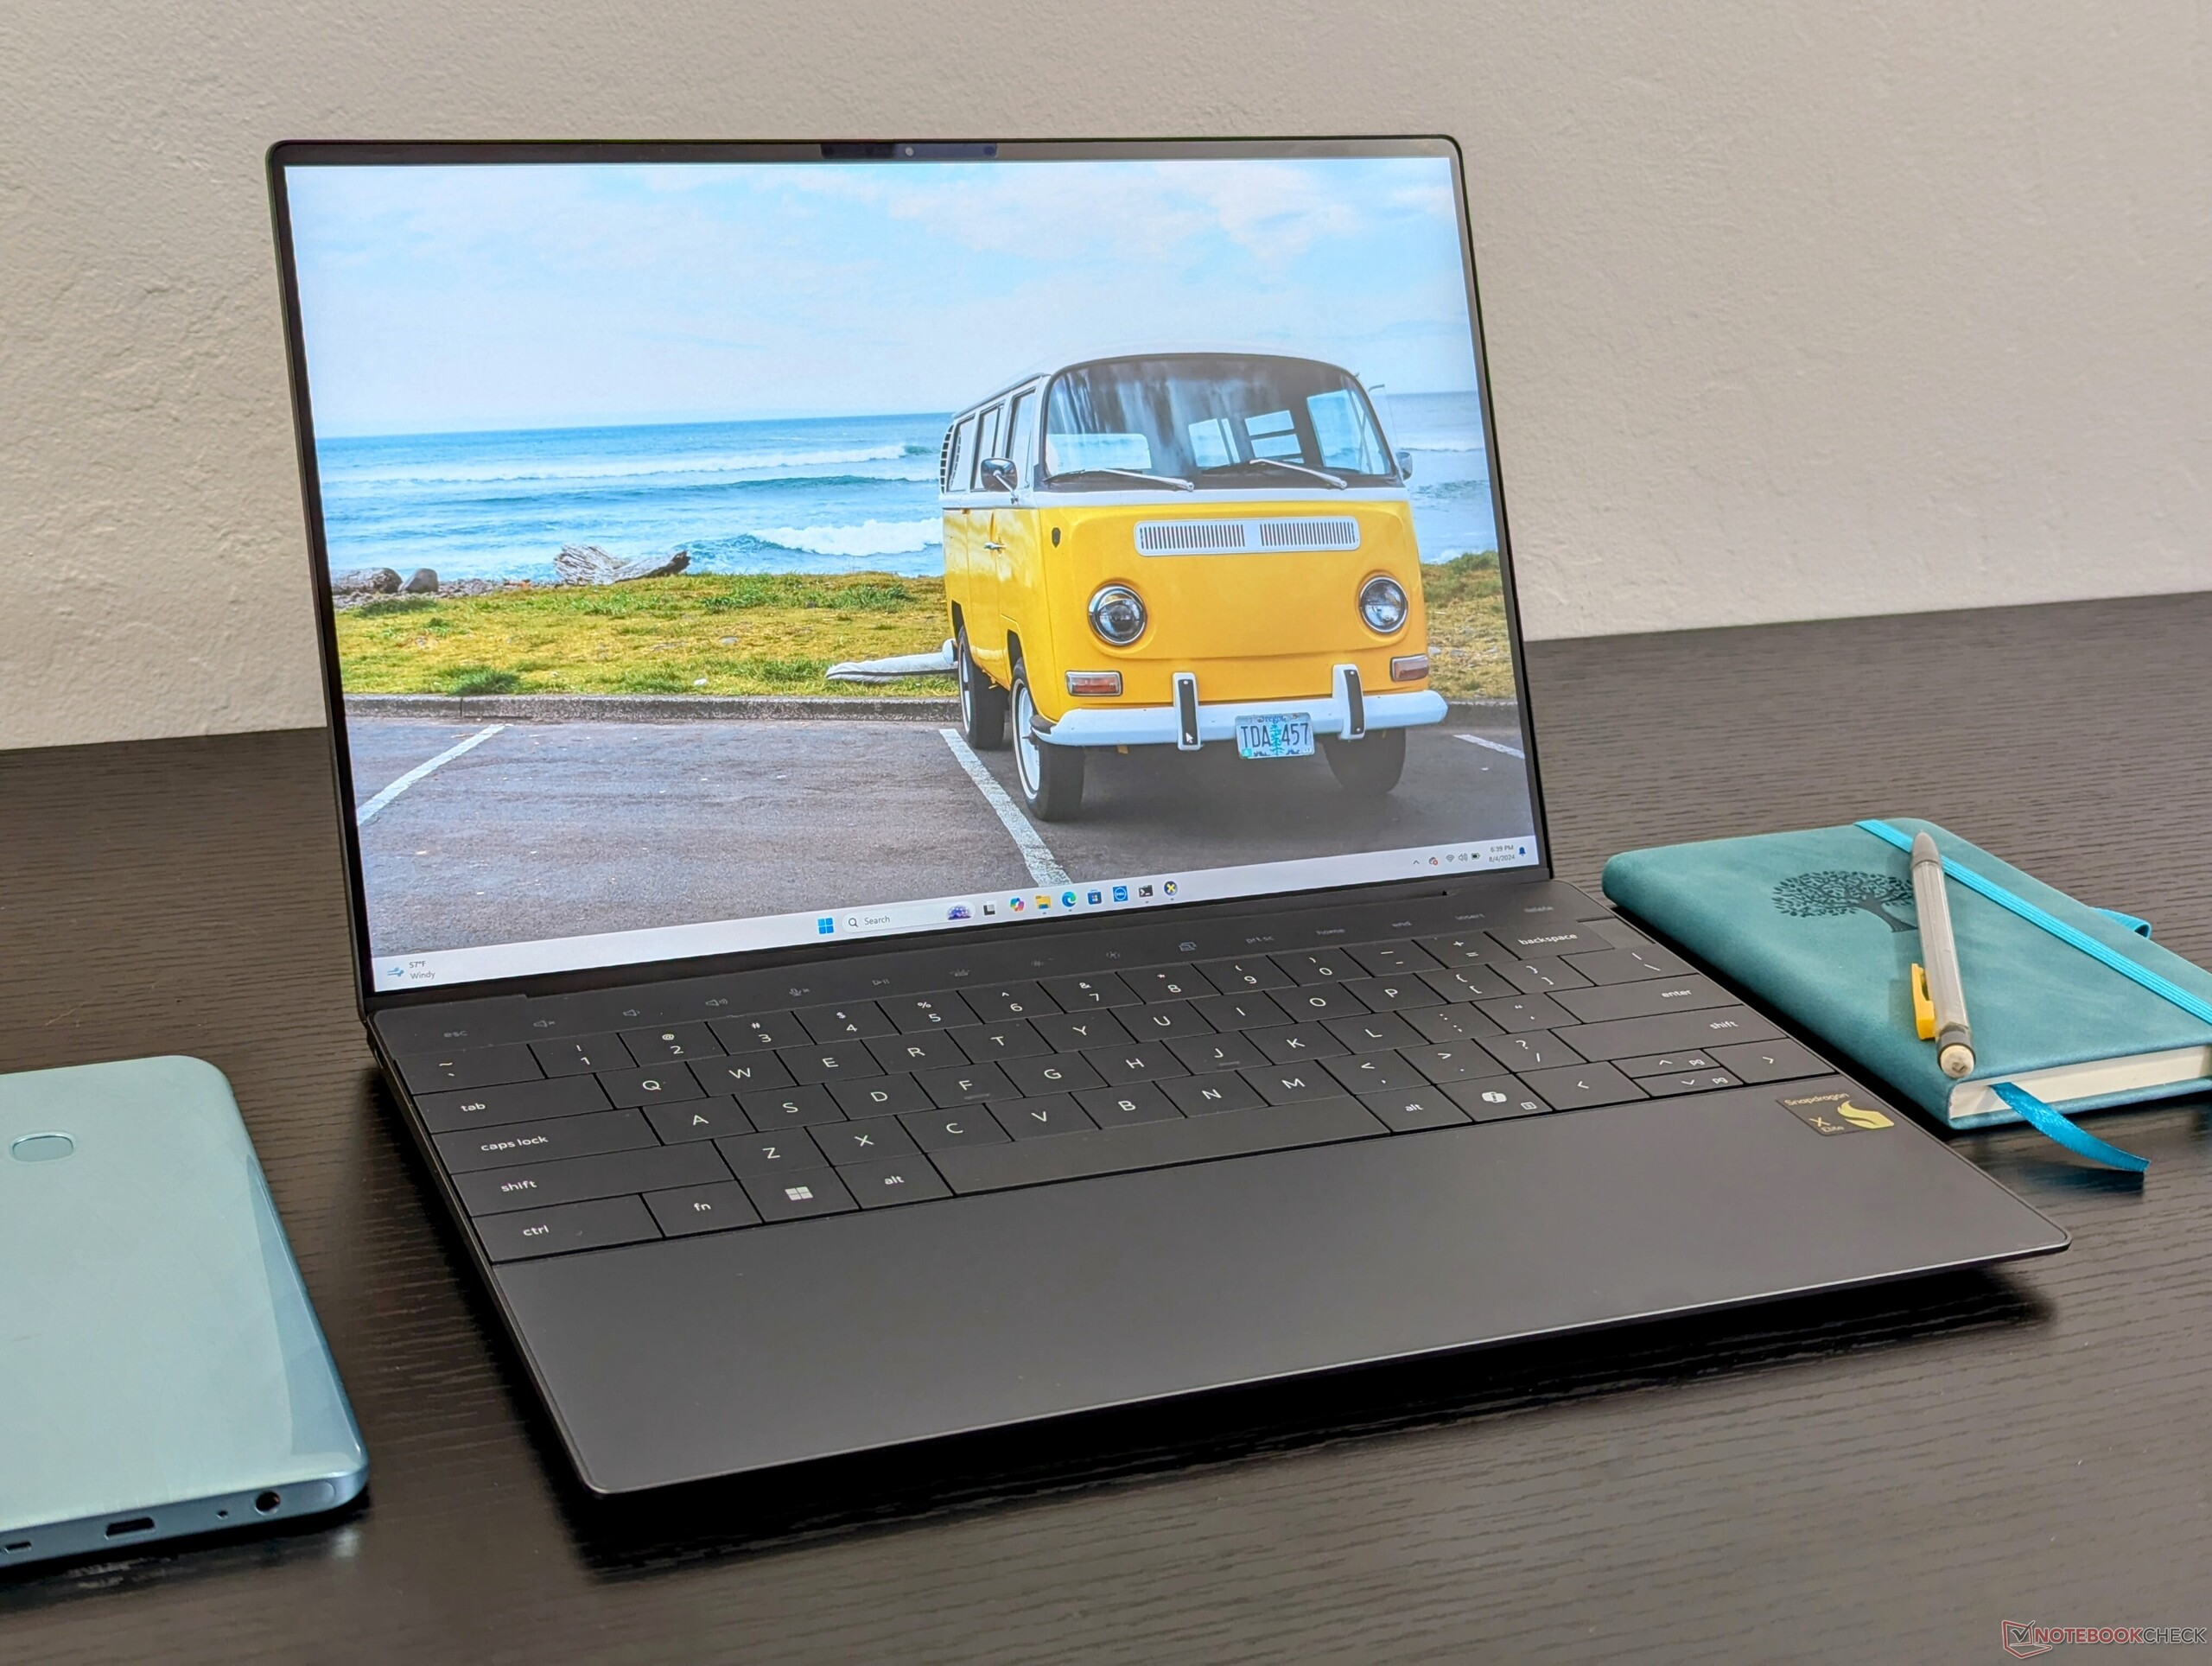
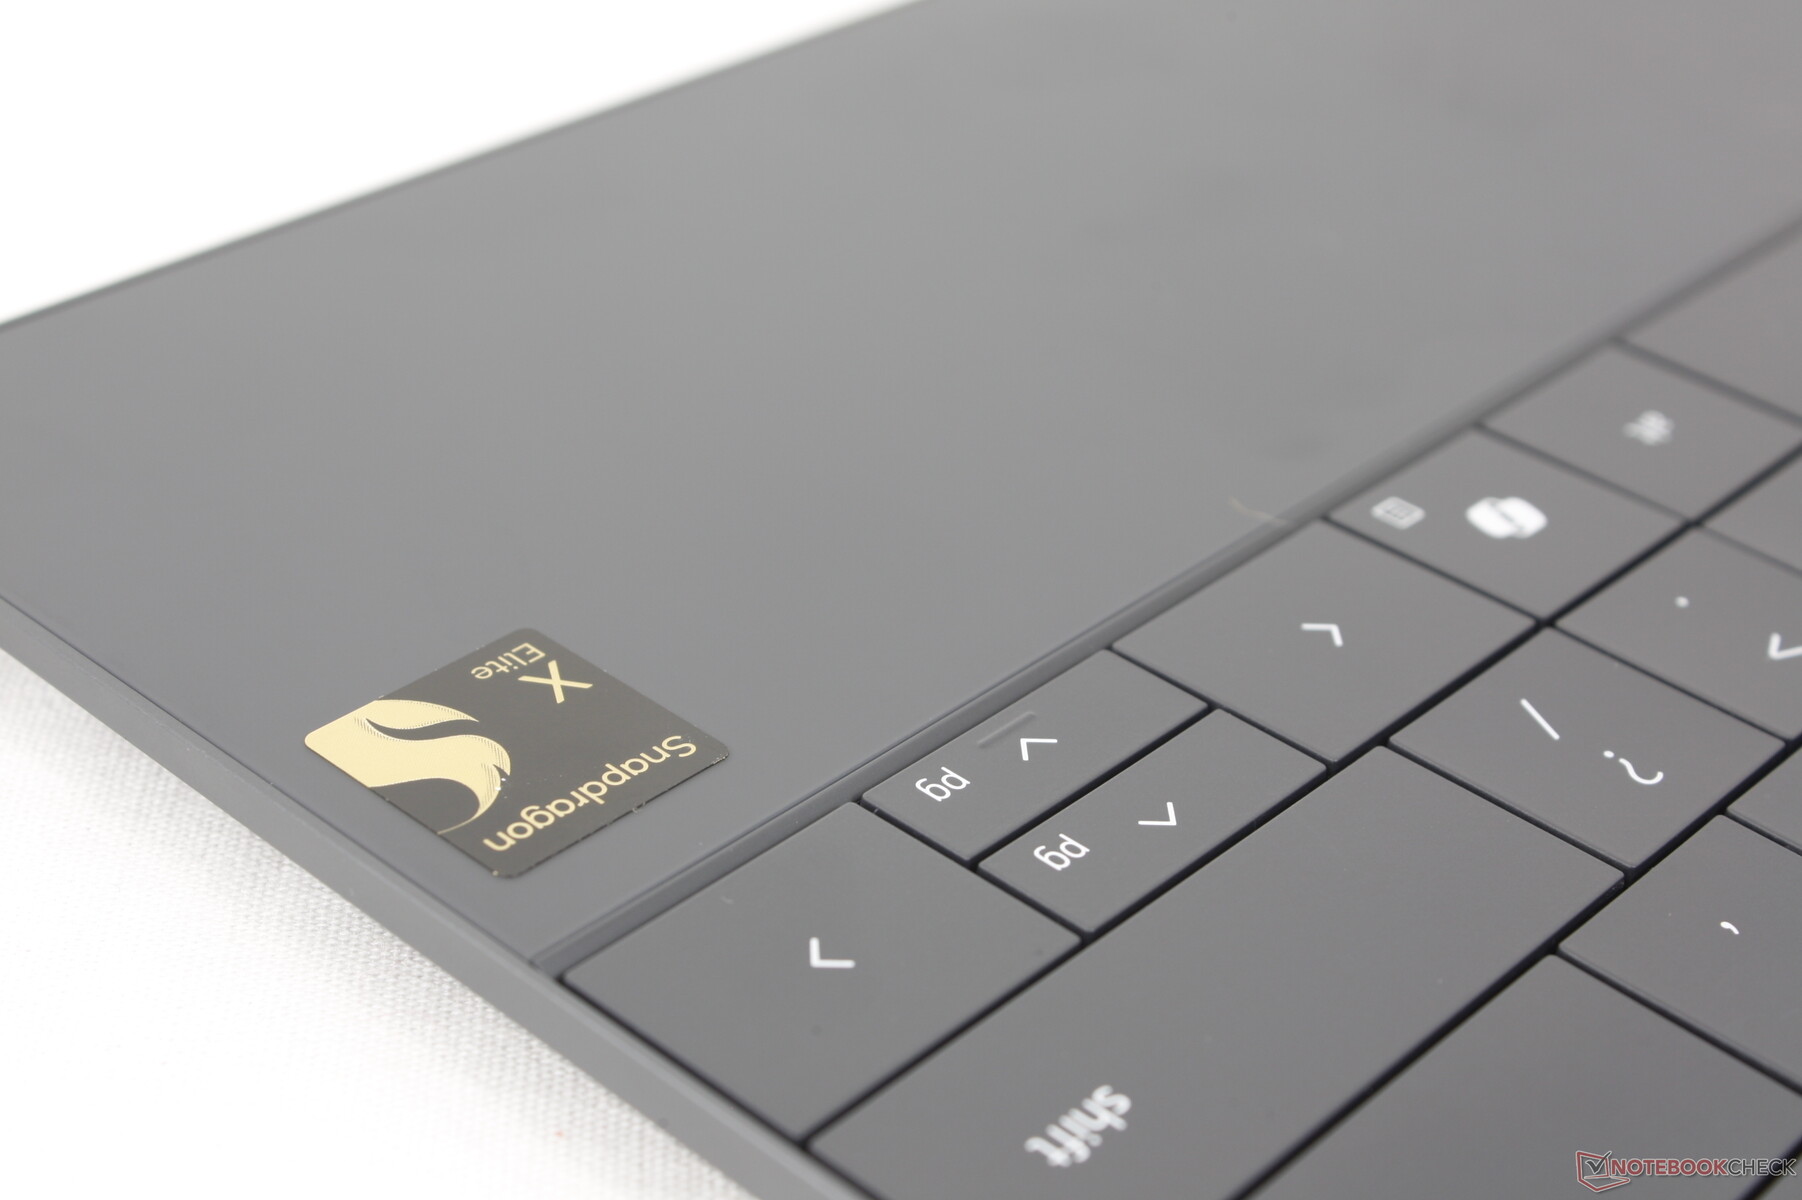
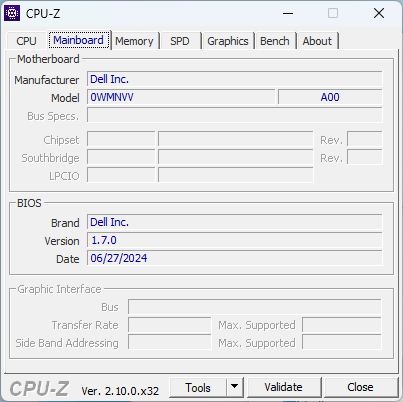
Quale modo migliore di mostrare il proprio processore se non quello di farlo debuttare su uno dei laptop consumer più popolari di Dell? Lo chassis dell'XPS 13 Plus 9320/9340 è stato riadattato con l'ultima CPU Snapdragon X Elite per far parte della piccola manciata di laptop Windows alimentati da Qualcomm in uscita quest'anno. Chiamato XPS 13 9345, il modello Snapdragon è visivamente identico all'attuale XPS 13 Plus 9320 XPS 13 Plus 9320 o 9340 con CPU Intel tradizionali.
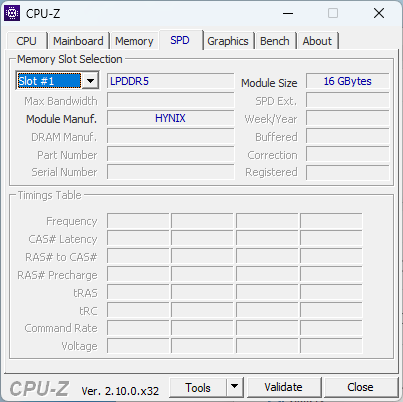
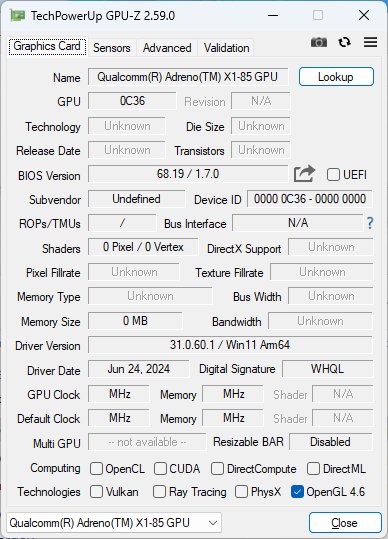
La nostra configurazione di recensione è dotata di Snapdragon X1 Elite X1E-80-100, 16 GB di RAM LPDDR5X-8448 e display IPS 1200p 120 Hz per circa 1300 dollari. Sono disponibili pannelli OLED di fascia più alta e alcune regioni possono includere una seconda opzione di processore Snapdragon X1 Plus X1P, ma la GPU integrata rimane la stessa su tutta la linea.
Le alternative all'XPS 13 9345 includono il Microsoft Surface Pro o Samsung Galaxy Book4 Edge 16 entrambi alimentati dallo stesso processore Snapdragon X1 Elite X1E-80-100. Naturalmente, è anche in diretta concorrenza con i subnotebook da ufficio più convenzionali da 13 e 14 pollici, come i modelli Lenovo ThinkBook 13x G4, Asus ZenBook S13o l'XPS 13 9340 di Dell.
Altre recensioni Dell:
Potenziali concorrenti a confrontos
Punteggio | Versione | Data | Modello | Peso | Altezza | Dimensione | Risoluzione | Prezzo |
|---|---|---|---|---|---|---|---|---|
| 84.5 % | v8 | 08/2024 | Dell XPS 13 9345 SD X Elite X1E-80-100, Adreno X1-85 3.8 TFLOPS | 1.2 kg | 15.3 mm | 13.40" | 1920x1200 | |
| 86.5 % v7 (old) | v7 (old) | 05/2024 | Dell XPS 13 9340 Core Ultra 7 Ultra 7 155H, Arc 8-Core | 1.2 kg | 15.3 mm | 13.40" | 1920x1200 | |
| 86.2 % | v8 | 07/2024 | Microsoft Surface Laptop 7 13.8 Copilot+ SD X Elite X1E-80-100, Adreno X1-85 3.8 TFLOPS | 1.3 kg | 17.5 mm | 13.80" | 2304x1536 | |
| 90.1 % v7 (old) | v7 (old) | 05/2024 | Lenovo ThinkBook 13x G4 21KR0008GE Ultra 5 125H, Arc 7-Core | 1.2 kg | 12.9 mm | 13.50" | 2880x1920 | |
| 82.3 % | v8 | 07/2024 | HP EliteBook Ultra G1q 14 SD X Elite X1E-78-100, Adreno X1-85 3.8 TFLOPS | 1.3 kg | 11.2 mm | 14.00" | 2240x1400 | |
| 85.4 % v7 (old) | v7 (old) | 05/2023 | Asus ZenBook S13 OLED UX5304 i7-1355U, Iris Xe G7 96EUs | 1 kg | 11.8 mm | 13.30" | 2880x1800 |
Informazioni: Abbiamo aggiornato il nostro sistema di valutazione e i risultati della versione 8 non sono confrontabili con i risultati della versione 7. Altre informazioni sono gerarchicamente verfügbar.
Nota: abbiamo recentemente aggiornato il nostro sistema di valutazione e i risultati della versione 8 non sono confrontabili con quelli della versione 7. Ulteriori informazioni sono disponibili qui .
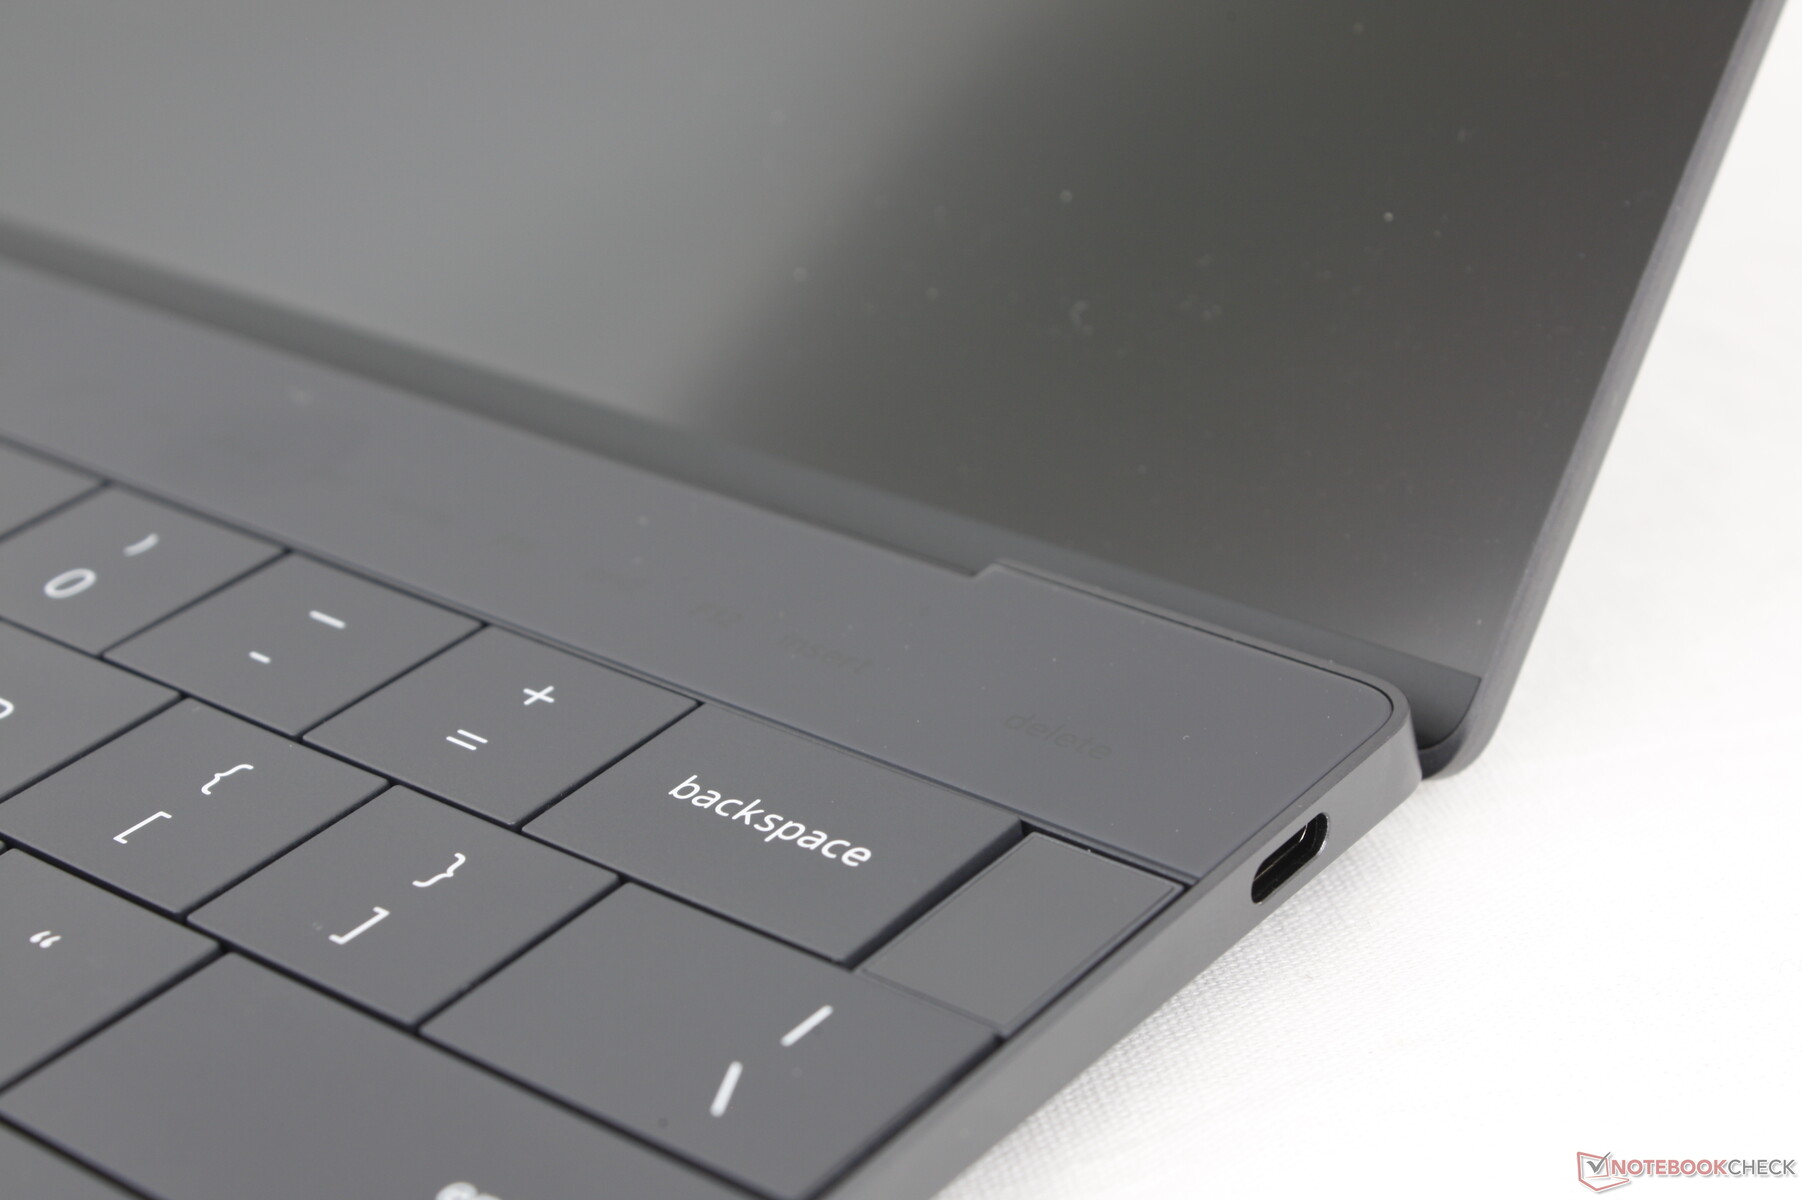
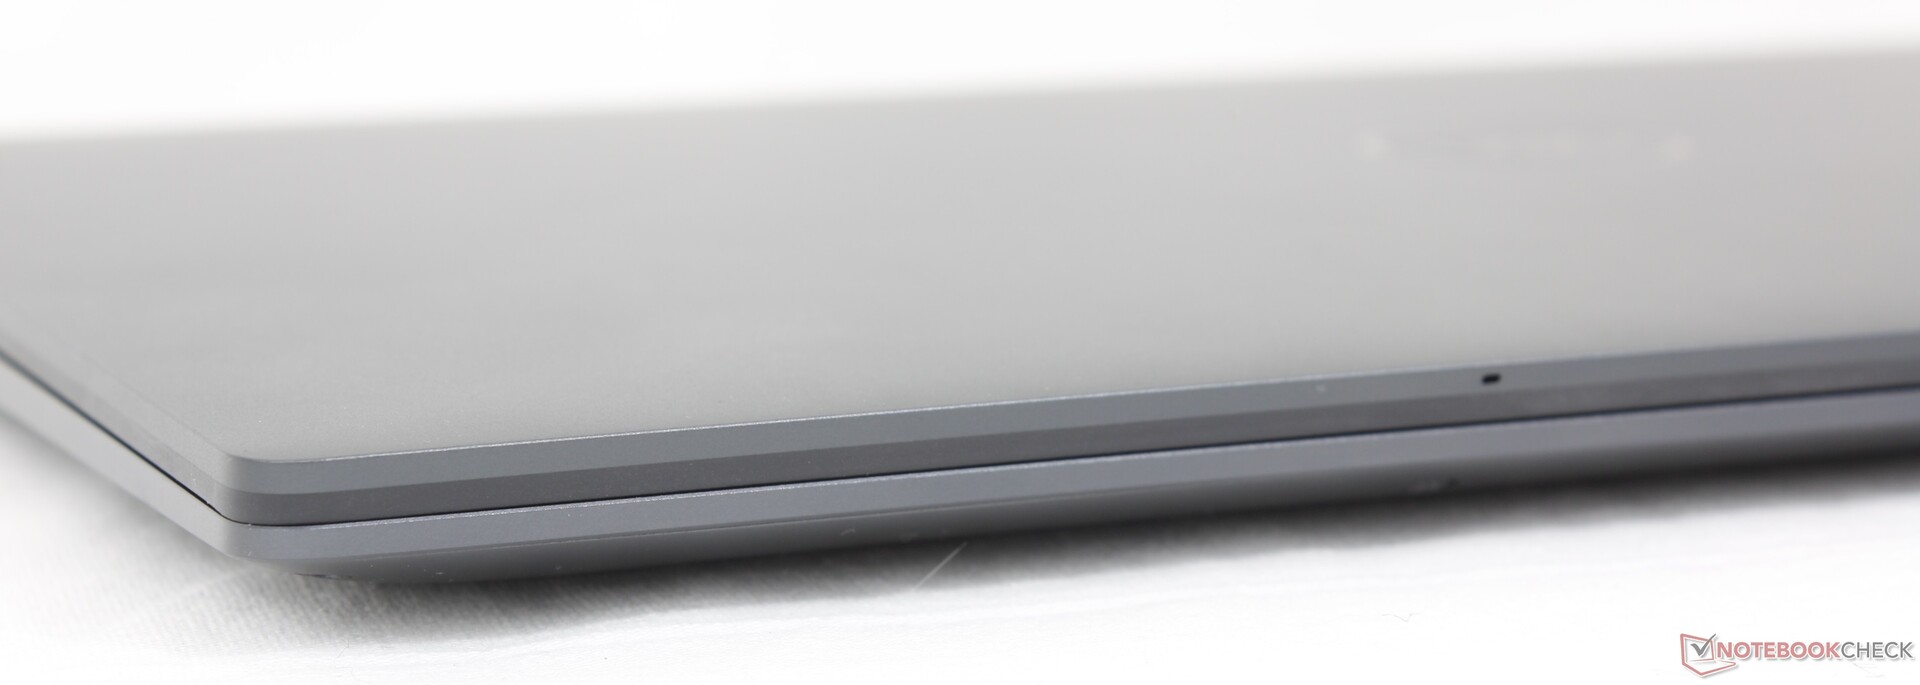
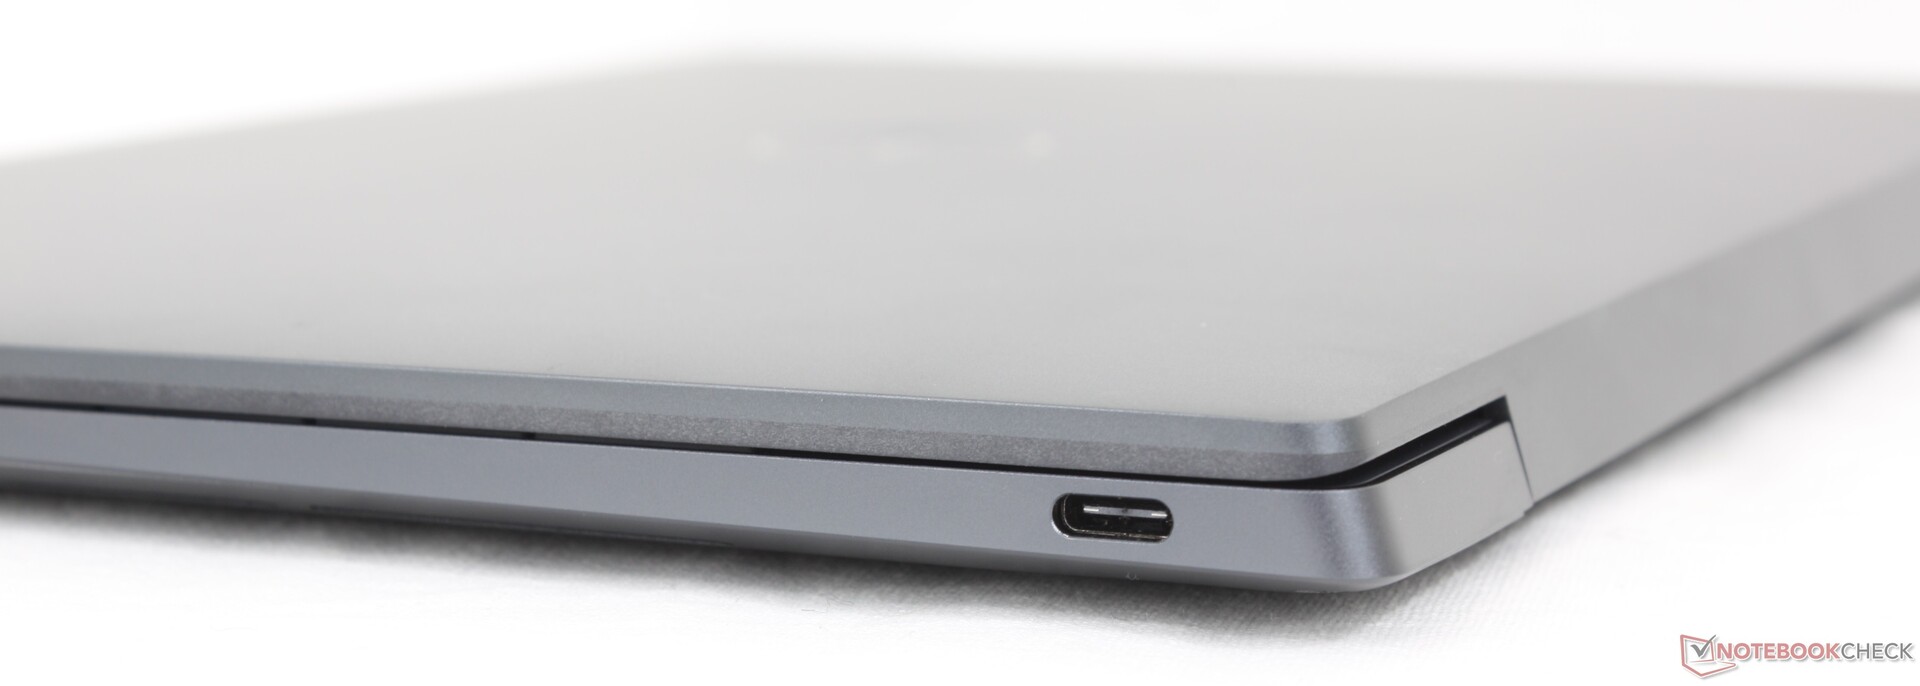
Caso - Aspetto e sensazione familiare
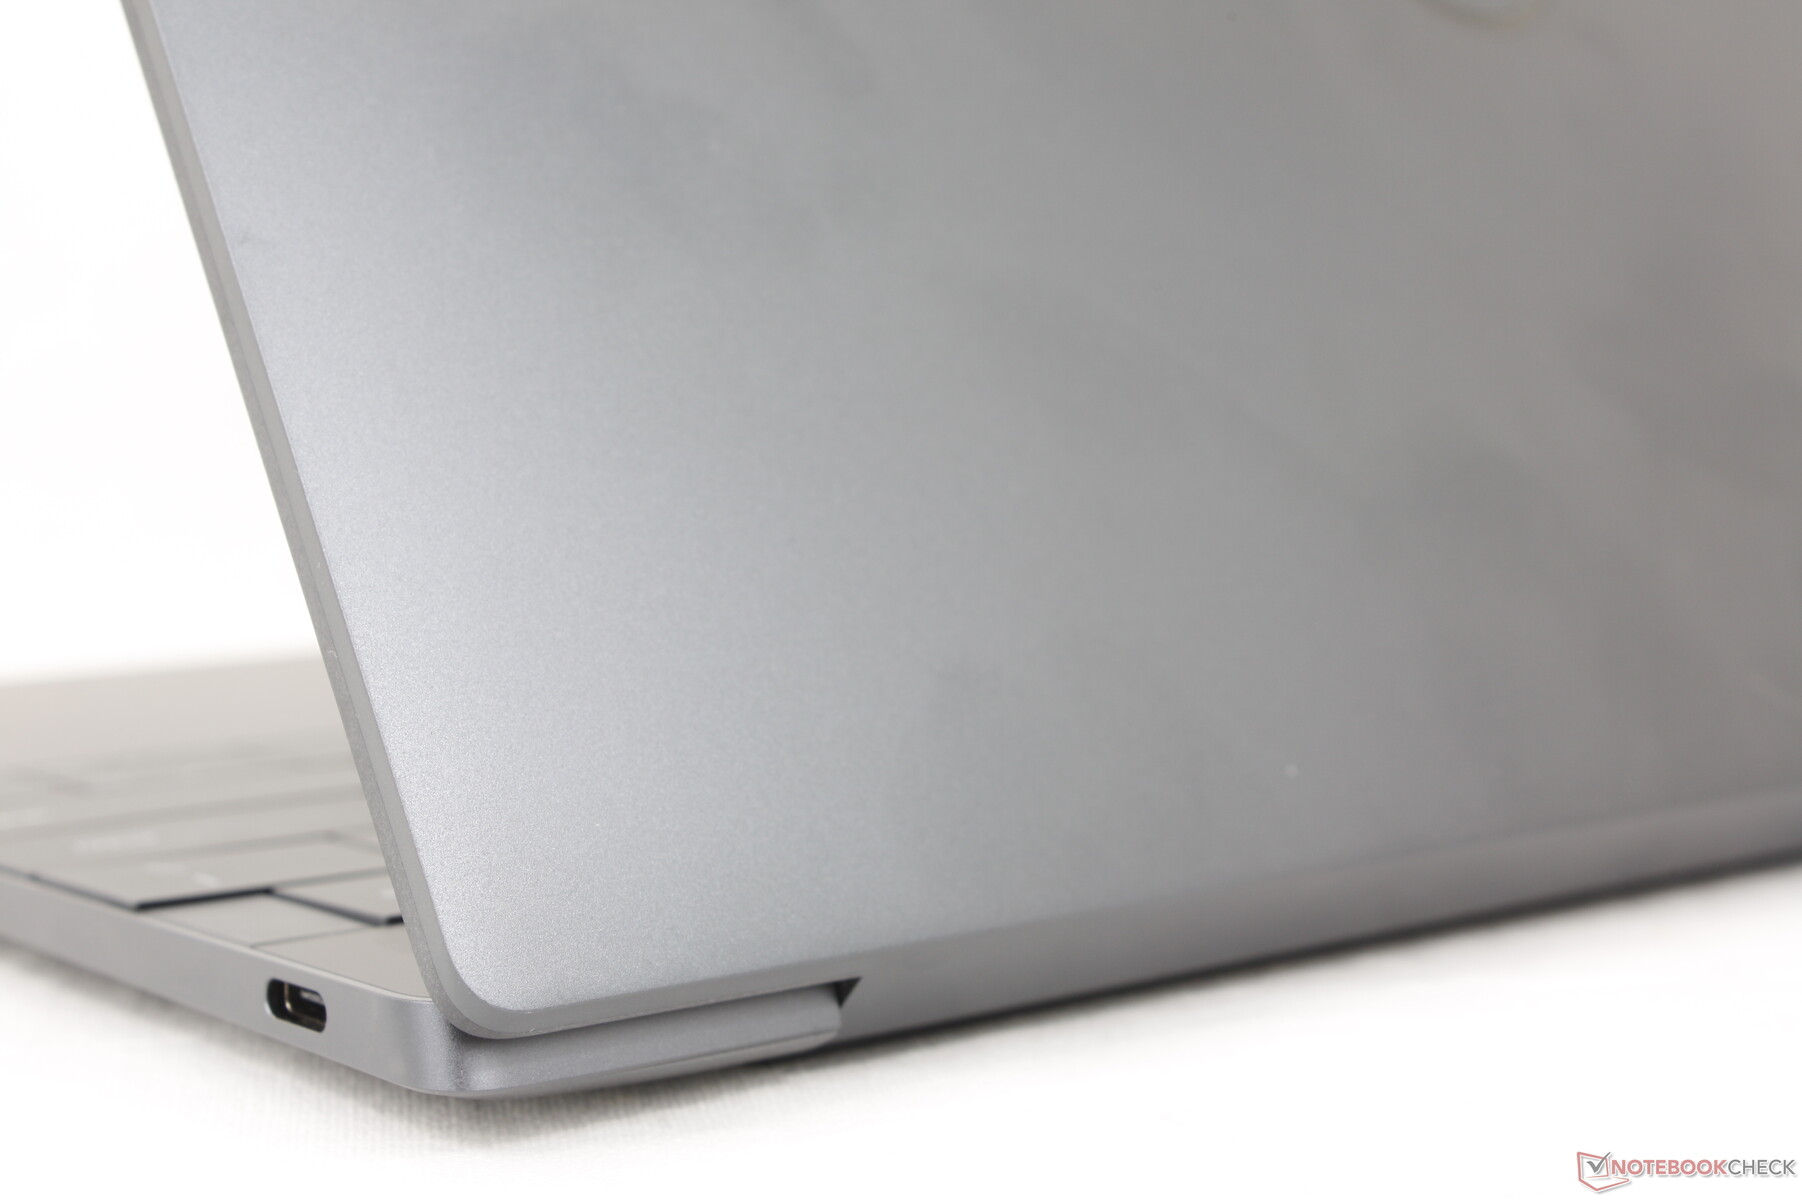
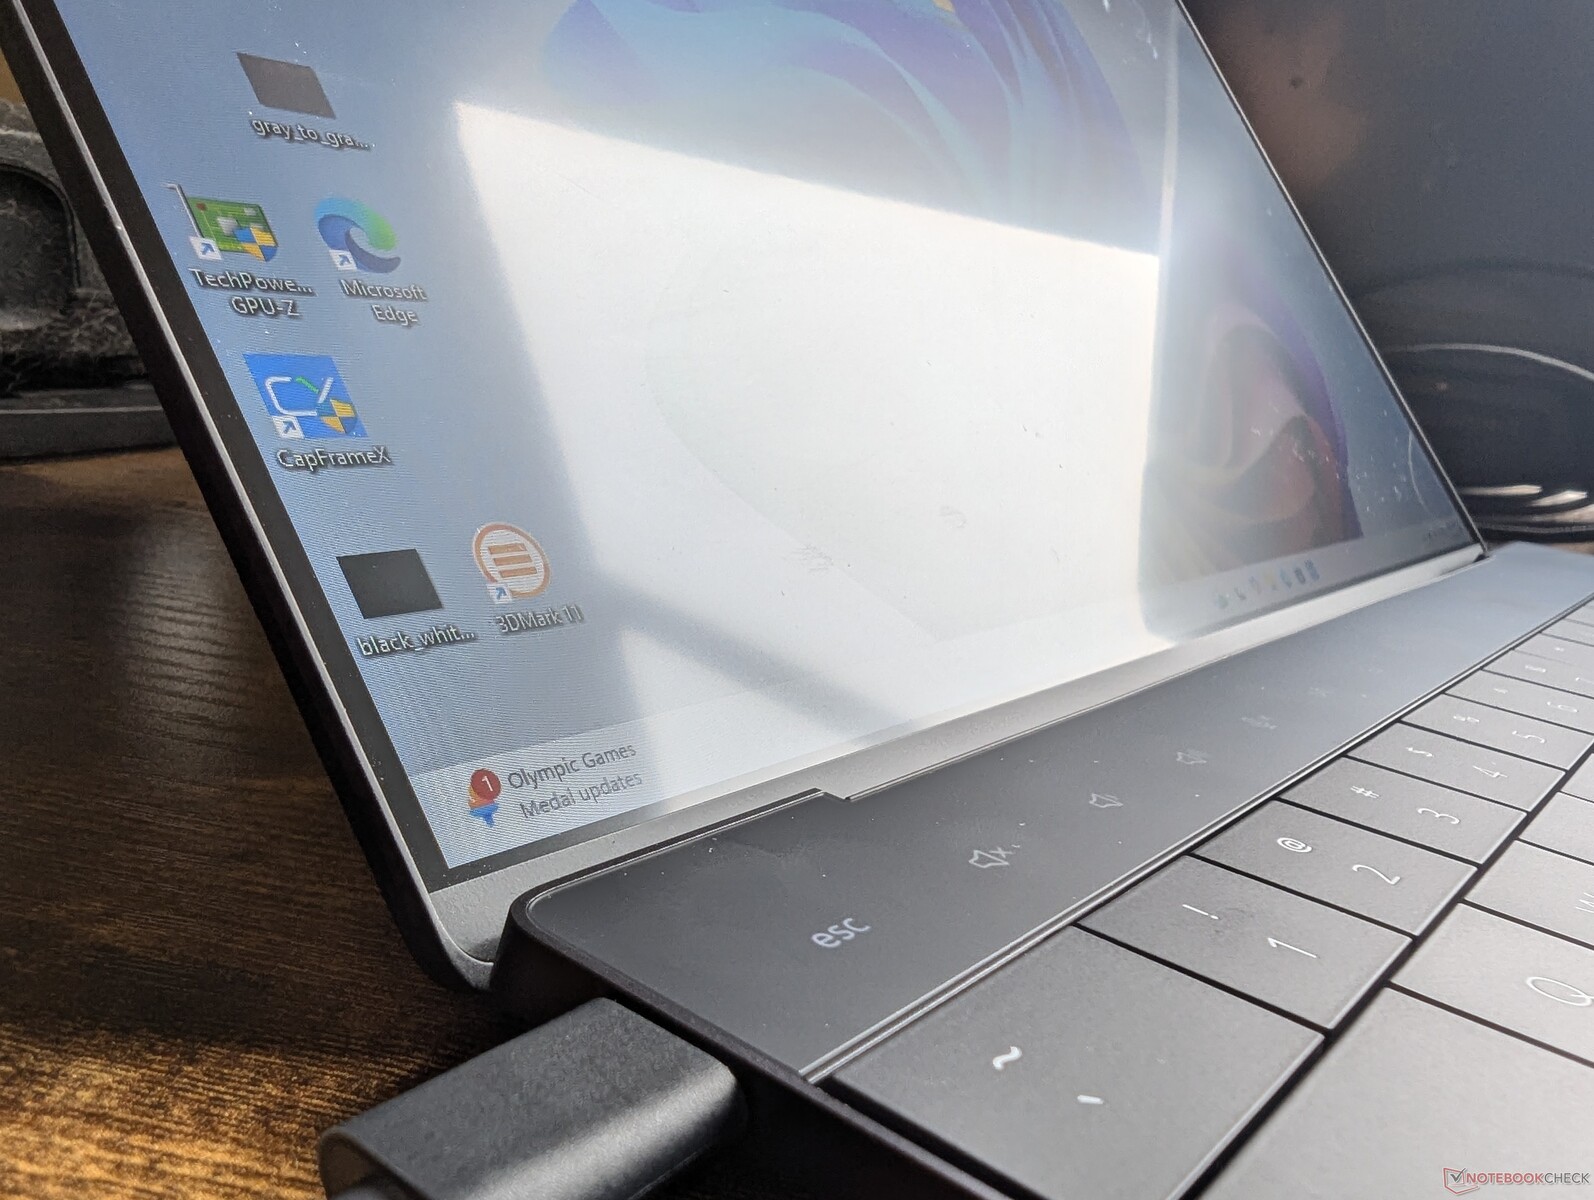
Non ci sono differenze esterne che separano il modello Qualcomm dal modello Intel e quindi i nostri commenti sul modello Intel si applicano anche in questo caso. Sarebbe stata gradita qualche nuova opzione di colore, ma sono valide le stesse opzioni Platinum e Graphite. Preferiamo leggermente l'opzione Platinum, in quanto il suo colore bianco brillante nasconde meglio le impronte digitali rispetto all'opzione Graphite, più scura, della nostra unità di test Qualcomm, soprattutto lungo i poggiapolsi e il coperchio esterno.
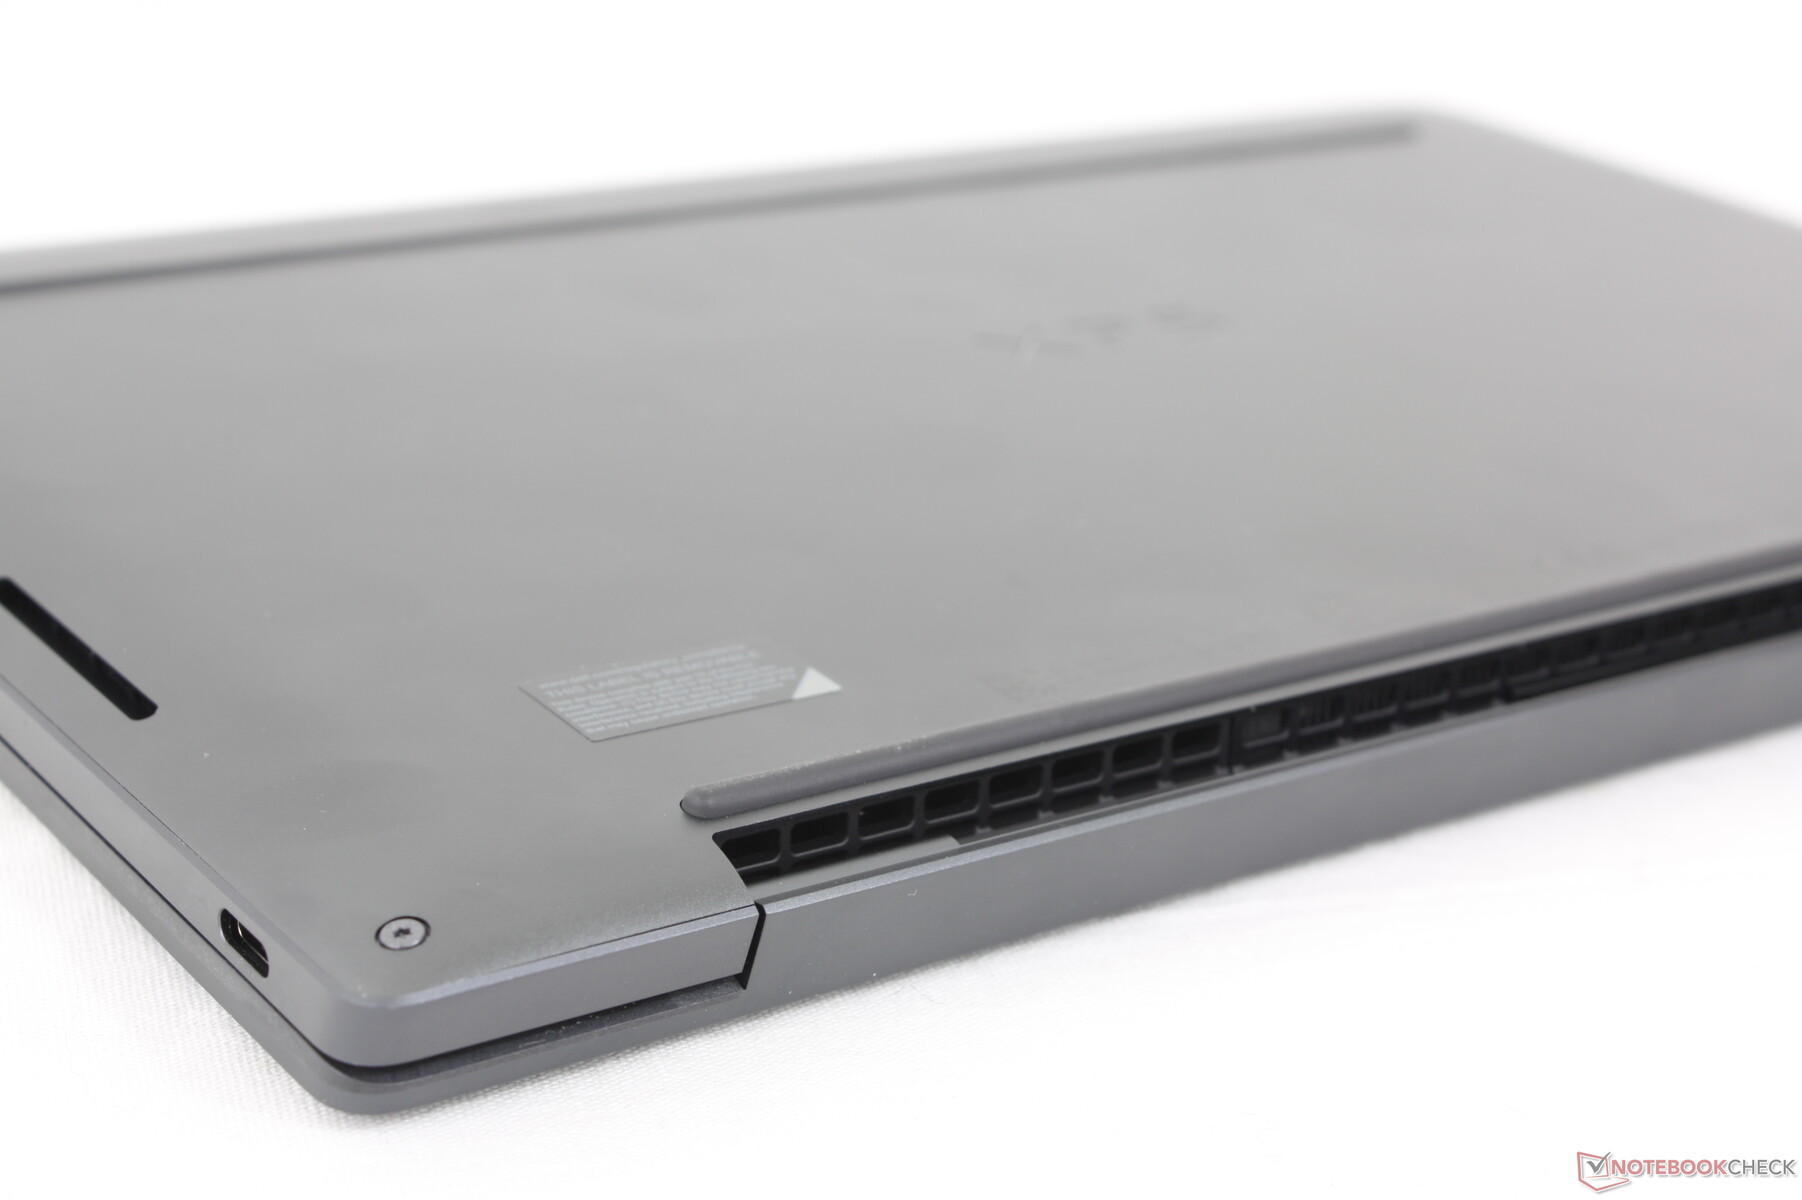
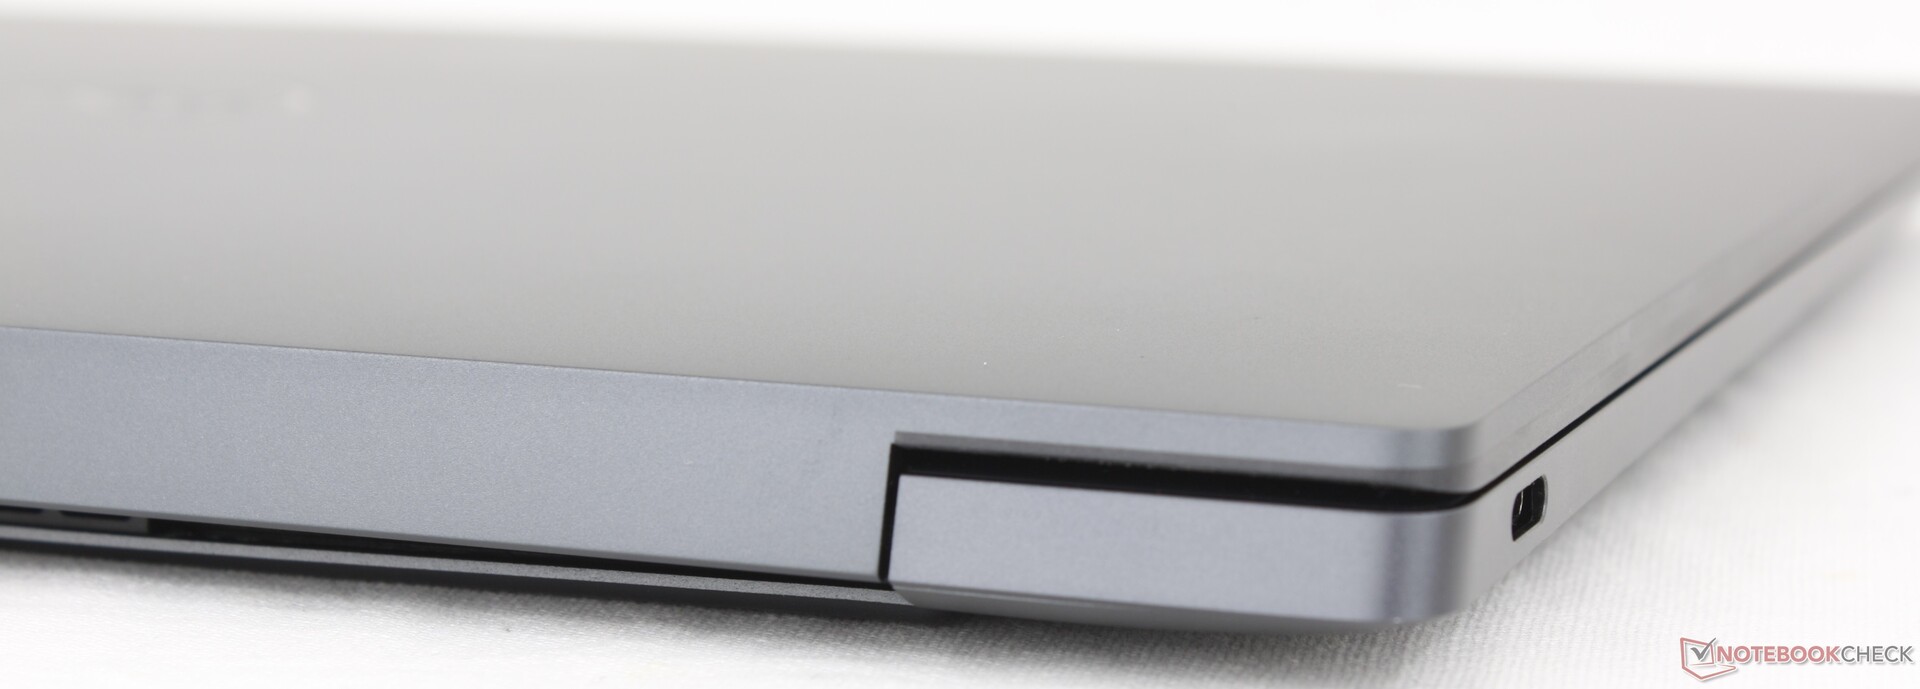
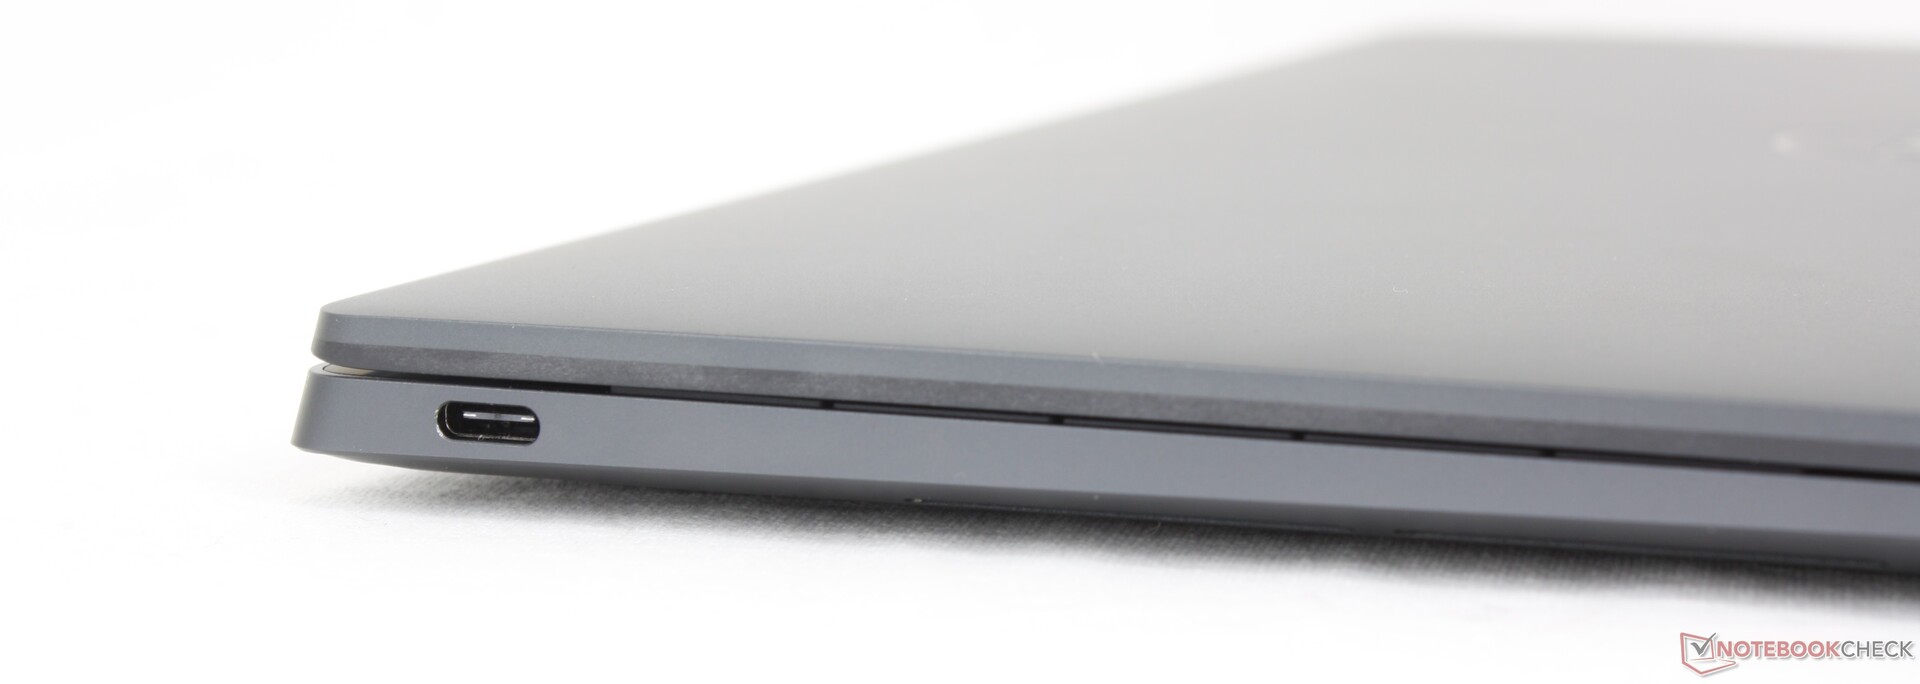
Connettività
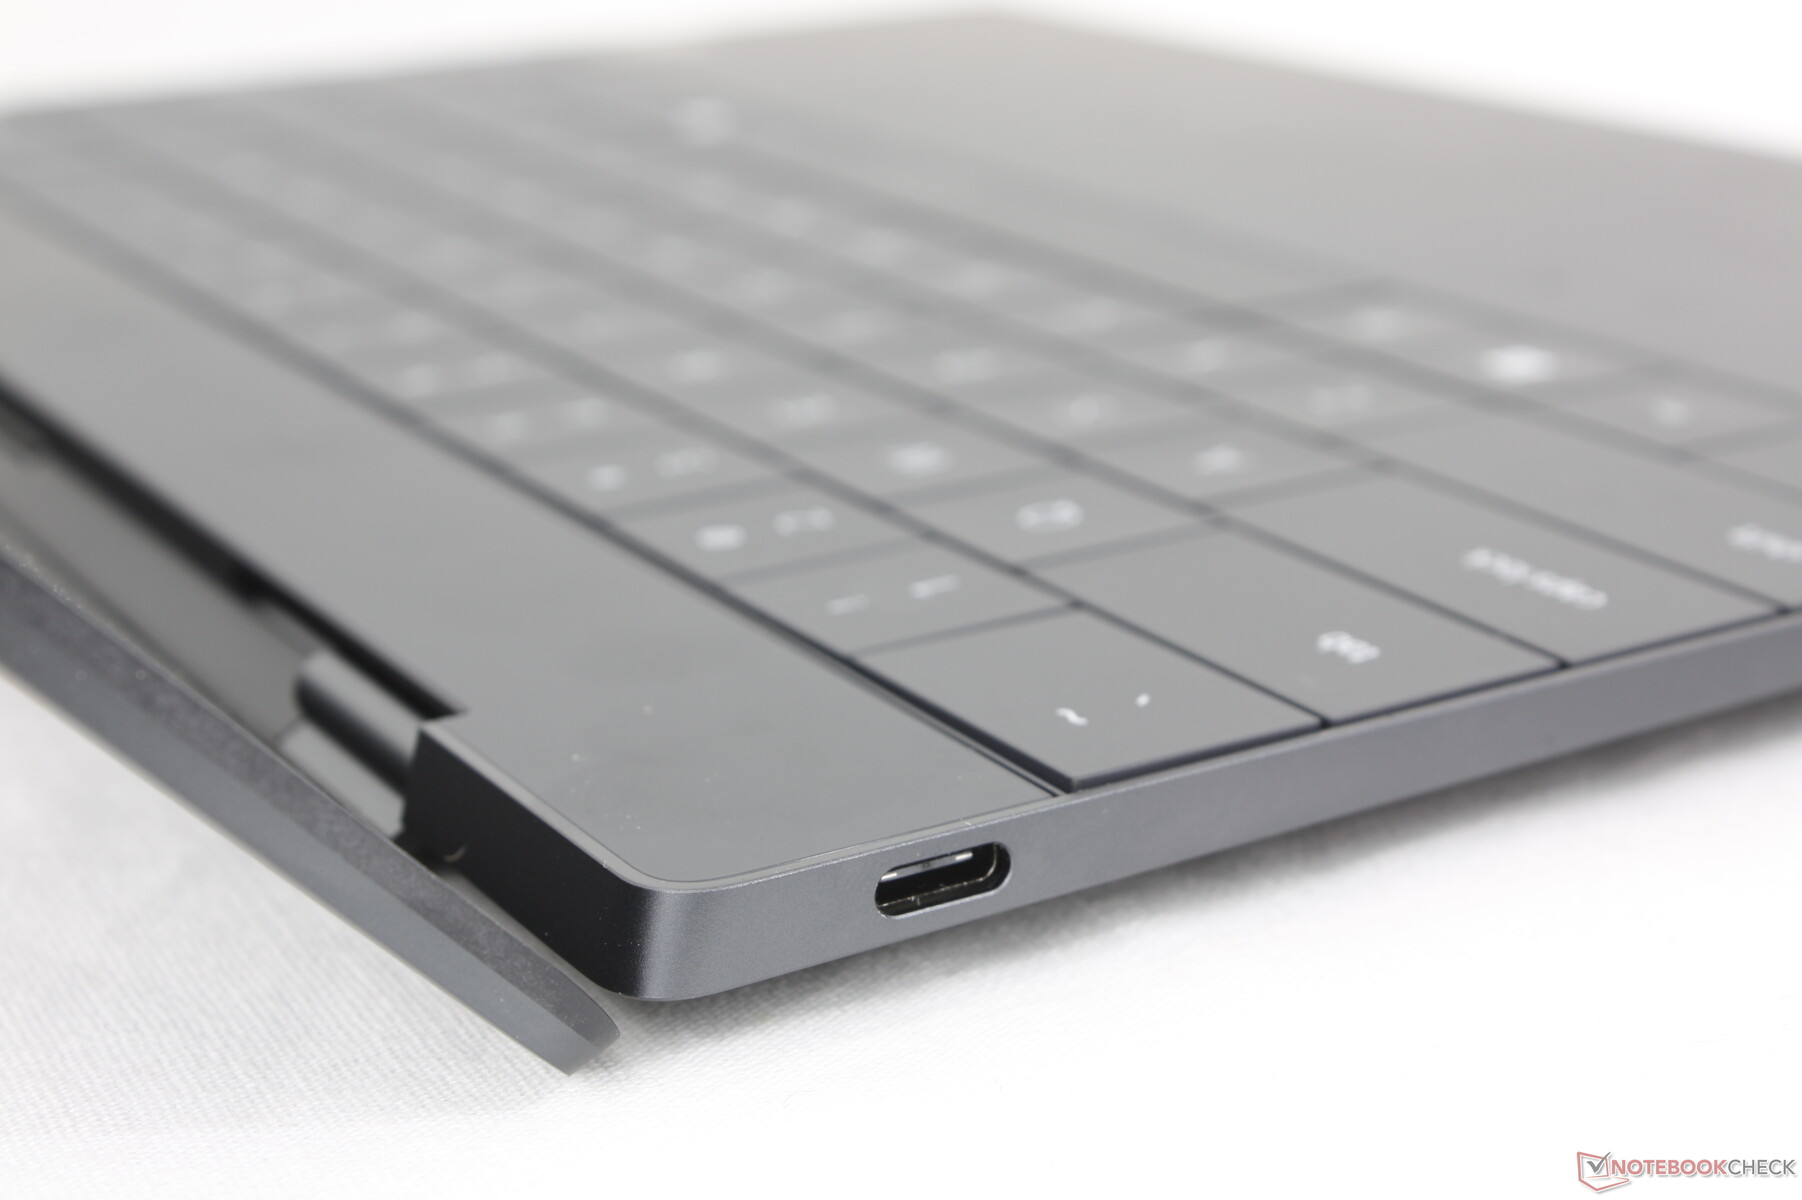
Sono presenti due porte USB-C 4.0, proprio come nella versione Intel dell'XPS 13. Tuttavia, le porte qui non supportano Thunderbolt e quindi la compatibilità con l'eGPU non è garantita. Quando abbiamo cercato di collegare la nostra Aorus RTX 2080 Ti Gaming Box, ad esempio, il portatile Qualcomm non è stato in grado di riconoscere la eGPU, mentre un PC abilitato a Thunderbolt l'avrebbe riconosciuta automaticamente attraverso Gestione dispositivi. Qualcomm ha dichiarato che qualsiasi supporto e driver applicabile spetterà ai singoli produttori di eGPU, il che non è promettente per i proprietari di eGPU esistenti.
Comunicazione
Dell ha sostituito il BE200 dell'XPS 13 Intel con il FastConnect 7800 dell'XPS 13 Qualcomm. Il modulo supporta la connettività Wi-Fi 7, ancora poco diffusa nella maggior parte delle famiglie. Le prestazioni sono comunque stabili quando viene abbinato al nostro router di prova Wi-Fi 6E AXE11000.
Webcam
Il modello è dotato di serie della stessa webcam da 2 MP presente sull'XPS 13 9340, invece della webcam da 1 MP presente sull'XPS 13 9320 originale. Anche l'IR è integrato per supportare il riconoscimento facciale Windows Hello. Tuttavia, non c'è ancora una copertura per la fotocamera o un interruttore di spegnimento di cui parlare.


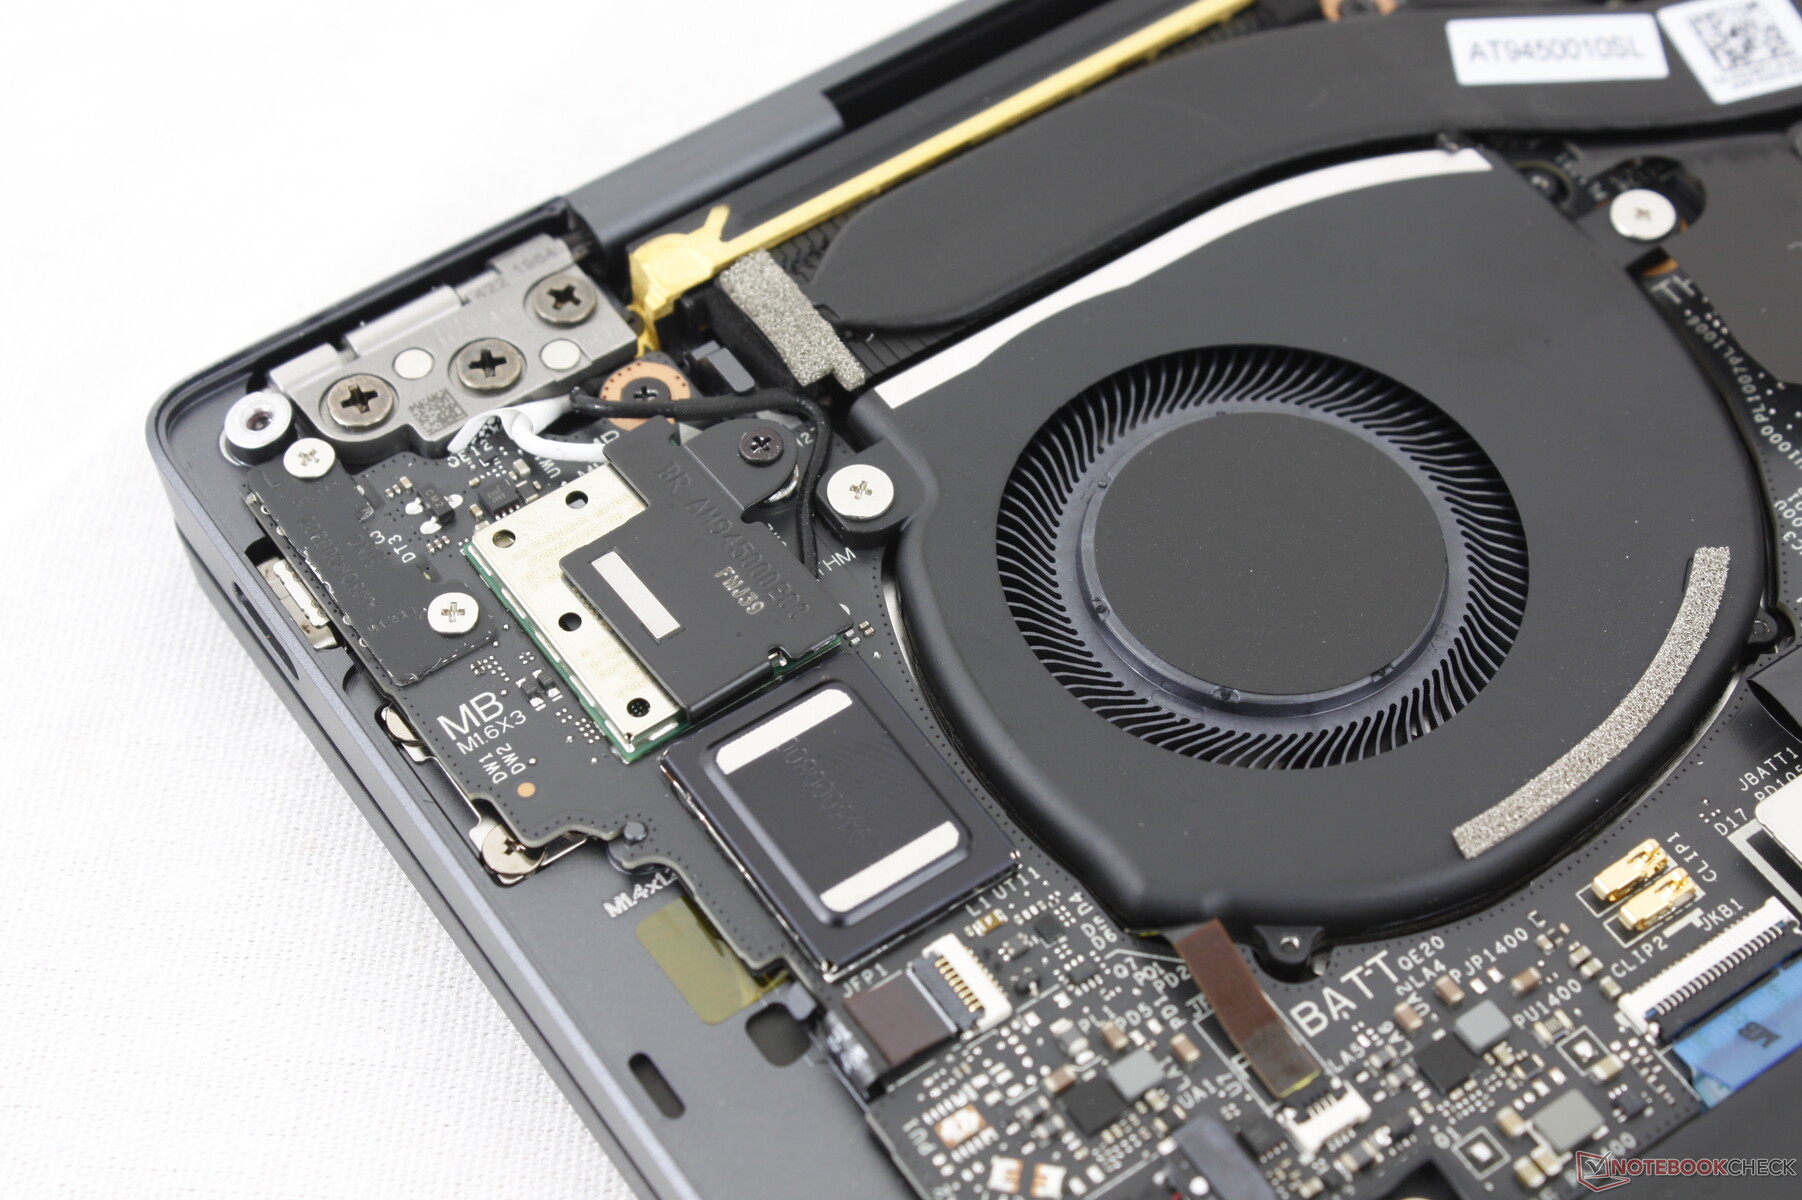
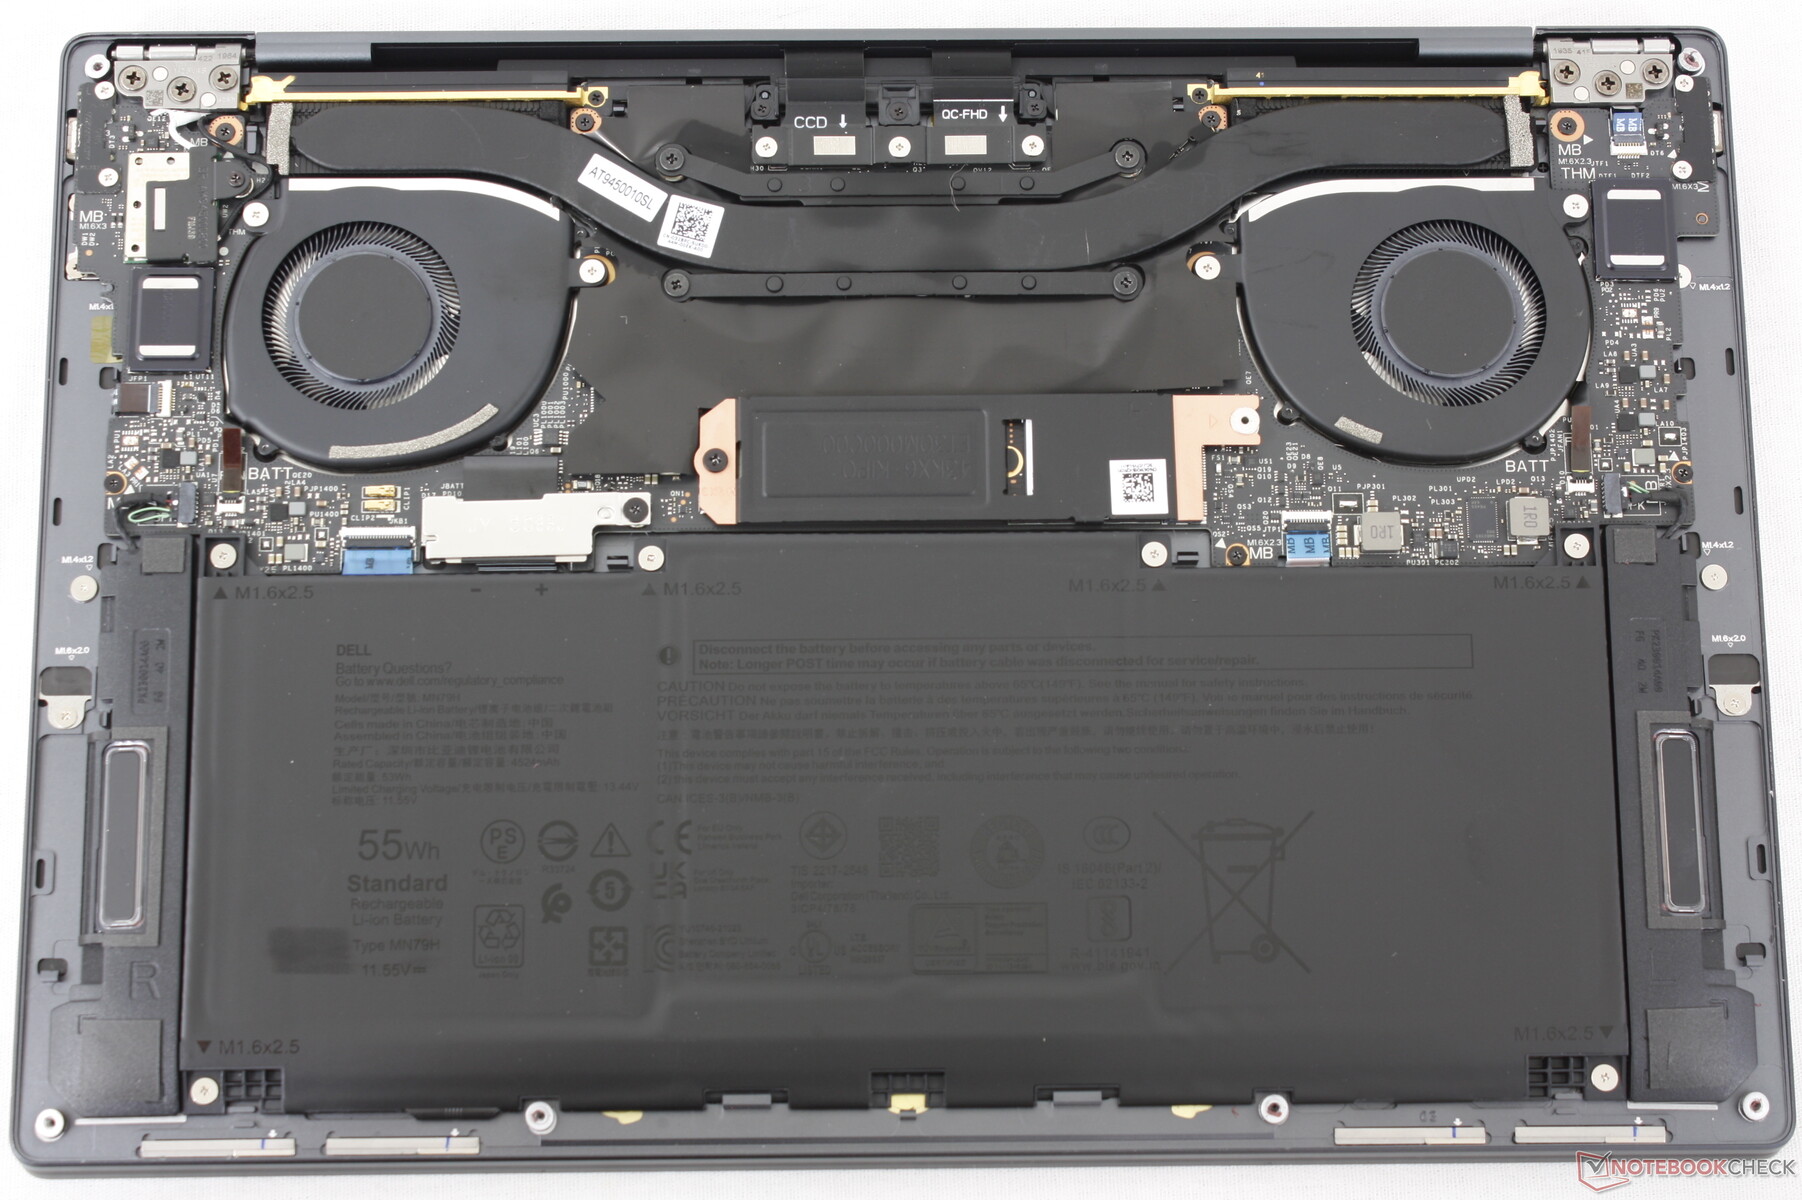
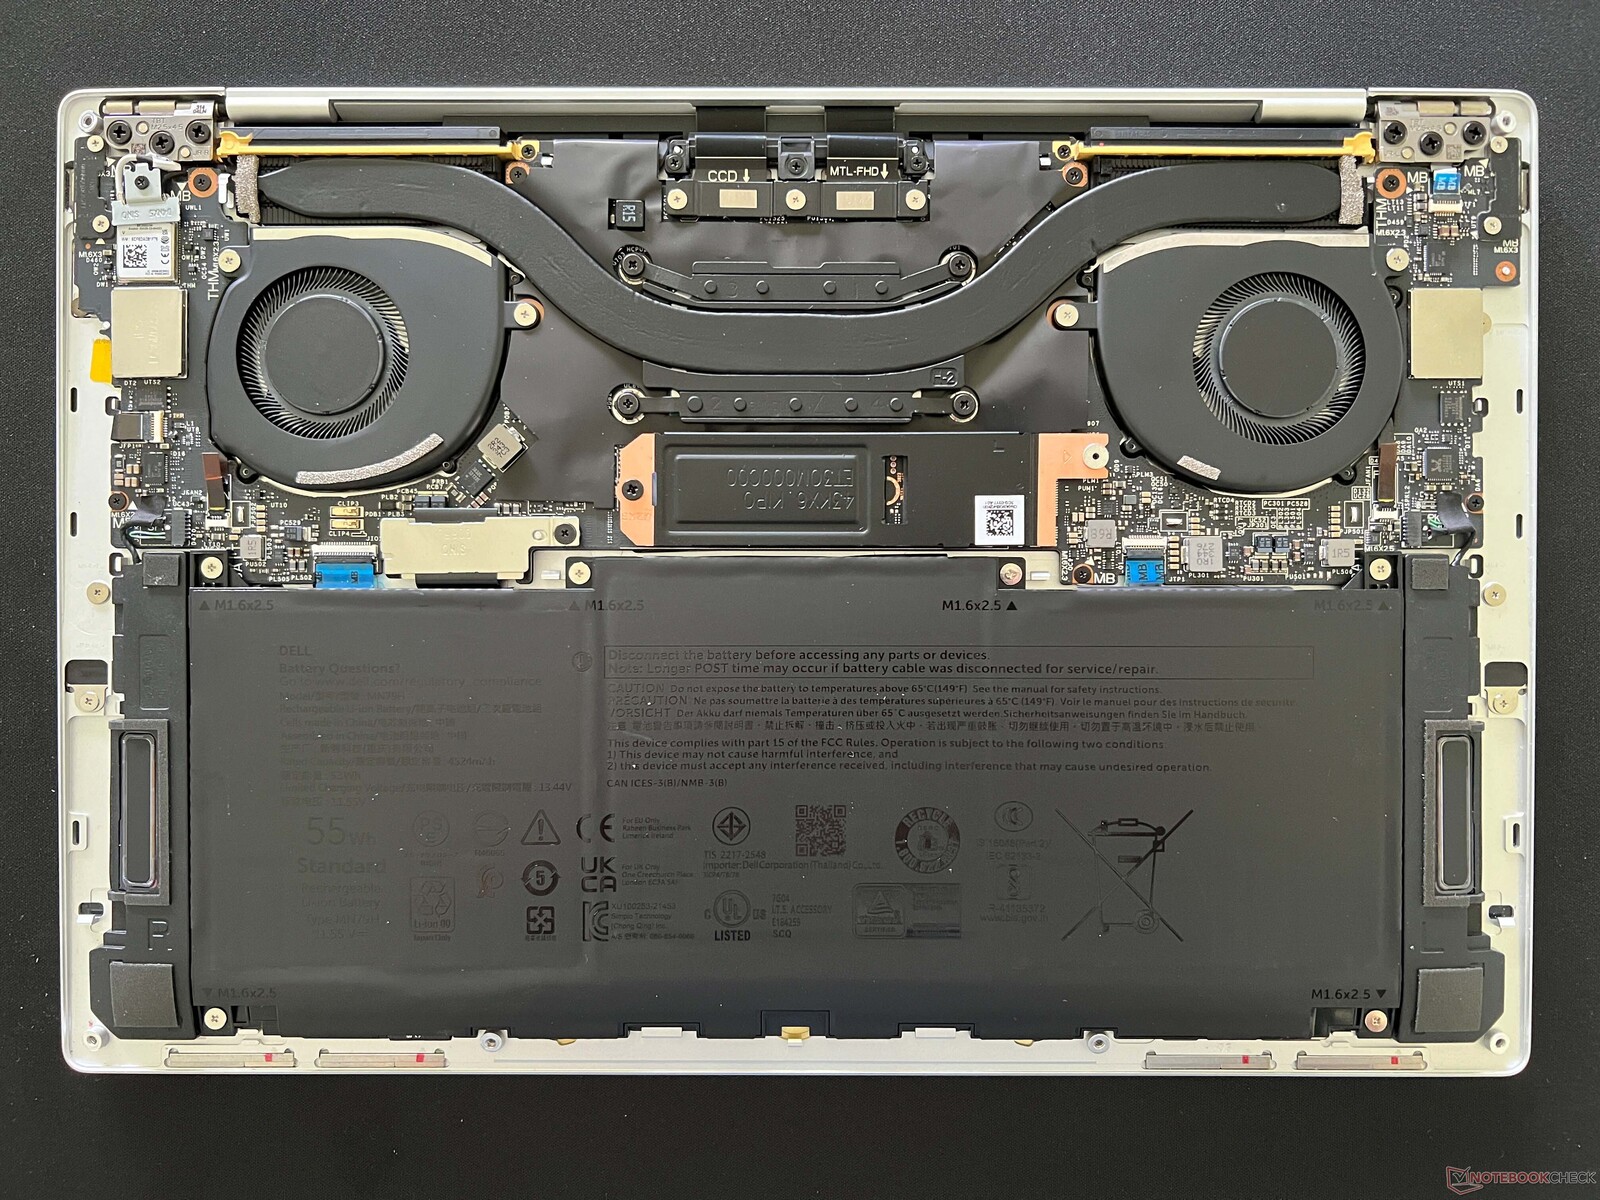
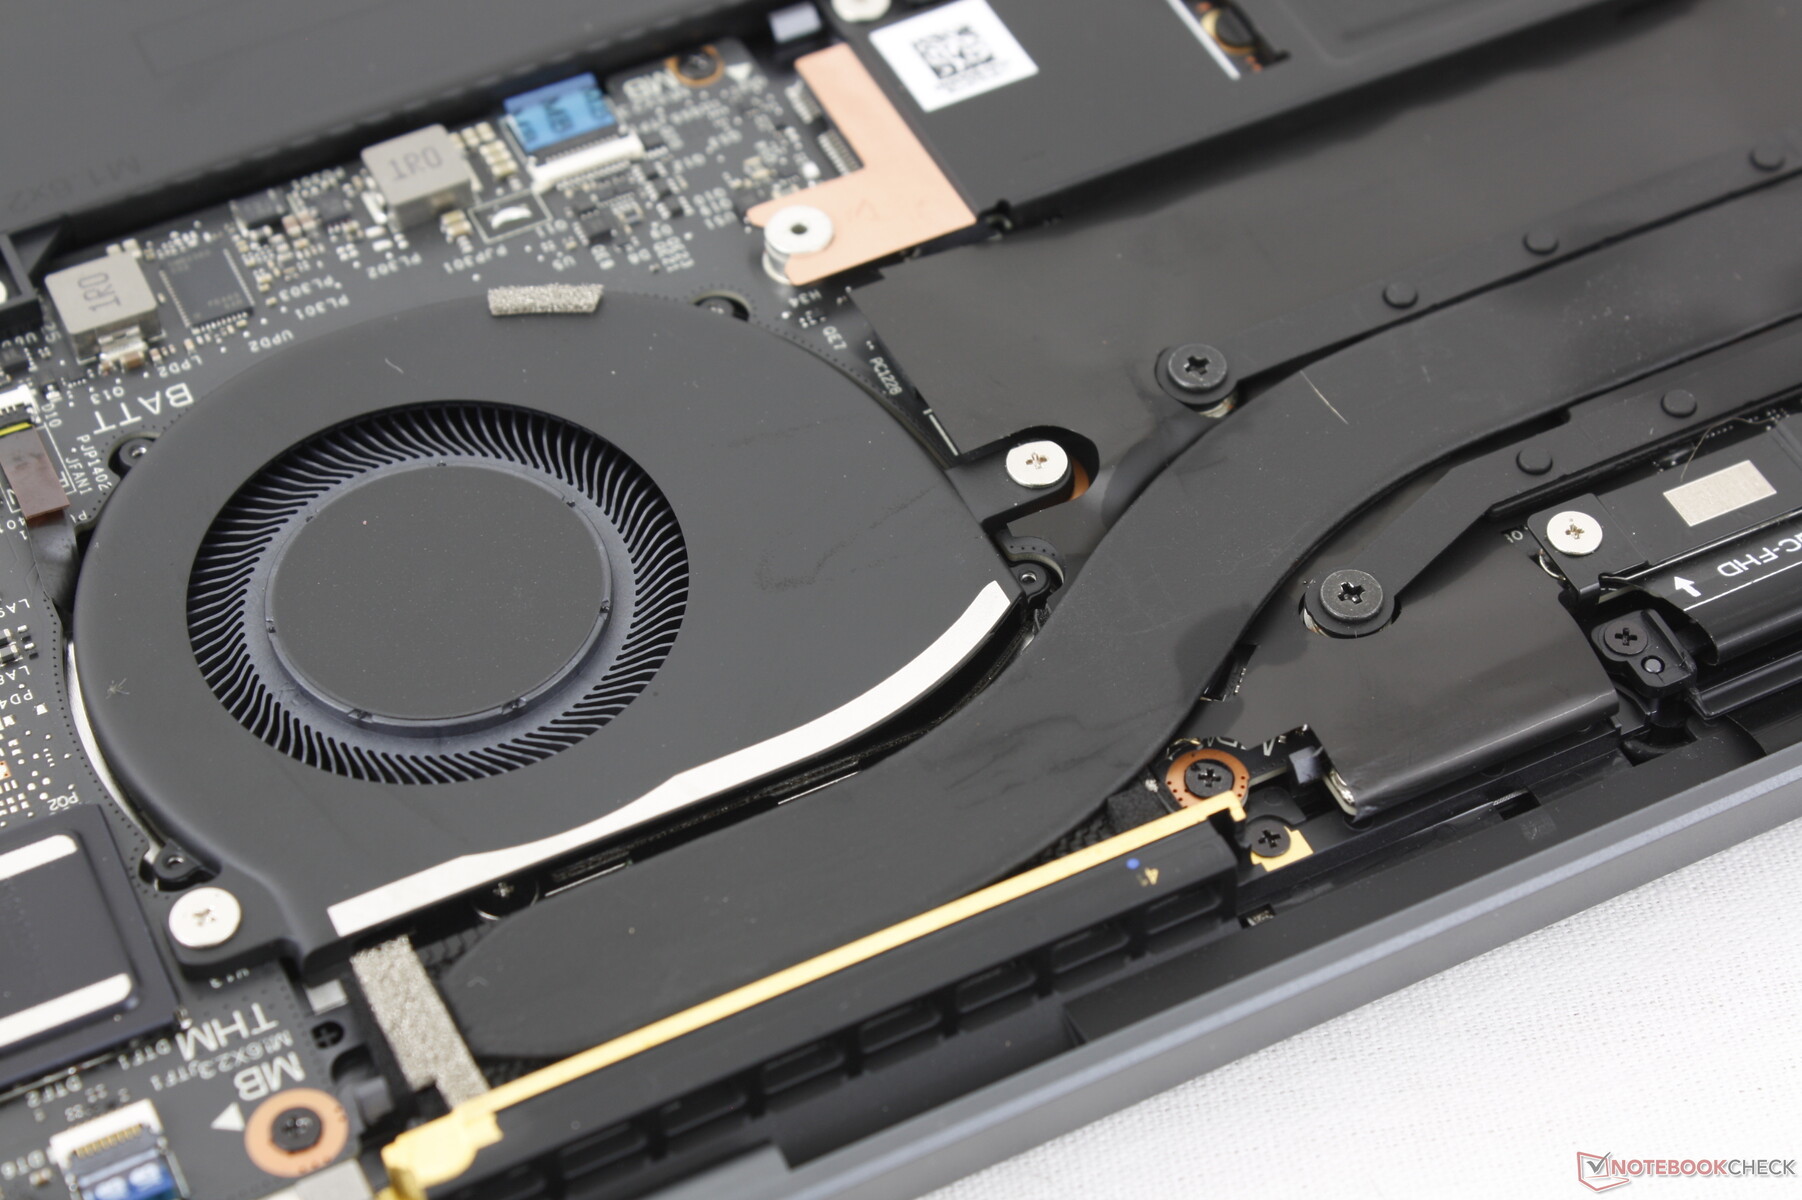
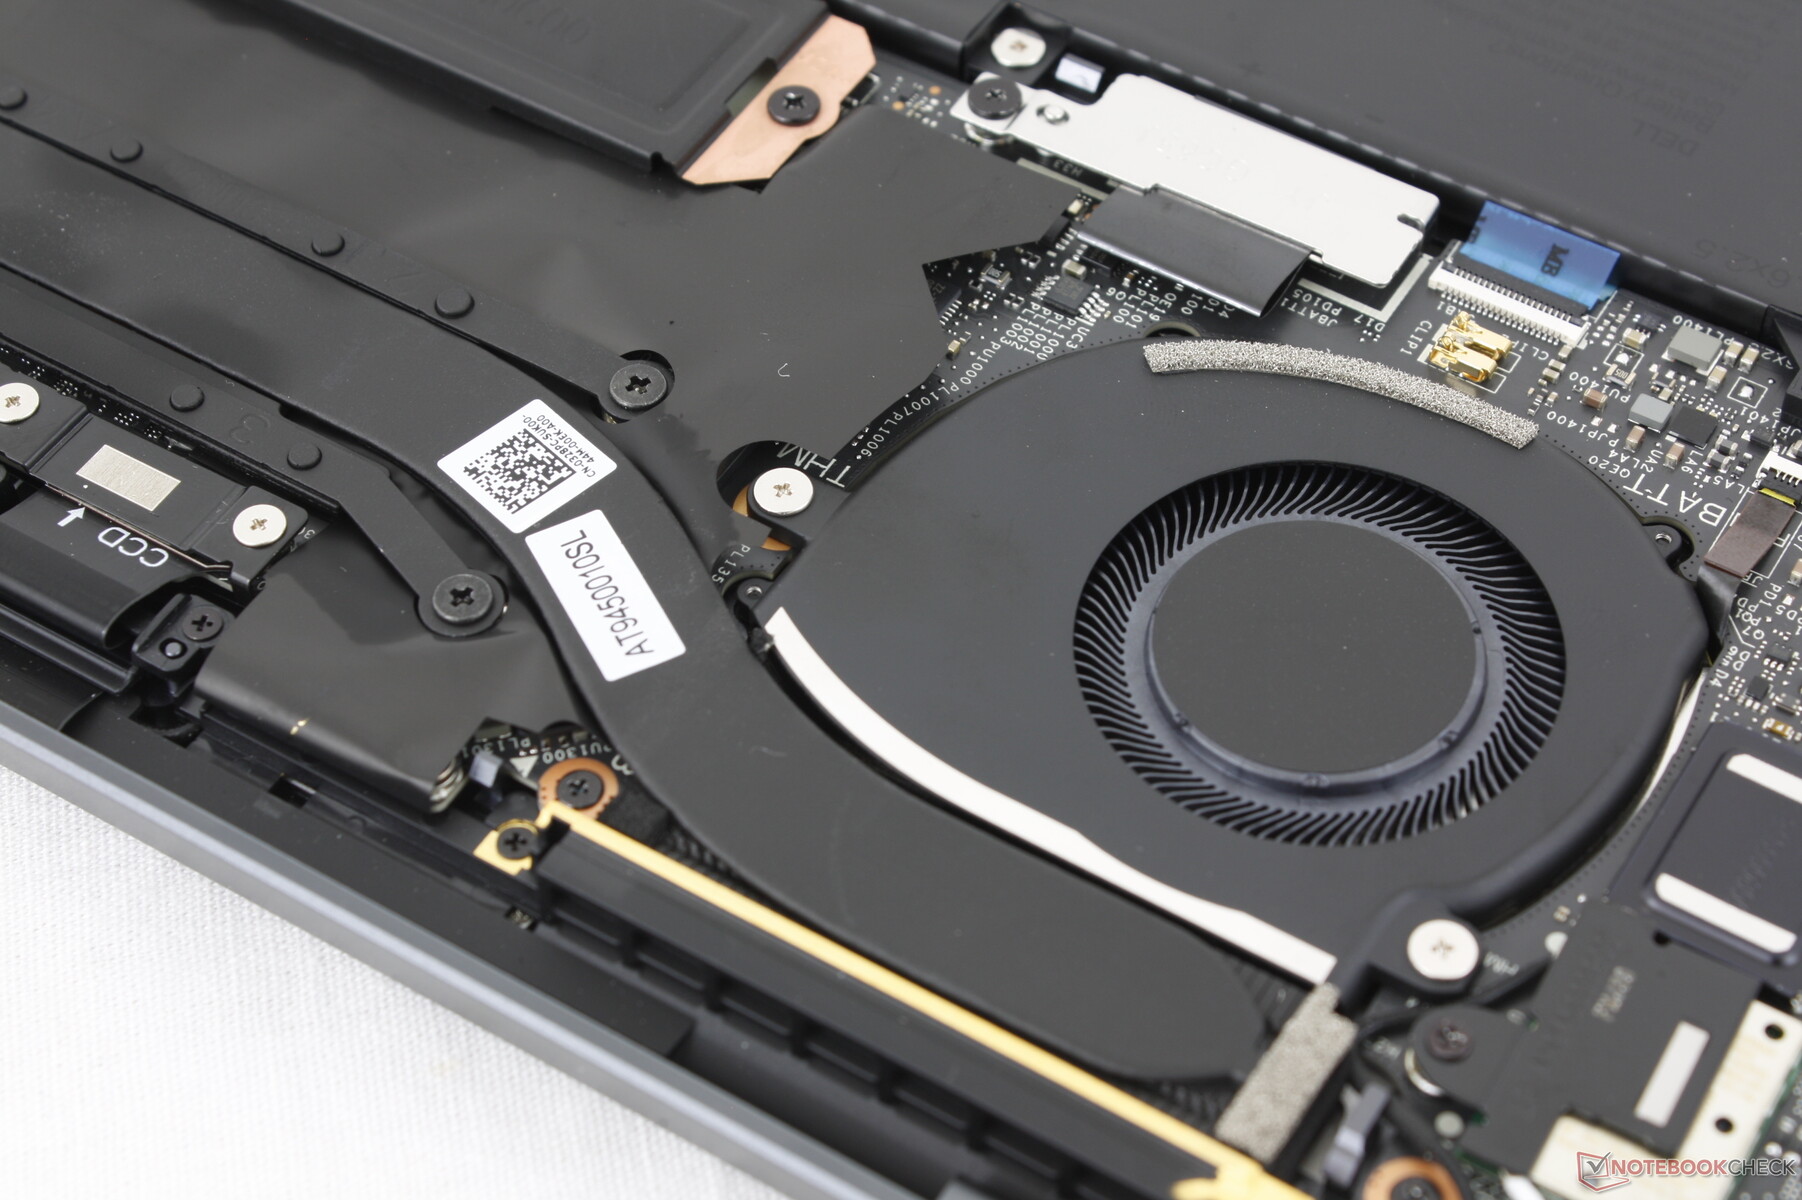
Manutenzione
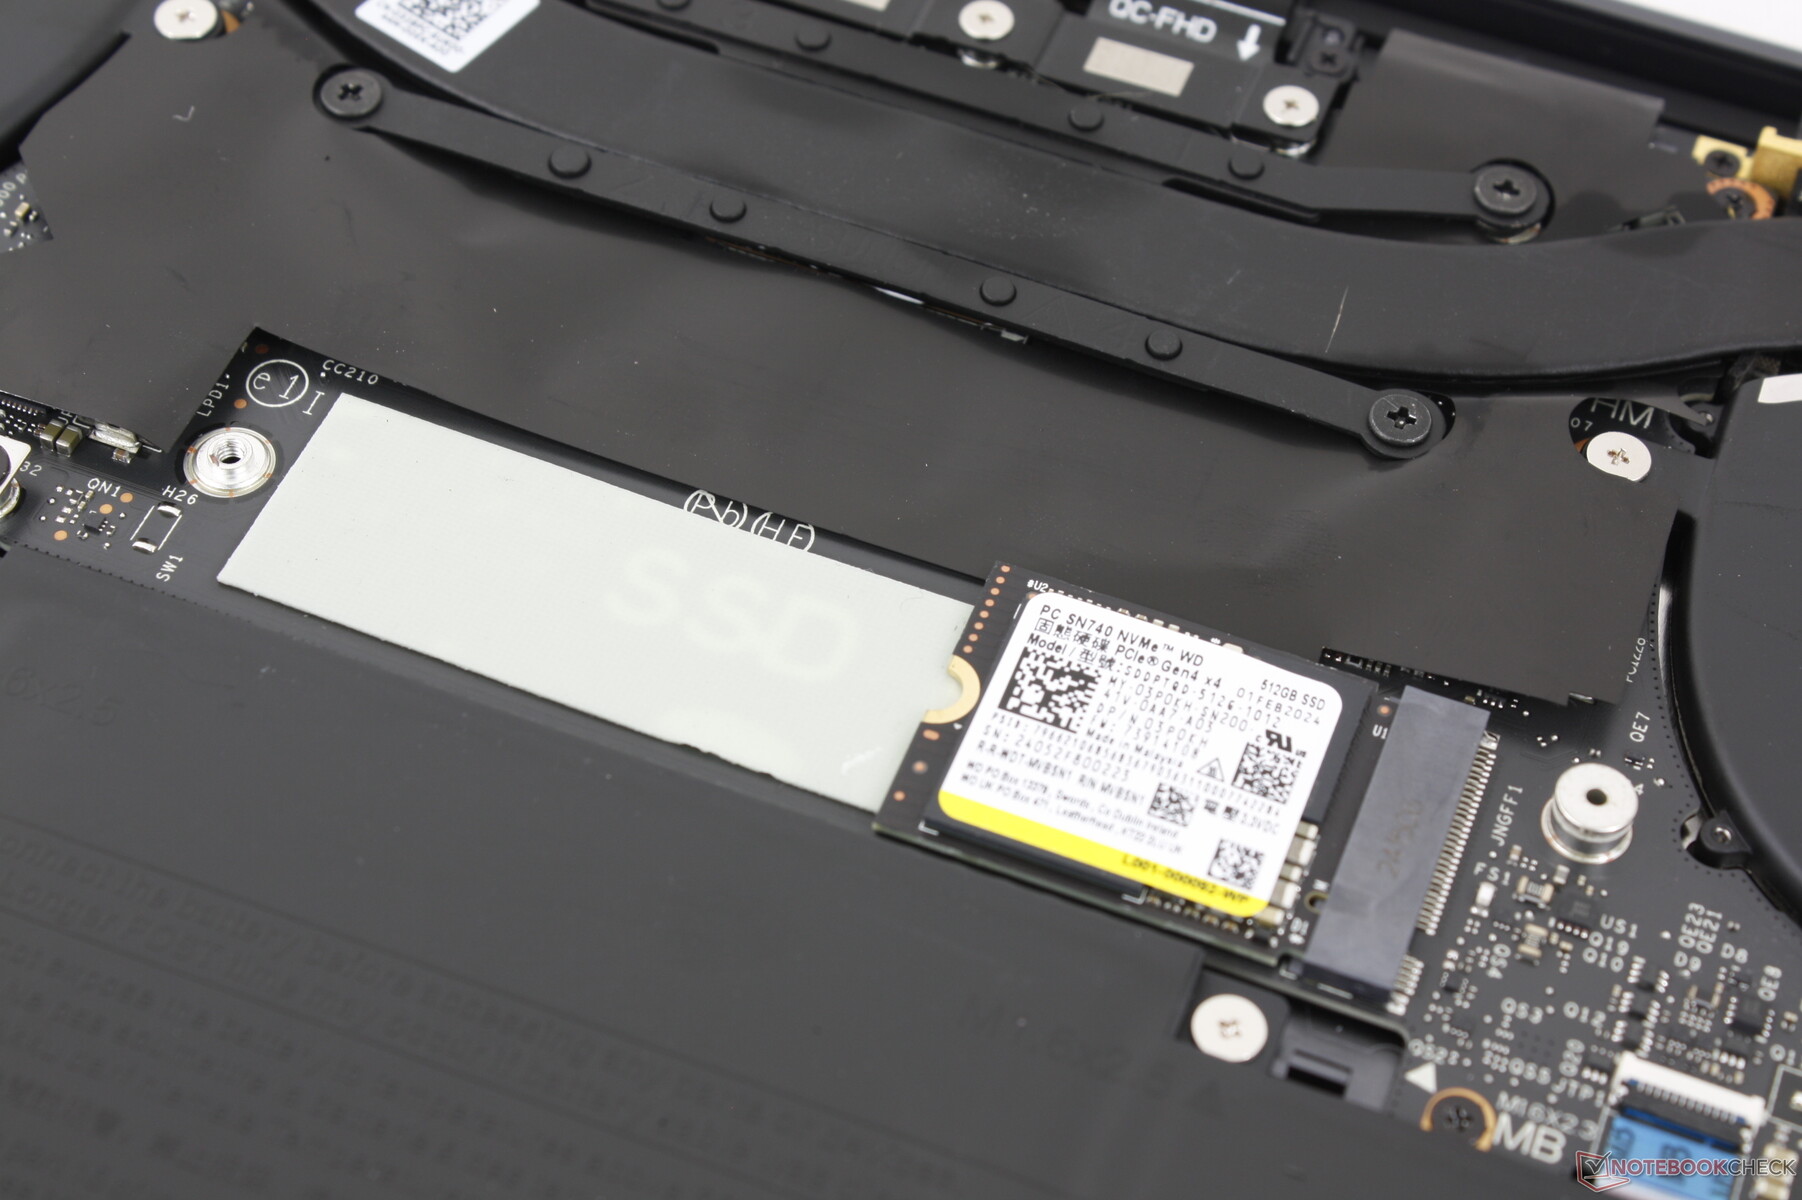
Il pannello inferiore richiede solo un cacciavite Torx per essere rimosso. Per il resto, non c'è nulla da aggiornare oltre al singolo SSD M.2, poiché sia la RAM che la WLAN sono saldate.
Sostenibilità
L'imballaggio è composto dal 75 percento di materiale riciclato e dal 25 percento di materiale rinnovabile per essere completamente riciclabile. Nel frattempo, il portatile stesso è stato prodotto con almeno il 20 percento di alluminio e vetro riciclati.
Accessori e garanzia
Nella confezione non ci sono altri extra oltre all'adattatore CA e alla documentazione, mentre i modelli XPS basati su Intel spesso includono un adattatore da USB-C a USB-A in omaggio.
Se acquistato negli Stati Uniti, si applica la consueta garanzia limitata di un anno del produttore.
Dispositivi di input - Look più pulito a scapito dell'usabilità
Tastiera
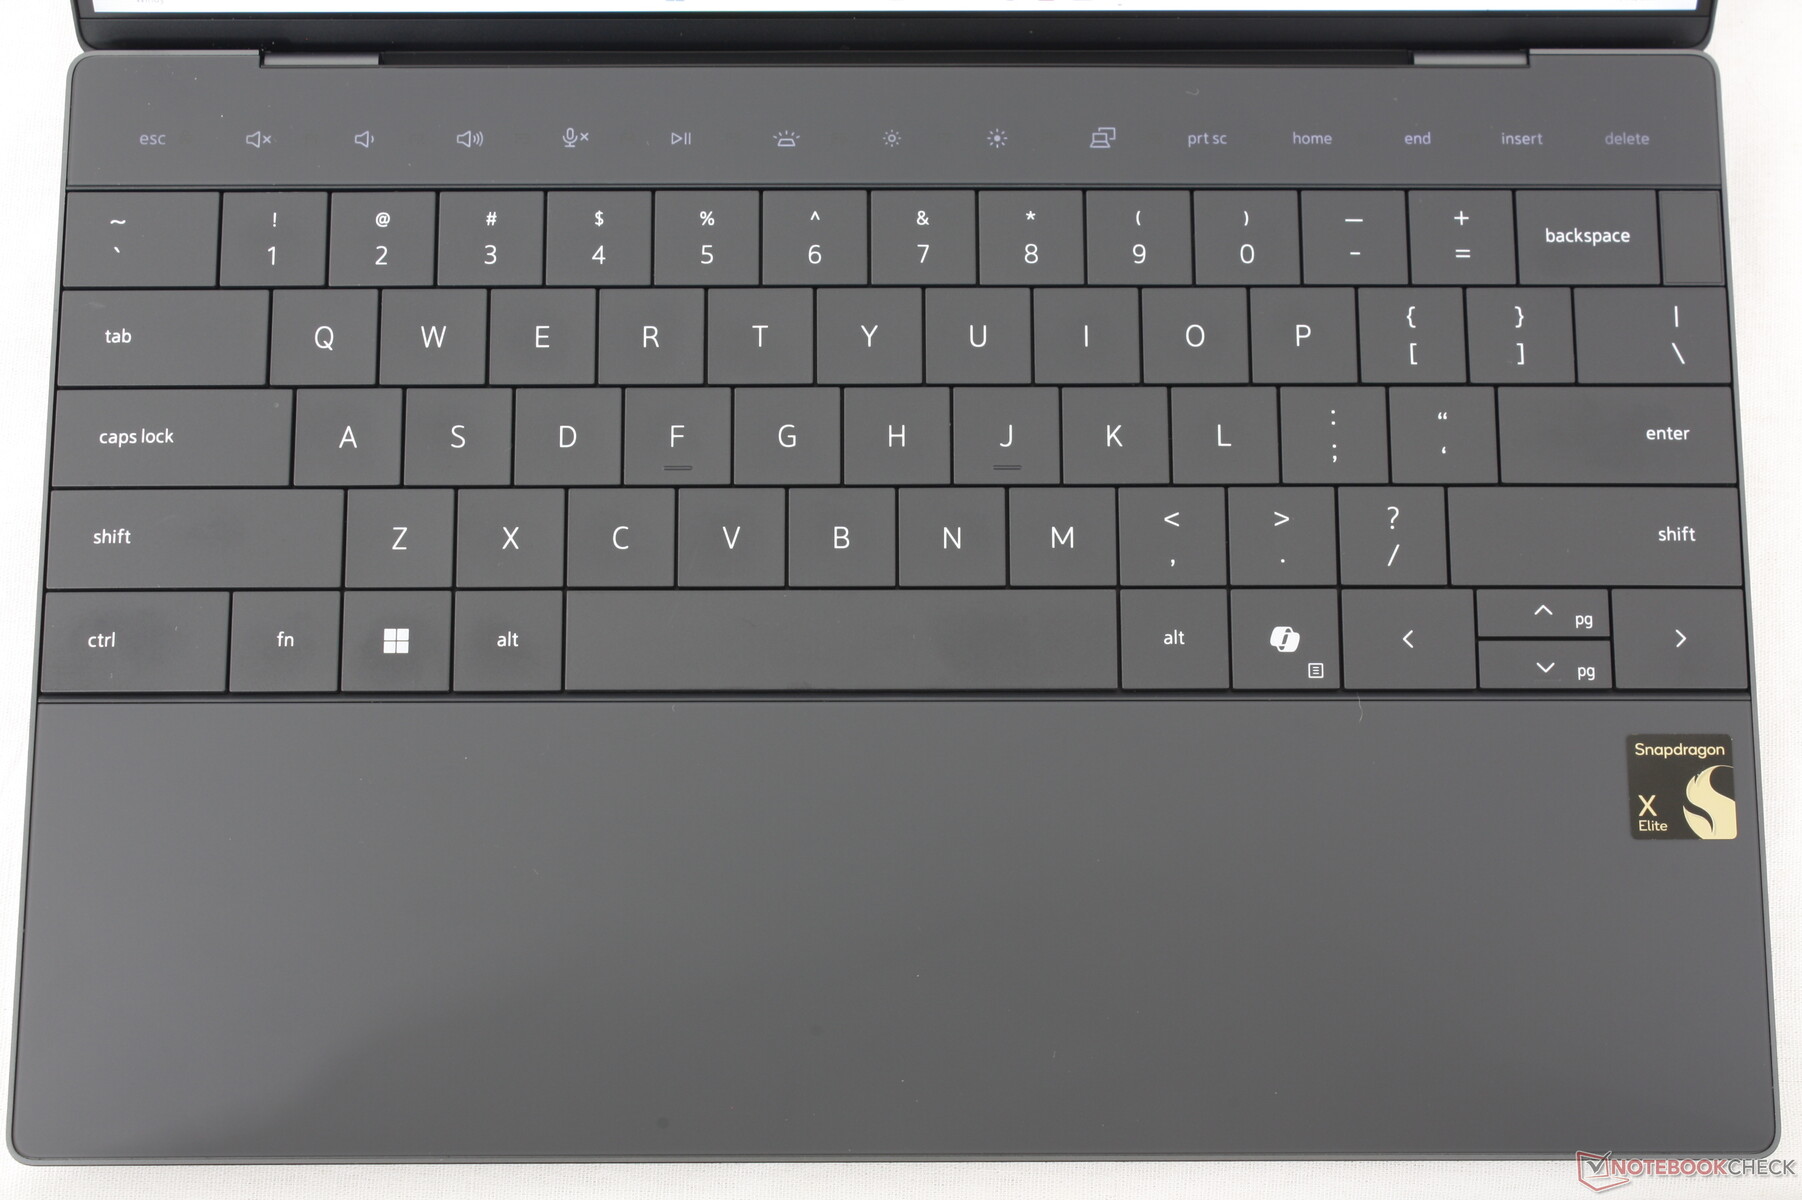
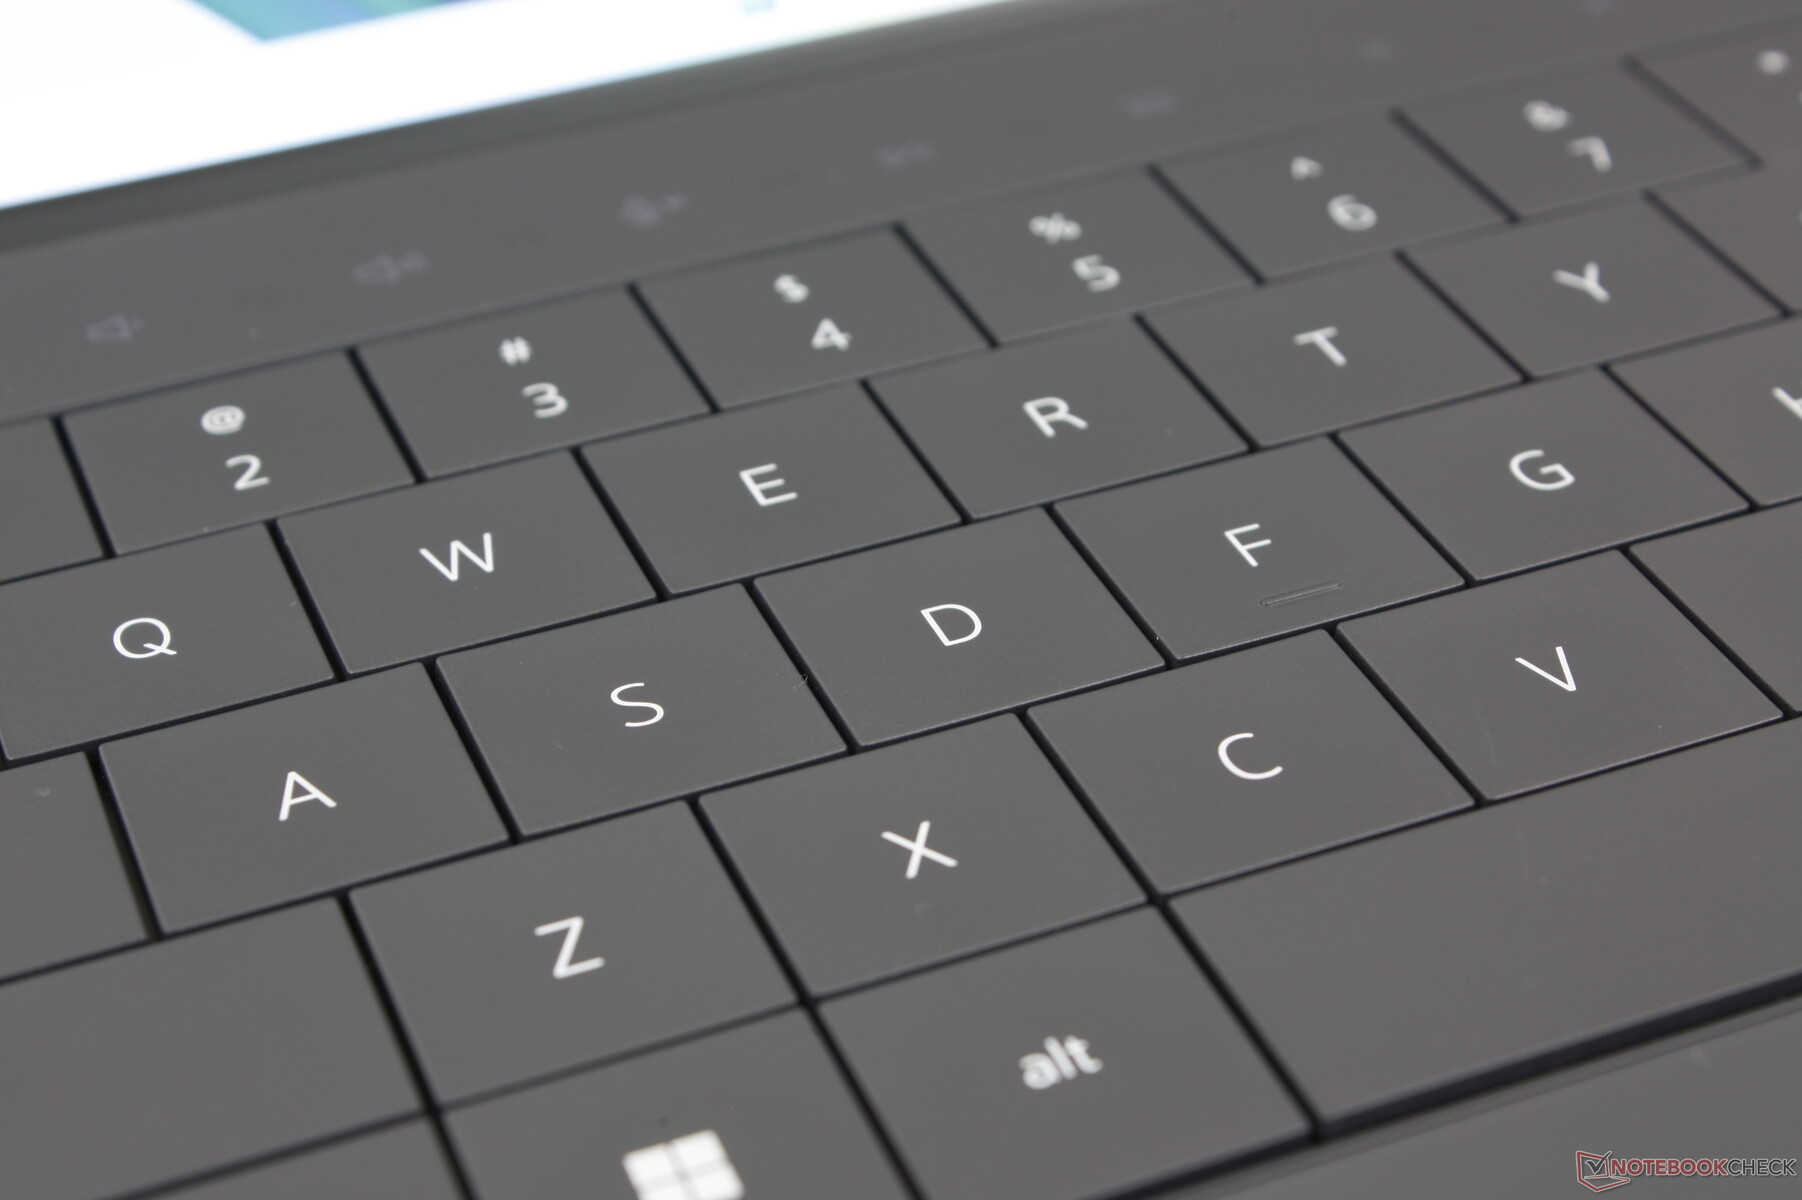
La tastiera zero-lattice richiede un po' di tempo per abituarsi rispetto alle tastiere tradizionali della maggior parte degli altri subnotebook. La corsa dei tasti è ancora più ridotta rispetto al solito, con soli 1,0 mm, e il feedback è relativamente morbido, per un'esperienza di digitazione più spugnosa. La differenza è notte e giorno quando si passa dalla tastiera dell'XPS 13 9345 ai tasti più rigidi dell' HP Spectre x360 14.
Anche i tasti funzione abilitati al tocco sono un misto. Lenovo ha implementato qualcosa di molto simile sulla sua serie ThinkPad diversi anni fa, prima di abbandonarla prontamente, quindi è un po' sorprendente vederli riapparire su un produttore concorrente. Il problema principale è che i tasti sono sensibili anche al minimo tocco, il che può portare a input accidentali.
Touchpad
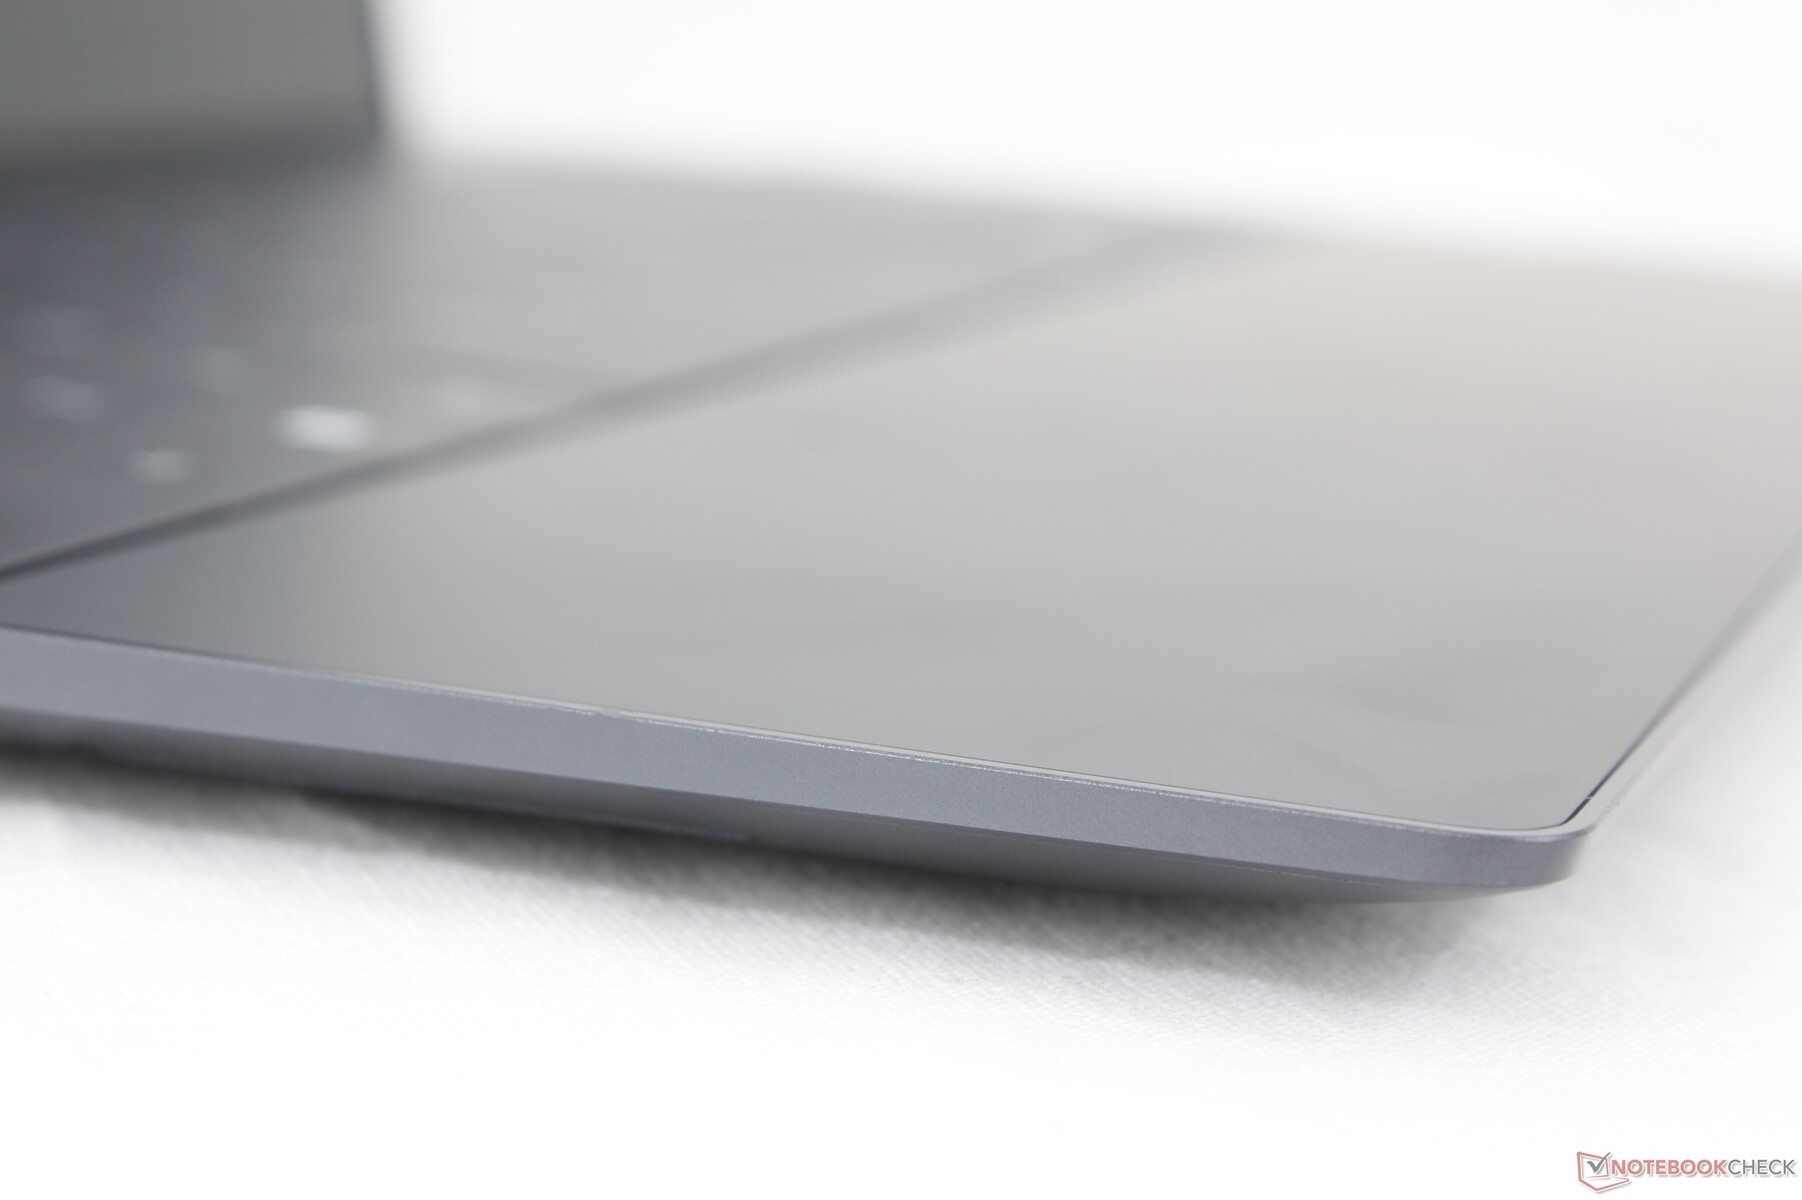
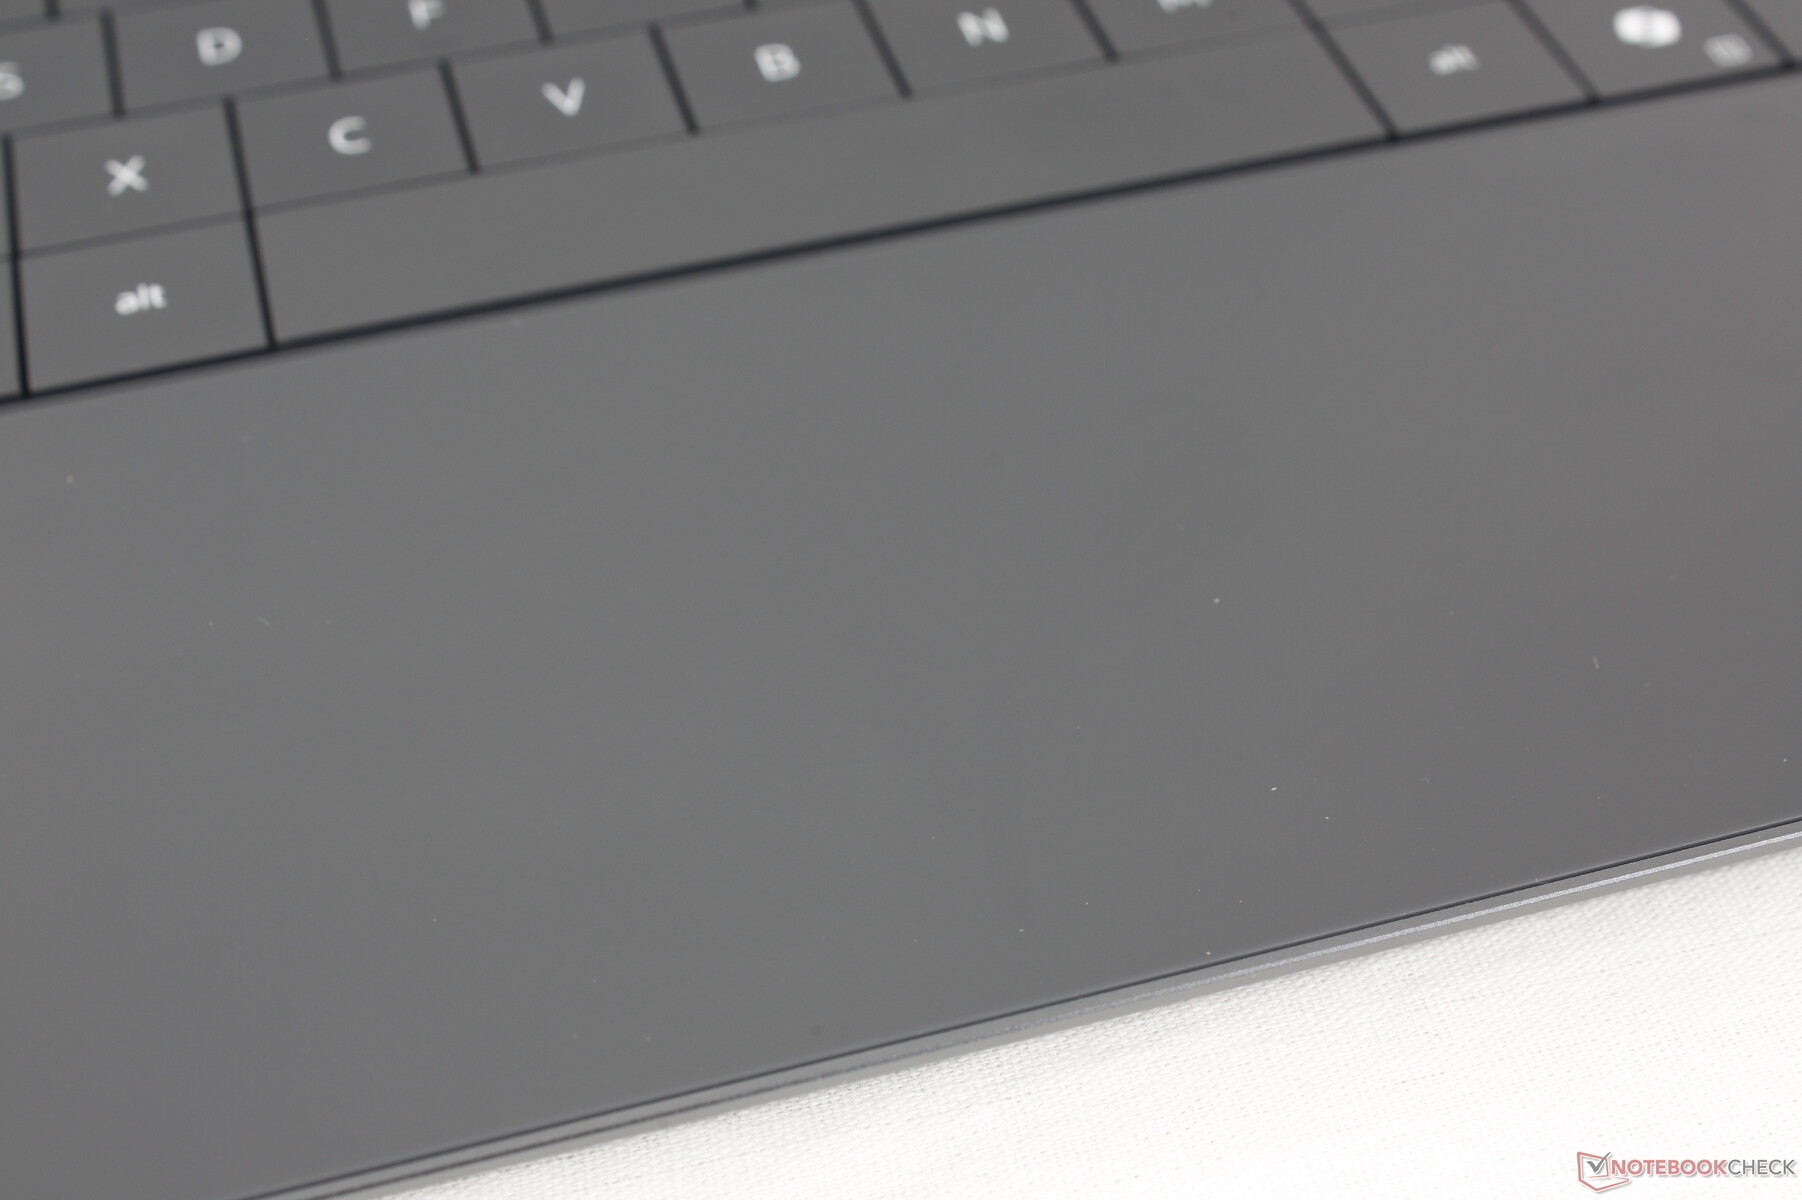
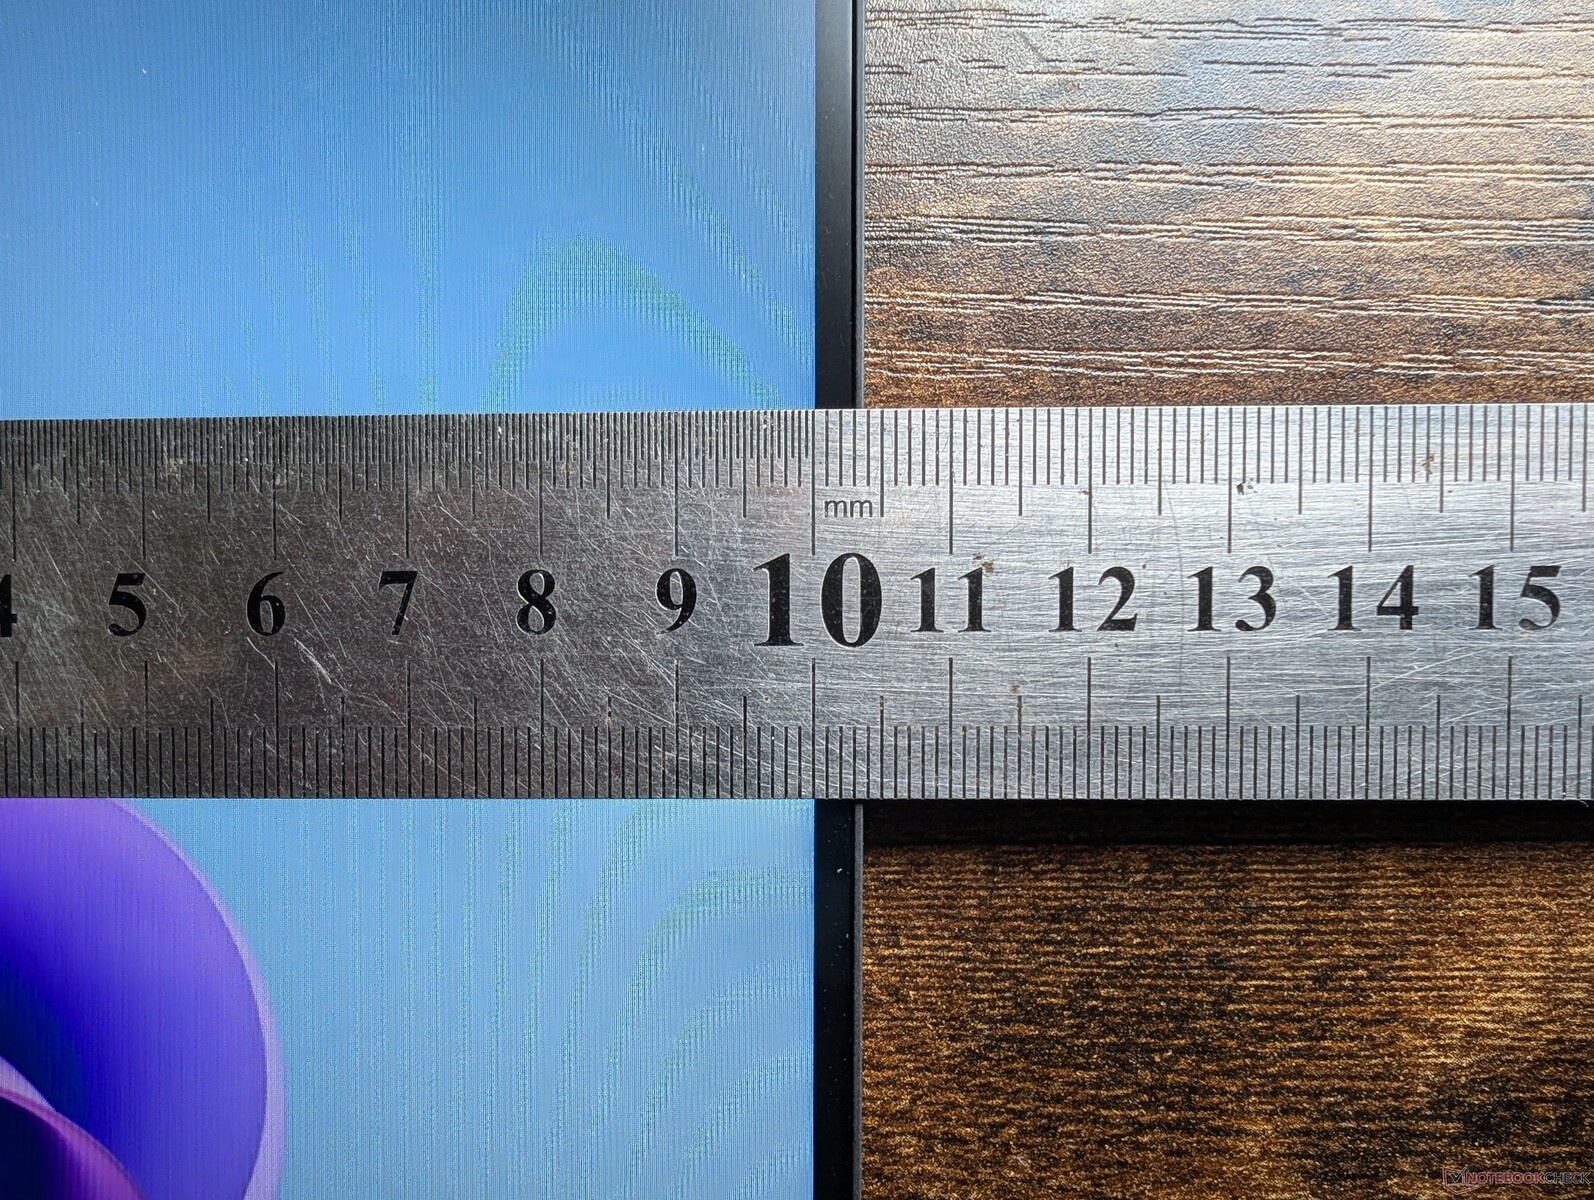
L'invisibile clickpad dell'XPS è diventato famoso per la sua scarsa facilità d'uso e la tendenza continua nel modello Snapdragon. Sebbene la superficie utilizzabile sia abbastanza spaziosa per un formato da 13 pollici, con circa 11,5 x 7,5 cm, il clic è insoddisfacente a causa del feedback debole. Peggio ancora, la forza necessaria per inserire un clic è molto più bassa rispetto alla maggior parte degli altri computer portatili, il che porta a molti clic e trascinamenti accidentali quando si sta semplicemente cercando di spostare il cursore. Speravamo in qualche miglioramento in questo senso dopo due anni di utilizzo di questo design, ma purtroppo non è così.

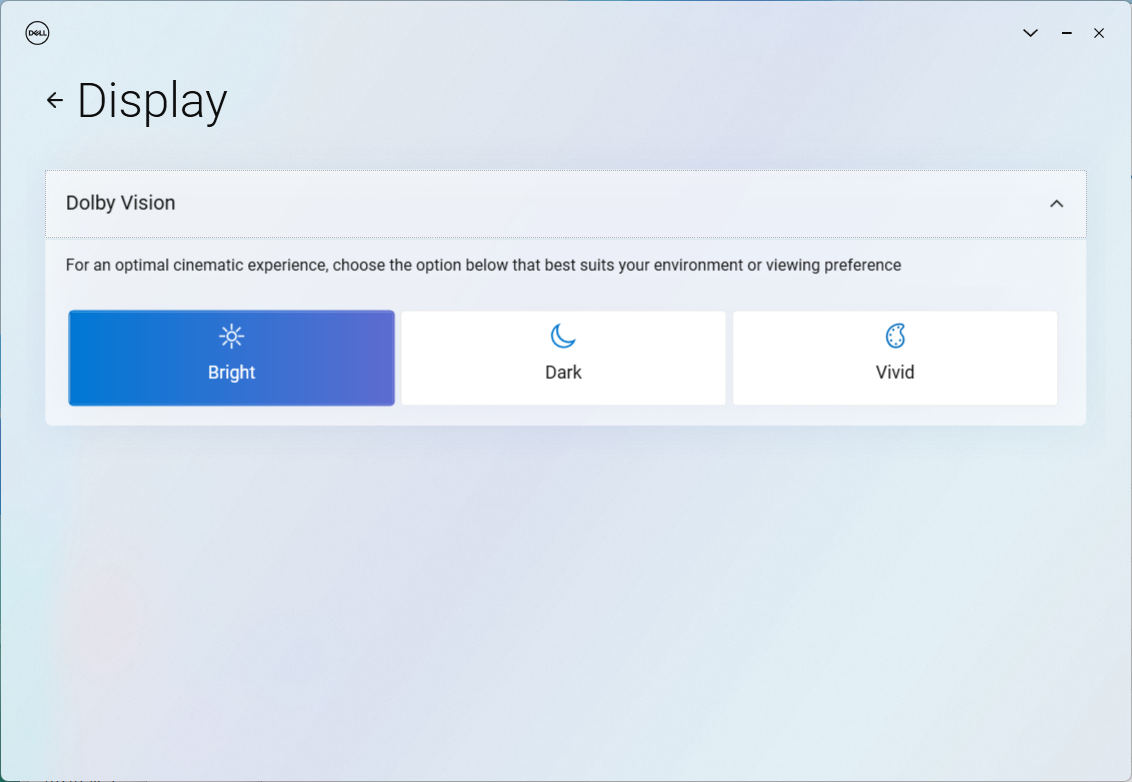
Display
Sono disponibili tre opzioni di display, come segue. La nostra configurazione di recensione è dotata dell'opzione in grassetto.
- 1920 x 1200, IPS, 120 Hz, non touch, opaco
- 2560 x 1600, IPS, 120 Hz, touch, lucido
- 2880 x 1800, OLED, 60 Hz, touch, lucido
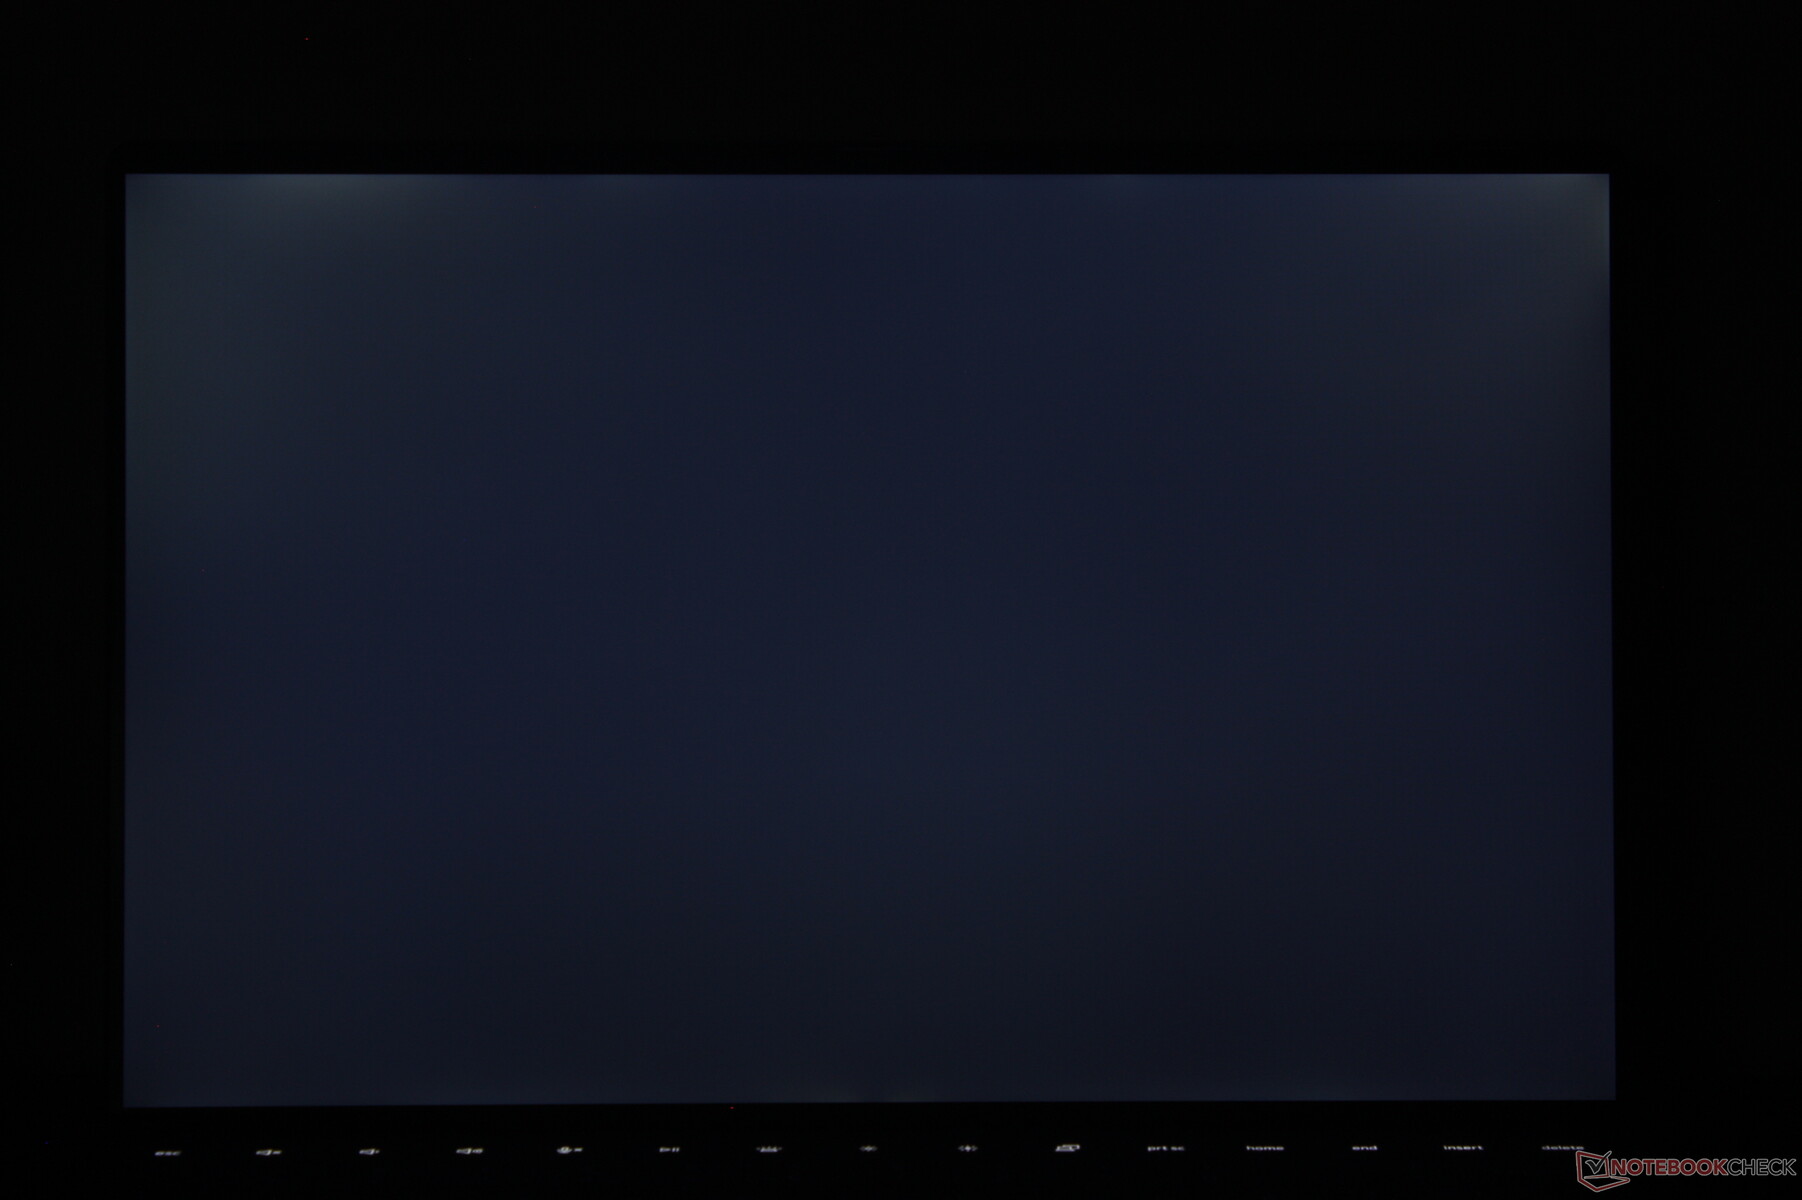
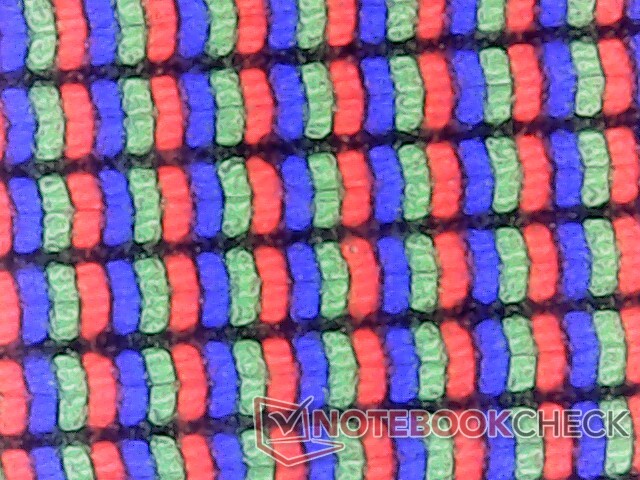
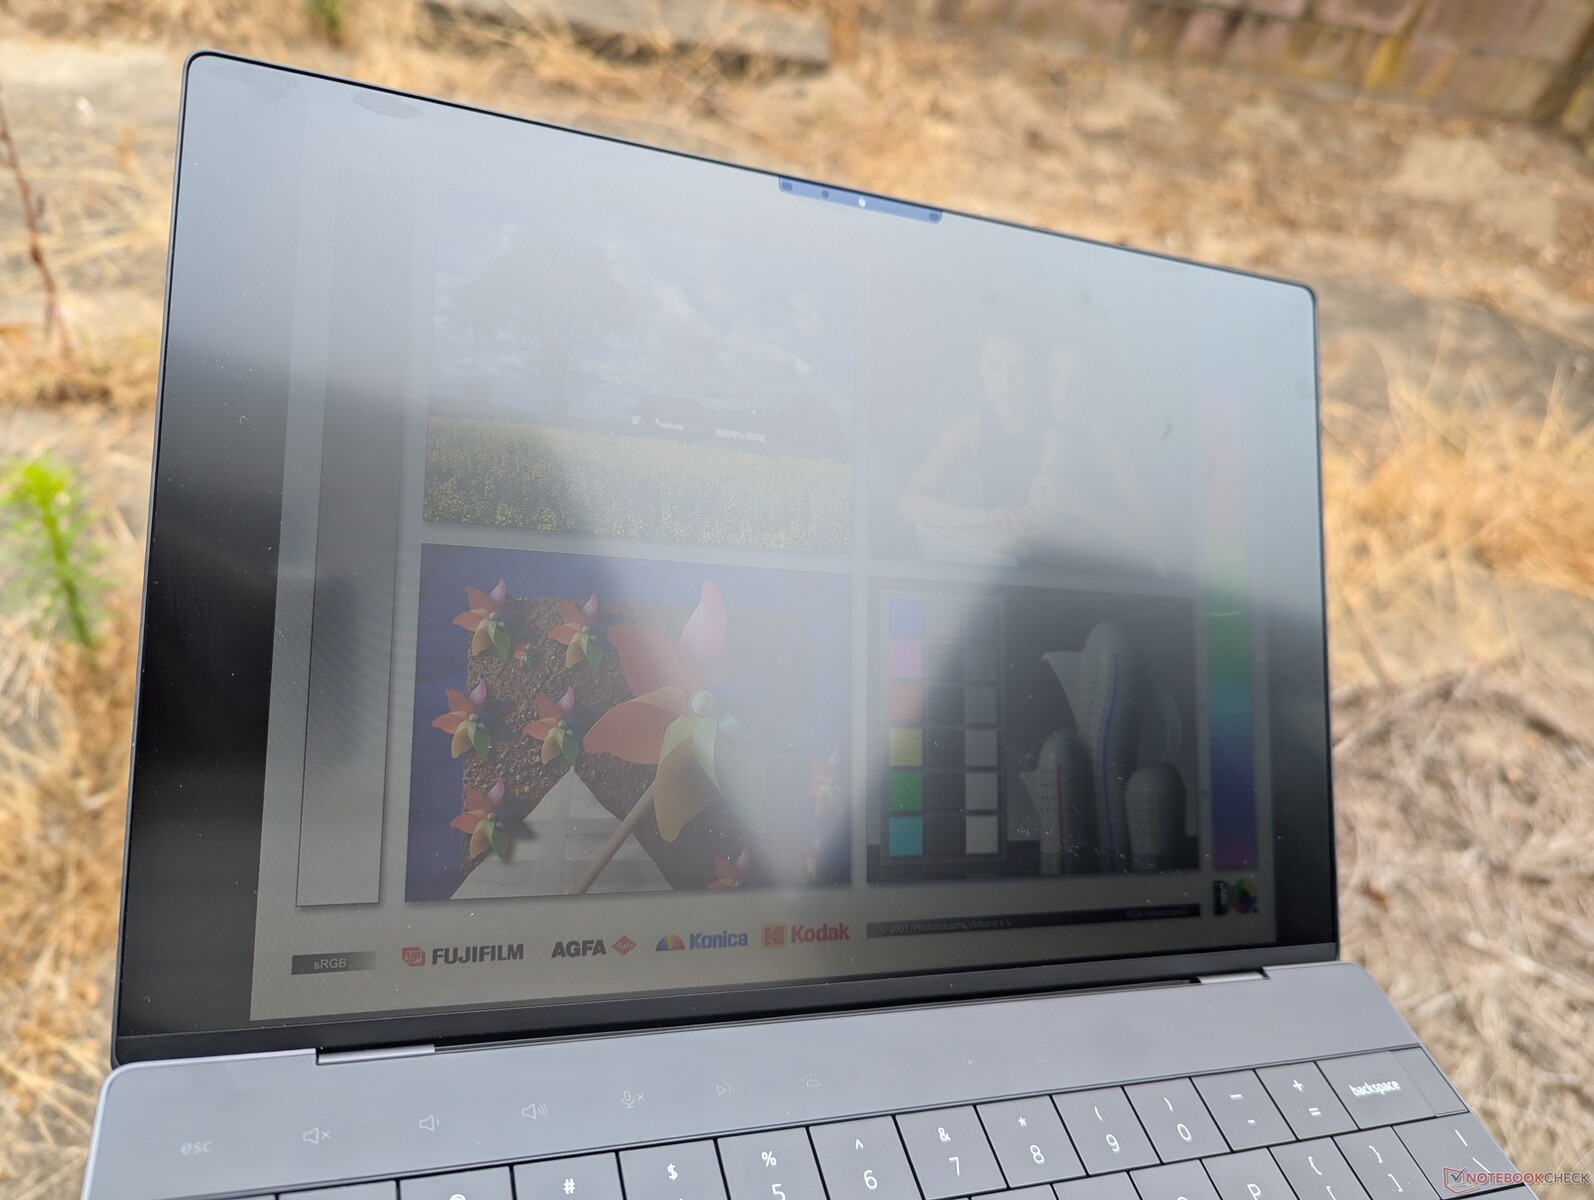
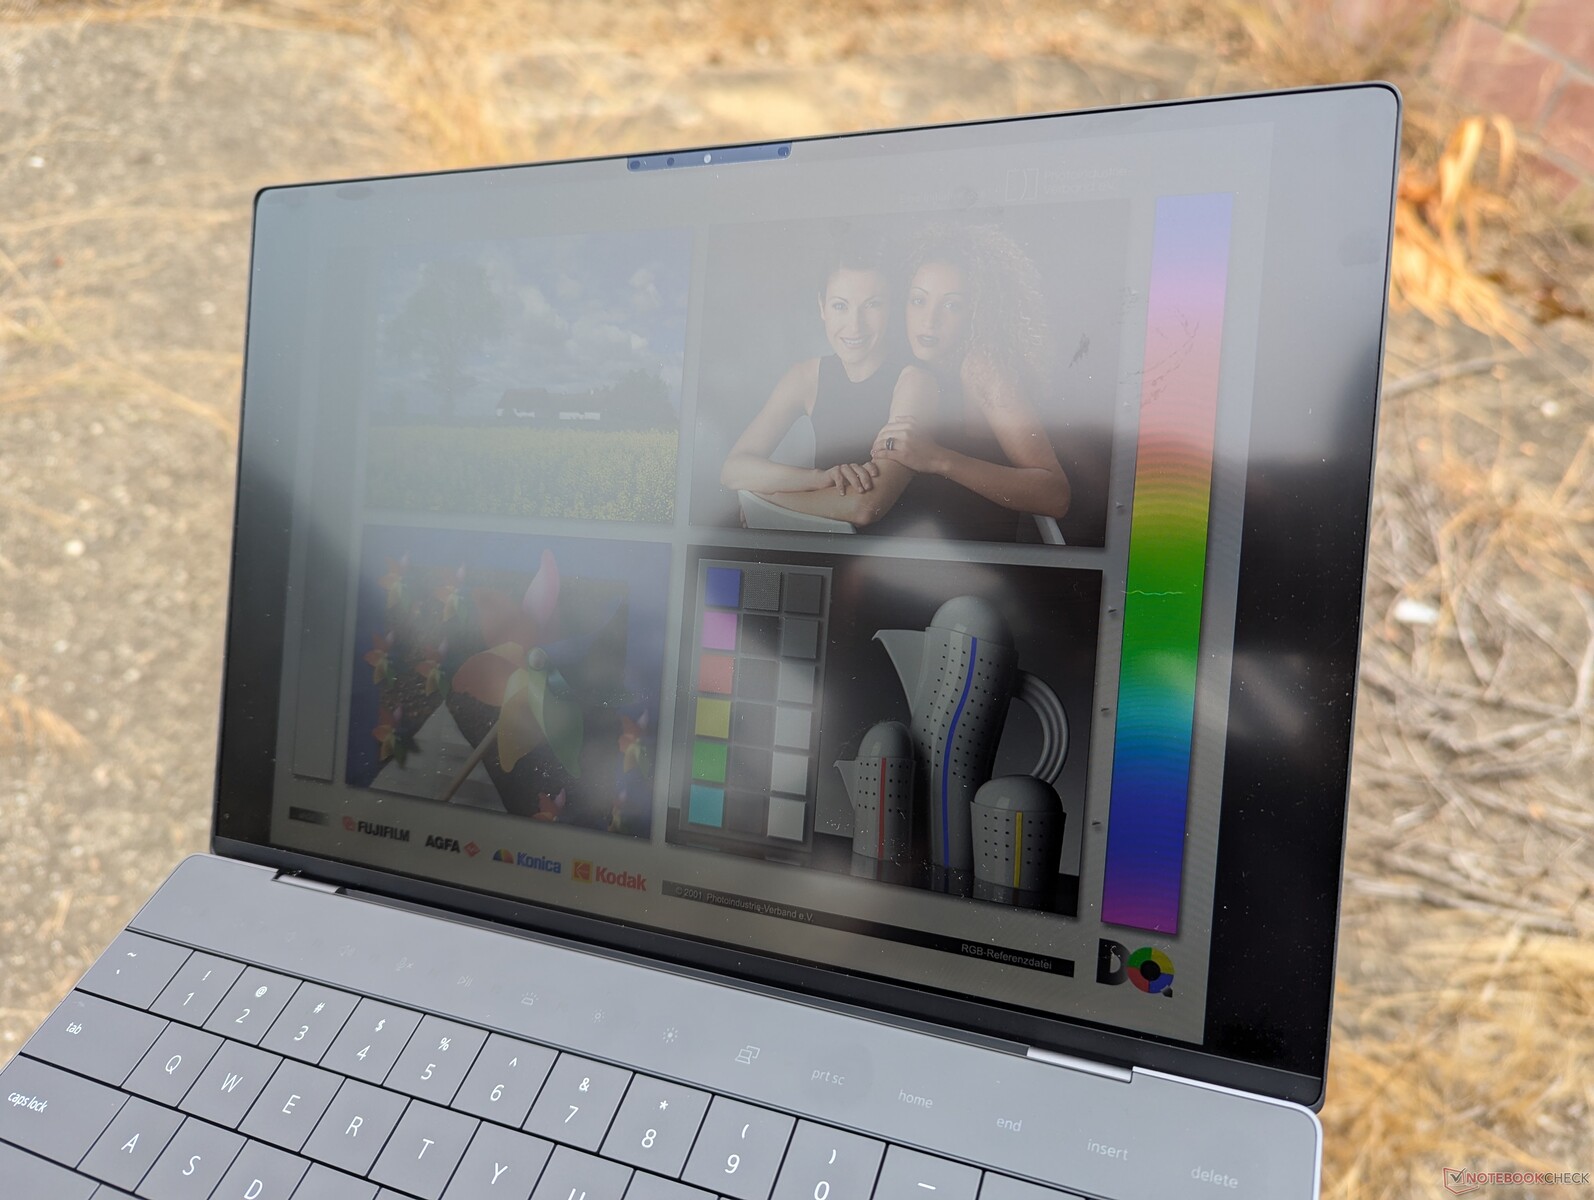
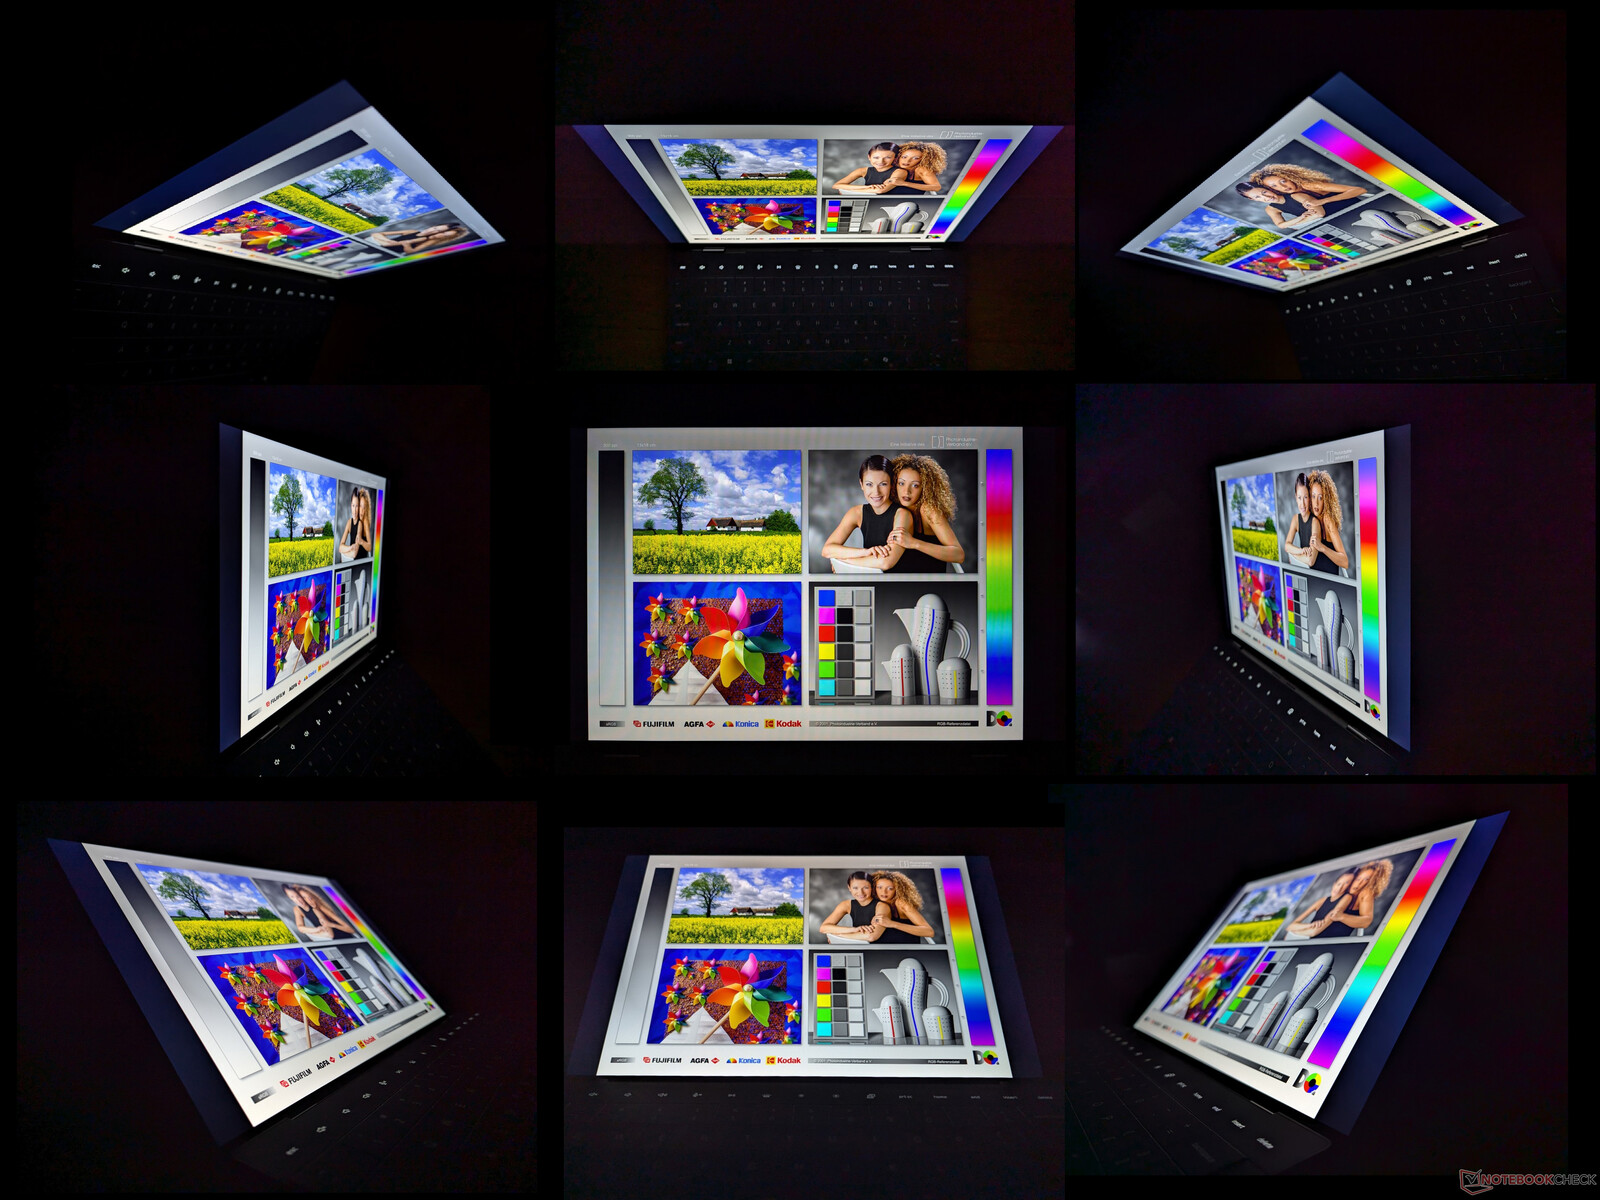
Tutti gli indizi indicano che il nostro pannello a 120 Hz è lo stesso utilizzato per l'XPS 13 basato su Intel. Tutto, dal supporto VRR fino a 30 Hz, ai tempi di risposta adeguati e alla luminosità massima di 500 nit, sono caratteristiche simili a quelle riscontrate nella nostra recente unità di test dell'XPS 13 con Core Ultra 7. La cosa più notevole è l'elevato rapporto di contrasto, pari a quasi 2000:1 rispetto ai 1000:1 della maggior parte dei pannelli IPS presenti su altri computer portatili. I display dei modelli XPS sono sempre stati tra i migliori della categoria e quindi anche l'opzione IPS più economica ha un aspetto fantastico.
La copertura del colore è limitata a >95% sRGB se configurato con l'opzione base, mentre i colori DCI-P3 sono riservati ai pannelli IPS da 1600p e OLED da 1800p più costosi. Gli utenti potrebbero voler disabilitare il colore adattivo per evitare minime variazioni di colore durante l'editing fotografico.
Un aspetto degno di nota di questo pannello è il livello di luminosità minima relativamente alto, pari a 49 nit, che abbiamo notato anche sul nostro modello Core i7. In confronto, i display della maggior parte degli altri computer portatili raggiungono in genere 15 nits o meno quando si imposta la luminosità minima. Il livello di luminosità più elevato di Dell potrebbe causare un affaticamento della vista se la visione avviene in ambienti bui. Questo potenziale problema non è presente nella configurazione OLED, che può raggiungere livelli di luminosità molto più bassi.
| |||||||||||||||||||||||||
Distribuzione della luminosità: 86 %
Al centro con la batteria: 518.3 cd/m²
Contrasto: 1993:1 (Nero: 0.26 cd/m²)
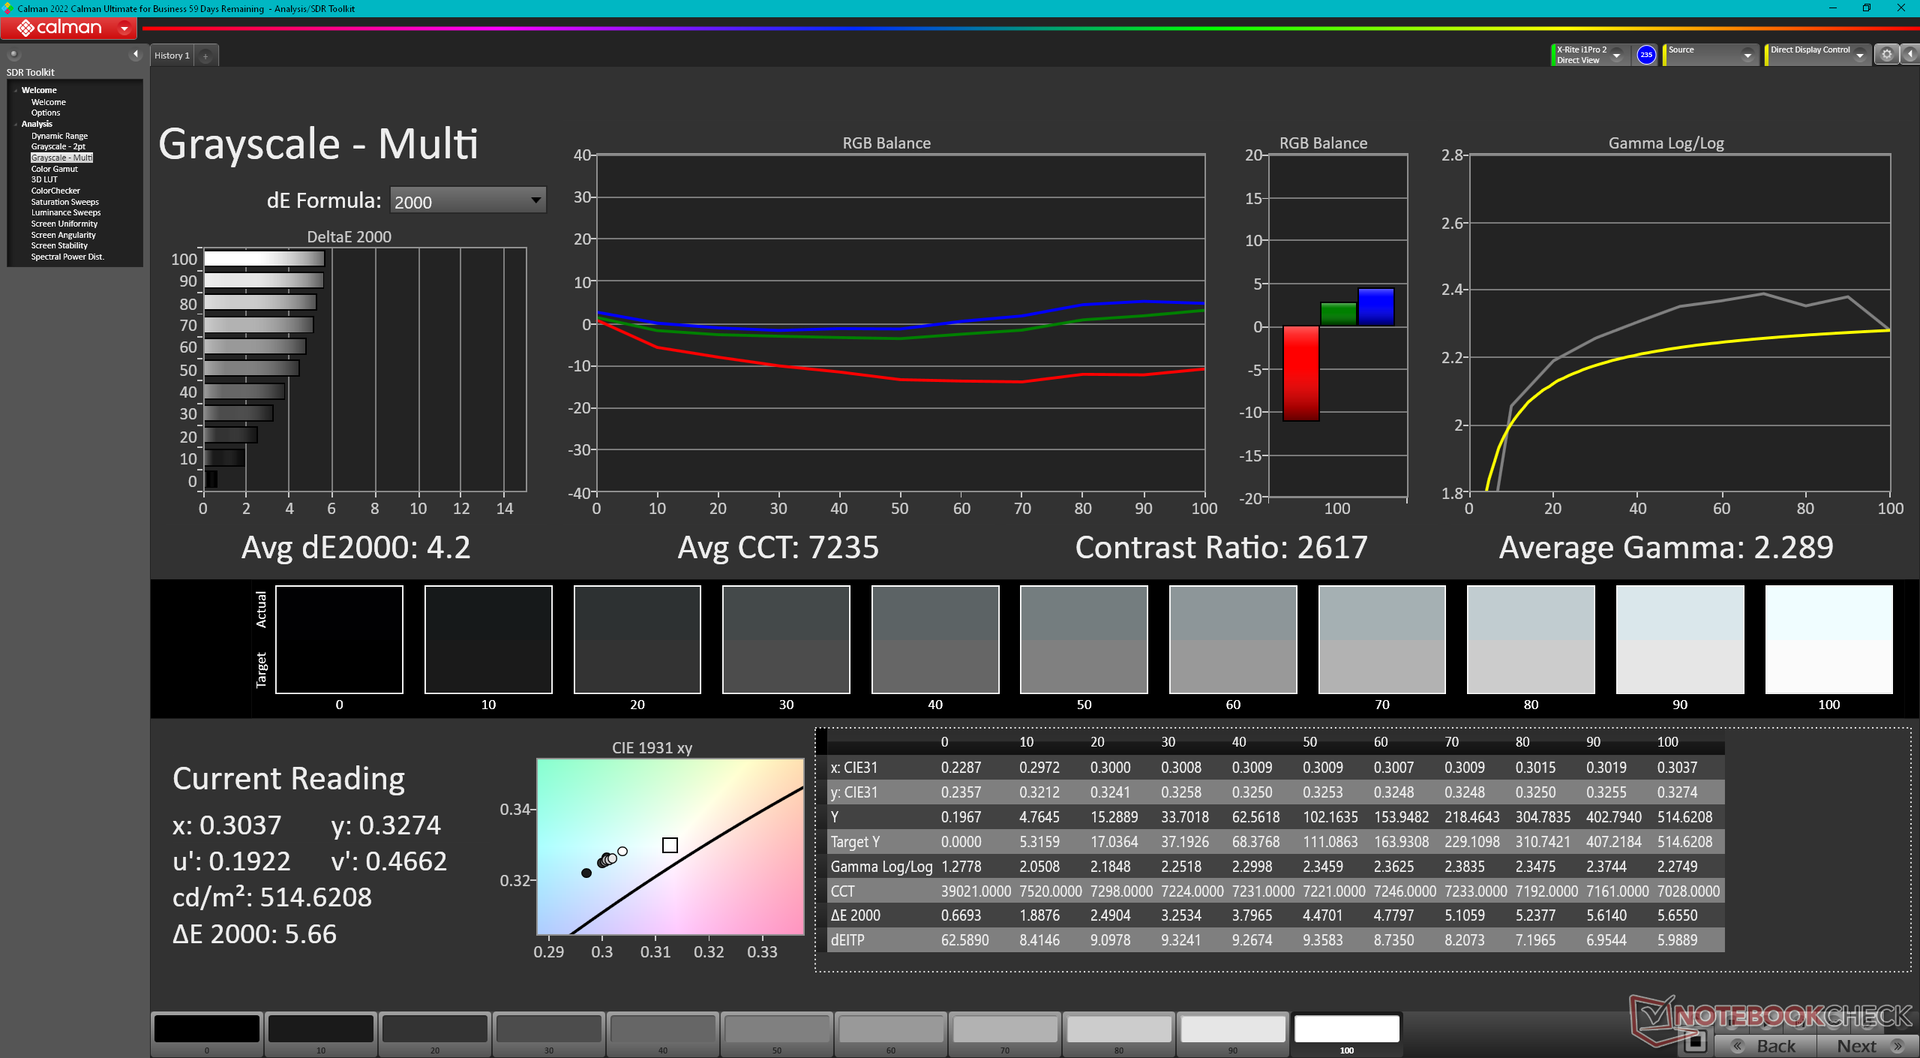
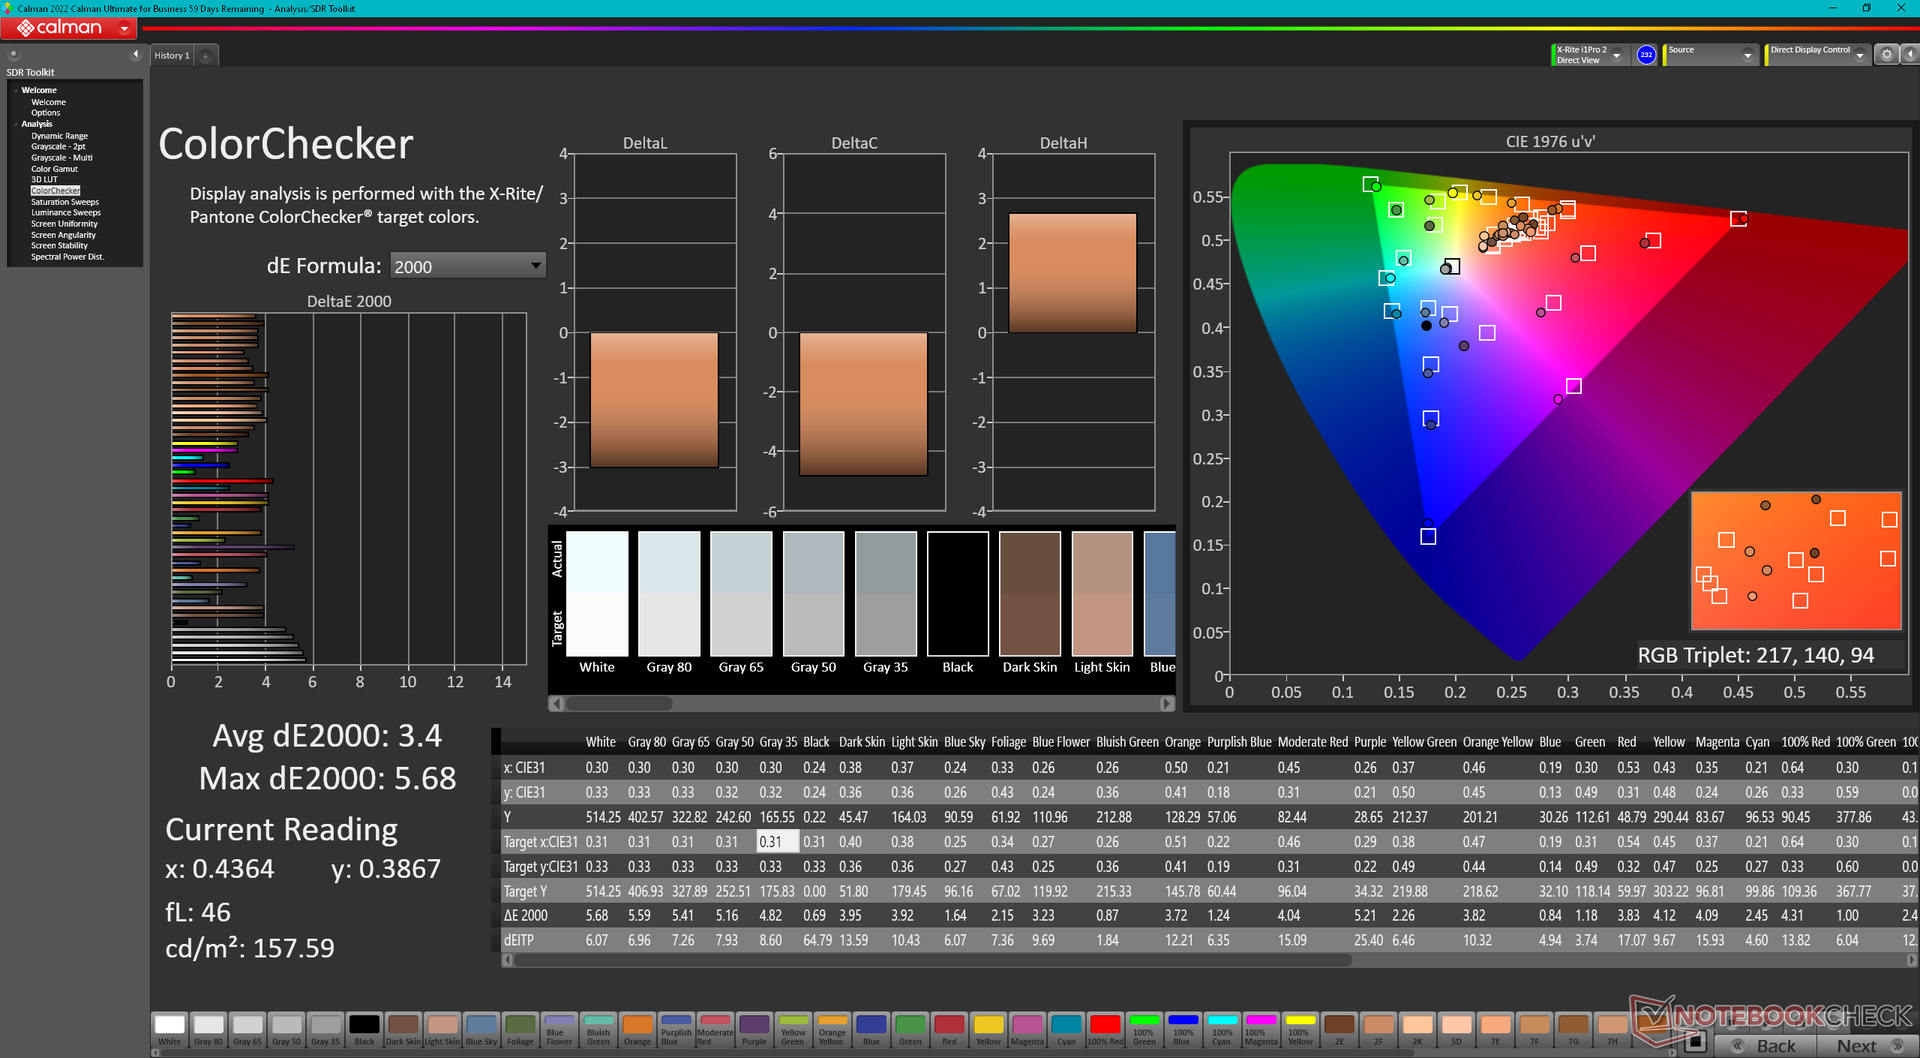
ΔE ColorChecker Calman: 3.4 | ∀{0.5-29.43 Ø4.75}
ΔE Greyscale Calman: 4.2 | ∀{0.09-98 Ø5}
71.7% AdobeRGB 1998 (Argyll 3D)
97.8% sRGB (Argyll 3D)
69.4% Display P3 (Argyll 3D)
Gamma: 2.29
CCT: 7235 K
| Dell XPS 13 9345 IPS, 1920x1200, 13.4", 120 Hz | Dell XPS 13 9340 Core Ultra 7 SHP1593, IPS, 1920x1200, 13.4", 120 Hz | Microsoft Surface Laptop 7 13.8 Copilot+ LQ138P1JX61, IPS, 2304x1536, 13.8", 120 Hz | Lenovo ThinkBook 13x G4 21KR0008GE LEN135WQ+, IPS, 2880x1920, 13.5", 120 Hz | HP EliteBook Ultra G1q 14 IPS, 2240x1400, 14", 60 Hz | Asus ZenBook S13 OLED UX5304 SDC417B, OLED, 2880x1800, 13.3", 60 Hz | |
|---|---|---|---|---|---|---|
| Display | 0% | 21% | -4% | 27% | ||
| Display P3 Coverage (%) | 69.4 | 69.4 0% | 97.8 41% | 65.5 -6% | 99.7 44% | |
| sRGB Coverage (%) | 97.8 | 97.8 0% | 98.2 0% | 97.3 -1% | 100 2% | |
| AdobeRGB 1998 Coverage (%) | 71.7 | 71.7 0% | 87.3 22% | 67.7 -6% | 96.9 35% | |
| Response Times | -25% | 5% | 32% | 27% | 94% | |
| Response Time Grey 50% / Grey 80% * (ms) | 35.2 ? | 43.2 ? -23% | 38.9 ? -11% | 27.3 ? 22% | 22.8 ? 35% | 2 ? 94% |
| Response Time Black / White * (ms) | 21.8 ? | 27.6 ? -27% | 17.4 ? 20% | 12.8 ? 41% | 17.9 ? 18% | 1.6 ? 93% |
| PWM Frequency (Hz) | 240 ? | |||||
| Screen | -6% | 16% | 10% | -58% | 27% | |
| Brightness middle (cd/m²) | 518.3 | 429 -17% | 606 17% | 539 4% | 341.4 -34% | 361 -30% |
| Brightness (cd/m²) | 487 | 407 -16% | 592 22% | 513 5% | 315 -35% | 365 -25% |
| Brightness Distribution (%) | 86 | 90 5% | 94 9% | 89 3% | 87 1% | 98 14% |
| Black Level * (cd/m²) | 0.26 | 0.28 -8% | 0.43 -65% | 0.38 -46% | 0.39 -50% | |
| Contrast (:1) | 1993 | 1532 -23% | 1409 -29% | 1418 -29% | 875 -56% | |
| Colorchecker dE 2000 * | 3.4 | 2.6 24% | 1.3 62% | 1.4 59% | 5.63 -66% | 1.2 65% |
| Colorchecker dE 2000 max. * | 5.68 | 6.6 -16% | 2.1 63% | 3.5 38% | 11.94 -110% | 1.9 67% |
| Greyscale dE 2000 * | 4.2 | 4 5% | 2.1 50% | 2.2 48% | 8.8 -110% | 1.2 71% |
| Gamma | 2.29 96% | 2.23 99% | 2.16 102% | 2.19 100% | 2.14 103% | 2.27 97% |
| CCT | 7235 90% | 7332 89% | 6842 95% | 6710 97% | 6034 108% | 6486 100% |
| Colorchecker dE 2000 calibrated * | 1.4 | 0.7 | ||||
| Media totale (Programma / Settaggio) | -10% /
-7% | 14% /
15% | 13% /
10% | -16% /
-41% | 49% /
39% |
* ... Meglio usare valori piccoli
Il nostro colorimetro X-Rite mostra che il display si rivolge a sRGB con valori medi di scala di grigi e deltaE di colore decenti, rispettivamente di 4,2 e 3,4. La temperatura del colore, tuttavia, è leggermente troppo fredda a 7235, il che compromette l'accuratezza del colore ai livelli di saturazione più bassi. È un peccato che Dell non calibri il pannello in fabbrica, poiché la maggior parte dei software di calibrazione non sono ancora compatibili con ARM, compreso i1Profiler.

Tempi di risposta del Display
| ↔ Tempi di risposta dal Nero al Bianco | ||
|---|---|---|
| 21.8 ms ... aumenta ↗ e diminuisce ↘ combinato | ↗ 10.5 ms Incremento | 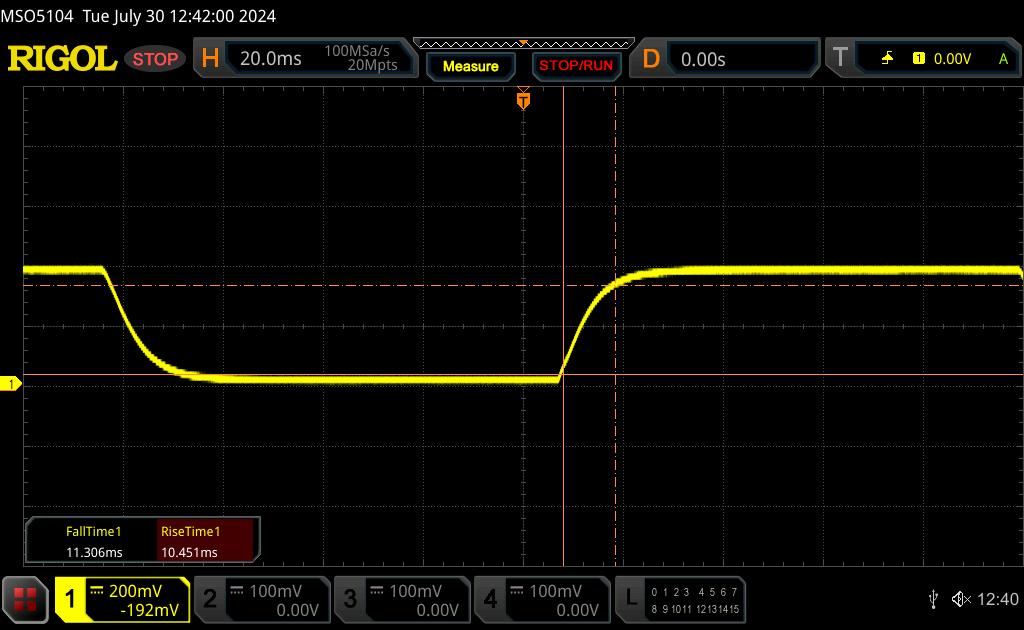 |
| ↘ 11.3 ms Calo | ||
| Lo schermo mostra buoni tempi di risposta durante i nostri tests, ma potrebbe essere troppo lento per i gamers competitivi. In confronto, tutti i dispositivi di test variano da 0.1 (minimo) a 240 (massimo) ms. » 48 % di tutti i dispositivi è migliore. Questo significa che i tempi di risposta rilevati sono simili alla media di tutti i dispositivi testati (20 ms). | ||
| ↔ Tempo di risposta dal 50% Grigio all'80% Grigio | ||
| 35.2 ms ... aumenta ↗ e diminuisce ↘ combinato | ↗ 15.2 ms Incremento | 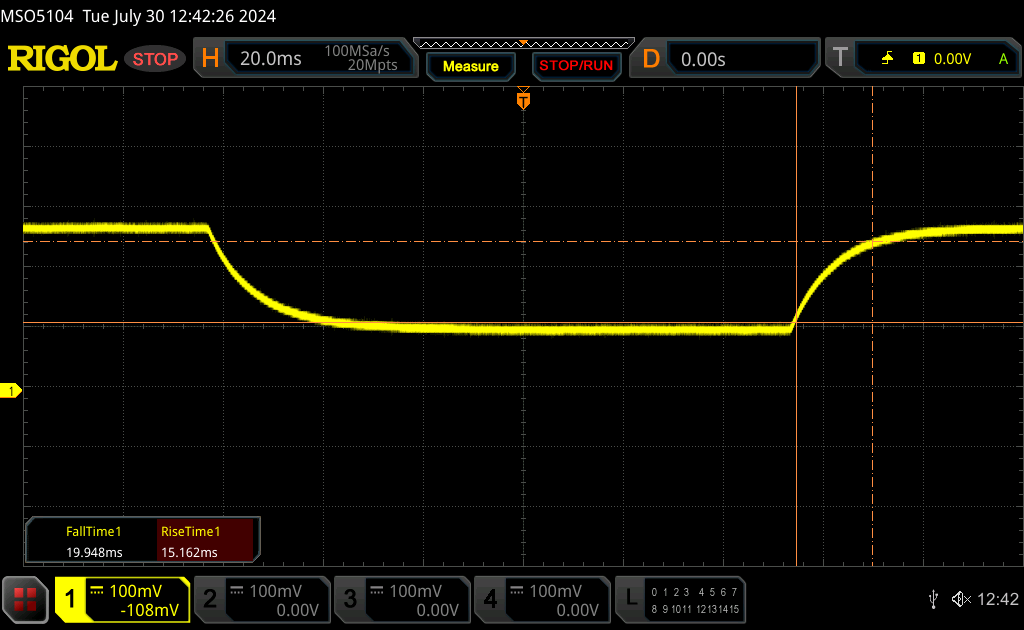 |
| ↘ 20 ms Calo | ||
| Lo schermo mostra tempi di risposta lenti nei nostri tests e sarà insoddisfacente per i gamers. In confronto, tutti i dispositivi di test variano da 0.165 (minimo) a 636 (massimo) ms. » 49 % di tutti i dispositivi è migliore. Questo significa che i tempi di risposta rilevati sono peggiori rispetto alla media di tutti i dispositivi testati (31.3 ms). | ||
Sfarfallio dello schermo / PWM (Pulse-Width Modulation)
| flickering dello schermo / PWM non rilevato | 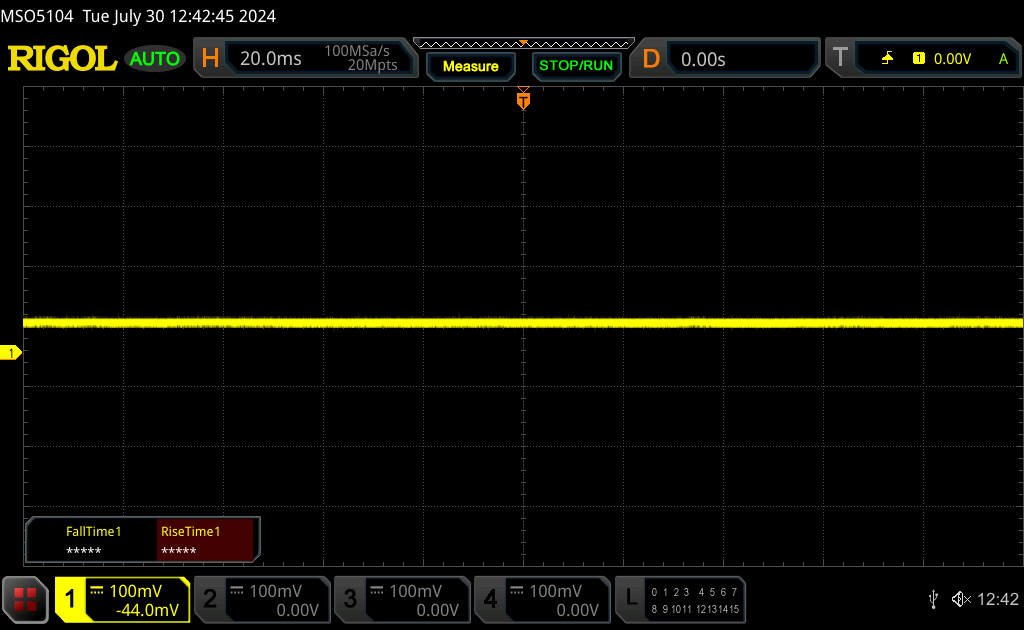 | ||
In confronto: 53 % di tutti i dispositivi testati non utilizza PWM per ridurre la luminosita' del display. Se è rilevato PWM, una media di 7946 (minimo: 5 - massimo: 343500) Hz è stata rilevata. | |||

Prestazioni
Condizioni del test
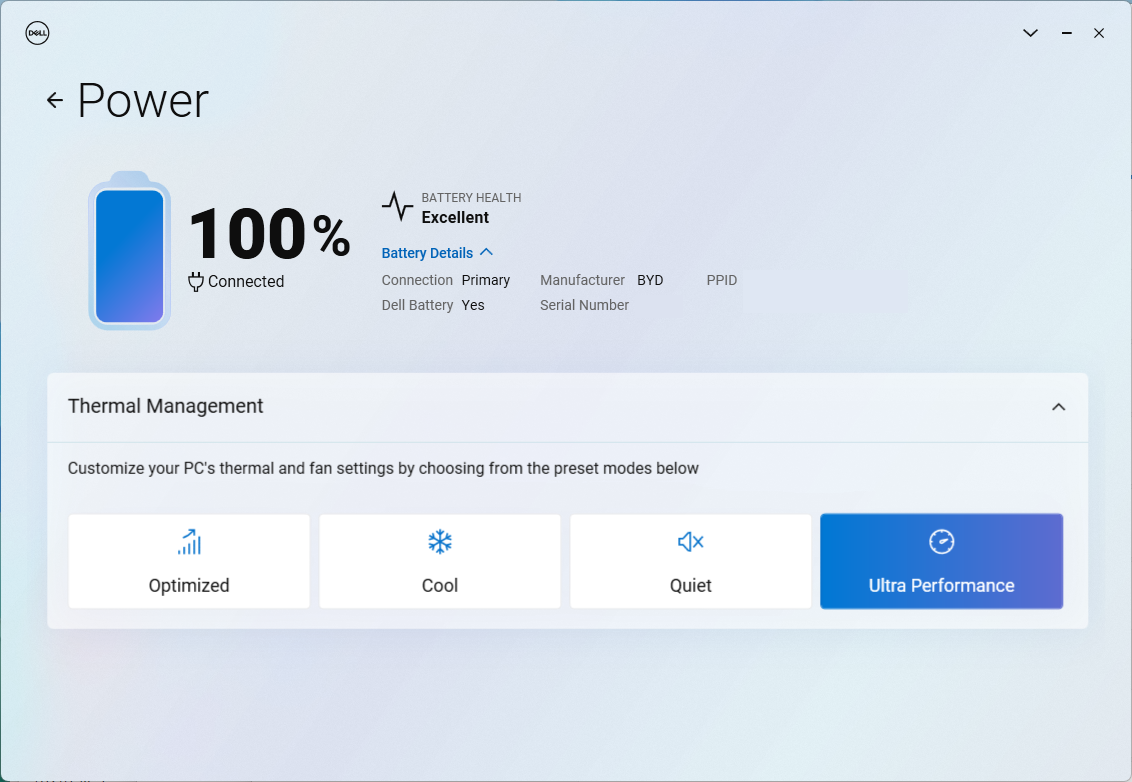
Abbiamo impostato Windows e MyDell in modalità Prestazioni prima di eseguire i benchmark qui sotto. MyDell è stato riprogettato sul modello Snapdragon per essere più semplice da usare rispetto allo stesso software dell'XPS 13 basato su Intel. Alcune funzioni precedentemente presenti nel software, come il Rilevamento Presenza, sono state spostate nel menu Alimentazione e Batteria di Windows.
Processore
Le prestazioni dipendono molto dal fatto che l'applicazione sia nativa o emulata. Ad esempio, il processore eccelle in CineBench 2024 e GeekBench 6, poiché entrambi sono stati ottimizzati per un ambiente ARM. Il nostro Snapdragon X Elite X1E-80-100 supererebbe il Core Ultra 7 155H sia nelle operazioni multi-thread che in quelle single-thread, in queste condizioni. Altrimenti, i benchmark emulati riportano la nostra CPU Snapdragon a livelli di prestazioni più simili a quelli del vecchio Core i5-1240P o Core i7-1260P. In altre parole, la CPU Qualcomm può essere competitiva rispetto al Core Ultra 7 155H, come il produttore ama affermare, ma le condizioni e le applicazioni devono essere giuste per ottenere questi vantaggi.
Anche la coerenza delle prestazioni può essere difficile da misurare tra le CPU Snapdragon. Per il nostro esempio, il nostro Snapdragon X Elite X1E-80-100 supererebbe comodamente le prestazioni dello Snapdragon X Elite X1E-78-100 nell'EliteBook Ultra G1q EliteBook Ultra G1q 14 in CineBench 2024, ma il contrario è vero in CineBench R23 e R15.
Cinebench R15 Multi Loop
Cinebench 2024: CPU Multi Core | CPU Single Core
Cinebench R23: Multi Core | Single Core
Cinebench R20: CPU (Multi Core) | CPU (Single Core)
Cinebench R15: CPU Multi 64Bit | CPU Single 64Bit
Blender: v2.79 BMW27 CPU
7-Zip 18.03: 7z b 4 | 7z b 4 -mmt1
Geekbench 6.6: Multi-Core | Single-Core
HWBOT x265 Benchmark v2.2: 4k Preset
LibreOffice : 20 Documents To PDF
R Benchmark 2.5: Overall mean
| Cinebench 2024 / CPU Multi Core | |
| Dell XPS 13 9345 | |
| Microsoft Surface Laptop 7 13.8 Copilot+ | |
| Media Qualcomm Snapdragon X Elite X1E-80-100 (621 - 927, n=7) | |
| Medion SPRCHRGD 14 S1 Elite | |
| HP EliteBook Ultra G1q 14 | |
| Lenovo ThinkPad T14s Gen 6 21N10007GE | |
| Dell XPS 13 9340 Core Ultra 7 | |
| Dell XPS 14 2024 OLED | |
| Cinebench 2024 / CPU Single Core | |
| Microsoft Surface Laptop 7 13.8 Copilot+ | |
| Media Qualcomm Snapdragon X Elite X1E-80-100 (122 - 123, n=7) | |
| Dell XPS 13 9345 | |
| Lenovo ThinkPad T14s Gen 6 21N10007GE | |
| Medion SPRCHRGD 14 S1 Elite | |
| HP EliteBook Ultra G1q 14 | |
| Dell XPS 14 2024 OLED | |
| Dell XPS 13 9340 Core Ultra 7 | |
| Geekbench 6.6 / Multi-Core | |
| Lenovo ThinkPad T14s Gen 6 21N10007GE | |
| Dell XPS 13 9345 | |
| Medion SPRCHRGD 14 S1 Elite | |
| Microsoft Surface Laptop 7 13.8 Copilot+ | |
| Dell XPS 14 2024 OLED | |
| HP EliteBook Ultra G1q 14 | |
| Media Qualcomm Snapdragon X Elite X1E-80-100 (7596 - 14998, n=9) | |
| Dell XPS 13 9340 Core Ultra 7 | |
| Geekbench 6.6 / Single-Core | |
| Dell XPS 13 9345 | |
| Microsoft Surface Laptop 7 13.8 Copilot+ | |
| Media Qualcomm Snapdragon X Elite X1E-80-100 (1896 - 2845, n=9) | |
| Lenovo ThinkPad T14s Gen 6 21N10007GE | |
| Medion SPRCHRGD 14 S1 Elite | |
| Dell XPS 14 2024 OLED | |
| Dell XPS 13 9340 Core Ultra 7 | |
| HP EliteBook Ultra G1q 14 | |
Cinebench 2024: CPU Multi Core | CPU Single Core
Cinebench R23: Multi Core | Single Core
Cinebench R20: CPU (Multi Core) | CPU (Single Core)
Cinebench R15: CPU Multi 64Bit | CPU Single 64Bit
Blender: v2.79 BMW27 CPU
7-Zip 18.03: 7z b 4 | 7z b 4 -mmt1
Geekbench 6.6: Multi-Core | Single-Core
HWBOT x265 Benchmark v2.2: 4k Preset
LibreOffice : 20 Documents To PDF
R Benchmark 2.5: Overall mean
* ... Meglio usare valori piccoli
AIDA64: FP32 Ray-Trace | FPU Julia | CPU SHA3 | CPU Queen | FPU SinJulia | FPU Mandel | CPU AES | CPU ZLib | FP64 Ray-Trace | CPU PhotoWorxx
| Performance rating | |
| Dell XPS 13 9340 Core Ultra 7 | |
| Lenovo ThinkBook 13x G4 21KR0008GE | |
| Microsoft Surface Laptop 7 13.8 Copilot+ | |
| Dell XPS 13 9345 | |
| HP EliteBook Ultra G1q 14 | |
| Media Qualcomm Snapdragon X Elite X1E-80-100 | |
| Asus ZenBook S13 OLED UX5304 | |
| AIDA64 / FP32 Ray-Trace | |
| Dell XPS 13 9340 Core Ultra 7 | |
| Lenovo ThinkBook 13x G4 21KR0008GE | |
| HP EliteBook Ultra G1q 14 | |
| Microsoft Surface Laptop 7 13.8 Copilot+ | |
| Dell XPS 13 9345 | |
| Media Qualcomm Snapdragon X Elite X1E-80-100 (2184 - 7469, n=7) | |
| Asus ZenBook S13 OLED UX5304 | |
| AIDA64 / FPU Julia | |
| Dell XPS 13 9340 Core Ultra 7 | |
| Lenovo ThinkBook 13x G4 21KR0008GE | |
| Asus ZenBook S13 OLED UX5304 | |
| Microsoft Surface Laptop 7 13.8 Copilot+ | |
| Dell XPS 13 9345 | |
| HP EliteBook Ultra G1q 14 | |
| Media Qualcomm Snapdragon X Elite X1E-80-100 (5687 - 26391, n=7) | |
| AIDA64 / CPU SHA3 | |
| HP EliteBook Ultra G1q 14 | |
| Microsoft Surface Laptop 7 13.8 Copilot+ | |
| Dell XPS 13 9340 Core Ultra 7 | |
| Dell XPS 13 9345 | |
| Media Qualcomm Snapdragon X Elite X1E-80-100 (2607 - 3122, n=7) | |
| Lenovo ThinkBook 13x G4 21KR0008GE | |
| Asus ZenBook S13 OLED UX5304 | |
| AIDA64 / CPU Queen | |
| Lenovo ThinkBook 13x G4 21KR0008GE | |
| Dell XPS 13 9340 Core Ultra 7 | |
| Microsoft Surface Laptop 7 13.8 Copilot+ | |
| Media Qualcomm Snapdragon X Elite X1E-80-100 (67219 - 69762, n=7) | |
| Dell XPS 13 9345 | |
| HP EliteBook Ultra G1q 14 | |
| Asus ZenBook S13 OLED UX5304 | |
| AIDA64 / FPU SinJulia | |
| Dell XPS 13 9340 Core Ultra 7 | |
| Lenovo ThinkBook 13x G4 21KR0008GE | |
| Asus ZenBook S13 OLED UX5304 | |
| Microsoft Surface Laptop 7 13.8 Copilot+ | |
| Dell XPS 13 9345 | |
| Media Qualcomm Snapdragon X Elite X1E-80-100 (1521 - 2357, n=7) | |
| HP EliteBook Ultra G1q 14 | |
| AIDA64 / FPU Mandel | |
| Dell XPS 13 9340 Core Ultra 7 | |
| Lenovo ThinkBook 13x G4 21KR0008GE | |
| Asus ZenBook S13 OLED UX5304 | |
| HP EliteBook Ultra G1q 14 | |
| Microsoft Surface Laptop 7 13.8 Copilot+ | |
| Media Qualcomm Snapdragon X Elite X1E-80-100 (10117 - 15669, n=7) | |
| Dell XPS 13 9345 | |
| AIDA64 / CPU AES | |
| HP EliteBook Ultra G1q 14 | |
| Dell XPS 13 9340 Core Ultra 7 | |
| Microsoft Surface Laptop 7 13.8 Copilot+ | |
| Media Qualcomm Snapdragon X Elite X1E-80-100 (39956 - 71089, n=7) | |
| Dell XPS 13 9345 | |
| Lenovo ThinkBook 13x G4 21KR0008GE | |
| Asus ZenBook S13 OLED UX5304 | |
| AIDA64 / CPU ZLib | |
| Dell XPS 13 9340 Core Ultra 7 | |
| HP EliteBook Ultra G1q 14 | |
| Microsoft Surface Laptop 7 13.8 Copilot+ | |
| Dell XPS 13 9345 | |
| Media Qualcomm Snapdragon X Elite X1E-80-100 (398 - 802, n=7) | |
| Lenovo ThinkBook 13x G4 21KR0008GE | |
| Asus ZenBook S13 OLED UX5304 | |
| AIDA64 / FP64 Ray-Trace | |
| Dell XPS 13 9340 Core Ultra 7 | |
| Lenovo ThinkBook 13x G4 21KR0008GE | |
| Microsoft Surface Laptop 7 13.8 Copilot+ | |
| Dell XPS 13 9345 | |
| Media Qualcomm Snapdragon X Elite X1E-80-100 (2581 - 4044, n=7) | |
| Asus ZenBook S13 OLED UX5304 | |
| HP EliteBook Ultra G1q 14 | |
| AIDA64 / CPU PhotoWorxx | |
| Dell XPS 13 9340 Core Ultra 7 | |
| Lenovo ThinkBook 13x G4 21KR0008GE | |
| Asus ZenBook S13 OLED UX5304 | |
| Microsoft Surface Laptop 7 13.8 Copilot+ | |
| Dell XPS 13 9345 | |
| Media Qualcomm Snapdragon X Elite X1E-80-100 (28474 - 38707, n=7) | |
| HP EliteBook Ultra G1q 14 | |
Prestazioni del sistema
WebXPRT e Kraken, che funzionano in modo nativo sul browser Edge ottimizzato per ARM, classificano entrambi il nostro Qualcomm XPS davanti all'Intel XPS con margini decenti.
WebXPRT 3: Overall
WebXPRT 4: Overall
Mozilla Kraken 1.1: Total
| CrossMark / Overall | |
| Dell XPS 13 9340 Core Ultra 7 | |
| Asus ZenBook S13 OLED UX5304 | |
| Lenovo ThinkBook 13x G4 21KR0008GE | |
| Microsoft Surface Laptop 7 13.8 Copilot+ | |
| Media Qualcomm Snapdragon X Elite X1E-80-100, Qualcomm SD X Adreno X1-85 3.8 TFLOPS (1356 - 1443, n=7) | |
| Dell XPS 13 9345 | |
| HP EliteBook Ultra G1q 14 | |
| CrossMark / Productivity | |
| Dell XPS 13 9340 Core Ultra 7 | |
| Asus ZenBook S13 OLED UX5304 | |
| Lenovo ThinkBook 13x G4 21KR0008GE | |
| Microsoft Surface Laptop 7 13.8 Copilot+ | |
| Media Qualcomm Snapdragon X Elite X1E-80-100, Qualcomm SD X Adreno X1-85 3.8 TFLOPS (1271 - 1375, n=7) | |
| Dell XPS 13 9345 | |
| HP EliteBook Ultra G1q 14 | |
| CrossMark / Creativity | |
| Dell XPS 13 9340 Core Ultra 7 | |
| Lenovo ThinkBook 13x G4 21KR0008GE | |
| Asus ZenBook S13 OLED UX5304 | |
| Microsoft Surface Laptop 7 13.8 Copilot+ | |
| Media Qualcomm Snapdragon X Elite X1E-80-100, Qualcomm SD X Adreno X1-85 3.8 TFLOPS (1402 - 1537, n=7) | |
| Dell XPS 13 9345 | |
| HP EliteBook Ultra G1q 14 | |
| CrossMark / Responsiveness | |
| Dell XPS 13 9340 Core Ultra 7 | |
| Asus ZenBook S13 OLED UX5304 | |
| Microsoft Surface Laptop 7 13.8 Copilot+ | |
| Media Qualcomm Snapdragon X Elite X1E-80-100, Qualcomm SD X Adreno X1-85 3.8 TFLOPS (1237 - 1401, n=7) | |
| Lenovo ThinkBook 13x G4 21KR0008GE | |
| Dell XPS 13 9345 | |
| HP EliteBook Ultra G1q 14 | |
| WebXPRT 3 / Overall | |
| Media Qualcomm Snapdragon X Elite X1E-80-100, Qualcomm SD X Adreno X1-85 3.8 TFLOPS (430 - 455, n=7) | |
| Microsoft Surface Laptop 7 13.8 Copilot+ | |
| Dell XPS 13 9345 | |
| HP EliteBook Ultra G1q 14 | |
| Asus ZenBook S13 OLED UX5304 | |
| Dell XPS 13 9340 Core Ultra 7 | |
| Lenovo ThinkBook 13x G4 21KR0008GE | |
| WebXPRT 4 / Overall | |
| Dell XPS 13 9345 | |
| Media Qualcomm Snapdragon X Elite X1E-80-100, Qualcomm SD X Adreno X1-85 3.8 TFLOPS (295 - 324, n=7) | |
| Microsoft Surface Laptop 7 13.8 Copilot+ | |
| HP EliteBook Ultra G1q 14 | |
| Dell XPS 13 9340 Core Ultra 7 | |
| Asus ZenBook S13 OLED UX5304 | |
| Lenovo ThinkBook 13x G4 21KR0008GE | |
| Mozilla Kraken 1.1 / Total | |
| Lenovo ThinkBook 13x G4 21KR0008GE | |
| Dell XPS 13 9340 Core Ultra 7 | |
| Asus ZenBook S13 OLED UX5304 | |
| HP EliteBook Ultra G1q 14 | |
| Dell XPS 13 9345 | |
| Media Qualcomm Snapdragon X Elite X1E-80-100, Qualcomm SD X Adreno X1-85 3.8 TFLOPS (391 - 422, n=7) | |
| Microsoft Surface Laptop 7 13.8 Copilot+ | |
* ... Meglio usare valori piccoli
| AIDA64 / Memory Copy | |
| Dell XPS 13 9340 Core Ultra 7 | |
| Lenovo ThinkBook 13x G4 21KR0008GE | |
| Dell XPS 13 9345 | |
| Microsoft Surface Laptop 7 13.8 Copilot+ | |
| Asus ZenBook S13 OLED UX5304 | |
| Media Qualcomm Snapdragon X Elite X1E-80-100 (44795 - 63495, n=7) | |
| HP EliteBook Ultra G1q 14 | |
| AIDA64 / Memory Read | |
| Dell XPS 13 9345 | |
| Microsoft Surface Laptop 7 13.8 Copilot+ | |
| Media Qualcomm Snapdragon X Elite X1E-80-100 (58855 - 125604, n=7) | |
| Dell XPS 13 9340 Core Ultra 7 | |
| Lenovo ThinkBook 13x G4 21KR0008GE | |
| HP EliteBook Ultra G1q 14 | |
| Asus ZenBook S13 OLED UX5304 | |
| AIDA64 / Memory Write | |
| Dell XPS 13 9340 Core Ultra 7 | |
| Asus ZenBook S13 OLED UX5304 | |
| Lenovo ThinkBook 13x G4 21KR0008GE | |
| Dell XPS 13 9345 | |
| Microsoft Surface Laptop 7 13.8 Copilot+ | |
| Media Qualcomm Snapdragon X Elite X1E-80-100 (37270 - 45265, n=7) | |
| HP EliteBook Ultra G1q 14 | |
| AIDA64 / Memory Latency | |
| Lenovo ThinkBook 13x G4 21KR0008GE | |
| Dell XPS 13 9340 Core Ultra 7 | |
| Asus ZenBook S13 OLED UX5304 | |
| Media Qualcomm Snapdragon X Elite X1E-80-100 (7.4 - 8.8, n=5) | |
| HP EliteBook Ultra G1q 14 | |
| Dell XPS 13 9345 | |
| Microsoft Surface Laptop 7 13.8 Copilot+ | |
* ... Meglio usare valori piccoli
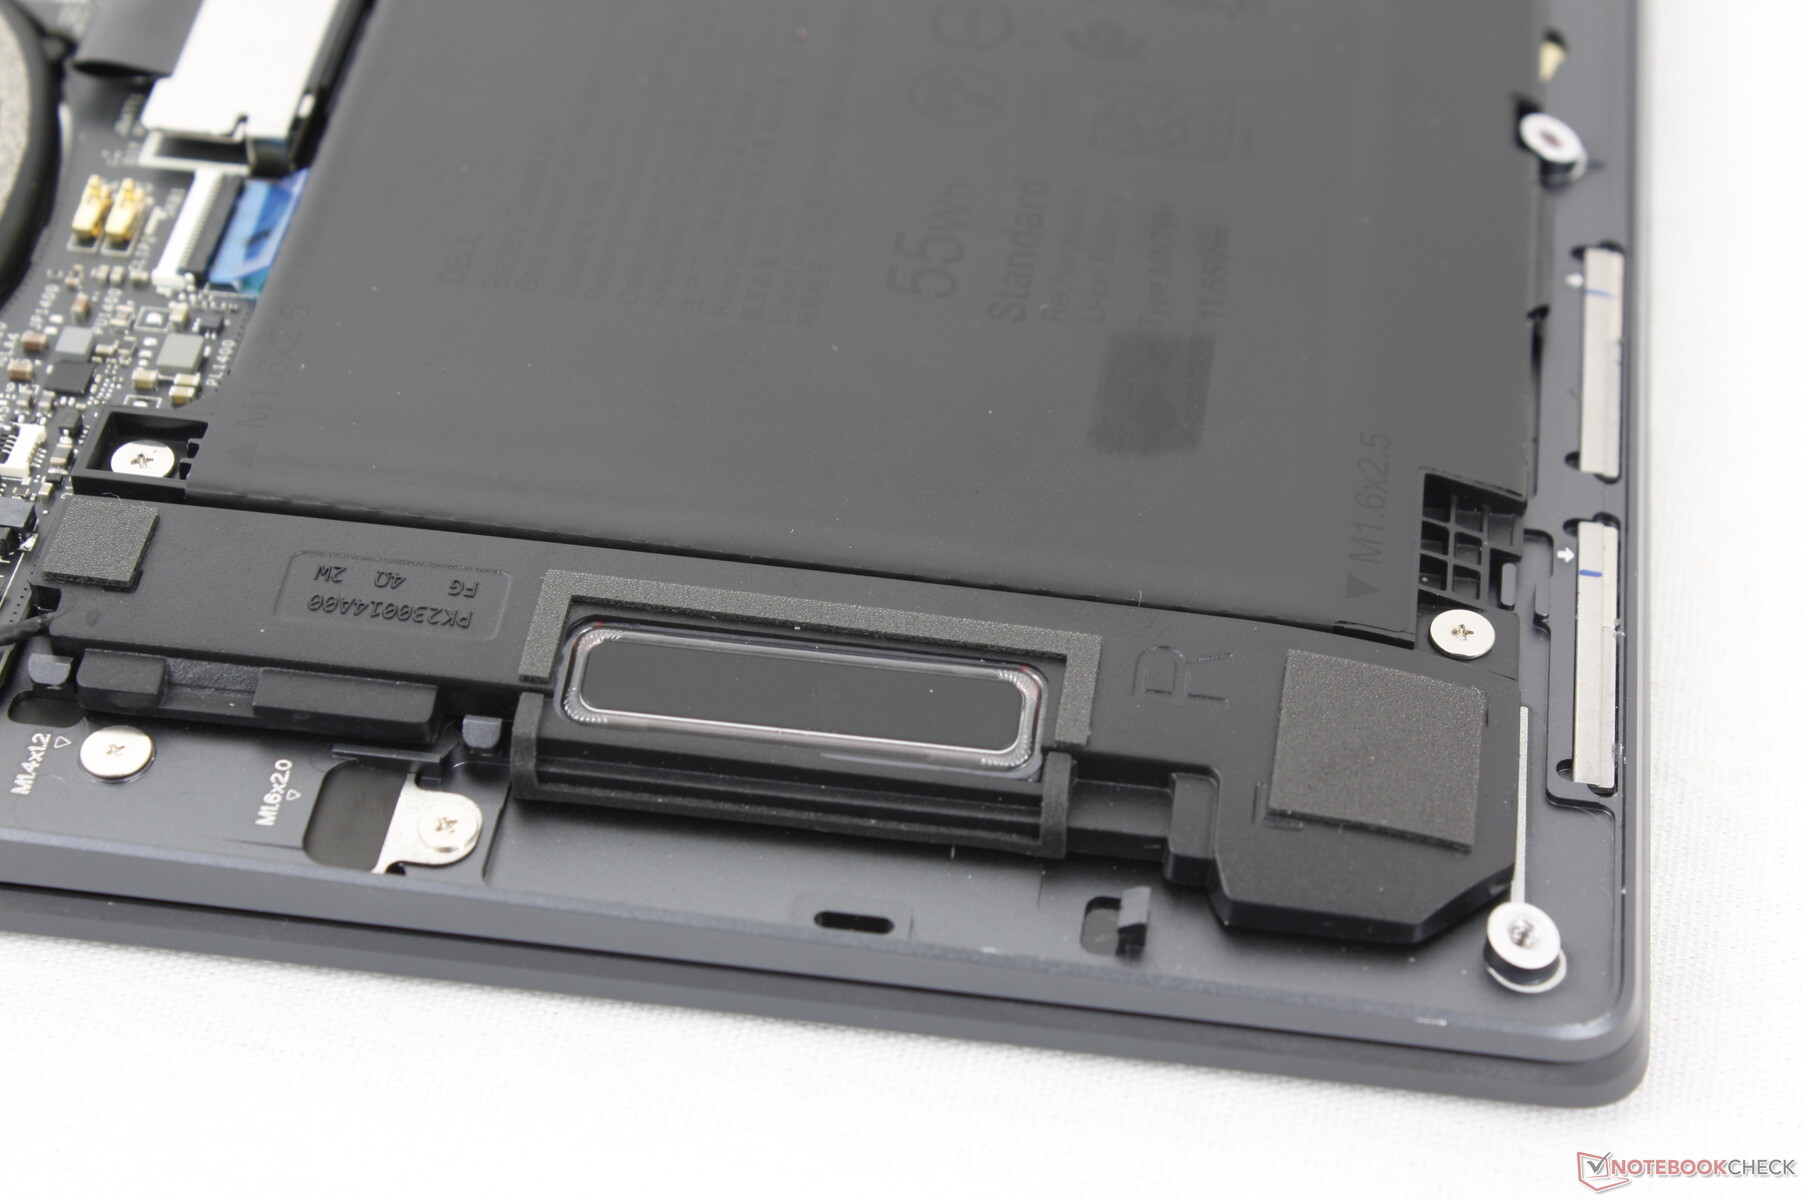
Dispositivi di archiviazione
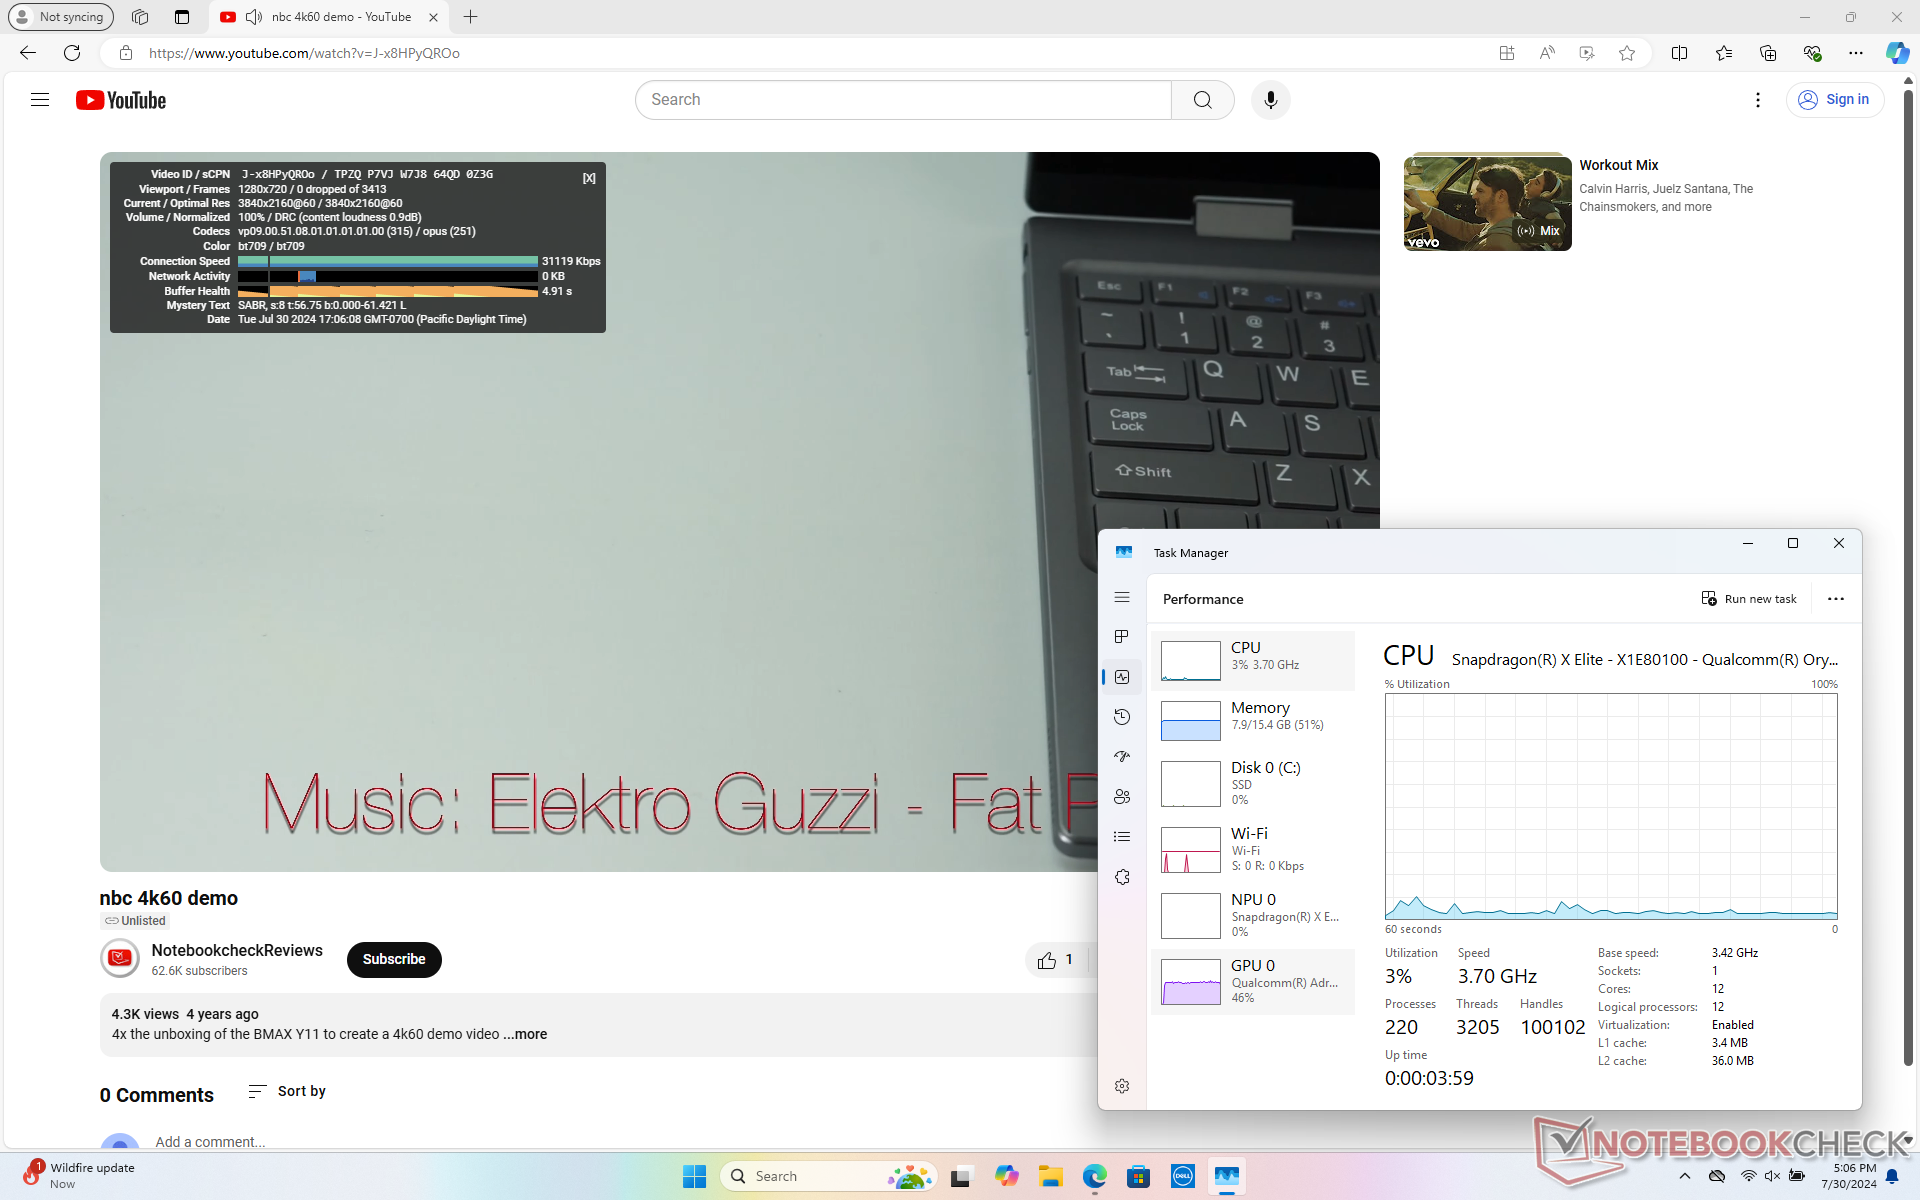
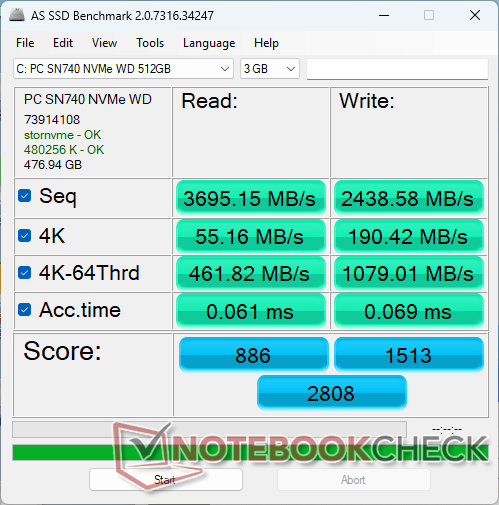
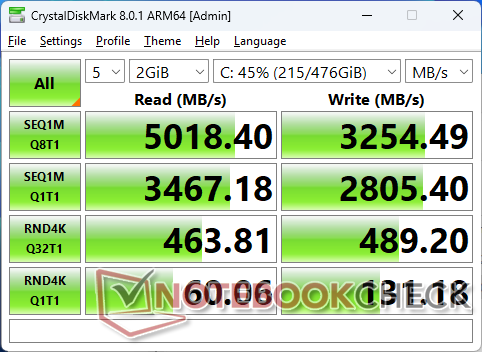
Dell si rifornisce di SSD da un'ampia varietà di produttori, per cui è difficile sapere quale unità si sta acquistando prima dell'acquisto. Ad esempio, abbiamo avuto unità di Micron, Samsung, WD, Toshiba e SK Hynix in oltre 10 diverse unità XPS 13 interne. La nostra unità specifica di Qualcomm viene fornita con il WD SN740 di fascia media, che offre velocità di trasferimento stabili fino a 5000 MB/s. Non abbiamo osservato alcun comportamento di throttling nonostante la lunghezza ridotta di 42 mm, probabilmente dovuto in parte al diffusore di calore SSD incluso.

* ... Meglio usare valori piccoli
Disk Throttling: DiskSpd Read Loop, Queue Depth 8
Prestazioni della GPU
Le prestazioni grafiche, secondo 3DMark emulato, sono alla pari con l'Iris Xe 96 EU Iris Xe 96 EUs ma ben al di sotto dell' Arc 8 o Radeon 680M/780M fino al 20-40%. Tuttavia, i risultati sono costantemente migliori rispetto al HP EliteBook Ultra G1q 14 anche se i delta sono minori in media.
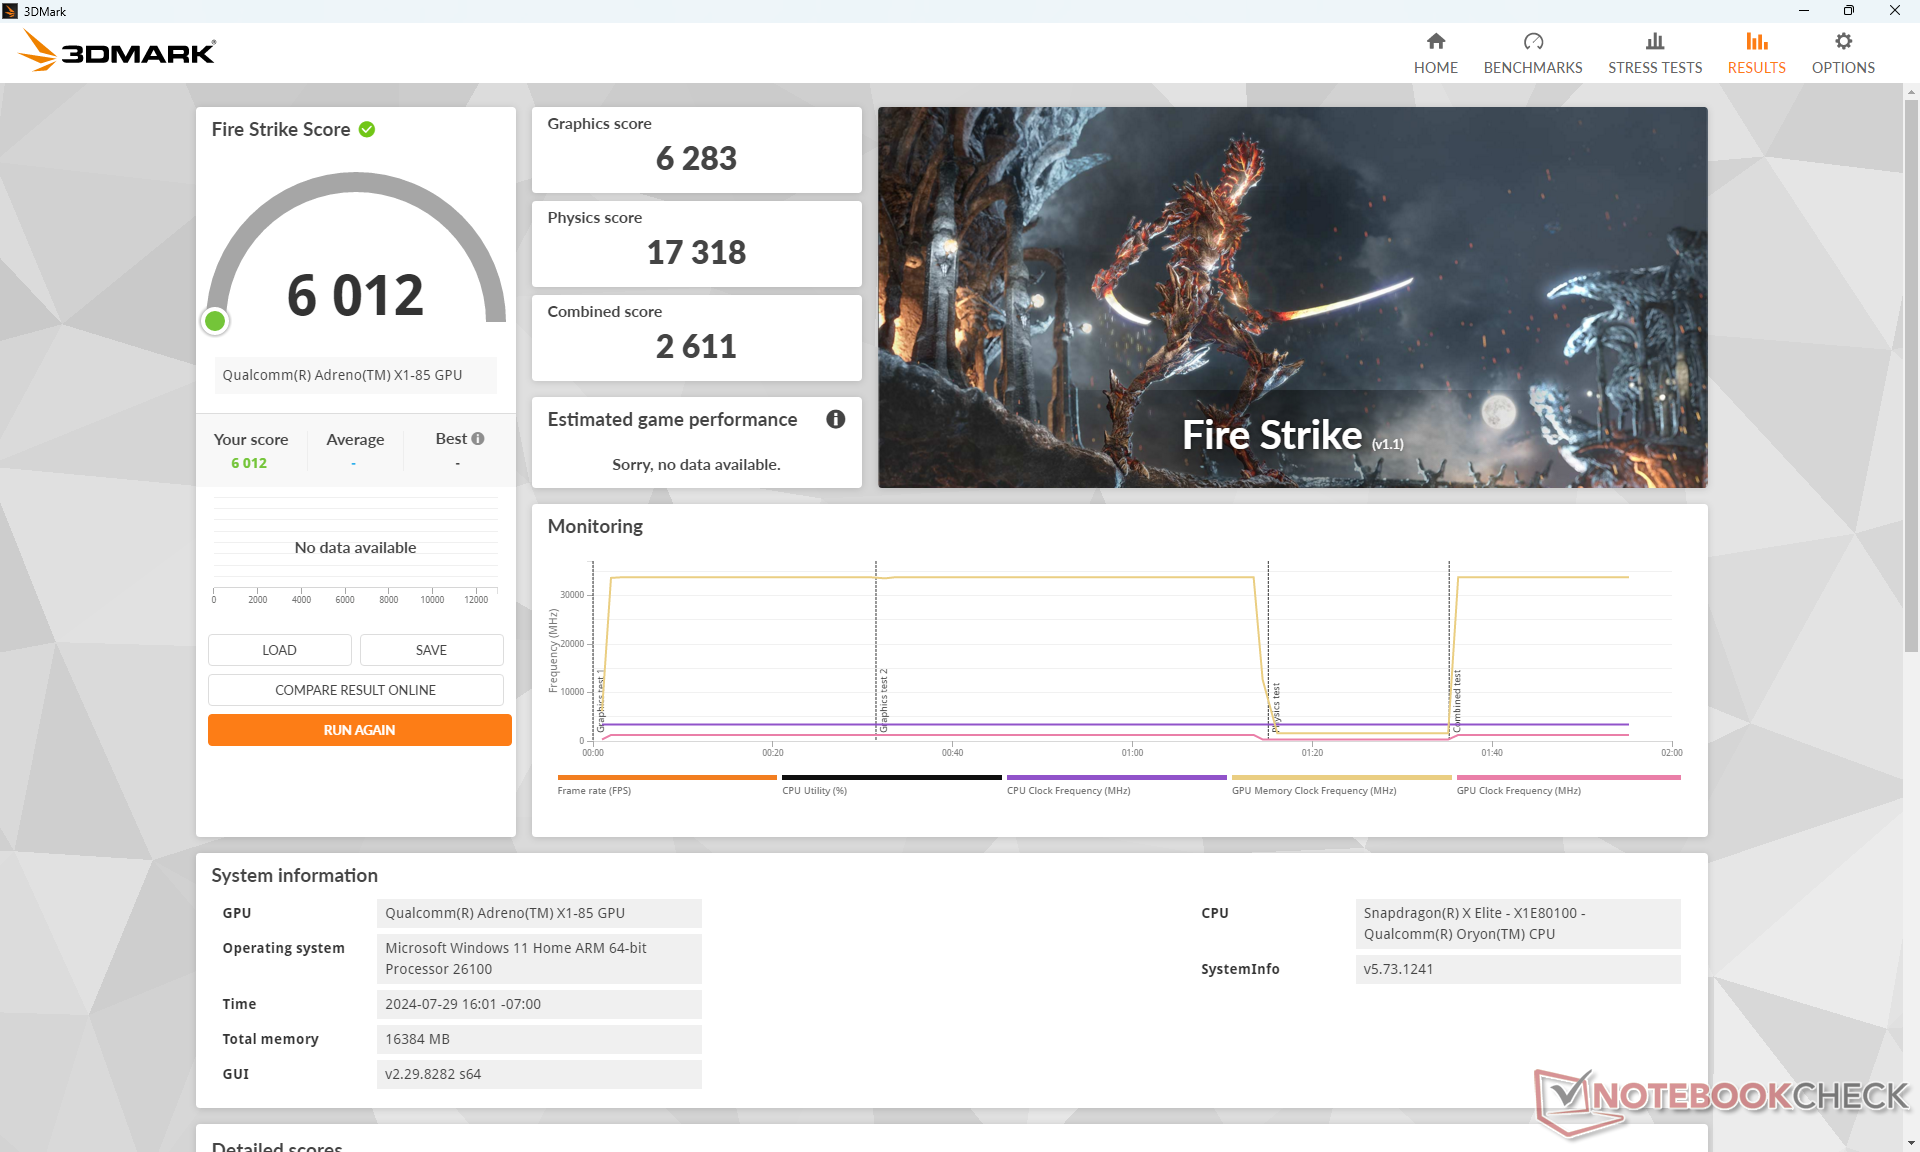
| Profilo di potenza | Punteggio grafico | Punteggio Fisica | Punteggio combinato |
| Modalità prestazioni | 6283 | 17318 | 2611 |
| Modalità equilibrata | 6209 | 18348 | 2643 |
| Alimentazione a batteria | 6287 | 18156 | 2687 |
Non c'è un calo significativo delle prestazioni quando si passa dalle modalità Prestazioni, Bilanciato o Alimentazione a batteria, come dimostra la tabella dei risultati di Fire Strike qui sopra.
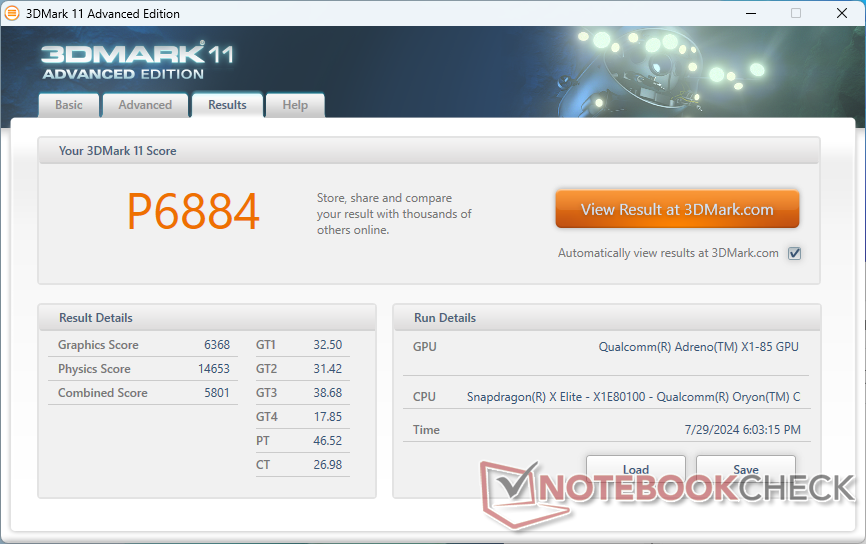
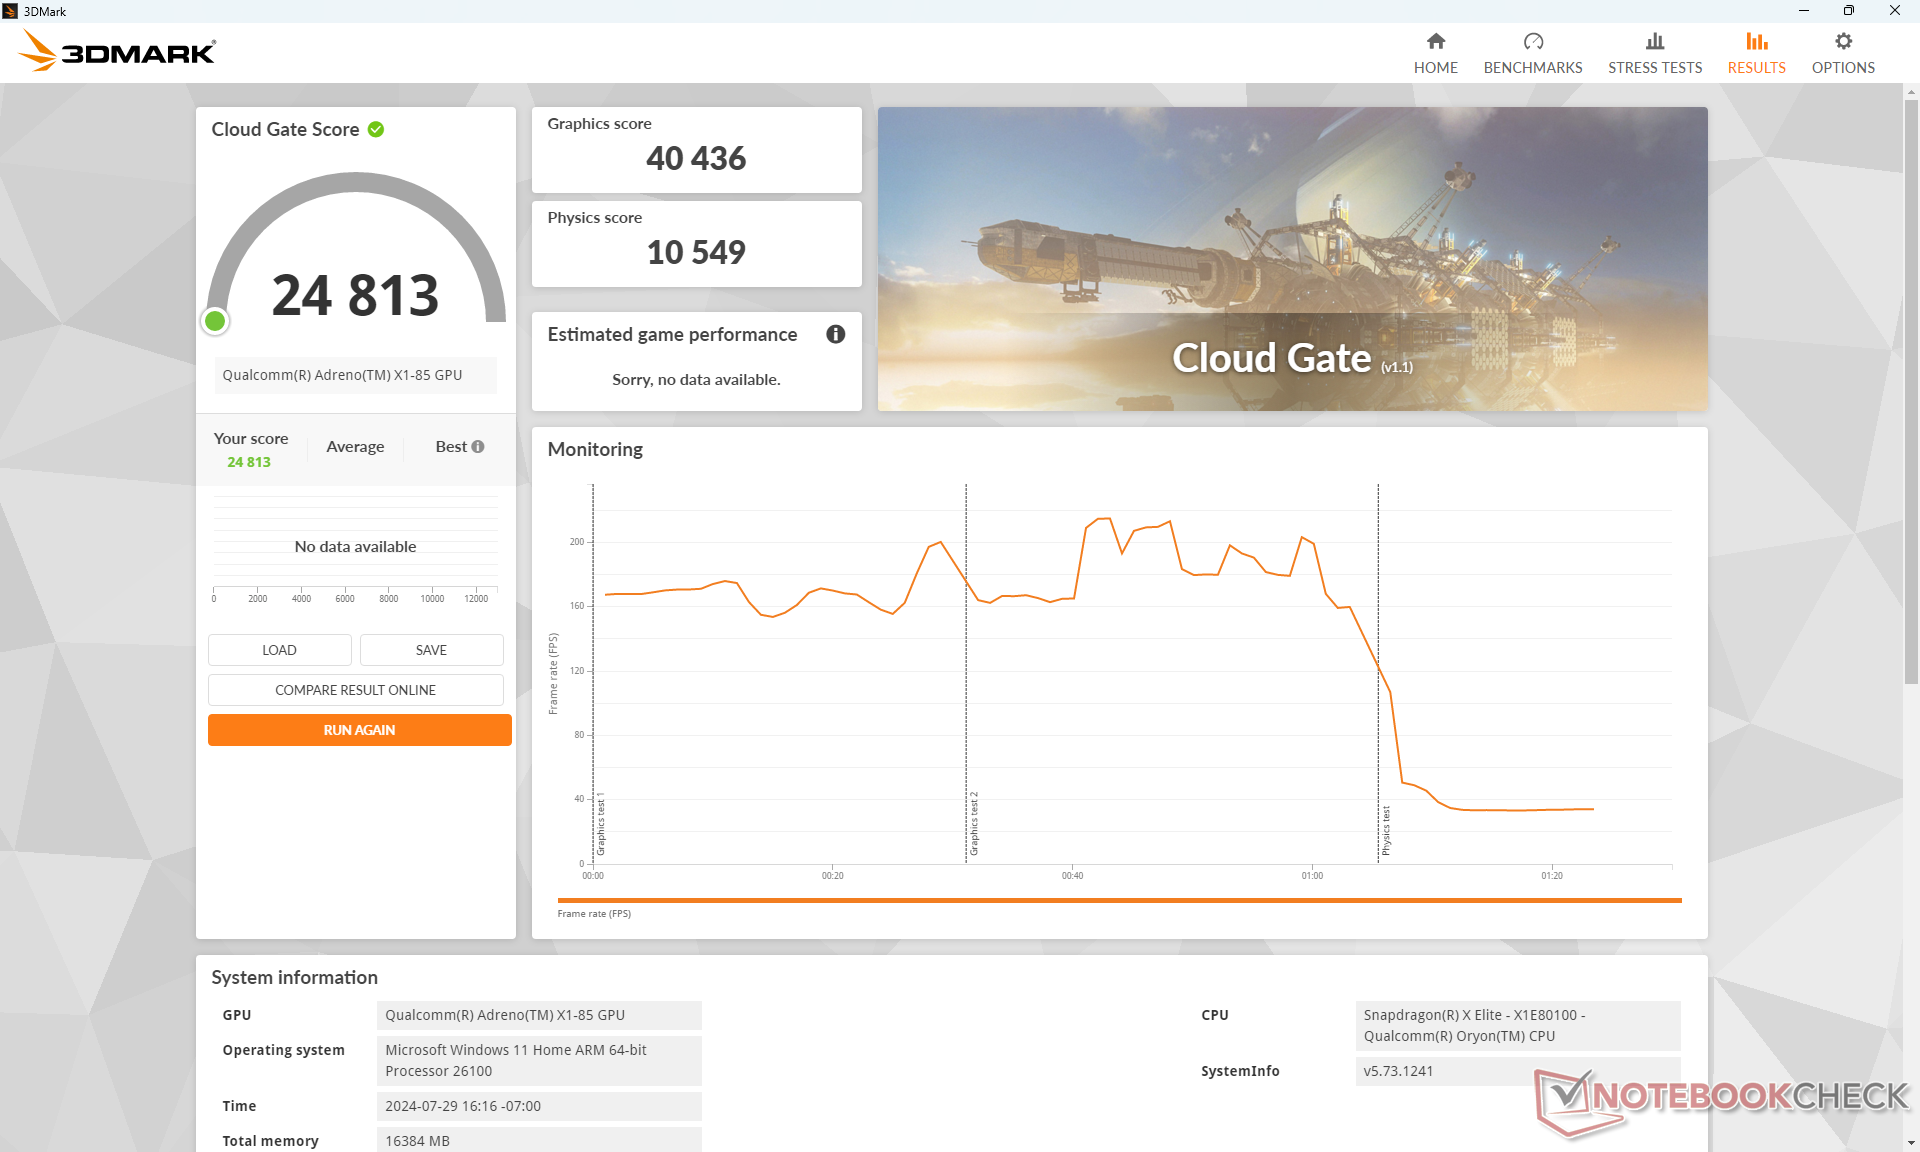
| 3DMark 11 Performance | 6884 punti | |
| 3DMark Cloud Gate Standard Score | 24813 punti | |
| 3DMark Fire Strike Score | 6012 punti | |
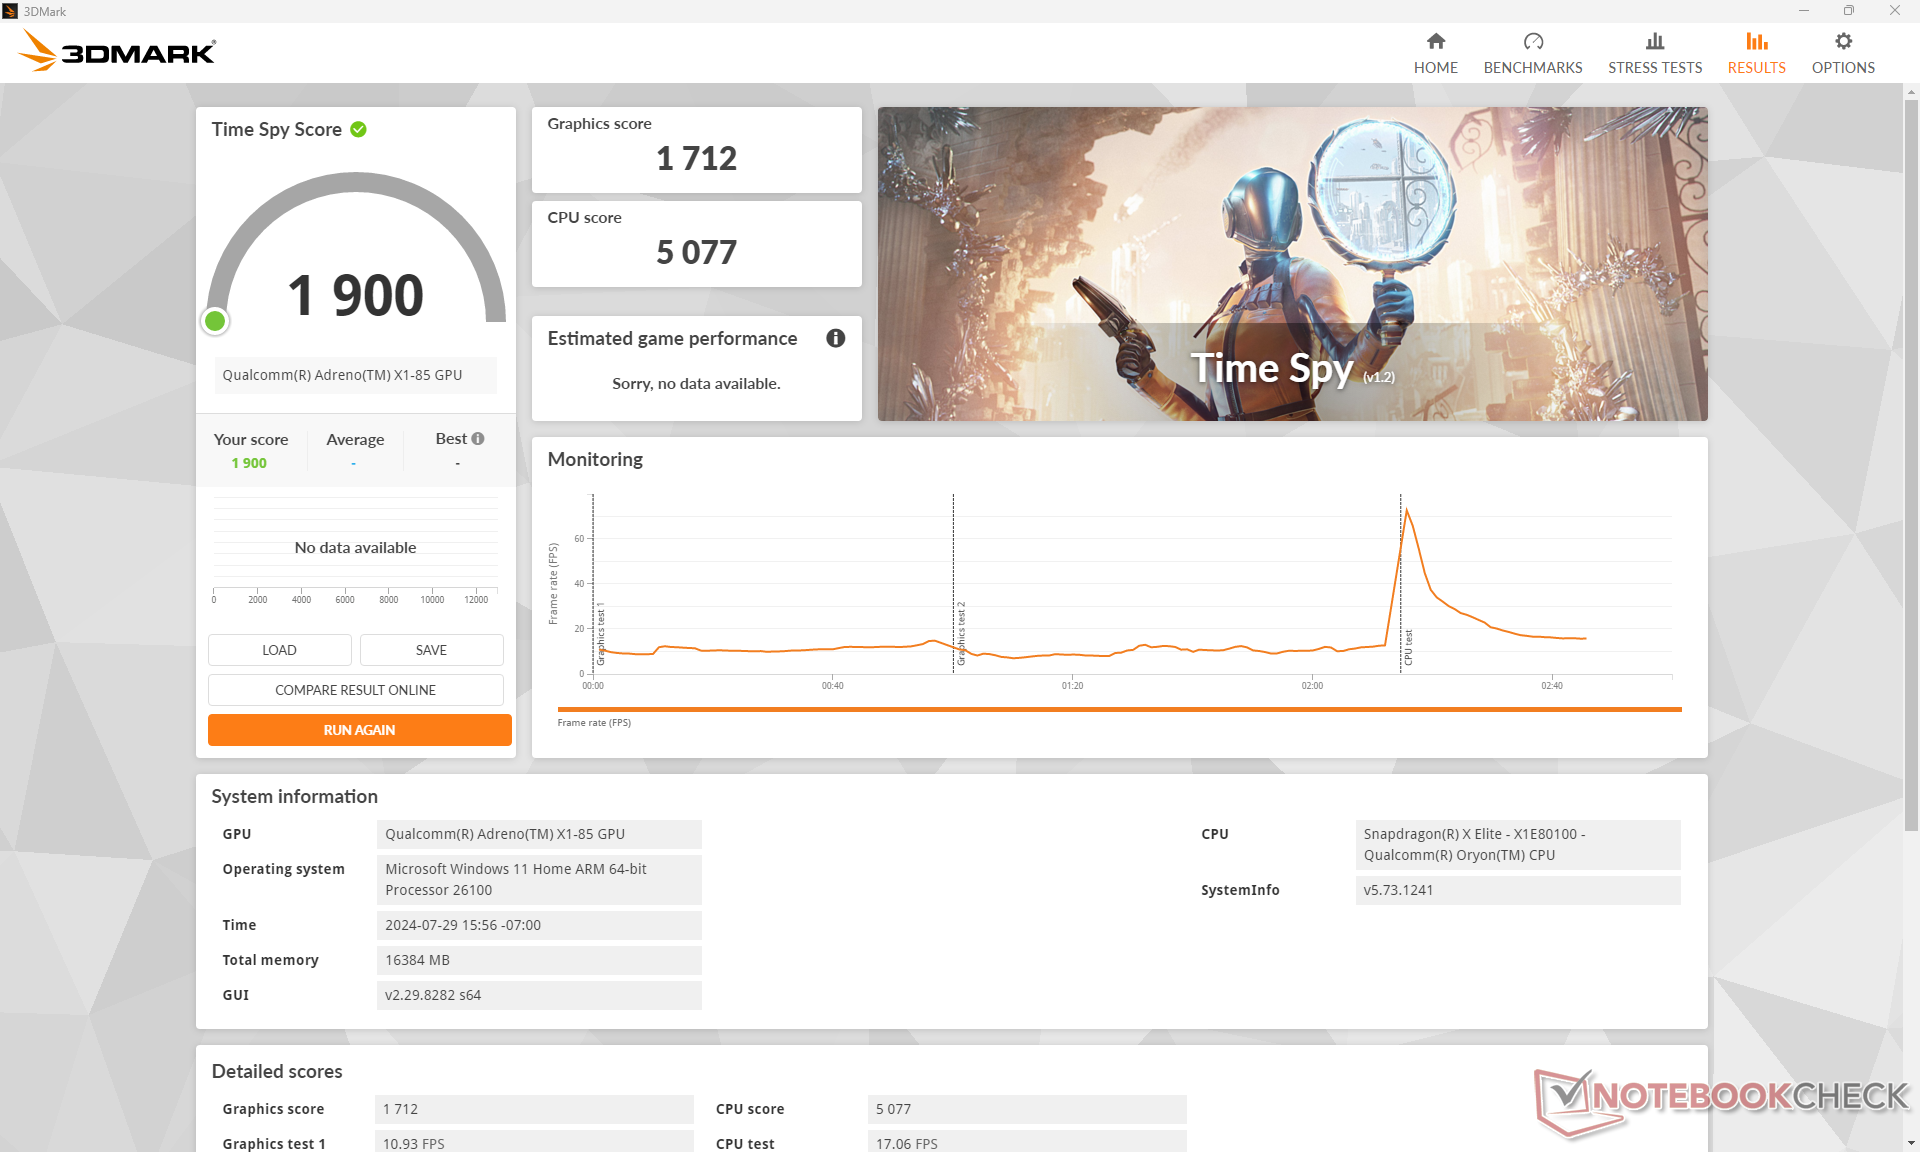
| 3DMark Time Spy Score | 1900 punti | |
Aiuto | ||
* ... Meglio usare valori piccoli
Prestazioni di gioco
I nostri risultati 3DMark leggermente superiori rispetto all'EliteBook Ultra G1q 14 si traducono in prestazioni leggermente più veloci nei titoli testati di seguito. È interessante notare che alcuni titoli venivano eseguiti sulla nostra unità Dell ma non su quella HP e viceversa. Ad esempio, Far Cry 5 girava sul nostro Dell ma non sull'HP e Baldur's Gate 3 girava sull'HP ma non sul Dell, indipendentemente dalla modalità DirectX. La discrepanza potrebbe essere dovuta alle differenze di driver tra i due modelli, ma questo dimostra anche che è necessario lavorare di più sui driver grafici.
| Performance rating - Percent | |
| Lenovo ThinkBook 13x G4 21KR0008GE -2! | |
| Dell XPS 13 9340 Core Ultra 7 -2! | |
| Dell XPS 13 9345 | |
| Microsoft Surface Laptop 7 13.8 Copilot+ -2! | |
| HP EliteBook Ultra G1q 14 -1! | |
| Asus ZenBook S13 OLED UX5304 -1! | |
| The Witcher 3 - 1920x1080 Ultra Graphics & Postprocessing (HBAO+) | |
| Lenovo ThinkBook 13x G4 21KR0008GE | |
| Dell XPS 13 9340 Core Ultra 7 | |
| Dell XPS 13 9345 | |
| HP EliteBook Ultra G1q 14 | |
| Asus ZenBook S13 OLED UX5304 | |
| GTA V - 1920x1080 Highest AA:4xMSAA + FX AF:16x | |
| Microsoft Surface Laptop 7 13.8 Copilot+ | |
| Dell XPS 13 9345 | |
| Lenovo ThinkBook 13x G4 21KR0008GE | |
| Dell XPS 13 9340 Core Ultra 7 | |
| Asus ZenBook S13 OLED UX5304 | |
| Final Fantasy XV Benchmark - 1920x1080 High Quality | |
| Dell XPS 13 9340 Core Ultra 7 | |
| Lenovo ThinkBook 13x G4 21KR0008GE | |
| Microsoft Surface Laptop 7 13.8 Copilot+ | |
| Dell XPS 13 9345 | |
| Asus ZenBook S13 OLED UX5304 | |
| HP EliteBook Ultra G1q 14 | |
| Strange Brigade - 1920x1080 ultra AA:ultra AF:16 | |
| Lenovo ThinkBook 13x G4 21KR0008GE | |
| Dell XPS 13 9340 Core Ultra 7 | |
| Microsoft Surface Laptop 7 13.8 Copilot+ | |
| Dell XPS 13 9345 | |
| HP EliteBook Ultra G1q 14 | |
| Asus ZenBook S13 OLED UX5304 | |
| Dota 2 Reborn - 1920x1080 ultra (3/3) best looking | |
| Dell XPS 13 9340 Core Ultra 7 | |
| Lenovo ThinkBook 13x G4 21KR0008GE | |
| Microsoft Surface Laptop 7 13.8 Copilot+ | |
| Asus ZenBook S13 OLED UX5304 | |
| Dell XPS 13 9345 | |
| HP EliteBook Ultra G1q 14 | |
| Tiny Tina's Wonderlands - 1920x1080 Badass Preset (DX12) | |
| Dell XPS 13 9345 | |
| HP EliteBook Ultra G1q 14 | |
| F1 22 - 1920x1080 High Preset AA:T AF:16x | |
| Dell XPS 13 9345 | |
| Microsoft Surface Laptop 7 13.8 Copilot+ | |
| HP EliteBook Ultra G1q 14 | |
| Asus ZenBook S13 OLED UX5304 | |
| Tiny Tina's Wonderlands | |
| 1280x720 Lowest Preset (DX12) | |
| Dell XPS 13 9345 | |
| Media Qualcomm SD X Adreno X1-85 3.8 TFLOPS (67.6 - 73.9, n=3) | |
| HP EliteBook Ultra G1q 14 | |
| Dell XPS 13 Plus 9320 Core i7-1360P | |
| 1920x1080 Low Preset (DX12) | |
| Dell XPS 13 9345 | |
| Media Qualcomm SD X Adreno X1-85 3.8 TFLOPS (41.5 - 44.7, n=3) | |
| HP EliteBook Ultra G1q 14 | |
| Dell XPS 13 Plus 9320 Core i7-1360P | |
| 1920x1080 Medium Preset (DX12) | |
| Dell XPS 13 9345 | |
| Media Qualcomm SD X Adreno X1-85 3.8 TFLOPS (30.8 - 33.7, n=3) | |
| HP EliteBook Ultra G1q 14 | |
| Dell XPS 13 Plus 9320 Core i7-1360P | |
| 1920x1080 High Preset (DX12) | |
| Dell XPS 13 9345 | |
| Media Qualcomm SD X Adreno X1-85 3.8 TFLOPS (20.6 - 22.4, n=3) | |
| HP EliteBook Ultra G1q 14 | |
| Dell XPS 13 Plus 9320 Core i7-1360P | |
| 1920x1080 Badass Preset (DX12) | |
| Dell XPS 13 9345 | |
| Media Qualcomm SD X Adreno X1-85 3.8 TFLOPS (16.8 - 18, n=3) | |
| HP EliteBook Ultra G1q 14 | |
| Dell XPS 13 Plus 9320 Core i7-1360P | |
Cyberpunk 2077 ultra FPS Chart
| basso | medio | alto | ultra | |
|---|---|---|---|---|
| GTA V (2015) | 96.3 | 94.2 | 49.5 | 21.2 |
| The Witcher 3 (2015) | 104 | 74.5 | 43.7 | 19.2 |
| Dota 2 Reborn (2015) | 80 | 60.7 | 57.4 | 50.7 |
| Final Fantasy XV Benchmark (2018) | 56.1 | 25 | 15.8 | |
| X-Plane 11.11 (2018) | 38 | |||
| Far Cry 5 (2018) | 42 | 33 | 31 | 28 |
| Strange Brigade (2018) | 123.9 | 50.8 | 41.8 | 33.9 |
| Tiny Tina's Wonderlands (2022) | 44.5 | 33.6 | 22.4 | 18 |
| F1 22 (2022) | 62.9 | 55.4 | 38.5 | |
| Cyberpunk 2077 (2023) | 24.1 | 19.5 | 16.9 | 14.7 |
Emissioni
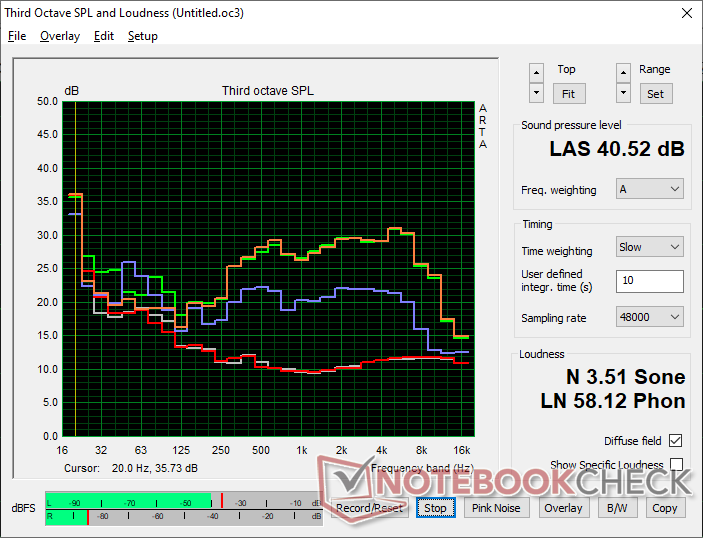
Rumore del sistema - Attività della ventola più rilassata
Il rumore della ventola è leggermente più silenzioso rispetto al modello Modello Intel Core Ultra 7 nel senso che le ventole interne aumentano più lentamente in risposta all'aumento dei carichi. Altrimenti, le ventole di entrambi i modelli si assesterebbero su valori di RPM massimi simili quando si eseguono carichi impegnativi per periodi prolungati. Ad esempio, il rumore della ventola raggiungeva i 32,8 dB(A) verso la fine della prima scena di benchmark di 90 secondi in 3DMark 06, rispetto ai 37,4 dB(A) del modello Intel in condizioni simili. Quando si eseguono giochi come Cyberpunk 2077, tuttavia, entrambi i modelli si assestano sulla fascia bassa dei 40 dB(A). Il sistema alimentato da Qualcomm non è necessariamente più silenzioso quando si eseguono carichi elevati, ma è anche meno probabile che si noti l'attività della ventola durante la navigazione web o lo streaming video.
Rumorosità
| Idle |
| 22.9 / 22.9 / 22.9 dB(A) |
| Sotto carico |
| 32.8 / 40.6 dB(A) |
 | ||
30 dB silenzioso 40 dB(A) udibile 50 dB(A) rumoroso |
||
min: | ||
| Dell XPS 13 9345 Adreno X1-85 3.8 TFLOPS, SD X Elite X1E-80-100 | Dell XPS 13 9340 Core Ultra 7 Arc 8-Core, Ultra 7 155H, Micron 2550 512GB | Microsoft Surface Laptop 7 13.8 Copilot+ Adreno X1-85 3.8 TFLOPS, SD X Elite X1E-80-100, Samsung MZ9L4512HBLU-00BMV | Lenovo ThinkBook 13x G4 21KR0008GE Arc 7-Core, Ultra 5 125H, Samsung PM9C1a MZAL8512HDLU | HP EliteBook Ultra G1q 14 Adreno X1-85 3.8 TFLOPS, SD X Elite X1E-78-100, SK hynix PC801 HFS512GEJ9X101N BF | Asus ZenBook S13 OLED UX5304 Iris Xe G7 96EUs, i7-1355U, Samsung PM9A1 MZVL21T0HCLR | |
|---|---|---|---|---|---|---|
| Noise | -10% | 4% | -7% | 4% | -4% | |
| off /ambiente * (dB) | 22.9 | 25.1 -10% | 23.8 -4% | 24.5 -7% | 23.4 -2% | 23.3 -2% |
| Idle Minimum * (dB) | 22.9 | 25.1 -10% | 23.8 -4% | 24.5 -7% | 23.4 -2% | 23.3 -2% |
| Idle Average * (dB) | 22.9 | 25.1 -10% | 23.8 -4% | 24.5 -7% | 23.4 -2% | 23.3 -2% |
| Idle Maximum * (dB) | 22.9 | 25.1 -10% | 23.8 -4% | 27.1 -18% | 24.3 -6% | 23.3 -2% |
| Load Average * (dB) | 32.8 | 37.4 -14% | 26 21% | 33.3 -2% | 25 24% | 37.7 -15% |
| Cyberpunk 2077 ultra * (dB) | 40.6 | 31.5 22% | ||||
| Load Maximum * (dB) | 40.6 | 42.5 -5% | 40.3 1% | 40.7 -0% | 34.8 14% | 40.1 1% |
| Witcher 3 ultra * (dB) | 42.5 | 36.8 | 30.6 | 40.1 |
* ... Meglio usare valori piccoli
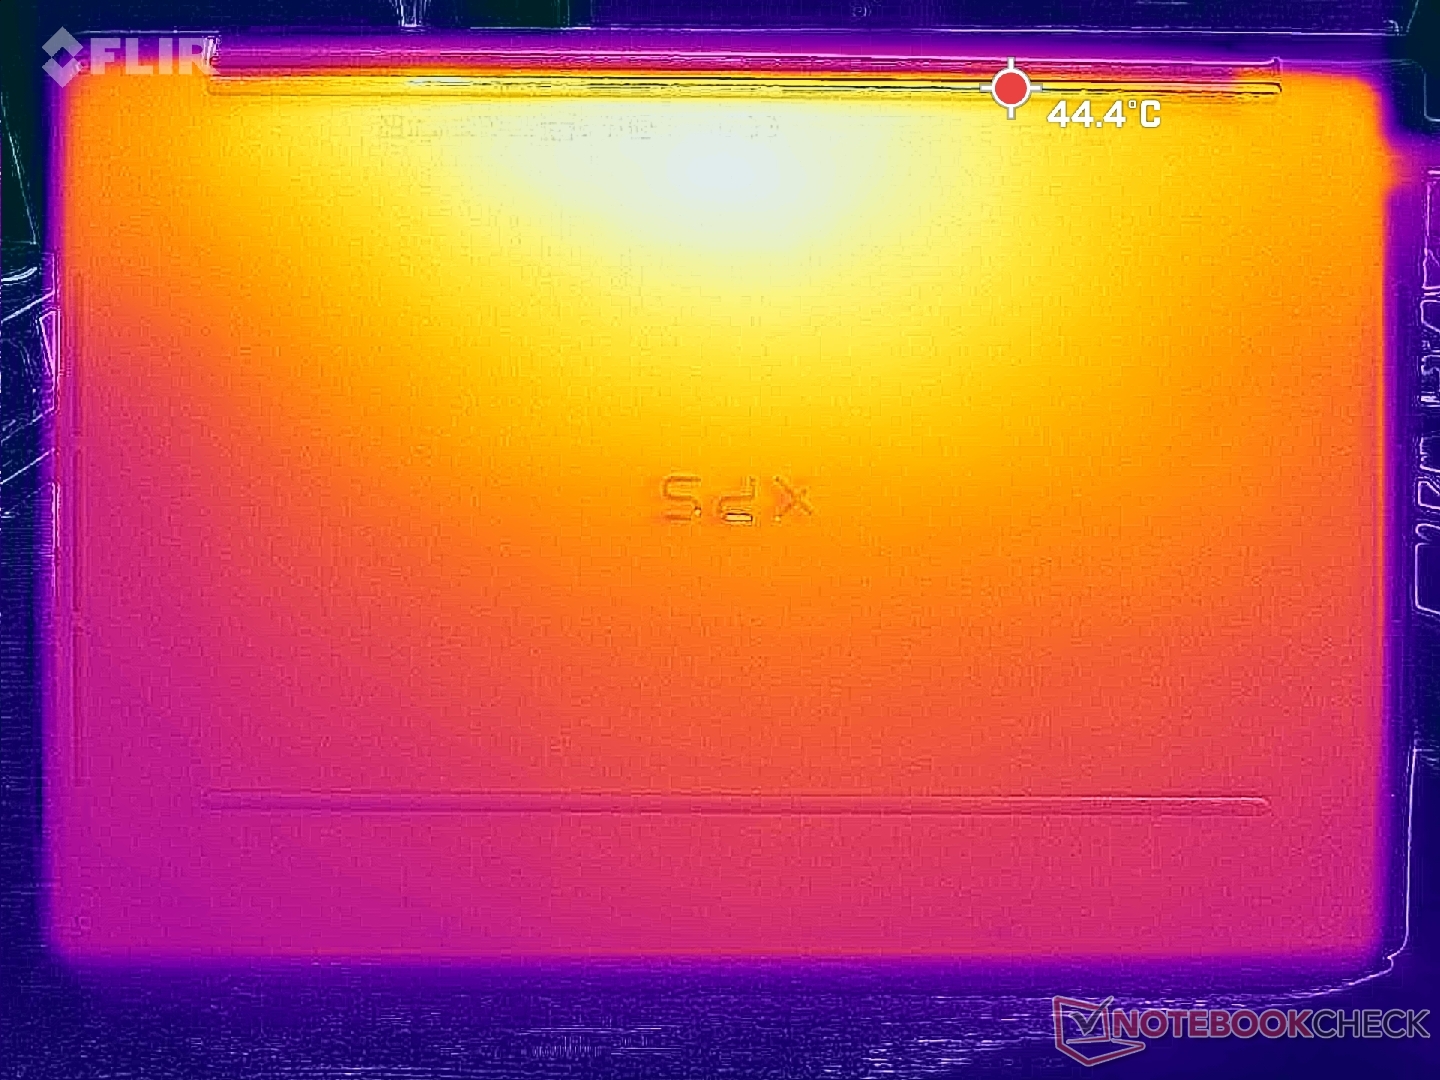
Temperatura
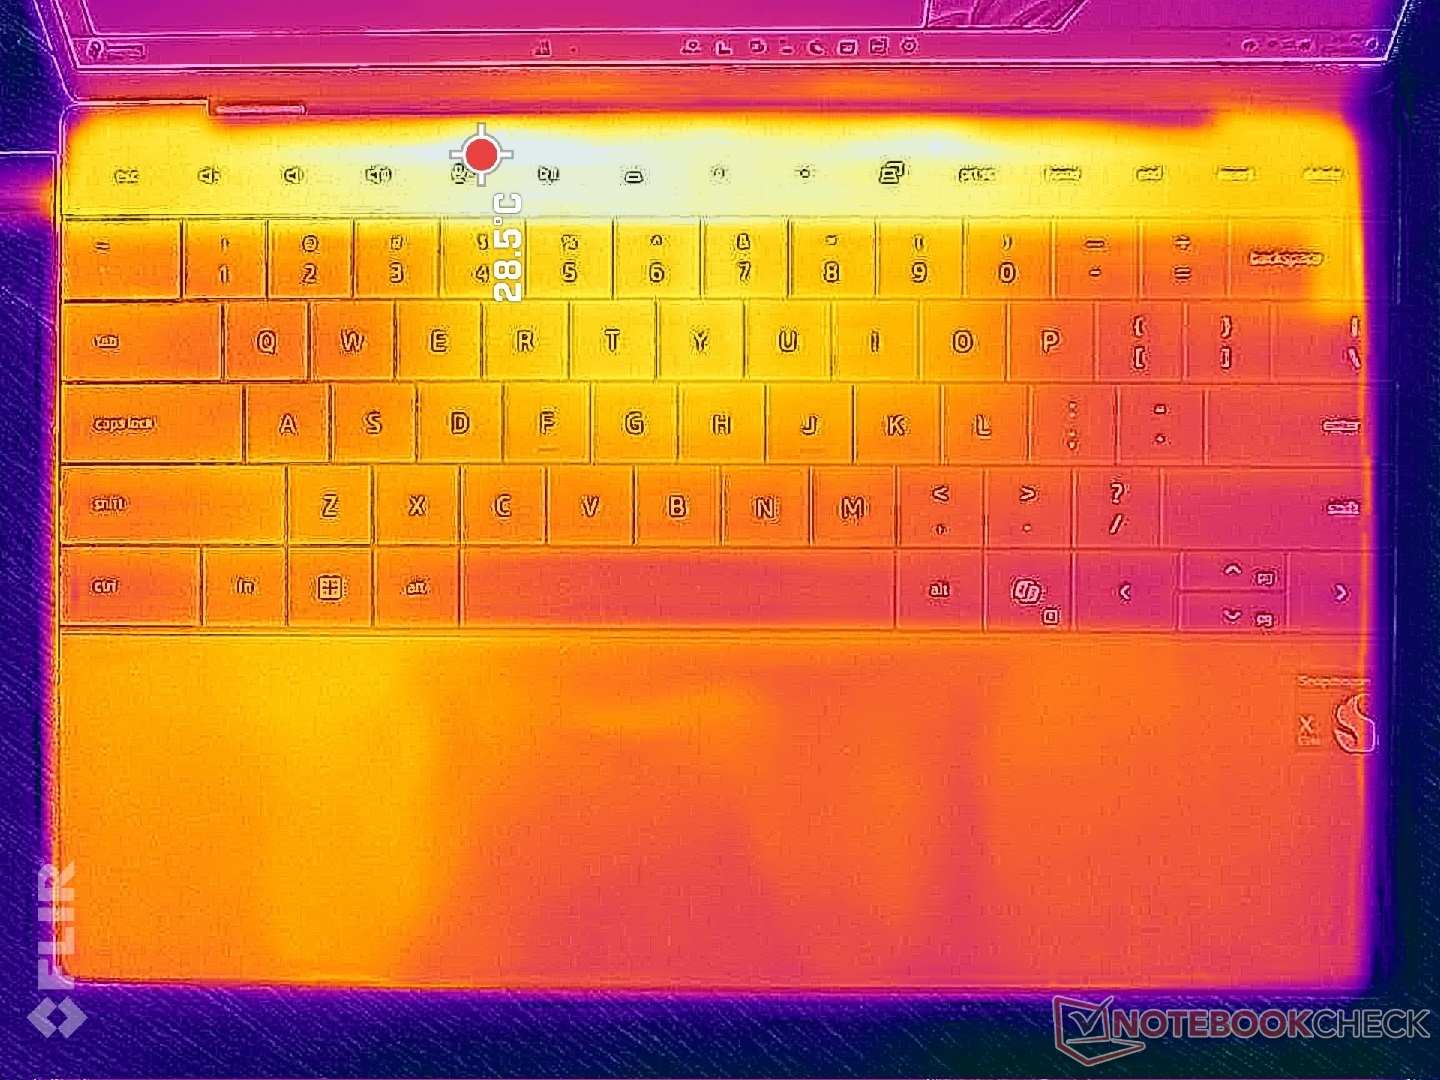
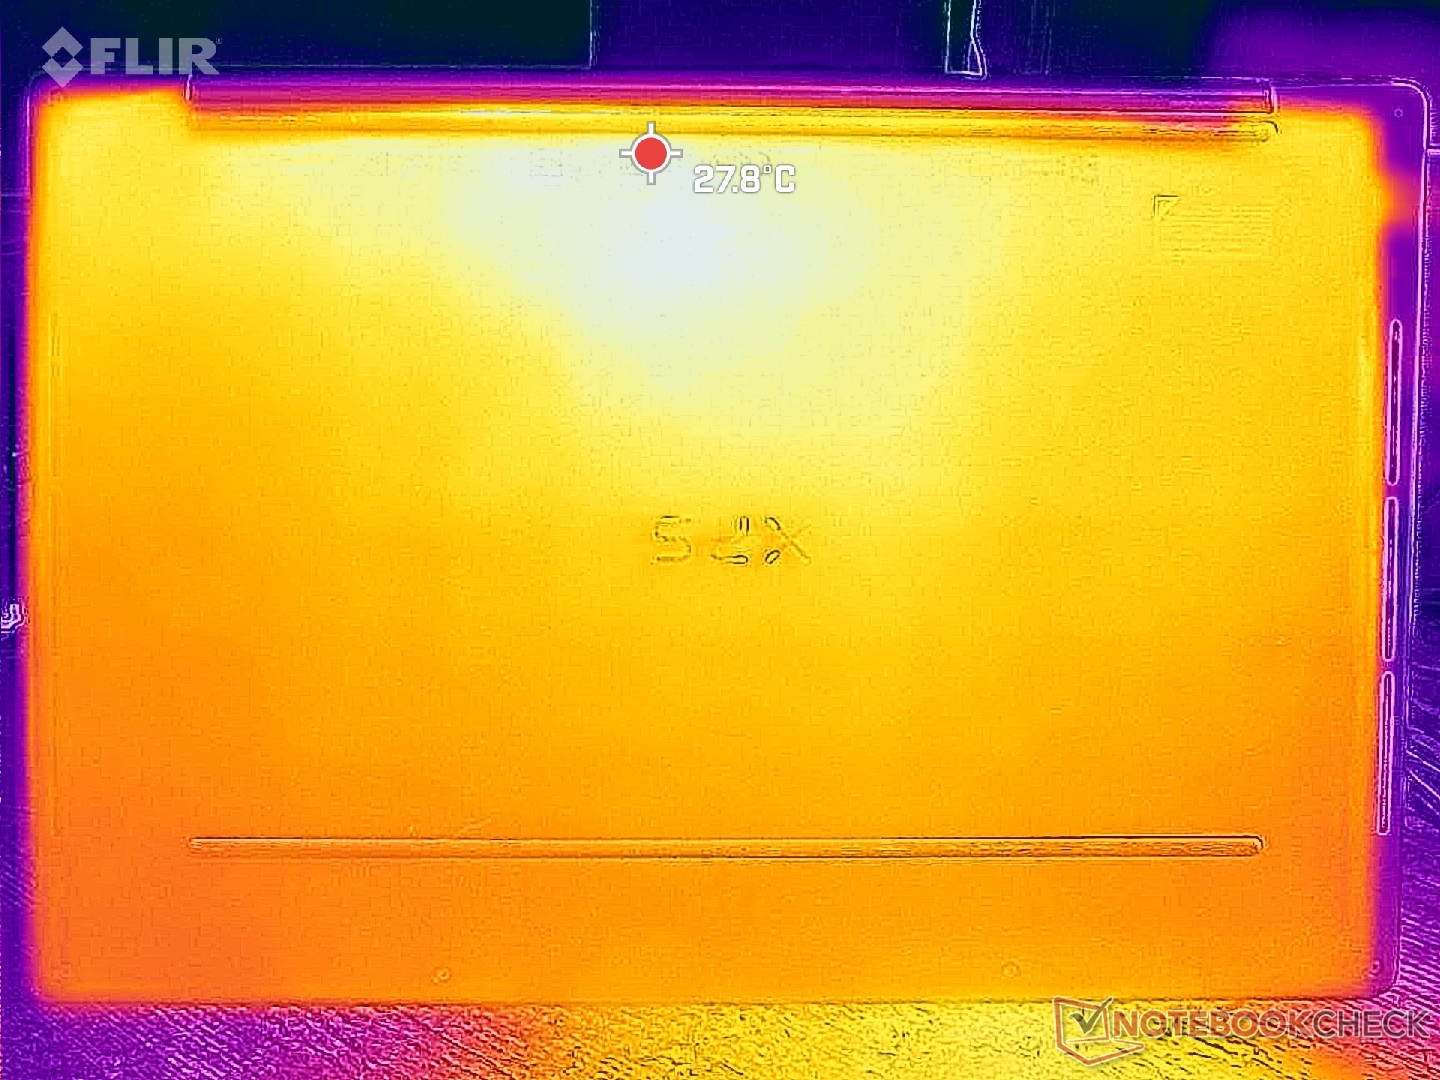
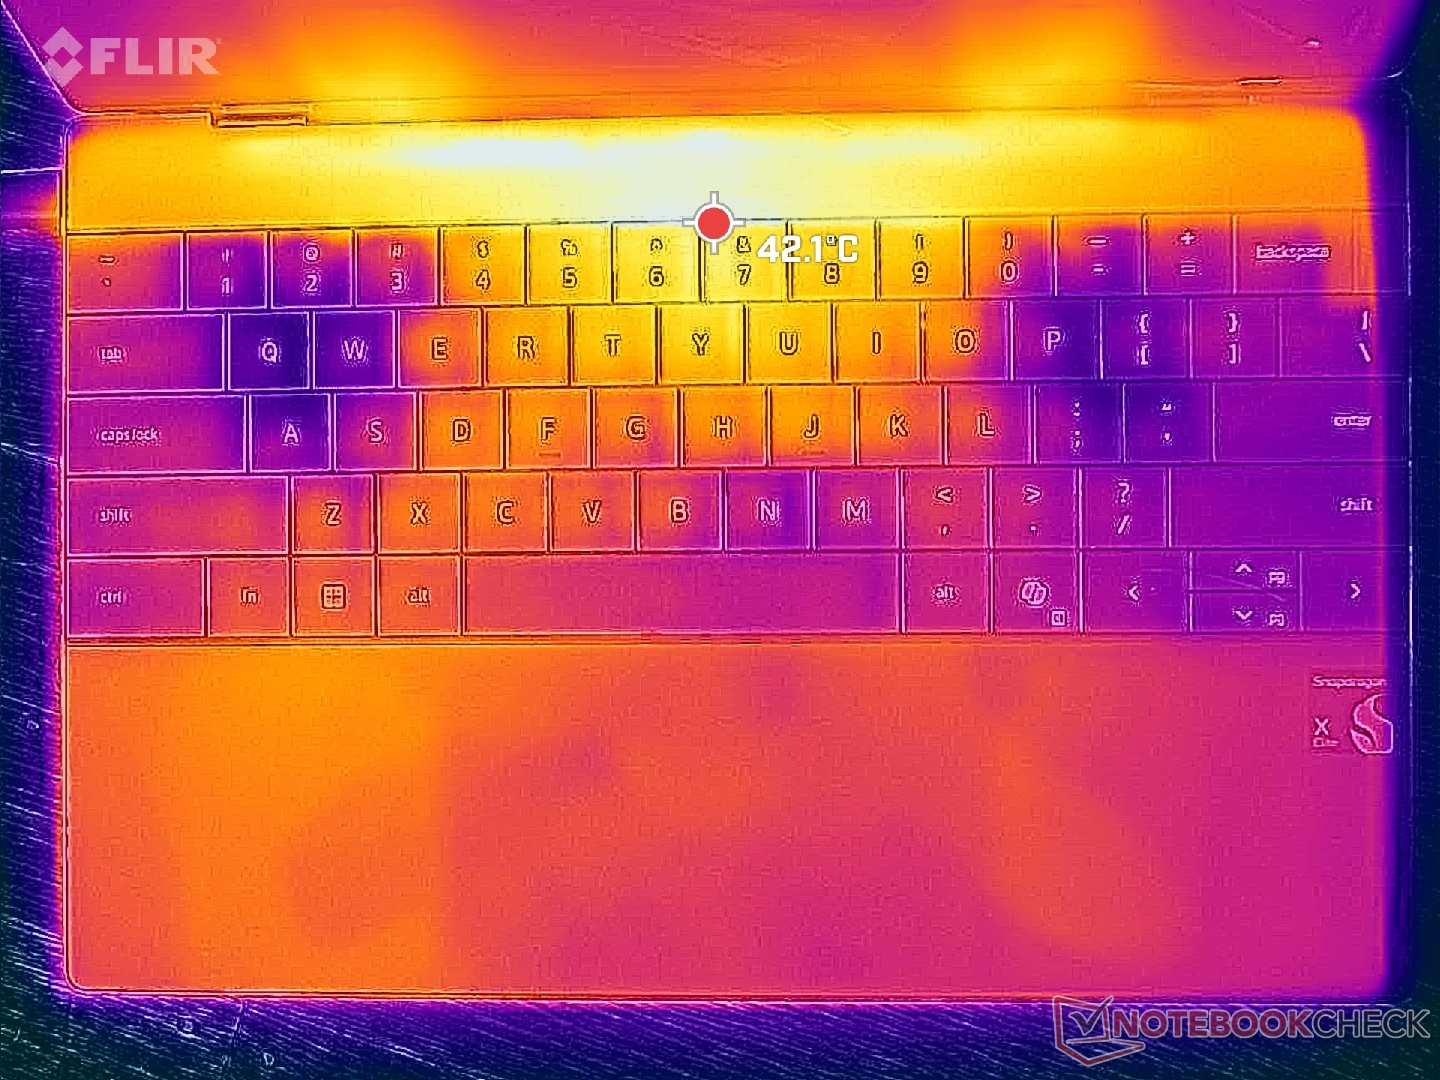
Le temperature di superficie sono molto vicine a quelle che abbiamo registrato sull'XPS 13 9340 con processore Intel, a dimostrazione che il modello Qualcomm non funziona in modo sensibilmente più caldo o più freddo, nonostante lo scambio di processore. I punti caldi verso il centro del sistema possono raggiungere i 45 C, il che è simile al modello Intel quando entrambi eseguono carichi impegnativi per periodi prolungati. Le temperature medie sono più fresche rispetto a quelle registrate sul modello Microsoft Surface Laptop 7 13.8 ma più calde di quelle del HP EliteBook Ultra G1q 14 ciascuno con CPU Snapdragon Elite simili.
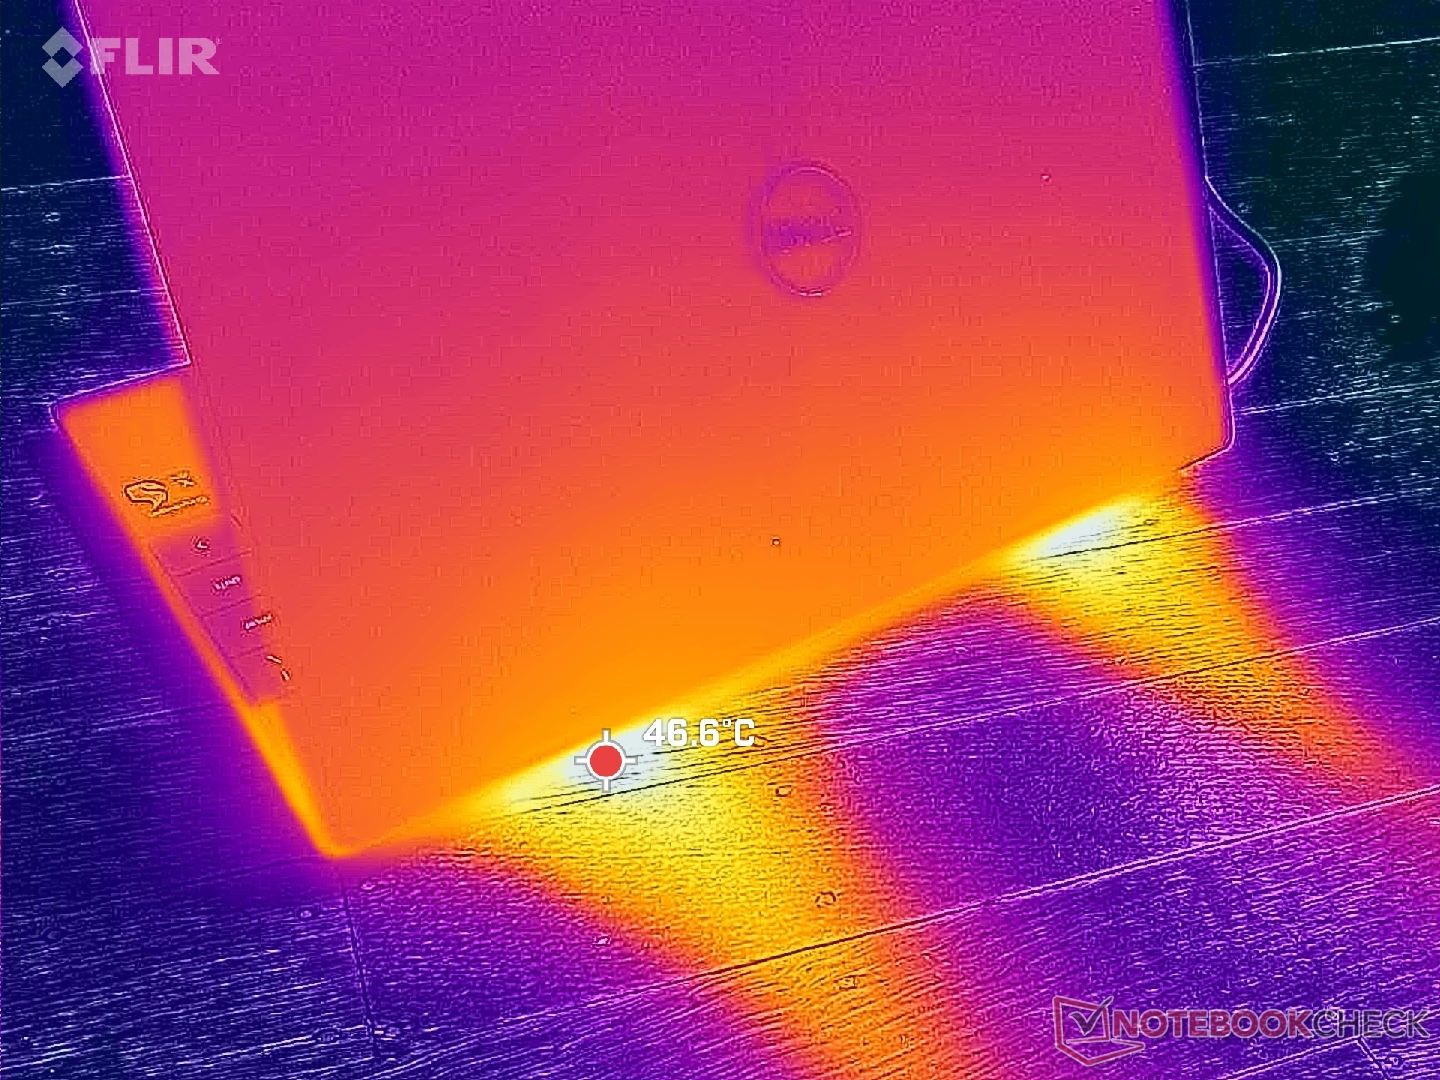
(-) La temperatura massima sul lato superiore è di 45.2 °C / 113 F, rispetto alla media di 35.9 °C / 97 F, che varia da 21.4 a 59 °C per questa classe Subnotebook.
(±) Il lato inferiore si riscalda fino ad un massimo di 44.2 °C / 112 F, rispetto alla media di 39.2 °C / 103 F
(+) In idle, la temperatura media del lato superiore è di 29.1 °C / 84 F, rispetto alla media deld ispositivo di 30.8 °C / 87 F.
(+) I poggiapolsi e il touchpad raggiungono la temperatura massima della pelle (34.4 °C / 93.9 F) e quindi non sono caldi.
(-) La temperatura media della zona del palmo della mano di dispositivi simili e'stata di 28.2 °C / 82.8 F (-6.2 °C / -11.1 F).
| Dell XPS 13 9345 Qualcomm Snapdragon X Elite X1E-80-100, Qualcomm SD X Adreno X1-85 3.8 TFLOPS | Dell XPS 13 9340 Core Ultra 7 Intel Core Ultra 7 155H, Intel Arc 8-Core iGPU | Microsoft Surface Laptop 7 13.8 Copilot+ Qualcomm Snapdragon X Elite X1E-80-100, Qualcomm SD X Adreno X1-85 3.8 TFLOPS | Lenovo ThinkBook 13x G4 21KR0008GE Intel Core Ultra 5 125H, Intel Arc 7-Core iGPU | HP EliteBook Ultra G1q 14 Qualcomm Snapdragon X Elite X1E-78-100, Qualcomm SD X Adreno X1-85 3.8 TFLOPS | Asus ZenBook S13 OLED UX5304 Intel Core i7-1355U, Intel Iris Xe Graphics G7 96EUs | |
|---|---|---|---|---|---|---|
| Heat | 12% | 9% | 9% | 4% | 6% | |
| Maximum Upper Side * (°C) | 45.2 | 41 9% | 47.1 -4% | 43.1 5% | 40.8 10% | 43.1 5% |
| Maximum Bottom * (°C) | 44.2 | 43.5 2% | 44.6 -1% | 39.2 11% | 40.4 9% | 45 -2% |
| Idle Upper Side * (°C) | 30.4 | 25.3 17% | 24.7 19% | 28.3 7% | 32.2 -6% | 27.3 10% |
| Idle Bottom * (°C) | 31.6 | 25.5 19% | 24.5 22% | 28 11% | 31.2 1% | 27.8 12% |
* ... Meglio usare valori piccoli
Altoparlanti
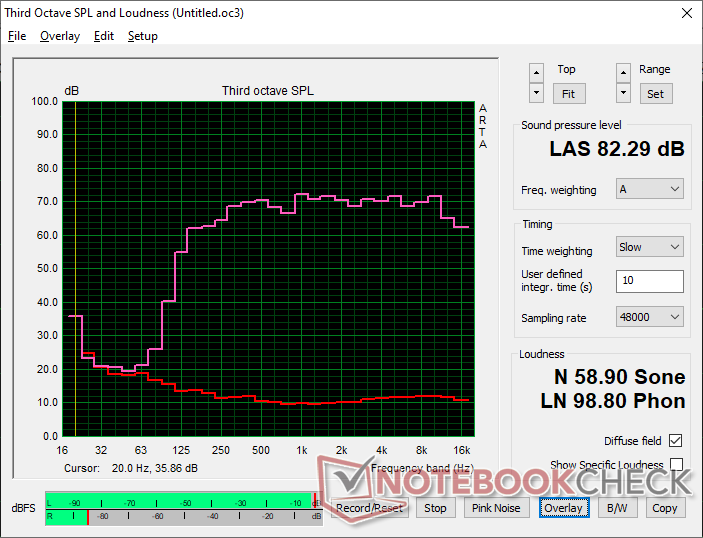
Dell XPS 13 9345 analisi audio
(+) | gli altoparlanti sono relativamente potenti (82.3 dB)
Bassi 100 - 315 Hz
(±) | bassi ridotti - in media 9.9% inferiori alla media
(±) | la linearità dei bassi è media (12.4% delta rispetto alla precedente frequenza)
Medi 400 - 2000 Hz
(+) | medi bilanciati - solo only 1.9% rispetto alla media
(+) | medi lineari (3.2% delta rispetto alla precedente frequenza)
Alti 2 - 16 kHz
(+) | Alti bilanciati - appena 1.5% dalla media
(+) | alti lineari (3% delta rispetto alla precedente frequenza)
Nel complesso 100 - 16.000 Hz
(+) | suono nel complesso lineare (8.2% differenza dalla media)
Rispetto alla stessa classe
» 2% di tutti i dispositivi testati in questa classe è stato migliore, 1% simile, 97% peggiore
» Il migliore ha avuto un delta di 5%, medio di 18%, peggiore di 53%
Rispetto a tutti i dispositivi testati
» 2% di tutti i dispositivi testati in questa classe è stato migliore, 1% similare, 98% peggiore
» Il migliore ha avuto un delta di 4%, medio di 24%, peggiore di 134%
Apple MacBook Pro 16 2021 M1 Pro analisi audio
(+) | gli altoparlanti sono relativamente potenti (84.7 dB)
Bassi 100 - 315 Hz
(+) | bassi buoni - solo 3.8% dalla media
(+) | bassi in lineaa (5.2% delta rispetto alla precedente frequenza)
Medi 400 - 2000 Hz
(+) | medi bilanciati - solo only 1.3% rispetto alla media
(+) | medi lineari (2.1% delta rispetto alla precedente frequenza)
Alti 2 - 16 kHz
(+) | Alti bilanciati - appena 1.9% dalla media
(+) | alti lineari (2.7% delta rispetto alla precedente frequenza)
Nel complesso 100 - 16.000 Hz
(+) | suono nel complesso lineare (4.6% differenza dalla media)
Rispetto alla stessa classe
» 0% di tutti i dispositivi testati in questa classe è stato migliore, 0% simile, 100% peggiore
» Il migliore ha avuto un delta di 5%, medio di 17%, peggiore di 45%
Rispetto a tutti i dispositivi testati
» 0% di tutti i dispositivi testati in questa classe è stato migliore, 0% similare, 100% peggiore
» Il migliore ha avuto un delta di 4%, medio di 24%, peggiore di 134%
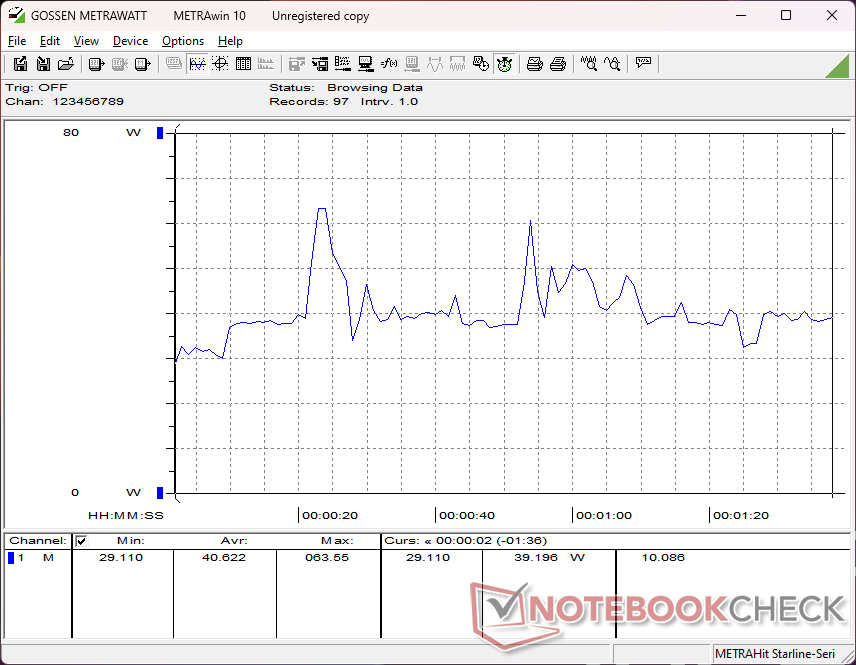
Gestione dell'energia
Consumo di energia
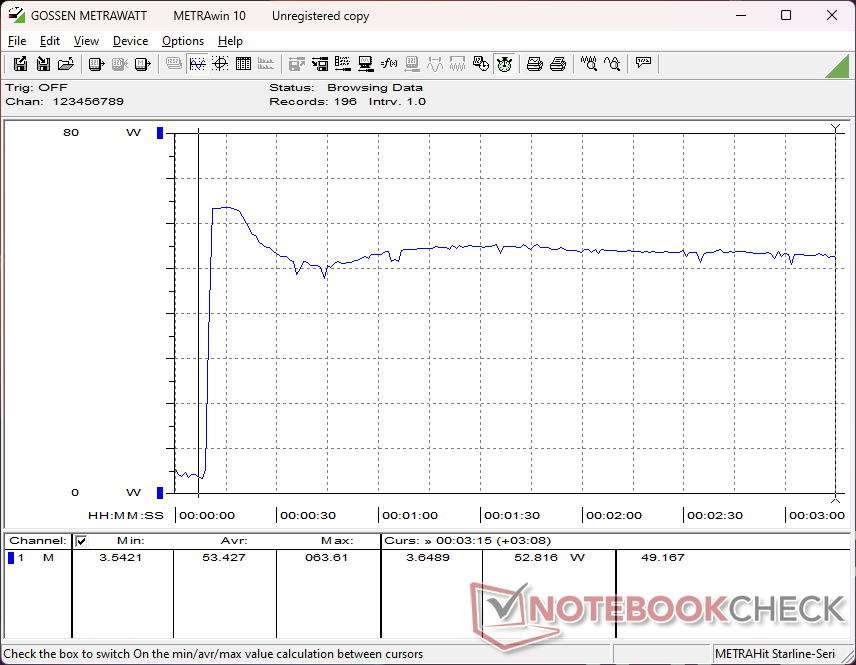
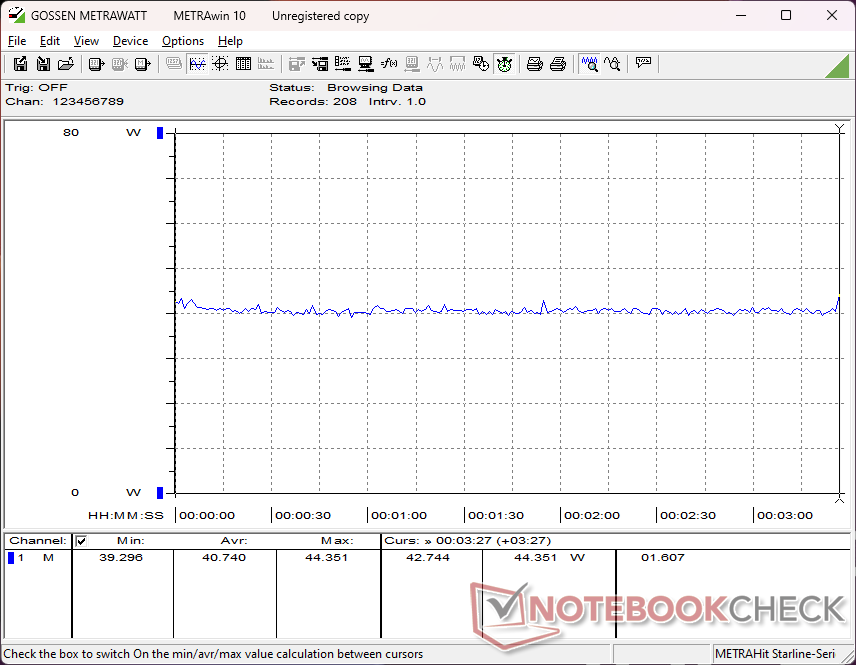
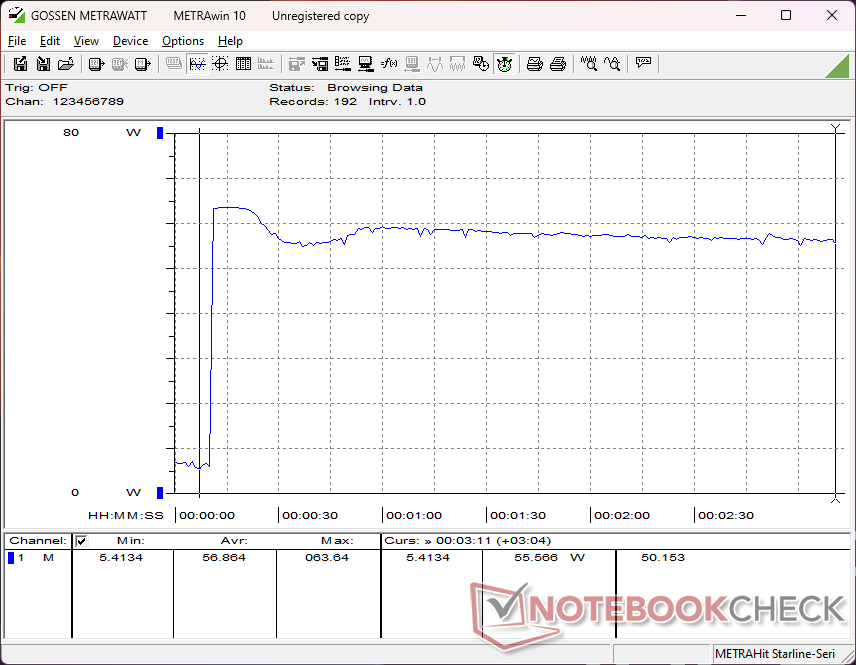
Le misurazioni del consumo energetico mostrano alcuni risultati interessanti rispetto al Core Ultra 7 XPS 13. Quando si eseguono carichi medi o bassi, il nostro Snapdragon XPS 13 richiede costantemente meno energia rispetto alla versione Intel, il che apre la strada a una maggiore durata della batteria, come illustrato nella sezione successiva. Quando si eseguono carichi più impegnativi, come i giochi, tuttavia, il consumo medio sarebbe circa lo stesso, con circa 40 W ciascuno, anche se il Core Ultra 7 offre generalmente prestazioni grafiche più veloci.
Il consumo durante l'esecuzione di Prime95 per stressare la CPU mostra che il modello Snapdragon richiede in media più energia rispetto al modello Intel, in quanto quest'ultimo subisce un throttling più marcato nel tempo. D'altra parte, il consumo quando si esegue FurMark per stressare la GPU è in media di soli 18 W rispetto ai 34 W o più del modello Intel. Questo suggerisce che Qualcomm potrebbe dedicare meno superficie o budget di silicio al suo design di GPU integrata rispetto alla serie Arc 8 della concorrenza, che è sia più potente che più esigente in media.
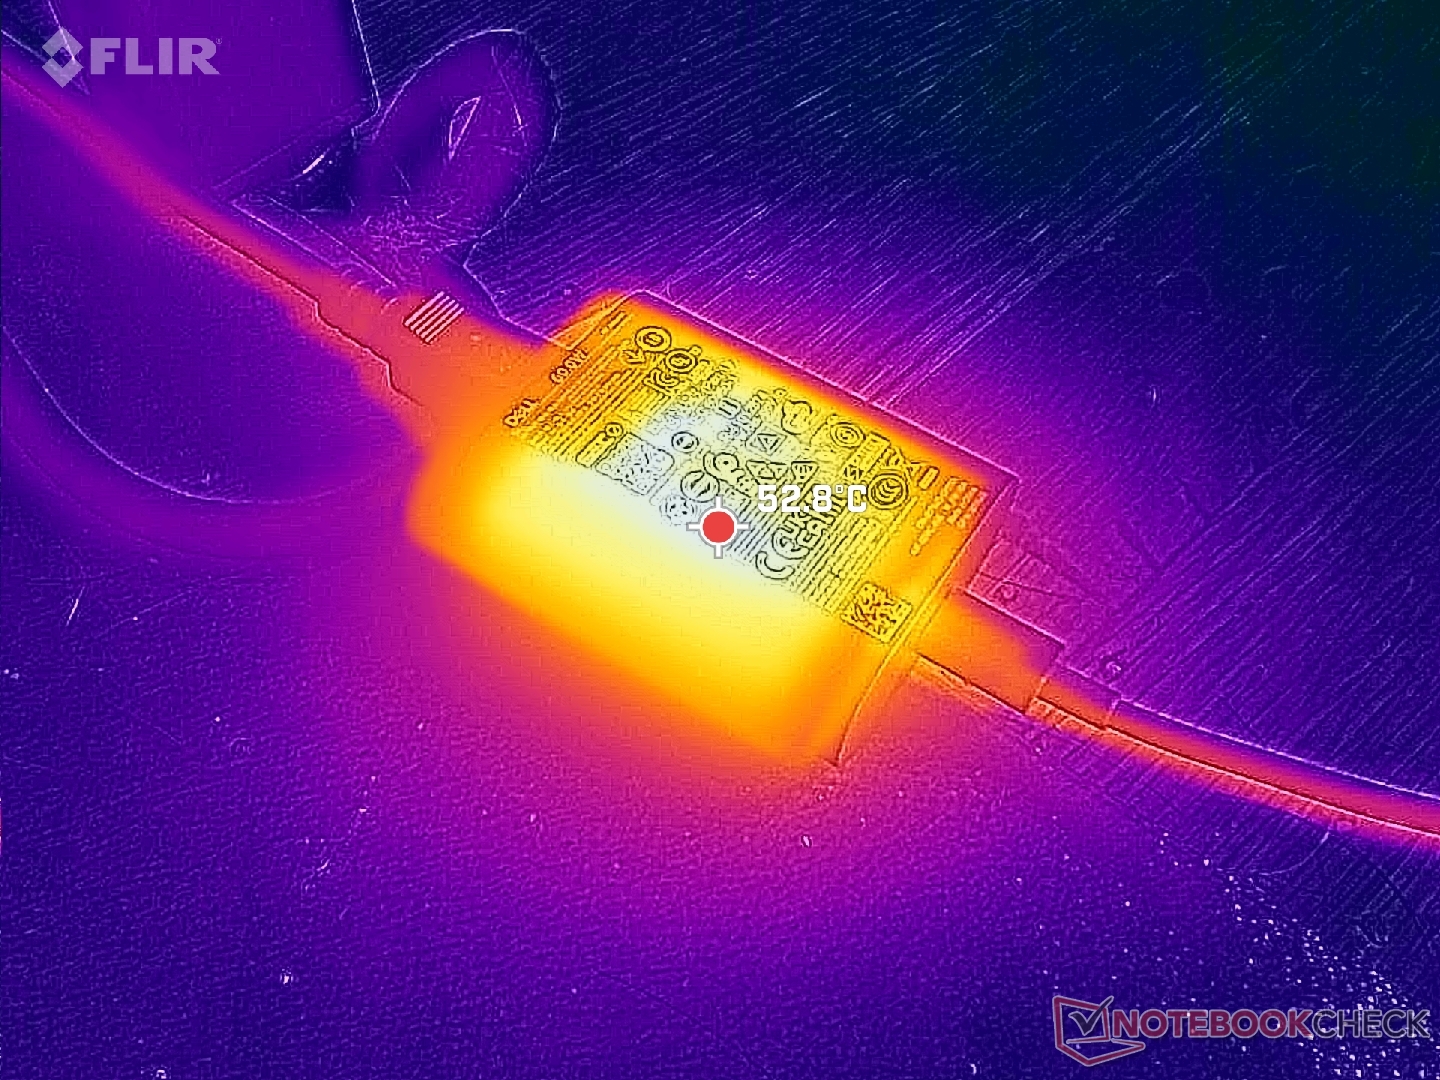
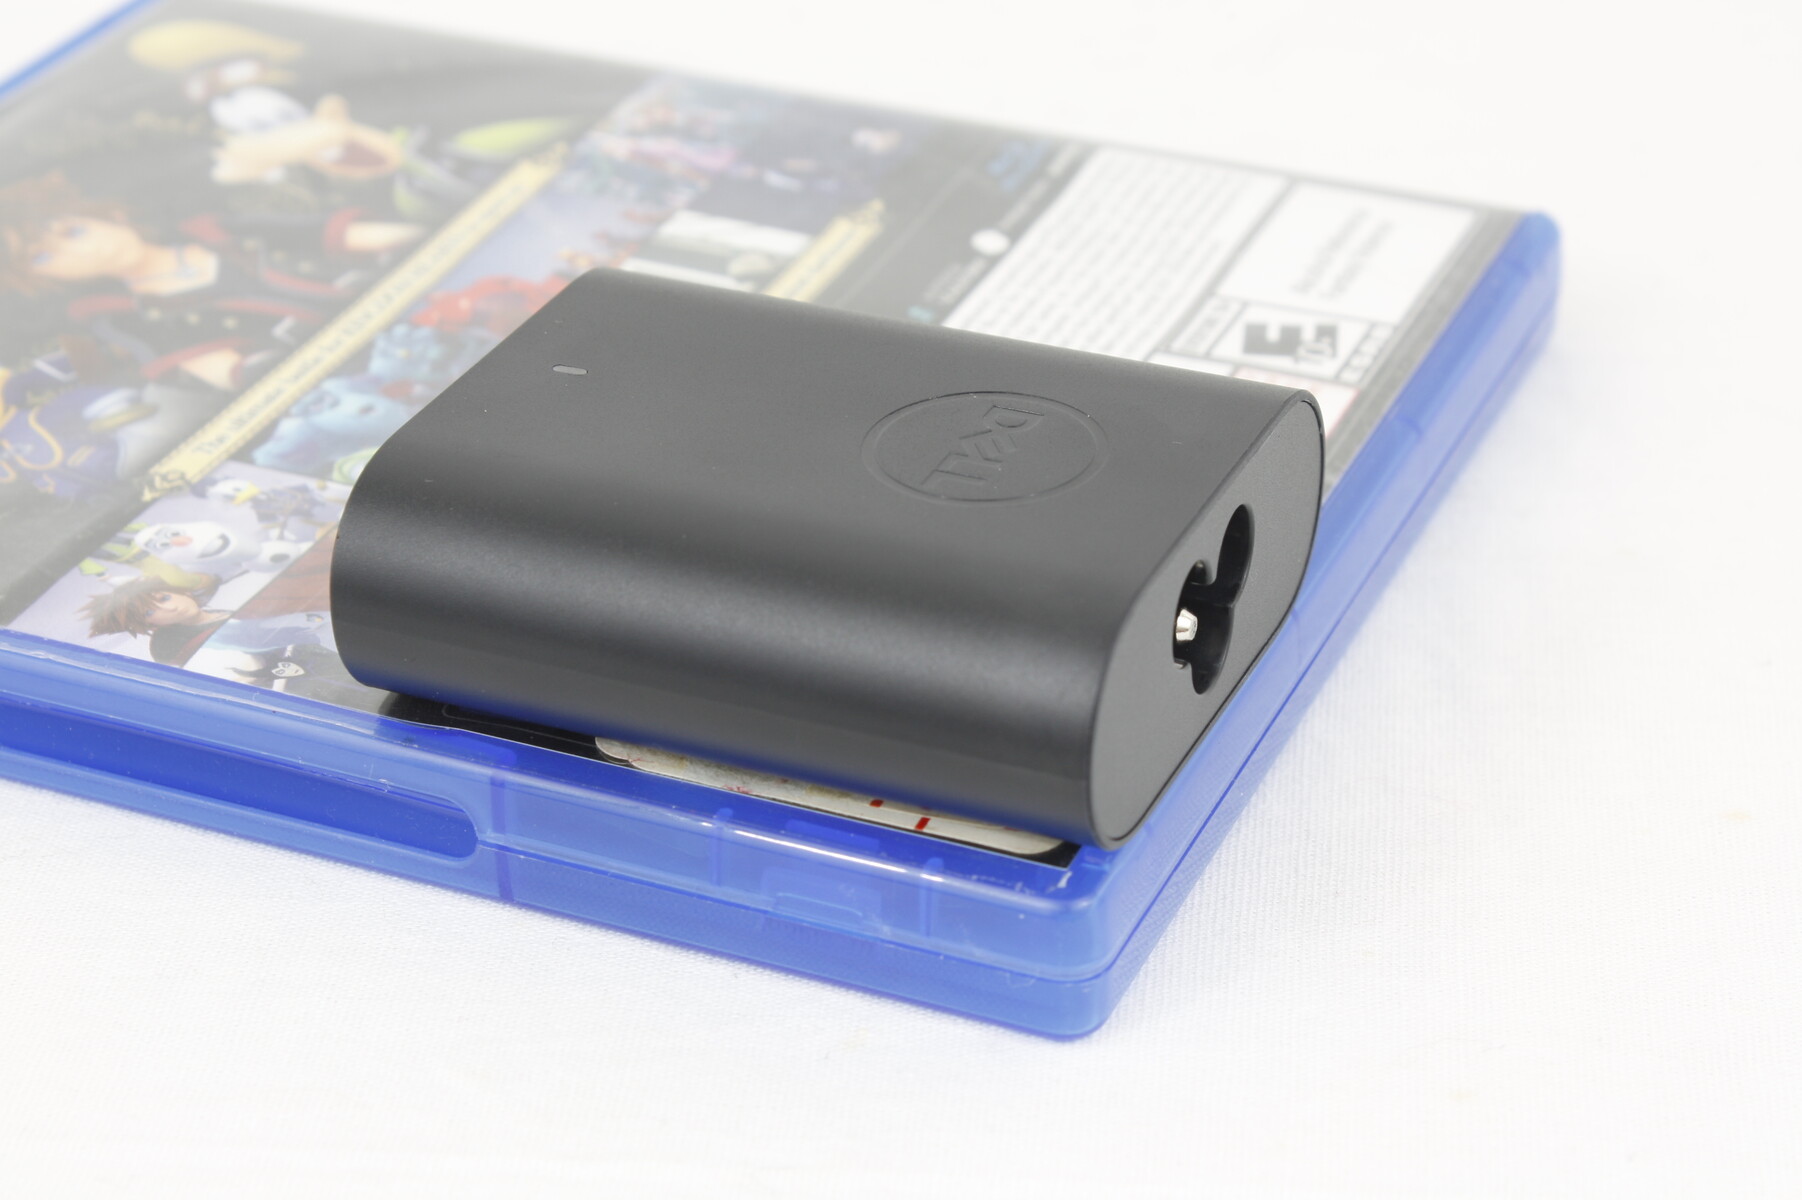
Il consumo massimo può raggiungere i 64 W dall'adattatore CA USB-C extra piccolo (~6,5 x 5,5 x 2,3 cm) da 65 W, proprio come nel modello Intel.
| Off / Standby | |
| Idle | |
| Sotto carico |
|
Leggenda:
min: | |
| Dell XPS 13 9345 SD X Elite X1E-80-100, Adreno X1-85 3.8 TFLOPS, , IPS, 1920x1200, 13.4" | Dell XPS 13 9340 Core Ultra 7 Ultra 7 155H, Arc 8-Core, Micron 2550 512GB, IPS, 1920x1200, 13.4" | Microsoft Surface Laptop 7 13.8 Copilot+ SD X Elite X1E-80-100, Adreno X1-85 3.8 TFLOPS, Samsung MZ9L4512HBLU-00BMV, IPS, 2304x1536, 13.8" | Lenovo ThinkBook 13x G4 21KR0008GE Ultra 5 125H, Arc 7-Core, Samsung PM9C1a MZAL8512HDLU, IPS, 2880x1920, 13.5" | HP EliteBook Ultra G1q 14 SD X Elite X1E-78-100, Adreno X1-85 3.8 TFLOPS, SK hynix PC801 HFS512GEJ9X101N BF, IPS, 2240x1400, 14" | Asus ZenBook S13 OLED UX5304 i7-1355U, Iris Xe G7 96EUs, Samsung PM9A1 MZVL21T0HCLR, OLED, 2880x1800, 13.3" | |
|---|---|---|---|---|---|---|
| Power Consumption | -27% | 11% | -48% | 11% | -43% | |
| Idle Minimum * (Watt) | 2.8 | 3.8 -36% | 1.4 50% | 5.4 -93% | 2.5 11% | 5.8 -107% |
| Idle Average * (Watt) | 4.9 | 7 -43% | 6.3 -29% | 7.8 -59% | 5.7 -16% | 8.5 -73% |
| Idle Maximum * (Watt) | 5.7 | 7.3 -28% | 7.6 -33% | 8.9 -56% | 5.8 -2% | 8.8 -54% |
| Load Average * (Watt) | 40.6 | 52.6 -30% | 26.9 34% | 49.4 -22% | 24.2 40% | 35.1 14% |
| Cyberpunk 2077 ultra external monitor * (Watt) | 39.4 | 26.8 32% | ||||
| Cyberpunk 2077 ultra * (Watt) | 40.7 | 38.5 5% | 33.5 18% | |||
| Load Maximum * (Watt) | 64 | 62.7 2% | 40.7 36% | 68.8 -8% | 66.4 -4% | 59.5 7% |
| Witcher 3 ultra * (Watt) | 38.3 | 44.4 | 23.1 | 27.6 |
* ... Meglio usare valori piccoli
Power Consumption Cyberpunk / Stress Test
Power Consumption external Monitor
Durata della batteria
Se c'è una cosa in cui il sistema eccelle inequivocabilmente, è la durata della batteria. Siamo riusciti a registrare un'autonomia di navigazione WLAN in condizioni reali di quasi 26,5 ore, ovvero oltre 2 volte più lunga rispetto all'XPS 13 9340 equipaggiato con il Core Ultra 7 155H e lo stesso display IPS da 1200p. I tempi di esecuzione sono garantiti più brevi se configurati con il pannello OLED, ma saranno comunque incredibilmente lunghi e tra i più lunghi di qualsiasi subnotebook da 13 pollici, compresa la serie MacBook Air Serie MacBook Air.
Il nostro test è stato eseguito dopo aver applicato l'ultimo aggiornamento del BIOS di Dell, progettato specificamente per migliorare la durata della batteria sul modello Snapdragon. Raccomandiamo di installare l'aggiornamento qui.
La ricarica da vuoto a piena capacità richiede poco più di 90 minuti, il che è comune alla maggior parte dei computer portatili.
| Dell XPS 13 9345 SD X Elite X1E-80-100, Adreno X1-85 3.8 TFLOPS, 55 Wh | Dell XPS 13 9340 Core Ultra 7 Ultra 7 155H, Arc 8-Core, 55 Wh | Microsoft Surface Laptop 7 13.8 Copilot+ SD X Elite X1E-80-100, Adreno X1-85 3.8 TFLOPS, 54 Wh | Lenovo ThinkBook 13x G4 21KR0008GE Ultra 5 125H, Arc 7-Core, 74 Wh | HP EliteBook Ultra G1q 14 SD X Elite X1E-78-100, Adreno X1-85 3.8 TFLOPS, 59 Wh | Asus ZenBook S13 OLED UX5304 i7-1355U, Iris Xe G7 96EUs, 63 Wh | |
|---|---|---|---|---|---|---|
| Autonomia della batteria | 34% | -8% | 17% | 1% | 42% | |
| Reader / Idle (h) | 46.4 | 20.4 -56% | ||||
| WiFi v1.3 (h) | 26.4 | 12.8 -52% | 14.2 -46% | 11.4 -57% | 13.2 -50% | 11.3 -57% |
| Load (h) | 1 | 2.2 120% | 1.3 30% | 1.9 90% | 2.1 110% | 2.4 140% |
| H.264 (h) | 17.6 | 19.7 | 20.5 | 13.8 |
Pro
Contro
Verdetto - Alternativa rispettabile all'Intel XPS 13
Lo Snapdragon XPS 13 da 1.300 dollari è leggermente più economico del Core Ultra 7 XPS 13 da 1.400 dollari Core Ultra 7 XPS 13 pur offrendo una durata della batteria significativamente maggiore, l'integrazione Co-Pilot+ e caratteristiche hardware identiche. L'esperienza effettiva dell'utente, tuttavia, dipenderà molto dal carico di lavoro e dall'applicazione. Se viene utilizzato principalmente per la navigazione, l'elaborazione di testi, i video e lo streaming, lo Snapdragon XPS 13 tende ad essere più efficiente, soprattutto quando i programmi possono essere eseguiti in modo nativo su ARM. D'altra parte, le attività più impegnative come l'editing grafico, la codifica video, il docking Thunderbolt o le applicazioni specifiche che devono essere emulate su ARM sarebbero più adatte al tradizionale XPS 13 Intel. A tal fine, il modello Intel offre un livello di prestazioni più prevedibile in tutti gli scenari d'uso, che probabilmente supera i pochi casi limite in cui il modello Snapdragon può risultare superiore.
Lo Snapdragon XPS 13 è un'ottima alternativa all'Intel XPS 13, dollaro per dollaro. L'esperienza dell'utente, tuttavia, varierà notevolmente a seconda del tipo di applicazioni e attività per cui intende utilizzare il sistema.
I vantaggi in termini di durata della batteria e di compatibilità con Co-Pilot+ potrebbero non essere sufficienti a convincere gli acquirenti, visto che la durata della batteria dell'Intel XPS 13 è già piuttosto buona e che Co-Pilot+ è previsto per le future CPU Intel e AMD. Tuttavia, gli utenti che desiderano massimizzare i tempi di esecuzione e sperimentare le più recenti funzioni AI di Microsoft oggi potrebbero trovare lo Snapdragon XPS 13 come l'opzione più produttiva.
Prezzo e disponibilità
Dell sta spedendo l'XPS 13 9345 in configurazione a $1300 fino a $1800+ se configurato con il pannello OLED.
Informazioni: Abbiamo aggiornato il nostro sistema di valutazione e i risultati della versione 8 non sono confrontabili con i risultati della versione 7. Altre informazioni sono gerarchicamente verfügbar.
Nota: abbiamo recentemente aggiornato il nostro sistema di valutazione e i risultati della versione 8 non sono confrontabili con quelli della versione 7. Ulteriori informazioni sono disponibili qui .
Dell XPS 13 9345
- 08/04/2024 v8
Allen Ngo
 Total Sustainability Score:
 Transparency
La selezione dei dispositivi da recensire viene effettuata dalla nostra redazione. Il campione di prova è stato fornito all'autore come prestito dal produttore o dal rivenditore ai fini di questa recensione. L'istituto di credito non ha avuto alcuna influenza su questa recensione, né il produttore ne ha ricevuto una copia prima della pubblicazione. Non vi era alcun obbligo di pubblicare questa recensione. In quanto società mediatica indipendente, Notebookcheck non è soggetta all'autorità di produttori, rivenditori o editori.
Ecco come Notebookcheck esegue i test
Ogni anno, Notebookcheck esamina in modo indipendente centinaia di laptop e smartphone utilizzando procedure standardizzate per garantire che tutti i risultati siano comparabili. Da circa 20 anni sviluppiamo continuamente i nostri metodi di prova e nel frattempo stabiliamo gli standard di settore. Nei nostri laboratori di prova, tecnici ed editori esperti utilizzano apparecchiature di misurazione di alta qualità. Questi test comportano un processo di validazione in più fasi. Il nostro complesso sistema di valutazione si basa su centinaia di misurazioni e parametri di riferimento ben fondati, che mantengono l'obiettività.Price comparison

