Recensione del portatile Lenovo ThinkBook 13x G4: Uno dei migliori subnotebook a parte la tastiera

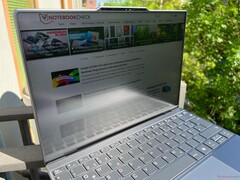
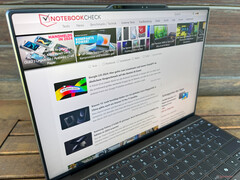
I modelli della serie ThinkBook si rivolgono principalmente ai clienti aziendali che non vogliono spendere i prezzi elevati dei ThinkPad per i loro dipendenti. Il nuovo ThinkBook 13x G4 è un subnotebook compatto che potrebbe interessare anche gli acquirenti individuali, in quanto offre prestazioni decenti, una batteria capiente, un display IPS 3:2 ad alta risoluzione con superficie opaca e uno chassis in alluminio per circa 1.100 dollari
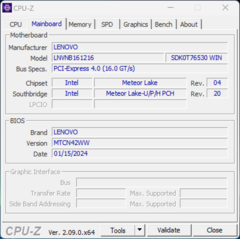
Il nostro modello di prova del ThinkBook 13x G4 reca il numero di modello 21KR0008GE ed è dotato di Core Ultra 5 125H16 GB di RAM, 512 GB di archiviazione SSD e un display 2.8K (2880 x 1920) per 1.106 dollari.
Potenziali concorrenti a confrontos
Punteggio | Data | Modello | Peso | Altezza | Dimensione | Risoluzione | Prezzo |
|---|---|---|---|---|---|---|---|
| 90.1 % v7 (old) | 05/2024 | Lenovo ThinkBook 13x G4 21KR0008GE Ultra 5 125H, Arc 7-Core | 1.2 kg | 12.9 mm | 13.50" | 2880x1920 | |
| 86.5 % v7 (old) | 05/2024 | Dell XPS 13 9340 Core Ultra 7 Ultra 7 155H, Arc 8-Core | 1.2 kg | 15.3 mm | 13.40" | 1920x1200 | |
| 92.4 % v7 (old) | 03/2024 | Apple MacBook Air 13 M3 10C GPU M3, M3 10-Core GPU | 1.2 kg | 11.3 mm | 13.60" | 2560x1664 | |
| 86.6 % v7 (old) | 03/2024 | MSI Prestige 13 AI Evo Ultra 7 155H, Arc 8-Core | 967 gr | 16.9 mm | 13.30" | 2880x1800 | |
| 89.5 % v7 (old) | 01/2024 | Lenovo ThinkPad Z13 Gen 2 R7 PRO 7840U, Radeon 780M | 1.2 kg | 13.99 mm | 13.30" | 2880x1800 | |
| 91.9 % v7 (old) | 07/2023 | HP Dragonfly G4 i7-1365U, Iris Xe G7 96EUs | 1.1 kg | 16.3 mm | 13.50" | 1920x1280 |
I nostri Top 10
» Top 10 Portatili Multimedia
» Top 10 Portatili Gaming
» Top 10 Portatili Gaming Leggeri
» Top 10 Portatili da Ufficio e Business economici
» Top 10 Portatili Premium da Ufficio/Business
» Top 10 Portatili sotto i 300 Euro
» Top 10 Portatili sotto i 500 Euro
» Top 10 dei Portatili Workstation
» Top 10 Subnotebooks
» Top 10 Ultrabooks
» Top 10 Convertibili
» Top 10 Tablets
» Top 10 Tablets Windows
» Top 10 Smartphones
Case - ThinkBook con telaio in alluminio
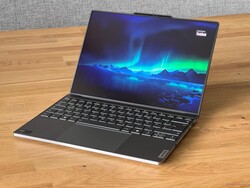
Fondamentalmente, il design del ThinkBook 13x G4 non differisce dai suoi fratelli più economici, in quanto il case grigio-argento ha un coperchio bicolore con scritte grandi e sembra molto semplice a prima vista. Mentre i modelli più economici, come il ThinkBook 16 G6, di solito hanno solo un coperchio dello schermo in alluminio e il resto del case è in plastica, il ThinkBook 13x G4 utilizza l'alluminio anche per l'unità base. I lati dell'unità base sono lucidi e il dispositivo ha un aspetto complessivo di alta qualità. L'unità base non è affusolata ai lati, il che fa apparire il dispositivo un po' più ingombrante di quanto non sia in realtà.
Come per tutti gli altri modelli, Lenovo utilizza una gobba per la fotocamera, che in questo caso appare molto grande. Non ha un aspetto gradevole, ma almeno aiuta ad aprire il coperchio. Due cose si notano quando si apre il coperchio: i bordi dello schermo molto stretti e l'angolo di apertura notevolmente limitato, pari a un massimo di 135 gradi rispetto ai ThinkPad. Tuttavia, le cerniere stesse sono ben regolate e mantengono il coperchio saldamente in posizione, a parte una minima oscillazione durante la regolazione dell'angolo. Nonostante il design sottile, il coperchio è molto stabile e non abbiamo riscontrato errori o distorsioni dell'immagine. La stabilità dell'unità base è eccellente e solo l'area centrale della tastiera cede leggermente sotto pressione. Non sono stati rilevati scricchiolii. Anche la lavorazione non dà adito a critiche.
Come descritto in precedenza, il ThinkBook 13x G4 sembra un po' più spesso a causa del suo design, ma le apparenze ingannano e con un'altezza di soli 12,9 mm, è uno dei dispositivi più sottili del nostro gruppo di confronto, scalzato solo dal MacBook Air M3 MacBook Air M3. D'altra parte, il portatile Lenovo occupa meno spazio sulla scrivania rispetto all'Air M3 ed è anche uno dei modelli più compatti in assoluto, quindi può essere facilmente riposto in qualsiasi borsa. Tuttavia, con i suoi 1,2 kg, è anche uno dei dispositivi più pesanti e l'alimentatore plug-in da 65 watt aggiunge altri 191 grammi. La scheda tecnica ufficiale menziona anche un modello in magnesio con un peso di circa 1 kg, ma non siamo riusciti a trovare una configurazione corrispondente.
Equipaggiamento - 3x Thunderbolt 4
Lenovo equipaggia il ThinkBook 13x G4 con tre porte USB-C veloci, tra cui la Thunderbolt 4. Il posizionamento sembra un po' insolito all'inizio, ma si rivela piuttosto pratico nella pratica. Una delle porte si trova sulla parte anteriore destra, dove è possibile collegare facilmente le chiavette USB, e il dispositivo può essere caricato su entrambi i lati. Tuttavia, per i dispositivi USB-A sono necessari degli adattatori e non c'è nemmeno un lettore di schede. Esistono modelli opzionali con connessione Magic Bay di Lenovo, nel qual caso la gobba della fotocamera è più spessa e dotata di pogo pin. Gli accessori opzionali, come una webcam 4K, possono essere collegati qui.
Comunicazione
Nel ThinkBook 13x G4 non è ancora installato un modulo WiFi 7, ma è presente il noto modulo AX211 di Intel. Questo supporta il WiFi 6E e il Bluetooth 5.3. Nei test con il nostro router di riferimento Asus, le velocità di trasferimento sono state molto elevate e stabili. Inoltre, non abbiamo avuto problemi di stabilità del segnale.
| Networking | |
| Lenovo ThinkBook 13x G4 21KR0008GE | |
| iperf3 transmit AXE11000 | |
| iperf3 receive AXE11000 | |
| Dell XPS 13 9340 Core Ultra 7 | |
| iperf3 transmit AXE11000 | |
| iperf3 receive AXE11000 | |
| Apple MacBook Air 13 M3 10C GPU | |
| iperf3 transmit AXE11000 | |
| iperf3 receive AXE11000 | |
| MSI Prestige 13 AI Evo | |
| iperf3 transmit AXE11000 | |
| iperf3 receive AXE11000 | |
| Lenovo ThinkPad Z13 Gen 2 | |
| iperf3 transmit AXE11000 | |
| iperf3 receive AXE11000 | |
| iperf3 transmit AXE11000 6GHz | |
| iperf3 receive AXE11000 6GHz | |
| HP Dragonfly G4 | |
| iperf3 transmit AXE11000 | |
| iperf3 receive AXE11000 | |
| iperf3 transmit AXE11000 6GHz | |
| iperf3 receive AXE11000 6GHz | |
Webcam
La webcam a 1080p nella cornice superiore del display fa il suo lavoro, ma non deve aspettarsi miracoli. È presente anche un sensore IR per il riconoscimento facciale tramite Windows Hello.

Manutenzione
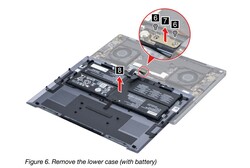
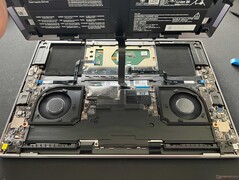
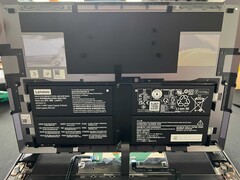
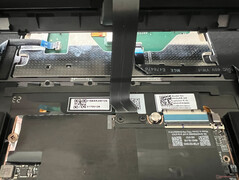
Siamo rimasti sorpresi quando abbiamo aperto il case: sebbene la piastra di base possa essere facilmente rimossa, le opzioni per la manutenzione sono massicciamente limitate. La batteria è fissata al coperchio della base e collegata alla scheda madre con un cavo a nastro, anch'esso avvitato. Anche questo è descritto nel manuale di manutenzione, ma la procedura potrebbe risultare complicata per gli utenti inesperti.
Dispositivi di input - Touchpad aptico, ma tastiera debole
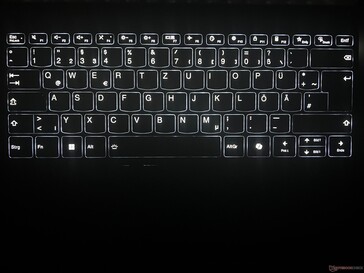
La tastiera è uno dei punti deboli del ThinkBook 13x G4, in quanto la corsa dei tasti è molto breve e l'esperienza di digitazione non è molto confortevole. I tasti sono precisi e non troppo rumorosi, ma se digita molto ed è abituato a una tastiera con una maggiore corsa dei tasti, dovrebbe testare l'input prima dell'acquisto, se possibile. Il layout è semplice e ora c'è anche un tasto copilota, anche se i tasti freccia verticali sono piuttosto piccoli. È disponibile una retroilluminazione bianca a due livelli, che può anche essere attivata automaticamente tramite un sensore.
Per il controllo del puntatore è disponibile un touchpad aptico, che fornisce un feedback tramite motori a vibrazione. Funziona molto bene, ma il rumore del clic potrebbe essere un po' più silenzioso. Il vantaggio di questa soluzione è che può cliccare in qualsiasi punto del pad e ottenere lo stesso feedback. Le proprietà di scorrimento della superficie di vetro sono eccellenti. Con una dimensione di 12 x 7,5 cm, c'è spazio sufficiente per i movimenti/gesture.
Display - 2,8K IPS con 120 Hz
Lenovo rinuncia ad uno schermo OLED sul ThinkBook 13x G4 e installa invece un pannello IPS ad alta risoluzione in formato 3:2. Grazie alla risoluzione di 2880 x 1920, tutti i contenuti sono molto nitidi e i colori vividi, anche se non al livello degli OLED. Nel complesso, la qualità dell'immagine soggettiva è molto buona, in quanto le aree luminose non appaiono sgranate e i movimenti beneficiano della maggiore frequenza. Anche l'assenza di sfarfallio PWM è un vantaggio importante e anche i tempi di risposta sono poco evidenti. Sia la luminosità che la temperatura del colore vengono regolate automaticamente tramite un sensore.
La luminosità media è di 513 cd/m² e il livello del nero è leggermente più alto, con 0,38 cd/m², ma questo si traduce comunque in un ottimo rapporto di contrasto. Gli aloni non sono un problema grave e il pannello supporta anche i contenuti HDR, ma la luminosità massima è comunque di 540 cd/m².
| |||||||||||||||||||||||||
Distribuzione della luminosità: 89 %
Al centro con la batteria: 539 cd/m²
Contrasto: 1418:1 (Nero: 0.38 cd/m²)
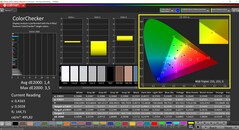
ΔE Color 1.4 | 0.5-29.43 Ø4.87, calibrated: 0.7
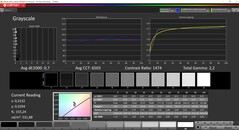
ΔE Greyscale 2.2 | 0.5-98 Ø5.1
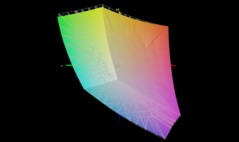
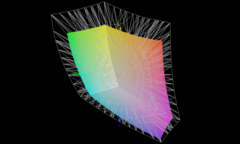
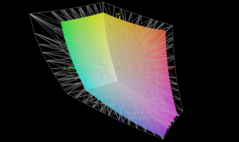
67.7% AdobeRGB 1998 (Argyll 2.2.0 3D)
97.3% sRGB (Argyll 2.2.0 3D)
65.5% Display P3 (Argyll 2.2.0 3D)
Gamma: 2.19
| Lenovo ThinkBook 13x G4 21KR0008GE LEN135WQ+, IPS, 2880x1920, 13.5" | Dell XPS 13 9340 Core Ultra 7 SHP1593, IPS, 1920x1200, 13.4" | Apple MacBook Air 13 M3 10C GPU IPS, 2560x1664, 13.6" | MSI Prestige 13 AI Evo ATNA33AA07-0, OLED, 2880x1800, 13.3" | Lenovo ThinkPad Z13 Gen 2 ATNA33AA02-0, OLED, 2880x1800, 13.3" | HP Dragonfly G4 Chi Mei CMN13C0, IPS, 1920x1280, 13.5" | |
|---|---|---|---|---|---|---|
| Display | 4% | 28% | 33% | 33% | 3% | |
| Display P3 Coverage | 65.5 | 69.4 6% | 98.4 50% | 99.9 53% | 99.7 52% | 68.4 4% |
| sRGB Coverage | 97.3 | 97.8 1% | 99.9 3% | 100 3% | 100 3% | 98.3 1% |
| AdobeRGB 1998 Coverage | 67.7 | 71.7 6% | 87.9 30% | 97.8 44% | 97.3 44% | 70.4 4% |
| Response Times | -87% | -70% | 92% | 88% | -112% | |
| Response Time Grey 50% / Grey 80% * | 27.3 ? | 43.2 ? -58% | 34.5 ? -26% | 1.54 ? 94% | 2.1 ? 92% | 48.8 ? -79% |
| Response Time Black / White * | 12.8 ? | 27.6 ? -116% | 27.2 ? -113% | 1.44 ? 89% | 2.2 ? 83% | 31.3 ? -145% |
| PWM Frequency | 240 ? | 60.1 ? | ||||
| Screen | -40% | 1% | -11% | 7% | -9% | |
| Brightness middle | 539 | 429 -20% | 525 -3% | 404 -25% | 372 -31% | 408.8 -24% |
| Brightness | 513 | 407 -21% | 506 -1% | 407 -21% | 375 -27% | 399 -22% |
| Brightness Distribution | 89 | 90 1% | 92 3% | 98 10% | 99 11% | 90 1% |
| Black Level * | 0.38 | 0.28 26% | 0.42 -11% | 0.32 16% | ||
| Contrast | 1418 | 1532 8% | 1250 -12% | 1278 -10% | ||
| Colorchecker dE 2000 * | 1.4 | 2.6 -86% | 1.4 -0% | 2.1 -50% | 0.88 37% | 2.02 -44% |
| Colorchecker dE 2000 max. * | 3.5 | 6.6 -89% | 2.8 20% | 4.3 -23% | 3.22 8% | 3.84 -10% |
| Colorchecker dE 2000 calibrated * | 0.7 | 1.4 -100% | 0.61 13% | |||
| Greyscale dE 2000 * | 2.2 | 4 -82% | 2 9% | 1.2 45% | 1.2 45% | 2.3 -5% |
| Gamma | 2.19 100% | 2.23 99% | 2.2 100% | 2.16 102% | 2.18 101% | 2.2 100% |
| CCT | 6710 97% | 7332 89% | 6876 95% | 6465 101% | 6326 103% | 6203 105% |
| Media totale (Programma / Settaggio) | -41% /
-37% | -14% /
-4% | 38% /
20% | 43% /
29% | -39% /
-21% |
* ... Meglio usare valori piccoli
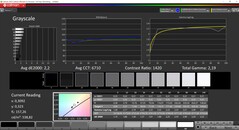
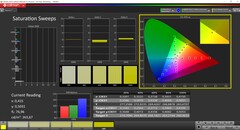
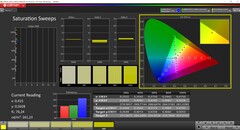
Il display è già ben regolato ex-novo e la nostra analisi con il software professionale CalMAN (X-Rite i1 Pro 2) mostra solo una minima tonalità di blu, che non si nota nella pratica. Tutti i colori sono già al di sotto dell'importante soglia DeltaE-2000 di 3 rispetto allo spazio colore di riferimento sRGB, quindi la calibrazione non è assolutamente necessaria. Siamo stati in grado di migliorare leggermente il display con la nostra calibrazione (il profilo corrispondente è disponibile per il download gratuito qui sopra) e di eliminare anche il cast di colore minimo. Lo spazio di colore sRGB è quasi completamente coperto, quindi il ThinkBook è adatto per l'editing di video e immagini.
Tempi di risposta del Display
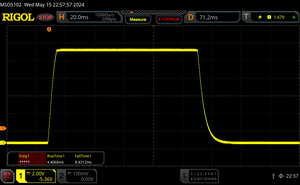
| ↔ Tempi di risposta dal Nero al Bianco | ||
|---|---|---|
| 12.8 ms ... aumenta ↗ e diminuisce ↘ combinato | ↗ 4.4 ms Incremento | |
| ↘ 8.4 ms Calo | ||
| Lo schermo mostra buoni tempi di risposta durante i nostri tests, ma potrebbe essere troppo lento per i gamers competitivi. In confronto, tutti i dispositivi di test variano da 0.1 (minimo) a 240 (massimo) ms. » 30 % di tutti i dispositivi è migliore. Questo significa che i tempi di risposta rilevati sono migliori rispettto alla media di tutti i dispositivi testati (20.8 ms). | ||
| ↔ Tempo di risposta dal 50% Grigio all'80% Grigio | ||
| 27.3 ms ... aumenta ↗ e diminuisce ↘ combinato | ↗ 12.8 ms Incremento | |
| ↘ 14.5 ms Calo | ||
| Lo schermo mostra tempi di risposta relativamente lenti nei nostri tests e potrebbe essere troppo lento per i gamers. In confronto, tutti i dispositivi di test variano da 0.165 (minimo) a 636 (massimo) ms. » 34 % di tutti i dispositivi è migliore. Questo significa che i tempi di risposta rilevati sono migliori rispettto alla media di tutti i dispositivi testati (32.5 ms). | ||
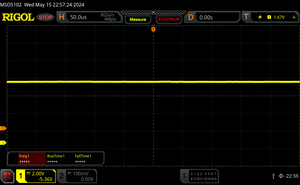
Sfarfallio dello schermo / PWM (Pulse-Width Modulation)
| flickering dello schermo / PWM non rilevato | |||
In confronto: 53 % di tutti i dispositivi testati non utilizza PWM per ridurre la luminosita' del display. Se è rilevato PWM, una media di 8516 (minimo: 5 - massimo: 343500) Hz è stata rilevata. | |||
Prestazioni - Core Ultra e fino a 32 GB di RAM
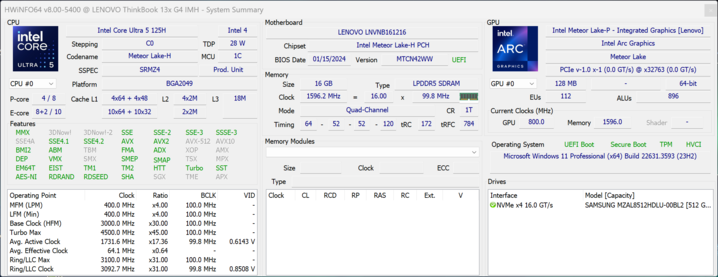
È interessante notare che Lenovo offre solo il ThinkBook 13x G4 con il Core Ultra 5 125H o con il Core Ultra 9 185Hma il popolare Core Ultra 7 155H non è disponibile. Deve inoltre scegliere il Core Ultra 9 per passare da 16 a 32 GB di RAM, entrambi con un moderato sovrapprezzo.
Condizioni di test
Come di consueto, Lenovo offre diverse modalità di alimentazione e, a differenza dei modelli ThinkPad, queste non sono direttamente collegate alle impostazioni di alimentazione di Windows. I profili possono essere cambiati tramite il software Vantage preinstallato o la combinazione di tasti Fn+Q. Abbiamo elencato i valori TDP corrispondenti nella tabella sottostante. Per i nostri test, abbiamo utilizzato il profilo Auto, che è attivo per impostazione predefinita.
| Modalità di alimentazione | TDP | CB R23 Multi | Time Spy Grafica | volume massimo della ventola |
|---|---|---|---|---|
| Risparmio batteria | 44 -> 18 watt | 5.536 punti | 2.471 punti | 33,9 dB(A) |
| Auto | 51 -> 28 watt | 9.194 punti | 3.248 punti | 40,7 dB(A) -> 36,8 dB(A) |
| Performance | 51 -> 35 watt | 12.188 punti | 3.382 punti | 42,5 dB(A) |
In modalità prestazioni, il processore funziona molto più a lungo con 51 watt, mentre in modalità automatica si tratta solo di pochi secondi. Se ha bisogno delle massime prestazioni della CPU, questa modalità è utile. Per le attività meno impegnative della vita quotidiana, può utilizzare senza esitazione la modalità risparmio batteria e beneficiare di ventole più silenziose.
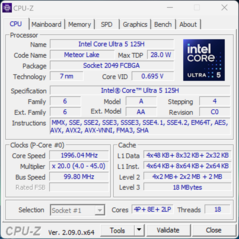
Processore - Core Ultra 5 125H
Il Core Ultra 5 125H nel nostro dispositivo di prova appartiene all'attuale generazione Meteor Lake di Intel e offre due core di prestazioni in meno rispetto al diffusissimo Core Ultra 7 155H. I quattro core P esistenti raggiungono anche una frequenza di clock massima inferiore, fino a 4,5 GHz. Nel ThinkBook, il processore consuma fino a 51 watt per alcuni secondi, prima di stabilizzarsi a 28 watt, come si può vedere chiaramente nel nostro ciclo Cinebench. Questo livello di prestazioni è perfettamente sufficiente per le attività di tutti i giorni, ma i risultati non sono davvero buoni e il Core Ultra 5 non ha alcuna chance contro un processore Zen4 di AMD. Apple il processore raffreddato passivamente M3 offre anche prestazioni migliori, sia nei test single che in quelli multi-core. In modalità batteria, il processore può consumare fino a 51 watt, ma poi scende rapidamente a 25 watt, motivo per cui le prestazioni sono leggermente inferiori rispetto al funzionamento a rete (-4%). Ulteriori benchmark della CPU sono disponibili nella nostra sezione tecnica.
Cinebench R15 Multi Sustained Load
Cinebench R23: Multi Core | Single Core
Cinebench R20: CPU (Multi Core) | CPU (Single Core)
Cinebench R15: CPU Multi 64Bit | CPU Single 64Bit
Blender: v2.79 BMW27 CPU
7-Zip 18.03: 7z b 4 | 7z b 4 -mmt1
Geekbench 6.4: Multi-Core | Single-Core
Geekbench 5.5: Multi-Core | Single-Core
HWBOT x265 Benchmark v2.2: 4k Preset
LibreOffice : 20 Documents To PDF
R Benchmark 2.5: Overall mean
| CPU Performance Rating | |
| Lenovo ThinkPad Z13 Gen 2 | |
| Apple MacBook Air 13 M3 10C GPU -9! | |
| Dell XPS 13 9340 Core Ultra 7 | |
| Media della classe Subnotebook | |
| MSI Prestige 13 AI Evo | |
| Media Intel Core Ultra 5 125H | |
| Lenovo ThinkBook 13x G4 21KR0008GE -1! | |
| HP Dragonfly G4 -2! | |
| Cinebench R23 / Multi Core | |
| Lenovo ThinkPad Z13 Gen 2 | |
| Dell XPS 13 9340 Core Ultra 7 | |
| Media Intel Core Ultra 5 125H (9194 - 14564, n=6) | |
| Media della classe Subnotebook (1555 - 21812, n=75, ultimi 2 anni) | |
| Apple MacBook Air 13 M3 10C GPU | |
| MSI Prestige 13 AI Evo | |
| Lenovo ThinkBook 13x G4 21KR0008GE | |
| HP Dragonfly G4 | |
| Cinebench R23 / Single Core | |
| Apple MacBook Air 13 M3 10C GPU | |
| HP Dragonfly G4 | |
| Lenovo ThinkPad Z13 Gen 2 | |
| Dell XPS 13 9340 Core Ultra 7 | |
| Media della classe Subnotebook (358 - 2165, n=75, ultimi 2 anni) | |
| MSI Prestige 13 AI Evo | |
| Media Intel Core Ultra 5 125H (1549 - 1735, n=6) | |
| Lenovo ThinkBook 13x G4 21KR0008GE | |
| Cinebench R20 / CPU (Multi Core) | |
| Lenovo ThinkPad Z13 Gen 2 | |
| Dell XPS 13 9340 Core Ultra 7 | |
| Media Intel Core Ultra 5 125H (3673 - 5618, n=6) | |
| Media della classe Subnotebook (579 - 8541, n=70, ultimi 2 anni) | |
| MSI Prestige 13 AI Evo | |
| Lenovo ThinkBook 13x G4 21KR0008GE | |
| HP Dragonfly G4 | |
| Cinebench R20 / CPU (Single Core) | |
| HP Dragonfly G4 | |
| Lenovo ThinkPad Z13 Gen 2 | |
| Dell XPS 13 9340 Core Ultra 7 | |
| Lenovo ThinkBook 13x G4 21KR0008GE | |
| Media Intel Core Ultra 5 125H (622 - 664, n=6) | |
| Media della classe Subnotebook (128 - 826, n=70, ultimi 2 anni) | |
| MSI Prestige 13 AI Evo | |
| Cinebench R15 / CPU Multi 64Bit | |
| Dell XPS 13 9340 Core Ultra 7 | |
| Lenovo ThinkPad Z13 Gen 2 | |
| MSI Prestige 13 AI Evo | |
| Media Intel Core Ultra 5 125H (1700 - 2245, n=6) | |
| Media della classe Subnotebook (327 - 3345, n=75, ultimi 2 anni) | |
| Lenovo ThinkBook 13x G4 21KR0008GE | |
| HP Dragonfly G4 | |
| Cinebench R15 / CPU Single 64Bit | |
| Lenovo ThinkPad Z13 Gen 2 | |
| HP Dragonfly G4 | |
| Dell XPS 13 9340 Core Ultra 7 | |
| Media della classe Subnotebook (72.4 - 322, n=71, ultimi 2 anni) | |
| Lenovo ThinkBook 13x G4 21KR0008GE | |
| Media Intel Core Ultra 5 125H (235 - 251, n=6) | |
| MSI Prestige 13 AI Evo | |
| Blender / v2.79 BMW27 CPU | |
| Apple MacBook Air 13 M3 10C GPU | |
| HP Dragonfly G4 | |
| Media della classe Subnotebook (159 - 2271, n=74, ultimi 2 anni) | |
| Lenovo ThinkBook 13x G4 21KR0008GE | |
| MSI Prestige 13 AI Evo | |
| Media Intel Core Ultra 5 125H (228 - 364, n=6) | |
| Dell XPS 13 9340 Core Ultra 7 | |
| Lenovo ThinkPad Z13 Gen 2 | |
| 7-Zip 18.03 / 7z b 4 | |
| Lenovo ThinkPad Z13 Gen 2 | |
| Dell XPS 13 9340 Core Ultra 7 | |
| Media della classe Subnotebook (11668 - 77867, n=66, ultimi 2 anni) | |
| MSI Prestige 13 AI Evo | |
| HP Dragonfly G4 | |
| Media Intel Core Ultra 5 125H (0 - 0, n=2) | |
| 7-Zip 18.03 / 7z b 4 -mmt1 | |
| HP Dragonfly G4 | |
| Lenovo ThinkPad Z13 Gen 2 | |
| Media della classe Subnotebook (2643 - 6442, n=68, ultimi 2 anni) | |
| MSI Prestige 13 AI Evo | |
| Dell XPS 13 9340 Core Ultra 7 | |
| Lenovo ThinkBook 13x G4 21KR0008GE | |
| Media Intel Core Ultra 5 125H (4663 - 5136, n=6) | |
| Geekbench 6.4 / Multi-Core | |
| Lenovo ThinkPad Z13 Gen 2 | |
| Apple MacBook Air 13 M3 10C GPU | |
| Dell XPS 13 9340 Core Ultra 7 | |
| Media della classe Subnotebook (2244 - 17489, n=72, ultimi 2 anni) | |
| Media Intel Core Ultra 5 125H (11087 - 11749, n=6) | |
| Lenovo ThinkBook 13x G4 21KR0008GE | |
| MSI Prestige 13 AI Evo | |
| Geekbench 6.4 / Single-Core | |
| Apple MacBook Air 13 M3 10C GPU | |
| Media della classe Subnotebook (960 - 3655, n=67, ultimi 2 anni) | |
| Lenovo ThinkPad Z13 Gen 2 | |
| MSI Prestige 13 AI Evo | |
| Dell XPS 13 9340 Core Ultra 7 | |
| Lenovo ThinkBook 13x G4 21KR0008GE | |
| Media Intel Core Ultra 5 125H (2199 - 2316, n=6) | |
| Geekbench 5.5 / Multi-Core | |
| Dell XPS 13 9340 Core Ultra 7 | |
| Lenovo ThinkPad Z13 Gen 2 | |
| Apple MacBook Air 13 M3 10C GPU | |
| Media Intel Core Ultra 5 125H (9696 - 10856, n=6) | |
| Lenovo ThinkBook 13x G4 21KR0008GE | |
| Media della classe Subnotebook (2557 - 17218, n=67, ultimi 2 anni) | |
| MSI Prestige 13 AI Evo | |
| HP Dragonfly G4 | |
| Geekbench 5.5 / Single-Core | |
| Apple MacBook Air 13 M3 10C GPU | |
| HP Dragonfly G4 | |
| Lenovo ThinkPad Z13 Gen 2 | |
| Media della classe Subnotebook (726 - 2350, n=67, ultimi 2 anni) | |
| Dell XPS 13 9340 Core Ultra 7 | |
| MSI Prestige 13 AI Evo | |
| Lenovo ThinkBook 13x G4 21KR0008GE | |
| Media Intel Core Ultra 5 125H (1593 - 1699, n=6) | |
| HWBOT x265 Benchmark v2.2 / 4k Preset | |
| Lenovo ThinkPad Z13 Gen 2 | |
| Dell XPS 13 9340 Core Ultra 7 | |
| Media Intel Core Ultra 5 125H (9.7 - 16.7, n=6) | |
| Media della classe Subnotebook (0.97 - 25.1, n=69, ultimi 2 anni) | |
| MSI Prestige 13 AI Evo | |
| Lenovo ThinkBook 13x G4 21KR0008GE | |
| HP Dragonfly G4 | |
| LibreOffice / 20 Documents To PDF | |
| Media della classe Subnotebook (38.5 - 220, n=67, ultimi 2 anni) | |
| Media Intel Core Ultra 5 125H (42.7 - 70.9, n=6) | |
| Lenovo ThinkBook 13x G4 21KR0008GE | |
| Lenovo ThinkPad Z13 Gen 2 | |
| Dell XPS 13 9340 Core Ultra 7 | |
| HP Dragonfly G4 | |
| MSI Prestige 13 AI Evo | |
| R Benchmark 2.5 / Overall mean | |
| Media della classe Subnotebook (0.403 - 1.456, n=69, ultimi 2 anni) | |
| Media Intel Core Ultra 5 125H (0.4898 - 0.53, n=6) | |
| Lenovo ThinkBook 13x G4 21KR0008GE | |
| Dell XPS 13 9340 Core Ultra 7 | |
| Lenovo ThinkPad Z13 Gen 2 | |
| MSI Prestige 13 AI Evo | |
| HP Dragonfly G4 | |
* ... Meglio usare valori piccoli
AIDA64: FP32 Ray-Trace | FPU Julia | CPU SHA3 | CPU Queen | FPU SinJulia | FPU Mandel | CPU AES | CPU ZLib | FP64 Ray-Trace | CPU PhotoWorxx
| Performance Rating | |
| Lenovo ThinkPad Z13 Gen 2 | |
| Dell XPS 13 9340 Core Ultra 7 | |
| Media Intel Core Ultra 5 125H | |
| Media della classe Subnotebook | |
| Lenovo ThinkBook 13x G4 21KR0008GE | |
| MSI Prestige 13 AI Evo | |
| HP Dragonfly G4 | |
| AIDA64 / FP32 Ray-Trace | |
| Lenovo ThinkPad Z13 Gen 2 | |
| Media della classe Subnotebook (1135 - 32888, n=69, ultimi 2 anni) | |
| Dell XPS 13 9340 Core Ultra 7 | |
| Media Intel Core Ultra 5 125H (8430 - 13639, n=6) | |
| Lenovo ThinkBook 13x G4 21KR0008GE | |
| HP Dragonfly G4 | |
| MSI Prestige 13 AI Evo | |
| AIDA64 / FPU Julia | |
| Lenovo ThinkPad Z13 Gen 2 | |
| Dell XPS 13 9340 Core Ultra 7 | |
| Media della classe Subnotebook (5218 - 123315, n=69, ultimi 2 anni) | |
| Media Intel Core Ultra 5 125H (43652 - 70880, n=6) | |
| MSI Prestige 13 AI Evo | |
| Lenovo ThinkBook 13x G4 21KR0008GE | |
| HP Dragonfly G4 | |
| AIDA64 / CPU SHA3 | |
| Lenovo ThinkPad Z13 Gen 2 | |
| Dell XPS 13 9340 Core Ultra 7 | |
| Media della classe Subnotebook (444 - 5287, n=69, ultimi 2 anni) | |
| Media Intel Core Ultra 5 125H (2047 - 3404, n=6) | |
| Lenovo ThinkBook 13x G4 21KR0008GE | |
| MSI Prestige 13 AI Evo | |
| HP Dragonfly G4 | |
| AIDA64 / CPU Queen | |
| Lenovo ThinkPad Z13 Gen 2 | |
| Lenovo ThinkBook 13x G4 21KR0008GE | |
| Dell XPS 13 9340 Core Ultra 7 | |
| Media Intel Core Ultra 5 125H (77892 - 79986, n=6) | |
| Media della classe Subnotebook (10579 - 115682, n=69, ultimi 2 anni) | |
| HP Dragonfly G4 | |
| MSI Prestige 13 AI Evo | |
| AIDA64 / FPU SinJulia | |
| Lenovo ThinkPad Z13 Gen 2 | |
| Dell XPS 13 9340 Core Ultra 7 | |
| Media Intel Core Ultra 5 125H (6588 - 7851, n=6) | |
| Media della classe Subnotebook (744 - 18418, n=69, ultimi 2 anni) | |
| Lenovo ThinkBook 13x G4 21KR0008GE | |
| MSI Prestige 13 AI Evo | |
| HP Dragonfly G4 | |
| AIDA64 / FPU Mandel | |
| Lenovo ThinkPad Z13 Gen 2 | |
| Dell XPS 13 9340 Core Ultra 7 | |
| Media della classe Subnotebook (3341 - 65433, n=69, ultimi 2 anni) | |
| Media Intel Core Ultra 5 125H (21210 - 35321, n=6) | |
| MSI Prestige 13 AI Evo | |
| Lenovo ThinkBook 13x G4 21KR0008GE | |
| HP Dragonfly G4 | |
| AIDA64 / CPU AES | |
| Lenovo ThinkPad Z13 Gen 2 | |
| Media Intel Core Ultra 5 125H (45524 - 108402, n=6) | |
| Dell XPS 13 9340 Core Ultra 7 | |
| Media della classe Subnotebook (638 - 161430, n=69, ultimi 2 anni) | |
| Lenovo ThinkBook 13x G4 21KR0008GE | |
| MSI Prestige 13 AI Evo | |
| HP Dragonfly G4 | |
| AIDA64 / CPU ZLib | |
| Lenovo ThinkPad Z13 Gen 2 | |
| Dell XPS 13 9340 Core Ultra 7 | |
| Media Intel Core Ultra 5 125H (594 - 994, n=6) | |
| Media della classe Subnotebook (164.9 - 1379, n=69, ultimi 2 anni) | |
| Lenovo ThinkBook 13x G4 21KR0008GE | |
| MSI Prestige 13 AI Evo | |
| HP Dragonfly G4 | |
| AIDA64 / FP64 Ray-Trace | |
| Lenovo ThinkPad Z13 Gen 2 | |
| Media della classe Subnotebook (610 - 17495, n=69, ultimi 2 anni) | |
| Dell XPS 13 9340 Core Ultra 7 | |
| Media Intel Core Ultra 5 125H (4345 - 7221, n=6) | |
| Lenovo ThinkBook 13x G4 21KR0008GE | |
| MSI Prestige 13 AI Evo | |
| HP Dragonfly G4 | |
| AIDA64 / CPU PhotoWorxx | |
| Dell XPS 13 9340 Core Ultra 7 | |
| Lenovo ThinkBook 13x G4 21KR0008GE | |
| Media Intel Core Ultra 5 125H (45724 - 49844, n=6) | |
| MSI Prestige 13 AI Evo | |
| Media della classe Subnotebook (6569 - 64588, n=69, ultimi 2 anni) | |
| Lenovo ThinkPad Z13 Gen 2 | |
| HP Dragonfly G4 | |
Prestazioni del sistema
Nell'uso quotidiano, il ThinkBook 13x G4 è un portatile veloce che elabora tutti gli input senza ritardi evidenti. I risultati dei benchmark sono in linea con le aspettative e non abbiamo riscontrato problemi di stabilità del sistema durante i test.
CrossMark: Overall | Productivity | Creativity | Responsiveness
WebXPRT 3: Overall
WebXPRT 4: Overall
Mozilla Kraken 1.1: Total
| PCMark 10 / Score | |
| Lenovo ThinkPad Z13 Gen 2 | |
| Dell XPS 13 9340 Core Ultra 7 | |
| Media della classe Subnotebook (4993 - 7788, n=58, ultimi 2 anni) | |
| Media Intel Core Ultra 5 125H, Intel Arc 7-Core iGPU (6194 - 6463, n=6) | |
| Lenovo ThinkBook 13x G4 21KR0008GE | |
| MSI Prestige 13 AI Evo | |
| HP Dragonfly G4 | |
| PCMark 10 / Essentials | |
| Lenovo ThinkPad Z13 Gen 2 | |
| HP Dragonfly G4 | |
| Dell XPS 13 9340 Core Ultra 7 | |
| Media della classe Subnotebook (9363 - 11331, n=58, ultimi 2 anni) | |
| Media Intel Core Ultra 5 125H, Intel Arc 7-Core iGPU (9427 - 10697, n=6) | |
| Lenovo ThinkBook 13x G4 21KR0008GE | |
| MSI Prestige 13 AI Evo | |
| PCMark 10 / Productivity | |
| Lenovo ThinkPad Z13 Gen 2 | |
| MSI Prestige 13 AI Evo | |
| Media della classe Subnotebook (5435 - 10623, n=58, ultimi 2 anni) | |
| Dell XPS 13 9340 Core Ultra 7 | |
| Lenovo ThinkBook 13x G4 21KR0008GE | |
| Media Intel Core Ultra 5 125H, Intel Arc 7-Core iGPU (7042 - 8000, n=6) | |
| HP Dragonfly G4 | |
| PCMark 10 / Digital Content Creation | |
| Lenovo ThinkPad Z13 Gen 2 | |
| Media Intel Core Ultra 5 125H, Intel Arc 7-Core iGPU (8198 - 9506, n=6) | |
| Media della classe Subnotebook (5305 - 12442, n=58, ultimi 2 anni) | |
| Dell XPS 13 9340 Core Ultra 7 | |
| Lenovo ThinkBook 13x G4 21KR0008GE | |
| MSI Prestige 13 AI Evo | |
| HP Dragonfly G4 | |
| CrossMark / Overall | |
| Apple MacBook Air 13 M3 10C GPU | |
| Dell XPS 13 9340 Core Ultra 7 | |
| HP Dragonfly G4 | |
| Media della classe Subnotebook (365 - 2018, n=67, ultimi 2 anni) | |
| Media Intel Core Ultra 5 125H, Intel Arc 7-Core iGPU (1522 - 1633, n=5) | |
| Lenovo ThinkBook 13x G4 21KR0008GE | |
| Lenovo ThinkPad Z13 Gen 2 | |
| MSI Prestige 13 AI Evo | |
| CrossMark / Productivity | |
| Apple MacBook Air 13 M3 10C GPU | |
| HP Dragonfly G4 | |
| Dell XPS 13 9340 Core Ultra 7 | |
| Media della classe Subnotebook (364 - 1875, n=67, ultimi 2 anni) | |
| Media Intel Core Ultra 5 125H, Intel Arc 7-Core iGPU (1432 - 1594, n=5) | |
| Lenovo ThinkBook 13x G4 21KR0008GE | |
| Lenovo ThinkPad Z13 Gen 2 | |
| MSI Prestige 13 AI Evo | |
| CrossMark / Creativity | |
| Apple MacBook Air 13 M3 10C GPU | |
| Dell XPS 13 9340 Core Ultra 7 | |
| Lenovo ThinkPad Z13 Gen 2 | |
| Media della classe Subnotebook (372 - 2396, n=67, ultimi 2 anni) | |
| HP Dragonfly G4 | |
| Media Intel Core Ultra 5 125H, Intel Arc 7-Core iGPU (1683 - 1765, n=5) | |
| Lenovo ThinkBook 13x G4 21KR0008GE | |
| MSI Prestige 13 AI Evo | |
| CrossMark / Responsiveness | |
| Dell XPS 13 9340 Core Ultra 7 | |
| HP Dragonfly G4 | |
| Apple MacBook Air 13 M3 10C GPU | |
| Media Intel Core Ultra 5 125H, Intel Arc 7-Core iGPU (1171 - 1520, n=5) | |
| Media della classe Subnotebook (312 - 1899, n=67, ultimi 2 anni) | |
| MSI Prestige 13 AI Evo | |
| Lenovo ThinkBook 13x G4 21KR0008GE | |
| Lenovo ThinkPad Z13 Gen 2 | |
| WebXPRT 3 / Overall | |
| Apple MacBook Air 13 M3 10C GPU | |
| Media della classe Subnotebook (156 - 479, n=66, ultimi 2 anni) | |
| HP Dragonfly G4 | |
| Lenovo ThinkPad Z13 Gen 2 | |
| Dell XPS 13 9340 Core Ultra 7 | |
| MSI Prestige 13 AI Evo | |
| Media Intel Core Ultra 5 125H, Intel Arc 7-Core iGPU (245 - 263, n=6) | |
| Lenovo ThinkBook 13x G4 21KR0008GE | |
| WebXPRT 4 / Overall | |
| Apple MacBook Air 13 M3 10C GPU | |
| HP Dragonfly G4 | |
| Media della classe Subnotebook (132 - 348, n=67, ultimi 2 anni) | |
| Dell XPS 13 9340 Core Ultra 7 | |
| MSI Prestige 13 AI Evo | |
| Lenovo ThinkBook 13x G4 21KR0008GE | |
| Lenovo ThinkPad Z13 Gen 2 | |
| Media Intel Core Ultra 5 125H, Intel Arc 7-Core iGPU (227 - 240, n=5) | |
| Mozilla Kraken 1.1 / Total | |
| Media Intel Core Ultra 5 125H, Intel Arc 7-Core iGPU (560 - 595, n=6) | |
| Lenovo ThinkPad Z13 Gen 2 | |
| Lenovo ThinkBook 13x G4 21KR0008GE | |
| MSI Prestige 13 AI Evo | |
| Dell XPS 13 9340 Core Ultra 7 | |
| Media della classe Subnotebook (278 - 1104, n=75, ultimi 2 anni) | |
| HP Dragonfly G4 | |
| Apple MacBook Air 13 M3 10C GPU | |
* ... Meglio usare valori piccoli
| PCMark 10 Score | 6293 punti | |
Aiuto | ||
| AIDA64 / Memory Copy | |
| Dell XPS 13 9340 Core Ultra 7 | |
| Lenovo ThinkBook 13x G4 21KR0008GE | |
| MSI Prestige 13 AI Evo | |
| Media Intel Core Ultra 5 125H (67482 - 87473, n=6) | |
| Media della classe Subnotebook (14554 - 109035, n=69, ultimi 2 anni) | |
| Lenovo ThinkPad Z13 Gen 2 | |
| HP Dragonfly G4 | |
| AIDA64 / Memory Read | |
| Dell XPS 13 9340 Core Ultra 7 | |
| Lenovo ThinkBook 13x G4 21KR0008GE | |
| Media Intel Core Ultra 5 125H (70520 - 76803, n=6) | |
| MSI Prestige 13 AI Evo | |
| Media della classe Subnotebook (15948 - 122210, n=69, ultimi 2 anni) | |
| Lenovo ThinkPad Z13 Gen 2 | |
| HP Dragonfly G4 | |
| AIDA64 / Memory Write | |
| Lenovo ThinkPad Z13 Gen 2 | |
| Media della classe Subnotebook (15709 - 117898, n=69, ultimi 2 anni) | |
| MSI Prestige 13 AI Evo | |
| Dell XPS 13 9340 Core Ultra 7 | |
| HP Dragonfly G4 | |
| Media Intel Core Ultra 5 125H (63162 - 72443, n=6) | |
| Lenovo ThinkBook 13x G4 21KR0008GE | |
| AIDA64 / Memory Latency | |
| MSI Prestige 13 AI Evo | |
| Media Intel Core Ultra 5 125H (127.3 - 184.8, n=6) | |
| Lenovo ThinkPad Z13 Gen 2 | |
| Lenovo ThinkBook 13x G4 21KR0008GE | |
| Dell XPS 13 9340 Core Ultra 7 | |
| Media della classe Subnotebook (7.2 - 187.8, n=68, ultimi 2 anni) | |
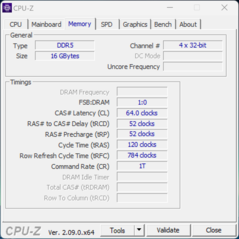
| HP Dragonfly G4 | |
* ... Meglio usare valori piccoli
Latenza DPC
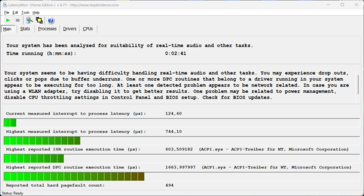
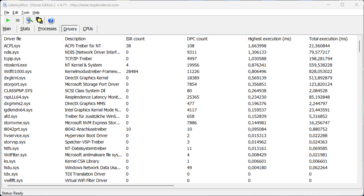
Nel nostro test di latenza standardizzato (navigazione web, riproduzione di YouTube 4K, carico della CPU), il nostro dispositivo di prova non mostra limitazioni con la versione attuale del BIOS. Anche se uno dei driver mostra un picco, il valore importante "interrupt-to-process-latency" è basso.
| DPC Latencies / LatencyMon - interrupt to process latency (max), Web, Youtube, Prime95 | |
| MSI Prestige 13 AI Evo | |
| Lenovo ThinkPad Z13 Gen 2 | |
| HP Dragonfly G4 | |
| Lenovo ThinkBook 13x G4 21KR0008GE | |
| Dell XPS 13 9340 Core Ultra 7 | |
* ... Meglio usare valori piccoli
Dispositivi di archiviazione
Lenovo installa un SSD compatto M.2-2242 con connessione PCIe 4.0, che nel nostro dispositivo di prova proviene da Samsung (PM9C1a) e offre una capacità di archiviazione di 512 GB. Dopo il primo avvio, rimangono 422 GB. Le velocità di trasferimento sono buone, ma le prestazioni non rimangono stabili in caso di carico prolungato. Nell'uso quotidiano, tuttavia, questo non ha alcun effetto, in quanto le prestazioni sono ancora sufficienti (oltre 3,3 GB/s). Altri benchmark SSD sono elencati qui.
* ... Meglio usare valori piccoli
Sustained Read Performance: DiskSpd Read Loop, Queue Depth 8
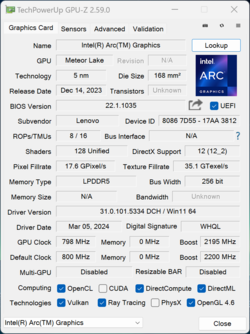
Scheda grafica - Arc Graphics con 7 core Xe
In combinazione con Core Ultra 5 125H, viene utilizzata la più lenta grafica integrata Intel Arc Graphics con 7 core Xe. Grazie alla RAM veloce, le prestazioni grafiche sono complessivamente molto buone e difficilmente si differenziano dai computer portatili con la variante più veloce a 8 core che abbiamo testato finora. Questo vale anche per Dell XPS 13 9340 e MSI Prestige 13 AI Evo. Anche ThinkPad Z13 Gen2 con il processore AMD e la Radeon 780M viene superato nei test sintetici.
La Radeon 780M ha ancora un leggero vantaggio nei benchmark di gioco, ma il ThinkBook 13x G4 è ancora una volta in vantaggio rispetto ai presumibilmente più veloci Dell XPS 13 e MSI Prestige 13. Inoltre, non abbiamo notato alcun problema di cadute di frame durante il gioco. In generale, molti titoli più vecchi o meno esigenti possono essere giocati senza problemi a dettagli medio-alti in 1080p. Con i titoli moderni, come Cyberpunk 2077, tuttavia, le cose si fanno difficili e, oltre alla risoluzione ridotta o ai dettagli ridotti, è necessario utilizzare anche le tecnologie di upscaling.
Le prestazioni grafiche rimangono stabili sotto carico prolungato e in modalità batteria. Ulteriori benchmark grafici sono disponibili in nostra sezione tecnica.
| 3DMark 11 Performance | 11306 punti | |
| 3DMark Fire Strike Score | 7500 punti | |
| 3DMark Time Spy Score | 3498 punti | |
Aiuto | ||
| Blender / v3.3 Classroom CPU | |
| HP Dragonfly G4 | |
| Lenovo ThinkBook 13x G4 21KR0008GE | |
| MSI Prestige 13 AI Evo | |
| Media della classe Subnotebook (241 - 1127, n=71, ultimi 2 anni) | |
| Apple MacBook Air 13 M3 10C GPU | |
| Media Intel Arc 7-Core iGPU (391 - 671, n=6) | |
| Dell XPS 13 9340 Core Ultra 7 | |
| Lenovo ThinkPad Z13 Gen 2 | |
| Blender / v3.3 Classroom METAL | |
| Media della classe Subnotebook (103 - 237, n=4, ultimi 2 anni) | |
| Apple MacBook Air 13 M3 10C GPU | |
* ... Meglio usare valori piccoli
| Performance Rating - Percent | |
| Lenovo ThinkPad Z13 Gen 2 -1! | |
| Media della classe Subnotebook | |
| Lenovo ThinkBook 13x G4 21KR0008GE | |
| Dell XPS 13 9340 Core Ultra 7 | |
| MSI Prestige 13 AI Evo | |
| HP Dragonfly G4 | |
| The Witcher 3 - 1920x1080 Ultra Graphics & Postprocessing (HBAO+) | |
| Lenovo ThinkPad Z13 Gen 2 | |
| Lenovo ThinkBook 13x G4 21KR0008GE | |
| Media della classe Subnotebook (8.5 - 43.7, n=49, ultimi 2 anni) | |
| Dell XPS 13 9340 Core Ultra 7 | |
| HP Dragonfly G4 | |
| MSI Prestige 13 AI Evo | |
| GTA V - 1920x1080 Highest Settings possible AA:4xMSAA + FX AF:16x | |
| Media della classe Subnotebook (7.81 - 53, n=66, ultimi 2 anni) | |
| Lenovo ThinkBook 13x G4 21KR0008GE | |
| Dell XPS 13 9340 Core Ultra 7 | |
| HP Dragonfly G4 | |
| MSI Prestige 13 AI Evo | |
| Final Fantasy XV Benchmark - 1920x1080 High Quality | |
| Lenovo ThinkPad Z13 Gen 2 | |
| Dell XPS 13 9340 Core Ultra 7 | |
| Lenovo ThinkBook 13x G4 21KR0008GE | |
| Media della classe Subnotebook (11.9 - 44.2, n=71, ultimi 2 anni) | |
| MSI Prestige 13 AI Evo | |
| HP Dragonfly G4 | |
| Strange Brigade - 1920x1080 ultra AA:ultra AF:16 | |
| Lenovo ThinkBook 13x G4 21KR0008GE | |
| Lenovo ThinkPad Z13 Gen 2 | |
| Media della classe Subnotebook (17.7 - 70.7, n=70, ultimi 2 anni) | |
| Dell XPS 13 9340 Core Ultra 7 | |
| MSI Prestige 13 AI Evo | |
| HP Dragonfly G4 | |
| Dota 2 Reborn - 1920x1080 ultra (3/3) best looking | |
| Lenovo ThinkPad Z13 Gen 2 | |
| Dell XPS 13 9340 Core Ultra 7 | |
| Lenovo ThinkBook 13x G4 21KR0008GE | |
| Media della classe Subnotebook (13 - 99.5, n=74, ultimi 2 anni) | |
| HP Dragonfly G4 | |
| MSI Prestige 13 AI Evo | |
| X-Plane 11.11 - 1920x1080 high (fps_test=3) | |
| Lenovo ThinkBook 13x G4 21KR0008GE | |
| Media della classe Subnotebook (20.7 - 97.1, n=63, ultimi 2 anni) | |
| MSI Prestige 13 AI Evo | |
| Dell XPS 13 9340 Core Ultra 7 | |
| HP Dragonfly G4 | |
| Lenovo ThinkPad Z13 Gen 2 | |
Witcher 3 FPS chart
| basso | medio | alto | ultra | |
|---|---|---|---|---|
| GTA V (2015) | 116.9 | 106.4 | 32.4 | 14.8 |
| The Witcher 3 (2015) | 126 | 80 | 45 | 23.4 |
| Dota 2 Reborn (2015) | 93.8 | 83 | 68.4 | 64.9 |
| Final Fantasy XV Benchmark (2018) | 59.8 | 33.4 | 25.3 | |
| X-Plane 11.11 (2018) | 52 | 40.1 | 34.2 | |
| Far Cry 5 (2018) | 64 | 37 | 35 | 31 |
| Strange Brigade (2018) | 141 | 68 | 54 | 44 |
| F1 23 (2023) | 58.7 | 53.5 | 37.3 | |
| Cyberpunk 2077 2.2 Phantom Liberty (2023) | 23.2 | 19.8 | 16.6 | 14.8 |
Emissioni - Altoparlanti eccellenti
Rumore
Le due ventole rimangono generalmente molto silenziose o disattivate nell'uso quotidiano e non sono affatto fastidiose, anche sotto carico elevato. Abbiamo registrato un valore massimo di 40,7 dB(A) solo per un breve periodo, prima che le ventole si stabilizzassero a 36,8 dB(A). In modalità prestazioni, il massimo è 42,5 dB(A) e 33,9 dB(A) in modalità risparmio batteria. Non sono stati rilevati altri rumori elettronici, come il fruscio della bobina.
Rumorosità
| Idle |
| 24.5 / 24.5 / 27.1 dB(A) |
| Sotto carico |
| 33.3 / 40.7 dB(A) |
 | ||
30 dB silenzioso 40 dB(A) udibile 50 dB(A) rumoroso |
||
min: | ||
| Lenovo ThinkBook 13x G4 21KR0008GE Arc 7-Core, Ultra 5 125H, Samsung PM9C1a MZAL8512HDLU | Dell XPS 13 9340 Core Ultra 7 Arc 8-Core, Ultra 7 155H, Micron 2550 512GB | MSI Prestige 13 AI Evo Arc 8-Core, Ultra 7 155H, Samsung PM9A1 MZVL21T0HCLR | Lenovo ThinkPad Z13 Gen 2 Radeon 780M, R7 PRO 7840U, SK hynix BC901 HFS001TEJ4X164N | HP Dragonfly G4 Iris Xe G7 96EUs, i7-1365U, Micron 3400 MTFDKBA512TFH 512GB | |
|---|---|---|---|---|---|
| Noise | -4% | 2% | -5% | 8% | |
| off /ambiente * | 24.5 | 25.1 -2% | 23.4 4% | 25.1 -2% | 23.3 5% |
| Idle Minimum * | 24.5 | 25.1 -2% | 23.4 4% | 25.8 -5% | 23.5 4% |
| Idle Average * | 24.5 | 25.1 -2% | 26.9 -10% | 25.8 -5% | 23.5 4% |
| Idle Maximum * | 27.1 | 25.1 7% | 26.9 1% | 28.3 -4% | 26.8 1% |
| Load Average * | 33.3 | 37.4 -12% | 32 4% | 28.3 15% | 27.2 18% |
| Witcher 3 ultra * | 36.8 | 42.5 -15% | 32 13% | 44.8 -22% | 32.7 11% |
| Load Maximum * | 40.7 | 42.5 -4% | 40.3 1% | 44.8 -10% | 35 14% |
* ... Meglio usare valori piccoli
Temperatura
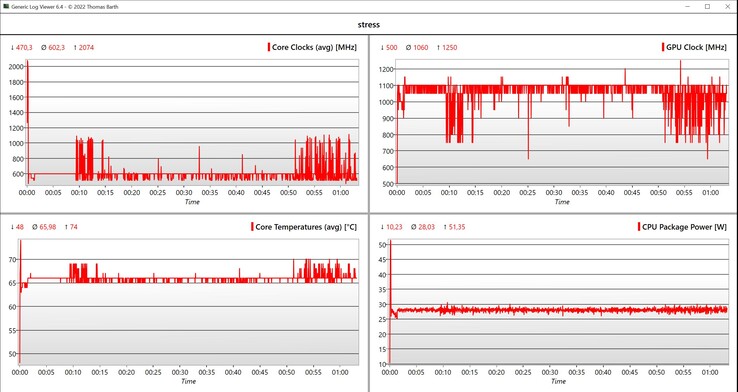
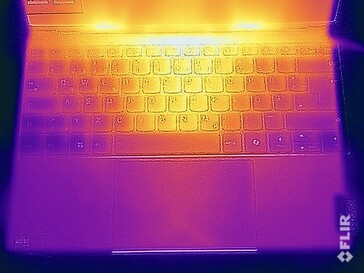
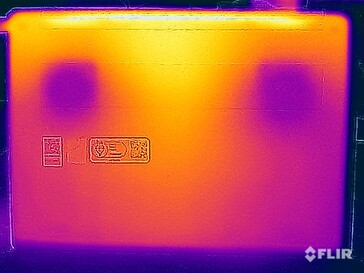
Lenovo tiene sotto controllo le temperature di superficie del ThinkBook 13x G4. Il dispositivo non si riscalda praticamente per niente quando è al minimo e sotto basso carico, e c'è solo un punto caldo in cui misuriamo più di 40 °C sotto carico. Si tratta della parte superiore dell'unità base, sopra la tastiera, dove comunque non si tocca il dispositivo. La temperatura massima sul lato inferiore è di 39 °C, quindi può appoggiare il dispositivo sulle cosce senza problemi, anche sotto carico. Nel test di stress con carico combinato CPU/GPU, il SoC si stabilizza rapidamente a 28 watt e rimane a questo livello.
(±) La temperatura massima sul lato superiore è di 43.1 °C / 110 F, rispetto alla media di 35.9 °C / 97 F, che varia da 21.4 a 59 °C per questa classe Subnotebook.
(+) Il lato inferiore si riscalda fino ad un massimo di 39.2 °C / 103 F, rispetto alla media di 39.3 °C / 103 F
(+) In idle, la temperatura media del lato superiore è di 27.1 °C / 81 F, rispetto alla media deld ispositivo di 30.8 °C / 87 F.
(±) Riproducendo The Witcher 3, la temperatura media per il lato superiore e' di 35 °C / 95 F, rispetto alla media del dispositivo di 30.8 °C / 87 F.
(+) I poggiapolsi e il touchpad sono piu' freddi della temperatura della pelle con un massimo di 29.3 °C / 84.7 F e sono quindi freddi al tatto.
(±) La temperatura media della zona del palmo della mano di dispositivi simili e'stata di 28.2 °C / 82.8 F (-1.1 °C / -1.9 F).
| Lenovo ThinkBook 13x G4 21KR0008GE Intel Core Ultra 5 125H, Intel Arc 7-Core iGPU | Dell XPS 13 9340 Core Ultra 7 Intel Core Ultra 7 155H, Intel Arc 8-Core iGPU | Apple MacBook Air 13 M3 10C GPU Apple M3, Apple M3 10-Core GPU | MSI Prestige 13 AI Evo Intel Core Ultra 7 155H, Intel Arc 8-Core iGPU | Lenovo ThinkPad Z13 Gen 2 AMD Ryzen 7 PRO 7840U, AMD Radeon 780M | HP Dragonfly G4 Intel Core i7-1365U, Intel Iris Xe Graphics G7 96EUs | |
|---|---|---|---|---|---|---|
| Heat | 4% | 7% | 6% | 2% | 1% | |
| Maximum Upper Side * | 43.1 | 41 5% | 44.3 -3% | 40.9 5% | 46.2 -7% | 38.6 10% |
| Maximum Bottom * | 39.2 | 43.5 -11% | 43.4 -11% | 40.4 -3% | 48.4 -23% | 40.4 -3% |
| Idle Upper Side * | 28.3 | 25.3 11% | 22.3 21% | 25 12% | 23.2 18% | 28.2 -0% |
| Idle Bottom * | 28 | 25.5 9% | 22.1 21% | 25.5 9% | 23 18% | 29 -4% |
* ... Meglio usare valori piccoli
Altoparlanti
Il ThinkBook 13x G4 offre quattro altoparlanti composti da due tweeter e due woofer con 2 watt ciascuno, che si traducono in un'eccellente qualità del suono. In questo caso, il ThinkBook è in grado di reggere il confronto con il MacBook Air 13. I bassi sono un po' limitati rispetto ai computer portatili multimediali più grandi, ma il risultato è comunque molto buono viste le dimensioni del telaio.
Lenovo ThinkBook 13x G4 21KR0008GE analisi audio
(+) | gli altoparlanti sono relativamente potenti (83.8 dB)
Bassi 100 - 315 Hz
(±) | bassi ridotti - in media 9% inferiori alla media
(±) | la linearità dei bassi è media (8% delta rispetto alla precedente frequenza)
Medi 400 - 2000 Hz
(+) | medi bilanciati - solo only 2.4% rispetto alla media
(+) | medi lineari (2.9% delta rispetto alla precedente frequenza)
Alti 2 - 16 kHz
(+) | Alti bilanciati - appena 3.2% dalla media
(+) | alti lineari (3.4% delta rispetto alla precedente frequenza)
Nel complesso 100 - 16.000 Hz
(+) | suono nel complesso lineare (8.6% differenza dalla media)
Rispetto alla stessa classe
» 3% di tutti i dispositivi testati in questa classe è stato migliore, 1% simile, 97% peggiore
» Il migliore ha avuto un delta di 5%, medio di 19%, peggiore di 53%
Rispetto a tutti i dispositivi testati
» 2% di tutti i dispositivi testati in questa classe è stato migliore, 1% similare, 97% peggiore
» Il migliore ha avuto un delta di 4%, medio di 24%, peggiore di 134%
Dell XPS 13 9340 Core Ultra 7 analisi audio
(+) | gli altoparlanti sono relativamente potenti (83.2 dB)
Bassi 100 - 315 Hz
(-) | quasi nessun basso - in media 17% inferiori alla media
(±) | la linearità dei bassi è media (9.3% delta rispetto alla precedente frequenza)
Medi 400 - 2000 Hz
(+) | medi bilanciati - solo only 2.1% rispetto alla media
(+) | medi lineari (4.7% delta rispetto alla precedente frequenza)
Alti 2 - 16 kHz
(+) | Alti bilanciati - appena 2.5% dalla media
(+) | alti lineari (4.6% delta rispetto alla precedente frequenza)
Nel complesso 100 - 16.000 Hz
(+) | suono nel complesso lineare (11.6% differenza dalla media)
Rispetto alla stessa classe
» 12% di tutti i dispositivi testati in questa classe è stato migliore, 3% simile, 85% peggiore
» Il migliore ha avuto un delta di 5%, medio di 19%, peggiore di 53%
Rispetto a tutti i dispositivi testati
» 7% di tutti i dispositivi testati in questa classe è stato migliore, 2% similare, 91% peggiore
» Il migliore ha avuto un delta di 4%, medio di 24%, peggiore di 134%
Apple MacBook Air 13 M3 10C GPU analisi audio
(+) | gli altoparlanti sono relativamente potenti (83.2 dB)
Bassi 100 - 315 Hz
(±) | bassi ridotti - in media 13.3% inferiori alla media
(±) | la linearità dei bassi è media (11.3% delta rispetto alla precedente frequenza)
Medi 400 - 2000 Hz
(+) | medi bilanciati - solo only 0.4% rispetto alla media
(+) | medi lineari (1.6% delta rispetto alla precedente frequenza)
Alti 2 - 16 kHz
(+) | Alti bilanciati - appena 4.5% dalla media
(+) | alti lineari (1.9% delta rispetto alla precedente frequenza)
Nel complesso 100 - 16.000 Hz
(+) | suono nel complesso lineare (10.7% differenza dalla media)
Rispetto alla stessa classe
» 8% di tutti i dispositivi testati in questa classe è stato migliore, 3% simile, 89% peggiore
» Il migliore ha avuto un delta di 5%, medio di 19%, peggiore di 53%
Rispetto a tutti i dispositivi testati
» 5% di tutti i dispositivi testati in questa classe è stato migliore, 1% similare, 94% peggiore
» Il migliore ha avuto un delta di 4%, medio di 24%, peggiore di 134%
Gestione dell'energia - Lunghi tempi di funzionamento
Consumo di energia
Le nostre misurazioni dei consumi non mostrano sorprese e, come ci si aspettava, il pannello ad alta risoluzione e luminosità richiede una quantità di energia leggermente superiore rispetto all'XPS 13 con schermo a 1080p, ad esempio. Con un massimo di 8,9 watt in modalità idle, il consumo non è troppo elevato. Sotto carico massimo, il dispositivo raggiunge brevemente il limite dell'alimentatore da 65 watt, ma scende a ~45 watt dopo pochi secondi e rimane a questo livello.
| Off / Standby | |
| Idle | |
| Sotto carico |
|
Leggenda:
min: | |
| Lenovo ThinkBook 13x G4 21KR0008GE Ultra 5 125H, Arc 7-Core, Samsung PM9C1a MZAL8512HDLU, IPS, 2880x1920, 13.5" | Dell XPS 13 9340 Core Ultra 7 Ultra 7 155H, Arc 8-Core, Micron 2550 512GB, IPS, 1920x1200, 13.4" | Apple MacBook Air 13 M3 10C GPU M3, M3 10-Core GPU, Apple SSD AP0512Z, IPS, 2560x1664, 13.6" | MSI Prestige 13 AI Evo Ultra 7 155H, Arc 8-Core, Samsung PM9A1 MZVL21T0HCLR, OLED, 2880x1800, 13.3" | Lenovo ThinkPad Z13 Gen 2 R7 PRO 7840U, Radeon 780M, SK hynix BC901 HFS001TEJ4X164N, OLED, 2880x1800, 13.3" | HP Dragonfly G4 i7-1365U, Iris Xe G7 96EUs, Micron 3400 MTFDKBA512TFH 512GB, IPS, 1920x1280, 13.5" | Media Intel Arc 7-Core iGPU | Media della classe Subnotebook | |
|---|---|---|---|---|---|---|---|---|
| Power Consumption | 13% | 28% | 14% | 1% | 14% | -20% | 7% | |
| Idle Minimum * | 5.4 | 3.8 30% | 1.95 64% | 4.5 17% | 5.8 -7% | 4.1 24% | 6.88 ? -27% | 4.31 ? 20% |
| Idle Average * | 7.8 | 7 10% | 8.7 -12% | 8 -3% | 6.2 21% | 7.5 4% | 9.02 ? -16% | 7.33 ? 6% |
| Idle Maximum * | 8.9 | 7.3 18% | 8.9 -0% | 8.7 2% | 12.7 -43% | 8.2 8% | 12.2 ? -37% | 9.09 ? -2% |
| Load Average * | 49.4 | 52.6 -6% | 34.3 31% | 36.1 27% | 27.2 45% | 35.5 28% | 51.4 ? -4% | 44.9 ? 9% |
| Witcher 3 ultra * | 44.4 | 38.3 14% | 28.6 36% | 29.7 33% | 54.1 -22% | 37.5 16% | ||
| Load Maximum * | 68.8 | 62.7 9% | 35.4 49% | 65 6% | 61.4 11% | 66.5 3% | 78.3 ? -14% | 68.7 ? -0% |
* ... Meglio usare valori piccoli
Power consumption Witcher 3 / Stress test
Power consumption with external monitor
Durata della batteria
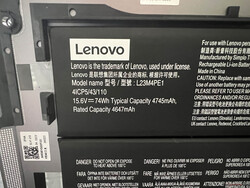
Con la sua grande batteria da 74 Wh, il ThinkBook 13x G4 raggiunge tempi di autonomia buoni, ma non eccezionali, nel nostro test WLAN. A 150 cd/m² (corrispondenti al 56% della luminosità massima del dispositivo di test), abbiamo misurato poco meno di 11,5 ore a 60 Hz e circa 10,5 ore a 120 Hz. Alla massima luminosità, otteniamo ancora 9 ore (60 Hz) e 7,5 ore (120 Hz). Nel test video a 150 cd/m², il ThinkBook raggiunge un'eccezionale durata di 20,5 ore e supera chiaramente tutti i concorrenti. A pieno carico e con la massima luminosità, termina dopo poco meno di 2 ore. Una ricarica completa richiede 113 minuti con il dispositivo acceso (80% dopo 66 minuti). Esiste anche una modalità di ricarica express, ma non offre alcun vantaggio con l'alimentatore da 65 watt.
| Lenovo ThinkBook 13x G4 21KR0008GE Ultra 5 125H, Arc 7-Core, 74 Wh | Dell XPS 13 9340 Core Ultra 7 Ultra 7 155H, Arc 8-Core, 55 Wh | Apple MacBook Air 13 M3 10C GPU M3, M3 10-Core GPU, 52.6 Wh | MSI Prestige 13 AI Evo Ultra 7 155H, Arc 8-Core, 75 Wh | Lenovo ThinkPad Z13 Gen 2 R7 PRO 7840U, Radeon 780M, 51.5 Wh | HP Dragonfly G4 i7-1365U, Iris Xe G7 96EUs, 68 Wh | Media della classe Subnotebook | |
|---|---|---|---|---|---|---|---|
| Autonomia della batteria | 4% | 22% | 10% | -31% | 53% | -2% | |
| H.264 | 1229 | 1053 -14% | 1044 -15% | 1002 -18% | 963 ? -22% | ||
| WiFi v1.3 | 684 | 769 12% | 914 34% | 694 1% | 469 -31% | 954 39% | 757 ? 11% |
| Load | 116 | 131 13% | 171 47% | 169 46% | 192 66% | 122 ? 5% |
Pro
Contro
Verdetto - Il ThinkBook 13x G4 è un ottimo subnotebook, se riesce ad accettare la tastiera
Il ThinkBook 13x G4 ci ha sorpreso perché Lenovo offre un ultrabook molto mobile con un telaio in metallo di alta qualità e uno schermo opaco 3:2. Non ci sono limitazioni in termini di lavorazione o stabilità, e non ci si aspetta uno chassis in metallo su un ThinkBook (di solito solo il coperchio è in alluminio). Ci sono tre porte Thunderbolt 4, che a volte richiedono adattatori nell'uso quotidiano, ma dovrebbero essere sufficienti. Le opzioni di manutenzione sono limitate, tuttavia, poiché la batteria è attaccata al lato inferiore dello chassis.
Le prestazioni del Core Ultra 5 125H sono sufficienti per l'uso quotidiano, ma non stabiliscono alcun record. In effetti, avremmo preferito un processore AMD, dato il limite di potenza di 28 watt. Il Core Ultra 9 185H è disponibile come opzione, ma solo con un forte sovrapprezzo. anche i 32 GB di RAM possono essere combinati solo con il Core Ultra 9. Lo schermo IPS opaco con 120 Hz è impressionante sotto ogni aspetto. La qualità dell'immagine soggettiva non è così buona come quella dei pannelli OLED, ma non ci sono riflessi e lo sfarfallio PWM è inesistente. La durata della batteria è perfettamente accettabile. È integrato anche un ottimo sistema audio con quattro altoparlanti.
Il ThinkBook 13x G4 di Lenovo convince con uno chassis di alta qualità, ottimi altoparlanti, un buon display IPS e una lunga durata della batteria. Tuttavia, la tastiera ha i suoi limiti.
Oltre alle scarse opzioni di manutenzione, compresa la RAM saldata, l'altro grande punto debole del ThinkBook 13x G4 è la tastiera. Sebbene la pressione dei tasti sia decisa, la corsa dei tasti è molto limitata, il che influisce notevolmente sul comfort di digitazione. Ci si può certamente abituare alla tastiera e dipende anche un po' dal tipo di tastiera che si è utilizzata in precedenza, ma questo problema si sarebbe potuto facilmente evitare con un po' più di corsa dei tasti. La tastiera del Dell XPS 13 9340è più comoda, ma gli utenti devono sopportare il layout insolito e i tasti funzione capacitivi. Nel complesso, il 13x G4 offre un rapporto prezzo-prestazioni decisamente migliore. Il Apple MacBook Air M3 rimane un forte concorrente, offrendo maggiori prestazioni in combinazione con il raffreddamento passivo, ma utilizza solo un display a 60 Hz.
Prezzo e disponibilità
Sul webstore statunitense di Lenovo, il modello base del Thinkbook 13x Gen 4 parte da 1106,00 dollari. Naturalmente, questo modello può essere configurato con una CPU più potente, RAM extra e più spazio di archiviazione.
Lenovo ThinkBook 13x G4 21KR0008GE
- 05/23/2024 v7 (old)
Andreas Osthoff
Transparency
La selezione dei dispositivi da recensire viene effettuata dalla nostra redazione. Il campione di prova è stato fornito all'autore come prestito dal produttore o dal rivenditore ai fini di questa recensione. L'istituto di credito non ha avuto alcuna influenza su questa recensione, né il produttore ne ha ricevuto una copia prima della pubblicazione. Non vi era alcun obbligo di pubblicare questa recensione. Non accettiamo mai compensi o pagamenti in cambio delle nostre recensioni. In quanto società mediatica indipendente, Notebookcheck non è soggetta all'autorità di produttori, rivenditori o editori.
Ecco come Notebookcheck esegue i test
Ogni anno, Notebookcheck esamina in modo indipendente centinaia di laptop e smartphone utilizzando procedure standardizzate per garantire che tutti i risultati siano comparabili. Da circa 20 anni sviluppiamo continuamente i nostri metodi di prova e nel frattempo stabiliamo gli standard di settore. Nei nostri laboratori di prova, tecnici ed editori esperti utilizzano apparecchiature di misurazione di alta qualità. Questi test comportano un processo di validazione in più fasi. Il nostro complesso sistema di valutazione si basa su centinaia di misurazioni e parametri di riferimento ben fondati, che mantengono l'obiettività.


