Recensione del Geekom XT13 Pro: Il mini-PC NUC rinuncia Meteor Lake e opta solo per un Intel Core i9-13900H
Il Geekom XT13 Pro eredita il modello Geekom XT12 Pro e viene fornito nella configurazione top con un Intel Core i9-13900H equipaggiato. Sono presenti anche 32 GB di RAM DDR4 e un SSD da 2 TB, anche se questo ha un prezzo. Il prezzo è di 999 euro, quindi non è proprio un affare. Al prezzo di 769 euro, il Geekom XT13 Pro è disponibile con un Intel Core i7-13620H e un SSD da 1 TB. Geekom ha deciso di non utilizzare i nuovi processori Meteor Lake e di attenersi ai vecchi processori Raptor Lake. Questo test mostrerà se questo è il modo giusto per affrontare la concorrenza.
Ci si chiede anche se questo prezzo sia giustificato. Affronteremo questo punto importante in modo specifico dopo l'analisi delle prestazioni. In ogni caso, il produttore stesso fissa un livello molto alto.
Potenziali concorrenti a confrontos
Punteggio | Versione | Data | Modello | Memoria | Peso | Altezza |
|---|---|---|---|---|---|---|
| 72.8 % | v8 | 08/2024 | Geekom XT13 Pro i9-13900H, Iris Xe G7 96EUs | 32768 MB | 555 gr | 37 mm |
| 80.8 % | v8 | 06/2024 | Aoostar GEM12 R7 8845HS, Radeon 780M | 32768 MB | 653 gr | 60 mm |
| 87.5 % v7 (old) | v7 (old) | 05/2024 | Minisforum AtomMan X7 Ti Ultra 9 185H, Arc 8-Core | 32768 MB | 863 gr | 48.6 mm |
| 83.4 % v7 (old) | v7 (old) | 04/2024 | Acemagic F2A Ultra 7 155H, Arc 8-Core | 32768 MB | 768 gr | 57 mm |
| 84.1 % | v8 | 04/2024 | Geekom XT12 Pro i9-12900H, Iris Xe G7 96EUs | 32768 MB | 545 gr | 37 mm |
| 82.6 % v7 (old) | v7 (old) | 03/2024 | Geekom A7 R9 7940HS, Radeon 780M | 32768 MB | 417 gr | 38 mm |
Nota: abbiamo aggiornato il nostro sistema di valutazione e i risultati della versione 8 non sono paragonabili a quelli della versione 7, disponibili qui qui.

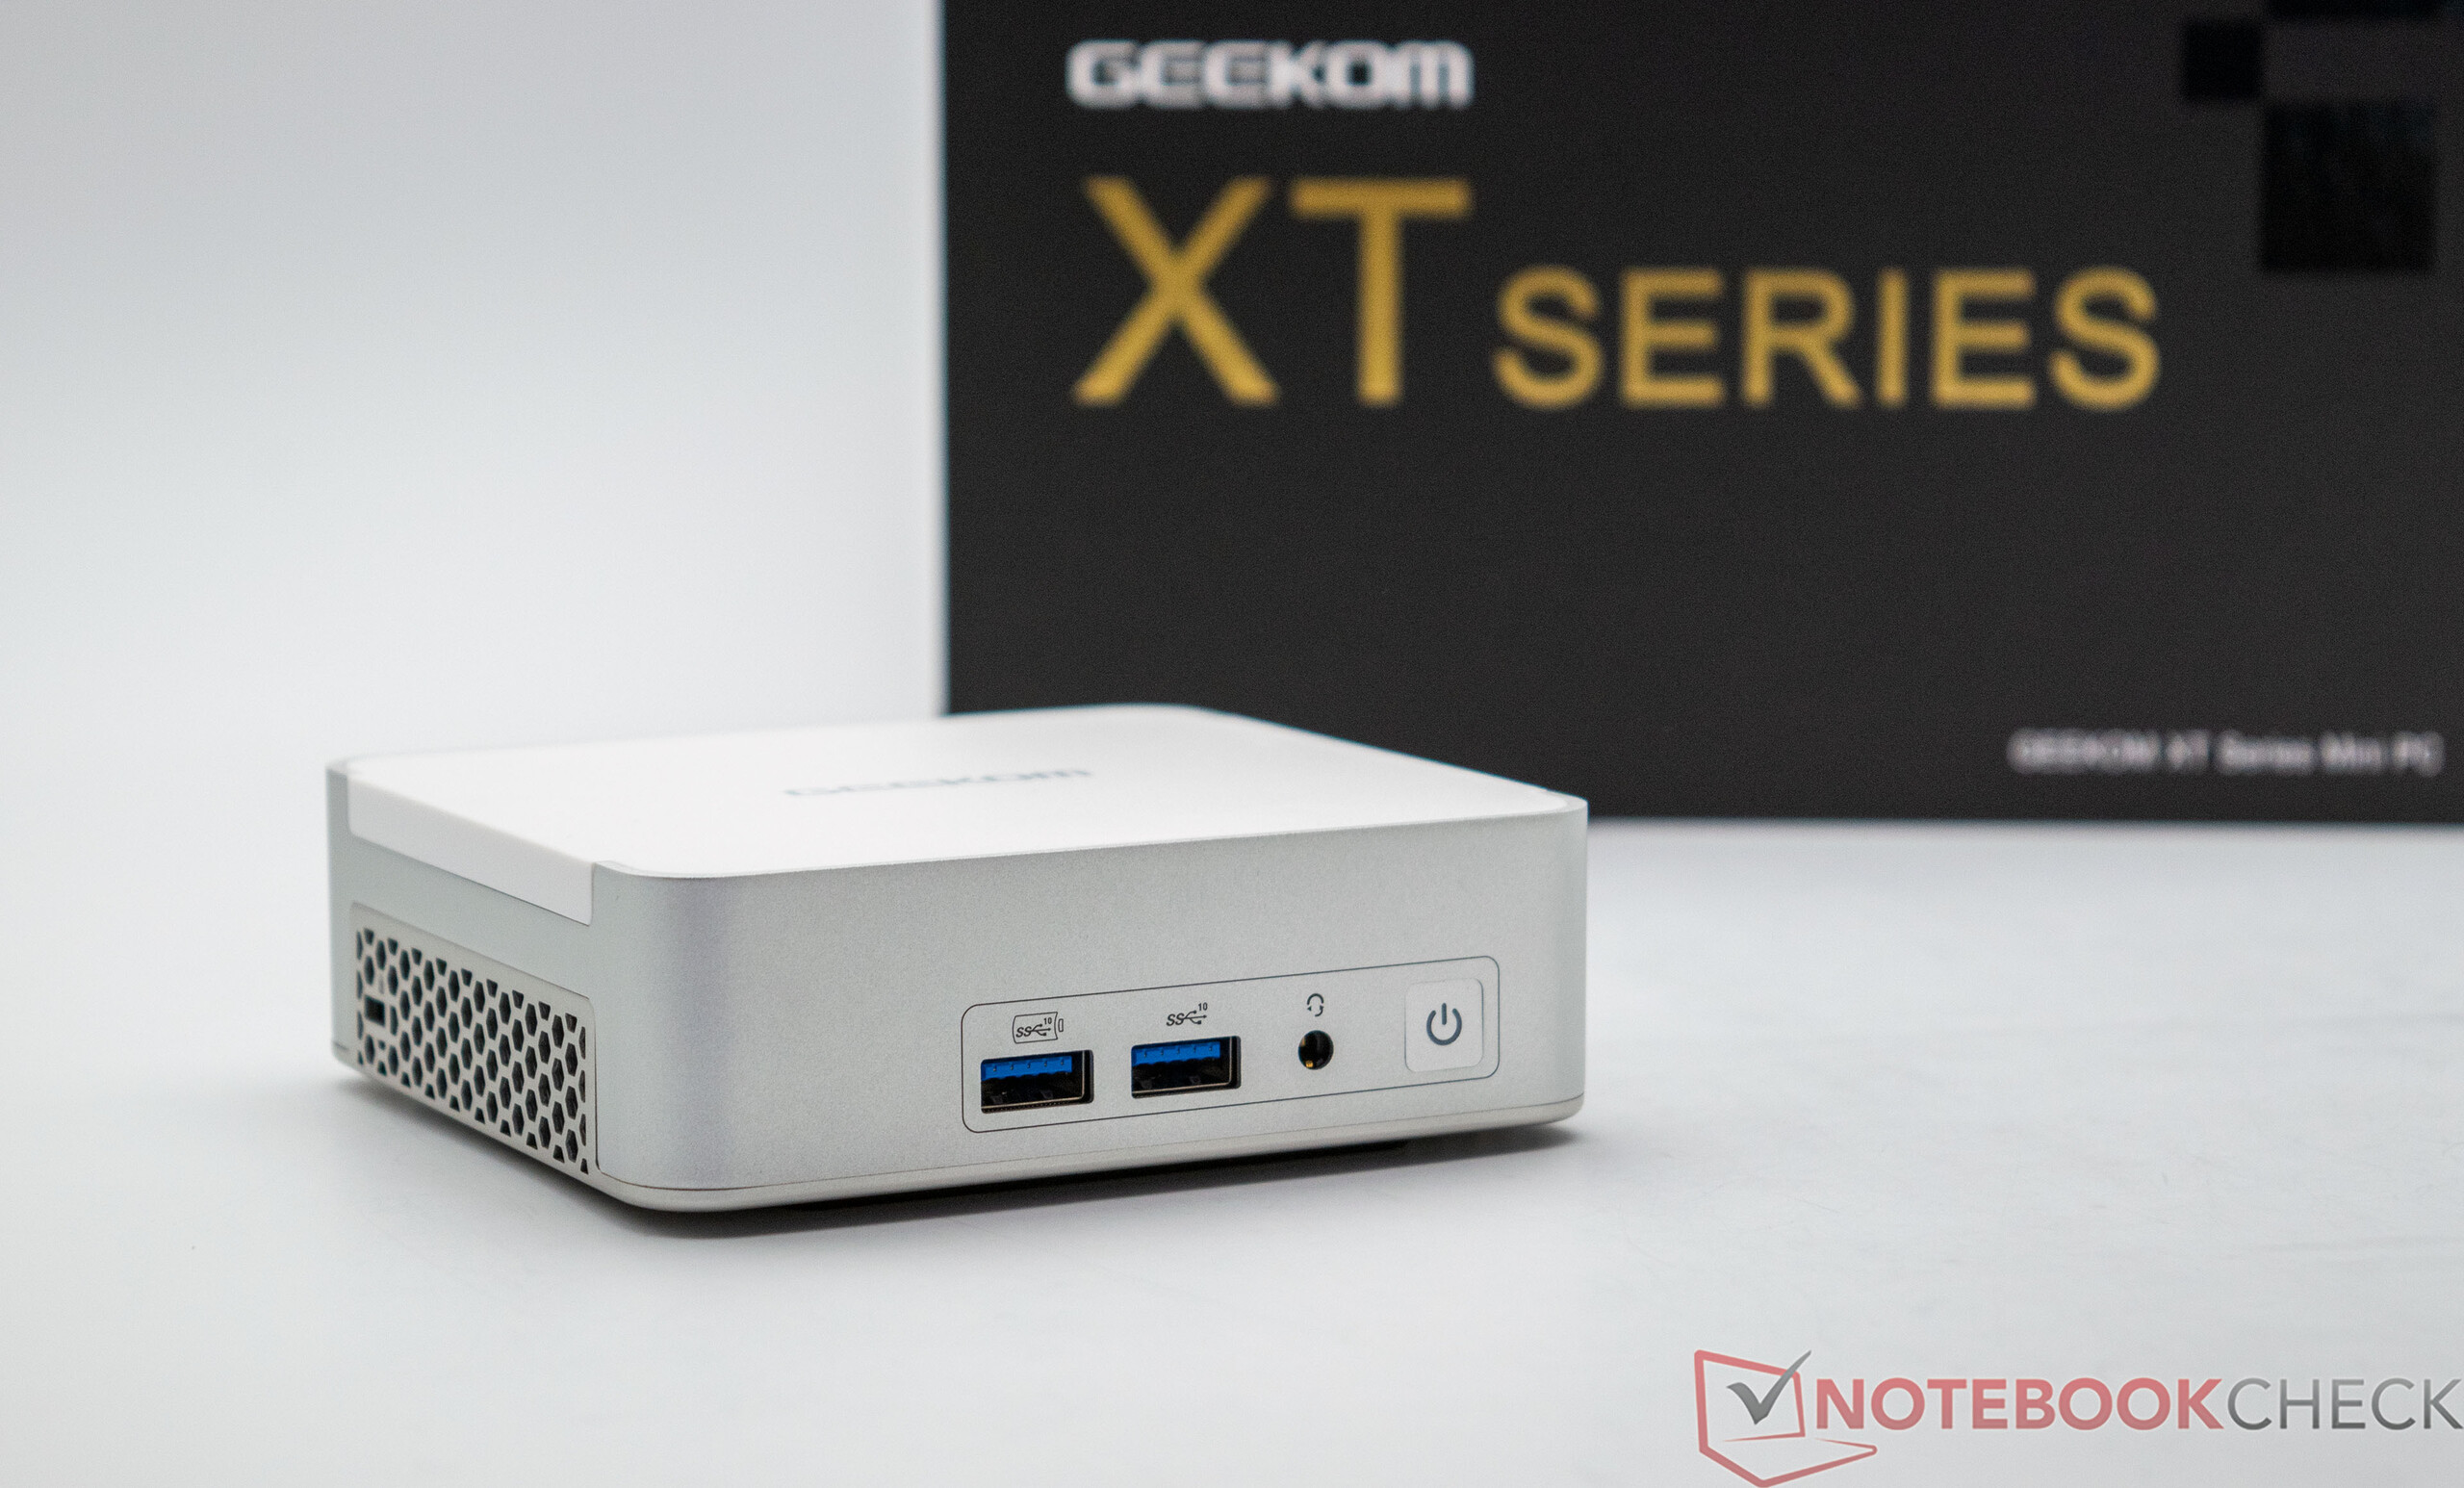
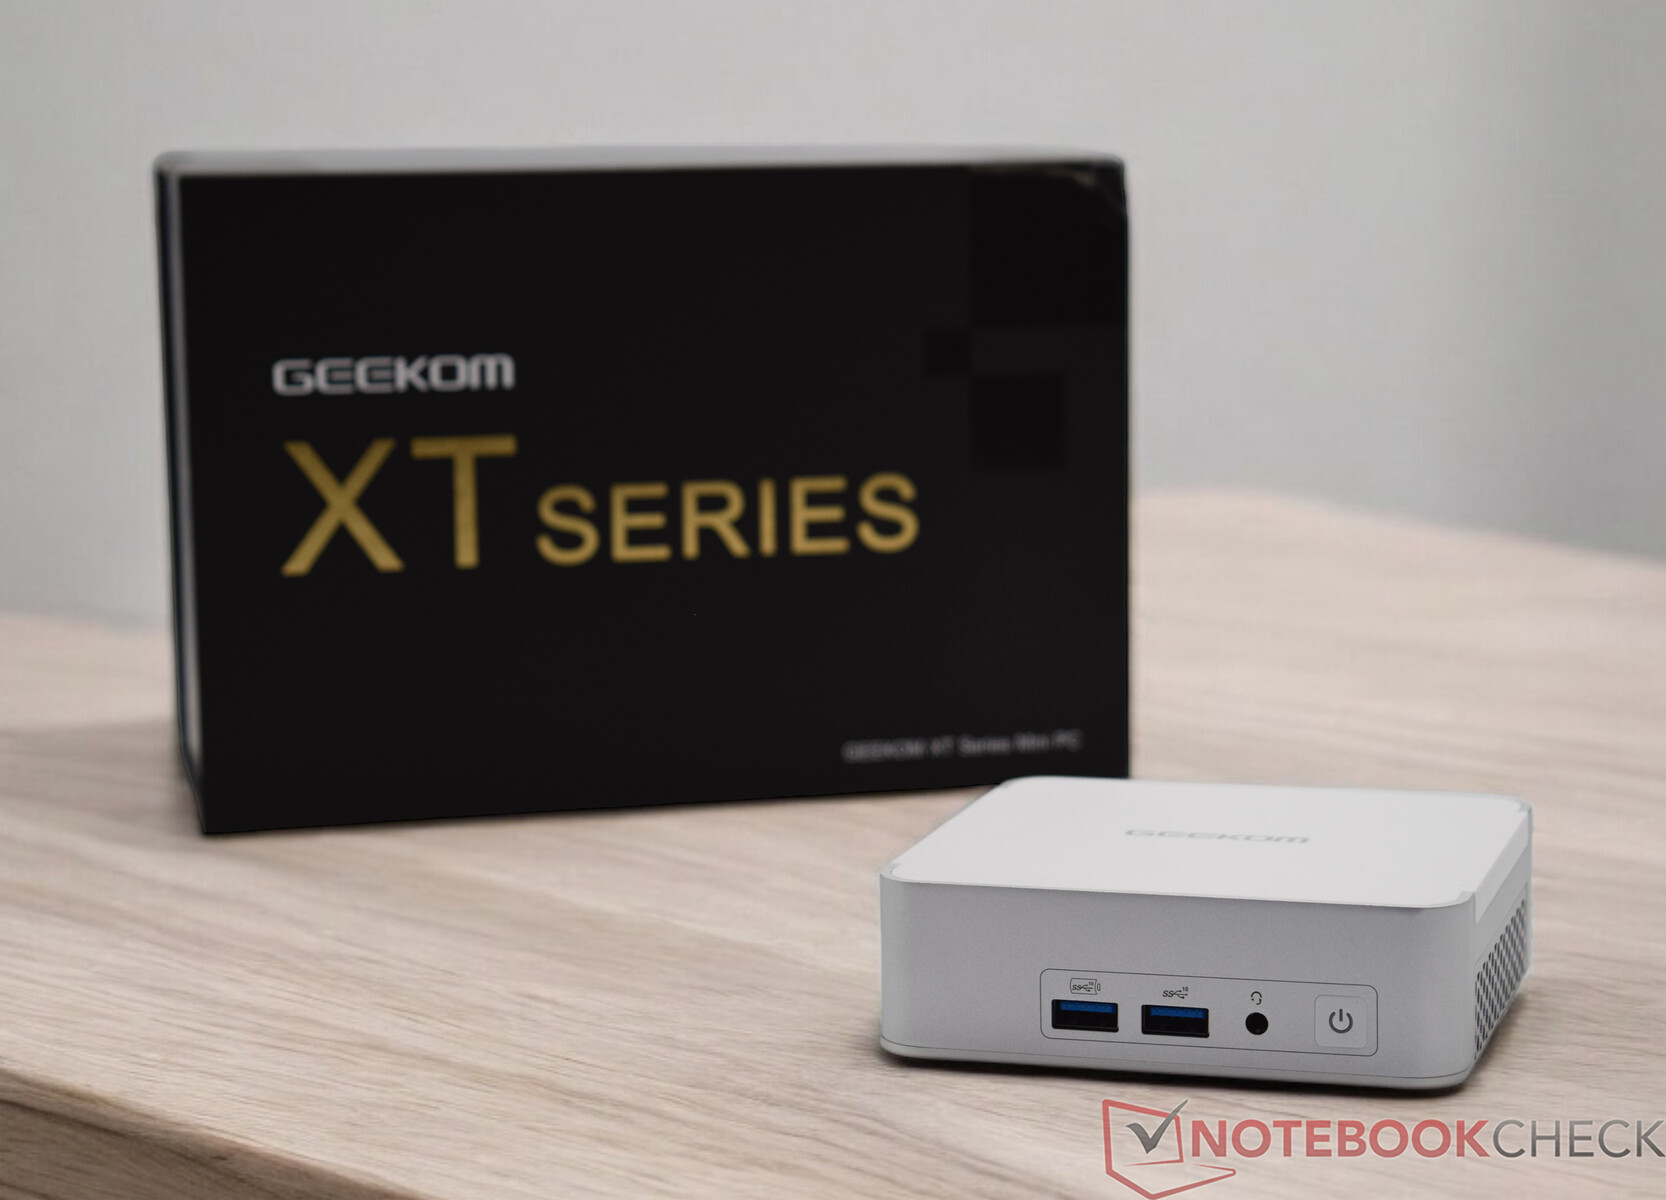
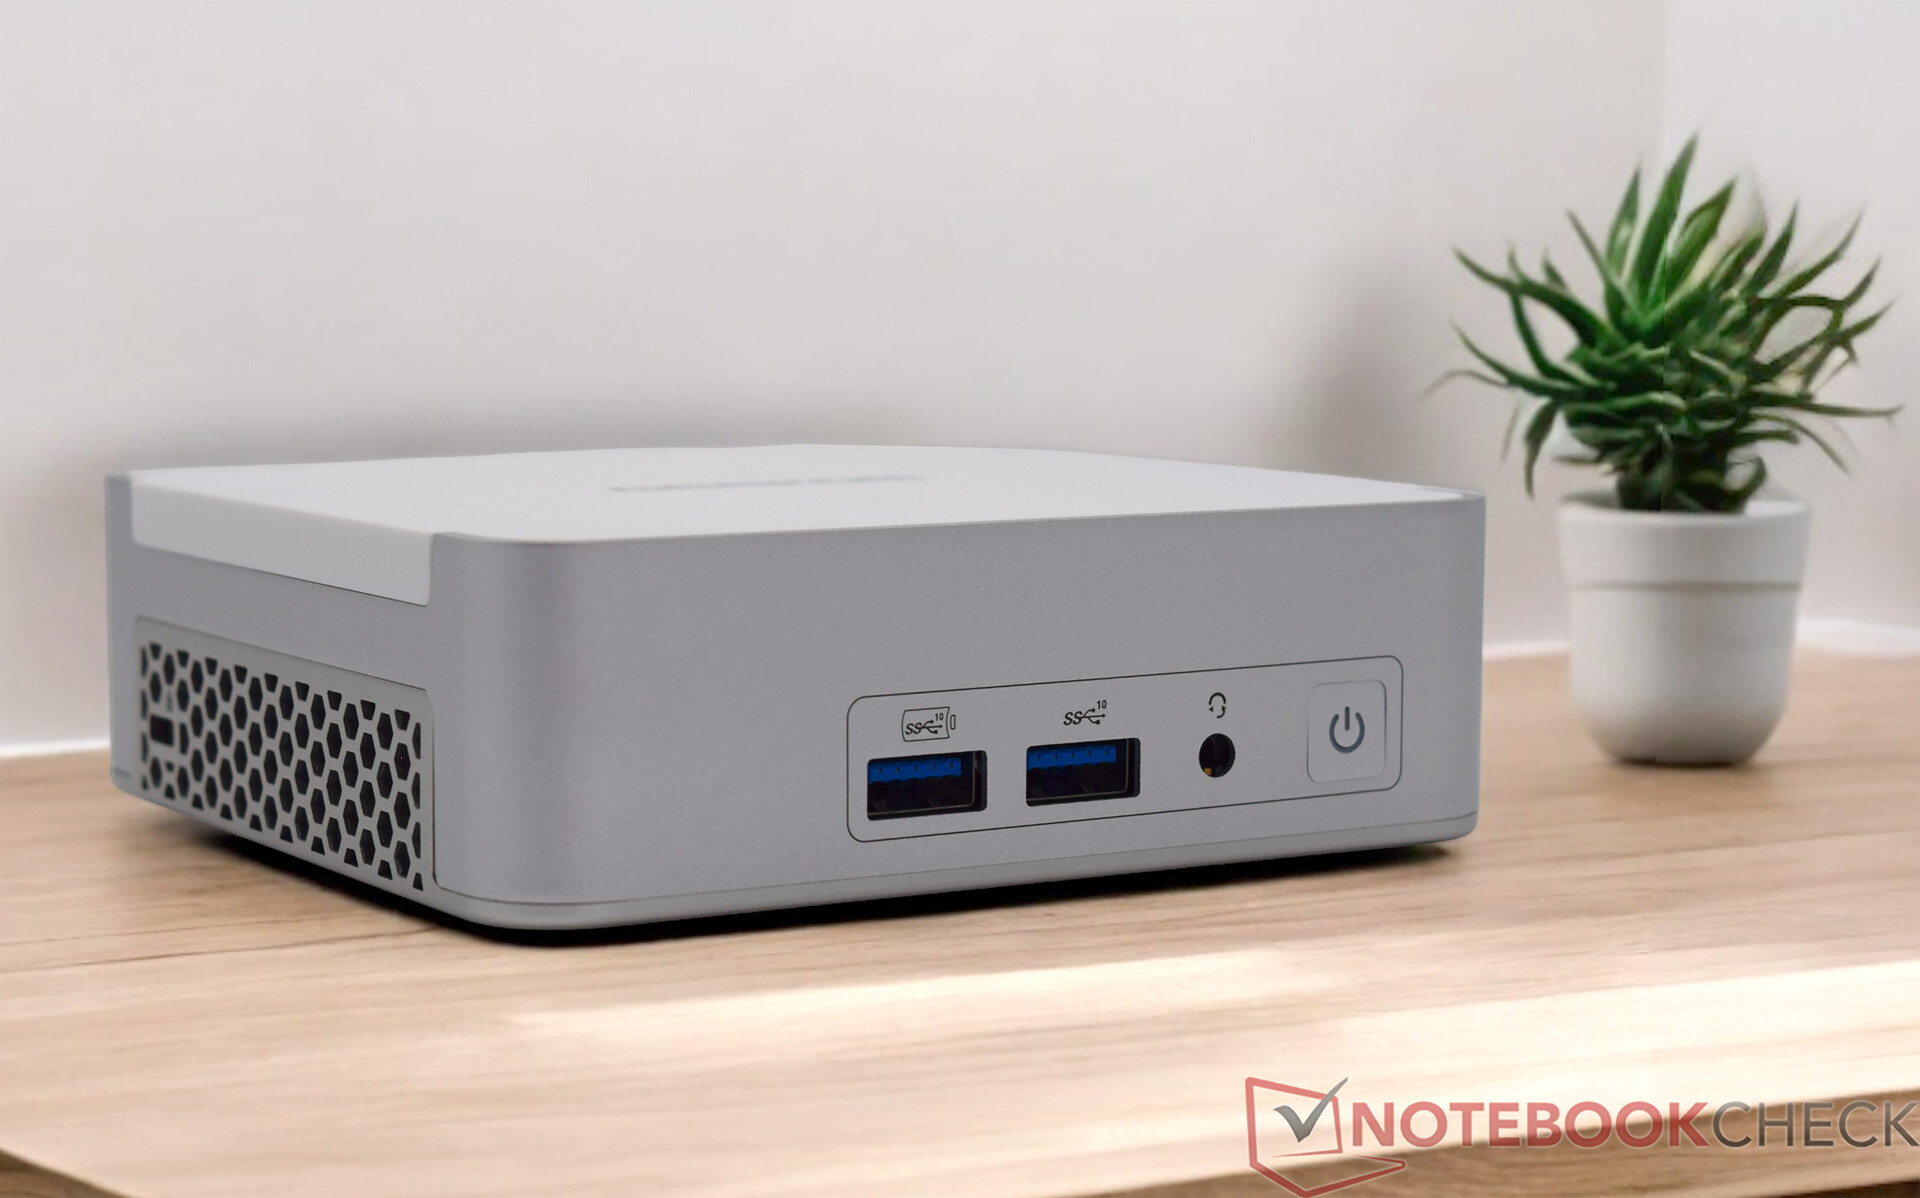
Caso - Lavorazione perfetta di metallo e plastica
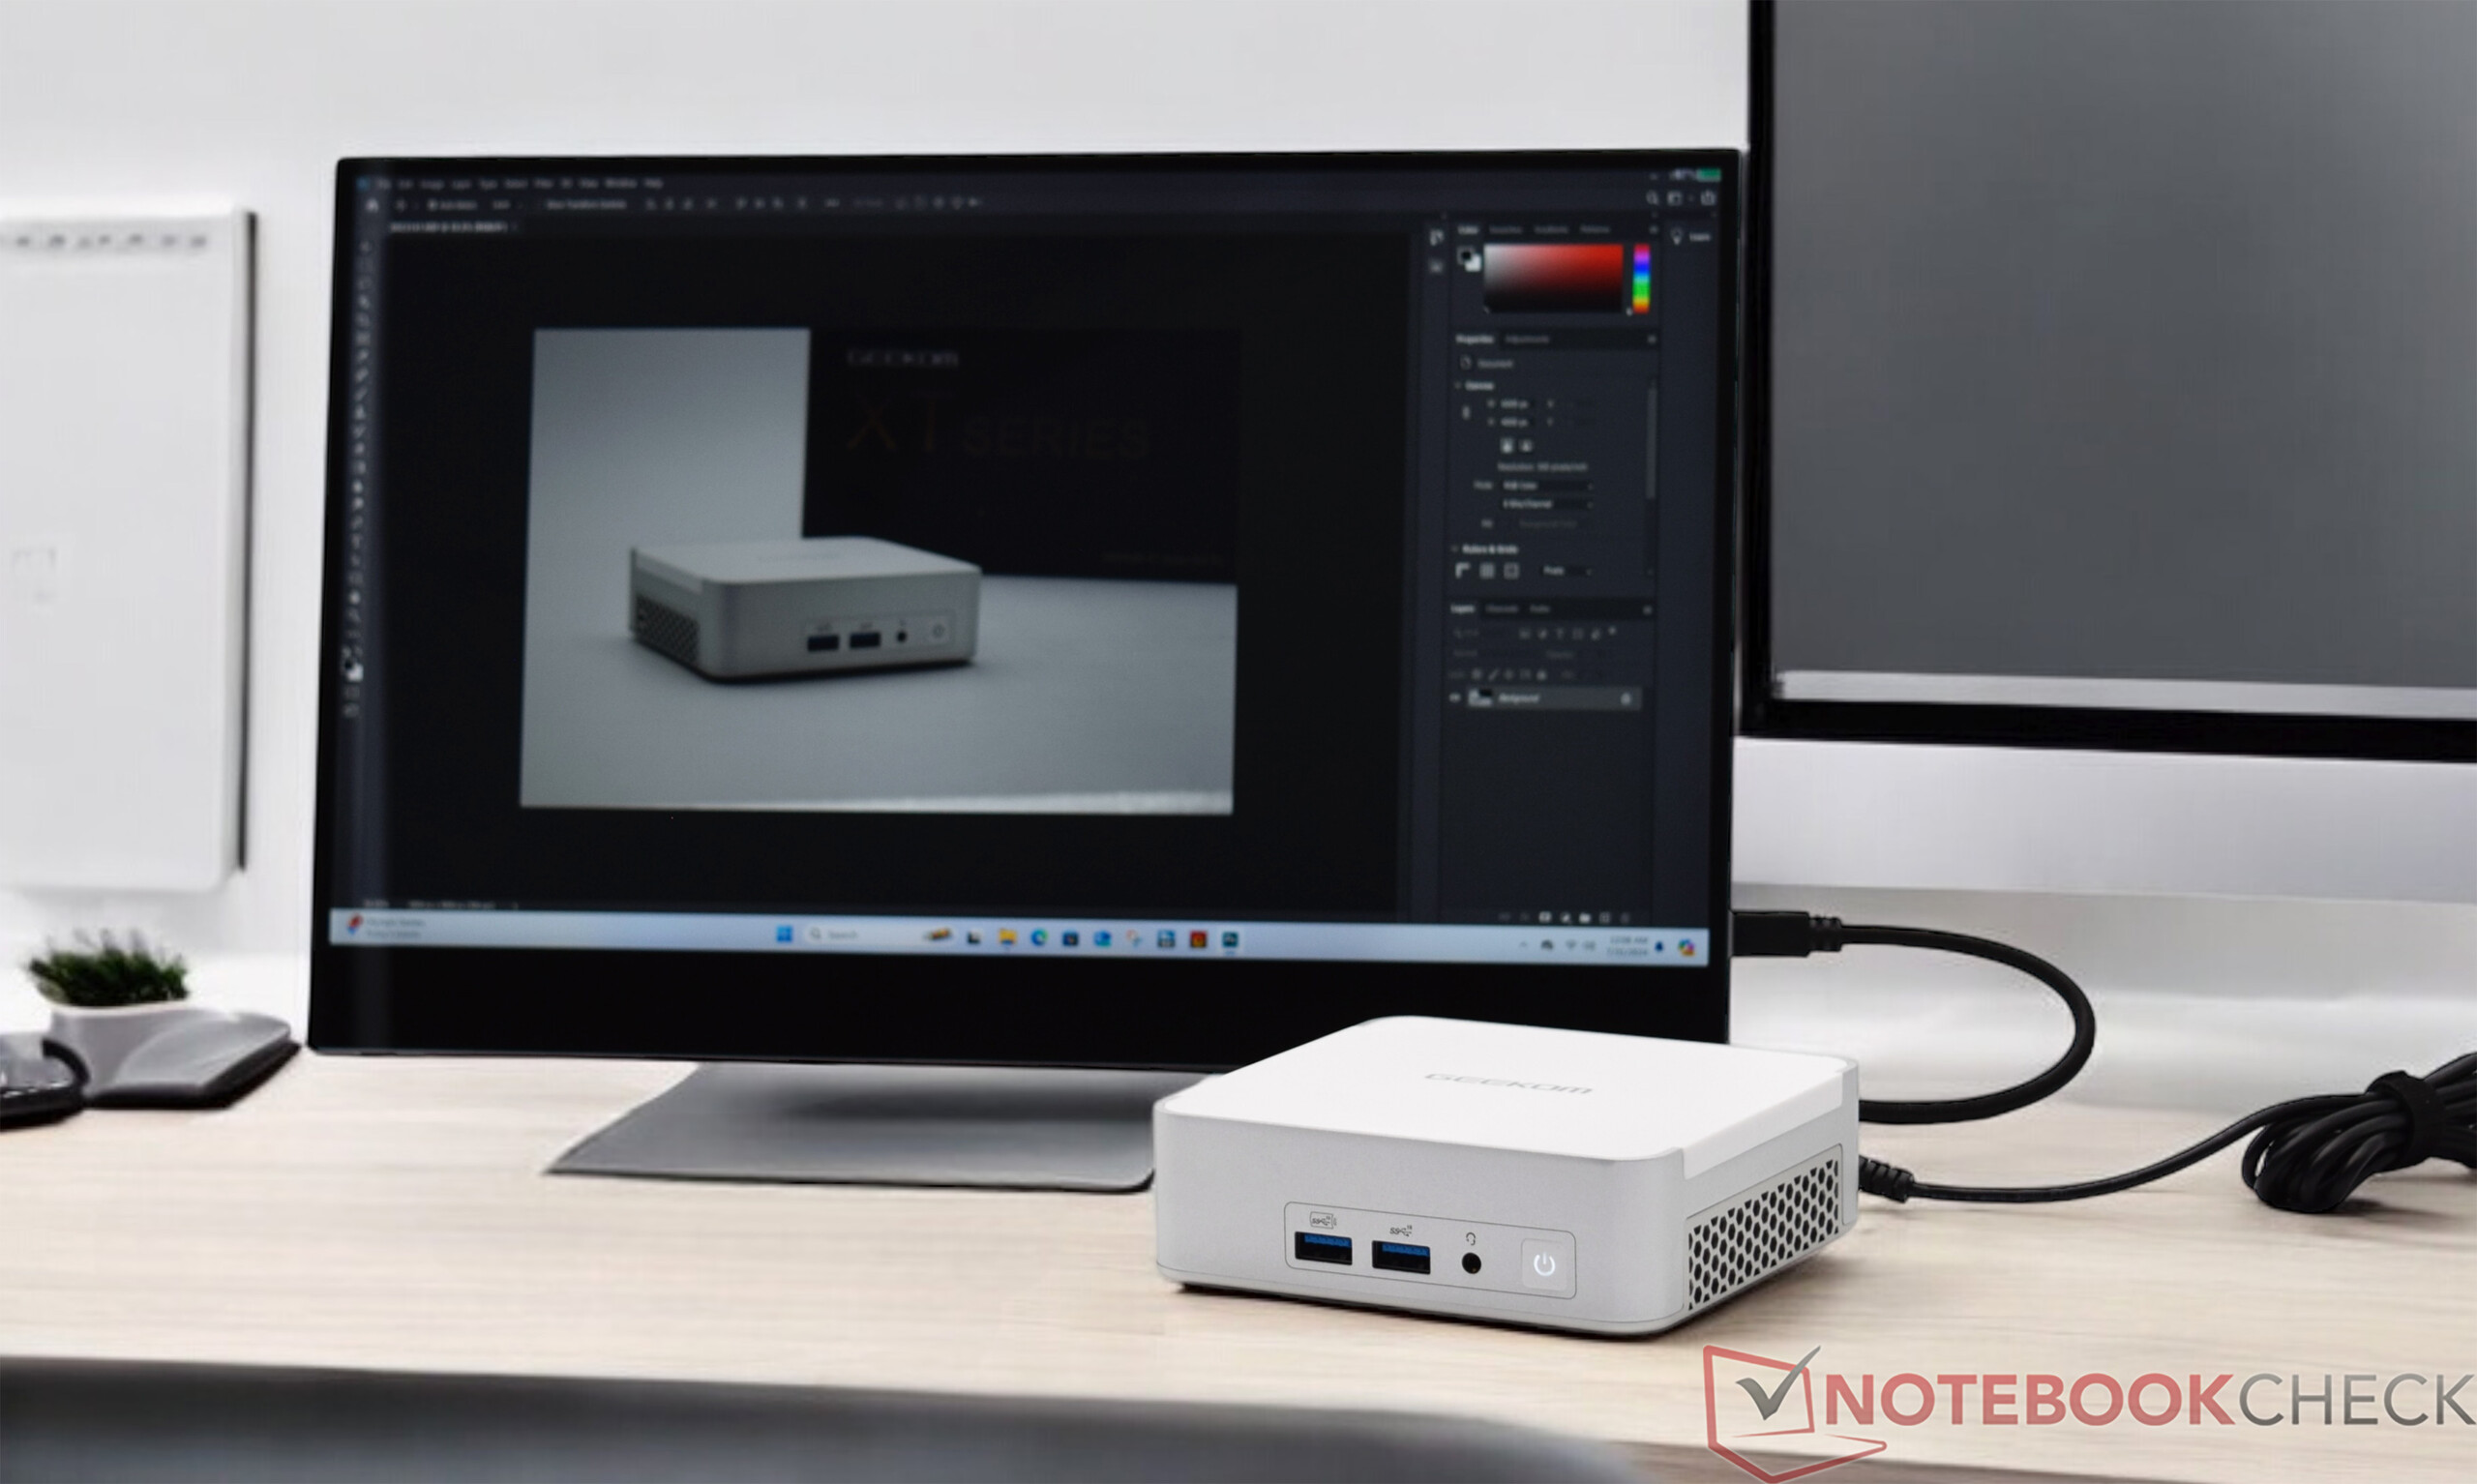
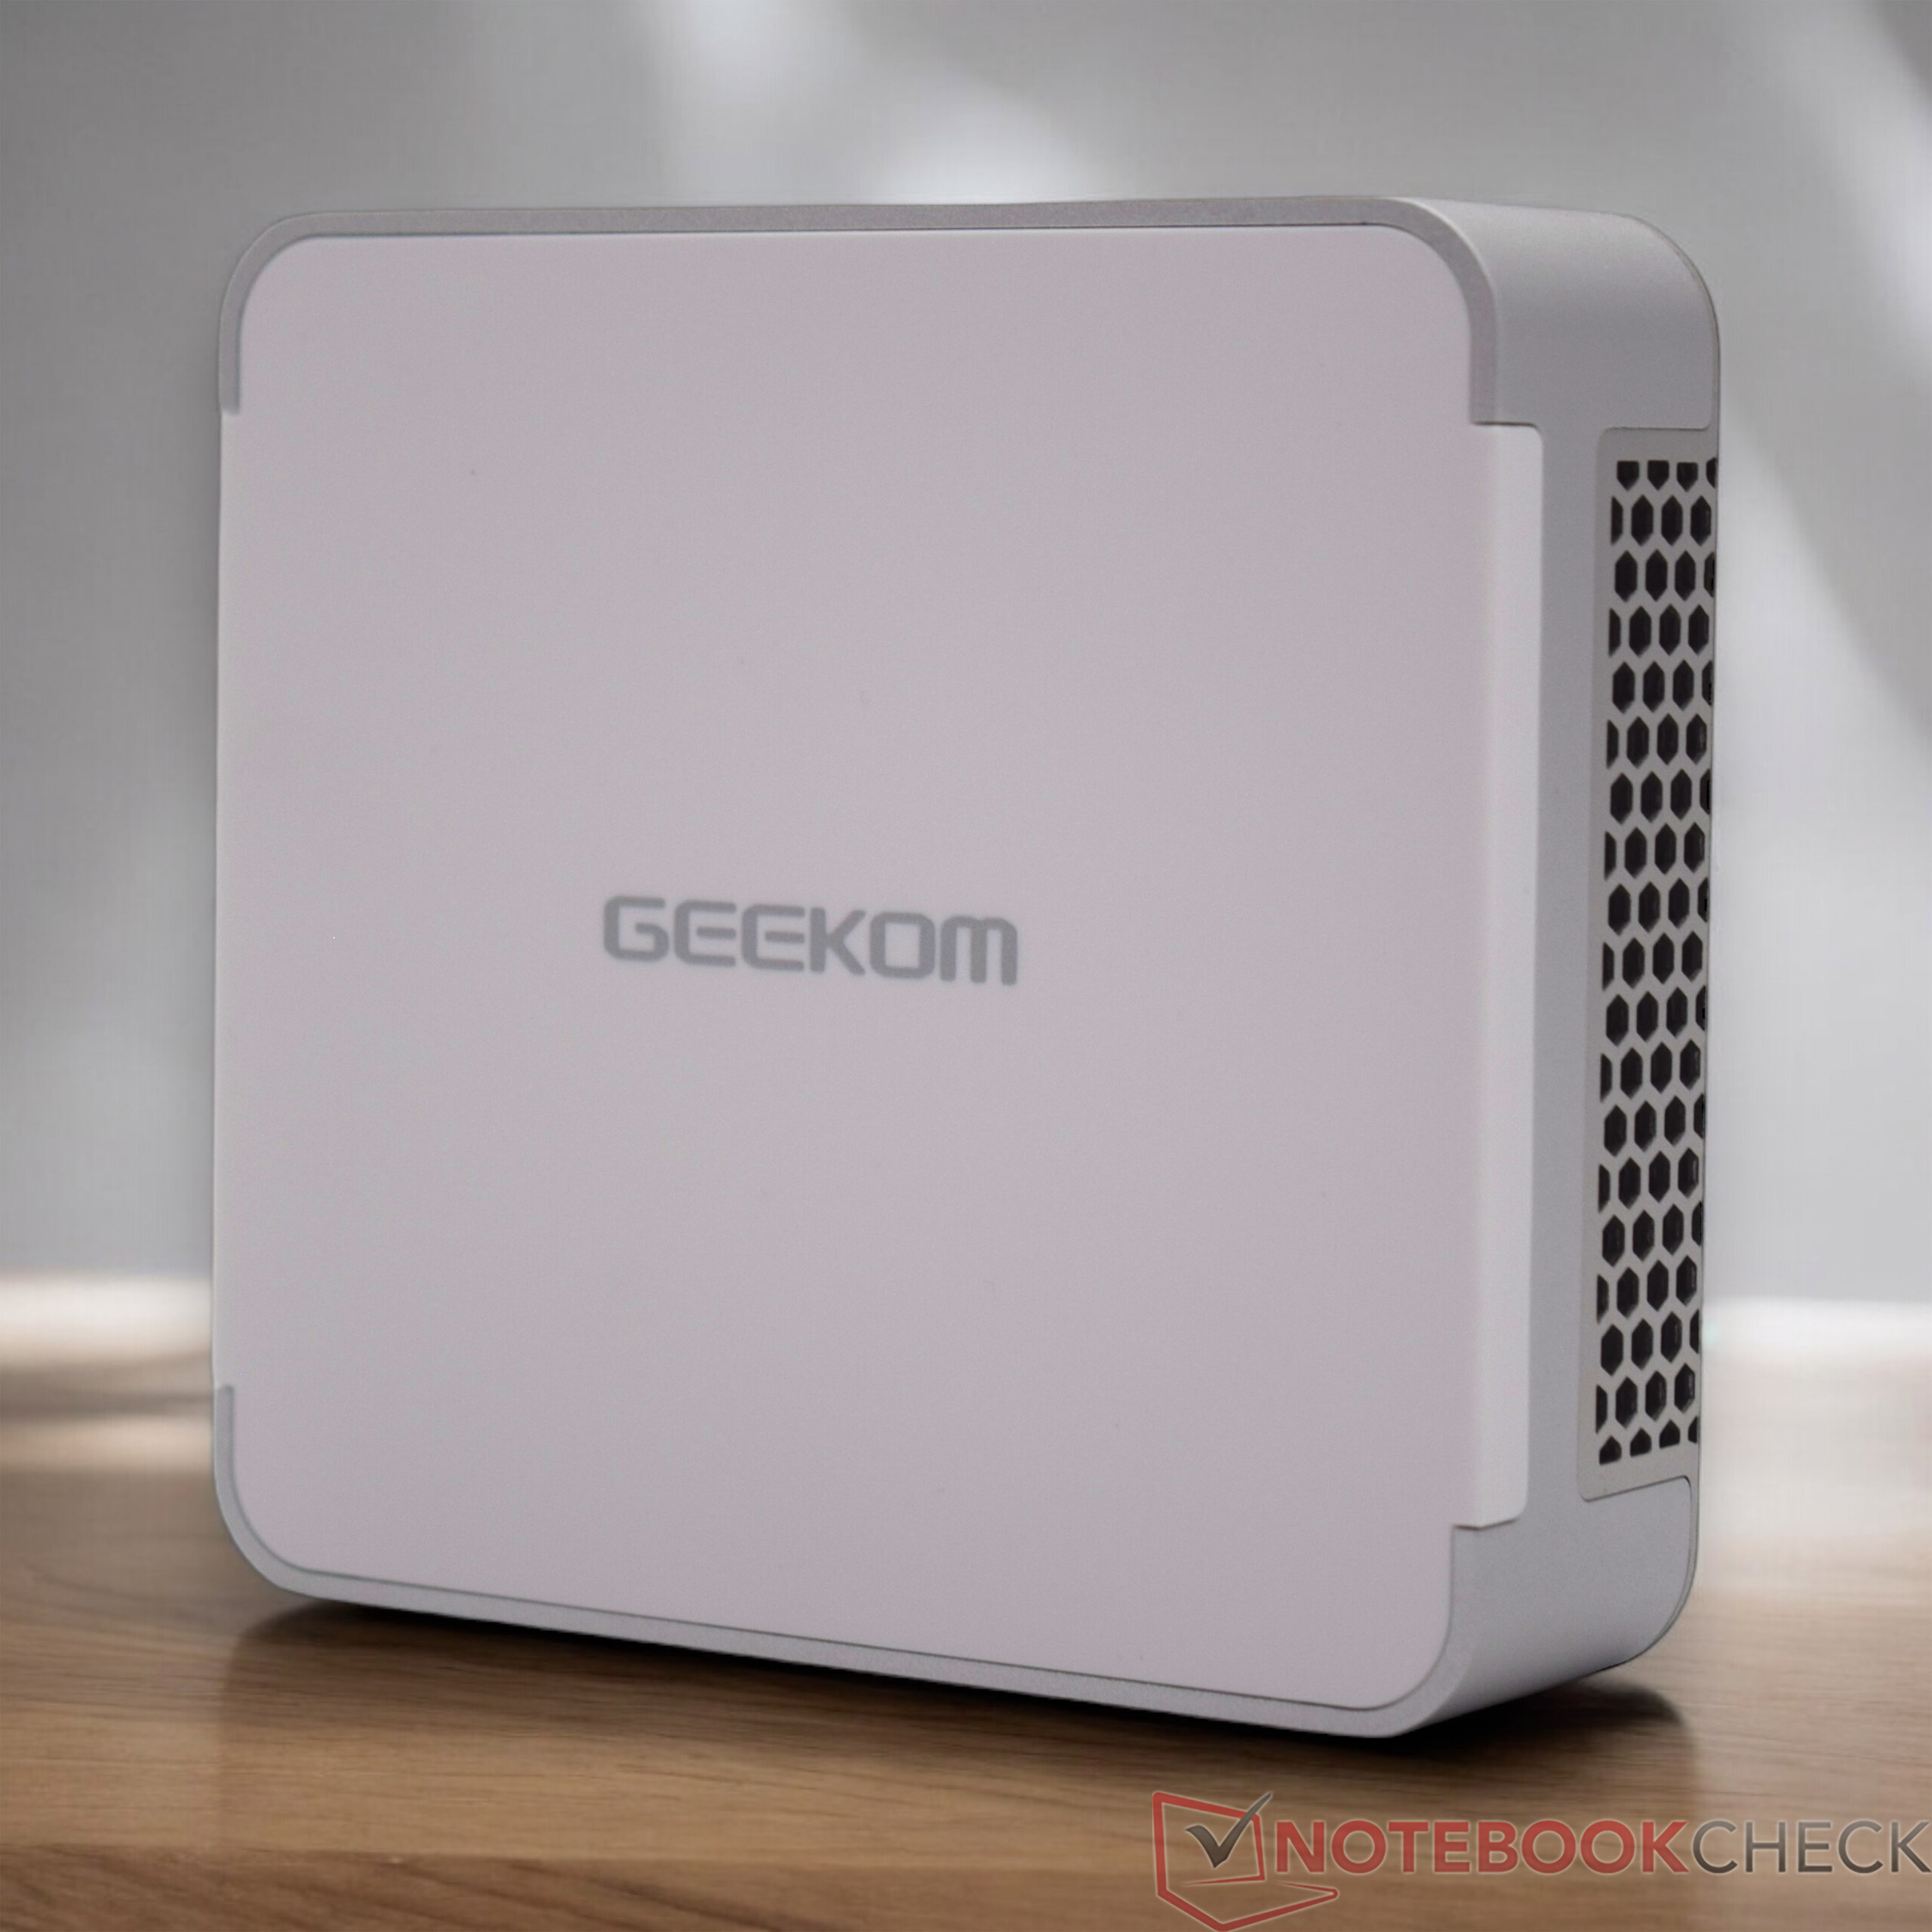
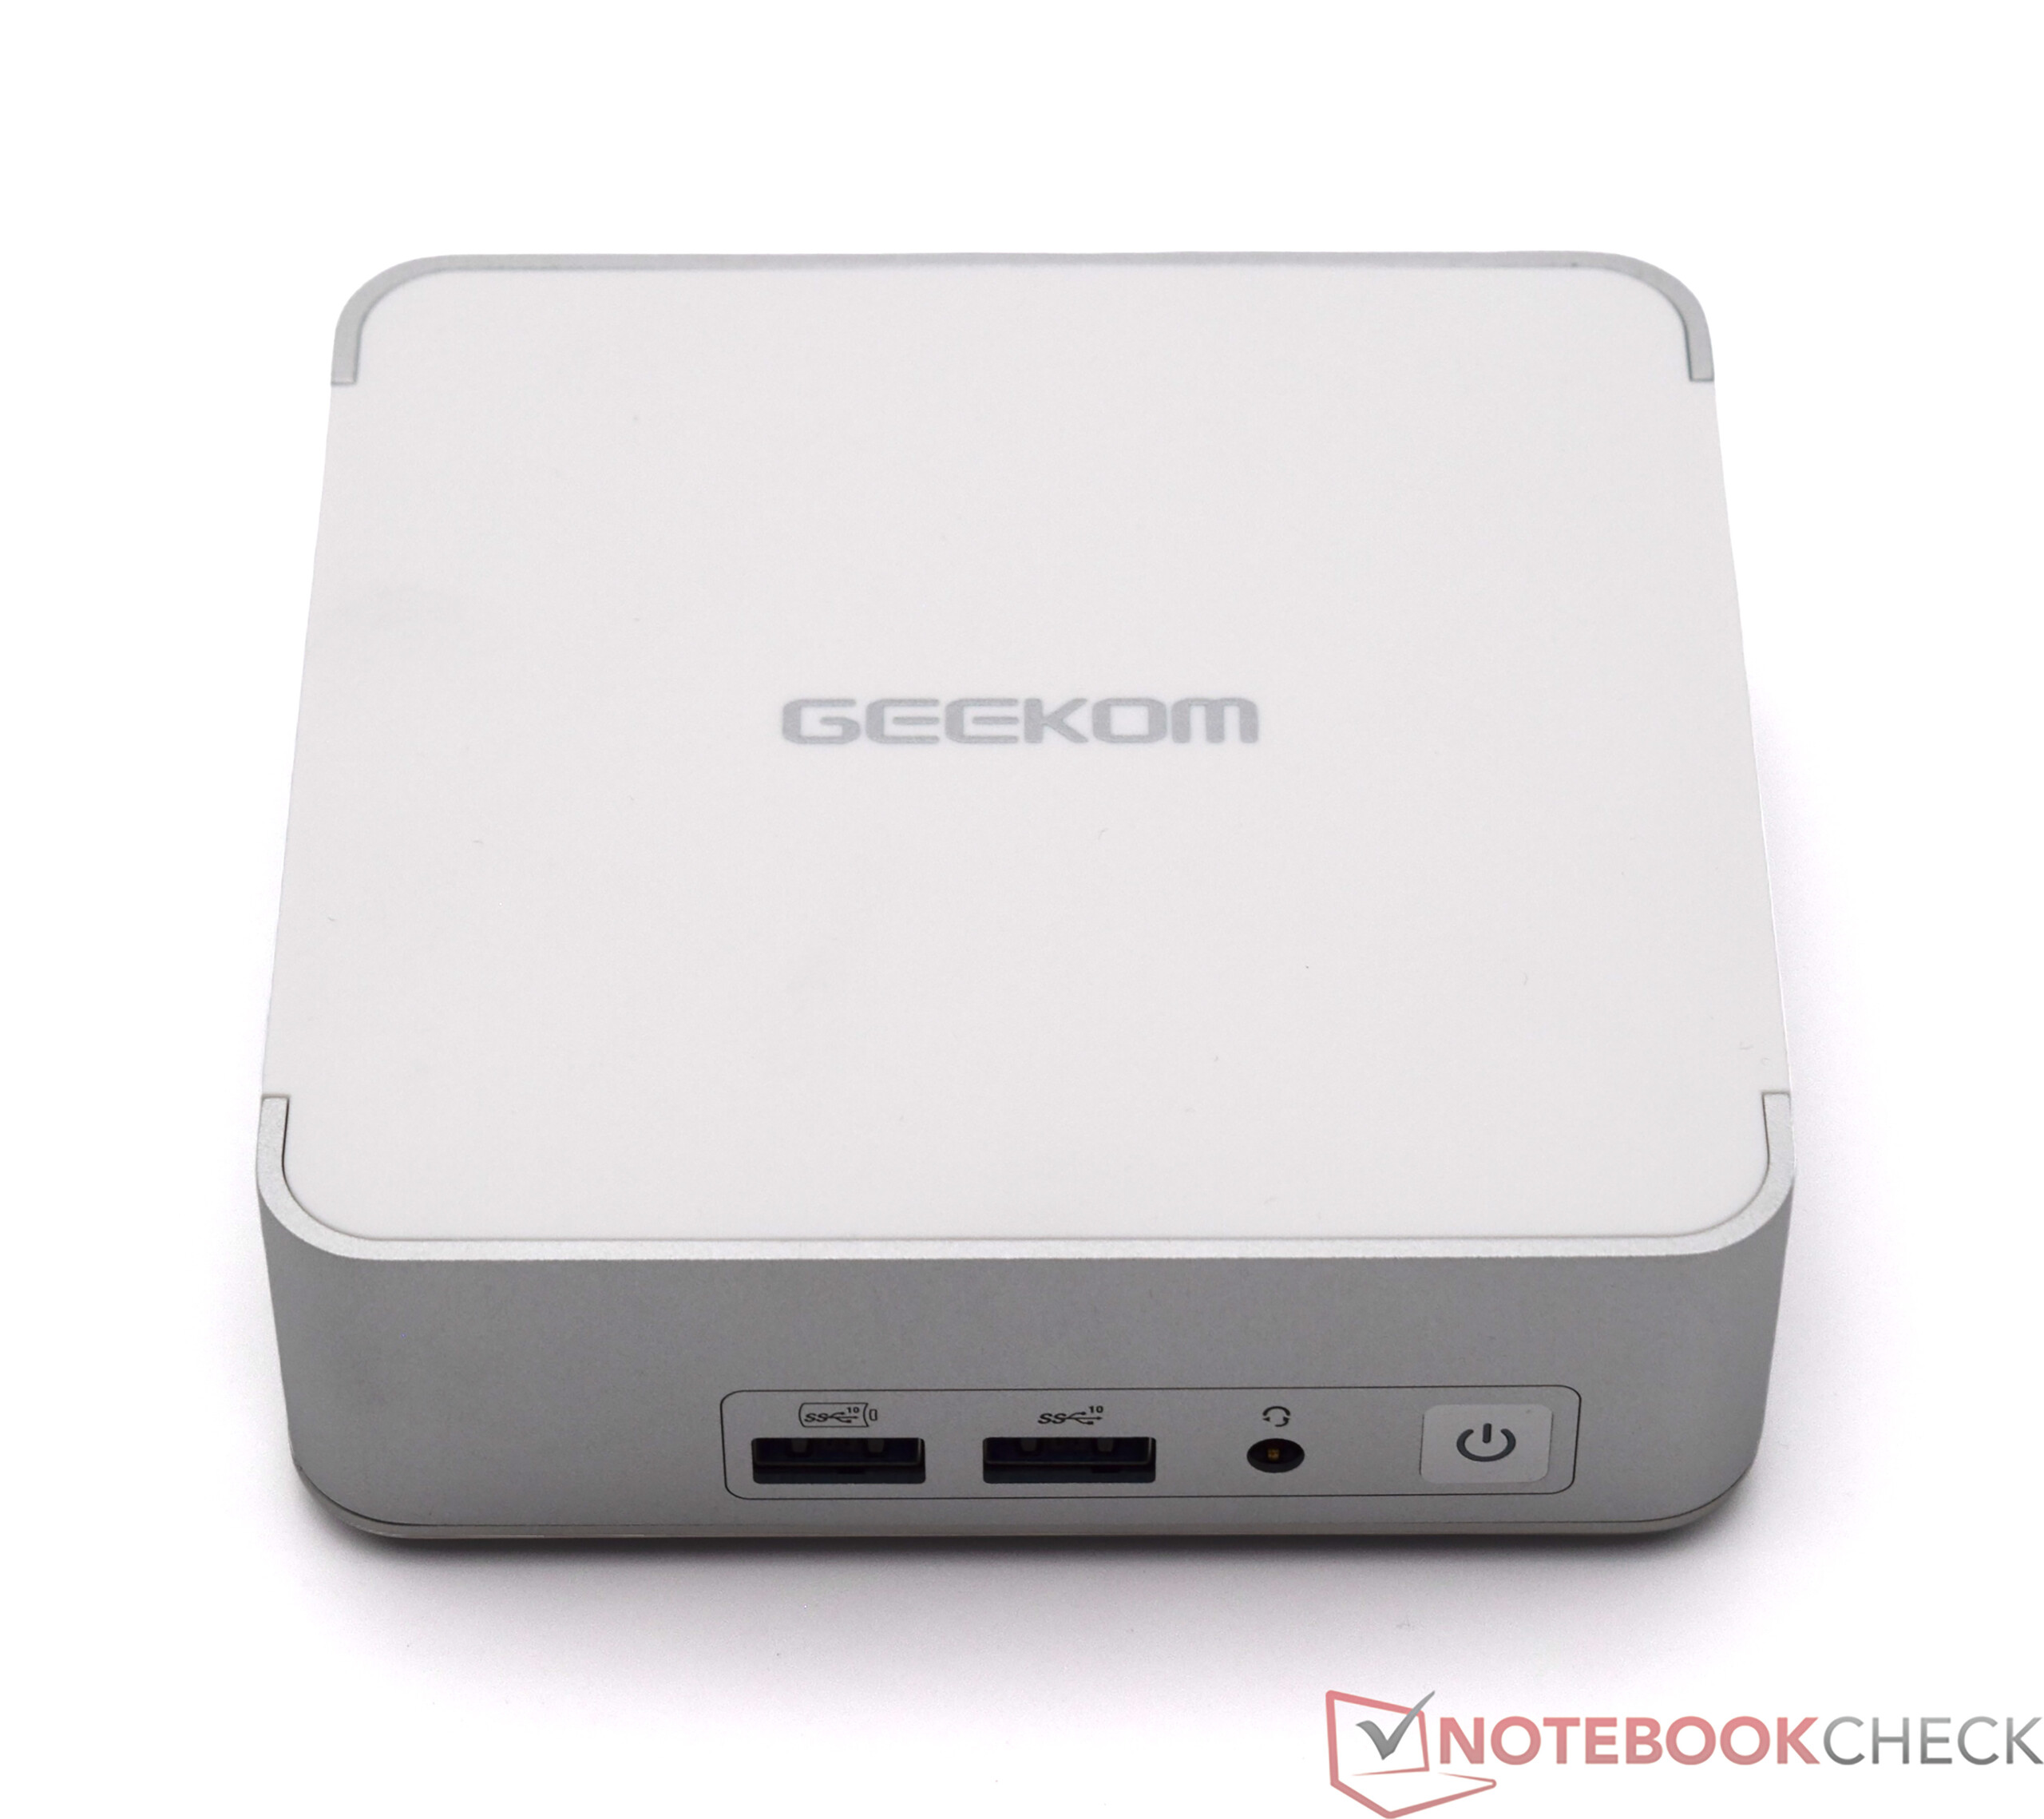
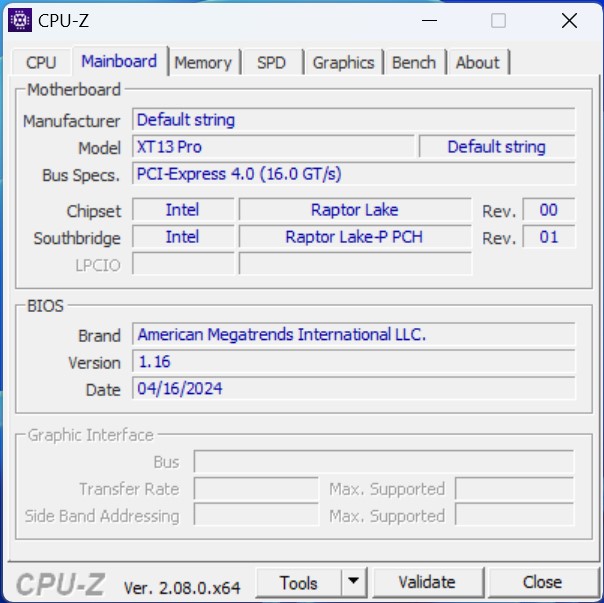
L'alloggiamento del Geekom XT13 Pro è familiare, è stato utilizzato per il Geekom XT12 Pro. Non si può negare nemmeno una somiglianza con il kit Intel NUC 13 Pro Desk Edition. Fondamentalmente, non c'è nulla di sbagliato nell'aspetto. Il nostro campione di prova è ancora una volta perfettamente rifinito e tutto si incastra a meraviglia. Tuttavia, ci sarebbe piaciuto vedere un nuovo involucro per differenziarlo leggermente dalla concorrenza interna. Il mini-PC occupa solo 11,7 x 11,2 centimetri sulla scrivania, il che lo rende uno dei dispositivi più compatti. Il Geekom XT13 Pro può anche essere collegato direttamente a un monitor utilizzando il supporto VESA in dotazione.
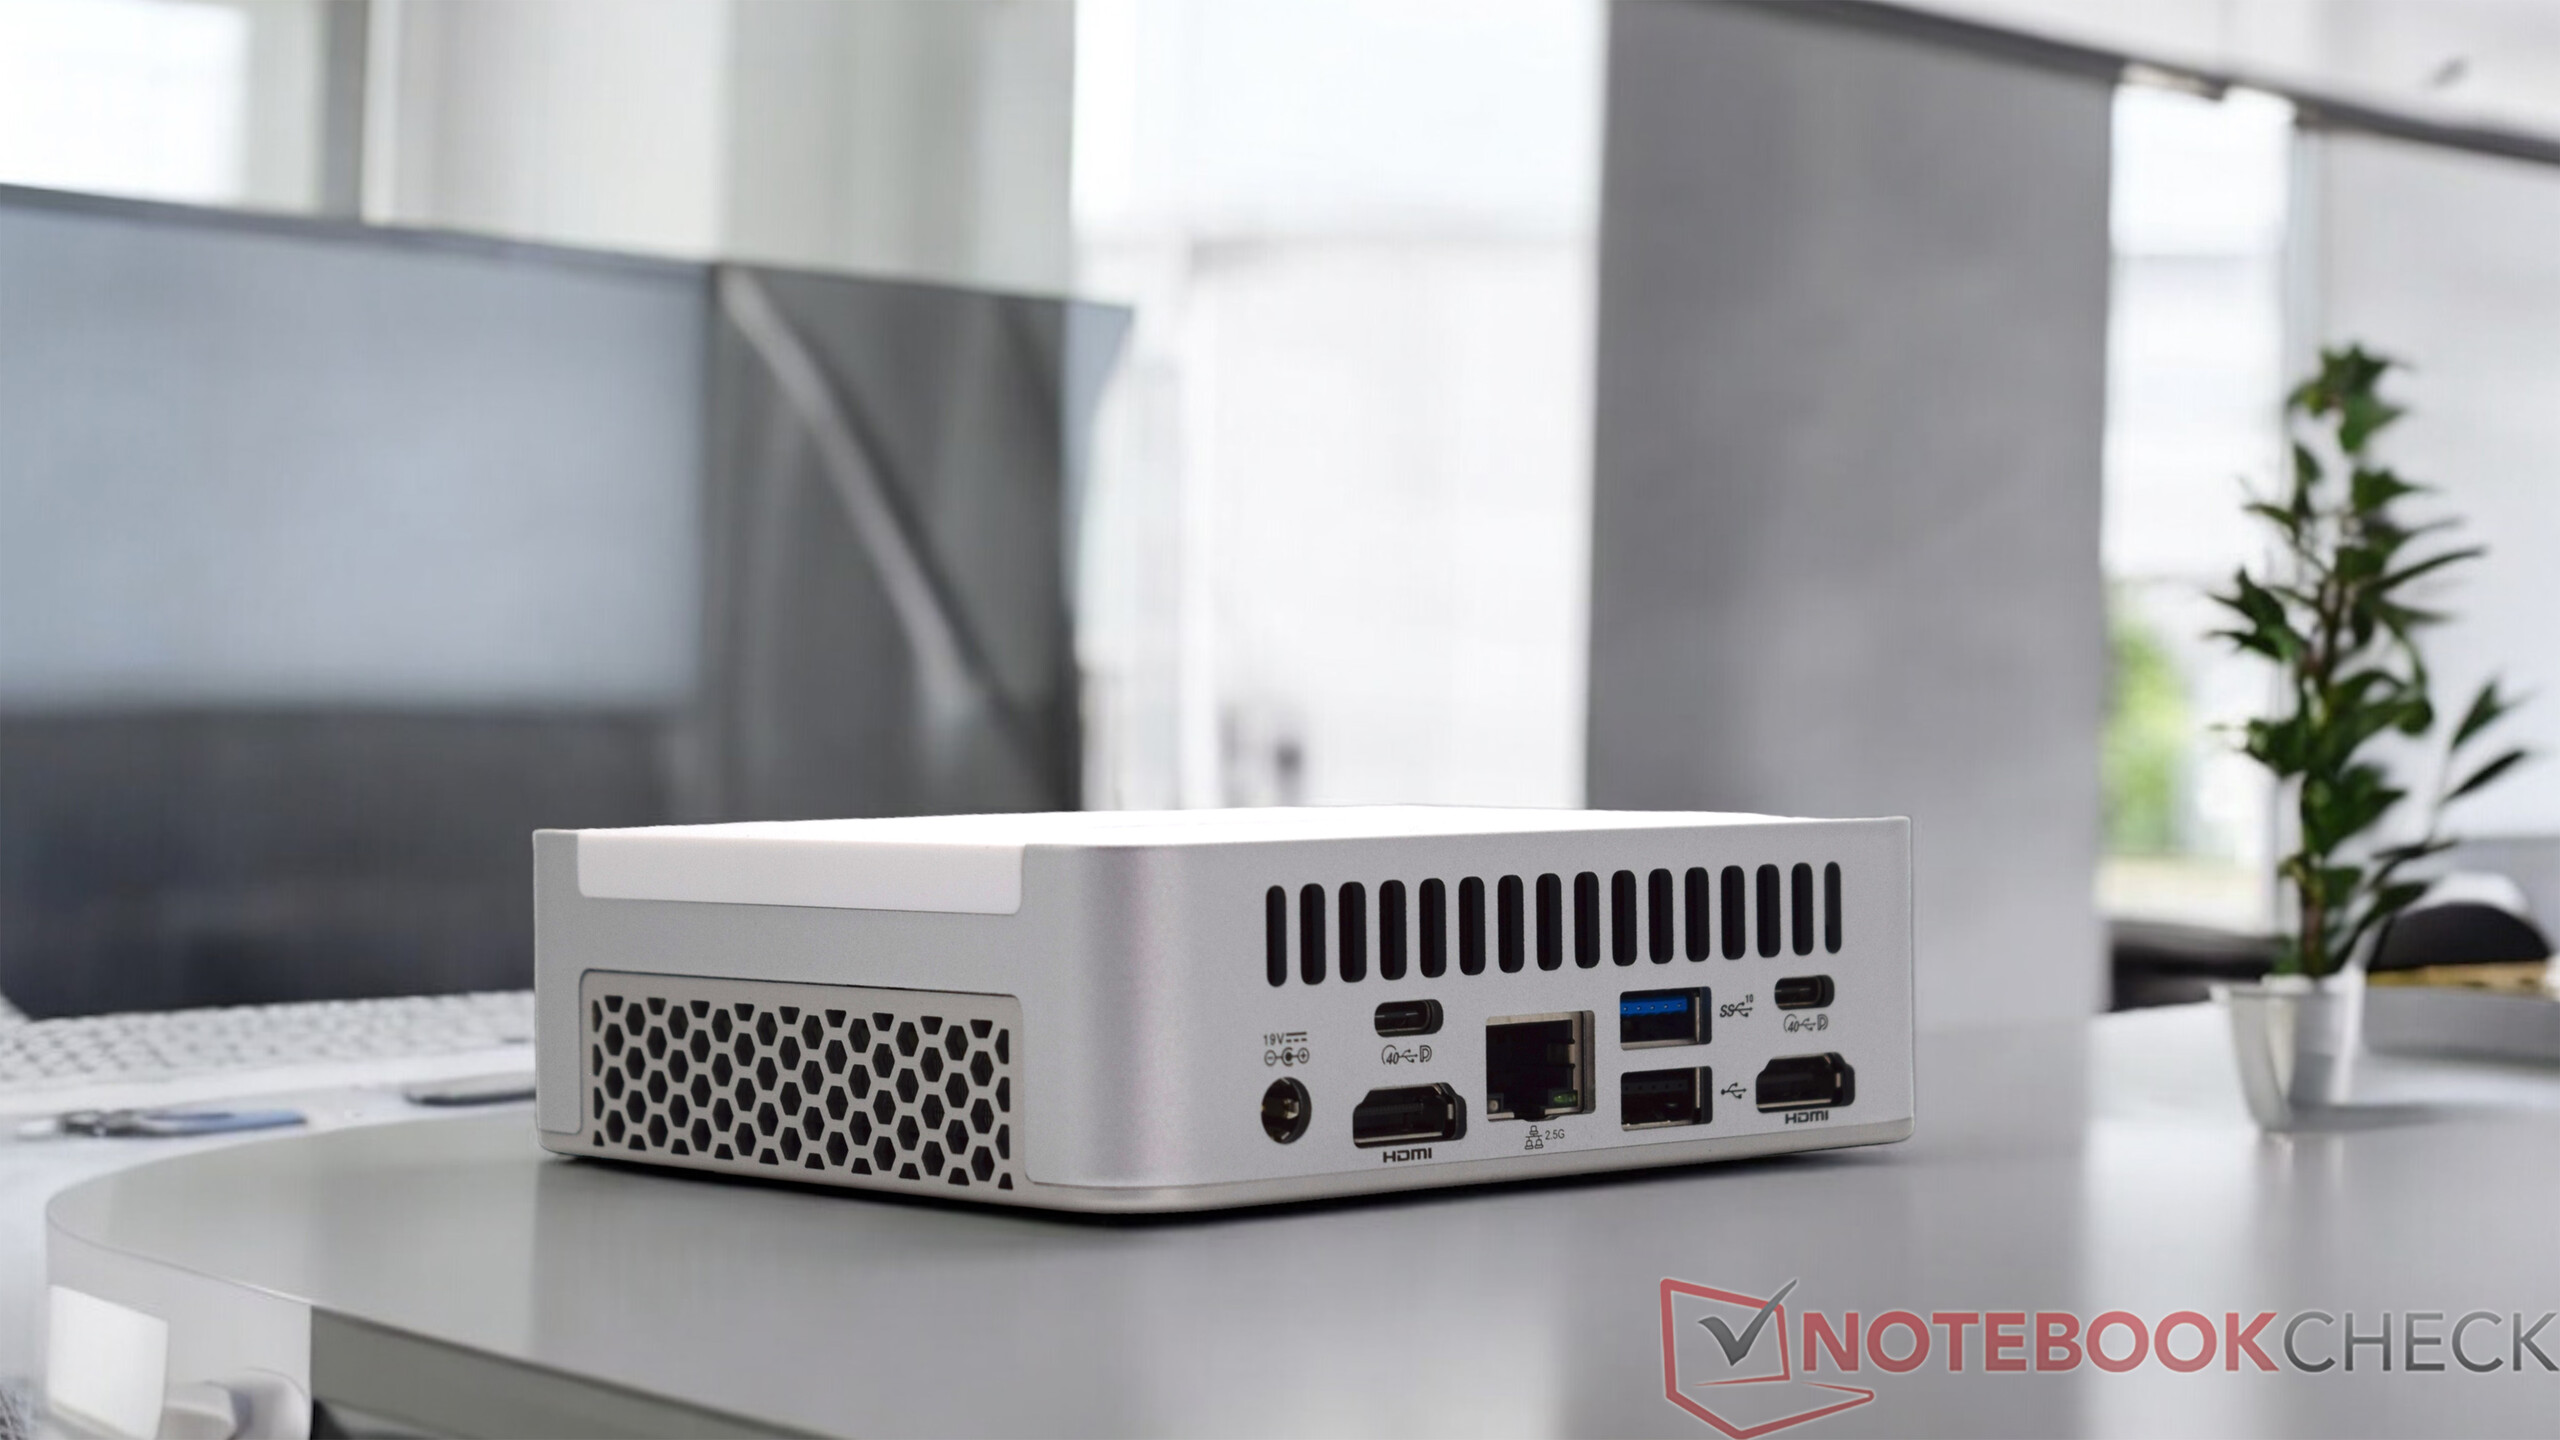
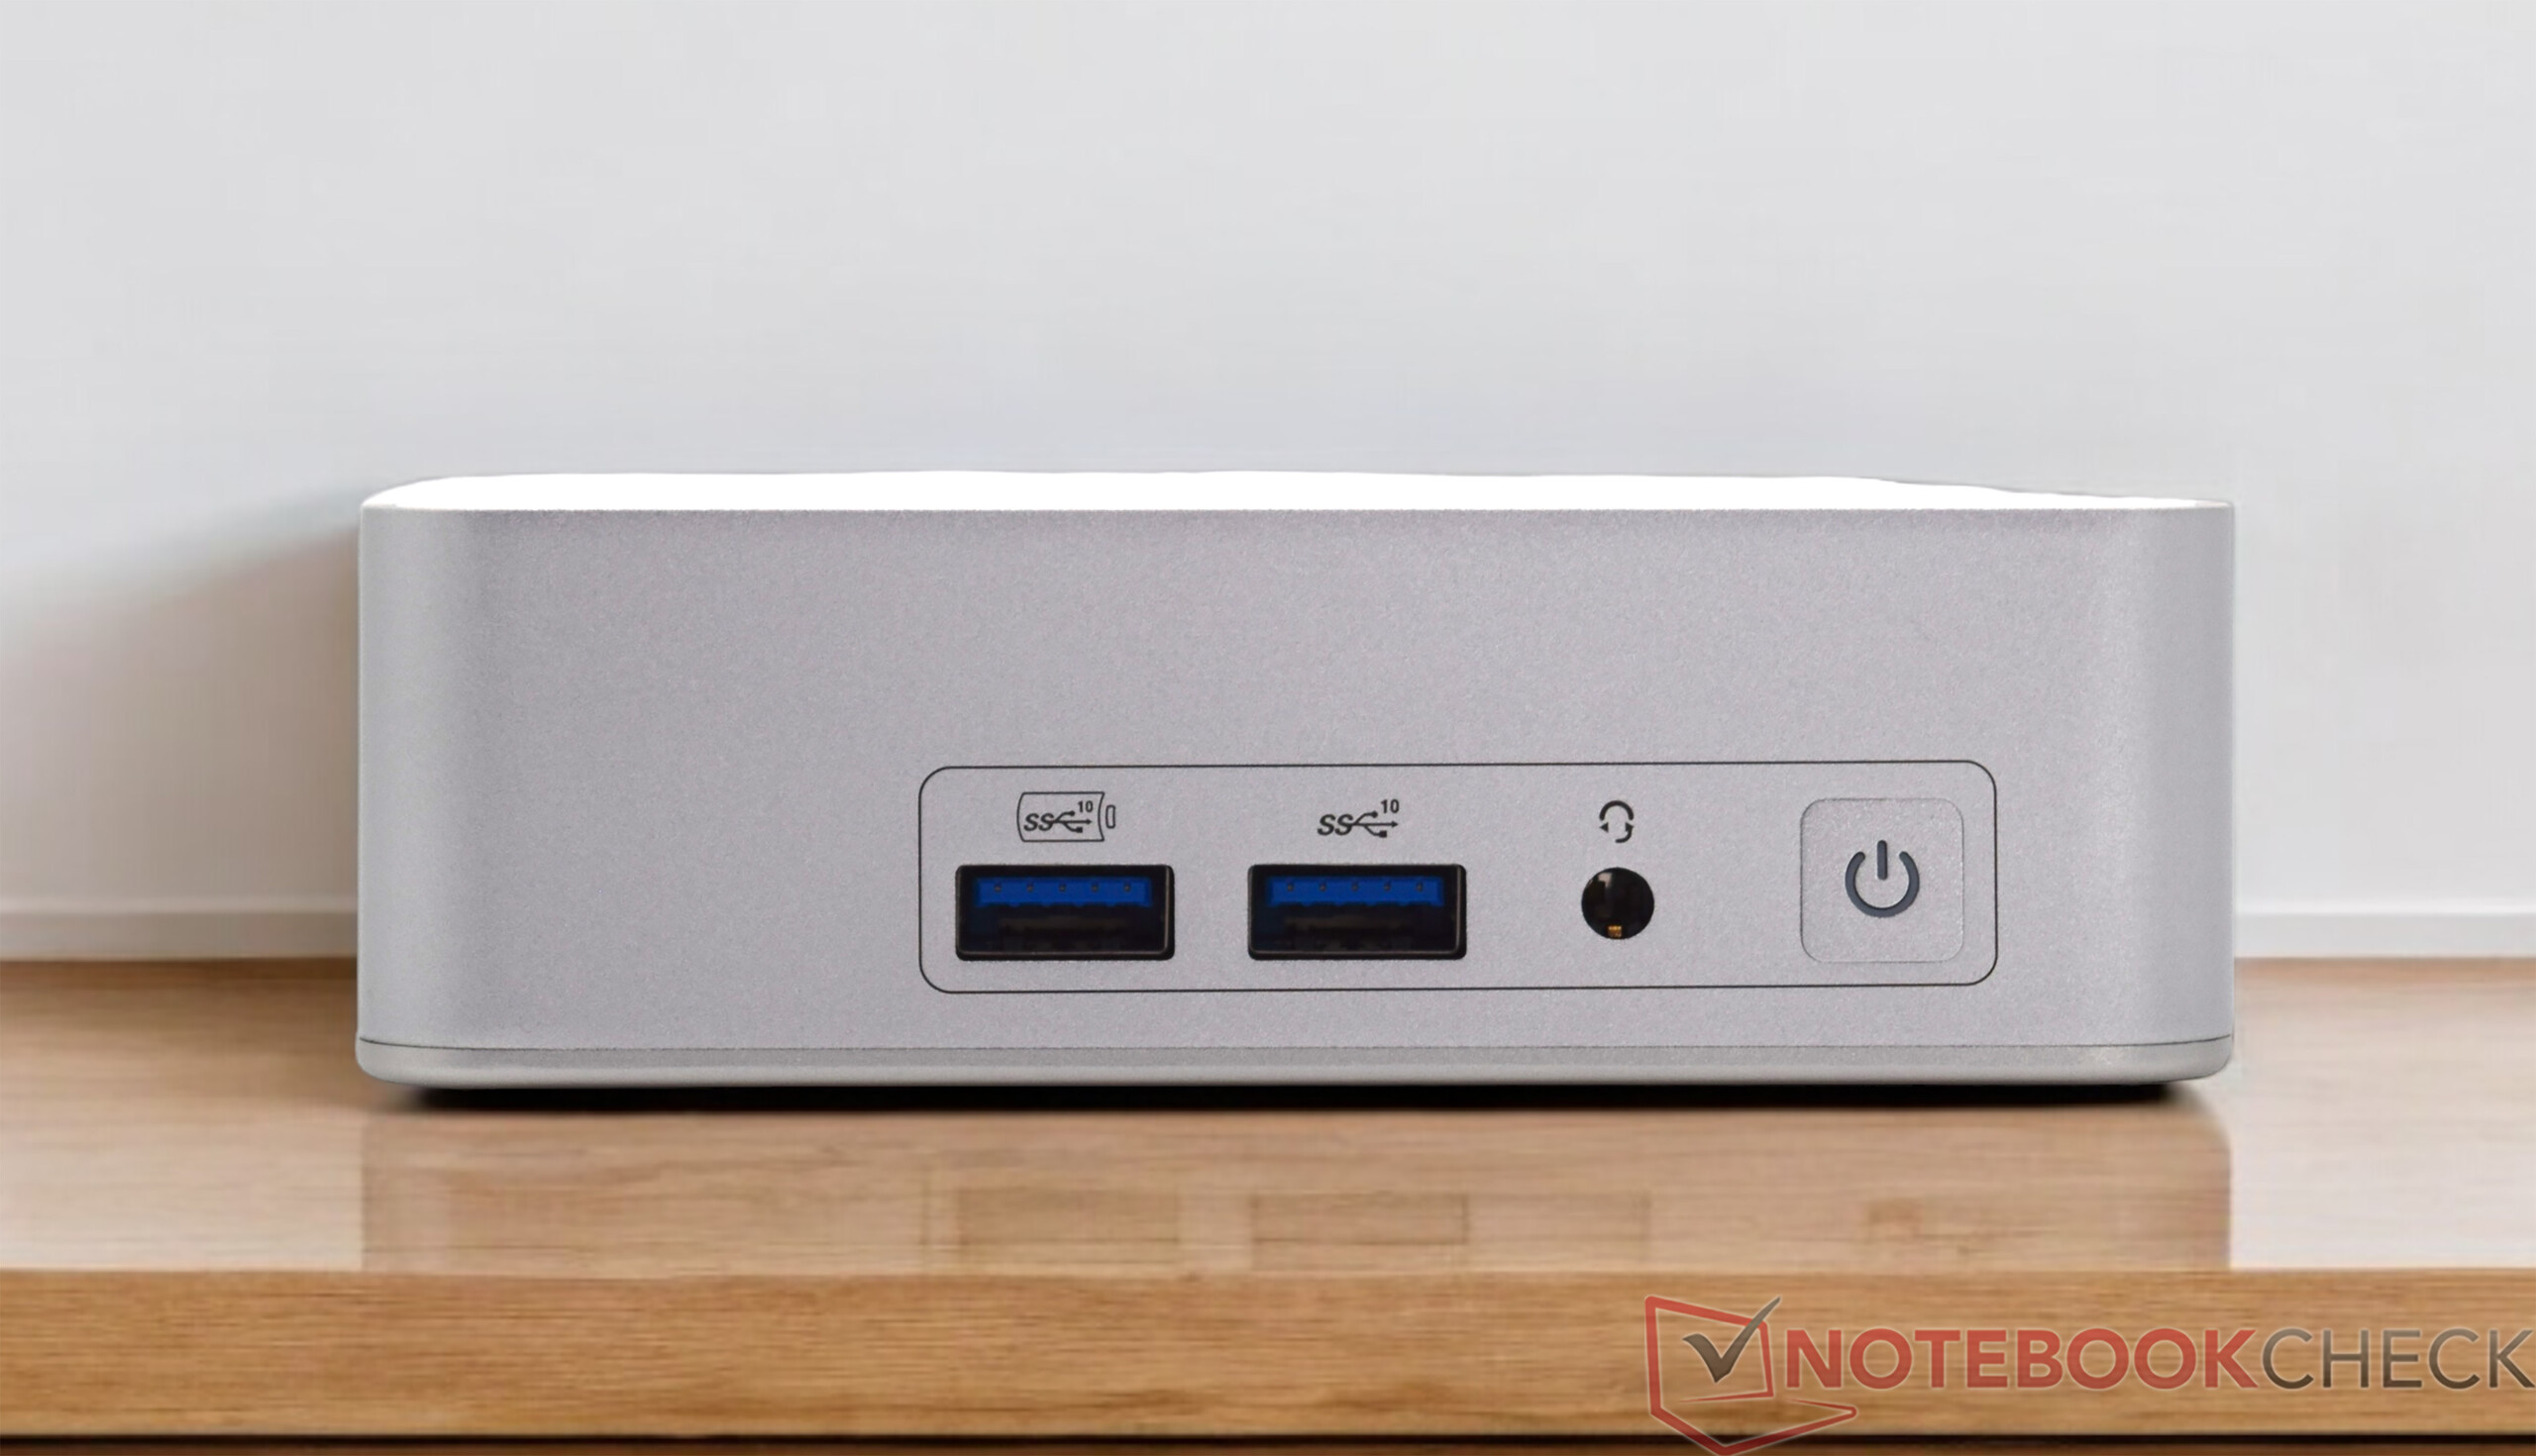
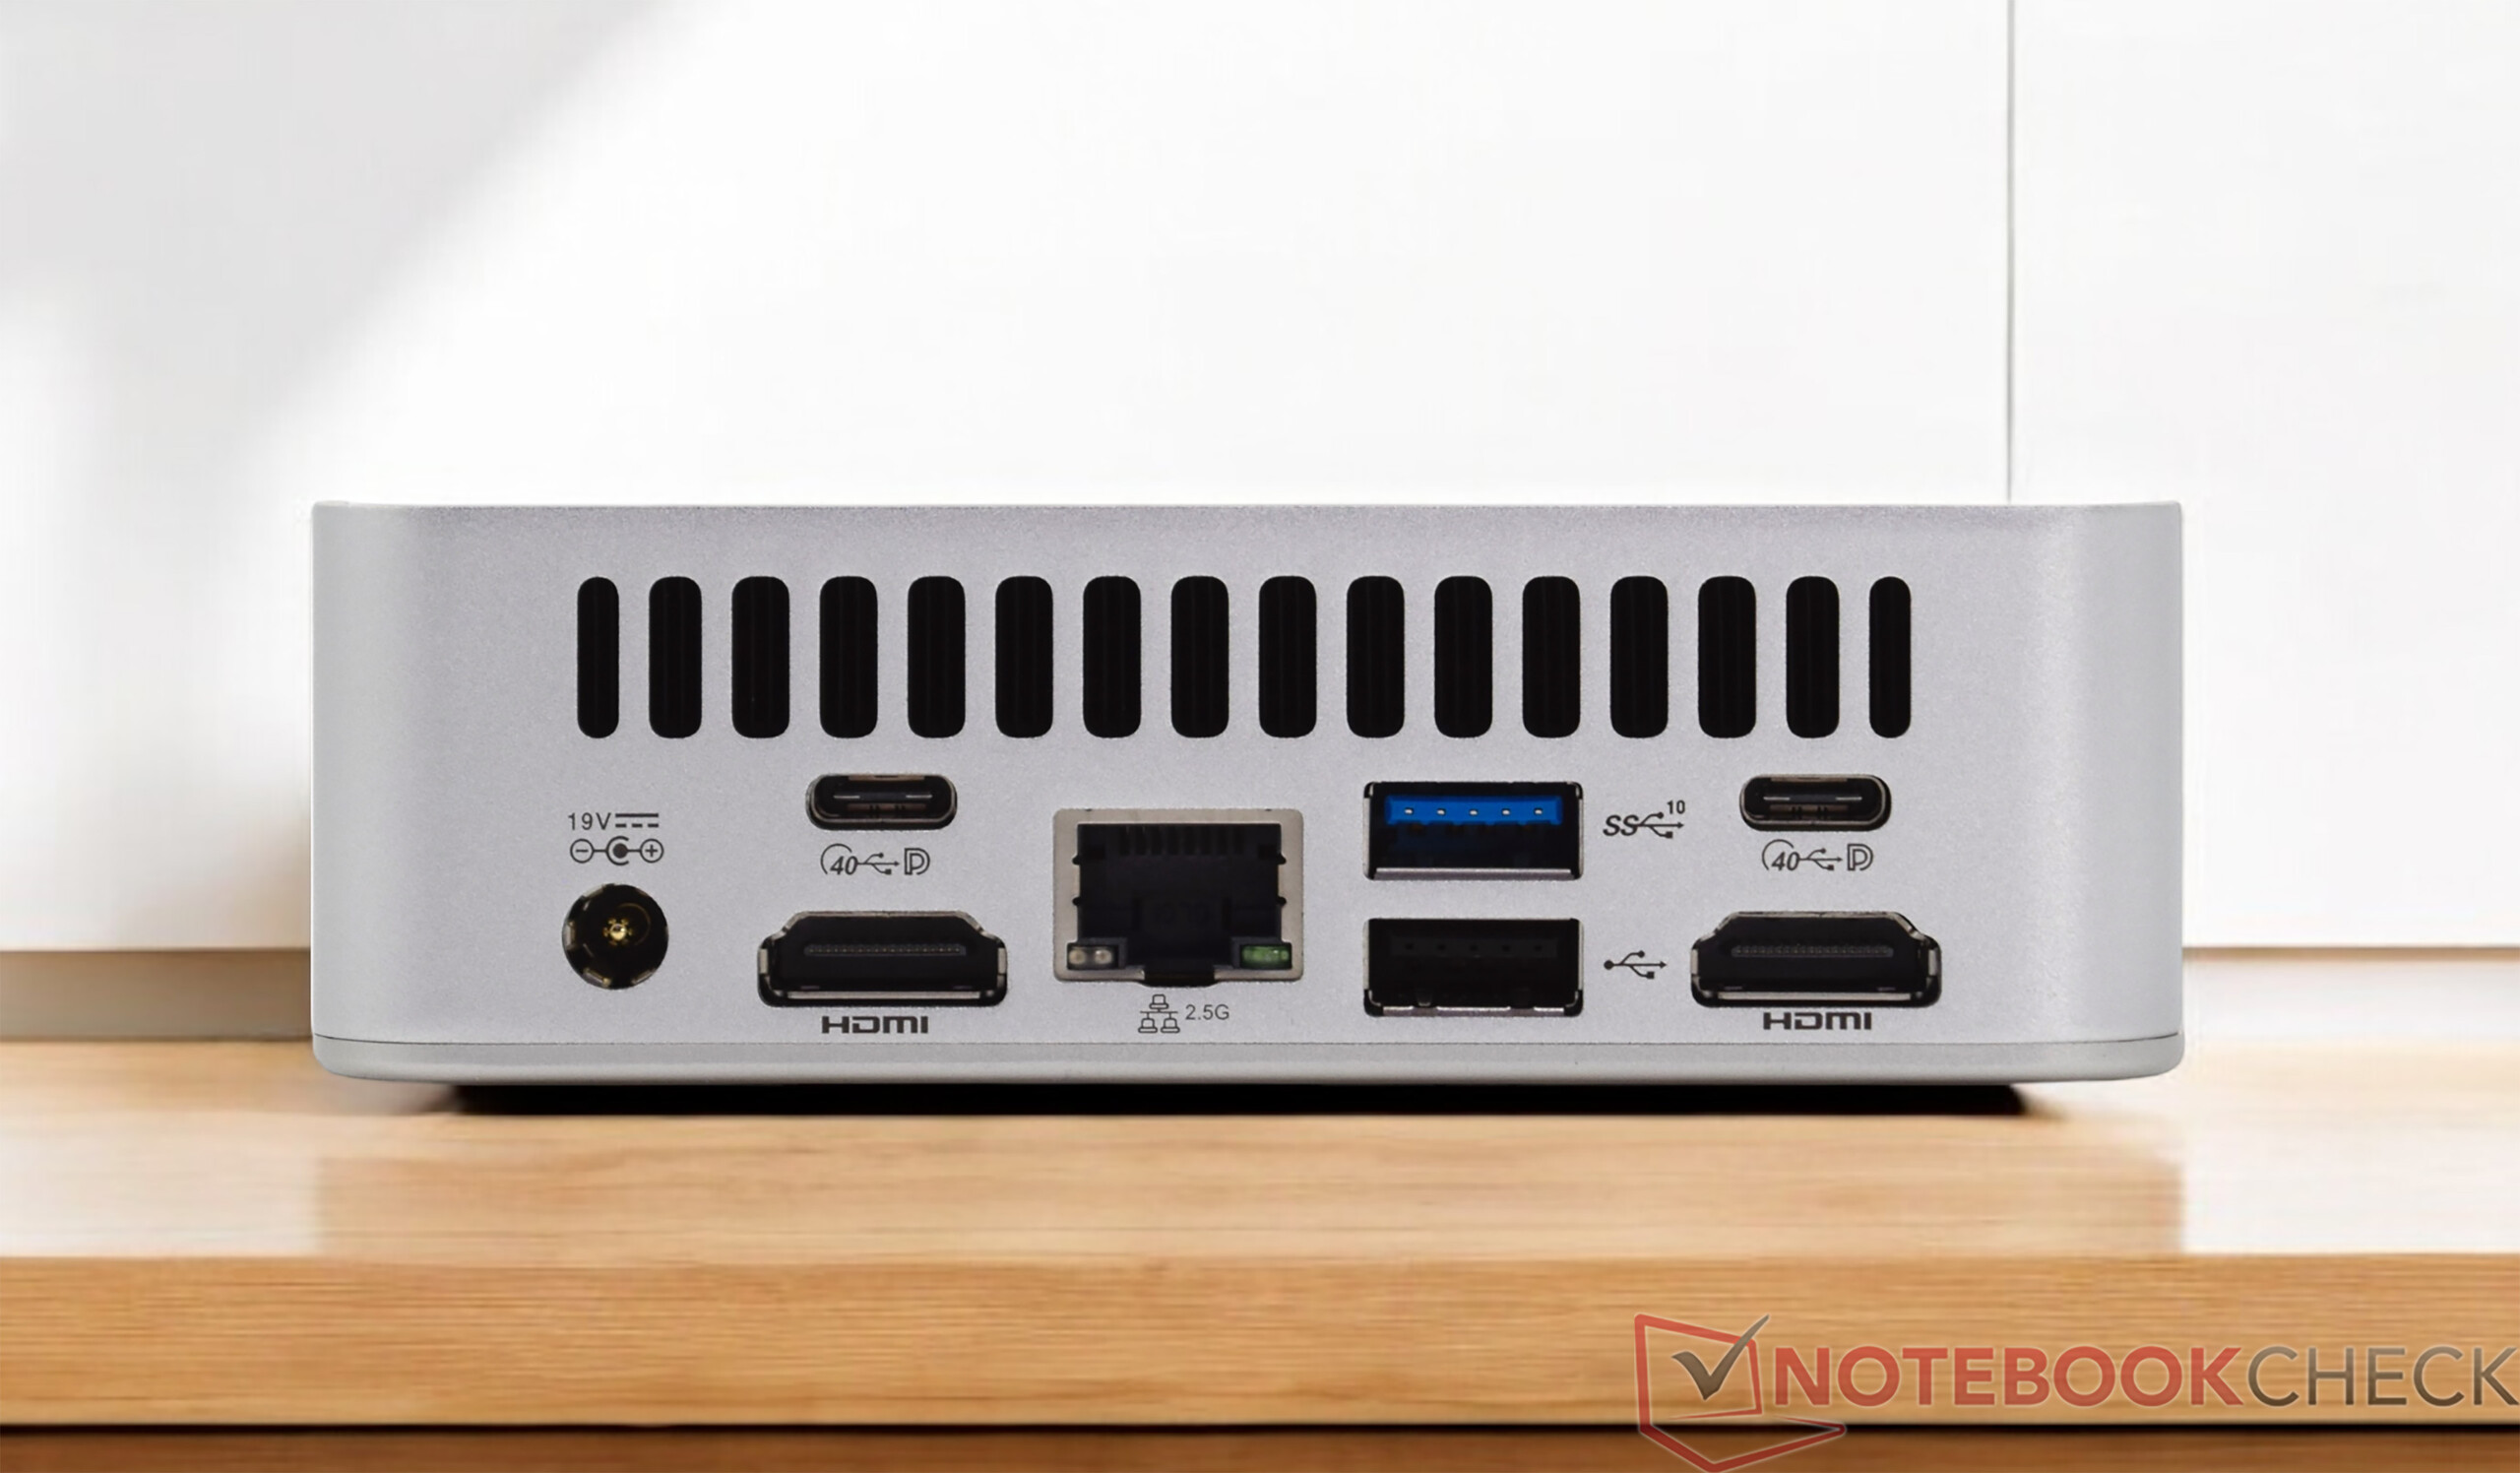
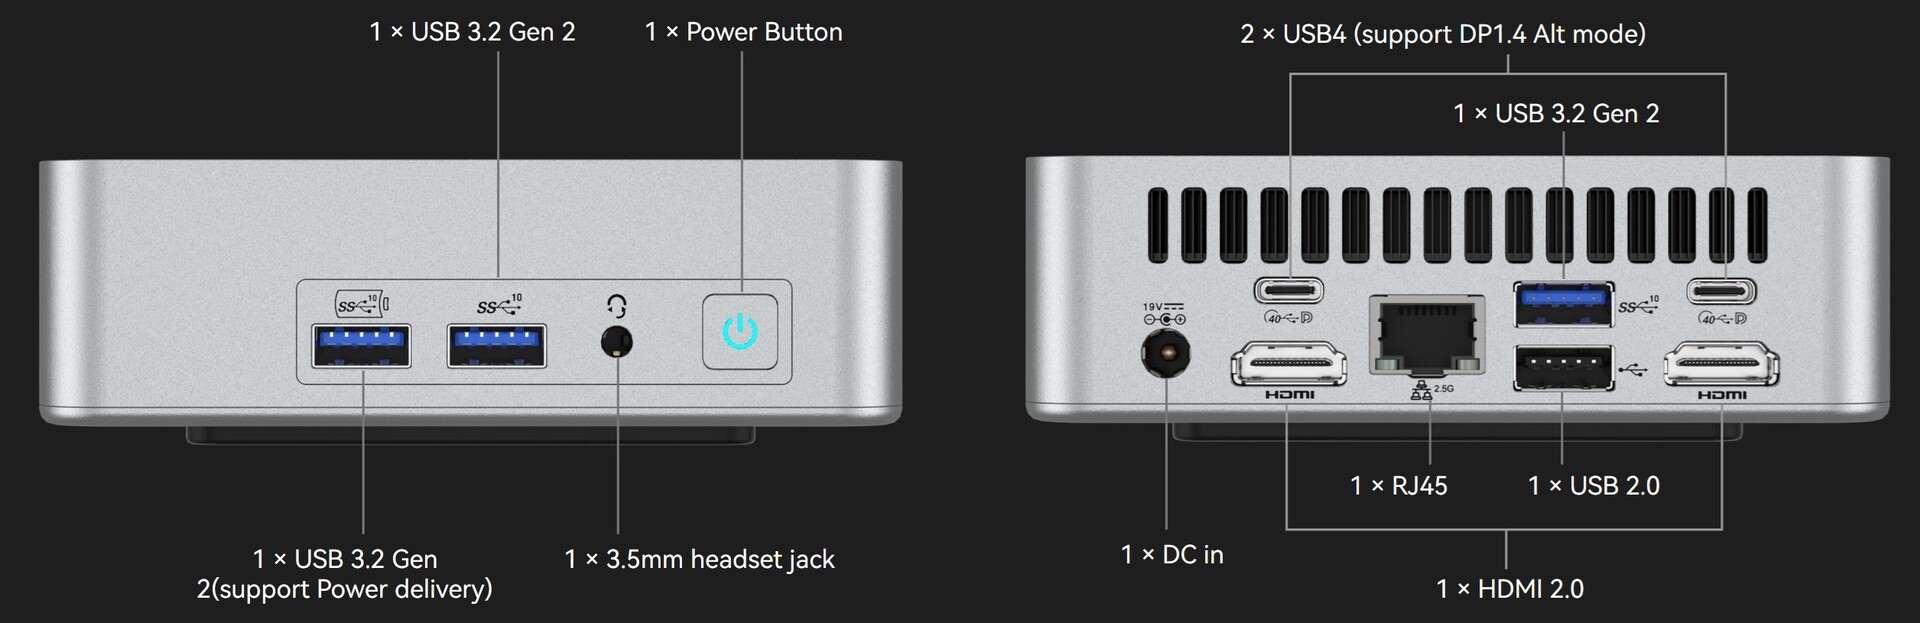
Attrezzatura - Buona selezione e 2x USB4
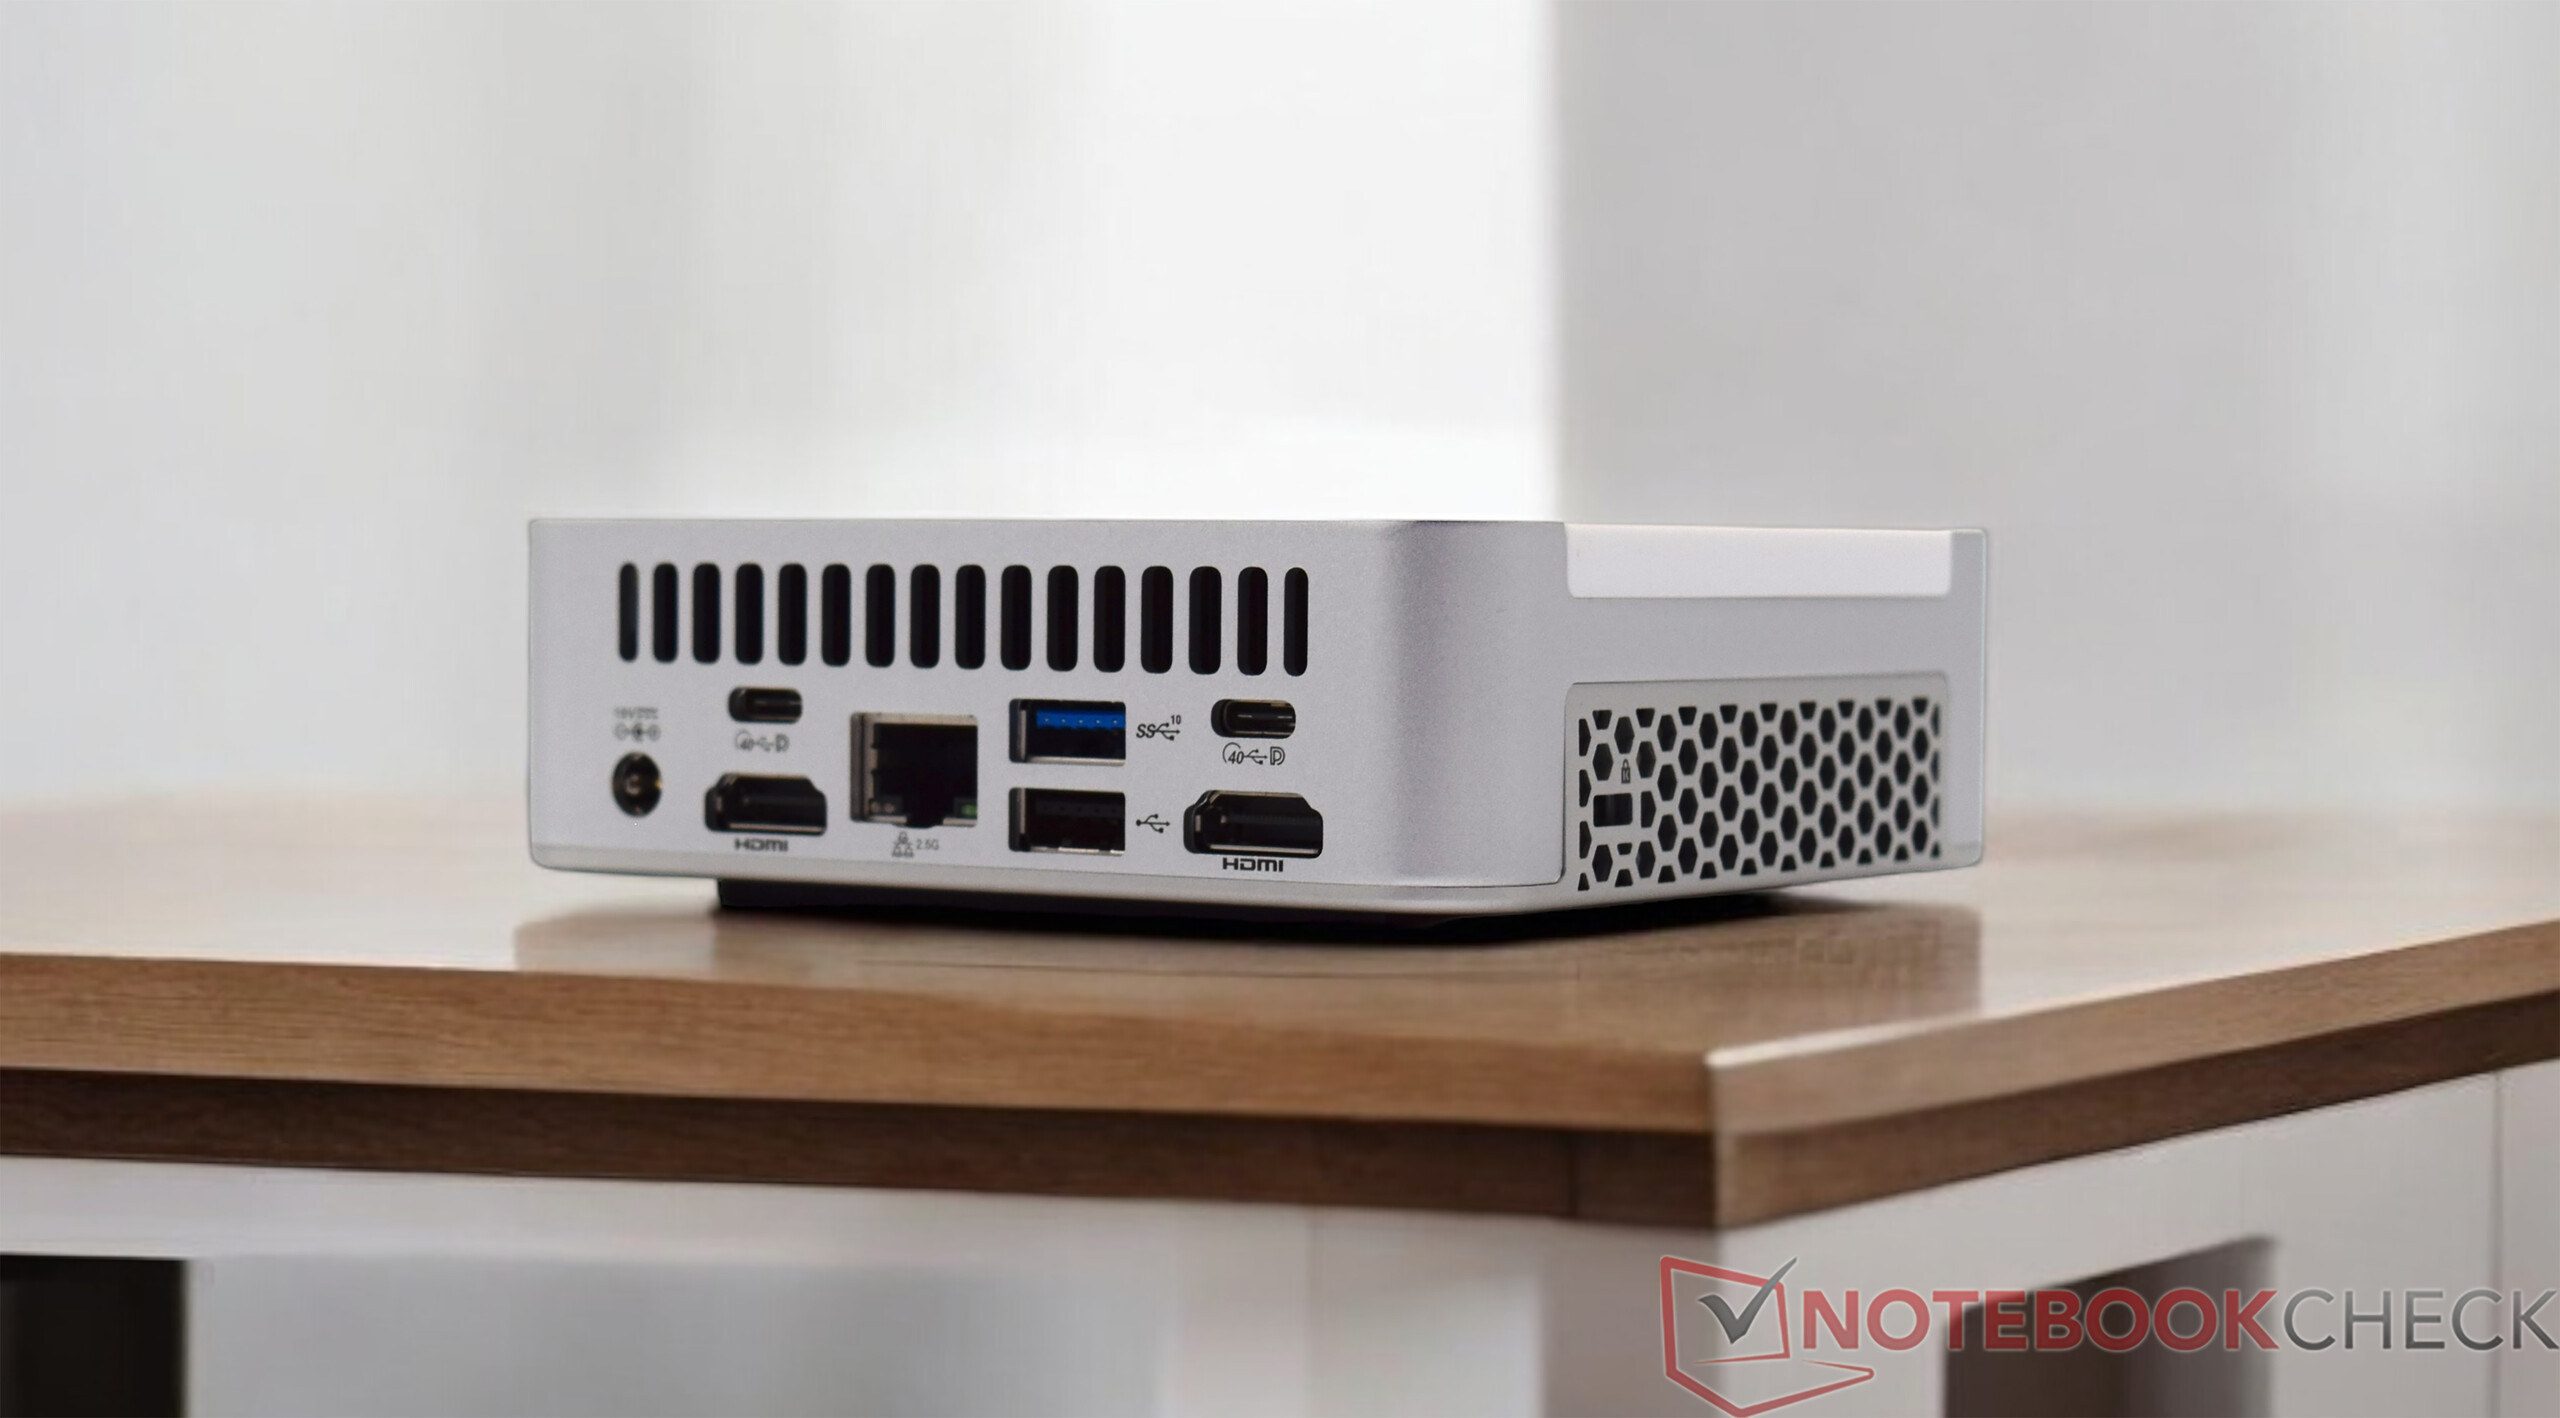
In termini di interfacce esterne, il Geekom XT13 Pro ha le stesse opzioni del Geekom XT12 Pro. Sebbene il dispositivo sia molto compatto, ci sono molte connessioni diverse. Le due prese USB-C sul retro sono moderne porte USB4, che ampliano notevolmente la gamma di applicazioni con gli accessori giusti. È possibile utilizzare un totale di quattro schermi contemporaneamente e c'è anche una connessione LAN.
Comunicazione
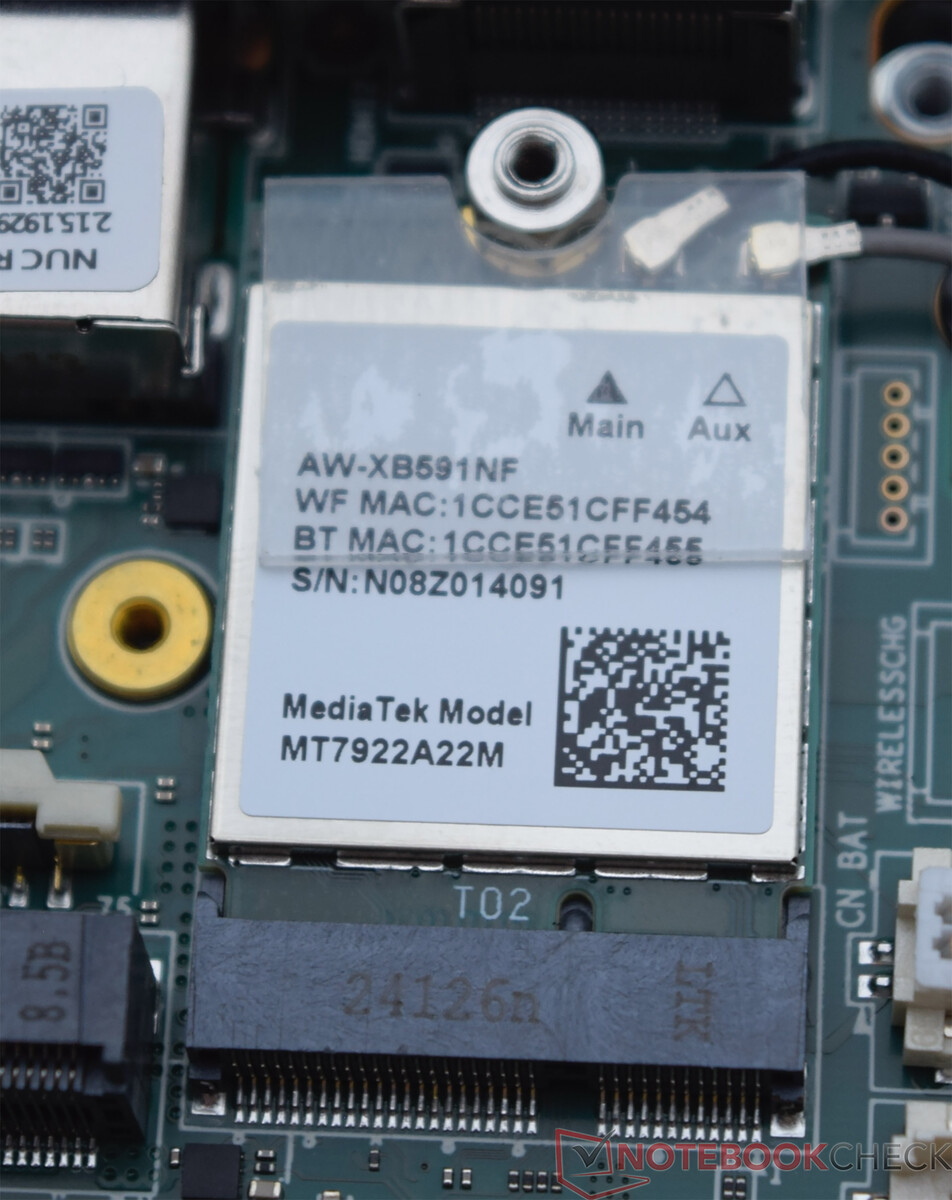
Geekom XT13 Pro utilizza un noto modulo wireless che Geekom installa in molti dei suoi dispositivi. Il modulo WLAN MediaTek Wi-Fi 6E MT7922 può fornire prestazioni adeguate nel nostro dispositivo di prova. Se possibile, tuttavia, si dovrebbe utilizzare principalmente la gamma di frequenza di 6 GHz. In alternativa, è possibile utilizzare anche la connessione via cavo. In questo caso è possibile raggiungere velocità di trasmissione dati fino a 2,5 GBit/s.
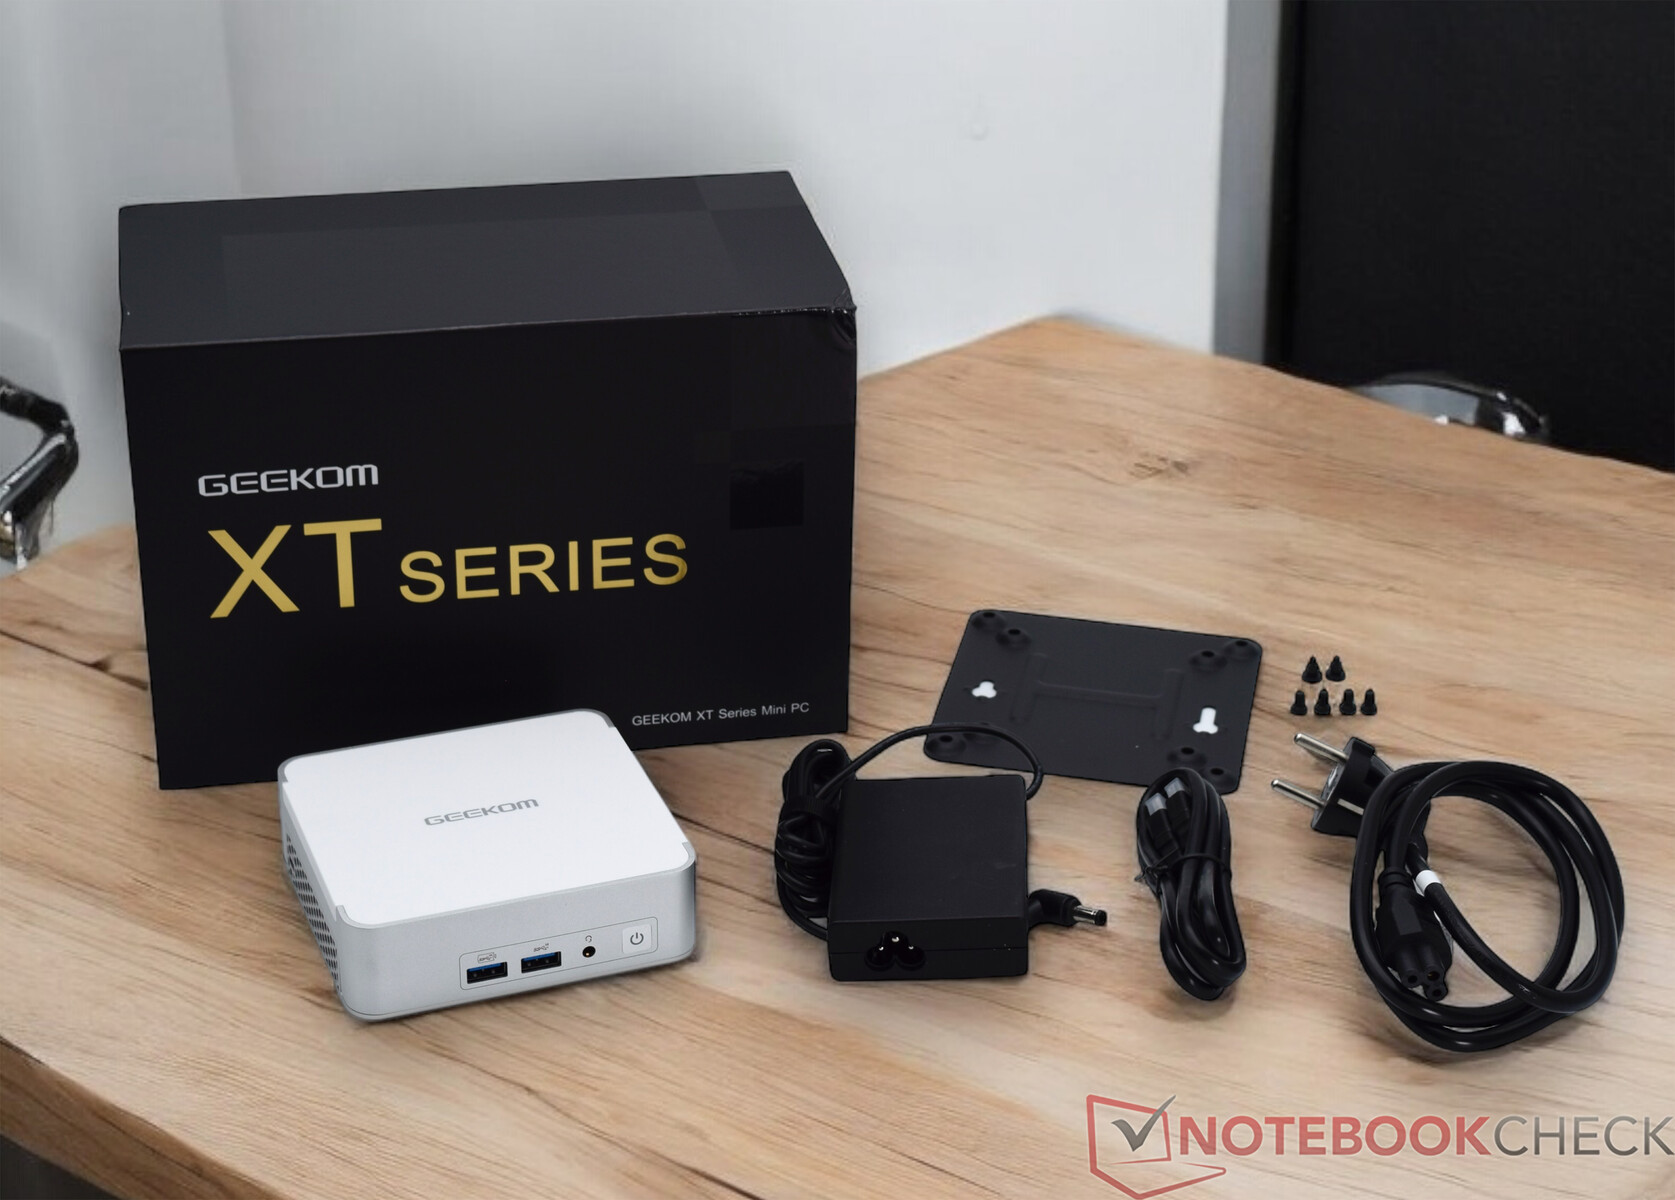
Accessori
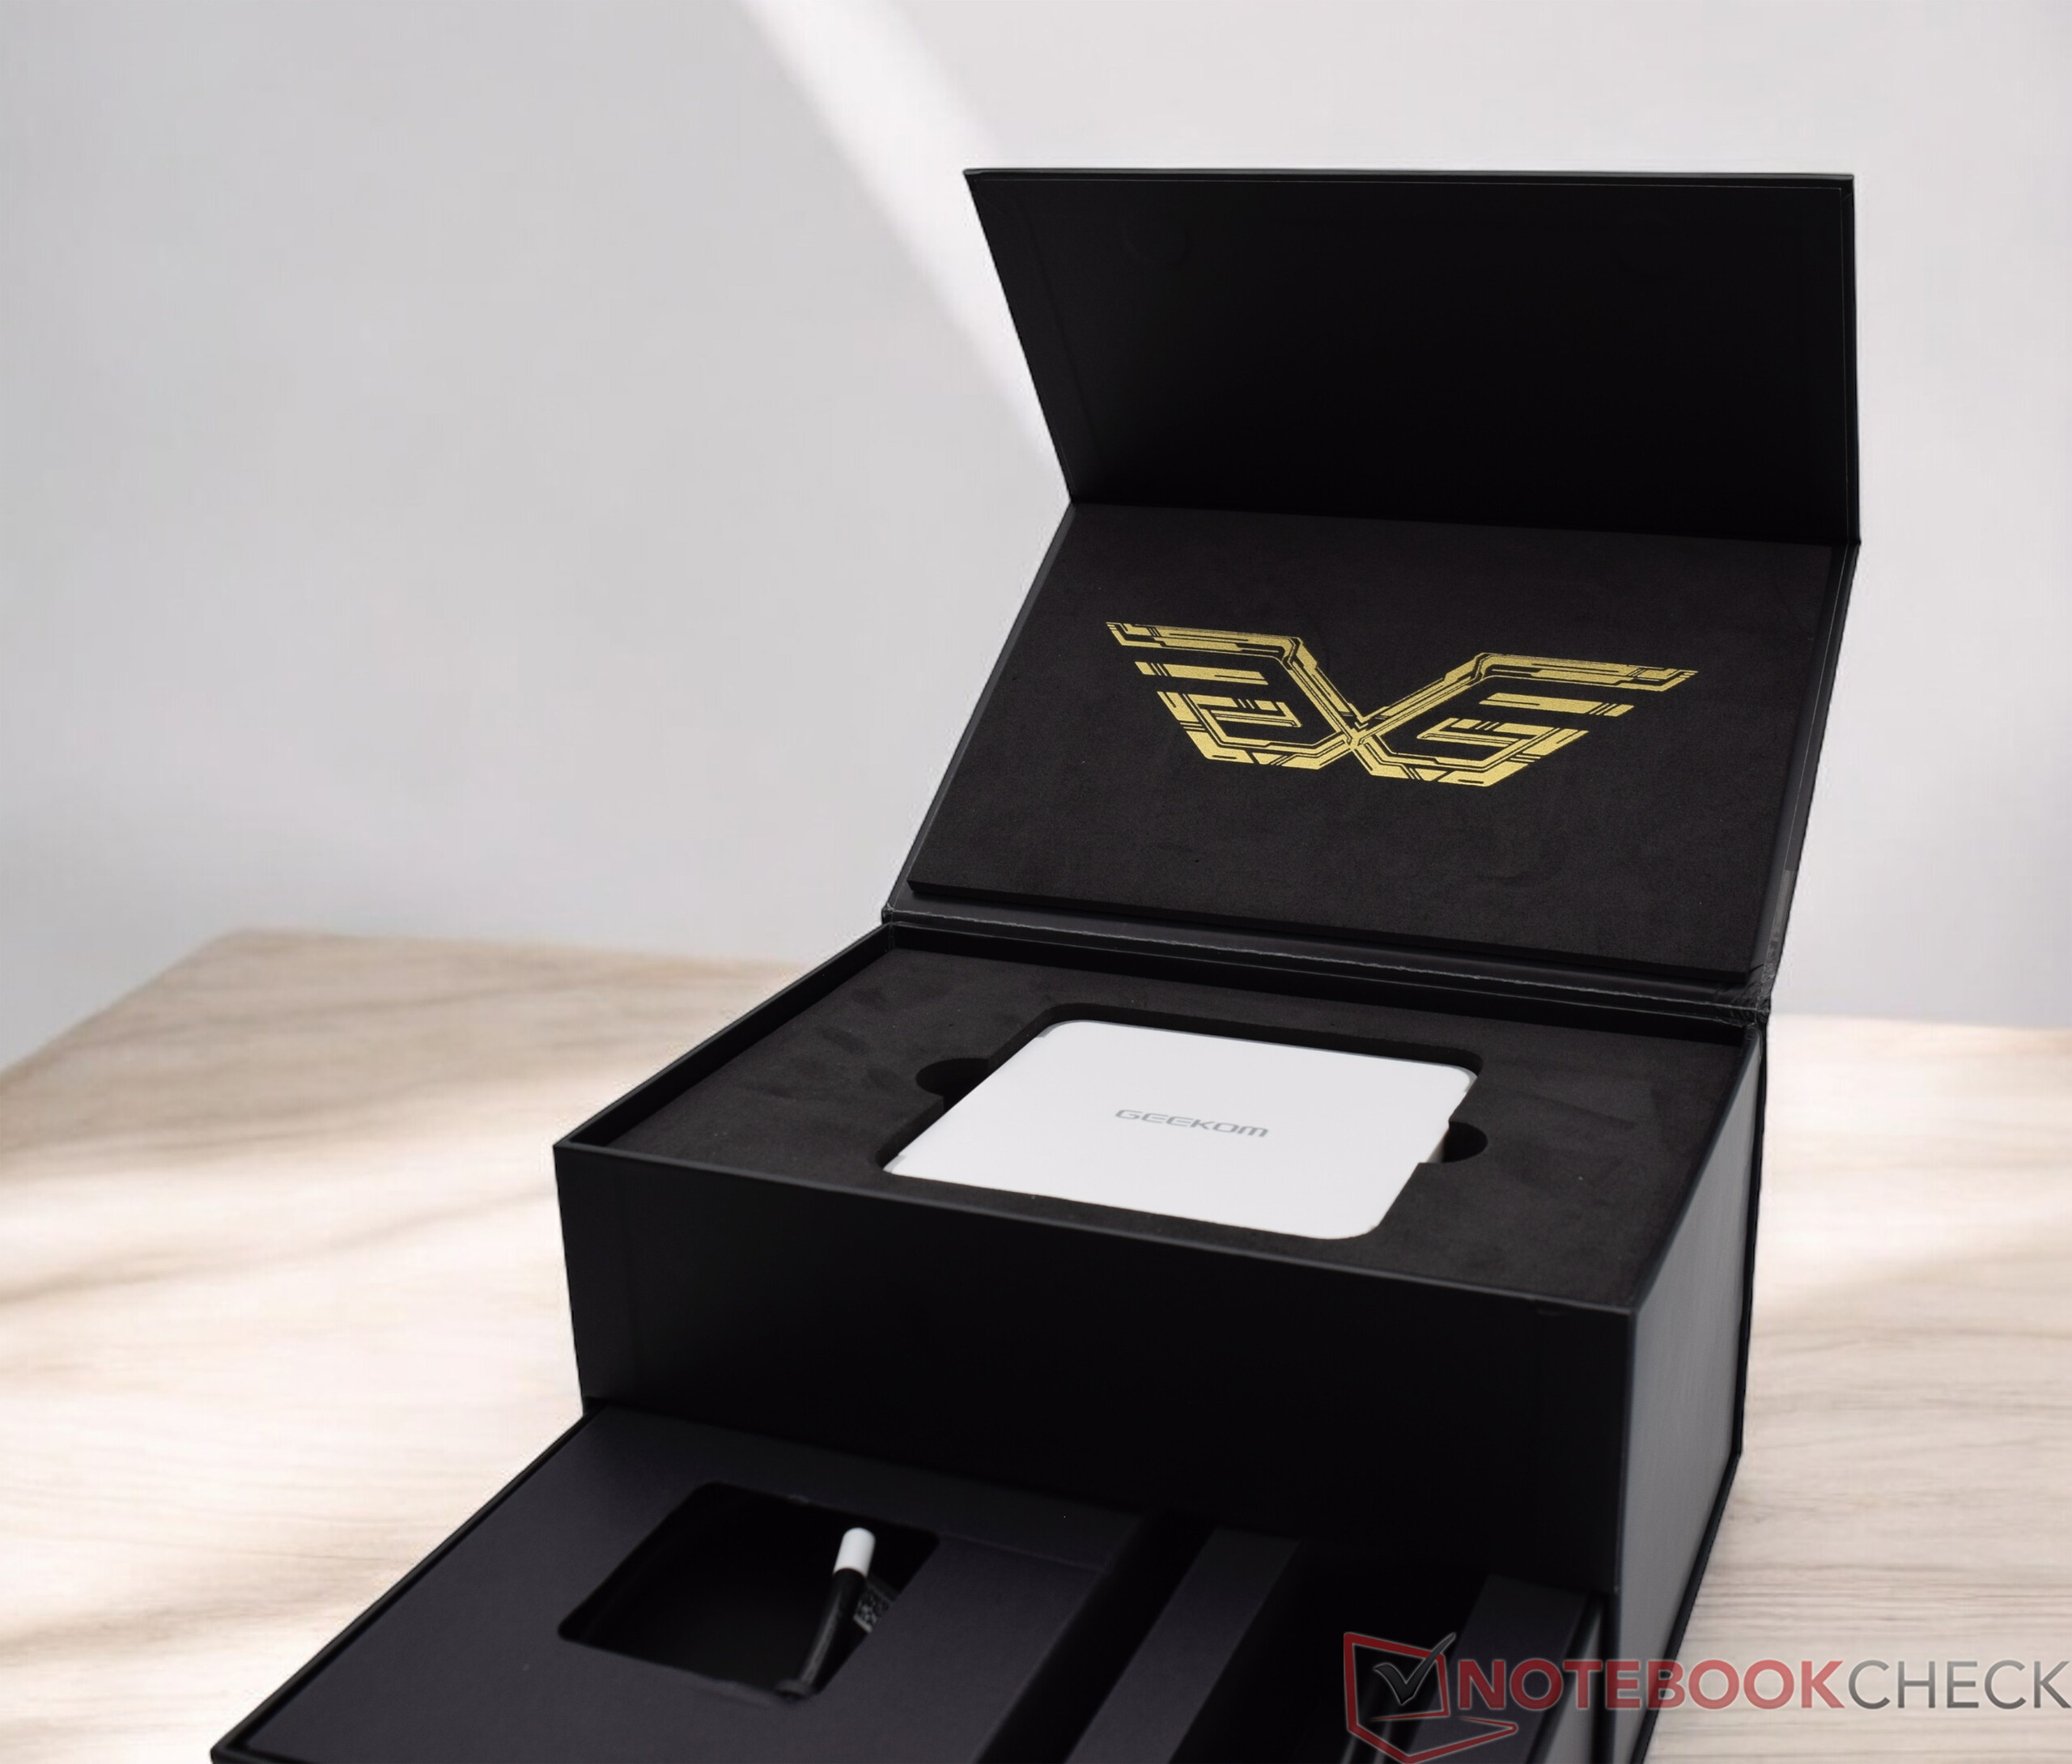
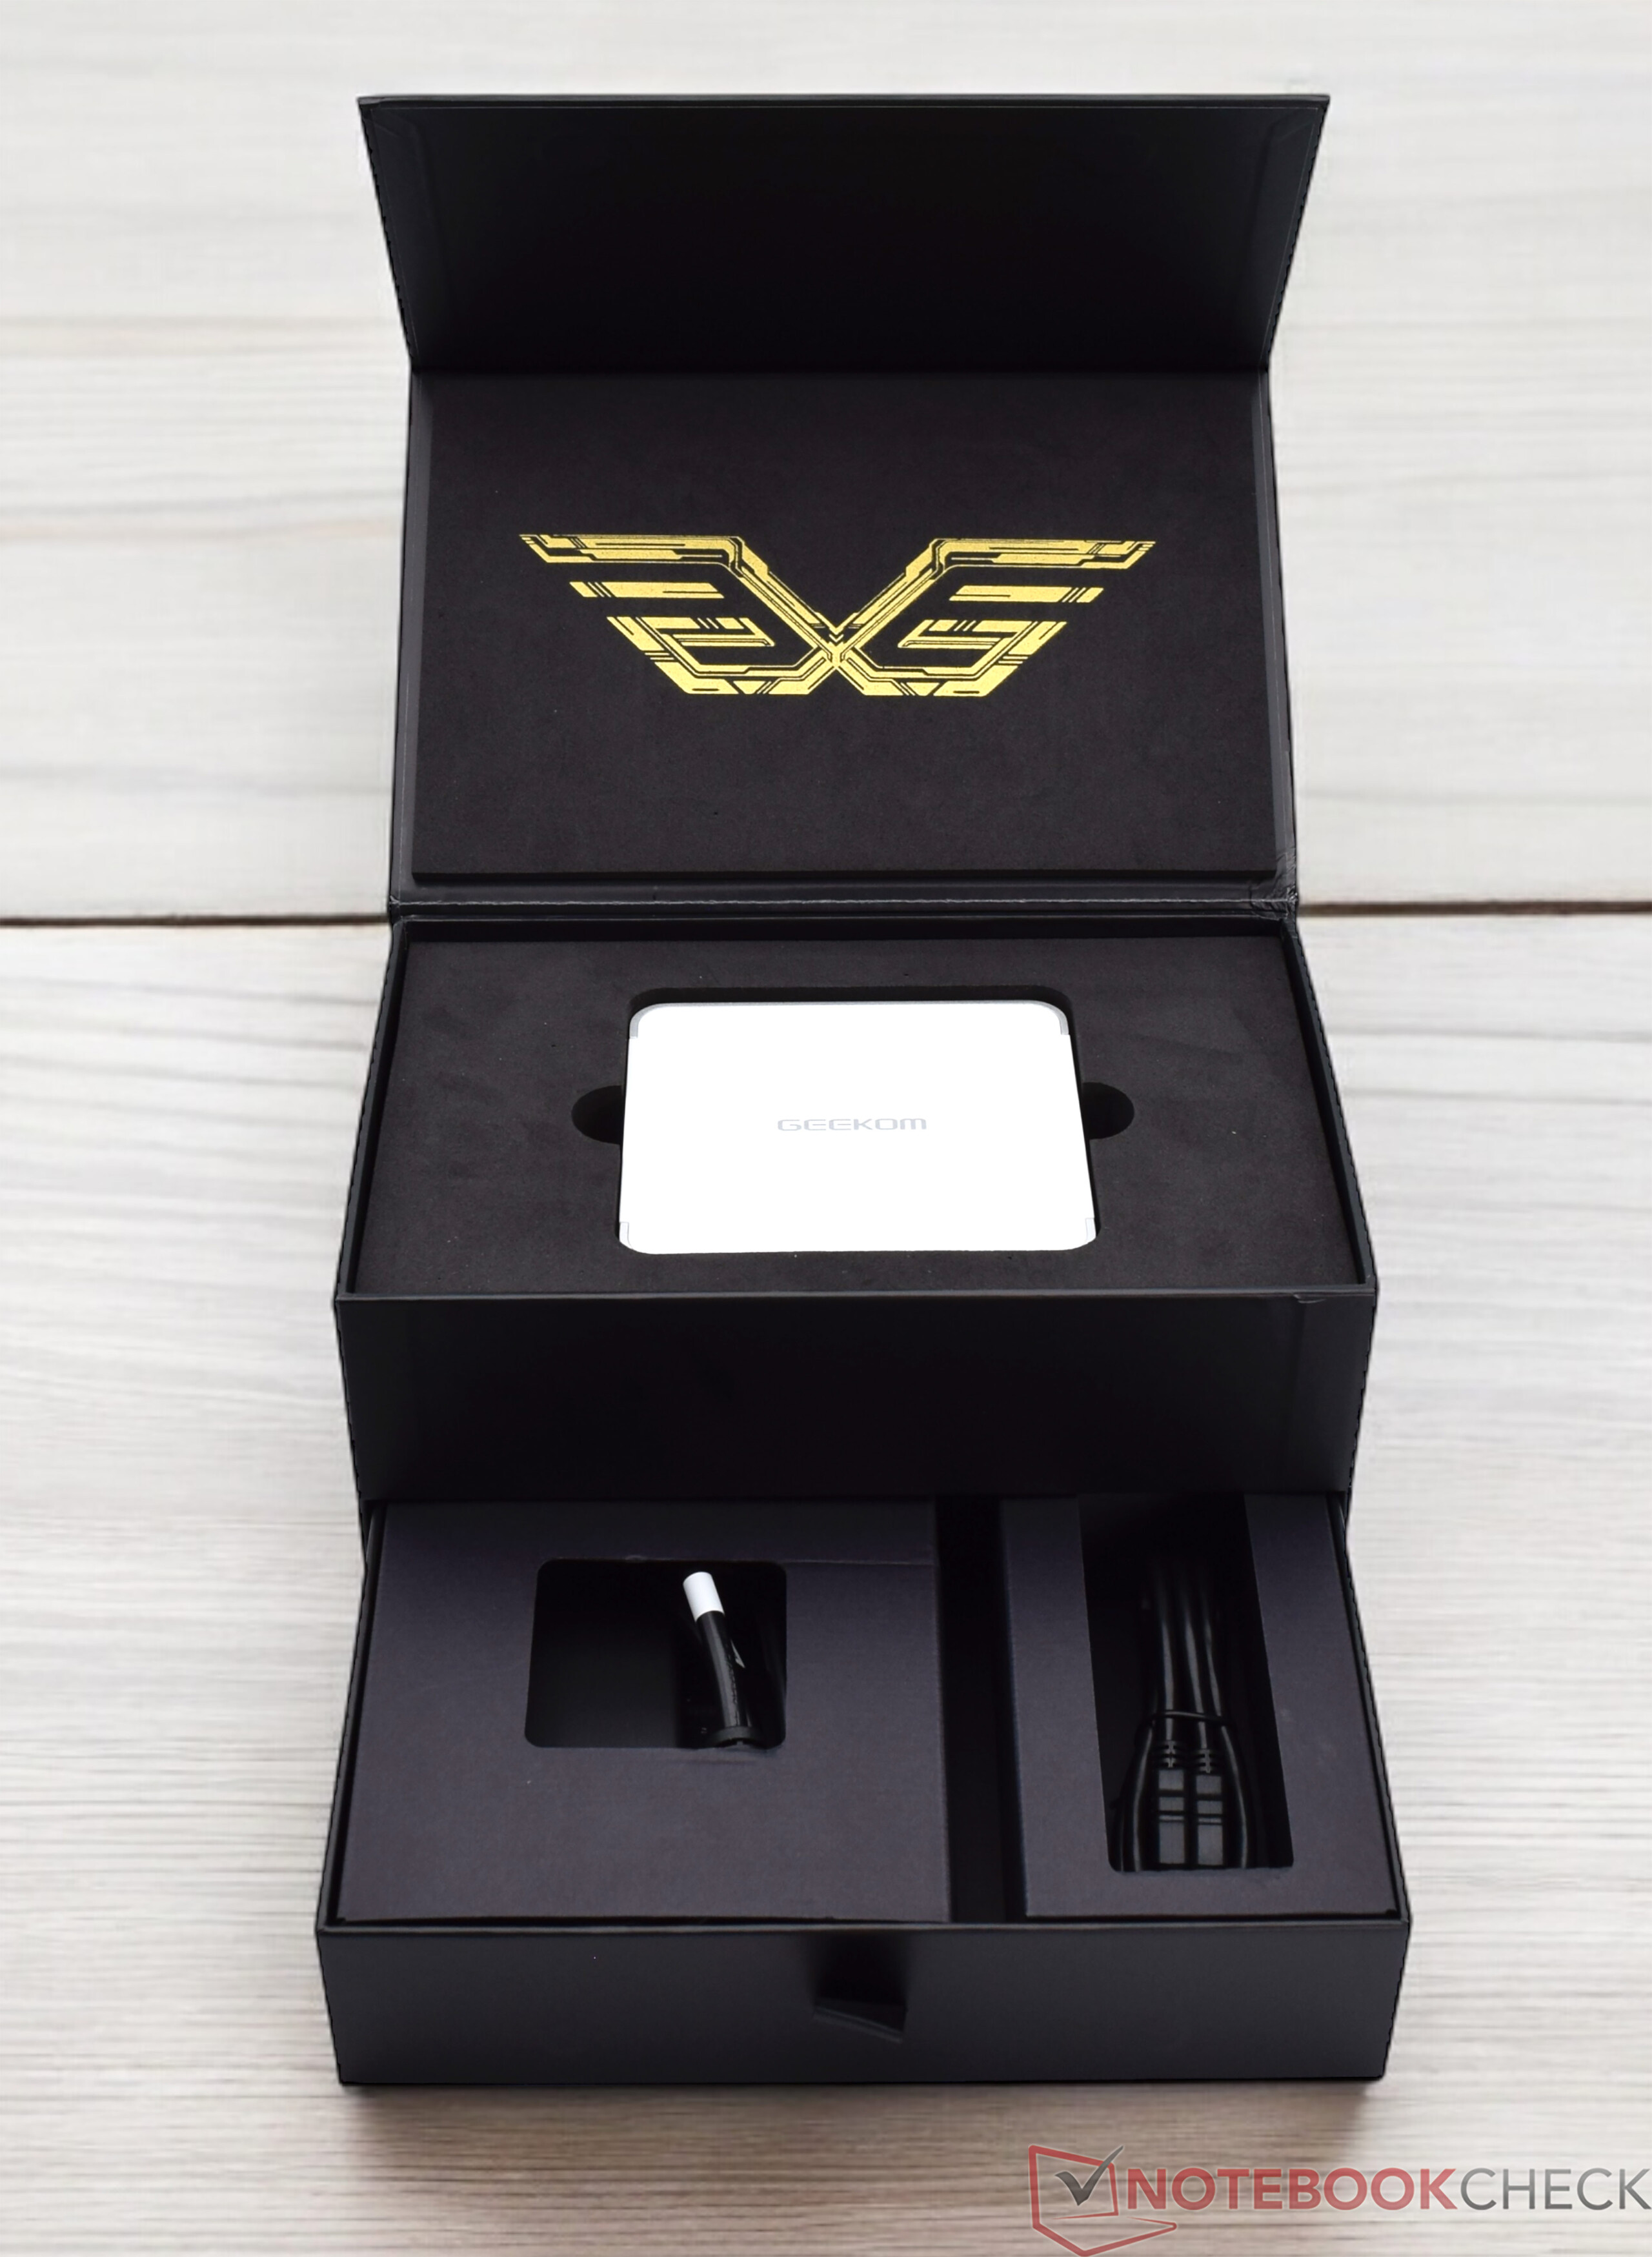
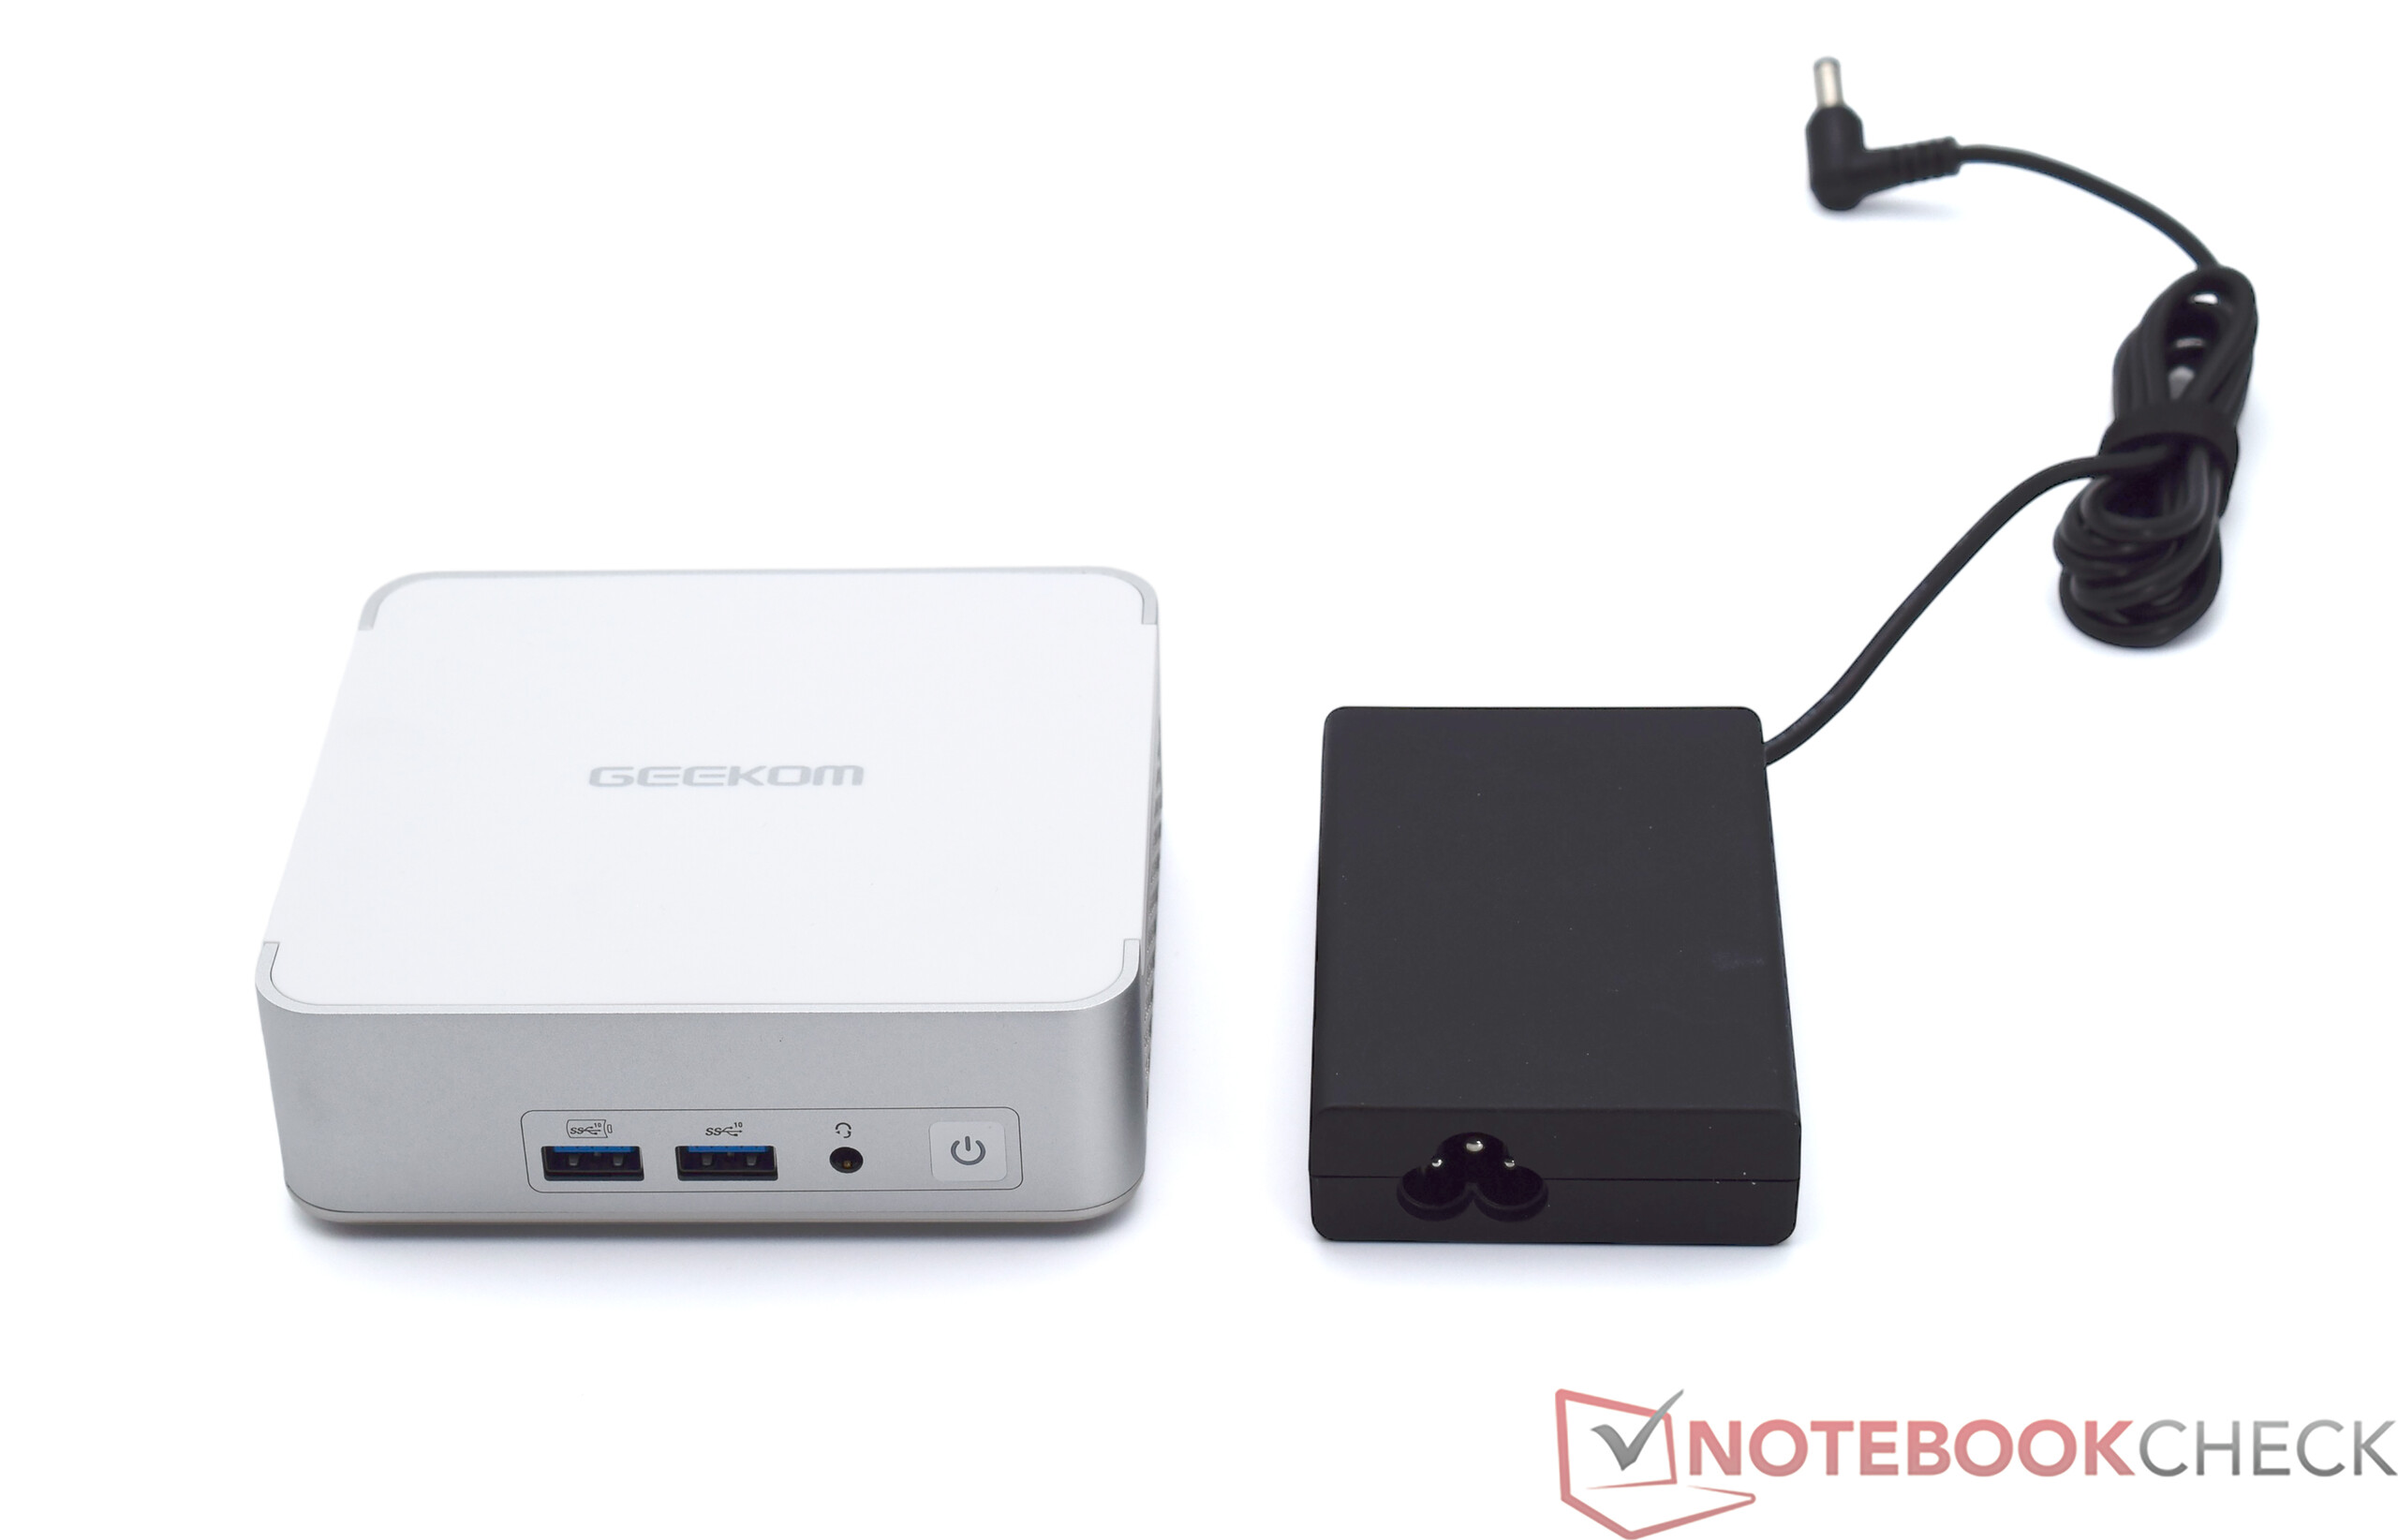
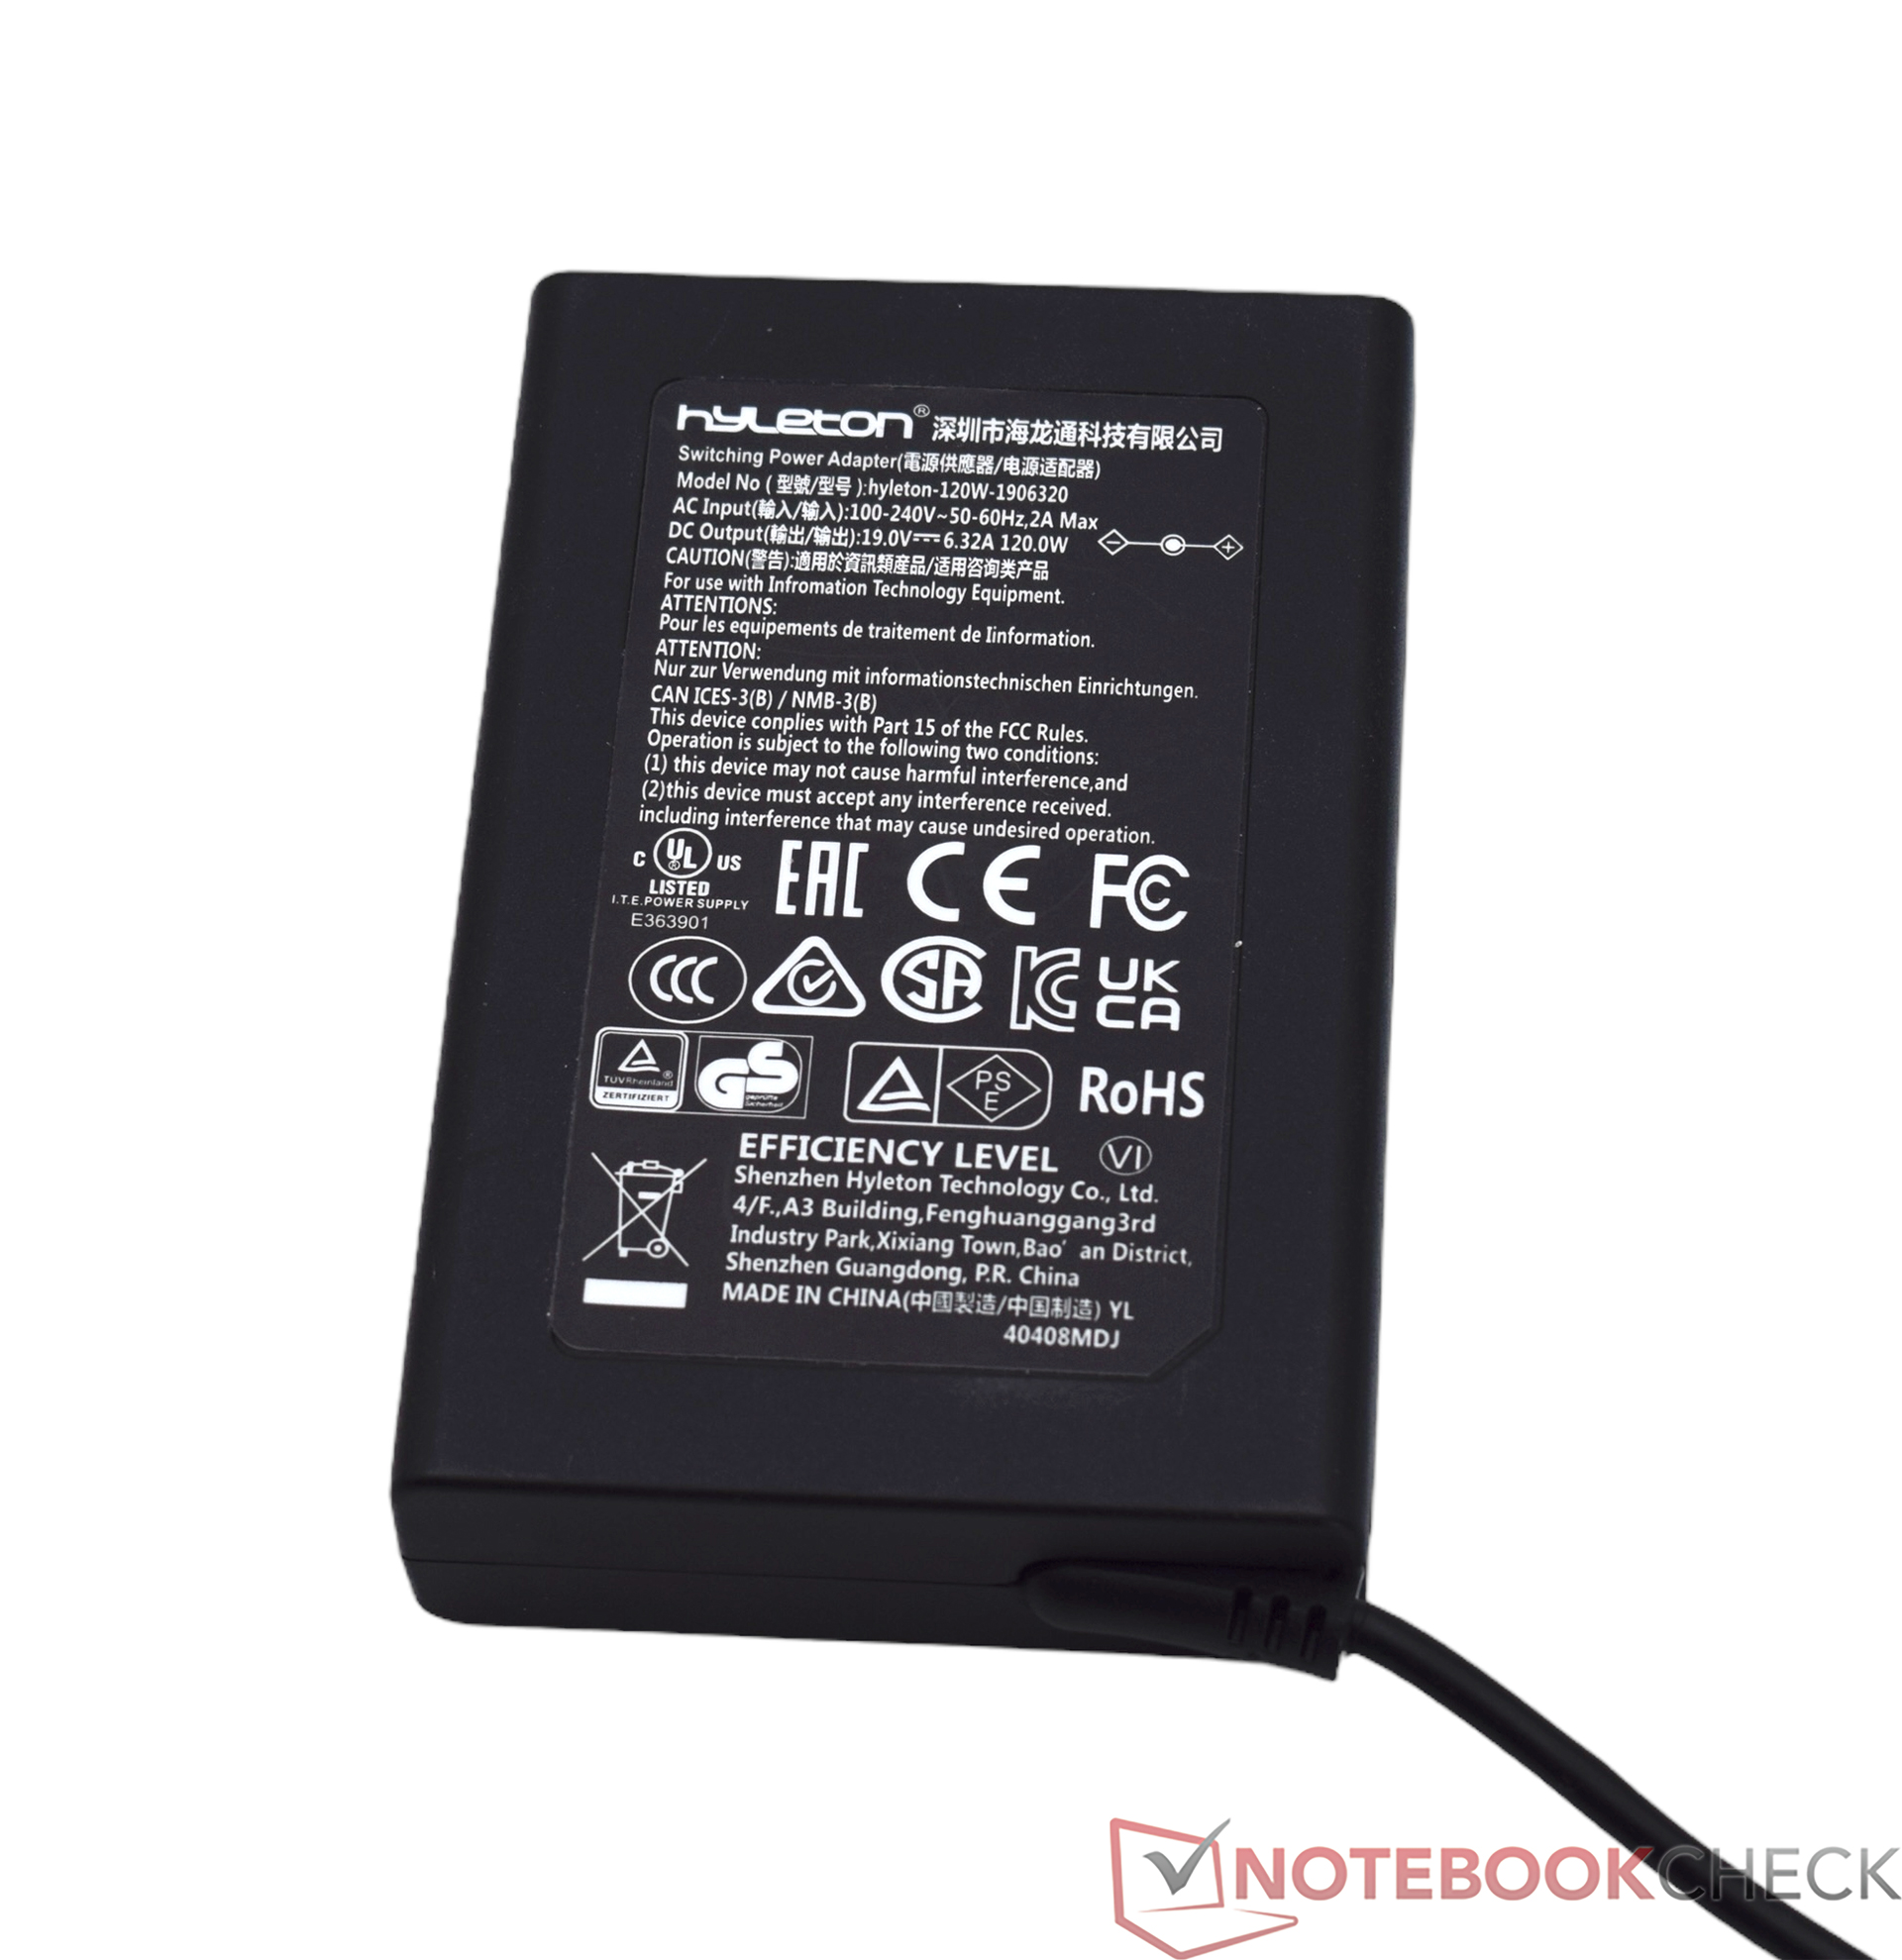
La dotazione di Geekom XT13 Pro offre il solito standard. Oltre al dispositivo stesso, la confezione contiene anche l'alimentatore da 120 watt e una staffa VESA con materiale di montaggio. Sono inclusi anche un cavo HDMI e l'obbligatorio biglietto di ringraziamento di Geekom.
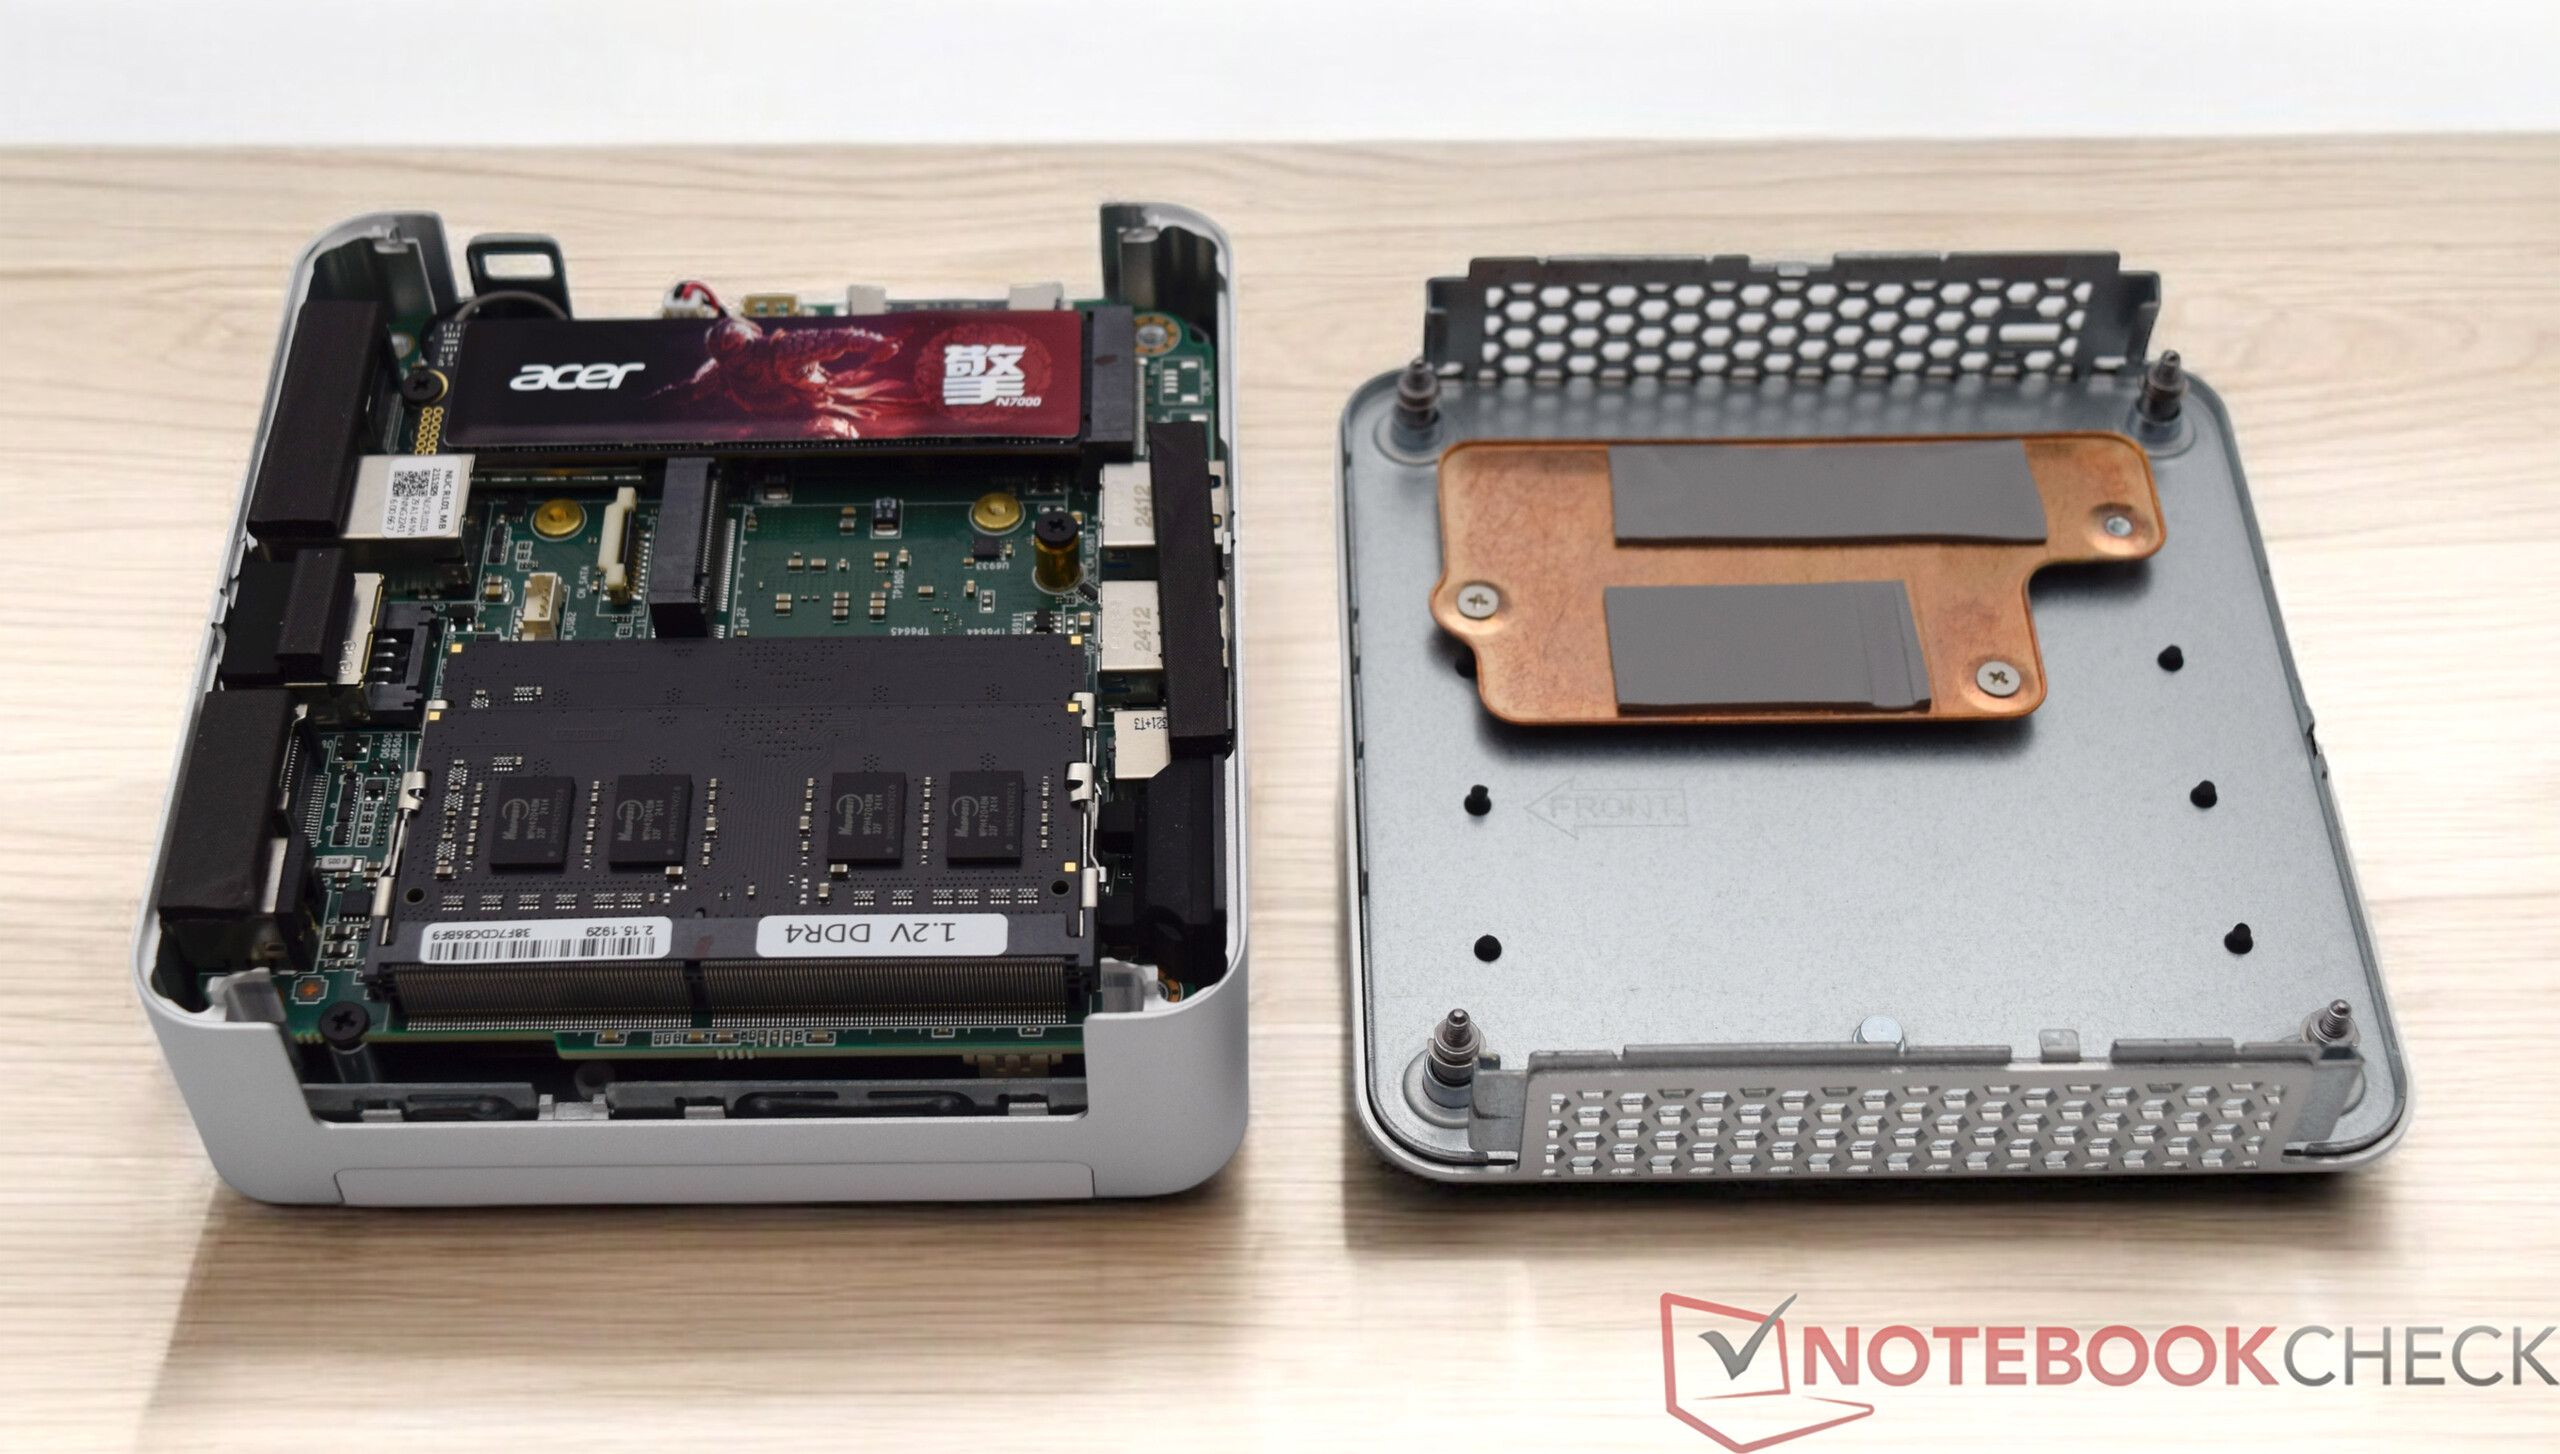
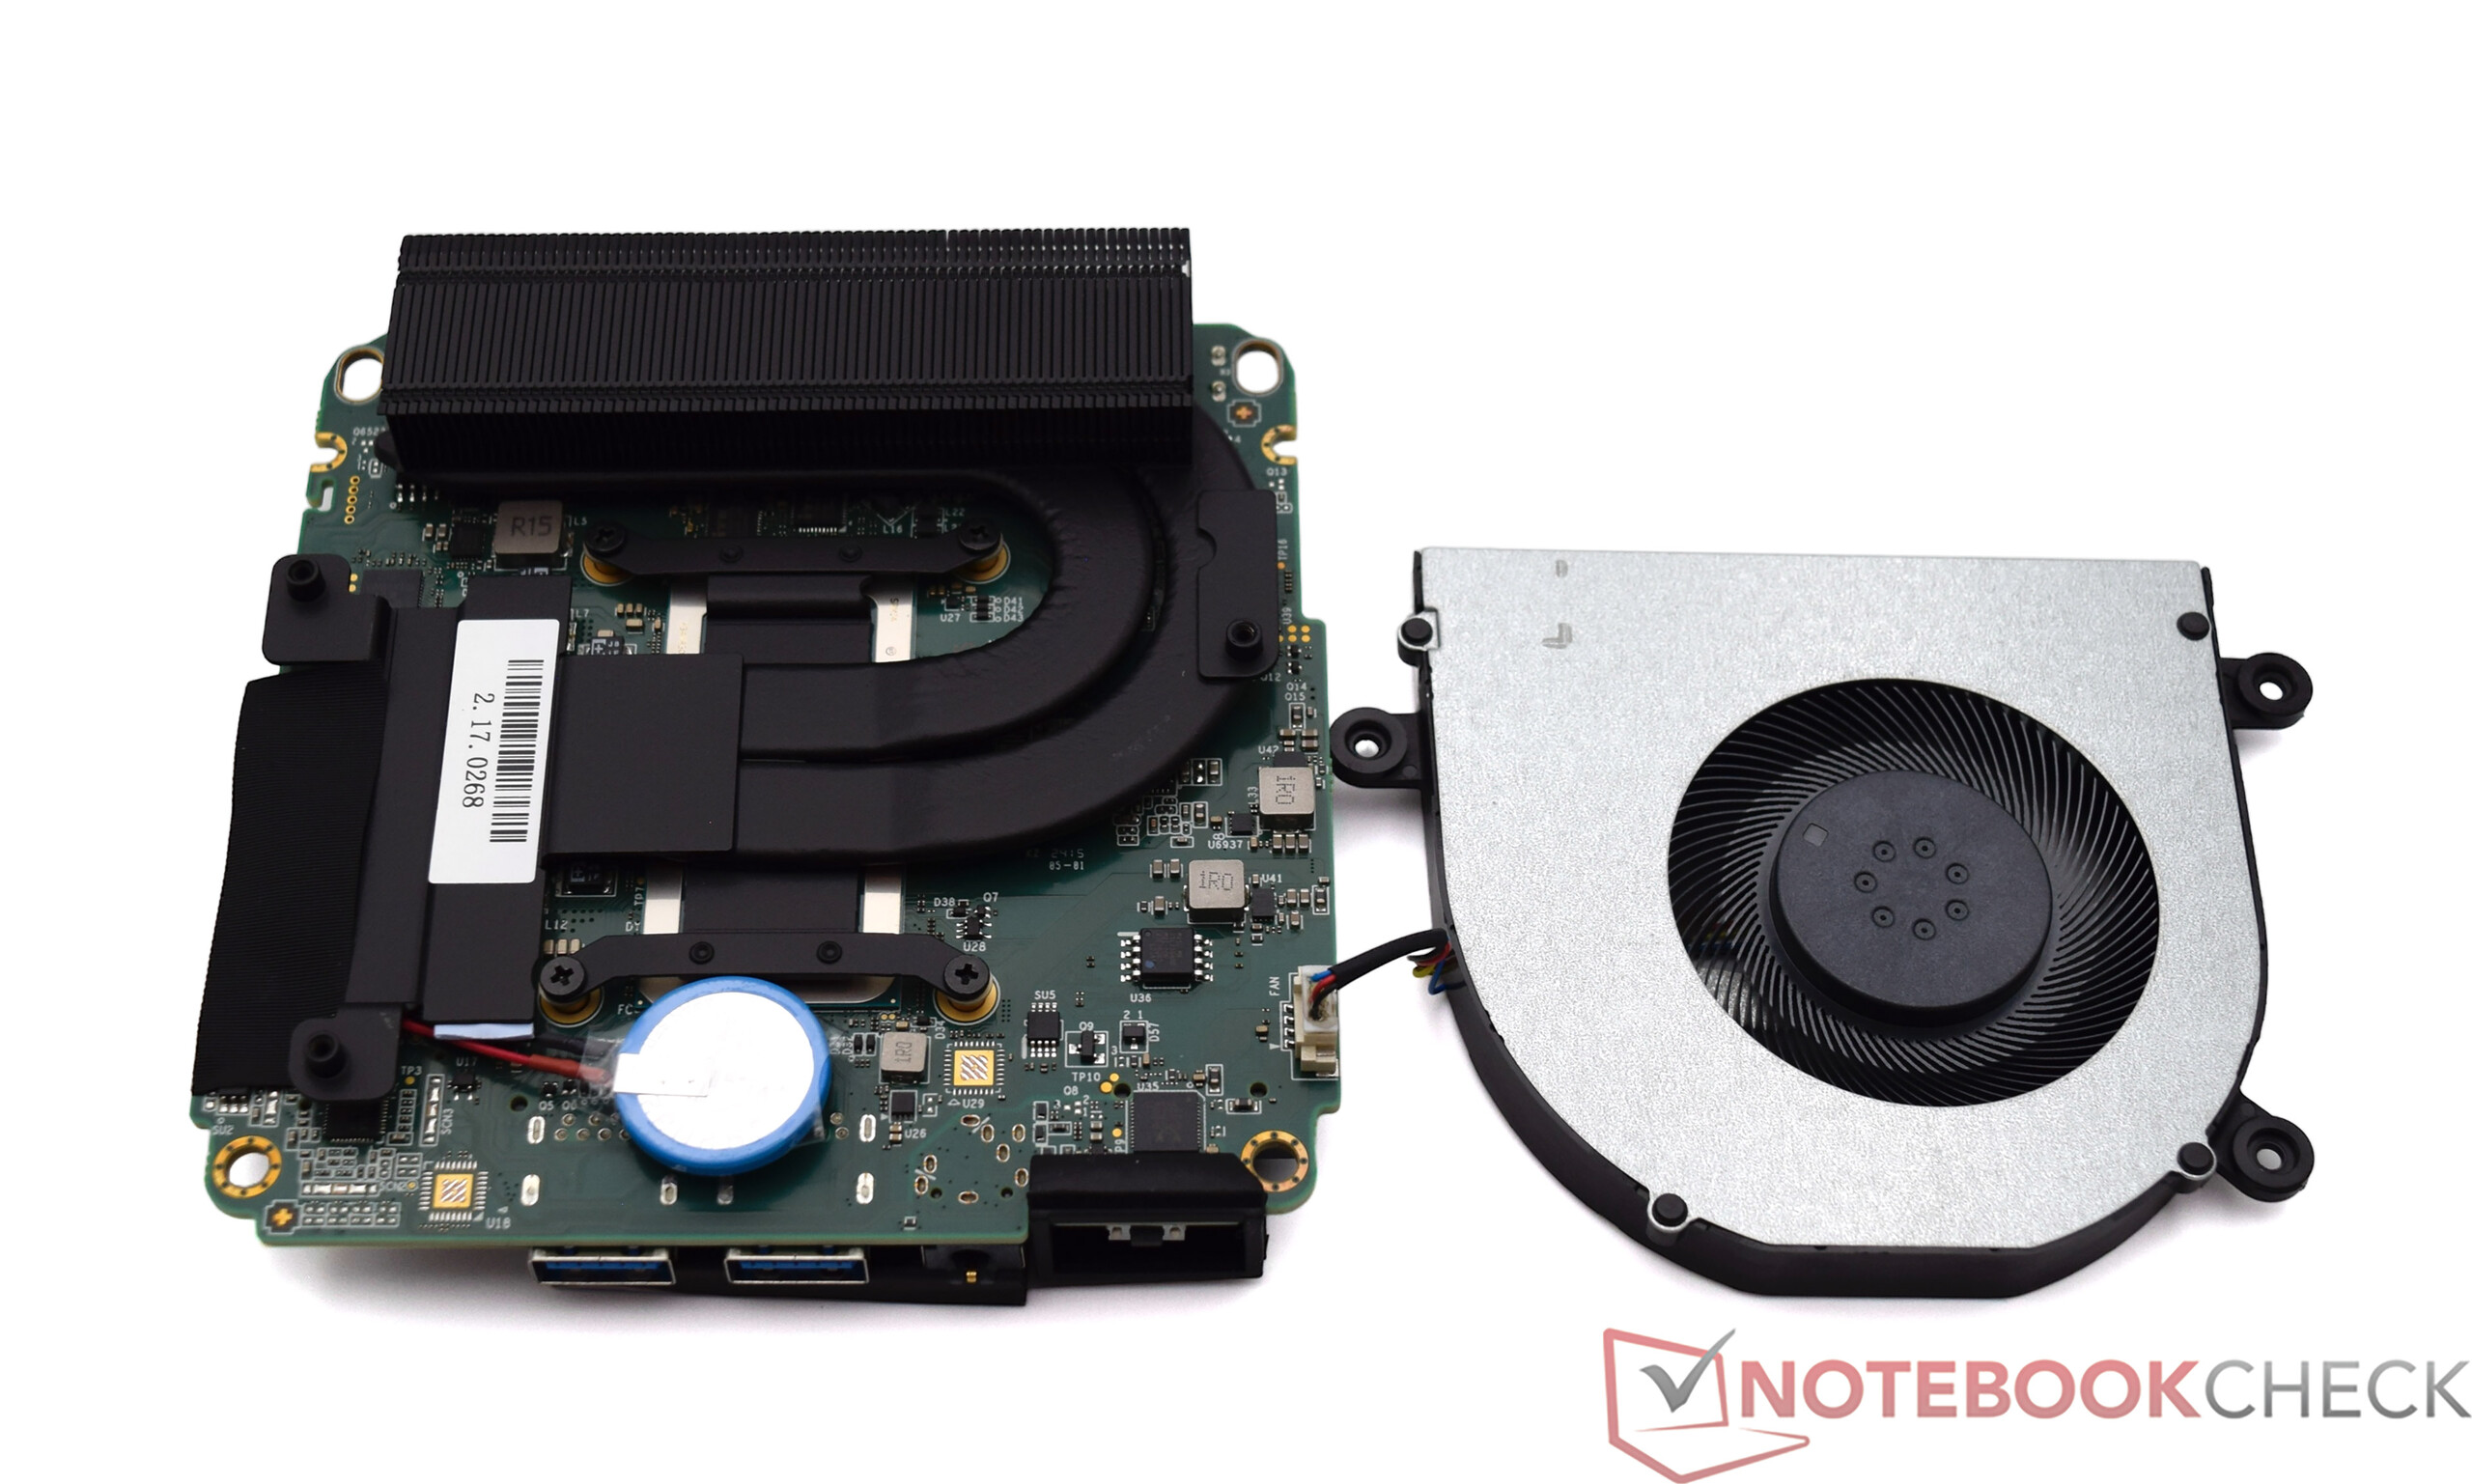
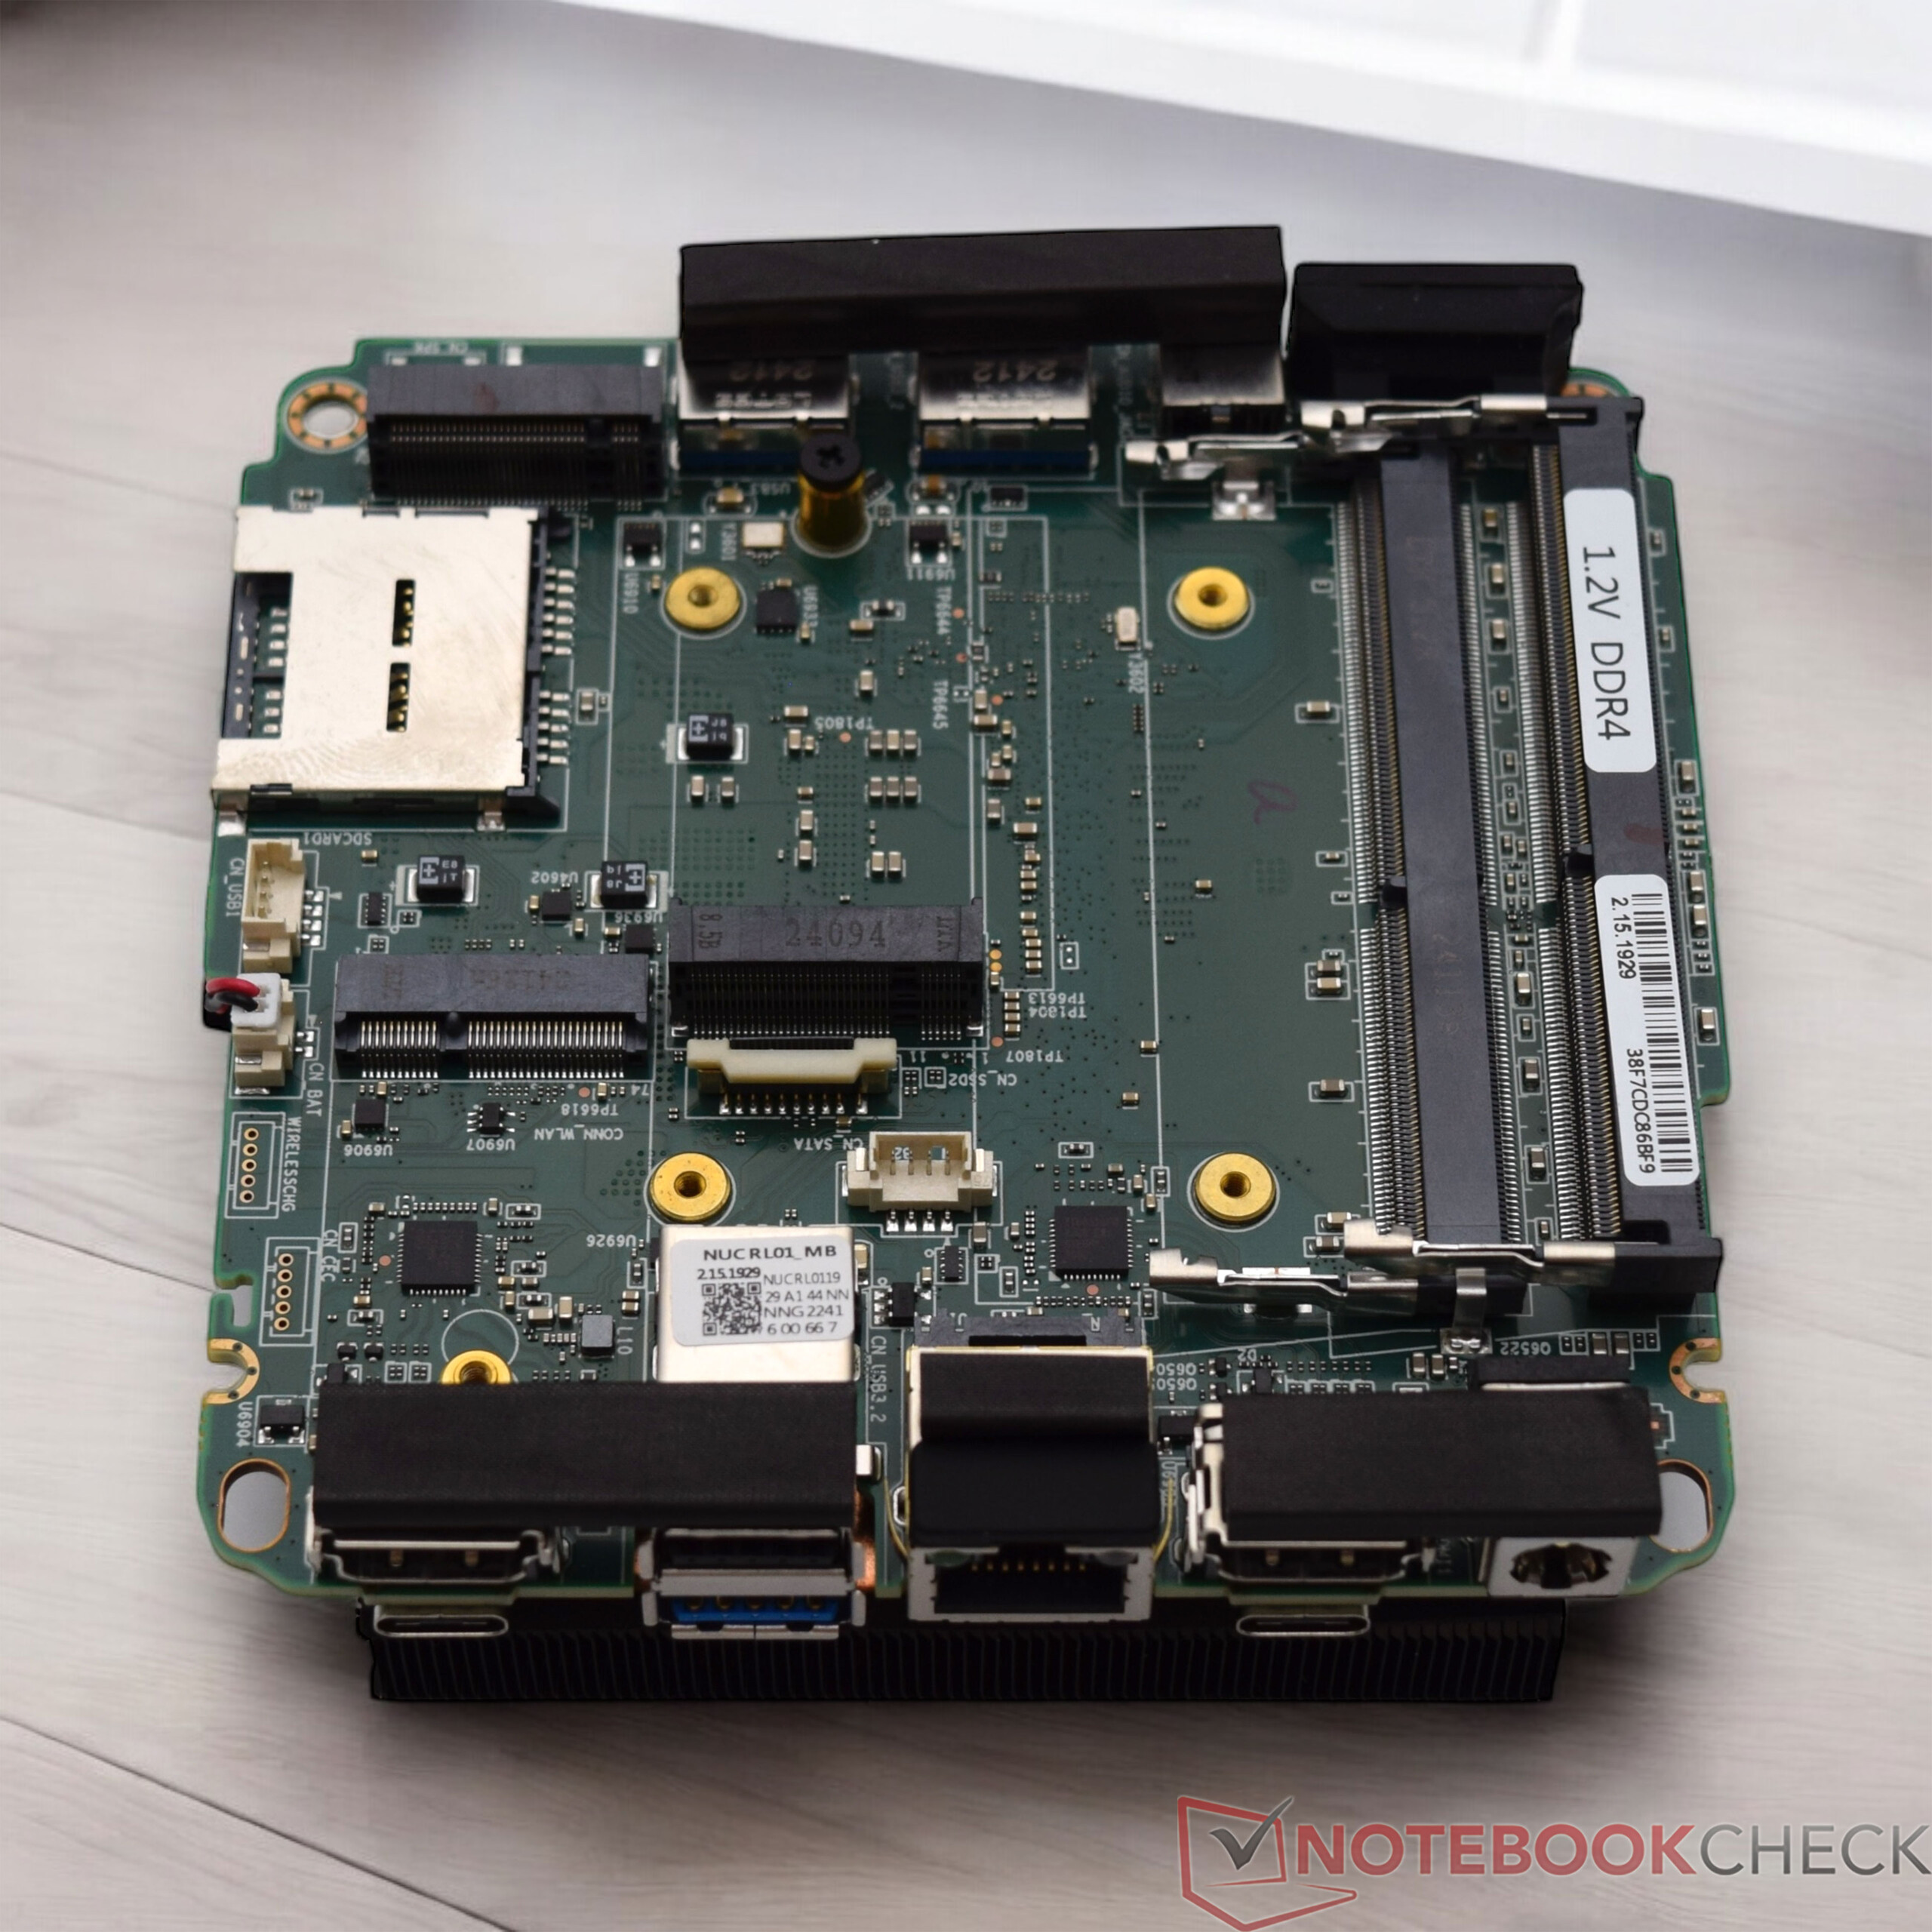
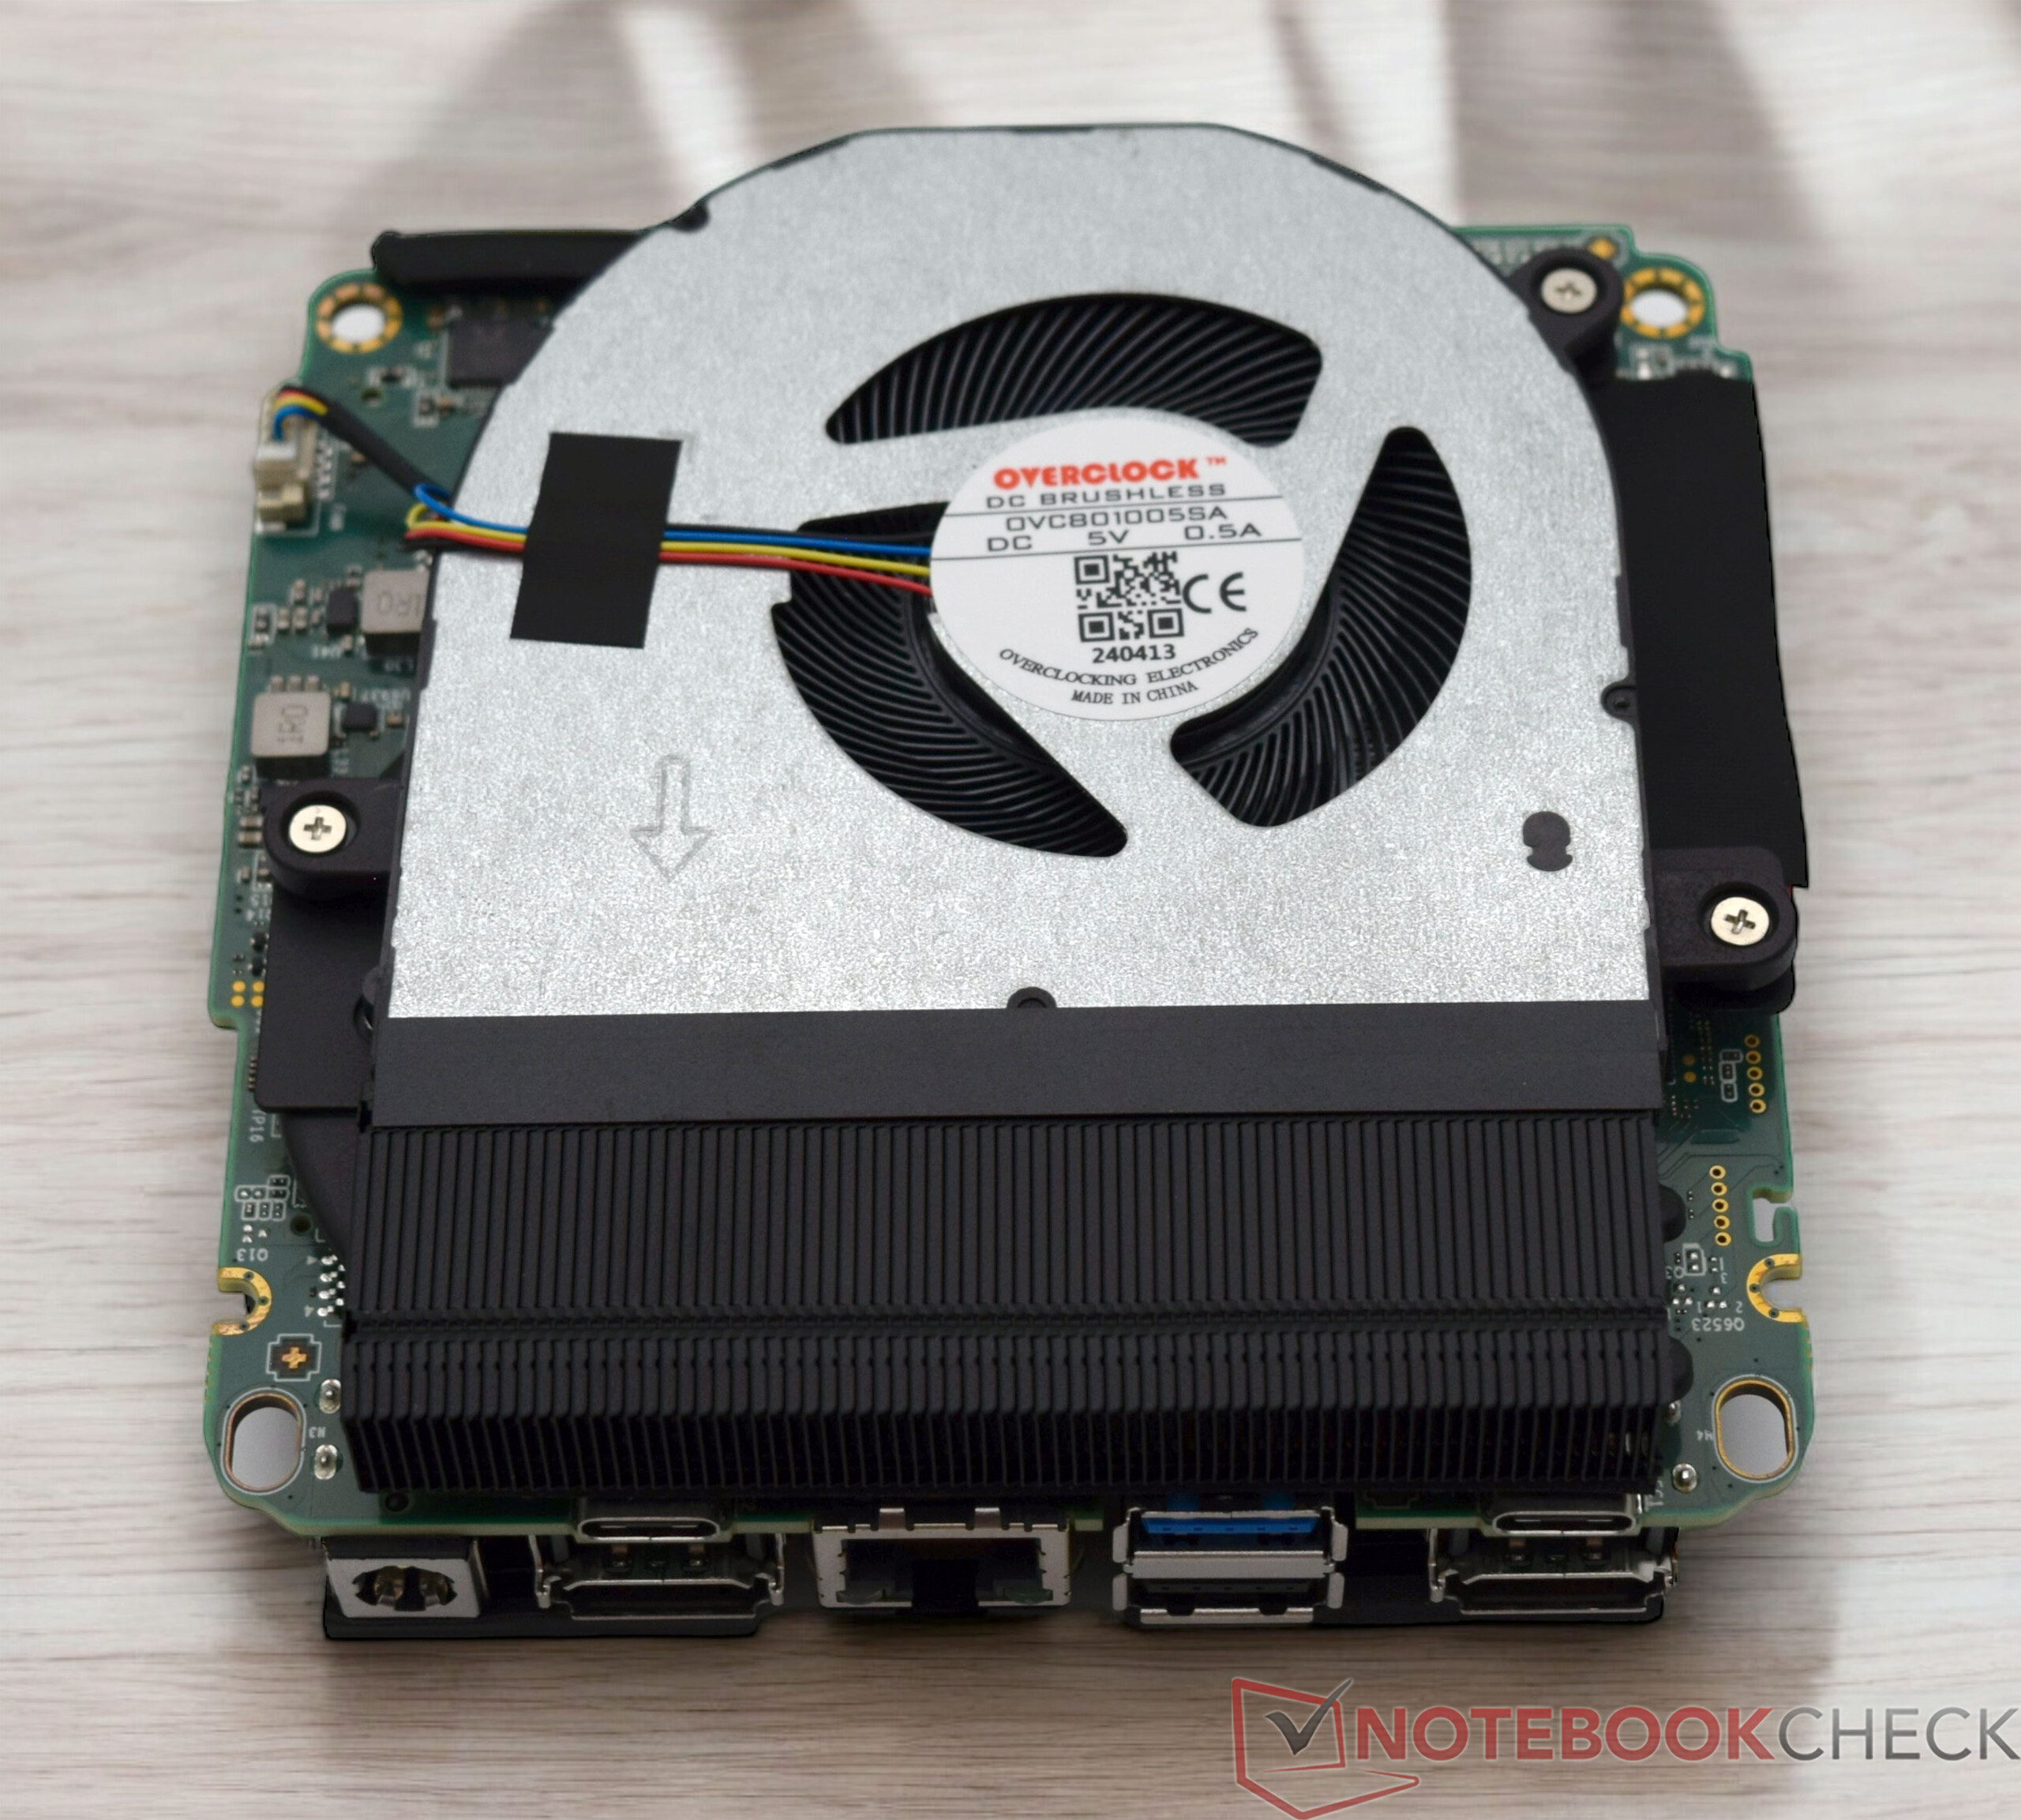
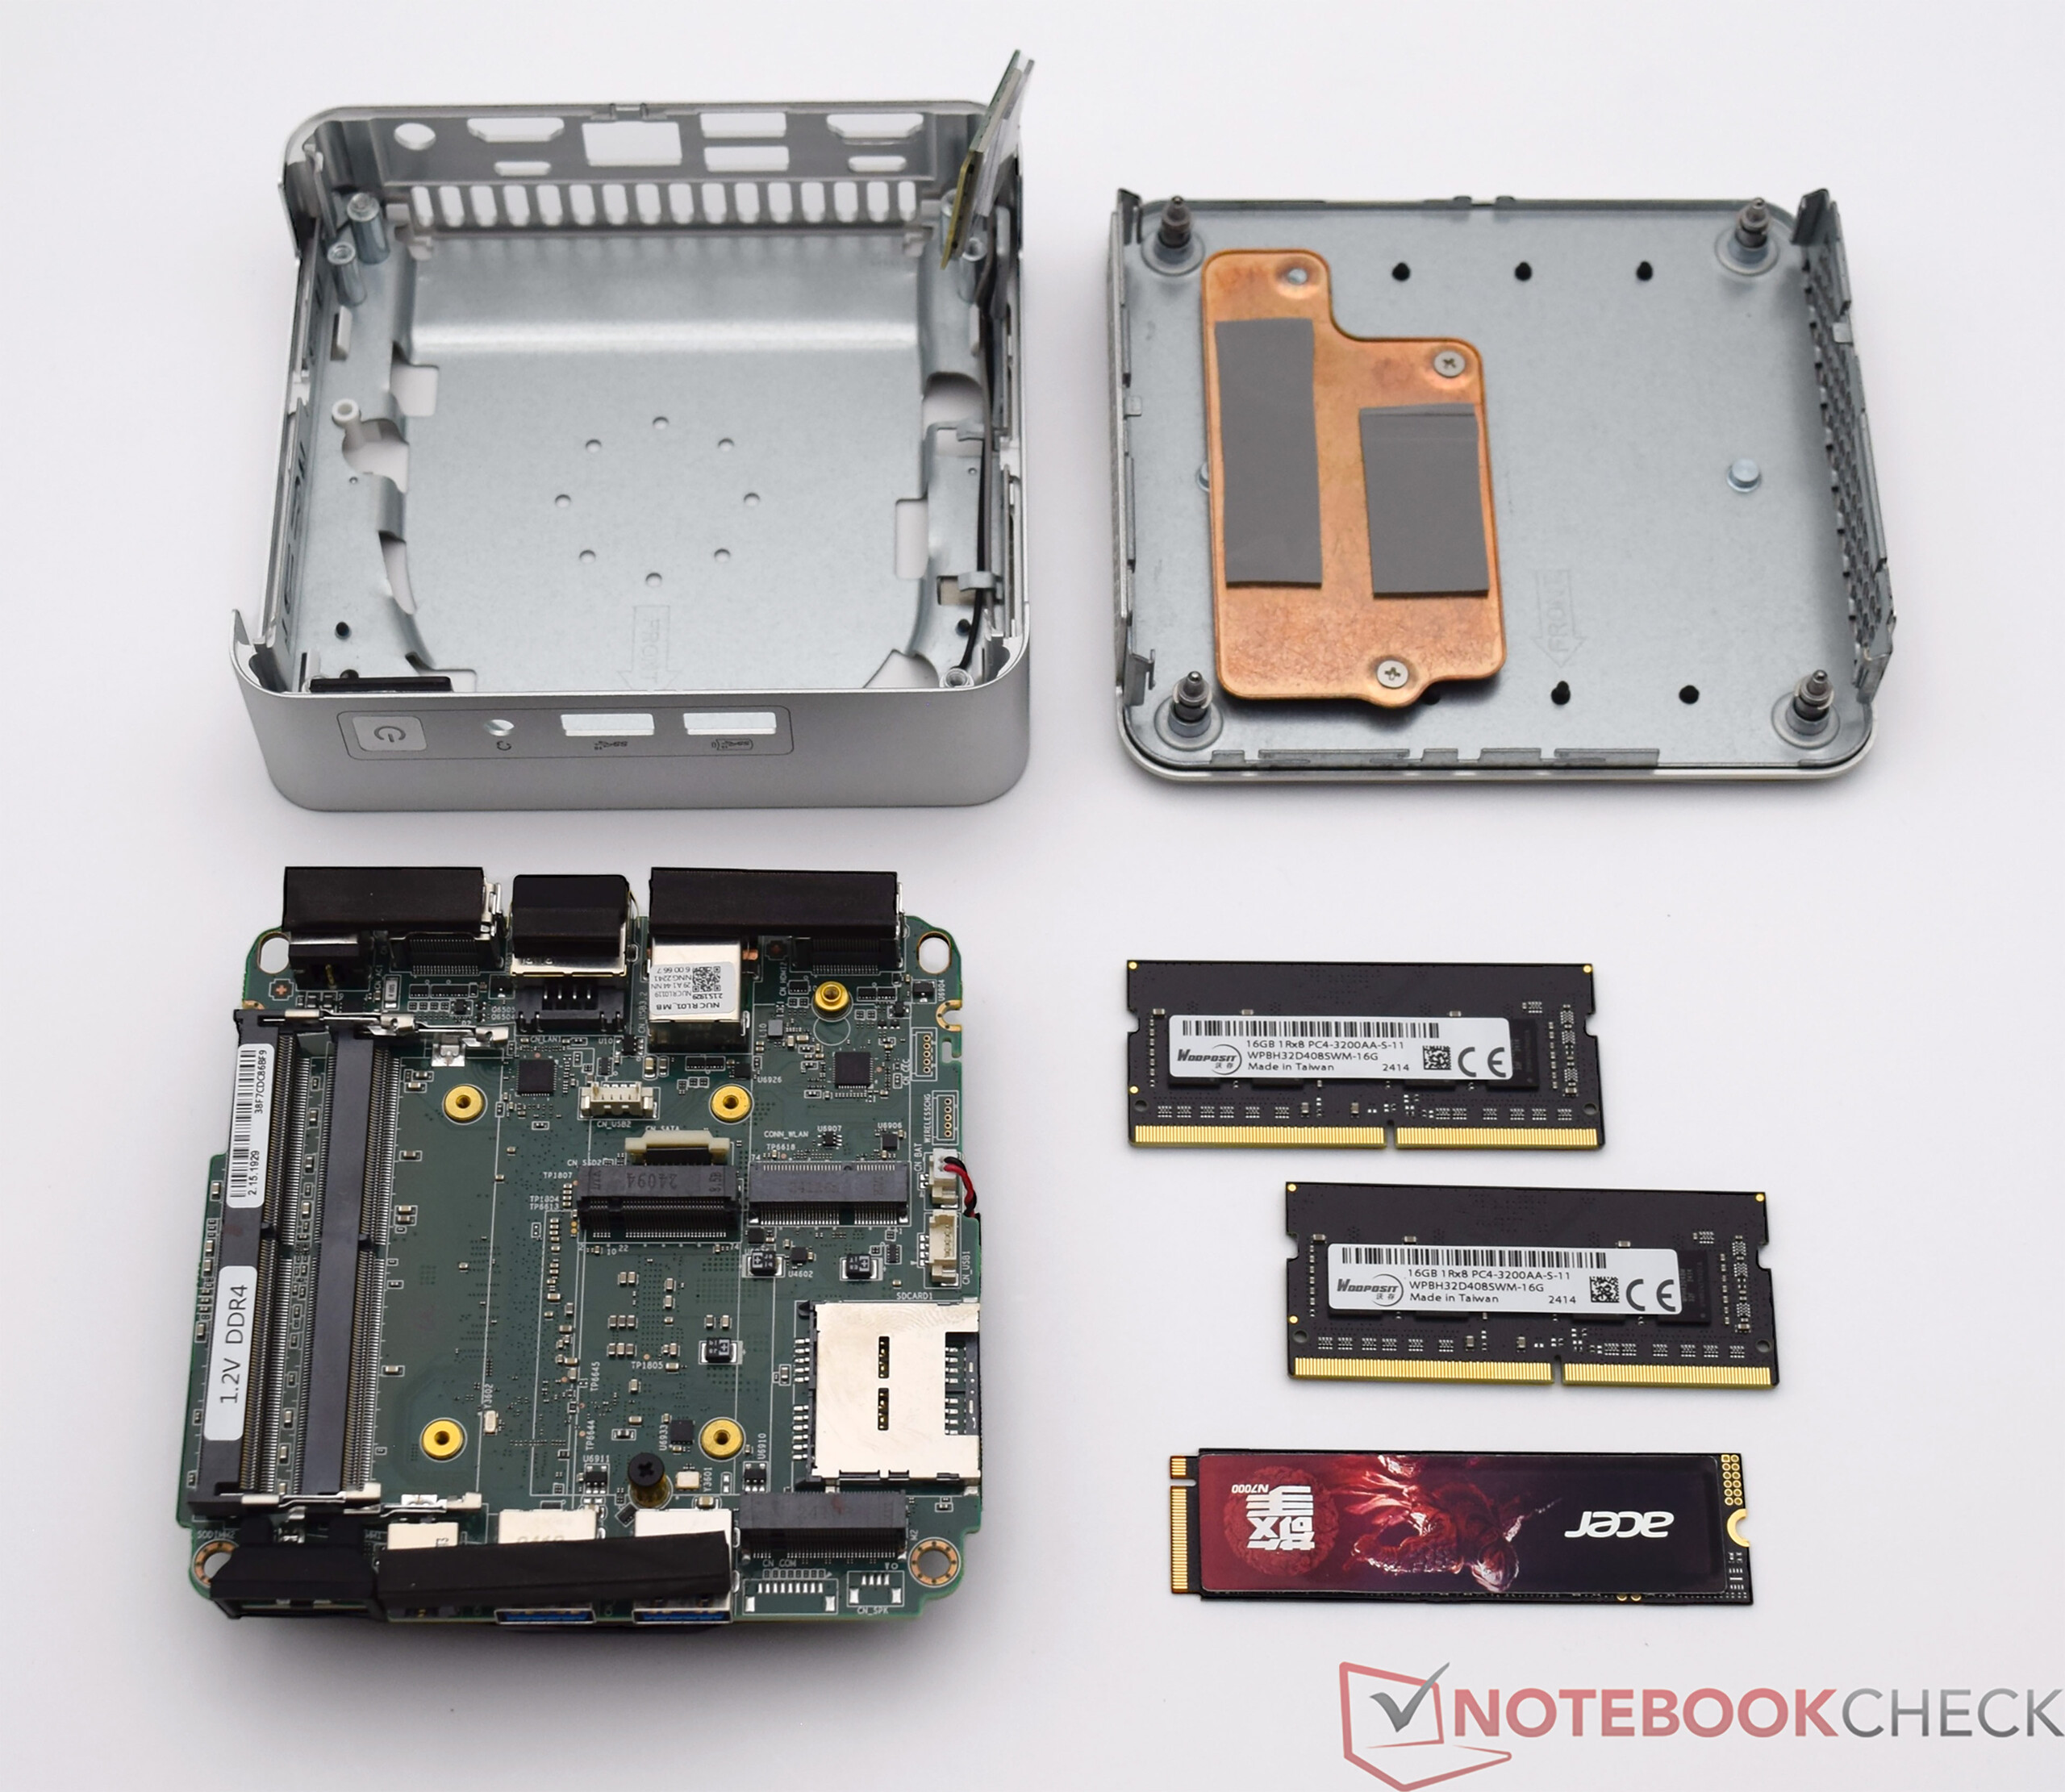
Manutenzione
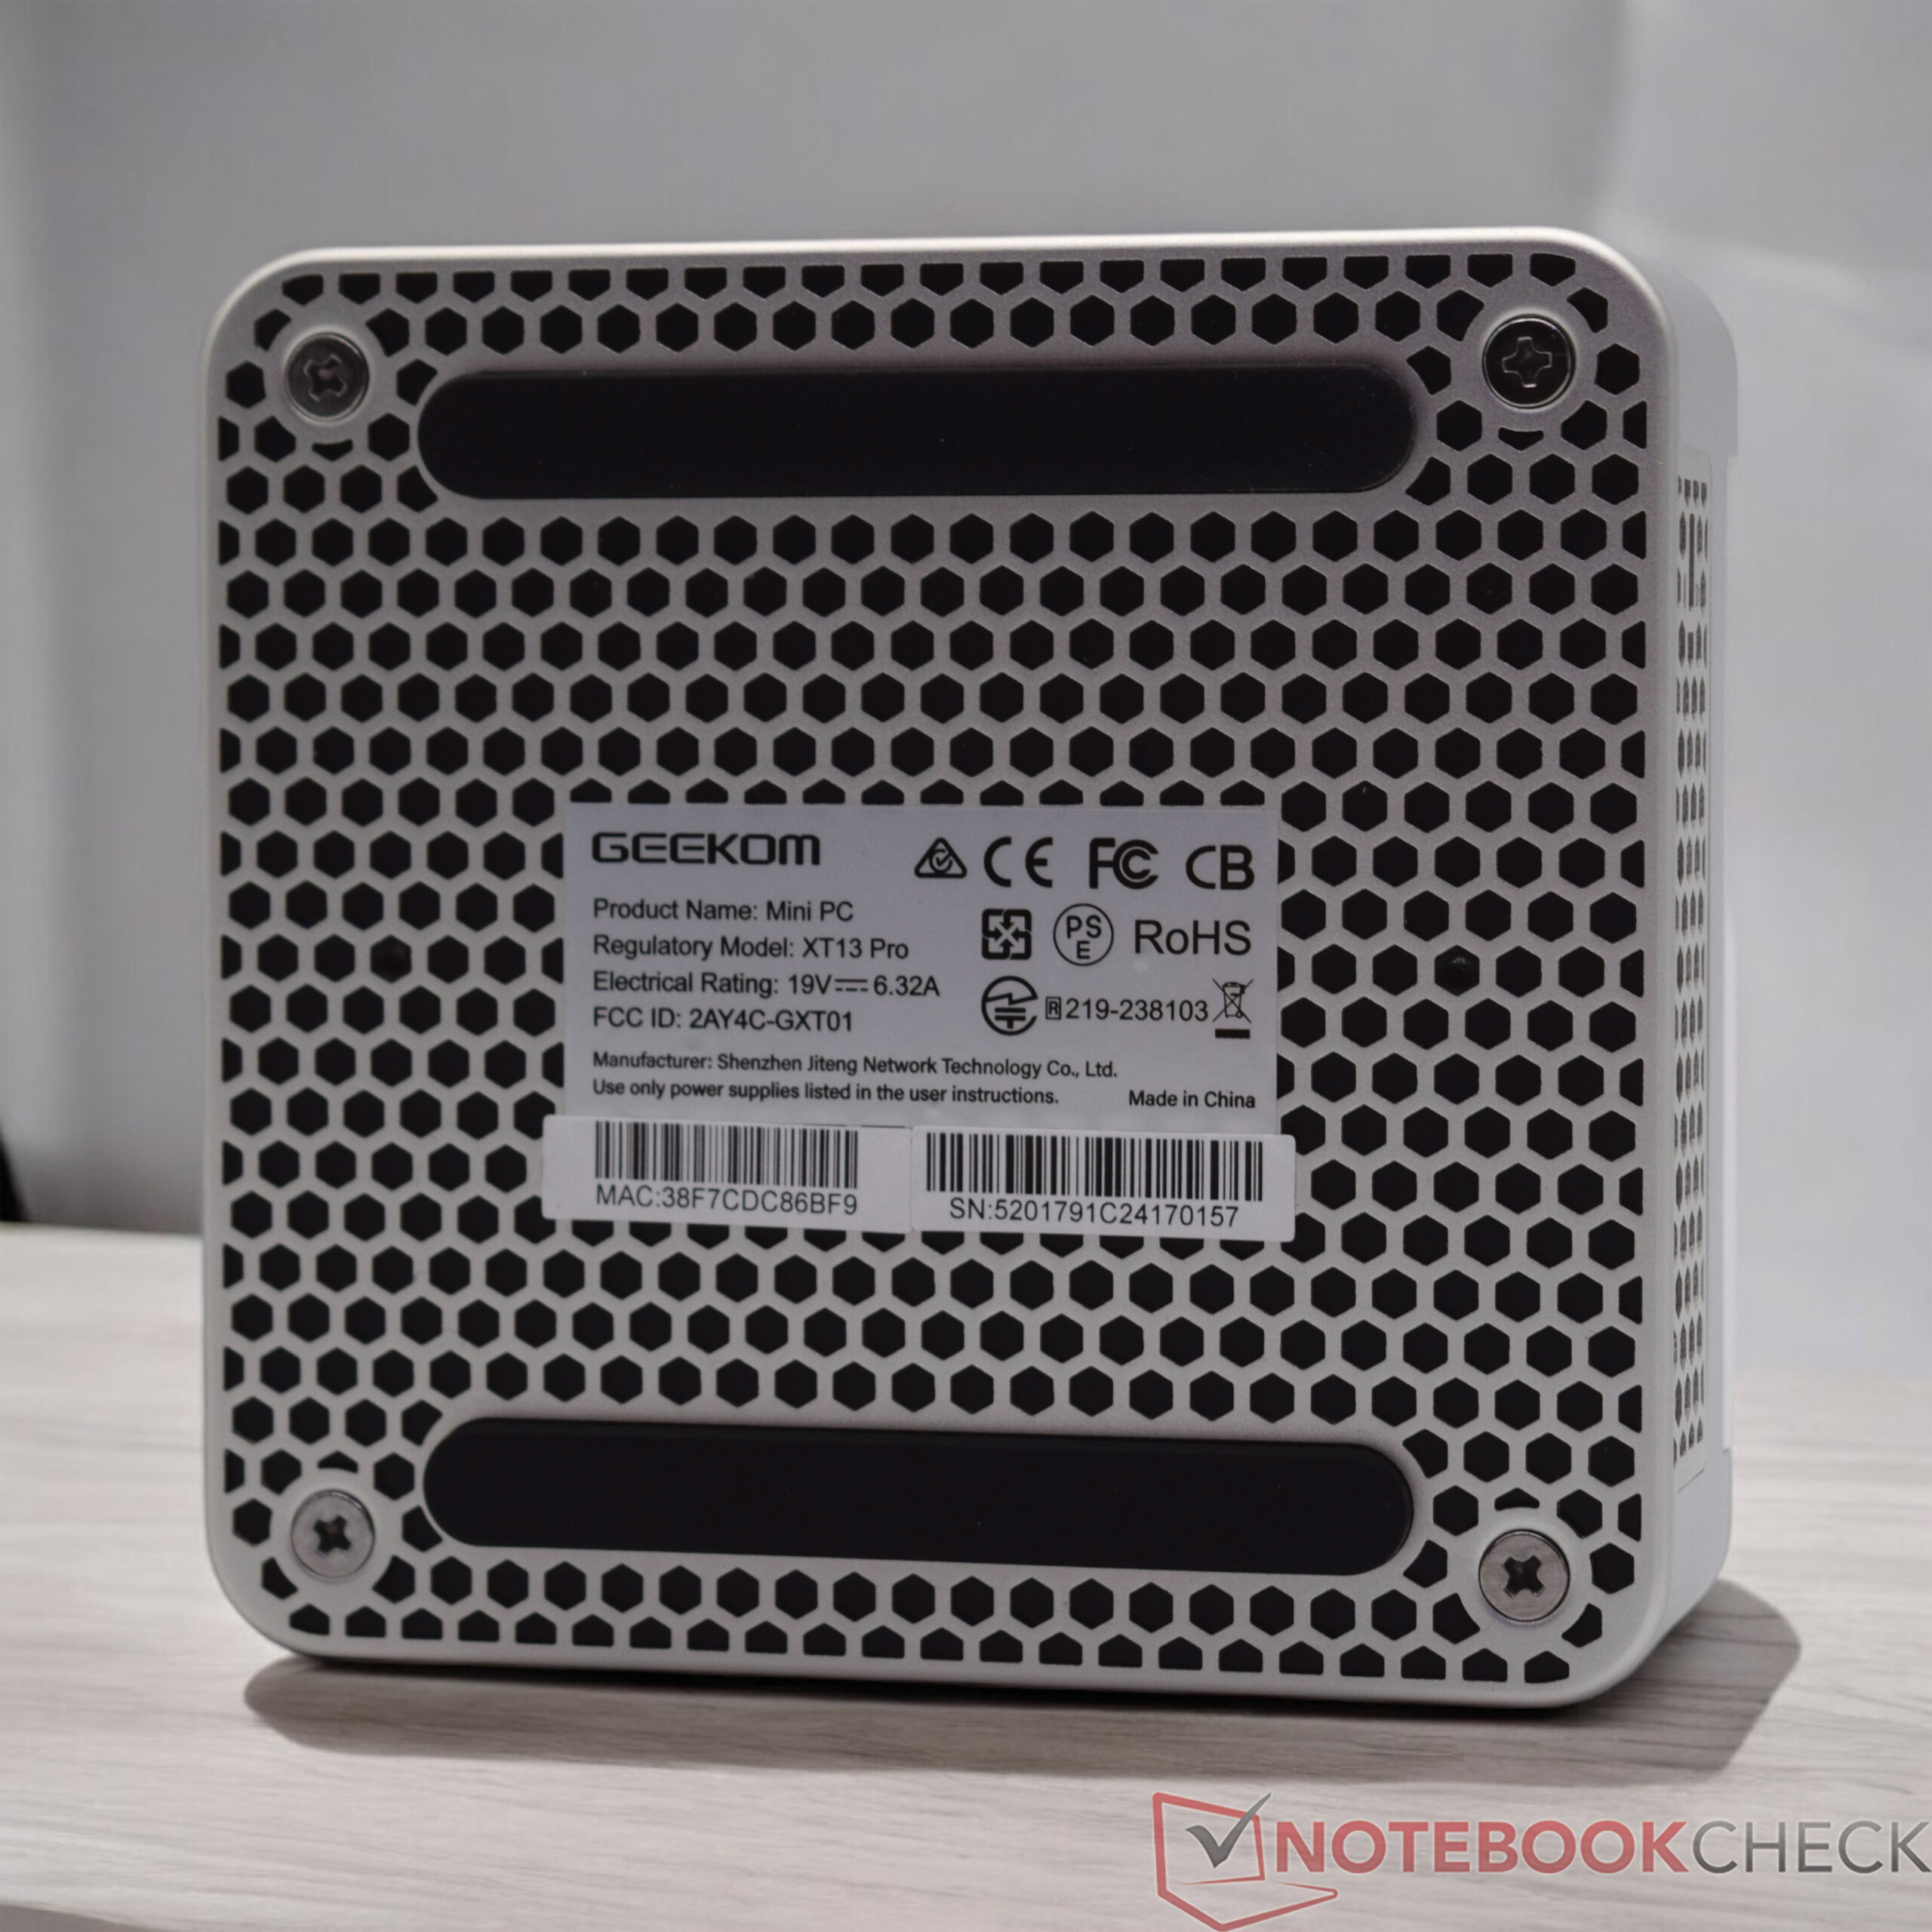
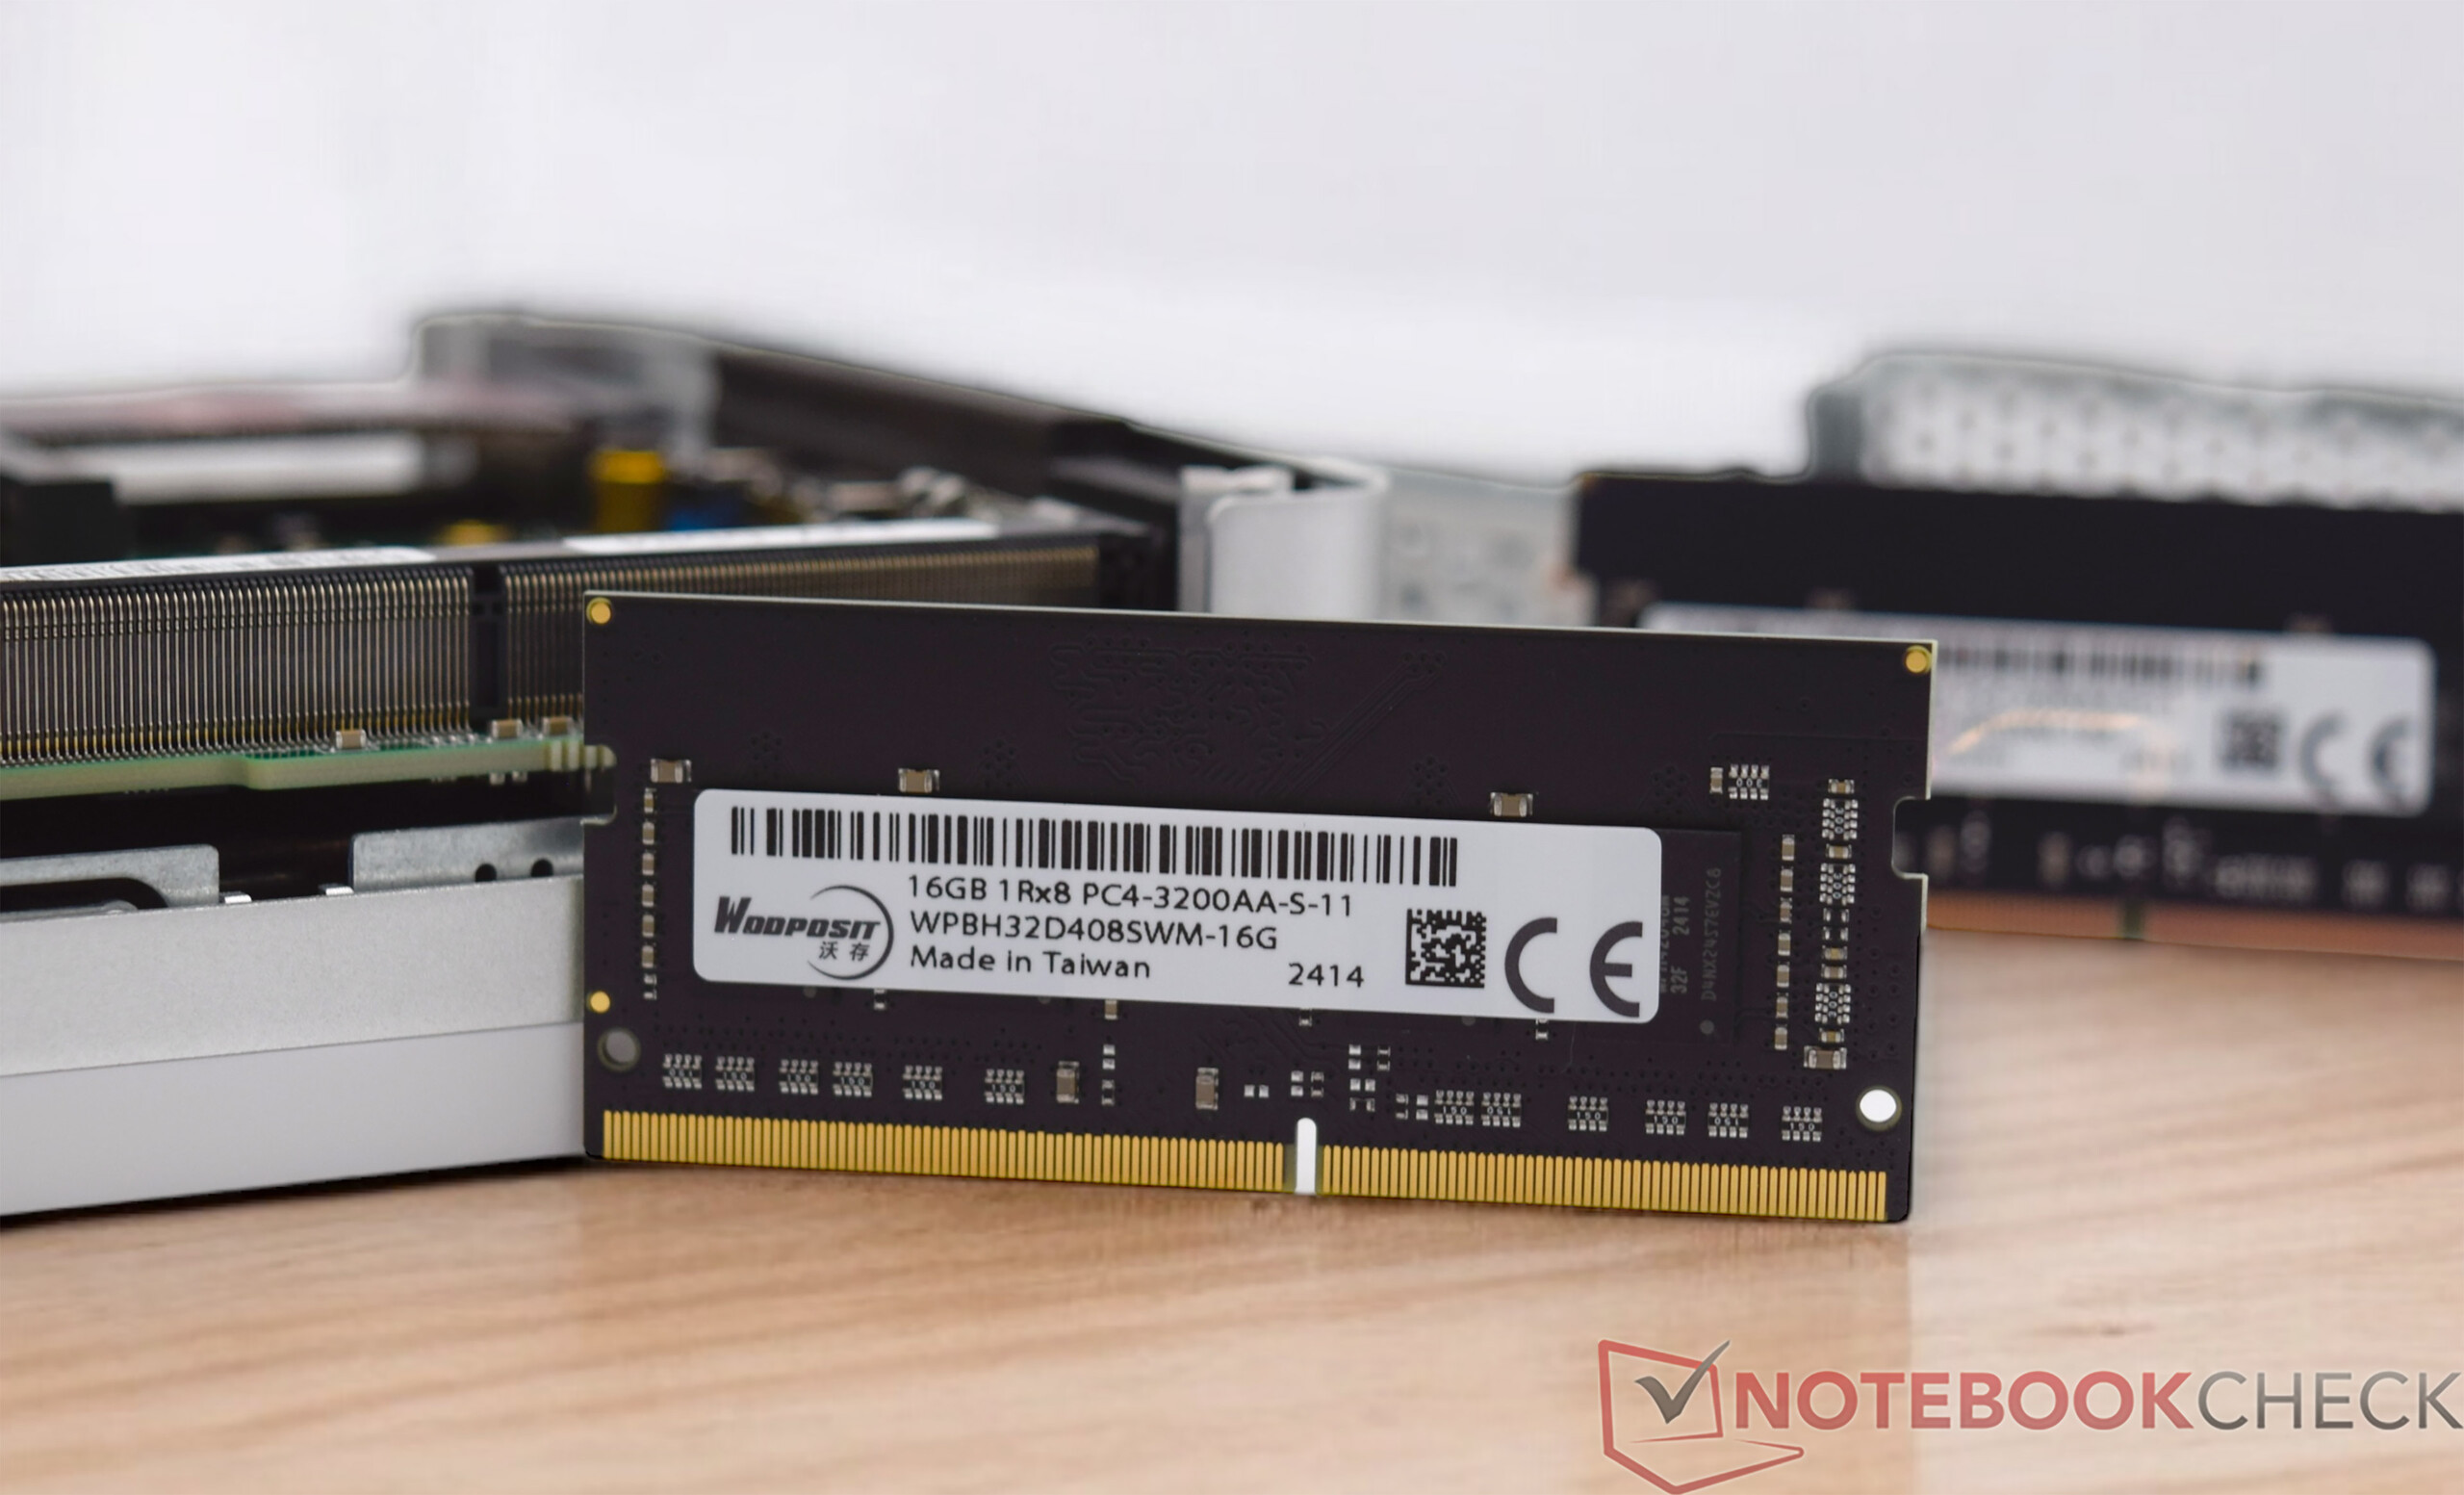
Geekom XT13 Pro è facile da aprire. È necessario allentare solo quattro piccole viti sul lato inferiore, che fissano la piastra di base al resto del case. C'è un radiatore SSD sulla piastra di base stessa, ed è per questo che bisogna fare un po' più di attenzione a questo punto. La RAM e la memoria di massa sono quindi facilmente accessibili. Nel nostro caso, è possibile installare un SSD aggiuntivo. Tuttavia, in questo caso è necessario rispettare lo standard corretto, in quanto sono compatibili solo le unità SSD SATA con una lunghezza di 42 millimetri.
Sostenibilità
Il Geekom XT13 Pro viene consegnato in una scatola relativamente grande con molta "aria". Abbiamo visto che Geekom fa le cose in modo diverso. Inoltre, gli accessori standard forniti sono confezionati in sacchetti di plastica separati, il che potrebbe essere migliorato in termini di sostenibilità. Il dispositivo stesso è realizzato principalmente in metallo e plastica. Tuttavia, non sappiamo se per la sua produzione siano stati utilizzati materiali riciclati. Una nota positiva è che il produttore offre una garanzia di 36 mesi.
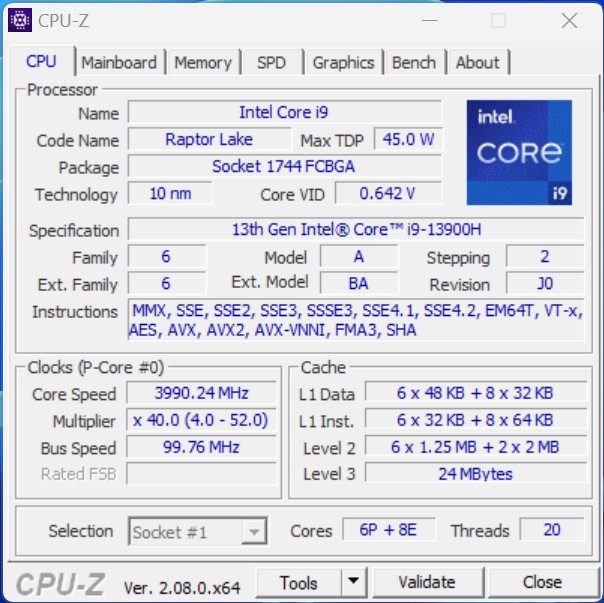
Prestazioni - Intel Core i9-13900H con 14 core e 20 threads
Il Geekom XT13 Pro è disponibile nella configurazione top con l'Intel Core i9-13900H Intel Core i9-13900H nella configurazione top. In alternativa, il NUC PC può anche essere equipaggiato con un Intel Core i7-13620H che è dotato anch'esso di 6P core e dovrebbe essere solo leggermente svantaggiato rispetto al modello superiore in termini di prestazioni. 32 GB di RAM DDR4 sono sempre inclusi, anche se il veloce SSD NVMe fornisce una solida configurazione di base. Il Geekom XT13 Pro non è un compito insormontabile per le applicazioni affamate di prestazioni. Tuttavia, le prestazioni 3D della iGPU sono il principale punto debole, ma possono essere notevolmente migliorate con una eGPU.
Condizioni del test
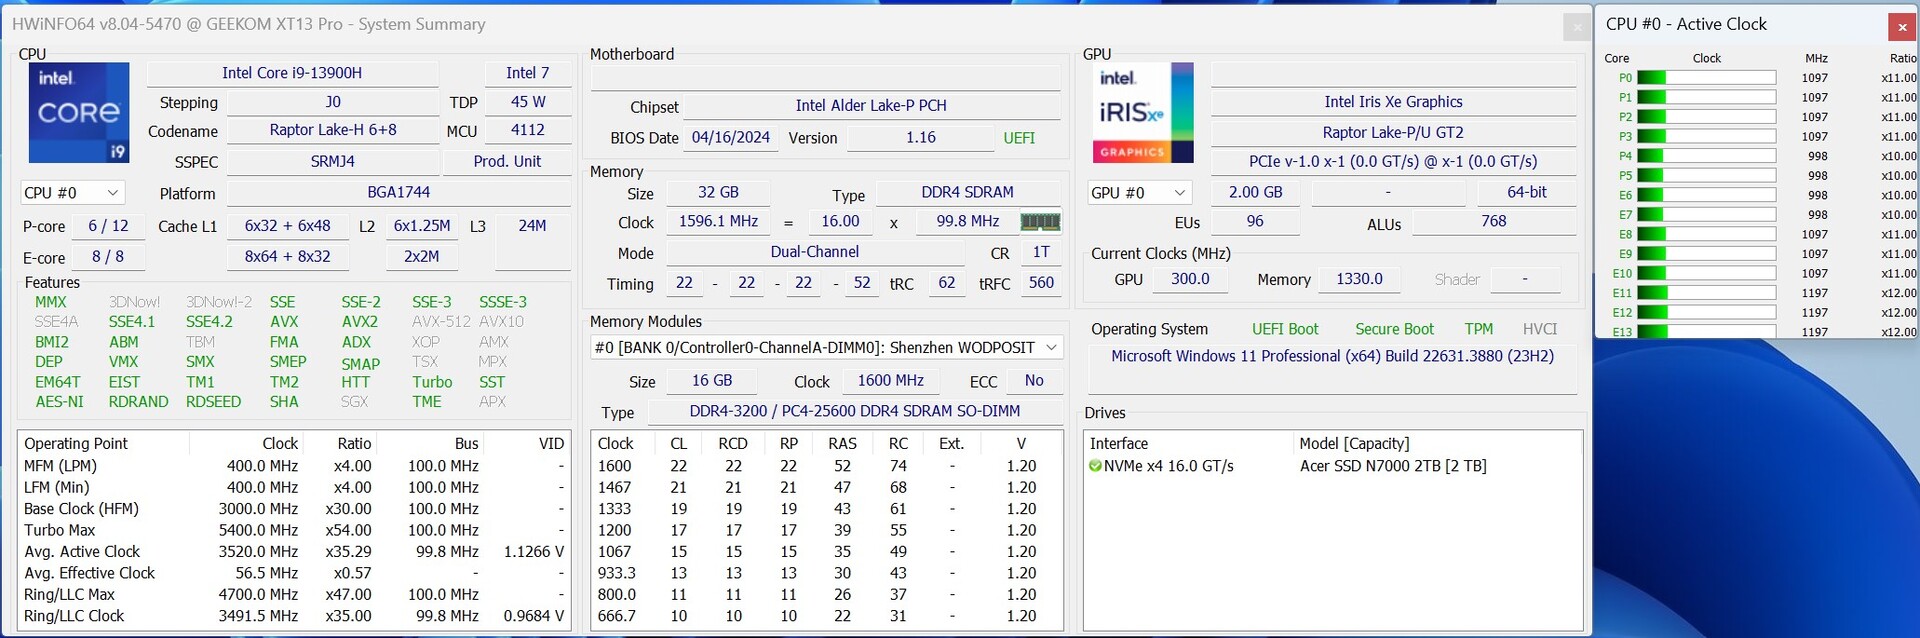
Per tutti i test sulle prestazioni con il Geekom XT13 Pro, utilizziamo il profilo energetico "Prestazioni elevate". Ci sono state solo deviazioni da questo nelle misurazioni del consumo energetico e della rumorosità, secondo i nostri Criteri di test. In conformità alle specifiche del produttore, Geekom consente al SoC di funzionare con il consumo energetico più basso. In cifre, questo significa un limite di potenza di 35 watt sotto carico continuo, anche se sono consentiti fino a 64 watt per brevi periodi.
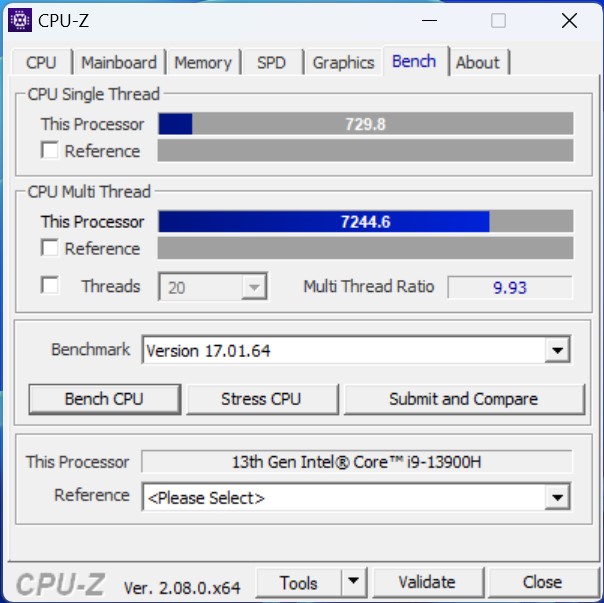
Processore

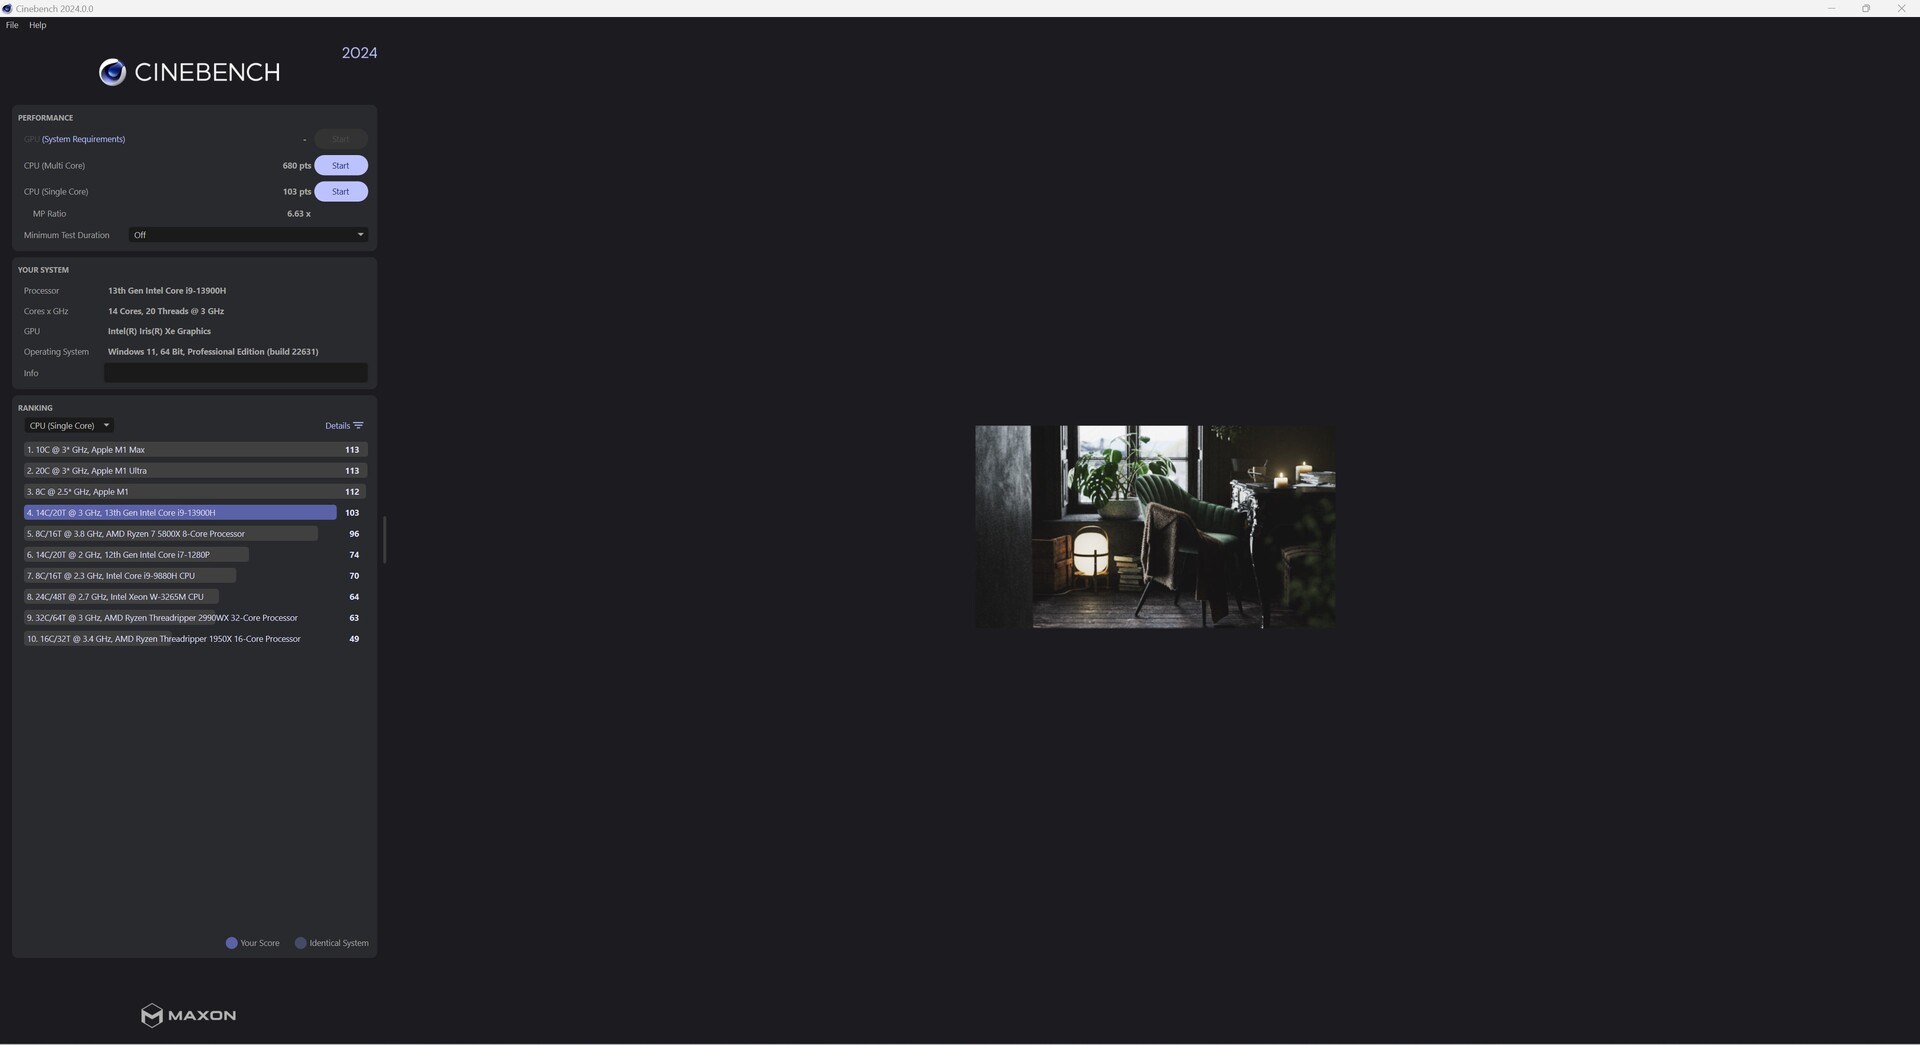
Il Intel Core i9-13900H si basa sull'architettura Raptor Lake e combina 6P e 8E core. Tecnicamente, ci sono Intel Core i9-12900H come possiamo vedere dai risultati del nostro benchmark nella valutazione delle prestazioni rispetto al modello Geekom XT12 Pro. Nel dettaglio, tuttavia, notiamo un leggero vantaggio a favore dell'Intel Core i9-13900H, che può attirare l'attenzione su di sé con prestazioni multi-core leggermente migliori. Uno AMD Ryzen 9 7940HS o i modelli più recenti di Intel della serie Meteor Lake. Tuttavia, il divario con i modelli leggermente più veloci della concorrenza non è molto grande. Non si può parlare di una differenza notevole nelle prestazioni nell'uso quotidiano, a causa delle piccole differenze.
Può trovare altri benchmark per i processori qui.
| Performance rating - Percent | |
| Geekom A7 | |
| Aoostar GEM12 | |
| Minisforum AtomMan X7 Ti | |
| Acemagic F2A | |
| Geekom XT13 Pro | |
| Geekom XT12 Pro | |
| Cinebench 2024 | |
| CPU Multi Core | |
| Minisforum AtomMan X7 Ti | |
| Acemagic F2A | |
| Aoostar GEM12 | |
| Geekom A7 | |
| Geekom XT13 Pro | |
| Geekom XT12 Pro | |
| CPU Single Core | |
| Minisforum AtomMan X7 Ti | |
| Geekom A7 | |
| Geekom XT12 Pro | |
| Aoostar GEM12 | |
| Acemagic F2A | |
| Geekom XT13 Pro | |
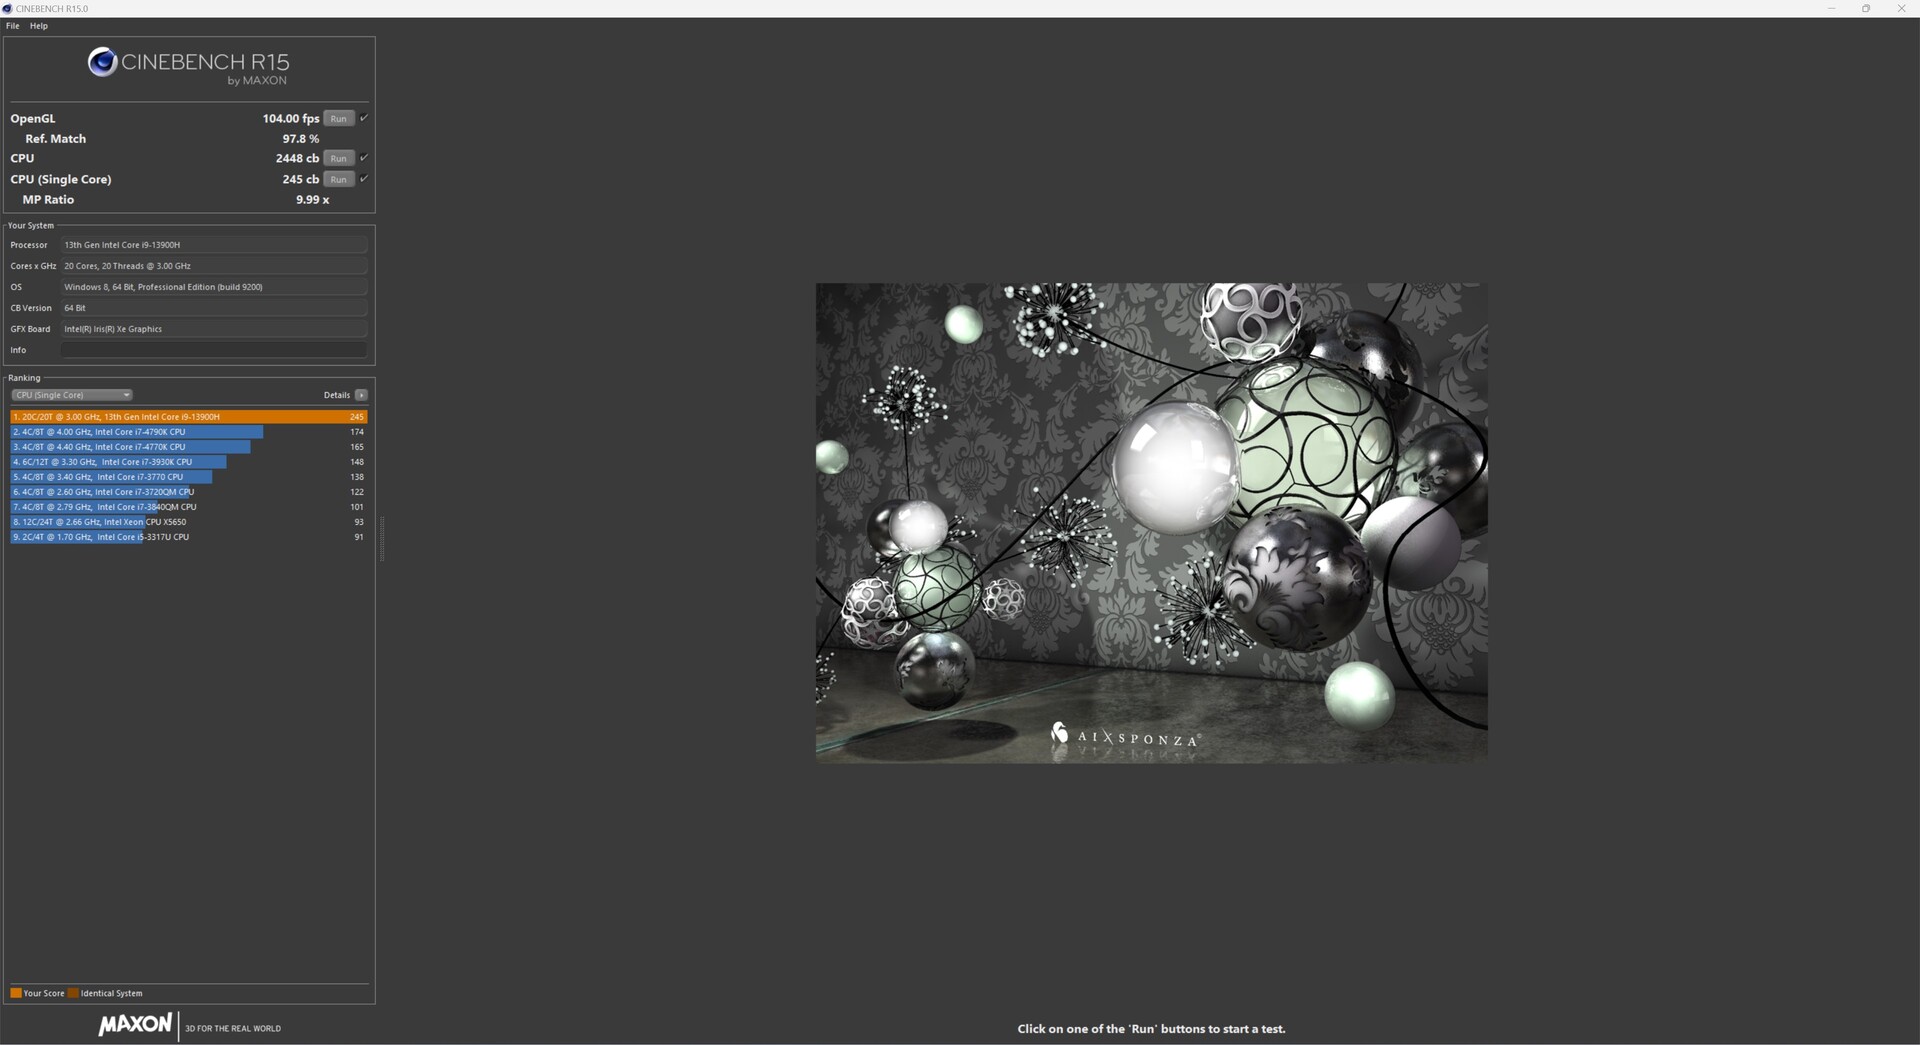
| Cinebench R15 | |
| CPU Single 64Bit | |
| Aoostar GEM12 | |
| Geekom A7 | |
| Minisforum AtomMan X7 Ti | |
| Acemagic F2A | |
| Geekom XT12 Pro | |
| Geekom XT13 Pro | |
| CPU Multi 64Bit | |
| Minisforum AtomMan X7 Ti | |
| Acemagic F2A | |
| Aoostar GEM12 | |
| Geekom A7 | |
| Geekom XT13 Pro | |
| Geekom XT12 Pro | |
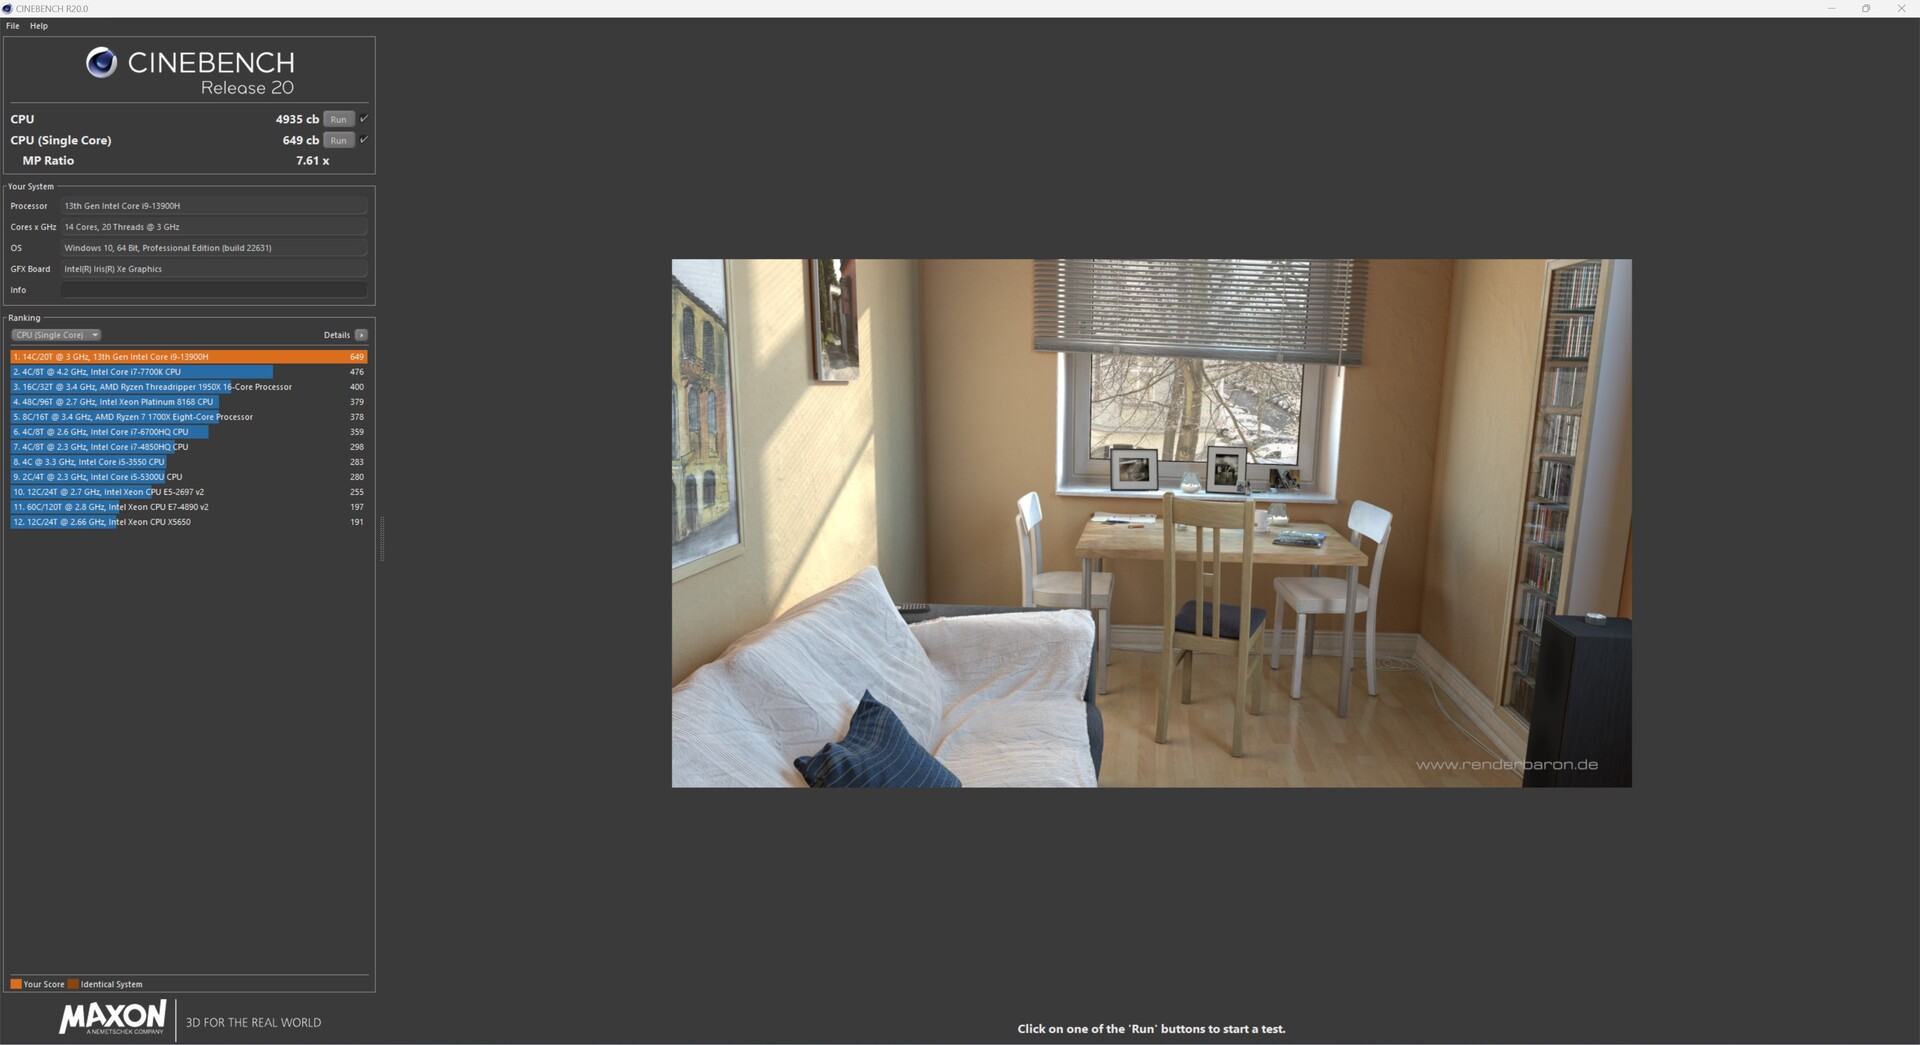
| Cinebench R20 | |
| CPU (Single Core) | |
| Minisforum AtomMan X7 Ti | |
| Geekom XT12 Pro | |
| Geekom A7 | |
| Aoostar GEM12 | |
| Acemagic F2A | |
| Geekom XT13 Pro | |
| CPU (Multi Core) | |
| Minisforum AtomMan X7 Ti | |
| Acemagic F2A | |
| Aoostar GEM12 | |
| Geekom A7 | |
| Geekom XT13 Pro | |
| Geekom XT12 Pro | |
| Cinebench R11.5 | |
| CPU Single 64Bit | |
| Geekom A7 | |
| Aoostar GEM12 | |
| Minisforum AtomMan X7 Ti | |
| Acemagic F2A | |
| Geekom XT12 Pro | |
| Geekom XT13 Pro | |
| CPU Multi 64Bit | |
| Minisforum AtomMan X7 Ti | |
| Acemagic F2A | |
| Geekom A7 | |
| Aoostar GEM12 | |
| Geekom XT13 Pro | |
| Geekom XT12 Pro | |
| Cinebench R10 | |
| Rendering Single CPUs 64Bit | |
| Minisforum AtomMan X7 Ti | |
| Geekom A7 | |
| Aoostar GEM12 | |
| Acemagic F2A | |
| Geekom XT13 Pro | |
| Geekom XT12 Pro | |
| Rendering Multiple CPUs 64Bit | |
| Acemagic F2A | |
| Minisforum AtomMan X7 Ti | |
| Aoostar GEM12 | |
| Geekom A7 | |
| Geekom XT13 Pro | |
| Geekom XT12 Pro | |
| Blender - v2.79 BMW27 CPU | |
| Geekom XT12 Pro | |
| Geekom XT13 Pro | |
| Geekom A7 | |
| Aoostar GEM12 | |
| Acemagic F2A | |
| Minisforum AtomMan X7 Ti | |
| wPrime 2.10 | |
| 32m | |
| Geekom XT12 Pro | |
| Acemagic F2A | |
| Geekom XT13 Pro | |
| Minisforum AtomMan X7 Ti | |
| Aoostar GEM12 | |
| Geekom A7 | |
| 1024m | |
| Minisforum AtomMan X7 Ti | |
| Geekom XT13 Pro | |
| Geekom XT12 Pro | |
| Acemagic F2A | |
| Aoostar GEM12 | |
| Geekom A7 | |
| WinRAR - Result | |
| Geekom XT12 Pro | |
| Minisforum AtomMan X7 Ti | |
| Acemagic F2A | |
| Geekom A7 | |
| Aoostar GEM12 | |
| Geekom XT13 Pro | |
| Geekbench 5.0 | |
| 5.0 Multi-Core | |
| Minisforum AtomMan X7 Ti | |
| Acemagic F2A | |
| Geekom A7 | |
| Aoostar GEM12 | |
| Geekom XT13 Pro | |
| Geekom XT12 Pro | |
| 5.0 Single-Core | |
| Geekom A7 | |
| Aoostar GEM12 | |
| Minisforum AtomMan X7 Ti | |
| Geekom XT12 Pro | |
| Acemagic F2A | |
| Geekom XT13 Pro | |
| Geekbench 4.4 | |
| 64 Bit Single-Core Score | |
| Geekom A7 | |
| Aoostar GEM12 | |
| Geekom XT12 Pro | |
| Minisforum AtomMan X7 Ti | |
| Geekom XT13 Pro | |
| Acemagic F2A | |
| 64 Bit Multi-Core Score | |
| Geekom A7 | |
| Minisforum AtomMan X7 Ti | |
| Aoostar GEM12 | |
| Acemagic F2A | |
| Geekom XT13 Pro | |
| Geekom XT12 Pro | |
| 3DMark 11 - 1280x720 Performance Physics | |
| Geekom A7 | |
| Minisforum AtomMan X7 Ti | |
| Aoostar GEM12 | |
| Acemagic F2A | |
| Geekom XT13 Pro | |
| Geekom XT12 Pro | |
| HWBOT x265 Benchmark v2.2 - 4k Preset | |
| Minisforum AtomMan X7 Ti | |
| Geekom A7 | |
| Aoostar GEM12 | |
| Acemagic F2A | |
| Geekom XT13 Pro | |
| Geekom XT12 Pro | |
| R Benchmark 2.5 - Overall mean | |
| Geekom XT13 Pro | |
| Acemagic F2A | |
| Geekom XT12 Pro | |
| Minisforum AtomMan X7 Ti | |
| Aoostar GEM12 | |
| Geekom A7 | |
| LibreOffice - 20 Documents To PDF | |
| Geekom A7 | |
| Minisforum AtomMan X7 Ti | |
| Aoostar GEM12 | |
| Geekom XT13 Pro | |
| Acemagic F2A | |
| Geekom XT12 Pro | |
| WebXPRT 3 - Overall | |
| Geekom A7 | |
| Aoostar GEM12 | |
| Geekom XT12 Pro | |
| Acemagic F2A | |
| Geekom XT13 Pro | |
| Minisforum AtomMan X7 Ti | |
| Mozilla Kraken 1.1 - Total | |
| Geekom XT13 Pro | |
| Acemagic F2A | |
| Minisforum AtomMan X7 Ti | |
| Aoostar GEM12 | |
| Geekom XT12 Pro | |
| Geekom A7 | |
| 3DMark | |
| 1920x1080 Fire Strike Physics | |
| Aoostar GEM12 | |
| Minisforum AtomMan X7 Ti | |
| Geekom A7 | |
| Acemagic F2A | |
| Geekom XT13 Pro | |
| Geekom XT12 Pro | |
| 2560x1440 Time Spy CPU | |
| Minisforum AtomMan X7 Ti | |
| Aoostar GEM12 | |
| Geekom A7 | |
| Acemagic F2A | |
| Geekom XT13 Pro | |
| Geekom XT12 Pro | |
| Super Pi mod 1.5 XS 1M - 1M | |
| Geekom XT13 Pro | |
| Geekom XT12 Pro | |
| Geekom A7 | |
| Aoostar GEM12 | |
| Acemagic F2A | |
| Minisforum AtomMan X7 Ti | |
| Super Pi mod 1.5 XS 2M - 2M | |
| Geekom A7 | |
| Aoostar GEM12 | |
| Geekom XT13 Pro | |
| Geekom XT12 Pro | |
| Acemagic F2A | |
| Minisforum AtomMan X7 Ti | |
| Super Pi Mod 1.5 XS 32M - 32M | |
| Aoostar GEM12 | |
| Geekom A7 | |
| Geekom XT13 Pro | |
| Geekom XT12 Pro | |
| Acemagic F2A | |
| Minisforum AtomMan X7 Ti | |
* ... Meglio usare valori piccoli
AIDA64: FP32 Ray-Trace | FPU Julia | CPU SHA3 | CPU Queen | FPU SinJulia | FPU Mandel | CPU AES | CPU ZLib | FP64 Ray-Trace | CPU PhotoWorxx
| Performance rating | |
| Geekom A7 | |
| Aoostar GEM12 | |
| Media della classe Mini PC | |
| Minisforum AtomMan X7 Ti | |
| Acemagic F2A | |
| Geekom XT13 Pro | |
| Geekom XT12 Pro | |
| AIDA64 / FP32 Ray-Trace | |
| Aoostar GEM12 | |
| Geekom A7 | |
| Media della classe Mini PC (974 - 82725, n=110, ultimi 2 anni) | |
| Acemagic F2A | |
| Minisforum AtomMan X7 Ti | |
| Geekom XT13 Pro | |
| Geekom XT12 Pro | |
| AIDA64 / FPU Julia | |
| Aoostar GEM12 | |
| Geekom A7 | |
| Media della classe Mini PC (6115 - 363782, n=110, ultimi 2 anni) | |
| Minisforum AtomMan X7 Ti | |
| Acemagic F2A | |
| Geekom XT13 Pro | |
| Geekom XT12 Pro | |
| AIDA64 / CPU SHA3 | |
| Geekom A7 | |
| Aoostar GEM12 | |
| Minisforum AtomMan X7 Ti | |
| Acemagic F2A | |
| Media della classe Mini PC (385 - 9475, n=110, ultimi 2 anni) | |
| Geekom XT13 Pro | |
| Geekom XT12 Pro | |
| AIDA64 / CPU Queen | |
| Geekom A7 | |
| Aoostar GEM12 | |
| Media della classe Mini PC (20501 - 184747, n=100, ultimi 2 anni) | |
| Geekom XT13 Pro | |
| Acemagic F2A | |
| Minisforum AtomMan X7 Ti | |
| Geekom XT12 Pro | |
| AIDA64 / FPU SinJulia | |
| Aoostar GEM12 | |
| Geekom A7 | |
| Media della classe Mini PC (1019 - 31931, n=110, ultimi 2 anni) | |
| Minisforum AtomMan X7 Ti | |
| Acemagic F2A | |
| Geekom XT13 Pro | |
| Geekom XT12 Pro | |
| AIDA64 / FPU Mandel | |
| Aoostar GEM12 | |
| Geekom A7 | |
| Media della classe Mini PC (3322 - 192994, n=110, ultimi 2 anni) | |
| Acemagic F2A | |
| Minisforum AtomMan X7 Ti | |
| Geekom XT13 Pro | |
| Geekom XT12 Pro | |
| AIDA64 / CPU AES | |
| Geekom A7 | |
| Minisforum AtomMan X7 Ti | |
| Acemagic F2A | |
| Geekom XT13 Pro | |
| Geekom XT12 Pro | |
| Media della classe Mini PC (9214 - 325960, n=109, ultimi 2 anni) | |
| Aoostar GEM12 | |
| AIDA64 / CPU ZLib | |
| Minisforum AtomMan X7 Ti | |
| Acemagic F2A | |
| Media della classe Mini PC (127.2 - 2431, n=110, ultimi 2 anni) | |
| Aoostar GEM12 | |
| Geekom A7 | |
| Geekom XT13 Pro | |
| Geekom XT12 Pro | |
| AIDA64 / FP64 Ray-Trace | |
| Aoostar GEM12 | |
| Geekom A7 | |
| Media della classe Mini PC (537 - 43587, n=110, ultimi 2 anni) | |
| Acemagic F2A | |
| Minisforum AtomMan X7 Ti | |
| Geekom XT13 Pro | |
| Geekom XT12 Pro | |
| AIDA64 / CPU PhotoWorxx | |
| Minisforum AtomMan X7 Ti | |
| Geekom A7 | |
| Aoostar GEM12 | |
| Media della classe Mini PC (8069 - 96843, n=110, ultimi 2 anni) | |
| Acemagic F2A | |
| Geekom XT13 Pro | |
| Geekom XT12 Pro | |
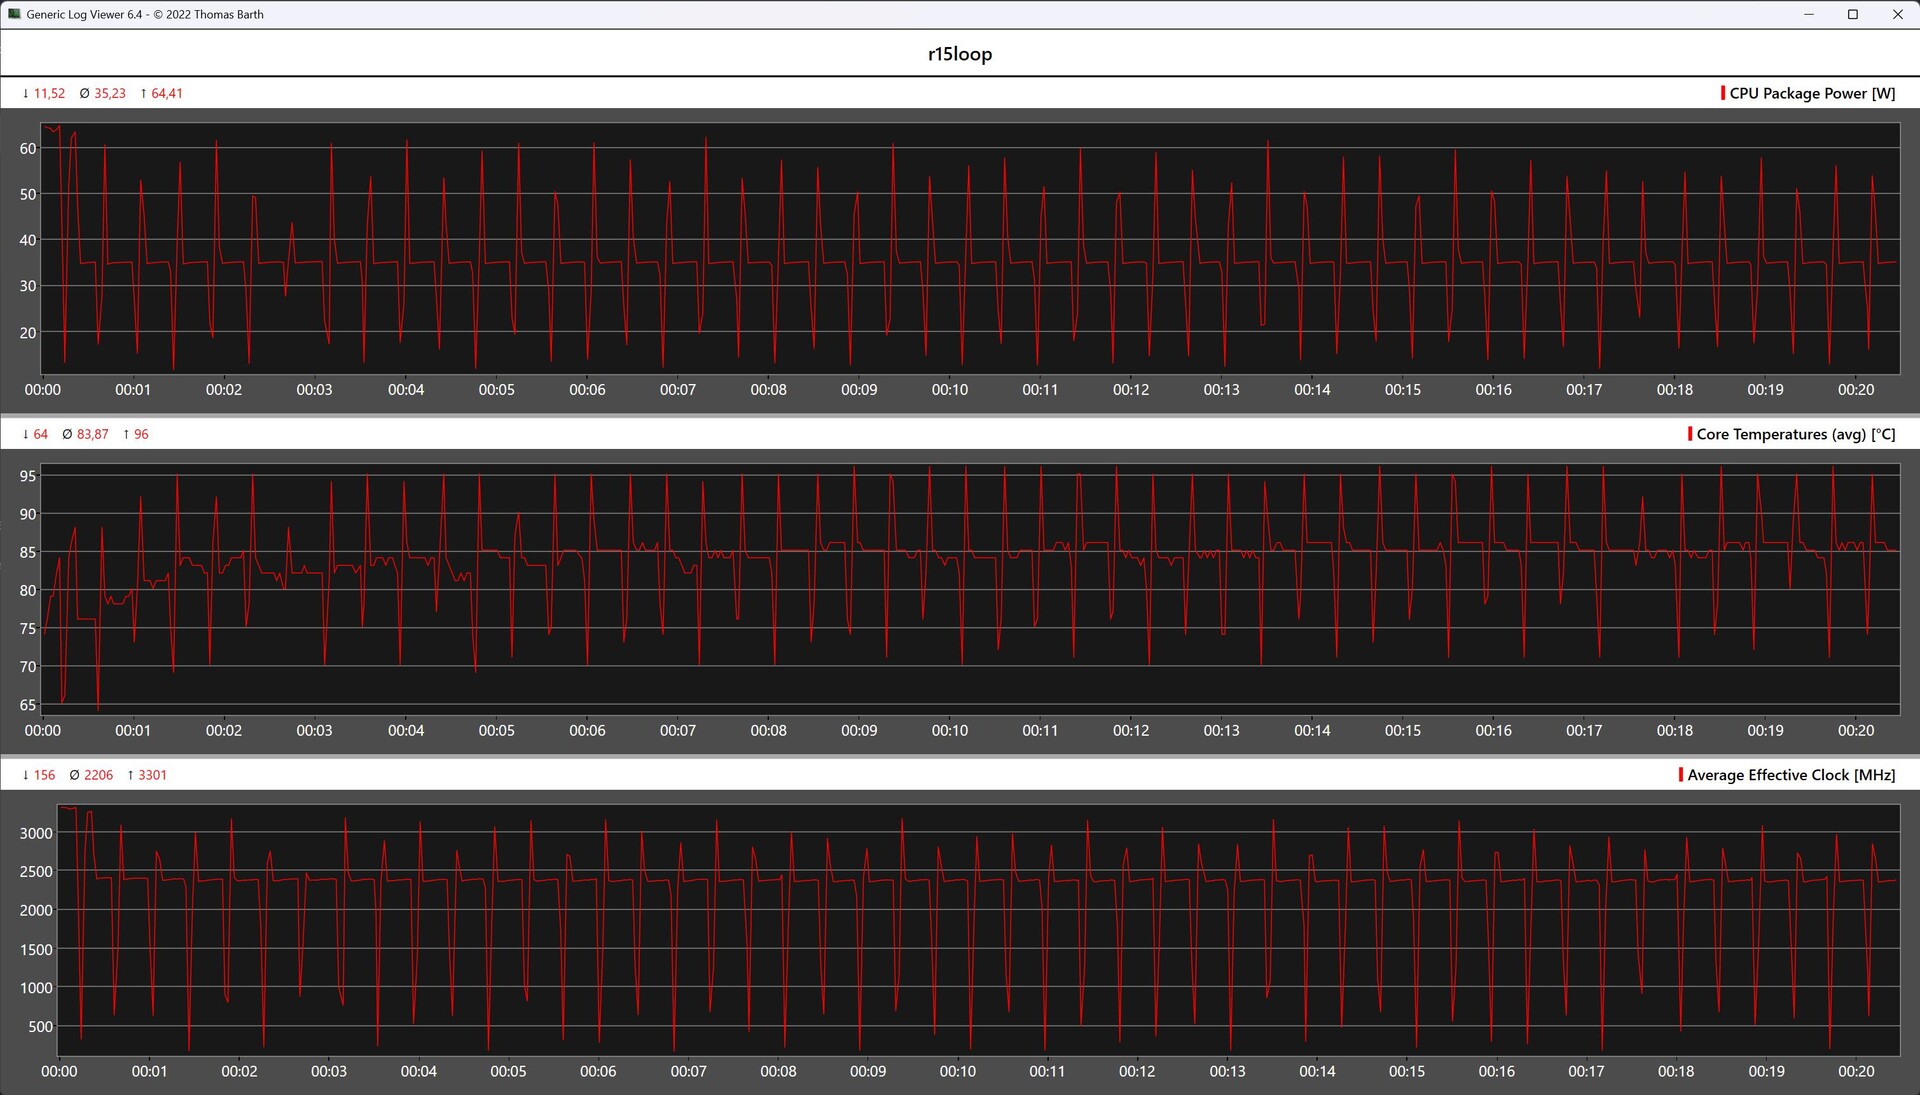
Cinebench R15 Multi loop
Il ciclo continuo Cinebench R15 del nostro campione di prova corre quasi parallelo a quello del Geekom XT12 Pro. Alla fine, però, il modello più recente XT13 Pro riesce a staccarsi con un netto vantaggio. Si può anche notare che il piccolo sistema di raffreddamento non riesce a mantenere il Turbo del SoC per un periodo di tempo più lungo. Il limite di potenza massima di 64 watt viene raggiunto solo per un breve periodo, perché il consumo di energia deve essere limitato a causa delle temperature elevate.
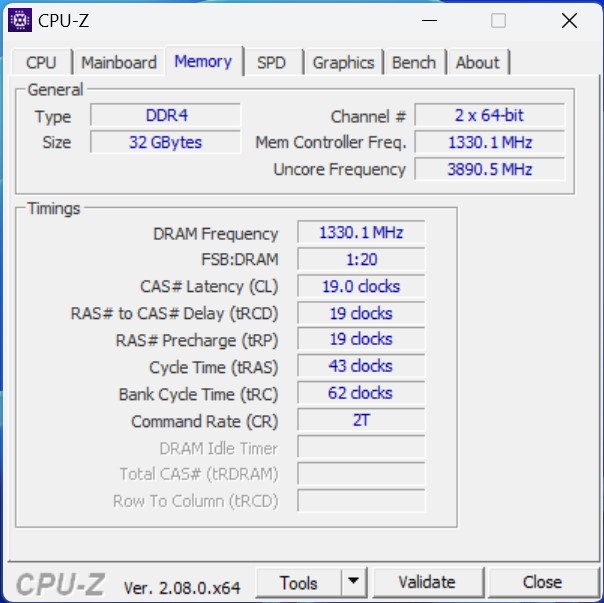
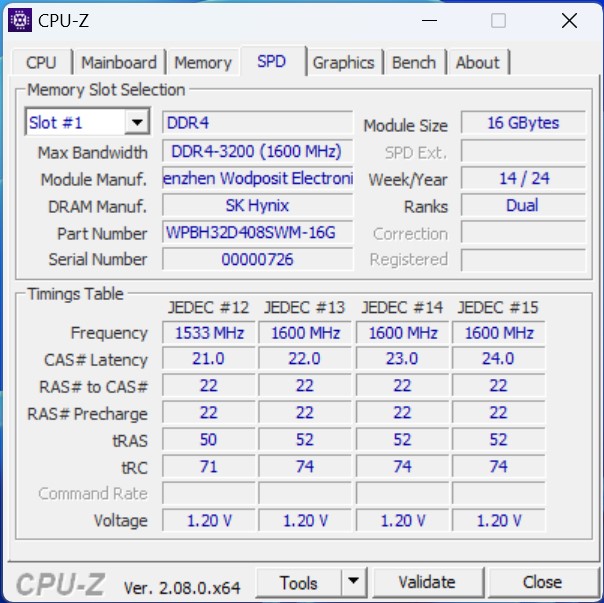
Prestazioni del sistema
Nei test sulle prestazioni del sistema, le prestazioni documentate di Geekom XT13 Pro sono sufficienti per un posto in fondo alla classifica. Soggettivamente, tuttavia, possiamo dire che il Geekom XT13 Pro offre prestazioni decenti. Durante la fase di test, non abbiamo riscontrato latenze degne di nota durante il lavoro con il dispositivo. Per quanto riguarda la scelta della RAM, lo standard DDR4 più lento si prende la sua rivincita, come si può vedere dai benchmark AIDA64. Tecnicamente, il Intel Core i9-13900H potrebbe essere abbinato a DDR5 (5.200 MT/s).
| AIDA64 / Memory Copy | |
| Minisforum AtomMan X7 Ti | |
| Aoostar GEM12 | |
| Geekom A7 | |
| Media della classe Mini PC (15933 - 163031, n=110, ultimi 2 anni) | |
| Acemagic F2A | |
| Geekom XT13 Pro | |
| Geekom XT12 Pro | |
| AIDA64 / Memory Read | |
| Minisforum AtomMan X7 Ti | |
| Acemagic F2A | |
| Media della classe Mini PC (14143 - 123769, n=110, ultimi 2 anni) | |
| Geekom A7 | |
| Aoostar GEM12 | |
| Geekom XT12 Pro | |
| Geekom XT13 Pro | |
| AIDA64 / Memory Write | |
| Geekom A7 | |
| Aoostar GEM12 | |
| Media della classe Mini PC (10630 - 216693, n=110, ultimi 2 anni) | |
| Minisforum AtomMan X7 Ti | |
| Acemagic F2A | |
| Geekom XT13 Pro | |
| Geekom XT12 Pro | |
| AIDA64 / Memory Latency | |
| Acemagic F2A | |
| Minisforum AtomMan X7 Ti | |
| Media della classe Mini PC (108.9 - 184.8, n=111, ultimi 2 anni) | |
| Geekom A7 | |
| Aoostar GEM12 | |
| Geekom XT13 Pro | |
| Geekom XT12 Pro | |
* ... Meglio usare valori piccoli
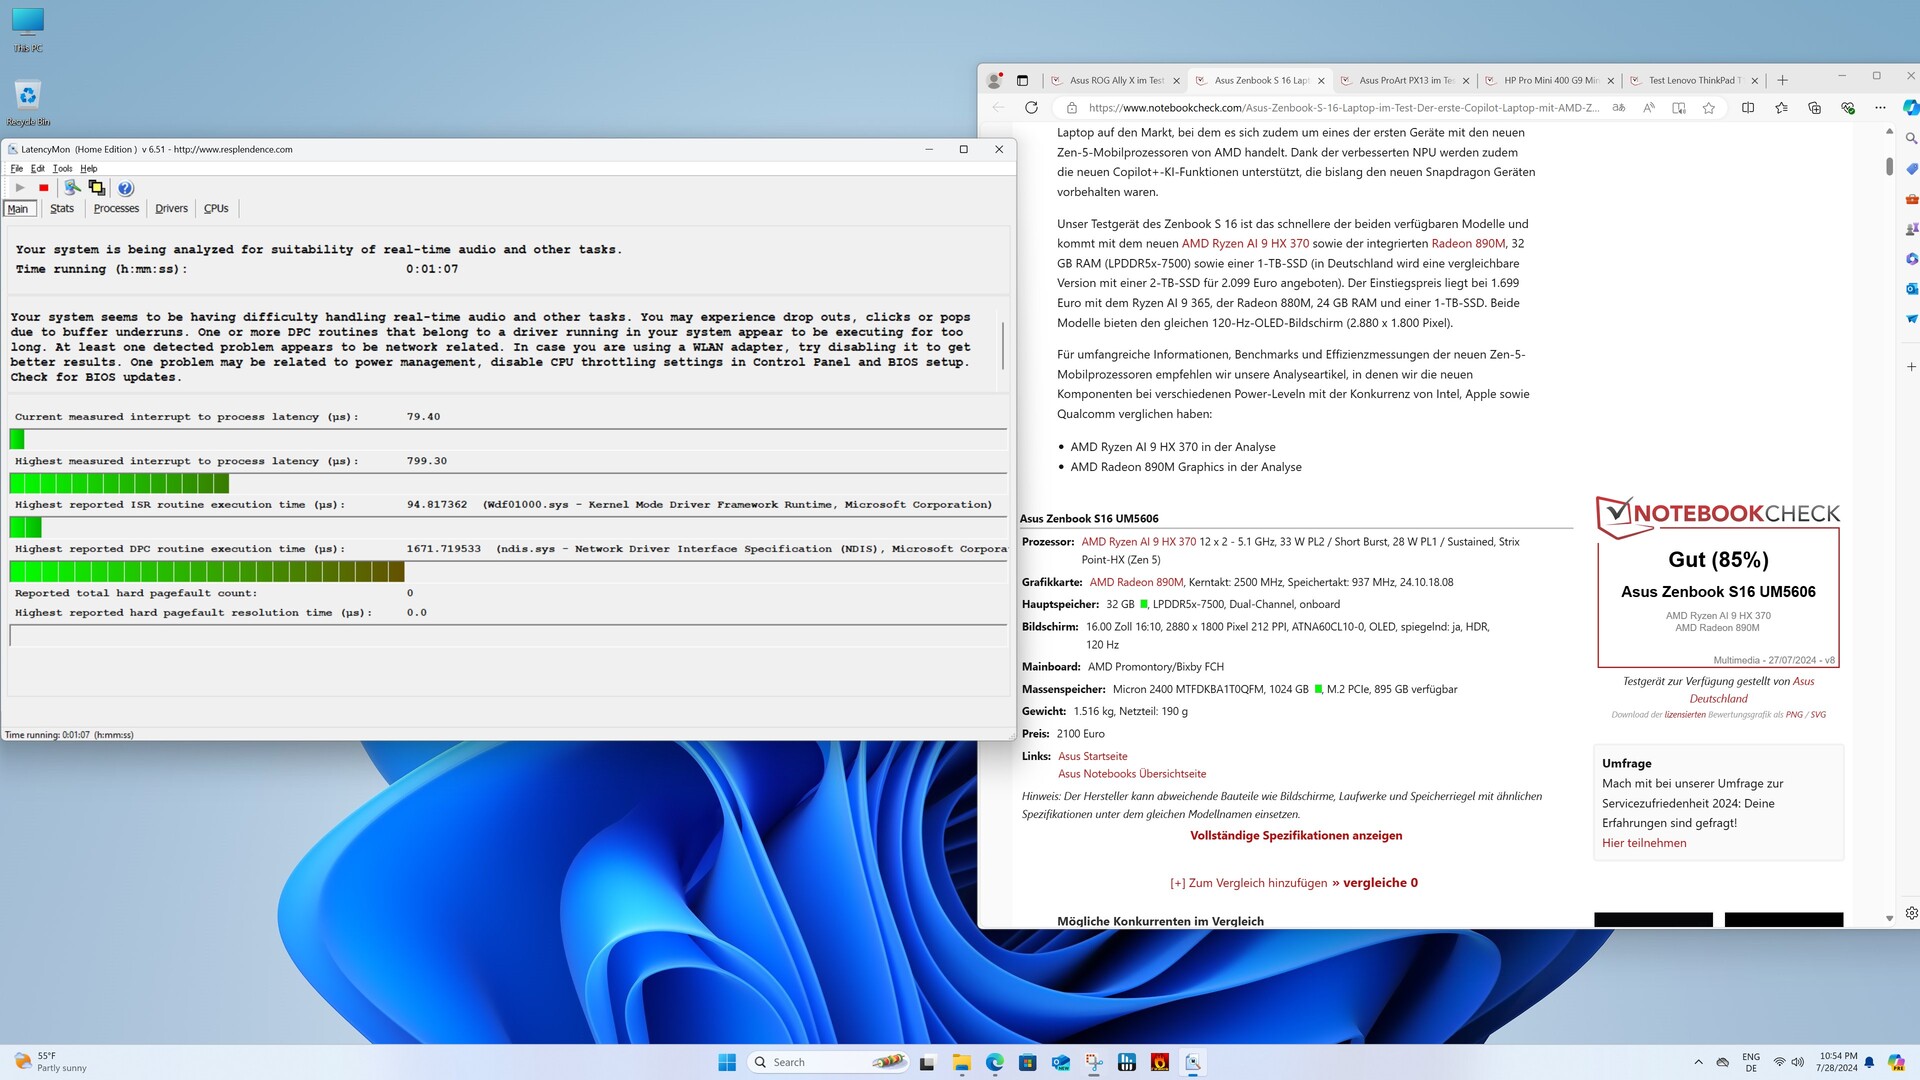
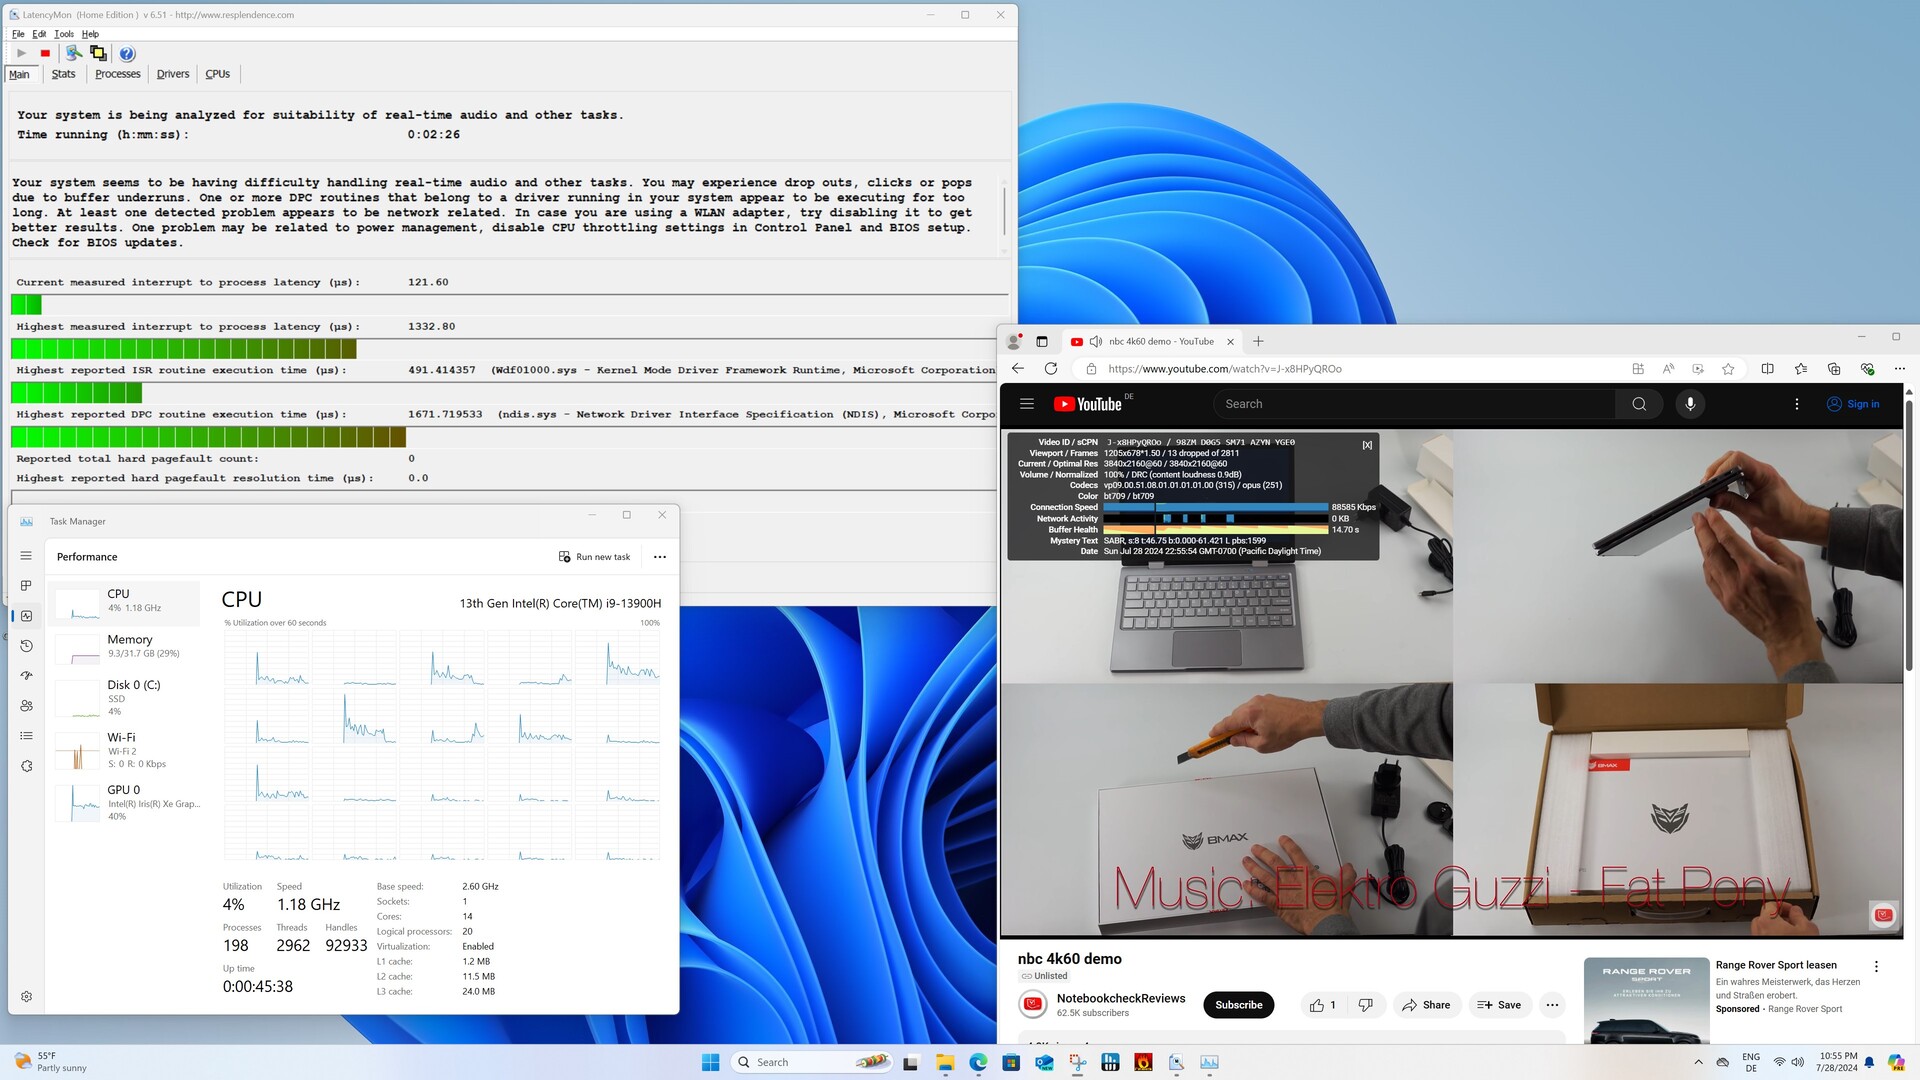
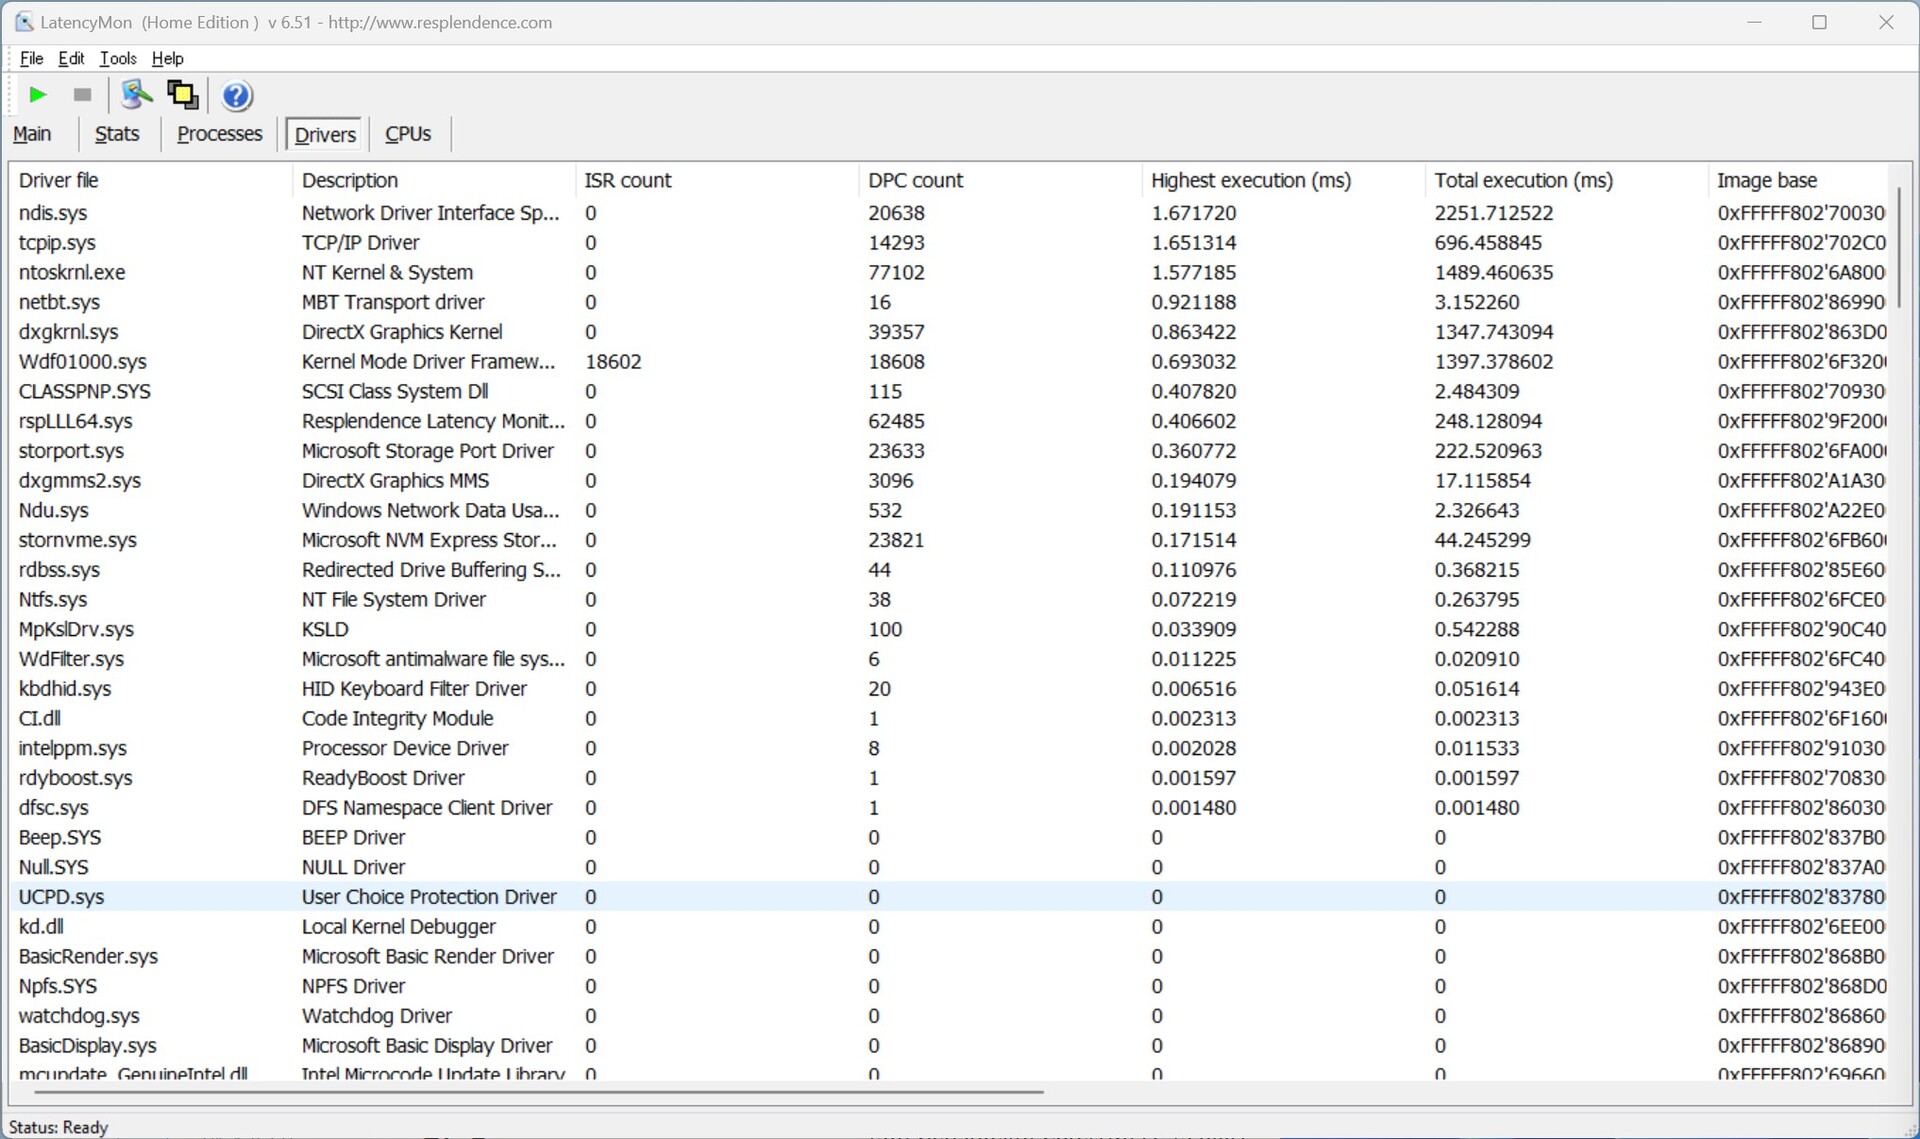
Latenze DPC
Non vediamo latenze DPC estremamente eccessive con il Geekom XT13 Pro. Questo era il caso del Geekom XT12 Pro. Tuttavia, il nostro campione di prova è lontano da risultati eccezionali. Abbiamo raggiunto il valore massimo anche navigando semplicemente con il browser Edge.

| DPC Latencies / LatencyMon - interrupt to process latency (max), Web, Youtube, Prime95 | |
| Acemagic F2A | |
| Geekom XT12 Pro | |
| Minisforum AtomMan X7 Ti | |
| Geekom XT13 Pro | |
| Geekom A7 | |
| Aoostar GEM12 | |
* ... Meglio usare valori piccoli
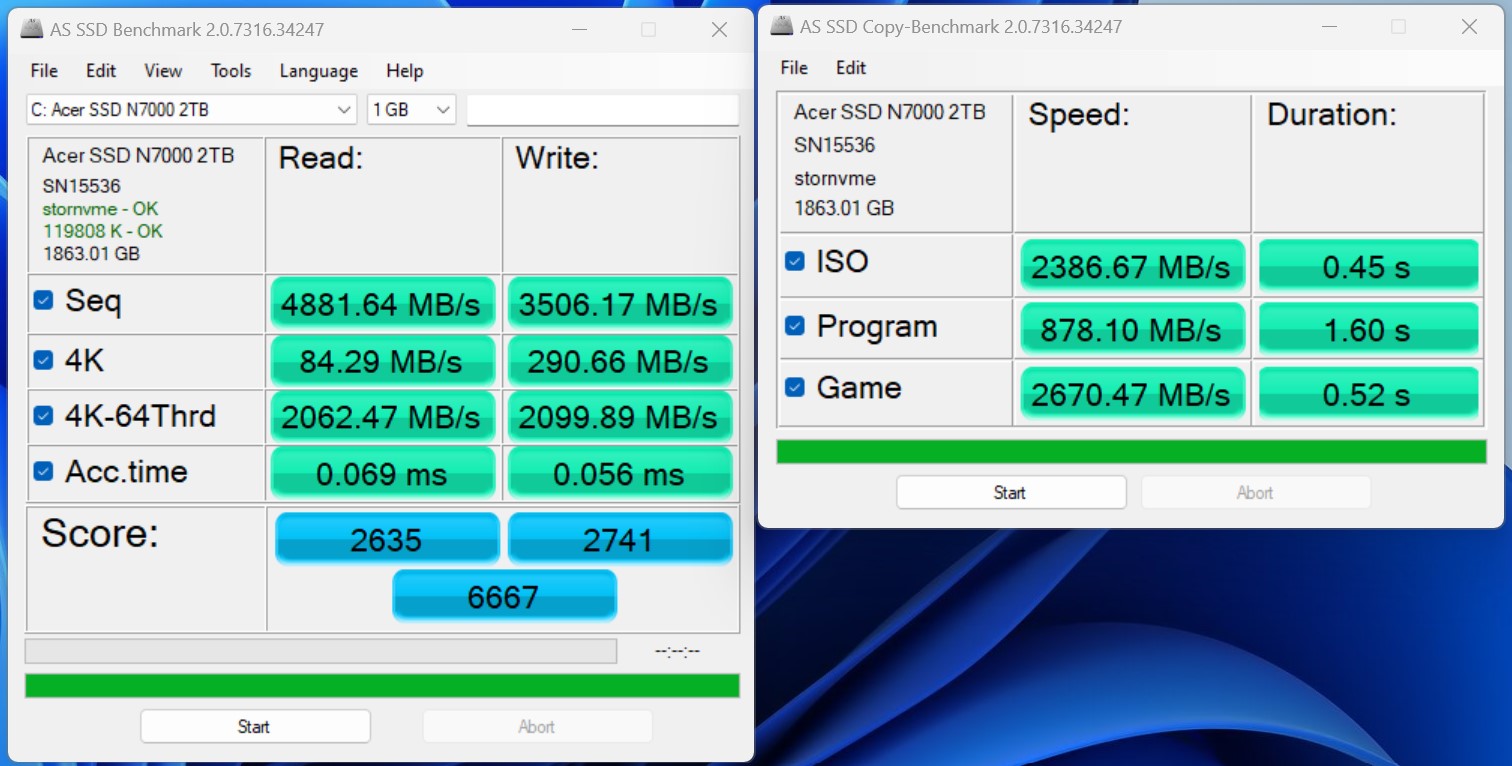
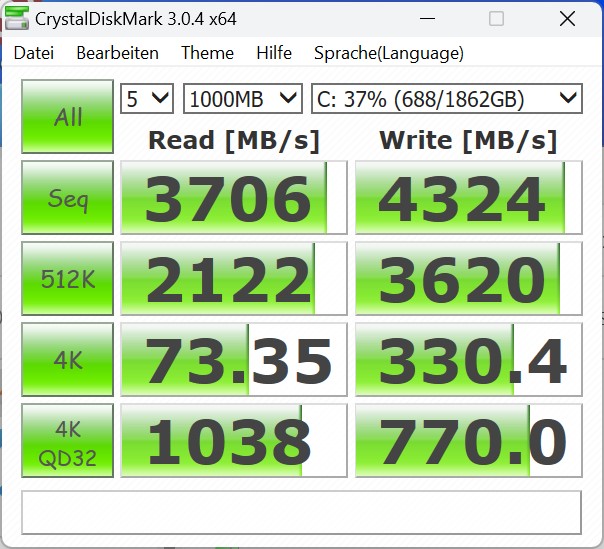
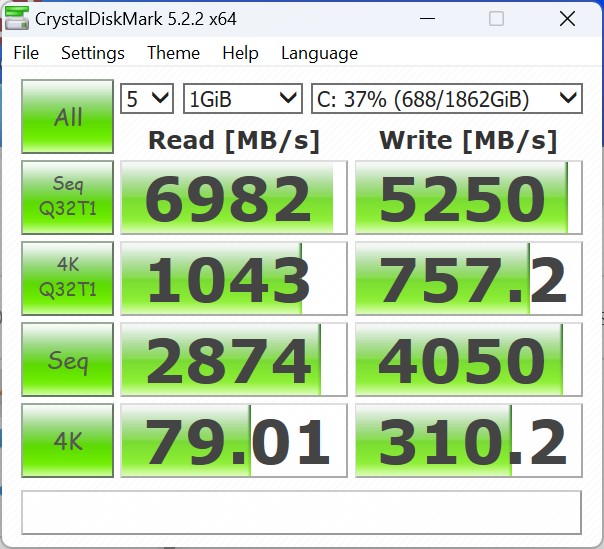
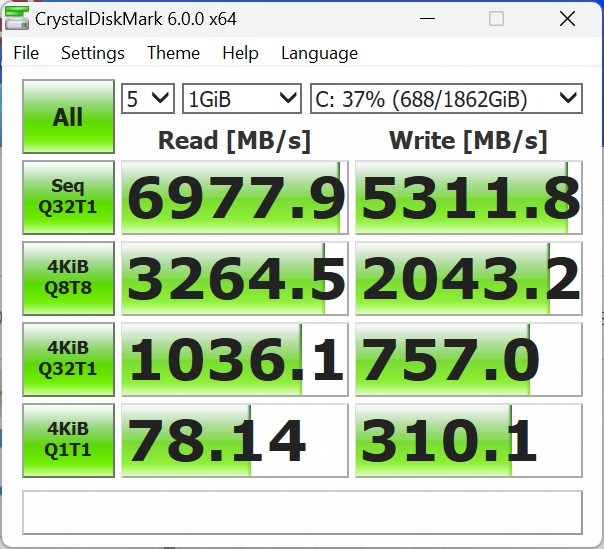
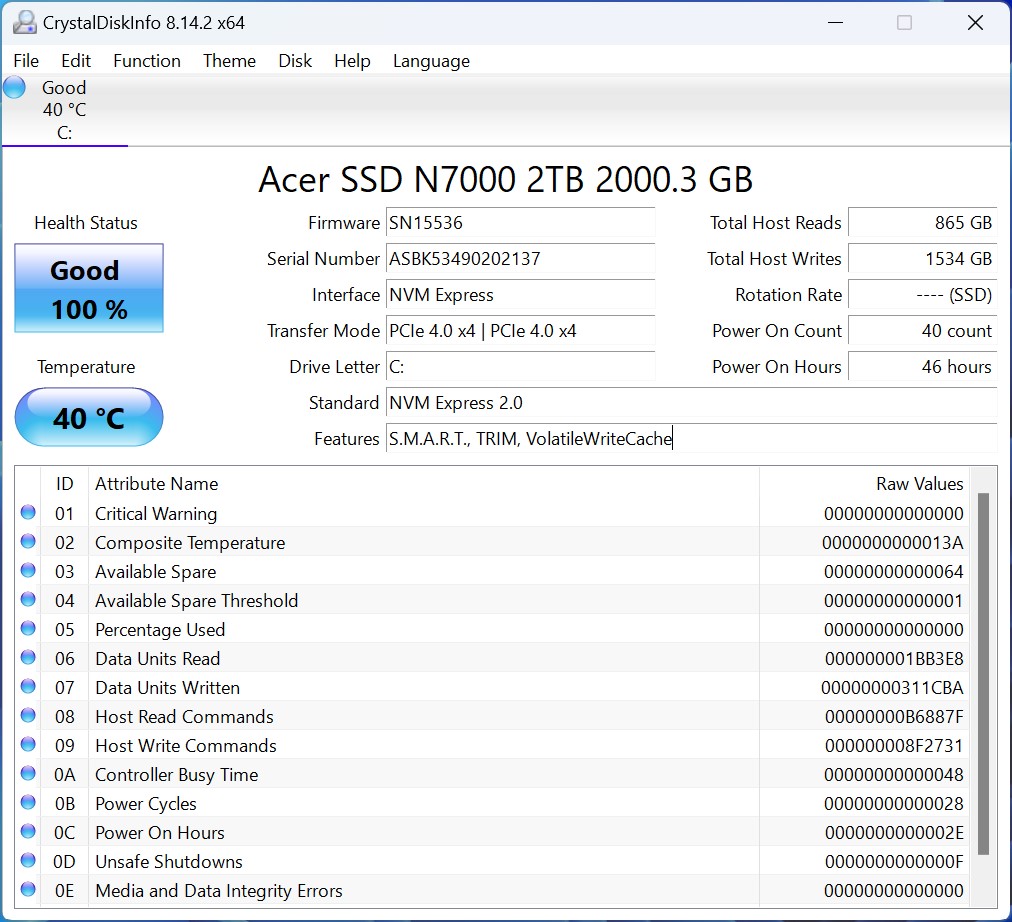
Memoria di massa
Il Geekom XT13 Pro è dotato di un SSD con 2 TB di spazio di archiviazione di Acer. Lo stesso modello era già presente nel Geekom GT13 e ha fornito ottime prestazioni in tutti i test. La connessione tecnica è ottimale e le velocità di trasferimento risultanti sono molto elevate. Sotto carico continuo, l'Acer N7000 ha qualche problema a mantenere stabili le prestazioni di lettura. Fortunatamente, non c'è uno svantaggio estremo. Come si può vedere dal grafico, l'Acer N7000 è ancora in grado di ottenere prestazioni significativamente migliori con prestazioni di lettura ridotte rispetto al Geekom XT12 Pro o del Acemagic F2A. Il test del Geekom XT12 Pro ha rivelato un problema con la posizione del pad termico, cosa che non accade con il Geekom XT13 Pro. I pad termici sono nella posizione corretta. Come abbiamo già detto nella sezione sulla manutenzione, è possibile installare un SSD aggiuntivo nel Geekom XT13 Pro. Tuttavia, il secondo slot M.2 supporta solo SSD SATA con una lunghezza di 42 millimetri (M.2-2242).
Per ulteriori confronti e benchmark, faccia riferimento alla nostra Tabella di confronto.

| Drive Performance rating - Percent | |
| Aoostar GEM12 | |
| Geekom XT13 Pro | |
| Geekom XT12 Pro | |
| Minisforum AtomMan X7 Ti | |
| Media della classe Mini PC | |
| Geekom A7 | |
| Acemagic F2A | |
* ... Meglio usare valori piccoli
Continuous read: DiskSpd Read Loop, Queue Depth 8
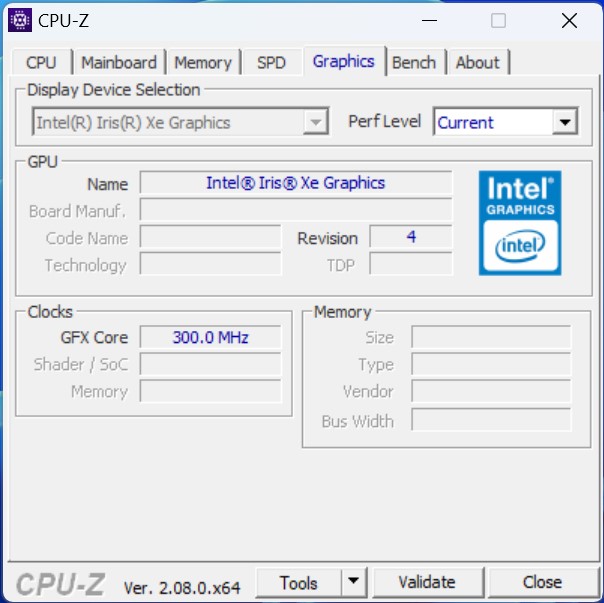
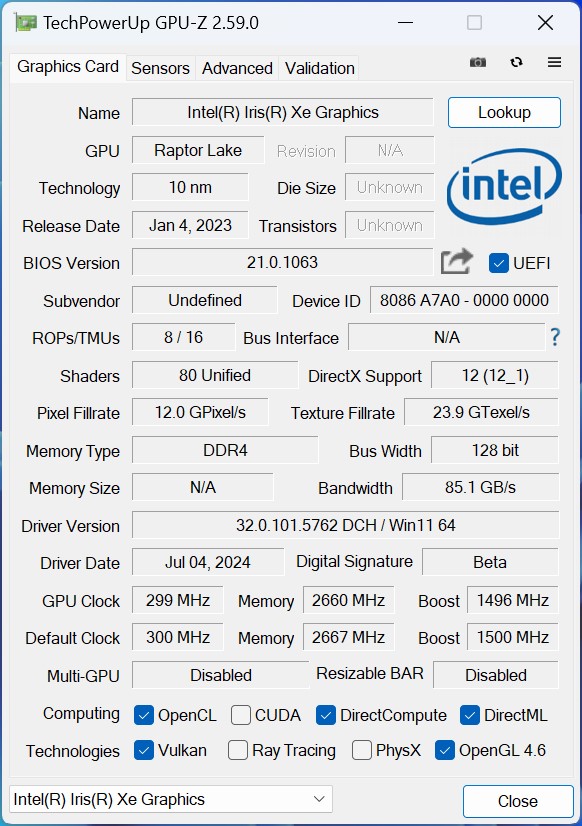
Grafica
La Intel Iris Xe Graphics G7 gestisce i calcoli 3D ed è responsabile dell'output delle immagini. Con 96 EU, il Intel Core i9-13900H è il modello più veloce della serie. Tuttavia, il modello obsoleto ha difficoltà ad affermarsi contro i rappresentanti moderni. Se Geekom avesse già osato fare il passo di installare un SoC Meteor Lake nell'XT13 Pro, ci si sarebbe potuto aspettare un aumento chiaramente percepibile delle prestazioni 3D. Le prestazioni di una iGPU Intel Arc a 8 core sono perfettamente visibili nei dati di confronto. Nel frattempo, si ottengono prestazioni 3D ancora più elevate se nel sistema è installata una AMD Radeon 780M. Geekom stessa offre ora diversi dispositivi con questa iGPU, il che significa che il produttore si sta complicando la vita in questa disciplina. Un esempio di questo è il Geekom A7e il Geekom A8o il Geekom AE7.
Ulteriori confronti e benchmark sono disponibili nella nostra Tabella di confronto delle GPU.
| 3DMark Performance rating - Percent | |
| Geekom A7 | |
| Aoostar GEM12 | |
| Acemagic F2A | |
| Minisforum AtomMan X7 Ti | |
| Geekom XT13 Pro | |
| Geekom XT12 Pro | |
| 3DMark 11 - 1280x720 Performance GPU | |
| Geekom A7 | |
| Aoostar GEM12 | |
| Acemagic F2A | |
| Minisforum AtomMan X7 Ti | |
| Geekom XT13 Pro | |
| Geekom XT12 Pro | |
| 3DMark | |
| 2560x1440 Time Spy Graphics | |
| Acemagic F2A | |
| Minisforum AtomMan X7 Ti | |
| Geekom A7 | |
| Aoostar GEM12 | |
| Geekom XT13 Pro | |
| Geekom XT12 Pro | |
| 1920x1080 Fire Strike Graphics | |
| Geekom A7 | |
| Aoostar GEM12 | |
| Acemagic F2A | |
| Minisforum AtomMan X7 Ti | |
| Geekom XT13 Pro | |
| Geekom XT12 Pro | |
| Unigine Heaven 4.0 | |
| Extreme Preset OpenGL | |
| Aoostar GEM12 | |
| Acemagic F2A | |
| Minisforum AtomMan X7 Ti | |
| Geekom A7 | |
| Geekom XT13 Pro | |
| Geekom XT12 Pro | |
| Extreme Preset DX11 | |
| Aoostar GEM12 | |
| Minisforum AtomMan X7 Ti | |
| Acemagic F2A | |
| Geekom A7 | |
| Geekom XT13 Pro | |
| Geekom XT12 Pro | |
| Unigine Valley 1.0 | |
| 1920x1080 Extreme HD DirectX AA:x8 | |
| Aoostar GEM12 | |
| Minisforum AtomMan X7 Ti | |
| Geekom A7 | |
| Acemagic F2A | |
| Geekom XT13 Pro | |
| Geekom XT12 Pro | |
| 1920x1080 Extreme HD Preset OpenGL AA:x8 | |
| Minisforum AtomMan X7 Ti | |
| Aoostar GEM12 | |
| Acemagic F2A | |
| Geekom XT13 Pro | |
| Geekom XT12 Pro | |
| Geekom A7 | |
| Unigine Superposition | |
| 1280x720 720p Low | |
| Aoostar GEM12 | |
| Acemagic F2A | |
| Minisforum AtomMan X7 Ti | |
| Geekom A7 | |
| Geekom XT13 Pro | |
| Geekom XT12 Pro | |
| 1920x1080 1080p High | |
| Aoostar GEM12 | |
| Acemagic F2A | |
| Minisforum AtomMan X7 Ti | |
| Geekom A7 | |
| Geekom XT13 Pro | |
| Geekom XT12 Pro | |
| 1920x1080 1080p Extreme | |
| Acemagic F2A | |
| Minisforum AtomMan X7 Ti | |
| Aoostar GEM12 | |
| Geekom A7 | |
| Geekom XT13 Pro | |
| Geekom XT12 Pro | |
| ComputeMark v2.1 | |
| 1024x600 Normal, Score | |
| Geekom A7 | |
| Aoostar GEM12 | |
| Acemagic F2A | |
| Minisforum AtomMan X7 Ti | |
| Geekom XT13 Pro | |
| Geekom XT12 Pro | |
| 1024x600 Normal, Fluid 3DTex | |
| Aoostar GEM12 | |
| Geekom A7 | |
| Minisforum AtomMan X7 Ti | |
| Acemagic F2A | |
| Geekom XT13 Pro | |
| Geekom XT12 Pro | |
| 1024x600 Normal, Fluid 2DTexArr | |
| Geekom A7 | |
| Aoostar GEM12 | |
| Minisforum AtomMan X7 Ti | |
| Acemagic F2A | |
| Geekom XT13 Pro | |
| Geekom XT12 Pro | |
| 1024x600 Normal, Mandel Vector | |
| Geekom A7 | |
| Aoostar GEM12 | |
| Acemagic F2A | |
| Minisforum AtomMan X7 Ti | |
| Geekom XT12 Pro | |
| Geekom XT13 Pro | |
| 1024x600 Normal, Mandel Scalar | |
| Geekom A7 | |
| Aoostar GEM12 | |
| Acemagic F2A | |
| Minisforum AtomMan X7 Ti | |
| Geekom XT12 Pro | |
| Geekom XT13 Pro | |
| 1024x600 Normal, QJuliaRayTrace | |
| Geekom A7 | |
| Aoostar GEM12 | |
| Acemagic F2A | |
| Minisforum AtomMan X7 Ti | |
| Geekom XT13 Pro | |
| Geekom XT12 Pro | |
| LuxMark v2.0 64Bit | |
| Room GPUs-only | |
| Geekom A7 | |
| Aoostar GEM12 | |
| Minisforum AtomMan X7 Ti | |
| Geekom XT13 Pro | |
| Acemagic F2A | |
| Sala GPUs-only | |
| Minisforum AtomMan X7 Ti | |
| Acemagic F2A | |
| Geekom XT13 Pro | |
| Geekom A7 | |
| Aoostar GEM12 | |
| Affinity Photo 2 - Combined (Single / Multi GPU) | |
| Minisforum AtomMan X7 Ti | |
| Acemagic F2A | |
| Geekom XT13 Pro | |
| Geekom XT12 Pro | |
| Aoostar GEM12 | |
| Geekom A7 | |
| Geekom XT13 Pro, Intel Iris Xe Graphics G7 96EUs i9-13900H | Aoostar GEM12, AMD Radeon 780M R7 8845HS | Minisforum AtomMan X7 Ti, Intel Arc 8-Core iGPU Ultra 9 185H | Acemagic F2A, Intel Arc 8-Core iGPU Ultra 7 155H | Geekom XT12 Pro, Intel Iris Xe Graphics G7 96EUs i9-12900H | Geekom A7, AMD Radeon 780M R9 7940HS | Media della classe Mini PC | |
|---|---|---|---|---|---|---|---|
| SPECviewperf 2020 | 309% | 36% | 25% | -4% | 278% | 493% | |
| 3840x2160 Medical (medical-03) (fps) | 3.63 | 11.2 209% | 4.23 17% | 5.05 39% | 3.49 -4% | 11.1 206% | 21.2 ? 484% |
| 3840x2160 Energy (energy-03) (fps) | 3.15 | 19.9 532% | 6.03 91% | 4.61 46% | 3.05 -3% | 14.1 348% | 31.8 ? 910% |
| 3840x2160 Creo (creo-03) (fps) | 16 | 33.4 109% | 18.5 16% | 17.9 12% | 14.8 -7% | 31.4 96% | 48.4 ? 203% |
| 3840x2160 CATIA (catia-06) (fps) | 7.9 | 23.2 194% | 11.1 41% | 10 27% | 7.78 -2% | 24.8 214% | 33.1 ? 319% |
| 3840x2160 3ds Max (3dsmax-07) (fps) | 10.3 | 20.4 98% | 14.9 45% | 12.9 25% | 9.69 -6% | 20.9 103% | 51.3 ? 398% |
| 3840x2160 Siemens NX (snx-04) (fps) | 6.13 | 64.1 946% | 6.24 2% | 5.7 -7% | 6.29 3% | 61.4 902% | 51.4 ? 738% |
| 3840x2160 Maya (maya-06) (fps) | 26.8 | 47.7 78% | 37.7 41% | 35.4 32% | 23.9 -11% | 47 75% | 132.8 ? 396% |
| 3DMark 05 Standard | 29045 punti | |
| 3DMark 06 Score 1366x768 | 30156 punti | |
| 3DMark Vantage P Result | 28599 punti | |
| 3DMark 11 Performance | 8024 punti | |
| 3DMark Ice Storm Standard Score | 155640 punti | |
| 3DMark Cloud Gate Standard Score | 28112 punti | |
| 3DMark Fire Strike Score | 5448 punti | |
| 3DMark Fire Strike Extreme Score | 2570 punti | |
| 3DMark Time Spy Score | 1920 punti | |
| 3DMark Steel Nomad Score | 183 punti | |
| 3DMark Steel Nomad Light Score | 1276 punti | |
Aiuto | ||
Prestazioni di gioco
L'iGPU Intel Iris Xe non è in grado di gestire la maggior parte dei giochi. L'iGPU invecchiata riesce a raggiungere un frame rate adeguato, se non addirittura nullo, con risoluzioni basse e un preset grafico basso o medio. Se vuole comunque utilizzare il Geekom XT13 Pro per i giochi, deve fare una deviazione con una scheda grafica esterna. Vari modelli possono essere utilizzati con il dispositivo tramite USB4.
| Dota 2 Reborn | |
| 1280x720 min (0/3) fastest | |
| Geekom A7 | |
| Aoostar GEM12 | |
| Geekom XT13 Pro | |
| Minisforum AtomMan X7 Ti | |
| Geekom XT12 Pro | |
| Acemagic F2A | |
| 1920x1080 high (2/3) | |
| Geekom A7 | |
| Aoostar GEM12 | |
| Minisforum AtomMan X7 Ti | |
| Acemagic F2A | |
| Geekom XT13 Pro | |
| Geekom XT12 Pro | |
| GTA V | |
| 1024x768 Lowest Settings possible | |
| Geekom A7 | |
| Aoostar GEM12 | |
| Minisforum AtomMan X7 Ti | |
| Acemagic F2A | |
| Geekom XT13 Pro | |
| 1920x1080 High/On (Advanced Graphics Off) AA:2xMSAA + FX AF:8x | |
| Geekom A7 | |
| Aoostar GEM12 | |
| Minisforum AtomMan X7 Ti | |
| Acemagic F2A | |
| Geekom XT13 Pro | |
| Cyberpunk 2077 | |
| 1920x1080 Low Preset (FSR off) | |
| Aoostar GEM12 | |
| Minisforum AtomMan X7 Ti | |
| Acemagic F2A | |
| Geekom XT13 Pro | |
| Geekom XT12 Pro | |
| 1920x1080 High Preset (FSR off) | |
| Aoostar GEM12 | |
| Minisforum AtomMan X7 Ti | |
| Acemagic F2A | |
| Geekom XT13 Pro | |
| Geekom XT12 Pro | |
| Baldur's Gate 3 | |
| 1280x720 Low Preset AA:SM | |
| Aoostar GEM12 | |
| Minisforum AtomMan X7 Ti | |
| Geekom XT13 Pro | |
| 1920x1080 High Preset AA:T | |
| Aoostar GEM12 | |
| Minisforum AtomMan X7 Ti | |
| Geekom XT13 Pro | |
| F1 24 | |
| 1920x1080 Low Preset AA:T AF:16x | |
| Minisforum AtomMan X7 Ti | |
| Acemagic F2A | |
| Geekom XT13 Pro | |
| 1920x1080 High Preset AA:T AF:16x | |
| Minisforum AtomMan X7 Ti | |
| Acemagic F2A | |
| Geekom XT13 Pro | |
FPS chart
| basso | medio | alto | ultra | |
|---|---|---|---|---|
| GTA V (2015) | 123.5 | 105.9 | 22.1 | 9 |
| Dota 2 Reborn (2015) | 117.2 | 82.9 | 72.5 | 66.5 |
| Final Fantasy XV Benchmark (2018) | 46 | 25.7 | 18.2 | |
| Baldur's Gate 3 (2023) | 19.9 | 15.4 | 13.5 | 13 |
| Cyberpunk 2077 (2023) | 18.6 | 15 | 13 | 11.4 |
| F1 24 (2024) | 43.1 | 37.3 | 26.7 |
Geekom XT13 Pro verifica le prestazioni con una Nvidia GeForce RTX 3060 Ti
Il Geekom XT13 Pro dispone di due porte USB4, che supportano l'uso di schede grafiche esterne. Senza influenzare il risultato complessivo, abbiamo effettuato alcuni test con il Razer Core X e una Nvidia GeForce RTX 3060 Ti. Rispetto alla vecchia iGPU dell'Intel Core i9-13900H, le prestazioni 3D possono essere aumentate in modo massiccio. Il confronto con gli altri dispositivi di prova mostra un risultato quasi identico nei test sintetici. Anche le prestazioni di gioco possono essere aumentate in modo significativo con questa combinazione, come si può vedere dai giochi testati. A volte anche i giochi più moderni possono essere goduti con tutti i dettagli.
| Performance rating - Percent | |
| Geekom AE7 (Nvidia GeForce RTX 3060 Ti FE) | |
| Geekom A8 (Nvidia GeForce RTX 3060 Ti FE) | |
| Geekom GT13 Pro (Nvidia GeForce RTX 3060 Ti FE) | |
| Geekom XT13 Pro (Nvidia GeForce RTX 3060 Ti FE) | |
| Geekom XT12 Pro (Nvidia GeForce RTX 3060 Ti FE) | |
| Minisforum UH125 Pro (Nvidia GeForce RTX 3060 Ti FE) | |
| 3DMark 11 - 1280x720 Performance GPU | |
| Geekom A8 (Nvidia GeForce RTX 3060 Ti FE) | |
| Geekom AE7 (Nvidia GeForce RTX 3060 Ti FE) | |
| Geekom XT13 Pro (Nvidia GeForce RTX 3060 Ti FE) | |
| Geekom GT13 Pro (Nvidia GeForce RTX 3060 Ti FE) | |
| Geekom XT12 Pro (Nvidia GeForce RTX 3060 Ti FE) | |
| Minisforum UH125 Pro (Nvidia GeForce RTX 3060 Ti FE) | |
| 3DMark | |
| 2560x1440 Time Spy Graphics | |
| Geekom A8 (Nvidia GeForce RTX 3060 Ti FE) | |
| Geekom AE7 (Nvidia GeForce RTX 3060 Ti FE) | |
| Geekom XT13 Pro (Nvidia GeForce RTX 3060 Ti FE) | |
| Geekom GT13 Pro (Nvidia GeForce RTX 3060 Ti FE) | |
| Geekom XT12 Pro (Nvidia GeForce RTX 3060 Ti FE) | |
| Minisforum UH125 Pro (Nvidia GeForce RTX 3060 Ti FE) | |
| 1920x1080 Fire Strike Graphics | |
| Geekom AE7 (Nvidia GeForce RTX 3060 Ti FE) | |
| Geekom GT13 Pro (Nvidia GeForce RTX 3060 Ti FE) | |
| Geekom A8 (Nvidia GeForce RTX 3060 Ti FE) | |
| Geekom XT13 Pro (Nvidia GeForce RTX 3060 Ti FE) | |
| Minisforum UH125 Pro (Nvidia GeForce RTX 3060 Ti FE) | |
| Geekom XT12 Pro (Nvidia GeForce RTX 3060 Ti FE) | |
| 3840x2160 Fire Strike Ultra Graphics | |
| Geekom GT13 Pro (Nvidia GeForce RTX 3060 Ti FE) | |
| Geekom AE7 (Nvidia GeForce RTX 3060 Ti FE) | |
| Geekom XT12 Pro (Nvidia GeForce RTX 3060 Ti FE) | |
| Geekom XT13 Pro (Nvidia GeForce RTX 3060 Ti FE) | |
| Geekom A8 (Nvidia GeForce RTX 3060 Ti FE) | |
| Minisforum UH125 Pro (Nvidia GeForce RTX 3060 Ti FE) | |
| Unigine Superposition | |
| 1280x720 720p Low | |
| Geekom AE7 (Nvidia GeForce RTX 3060 Ti FE) | |
| Geekom GT13 Pro (Nvidia GeForce RTX 3060 Ti FE) | |
| Geekom A8 (Nvidia GeForce RTX 3060 Ti FE) | |
| Geekom XT13 Pro (Nvidia GeForce RTX 3060 Ti FE) | |
| Geekom XT12 Pro (Nvidia GeForce RTX 3060 Ti FE) | |
| Minisforum UH125 Pro (Nvidia GeForce RTX 3060 Ti FE) | |
| 1920x1080 1080p High | |
| Geekom GT13 Pro (Nvidia GeForce RTX 3060 Ti FE) | |
| Geekom A8 (Nvidia GeForce RTX 3060 Ti FE) | |
| Geekom AE7 (Nvidia GeForce RTX 3060 Ti FE) | |
| Geekom XT13 Pro (Nvidia GeForce RTX 3060 Ti FE) | |
| Minisforum UH125 Pro (Nvidia GeForce RTX 3060 Ti FE) | |
| Geekom XT12 Pro (Nvidia GeForce RTX 3060 Ti FE) | |
| 1920x1080 1080p Extreme | |
| Geekom GT13 Pro (Nvidia GeForce RTX 3060 Ti FE) | |
| Geekom XT13 Pro (Nvidia GeForce RTX 3060 Ti FE) | |
| Geekom XT12 Pro (Nvidia GeForce RTX 3060 Ti FE) | |
| Minisforum UH125 Pro (Nvidia GeForce RTX 3060 Ti FE) | |
| Geekom A8 (Nvidia GeForce RTX 3060 Ti FE) | |
| Geekom AE7 (Nvidia GeForce RTX 3060 Ti FE) | |
| 3840x2160 4k Optimized | |
| Geekom GT13 Pro (Nvidia GeForce RTX 3060 Ti FE) | |
| Geekom XT13 Pro (Nvidia GeForce RTX 3060 Ti FE) | |
| Geekom XT12 Pro (Nvidia GeForce RTX 3060 Ti FE) | |
| Geekom A8 (Nvidia GeForce RTX 3060 Ti FE) | |
| Minisforum UH125 Pro (Nvidia GeForce RTX 3060 Ti FE) | |
| Geekom AE7 (Nvidia GeForce RTX 3060 Ti FE) | |
| 7680x4320 8k Optimized | |
| Geekom GT13 Pro (Nvidia GeForce RTX 3060 Ti FE) | |
| Geekom XT13 Pro (Nvidia GeForce RTX 3060 Ti FE) | |
| Geekom XT12 Pro (Nvidia GeForce RTX 3060 Ti FE) | |
| Minisforum UH125 Pro (Nvidia GeForce RTX 3060 Ti FE) | |
| Geekom A8 (Nvidia GeForce RTX 3060 Ti FE) | |
| Geekom AE7 (Nvidia GeForce RTX 3060 Ti FE) | |
| Unigine Valley 1.0 | |
| 1920x1080 Extreme HD DirectX AA:x8 | |
| Geekom XT12 Pro (Nvidia GeForce RTX 3060 Ti FE) | |
| Geekom GT13 Pro (Nvidia GeForce RTX 3060 Ti FE) | |
| Geekom XT13 Pro (Nvidia GeForce RTX 3060 Ti FE) | |
| Geekom A8 (Nvidia GeForce RTX 3060 Ti FE) | |
| Geekom AE7 (Nvidia GeForce RTX 3060 Ti FE) | |
| Minisforum UH125 Pro (Nvidia GeForce RTX 3060 Ti FE) | |
| 1920x1080 Extreme HD Preset OpenGL AA:x8 | |
| Geekom GT13 Pro (Nvidia GeForce RTX 3060 Ti FE) | |
| Geekom XT12 Pro (Nvidia GeForce RTX 3060 Ti FE) | |
| Geekom XT13 Pro (Nvidia GeForce RTX 3060 Ti FE) | |
| Geekom A8 (Nvidia GeForce RTX 3060 Ti FE) | |
| Geekom AE7 (Nvidia GeForce RTX 3060 Ti FE) | |
| Minisforum UH125 Pro (Nvidia GeForce RTX 3060 Ti FE) | |
| Unigine Heaven 4.0 | |
| Extreme Preset OpenGL | |
| Geekom A8 (Nvidia GeForce RTX 3060 Ti FE) | |
| Geekom AE7 (Nvidia GeForce RTX 3060 Ti FE) | |
| Geekom GT13 Pro (Nvidia GeForce RTX 3060 Ti FE) | |
| Geekom XT13 Pro (Nvidia GeForce RTX 3060 Ti FE) | |
| Minisforum UH125 Pro (Nvidia GeForce RTX 3060 Ti FE) | |
| Geekom XT12 Pro (Nvidia GeForce RTX 3060 Ti FE) | |
| Extreme Preset DX11 | |
| Geekom XT13 Pro (Nvidia GeForce RTX 3060 Ti FE) | |
| Geekom GT13 Pro (Nvidia GeForce RTX 3060 Ti FE) | |
| Geekom A8 (Nvidia GeForce RTX 3060 Ti FE) | |
| Geekom XT12 Pro (Nvidia GeForce RTX 3060 Ti FE) | |
| Geekom AE7 (Nvidia GeForce RTX 3060 Ti FE) | |
| Minisforum UH125 Pro (Nvidia GeForce RTX 3060 Ti FE) | |
| ComputeMark v2.1 | |
| 1024x600 Normal, Score | |
| Geekom GT13 Pro (Nvidia GeForce RTX 3060 Ti FE) | |
| Geekom AE7 (Nvidia GeForce RTX 3060 Ti FE) | |
| Geekom A8 (Nvidia GeForce RTX 3060 Ti FE) | |
| Geekom XT13 Pro (Nvidia GeForce RTX 3060 Ti FE) | |
| Minisforum UH125 Pro (Nvidia GeForce RTX 3060 Ti FE) | |
| Geekom XT12 Pro (Nvidia GeForce RTX 3060 Ti FE) | |
| 1024x600 Normal, Fluid 3DTex | |
| Geekom GT13 Pro (Nvidia GeForce RTX 3060 Ti FE) | |
| Geekom AE7 (Nvidia GeForce RTX 3060 Ti FE) | |
| Minisforum UH125 Pro (Nvidia GeForce RTX 3060 Ti FE) | |
| Geekom A8 (Nvidia GeForce RTX 3060 Ti FE) | |
| Geekom XT13 Pro (Nvidia GeForce RTX 3060 Ti FE) | |
| Geekom XT12 Pro (Nvidia GeForce RTX 3060 Ti FE) | |
| 1024x600 Normal, Fluid 2DTexArr | |
| Geekom GT13 Pro (Nvidia GeForce RTX 3060 Ti FE) | |
| Geekom AE7 (Nvidia GeForce RTX 3060 Ti FE) | |
| Minisforum UH125 Pro (Nvidia GeForce RTX 3060 Ti FE) | |
| Geekom A8 (Nvidia GeForce RTX 3060 Ti FE) | |
| Geekom XT13 Pro (Nvidia GeForce RTX 3060 Ti FE) | |
| Geekom XT12 Pro (Nvidia GeForce RTX 3060 Ti FE) | |
| 1024x600 Normal, Mandel Vector | |
| Geekom GT13 Pro (Nvidia GeForce RTX 3060 Ti FE) | |
| Geekom AE7 (Nvidia GeForce RTX 3060 Ti FE) | |
| Geekom A8 (Nvidia GeForce RTX 3060 Ti FE) | |
| Geekom XT13 Pro (Nvidia GeForce RTX 3060 Ti FE) | |
| Minisforum UH125 Pro (Nvidia GeForce RTX 3060 Ti FE) | |
| Geekom XT12 Pro (Nvidia GeForce RTX 3060 Ti FE) | |
| 1024x600 Normal, Mandel Scalar | |
| Geekom GT13 Pro (Nvidia GeForce RTX 3060 Ti FE) | |
| Geekom AE7 (Nvidia GeForce RTX 3060 Ti FE) | |
| Geekom A8 (Nvidia GeForce RTX 3060 Ti FE) | |
| Geekom XT13 Pro (Nvidia GeForce RTX 3060 Ti FE) | |
| Minisforum UH125 Pro (Nvidia GeForce RTX 3060 Ti FE) | |
| Geekom XT12 Pro (Nvidia GeForce RTX 3060 Ti FE) | |
| 1024x600 Normal, QJuliaRayTrace | |
| Geekom GT13 Pro (Nvidia GeForce RTX 3060 Ti FE) | |
| Geekom AE7 (Nvidia GeForce RTX 3060 Ti FE) | |
| Geekom A8 (Nvidia GeForce RTX 3060 Ti FE) | |
| Geekom XT13 Pro (Nvidia GeForce RTX 3060 Ti FE) | |
| Minisforum UH125 Pro (Nvidia GeForce RTX 3060 Ti FE) | |
| Geekom XT12 Pro (Nvidia GeForce RTX 3060 Ti FE) | |
| Photoshop PugetBench - GPU Score | |
| Geekom A8 (Nvidia GeForce RTX 3060 Ti FE) | |
| Geekom AE7 (Nvidia GeForce RTX 3060 Ti FE) | |
| Geekom XT12 Pro (Nvidia GeForce RTX 3060 Ti FE) | |
| Geekom GT13 Pro (Nvidia GeForce RTX 3060 Ti FE) | |
| Minisforum UH125 Pro (Nvidia GeForce RTX 3060 Ti FE) | |
| Geekom XT13 Pro (Nvidia GeForce RTX 3060 Ti FE) | |
| Premiere Pro PugetBench - GPU 0.9 | |
| Geekom A8 (Nvidia GeForce RTX 3060 Ti FE) | |
| Geekom AE7 (Nvidia GeForce RTX 3060 Ti FE) | |
| Geekom GT13 Pro (Nvidia GeForce RTX 3060 Ti FE) | |
| Minisforum UH125 Pro (Nvidia GeForce RTX 3060 Ti FE) | |
| Geekom XT13 Pro (Nvidia GeForce RTX 3060 Ti FE) | |
| Geekom XT12 Pro (Nvidia GeForce RTX 3060 Ti FE) | |
| Cyberpunk 2077 | |
| 1280x720 Low Preset (FSR off) | |
| Geekom AE7 (Nvidia GeForce RTX 3060 Ti FE) | |
| Geekom A8 (Nvidia GeForce RTX 3060 Ti FE) | |
| Geekom XT13 Pro (Nvidia GeForce RTX 3060 Ti FE) | |
| Geekom GT13 Pro (Nvidia GeForce RTX 3060 Ti FE) | |
| Geekom XT12 Pro (Nvidia GeForce RTX 3060 Ti FE) | |
| Minisforum UH125 Pro (Nvidia GeForce RTX 3060 Ti FE) | |
| Geekom XT13 Pro | |
| 1920x1080 Medium Preset (FSR off) | |
| Geekom AE7 (Nvidia GeForce RTX 3060 Ti FE) | |
| Geekom XT13 Pro (Nvidia GeForce RTX 3060 Ti FE) | |
| Geekom A8 (Nvidia GeForce RTX 3060 Ti FE) | |
| Geekom GT13 Pro (Nvidia GeForce RTX 3060 Ti FE) | |
| Geekom XT12 Pro (Nvidia GeForce RTX 3060 Ti FE) | |
| Minisforum UH125 Pro (Nvidia GeForce RTX 3060 Ti FE) | |
| Geekom XT13 Pro | |
| 1920x1080 Ultra Preset (FSR off) | |
| Geekom AE7 (Nvidia GeForce RTX 3060 Ti FE) | |
| Geekom XT13 Pro (Nvidia GeForce RTX 3060 Ti FE) | |
| Geekom GT13 Pro (Nvidia GeForce RTX 3060 Ti FE) | |
| Geekom A8 (Nvidia GeForce RTX 3060 Ti FE) | |
| Geekom XT12 Pro (Nvidia GeForce RTX 3060 Ti FE) | |
| Minisforum UH125 Pro (Nvidia GeForce RTX 3060 Ti FE) | |
| Geekom XT13 Pro | |
| Baldur's Gate 3 | |
| 1920x1080 Low Preset AA:SM | |
| Geekom GT13 Pro (Nvidia GeForce RTX 3060 Ti FE) | |
| Geekom XT12 Pro (Nvidia GeForce RTX 3060 Ti FE) | |
| Geekom XT13 Pro (Nvidia GeForce RTX 3060 Ti FE) | |
| Geekom AE7 (Nvidia GeForce RTX 3060 Ti FE) | |
| Geekom A8 (Nvidia GeForce RTX 3060 Ti FE) | |
| Minisforum UH125 Pro (Nvidia GeForce RTX 3060 Ti FE) | |
| Geekom XT13 Pro | |
| 1920x1080 Medium Preset AA:T | |
| Geekom XT13 Pro (Nvidia GeForce RTX 3060 Ti FE) | |
| Geekom GT13 Pro (Nvidia GeForce RTX 3060 Ti FE) | |
| Geekom A8 (Nvidia GeForce RTX 3060 Ti FE) | |
| Geekom XT12 Pro (Nvidia GeForce RTX 3060 Ti FE) | |
| Geekom AE7 (Nvidia GeForce RTX 3060 Ti FE) | |
| Minisforum UH125 Pro (Nvidia GeForce RTX 3060 Ti FE) | |
| Geekom XT13 Pro | |
| 1920x1080 Ultra Preset AA:T | |
| Geekom GT13 Pro (Nvidia GeForce RTX 3060 Ti FE) | |
| Geekom XT13 Pro (Nvidia GeForce RTX 3060 Ti FE) | |
| Geekom A8 (Nvidia GeForce RTX 3060 Ti FE) | |
| Geekom XT12 Pro (Nvidia GeForce RTX 3060 Ti FE) | |
| Geekom AE7 (Nvidia GeForce RTX 3060 Ti FE) | |
| Minisforum UH125 Pro (Nvidia GeForce RTX 3060 Ti FE) | |
| Geekom XT13 Pro | |
| F1 24 | |
| 1920x1080 Low Preset AA:T AF:16x | |
| Geekom AE7 (Nvidia GeForce RTX 3060 Ti FE) | |
| Geekom A8 (Nvidia GeForce RTX 3060 Ti FE) | |
| Geekom GT13 Pro (Nvidia GeForce RTX 3060 Ti FE) | |
| Geekom XT13 Pro (Nvidia GeForce RTX 3060 Ti FE) | |
| Geekom XT12 Pro (Nvidia GeForce RTX 3060 Ti FE) | |
| Minisforum UH125 Pro (Nvidia GeForce RTX 3060 Ti FE) | |
| Geekom XT13 Pro | |
| 1920x1080 Medium Preset AA:T AF:16x | |
| Geekom A8 (Nvidia GeForce RTX 3060 Ti FE) | |
| Geekom AE7 (Nvidia GeForce RTX 3060 Ti FE) | |
| Geekom XT12 Pro (Nvidia GeForce RTX 3060 Ti FE) | |
| Geekom XT13 Pro (Nvidia GeForce RTX 3060 Ti FE) | |
| Geekom GT13 Pro (Nvidia GeForce RTX 3060 Ti FE) | |
| Minisforum UH125 Pro (Nvidia GeForce RTX 3060 Ti FE) | |
| Geekom XT13 Pro | |
| 1920x1080 Ultra High Preset AA:T AF:16x | |
| Geekom AE7 (Nvidia GeForce RTX 3060 Ti FE) | |
| Geekom A8 (Nvidia GeForce RTX 3060 Ti FE) | |
| Geekom XT13 Pro (Nvidia GeForce RTX 3060 Ti FE) | |
| Geekom GT13 Pro (Nvidia GeForce RTX 3060 Ti FE) | |
| Geekom XT12 Pro (Nvidia GeForce RTX 3060 Ti FE) | |
| Minisforum UH125 Pro (Nvidia GeForce RTX 3060 Ti FE) | |
| Geekom XT13 Pro, Intel Iris Xe Graphics G7 96EUs i9-13900H | Geekom XT13 Pro (Nvidia GeForce RTX 3060 Ti FE), i9-13900H | Geekom GT13 Pro (Nvidia GeForce RTX 3060 Ti FE), i9-13900H | Geekom XT12 Pro (Nvidia GeForce RTX 3060 Ti FE), i9-12900H | Minisforum UH125 Pro (Nvidia GeForce RTX 3060 Ti FE), Ultra 5 125H | Geekom AE7 (Nvidia GeForce RTX 3060 Ti FE), R9 7940HS | Geekom A8 (Nvidia GeForce RTX 3060 Ti FE), R9 8945HS | Media della classe Mini PC | |
|---|---|---|---|---|---|---|---|---|
| SPECviewperf 2020 | 391% | 387% | 321% | 182% | 395% | 516% | 493% | |
| 3840x2160 Medical (medical-03) (fps) | 3.63 | 13 258% | 10.8 198% | 11.8 225% | 10.9 200% | 13 258% | 10.8 198% | 21.2 ? 484% |
| 3840x2160 Energy (energy-03) (fps) | 3.15 | 20.9 563% | 21 567% | 18.9 500% | 17.8 465% | 20.9 563% | 50.3 1497% | 31.8 ? 910% |
| 3840x2160 Creo (creo-03) (fps) | 16 | 74.2 364% | 76.4 378% | 62.7 292% | 26.6 66% | 76.8 380% | 76.6 379% | 48.4 ? 203% |
| 3840x2160 CATIA (catia-06) (fps) | 7.9 | 39.4 399% | 40.1 408% | 32.8 315% | 23.6 199% | 39.2 396% | 38.8 391% | 33.1 ? 319% |
| 3840x2160 3ds Max (3dsmax-07) (fps) | 10.3 | 47.2 358% | 47.3 359% | 40 288% | 28.7 179% | 46.5 351% | 45.9 346% | 51.3 ? 398% |
| 3840x2160 Siemens NX (snx-04) (fps) | 6.13 | 16.5 169% | 16.5 169% | 15.2 148% | 11.4 86% | 16.6 171% | 16.6 171% | 51.4 ? 738% |
| 3840x2160 Maya (maya-06) (fps) | 26.8 | 194 624% | 196 631% | 155 478% | 47.5 77% | 199 643% | 195 628% | 132.8 ? 396% |
| basso | medio | alto | ultra | QHD | 4K | |
|---|---|---|---|---|---|---|
| GTA V (2015) | 182.2 | 178.4 | 170.3 | 104.2 | 92.7 | 103.4 |
| Dota 2 Reborn (2015) | 165.8 | 138.3 | 132 | 121.9 | 104.6 | |
| Final Fantasy XV Benchmark (2018) | 183.7 | 142.2 | 98.8 | 77.6 | 48.6 | |
| X-Plane 11.11 (2018) | 146.4 | 137.9 | 106.3 | 92.1 | ||
| Baldur's Gate 3 (2023) | 113 | 91.3 | 79 | 78.5 | 61.6 | 37.1 |
| Cyberpunk 2077 (2023) | 88.2 | 81.4 | 71.7 | 64.4 | 44.5 | 22.2 |
| F1 24 (2024) | 76.9 | 73.1 | 60.5 | 42.2 | 36.9 | 19.2 |
Emissioni - Raffreddamento debole e basso consumo energetico
Emissioni di rumore
Anche i dispositivi con lo stesso design non sono stati in grado di impressionare con valori al top in termini di emissioni acustiche. Questo vale anche per il Geekom XT13 Pro, almeno sotto carico. Il mini-PC è molto silenzioso quando è inattivo e si sente appena. Tuttavia, la ventola è sempre in funzione, il che significa che non è possibile un funzionamento semi-passivo. Sotto carico, la ventola di tanto in tanto sale di giri in modo considerevole e siamo stati in grado di misurare un livello di pressione sonora di picco di 49,5 dB(A). Tuttavia, il volume massimo non è sempre presente. Durante lo stress test, la velocità della ventola ha oscillato più volte, tanto che il Geekom XT13 Pro ha raggiunto solo 38 dB(A) sotto carico. Abbiamo osservato lo stesso fenomeno sotto carico medio. Qui, il volume misurabile oscilla tra 38 e 42,2 dB(A)
Purtroppo, il Geekom XT12 Pro non è uno dei dispositivi più silenziosi. Il dispositivo funziona in modo quasi silenzioso solo quando è al minimo, e si sente solo il rumore della ventola. La situazione cambia sotto carico, in quanto il mini-PC è chiaramente udibile fino a 44,2 dB(A). Siamo persino riusciti a misurare fino a 47,2 dB(A) durante il gioco. Tuttavia, non siamo riusciti a rilevare un livello di pressione sonora costantemente alto durante il gioco. In questo caso, il risultato oscillava tra 39 e 47,2 dB(A).
Rumorosità
| Idle |
| 27.6 / 27.8 / 27.9 dB(A) |
| Sotto carico |
| 42.2 / 49.5 dB(A) |
 | ||
30 dB silenzioso 40 dB(A) udibile 50 dB(A) rumoroso |
||
min: | ||
| Geekom XT13 Pro i9-13900H, Iris Xe G7 96EUs | Aoostar GEM12 R7 8845HS, Radeon 780M | Minisforum AtomMan X7 Ti Ultra 9 185H, Arc 8-Core | Acemagic F2A Ultra 7 155H, Arc 8-Core | Geekom XT12 Pro i9-12900H, Iris Xe G7 96EUs | Geekom A7 R9 7940HS, Radeon 780M | |
|---|---|---|---|---|---|---|
| Noise | 10% | 1% | 2% | 2% | -9% | |
| off /ambiente * (dB) | 25 | 24.3 3% | 24.1 4% | 24.9 -0% | 25.4 -2% | 25.4 -2% |
| Idle Minimum * (dB) | 27.6 | 27.5 -0% | 29.8 -8% | 25.4 8% | 28 -1% | 33.3 -21% |
| Idle Average * (dB) | 27.8 | 27.6 1% | 29.9 -8% | 25.7 8% | 28.1 -1% | 33.6 -21% |
| Idle Maximum * (dB) | 27.9 | 27.6 1% | 30 -8% | 25.7 8% | 28.5 -2% | 33.7 -21% |
| Load Average * (dB) | 42.2 | 36 15% | 37.3 12% | 47.8 -13% | 39.6 6% | 43.3 -3% |
| Cyberpunk 2077 ultra * (dB) | 46.6 | 35.4 24% | ||||
| Load Maximum * (dB) | 49.5 | 38.2 23% | 43.5 12% | 49 1% | 44.2 11% | 43.3 13% |
| Witcher 3 ultra * (dB) | 35.4 | 40.2 | 45.23 | 47.2 | 43.2 |
* ... Meglio usare valori piccoli
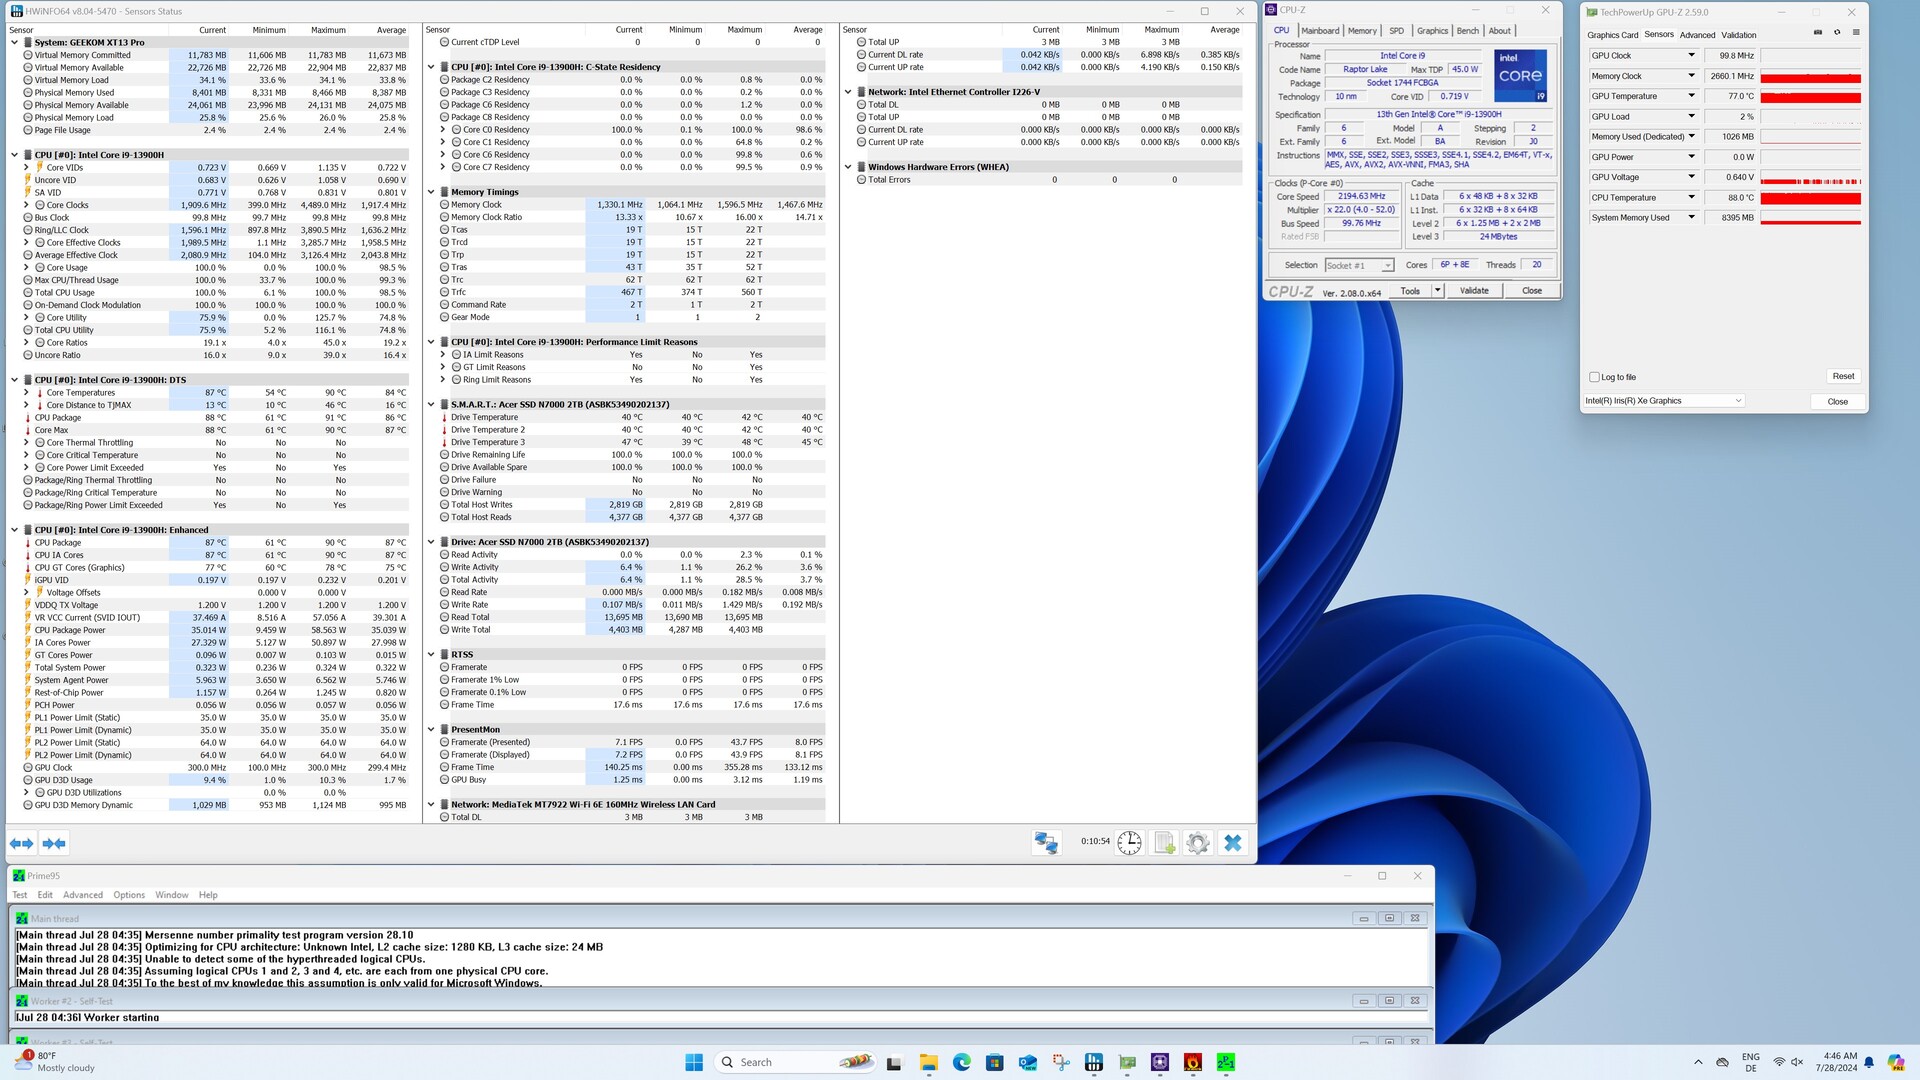
Temperatura
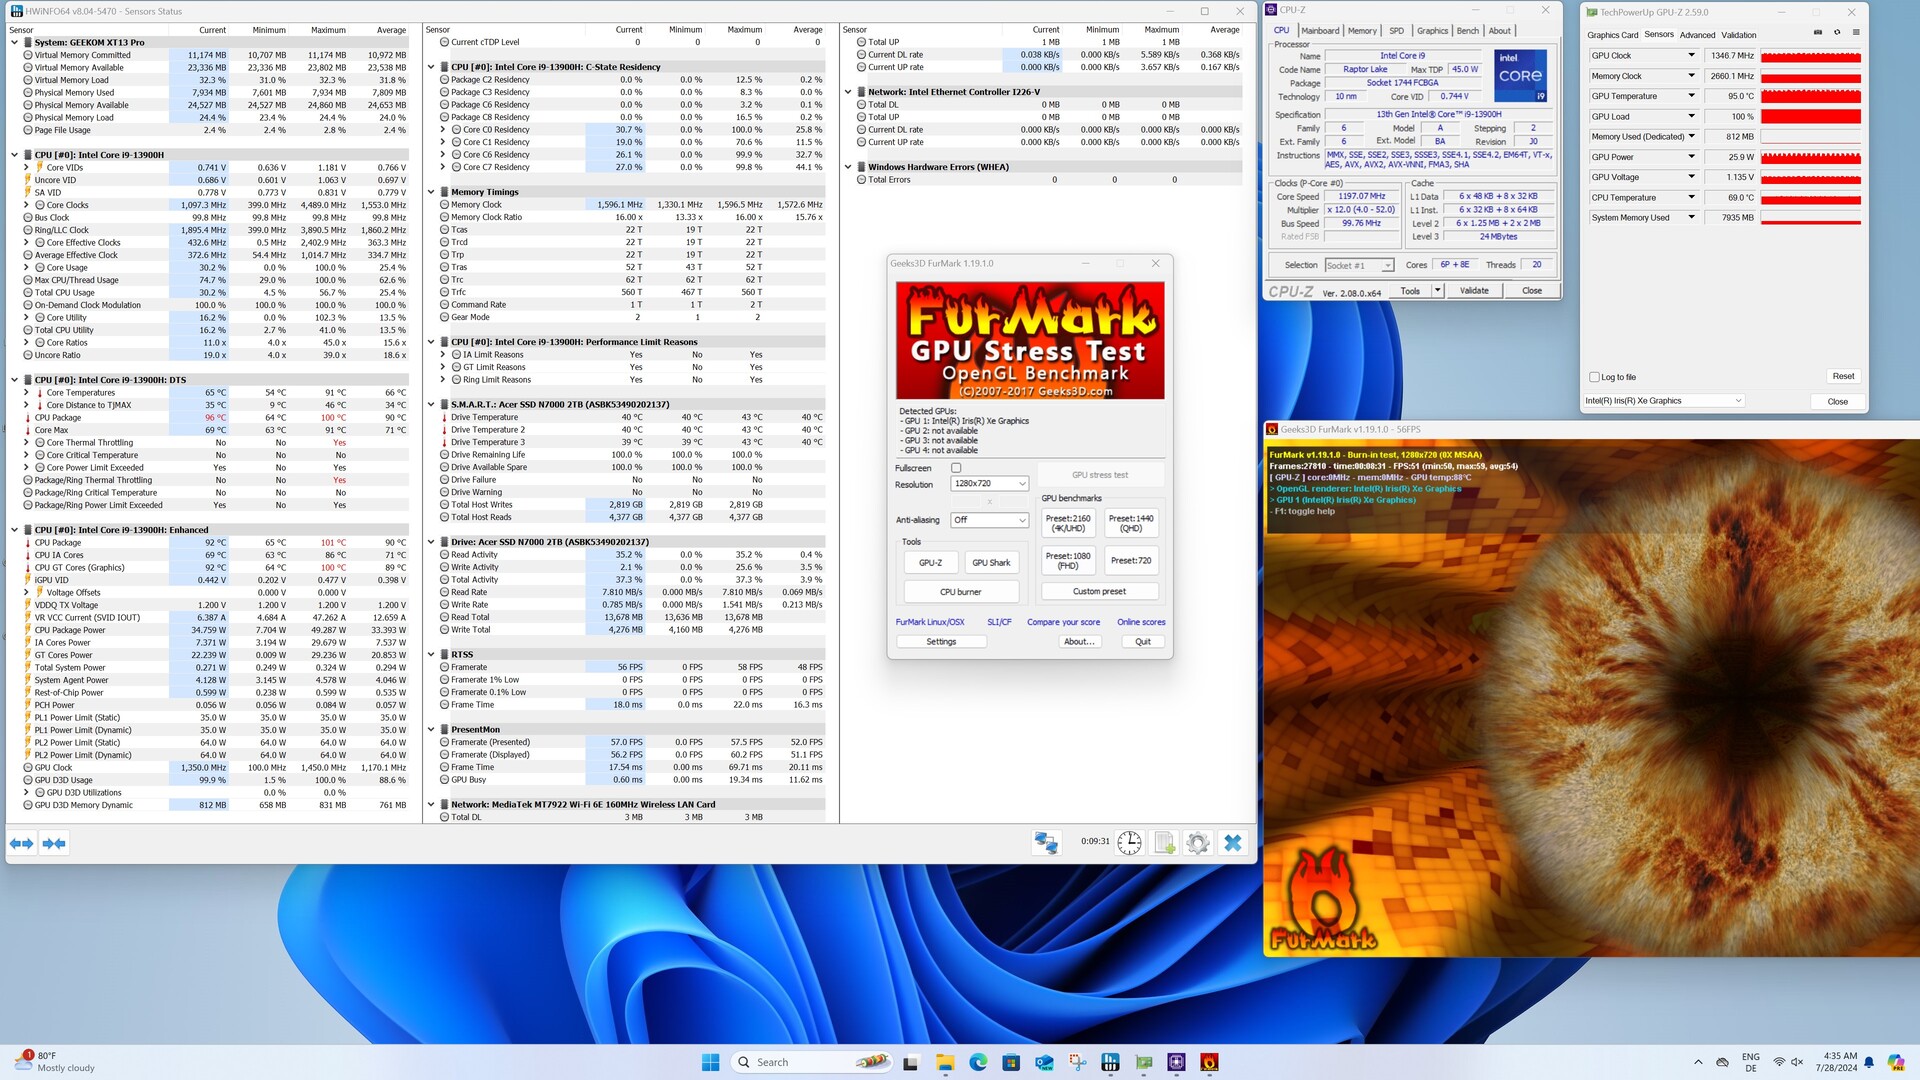
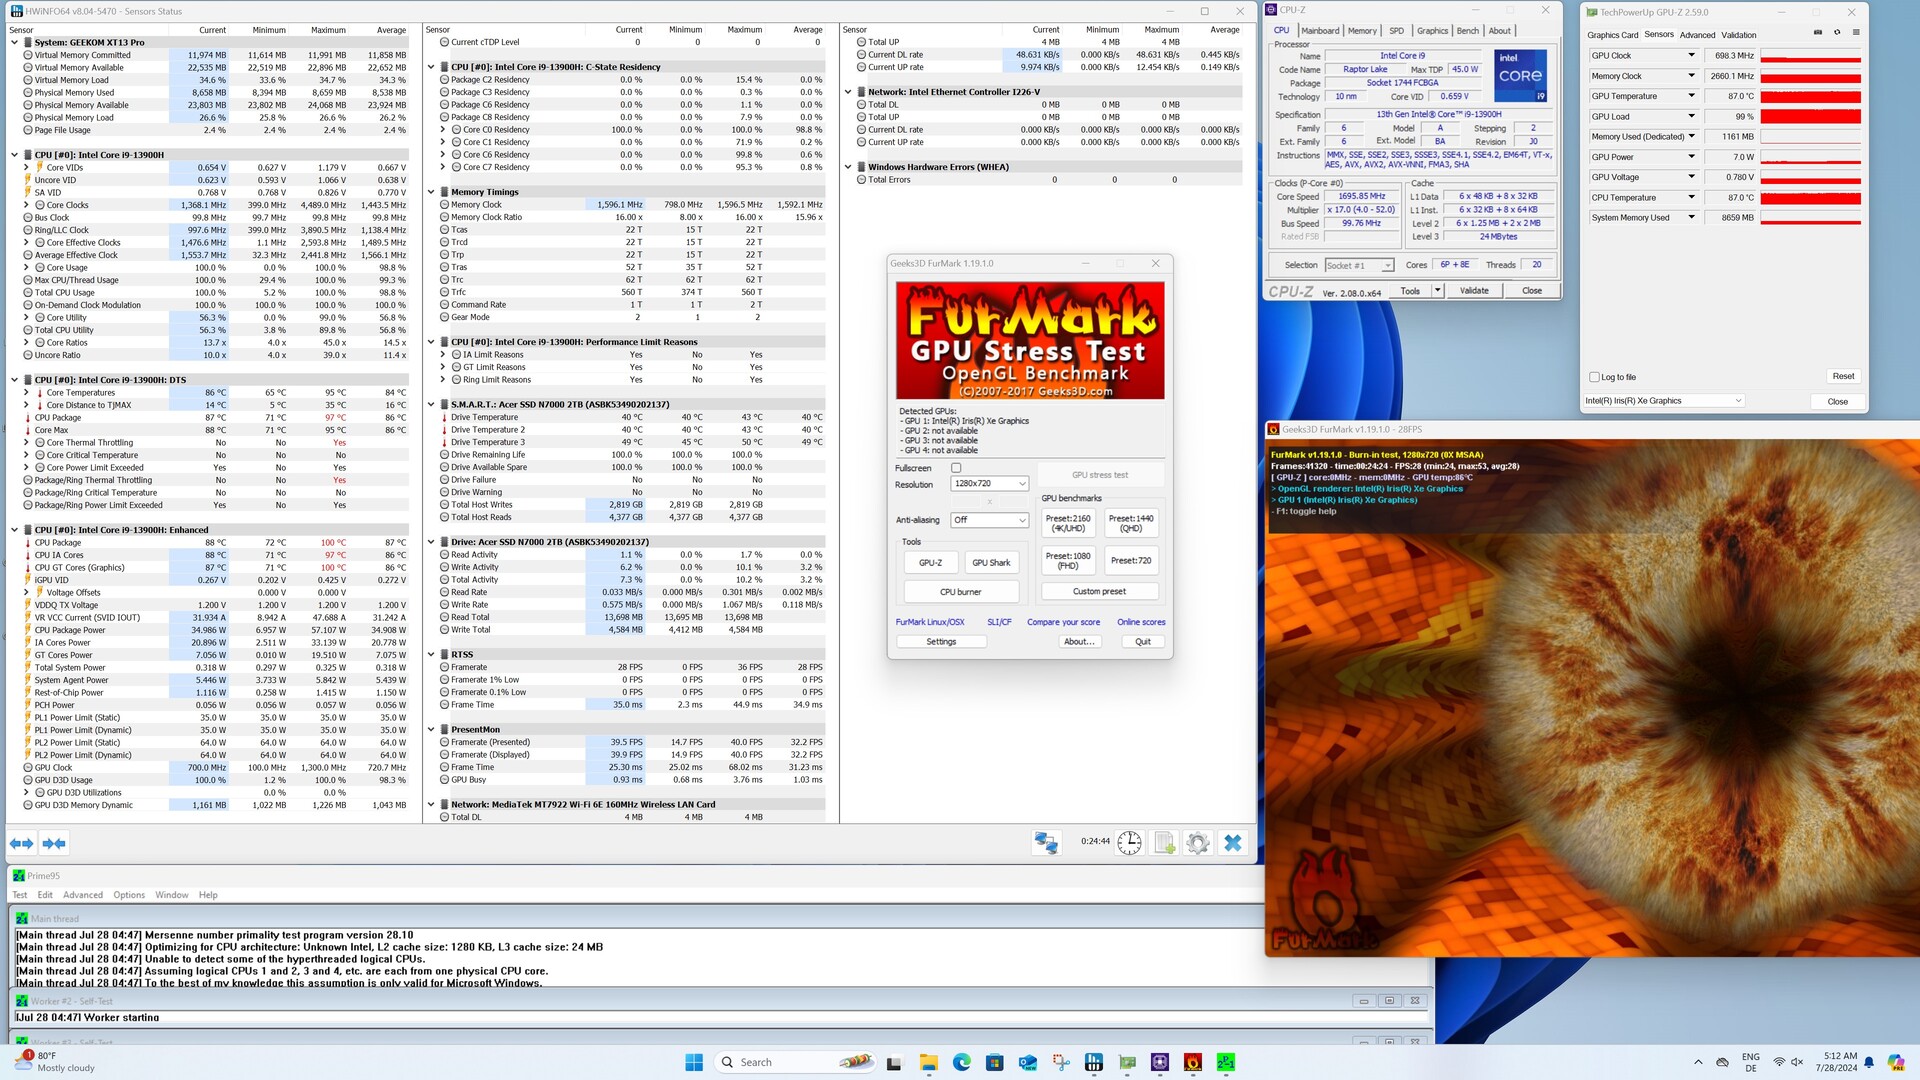
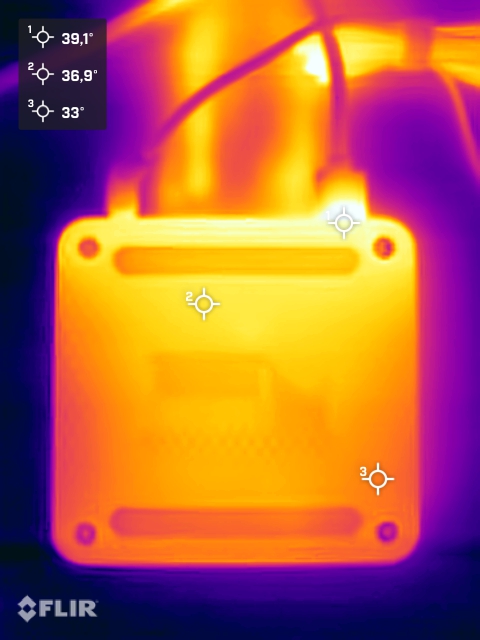
L'involucro si riscalda sensibilmente sotto carico. Tuttavia, non troviamo valori critici. Il SoC appare un po' diverso, in quanto Geekom non limita la temperatura massima, che raggiunge rapidamente i 100 °C sotto carico. A differenza del Cinebench R15 multi-loop, l'Intel Core i9-13900H non supera il limite di 64 watt nello stress test. Il SoC si riscalda troppo rapidamente e le prestazioni devono essere ridotte. In un periodo di tempo più lungo, la temperatura si stabilizza a circa 90 °C, il che non rappresenta un problema per il processore. Il design estremamente compatto rende semplicemente impossibile installare un sistema di raffreddamento più potente.
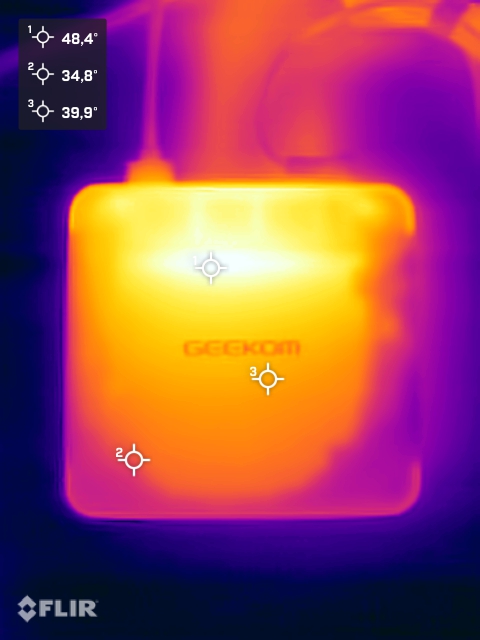
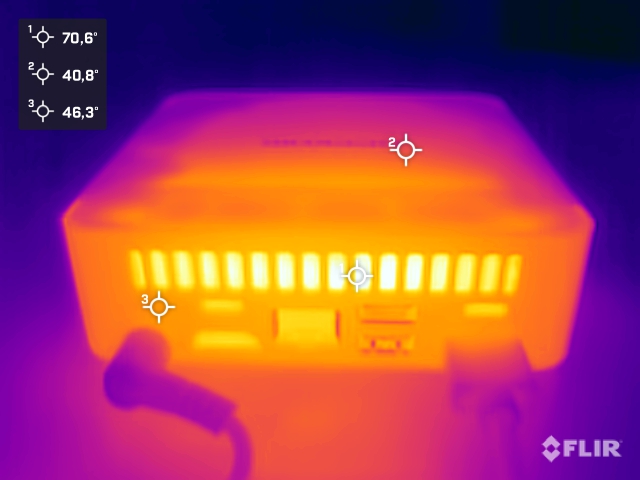
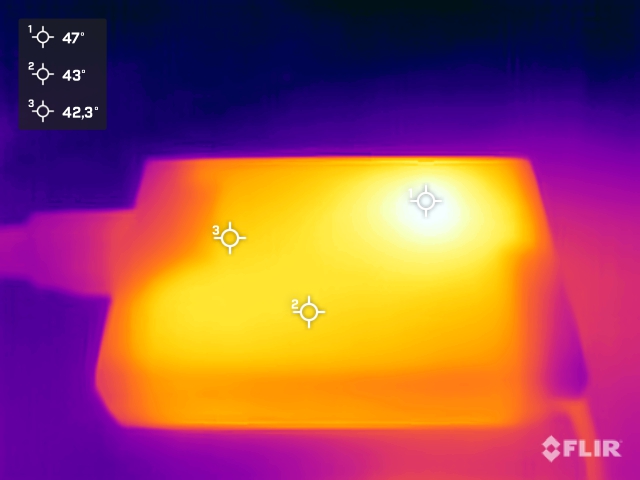
(-) La temperatura massima sul lato superiore è di 45.7 °C / 114 F, rispetto alla media di 35.5 °C / 96 F, che varia da 20.6 a 69.5 °C per questa classe Mini PC.
(±) Il lato inferiore si riscalda fino ad un massimo di 40.3 °C / 105 F, rispetto alla media di 36.2 °C / 97 F
(+) In idle, la temperatura media del lato superiore è di 27.9 °C / 82 F, rispetto alla media deld ispositivo di 32.2 °C / 90 F.
Consumo di energia
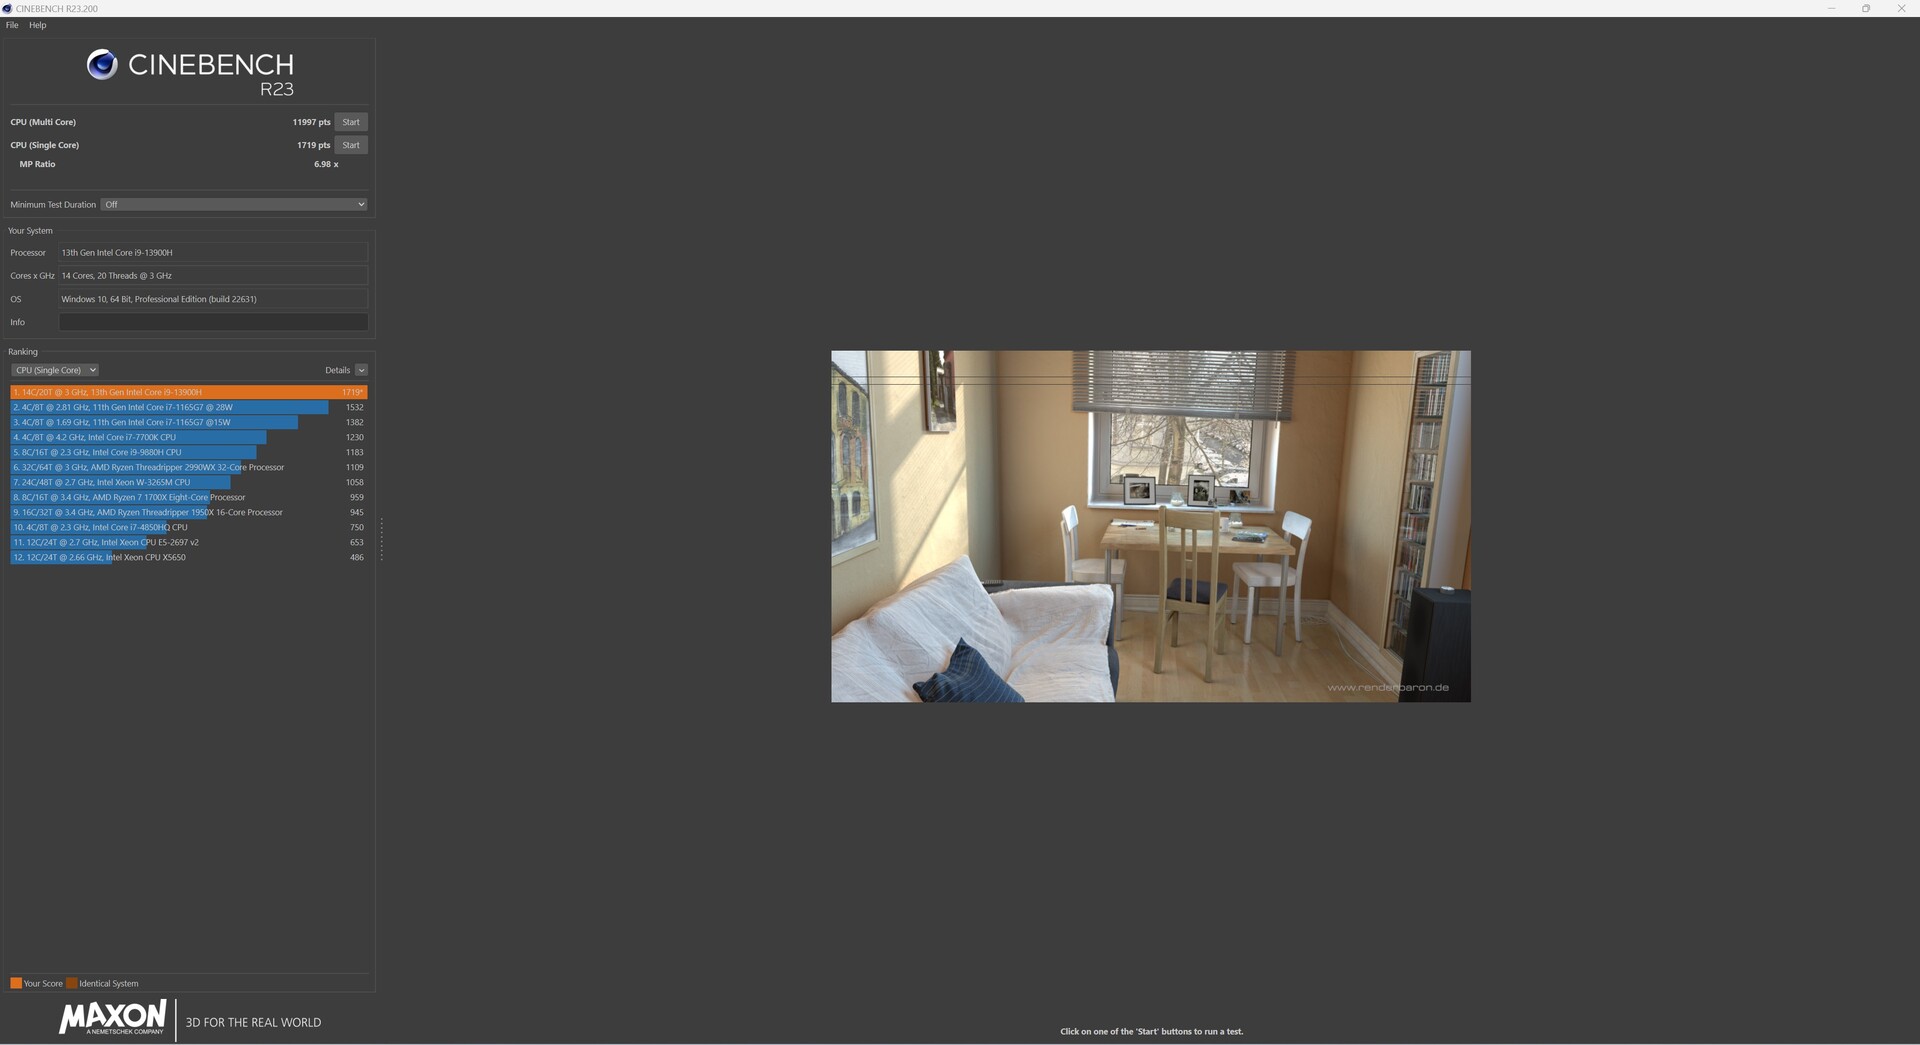
Il consumo energetico di Geekom XT13 Pro si confronta in modo molto favorevole con i suoi concorrenti. Abbiamo misurato solo valori bassi anche in modalità idle. I limiti di potenza ridotti (PL1 e PL2) dell'Intel Core i9-13900H garantiscono un fabbisogno energetico relativamente basso sotto carico. Sotto carico medio, il sistema riesce a gestire poco meno di 50 watt. Sotto carico, vediamo i 94,5 watt solo per un breve periodo, quando il sistema può ancora sfruttare il Turbo. Abbiamo potuto osservare un comportamento un po' particolare. Nel test Cinebench R23 Sigle, abbiamo documentato molti picchi, mai visti in altri dispositivi di test. Abbiamo ripetuto il test diverse volte - con lo stesso risultato. È ragionevole supporre che il SoC stia lavorando ripetutamente a una temperatura limite in questo caso, che gli consente di assorbire brevemente più energia. L'alimentazione è fornita da un piccolo alimentatore da 120 watt. Lo stesso alimentatore è incluso in molti dispositivi Geekom.
| Off / Standby | |
| Idle | |
| Sotto carico |
|
Leggenda:
min: | |
| Geekom XT13 Pro i9-13900H, Iris Xe G7 96EUs | Aoostar GEM12 R7 8845HS, Radeon 780M | Minisforum AtomMan X7 Ti Ultra 9 185H, Arc 8-Core | Acemagic F2A Ultra 7 155H, Arc 8-Core | Geekom XT12 Pro i9-12900H, Iris Xe G7 96EUs | Geekom A7 R9 7940HS, Radeon 780M | Media Intel Iris Xe Graphics G7 96EUs | Media della classe Mini PC | |
|---|---|---|---|---|---|---|---|---|
| Power Consumption | -38% | -34% | -35% | -21% | 11% | 1% | -41% | |
| Idle Minimum * (Watt) | 6.3 | 8.2 -30% | 8.2 -30% | 9.1 -44% | 5.7 10% | 3.8 40% | 5.51 ? 13% | 8.95 ? -42% |
| Idle Average * (Watt) | 7.1 | 10 -41% | 12.1 -70% | 10.3 -45% | 9.5 -34% | 4.8 32% | 8.66 ? -22% | 11.1 ? -56% |
| Idle Maximum * (Watt) | 9 | 14.6 -62% | 14 -56% | 14.4 -60% | 16.5 -83% | 6.5 28% | 10.9 ? -21% | 14.2 ? -58% |
| Load Average * (Watt) | 49.8 | 73.9 -48% | 53.1 -7% | 54.9 -10% | 53.3 -7% | 71.9 -44% | 45.6 ? 8% | 64.9 ? -30% |
| Cyberpunk 2077 ultra external monitor * (Watt) | 54 | 79.9 -48% | ||||||
| Load Maximum * (Watt) | 94.5 | 95.3 -1% | 100.4 -6% | 110.4 -17% | 87.8 7% | 94.7 -0% | 67.8 ? 28% | 112.7 ? -19% |
* ... Meglio usare valori piccoli
Efficiency
| Performance rating - Percent | |
| Geekom A8, R9 8945HS | |
| Minisforum AtomMan X7 Ti | |
| Acemagic F2A | |
| Geekom XT13 Pro | |
| Geekom XT12 Pro | |
| Power Consumption | |
| Cinebench R23 Multi Power Efficiency - external Monitor | |
| Geekom A8, R9 8945HS | |
| Minisforum AtomMan X7 Ti | |
| Geekom XT13 Pro | |
| Acemagic F2A | |
| Geekom XT12 Pro | |
| Cinebench R23 Single Power Efficiency - external Monitor | |
| Geekom A8, R9 8945HS | |
| Minisforum AtomMan X7 Ti | |
| Acemagic F2A | |
| Geekom XT13 Pro | |
| Geekom XT12 Pro | |
| Cinebench R15 Multi Efficiency (external Monitor) | |
| Geekom A8, R9 8945HS | |
| Minisforum AtomMan X7 Ti | |
| Geekom XT13 Pro | |
| Acemagic F2A | |
| Geekom XT12 Pro | |
Power consumption with external monitor
Power consumption with external monitor
Pro
Contro
Verdetto - Prezzo premium senza prestazioni premium
Il Geekom XT13 Pro è un mini-PC potente. Tuttavia, abbiamo già potuto constatarlo con il Geekom XT12 Pro. Se ci limitiamo a confrontare questi due modelli tra loro, può optare per il dispositivo più vecchio senza che si noti una perdita di prestazioni. Il Intel Core i9-13900H del Geekom XT13 Pro non è in grado di fornire un aumento notevole delle prestazioni. Le differenze tecniche rispetto all'Intel Core i9-12900H sono troppo ridotte. Geekom non osa fare il passo coraggioso di un mini-PC basato sulla serie Meteor Lake. Ciò significa che Geekom è rimasto indietro, in quanto molti altri produttori hanno già equipaggiato le loro serie di modelli con gli ultimi processori di Intel. Lo svantaggio maggiore di Geekom XT13 Pro è l'iGPU, che è inferiore ai rappresentanti moderni in tutti i test. Tuttavia, Geekom non è inferiore solo ai suoi concorrenti, ma anche a se stesso. Il portafoglio di Geekom include mini-PC con i più recenti SoC AMD, che tecnicamente non sono molto peggiori, ma offrono un risultato complessivamente migliore. Non abbiamo ancora considerato il prezzo. Purtroppo, il Geekom XT13 Pro è completamente fuori linea. 999 euro è attualmente il prezzo da pagare per essere il modello di punta. Altri mini-PC costano un po' meno ma offrono maggiori prestazioni.
Il Geekom XT13 Pro offre prestazioni adeguate con l'Intel Core i9-13900H e colpisce per le sue caratteristiche versatili. Tuttavia, il rapporto prezzo-prestazioni del Geekom XT13 Pro non è affatto all'altezza.
La buona connettività, con la quale Geekom ha ripetutamente ottenuto punti in passato, deve essere sottolineata positivamente. Le numerose connessioni includono due porte USB4, che possono influenzare la decisione di acquisto in termini di protezione futura. Anche la garanzia di tre anni del produttore parla a favore di un dispositivo di Geekom. Naturalmente, è disponibile anche per altri dispositivi del produttore. L'efficienza potrebbe essere solo leggermente aumentata rispetto al Geekom XT12 Pro. In questa disciplina, l'Intel Core i9-13900H è chiaramente inferiore ai più moderni processori Meteor Lake. Per questo motivo, non possiamo consigliare l'acquisto del Geekom XT13 Pro, anche in relazione all'elevato prezzo di acquisto. Se il Geekom XT13 Pro non vuole diventare uno scalda scaffali, Geekom deve rivedere urgentemente il suo prezzo attuale.
Nota: abbiamo recentemente aggiornato il nostro sistema di valutazione e i risultati della versione 8 non sono paragonabili ai risultati della versione 7. Ulteriori informazioni sono disponibili qui.
Geekom XT13 Pro
- 10/29/2025 v8
Sebastian Bade
 Total Sustainability Score:
 Transparency
La selezione dei dispositivi da recensire viene effettuata dalla nostra redazione. Il campione di prova è stato fornito gratuitamente all'autore dal produttore a scopo di revisione. Non vi è stata alcuna influenza di terze parti su questa recensione, né il produttore ne ha ricevuto una copia prima della pubblicazione. Non vi era alcun obbligo di pubblicare questa recensione. In quanto società mediatica indipendente, Notebookcheck non è soggetta all'autorità di produttori, rivenditori o editori.
Ecco come Notebookcheck esegue i test
Ogni anno, Notebookcheck esamina in modo indipendente centinaia di laptop e smartphone utilizzando procedure standardizzate per garantire che tutti i risultati siano comparabili. Da circa 20 anni sviluppiamo continuamente i nostri metodi di prova e nel frattempo stabiliamo gli standard di settore. Nei nostri laboratori di prova, tecnici ed editori esperti utilizzano apparecchiature di misurazione di alta qualità. Questi test comportano un processo di validazione in più fasi. Il nostro complesso sistema di valutazione si basa su centinaia di misurazioni e parametri di riferimento ben fondati, che mantengono l'obiettività.Price comparison
