Notebookcheck Logo
Nvidia GeForce RTX 5080 Founders Edition in review

Recensione di Nvidia GeForce RTX 5080 Founders Edition: la scheda da 999 dollari rende di fatto superflua la RX 7900 XTX

Far sembrare 1.000 dollari un affare.

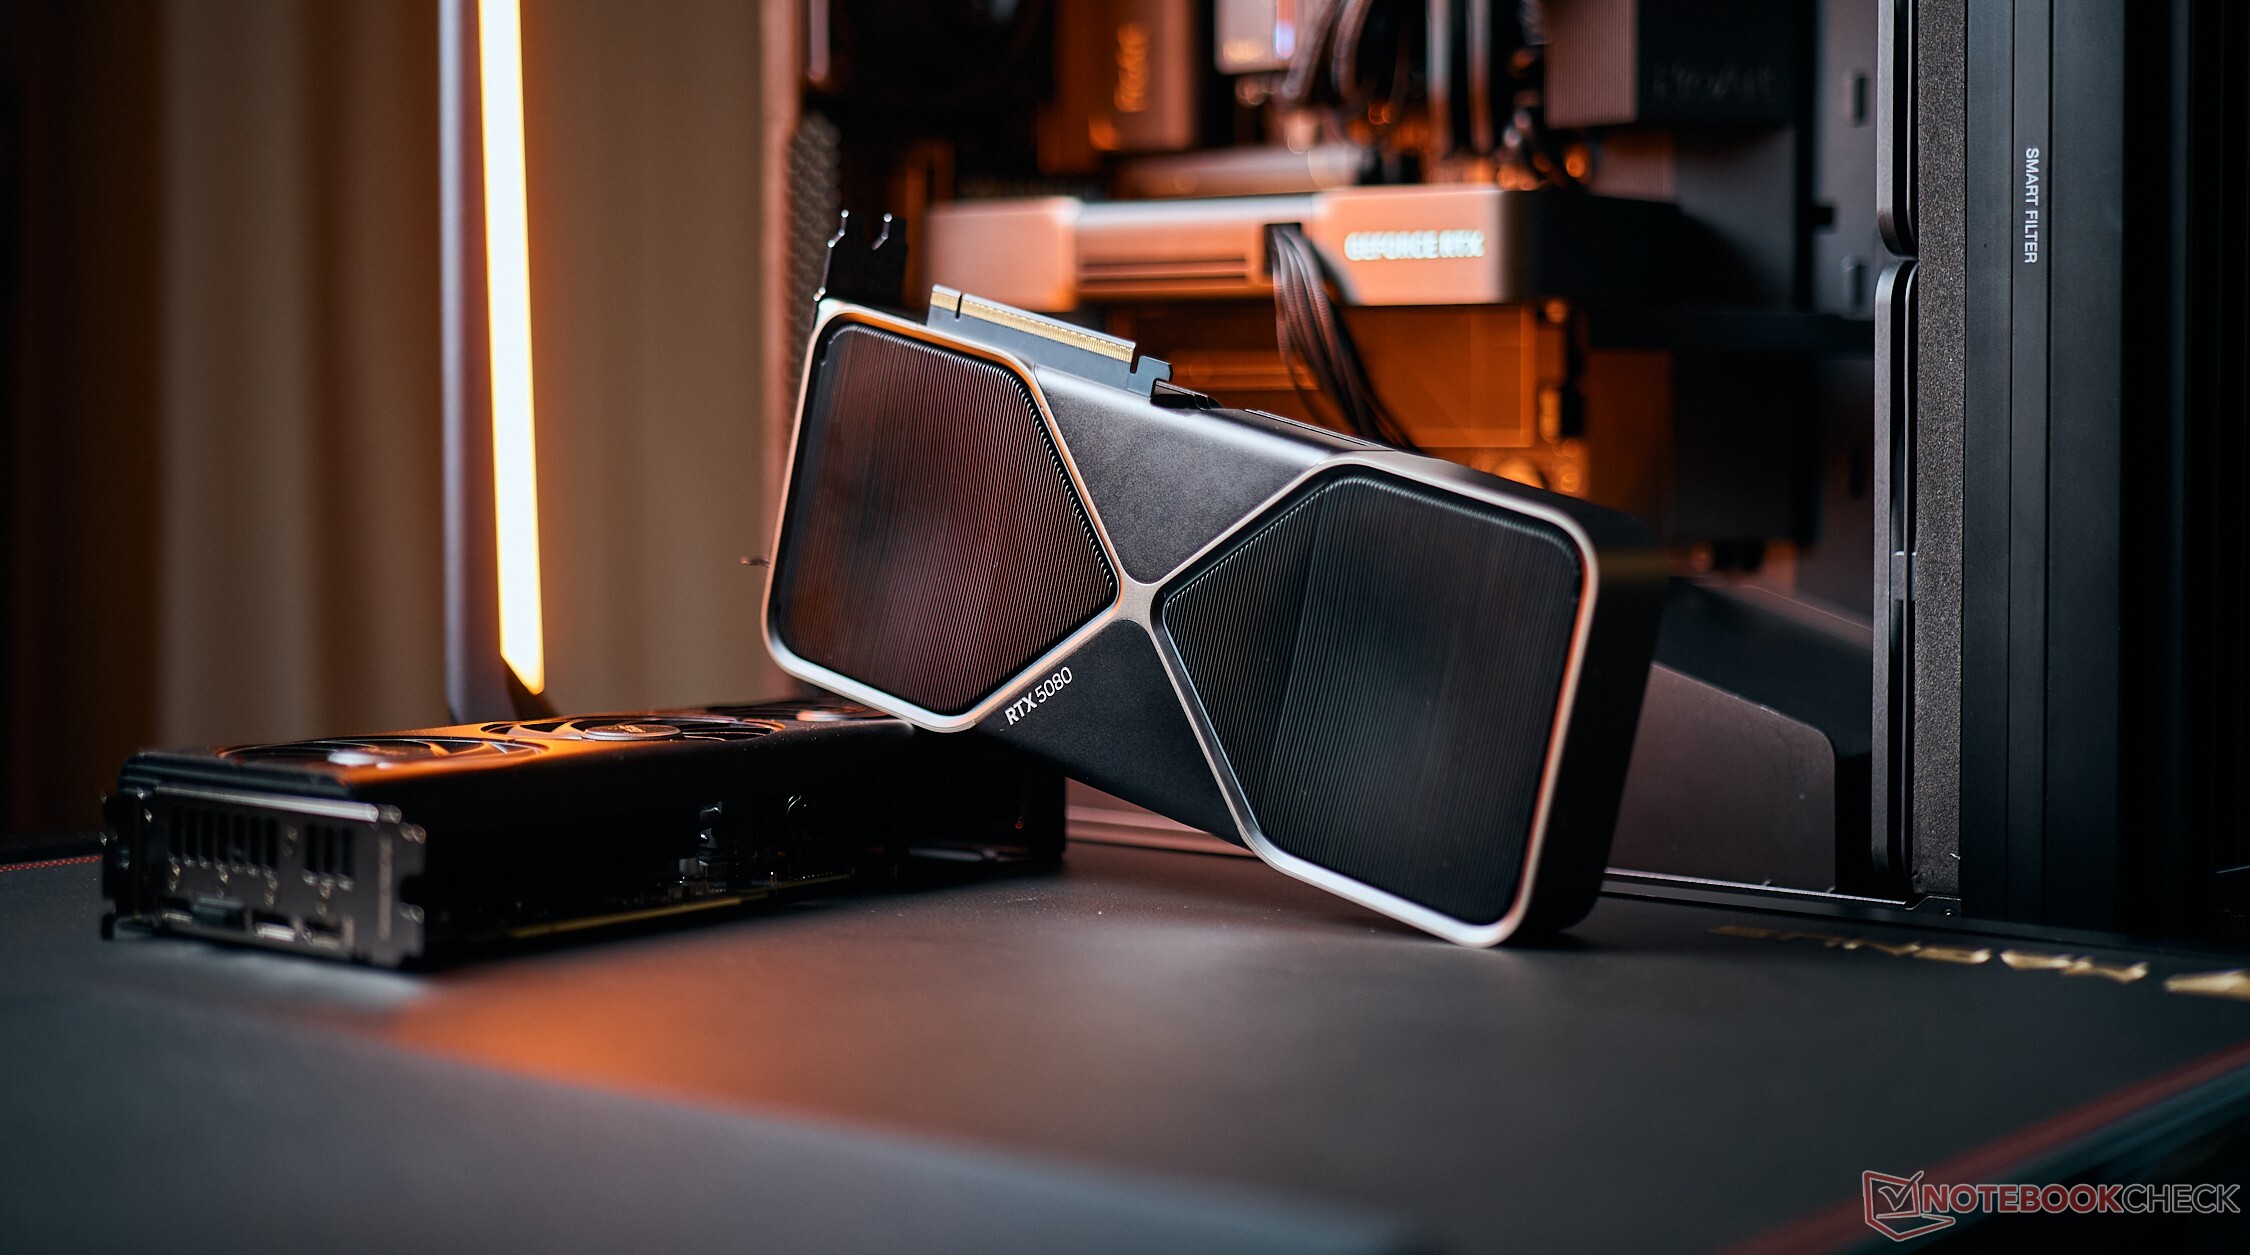
Con un nuovo design elegante che sembra perfetto in un case SFF, la Nvidia GeForce RTX 5080 Founders Edition è finalmente arrivata per scatenare la furia di Blackwell sui giocatori mainstream. La RTX 5080 FE apporta miglioramenti tangibili in termini di calcolo, raster e ray-tracing, oltre all'accesso alla nuova tecnologia DLSS frame gen, allo stesso prezzo di listino di 1.000 dollari, il che la pone in una posizione di vantaggio rispetto alla Radeon RX 7900 XTX... sempre che riesca ad accaparrarsene una.
Vaidyanathan Subramaniam, 👁 Vaidyanathan Subramaniam (traduzione a cura di DeepL / Ninh Duy) Pubblicato 🇺🇸 🇷🇺 ...
Nvidia Geforce GPU Gaming Desktop

Prezzi e disponibilità

Best Buy offre attualmente la Nvidia GeForce RTX 5080 Founders Edition al suo MSRP di 999 dollari, ma la scheda è esaurita al momento della scrittura.

In India, la RTX 5080 Founders Edition ha un prezzo ufficiale di ₹1.07.000 dollari. La scheda non è ancora presente nell'elenco di Amazon India, ma gli acquirenti interessati possono fare una richiesta a RP Tech Indial'importatore ufficiale di queste schede.

Amazon Logo
$1,989.99
ASUS The SFF-Ready Prime GeForce RTX™ 5080 16GB GDDR7 Graphics Card (PCIe® 5.0, HDMI®/DP 2.1, 2.5-Slot, Axial-tech Fans, Vapor Chamber, Dual BIOS)

Le ultime GPU RTX 50 Blackwell di Nvidia hanno visto opinioni divise. GeForce RTX 5090 Founders Edition continua ad essere la GPU a cui aspirare e il sorprendente design a 2 slot è stato generalmente lodato dai recensori, compresi noi.

La RTX 5090 è la Big Kahuna di Blackwell che si rivolge ai professionisti che giocano e che ha un prezzo di listino di 1.999 dollari. Ma che dire dei giocatori mainstream?

Ecco la RTX 5080. La RTX 5080 è dotata dei consueti miglioramenti architettonici e punta molto sulla sua abilità nell'intelligenza artificiale, nella speranza di prendere il testimone dalla RTX 4080 / RTX 4080 Super.

In questa recensione, diamo un'occhiata alla Nvidia GeForce RTX 5080 Founders Edition (FE) e vediamo che tipo di miglioramento può offrire il prezzo di 999 dollari rispetto alla generazione Ada.

Confronto tra RTX 5080 FE e altre GPU Nvidia

Specifiche RTX 5090 FE RTX 5080 FE RTX 4090 FE RTX 4080 Super FE RTX 4080 FE Asus TUF RTX 4070 Ti Super RTX 4070 Super FE KFA2RTX 4060 Ti EX RTX 3090 Ti FE RTX 3090 FE RTX 3080 Ti FE
Chip GB202 GB203 AD102 AD103 AD103 AD103 AD104 AD106 GA102 GA102 GA102
Processo FinFET Custom 4N Custom 4N Custom 4N Custom 4N Custom 4N Custom 4N Custom 4N Custom 4N 8 nm 8 nm 8 nm
CUDA Cores 21.760 10.752 16.384 10.240 9.728 8.448 7.168 4.352 10.752 10.496 10.240
Unità di struttura 680 336 512 320 304 264 224 136 336 328 320
Nuclei Tensori 680 5° Gen. 336 5° Gen. 512 4° Gen. 320 4° Gen. 304 4° Gen. 264 4° Gen. 224 4° Gen. 136 4° Gen. 336 3° Gen. 328 3° Gen. 320 3° Gen.
Core RT 170 4a Gen. 84 4a Gen. 128 3a Gen. 80 3a Gen. 76 3a Gen. 66 3a Gen. 56 3a Gen. 34 3a Gen. 84 2a Gen. 82 2a Gen. 80 2a Gen.
GPU Base Clock 2.017 MHz 2.295 MHz 2.235 MHz 2.295 MHz 2.205 MHz 2.340 MHz 1.980 MHz 2.310 MHz 1.560 MHz 1.395 MHz 1.365 MHz
GPU Boost Clock 2.407 MHz 2.617 MHz 2.520 MHz 2.550 MHz 2.505 MHz 2.610 MHz 2.475 MHz 2.535 MHz 1.860 MHz 1.695 MHz 1.665 MHz
Bus di memoria 512-bit 256-bit 384-bit 256-bit 256-bit 256-bit 192-bit 128-bit 384-bit 384-bit 384-bit
Larghezza di banda della memoria 1,79 TB/s 960 GB/s 1.008 GB/s 736,3 GB/s 716,8 GB/s 672 GB/s 504 GB/s 288 GB/s 1.008 GB/s 936 GB/s 912 GB/s
Memoria video 32 GB GDDR7 16 GB GDDR7 24 GB GDDR6X 16 GB GDDR6X 16 GB GDDR6X 16 GB GDDR6X 12 GB GDDR6X 8 GB GDDR6X 24 GB GDDR6X 24 GB GDDR6X 12 GB GDDR6X
Consumo energetico 575 W 360 W 450 W 320 W 320 W 285 W 220 W 160 W 450 W 350 W 350 W

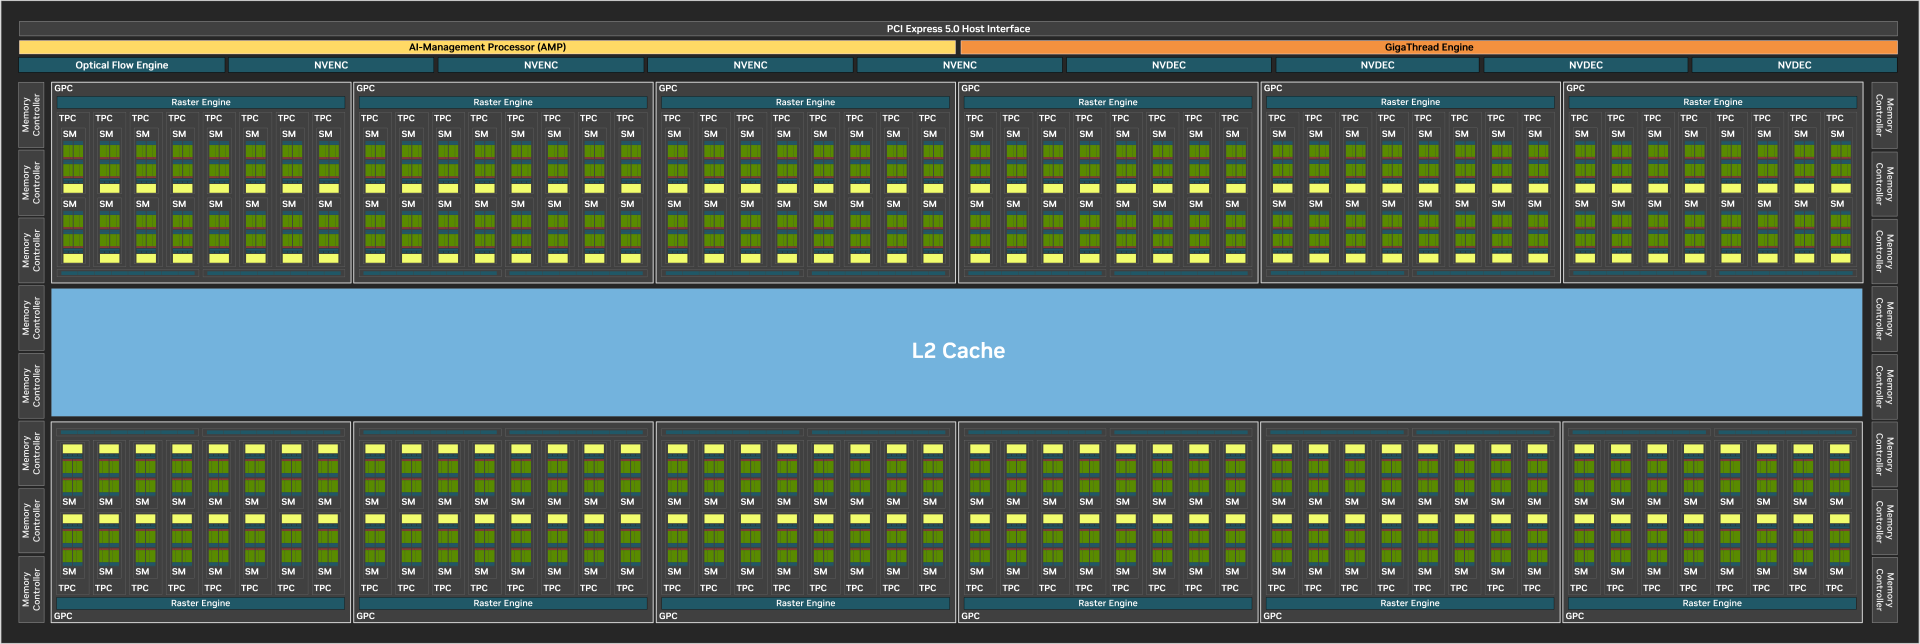
La RTX 5080 FE di GeForce si basa sulla GPU GB203, le cui specifiche ricordano molto da vicino quelle della RTX 3090 Ti. Rispetto alla RTX 4080 FE, la nuova GPU Blackwell offre un aumento del 10,5% dei core CUDA, introduce nuovi core Tensor di quinta generazione e ray tracing (RT) di quarta generazione e dispone di 16 GB di veloce VRAM GDDR7 a 256 bit con una larghezza di banda di 960 GB/s.

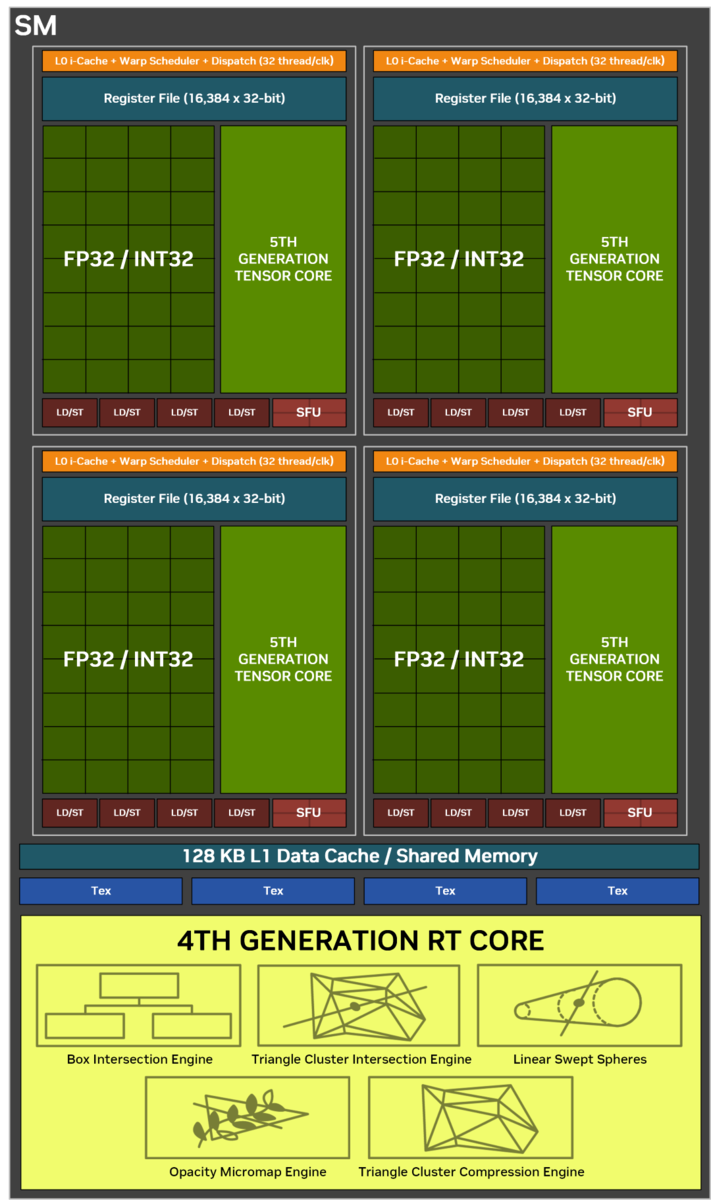
La GPU GB203 di RTX 5080 FE racchiude 45,6 miliardi di transistor con 84 multiprocessori di streaming (SM), ognuno dei quali contiene 128 core CUDA per un totale di 10.752 core CUDA. Inoltre, ci sono un totale di 336 core Tensor, 84 core RT, 336 unità di mappatura delle texture (TMU) e 112 pipeline di operazioni raster (ROP).

Schema a blocchi completo di GB202. (Fonte immagine: Nvidia)
Struttura di un Blackwell SM. (Fonte immagine: Nvidia)

Rispetto alla RTX 4080 Super FE, tuttavia, le differenze sono meno pronunciate. Otteniamo solo un aumento del 5% nel numero di core CUDA e un numero nominalmente superiore di core Tensor e RT.

Anche se questa è un'indicazione per mantenere le aspettative moderate rispetto ai guadagni gen-on-gen, i miglioramenti nella larghezza di banda della memoria e nei clock di boost sia rispetto alla RTX 4080 FE che alla RTX 4080 Super FE possono potenzialmente portare a benefici tangibili.

La RTX 5080 è anche abilmente aiutata dallo stack tecnologico DLSS di Nvidia che include Super Resolution, Ray Reconstruction e DLAA. Questa generazione vede l'introduzione di DLSS 4 che utilizza un nuovo modello di trasformatore.

Secondo Nvidia, il nuovo modello di trasformatore offre spazio sufficiente per miglioramenti generazionali multipli, mentre l'attuale rete neurale convoluta (CNN) ha raggiunto il limite di ottimizzazione.

Un'altra novità della generazione RTX 50 Blackwell è il supporto della flip metering hardware. La flip metering sposta la logica di stimolazione dei fotogrammi al motore di visualizzazione e consente nuove capacità di generazione di fotogrammi fino a 4 volte. Ad aiutare questo processo c'è un co-processore RISC-V nella GPU che scarica la programmazione delle attività dalla CPU per ridurre la latenza.

Tutto questo, ovviamente, comporta un consumo energetico aggiuntivo di 40 W, con la RTX 5080 FE valutata a 360 W TGP.

La RTX 5080 Founders Edition da vicino

Questa volta Nvidia ha optato per un design radicalmente diverso. Entrambe le schede RTX 5090 e RTX 5080 Founders Edition presentano la stessa estetica e quasi lo stesso spessore, con la RTX 5080 FE più leggera di circa 180 g.

Rispetto alla RTX 4080 FE, Nvidia ha ridotto l'ingombro della scheda per occupare solo due slot, rendendola ideale per le costruzioni a fattore di forma ridotto (SFF).

Nonostante l'ingombro ridotto, la RTX 5080 FE è costruita con una finitura premium. Analizzeremo a breve l'impatto di questo nuovo design sulle emissioni termiche e acustiche.

Nvidia GeForce RTX 5080 Founders Edition
Nvidia GeForce RTX 5080 Founders Edition e RTX 5090 Founders Edition
Nvidia GeForce RTX 5080 Founders Edition e RTX 4080 Founders Edition

La RTX 5080 FE, così come l'intera generazione Blackwell, riceve una serie di porte aggiornate. Vediamo tre porte DisplayPort 2.1b che supportano UHBR20 e una singola uscita HDMI 2.1b.

Nvidia si affida al nuovo standard 12V-2x6 per l'alimentazione della GPU. Il connettore 12V-2x6 presenta pin di rilevamento più corti di 1,5 mm e terminali del conduttore più lunghi di 0,25 mm rispetto allo standard 12VHPWR originale, per migliorare l'affidabilità della connessione.

È utile notare che questa modifica riguarda solo l'estremità del connettore per la GPU, quindi i cavi 12VHWPR esistenti delle PSU ATX 3.x dovrebbero funzionare perfettamente. Tuttavia, i connettori 12VHPWR ad angolo retto non si inseriscono nell'incavo del connettore di alimentazione angolato di RTX 5080 FE e RTX 5090 FE.

Nvidia fornisce un pratico adattatore da 16 pin a 3x 8 pin nella confezione, se non dispone di un alimentatore ATX 3.x che supporta i cavi 12VHPWR.

Porte: 3x DisplayPort 2.1b-out, 1x HDMI 2.1b-out
Connettore 12V-2x6 incassato
cavo adattatore da 12V-2x6 a 3x 8 pin

Il banco di prova: RTX 5080 FE si accoppia bene con il Core i9-14900K

Molte delle nostre recensioni di GPU per desktop nel recente passato sono state eseguite su un Intel Core i9-13900K di Intel. Da questa generazione in poi, stiamo passando a opzioni di CPU più recenti, tra cui il Core i9-14900K e il AMD Ryzen 7 9800X3D.

Abbiamo un numero limitato di GPU a disposizione, ma stiamo facendo del nostro meglio per testare nuovamente il maggior numero possibile di GPU nel nostro database nelle prossime settimane e mesi.

I seguenti componenti costituiscono il nostro banco di prova attuale:

  • Banco di prova aperto Cooler Master MasterFrame 700
  • Intel Core i9-14900K con profilo Intel Extreme impostato nel BIOS
  • Scheda madre Gigabyte Z790 Aorus Master
  • SSD Sabrent Rocket 4 Plus Gen4 2 TB NVMe e 2x SSD Crucial MX500 1 TB SATA per il sistema operativo, i benchmark e i giochi
  • 2x 16 GB di RAM Kingston Fury Renegade DDR5-6400 con temporizzazioni 32-39-39-80 a 1,40 V
  • Monitor Alienware AW3225QF 4K 240 Hz QD-OLED
  • Thermaltake TH420 V2 Ultra EX ARGB Raffreddatore AiO
  • Cooler Master MVE Gold V2 1250 ATX 3.0 alimentatore completamente modulare

È stato utilizzato Windows 11 24H2 con le ultime patch, insieme al driver Nvidia Game Ready versione 572.12 rilasciato alla stampa.

Desideriamo ringraziare Cooler Master per aver fornito il banco di prova e l'alimentatore, Gigabyte per la scheda madre, Sabrent per l'SSD, Dell per il monitor Alienware, Thermaltake per il raffreddatore AiO e Kingston per la memoria.

Parametri di riferimento sintetici: RX 7900 XTX rosicchia i talloni alla RTX 5080

Nei benchmark sintetici cumulativi composti dai test 3DMark e Unigine, la RTX 5080 Founders Edition riesce a ottenere solo un leggero vantaggio rispetto alla XFX Radeon RX 7900 XTX.

Mentre la scheda Blackwell offre evidenti guadagni rispetto alle Radeon nei test che coinvolgono una certa quantità di ray tracing, come 3DMark Port Royal e Speed Way, la RX 7900 XTX è alla pari con la RTX 5080 nei raster.

Performance Rating - Percent
NVIDIA GeForce RTX 5090 Founders Edition
Intel Core i9-14900K, NVIDIA GeForce RTX 5090
98.9 pt
NVIDIA GeForce RTX 4090
Intel Core i9-14900K, NVIDIA GeForce RTX 4090
78.4 pt
NVIDIA GeForce RTX 5080 Founders Edition
Intel Core i9-14900K, NVIDIA GeForce RTX 5080
70.4 pt
XFX Radeon RX 7900 XTX Merc 310 Black Edition
Intel Core i9-14900K, AMD Radeon RX 7900 XTX
66.6 pt
Sapphire Pulse AMD Radeon RX 7900 XTX
Intel Core i9-14900K, AMD Radeon RX 7900 XTX
65.4 pt
Zotac RTX 4080 Super Trinity Black Edition -1!
Intel Core i9-14900K, NVIDIA GeForce RTX 4080 Super
65.1 pt
KFA2 GeForce RTX 4080 Super SG -1!
Intel Core i9-14900K, NVIDIA GeForce RTX 4080 Super
64.2 pt
NVIDIA GeForce RTX 4080 Founders Edition
Intel Core i9-14900K, NVIDIA GeForce RTX 4080
59.2 pt
Sapphire Pulse AMD Radeon RX 7900 XT
Intel Core i9-14900K, AMD Radeon RX 7900 XT
57.1 pt
ASUS TUF Gaming Radeon RX 7800 XT
Intel Core i9-14900K, AMD Radeon RX 7800 XT
43.4 pt
3DMark
1920x1080 Fire Strike Graphics
NVIDIA GeForce RTX 5090 Founders Edition
Intel Core i9-14900K, NVIDIA GeForce RTX 5090
70445 Points +14%
NVIDIA GeForce RTX 4090
Intel Core i9-14900K, NVIDIA GeForce RTX 4090
68682 Points +11%
Sapphire Pulse AMD Radeon RX 7900 XTX
Intel Core i9-14900K, AMD Radeon RX 7900 XTX
66518 Points +8%
Sapphire Pulse AMD Radeon RX 7900 XT
Intel Core i9-14900K, AMD Radeon RX 7900 XT
63086 Points +2%
XFX Radeon RX 7900 XTX Merc 310 Black Edition
Intel Core i9-14900K, AMD Radeon RX 7900 XTX
62392 Points +1%
NVIDIA GeForce RTX 5080 Founders Edition
Intel Core i9-14900K, NVIDIA GeForce RTX 5080
61690 Points
Zotac RTX 4080 Super Trinity Black Edition
Intel Core i9-14900K, NVIDIA GeForce RTX 4080 Super
59674 Points -3%
NVIDIA GeForce RTX 4080 Founders Edition
Intel Core i9-14900K, NVIDIA GeForce RTX 4080
59489 Points -4%
KFA2 GeForce RTX 4080 Super SG
Intel Core i9-14900K, NVIDIA GeForce RTX 4080 Super
59075 Points -4%
ASUS TUF Gaming Radeon RX 7800 XT
Intel Core i9-14900K, AMD Radeon RX 7800 XT
49232 Points -20%
Fire Strike Extreme Graphics
NVIDIA GeForce RTX 5090 Founders Edition
Intel Core i9-14900K, NVIDIA GeForce RTX 5090
53439 Points +33%
NVIDIA GeForce RTX 4090
Intel Core i9-14900K, NVIDIA GeForce RTX 4090
43471 Points +8%
XFX Radeon RX 7900 XTX Merc 310 Black Edition
Intel Core i9-14900K, AMD Radeon RX 7900 XTX
40464 Points +1%
NVIDIA GeForce RTX 5080 Founders Edition
Intel Core i9-14900K, NVIDIA GeForce RTX 5080
40159 Points
Sapphire Pulse AMD Radeon RX 7900 XTX
Intel Core i9-14900K, AMD Radeon RX 7900 XTX
39479 Points -2%
Zotac RTX 4080 Super Trinity Black Edition
Intel Core i9-14900K, NVIDIA GeForce RTX 4080 Super
34430 Points -14%
KFA2 GeForce RTX 4080 Super SG
Intel Core i9-14900K, NVIDIA GeForce RTX 4080 Super
33634 Points -16%
Sapphire Pulse AMD Radeon RX 7900 XT
Intel Core i9-14900K, AMD Radeon RX 7900 XT
33632 Points -16%
NVIDIA GeForce RTX 4080 Founders Edition
Intel Core i9-14900K, NVIDIA GeForce RTX 4080
32344 Points -19%
ASUS TUF Gaming Radeon RX 7800 XT
Intel Core i9-14900K, AMD Radeon RX 7800 XT
25690 Points -36%
3840x2160 Fire Strike Ultra Graphics
NVIDIA GeForce RTX 5090 Founders Edition
Intel Core i9-14900K, NVIDIA GeForce RTX 5090
32495 Points +56%
NVIDIA GeForce RTX 4090
Intel Core i9-14900K, NVIDIA GeForce RTX 4090
23886 Points +15%
XFX Radeon RX 7900 XTX Merc 310 Black Edition
Intel Core i9-14900K, AMD Radeon RX 7900 XTX
20998 Points +1%
NVIDIA GeForce RTX 5080 Founders Edition
Intel Core i9-14900K, NVIDIA GeForce RTX 5080
20843 Points
Sapphire Pulse AMD Radeon RX 7900 XTX
Intel Core i9-14900K, AMD Radeon RX 7900 XTX
20515 Points -2%
Zotac RTX 4080 Super Trinity Black Edition
Intel Core i9-14900K, NVIDIA GeForce RTX 4080 Super
17579 Points -16%
Sapphire Pulse AMD Radeon RX 7900 XT
Intel Core i9-14900K, AMD Radeon RX 7900 XT
17293 Points -17%
KFA2 GeForce RTX 4080 Super SG
Intel Core i9-14900K, NVIDIA GeForce RTX 4080 Super
17236 Points -17%
NVIDIA GeForce RTX 4080 Founders Edition
Intel Core i9-14900K, NVIDIA GeForce RTX 4080
16760 Points -20%
ASUS TUF Gaming Radeon RX 7800 XT
Intel Core i9-14900K, AMD Radeon RX 7800 XT
12845 Points -38%
2560x1440 Port Royal Graphics
NVIDIA GeForce RTX 5090 Founders Edition
Intel Core i9-14900K, NVIDIA GeForce RTX 5090
33897 Points +59%
NVIDIA GeForce RTX 4090
Intel Core i9-14900K, NVIDIA GeForce RTX 4090
25364 Points +19%
NVIDIA GeForce RTX 5080 Founders Edition
Intel Core i9-14900K, NVIDIA GeForce RTX 5080
21363 Points
Zotac RTX 4080 Super Trinity Black Edition
Intel Core i9-14900K, NVIDIA GeForce RTX 4080 Super
18187 Points -15%
KFA2 GeForce RTX 4080 Super SG
Intel Core i9-14900K, NVIDIA GeForce RTX 4080 Super
17893 Points -16%
XFX Radeon RX 7900 XTX Merc 310 Black Edition
Intel Core i9-14900K, AMD Radeon RX 7900 XTX
17193 Points -20%
NVIDIA GeForce RTX 4080 Founders Edition
Intel Core i9-14900K, NVIDIA GeForce RTX 4080
16547 Points -23%
Sapphire Pulse AMD Radeon RX 7900 XTX
Intel Core i9-14900K, AMD Radeon RX 7900 XTX
16463 Points -23%
Sapphire Pulse AMD Radeon RX 7900 XT
Intel Core i9-14900K, AMD Radeon RX 7900 XT
13984 Points -35%
ASUS TUF Gaming Radeon RX 7800 XT
Intel Core i9-14900K, AMD Radeon RX 7800 XT
10816 Points -49%
2560x1440 Speed Way Score
NVIDIA GeForce RTX 5090 Founders Edition
Intel Core i9-14900K, NVIDIA GeForce RTX 5090
14384 Points +62%
NVIDIA GeForce RTX 4090
Intel Core i9-14900K, NVIDIA GeForce RTX 4090
10007 Points +13%
NVIDIA GeForce RTX 5080 Founders Edition
Intel Core i9-14900K, NVIDIA GeForce RTX 5080
8861 Points
Zotac RTX 4080 Super Trinity Black Edition
Intel Core i9-14900K, NVIDIA GeForce RTX 4080 Super
7378 Points -17%
KFA2 GeForce RTX 4080 Super SG
Intel Core i9-14900K, NVIDIA GeForce RTX 4080 Super
7277 Points -18%
NVIDIA GeForce RTX 4080 Founders Edition
Intel Core i9-14900K, NVIDIA GeForce RTX 4080
6861 Points -23%
XFX Radeon RX 7900 XTX Merc 310 Black Edition
Intel Core i9-14900K, AMD Radeon RX 7900 XTX
6551 Points -26%
Sapphire Pulse AMD Radeon RX 7900 XTX
Intel Core i9-14900K, AMD Radeon RX 7900 XTX
6122 Points -31%
Sapphire Pulse AMD Radeon RX 7900 XT
Intel Core i9-14900K, AMD Radeon RX 7900 XT
5048 Points -43%
ASUS TUF Gaming Radeon RX 7800 XT
Intel Core i9-14900K, AMD Radeon RX 7800 XT
4007 Points -55%
Steel Nomad Score
NVIDIA GeForce RTX 5090 Founders Edition
Intel Core i9-14900K, NVIDIA GeForce RTX 5090
13807 Points +69%
NVIDIA GeForce RTX 4090
Intel Core i9-14900K, NVIDIA GeForce RTX 4090
8985 Points +10%
NVIDIA GeForce RTX 5080 Founders Edition
Intel Core i9-14900K, NVIDIA GeForce RTX 5080
8159 Points
XFX Radeon RX 7900 XTX Merc 310 Black Edition
Intel Core i9-14900K, AMD Radeon RX 7900 XTX
6975 Points -15%
Sapphire Pulse AMD Radeon RX 7900 XTX
Intel Core i9-14900K, AMD Radeon RX 7900 XTX
6618 Points -19%
NVIDIA GeForce RTX 4080 Founders Edition
Intel Core i9-14900K, NVIDIA GeForce RTX 4080
6427 Points -21%
Sapphire Pulse AMD Radeon RX 7900 XT
Intel Core i9-14900K, AMD Radeon RX 7900 XT
5443 Points -33%
ASUS TUF Gaming Radeon RX 7800 XT
Intel Core i9-14900K, AMD Radeon RX 7800 XT
4253 Points -48%
2560x1440 Time Spy Graphics
NVIDIA GeForce RTX 5090 Founders Edition
Intel Core i9-14900K, NVIDIA GeForce RTX 5090
42108 Points +32%
NVIDIA GeForce RTX 4090
Intel Core i9-14900K, NVIDIA GeForce RTX 4090
35551 Points +12%
XFX Radeon RX 7900 XTX Merc 310 Black Edition
Intel Core i9-14900K, AMD Radeon RX 7900 XTX
32205 Points +1%
NVIDIA GeForce RTX 5080 Founders Edition
Intel Core i9-14900K, NVIDIA GeForce RTX 5080
31803 Points
Sapphire Pulse AMD Radeon RX 7900 XTX
Intel Core i9-14900K, AMD Radeon RX 7900 XTX
31227 Points -2%
Zotac RTX 4080 Super Trinity Black Edition
Intel Core i9-14900K, NVIDIA GeForce RTX 4080 Super
28605 Points -10%
KFA2 GeForce RTX 4080 Super SG
Intel Core i9-14900K, NVIDIA GeForce RTX 4080 Super
28378 Points -11%
Sapphire Pulse AMD Radeon RX 7900 XT
Intel Core i9-14900K, AMD Radeon RX 7900 XT
26878 Points -15%
NVIDIA GeForce RTX 4080 Founders Edition
Intel Core i9-14900K, NVIDIA GeForce RTX 4080
26550 Points -17%
ASUS TUF Gaming Radeon RX 7800 XT
Intel Core i9-14900K, AMD Radeon RX 7800 XT
20147 Points -37%
Unigine Heaven 4.0 - Extreme Preset DX11
NVIDIA GeForce RTX 5090 Founders Edition
Intel Core i9-14900K, NVIDIA GeForce RTX 5090
511.2 (55.3min - 899.7max) fps +21%
NVIDIA GeForce RTX 4090
Intel Core i9-14900K, NVIDIA GeForce RTX 4090
439.7 (54.3min - 978.6max) fps +4%
NVIDIA GeForce RTX 5080 Founders Edition
Intel Core i9-14900K, NVIDIA GeForce RTX 5080
421.5 (56.3min - 870.3max) fps
Zotac RTX 4080 Super Trinity Black Edition
Intel Core i9-14900K, NVIDIA GeForce RTX 4080 Super
394.4 fps -6%
XFX Radeon RX 7900 XTX Merc 310 Black Edition
Intel Core i9-14900K, AMD Radeon RX 7900 XTX
390.2 fps -7%
KFA2 GeForce RTX 4080 Super SG
Intel Core i9-14900K, NVIDIA GeForce RTX 4080 Super
386.2 fps -8%
Sapphire Pulse AMD Radeon RX 7900 XTX
Intel Core i9-14900K, AMD Radeon RX 7900 XTX
376.1 (56.3min - 807.1max) fps -11%
NVIDIA GeForce RTX 4080 Founders Edition
Intel Core i9-14900K, NVIDIA GeForce RTX 4080
343 (55.4min - 668.3max) fps -19%
Sapphire Pulse AMD Radeon RX 7900 XT
Intel Core i9-14900K, AMD Radeon RX 7900 XT
336.5 (55.2min - 676.4max) fps -20%
ASUS TUF Gaming Radeon RX 7800 XT
Intel Core i9-14900K, AMD Radeon RX 7800 XT
251 fps -40%
Unigine Valley 1.0 - 1920x1080 Extreme HD DirectX AA:x8
XFX Radeon RX 7900 XTX Merc 310 Black Edition
Intel Core i9-14900K, AMD Radeon RX 7900 XTX
293.3 fps +16%
Sapphire Pulse AMD Radeon RX 7900 XTX
Intel Core i9-14900K, AMD Radeon RX 7900 XTX
288.1 (81.4min - 495.4max) fps +14%
Zotac RTX 4080 Super Trinity Black Edition
Intel Core i9-14900K, NVIDIA GeForce RTX 4080 Super
282.3 fps +12%
KFA2 GeForce RTX 4080 Super SG
Intel Core i9-14900K, NVIDIA GeForce RTX 4080 Super
277.1 fps +10%
Sapphire Pulse AMD Radeon RX 7900 XT
Intel Core i9-14900K, AMD Radeon RX 7900 XT
274.8 (84.5min - 515.1max) fps +9%
NVIDIA GeForce RTX 4090
Intel Core i9-14900K, NVIDIA GeForce RTX 4090
259.4 (79.6min - 541.8max) fps +3%
NVIDIA GeForce RTX 5090 Founders Edition
Intel Core i9-14900K, NVIDIA GeForce RTX 5090
256.4 (56.1min - 464max) fps +2%
NVIDIA GeForce RTX 4080 Founders Edition
Intel Core i9-14900K, NVIDIA GeForce RTX 4080
253.1 (70min - 521.5max) fps 0%
NVIDIA GeForce RTX 5080 Founders Edition
Intel Core i9-14900K, NVIDIA GeForce RTX 5080
252.2 (78.8min - 499.6max) fps
ASUS TUF Gaming Radeon RX 7800 XT
Intel Core i9-14900K, AMD Radeon RX 7800 XT
202.8 fps -20%
Unigine Superposition
3840x2160 4k Optimized
NVIDIA GeForce RTX 5090 Founders Edition
Intel Core i9-14900K, NVIDIA GeForce RTX 5090
43145 Points +62%
NVIDIA GeForce RTX 4090
Intel Core i9-14900K, NVIDIA GeForce RTX 4090
31971 Points +20%
NVIDIA GeForce RTX 5080 Founders Edition
Intel Core i9-14900K, NVIDIA GeForce RTX 5080
26580 Points
XFX Radeon RX 7900 XTX Merc 310 Black Edition
Intel Core i9-14900K, AMD Radeon RX 7900 XTX
23972 Points -10%
Sapphire Pulse AMD Radeon RX 7900 XTX
Intel Core i9-14900K, AMD Radeon RX 7900 XTX
23558 Points -11%
Zotac RTX 4080 Super Trinity Black Edition
Intel Core i9-14900K, NVIDIA GeForce RTX 4080 Super
23135 Points -13%
KFA2 GeForce RTX 4080 Super SG
Intel Core i9-14900K, NVIDIA GeForce RTX 4080 Super
23130 Points -13%
NVIDIA GeForce RTX 4080 Founders Edition
Intel Core i9-14900K, NVIDIA GeForce RTX 4080
21717 Points -18%
Sapphire Pulse AMD Radeon RX 7900 XT
Intel Core i9-14900K, AMD Radeon RX 7900 XT
19101 Points -28%
ASUS TUF Gaming Radeon RX 7800 XT
Intel Core i9-14900K, AMD Radeon RX 7800 XT
14327 Points -46%
7680x4320 8k Optimized
NVIDIA GeForce RTX 5090 Founders Edition
Intel Core i9-14900K, NVIDIA GeForce RTX 5090
18256 Points +72%
NVIDIA GeForce RTX 4090
Intel Core i9-14900K, NVIDIA GeForce RTX 4090
12421 Points +17%
NVIDIA GeForce RTX 5080 Founders Edition
Intel Core i9-14900K, NVIDIA GeForce RTX 5080
10625 Points
XFX Radeon RX 7900 XTX Merc 310 Black Edition
Intel Core i9-14900K, AMD Radeon RX 7900 XTX
8931 Points -16%
Sapphire Pulse AMD Radeon RX 7900 XTX
Intel Core i9-14900K, AMD Radeon RX 7900 XTX
8864 Points -17%
Zotac RTX 4080 Super Trinity Black Edition
Intel Core i9-14900K, NVIDIA GeForce RTX 4080 Super
8767 Points -17%
KFA2 GeForce RTX 4080 Super SG
Intel Core i9-14900K, NVIDIA GeForce RTX 4080 Super
8729 Points -18%
NVIDIA GeForce RTX 4080 Founders Edition
Intel Core i9-14900K, NVIDIA GeForce RTX 4080
8239 Points -22%
Sapphire Pulse AMD Radeon RX 7900 XT
Intel Core i9-14900K, AMD Radeon RX 7900 XT
7120 Points -33%
ASUS TUF Gaming Radeon RX 7800 XT
Intel Core i9-14900K, AMD Radeon RX 7800 XT
5454 Points -49%
3DMark Fire Strike Score
45908 punti
3DMark Fire Strike Extreme Score
35517 punti
3DMark Time Spy Score
29987 punti
3DMark Steel Nomad Score
8159 punti
Aiuto

Prestazioni AI e di calcolo: Guadagni significativi rispetto a RTX 4080 FE e RDNA 3

In MLPerf, la RTX 5080 FE gestisce un tasso di generazione di token superiore del 19% rispetto alla RTX 4080 FE, sebbene sia inferiore alla RTX 4090 del 10%. Inutile dire che la RTX 5090 FE è quasi il 60% più veloce della RTX 5080 FE nella generazione di token, grazie a un numero di core superiore del 102%.

La RTX 4090 si dimostra anche più veloce del 29% rispetto alla RTX 5080 FE in Blender 3.3 CUDA. Mentre le GPU AMD sono comprensibilmente in svantaggio nei test CUDA, la RX 7900 XTX rimane indietro rispetto alla RTX 5080 FE solo del 9% nei punteggi cumulativi di ComputeMark.

MLPerf Client 0.5 - overall generation rate
NVIDIA GeForce RTX 5090 Founders Edition
Intel Core i9-14900K, NVIDIA GeForce RTX 5090
248 tokens/s +59%
NVIDIA GeForce RTX 4090
Intel Core i9-14900K, NVIDIA GeForce RTX 4090
173.9 tokens/s +12%
NVIDIA GeForce RTX 5080 Founders Edition
Intel Core i9-14900K, NVIDIA GeForce RTX 5080
155.8 tokens/s
Sapphire Pulse AMD Radeon RX 7900 XTX
Intel Core i9-14900K, AMD Radeon RX 7900 XTX
131.7 tokens/s -15%
NVIDIA GeForce RTX 4080 Founders Edition
Intel Core i9-14900K, NVIDIA GeForce RTX 4080
130.9 tokens/s -16%
Sapphire Pulse AMD Radeon RX 7900 XT
Intel Core i9-14900K, AMD Radeon RX 7900 XT
116.9 tokens/s -25%
Blender
v3.3 Classroom CUDA
KFA2 GeForce RTX 4080 Super SG
Intel Core i9-14900K, NVIDIA GeForce RTX 4080 Super
99 Seconds * -607%
Zotac RTX 4080 Super Trinity Black Edition
Intel Core i9-14900K, NVIDIA GeForce RTX 4080 Super
97 Seconds * -593%
NVIDIA GeForce RTX 4080 Founders Edition
Intel Core i9-14900K, NVIDIA GeForce RTX 4080
15 Seconds * -7%
NVIDIA GeForce RTX 5080 Founders Edition
Intel Core i9-14900K, NVIDIA GeForce RTX 5080
14 Seconds *
NVIDIA GeForce RTX 4090
Intel Core i9-14900K, NVIDIA GeForce RTX 4090
10 Seconds * +29%
NVIDIA GeForce RTX 5090 Founders Edition
Intel Core i9-14900K, NVIDIA GeForce RTX 5090
8 Seconds * +43%
v3.3 Classroom OPTIX/RTX
Zotac RTX 4080 Super Trinity Black Edition
Intel Core i9-14900K, NVIDIA GeForce RTX 4080 Super
9 Seconds * -13%
KFA2 GeForce RTX 4080 Super SG
Intel Core i9-14900K, NVIDIA GeForce RTX 4080 Super
9 Seconds * -13%
NVIDIA GeForce RTX 4080 Founders Edition
Intel Core i9-14900K, NVIDIA GeForce RTX 4080
9 Seconds * -13%
NVIDIA GeForce RTX 5080 Founders Edition
Intel Core i9-14900K, NVIDIA GeForce RTX 5080
8 Seconds *
NVIDIA GeForce RTX 4090
Intel Core i9-14900K, NVIDIA GeForce RTX 4090
7 Seconds * +12%
NVIDIA GeForce RTX 5090 Founders Edition
Intel Core i9-14900K, NVIDIA GeForce RTX 5090
5 Seconds * +37%
V-Ray Benchmark Next 4.10 - GPU
NVIDIA GeForce RTX 5090 Founders Edition
Intel Core i9-14900K, NVIDIA GeForce RTX 5090
2381 mpaths +58%
NVIDIA GeForce RTX 4090
Intel Core i9-14900K, NVIDIA GeForce RTX 4090
1858 mpaths +24%
NVIDIA GeForce RTX 5080 Founders Edition
Intel Core i9-14900K, NVIDIA GeForce RTX 5080
1504 mpaths
KFA2 GeForce RTX 4080 Super SG
Intel Core i9-14900K, NVIDIA GeForce RTX 4080 Super
1492 mpaths -1%
NVIDIA GeForce RTX 4080 Founders Edition
Intel Core i9-14900K, NVIDIA GeForce RTX 4080
1445 mpaths -4%
ASUS TUF Gaming Radeon RX 7800 XT
Intel Core i9-14900K, AMD Radeon RX 7800 XT
236 mpaths -84%
XFX Radeon RX 7900 XTX Merc 310 Black Edition
Intel Core i9-14900K, AMD Radeon RX 7900 XTX
224 mpaths -85%
Sapphire Pulse AMD Radeon RX 7900 XTX
Intel Core i9-14900K, AMD Radeon RX 7900 XTX
219 mpaths -85%
Sapphire Pulse AMD Radeon RX 7900 XT
Intel Core i9-14900K, AMD Radeon RX 7900 XT
217 mpaths -86%
V-Ray 5 Benchmark
GPU CUDA
NVIDIA GeForce RTX 5090 Founders Edition
Intel Core i9-14900K, NVIDIA GeForce RTX 5090
5780 mpaths +57%
NVIDIA GeForce RTX 4090
Intel Core i9-14900K, NVIDIA GeForce RTX 4090
4344 mpaths +18%
NVIDIA GeForce RTX 5080 Founders Edition
Intel Core i9-14900K, NVIDIA GeForce RTX 5080
3683 mpaths
KFA2 GeForce RTX 4080 Super SG
Intel Core i9-14900K, NVIDIA GeForce RTX 4080 Super
3072 mpaths -17%
NVIDIA GeForce RTX 4080 Founders Edition
Intel Core i9-14900K, NVIDIA GeForce RTX 4080
3063 mpaths -17%
ASUS TUF Gaming Radeon RX 7800 XT
Intel Core i9-14900K, AMD Radeon RX 7800 XT
738 mpaths -80%
XFX Radeon RX 7900 XTX Merc 310 Black Edition
Intel Core i9-14900K, AMD Radeon RX 7900 XTX
698 mpaths -81%
Sapphire Pulse AMD Radeon RX 7900 XTX
Intel Core i9-14900K, AMD Radeon RX 7900 XTX
685 mpaths -81%
Sapphire Pulse AMD Radeon RX 7900 XT
Intel Core i9-14900K, AMD Radeon RX 7900 XT
674 mpaths -82%
GPU RTX
NVIDIA GeForce RTX 5090 Founders Edition
Intel Core i9-14900K, NVIDIA GeForce RTX 5090
7311 mpaths +63%
NVIDIA GeForce RTX 4090
Intel Core i9-14900K, NVIDIA GeForce RTX 4090
5622 mpaths +26%
NVIDIA GeForce RTX 5080 Founders Edition
Intel Core i9-14900K, NVIDIA GeForce RTX 5080
4477 mpaths
KFA2 GeForce RTX 4080 Super SG
Intel Core i9-14900K, NVIDIA GeForce RTX 4080 Super
4220 mpaths -6%
XFX Radeon RX 7900 XTX Merc 310 Black Edition
Intel Core i9-14900K, AMD Radeon RX 7900 XTX
4220 mpaths -6%
NVIDIA GeForce RTX 4080 Founders Edition
Intel Core i9-14900K, NVIDIA GeForce RTX 4080
4036 mpaths -10%
ComputeMark v2.1
1024x600 Normal, Score
NVIDIA GeForce RTX 5090 Founders Edition
Intel Core i9-14900K, NVIDIA GeForce RTX 5090
115468 Points +64%
NVIDIA GeForce RTX 4090
Intel Core i9-14900K, NVIDIA GeForce RTX 4090
80195 Points +14%
NVIDIA GeForce RTX 5080 Founders Edition
Intel Core i9-14900K, NVIDIA GeForce RTX 5080
70574 Points
Sapphire Pulse AMD Radeon RX 7900 XTX
Intel Core i9-14900K, AMD Radeon RX 7900 XTX
67993 Points -4%
Zotac RTX 4080 Super Trinity Black Edition
Intel Core i9-14900K, NVIDIA GeForce RTX 4080 Super
67215 Points -5%
KFA2 GeForce RTX 4080 Super SG
Intel Core i9-14900K, NVIDIA GeForce RTX 4080 Super
65378 Points -7%
XFX Radeon RX 7900 XTX Merc 310 Black Edition
Intel Core i9-14900K, AMD Radeon RX 7900 XTX
64304 Points -9%
Sapphire Pulse AMD Radeon RX 7900 XT
Intel Core i9-14900K, AMD Radeon RX 7900 XT
60102 Points -15%
NVIDIA GeForce RTX 4080 Founders Edition
Intel Core i9-14900K, NVIDIA GeForce RTX 4080
59738 Points -15%
ASUS TUF Gaming Radeon RX 7800 XT
Intel Core i9-14900K, AMD Radeon RX 7800 XT
41893 Points -41%
1024x600 Normal, Fluid 3DTex
NVIDIA GeForce RTX 5090 Founders Edition
Intel Core i9-14900K, NVIDIA GeForce RTX 5090
17834 Points +77%
NVIDIA GeForce RTX 5080 Founders Edition
Intel Core i9-14900K, NVIDIA GeForce RTX 5080
10101 Points
NVIDIA GeForce RTX 4090
Intel Core i9-14900K, NVIDIA GeForce RTX 4090
9728 Points -4%
XFX Radeon RX 7900 XTX Merc 310 Black Edition
Intel Core i9-14900K, AMD Radeon RX 7900 XTX
9123 Points -10%
Sapphire Pulse AMD Radeon RX 7900 XTX
Intel Core i9-14900K, AMD Radeon RX 7900 XTX
8680 Points -14%
Sapphire Pulse AMD Radeon RX 7900 XT
Intel Core i9-14900K, AMD Radeon RX 7900 XT
6985 Points -31%
KFA2 GeForce RTX 4080 Super SG
Intel Core i9-14900K, NVIDIA GeForce RTX 4080 Super
6807 Points -33%
Zotac RTX 4080 Super Trinity Black Edition
Intel Core i9-14900K, NVIDIA GeForce RTX 4080 Super
6780 Points -33%
NVIDIA GeForce RTX 4080 Founders Edition
Intel Core i9-14900K, NVIDIA GeForce RTX 4080
6232 Points -38%
ASUS TUF Gaming Radeon RX 7800 XT
Intel Core i9-14900K, AMD Radeon RX 7800 XT
4542 Points -55%
1024x600 Normal, Fluid 2DTexArr
NVIDIA GeForce RTX 5090 Founders Edition
Intel Core i9-14900K, NVIDIA GeForce RTX 5090
8368 Points +31%
XFX Radeon RX 7900 XTX Merc 310 Black Edition
Intel Core i9-14900K, AMD Radeon RX 7900 XTX
7993 Points +25%
Sapphire Pulse AMD Radeon RX 7900 XTX
Intel Core i9-14900K, AMD Radeon RX 7900 XTX
7726 Points +21%
Sapphire Pulse AMD Radeon RX 7900 XT
Intel Core i9-14900K, AMD Radeon RX 7900 XT
6684 Points +5%
NVIDIA GeForce RTX 5080 Founders Edition
Intel Core i9-14900K, NVIDIA GeForce RTX 5080
6388 Points
NVIDIA GeForce RTX 4090
Intel Core i9-14900K, NVIDIA GeForce RTX 4090
6226 Points -3%
Zotac RTX 4080 Super Trinity Black Edition
Intel Core i9-14900K, NVIDIA GeForce RTX 4080 Super
5674 Points -11%
KFA2 GeForce RTX 4080 Super SG
Intel Core i9-14900K, NVIDIA GeForce RTX 4080 Super
5651 Points -12%
NVIDIA GeForce RTX 4080 Founders Edition
Intel Core i9-14900K, NVIDIA GeForce RTX 4080
5334 Points -16%
ASUS TUF Gaming Radeon RX 7800 XT
Intel Core i9-14900K, AMD Radeon RX 7800 XT
4453 Points -30%
1024x600 Normal, Mandel Vector
NVIDIA GeForce RTX 5090 Founders Edition
Intel Core i9-14900K, NVIDIA GeForce RTX 5090
23732 Points +71%
Sapphire Pulse AMD Radeon RX 7900 XTX
Intel Core i9-14900K, AMD Radeon RX 7900 XTX
15307 Points +10%
NVIDIA GeForce RTX 4090
Intel Core i9-14900K, NVIDIA GeForce RTX 4090
14965 Points +8%
NVIDIA GeForce RTX 5080 Founders Edition
Intel Core i9-14900K, NVIDIA GeForce RTX 5080
13854 Points
Sapphire Pulse AMD Radeon RX 7900 XT
Intel Core i9-14900K, AMD Radeon RX 7900 XT
13767 Points -1%
Zotac RTX 4080 Super Trinity Black Edition
Intel Core i9-14900K, NVIDIA GeForce RTX 4080 Super
12779 Points -8%
XFX Radeon RX 7900 XTX Merc 310 Black Edition
Intel Core i9-14900K, AMD Radeon RX 7900 XTX
12625 Points -9%
KFA2 GeForce RTX 4080 Super SG
Intel Core i9-14900K, NVIDIA GeForce RTX 4080 Super
11618 Points -16%
NVIDIA GeForce RTX 4080 Founders Edition
Intel Core i9-14900K, NVIDIA GeForce RTX 4080
11246 Points -19%
ASUS TUF Gaming Radeon RX 7800 XT
Intel Core i9-14900K, AMD Radeon RX 7800 XT
9379 Points -32%
1024x600 Normal, Mandel Scalar
NVIDIA GeForce RTX 5090 Founders Edition
Intel Core i9-14900K, NVIDIA GeForce RTX 5090
27258 Points +78%
NVIDIA GeForce RTX 4090
Intel Core i9-14900K, NVIDIA GeForce RTX 4090
19769 Points +29%
Sapphire Pulse AMD Radeon RX 7900 XTX
Intel Core i9-14900K, AMD Radeon RX 7900 XTX
16776 Points +9%
Zotac RTX 4080 Super Trinity Black Edition
Intel Core i9-14900K, NVIDIA GeForce RTX 4080 Super
15806 Points +3%
KFA2 GeForce RTX 4080 Super SG
Intel Core i9-14900K, NVIDIA GeForce RTX 4080 Super
15609 Points +2%
XFX Radeon RX 7900 XTX Merc 310 Black Edition
Intel Core i9-14900K, AMD Radeon RX 7900 XTX
15422 Points +1%
NVIDIA GeForce RTX 5080 Founders Edition
Intel Core i9-14900K, NVIDIA GeForce RTX 5080
15326 Points
Sapphire Pulse AMD Radeon RX 7900 XT
Intel Core i9-14900K, AMD Radeon RX 7900 XT
14608 Points -5%
NVIDIA GeForce RTX 4080 Founders Edition
Intel Core i9-14900K, NVIDIA GeForce RTX 4080
14001 Points -9%
ASUS TUF Gaming Radeon RX 7800 XT
Intel Core i9-14900K, AMD Radeon RX 7800 XT
10759 Points -30%
1024x600 Normal, QJuliaRayTrace
NVIDIA GeForce RTX 5090 Founders Edition
Intel Core i9-14900K, NVIDIA GeForce RTX 5090
38276 Points +54%
NVIDIA GeForce RTX 4090
Intel Core i9-14900K, NVIDIA GeForce RTX 4090
29507 Points +18%
Zotac RTX 4080 Super Trinity Black Edition
Intel Core i9-14900K, NVIDIA GeForce RTX 4080 Super
26177 Points +5%
KFA2 GeForce RTX 4080 Super SG
Intel Core i9-14900K, NVIDIA GeForce RTX 4080 Super
25693 Points +3%
NVIDIA GeForce RTX 5080 Founders Edition
Intel Core i9-14900K, NVIDIA GeForce RTX 5080
24906 Points
NVIDIA GeForce RTX 4080 Founders Edition
Intel Core i9-14900K, NVIDIA GeForce RTX 4080
22926 Points -8%
Sapphire Pulse AMD Radeon RX 7900 XTX
Intel Core i9-14900K, AMD Radeon RX 7900 XTX
19505 Points -22%
XFX Radeon RX 7900 XTX Merc 310 Black Edition
Intel Core i9-14900K, AMD Radeon RX 7900 XTX
19141 Points -23%
Sapphire Pulse AMD Radeon RX 7900 XT
Intel Core i9-14900K, AMD Radeon RX 7900 XT
18058 Points -27%
ASUS TUF Gaming Radeon RX 7800 XT
Intel Core i9-14900K, AMD Radeon RX 7800 XT
12761 Points -49%
LuxMark v2.0 64Bit
Room GPUs-only
NVIDIA GeForce RTX 5090 Founders Edition
Intel Core i9-14900K, NVIDIA GeForce RTX 5090
14722 Samples/s +27%
NVIDIA GeForce RTX 4090
Intel Core i9-14900K, NVIDIA GeForce RTX 4090
12513 Samples/s +8%
NVIDIA GeForce RTX 5080 Founders Edition
Intel Core i9-14900K, NVIDIA GeForce RTX 5080
11576 Samples/s
NVIDIA GeForce RTX 4080 Founders Edition
Intel Core i9-14900K, NVIDIA GeForce RTX 4080
10203 Samples/s -12%
Zotac RTX 4080 Super Trinity Black Edition
Intel Core i9-14900K, NVIDIA GeForce RTX 4080 Super
10136 Samples/s -12%
KFA2 GeForce RTX 4080 Super SG
Intel Core i9-14900K, NVIDIA GeForce RTX 4080 Super
10075 Samples/s -13%
Sapphire Pulse AMD Radeon RX 7900 XTX
Intel Core i9-14900K, AMD Radeon RX 7900 XTX
6226 Samples/s -46%
Sapphire Pulse AMD Radeon RX 7900 XT
Intel Core i9-14900K, AMD Radeon RX 7900 XT
5924 Samples/s -49%
XFX Radeon RX 7900 XTX Merc 310 Black Edition
Intel Core i9-14900K, AMD Radeon RX 7900 XTX
4534 Samples/s -61%
ASUS TUF Gaming Radeon RX 7800 XT
Intel Core i9-14900K, AMD Radeon RX 7800 XT
3737 Samples/s -68%
Sala GPUs-only
NVIDIA GeForce RTX 5090 Founders Edition
Intel Core i9-14900K, NVIDIA GeForce RTX 5090
33461 Samples/s +32%
NVIDIA GeForce RTX 4090
Intel Core i9-14900K, NVIDIA GeForce RTX 4090
26702 Samples/s +6%
NVIDIA GeForce RTX 5080 Founders Edition
Intel Core i9-14900K, NVIDIA GeForce RTX 5080
25255 Samples/s
NVIDIA GeForce RTX 4080 Founders Edition
Intel Core i9-14900K, NVIDIA GeForce RTX 4080
24215 Samples/s -4%
Zotac RTX 4080 Super Trinity Black Edition
Intel Core i9-14900K, NVIDIA GeForce RTX 4080 Super
23374 Samples/s -7%
KFA2 GeForce RTX 4080 Super SG
Intel Core i9-14900K, NVIDIA GeForce RTX 4080 Super
22634 Samples/s -10%
Sapphire Pulse AMD Radeon RX 7900 XTX
Intel Core i9-14900K, AMD Radeon RX 7900 XTX
17547 Samples/s -31%
Sapphire Pulse AMD Radeon RX 7900 XT
Intel Core i9-14900K, AMD Radeon RX 7900 XT
15531 Samples/s -39%
XFX Radeon RX 7900 XTX Merc 310 Black Edition
Intel Core i9-14900K, AMD Radeon RX 7900 XTX
13953 Samples/s -45%
ASUS TUF Gaming Radeon RX 7800 XT
Intel Core i9-14900K, AMD Radeon RX 7800 XT
10441 Samples/s -59%

* ... Meglio usare valori piccoli

Prestazioni di gioco: Buoni risultati rispetto alla RX 7900 XTX in 4K raster

La RTX 5080 FE dimostra un vantaggio fino al 17% rispetto alla RX 7900 XTX nei test cumulativi di gioco raster puro a 4K Ultra. Questo si riduce fino al 9% con le impostazioni 1080p e 2K Ultra, mentre rimane indietro rispetto alla RTX 4090 con un margine simile. Si aspetti un guadagno medio del 22% a 4K e del 29% a 1080p e 2K combinati, se sta effettuando l'aggiornamento da una RTX 4080 FE.

Sebbene la RTX 5080 FE fatichi ad avvicinarsi all'agognato traguardo dei 60 fps in titoli pesanti dal punto di vista delle texture come Avatar: Frontiers of Pandora e Black Myth: Wukong, un buon numero di giochi AAA moderni dovrebbe essere giocabile alla risoluzione 4K nativa senza l'aiuto dell'upscaling, a condizione che non sia coinvolto il ray tracing.

Come si è visto con la serie RTX 40, è necessaria una CPU veloce per alimentare la RTX 5080 FE senza intoppi. Il Core i9-14900K non è una cattiva opzione se gioca per lo più a risoluzioni 2K o superiori, ma le impostazioni a 1080p e inferiori possono trarre grande beneficio da un Ryzen 7 9800X3D.

Performance Rating - Percent
NVIDIA GeForce RTX 5090 Founders Edition
Intel Core i9-14900K, NVIDIA GeForce RTX 5090
100 pt
NVIDIA GeForce RTX 4090
Intel Core i9-14900K, NVIDIA GeForce RTX 4090
78.9 pt
NVIDIA GeForce RTX 5080 Founders Edition
Intel Core i9-14900K, NVIDIA GeForce RTX 5080
69.7 pt
XFX Radeon RX 7900 XTX Merc 310 Black Edition
Intel Core i9-14900K, AMD Radeon RX 7900 XTX
60.9 pt
Sapphire Pulse AMD Radeon RX 7900 XTX
Intel Core i9-14900K, AMD Radeon RX 7900 XTX
59.6 pt
NVIDIA GeForce RTX 4080 Founders Edition
Intel Core i9-14900K, NVIDIA GeForce RTX 4080
57.2 pt
Sapphire Pulse AMD Radeon RX 7900 XT
Intel Core i9-14900K, AMD Radeon RX 7900 XT
49.6 pt
Indiana Jones and the Great Circle - 3840x2160 Very Ultra Preset
NVIDIA GeForce RTX 5090 Founders Edition
Intel Core i9-14900K, NVIDIA GeForce RTX 5090
123.9 (4.96min, 65.9P0.1, 103.3P1 - 184.7max) fps +38%
NVIDIA GeForce RTX 4090
Intel Core i9-14900K, NVIDIA GeForce RTX 4090
103.4 (9.64min, 58.6P0.1, 93.5P1 - 203max) fps +15%
NVIDIA GeForce RTX 5080 Founders Edition
Intel Core i9-14900K, NVIDIA GeForce RTX 5080
89.9 (7.74min, 55.4P0.1, 76.1P1 - 131.6max) fps
XFX Radeon RX 7900 XTX Merc 310 Black Edition
Intel Core i9-14900K, AMD Radeon RX 7900 XTX
76.7 (66.2min, 68.9P0.1, 70.9P1 - 89.1max) fps -15%
Sapphire Pulse AMD Radeon RX 7900 XTX
Intel Core i9-14900K, AMD Radeon RX 7900 XTX
72.1 (4.67min, 32.5P0.1, 65.8P1 - 81.5max) fps -20%
NVIDIA GeForce RTX 4080 Founders Edition
Intel Core i9-14900K, NVIDIA GeForce RTX 4080
64.6 (5.96min, 25.3P0.1, 51.2P1 - 219max) fps -28%
Sapphire Pulse AMD Radeon RX 7900 XT
Intel Core i9-14900K, AMD Radeon RX 7900 XT
61.2 (7.29min, 23.4P0.1, 56.4P1 - 69.1max) fps -32%
Black Myth: Wukong - 3840x2160 cinematic TSR 100
NVIDIA GeForce RTX 5090 Founders Edition
Intel Core i9-14900K, NVIDIA GeForce RTX 5090
58 (48min - 65max) fps +53%
NVIDIA GeForce RTX 4090
Intel Core i9-14900K, NVIDIA GeForce RTX 4090
43 (33min - 48max) fps +13%
NVIDIA GeForce RTX 5080 Founders Edition
Intel Core i9-14900K, NVIDIA GeForce RTX 5080
38 (30min - 43max) fps
XFX Radeon RX 7900 XTX Merc 310 Black Edition
Intel Core i9-14900K, AMD Radeon RX 7900 XTX
32 (26min - 37max) fps -16%
NVIDIA GeForce RTX 4080 Founders Edition
Intel Core i9-14900K, NVIDIA GeForce RTX 4080
31 (25min - 35max) fps -18%
Sapphire Pulse AMD Radeon RX 7900 XTX
Intel Core i9-14900K, AMD Radeon RX 7900 XTX
31 (16min - 36max) fps -18%
Sapphire Pulse AMD Radeon RX 7900 XT
Intel Core i9-14900K, AMD Radeon RX 7900 XT
26 (21min - 31max) fps -32%
Alan Wake 2 - 3840x2160 High Preset
NVIDIA GeForce RTX 5090 Founders Edition
Intel Core i9-14900K, NVIDIA GeForce RTX 5090
88.7 (46.5min, 63.4P0.1, 77.1P1 - 97.8max) fps +59%
NVIDIA GeForce RTX 4090
Intel Core i9-14900K, NVIDIA GeForce RTX 4090
67 (36.9min, 44.9P0.1, 57.2P1 - 80.5max) fps +20%
Sapphire Pulse AMD Radeon RX 7900 XTX
Intel Core i9-14900K, AMD Radeon RX 7900 XTX
63.7 (34min, 42.3P0.1, 55.1P1 - 68.5max) fps +14%
XFX Radeon RX 7900 XTX Merc 310 Black Edition
Intel Core i9-14900K, AMD Radeon RX 7900 XTX
62.2 (29.3min, 29.5P0.1, 38.8P1 - 160max) fps +12%
NVIDIA GeForce RTX 5080 Founders Edition
Intel Core i9-14900K, NVIDIA GeForce RTX 5080
55.7 (34min, 43P0.1, 49P1 - 60.3max) fps
Sapphire Pulse AMD Radeon RX 7900 XT
Intel Core i9-14900K, AMD Radeon RX 7900 XT
48.5 (30.1min, 37.4P0.1, 42.8P1 - 52.3max) fps -13%
NVIDIA GeForce RTX 4080 Founders Edition
Intel Core i9-14900K, NVIDIA GeForce RTX 4080
44.1 (23.7min, 24.2P0.1, 31P1 - 51.5max) fps -21%
F1 24 - 3840x2160 Ultra High Preset AA:T AF:16x
NVIDIA GeForce RTX 5090 Founders Edition
Intel Core i9-14900K, NVIDIA GeForce RTX 5090
120.9 (95min, 97P1 - 145max) fps +66%
NVIDIA GeForce RTX 4090
Intel Core i9-14900K, NVIDIA GeForce RTX 4090
89.9 (75min, 73P1 - 107max) fps +23%
NVIDIA GeForce RTX 5080 Founders Edition
Intel Core i9-14900K, NVIDIA GeForce RTX 5080
72.8 (60min, 60P1 - 88max) fps
NVIDIA GeForce RTX 4080 Founders Edition
Intel Core i9-14900K, NVIDIA GeForce RTX 4080
62.1 (53min, 52P1 - 75max) fps -15%
Sapphire Pulse AMD Radeon RX 7900 XTX
Intel Core i9-14900K, AMD Radeon RX 7900 XTX
49.9 (39min, 37P1 - 61max) fps -31%
XFX Radeon RX 7900 XTX Merc 310 Black Edition
Intel Core i9-14900K, AMD Radeon RX 7900 XTX
46.6 (32min, 32P1 - 57max) fps -36%
Sapphire Pulse AMD Radeon RX 7900 XT
Intel Core i9-14900K, AMD Radeon RX 7900 XT
42.4 (33min, 32P1 - 51max) fps -42%
Assassin's Creed Mirage - 3840x2160 Ultra High Preset (Adaptive Quality Off)
NVIDIA GeForce RTX 5090 Founders Edition
Intel Core i9-14900K, NVIDIA GeForce RTX 5090
148 (76min - 201max) fps +36%
NVIDIA GeForce RTX 4090
Intel Core i9-14900K, NVIDIA GeForce RTX 4090
123 (68min - 180max) fps +13%
NVIDIA GeForce RTX 5080 Founders Edition
Intel Core i9-14900K, NVIDIA GeForce RTX 5080
109 (56min - 155max) fps
XFX Radeon RX 7900 XTX Merc 310 Black Edition
Intel Core i9-14900K, AMD Radeon RX 7900 XTX
102 (49min, 54P0.1, 66P1 - 205max) fps -6%
Sapphire Pulse AMD Radeon RX 7900 XTX
Intel Core i9-14900K, AMD Radeon RX 7900 XTX
100 (44min - 142max) fps -8%
NVIDIA GeForce RTX 4080 Founders Edition
Intel Core i9-14900K, NVIDIA GeForce RTX 4080
93 (28min - 177max) fps -15%
Sapphire Pulse AMD Radeon RX 7900 XT
Intel Core i9-14900K, AMD Radeon RX 7900 XT
81 (42min - 204max) fps -26%
Avatar Frontiers of Pandora - 3840x2160 Ultra Preset AA:T
NVIDIA GeForce RTX 5090 Founders Edition
Intel Core i9-14900K, NVIDIA GeForce RTX 5090
83.3 (70min - 106max) fps +60%
NVIDIA GeForce RTX 4090
Intel Core i9-14900K, NVIDIA GeForce RTX 4090
64.5 (54min - 80max) fps +24%
NVIDIA GeForce RTX 5080 Founders Edition
Intel Core i9-14900K, NVIDIA GeForce RTX 5080
52.1 (45min - 65max) fps
XFX Radeon RX 7900 XTX Merc 310 Black Edition
Intel Core i9-14900K, AMD Radeon RX 7900 XTX
46 (38min - 58max) fps -12%
Sapphire Pulse AMD Radeon RX 7900 XTX
Intel Core i9-14900K, AMD Radeon RX 7900 XTX
44.8 (39min - 57max) fps -14%
NVIDIA GeForce RTX 4080 Founders Edition
Intel Core i9-14900K, NVIDIA GeForce RTX 4080
43.8 (35min - 55max) fps -16%
Sapphire Pulse AMD Radeon RX 7900 XT
Intel Core i9-14900K, AMD Radeon RX 7900 XT
35.4 (31min - 45max) fps -32%
Cyberpunk 2077 2.2 Phantom Liberty - 3840x2160 Ultra Preset (FSR off)
NVIDIA GeForce RTX 5090 Founders Edition
Intel Core i9-14900K, NVIDIA GeForce RTX 5090
111.7 (87.8min - 140.2max) fps +56%
NVIDIA GeForce RTX 4090
Intel Core i9-14900K, NVIDIA GeForce RTX 4090
73.3 (57.5min - 92.4max) fps +3%
NVIDIA GeForce RTX 5080 Founders Edition
Intel Core i9-14900K, NVIDIA GeForce RTX 5080
71.4 (58.6min - 90.8max) fps
XFX Radeon RX 7900 XTX Merc 310 Black Edition
Intel Core i9-14900K, AMD Radeon RX 7900 XTX
67.9 (57.2min - 85.2max) fps -5%
Sapphire Pulse AMD Radeon RX 7900 XTX
Intel Core i9-14900K, AMD Radeon RX 7900 XTX
65 (54.8min - 81.6max) fps -9%
NVIDIA GeForce RTX 4080 Founders Edition
Intel Core i9-14900K, NVIDIA GeForce RTX 4080
54.9 (44.9min - 69.5max) fps -23%
Sapphire Pulse AMD Radeon RX 7900 XT
Intel Core i9-14900K, AMD Radeon RX 7900 XT
53.3 (45.2min - 67.1max) fps -25%
X-Plane 11.11 - 3840x2160 high (fps_test=3)
NVIDIA GeForce RTX 5090 Founders Edition
Intel Core i9-14900K, NVIDIA GeForce RTX 5090
132.2 fps +4%
NVIDIA GeForce RTX 4090
Intel Core i9-14900K, NVIDIA GeForce RTX 4090
128.9 fps +1%
NVIDIA GeForce RTX 5080 Founders Edition
Intel Core i9-14900K, NVIDIA GeForce RTX 5080
127.7 fps
NVIDIA GeForce RTX 4080 Founders Edition
Intel Core i9-14900K, NVIDIA GeForce RTX 4080
113.8 fps -11%
XFX Radeon RX 7900 XTX Merc 310 Black Edition
Intel Core i9-14900K, AMD Radeon RX 7900 XTX
101.2 fps -21%
Sapphire Pulse AMD Radeon RX 7900 XTX
Intel Core i9-14900K, AMD Radeon RX 7900 XTX
95.5 fps -25%
Sapphire Pulse AMD Radeon RX 7900 XT
Intel Core i9-14900K, AMD Radeon RX 7900 XT
89.5 fps -30%
1080p and 2K Performance Rating - Percent
NVIDIA GeForce RTX 5090 Founders Edition
Intel Core i9-14900K, NVIDIA GeForce RTX 5090
99.4 pt
NVIDIA GeForce RTX 4090
Intel Core i9-14900K, NVIDIA GeForce RTX 4090
85.6 pt
NVIDIA GeForce RTX 5080 Founders Edition
Intel Core i9-14900K, NVIDIA GeForce RTX 5080
79.7 pt
XFX Radeon RX 7900 XTX Merc 310 Black Edition
Intel Core i9-14900K, AMD Radeon RX 7900 XTX
74.4 pt
Sapphire Pulse AMD Radeon RX 7900 XTX
Intel Core i9-14900K, AMD Radeon RX 7900 XTX
72.9 pt
Sapphire Pulse AMD Radeon RX 7900 XT -1!
Intel Core i9-14900K, AMD Radeon RX 7900 XT
62.6 pt
NVIDIA GeForce RTX 4080 Founders Edition
Intel Core i9-14900K, NVIDIA GeForce RTX 4080
61.8 pt
Indiana Jones and the Great Circle
2560x1440 Very Ultra Preset
NVIDIA GeForce RTX 5090 Founders Edition
Intel Core i9-14900K, NVIDIA GeForce RTX 5090
176.5 (8.79min, 89.2P0.1, 128P1 - 333max) fps +33%
NVIDIA GeForce RTX 4090
Intel Core i9-14900K, NVIDIA GeForce RTX 4090
148.7 (19.3min, 89.8P0.1, 124.9P1 - 360max) fps +12%
NVIDIA GeForce RTX 5080 Founders Edition
Intel Core i9-14900K, NVIDIA GeForce RTX 5080
132.3 (9.96min, 73.6P0.1, 102.1P1 - 193.6max) fps
XFX Radeon RX 7900 XTX Merc 310 Black Edition
Intel Core i9-14900K, AMD Radeon RX 7900 XTX
127.1 (103min, 108.9P0.1, 113P1 - 146.5max) fps -4%
Sapphire Pulse AMD Radeon RX 7900 XTX
Intel Core i9-14900K, AMD Radeon RX 7900 XTX
122.9 (13.6min, 88.2P0.1, 110.8P1 - 145max) fps -7%
Sapphire Pulse AMD Radeon RX 7900 XT
Intel Core i9-14900K, AMD Radeon RX 7900 XT
105.1 (11.2min, 62.3P0.1, 92.4P1 - 126max) fps -21%
NVIDIA GeForce RTX 4080 Founders Edition
Intel Core i9-14900K, NVIDIA GeForce RTX 4080
86.9 (15.2min, 48.8P0.1, 64.1P1 - 205max) fps -34%
1920x1080 Very Ultra Preset
NVIDIA GeForce RTX 5090 Founders Edition
Intel Core i9-14900K, NVIDIA GeForce RTX 5090
199.4 (15min, 121.6P0.1, 140.5P1 - 645max) fps +24%
NVIDIA GeForce RTX 4090
Intel Core i9-14900K, NVIDIA GeForce RTX 4090
179.3 (31.7min, 136.2P0.1, 142.8P1 - 503max) fps +11%
NVIDIA GeForce RTX 5080 Founders Edition
Intel Core i9-14900K, NVIDIA GeForce RTX 5080
161.2 (17.1min, 89.6P0.1, 128.1P1 - 267max) fps
XFX Radeon RX 7900 XTX Merc 310 Black Edition
Intel Core i9-14900K, AMD Radeon RX 7900 XTX
160.5 (128.2min, 133.4P0.1, 139.9P1 - 195.5max) fps 0%
Sapphire Pulse AMD Radeon RX 7900 XTX
Intel Core i9-14900K, AMD Radeon RX 7900 XTX
153.2 (20.4min, 106.1P0.1, 133.3P1 - 179max) fps -5%
Sapphire Pulse AMD Radeon RX 7900 XT
Intel Core i9-14900K, AMD Radeon RX 7900 XT
134 (21min, 105.8P0.1, 116.8P1 - 157.9max) fps -17%
NVIDIA GeForce RTX 4080 Founders Edition
Intel Core i9-14900K, NVIDIA GeForce RTX 4080
95.8 (16.5min, 52.1P0.1, 67.2P1 - 267max) fps -41%
Black Myth: Wukong
2560x1440 cinematic TSR 100
NVIDIA GeForce RTX 5090 Founders Edition
Intel Core i9-14900K, NVIDIA GeForce RTX 5090
87 (74min - 98max) fps +45%
NVIDIA GeForce RTX 4090
Intel Core i9-14900K, NVIDIA GeForce RTX 4090
68 (18min - 76max) fps +13%
NVIDIA GeForce RTX 5080 Founders Edition
Intel Core i9-14900K, NVIDIA GeForce RTX 5080
60 (53min - 68max) fps
XFX Radeon RX 7900 XTX Merc 310 Black Edition
Intel Core i9-14900K, AMD Radeon RX 7900 XTX
53 (43min - 60max) fps -12%
Sapphire Pulse AMD Radeon RX 7900 XTX
Intel Core i9-14900K, AMD Radeon RX 7900 XTX
51 (39min - 58max) fps -15%
NVIDIA GeForce RTX 4080 Founders Edition
Intel Core i9-14900K, NVIDIA GeForce RTX 4080
50 (44min - 56max) fps -17%
Sapphire Pulse AMD Radeon RX 7900 XT
Intel Core i9-14900K, AMD Radeon RX 7900 XT
44 (34min - 51max) fps -27%
1920x1080 cinematic TSR 100
NVIDIA GeForce RTX 5090 Founders Edition
Intel Core i9-14900K, NVIDIA GeForce RTX 5090
104 (19min - 124max) fps +33%
NVIDIA GeForce RTX 4090
Intel Core i9-14900K, NVIDIA GeForce RTX 4090
85 (73min - 98max) fps +9%
NVIDIA GeForce RTX 5080 Founders Edition
Intel Core i9-14900K, NVIDIA GeForce RTX 5080
78 (69min - 92max) fps
XFX Radeon RX 7900 XTX Merc 310 Black Edition
Intel Core i9-14900K, AMD Radeon RX 7900 XTX
68 (55min - 80max) fps -13%
NVIDIA GeForce RTX 4080 Founders Edition
Intel Core i9-14900K, NVIDIA GeForce RTX 4080
64 (18min - 72max) fps -18%
Sapphire Pulse AMD Radeon RX 7900 XTX
Intel Core i9-14900K, AMD Radeon RX 7900 XTX
62 (52min - 76max) fps -21%
Sapphire Pulse AMD Radeon RX 7900 XT
Intel Core i9-14900K, AMD Radeon RX 7900 XT
57 (20min - 66max) fps -27%
Alan Wake 2
2560x1440 High Preset
NVIDIA GeForce RTX 5090 Founders Edition
Intel Core i9-14900K, NVIDIA GeForce RTX 5090
150 (85.2min, 98.3P0.1, 126.1P1 - 165.4max) fps +47%
Sapphire Pulse AMD Radeon RX 7900 XTX
Intel Core i9-14900K, AMD Radeon RX 7900 XTX
121.6 (42.6min, 59.5P0.1, 104.8P1 - 138.9max) fps +19%
XFX Radeon RX 7900 XTX Merc 310 Black Edition
Intel Core i9-14900K, AMD Radeon RX 7900 XTX
120.4 (51.3min, 61.1P0.1, 93.5P1 - 167.6max) fps +18%
NVIDIA GeForce RTX 4090
Intel Core i9-14900K, NVIDIA GeForce RTX 4090
120.1 (78.4min, 87P0.1, 105.4P1 - 141.6max) fps +18%
NVIDIA GeForce RTX 5080 Founders Edition
Intel Core i9-14900K, NVIDIA GeForce RTX 5080
101.9 (52.6min, 73.1P0.1, 90.5P1 - 112.2max) fps
Sapphire Pulse AMD Radeon RX 7900 XT
Intel Core i9-14900K, AMD Radeon RX 7900 XT
95.9 (65.2min, 71.9P0.1, 85.1P1 - 151.5max) fps -6%
NVIDIA GeForce RTX 4080 Founders Edition
Intel Core i9-14900K, NVIDIA GeForce RTX 4080
75.1 (30min, 33.4P0.1, 52.9P1 - 87.3max) fps -26%
1920x1080 High Preset
NVIDIA GeForce RTX 5090 Founders Edition
Intel Core i9-14900K, NVIDIA GeForce RTX 5090
174 (76.8min, 88.2P0.1, 119.3P1 - 214max) fps +21%
NVIDIA GeForce RTX 4090
Intel Core i9-14900K, NVIDIA GeForce RTX 4090
163.7 (84.5min, 102.7P0.1, 129.9P1 - 199max) fps +14%
Sapphire Pulse AMD Radeon RX 7900 XTX
Intel Core i9-14900K, AMD Radeon RX 7900 XTX
155.8 (52.5min, 73.9P0.1, 98P1 - 194.4max) fps +8%
XFX Radeon RX 7900 XTX Merc 310 Black Edition
Intel Core i9-14900K, AMD Radeon RX 7900 XTX
155.4 (66.4min, 85P0.1, 120.3P1 - 177.8max) fps +8%
NVIDIA GeForce RTX 5080 Founders Edition
Intel Core i9-14900K, NVIDIA GeForce RTX 5080
144.1 (69.4min, 88P0.1, 113.1P1 - 163.4max) fps
Sapphire Pulse AMD Radeon RX 7900 XT
Intel Core i9-14900K, AMD Radeon RX 7900 XT
143.4 (49min, 76.3P0.1, 107.6P1 - 159.7max) fps 0%
NVIDIA GeForce RTX 4080 Founders Edition
Intel Core i9-14900K, NVIDIA GeForce RTX 4080
94.9 (29.8min, 38.9P0.1, 60.9P1 - 127.7max) fps -34%
F1 24
2560x1440 Ultra High Preset AA:T AF:16x
NVIDIA GeForce RTX 5090 Founders Edition
Intel Core i9-14900K, NVIDIA GeForce RTX 5090
211 (99min, 122P1 - 241max) fps +51%
NVIDIA GeForce RTX 4090
Intel Core i9-14900K, NVIDIA GeForce RTX 4090
169 (103min, 117P1 - 200max) fps +21%
NVIDIA GeForce RTX 5080 Founders Edition
Intel Core i9-14900K, NVIDIA GeForce RTX 5080
139.5 (101min, 107P1 - 168max) fps
NVIDIA GeForce RTX 4080 Founders Edition
Intel Core i9-14900K, NVIDIA GeForce RTX 4080
117.9 (83min, 88P1 - 136max) fps -15%
Sapphire Pulse AMD Radeon RX 7900 XTX
Intel Core i9-14900K, AMD Radeon RX 7900 XTX
98.4 (72min, 75P1 - 120max) fps -29%
XFX Radeon RX 7900 XTX Merc 310 Black Edition
Intel Core i9-14900K, AMD Radeon RX 7900 XTX
91.2 (66min, 63P1 - 112max) fps -35%
Sapphire Pulse AMD Radeon RX 7900 XT
Intel Core i9-14900K, AMD Radeon RX 7900 XT
85 (68min, 66P1 - 103max) fps -39%
1920x1080 Ultra High Preset AA:T AF:16x
NVIDIA GeForce RTX 5090 Founders Edition
Intel Core i9-14900K, NVIDIA GeForce RTX 5090
214 (120min, 123P1 - 242max) fps +7%
NVIDIA GeForce RTX 4090
Intel Core i9-14900K, NVIDIA GeForce RTX 4090
213 (103min, 120P1 - 238max) fps +7%
NVIDIA GeForce RTX 5080 Founders Edition
Intel Core i9-14900K, NVIDIA GeForce RTX 5080
199.7 (97min, 121P1 - 229max) fps
NVIDIA GeForce RTX 4080 Founders Edition
Intel Core i9-14900K, NVIDIA GeForce RTX 4080
147 (79min, 86P1 - 167max) fps -26%
Sapphire Pulse AMD Radeon RX 7900 XTX
Intel Core i9-14900K, AMD Radeon RX 7900 XTX
144.3 (76min, 94P1 - 169max) fps -28%
XFX Radeon RX 7900 XTX Merc 310 Black Edition
Intel Core i9-14900K, AMD Radeon RX 7900 XTX
134.9 (101min, 94P1 - 161max) fps -32%
Sapphire Pulse AMD Radeon RX 7900 XT
Intel Core i9-14900K, AMD Radeon RX 7900 XT
126.9 (78min, 89P1 - 151max) fps -36%
Assassin's Creed Mirage
2560x1440 Ultra High Preset (Adaptive Quality Off)
NVIDIA GeForce RTX 5090 Founders Edition
Intel Core i9-14900K, NVIDIA GeForce RTX 5090
195 (94min - 245max) fps +22%
XFX Radeon RX 7900 XTX Merc 310 Black Edition
Intel Core i9-14900K, AMD Radeon RX 7900 XTX
160 (63min, 77P0.1, 101P1 - 173max) fps 0%
NVIDIA GeForce RTX 5080 Founders Edition
Intel Core i9-14900K, NVIDIA GeForce RTX 5080
160 (84min - 206max) fps
Sapphire Pulse AMD Radeon RX 7900 XTX
Intel Core i9-14900K, AMD Radeon RX 7900 XTX
160 (59min - 200max) fps 0%
Sapphire Pulse AMD Radeon RX 7900 XT
Intel Core i9-14900K, AMD Radeon RX 7900 XT
138 (53min - 235max) fps -14%
NVIDIA GeForce RTX 4080 Founders Edition
Intel Core i9-14900K, NVIDIA GeForce RTX 4080
133 (24min - 191max) fps -17%
NVIDIA GeForce RTX 4090
Intel Core i9-14900K, NVIDIA GeForce RTX 4090
123 (68min - 180max) fps -23%
1920x1080 Ultra High Preset (Adaptive Quality Off)
NVIDIA GeForce RTX 4090
Intel Core i9-14900K, NVIDIA GeForce RTX 4090
199 (104min - 255max) fps +2%
NVIDIA GeForce RTX 5090 Founders Edition
Intel Core i9-14900K, NVIDIA GeForce RTX 5090
198 (81min - 243max) fps +2%
NVIDIA GeForce RTX 5080 Founders Edition
Intel Core i9-14900K, NVIDIA GeForce RTX 5080
195 (102min - 247max) fps
XFX Radeon RX 7900 XTX Merc 310 Black Edition
Intel Core i9-14900K, AMD Radeon RX 7900 XTX
192 (60min, 83P0.1, 123P1 - 251max) fps -2%
Sapphire Pulse AMD Radeon RX 7900 XTX
Intel Core i9-14900K, AMD Radeon RX 7900 XTX
187 (67min - 231max) fps -4%
Sapphire Pulse AMD Radeon RX 7900 XT
Intel Core i9-14900K, AMD Radeon RX 7900 XT
169 (61min - 255max) fps -13%
NVIDIA GeForce RTX 4080 Founders Edition
Intel Core i9-14900K, NVIDIA GeForce RTX 4080
155 (43min - 198max) fps -21%
Avatar Frontiers of Pandora
2560x1440 Ultra Preset AA:T
NVIDIA GeForce RTX 5090 Founders Edition
Intel Core i9-14900K, NVIDIA GeForce RTX 5090
144.6 (120min - 181max) fps +50%
NVIDIA GeForce RTX 4090
Intel Core i9-14900K, NVIDIA GeForce RTX 4090
116 (92min - 142max) fps +20%
NVIDIA GeForce RTX 5080 Founders Edition
Intel Core i9-14900K, NVIDIA GeForce RTX 5080
96.4 (78min - 122max) fps
XFX Radeon RX 7900 XTX Merc 310 Black Edition
Intel Core i9-14900K, AMD Radeon RX 7900 XTX
86 (66min - 108max) fps -11%
Sapphire Pulse AMD Radeon RX 7900 XTX
Intel Core i9-14900K, AMD Radeon RX 7900 XTX
84.6 (70min - 104max) fps -12%
NVIDIA GeForce RTX 4080 Founders Edition
Intel Core i9-14900K, NVIDIA GeForce RTX 4080
77.8 (57min - 99max) fps -19%
Sapphire Pulse AMD Radeon RX 7900 XT
Intel Core i9-14900K, AMD Radeon RX 7900 XT
68.3 (58min - 83max) fps -29%
1920x1080 Ultra Preset AA:T
NVIDIA GeForce RTX 5090 Founders Edition
Intel Core i9-14900K, NVIDIA GeForce RTX 5090
190.2 (152min - 228max) fps +42%
NVIDIA GeForce RTX 4090
Intel Core i9-14900K, NVIDIA GeForce RTX 4090
157.1 (126min - 196max) fps +17%
NVIDIA GeForce RTX 5080 Founders Edition
Intel Core i9-14900K, NVIDIA GeForce RTX 5080
134.4 (106min - 163max) fps
XFX Radeon RX 7900 XTX Merc 310 Black Edition
Intel Core i9-14900K, AMD Radeon RX 7900 XTX
120 (86min - 149max) fps -11%
Sapphire Pulse AMD Radeon RX 7900 XTX
Intel Core i9-14900K, AMD Radeon RX 7900 XTX
117.6 (92min - 144max) fps -12%
NVIDIA GeForce RTX 4080 Founders Edition
Intel Core i9-14900K, NVIDIA GeForce RTX 4080
103.4 (73min - 127max) fps -23%
Sapphire Pulse AMD Radeon RX 7900 XT
Intel Core i9-14900K, AMD Radeon RX 7900 XT
97.2 (77min - 121max) fps -28%
Cyberpunk 2077 2.2 Phantom Liberty
2560x1440 Ultra Preset (FSR off)
NVIDIA GeForce RTX 5090 Founders Edition
Intel Core i9-14900K, NVIDIA GeForce RTX 5090
181.7 (136.1min - 220max) fps +21%
NVIDIA GeForce RTX 5080 Founders Edition
Intel Core i9-14900K, NVIDIA GeForce RTX 5080
150 (125.8min - 189.9max) fps
NVIDIA GeForce RTX 4090
Intel Core i9-14900K, NVIDIA GeForce RTX 4090
149.1 (121.1min - 185.4max) fps -1%
XFX Radeon RX 7900 XTX Merc 310 Black Edition
Intel Core i9-14900K, AMD Radeon RX 7900 XTX
144.8 (122.7min - 179.5max) fps -3%
Sapphire Pulse AMD Radeon RX 7900 XTX
Intel Core i9-14900K, AMD Radeon RX 7900 XTX
142.7 (120.3min - 176max) fps -5%
Sapphire Pulse AMD Radeon RX 7900 XT
Intel Core i9-14900K, AMD Radeon RX 7900 XT
122.7 (103.7min - 153.1max) fps -18%
NVIDIA GeForce RTX 4080 Founders Edition
Intel Core i9-14900K, NVIDIA GeForce RTX 4080
113.1 (91min - 144.5max) fps -25%
1920x1080 Ultra Preset (FSR off)
XFX Radeon RX 7900 XTX Merc 310 Black Edition
Intel Core i9-14900K, AMD Radeon RX 7900 XTX
201 (152.5min - 253max) fps +15%
NVIDIA GeForce RTX 5090 Founders Edition
Intel Core i9-14900K, NVIDIA GeForce RTX 5090
184.6 (140.7min - 220max) fps +6%
Sapphire Pulse AMD Radeon RX 7900 XTX
Intel Core i9-14900K, AMD Radeon RX 7900 XTX
181.6 (138min - 223max) fps +4%
NVIDIA GeForce RTX 4090
Intel Core i9-14900K, NVIDIA GeForce RTX 4090
180.4 (135.7min - 218max) fps +3%
NVIDIA GeForce RTX 5080 Founders Edition
Intel Core i9-14900K, NVIDIA GeForce RTX 5080
174.9 (132.5min - 209max) fps
NVIDIA GeForce RTX 4080 Founders Edition
Intel Core i9-14900K, NVIDIA GeForce RTX 4080
152.9 (101.6min - 193.8max) fps -13%
X-Plane 11.11 - 1920x1080 high (fps_test=3)
NVIDIA GeForce RTX 5090 Founders Edition
Intel Core i9-14900K, NVIDIA GeForce RTX 5090
159.3 fps +1%
NVIDIA GeForce RTX 5080 Founders Edition
Intel Core i9-14900K, NVIDIA GeForce RTX 5080
157.3 fps
NVIDIA GeForce RTX 4090
Intel Core i9-14900K, NVIDIA GeForce RTX 4090
155.8 fps -1%
NVIDIA GeForce RTX 4080 Founders Edition
Intel Core i9-14900K, NVIDIA GeForce RTX 4080
140.6 fps -11%
XFX Radeon RX 7900 XTX Merc 310 Black Edition
Intel Core i9-14900K, AMD Radeon RX 7900 XTX
128.4 fps -18%
Sapphire Pulse AMD Radeon RX 7900 XTX
Intel Core i9-14900K, AMD Radeon RX 7900 XTX
124.9 fps -21%
Sapphire Pulse AMD Radeon RX 7900 XT
Intel Core i9-14900K, AMD Radeon RX 7900 XT
121.5 fps -23%

Prestazioni del Ray Tracing

Con l'aiuto di DLSS Super Resolution e Frame Generation, la RTX 5080 FE offre uno spettacolo decente anche nel ray tracing. La RTX 5080 FE raggiunge un incremento del 33% nelle prestazioni di ray tracing rispetto alla RTX 4080 FE in Indiana Jones and the Great Circle, ma rimane indietro rispetto alla RTX 5090 FE di altrettanto.

La RX 7900 XTX non è in grado di eguagliare le capacità di ray tracing della RTX 5080 FE, con quest'ultima che registra un vantaggio fino al 71% in Alan Wake 2 4K High Ray Tracing preset.

Detto questo, la RTX 5080 FE non può sostenere il peso da sola senza l'assistenza degli upscaler. Con i giochi moderni che prendono sempre più la strada del path tracing, sarà invariabilmente necessario attivare la Generazione di frame per ottenere tassi di frame giocabili.

Indiana Jones and the Great Circle - 2560x1440 Very Ultra Preset + Full Path Tracing + Quality DLSS + Frame Generation
NVIDIA GeForce RTX 5090 Founders Edition
Intel Core i9-14900K, NVIDIA GeForce RTX 5090
143.5 (13.3min, 101.6P0.1, 113.3P1 - 279max) fps +49%
NVIDIA GeForce RTX 4090
Intel Core i9-14900K, NVIDIA GeForce RTX 4090
111.3 (45.7min, 80.3P0.1, 89.8P1 - 182.7max) fps +15%
NVIDIA GeForce RTX 5080 Founders Edition
Intel Core i9-14900K, NVIDIA GeForce RTX 5080
96.5 (25.3min, 52.7P0.1, 78.1P1 - 144.2max) fps
NVIDIA GeForce RTX 4080 Founders Edition
Intel Core i9-14900K, NVIDIA GeForce RTX 4080
72.7 (31.1min, 33.3P0.1, 42.3P1 - 393max) fps -25%
Black Myth: Wukong
3840x2160 cinematic RT: Very High DLSS 68 FG
NVIDIA GeForce RTX 4090
Intel Core i9-14900K, NVIDIA GeForce RTX 4090
103 (93min - 115max) fps +69%
NVIDIA GeForce RTX 5090 Founders Edition
Intel Core i9-14900K, NVIDIA GeForce RTX 5090
99 (42min - 115max) fps +62%
NVIDIA GeForce RTX 5080 Founders Edition
Intel Core i9-14900K, NVIDIA GeForce RTX 5080
61 (53min - 71max) fps
NVIDIA GeForce RTX 4080 Founders Edition
Intel Core i9-14900K, NVIDIA GeForce RTX 4080
50 (42min - 59max) fps -18%
2560x1440 cinematic RT: Very High DLSS 68 FG
NVIDIA GeForce RTX 5090 Founders Edition
Intel Core i9-14900K, NVIDIA GeForce RTX 5090
152 (129min - 177max) fps +48%
NVIDIA GeForce RTX 4090
Intel Core i9-14900K, NVIDIA GeForce RTX 4090
135 (116min - 154max) fps +31%
NVIDIA GeForce RTX 5080 Founders Edition
Intel Core i9-14900K, NVIDIA GeForce RTX 5080
103 (87min - 120max) fps
NVIDIA GeForce RTX 4080 Founders Edition
Intel Core i9-14900K, NVIDIA GeForce RTX 4080
83 (70min - 98max) fps -19%
Star Wars Outlaws
3840x2160 cinem. ultra, RT ultra, DLSS, FG RR
NVIDIA GeForce RTX 5090 Founders Edition
Intel Core i9-14900K, NVIDIA GeForce RTX 5090
111.4 (64.8min, 78.5P0.1, 89.7P1 - 176.2max) fps +61%
NVIDIA GeForce RTX 4090
Intel Core i9-14900K, NVIDIA GeForce RTX 4090
89.9 (43.1min, 68.5P0.1, 75.7P1 - 120.4max) fps +30%
NVIDIA GeForce RTX 5080 Founders Edition
Intel Core i9-14900K, NVIDIA GeForce RTX 5080
69.2 (43.9min, 45.8P0.1, 58.1P1 - 98.1max) fps
2560x1440 cinem. ultra, RT ultra, DLSS, FG RR
NVIDIA GeForce RTX 5090 Founders Edition
Intel Core i9-14900K, NVIDIA GeForce RTX 5090
160.5 (107.4min, 115.8P0.1, 127.5P1 - 278max) fps +44%
NVIDIA GeForce RTX 4090
Intel Core i9-14900K, NVIDIA GeForce RTX 4090
131.3 (55.5min, 77.1P0.1, 102.9P1 - 253max) fps +18%
NVIDIA GeForce RTX 5080 Founders Edition
Intel Core i9-14900K, NVIDIA GeForce RTX 5080
111.3 (75.5min, 83P0.1, 88.6P1 - 164.2max) fps
Alan Wake 2
3840x2160 High Preset + High Ray Tracing + Quality DLSS + FG
NVIDIA GeForce RTX 5090 Founders Edition
Intel Core i9-14900K, NVIDIA GeForce RTX 5090
146.4 (57min, 88.5P0.1, 109.6P1 - 1324max) fps +60%
NVIDIA GeForce RTX 4090
Intel Core i9-14900K, NVIDIA GeForce RTX 4090
108.2 (46.8min, 65.2P0.1, 82.2P1 - 495max) fps +18%
NVIDIA GeForce RTX 5080 Founders Edition
Intel Core i9-14900K, NVIDIA GeForce RTX 5080
91.7 (47min, 60.3P0.1, 70.4P1 - 212max) fps
NVIDIA GeForce RTX 4080 Founders Edition
Intel Core i9-14900K, NVIDIA GeForce RTX 4080
70.8 (32.4min, 34.3P0.1, 43P1 - 156.6max) fps -23%
3840x2160 High Preset + High Ray Tracing
NVIDIA GeForce RTX 5090 Founders Edition
Intel Core i9-14900K, NVIDIA GeForce RTX 5090
47.3 (29.7min, 32.7P0.1, 35.9P1 - 53.3max) fps +65%
NVIDIA GeForce RTX 4090
Intel Core i9-14900K, NVIDIA GeForce RTX 4090
34.2 (24min, 24.5P0.1, 26.6P1 - 38.8max) fps +19%
NVIDIA GeForce RTX 5080 Founders Edition
Intel Core i9-14900K, NVIDIA GeForce RTX 5080
28.7 (19.4min, 20.3P0.1, 23.1P1 - 32.2max) fps
NVIDIA GeForce RTX 4080 Founders Edition
Intel Core i9-14900K, NVIDIA GeForce RTX 4080
22.9 (16.5min, 16.9P0.1, 18.3P1 - 26.8max) fps -20%
XFX Radeon RX 7900 XTX Merc 310 Black Edition
Intel Core i9-14900K, AMD Radeon RX 7900 XTX
16.8 (6.89min, 6.9P0.1, 7.41P1 - 141.1max) fps -41%
Sapphire Pulse AMD Radeon RX 7900 XTX
Intel Core i9-14900K, AMD Radeon RX 7900 XTX
15.6 (11.8min, 11.8P0.1, 12.1P1 - 17.8max) fps -46%
Sapphire Pulse AMD Radeon RX 7900 XT
Intel Core i9-14900K, AMD Radeon RX 7900 XT
13.5 (9.06min, 9.08P0.1, 9.81P1 - 15.2max) fps -53%
1920x1080 High Preset + High Ray Tracing
NVIDIA GeForce RTX 5090 Founders Edition
Intel Core i9-14900K, NVIDIA GeForce RTX 5090
126.5 (51.8min, 79P0.1, 97.4P1 - 153.5max) fps +52%
NVIDIA GeForce RTX 4090
Intel Core i9-14900K, NVIDIA GeForce RTX 4090
97.4 (71.9min, 73P0.1, 79.4P1 - 116.4max) fps +17%
NVIDIA GeForce RTX 5080 Founders Edition
Intel Core i9-14900K, NVIDIA GeForce RTX 5080
83.3 (54min, 58.6P0.1, 64.2P1 - 97.4max) fps
NVIDIA GeForce RTX 4080 Founders Edition
Intel Core i9-14900K, NVIDIA GeForce RTX 4080
62.5 (34.6min, 35.9P0.1, 44.7P1 - 82.6max) fps -25%
XFX Radeon RX 7900 XTX Merc 310 Black Edition
Intel Core i9-14900K, AMD Radeon RX 7900 XTX
53.2 (21.9min, 34.4P0.1, 40.3P1 - 101.5max) fps -36%
Sapphire Pulse AMD Radeon RX 7900 XTX
Intel Core i9-14900K, AMD Radeon RX 7900 XTX
49.9 (30.5min, 33.2P0.1, 37.6P1 - 58.3max) fps -40%
Sapphire Pulse AMD Radeon RX 7900 XT
Intel Core i9-14900K, AMD Radeon RX 7900 XT
44.7 (30.3min, 30.4P0.1, 32.5P1 - 50.7max) fps -46%
Cyberpunk 2077 2.2 Phantom Liberty
3840x2160 Ray Tracing Ultra Preset (DLSS off, no Path Tracing)
NVIDIA GeForce RTX 5090 Founders Edition
Intel Core i9-14900K, NVIDIA GeForce RTX 5090
58.2 (52.6min - 68.1max) fps +65%
NVIDIA GeForce RTX 4090
Intel Core i9-14900K, NVIDIA GeForce RTX 4090
41.9 (37.3min - 50.4max) fps +19%
NVIDIA GeForce RTX 5080 Founders Edition
Intel Core i9-14900K, NVIDIA GeForce RTX 5080
35.3 (31.5min - 42.9max) fps
NVIDIA GeForce RTX 4080 Founders Edition
Intel Core i9-14900K, NVIDIA GeForce RTX 4080
28.7 (25.7min - 34.6max) fps -19%
XFX Radeon RX 7900 XTX Merc 310 Black Edition
Intel Core i9-14900K, AMD Radeon RX 7900 XTX
22.4 (19.5min - 28.8max) fps -37%
Sapphire Pulse AMD Radeon RX 7900 XTX
Intel Core i9-14900K, AMD Radeon RX 7900 XTX
21.9 (19.2min - 27.6max) fps -38%
Sapphire Pulse AMD Radeon RX 7900 XT
Intel Core i9-14900K, AMD Radeon RX 7900 XT
18.5 (16.1min - 23.4max) fps -48%
1920x1080 Ray Tracing Ultra Preset (DLSS off)
NVIDIA GeForce RTX 5090 Founders Edition
Intel Core i9-14900K, NVIDIA GeForce RTX 5090
139.4 (117.5min - 162.6max) fps +28%
NVIDIA GeForce RTX 4090
Intel Core i9-14900K, NVIDIA GeForce RTX 4090
118.9 (105.3min - 138.4max) fps +9%
NVIDIA GeForce RTX 5080 Founders Edition
Intel Core i9-14900K, NVIDIA GeForce RTX 5080
108.8 (96.1min - 127.8max) fps
NVIDIA GeForce RTX 4080 Founders Edition
Intel Core i9-14900K, NVIDIA GeForce RTX 4080
82.3 (72.6min - 91.6max) fps -24%
XFX Radeon RX 7900 XTX Merc 310 Black Edition
Intel Core i9-14900K, AMD Radeon RX 7900 XTX
70.3 (61.5min - 84max) fps -35%
Sapphire Pulse AMD Radeon RX 7900 XTX
Intel Core i9-14900K, AMD Radeon RX 7900 XTX
69.1 (60.2min - 83.3max) fps -36%
Sapphire Pulse AMD Radeon RX 7900 XT
Intel Core i9-14900K, AMD Radeon RX 7900 XT
60.7 (52.6min - 73.6max) fps -44%
Alan Wake 2
3840x2160 High Preset + Ultra Ray Tracing + Quality DLSS + FG 4x
NVIDIA GeForce RTX 5090 Founders Edition
Intel Core i9-14900K, NVIDIA GeForce RTX 5090
242 (76min, 105.4P0.1, 162.5P1) fps +57%
NVIDIA GeForce RTX 5080 Founders Edition
Intel Core i9-14900K, NVIDIA GeForce RTX 5080
154.2 (54.6min, 81P0.1, 106.2P1) fps
3840x2160 High Preset + Ultra Ray Tracing + Quality DLSS + FG 2x
NVIDIA GeForce RTX 5090 Founders Edition
Intel Core i9-14900K, NVIDIA GeForce RTX 5090
133.6 (50.3min, 72.1P0.1, 94.7P1) fps +57%
NVIDIA GeForce RTX 5080 Founders Edition
Intel Core i9-14900K, NVIDIA GeForce RTX 5080
84.9 (40.1min, 45.5P0.1, 61.9P1) fps
Cyberpunk 2077 2.2 Phantom Liberty
3840x2160 Ray Tracing Overdrive Preset + DLSS 4 Transformer Quality + Frame Generation MFG 4x
NVIDIA GeForce RTX 5090 Founders Edition
Intel Core i9-14900K, NVIDIA GeForce RTX 5090
216 (198.8min) fps +68%
NVIDIA GeForce RTX 5080 Founders Edition
Intel Core i9-14900K, NVIDIA GeForce RTX 5080
128.4 (116min) fps
3840x2160 Ray Tracing Overdrive Preset + DLSS 4 Transformer Quality + Frame Generation (M)FG 2x
NVIDIA GeForce RTX 5090 Founders Edition
Intel Core i9-14900K, NVIDIA GeForce RTX 5090
116.7 (106.8min) fps +14%
NVIDIA GeForce RTX 5080 Founders Edition
Intel Core i9-14900K, NVIDIA GeForce RTX 5080
102.2 (93.3min) fps
2560x1440 Ultra Preset DLSS4 quality no FG
NVIDIA GeForce RTX 5090 Founders Edition
Intel Core i9-14900K, NVIDIA GeForce RTX 5090
182.5 (140.4min) fps
Star Wars Outlaws - 3840x2160 cinem. ultra, RT ultra, DLSS, FG 4x, RR
NVIDIA GeForce RTX 5090 Founders Edition
Intel Core i9-14900K, NVIDIA GeForce RTX 5090
203 (56min, 126.4P0.1, 159.2P1) fps +60%
NVIDIA GeForce RTX 5080 Founders Edition
Intel Core i9-14900K, NVIDIA GeForce RTX 5080
126.5 (47.5min, 64.5P0.1, 93.2P1) fps
bassomedioaltoultraQHD DLSSQHD4K DLSS4K
The Witcher 3 (2015) 279 223 232
X-Plane 11.11 (2018) 157.3 127.7
Metro Exodus (2019) 195.5 172.8
Control (2019)
F1 22 (2022) 189.5 135.4 69.9
Cyberpunk 2077 2.2 Phantom Liberty (2023) 174.9 150 104 71.4
Assassin's Creed Mirage (2023) 195 160 140 109
Alan Wake 2 (2023) 144.1 101.9 91.7 55.7
Avatar Frontiers of Pandora (2023) 134.4 96.4 88.1 52.1
F1 24 (2024) 199.7 139.5 120 72.8
Black Myth: Wukong (2024) 78 85 60 63 38
Star Wars Outlaws (2024) 97.2 97 74.8 66.4 46.6
Stalker 2 (2024) 103.1 164.3 82.9 110.5 53.6
Indiana Jones and the Great Circle (2024) 161.2 132.3 89.9

Cyberpunk 2077 1080p Ultra FPS chart

0102030405060708090100110120130140150160170180Tooltip
NVIDIA GeForce RTX 5080 Founders Edition i9-14900K, GeForce RTX 5080; 3840x2160 Ultra Preset (FSR off): Ø84 (81.6-84.8)
NVIDIA GeForce RTX 5080 Founders Edition i9-14900K, GeForce RTX 5080; 1920x1080 30min Start Ultra Preset (FSR off): Ø180.9 (175.1-183.9)

Power consumption: External monitor

0306090120150180210240270300330360390420450480510Tooltip
NVIDIA GeForce RTX 5080 Founders Edition; 1280x720 FurMark 1.19 GPU Stress Test (external Monitor); Idle: 70 W: Ø476 (464-496)
NVIDIA GeForce RTX 5080 Founders Edition; Idle 1min (external Monitor): Ø69.8 (68.8-73.7)
NVIDIA GeForce RTX 5080 Founders Edition; Cyberpunk 2077 FHD ultra no FSR (external Monitor); Idle: 70 W: Ø520 (510-533)
Power Consumption / FurMark 1.19 GPU Stress Test (external Monitor)
NVIDIA GeForce RTX 5090 Founders Edition
Intel Core i9-14900K, NVIDIA GeForce RTX 5090 (Idle: 90 W)
708 (700min, 700P1 - 718max) Watt * -49%
NVIDIA GeForce RTX 4090
Intel Core i9-14900K, NVIDIA GeForce RTX 4090 (Idle: 82 W)
579 (558min, 561P1 - 595max) Watt * -22%
Sapphire Pulse AMD Radeon RX 7900 XTX
Intel Core i9-14900K, AMD Radeon RX 7900 XTX (Idle: 74 W)
549 (540min, 541P1 - 638max) Watt * -15%
NVIDIA GeForce RTX 5080 Founders Edition
Intel Core i9-14900K, NVIDIA GeForce RTX 5080 (Idle: 70 W)
476 (464min, 466P1 - 496max) Watt *
Sapphire Pulse AMD Radeon RX 7900 XT
Intel Core i9-14900K, AMD Radeon RX 7900 XT (Idle: 94 W)
474 (467min, 468P1 - 523max) Watt * -0%
NVIDIA GeForce RTX 4080 Founders Edition
Intel Core i9-14900K, NVIDIA GeForce RTX 4080 (Idle: 72 W)
420 (402min, 403P1 - 461max) Watt * +12%
Power Consumption / Cyberpunk 2077 FHD ultra no FSR (external Monitor)
Sapphire Pulse AMD Radeon RX 7900 XTX
Intel Core i9-14900K, AMD Radeon RX 7900 XTX (Idle: 74 W)
716 (697min, 701P1 - 730max) Watt * -38%
Sapphire Pulse AMD Radeon RX 7900 XT
Intel Core i9-14900K, AMD Radeon RX 7900 XT (Idle: 94 W)
652 (636min, 638P1 - 665max) Watt * -25%
NVIDIA GeForce RTX 5090 Founders Edition
Intel Core i9-14900K, NVIDIA GeForce RTX 5090 (Idle: 90 )
629 (615min, 618P1 - 646max) Watt * -21%
NVIDIA GeForce RTX 4090
Intel Core i9-14900K, NVIDIA GeForce RTX 4090 (Idle: 82 W)
588 (580min, 581P1 - 596max) Watt * -13%
NVIDIA GeForce RTX 5080 Founders Edition
Intel Core i9-14900K, NVIDIA GeForce RTX 5080 (Idle: 70 W)
520 (510min, 512P1 - 533max) Watt *
NVIDIA GeForce RTX 4080 Founders Edition
Intel Core i9-14900K, NVIDIA GeForce RTX 4080 (Idle: 72 W)
488 (479min, 480P1 - 503max) Watt * +6%
Power Consumption / Cyberpunk 2077 ultra Efficiency
NVIDIA GeForce RTX 5080 Founders Edition
Intel Core i9-14900K, NVIDIA GeForce RTX 5080
0.3479 fps per Watt
NVIDIA GeForce RTX 4090
Intel Core i9-14900K, NVIDIA GeForce RTX 4090
0.2991 fps per Watt -14%
NVIDIA GeForce RTX 4080 Founders Edition
Intel Core i9-14900K, NVIDIA GeForce RTX 4080
0.2988 fps per Watt -14%
NVIDIA GeForce RTX 5090 Founders Edition
Intel Core i9-14900K, NVIDIA GeForce RTX 5090
0.2928 fps per Watt -16%
Sapphire Pulse AMD Radeon RX 7900 XT
Intel Core i9-14900K, AMD Radeon RX 7900 XT
0.2874 fps per Watt -17%
Sapphire Pulse AMD Radeon RX 7900 XTX
Intel Core i9-14900K, AMD Radeon RX 7900 XTX
0.2654 fps per Watt -24%
Power Consumption / The Witcher 3 ultra (external Monitor)
NVIDIA GeForce RTX 5090 Founders Edition
Intel Core i9-14900K, NVIDIA GeForce RTX 5090 (Idle: 90 W)
692 (662min, 663P1 - 719max) Watt * -54%
Sapphire Pulse AMD Radeon RX 7900 XTX
Intel Core i9-14900K, AMD Radeon RX 7900 XTX (Idle: 74 W)
609 (598min, 600P1 - 622max) Watt * -35%
NVIDIA GeForce RTX 4090
Intel Core i9-14900K, NVIDIA GeForce RTX 4090 (Idle: 82 W)
538 (515min, 526P1 - 588max) Watt * -20%
Sapphire Pulse AMD Radeon RX 7900 XT
Intel Core i9-14900K, AMD Radeon RX 7900 XT (Idle: 94 W)
527 (522min, 523P1 - 540max) Watt * -17%
NVIDIA GeForce RTX 5080 Founders Edition
Intel Core i9-14900K, NVIDIA GeForce RTX 5080 (Idle: 70 W)
450 (440min, 441P1 - 483max) Watt *
NVIDIA GeForce RTX 4080 Founders Edition
Intel Core i9-14900K, NVIDIA GeForce RTX 4080 (Idle: 72 W)
367 (361min, 361P1 - 386max) Watt * +18%
Power Consumption / Witcher 3 ultra Efficiency (external Monitor)
NVIDIA GeForce RTX 5080 Founders Edition
Intel Core i9-14900K, NVIDIA GeForce RTX 5080
0.62 fps per Watt
NVIDIA GeForce RTX 4080 Founders Edition
Intel Core i9-14900K, NVIDIA GeForce RTX 4080
0.574 fps per Watt -7%
NVIDIA GeForce RTX 4090
Intel Core i9-14900K, NVIDIA GeForce RTX 4090
0.557 fps per Watt -10%
NVIDIA GeForce RTX 5090 Founders Edition
Intel Core i9-14900K, NVIDIA GeForce RTX 5090
0.4942 fps per Watt -20%
Sapphire Pulse AMD Radeon RX 7900 XT
Intel Core i9-14900K, AMD Radeon RX 7900 XT
0.463 fps per Watt -25%
Sapphire Pulse AMD Radeon RX 7900 XTX
Intel Core i9-14900K, AMD Radeon RX 7900 XTX
0.4548 fps per Watt -27%
1280x720 FurMark 1.19 GPU Stress Test (external Monitor)
350.77
1920x1080 The Witcher 3 ultra (external Monitor)
357.59

* ... Meglio usare valori piccoli

Transparency

La selezione dei dispositivi da recensire viene effettuata dalla nostra redazione. Il campione di prova è stato fornito all'autore come prestito dal produttore o dal rivenditore ai fini di questa recensione. L'istituto di credito non ha avuto alcuna influenza su questa recensione, né il produttore ne ha ricevuto una copia prima della pubblicazione. Non vi era alcun obbligo di pubblicare questa recensione. Non accettiamo mai compensi o pagamenti in cambio delle nostre recensioni. In quanto società mediatica indipendente, Notebookcheck non è soggetta all'autorità di produttori, rivenditori o editori.

Ecco come Notebookcheck esegue i test

Ogni anno, Notebookcheck esamina in modo indipendente centinaia di laptop e smartphone utilizzando procedure standardizzate per garantire che tutti i risultati siano comparabili. Da circa 20 anni sviluppiamo continuamente i nostri metodi di prova e nel frattempo stabiliamo gli standard di settore. Nei nostri laboratori di prova, tecnici ed editori esperti utilizzano apparecchiature di misurazione di alta qualità. Questi test comportano un processo di validazione in più fasi. Il nostro complesso sistema di valutazione si basa su centinaia di misurazioni e parametri di riferimento ben fondati, che mantengono l'obiettività.
Please share our article, every link counts!
Mail Logo
> Recensioni e prove di notebook, tablets e smartphones > Recensioni e prove > Recensioni e prove > Recensione di Nvidia GeForce RTX 5080 Founders Edition: la scheda da 999 dollari rende di fatto superflua la RX 7900 XTX
Vaidyanathan Subramaniam, 2025-03- 6 (Update: 2025-03- 6)