Notebookcheck Logo
Teaser

Recensione della CPU desktop AMD Ryzen 7 9800X3D: Nessuna possibilità per Arrow Lake di Intel contro la nuova CPU gaming di AMD con 3D V-Cache e architettura Zen 5

CPU da gioco di prima classe!

Grazie alla tecnologia 3D V-Cache, AMD Ryzen 7 9800X3D promette prestazioni impressionanti, in particolare nei giochi. Grazie alla moderna architettura Zen 5, il nuovo processore a 8 core dovrebbe offrire prestazioni nettamente superiori anche al di fuori del gioco. Nella nostra recensione, abbiamo evidenziato i suoi punti di forza e di debolezza e abbiamo analizzato il suo confronto con altre CPU di fascia alta presenti sul mercato.
Sebastian Bade (traduzione a cura di DeepL / Ninh Duy) Pubblicato 🇺🇸 🇩🇪 ...
AMD Zen 5 Desktop Gaming Ryzen (Zen)

Verdetto - Una CPU da gioco di prima classe con buone capacità allrounder

Durante il nostro test, AMD Ryzen 7 9800X3D ha fornito prestazioni di gioco impressionanti. Le applicazioni di tutti i giorni beneficiano inoltre di un aumento delle prestazioni IPC, rendendo il processore una buona base per i compiti creativi. Rispetto al suo predecessore, AMD Ryzen 7 9800X3D offre fino al 25% di prestazioni in più, a seconda dello scenario, senza aumentare il consumo energetico. Si tratta di un passo corretto e importante nella giusta direzione che porta a una migliore efficienza, anche se Intel è ancora in vantaggio in questa disciplina con i suoi processori Arrow Lake.

Per riassumere i nostri risultati, possiamo dire che AMD Ryzen 7 9800X3D è attualmente la CPU da gioco più veloce sul mercato. Tuttavia, il suo aumento nelle prestazioni di gioco rispetto all'AMD Ryzen 7 7800X3D è piuttosto ridotto. Intel non può assolutamente tenere il passo in un confronto diretto quando si tratta di prestazioni di gioco. Un divario elevato, a due cifre, nei test di benchmark è già un grande schiaffo per i nuovi processori Intel, anche se la differenza è molto più piccola se si considerano le impostazioni di gioco più realistiche. I numerosi piccoli miglioramenti apportati da AMD al suo AMD Ryzen 7 9800X3D hanno dato i loro frutti. Il design rivisto della CPU stessa ha aumentato sensibilmente le sue velocità di clock, mentre abbiamo misurato un calo significativo delle sue temperature.

Pro

+ eccellenti prestazioni di gioco
+ moderna produzione a 4 nm con 3D V-Cache
+ efficiente dal punto di vista energetico
+ ancora socket AM5

Contro

- relativamente costoso
- solo 8 core
- prestazioni aggiuntive limitate nei giochi rispetto a AMD Ryzen 7 7800X3D

Prezzo e disponibilità

AMD Ryzen 7 9800X3D ha un MRSP di 479 dollari, il che lo rende leggermente più costoso di AMD Ryzen 7 7800X3D al momento del lancio.

Amazon Logo
$523.99
AMD Ryzen 7 7800X3D 8-Core, 16-Thread Desktop Processor
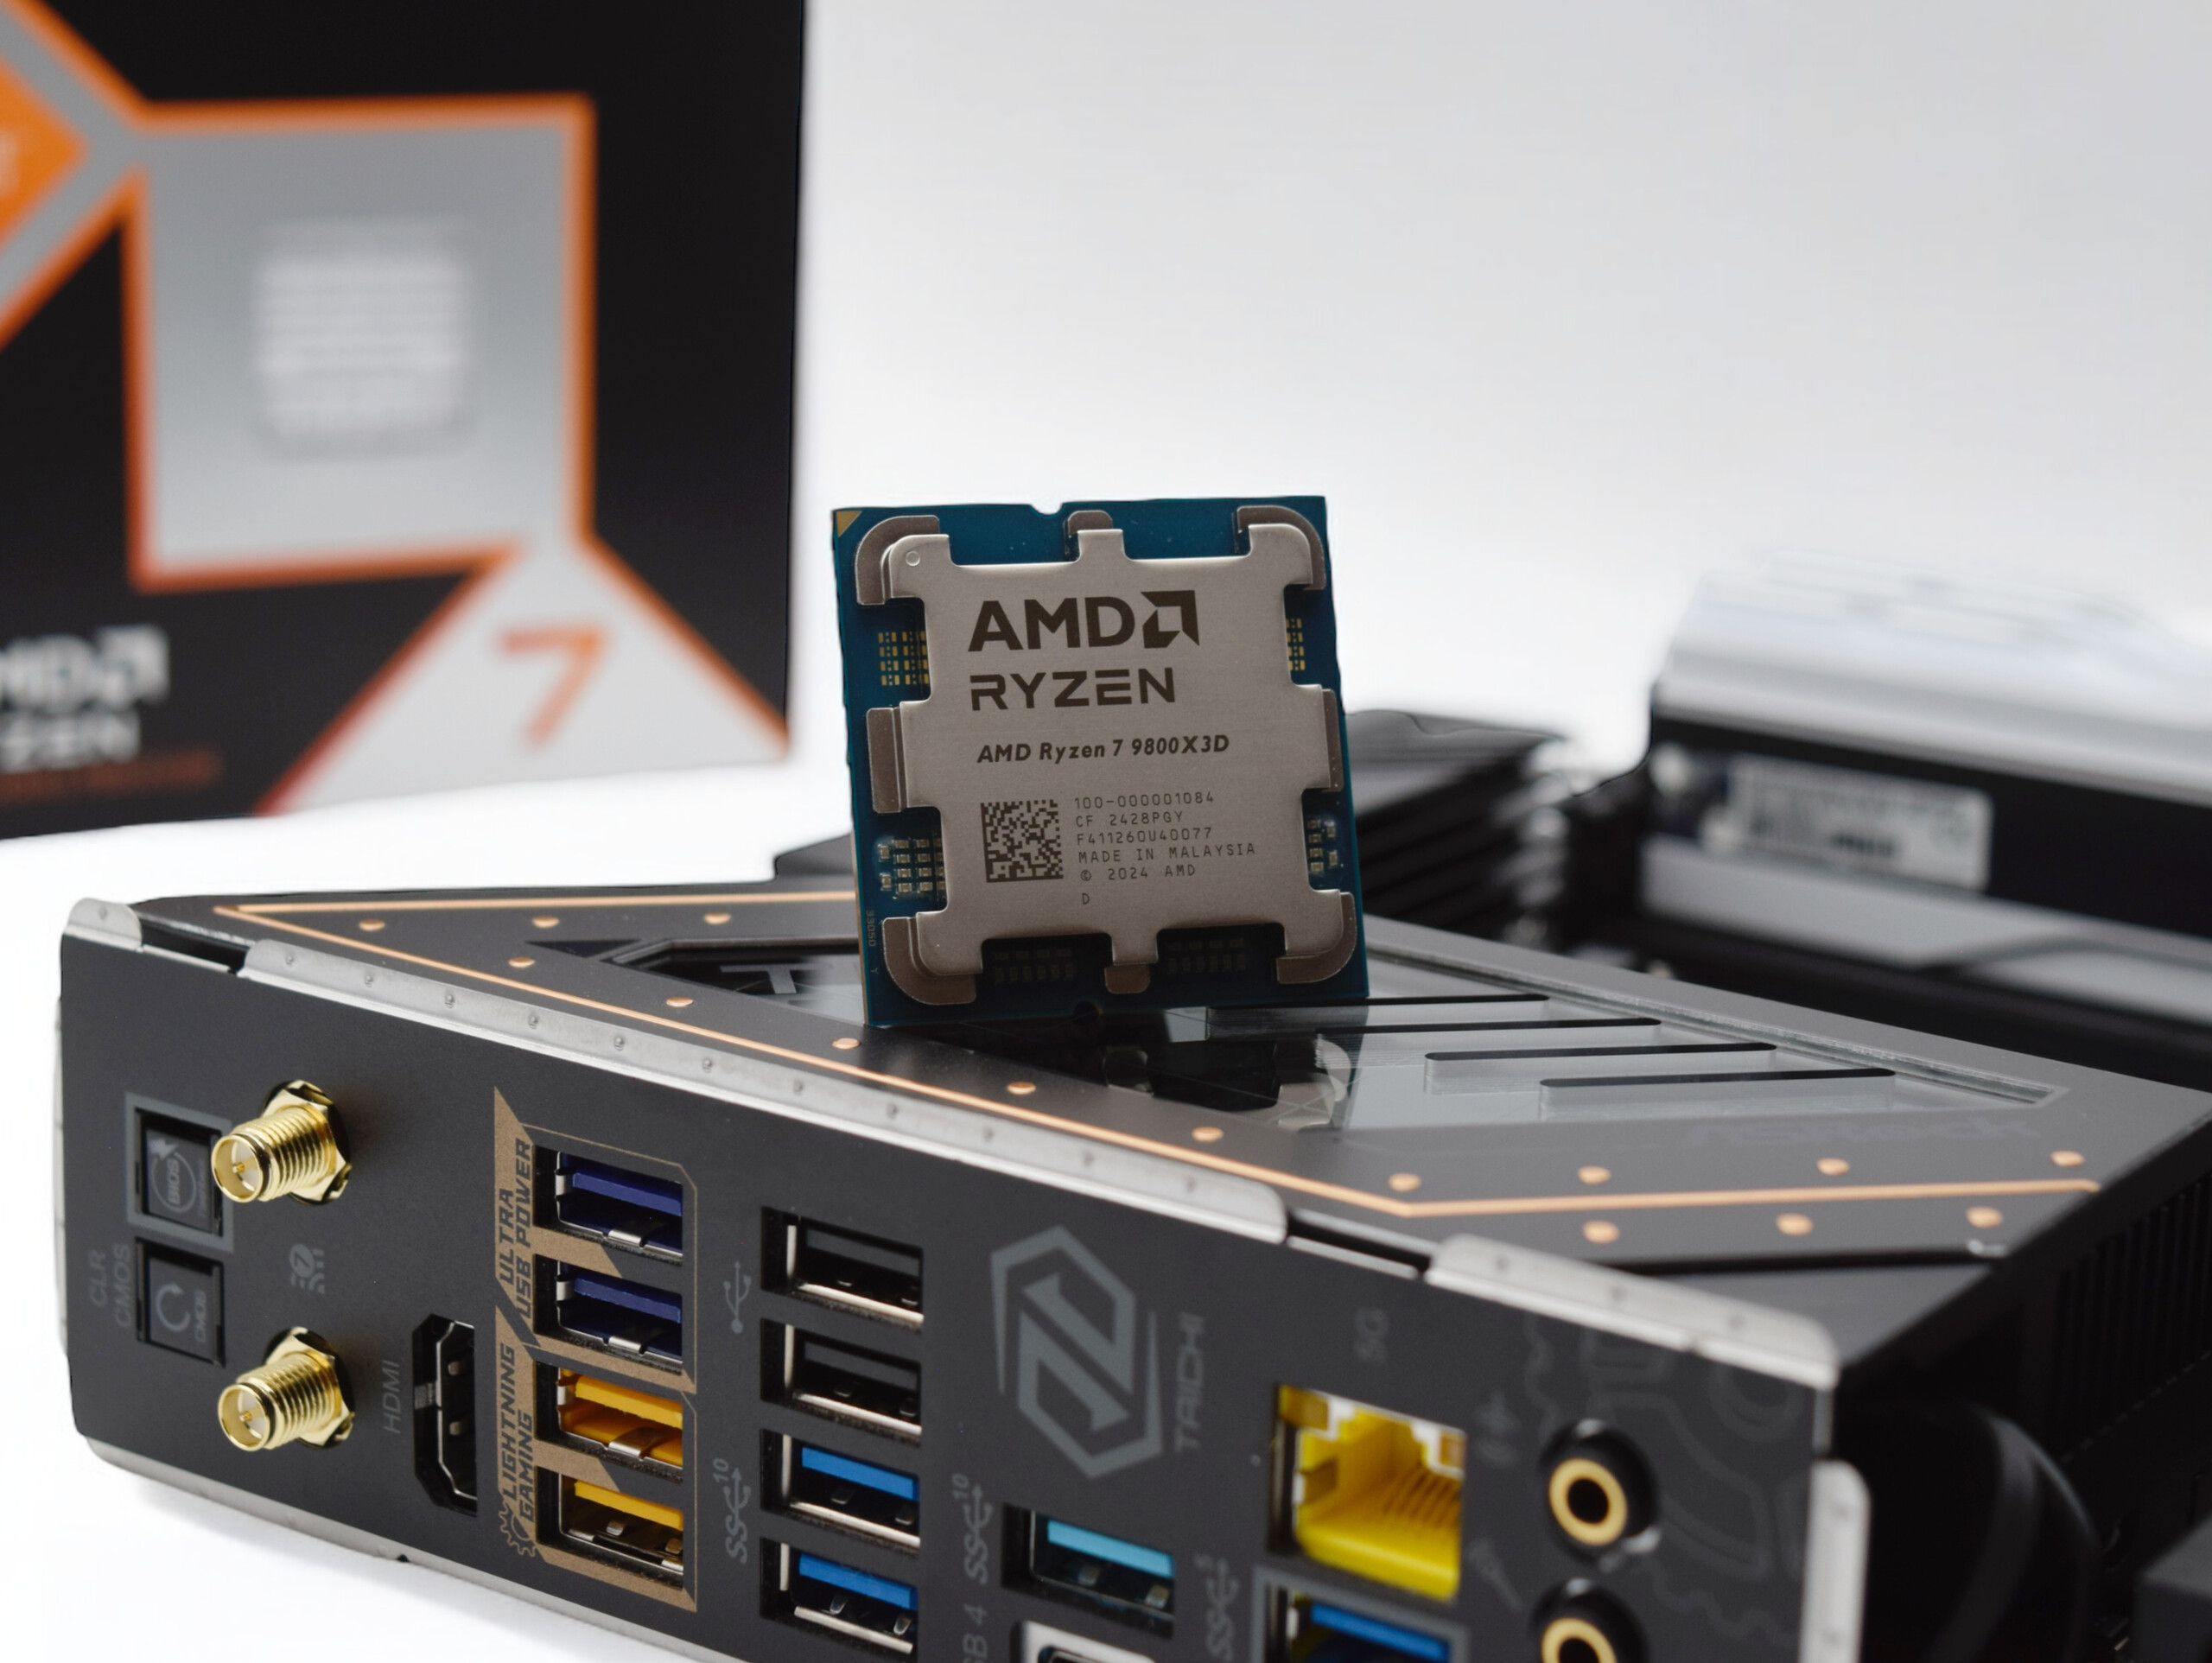
AMD Ryzen 7 9800X3D - build (fonte: AMD)

Soprattutto, i processori AMD dotati di 3D V-Cache offrono prestazioni estremamente elevate durante l'esecuzione di videogiochi. Questo aspetto è già stato dimostrato in modo impressionante da AMD con il modello AMD Ryzen 7 7800X3D. Dopo che AMD ha recentemente rilasciato i primi processori della serie 900 basati sull'architettura Zen 5, era solo questione di tempo prima che venisse lanciato il successore del popolare AMD Ryzen 7 7800X3D. Oggi possiamo condividere i risultati del nostro test di AMD Ryzen 7 9800X3D, il cui modello sarà disponibile per la vendita dal 7 novembre 2024. Se stava discutendo se acquistare un AMD Ryzen 9 con 3D V-Cache, potremmo doverla rimandare per il momento. AMD non ha ancora fatto alcun annuncio ufficiale sui processori. Tuttavia, se si crede alle voci di corridoio, l'anno prossimo seguiranno altri modelli.

In questo articolo ci concentreremo quindi esclusivamente su AMD Ryzen 7 9800X3D, che mira a rubare la corona di CPU da gioco più veloce del mercato. Intel ha presentato solo di recente i suoi nuovi processori Arrow Lake, che non sono stati nemmeno in grado di tenere il passo con il vecchio AMD Ryzen 7 7800X3D in termini di prestazioni di gioco. Questo dà ad AMD un gioco facile, perché al contrario il suo più grande avversario proviene dai suoi stessi ranghi.

Panoramica su AMD Ryzen 9000 e AMD Ryzen 7000

Modello Cores/threads Orologio base Turbo clock Cache L2 Cache L3 TDP PPT Prezzo di lancio
Ryzen 9 9950X 16/32 4,3 GHz 5,7 GHz 16x 1 MB 64 MB 170 watt 200 watt 649 USD
Ryzen 9 7950X3D 16/32 4,2 GHz 5,7 GHz 16x 1 MB 128 MB 120 watt 162 watt 699 USD
Ryzen 9 7950X 16/32 4,5 GHz 5,7 GHz 16x 1 MB 64 MB 170 watt 230 watt 699 USD
Ryzen 9 9900X 12/24 4,4 GHz 5,6 GHz 12x 1 MB 64 MB 120 watt 162 watt 499 USD
Ryzen 9 7900X3D 12/24 4,4 GHz 5,6 GHz 12x 1 MB 128 MB 120 watt 162 watt 599 USD
Ryzen 9 7900X 12/24 4,7 GHz 5,6 GHz 12x 1 MB 64 MB 170 watt 230 watt 549 USD
Ryzen 7 9800X3D 8/16 4,7 GHz 5,2 GHz 8x1 MB 96 MB 120 watt 162 watt 479USD
Ryzen 7 7800X3D 8/16 4,2 GHz 5,0 GHz 8x 1 MB 96 MB 120 watt 162 watt 449 USD
Ryzen 7 9700X 8/16 3,8 GHz 5,5 GHz 8x 1 MB 32 MB 65 watt 88 watt 359 USD
Ryzen 7 7700X 8/16 4,5 GHz 5,4 GHz 8x 1 MB 32 MB 105 watt 142 watt 399 USD
Ryzen 5 9600X 6/12 3,9 GHz 5,4 GHz 6x 1 MB 32 MB 65 watt 88 watt 279 USD
Ryzen 5 7600X 6/12 4,7 GHz 5,3 GHz 6x 1 MB 32 MB 105 watt 142 watt 299 USD
Ryzen 5 7500F 6/12 3,7 GHz 5,0 GHz 6x 1 MB 32 MB 65 watt 88 watt 179 USD

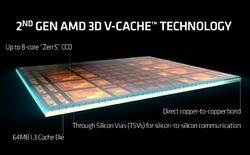
Ma prima di esaminare nel dettaglio i risultati, adottiamo un approccio cronologico e diamo un'occhiata alle nuove caratteristiche del processore. Esternamente, non è cambiato nulla, in quanto AMD Ryzen 7 9800X3D utilizza anche la base AM5, il che significa che un aggiornamento non costerebbe nulla se si possiede già una scheda madre AM5. Tuttavia, ci sono molte differenze da vedere sotto il dissipatore di calore. Oltre alla più recente architettura Zen 5 - che è prodotta con una struttura di 4 nm di larghezza - AMD ha disposto la cache in modo completamente diverso. Il grafico mostra che la cache è stata spostata sotto il CCD (Core Complex Die). Ciò consente di ottenere velocità di clock significativamente più elevate, accompagnate da una minore generazione di calore. Il CCD contiene le unità di calcolo vere e proprie, che consistono ancora in 8 core e 16 thread nell'AMD Ryzen 7 9800X3D. Un processore nativo a 8 core è attualmente una scelta eccellente per il gioco, come ha già dimostrato perfettamente l'AMD Ryzen 7 7800X3D. Inoltre, evita il problema dell'allocazione dei thread, che era in parte presente nel processore AMD Ryzen 9 7950X3D.

Il clock della RAM di AMD Ryzen 7 9800X3D è ufficialmente di 5.600 MT/s, quindi un leggero miglioramento. Nella maggior parte dei casi, il processore sarà probabilmente utilizzato con un kit RAM EXPO a 6.000 MT/s. Oltre al processore e alla scheda madre, il kit del nostro recensore includeva un kit di RAM da utilizzare per il test. Ciò significa che durante i nostri test abbiamo operato in un leggero scenario di OC per quanto riguarda la velocità di clock della RAM. A questo punto, vorremmo sottolineare che i noti produttori di schede madri hanno i cosiddetti elenchi QVL, che mostrano quale RAM è compatibile. Vale quindi la pena dare un'occhiata a questi elenchi prima dell'acquisto.

Per quanto riguarda il consumo energetico massimo di AMD Ryzen 7 9800X3D, non è cambiato nulla. Il produttore ha mantenuto il TDP esistente di 120 watt. Tuttavia, il consumo massimo di energia è limitato dal PPT (Package Power Tracking) a 162 watt. Anche in questo caso, non ci sono cambiamenti rispetto all'AMD Ryzen 7 7800X3D.

AMD Ryzen 7 9800X3D
Processore
AMD Ryzen 7 9800X3D 8 x 4.7 - 5.2 GHz, 162 W PL2 / Short Burst, 120 W PL1 / Sustained, Granite Ridge (Zen5)
Scheda grafica
NVIDIA GeForce RTX 4090 - 24 GB VRAM, Core: 2610 MHz, RAM: 1313 MHz, 450 W TDP, 565.9
Memoria
32 GB 
, DDR5-6000 MT/s
Scheda madre
AMD X870E
Harddisk
Kingston KC3000 2048G SKC3000D2048G, 2048 GB 
Sistema Operativo
Microsoft Windows 11 Pro
Prezzo
479 USD
Nota: il produttore potrebbe usare componenti di fornitori diversi pannelli dei diplay, drive o banchi di memoria con specifiche simili.


Per i nostri benchmark e test abbiamo utilizzato il seguente sistema:

  • Streacom BC1 V2 Open Benchtable
  • AMD Ryzen 7 9800X3D
  • Asrock X870E Taichi, BIOS: 3.09.AS03 (AGESA 1.2.0.2)
  • Sistema di raffreddamento ad acqua Custom Loop (pompa: Watercool WCP D5, radiatore: EK MO-RA3 420 Pro)
  • Palit GeForce RTX 4090 GameRock OC
  • EVGA SuperNOVA P+ 1.600 watt
  • G.Skill Trident Z5 Neo RGB DDR5-6000 2x 16 GB, EXPO (DDR5-6000 CL28-36-36-96)
  • Kingston KC3000 2 TB, M.2 2280 (OS + benchmark sintetici)
  • Microsoft Windows 11 Professional 64-Bit (versione 24H2)
AMD Ryzen 7 9800X3D
AMD Ryzen 7 9800X3D
AMD Ryzen 7 9800X3D
AMD Ryzen 7 9800X3D
AMD Ryzen 7 9800X3D
AMD Ryzen 7 9800X3D
G.Skill Trident Z5 Neo RGB
Kit di prova - AMD Ryzen 7 9800X3D, ASRock X870E Taichi, G.Skill Trident Z5 Neo RGB

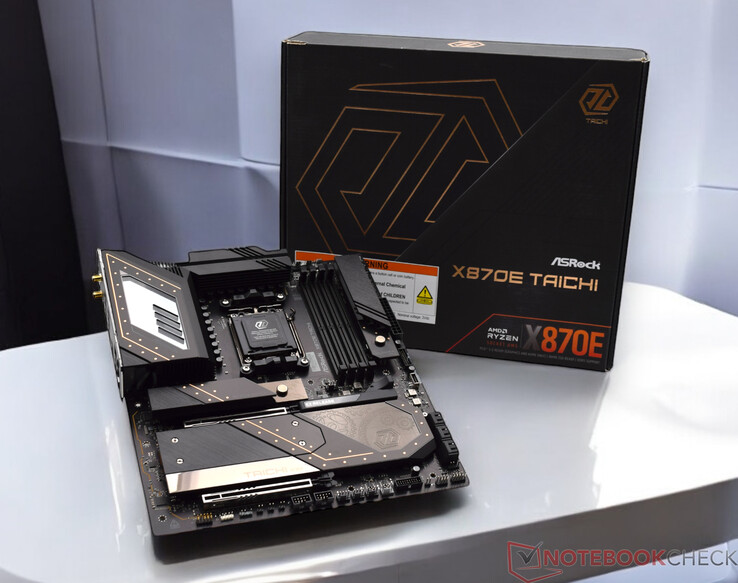
L'ASRock X870E Taichi funge da base per l'AMD Ryzen 7 9800X3D

Tutti i test di AMD Ryzen 7 9800X3D sono stati eseguiti sulla ASRock X870E Taichi. Le schede madri di recente introduzione della generazione di chipset 800 differiscono solo leggermente dai loro predecessori. La nuova ammiraglia, la X870E, è ora sempre dotata di USB4 e di un'ampia gamma di porte USB 3.2. Inoltre, sulla scheda madre è possibile alloggiare un totale di quattro SSD M.2.

La ASRock X870E Taichi fa parte della serie Taichi di ASRock, anche se gli elementi ottici non sono presenti come in altre schede madri del produttore. Gli elementi sono accompagnati da una sottile illuminazione RGB. Inoltre, è dotata di 1x 5G LAN per le connessioni di rete cablate e supporta l'ultimo standard Wi-Fi 7 per le connessioni wireless. Ci sono diversi dispositivi di raffreddamento distribuiti sull'intera scheda madre, che da un lato le conferiscono un aspetto sorprendente, ma dall'altro hanno lo scopo principale di dissipare il calore. Una caratteristica particolare è che sia il radiatore SSD sopra lo slot della scheda grafica, sia il radiatore SSD, che si trova accanto agli slot della RAM, possono essere rimossi rapidamente e senza dover utilizzare alcuno strumento. È possibile sbloccare e rimuovere la scheda grafica dal suo slot in modo semplice, utilizzando il cosiddetto rilascio EZ. Sistemi simili sono disponibili anche presso altri partner di schede. Purtroppo, questa rimozione senza attrezzi non si applica a tutti gli slot di espansione. I due slot M.2 inferiori si trovano sotto una solida piastra di raffreddamento, che a sua volta è fissata con quattro viti.

Funzioni come l'ASRock Auto Driver Installer, che fornisce tutti i driver adatti direttamente dopo l'installazione del sistema operativo, hanno funzionato perfettamente durante il nostro test. ASRock X870E Taichi supporta la RAM DDR5 con velocità di clock elevate, fino a 8.200 MT/s e oltre. Con tutti e quattro gli slot di RAM occupati, è possibile arrivare fino a 256 GB. Tuttavia, è essenziale prestare molta attenzione alla compatibilità. Consigliamo di dare un'occhiata all'elenco QVL (Qualified Vendor List) della rispettiva scheda madre per garantire la compatibilità.

Amazon Logo
$699.00
ASRock AMD X870E Taichi Ryzen Socket AM5 X870 Dual Channel DDR5 DIMMs 256 GB 8200 EATX Motherboard M.2 LED WiFi 7
ASRock X870E Taichi
ASRock X870E Taichi
ASRock X870E Taichi
ASRock X870E Taichi
ASRock X870E Taichi
ASRock X870E Taichi
ASRock X870E Taichi
ASRock X870E Taichi
ASRock X870E Taichi
ASRock X870E Taichi
ASRock X870E Taichi
ASRock X870E Taichi

Condizioni di test

Abbiamo eseguito tutti i test sulle prestazioni utilizzando il profilo energetico "prestazioni massime". Abbiamo anche attivato il PBO nel BIOS e caricato il profilo EXPO della RAM. Come unità di raffreddamento abbiamo utilizzato un sistema di raffreddamento ad acqua ad anello personalizzato, che abbiamo già utilizzato nella stessa forma per i precedenti test sulle prestazioni della CPU.

Parametri di riferimento del processore - Ryzen 7 9800X3D con 8 core Zen-5

Prima di affrontare lo scopo principale di AMD Ryzen 7 9800X3D, diamo un'occhiata alle prestazioni della CPU pura. Sulla base di molti benchmark individuali, l'AMD Ryzen 7 9800X3D ha mostrato costantemente un notevole aumento delle prestazioni rispetto all'AMD Ryzen 7 7800X3D AMD Ryzen 7 7800X3D. Se si considera il confronto delle prestazioni medie, il nostro modello di prova si è classificato appena davanti all'Intel Core i5-14600K Intel Core i5-14600K. Anche il recente Intel Core Ultra 5 245K è rimasto indietro. L'AMD Ryzen 7 9800X3D è solo leggermente svantaggiato quando si confronta il nuovo 8-core con gli attuali modelli top di gamma. Va detto, tuttavia, che questo confronto è impreciso, in quanto la gamma di applicazioni dell'AMD Ryzen 7 9800X3D è chiaramente rivolta agli appassionati di giochi.

Può trovare altri benchmark di processori qui.

CPU-Z
CPU-Z
CPU-Z
CPU-Z
CPU-Z
CPU-Z
GPU-Z (dGPU)
GPU-Z (iGPU)
HWiNFO
AMD Ryzen Master
AMD Ryzen Master
Performance Rating - Percent
AMD Ryzen 9 9950X
Ryzen 9 9950X, 4300 MHz
82 pt
Intel Core i9-14900K
i9-14900K, 3200 MHz
81.8 pt
Intel Core i9-13900K
i9-13900K, 3000 MHz
79.6 pt
Intel Core Ultra 9 285K
Ultra 9 285K, 3200 MHz
79.3 pt
AMD Ryzen 9 7950X
R9 7950X, 4500 MHz
78.2 pt
AMD Ryzen 9 7950X3D
R9 7950X3D, 4200 MHz
78 pt
AMD Ryzen 9 7900X
R9 7900X, 4700 MHz
71.4 pt
AMD Ryzen 7 9800X3D
R7 9800X3D, 4700 MHz
69.9 pt
Intel Core i5-14600K
i5-14600K, 3500 MHz
68.4 pt
AMD Ryzen 7 9700X
Ryzen 7 9700X, 3800 MHz
67.8 pt
Intel Core i9-12900K
i9-12900K, 3200 MHz
67.7 pt
Intel Core Ultra 5 245K
Ultra 5 245K, 3600 MHz
67.6 pt
AMD Ryzen 9 5950X
R9 5950X, 3400 MHz
66.6 pt
Intel Core i5-13600K
i5-13600K, 3500 MHz
66.3 pt
AMD Ryzen 5 9600X
Ryzen 5 9600X, 3900 MHz
64.1 pt
AMD Ryzen 7 7800X3D
R7 7800X3D, 4200 MHz
63.7 pt
AMD Ryzen 5 7600X
R5 7600X, 4700 MHz
61.4 pt
Intel Core i5-12600K
i5-12600K, 2800 MHz
59.3 pt
Intel Core i5-13400
i5-13400, 2500 MHz
56.7 pt
Intel Core i5-12400F
i5-12400F, 2500 MHz
52.1 pt
Cinebench R23
Single Core
Intel Core i9-14900K
i9-14900K, 3200 MHz
2351 Points +13%
Intel Core Ultra 9 285K
Ultra 9 285K, 3200 MHz
2342 Points +13%
Intel Core i9-13900K
i9-13900K, 3000 MHz
2267 Points +9%
AMD Ryzen 7 9700X
Ryzen 7 9700X, 3800 MHz
2211 Points +6%
AMD Ryzen 9 9950X
Ryzen 9 9950X, 4300 MHz
2202 Points +6%
AMD Ryzen 5 9600X
Ryzen 5 9600X, 3900 MHz
2180 Points +5%
Intel Core Ultra 5 245K
Ultra 5 245K, 3600 MHz
2132 Points +3%
AMD Ryzen 7 9800X3D
R7 9800X3D, 4700 MHz
2080 Points
Intel Core i5-14600K
i5-14600K, 3500 MHz
2064 Points -1%
AMD Ryzen 9 7950X3D
R9 7950X3D, 4200 MHz
2053 Points -1%
AMD Ryzen 9 7950X
R9 7950X, 4500 MHz
2045 Points -2%
AMD Ryzen 9 7900X
R9 7900X, 4700 MHz
2039 Points -2%
Intel Core i5-13600K
i5-13600K, 3500 MHz
2010 Points -3%
Intel Core i9-12900K
i9-12900K, 3200 MHz
1998 Points -4%
AMD Ryzen 5 7600X
R5 7600X, 4700 MHz
1967 Points -5%
Intel Core i5-12600K
i5-12600K, 2800 MHz
1907 Points -8%
AMD Ryzen 7 7800X3D
R7 7800X3D, 4200 MHz
1820 Points -12%
Intel Core i5-13400
i5-13400, 2500 MHz
1786 Points -14%
Intel Core i5-12400F
i5-12400F, 2500 MHz
1680 Points -19%
AMD Ryzen 9 5950X
R9 5950X, 3400 MHz
1649 Points -21%
Multi Core
Intel Core Ultra 9 285K
Ultra 9 285K, 3200 MHz
42522 Points +83%
Intel Core i9-14900K
i9-14900K, 3200 MHz
41193 Points +77%
AMD Ryzen 9 9950X
Ryzen 9 9950X, 4300 MHz
40924 Points +76%
Intel Core i9-13900K
i9-13900K, 3000 MHz
40103 Points +73%
AMD Ryzen 9 7950X
R9 7950X, 4500 MHz
37792 Points +63%
AMD Ryzen 9 7950X3D
R9 7950X3D, 4200 MHz
36291 Points +56%
AMD Ryzen 9 7900X
R9 7900X, 4700 MHz
29480 Points +27%
AMD Ryzen 9 5950X
R9 5950X, 3400 MHz
27062 Points +16%
Intel Core i9-12900K
i9-12900K, 3200 MHz
27005 Points +16%
Intel Core Ultra 5 245K
Ultra 5 245K, 3600 MHz
25066 Points +8%
Intel Core i5-14600K
i5-14600K, 3500 MHz
24491 Points +5%
Intel Core i5-13600K
i5-13600K, 3500 MHz
24268 Points +4%
AMD Ryzen 7 9800X3D
R7 9800X3D, 4700 MHz
23230 Points
AMD Ryzen 7 9700X
Ryzen 7 9700X, 3800 MHz
20485 Points -12%
AMD Ryzen 7 7800X3D
R7 7800X3D, 4200 MHz
18086 Points -22%
Intel Core i5-12600K
i5-12600K, 2800 MHz
17491 Points -25%
AMD Ryzen 5 9600X
Ryzen 5 9600X, 3900 MHz
17176 Points -26%
Intel Core i5-13400
i5-13400, 2500 MHz
15953 Points -31%
AMD Ryzen 5 7600X
R5 7600X, 4700 MHz
15322 Points -34%
Intel Core i5-12400F
i5-12400F, 2500 MHz
12380 Points -47%
Cinebench R20
CPU (Single Core)
Intel Core i9-14900K
i9-14900K, 3200 MHz
900 Points +10%
Intel Core Ultra 9 285K
Ultra 9 285K, 3200 MHz
899 Points +10%
AMD Ryzen 9 9950X
Ryzen 9 9950X, 4300 MHz
871 Points +6%
AMD Ryzen 7 9700X
Ryzen 7 9700X, 3800 MHz
870 Points +6%
AMD Ryzen 5 9600X
Ryzen 5 9600X, 3900 MHz
858 Points +5%
Intel Core i9-13900K
i9-13900K, 3000 MHz
828 Points +1%
Intel Core Ultra 5 245K
Ultra 5 245K, 3600 MHz
820 Points 0%
AMD Ryzen 7 9800X3D
R7 9800X3D, 4700 MHz
818 Points
AMD Ryzen 9 7950X
R9 7950X, 4500 MHz
795 Points -3%
AMD Ryzen 9 7950X3D
R9 7950X3D, 4200 MHz
795 Points -3%
Intel Core i5-14600K
i5-14600K, 3500 MHz
790 Points -3%
AMD Ryzen 9 7900X
R9 7900X, 4700 MHz
786 Points -4%
Intel Core i5-13600K
i5-13600K, 3500 MHz
775 Points -5%
Intel Core i9-12900K
i9-12900K, 3200 MHz
766 Points -6%
AMD Ryzen 5 7600X
R5 7600X, 4700 MHz
761 Points -7%
Intel Core i5-12600K
i5-12600K, 2800 MHz
734 Points -10%
AMD Ryzen 7 7800X3D
R7 7800X3D, 4200 MHz
709 Points -13%
Intel Core i5-13400
i5-13400, 2500 MHz
688 Points -16%
Intel Core i5-12400F
i5-12400F, 2500 MHz
653 Points -20%
AMD Ryzen 9 5950X
R9 5950X, 3400 MHz
641 Points -22%
CPU (Multi Core)
Intel Core Ultra 9 285K
Ultra 9 285K, 3200 MHz
16623 Points +84%
AMD Ryzen 9 9950X
Ryzen 9 9950X, 4300 MHz
15788 Points +74%
Intel Core i9-14900K
i9-14900K, 3200 MHz
15466 Points +71%
Intel Core i9-13900K
i9-13900K, 3000 MHz
15181 Points +68%
AMD Ryzen 9 7950X
R9 7950X, 4500 MHz
14786 Points +63%
AMD Ryzen 9 7950X3D
R9 7950X3D, 4200 MHz
14188 Points +57%
AMD Ryzen 9 7900X
R9 7900X, 4700 MHz
11563 Points +28%
AMD Ryzen 9 5950X
R9 5950X, 3400 MHz
10482 Points +16%
Intel Core i9-12900K
i9-12900K, 3200 MHz
10240 Points +13%
Intel Core Ultra 5 245K
Ultra 5 245K, 3600 MHz
9752 Points +8%
Intel Core i5-14600K
i5-14600K, 3500 MHz
9371 Points +3%
Intel Core i5-13600K
i5-13600K, 3500 MHz
9265 Points +2%
AMD Ryzen 7 9800X3D
R7 9800X3D, 4700 MHz
9057 Points
AMD Ryzen 7 9700X
Ryzen 7 9700X, 3800 MHz
7956 Points -12%
AMD Ryzen 7 7800X3D
R7 7800X3D, 4200 MHz
7121 Points -21%
AMD Ryzen 5 9600X
Ryzen 5 9600X, 3900 MHz
6719 Points -26%
Intel Core i5-12600K
i5-12600K, 2800 MHz
6692 Points -26%
Intel Core i5-13400
i5-13400, 2500 MHz
6135 Points -32%
AMD Ryzen 5 7600X
R5 7600X, 4700 MHz
5985 Points -34%
Intel Core i5-12400F
i5-12400F, 2500 MHz
4740 Points -48%
Cinebench R15
CPU Single 64Bit
Intel Core Ultra 9 285K
Ultra 9 285K, 3200 MHz
355 Points +8%
AMD Ryzen 7 9700X
Ryzen 7 9700X, 3800 MHz
346 Points +5%
AMD Ryzen 9 9950X
Ryzen 9 9950X, 4300 MHz
344 Points +5%
AMD Ryzen 5 9600X
Ryzen 5 9600X, 3900 MHz
341 Points +4%
Intel Core i9-14900K
i9-14900K, 3200 MHz
332 Points +1%
AMD Ryzen 9 7950X
R9 7950X, 4500 MHz
328 Points 0%
AMD Ryzen 7 9800X3D
R7 9800X3D, 4700 MHz
328 Points
Intel Core i9-13900K
i9-13900K, 3000 MHz
327 Points 0%
AMD Ryzen 9 7950X3D
R9 7950X3D, 4200 MHz
326 Points -1%
AMD Ryzen 9 7900X
R9 7900X, 4700 MHz
324 Points -1%
Intel Core Ultra 5 245K
Ultra 5 245K, 3600 MHz
322 Points -2%
AMD Ryzen 5 7600X
R5 7600X, 4700 MHz
315 Points -4%
Intel Core i5-14600K
i5-14600K, 3500 MHz
297 Points -9%
AMD Ryzen 7 7800X3D
R7 7800X3D, 4200 MHz
291 Points -11%
Intel Core i5-13600K
i5-13600K, 3500 MHz
289 Points -12%
Intel Core i9-12900K
i9-12900K, 3200 MHz
286 Points -13%
Intel Core i5-12600K
i5-12600K, 2800 MHz
275 Points -16%
AMD Ryzen 9 5950X
R9 5950X, 3400 MHz
272 Points -17%
Intel Core i5-13400
i5-13400, 2500 MHz
257 Points -22%
Intel Core i5-12400F
i5-12400F, 2500 MHz
244 Points -26%
CPU Multi 64Bit
Intel Core Ultra 9 285K
Ultra 9 285K, 3200 MHz
6396 Points +75%
AMD Ryzen 9 9950X
Ryzen 9 9950X, 4300 MHz
6335 (6262.72min - 6335.13max) Points +74%
Intel Core i9-14900K
i9-14900K, 3200 MHz
6282 Points +72%
AMD Ryzen 9 7950X
R9 7950X, 4500 MHz
6209 Points +70%
Intel Core i9-13900K
i9-13900K, 3000 MHz
6191 Points +70%
AMD Ryzen 9 7950X3D
R9 7950X3D, 4200 MHz
5974 Points +64%
AMD Ryzen 9 7900X
R9 7900X, 4700 MHz
4856 Points +33%
AMD Ryzen 9 5950X
R9 5950X, 3400 MHz
4492 Points +23%
Intel Core i9-12900K
i9-12900K, 3200 MHz
4057 Points +11%
Intel Core Ultra 5 245K
Ultra 5 245K, 3600 MHz
3850 Points +6%
AMD Ryzen 7 9800X3D
R7 9800X3D, 4700 MHz
3647 Points
Intel Core i5-13600K
i5-13600K, 3500 MHz
3643 Points 0%
Intel Core i5-14600K
i5-14600K, 3500 MHz
3640 Points 0%
AMD Ryzen 7 9700X
Ryzen 7 9700X, 3800 MHz
3178 (3067.25min - 3120.37max) Points -13%
AMD Ryzen 7 7800X3D
R7 7800X3D, 4200 MHz
2974 Points -18%
AMD Ryzen 5 9600X
Ryzen 5 9600X, 3900 MHz
2630 Points -28%
Intel Core i5-12600K
i5-12600K, 2800 MHz
2555 Points -30%
AMD Ryzen 5 7600X
R5 7600X, 4700 MHz
2507 Points -31%
Intel Core i5-13400
i5-13400, 2500 MHz
2358 Points -35%
Intel Core i5-12400F
i5-12400F, 2500 MHz
1759 Points -52%
Cinebench R11.5
CPU Single 64Bit
Intel Core Ultra 9 285K
Ultra 9 285K, 3200 MHz
4.17 Points +9%
AMD Ryzen 7 9700X
Ryzen 7 9700X, 3800 MHz
4.06 Points +6%
AMD Ryzen 9 9950X
Ryzen 9 9950X, 4300 MHz
4.03 Points +5%
Intel Core i9-14900K
i9-14900K, 3200 MHz
4.02 Points +5%
AMD Ryzen 5 9600X
Ryzen 5 9600X, 3900 MHz
4 Points +4%
Intel Core i9-13900K
i9-13900K, 3000 MHz
3.92 Points +2%
AMD Ryzen 9 7950X
R9 7950X, 4500 MHz
3.86 Points +1%
AMD Ryzen 9 7950X3D
R9 7950X3D, 4200 MHz
3.86 Points +1%
Intel Core Ultra 5 245K
Ultra 5 245K, 3600 MHz
3.85 Points 0%
AMD Ryzen 7 9800X3D
R7 9800X3D, 4700 MHz
3.84 Points
AMD Ryzen 9 7900X
R9 7900X, 4700 MHz
3.83 Points 0%
AMD Ryzen 5 7600X
R5 7600X, 4700 MHz
3.72 Points -3%
Intel Core i5-14600K
i5-14600K, 3500 MHz
3.58 Points -7%
Intel Core i9-12900K
i9-12900K, 3200 MHz
3.49 Points -9%
Intel Core i5-13600K
i5-13600K, 3500 MHz
3.48 Points -9%
AMD Ryzen 7 7800X3D
R7 7800X3D, 4200 MHz
3.43 Points -11%
Intel Core i5-12600K
i5-12600K, 2800 MHz
3.31 Points -14%
AMD Ryzen 9 5950X
R9 5950X, 3400 MHz
3.14 Points -18%
Intel Core i5-13400
i5-13400, 2500 MHz
3.1 Points -19%
Intel Core i5-12400F
i5-12400F, 2500 MHz
2.95 Points -23%
CPU Multi 64Bit
Intel Core Ultra 9 285K
Ultra 9 285K, 3200 MHz
77.29 Points +85%
AMD Ryzen 9 9950X
Ryzen 9 9950X, 4300 MHz
72.28 Points +73%
Intel Core i9-14900K
i9-14900K, 3200 MHz
72.24 Points +73%
Intel Core i9-13900K
i9-13900K, 3000 MHz
70.78 Points +70%
AMD Ryzen 9 7950X
R9 7950X, 4500 MHz
68.61 Points +65%
AMD Ryzen 9 7950X3D
R9 7950X3D, 4200 MHz
64.59 Points +55%
AMD Ryzen 9 7900X
R9 7900X, 4700 MHz
54.51 Points +31%
AMD Ryzen 9 5950X
R9 5950X, 3400 MHz
49.6 Points +19%
Intel Core Ultra 5 245K
Ultra 5 245K, 3600 MHz
47.55 Points +14%
Intel Core i9-12900K
i9-12900K, 3200 MHz
47.06 Points +13%
Intel Core i5-13600K
i5-13600K, 3500 MHz
42.38 Points +2%
AMD Ryzen 7 9800X3D
R7 9800X3D, 4700 MHz
41.67 Points
Intel Core i5-14600K
i5-14600K, 3500 MHz
40.96 Points -2%
AMD Ryzen 7 9700X
Ryzen 7 9700X, 3800 MHz
36.24 Points -13%
AMD Ryzen 7 7800X3D
R7 7800X3D, 4200 MHz
33.48 Points -20%
AMD Ryzen 5 9600X
Ryzen 5 9600X, 3900 MHz
30.86 Points -26%
Intel Core i5-12600K
i5-12600K, 2800 MHz
30.01 Points -28%
AMD Ryzen 5 7600X
R5 7600X, 4700 MHz
28.41 Points -32%
Intel Core i5-13400
i5-13400, 2500 MHz
27.36 Points -34%
Intel Core i5-12400F
i5-12400F, 2500 MHz
20.39 Points -51%
Blender - v2.79 BMW27 CPU
Intel Core i5-12400F
i5-12400F, 2500 MHz
269 Seconds * -96%
Intel Core i5-13400
i5-13400, 2500 MHz
206 Seconds * -50%
AMD Ryzen 5 7600X
R5 7600X, 4700 MHz
203 Seconds * -48%
Intel Core i5-12600K
i5-12600K, 2800 MHz
189.5 Seconds * -38%
AMD Ryzen 5 9600X
Ryzen 5 9600X, 3900 MHz
184 Seconds * -34%
AMD Ryzen 7 7800X3D
R7 7800X3D, 4200 MHz
169 Seconds * -23%
AMD Ryzen 7 9700X
Ryzen 7 9700X, 3800 MHz
154 Seconds * -12%
AMD Ryzen 7 9800X3D
R7 9800X3D, 4700 MHz
137 Seconds *
Intel Core Ultra 5 245K
Ultra 5 245K, 3600 MHz
136 Seconds * +1%
Intel Core i5-13600K
i5-13600K, 3500 MHz
135 Seconds * +1%
Intel Core i5-14600K
i5-14600K, 3500 MHz
134 Seconds * +2%
Intel Core i9-12900K
i9-12900K, 3200 MHz
121.1 Seconds * +12%
AMD Ryzen 9 5950X
R9 5950X, 3400 MHz
112.8 Seconds * +18%
AMD Ryzen 9 7900X
R9 7900X, 4700 MHz
106 Seconds * +23%
AMD Ryzen 9 7950X3D
R9 7950X3D, 4200 MHz
86 Seconds * +37%
AMD Ryzen 9 7950X
R9 7950X, 4500 MHz
85 Seconds * +38%
Intel Core i9-13900K
i9-13900K, 3000 MHz
80 Seconds * +42%
Intel Core i9-14900K
i9-14900K, 3200 MHz
80 Seconds * +42%
Intel Core Ultra 9 285K
Ultra 9 285K, 3200 MHz
79 Seconds * +42%
AMD Ryzen 9 9950X
Ryzen 9 9950X, 4300 MHz
77 Seconds * +44%
wPrime 2.10
32m
Intel Core i9-12900K
i9-12900K, 3200 MHz
4.924 s * -118%
Intel Core i5-12600K
i5-12600K, 2800 MHz
4.725 s * -110%
Intel Core i5-12400F
i5-12400F, 2500 MHz
4.078 s * -81%
Intel Core i5-13400
i5-13400, 2500 MHz
3.474 s * -54%
Intel Core Ultra 5 245K
Ultra 5 245K, 3600 MHz
2.976 s * -32%
AMD Ryzen 5 7600X
R5 7600X, 4700 MHz
2.78 s * -23%
AMD Ryzen 5 9600X
Ryzen 5 9600X, 3900 MHz
2.617 s * -16%
AMD Ryzen 9 5950X
R9 5950X, 3400 MHz
2.538 s * -13%
Intel Core i5-13600K
i5-13600K, 3500 MHz
2.527 s * -12%
AMD Ryzen 7 7800X3D
R7 7800X3D, 4200 MHz
2.435 s * -8%
Intel Core i5-14600K
i5-14600K, 3500 MHz
2.39 s * -6%
AMD Ryzen 7 9700X
Ryzen 7 9700X, 3800 MHz
2.36 s * -5%
AMD Ryzen 7 9800X3D
R7 9800X3D, 4700 MHz
2.254 s *
Intel Core Ultra 9 285K
Ultra 9 285K, 3200 MHz
2.197 s * +3%
AMD Ryzen 9 9950X
Ryzen 9 9950X, 4300 MHz
2.077 s * +8%
Intel Core i9-14900K
i9-14900K, 3200 MHz
2.07 s * +8%
AMD Ryzen 9 7950X3D
R9 7950X3D, 4200 MHz
2.007 s * +11%
Intel Core i9-13900K
i9-13900K, 3000 MHz
1.818 s * +19%
AMD Ryzen 9 7900X
R9 7900X, 4700 MHz
1.781 s * +21%
AMD Ryzen 9 7950X
R9 7950X, 4500 MHz
1.669 s * +26%
1024m
Intel Core i5-13400
i5-13400, 2500 MHz
452.309 s * -733%
Intel Core i5-12600K
i5-12600K, 2800 MHz
202.7 s * -273%
Intel Core i9-12900K
i9-12900K, 3200 MHz
190.6 s * -251%
Intel Core i5-13600K
i5-13600K, 3500 MHz
177.592 s * -227%
Intel Core i5-14600K
i5-14600K, 3500 MHz
158.77 s * -192%
Intel Core i5-12400F
i5-12400F, 2500 MHz
112.849 s * -108%
Intel Core i9-13900K
i9-13900K, 3000 MHz
79.738 s * -47%
Intel Core Ultra 5 245K
Ultra 5 245K, 3600 MHz
77.721 s * -43%
AMD Ryzen 5 7600X
R5 7600X, 4700 MHz
74.491 s * -37%
Intel Core i9-14900K
i9-14900K, 3200 MHz
74.47 s * -37%
AMD Ryzen 5 9600X
Ryzen 5 9600X, 3900 MHz
72.546 s * -34%
AMD Ryzen 9 5950X
R9 5950X, 3400 MHz
64.9 s * -20%
AMD Ryzen 7 7800X3D
R7 7800X3D, 4200 MHz
62.733 s * -16%
AMD Ryzen 7 9700X
Ryzen 7 9700X, 3800 MHz
59.56 s * -10%
AMD Ryzen 7 9800X3D
R7 9800X3D, 4700 MHz
54.284 s *
Intel Core Ultra 9 285K
Ultra 9 285K, 3200 MHz
48.806 s * +10%
AMD Ryzen 9 7900X
R9 7900X, 4700 MHz
39.954 s * +26%
AMD Ryzen 9 7950X3D
R9 7950X3D, 4200 MHz
33.879 s * +38%
AMD Ryzen 9 7950X
R9 7950X, 4500 MHz
30.811 s * +43%
AMD Ryzen 9 9950X
Ryzen 9 9950X, 4300 MHz
29.318 s * +46%
X264 HD Benchmark 4.0
Pass 1
Intel Core i9-14900K
i9-14900K, 3200 MHz
433.5 (424min - 434max) fps +15%
Intel Core Ultra 9 285K
Ultra 9 285K, 3200 MHz
422 (421min - 423max) fps +12%
Intel Core i9-13900K
i9-13900K, 3000 MHz
412 (410min - 417max) fps +10%
Intel Core i5-14600K
i5-14600K, 3500 MHz
411 (410min - 412max) fps +9%
AMD Ryzen 9 7950X3D
R9 7950X3D, 4200 MHz
392.5 (391min - 397max) fps +5%
AMD Ryzen 9 9950X
Ryzen 9 9950X, 4300 MHz
392 (392min - 393max) fps +4%
Intel Core Ultra 5 245K
Ultra 5 245K, 3600 MHz
388.5 (387min - 390max) fps +3%
Intel Core i5-13600K
i5-13600K, 3500 MHz
388 (386min - 388max) fps +3%
AMD Ryzen 9 7950X
R9 7950X, 4500 MHz
379.5 (378min - 385max) fps +1%
AMD Ryzen 9 7900X
R9 7900X, 4700 MHz
376 (369min - 378max) fps 0%
AMD Ryzen 7 9700X
Ryzen 7 9700X, 3800 MHz
376 (374min - 376max) fps 0%
AMD Ryzen 7 9800X3D
R7 9800X3D, 4700 MHz
375.5 (375min - 377max) fps
Intel Core i9-12900K
i9-12900K, 3200 MHz
368.5 (366min - 369max) fps -2%
AMD Ryzen 5 7600X
R5 7600X, 4700 MHz
367 (363min - 371max) fps -2%
AMD Ryzen 5 9600X
Ryzen 5 9600X, 3900 MHz
364 (361min - 367max) fps -3%
AMD Ryzen 7 7800X3D
R7 7800X3D, 4200 MHz
344 (339min - 346max) fps -8%
AMD Ryzen 9 5950X
R9 5950X, 3400 MHz
338.5 (337min - 340max) fps -10%
Intel Core i5-12600K
i5-12600K, 2800 MHz
333.5 (332min - 336max) fps -11%
Intel Core i5-13400
i5-13400, 2500 MHz
311 (310min - 312max) fps -17%
Intel Core i5-12400F
i5-12400F, 2500 MHz
252.5 (249min - 256max) fps -33%
Pass 2
Intel Core Ultra 9 285K
Ultra 9 285K, 3200 MHz
296.5 (296min - 298max) fps +46%
Intel Core i9-14900K
i9-14900K, 3200 MHz
286.5 (285min - 287max) fps +41%
AMD Ryzen 9 9950X
Ryzen 9 9950X, 4300 MHz
271 (271min - 272max) fps +33%
Intel Core i9-13900K
i9-13900K, 3000 MHz
267 (266min - 271max) fps +32%
AMD Ryzen 9 7950X
R9 7950X, 4500 MHz
266.5 (263min - 267max) fps +31%
AMD Ryzen 9 7950X3D
R9 7950X3D, 4200 MHz
265.5 (263min - 266max) fps +31%
AMD Ryzen 9 7900X
R9 7900X, 4700 MHz
241 (240min - 242max) fps +19%
AMD Ryzen 9 5950X
R9 5950X, 3400 MHz
221 (220min - 221max) fps +9%
Intel Core Ultra 5 245K
Ultra 5 245K, 3600 MHz
216.5 (215min - 217max) fps +7%
Intel Core i5-14600K
i5-14600K, 3500 MHz
209 (208min - 209max) fps +3%
Intel Core i9-12900K
i9-12900K, 3200 MHz
206 (206min - 206max) fps +1%
AMD Ryzen 7 9800X3D
R7 9800X3D, 4700 MHz
203 (202min - 203max) fps
Intel Core i5-13600K
i5-13600K, 3500 MHz
199 (198.5min - 199.4max) fps -2%
AMD Ryzen 7 9700X
Ryzen 7 9700X, 3800 MHz
176.05 (175.9min - 176.1max) fps -13%
AMD Ryzen 7 7800X3D
R7 7800X3D, 4200 MHz
169.25 (169.1min - 170max) fps -17%
AMD Ryzen 5 9600X
Ryzen 5 9600X, 3900 MHz
154 (153.4min - 154.3max) fps -24%
Intel Core i5-12600K
i5-12600K, 2800 MHz
148 (147min - 148max) fps -27%
AMD Ryzen 5 7600X
R5 7600X, 4700 MHz
147.8 (147.7min - 147.9max) fps -27%
Intel Core i5-13400
i5-13400, 2500 MHz
135.8 (135.7min - 135.9max) fps -33%
Intel Core i5-12400F
i5-12400F, 2500 MHz
101.35 (101.1min - 101.5max) fps -50%
WinRAR - Result
AMD Ryzen 9 7900X
R9 7900X, 4700 MHz
17225 KB/s +11%
AMD Ryzen 7 7800X3D
R7 7800X3D, 4200 MHz
16585 KB/s +6%
AMD Ryzen 9 7950X
R9 7950X, 4500 MHz
16351 KB/s +5%
AMD Ryzen 5 7600X
R5 7600X, 4700 MHz
16178 KB/s +4%
Intel Core i9-14900K
i9-14900K, 3200 MHz
16108 KB/s +3%
AMD Ryzen 9 7950X3D
R9 7950X3D, 4200 MHz
15779 KB/s +1%
AMD Ryzen 7 9800X3D
R7 9800X3D, 4700 MHz
15574 KB/s
Intel Core i9-13900K
i9-13900K, 3000 MHz
14836 KB/s -5%
AMD Ryzen 5 9600X
Ryzen 5 9600X, 3900 MHz
14819 KB/s -5%
AMD Ryzen 9 9950X
Ryzen 9 9950X, 4300 MHz
13778 KB/s -12%
AMD Ryzen 7 9700X
Ryzen 7 9700X, 3800 MHz
13549 KB/s -13%
Intel Core Ultra 9 285K
Ultra 9 285K, 3200 MHz
12599 KB/s -19%
AMD Ryzen 9 5950X
R9 5950X, 3400 MHz
12503 KB/s -20%
Intel Core i5-14600K
i5-14600K, 3500 MHz
11491 KB/s -26%
Intel Core i5-13600K
i5-13600K, 3500 MHz
10937 KB/s -30%
Intel Core i9-12900K
i9-12900K, 3200 MHz
10792 KB/s -31%
Intel Core Ultra 5 245K
Ultra 5 245K, 3600 MHz
10521 KB/s -32%
Intel Core i5-13400
i5-13400, 2500 MHz
7979 KB/s -49%
Intel Core i5-12400F
i5-12400F, 2500 MHz
7816 KB/s -50%
Intel Core i5-12600K
i5-12600K, 2800 MHz
6239 KB/s -60%
TrueCrypt
AES Mean 100MB
AMD Ryzen 9 9950X
Ryzen 9 9950X, 4300 MHz
32.4 GB/s +82%
AMD Ryzen 9 7950X
R9 7950X, 4500 MHz
30.7 GB/s +72%
Intel Core i9-13900K
i9-13900K, 3000 MHz
27 GB/s +52%
AMD Ryzen 9 5950X
R9 5950X, 3400 MHz
26.9 GB/s +51%
AMD Ryzen 9 7950X3D
R9 7950X3D, 4200 MHz
26.9 GB/s +51%
Intel Core i9-14900K
i9-14900K, 3200 MHz
26.7 GB/s +50%
Intel Core i5-14600K
i5-14600K, 3500 MHz
19.5 GB/s +10%
Intel Core i5-13600K
i5-13600K, 3500 MHz
18.8 GB/s +6%
Intel Core i9-12900K
i9-12900K, 3200 MHz
18.5 GB/s +4%
AMD Ryzen 7 9800X3D
R7 9800X3D, 4700 MHz
17.8 GB/s
Intel Core Ultra 5 245K
Ultra 5 245K, 3600 MHz
16.4 GB/s -8%
AMD Ryzen 7 9700X
Ryzen 7 9700X, 3800 MHz
16.1 GB/s -10%
Intel Core Ultra 9 285K
Ultra 9 285K, 3200 MHz
16 GB/s -10%
AMD Ryzen 7 7800X3D
R7 7800X3D, 4200 MHz
15.3 GB/s -14%
AMD Ryzen 9 7900X
R9 7900X, 4700 MHz
14.8 GB/s -17%
AMD Ryzen 5 9600X
Ryzen 5 9600X, 3900 MHz
13.4 GB/s -25%
AMD Ryzen 5 7600X
R5 7600X, 4700 MHz
13.2 GB/s -26%
Intel Core i5-12600K
i5-12600K, 2800 MHz
12.8 GB/s -28%
Intel Core i5-13400
i5-13400, 2500 MHz
11.8 GB/s -34%
Intel Core i5-12400F
i5-12400F, 2500 MHz
9.3 GB/s -48%
Twofish Mean 100MB
Intel Core i9-14900K
i9-14900K, 3200 MHz
5.8 GB/s +100%
AMD Ryzen 9 9950X
Ryzen 9 9950X, 4300 MHz
5.6 GB/s +93%
Intel Core i9-13900K
i9-13900K, 3000 MHz
5.4 GB/s +86%
Intel Core Ultra 9 285K
Ultra 9 285K, 3200 MHz
4.9 GB/s +69%
AMD Ryzen 9 7950X
R9 7950X, 4500 MHz
4.5 GB/s +55%
AMD Ryzen 9 7950X3D
R9 7950X3D, 4200 MHz
4.2 GB/s +45%
AMD Ryzen 9 5950X
R9 5950X, 3400 MHz
3.7 GB/s +28%
Intel Core i9-12900K
i9-12900K, 3200 MHz
3.7 GB/s +28%
Intel Core i5-14600K
i5-14600K, 3500 MHz
3.4 GB/s +17%
Intel Core i5-13600K
i5-13600K, 3500 MHz
3.1 GB/s +7%
Intel Core Ultra 5 245K
Ultra 5 245K, 3600 MHz
3 GB/s +3%
AMD Ryzen 7 9800X3D
R7 9800X3D, 4700 MHz
2.9 GB/s
AMD Ryzen 9 7900X
R9 7900X, 4700 MHz
2.8 GB/s -3%
AMD Ryzen 7 9700X
Ryzen 7 9700X, 3800 MHz
2.8 GB/s -3%
Intel Core i5-12600K
i5-12600K, 2800 MHz
2.2 GB/s -24%
AMD Ryzen 5 9600X
Ryzen 5 9600X, 3900 MHz
2.2 GB/s -24%
AMD Ryzen 7 7800X3D
R7 7800X3D, 4200 MHz
2.1 GB/s -28%
Intel Core i5-13400
i5-13400, 2500 MHz
2 GB/s -31%
AMD Ryzen 5 7600X
R5 7600X, 4700 MHz
1.8 GB/s -38%
Intel Core i5-12400F
i5-12400F, 2500 MHz
1.4 GB/s -52%
Serpent Mean 100MB
AMD Ryzen 9 9950X
Ryzen 9 9950X, 4300 MHz
3.4 GB/s +100%
Intel Core i9-13900K
i9-13900K, 3000 MHz
3 GB/s +76%
AMD Ryzen 9 7950X
R9 7950X, 4500 MHz
2.8 GB/s +65%
AMD Ryzen 9 7950X3D
R9 7950X3D, 4200 MHz
2.8 GB/s +65%
Intel Core i9-14900K
i9-14900K, 3200 MHz
2.8 GB/s +65%
AMD Ryzen 9 5950X
R9 5950X, 3400 MHz
2.4 GB/s +41%
Intel Core Ultra 9 285K
Ultra 9 285K, 3200 MHz
2.3 GB/s +35%
Intel Core i9-12900K
i9-12900K, 3200 MHz
1.9 GB/s +12%
Intel Core i5-14600K
i5-14600K, 3500 MHz
1.8 GB/s +6%
Intel Core i5-13600K
i5-13600K, 3500 MHz
1.7 GB/s 0%
AMD Ryzen 7 9700X
Ryzen 7 9700X, 3800 MHz
1.7 GB/s 0%
AMD Ryzen 7 9800X3D
R7 9800X3D, 4700 MHz
1.7 GB/s
AMD Ryzen 9 7900X
R9 7900X, 4700 MHz
1.5 GB/s -12%
Intel Core Ultra 5 245K
Ultra 5 245K, 3600 MHz
1.5 GB/s -12%
AMD Ryzen 5 9600X
Ryzen 5 9600X, 3900 MHz
1.4 GB/s -18%
Intel Core i5-12600K
i5-12600K, 2800 MHz
1.3 GB/s -24%
AMD Ryzen 7 7800X3D
R7 7800X3D, 4200 MHz
1.3 GB/s -24%
Intel Core i5-13400
i5-13400, 2500 MHz
1.2 GB/s -29%
AMD Ryzen 5 7600X
R5 7600X, 4700 MHz
1.1 GB/s -35%
Intel Core i5-12400F
i5-12400F, 2500 MHz
0.884 GB/s -48%
Geekbench 5.5
Multi-Core
Intel Core i9-14900K
i9-14900K, 3200 MHz
25867 Points +55%
Intel Core Ultra 9 285K
Ultra 9 285K, 3200 MHz
25740 Points +55%
AMD Ryzen 9 7950X
R9 7950X, 4500 MHz
24625 Points +48%
AMD Ryzen 9 7950X3D
R9 7950X3D, 4200 MHz
24343 Points +46%
Intel Core i9-13900K
i9-13900K, 3000 MHz
24157 Points +45%
AMD Ryzen 9 9950X
Ryzen 9 9950X, 4300 MHz
23982 Points +44%
AMD Ryzen 9 7900X
R9 7900X, 4700 MHz
19987 Points +20%
Intel Core i9-12900K
i9-12900K, 3200 MHz
17854 Points +7%
Intel Core Ultra 5 245K
Ultra 5 245K, 3600 MHz
17760 Points +7%
Intel Core i5-14600K
i5-14600K, 3500 MHz
17516 Points +5%
AMD Ryzen 9 5950X
R9 5950X, 3400 MHz
16891 Points +2%
Intel Core i5-13600K
i5-13600K, 3500 MHz
16651 Points 0%
AMD Ryzen 7 9800X3D
R7 9800X3D, 4700 MHz
16637 Points
AMD Ryzen 7 9700X
Ryzen 7 9700X, 3800 MHz
14613 Points -12%
AMD Ryzen 7 7800X3D
R7 7800X3D, 4200 MHz
14252 Points -14%
Intel Core i5-12600K
i5-12600K, 2800 MHz
12797 Points -23%
AMD Ryzen 5 9600X
Ryzen 5 9600X, 3900 MHz
12751 Points -23%
Intel Core i5-13400
i5-13400, 2500 MHz
12107 Points -27%
AMD Ryzen 5 7600X
R5 7600X, 4700 MHz
11917 Points -28%
Intel Core i5-12400F
i5-12400F, 2500 MHz
9517 Points -43%
Single-Core
AMD Ryzen 9 9950X
Ryzen 9 9950X, 4300 MHz
2559 Points +4%
AMD Ryzen 5 9600X
Ryzen 5 9600X, 3900 MHz
2523 Points +3%
AMD Ryzen 7 9700X
Ryzen 7 9700X, 3800 MHz
2507 Points +2%
AMD Ryzen 7 9800X3D
R7 9800X3D, 4700 MHz
2450 Points
Intel Core Ultra 9 285K
Ultra 9 285K, 3200 MHz
2366 Points -3%
AMD Ryzen 9 7950X
R9 7950X, 4500 MHz
2311 Points -6%
AMD Ryzen 9 7950X3D
R9 7950X3D, 4200 MHz
2311 Points -6%
Intel Core i9-13900K
i9-13900K, 3000 MHz
2290 Points -7%
AMD Ryzen 9 7900X
R9 7900X, 4700 MHz
2274 Points -7%
Intel Core i9-14900K
i9-14900K, 3200 MHz
2243 Points -8%
Intel Core Ultra 5 245K
Ultra 5 245K, 3600 MHz
2224 Points -9%
AMD Ryzen 5 7600X
R5 7600X, 4700 MHz
2205 Points -10%
Intel Core i9-12900K
i9-12900K, 3200 MHz
2042 Points -17%
AMD Ryzen 7 7800X3D
R7 7800X3D, 4200 MHz
2027 Points -17%
Intel Core i5-14600K
i5-14600K, 3500 MHz
2017 Points -18%
Intel Core i5-13600K
i5-13600K, 3500 MHz
1967 Points -20%
Intel Core i5-12600K
i5-12600K, 2800 MHz
1904 Points -22%
Intel Core i5-13400
i5-13400, 2500 MHz
1795 Points -27%
Intel Core i5-12400F
i5-12400F, 2500 MHz
1742 Points -29%
AMD Ryzen 9 5950X
R9 5950X, 3400 MHz
1682 Points -31%
Geekbench 5.0
5.0 Multi-Core
Intel Core Ultra 9 285K
Ultra 9 285K, 3200 MHz
25793 Points +54%
Intel Core i9-14900K
i9-14900K, 3200 MHz
25459 Points +52%
AMD Ryzen 9 7950X
R9 7950X, 4500 MHz
24479 Points +46%
Intel Core i9-13900K
i9-13900K, 3000 MHz
24021 Points +43%
AMD Ryzen 9 7950X3D
R9 7950X3D, 4200 MHz
23720 Points +41%
AMD Ryzen 9 9950X
Ryzen 9 9950X, 4300 MHz
23387 Points +39%
AMD Ryzen 9 7900X
R9 7900X, 4700 MHz
19975 Points +19%
Intel Core i9-12900K
i9-12900K, 3200 MHz
17959 Points +7%
Intel Core Ultra 5 245K
Ultra 5 245K, 3600 MHz
17938 Points +7%
Intel Core i5-14600K
i5-14600K, 3500 MHz
17374 Points +4%
AMD Ryzen 7 9800X3D
R7 9800X3D, 4700 MHz
16773 Points
Intel Core i5-13600K
i5-13600K, 3500 MHz
16635 Points -1%
AMD Ryzen 9 5950X
R9 5950X, 3400 MHz
16570 Points -1%
AMD Ryzen 7 9700X
Ryzen 7 9700X, 3800 MHz
14698 Points -12%
AMD Ryzen 7 7800X3D
R7 7800X3D, 4200 MHz
13888 Points -17%
Intel Core i5-12600K
i5-12600K, 2800 MHz
12746 Points -24%
AMD Ryzen 5 9600X
Ryzen 5 9600X, 3900 MHz
12556 Points -25%
AMD Ryzen 5 7600X
R5 7600X, 4700 MHz
11880 Points -29%
Intel Core i5-13400
i5-13400, 2500 MHz
11801 Points -30%
Intel Core i5-12400F
i5-12400F, 2500 MHz
9368 Points -44%
5.0 Single-Core
AMD Ryzen 9 9950X
Ryzen 9 9950X, 4300 MHz
2445 Points +6%
AMD Ryzen 7 9700X
Ryzen 7 9700X, 3800 MHz
2402 Points +4%
AMD Ryzen 5 9600X
Ryzen 5 9600X, 3900 MHz
2397 Points +3%
Intel Core Ultra 9 285K
Ultra 9 285K, 3200 MHz
2332 Points +1%
AMD Ryzen 7 9800X3D
R7 9800X3D, 4700 MHz
2316 Points
Intel Core i9-14900K
i9-14900K, 3200 MHz
2272 Points -2%
AMD Ryzen 9 7950X
R9 7950X, 4500 MHz
2222 Points -4%
Intel Core i9-13900K
i9-13900K, 3000 MHz
2214 Points -4%
AMD Ryzen 9 7900X
R9 7900X, 4700 MHz
2194 Points -5%
AMD Ryzen 9 7950X3D
R9 7950X3D, 4200 MHz
2183 Points -6%
Intel Core Ultra 5 245K
Ultra 5 245K, 3600 MHz
2180 Points -6%
AMD Ryzen 5 7600X
R5 7600X, 4700 MHz
2126 Points -8%
Intel Core i5-14600K
i5-14600K, 3500 MHz
2004 Points -13%
Intel Core i9-12900K
i9-12900K, 3200 MHz
1968 Points -15%
AMD Ryzen 7 7800X3D
R7 7800X3D, 4200 MHz
1938 Points -16%
Intel Core i5-13600K
i5-13600K, 3500 MHz
1931 Points -17%
Intel Core i5-12600K
i5-12600K, 2800 MHz
1821 Points -21%
Intel Core i5-13400
i5-13400, 2500 MHz
1706 Points -26%
AMD Ryzen 9 5950X
R9 5950X, 3400 MHz
1683 Points -27%
Intel Core i5-12400F
i5-12400F, 2500 MHz
1673 Points -28%
Geekbench 4.4
64 Bit Single-Core Score
AMD Ryzen 9 9950X
Ryzen 9 9950X, 4300 MHz
10016 Points +5%
Intel Core i9-14900K
i9-14900K, 3200 MHz
9890 Points +4%
AMD Ryzen 7 9700X
Ryzen 7 9700X, 3800 MHz
9801 Points +3%
Intel Core Ultra 9 285K
Ultra 9 285K, 3200 MHz
9791 Points +3%
AMD Ryzen 5 9600X
Ryzen 5 9600X, 3900 MHz
9757 Points +2%
Intel Core i9-13900K
i9-13900K, 3000 MHz
9598 Points +1%
AMD Ryzen 7 9800X3D
R7 9800X3D, 4700 MHz
9530 Points
AMD Ryzen 9 7950X
R9 7950X, 4500 MHz
9322 Points -2%
AMD Ryzen 9 7950X3D
R9 7950X3D, 4200 MHz
9240 Points -3%
AMD Ryzen 9 7900X
R9 7900X, 4700 MHz
9193 Points -4%
Intel Core Ultra 5 245K
Ultra 5 245K, 3600 MHz
9171 Points -4%
AMD Ryzen 7 7800X3D
R7 7800X3D, 4200 MHz
9097 Points -5%
AMD Ryzen 5 7600X
R5 7600X, 4700 MHz
8926 Points -6%
Intel Core i5-14600K
i5-14600K, 3500 MHz
8904 Points -7%
Intel Core i9-12900K
i9-12900K, 3200 MHz
8665 Points -9%
Intel Core i5-13600K
i5-13600K, 3500 MHz
8618 Points -10%
Intel Core i5-12600K
i5-12600K, 2800 MHz
8223 Points -14%
Intel Core i5-13400
i5-13400, 2500 MHz
7683 Points -19%
Intel Core i5-12400F
i5-12400F, 2500 MHz
7548 Points -21%
AMD Ryzen 9 5950X
R9 5950X, 3400 MHz
7216 Points -24%
64 Bit Multi-Core Score
AMD Ryzen 9 9950X
Ryzen 9 9950X, 4300 MHz
100326 Points +43%
Intel Core Ultra 9 285K
Ultra 9 285K, 3200 MHz
92188 Points +31%
AMD Ryzen 9 7950X
R9 7950X, 4500 MHz
89678 Points +27%
Intel Core i9-14900K
i9-14900K, 3200 MHz
89177 Points +27%
AMD Ryzen 9 7950X3D
R9 7950X3D, 4200 MHz
87922 Points +25%
Intel Core i9-13900K
i9-13900K, 3000 MHz
86695 Points +23%
AMD Ryzen 9 7900X
R9 7900X, 4700 MHz
74731 Points +6%
AMD Ryzen 7 9800X3D
R7 9800X3D, 4700 MHz
70343 Points
Intel Core Ultra 5 245K
Ultra 5 245K, 3600 MHz
65981 Points -6%
Intel Core i5-14600K
i5-14600K, 3500 MHz
64035 Points -9%
Intel Core i9-12900K
i9-12900K, 3200 MHz
63583 Points -10%
AMD Ryzen 9 5950X
R9 5950X, 3400 MHz
63233 Points -10%
Intel Core i5-13600K
i5-13600K, 3500 MHz
60407 Points -14%
AMD Ryzen 7 9700X
Ryzen 7 9700X, 3800 MHz
59594 Points -15%
AMD Ryzen 7 7800X3D
R7 7800X3D, 4200 MHz
54840 Points -22%
AMD Ryzen 5 9600X
Ryzen 5 9600X, 3900 MHz
51644 Points -27%
AMD Ryzen 5 7600X
R5 7600X, 4700 MHz
47407 Points -33%
Intel Core i5-12600K
i5-12600K, 2800 MHz
46557 Points -34%
Intel Core i5-13400
i5-13400, 2500 MHz
42509 Points -40%
Intel Core i5-12400F
i5-12400F, 2500 MHz
35098 Points -50%
3DMark 11 - 1280x720 Performance Physics
AMD Ryzen 7 9800X3D
R7 9800X3D, 4700 MHz
39622 Points
AMD Ryzen 9 9950X
Ryzen 9 9950X, 4300 MHz
38269 Points -3%
AMD Ryzen 9 7950X3D
R9 7950X3D, 4200 MHz
36991 Points -7%
AMD Ryzen 7 7800X3D
R7 7800X3D, 4200 MHz
35127 Points -11%
Intel Core i9-13900K
i9-13900K, 3000 MHz
32273 Points -19%
Intel Core i9-14900K
i9-14900K, 3200 MHz
32188 Points -19%
Intel Core i5-14600K
i5-14600K, 3500 MHz
31641 Points -20%
AMD Ryzen 7 9700X
Ryzen 7 9700X, 3800 MHz
30757 Points -22%
Intel Core i5-13600K
i5-13600K, 3500 MHz
30480 Points -23%
Intel Core Ultra 9 285K
Ultra 9 285K, 3200 MHz
28636 Points -28%
AMD Ryzen 9 7900X
R9 7900X, 4700 MHz
28618 Points -28%
AMD Ryzen 9 7950X
R9 7950X, 4500 MHz
28618 Points -28%
Intel Core i9-12900K
i9-12900K, 3200 MHz
28211 Points -29%
Intel Core Ultra 5 245K
Ultra 5 245K, 3600 MHz
27022 Points -32%
AMD Ryzen 5 9600X
Ryzen 5 9600X, 3900 MHz
25717 Points -35%
AMD Ryzen 5 7600X
R5 7600X, 4700 MHz
25396 Points -36%
AMD Ryzen 9 5950X
R9 5950X, 3400 MHz
25367 Points -36%
Intel Core i5-12600K
i5-12600K, 2800 MHz
25017 Points -37%
Intel Core i5-13400
i5-13400, 2500 MHz
23120 Points -42%
Intel Core i5-12400F
i5-12400F, 2500 MHz
19436 Points -51%
7-Zip 18.03
7z b 4
AMD Ryzen 9 7950X
R9 7950X, 4500 MHz
161724 MIPS +79%
AMD Ryzen 9 9950X
Ryzen 9 9950X, 4300 MHz
160423 MIPS +78%
AMD Ryzen 9 7950X3D
R9 7950X3D, 4200 MHz
159341 MIPS +76%
Intel Core i9-14900K
i9-14900K, 3200 MHz
149570 MIPS +66%
Intel Core i9-13900K
i9-13900K, 3000 MHz
147068 MIPS +63%
Intel Core Ultra 9 285K
Ultra 9 285K, 3200 MHz
129542 MIPS +43%
AMD Ryzen 9 5950X
R9 5950X, 3400 MHz
127792 MIPS +41%
AMD Ryzen 9 7900X
R9 7900X, 4700 MHz
124975 MIPS +38%
Intel Core i9-12900K
i9-12900K, 3200 MHz
97671 MIPS +8%
Intel Core i5-14600K
i5-14600K, 3500 MHz
93235 MIPS +3%
AMD Ryzen 7 9800X3D
R7 9800X3D, 4700 MHz
90354 MIPS
Intel Core i5-13600K
i5-13600K, 3500 MHz
89647 MIPS -1%
AMD Ryzen 7 7800X3D
R7 7800X3D, 4200 MHz
85067 MIPS -6%
AMD Ryzen 7 9700X
Ryzen 7 9700X, 3800 MHz
82553 MIPS -9%
Intel Core Ultra 5 245K
Ultra 5 245K, 3600 MHz
77921 MIPS -14%
AMD Ryzen 5 7600X
R5 7600X, 4700 MHz
69291 MIPS -23%
AMD Ryzen 5 9600X
Ryzen 5 9600X, 3900 MHz
68220 MIPS -24%
Intel Core i5-12600K
i5-12600K, 2800 MHz
64260 MIPS -29%
Intel Core i5-13400
i5-13400, 2500 MHz
59510 MIPS -34%
Intel Core i5-12400F
i5-12400F, 2500 MHz
45043 MIPS -50%
7z b 4 -mmt1
AMD Ryzen 7 9800X3D
R7 9800X3D, 4700 MHz
8484 MIPS
AMD Ryzen 9 7950X
R9 7950X, 4500 MHz
8365 MIPS -1%
AMD Ryzen 9 7950X3D
R9 7950X3D, 4200 MHz
8321 MIPS -2%
AMD Ryzen 9 7900X
R9 7900X, 4700 MHz
8282 MIPS -2%
AMD Ryzen 7 7800X3D
R7 7800X3D, 4200 MHz
8235 MIPS -3%
AMD Ryzen 5 7600X
R5 7600X, 4700 MHz
8063 MIPS -5%
AMD Ryzen 7 9700X
Ryzen 7 9700X, 3800 MHz
7894 MIPS -7%
AMD Ryzen 9 9950X
Ryzen 9 9950X, 4300 MHz
7852 MIPS -7%
AMD Ryzen 5 9600X
Ryzen 5 9600X, 3900 MHz
7796 MIPS -8%
Intel Core i9-14900K
i9-14900K, 3200 MHz
7772 MIPS -8%
Intel Core Ultra 9 285K
Ultra 9 285K, 3200 MHz
7288 MIPS -14%
Intel Core i9-13900K
i9-13900K, 3000 MHz
7272 MIPS -14%
AMD Ryzen 9 5950X
R9 5950X, 3400 MHz
6974 MIPS -18%
Intel Core i5-14600K
i5-14600K, 3500 MHz
6910 MIPS -19%
Intel Core i9-12900K
i9-12900K, 3200 MHz
6571 MIPS -23%
Intel Core i5-13600K
i5-13600K, 3500 MHz
6502 MIPS -23%
Intel Core Ultra 5 245K
Ultra 5 245K, 3600 MHz
6477 MIPS -24%
Intel Core i5-12600K
i5-12600K, 2800 MHz
5944 MIPS -30%
Intel Core i5-13400
i5-13400, 2500 MHz
5829 MIPS -31%
Intel Core i5-12400F
i5-12400F, 2500 MHz
5476 MIPS -35%
HWBOT x265 Benchmark v2.2 - 4k Preset
AMD Ryzen 9 9950X
Ryzen 9 9950X, 4300 MHz
45.1 fps +47%
Intel Core Ultra 9 285K
Ultra 9 285K, 3200 MHz
45 fps +47%
AMD Ryzen 9 7950X
R9 7950X, 4500 MHz
44.4 fps +45%
Intel Core i9-14900K
i9-14900K, 3200 MHz
42.8 fps +40%
Intel Core i9-13900K
i9-13900K, 3000 MHz
42.6 fps +39%
AMD Ryzen 9 7950X3D
R9 7950X3D, 4200 MHz
42.4 fps +39%
AMD Ryzen 9 7900X
R9 7900X, 4700 MHz
36.2 fps +18%
AMD Ryzen 9 5950X
R9 5950X, 3400 MHz
31.8 fps +4%
AMD Ryzen 7 9800X3D
R7 9800X3D, 4700 MHz
30.6 fps
Intel Core i5-12600K
i5-12600K, 2800 MHz
30.1 fps -2%
Intel Core i9-12900K
i9-12900K, 3200 MHz
30 fps -2%
Intel Core Ultra 5 245K
Ultra 5 245K, 3600 MHz
29.6 fps -3%
Intel Core i5-14600K
i5-14600K, 3500 MHz
28.6 fps -7%
Intel Core i5-13600K
i5-13600K, 3500 MHz
27.6 fps -10%
AMD Ryzen 7 9700X
Ryzen 7 9700X, 3800 MHz
26.4 fps -14%
AMD Ryzen 7 7800X3D
R7 7800X3D, 4200 MHz
24.4 fps -20%
AMD Ryzen 5 9600X
Ryzen 5 9600X, 3900 MHz
23.2 fps -24%
AMD Ryzen 5 7600X
R5 7600X, 4700 MHz
21.1 fps -31%
Intel Core i5-13400
i5-13400, 2500 MHz
19.1 fps -38%
Intel Core i5-12400F
i5-12400F, 2500 MHz
15.2 fps -50%
R Benchmark 2.5 - Overall mean
Intel Core i5-12400F
i5-12400F, 2500 MHz
0.4837 sec * -40%
Intel Core i5-13400
i5-13400, 2500 MHz
0.4654 sec * -34%
AMD Ryzen 9 5950X
R9 5950X, 3400 MHz
0.4556 sec * -32%
Intel Core i5-12600K
i5-12600K, 2800 MHz
0.4456 sec * -29%
Intel Core i9-12900K
i9-12900K, 3200 MHz
0.4216 sec * -22%
AMD Ryzen 7 7800X3D
R7 7800X3D, 4200 MHz
0.4152 sec * -20%
Intel Core Ultra 5 245K
Ultra 5 245K, 3600 MHz
0.4086 sec * -18%
Intel Core Ultra 5 245K
Ultra 5 245K, 3600 MHz
0.4058 sec * -17%
Intel Core i5-13600K
i5-13600K, 3500 MHz
0.405 sec * -17%
Intel Core i5-14600K
i5-14600K, 3500 MHz
0.3937 sec * -14%
Intel Core Ultra 9 285K
Ultra 9 285K, 3200 MHz
0.3833 sec * -11%
AMD Ryzen 5 7600X
R5 7600X, 4700 MHz
0.3749 sec * -8%
AMD Ryzen 9 7900X
R9 7900X, 4700 MHz
0.3736 sec * -8%
AMD Ryzen 9 7950X3D
R9 7950X3D, 4200 MHz
0.372 sec * -7%
AMD Ryzen 9 7950X
R9 7950X, 4500 MHz
0.3682 sec * -6%
Intel Core i9-13900K
i9-13900K, 3000 MHz
0.3539 sec * -2%
AMD Ryzen 7 9800X3D
R7 9800X3D, 4700 MHz
0.3461 sec *
Intel Core i9-14900K
i9-14900K, 3200 MHz
0.345 sec * -0%
AMD Ryzen 7 9700X
Ryzen 7 9700X, 3800 MHz
0.3414 sec * +1%
AMD Ryzen 5 9600X
Ryzen 5 9600X, 3900 MHz
0.3389 sec * +2%
AMD Ryzen 9 9950X
Ryzen 9 9950X, 4300 MHz
0.3307 sec * +4%
LibreOffice - 20 Documents To PDF
Intel Core i5-12600K
i5-12600K, 2800 MHz
71.8 s * -54%
AMD Ryzen 7 9800X3D
R7 9800X3D, 4700 MHz
46.6 s *
Intel Core i5-12400F
i5-12400F, 2500 MHz
46.5 s * -0%
AMD Ryzen 5 9600X
Ryzen 5 9600X, 3900 MHz
46.4 s * -0%
AMD Ryzen 9 5950X
R9 5950X, 3400 MHz
45.97 s * +1%
AMD Ryzen 9 9950X
Ryzen 9 9950X, 4300 MHz
45.1 s * +3%
AMD Ryzen 7 9700X
Ryzen 7 9700X, 3800 MHz
43.8 s * +6%
Intel Core Ultra 5 245K
Ultra 5 245K, 3600 MHz
43.1 s * +8%
Intel Core Ultra 5 245K
Ultra 5 245K, 3600 MHz
39.3 s * +16%
AMD Ryzen 7 7800X3D
R7 7800X3D, 4200 MHz
40.7 s * +13%
Intel Core i9-12900K
i9-12900K, 3200 MHz
40.6 s * +13%
Intel Core i5-13400
i5-13400, 2500 MHz
38.7 s * +17%
AMD Ryzen 9 7950X3D
R9 7950X3D, 4200 MHz
38.6 s * +17%
AMD Ryzen 5 7600X
R5 7600X, 4700 MHz
36.8 s * +21%
Intel Core i9-13900K
i9-13900K, 3000 MHz
36.6 s * +21%
Intel Core Ultra 9 285K
Ultra 9 285K, 3200 MHz
36.2 s * +22%
AMD Ryzen 9 7950X
R9 7950X, 4500 MHz
35.5 s * +24%
Intel Core i5-13600K
i5-13600K, 3500 MHz
35 s * +25%
AMD Ryzen 9 7900X
R9 7900X, 4700 MHz
34.9 s * +25%
Intel Core i9-14900K
i9-14900K, 3200 MHz
32.5 s * +30%
Intel Core i5-14600K
i5-14600K, 3500 MHz
31.9 s * +32%
WebXPRT 3 - Overall
AMD Ryzen 9 9950X
Ryzen 9 9950X, 4300 MHz
409 Points +16%
AMD Ryzen 7 9700X
Ryzen 7 9700X, 3800 MHz
398 Points +13%
AMD Ryzen 9 7950X3D
R9 7950X3D, 4200 MHz
383 Points +8%
Intel Core i9-14900K
i9-14900K, 3200 MHz
382 Points +8%
Intel Core Ultra 9 285K
Ultra 9 285K, 3200 MHz
377 Points +7%
AMD Ryzen 9 7900X
R9 7900X, 4700 MHz
371 Points +5%
AMD Ryzen 9 7950X
R9 7950X, 4500 MHz
366 Points +4%
AMD Ryzen 5 9600X
Ryzen 5 9600X, 3900 MHz
364 Points +3%
AMD Ryzen 5 7600X
R5 7600X, 4700 MHz
362 Points +3%
Intel Core i9-13900K
i9-13900K, 3000 MHz
361 Points +2%
Intel Core i5-14600K
i5-14600K, 3500 MHz
354 Points 0%
AMD Ryzen 7 7800X3D
R7 7800X3D, 4200 MHz
353 Points 0%
AMD Ryzen 7 9800X3D
R7 9800X3D, 4700 MHz
353 Points
Intel Core Ultra 5 245K
Ultra 5 245K, 3600 MHz
346 Points -2%
Intel Core i5-13600K
i5-13600K, 3500 MHz
333 Points -6%
Intel Core i9-12900K
i9-12900K, 3200 MHz
320 Points -9%
Intel Core i5-13400
i5-13400, 2500 MHz
306 Points -13%
Intel Core i5-12600K
i5-12600K, 2800 MHz
293 Points -17%
AMD Ryzen 9 5950X
R9 5950X, 3400 MHz
291 Points -18%
Intel Core i5-12400F
i5-12400F, 2500 MHz
272 Points -23%
Mozilla Kraken 1.1 - Total
Intel Core i5-12400F
i5-12400F, 2500 MHz
573 ms * -43%
AMD Ryzen 9 5950X
R9 5950X, 3400 MHz
558 ms * -39%
Intel Core i5-13400
i5-13400, 2500 MHz
535 ms * -33%
Intel Core i5-12600K
i5-12600K, 2800 MHz
511 ms * -27%
AMD Ryzen 7 7800X3D
R7 7800X3D, 4200 MHz
487 ms * -21%
Intel Core i9-12900K
i9-12900K, 3200 MHz
481 ms * -20%
Intel Core i5-13600K
i5-13600K, 3500 MHz
469 ms * -17%
Intel Core i5-14600K
i5-14600K, 3500 MHz
450 ms * -12%
AMD Ryzen 5 7600X
R5 7600X, 4700 MHz
441 ms * -10%
AMD Ryzen 9 7950X3D
R9 7950X3D, 4200 MHz
437 ms * -9%
AMD Ryzen 9 7950X
R9 7950X, 4500 MHz
433 ms * -8%
Intel Core i9-13900K
i9-13900K, 3000 MHz
432 ms * -8%
AMD Ryzen 9 7900X
R9 7900X, 4700 MHz
431 ms * -7%
Intel Core Ultra 5 245K
Ultra 5 245K, 3600 MHz
425 ms * -6%
Intel Core i9-14900K
i9-14900K, 3200 MHz
418 ms * -4%
AMD Ryzen 7 9800X3D
R7 9800X3D, 4700 MHz
401 ms *
Intel Core Ultra 9 285K
Ultra 9 285K, 3200 MHz
396 ms * +1%
AMD Ryzen 5 9600X
Ryzen 5 9600X, 3900 MHz
389 ms * +3%
AMD Ryzen 7 9700X
Ryzen 7 9700X, 3800 MHz
383 ms * +4%
AMD Ryzen 9 9950X
Ryzen 9 9950X, 4300 MHz
377 ms * +6%
3DMark
1920x1080 Fire Strike Physics
Intel Core i9-14900K
i9-14900K, 3200 MHz
56087 Points +41%
Intel Core i9-13900K
i9-13900K, 3000 MHz
53853 Points +35%
Intel Core Ultra 9 285K
Ultra 9 285K, 3200 MHz
53194 Points +33%
AMD Ryzen 9 9950X
Ryzen 9 9950X, 4300 MHz
49522 Points +24%
AMD Ryzen 9 7950X3D
R9 7950X3D, 4200 MHz
44787 Points +12%
AMD Ryzen 9 7900X
R9 7900X, 4700 MHz
42682 Points +7%
AMD Ryzen 9 7950X
R9 7950X, 4500 MHz
42682 Points +7%
Intel Core i5-14600K
i5-14600K, 3500 MHz
40164 Points +1%
AMD Ryzen 7 9800X3D
R7 9800X3D, 4700 MHz
39893 Points
AMD Ryzen 9 5950X
R9 5950X, 3400 MHz
39600 Points -1%
Intel Core i9-12900K
i9-12900K, 3200 MHz
39112 Points -2%
Intel Core Ultra 5 245K
Ultra 5 245K, 3600 MHz
38202 Points -4%
AMD Ryzen 7 9700X
Ryzen 7 9700X, 3800 MHz
38088 Points -5%
Intel Core i5-13600K
i5-13600K, 3500 MHz
35386 Points -11%
AMD Ryzen 5 9600X
Ryzen 5 9600X, 3900 MHz
33462 Points -16%
AMD Ryzen 7 7800X3D
R7 7800X3D, 4200 MHz
33345 Points -16%
AMD Ryzen 5 7600X
R5 7600X, 4700 MHz
30691 Points -23%
Intel Core i5-12600K
i5-12600K, 2800 MHz
29671 Points -26%
Intel Core i5-13400
i5-13400, 2500 MHz
27135 Points -32%
Intel Core i5-12400F
i5-12400F, 2500 MHz
24023 Points -40%
2560x1440 Time Spy CPU
Intel Core i9-14900K
i9-14900K, 3200 MHz
23721 Points +47%
Intel Core i9-13900K
i9-13900K, 3000 MHz
19392 Points +20%
Intel Core i5-14600K
i5-14600K, 3500 MHz
18768 Points +16%
Intel Core i9-12900K
i9-12900K, 3200 MHz
18431 Points +14%
Intel Core Ultra 9 285K
Ultra 9 285K, 3200 MHz
17911 Points +11%
AMD Ryzen 9 7950X3D
R9 7950X3D, 4200 MHz
17206 Points +6%
Intel Core i5-13600K
i5-13600K, 3500 MHz
17124 Points +6%
AMD Ryzen 9 7900X
R9 7900X, 4700 MHz
16616 Points +3%
AMD Ryzen 9 7950X
R9 7950X, 4500 MHz
16616 Points +3%
AMD Ryzen 7 9800X3D
R7 9800X3D, 4700 MHz
16159 Points
AMD Ryzen 9 9950X
Ryzen 9 9950X, 4300 MHz
16112 Points 0%
Intel Core Ultra 5 245K
Ultra 5 245K, 3600 MHz
15010 Points -7%
AMD Ryzen 7 9700X
Ryzen 7 9700X, 3800 MHz
14306 Points -11%
AMD Ryzen 7 7800X3D
R7 7800X3D, 4200 MHz
14098 Points -13%
Intel Core i5-12600K
i5-12600K, 2800 MHz
13869 Points -14%
AMD Ryzen 9 5950X
R9 5950X, 3400 MHz
13650 Points -16%
Intel Core i5-13400
i5-13400, 2500 MHz
12948 Points -20%
AMD Ryzen 5 9600X
Ryzen 5 9600X, 3900 MHz
10821 Points -33%
AMD Ryzen 5 7600X
R5 7600X, 4700 MHz
10458 Points -35%
Intel Core i5-12400F
i5-12400F, 2500 MHz
9745 Points -40%
Super Pi mod 1.5 XS 1M - 1M
Intel Core i5-12400F
i5-12400F, 2500 MHz
8.298 s * -4%
Intel Core i5-13400
i5-13400, 2500 MHz
8.033 s * -0%
AMD Ryzen 7 9800X3D
R7 9800X3D, 4700 MHz
8.005 s *
AMD Ryzen 5 9600X
Ryzen 5 9600X, 3900 MHz
7.614 s * +5%
AMD Ryzen 7 9700X
Ryzen 7 9700X, 3800 MHz
7.54 s * +6%
AMD Ryzen 5 7600X
R5 7600X, 4700 MHz
7.423 s * +7%
Intel Core i5-12600K
i5-12600K, 2800 MHz
7.406 s * +7%
AMD Ryzen 9 9950X
Ryzen 9 9950X, 4300 MHz
7.31 s * +9%
Intel Core Ultra 5 245K
Ultra 5 245K, 3600 MHz
7.303 s * +9%
AMD Ryzen 7 7800X3D
R7 7800X3D, 4200 MHz
7.089 s * +11%
AMD Ryzen 9 5950X
R9 5950X, 3400 MHz
7.065 s * +12%
Intel Core i9-12900K
i9-12900K, 3200 MHz
7.063 s * +12%
Intel Core Ultra 9 285K
Ultra 9 285K, 3200 MHz
6.713 s * +16%
Intel Core i5-13600K
i5-13600K, 3500 MHz
6.58 s * +18%
Intel Core i5-14600K
i5-14600K, 3500 MHz
6.234 s * +22%
AMD Ryzen 9 7900X
R9 7900X, 4700 MHz
6.141 s * +23%
AMD Ryzen 9 7950X3D
R9 7950X3D, 4200 MHz
6.109 s * +24%
AMD Ryzen 9 7950X
R9 7950X, 4500 MHz
6.088 s * +24%
Intel Core i9-13900K
i9-13900K, 3000 MHz
5.655 s * +29%
Intel Core i9-14900K
i9-14900K, 3200 MHz
5.476 s * +32%
Super Pi mod 1.5 XS 2M - 2M
Intel Core i5-12400F
i5-12400F, 2500 MHz
18.473 s * -8%
Intel Core i5-13400
i5-13400, 2500 MHz
17.963 s * -5%
AMD Ryzen 7 9800X3D
R7 9800X3D, 4700 MHz
17.086 s *
Intel Core i5-12600K
i5-12600K, 2800 MHz
16.42 s * +4%
AMD Ryzen 5 9600X
Ryzen 5 9600X, 3900 MHz
16.363 s * +4%
AMD Ryzen 7 9700X
Ryzen 7 9700X, 3800 MHz
16.1 s * +6%
Intel Core Ultra 5 245K
Ultra 5 245K, 3600 MHz
16.026 s * +6%
AMD Ryzen 5 7600X
R5 7600X, 4700 MHz
15.954 s * +7%
AMD Ryzen 9 9950X
Ryzen 9 9950X, 4300 MHz
15.61 s * +9%
Intel Core i9-12900K
i9-12900K, 3200 MHz
15.59 s * +9%
AMD Ryzen 7 7800X3D
R7 7800X3D, 4200 MHz
15.335 s * +10%
AMD Ryzen 9 5950X
R9 5950X, 3400 MHz
15.28 s * +11%
Intel Core i5-13600K
i5-13600K, 3500 MHz
14.876 s * +13%
Intel Core Ultra 9 285K
Ultra 9 285K, 3200 MHz
14.64 s * +14%
Intel Core i5-14600K
i5-14600K, 3500 MHz
13.657 s * +20%
AMD Ryzen 9 7950X
R9 7950X, 4500 MHz
13.291 s * +22%
AMD Ryzen 9 7900X
R9 7900X, 4700 MHz
13.251 s * +22%
Intel Core i9-13900K
i9-13900K, 3000 MHz
13.193 s * +23%
AMD Ryzen 9 7950X3D
R9 7950X3D, 4200 MHz
13.189 s * +23%
Intel Core i9-14900K
i9-14900K, 3200 MHz
11.996 s * +30%

* ... Meglio usare valori piccoli

AMD Ryzen 7 9800X3D durante il Multi-Loop di Cinebench

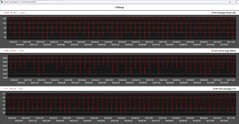
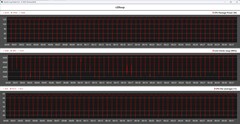
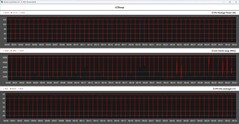
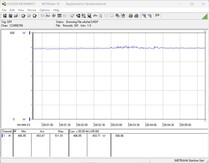
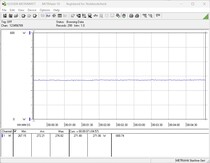
L'AMD Ryzen 7 9800X3D ha padroneggiato il ciclo continuo di Cinebench R15 senza subire alcun calo visibile delle prestazioni. I picchi di carico di poco meno di 126 watt sono stati presenti solo per un breve periodo. In media, circa 105 watt sono stati sufficienti per il processore su 50 cicli. I test di carico con Cinebench R20 e Cinebench R23 hanno rivelato un risultato altrettanto stabile. Il consumo energetico del processore è stato solo leggermente superiore, con un massimo di 130 watt. Non abbiamo notato problemi di temperatura in nessun momento.

Metriche della CPU durante il ciclo di Cinebench R15
Metriche della CPU durante il ciclo di Cinebench R20
Metriche della CPU durante il ciclo di Cinebench R23
258727872987318733873587378739874187438745874787498751875387558757875987Tooltip
AMD Ryzen 7 9800X3D R7 9800X3D: Ø3592 (3442.34-3617.29)
AMD Ryzen 7 7800X3D R7 7800X3D: Ø2967 (2917.15-3006.39)
Palit GeForce RTX 4090 GameRock OC i9-14900K: Ø6068 (5924.17-6110.6)
Intel Core i5-14600K i5-14600K: Ø3640 (3622.86-3654.64)
AMD Ryzen 5 9600X Ryzen 5 9600X: Ø2623 (2586.99-2654.28)
Intel Core Ultra 5 245K Ultra 5 245K: Ø3788 (3746.72-3821.53)

Benchmark sintetici e prestazioni delle applicazioni

L'AMD Ryzen 7 9800X3D si comporta in modo brillante durante l'uso quotidiano. Tuttavia, le prestazioni di tutti i processori elencati nel confronto sono così elevate che praticamente nessun modello è vittima di gravi errori. In tutti i test, il AMD Ryzen 7 7800X3Dè stato superato nelle prestazioni. Tuttavia, i due concorrenti sono stati separati solo da pochi punti percentuali, il che significa che l'AMD Ryzen 7 9800X3D purtroppo non è in grado di fornire un guadagno notevole in termini di prestazioni.

PCMark 10 - Score
AMD Ryzen 9 9950X
10699 Points +7%
Intel Core Ultra 9 285K
10443 Points +4%
Intel Core i9-14900K
10101 Points +1%
AMD Ryzen 5 9600X
10060 Points +1%
AMD Ryzen 7 9800X3D
10007 Points
AMD Ryzen 9 7900X
9911 Points -1%
AMD Ryzen 9 7950X
9911 Points -1%
Intel Core i9-13900K
9788 Points -2%
Intel Core i5-14600K
9587 Points -4%
AMD Ryzen 7 7800X3D
9500 Points -5%
AMD Ryzen 5 7600X
9470 Points -5%
Intel Core Ultra 5 245K
9409 Points -6%
Intel Core i5-13600K
9362 Points -6%
AMD Ryzen 9 5950X
8778 Points -12%
Intel Core i5-13400
8614 Points -14%
Intel Core i9-12900K
8604 Points -14%
Intel Core i5-12600K
8259 Points -17%
Intel Core i5-12400F
7756 Points -22%
CrossMark - Overall
Intel Core i9-14900K
2611 Points +11%
Intel Core i9-13900K
2589 Points +10%
Intel Core Ultra 9 285K
2533 Points +8%
AMD Ryzen 9 7950X
2512 Points +7%
AMD Ryzen 9 9950X
2451 Points +4%
AMD Ryzen 9 7900X
2405 Points +2%
AMD Ryzen 7 9800X3D
2347 Points
Intel Core i5-14600K
2310 Points -2%
Intel Core i5-13600K
2271 Points -3%
Intel Core Ultra 5 245K
2245 Points -4%
AMD Ryzen 5 7600X
2236 Points -5%
AMD Ryzen 7 7800X3D
2216 Points -6%
AMD Ryzen 9 7950X3D
2193 Points -7%
AMD Ryzen 5 9600X
2103 Points -10%
Intel Core i5-13400
1877 Points -20%
Intel Core i5-12400F
1762 Points -25%
AMD Ryzen 9 5950X
1495 Points -36%
Blender
v2.79 BMW27 CPU
Intel Core i5-12400F
269 Seconds * -96%
Intel Core i5-13400
206 Seconds * -50%
AMD Ryzen 5 7600X
203 Seconds * -48%
Intel Core i5-12600K
189.5 Seconds * -38%
AMD Ryzen 5 9600X
184 Seconds * -34%
AMD Ryzen 7 7800X3D
169 Seconds * -23%
AMD Ryzen 7 9800X3D
137 Seconds *
Intel Core Ultra 5 245K
136 Seconds * +1%
Intel Core i5-13600K
135 Seconds * +1%
Intel Core i5-14600K
134 Seconds * +2%
Intel Core i9-12900K
121.1 Seconds * +12%
AMD Ryzen 9 5950X
112.8 Seconds * +18%
AMD Ryzen 9 7900X
106 Seconds * +23%
AMD Ryzen 9 7950X3D
86 Seconds * +37%
AMD Ryzen 9 7950X
85 Seconds * +38%
Intel Core i9-13900K
80 Seconds * +42%
Intel Core i9-14900K
80 Seconds * +42%
Intel Core Ultra 9 285K
79 Seconds * +42%
AMD Ryzen 9 9950X
77 Seconds * +44%
v3.3 Classroom CPU
Intel Core i5-12400F
430 Seconds * -111%
Intel Core i5-13400
336 Seconds * -65%
AMD Ryzen 5 9600X
289 Seconds * -42%
AMD Ryzen 7 7800X3D
266 Seconds * -30%
Intel Core i5-13600K
224 Seconds * -10%
Intel Core i5-14600K
223 Seconds * -9%
Intel Core Ultra 5 245K
216 Seconds * -6%
AMD Ryzen 7 9800X3D
204 Seconds *
Intel Core i9-13900K
138 Seconds * +32%
Intel Core i9-14900K
135 Seconds * +34%
AMD Ryzen 9 7950X3D
133 Seconds * +35%
Intel Core Ultra 9 285K
124 Seconds * +39%
AMD Ryzen 9 9950X
118 Seconds * +42%

* ... Meglio usare valori piccoli
Performance Rating - Percent
AMD Ryzen 7 9800X3D
NVIDIA GeForce RTX 4090
98.5 pt
AMD Ryzen 5 9600X
NVIDIA GeForce RTX 4090
97.6 pt
Intel Core i9-14900K
NVIDIA GeForce RTX 4090
96.6 pt
Intel Core i5-14600K
NVIDIA GeForce RTX 4090
95.9 pt
Intel Core i7-13700K
NVIDIA GeForce RTX 4090
95.3 pt
AMD Ryzen 9 7950X3D
NVIDIA GeForce RTX 4090
94.8 pt
AMD Ryzen 9 7950X
NVIDIA GeForce RTX 4090
94.8 pt
AMD Ryzen 7 7800X3D
NVIDIA GeForce RTX 4090
94.7 pt
Intel Core i7-13700
NVIDIA GeForce RTX 4090
94.4 pt
Intel Core Ultra 9 285K
NVIDIA GeForce RTX 4090
90.8 pt
Intel Core i7-12700
NVIDIA GeForce RTX 4090
90.7 pt
Intel Core Ultra 5 245K
NVIDIA GeForce RTX 4090
90.5 pt
Intel Core i5-13400
NVIDIA GeForce RTX 4090
88.5 pt
3DMark 11 - 1280x720 Performance GPU
AMD Ryzen 7 7800X3D
NVIDIA GeForce RTX 4090
114641 Points 0%
AMD Ryzen 7 9800X3D
NVIDIA GeForce RTX 4090
114294 Points
Intel Core i5-14600K
NVIDIA GeForce RTX 4090
110994 Points -3%
AMD Ryzen 9 7950X
NVIDIA GeForce RTX 4090
107723 Points -6%
Intel Core i7-13700K
NVIDIA GeForce RTX 4090
107060 Points -6%
AMD Ryzen 9 7950X3D
NVIDIA GeForce RTX 4090
105886 Points -7%
Intel Core i7-13700
NVIDIA GeForce RTX 4090
105473 Points -8%
Intel Core i9-14900K
NVIDIA GeForce RTX 4090
104998 Points -8%
Intel Core i7-12700
NVIDIA GeForce RTX 4090
104876 Points -8%
Intel Core Ultra 5 245K
NVIDIA GeForce RTX 4090
104781 Points -8%
Intel Core i5-13400
NVIDIA GeForce RTX 4090
104598 Points -8%
AMD Ryzen 5 9600X
NVIDIA GeForce RTX 4090
104516 Points -9%
Intel Core Ultra 9 285K
NVIDIA GeForce RTX 4090
97005 Points -15%
3DMark
2560x1440 Time Spy Graphics
Intel Core i5-14600K
NVIDIA GeForce RTX 4090
37769 Points +2%
Intel Core i9-14900K
NVIDIA GeForce RTX 4090
37762 Points +2%
AMD Ryzen 7 7800X3D
NVIDIA GeForce RTX 4090
37664 Points +1%
AMD Ryzen 5 9600X
NVIDIA GeForce RTX 4090
37161 Points 0%
AMD Ryzen 7 9800X3D
NVIDIA GeForce RTX 4090
37130 Points
Intel Core i7-13700K
NVIDIA GeForce RTX 4090
37109 Points 0%
Intel Core i7-13700
NVIDIA GeForce RTX 4090
37106 Points 0%
AMD Ryzen 9 7950X
NVIDIA GeForce RTX 4090
36836 Points -1%
Intel Core Ultra 5 245K
NVIDIA GeForce RTX 4090
36813 Points -1%
AMD Ryzen 9 7950X3D
NVIDIA GeForce RTX 4090
36665 Points -1%
Intel Core Ultra 9 285K
NVIDIA GeForce RTX 4090
36172 Points -3%
Intel Core i7-12700
NVIDIA GeForce RTX 4090
34580 Points -7%
Intel Core i5-13400
NVIDIA GeForce RTX 4090
33624 Points -9%
1920x1080 Fire Strike Graphics
Intel Core i5-14600K
NVIDIA GeForce RTX 4090
86031 Points 0%
AMD Ryzen 7 9800X3D
NVIDIA GeForce RTX 4090
85646 Points
Intel Core i7-12700
NVIDIA GeForce RTX 4090
79398 Points -7%
Intel Core i7-13700K
NVIDIA GeForce RTX 4090
79091 Points -8%
Intel Core i7-13700
NVIDIA GeForce RTX 4090
78878 Points -8%
AMD Ryzen 5 9600X
NVIDIA GeForce RTX 4090
78579 Points -8%
Intel Core Ultra 5 245K
NVIDIA GeForce RTX 4090
78079 Points -9%
Intel Core i5-13400
NVIDIA GeForce RTX 4090
77224 Points -10%
AMD Ryzen 7 7800X3D
NVIDIA GeForce RTX 4090
73447 Points -14%
AMD Ryzen 9 7950X3D
NVIDIA GeForce RTX 4090
72901 Points -15%
AMD Ryzen 9 7950X
NVIDIA GeForce RTX 4090
72678 Points -15%
Intel Core i9-14900K
NVIDIA GeForce RTX 4090
70971 Points -17%
Intel Core Ultra 9 285K
NVIDIA GeForce RTX 4090
55924 Points -35%
3840x2160 Fire Strike Ultra Graphics
AMD Ryzen 7 7800X3D
NVIDIA GeForce RTX 4090
25571 Points +2%
Intel Core i5-14600K
NVIDIA GeForce RTX 4090
25342 Points +1%
Intel Core i7-13700
NVIDIA GeForce RTX 4090
25254 Points +1%
Intel Core i9-14900K
NVIDIA GeForce RTX 4090
25209 Points +1%
Intel Core i7-13700K
NVIDIA GeForce RTX 4090
25187 Points +1%
Intel Core Ultra 5 245K
NVIDIA GeForce RTX 4090
25088 Points 0%
AMD Ryzen 7 9800X3D
NVIDIA GeForce RTX 4090
25054 Points
Intel Core i5-13400
NVIDIA GeForce RTX 4090
25052 Points 0%
AMD Ryzen 9 7950X
NVIDIA GeForce RTX 4090
25018 Points 0%
AMD Ryzen 9 7950X3D
NVIDIA GeForce RTX 4090
24969 Points 0%
AMD Ryzen 5 9600X
NVIDIA GeForce RTX 4090
24915 Points -1%
Intel Core i7-12700
NVIDIA GeForce RTX 4090
24669 Points -2%
Intel Core Ultra 9 285K
NVIDIA GeForce RTX 4090
24376 Points -3%
Unigine Superposition
1280x720 720p Low
AMD Ryzen 7 9800X3D
NVIDIA GeForce RTX 4090
64942 Points
AMD Ryzen 5 9600X
NVIDIA GeForce RTX 4090
63603 Points -2%
Intel Core i9-14900K
NVIDIA GeForce RTX 4090
57174 Points -12%
AMD Ryzen 7 7800X3D
NVIDIA GeForce RTX 4090
56805 Points -13%
AMD Ryzen 9 7950X
NVIDIA GeForce RTX 4090
51741 Points -20%
Intel Core i7-13700K
NVIDIA GeForce RTX 4090
51443 Points -21%
AMD Ryzen 9 7950X3D
NVIDIA GeForce RTX 4090
50990 Points -21%
Intel Core i7-13700
NVIDIA GeForce RTX 4090
50107 Points -23%
Intel Core i5-14600K
NVIDIA GeForce RTX 4090
49203 Points -24%
Intel Core Ultra 9 285K
NVIDIA GeForce RTX 4090
44723 Points -31%
Intel Core i7-12700
NVIDIA GeForce RTX 4090
40758 Points -37%
Intel Core Ultra 5 245K
NVIDIA GeForce RTX 4090
40122 Points -38%
Intel Core i5-13400
NVIDIA GeForce RTX 4090
35207 Points -46%
1920x1080 1080p High
AMD Ryzen 7 9800X3D
NVIDIA GeForce RTX 4090
52446 Points
Intel Core i9-14900K
NVIDIA GeForce RTX 4090
50399 Points -4%
AMD Ryzen 5 9600X
NVIDIA GeForce RTX 4090
50230 Points -4%
AMD Ryzen 7 7800X3D
NVIDIA GeForce RTX 4090
49328 Points -6%
AMD Ryzen 9 7950X
NVIDIA GeForce RTX 4090
46814 Points -11%
Intel Core i7-13700K
NVIDIA GeForce RTX 4090
46385 Points -12%
AMD Ryzen 9 7950X3D
NVIDIA GeForce RTX 4090
46052 Points -12%
Intel Core i7-13700
NVIDIA GeForce RTX 4090
45368 Points -13%
Intel Core i5-14600K
NVIDIA GeForce RTX 4090
45162 Points -14%
Intel Core Ultra 9 285K
NVIDIA GeForce RTX 4090
41496 Points -21%
Intel Core i7-12700
NVIDIA GeForce RTX 4090
37819 Points -28%
Intel Core Ultra 5 245K
NVIDIA GeForce RTX 4090
36786 Points -30%
Intel Core i5-13400
NVIDIA GeForce RTX 4090
32711 Points -38%
1920x1080 1080p Extreme
AMD Ryzen 7 7800X3D
NVIDIA GeForce RTX 4090
22618 Points +4%
Intel Core Ultra 9 285K
NVIDIA GeForce RTX 4090
22319 Points +2%
Intel Core i5-14600K
NVIDIA GeForce RTX 4090
21954 Points 0%
Intel Core i9-14900K
NVIDIA GeForce RTX 4090
21920 Points 0%
AMD Ryzen 9 7950X3D
NVIDIA GeForce RTX 4090
21913 Points 0%
AMD Ryzen 7 9800X3D
NVIDIA GeForce RTX 4090
21845 Points
AMD Ryzen 9 7950X
NVIDIA GeForce RTX 4090
21824 Points 0%
Intel Core i7-13700
NVIDIA GeForce RTX 4090
21808 Points 0%
Intel Core i7-13700K
NVIDIA GeForce RTX 4090
21744 Points 0%
Intel Core Ultra 5 245K
NVIDIA GeForce RTX 4090
21706 Points -1%
Intel Core i5-13400
NVIDIA GeForce RTX 4090
21646 Points -1%
Intel Core i7-12700
NVIDIA GeForce RTX 4090
21615 Points -1%
AMD Ryzen 5 9600X
NVIDIA GeForce RTX 4090
21586 Points -1%
3840x2160 4k Optimized
AMD Ryzen 9 7950X
NVIDIA GeForce RTX 4090
33943 Points +1%
Intel Core i9-14900K
NVIDIA GeForce RTX 4090
33885 Points +1%
AMD Ryzen 9 7950X3D
NVIDIA GeForce RTX 4090
33883 Points +1%
Intel Core i7-13700
NVIDIA GeForce RTX 4090
33765 Points +1%
Intel Core i7-13700K
NVIDIA GeForce RTX 4090
33719 Points +1%
Intel Core i5-14600K
NVIDIA GeForce RTX 4090
33700 Points +1%
AMD Ryzen 7 7800X3D
NVIDIA GeForce RTX 4090
33601 Points 0%
AMD Ryzen 7 9800X3D
NVIDIA GeForce RTX 4090
33512 Points
AMD Ryzen 5 9600X
NVIDIA GeForce RTX 4090
33095 Points -1%
Intel Core Ultra 9 285K
NVIDIA GeForce RTX 4090
33051 Points -1%
Intel Core i7-12700
NVIDIA GeForce RTX 4090
32608 Points -3%
Intel Core Ultra 5 245K
NVIDIA GeForce RTX 4090
32169 Points -4%
Intel Core i5-13400
NVIDIA GeForce RTX 4090
30877 Points -8%
7680x4320 8k Optimized
AMD Ryzen 9 7950X3D
NVIDIA GeForce RTX 4090
13105 Points +3%
AMD Ryzen 9 7950X
NVIDIA GeForce RTX 4090
13082 Points +3%
Intel Core i7-13700
NVIDIA GeForce RTX 4090
13081 Points +3%
Intel Core i7-13700K
NVIDIA GeForce RTX 4090
13078 Points +3%
Intel Core i7-12700
NVIDIA GeForce RTX 4090
13070 Points +3%
Intel Core i5-13400
NVIDIA GeForce RTX 4090
13011 Points +2%
Intel Core i9-14900K
NVIDIA GeForce RTX 4090
12845 Points +1%
Intel Core i5-14600K
NVIDIA GeForce RTX 4090
12791 Points 0%
AMD Ryzen 7 7800X3D
NVIDIA GeForce RTX 4090
12770 Points 0%
AMD Ryzen 7 9800X3D
NVIDIA GeForce RTX 4090
12738 Points
Intel Core Ultra 5 245K
NVIDIA GeForce RTX 4090
12714 Points 0%
Intel Core Ultra 9 285K
NVIDIA GeForce RTX 4090
12705 Points 0%
AMD Ryzen 5 9600X
NVIDIA GeForce RTX 4090
12498 Points -2%
Unigine Valley 1.0
1920x1080 Extreme HD DirectX AA:x8
AMD Ryzen 5 9600X
NVIDIA GeForce RTX 4090
324 fps +5%
AMD Ryzen 7 9800X3D
NVIDIA GeForce RTX 4090
308.8 fps
Intel Core i9-14900K
NVIDIA GeForce RTX 4090
305.2 fps -1%
Intel Core i5-14600K
NVIDIA GeForce RTX 4090
283.4 fps -8%
AMD Ryzen 9 7950X3D
NVIDIA GeForce RTX 4090
277.2 fps -10%
Intel Core i7-13700K
NVIDIA GeForce RTX 4090
273.9 fps -11%
AMD Ryzen 9 7950X
NVIDIA GeForce RTX 4090
270.7 fps -12%
Intel Core i7-13700
NVIDIA GeForce RTX 4090
266.6 fps -14%
Intel Core Ultra 9 285K
NVIDIA GeForce RTX 4090
264 fps -15%
AMD Ryzen 7 7800X3D
NVIDIA GeForce RTX 4090
246.7 fps -20%
Intel Core Ultra 5 245K
NVIDIA GeForce RTX 4090
246.6 fps -20%
Intel Core i7-12700
NVIDIA GeForce RTX 4090
238.4 fps -23%
Intel Core i5-13400
NVIDIA GeForce RTX 4090
226.2 fps -27%
1920x1080 Extreme HD Preset OpenGL AA:x8
AMD Ryzen 5 9600X
NVIDIA GeForce RTX 4090
331.8 fps +4%
Intel Core i9-14900K
NVIDIA GeForce RTX 4090
322.2 fps +1%
AMD Ryzen 7 9800X3D
NVIDIA GeForce RTX 4090
317.9 fps
Intel Core i7-13700K
NVIDIA GeForce RTX 4090
305.7 fps -4%
Intel Core i5-14600K
NVIDIA GeForce RTX 4090
303.2 fps -5%
AMD Ryzen 9 7950X3D
NVIDIA GeForce RTX 4090
295.4 fps -7%
Intel Core i7-13700
NVIDIA GeForce RTX 4090
293.1 fps -8%
AMD Ryzen 9 7950X
NVIDIA GeForce RTX 4090
288 fps -9%
Intel Core Ultra 9 285K
NVIDIA GeForce RTX 4090
278.9 fps -12%
AMD Ryzen 7 7800X3D
NVIDIA GeForce RTX 4090
260.9 fps -18%
Intel Core Ultra 5 245K
NVIDIA GeForce RTX 4090
259.8 fps -18%
Intel Core i7-12700
NVIDIA GeForce RTX 4090
258.5 fps -19%
Intel Core i5-13400
NVIDIA GeForce RTX 4090
242.8 fps -24%
Unigine Heaven 4.0
Extreme Preset OpenGL
AMD Ryzen 7 9800X3D
NVIDIA GeForce RTX 4090
476.1 fps
AMD Ryzen 5 9600X
NVIDIA GeForce RTX 4090
472.4 fps -1%
Intel Core i9-14900K
NVIDIA GeForce RTX 4090
465.1 fps -2%
AMD Ryzen 9 7950X3D
NVIDIA GeForce RTX 4090
458.2 fps -4%
Intel Core i7-13700K
NVIDIA GeForce RTX 4090
456.9 fps -4%
Intel Core i5-14600K
NVIDIA GeForce RTX 4090
456.3 fps -4%
AMD Ryzen 9 7950X
NVIDIA GeForce RTX 4090
450.4 fps -5%
Intel Core i7-13700
NVIDIA GeForce RTX 4090
450.4 fps -5%
Intel Core Ultra 9 285K
NVIDIA GeForce RTX 4090
447.7 fps -6%
AMD Ryzen 7 7800X3D
NVIDIA GeForce RTX 4090
442.4 fps -7%
Intel Core i7-12700
NVIDIA GeForce RTX 4090
433.8 fps -9%
Intel Core Ultra 5 245K
NVIDIA GeForce RTX 4090
433.8 fps -9%
Intel Core i5-13400
NVIDIA GeForce RTX 4090
420 fps -12%
Extreme Preset DX11
AMD Ryzen 9 7950X3D
NVIDIA GeForce RTX 4090
492.5 fps +1%
AMD Ryzen 9 7950X
NVIDIA GeForce RTX 4090
491.5 fps 0%
AMD Ryzen 7 9800X3D
NVIDIA GeForce RTX 4090
489.5 fps
Intel Core i9-14900K
NVIDIA GeForce RTX 4090
483.7 fps -1%
AMD Ryzen 5 9600X
NVIDIA GeForce RTX 4090
473.9 fps -3%
Intel Core i7-13700K
NVIDIA GeForce RTX 4090
473.8 fps -3%
Intel Core i5-14600K
NVIDIA GeForce RTX 4090
473 fps -3%
AMD Ryzen 7 7800X3D
NVIDIA GeForce RTX 4090
463.8 fps -5%
Intel Core i7-13700
NVIDIA GeForce RTX 4090
462.5 fps -6%
Intel Core Ultra 9 285K
NVIDIA GeForce RTX 4090
462.4 fps -6%
Intel Core Ultra 5 245K
NVIDIA GeForce RTX 4090
440.5 fps -10%
Intel Core i7-12700
NVIDIA GeForce RTX 4090
435.2 fps -11%
Intel Core i5-13400
NVIDIA GeForce RTX 4090
416.6 fps -15%
ComputeMark v2.1
1024x600 Normal, Score
Intel Core i5-14600K
NVIDIA GeForce RTX 4090
92397 Points +1%
AMD Ryzen 5 9600X
NVIDIA GeForce RTX 4090
92222 Points +1%
AMD Ryzen 9 7950X
NVIDIA GeForce RTX 4090
92171 Points +1%
Intel Core i9-14900K
NVIDIA GeForce RTX 4090
92026 Points +1%
Intel Core i7-13700K
NVIDIA GeForce RTX 4090
92009 Points +1%
AMD Ryzen 9 7950X3D
NVIDIA GeForce RTX 4090
91838 Points 0%
Intel Core i7-12700
NVIDIA GeForce RTX 4090
91703 Points 0%
AMD Ryzen 7 7800X3D
NVIDIA GeForce RTX 4090
91665 Points 0%
Intel Core i5-13400
NVIDIA GeForce RTX 4090
91659 Points 0%
Intel Core i7-13700
NVIDIA GeForce RTX 4090
91616 Points 0%
AMD Ryzen 7 9800X3D
NVIDIA GeForce RTX 4090
91531 Points
Intel Core Ultra 9 285K
NVIDIA GeForce RTX 4090
90932 Points -1%
Intel Core Ultra 5 245K
NVIDIA GeForce RTX 4090
90595 Points -1%
1024x600 Normal, Fluid 3DTex
AMD Ryzen 7 7800X3D
NVIDIA GeForce RTX 4090
10875 Points +3%
Intel Core i7-13700K
NVIDIA GeForce RTX 4090
10805 Points +2%
Intel Core i5-14600K
NVIDIA GeForce RTX 4090
10797 Points +2%
AMD Ryzen 9 7950X3D
NVIDIA GeForce RTX 4090
10778 Points +2%
Intel Core i7-13700
NVIDIA GeForce RTX 4090
10759 Points +2%
Intel Core i5-13400
NVIDIA GeForce RTX 4090
10756 Points +2%
AMD Ryzen 5 9600X
NVIDIA GeForce RTX 4090
10756 Points +2%
Intel Core i7-12700
NVIDIA GeForce RTX 4090
10749 Points +1%
AMD Ryzen 9 7950X
NVIDIA GeForce RTX 4090
10724 Points +1%
Intel Core i9-14900K
NVIDIA GeForce RTX 4090
10715 Points +1%
AMD Ryzen 7 9800X3D
NVIDIA GeForce RTX 4090
10592 Points
Intel Core Ultra 9 285K
NVIDIA GeForce RTX 4090
10584 Points 0%
Intel Core Ultra 5 245K
NVIDIA GeForce RTX 4090
10396 Points -2%
1024x600 Normal, Fluid 2DTexArr
AMD Ryzen 5 9600X
NVIDIA GeForce RTX 4090
6948 Points 0%
Intel Core i9-14900K
NVIDIA GeForce RTX 4090
6940 Points 0%
Intel Core i5-14600K
NVIDIA GeForce RTX 4090
6920 Points 0%
AMD Ryzen 7 9800X3D
NVIDIA GeForce RTX 4090
6917 Points
Intel Core i7-13700K
NVIDIA GeForce RTX 4090
6914 Points 0%
Intel Core Ultra 9 285K
NVIDIA GeForce RTX 4090
6895 Points 0%
Intel Core Ultra 5 245K
NVIDIA GeForce RTX 4090
6892 Points 0%
AMD Ryzen 9 7950X
NVIDIA GeForce RTX 4090
6891 Points 0%
Intel Core i7-12700
NVIDIA GeForce RTX 4090
6891 Points 0%
Intel Core i7-13700
NVIDIA GeForce RTX 4090
6891 Points 0%
AMD Ryzen 9 7950X3D
NVIDIA GeForce RTX 4090
6887 Points 0%
AMD Ryzen 7 7800X3D
NVIDIA GeForce RTX 4090
6887 Points 0%
Intel Core i5-13400
NVIDIA GeForce RTX 4090
6879 Points -1%
1024x600 Normal, Mandel Vector
Intel Core i5-14600K
NVIDIA GeForce RTX 4090
17355 Points 0%
AMD Ryzen 9 7950X
NVIDIA GeForce RTX 4090
17336 Points 0%
AMD Ryzen 5 9600X
NVIDIA GeForce RTX 4090
17307 Points 0%
Intel Core i9-14900K
NVIDIA GeForce RTX 4090
17302 Points 0%
AMD Ryzen 9 7950X3D
NVIDIA GeForce RTX 4090
17301 Points 0%
AMD Ryzen 7 9800X3D
NVIDIA GeForce RTX 4090
17280 Points
Intel Core i7-13700K
NVIDIA GeForce RTX 4090
17250 Points 0%
Intel Core Ultra 9 285K
NVIDIA GeForce RTX 4090
17212 Points 0%
Intel Core i7-13700
NVIDIA GeForce RTX 4090
17207 Points 0%
Intel Core i7-12700
NVIDIA GeForce RTX 4090
17196 Points 0%
AMD Ryzen 7 7800X3D
NVIDIA GeForce RTX 4090
17156 Points -1%
Intel Core i5-13400
NVIDIA GeForce RTX 4090
17154 Points -1%
Intel Core Ultra 5 245K
NVIDIA GeForce RTX 4090
17075 Points -1%
1024x600 Normal, Mandel Scalar
Intel Core i5-14600K
NVIDIA GeForce RTX 4090
22992 Points +1%
Intel Core i9-14900K
NVIDIA GeForce RTX 4090
22976 Points +1%
AMD Ryzen 7 7800X3D
NVIDIA GeForce RTX 4090
22926 Points +1%
AMD Ryzen 9 7950X
NVIDIA GeForce RTX 4090
22889 Points 0%
Intel Core i7-13700K
NVIDIA GeForce RTX 4090
22862 Points 0%
AMD Ryzen 5 9600X
NVIDIA GeForce RTX 4090
22843 Points 0%
Intel Core i7-12700
NVIDIA GeForce RTX 4090
22834 Points 0%
AMD Ryzen 9 7950X3D
NVIDIA GeForce RTX 4090
22834 Points 0%
Intel Core i7-13700
NVIDIA GeForce RTX 4090
22825 Points 0%
Intel Core i5-13400
NVIDIA GeForce RTX 4090
22813 Points 0%
AMD Ryzen 7 9800X3D
NVIDIA GeForce RTX 4090
22799 Points
Intel Core Ultra 5 245K
NVIDIA GeForce RTX 4090
22542 Points -1%
Intel Core Ultra 9 285K
NVIDIA GeForce RTX 4090
22528 Points -1%
1024x600 Normal, QJuliaRayTrace
AMD Ryzen 5 9600X
NVIDIA GeForce RTX 4090
34367 Points +1%
Intel Core i5-14600K
NVIDIA GeForce RTX 4090
34333 Points +1%
AMD Ryzen 9 7950X
NVIDIA GeForce RTX 4090
34332 Points +1%
Intel Core i7-13700K
NVIDIA GeForce RTX 4090
34178 Points +1%
Intel Core i9-14900K
NVIDIA GeForce RTX 4090
34092 Points 0%
Intel Core i5-13400
NVIDIA GeForce RTX 4090
34057 Points 0%
AMD Ryzen 9 7950X3D
NVIDIA GeForce RTX 4090
34038 Points 0%
Intel Core i7-12700
NVIDIA GeForce RTX 4090
34033 Points 0%
AMD Ryzen 7 9800X3D
NVIDIA GeForce RTX 4090
33943 Points
Intel Core i7-13700
NVIDIA GeForce RTX 4090
33935 Points 0%
AMD Ryzen 7 7800X3D
NVIDIA GeForce RTX 4090
33822 Points 0%
Intel Core Ultra 5 245K
NVIDIA GeForce RTX 4090
33724 Points -1%
Intel Core Ultra 9 285K
NVIDIA GeForce RTX 4090
33713 Points -1%

Latenza da core a core

Abbiamo utilizzato MicrobenchX per testare la latenza tra i singoli core. In media, la latenza tra le unità di calcolo fisiche era di 23,3 ns. In questo scenario è entrato in gioco il vantaggio del singolo CCD, che ha portato a valori costantemente buoni. Abbiamo disattivato SMT (multithreading simultaneo) per questo test.

Core 0Core 1Core 2Core 3Core 4Core 5Core 6Core 7
Core 024.324.824.522.52325.324.5
Core 124.324.522.322.82223.820.3
Core 224.824.521.822.520.822.324.8
Core 324.522.321.822.323.521.823.5
Core 422.522.822.522.322.82524.8
Core 5232220.823.522.82424.8
Core 625.323.822.321.8252422.3
Core 724.520.324.823.524.824.822.3
, avg: 23.3 ns (20.3 ns - 25.3 ns)
CPU Core Latency - ---
Intel NUC 12, NUC12SNKi72_Serpent Canyon
A770M, i7-12700H, Kingston Fury Renegade SFYRS500G
42.1 (28.5min - 71.5max) ns +81%
AMD Ryzen 7 9800X3D
NVIDIA GeForce RTX 4090, R7 9800X3D, Kingston KC3000 2048G SKC3000D2048G
23.3 (20.3min - 25.3max) ns

Parametri di gioco - 8 core sono sufficienti per i giochi più recenti

Veniamo ora alla disciplina in cui AMD Ryzen 7 9800X3D si sente più a suo agio. L'AMD Ryzen 7 7800X3D ha ottenuto punti importanti con le sue impressionanti prestazioni di gioco. Persino un Intel Core i9-14900K non è stato in grado di essere all'altezza del precedente top dog. AMD ha alzato ulteriormente il livello con il suo Ryzen 7 9800X3D, anche se la differenza nel confronto diretto con l'AMD Ryzen 7 7800X3D è minima. Come sempre, dipende dai singoli giochi, che a volte beneficiano in modo diverso della nuova architettura Zen 5 e dei miglioramenti associati. AMD Ryzen 7 9800X3D offre attualmente le migliori prestazioni di gioco sul mercato. Se diamo un'occhiata più da vicino ai risultati dei limiti della CPU, AMD Ryzen 7 9800X3D vanta un aumento medio delle prestazioni del 14% rispetto a un Intel Core i9-14900K. Rispetto a un Intel Core Ultra 9 285K, l'AMD Ryzen 7 9800X3D ha addirittura ottenuto un vantaggio di 40 punti percentuali.

Nella seconda vista di confronto, abbiamo messo tutti i processori l'uno contro l'altro a 2.160p con dettagli massimi. Il vantaggio prestazionale di AMD Ryzen 7 9800X3D si è ridotto in modo significativo, anche se era ancora sufficiente per assicurarsi il primo posto. AMD offre ancora le migliori prestazioni di gioco con la sua piattaforma AM5 in combinazione con Nvidia RTX 4090. L'AMD Ryzen 7 7800X3D è stato immediatamente sostituito come migliore CPU da gioco dall'AMD Ryzen 7 9800X3D. Tuttavia, l'AMD Ryzen 7 7800X3D è ancora uno dei migliori processori quando si tratta di giocare.

Performance comparison CPU limit

Performance Rating - Percent
AMD Ryzen 7 9800X3D
98.4 pt
AMD Ryzen 7 7800X3D
94.4 pt
AMD Ryzen 9 7950X3D
87.3 pt
Intel Core i9-14900K
86.6 pt
AMD Ryzen 5 9600X
83.3 pt
AMD Ryzen 9 7950X
81.6 pt
AMD Ryzen 5 7600X
80.2 pt
Intel Core i9-13900K
80 pt
Intel Core i5-14600K
75.9 pt
Intel Core i7-13700K
74.1 pt
Intel Core i7-13700
73.4 pt
Intel Core Ultra 9 285K
70.2 pt
Intel Core Ultra 5 245K
63.5 pt
Intel Core i7-12700
63.1 pt
Intel Core i5-13400
55.2 pt
Intel Core i5-12400F
54.1 pt
F1 22 - 1920x1080 Low Preset AA:T AF:16x
AMD Ryzen 7 9800X3D
551 (407min, 317P1 - 630max) fps
AMD Ryzen 7 7800X3D
533 (380min, 288P1 - 637max) fps -3%
AMD Ryzen 9 7950X3D
475 (338min, 264P1 - 542max) fps -14%
Intel Core i9-14900K
462 (309min, 256P1 - 558max) fps -16%
AMD Ryzen 9 7950X
443 (278min, 245P1 - 521max) fps -20%
AMD Ryzen 5 9600X
439 (256min, 238P1 - 510max) fps -20%
AMD Ryzen 5 7600X
417 (281min, 236P1 - 488max) fps -24%
Intel Core i9-13900K
401 (265min, 222P1 - 463max) fps -27%
Intel Core i7-13700K
380 (280min, 217P1 - 437max) fps -31%
Intel Core i5-14600K
379 (280min, 225P1 - 455max) fps -31%
Intel Core i7-13700
378 (244min, 212P1 - 430max) fps -31%
Intel Core Ultra 9 285K
354 (237min, 199P1 - 414max) fps -36%
Intel Core i7-12700
313 (235min, 185P1 - 364max) fps -43%
Intel Core Ultra 5 245K
311 (242min, 180P1 - 346max) fps -44%
Intel Core i5-12400F
271 (200min, 165P1 - 305max) fps -51%
Intel Core i5-13400
249 (197min, 152P1 - 284max) fps -55%
Far Cry 5 - 1280x720 Low Preset AA:T
AMD Ryzen 7 9800X3D
375 (233min - 492max) fps
AMD Ryzen 7 7800X3D
344 (220min - 464max) fps -8%
AMD Ryzen 9 7950X3D
299 (201min - 390max) fps -20%
Intel Core i9-14900K
280 (214min - 355max) fps -25%
Intel Core i9-13900K
270 (203min - 349max) fps -28%
AMD Ryzen 5 9600X
263 (201min - 342max) fps -30%
Intel Core i5-14600K
255 (199min - 343max) fps -32%
Intel Core i7-13700K
242 (183min - 317max) fps -35%
AMD Ryzen 5 7600X
241 (180min - 334max) fps -36%
AMD Ryzen 9 7950X
238 (182min - 313max) fps -37%
Intel Core i7-13700
232 (161min - 306max) fps -38%
Intel Core Ultra 9 285K
213 (169min - 274max) fps -43%
Intel Core i7-12700
204 (156min - 270max) fps -46%
Intel Core Ultra 5 245K
204 (149min - 271max) fps -46%
Intel Core i5-13400
185 (144min - 241max) fps -51%
Intel Core i5-12400F
173 (124min - 232max) fps -54%
X-Plane 11.11 - 1280x720 low (fps_test=1)
Intel Core i9-13900K
245 fps +23%
AMD Ryzen 5 9600X
245 fps +23%
Intel Core i9-14900K
244 fps +22%
Intel Core i5-14600K
228 fps +14%
AMD Ryzen 9 7950X3D
225 fps +13%
Intel Core i7-13700K
224 fps +12%
AMD Ryzen 9 7950X
223 fps +12%
AMD Ryzen 7 7800X3D
219 fps +10%
Intel Core i7-13700
218 fps +9%
AMD Ryzen 5 7600X
217 fps +9%
AMD Ryzen 7 9800X3D
199.4 fps
Intel Core i7-12700
181.4 fps -9%
Intel Core i5-13400
155.7 fps -22%
Intel Core Ultra 9 285K
143.4 fps -28%
Intel Core Ultra 5 245K
129.1 fps -35%
Intel Core i5-12400F
113 fps -43%
Final Fantasy XV Benchmark - 1280x720 Lite Quality
AMD Ryzen 5 9600X
237 fps +1%
Intel Core i9-13900K
236 fps 0%
AMD Ryzen 9 7950X
236 fps 0%
AMD Ryzen 5 7600X
236 fps 0%
Intel Core i7-13700
236 fps 0%
Intel Core i7-13700K
236 fps 0%
AMD Ryzen 7 7800X3D
236 fps 0%
Intel Core i5-14600K
236 fps 0%
Intel Core Ultra 9 285K
236 fps 0%
Intel Core i9-14900K
235 fps 0%
Intel Core Ultra 5 245K
235 fps 0%
AMD Ryzen 7 9800X3D
235 fps
AMD Ryzen 9 7950X3D
234 fps 0%
Intel Core i7-12700
232 fps -1%
Intel Core i5-12400F
217 fps -8%
Intel Core i5-13400
217 fps -8%
Dota 2 Reborn - 1280x720 min (0/3) fastest
AMD Ryzen 7 9800X3D
368.7 (303min) fps
AMD Ryzen 7 7800X3D
322.9 (268min) fps -12%
AMD Ryzen 9 7950X3D
314.1 (261.7min) fps -15%
AMD Ryzen 9 7950X
310.6 (261.3min) fps -16%
Intel Core i9-14900K
299.9 (248.4min) fps -19%
Intel Core i9-13900K
294 (254.9min) fps -20%
AMD Ryzen 5 9600X
291 (244.2min) fps -21%
AMD Ryzen 5 7600X
278.1 (211.4min) fps -25%
Intel Core i5-14600K
261.5 (226.3min) fps -29%
Intel Core Ultra 9 285K
252.4 (219.5min) fps -32%
Intel Core i7-13700K
251.2 (215.9min) fps -32%
Intel Core i7-13700
245 (213.8min) fps -34%
Intel Core Ultra 5 245K
213.7 (189.8min) fps -42%
Intel Core i7-12700
202.4 (178min) fps -45%
Intel Core i5-12400F
182.1 (159.5min) fps -51%
Intel Core i5-13400
182.1 (160.5min) fps -51%
The Witcher 3 - 1024x768 Low Graphics & Postprocessing
AMD Ryzen 7 9800X3D
882 (30.2min, 308P0.1, 642P1 - 1554max) fps
AMD Ryzen 9 7950X3D
864.7 fps -2%
AMD Ryzen 7 7800X3D
858.4 fps -3%
Intel Core i9-14900K
829 (31.9min, 380P0.1, 595P1 - 1296max) fps -6%
AMD Ryzen 9 7950X
826 (23.6min, 360P0.1, 574P1 - 1357max) fps -6%
Intel Core i9-13900K
794 (25.1min, 361P0.1, 581P1 - 1267max) fps -10%
AMD Ryzen 5 9600X
762 (66min, 266P0.1, 520P1 - 1355max) fps -14%
AMD Ryzen 5 7600X
738 fps -16%
Intel Core i7-13700K
687.5 fps -22%
Intel Core i7-13700
670.4 fps -24%
Intel Core Ultra 9 285K
663 (87.9min, 319P0.1, 454P1 - 1115max) fps -25%
Intel Core i5-14600K
632 (29.4min, 209P0.1, 471P1 - 1028max) fps -28%
Intel Core Ultra 5 245K
536 (23.7min, 212P0.1, 371P1 - 944max) fps -39%
Intel Core i7-12700
522 fps -41%
Intel Core i5-13400
451.7 fps -49%
Intel Core i5-12400F
414 fps -53%
GTA V - 1024x768 Lowest Settings possible
AMD Ryzen 7 7800X3D
188.5 fps 0%
AMD Ryzen 9 7950X
188.2 (5.44min, 200P1 - 724max) fps 0%
AMD Ryzen 5 9600X
188.1 (3min, 200P1 - 713max) fps 0%
AMD Ryzen 9 7950X3D
188 (3.25min, 200P1 - 705max) fps 0%
AMD Ryzen 5 7600X
187.9 (7.22min, 200P1 - 815max) fps 0%
Intel Core i9-14900K
187.9 (3.8min, 200P1 - 705max) fps 0%
Intel Core i9-13900K
187.8 (2.26min, 200P1 - 688max) fps 0%
AMD Ryzen 7 9800X3D
187.8 (4.04min, 200P1 - 669max) fps
Intel Core i7-13700
187.7 (5.01min, 200P1 - 613max) fps 0%
Intel Core i5-14600K
187.7 (4.67min, 200P1 - 640max) fps 0%
Intel Core Ultra 5 245K
187.7 (4.11min, 200P1 - 547max) fps 0%
Intel Core Ultra 9 285K
187.7 (4.29min, 200P1 - 567max) fps 0%
Intel Core i7-13700K
187.6 (3.74min, 200P1 - 607max) fps 0%
Intel Core i7-12700
187.1 (2.4min, 200P1 - 499max) fps 0%
Intel Core i5-13400
186.8 (1.87min, 166.7P1 - 445max) fps -1%
Intel Core i5-12400F
186.4 (2.09min, 166.7P1 - 413max) fps -1%
Borderlands 3 - 1280x720 Very Low Overall Quality (DX11)
AMD Ryzen 7 9800X3D
325 fps
AMD Ryzen 7 7800X3D
310 fps -5%
AMD Ryzen 9 7950X3D
308 fps -5%
Intel Core i9-14900K
263 fps -19%
Intel Core i9-13900K
243 fps -25%
AMD Ryzen 9 7950X
242 fps -26%
Intel Core i5-14600K
237 fps -27%
AMD Ryzen 5 7600X
228 fps -30%
AMD Ryzen 5 9600X
228 fps -30%
Intel Core i7-13700
222 fps -32%
Intel Core i7-13700K
222 fps -32%
Intel Core Ultra 9 285K
196.6 fps -40%
Intel Core i7-12700
185.6 fps -43%
Intel Core Ultra 5 245K
172.1 fps -47%
Intel Core i5-13400
169 fps -48%
Intel Core i5-12400F
155 fps -52%
Far Cry New Dawn - 1280x720 Low Preset
AMD Ryzen 7 9800X3D
332 (222min - 481max) fps
AMD Ryzen 7 7800X3D
291 (218min - 442max) fps -12%
AMD Ryzen 9 7950X3D
255 (145min - 381max) fps -23%
Intel Core i9-14900K
235 (156min - 353max) fps -29%
AMD Ryzen 5 9600X
226 (163min - 362max) fps -32%
Intel Core i9-13900K
222 (150min - 335max) fps -33%
Intel Core i5-14600K
216 (168min - 312max) fps -35%
Intel Core i7-13700
203 (144min - 297max) fps -39%
Intel Core i7-13700K
203 (157min - 304max) fps -39%
AMD Ryzen 9 7950X
200 (140min - 302max) fps -40%
AMD Ryzen 5 7600X
199 (140min - 316max) fps -40%
Intel Core Ultra 9 285K
184 (140min - 275max) fps -45%
Intel Core i7-12700
174 (103min - 253max) fps -48%
Intel Core Ultra 5 245K
163 (122min - 246max) fps -51%
Intel Core i5-13400
159 (110min - 233max) fps -52%
Intel Core i5-12400F
147 (102min - 216max) fps -56%
Shadow of the Tomb Raider - 1280x720 Lowest Preset
AMD Ryzen 7 9800X3D
409 fps
AMD Ryzen 7 7800X3D
407 fps 0%
AMD Ryzen 9 7950X3D
383 fps -6%
AMD Ryzen 9 7950X
332 fps -19%
Intel Core i9-14900K
332 fps -19%
AMD Ryzen 5 7600X
321 fps -22%
Intel Core i9-13900K
320 fps -22%
AMD Ryzen 5 9600X
319 fps -22%
Intel Core i5-14600K
281 fps -31%
Intel Core i7-13700
272 fps -33%
Intel Core i7-13700K
272 fps -33%
Intel Core Ultra 9 285K
263 fps -36%
Intel Core Ultra 5 245K
246 fps -40%
Intel Core i7-12700
231 fps -44%
Intel Core i5-13400
204 fps -50%
Intel Core i5-12400F
196.4 fps -52%
Tiny Tina's Wonderlands - 1920x1080 Low Preset (DX12)
AMD Ryzen 7 9800X3D
578 fps
AMD Ryzen 7 7800X3D
506 fps -12%
Intel Core i9-14900K
502 fps -13%
AMD Ryzen 9 7950X3D
477 fps -17%
Intel Core i5-14600K
429 fps -26%
AMD Ryzen 9 7950X
428 fps -26%
AMD Ryzen 5 7600X
415 fps -28%
AMD Ryzen 5 9600X
411 fps -29%
Intel Core Ultra 9 285K
403 fps -30%
Intel Core i9-13900K
398 fps -31%
Intel Core i7-13700
378 fps -35%
Intel Core i7-13700K
371 fps -36%
Intel Core Ultra 5 245K
363 fps -37%
Intel Core i7-12700
303 fps -48%
Intel Core i5-13400
275 fps -52%
Intel Core i5-12400F
258 fps -55%
Strange Brigade - 1280x720 lowest AF:1
AMD Ryzen 5 7600X
780 (275min, 597P1 - 1128max) fps +1%
AMD Ryzen 7 9800X3D
776 (169.6min, 623P1 - 1082max) fps
Intel Core i9-14900K
762 (261min, 605P1 - 1027max) fps -2%
AMD Ryzen 7 7800X3D
760 (257min, 602P1 - 1084max) fps -2%
AMD Ryzen 5 9600X
735 (154.9min, 595P1 - 998max) fps -5%
Intel Core i5-14600K
717 (186min, 554P1 - 1036max) fps -8%
AMD Ryzen 9 7950X
698 (182.7min, 569P1 - 937max) fps -10%
Intel Core i9-13900K
691 (60.2min, 543P1 - 929max) fps -11%
Intel Core Ultra 9 285K
681 (43.7min, 531P1 - 898max) fps -12%
AMD Ryzen 9 7950X3D
672 (259min, 529P1 - 894max) fps -13%
Intel Core Ultra 5 245K
661 (248min, 487P1 - 949max) fps -15%
Intel Core i7-13700K
646 (277min, 510P1 - 858max) fps -17%
Intel Core i7-13700
626 (284min, 497P1 - 830max) fps -19%
Intel Core i7-12700
523 (243min, 410P1 - 698max) fps -33%
Intel Core i5-12400F
444 (33.1min, 345P1 - 648max) fps -43%
Intel Core i5-13400
408 (153.5min, 319P1 - 565max) fps -47%
Metro Exodus - 1280x720 Low Quality AF:4x
AMD Ryzen 7 9800X3D
433 (234.19min - 674.31max) fps
AMD Ryzen 7 7800X3D
374 (214.41min - 571.76max) fps -14%
AMD Ryzen 5 9600X
349 (182.25min - 551.57max) fps -19%
Intel Core i9-14900K
319 (166.53min - 527.7max) fps -26%
AMD Ryzen 5 7600X
309 (157.23min - 500.25max) fps -29%
AMD Ryzen 9 7950X
300 (162.95min - 476.42max) fps -31%
Intel Core i5-14600K
296 (170.68min - 455.17max) fps -32%
AMD Ryzen 9 7950X3D
293 (157.18min - 462.11max) fps -32%
Intel Core Ultra 9 285K
276 (133.01min - 479.85max) fps -36%
Intel Core i7-13700
268 (127.73min - 445.04max) fps -38%
Intel Core i9-13900K
261 (116.81min - 454.13max) fps -40%
Intel Core i7-13700K
261 (117.16min - 442.09max) fps -40%
Intel Core Ultra 5 245K
256 (135.37min - 427.35max) fps -41%
Intel Core i7-12700
233 (124.52min - 364.56max) fps -46%
Intel Core i5-12400F
203 (112.65min - 299.76max) fps -53%
Intel Core i5-13400
196.9 (110.05min - 286.04max) fps -55%
F1 2020 - 1280x720 Ultra Low Preset
AMD Ryzen 7 9800X3D
687 (546min - 750max) fps
AMD Ryzen 7 7800X3D
681 (531min - 769max) fps -1%
AMD Ryzen 5 9600X
630 (468min - 710max) fps -8%
Intel Core i9-14900K
598 (473min - 679max) fps -13%
AMD Ryzen 9 7950X3D
594 (461min - 653max) fps -14%
AMD Ryzen 9 7950X
563 (437min - 628max) fps -18%
AMD Ryzen 5 7600X
559 (420min - 634max) fps -19%
Intel Core i9-13900K
526 (418min - 596max) fps -23%
Intel Core i7-13700K
465 (325min - 539max) fps -32%
Intel Core i7-13700
461 (323min - 528max) fps -33%
Intel Core Ultra 9 285K
454 (355min - 499max) fps -34%
Intel Core i5-14600K
403 (333min - 436max) fps -41%
Intel Core i7-12700
388 (314min - 434max) fps -44%
Intel Core Ultra 5 245K
384 (313min - 422max) fps -44%
Intel Core i5-12400F
322 (266min - 345max) fps -53%
Intel Core i5-13400
292 (253min - 317max) fps -57%
F1 2021 - 1280x720 Ultra Low Preset
AMD Ryzen 7 7800X3D
830 (632min, 515P1 - 919max) fps +4%
AMD Ryzen 7 9800X3D
797 (624min, 486P1 - 869max) fps
Intel Core i9-14900K
733 (560min, 450P1 - 806max) fps -8%
AMD Ryzen 5 7600X
690 (453min, 397P1 - 783max) fps -13%
AMD Ryzen 9 7950X3D
682 (522min, 418P1 - 767max) fps -14%
AMD Ryzen 9 7950X
677 (504min, 418P1 - 754max) fps -15%
AMD Ryzen 5 9600X
669 (451min, 412P1 - 741max) fps -16%
Intel Core i9-13900K
599 (469min, 379P1 - 653max) fps -25%
Intel Core i7-13700K
588 (466min, 371P1 - 639max) fps -26%
Intel Core i7-13700
572 (447min, 359P1 - 620max) fps -28%
Intel Core i5-14600K
562 (468min, 364P1 - 618max) fps -29%
Intel Core Ultra 9 285K
527 (401min, 329P1 - 583max) fps -34%
Intel Core i7-12700
448 (363min, 297P1 - 477max) fps -44%
Intel Core i5-12400F
393 (309min, 274P1 - 416max) fps -51%
Intel Core Ultra 5 245K
386 (318min, 250P1 - 422max) fps -52%
Intel Core i5-13400
337 (277min, 237P1 - 358max) fps -58%

Performance comparison GPU limit

Performance Rating - Percent
AMD Ryzen 7 9800X3D
98.3 pt
AMD Ryzen 7 7800X3D
97.2 pt
AMD Ryzen 9 7950X3D
95.6 pt
Intel Core i9-14900K
95.2 pt
Intel Core i5-14600K
93.2 pt
AMD Ryzen 9 7950X
92.6 pt
AMD Ryzen 5 9600X
92.5 pt
AMD Ryzen 5 7600X
92.3 pt
Intel Core i9-13900K
92 pt
Intel Core i7-13700K
91.4 pt
Intel Core i7-13700
90.6 pt
Intel Core Ultra 9 285K
89.2 pt
Intel Core Ultra 5 245K
86.9 pt
Intel Core i7-12700
86.5 pt
Intel Core i5-13400
82.3 pt
Intel Core i5-12400F
79.6 pt
F1 22 - 3840x2160 Ultra High Preset AA:T AF:16x
AMD Ryzen 7 9800X3D
86.6 (74min, 73P1 - 101max) fps
Intel Core Ultra 9 285K
86.2 (74min, 70P1 - 101max) fps 0%
Intel Core Ultra 5 245K
85.5 (74min, 69P1 - 98max) fps -1%
AMD Ryzen 5 9600X
85 (73min, 72P1 - 99max) fps -2%
AMD Ryzen 7 7800X3D
84.5 (72min, 71P1 - 97max) fps -2%
Intel Core i5-14600K
83.5 (72min, 71P1 - 96max) fps -4%
Intel Core i9-14900K
83.4 (72min, 71P1 - 96max) fps -4%
AMD Ryzen 5 7600X
83 (72min, 71P1 - 95max) fps -4%
AMD Ryzen 9 7950X
82.5 (72min, 71P1 - 96max) fps -5%
Intel Core i7-13700K
82.4 (72min, 71P1 - 95max) fps -5%
AMD Ryzen 9 7950X3D
82.3 (71min, 70P1 - 94max) fps -5%
Intel Core i5-12400F
81.7 (71min, 70P1 - 95max) fps -6%
Intel Core i7-13700
81.6 (71min, 70P1 - 93max) fps -6%
Intel Core i7-12700
81.3 (71min, 68P1 - 93max) fps -6%
Intel Core i5-13400
81.2 (72min, 67P1 - 93max) fps -6%
Intel Core i9-13900K
81.1 (71min, 70P1 - 93max) fps -6%
Far Cry 5 - 3840x2160 Ultra Preset AA:T
AMD Ryzen 7 7800X3D
187 (166min - 215max) fps +2%
Intel Core i9-14900K
187 (168min - 216max) fps +2%
AMD Ryzen 7 9800X3D
183 (165min - 209max) fps
Intel Core i9-13900K
182 (148min - 212max) fps -1%
AMD Ryzen 9 7950X3D
182 (157min - 212max) fps -1%
Intel Core i5-14600K
181 (151min - 215max) fps -1%
AMD Ryzen 9 7950X
175 (140min - 212max) fps -4%
AMD Ryzen 5 7600X
173 (142min - 209max) fps -5%
Intel Core i7-13700K
172 (137min - 206max) fps -6%
Intel Core i7-13700
171 (140min - 207max) fps -7%
AMD Ryzen 5 9600X
170 (136min - 198max) fps -7%
Intel Core Ultra 9 285K
158 (125min - 209max) fps -14%
Intel Core i7-12700
153 (117min - 203max) fps -16%
Intel Core Ultra 5 245K
153 (117min - 210max) fps -16%
Intel Core i5-13400
142 (108min - 190max) fps -22%
Intel Core i5-12400F
131 (97min - 177max) fps -28%
X-Plane 11.11 - 3840x2160 high (fps_test=3)
AMD Ryzen 7 7800X3D
160.5 fps +6%
AMD Ryzen 9 7950X3D
158.4 fps +4%
AMD Ryzen 7 9800X3D
152 fps
AMD Ryzen 5 9600X
136.6 fps -10%
Intel Core i9-14900K
136.3 fps -10%
Intel Core i9-13900K
132.3 fps -13%
AMD Ryzen 5 7600X
125.8 fps -17%
Intel Core i5-14600K
124.6 fps -18%
AMD Ryzen 9 7950X
124.5 fps -18%
Intel Core i7-13700K
121.8 fps -20%
Intel Core i7-13700
119.3 fps -22%
Intel Core Ultra 9 285K
105.8 fps -30%
Intel Core i7-12700
105.4 fps -31%
Intel Core i5-13400
95 fps -37%
Intel Core Ultra 5 245K
93.4 fps -39%
Intel Core i5-12400F
77 fps -49%
Final Fantasy XV Benchmark - 3840x2160 High Quality
Intel Core Ultra 5 245K
162.3 fps +1%
Intel Core i9-14900K
161.9 fps 0%
Intel Core Ultra 9 285K
161.7 fps 0%
Intel Core i5-14600K
161.5 fps 0%
Intel Core i9-13900K
161.3 fps 0%
AMD Ryzen 9 7950X
161.1 fps 0%
AMD Ryzen 7 9800X3D
161.1 fps
AMD Ryzen 5 7600X
159.2 fps -1%
AMD Ryzen 7 7800X3D
158.2 fps -2%
Intel Core i7-13700
157.9 fps -2%
AMD Ryzen 9 7950X3D
157.6 fps -2%
Intel Core i7-13700K
155.9 fps -3%
Intel Core i7-12700
153.4 fps -5%
Intel Core i5-12400F
151.9 fps -6%
AMD Ryzen 5 9600X
150.9 fps -6%
Intel Core i5-13400
149.8 fps -7%
Dota 2 Reborn - 3840x2160 ultra (3/3) best looking
AMD Ryzen 7 9800X3D
298.4 (236.3min) fps
AMD Ryzen 7 7800X3D
258.2 (201.3min) fps -13%
AMD Ryzen 9 7950X3D
245.4 (195.9min) fps -18%
AMD Ryzen 9 7950X
234.4 (192.2min) fps -21%
Intel Core i9-13900K
230 (185.3min) fps -23%
Intel Core i9-14900K
227.8 (188.3min) fps -24%
AMD Ryzen 5 9600X
225 (189.1min) fps -25%
AMD Ryzen 5 7600X
223.4 (185.4min) fps -25%
Intel Core i5-14600K
211.5 (179.5min) fps -29%
Intel Core i7-13700K
200.2 (165.5min) fps -33%
Intel Core i7-13700
196.8 (166.7min) fps -34%
Intel Core Ultra 9 285K
193.6 (162.4min) fps -35%
Intel Core Ultra 5 245K
168 (143.3min) fps -44%
Intel Core i7-12700
163.7 (141.2min) fps -45%
Intel Core i5-12400F
150.3 (129.4min) fps -50%
Intel Core i5-13400
149.8 (129.3min) fps -50%
The Witcher 3 - 3840x2160 High Graphics & Postprocessing (Nvidia HairWorks Off)
AMD Ryzen 5 7600X
294 fps +4%
Intel Core i9-14900K
293 (121.6min, 193.2P0.1, 243P1 - 865max) fps +4%
Intel Core i5-14600K
288 (85.6min, 166.1P0.1, 233P1 - 721max) fps +2%
Intel Core Ultra 9 285K
286 (152.2min, 226P0.1, 257P1 - 596max) fps +1%
AMD Ryzen 9 7950X
284 (88.3min, 166.6P0.1, 240P1 - 831max) fps +1%
Intel Core Ultra 5 245K
284 (132.6min, 215P0.1, 256P1 - 516max) fps +1%
Intel Core i5-13400
282.2 fps 0%
Intel Core i7-13700
282.1 fps 0%
Intel Core i7-12700
282 fps 0%
AMD Ryzen 7 9800X3D
282 (147.6min, 226P0.1, 253P1 - 751max) fps
AMD Ryzen 7 7800X3D
281 fps 0%
Intel Core i7-13700K
278.9 fps -1%
AMD Ryzen 5 9600X
277 (20.2min, 154.7P0.1, 219P1 - 925max) fps -2%
AMD Ryzen 9 7950X3D
275.2 fps -2%
Intel Core i5-12400F
254 fps -10%
Intel Core i9-13900K
239 (103.3min, 154P0.1, 203P1 - 639max) fps -15%
GTA V - 3840x2160 High/On (Advanced Graphics Off) AA:FX AF:8x
AMD Ryzen 7 7800X3D
188 (2.69min, 200P1 - 698max) fps 0%
AMD Ryzen 5 9600X
187.7 (4.85min, 200P1 - 597max) fps 0%
Intel Core i9-14900K
187.6 (4.19min, 200P1 - 613max) fps 0%
AMD Ryzen 7 9800X3D
187.6 (3.92min, 200P1 - 615max) fps
Intel Core i9-13900K
187.5 (3.71min, 200P1 - 553max) fps 0%
AMD Ryzen 9 7950X
187.5 (2.97min, 200P1 - 593max) fps 0%
Intel Core i7-13700K
187.5 (6.22min, 200P1 - 502max) fps 0%
Intel Core i5-14600K
187.4 (5.2min, 200P1 - 502max) fps 0%
Intel Core i7-13700
187.2 (1.451min, 200P1 - 464max) fps 0%
AMD Ryzen 5 7600X
186.5 (2.19min, 166.7P1 - 524max) fps -1%
AMD Ryzen 9 7950X3D
186.5 (2.67min, 166.7P1 - 575max) fps -1%
Intel Core Ultra 9 285K
186 (2.01min, 166.7P1 - 464max) fps -1%
Intel Core Ultra 5 245K
183.7 (2.01min, 125P1 - 443max) fps -2%
Intel Core i7-12700
182 (2.29min, 142.9P1 - 460max) fps -3%
Intel Core i5-13400
178.2 (2.26min, 125P1 - 359max) fps -5%
Intel Core i5-12400F
175.6 (3.48min, 125P1 - 323max) fps -6%
Borderlands 3 - 3840x2160 Badass Overall Quality (DX11)
Intel Core i7-13700K
143.4 fps +4%
AMD Ryzen 7 9800X3D
138.5 fps
Intel Core i9-14900K
137.9 fps 0%
AMD Ryzen 7 7800X3D
137.4 fps -1%
AMD Ryzen 9 7950X3D
136.4 fps -2%
Intel Core i5-14600K
136.1 fps -2%
Intel Core i9-13900K
135.5 fps -2%
AMD Ryzen 9 7950X
135 fps -3%
AMD Ryzen 5 7600X
133.4 fps -4%
Intel Core i7-13700
132.4 fps -4%
AMD Ryzen 5 9600X
131.8 fps -5%
Intel Core Ultra 9 285K
128.6 fps -7%
Intel Core i7-12700
125.5 fps -9%
Intel Core Ultra 5 245K
124 fps -10%
Intel Core i5-13400
120.5 fps -13%
Intel Core i5-12400F
114.4 fps -17%
Far Cry New Dawn - 3840x2160 Ultra Preset
AMD Ryzen 7 9800X3D
183 (144min - 214max) fps
AMD Ryzen 7 7800X3D
180 (147min - 219max) fps -2%
AMD Ryzen 9 7950X3D
171 (130min - 219max) fps -7%
Intel Core i9-14900K
161 (122min - 221max) fps -12%
Intel Core i9-13900K
154 (113min - 219max) fps -16%
Intel Core i5-14600K
153 (115min - 219max) fps -16%
AMD Ryzen 5 9600X
148 (110min - 200max) fps -19%
AMD Ryzen 9 7950X
145 (104min - 215max) fps -21%
Intel Core i7-13700
145 (106min - 212max) fps -21%
Intel Core i7-13700K
145 (109min - 213max) fps -21%
AMD Ryzen 5 7600X
142 (99min - 212max) fps -22%
Intel Core Ultra 9 285K
130 (90min - 200max) fps -29%
Intel Core i7-12700
127 (92min - 198max) fps -31%
Intel Core Ultra 5 245K
120 (85min - 198max) fps -34%
Intel Core i5-13400
119 (88min - 182max) fps -35%
Intel Core i5-12400F
110 (79min - 170max) fps -40%
Tiny Tina's Wonderlands - 3840x2160 Badass Preset (DX12)
Intel Core Ultra 5 245K
132.6 fps +1%
Intel Core Ultra 9 285K
132.6 fps +1%
Intel Core i9-14900K
131.7 fps 0%
AMD Ryzen 9 7950X3D
131.3 fps 0%
AMD Ryzen 7 9800X3D
131.1 fps
AMD Ryzen 5 7600X
130.6 fps 0%
Intel Core i5-14600K
130.4 fps -1%
AMD Ryzen 9 7950X
130.3 fps -1%
Intel Core i7-13700
130.2 fps -1%
AMD Ryzen 5 9600X
130 fps -1%
Intel Core i9-13900K
129.8 fps -1%
AMD Ryzen 7 7800X3D
129.8 fps -1%
Intel Core i7-12700
129.7 fps -1%
Intel Core i5-13400
129.7 fps -1%
Intel Core i7-13700K
129.6 fps -1%
Intel Core i5-12400F
114.2 fps -13%
Strange Brigade - 3840x2160 ultra AA:ultra AF:16
Intel Core i9-14900K
291 (120min, 249P1 - 467max) fps +1%
AMD Ryzen 7 7800X3D
289 (119.3min, 246P1 - 463max) fps 0%
Intel Core i5-14600K
289 (243min, 249P1 - 426max) fps 0%
AMD Ryzen 7 9800X3D
289 (238min, 246P1 - 408max) fps
Intel Core Ultra 9 285K
288 (214min, 245P1 - 410max) fps 0%
AMD Ryzen 5 9600X
286 (37.1min, 244P1 - 520max) fps -1%
Intel Core i7-13700K
285 (59.9min, 241P1 - 552max) fps -1%
AMD Ryzen 9 7950X3D
285 (53.2min, 243P1 - 469max) fps -1%
Intel Core Ultra 5 245K
285 (195.3min, 242P1 - 410max) fps -1%
Intel Core i7-12700
284 (44.1min, 236P1 - 407max) fps -2%
AMD Ryzen 5 7600X
283 (39.7min, 242P1 - 668max) fps -2%
Intel Core i7-13700
282 (28.1min, 238P1 - 533max) fps -2%
AMD Ryzen 9 7950X
281 (31.7min, 239P1 - 482max) fps -3%
Intel Core i5-12400F
281 (59.7min, 240P1 - 421max) fps -3%
Intel Core i9-13900K
279 (59.9min, 239P1 - 532max) fps -3%
Intel Core i5-13400
278 (59.8min, 227P1 - 408max) fps -4%
Metro Exodus - 3840x2160 Ultra Quality AF:16x
Intel Core i9-14900K
143.4 (84.04min - 227.17max) fps +6%
Intel Core i5-14600K
142.1 (81.45min - 230.73max) fps +5%
AMD Ryzen 7 7800X3D
141.6 (85.41min - 213.31max) fps +5%
AMD Ryzen 9 7950X
139.7 (76.95min - 229.15max) fps +3%
AMD Ryzen 9 7950X3D
139.4 (76.47min - 227.32max) fps +3%
Intel Core i9-13900K
138.6 (76.78min - 237.3max) fps +3%
AMD Ryzen 5 9600X
138 (71.03min - 235.4max) fps +2%
AMD Ryzen 5 7600X
137 (71.99min - 228.62max) fps +1%
Intel Core i7-13700
136.9 (71.43min - 234.36max) fps +1%
Intel Core i7-13700K
136.9 (72.87min - 233.59max) fps +1%
AMD Ryzen 7 9800X3D
135 (79.78min - 194.59max) fps
Intel Core Ultra 5 245K
134.7 (69.85min - 225.07max) fps 0%
Intel Core Ultra 9 285K
134 (68.14min - 237.76max) fps -1%
Intel Core i7-12700
132.4 (68.05min - 211.86max) fps -2%
Intel Core i5-13400
126.7 (68.66min - 196.97max) fps -6%
Intel Core i5-12400F
124.1 (74min - 188.01max) fps -8%
F1 2020 - 3840x2160 Ultra High Preset AA:T AF:16x
AMD Ryzen 7 9800X3D
292 (243min - 326max) fps
Intel Core i9-14900K
289 (237min - 340max) fps -1%
AMD Ryzen 9 7950X3D
288 (242min - 339max) fps -1%
AMD Ryzen 7 7800X3D
288 (242min - 333max) fps -1%
Intel Core i5-14600K
288 (242min - 338max) fps -1%
AMD Ryzen 5 9600X
287 (243min - 337max) fps -2%
AMD Ryzen 9 7950X
286 (245min - 335max) fps -2%
Intel Core i9-13900K
285 (240min - 333max) fps -2%
AMD Ryzen 5 7600X
285 (241min - 333max) fps -2%
Intel Core i7-13700K
284 (242min - 329max) fps -3%
Intel Core i7-13700
283 (240min - 332max) fps -3%
Intel Core i7-12700
275 (197min - 319max) fps -6%
Intel Core Ultra 9 285K
273 (236min - 319max) fps -7%
Intel Core Ultra 5 245K
270 (233min - 318max) fps -8%
Intel Core i5-12400F
247 (202min - 285max) fps -15%
Intel Core i5-13400
229 (184min - 265max) fps -22%
F1 2021 - 3840x2160 Ultra High Preset + Raytracing AA:T AF:16x
AMD Ryzen 7 9800X3D
217 (184min, 175P1 - 242max) fps
AMD Ryzen 7 7800X3D
207 (179min, 176P1 - 230max) fps -5%
AMD Ryzen 5 9600X
205 (176min, 168P1 - 232max) fps -6%
AMD Ryzen 5 7600X
203 (173min, 170P1 - 228max) fps -6%
AMD Ryzen 9 7950X3D
203 (169min, 169P1 - 225max) fps -6%
Intel Core i9-14900K
203 (173min, 165P1 - 226max) fps -6%
Intel Core i5-14600K
201 (173min, 153P1 - 227max) fps -7%
Intel Core Ultra 9 285K
200 (168min, 137P1 - 218max) fps -8%
AMD Ryzen 9 7950X
199.1 (168min, 166P1 - 223max) fps -8%
Intel Core i7-13700K
197.5 (169min, 158P1 - 222max) fps -9%
Intel Core Ultra 5 245K
196.9 (171min, 139P1 - 211max) fps -9%
Intel Core i7-13700
196.8 (166min, 156P1 - 217max) fps -9%
Intel Core i9-13900K
196.5 (166min, 152P1 - 220max) fps -9%
Intel Core i7-12700
193.1 (162min, 137P1 - 211max) fps -11%
Intel Core i5-12400F
185 (153min, 132P1 - 197max) fps -15%
Intel Core i5-13400
176.2 (144min, 127P1 - 189max) fps -19%

AMD Ryzen 7 9800X3D with Nvidia GeForce RTX 4090

bassomedioaltoultraQHD DLSSQHD4K DLSS4K
GTA V (2015) 187.8 187.7 187.6 187.1 186.7 187.6
The Witcher 3 (2015) 882 823 648 304 262 282
Dota 2 Reborn (2015) 368.7 343.5 328.7 307.2 298.4
Final Fantasy XV Benchmark (2018) 235 236 236 225 161.1
X-Plane 11.11 (2018) 199.4 205 182.5 152
Far Cry 5 (2018) 375 339 324 309 292 183
Strange Brigade (2018) 776 624 615 610 538 289
Shadow of the Tomb Raider (2018) 409 392 383 375 315 184.8
Far Cry New Dawn (2019) 332 287 278 253 246 183
Metro Exodus (2019) 433 342 278 225 194.7 135
Borderlands 3 (2019) 325 299 276 262 234 138.5
F1 2020 (2020) 687 571 557 501 430 292
F1 2021 (2021) 797 711 642 351 322 217
Far Cry 6 (2021) 307 279 255 236 211 139.3
God of War (2022) 341 299 258 193.5 172.1 127.5
Tiny Tina's Wonderlands (2022) 578 479 378 307 233 131.1
F1 22 (2022) 551 548 498 221 163.6 86.6
The Quarry (2022) 461 360 314 265 198.1 82.4
A Plague Tale Requiem (2022) 278 243 200 162.1 129 79.7
Uncharted Legacy of Thieves Collection (2022) 172.8 173.4 170.3 168.4 151.9 102.3
The Callisto Protocol (2022) 342 320 313 256 217 151
High On Life (2023) 549 484 403 352 237 110.9
The Witcher 3 v4.00 (2023) 415 375 319 317 285 171.4
Dead Space Remake (2023) 291 285 256 257 187 98
Hogwarts Legacy (2023) 240 227 192.2 180.7 142 85.7
Returnal (2023) 261 257 239 209 172 115
Atomic Heart (2023) 384 315 233 199.6 162.5 103
Company of Heroes 3 (2023) 453 381 346 331 303 209
The Last of Us (2023) 256 234 220 203 155.4 86.2
F1 23 (2023) 567 574 528 223 157.9 80.6
Baldur's Gate 3 (2023) 397 320 287 283 225 134.1
Cyberpunk 2077 2.1 Phantom Liberty (2023) 251 239 232 223 154.9 76.2
Assassin's Creed Mirage (2023) 285 276 260 216 181 128
Total War Pharaoh (2023) 858.8 549.5 369.6 294.1 258.2 157.3
Alan Wake 2 (2023) 182.3 131.6 116.2 74.7
Avatar Frontiers of Pandora (2023) 246 234 208 171 126 70
Helldivers 2 (2024) 281 269 267 264 229 140
F1 24 (2024) 541 540 487 208 151.2 80
Black Myth: Wukong (2024) 94 97 76 74 49
Star Wars Outlaws (2024) 88.4 102.5 61.8 65.7 33.7
Call of Duty Black Ops 6 (2024) 205 187 175 128 120
Stalker 2 (2024) 118.6 184.4 100.1 127 65.6
Indiana Jones and the Great Circle (2024) 192.3 118.8 161.5 77.8 108.2

Fabbisogno energetico - Arrow Lake è più efficiente

Il consumo energetico disponibile di AMD Ryzen 7 9800X3D non è stato modificato rispetto a quello di AMD Ryzen 7 7800X3D. In cifre, questo significa un fabbisogno energetico massimo limitato a 162 watt (PPT). Tuttavia, l'AMD Ryzen 7 9800X3D non può avvicinarsi all'efficienza dei processori Arrow Lake recentemente introdotti. AMD è comunque riuscita ad aumentare in modo significativo l'efficienza energetica rispetto all'AMD Ryzen 7 7800X3D.

Le temperature sono sempre rimaste nella fascia verde durante tutti i test. Nel test di stress, l'AMD Ryzen 7 9800X3D si è riscaldato fino a un massimo di 82 °C. Negli scenari di carico più brevi, come il multi-loop di Cinebench R15, il processore ha raggiunto solo 64 °C e ha lavorato in modo sensibilmente più fresco rispetto a un AMD Ryzen 7 7800X3D.

Consumo di energia del sistema di test - inattivo
Consumo energetico del sistema di test - Cinebench R15 nT
Consumo energetico del sistema di test - Cinebench R23 nT
Consumo energetico del sistema di test - Cinebench R23 1T
Consumo di energia del sistema di test - gioco (Il Witcher 3, preset Ultra)
Consumo energetico del sistema di test - stress test Prime95
Test da sforzo - Prime95
 

Efficiency overview

Power Consumption / Cinebench R23 Single Power Efficiency - external Monitor
Ryzen 7 9700X
19.7 Points per Watt +18%
Ultra 9 285K
19.5 Points per Watt +17%
Ultra 5 245K
18.6 Points per Watt +11%
R7 9800X3D
16.7 Points per Watt
Ryzen 9 9950X
15.8 Points per Watt -5%
i9-14900K
15.51 Points per Watt -7%
Ryzen 5 9600X
15.2 Points per Watt -9%
i5-14600K
13.8 Points per Watt -17%
R9 7950X
13.1 Points per Watt -22%
R7 7800X3D
9.54 Points per Watt -43%
Power Consumption / Cinebench R23 Multi Power Efficiency - external Monitor
Ryzen 9 9950X
129.5 Points per Watt +34%
Ultra 9 285K
119.8 Points per Watt +24%
Ryzen 7 9700X
116.9 Points per Watt +21%
Ultra 5 245K
109.9 Points per Watt +14%
R9 7950X
108.4 Points per Watt +12%
R7 9800X3D
96.4 Points per Watt
R7 7800X3D
89.1 Points per Watt -8%
Ryzen 5 9600X
82.2 Points per Watt -15%
i9-14900K
77.57 Points per Watt -20%
i5-14600K
73.8 Points per Watt -23%
Power Consumption / Cinebench R15 Multi Efficiency (external Monitor)
Ryzen 9 9950X
20.2 Points per Watt +32%
Ryzen 7 9700X
18.2 Points per Watt +19%
R9 7950X
17.1 Points per Watt +12%
Ultra 9 285K
17.1 Points per Watt +12%
Ultra 5 245K
15.8 Points per Watt +3%
R7 9800X3D
15.3 Points per Watt
R7 7800X3D
14.4 Points per Watt -6%
Ryzen 5 9600X
12.5 Points per Watt -18%
i9-14900K
11.5 Points per Watt -25%
i5-14600K
11.1 Points per Watt -27%
Power Consumption / Witcher 3 ultra Efficiency (external Monitor)
Ryzen 7 9700X
0.642 fps per Watt +4%
R7 7800X3D
0.632 fps per Watt +2%
Ultra 5 245K
0.626 fps per Watt +1%
R7 9800X3D
0.617 fps per Watt
Ultra 9 285K
0.602 fps per Watt -2%
Ryzen 9 9950X
0.583 fps per Watt -6%
i9-14900K
0.56 fps per Watt -9%
i5-14600K
0.56 fps per Watt -9%
R9 7950X
0.325 fps per Watt -47%
Power Consumption / Cinebench R15 Multi (external Monitor)
Intel Core i9-14900K
548 (545min, 545P1 - 551max) Watt * -130%
Intel Core Ultra 9 285K
373 (360min, 360P1 - 402max) Watt * -57%
Intel Core i7-13700
365 (363min, 363P1 - 367max) Watt * -53%
Intel Core i7-13700K
357 (356min, 356P1 - 362max) Watt * -50%
Intel Core i5-14600K
329 (323min, 324P1 - 331max) Watt * -38%
Intel Core i7-12700
284 (282min, 282P1 - 287max) Watt * -19%
AMD Ryzen 9 7950X3D
273 (264min, 264P1 - 304max) Watt * -15%
Intel Core Ultra 5 245K
244 (242min, 242P1 - 246max) Watt * -3%
AMD Ryzen 7 9800X3D
238 (234min, 234P1 - 240max) Watt *
AMD Ryzen 5 7600X
215 (134.8min, 135.6P1 - 259max) Watt * +10%
AMD Ryzen 5 9600X
210 (209min, 209P1 - 210max) Watt * +12%
AMD Ryzen 7 7800X3D
207 (203min, 203P1 - 216max) Watt * +13%
Intel Core i5-13400
196.6 (194.6min, 194.6P1 - 207max) Watt * +17%
Intel Core i5-12400F
194.4 (192.3min, 192.3P1 - 200max) Watt * +18%
Power Consumption / Prime95 V2810 Stress (external Monitor)
Intel Core i9-14900K
537 (508min, 510P1 - 606max) Watt * -97%
Intel Core i7-13700
386 (363min, 364P1 - 487max) Watt * -42%
Intel Core Ultra 9 285K
382 (374min, 376P1 - 392max) Watt * -40%
Intel Core i5-14600K
370 (349min, 349P1 - 422max) Watt * -36%
Intel Core i7-13700K
357 (341min, 342P1 - 458max) Watt * -31%
Intel Core i7-12700
327 (304min, 305P1 - 394max) Watt * -20%
AMD Ryzen 9 7950X3D
276 (267min, 267P1 - 329max) Watt * -1%
AMD Ryzen 7 9800X3D
272 (267min, 269P1 - 277max) Watt *
Intel Core Ultra 5 245K
263 (256min, 256P1 - 271max) Watt * +3%
Intel Core i5-12400F
239 (225min, 226P1 - 252max) Watt * +12%
Intel Core i5-13400
229 (224min, 224P1 - 247max) Watt * +16%
AMD Ryzen 5 7600X
227 (218min, 219P1 - 245max) Watt * +17%
AMD Ryzen 7 7800X3D
218 (214min, 215P1 - 223max) Watt * +20%
AMD Ryzen 5 9600X
213 (207min, 208P1 - 220max) Watt * +22%

* ... Meglio usare valori piccoli
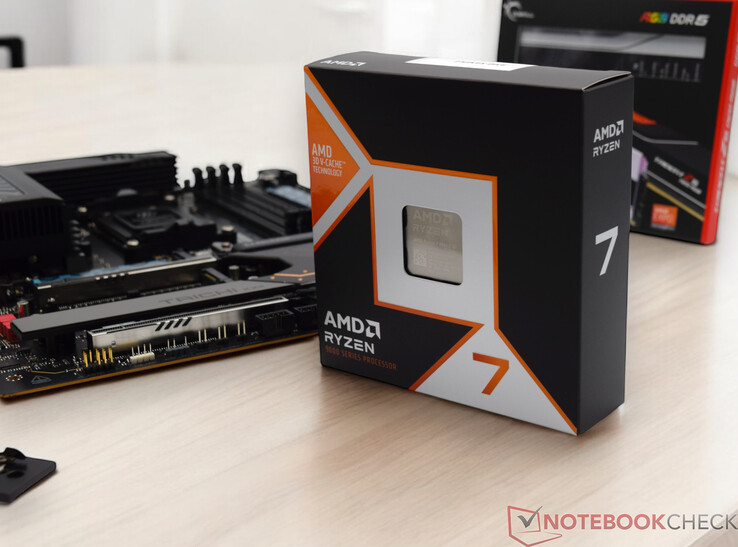
Power consumption with external monitor

0306090120150180210240270300330360390420450480510540570Tooltip
AMD Ryzen 7 9800X3D; Prime95 V2810 Stress (external Monitor): Ø272 (267-277)
AMD Ryzen 7 9800X3D; Cinebench R15 Multi (external Monitor): Ø238 (234-240)
AMD Ryzen 7 9800X3D; Cinebench R23 Single (external Monitor): Ø124.7 (120.1-157.7)
AMD Ryzen 7 9800X3D; Cinebench R23 Multi (external Monitor): Ø241 (230-251)
AMD Ryzen 7 9800X3D; 1280x720 FurMark 1.19 GPU Stress Test (external Monitor): Ø573 (565-585)

Power consumption with external monitor

0306090120150180210240270300330360390420450480510540Tooltip
AMD Ryzen 7 9800X3D; Idle 1min (external Monitor): Ø108.1 (102.7-112.5)
AMD Ryzen 7 9800X3D; Cyberpunk 2077 FHD ultra no FSR (external Monitor): Ø549 (540-554)
AMD Ryzen 7 9800X3D; 1920x1080 The Witcher 3 ultra (external Monitor): Ø493 (487-512)

Valutazione totale di Notebookcheck

AMD Ryzen 7 9800X3D offre maggiori prestazioni rispetto al suo predecessore, il che è particolarmente evidente nei benchmark della CPU. Senza la concorrenza significativa di Intel, AMD Ryzen 7 9800X3D è la prima scelta quando si tratta di prestazioni al top nel settore dei giochi. In termini di prezzo, tuttavia, AMD potrebbe inciampare, poiché il suo attuale MRSP di 479 dollari per un processore a 8 core è molto alto.

Transparency

La selezione dei dispositivi da recensire viene effettuata dalla nostra redazione. Il campione di prova è stato fornito all'autore come prestito dal produttore o dal rivenditore ai fini di questa recensione. L'istituto di credito non ha avuto alcuna influenza su questa recensione, né il produttore ne ha ricevuto una copia prima della pubblicazione. Non vi era alcun obbligo di pubblicare questa recensione. Non accettiamo mai compensi o pagamenti in cambio delle nostre recensioni. In quanto società mediatica indipendente, Notebookcheck non è soggetta all'autorità di produttori, rivenditori o editori.

Ecco come Notebookcheck esegue i test

Ogni anno, Notebookcheck esamina in modo indipendente centinaia di laptop e smartphone utilizzando procedure standardizzate per garantire che tutti i risultati siano comparabili. Da circa 20 anni sviluppiamo continuamente i nostri metodi di prova e nel frattempo stabiliamo gli standard di settore. Nei nostri laboratori di prova, tecnici ed editori esperti utilizzano apparecchiature di misurazione di alta qualità. Questi test comportano un processo di validazione in più fasi. Il nostro complesso sistema di valutazione si basa su centinaia di misurazioni e parametri di riferimento ben fondati, che mantengono l'obiettività.
Please share our article, every link counts!
Mail Logo
> Recensioni e prove di notebook, tablets e smartphones > Recensioni e prove > Recensioni e prove > Recensione della CPU desktop AMD Ryzen 7 9800X3D: Nessuna possibilità per Arrow Lake di Intel contro la nuova CPU gaming di AMD con 3D V-Cache e architettura Zen 5
Sebastian Bade, 2024-11- 7 (Update: 2024-11-11)