 Deutsch
 English
 Español
 Français
 Italiano
 Nederlands
 Polski
 Português
 Русский
 Türkçe
 Svenska
 Chinese
 Magyar
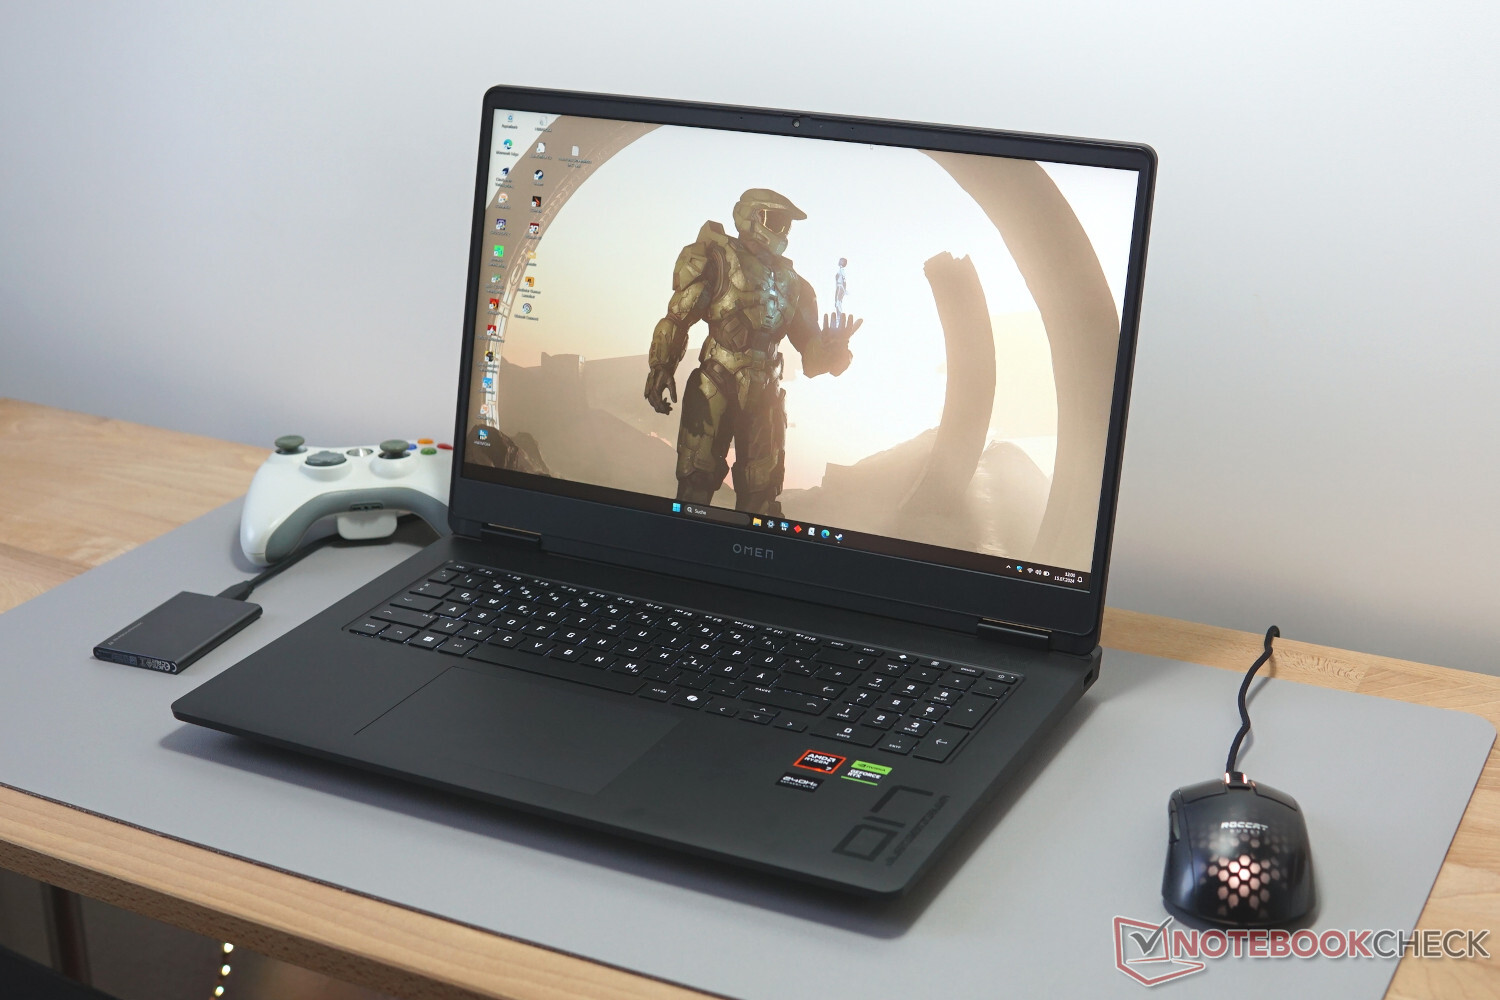
Recensione dell'HP Omen 17 (2024): RTX 4070 e Ryzen 7 mostrano la loro grandezza in questo portatile gaming
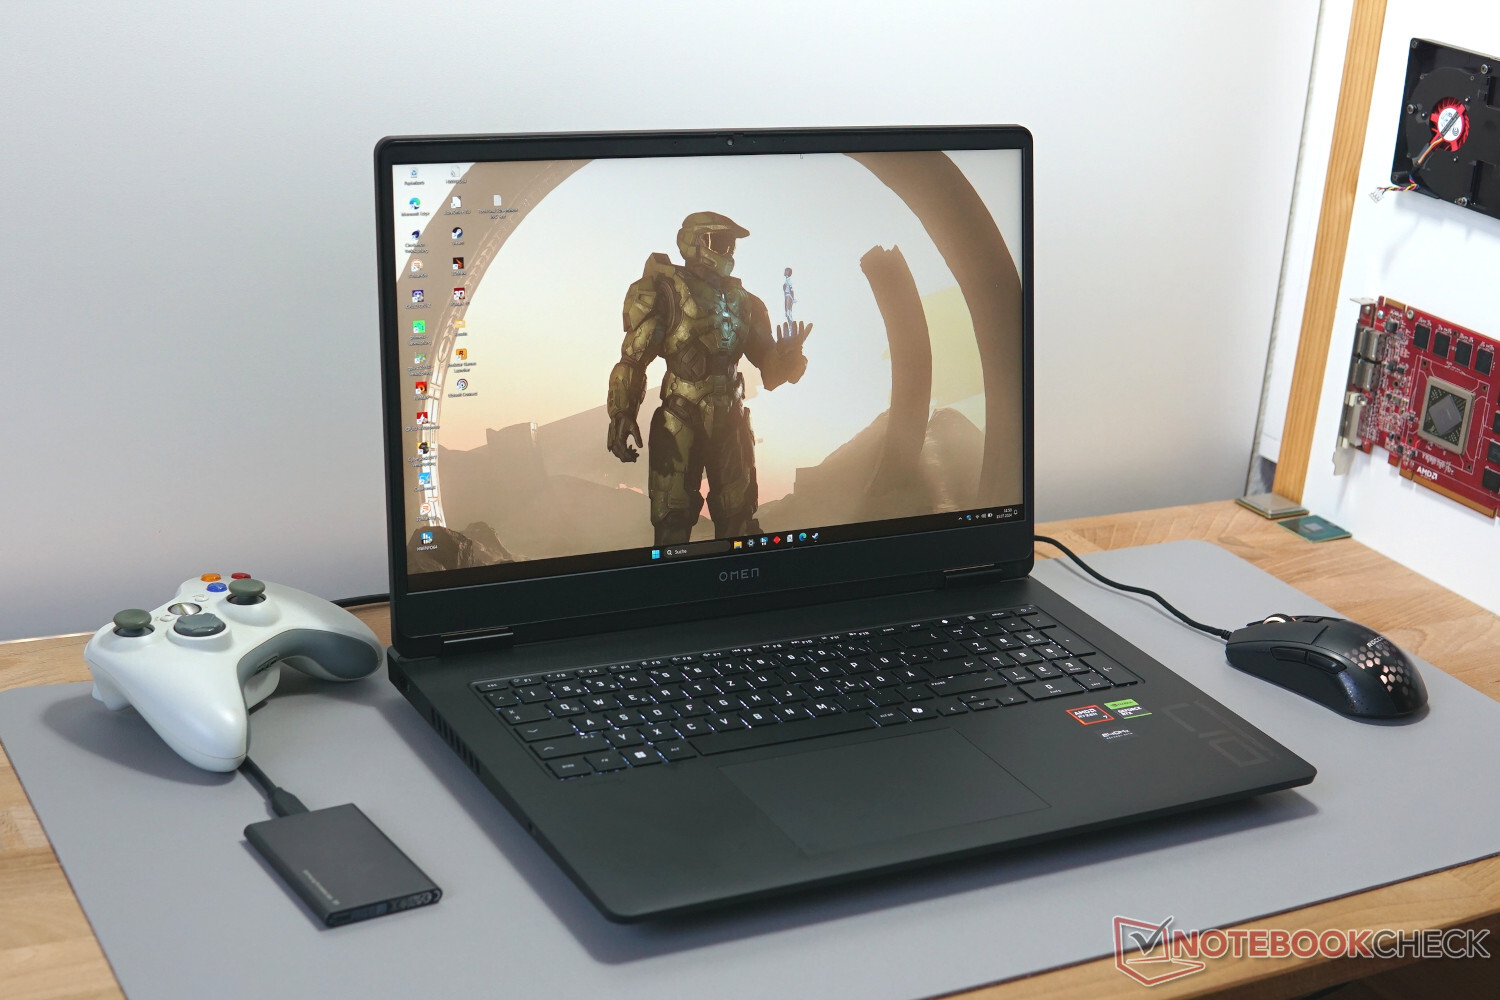
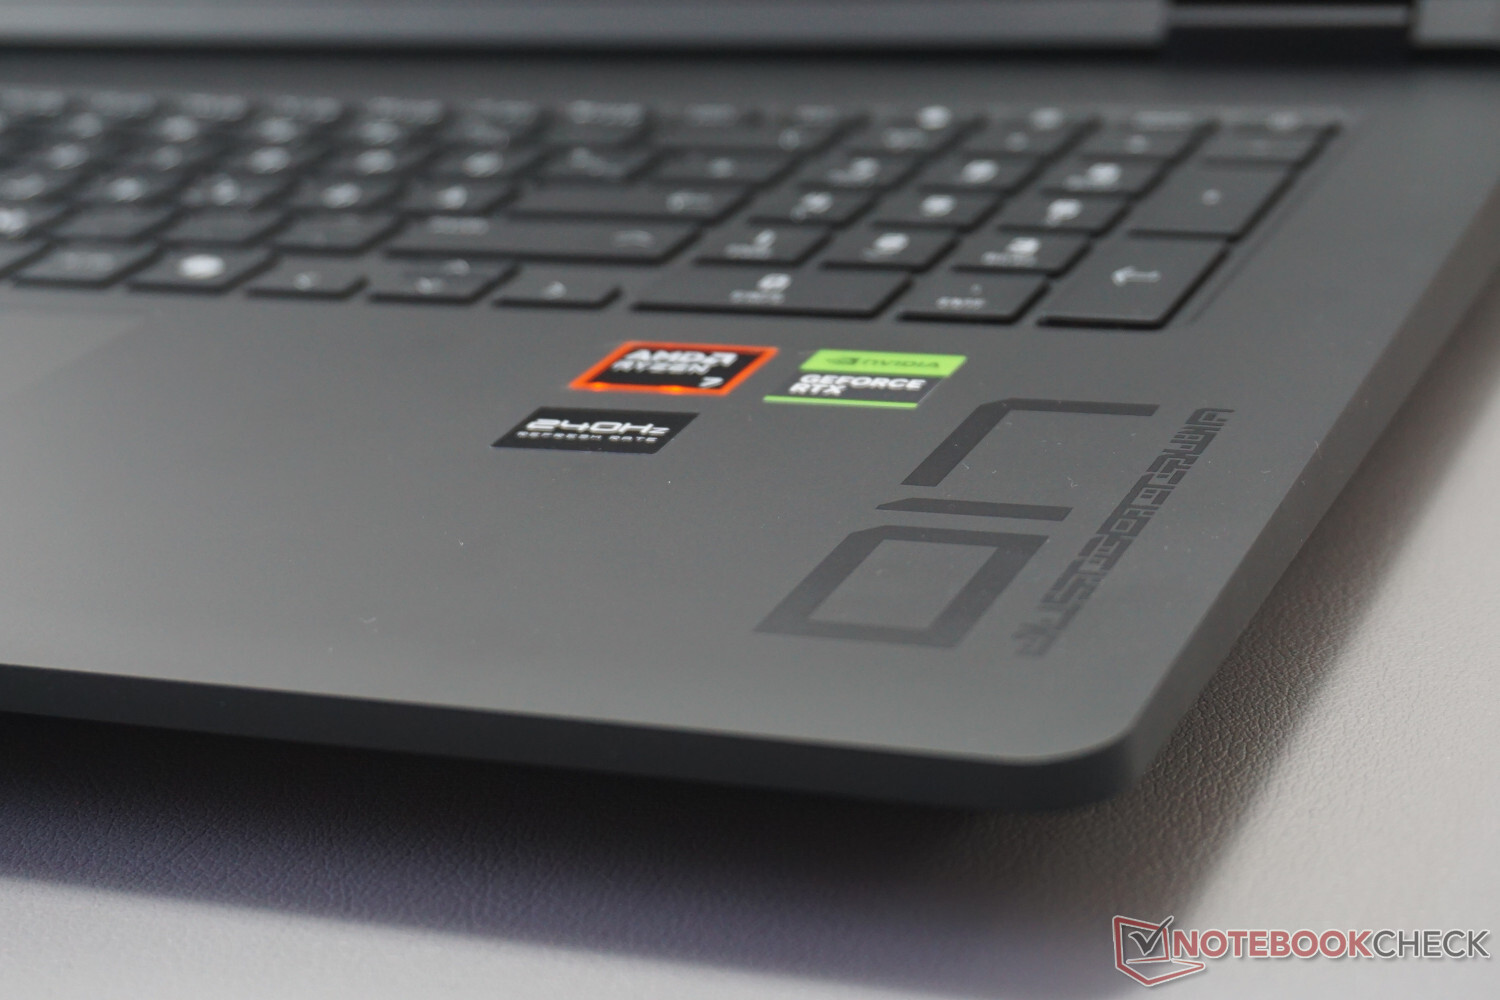
Ben equipaggiato per tutti i giochi attuali di alto livello con una RTX 4070 e AMD Ryzen 7 8845HS, l'HP Omen 17 (2024) è ai blocchi di partenza nella fascia media elevata. Inoltre, è presente un display QHD con una risoluzione adeguata che offre anche una frequenza di aggiornamento di 240 Hertz. Con questo, tutte le basi per un buon portatile da gioco sono coperte
Con così tanto spazio, soprattutto all'interno, possiamo anche aspettarci dei valori di prestazioni stabili che dovrebbero risultare migliori rispetto a quelli dei computer portatili più piccoli. Lo valutiamo in numerosi benchmark e test di gioco.
Il fatto che la nostra unità di prova rimanga al di sotto della soglia di prezzo di 2.000 Euro (~$2.172), nonostante l'elevato livello di equipaggiamento, non è più scontato a questo punto. Per raggiungere questo obiettivo, è necessario accettare diversi compromessi, alcuni dei quali non necessari. Il nostro test mostrerà se è ancora sufficiente per rimanere davanti ai concorrenti, come l' Acer Predator Helios Neo 16 con processore Intel o il Asus TUF Gaming A17 con la generazione precedente di AMD Ryzen 9.
Potenziali concorrenti a confrontos
Punteggio | Version | Data | Modello | Peso | Altezza | Dimensione | Risoluzione | Miglior Prezzo |
|---|---|---|---|---|---|---|---|---|
| 80.4 % | v8 | 07/2024 | HP Omen 17-db0079ng R7 8845HS, NVIDIA GeForce RTX 4070 Laptop GPU | 2.8 kg | 30.1 mm | 17.30" | 2560x1440 | |
| 80.3 % | v8 | 07/2024 | Asus TUF Gaming A15 FA507UV R9 8945H, NVIDIA GeForce RTX 4060 Laptop GPU | 2.1 kg | 22.4 mm | 15.60" | 1920x1080 | |
| 90.2 % | v7 (old) | 03/2024 | Alienware m16 R2 Ultra 7 155H, NVIDIA GeForce RTX 4070 Laptop GPU | 2.5 kg | 23.5 mm | 16.00" | 2560x1600 | |
| 87.6 % | v7 (old) | 04/2024 | Asus ROG Strix Scar 16 G634JZR i9-14900HX, NVIDIA GeForce RTX 4080 Laptop GPU | 2.7 kg | 30.4 mm | 16.00" | 2560x1600 | |
| 86.8 % | v7 (old) | 05/2024 | Acer Predator Helios Neo 16 (2024) i7-14700HX, NVIDIA GeForce RTX 4070 Laptop GPU | 2.6 kg | 25.95 mm | 16.00" | 2560x1600 | |
| 85.6 % | v7 (old) | 01/2024 | Asus TUF Gaming A17 FA707XI-NS94 R9 7940HS, NVIDIA GeForce RTX 4070 Laptop GPU | 2.5 kg | 25.4 mm | 17.30" | 1920x1080 |
Tenga presente che abbiamo recentemente aggiornato il nostro sistema di valutazione e che i risultati della versione 8 non sono più confrontabili con quelli della versione 7. Può trovare ulteriori informazioni al riguardo qui.
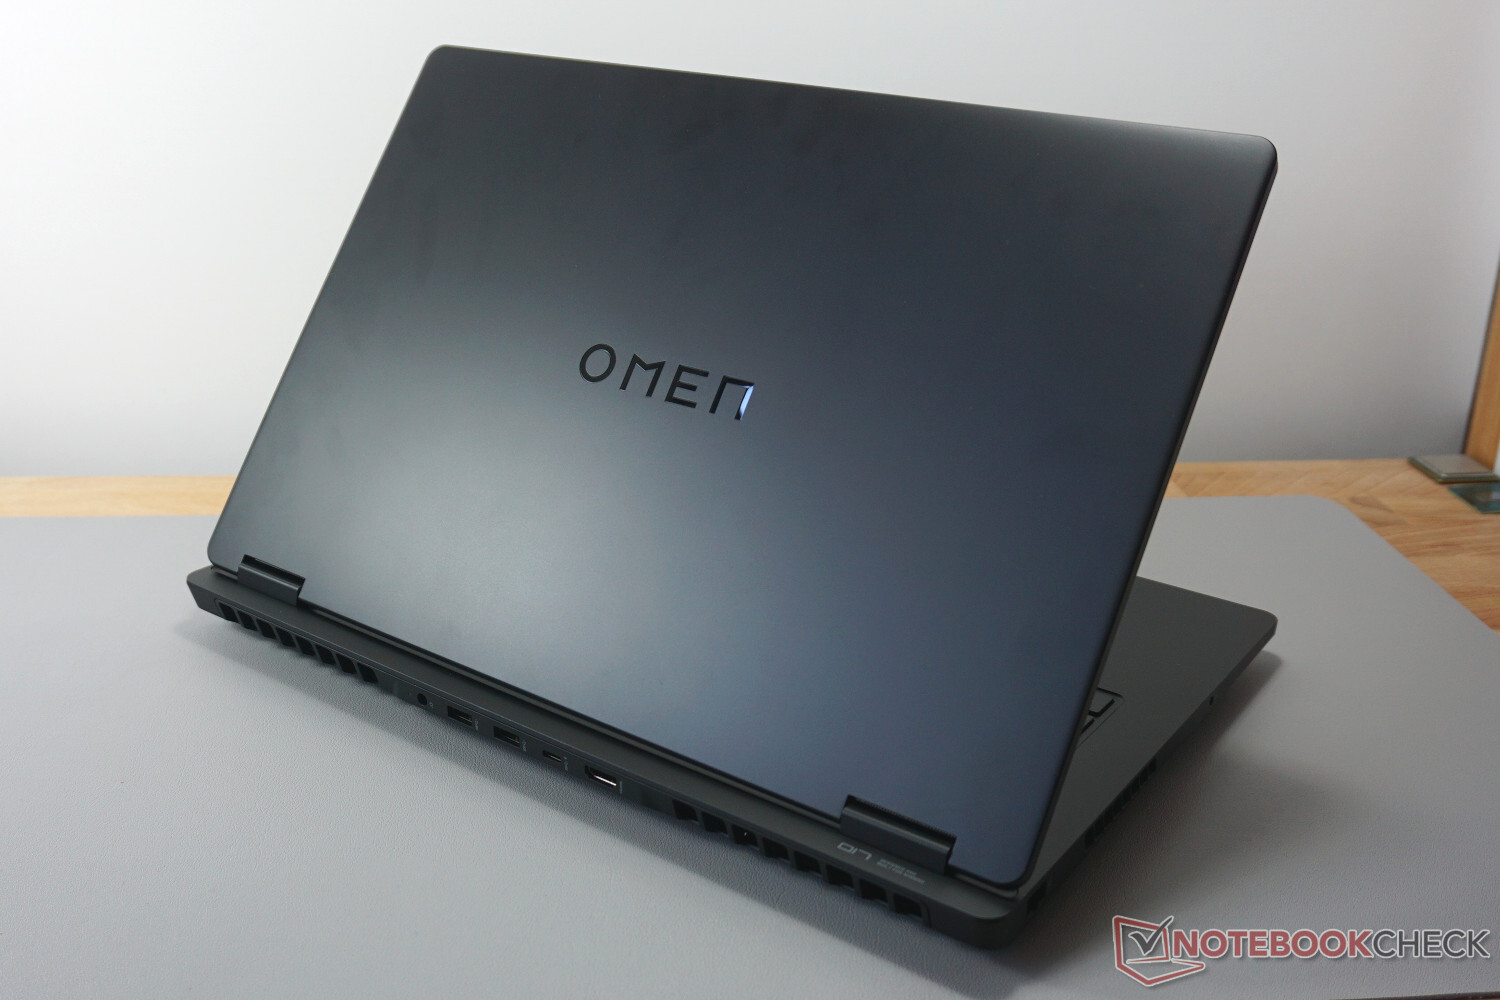
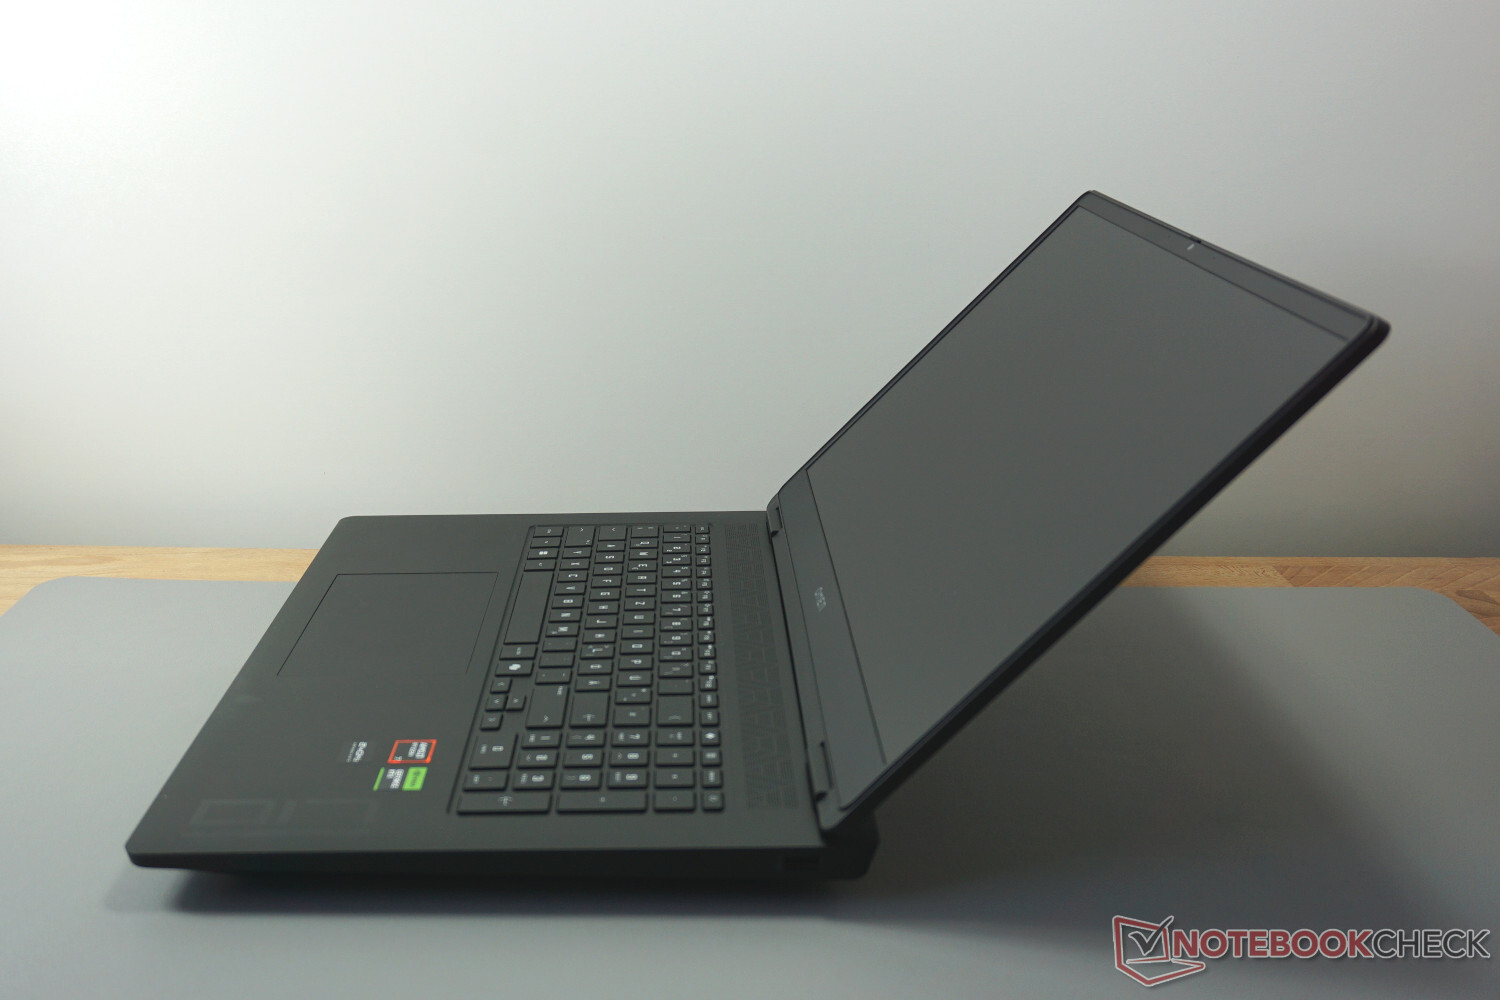
Caso - Un giocatore grande e pesante
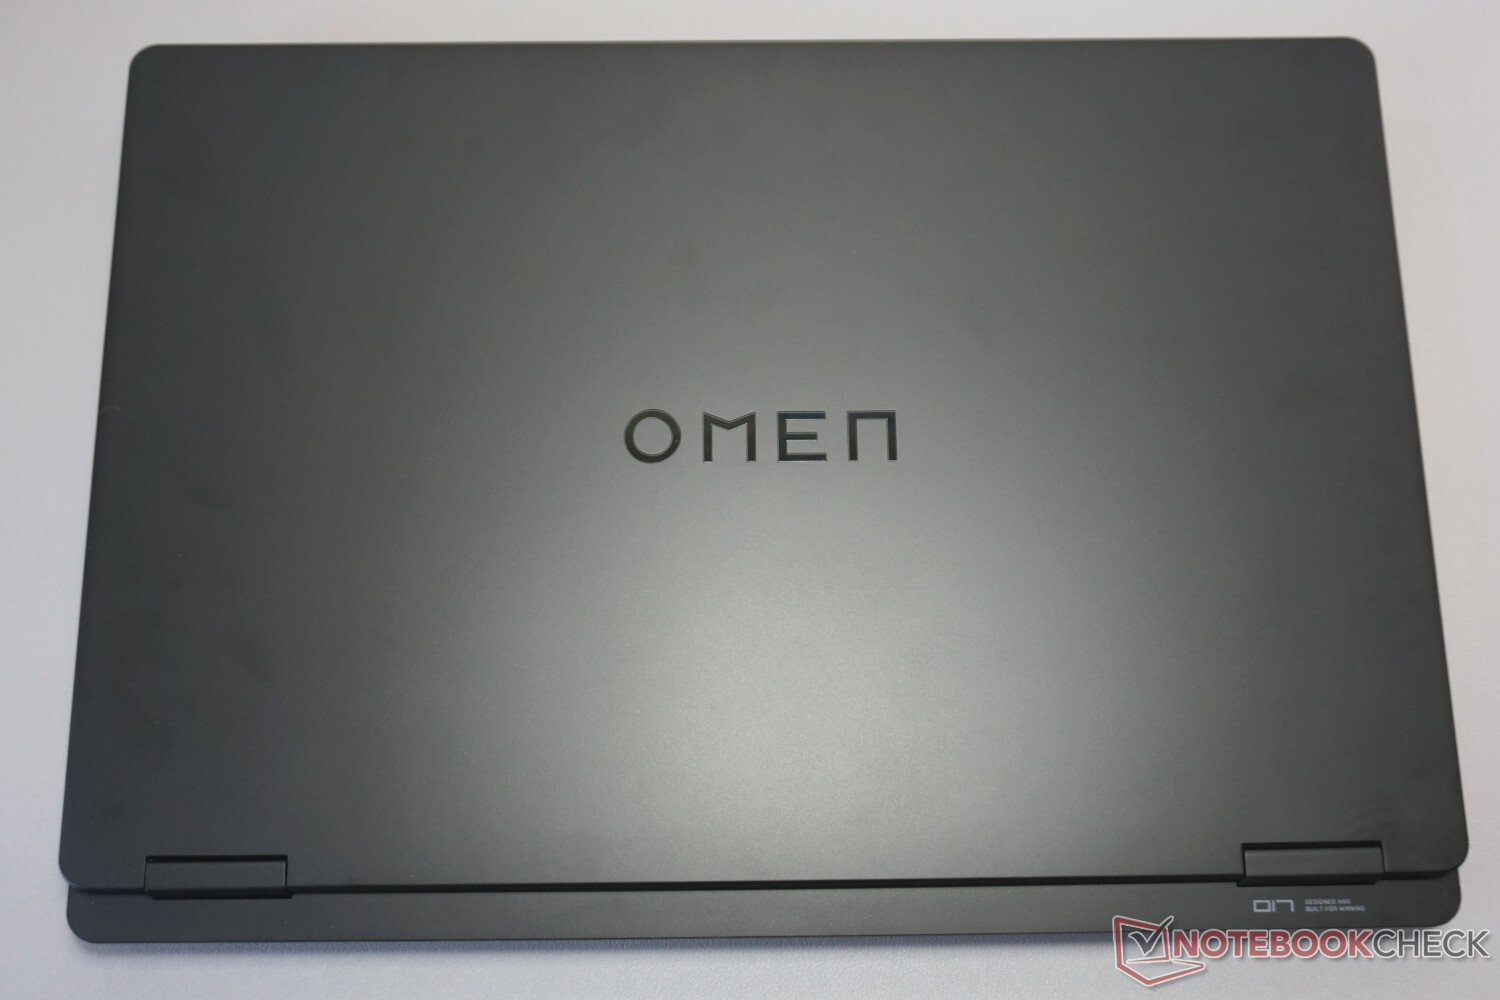
L'aspetto della cassa è quasi insignificante. La plastica nera, che si sente anche, domina tutto intorno. Non ci sono punti di forza visivi, piccoli dettagli o effetti di luce da ammirare.
Ma quando si cerca di sollevare il portatile - o quando lo si estrae direttamente dalla scatola nel nostro caso - diventa chiaro che HP non ha risparmiato sull'utilizzo di componenti massicci all'interno. Il peso non è lontano dai 3 kg (~6,6 lb), anche se la base rimane inalterata se lo si solleva su un solo angolo anteriore. Tutto rimane rigido e stretto.
Le cerniere del display offrono un'impressione simile, ma il coperchio del display avrebbe potuto avere un po' più di stabilità, rimanendo abbastanza pieghevole senza una cornice metallica aggiuntiva.
In termini di dimensioni complessive, ci sono solo pochi modelli che sono ancora più grandi. Una larghezza di 40 cm (~15,7 in) e un'altezza di 3 cm (~1,2 in), anche senza i piedini, non sembrano davvero una grande mobilità. D'altra parte, questo garantisce molto spazio per l'hardware e il raffreddamento, anche se potrebbe risultare troppo grande per alcune borse o zaini per computer portatili.
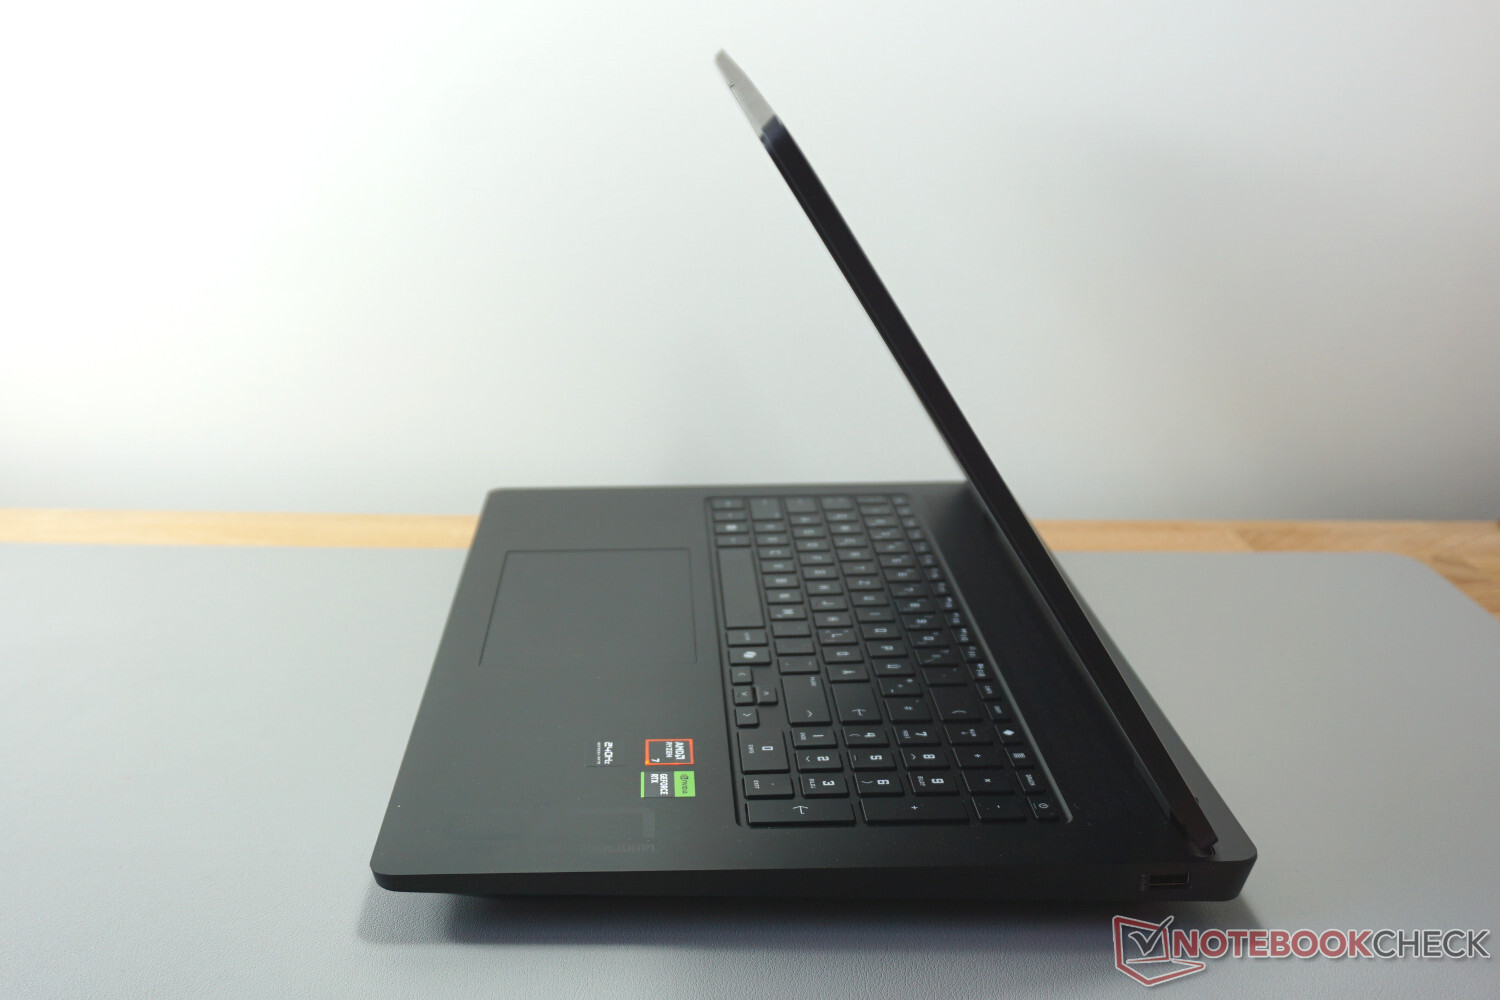
Apparecchiature di connessione - Omen 17 con poche aree da far brillare
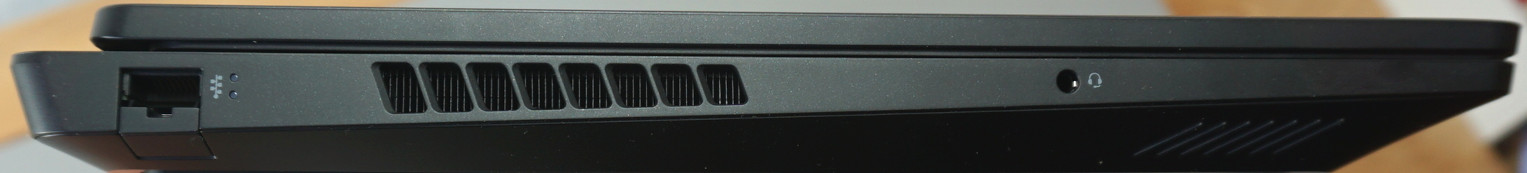
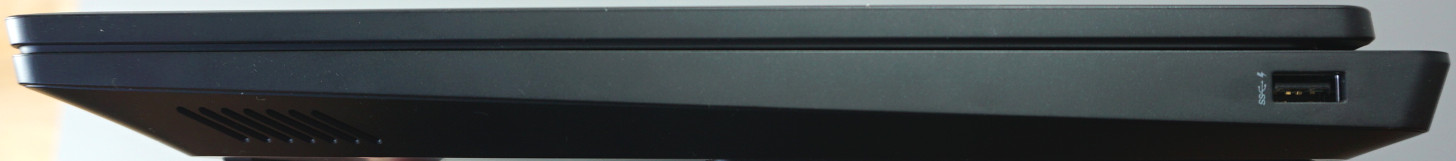
Anche se ci sarebbe stato molto spazio, le porte di connessione sono limitate. E non solo, ma sono anche le versioni più lente. Tutte le connessioni USB sul retro raggiungono solo 10 Gbit/s e quella sul lato addirittura solo 5 Gbit/s. USB4 o TB4 sarebbero state quattro o otto volte più veloci. Ma almeno le porte sul retro dovrebbero consentire di giocare a molti giochi da un SSD esterno.
Allo stesso modo, anche la porta LAN raggiunge solo 1 Gbit/s, mentre i concorrenti meglio equipaggiati come l' Acer Predator Helios Neo vanno più al passo con i tempi offrendo 2,5 Gbit/s. Anche la posizione della porta sul lato sinistro non è ottimale e sarebbe stata meglio sul retro. Inoltre, non c'è una terza porta video né un lettore di schede.
Per lo meno, le uscite video HDMI e USB-C supportano la visualizzazione di 4K@120Hz, consentendo a chi ha un televisore adatto di farne buon uso.

Comunicazione
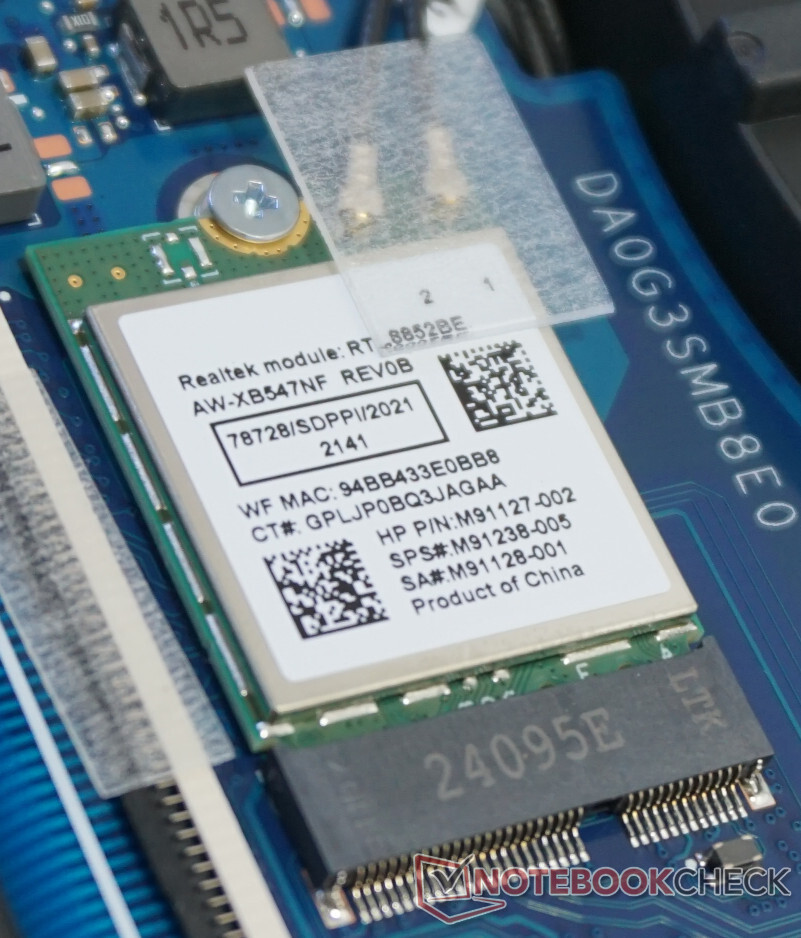
Il modulo WLAN funziona bene nei limiti delle sue capacità. Con una velocità di quasi 1 Gbit/s in condizioni ideali, è quasi pari a quella di una connessione cablata. Non ci sono state cadute degne di nota durante il nostro test.
Sebbene il modulo Wi-Fi 6 garantisca una connessione stabile e affidabile, non è certo adatto al trasferimento di grandi quantità di dati.
Webcam
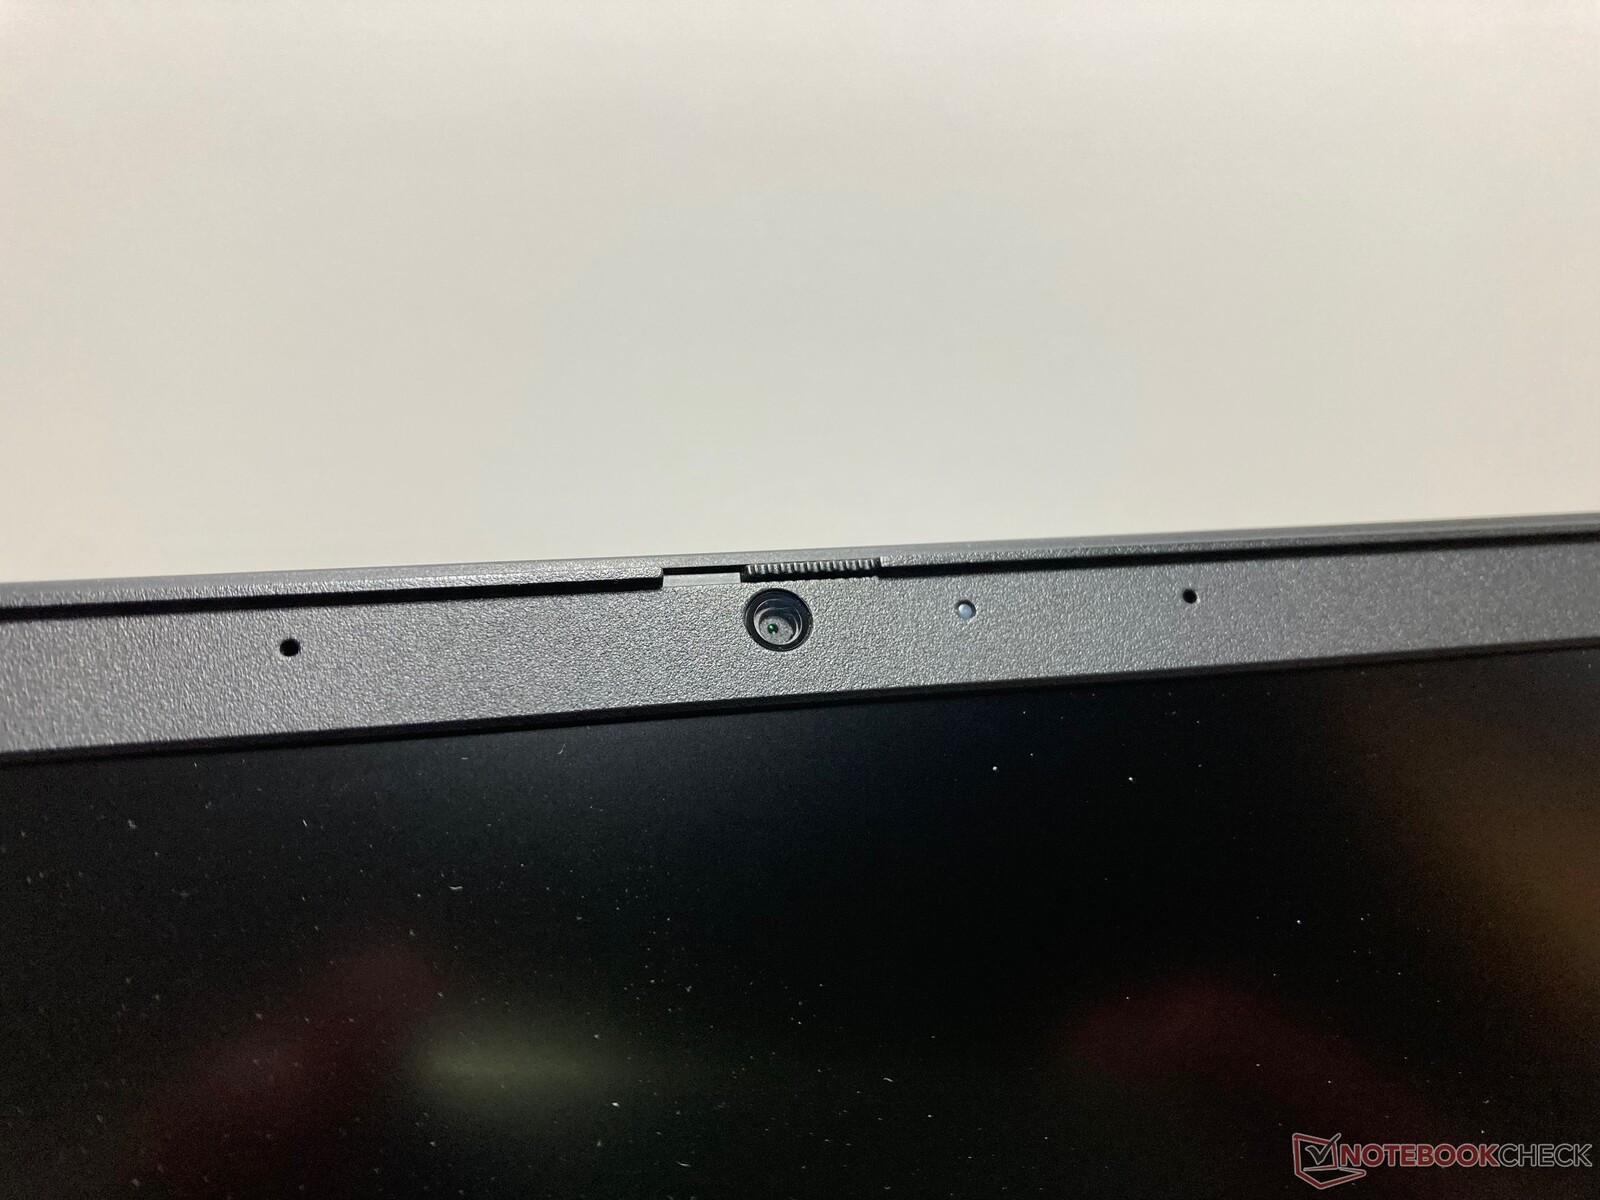
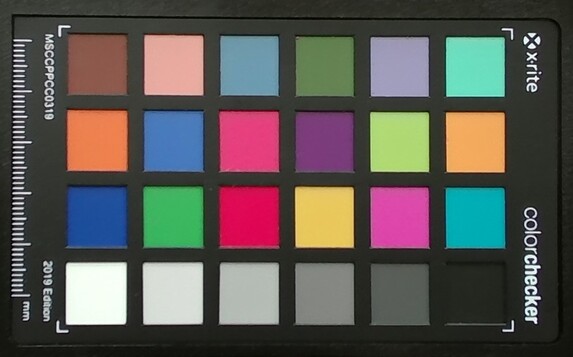
Una risoluzione Full-HD decente si traduce in immagini dettagliate. Ma questo vale solo per una luce sufficientemente intensa nella stanza. Anche una plafoniera non molto luminosa comporta un calo della qualità dell'immagine. La fotocamera è difficilmente in grado di gestire condizioni di luce debole. I dettagli si perdono e la riproduzione dei colori ne risente notevolmente. La precisione del colore è convincente per una fotocamera alloggiata nella cornice del display solo se la luce circostante è intensa. Pertanto, non possiamo consigliare di utilizzare la fotocamera per più di qualche videochiamata.
Questo è un peccato, perché il microfono ha un certo potenziale. Sebbene le sue registrazioni abbiano un suono leggermente metallico, sono sempre registrate allo stesso volume e risultano molto chiare. È persino possibile sentire facilmente le voci provenienti dall'esterno della stanza.


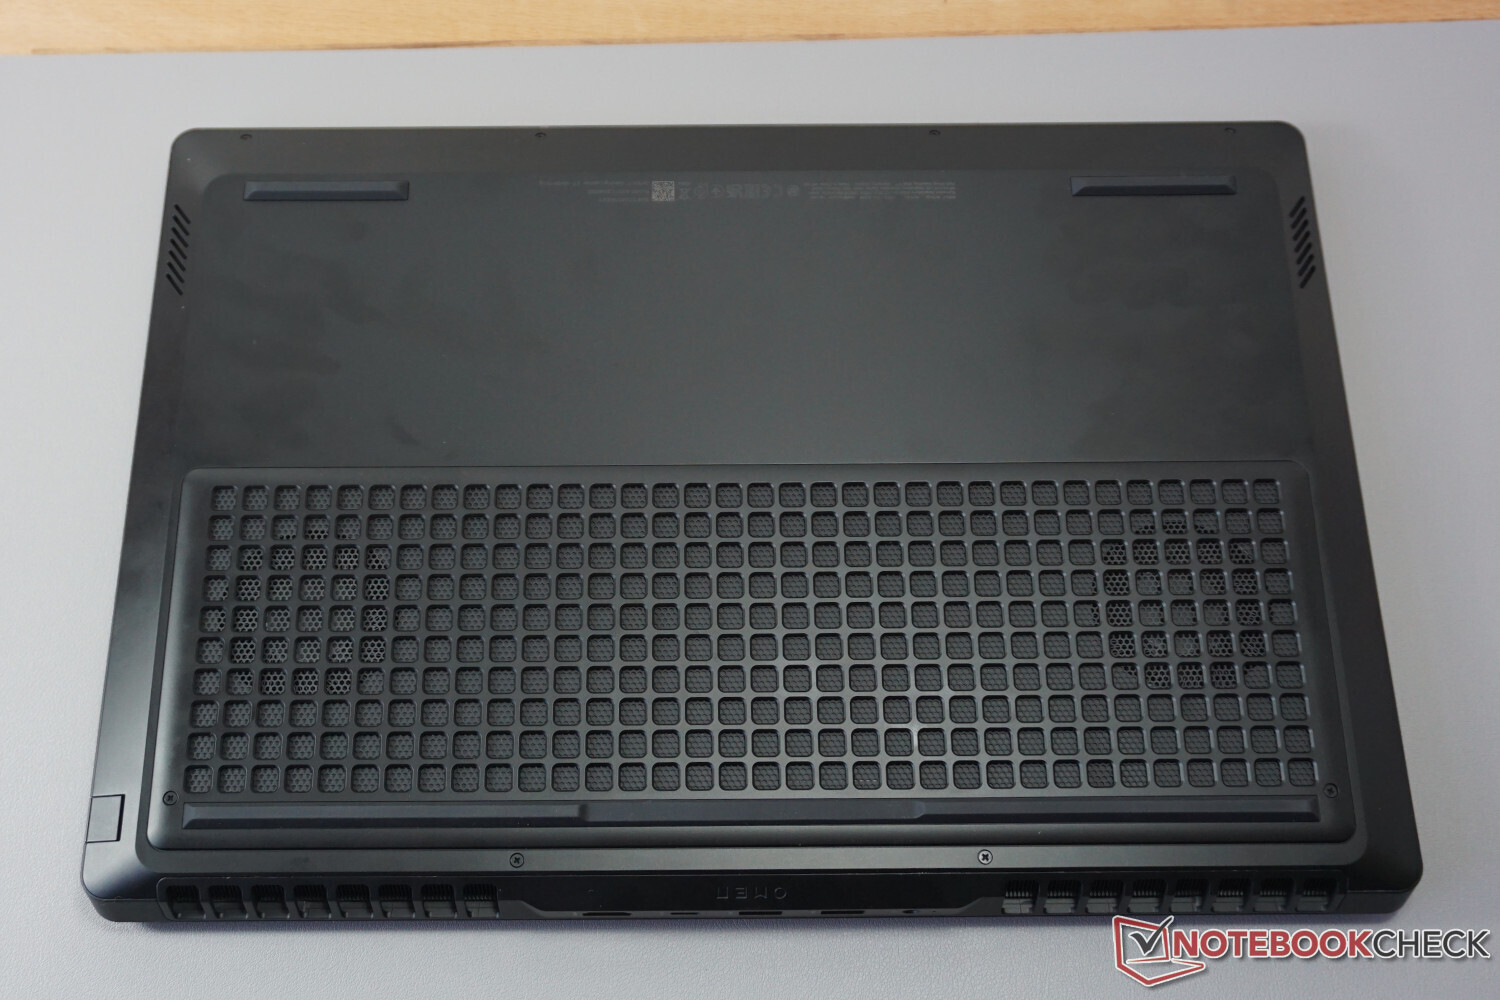
Manutenzione
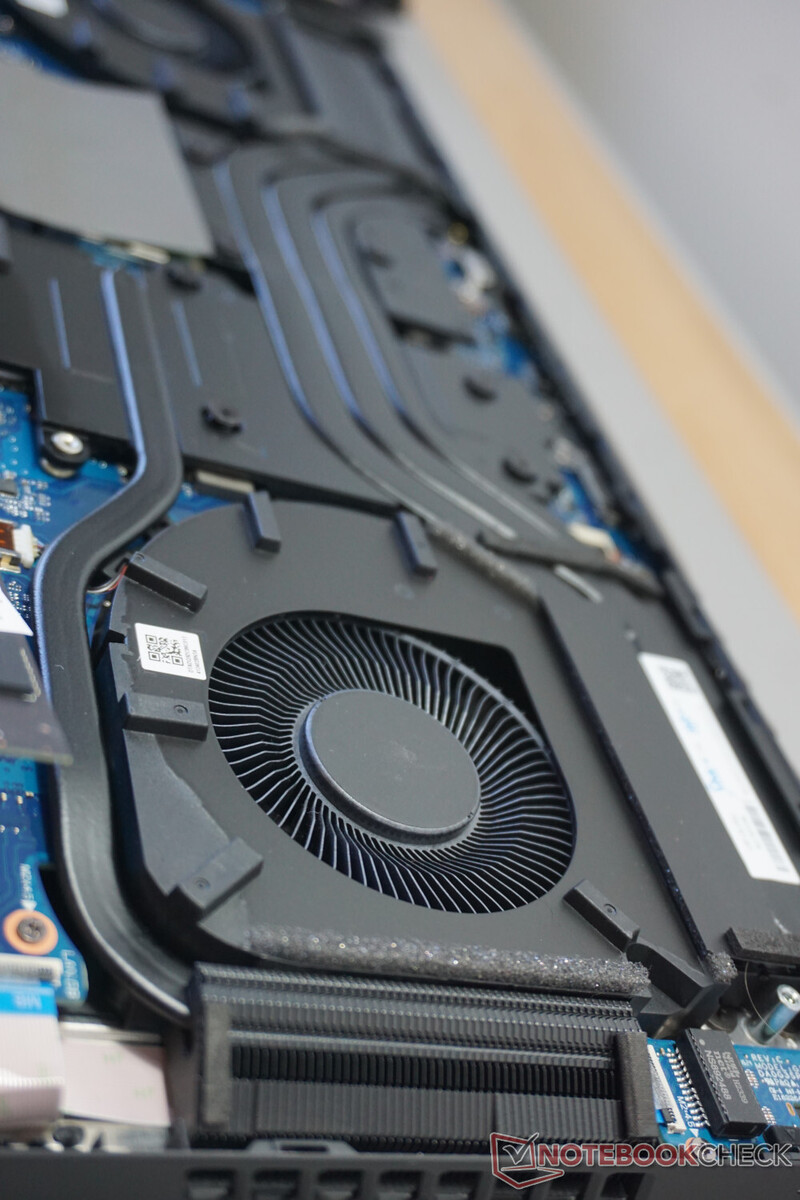
HP Omen 17 raccoglie alcuni punti positivi con la sua facilità di apertura del fondo del case. Una volta rimosse le otto normali viti Philips, il coperchio del case non offre alcuna resistenza e può essere facilmente rimosso senza l'uso della forza.
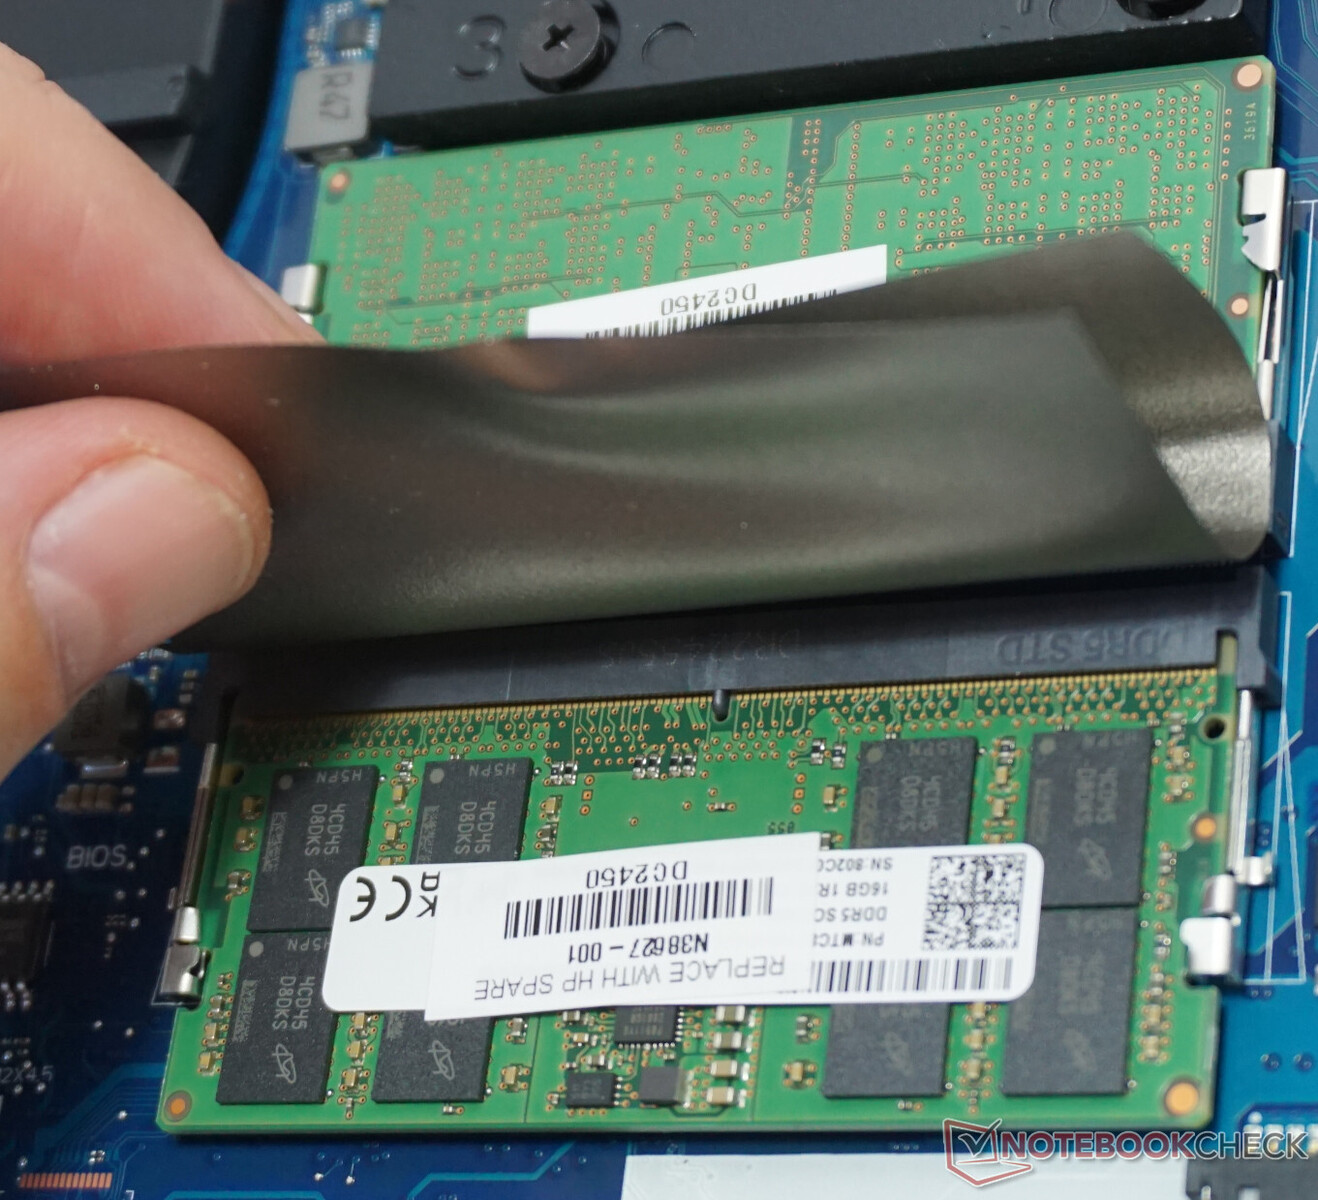
In questo modo è possibile accedere alla pulizia delle ventole e alla sostituzione di tutti i componenti importanti. Due slot per la RAM, un modulo WLAN con spinotti per l'antenna facilmente accessibili, due slot per SSD e una batteria che può essere facilmente rimossa non sono cose che molti dei portatili più compatti sono in grado di offrire, almeno non in questa combinazione completa.
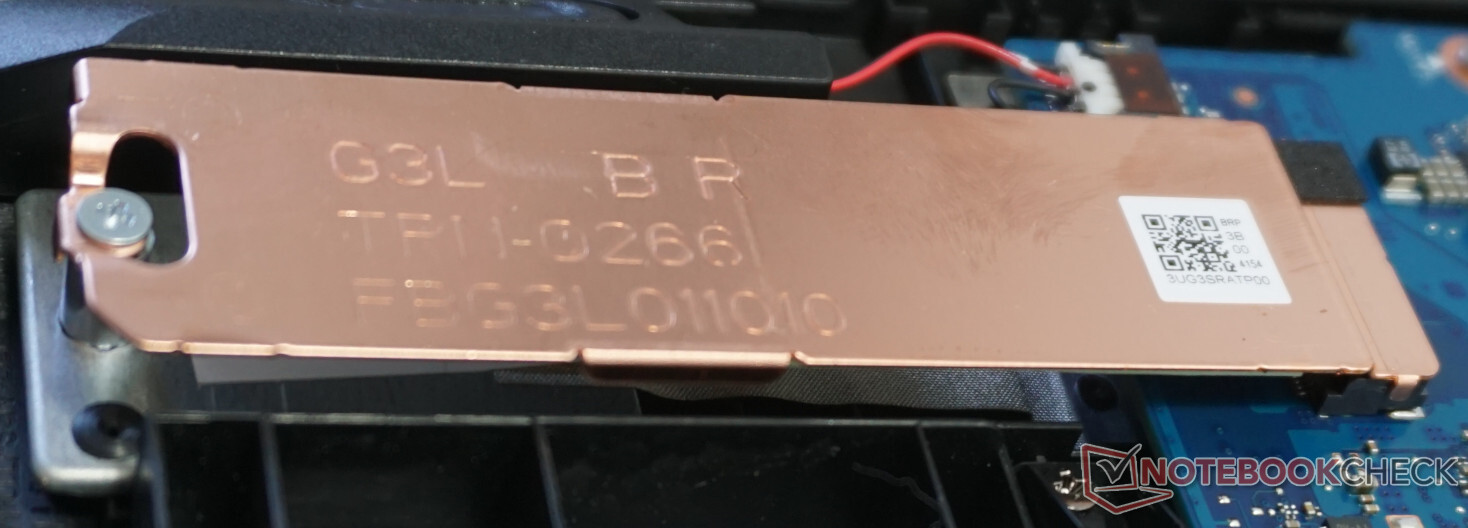
Inoltre, ci sono delle coperture in rame per gli slot SSD M.2 che apparentemente hanno un effetto, come scopriremo più avanti nel test. Uno degli slot è ancora disponibile, rendendo facilmente realizzabile un'aggiunta successiva di spazio di archiviazione.

Sostenibilità
L'imballaggio è costituito principalmente da cartone e carta. Anche il coperchio protettivo del portatile e la tastiera sono fatti di carta. Solo il caricabatterie è avvolto in un foglio di plastica protettivo. Inoltre, c'è anche la facilità di manutenzione del portatile, che sicuramente gioverà alla longevità dell'Omen 17. Dalla memoria di lavoro alla batteria, tutto può essere sostituito.
Poi c'è il consumo energetico moderato con le attività quotidiane, che si aggira per lo più sotto i 10 watt. Un tipico PC desktop è chiaramente svantaggiato in questo caso.
Infine, HP pubblica ogni anno un rapporto di sostenibilità che illustra le iniziative del produttore, che partono dalla generazione di energia da fonti rinnovabili e arrivano fino all'obiettivo della parità di trattamento di tutti i dipendenti a tutti i livelli della struttura aziendale. Può scoprire i dettagli qui.
Garanzia
Sebbene HP garantisca una garanzia di due anni, non offre alcun extra come la riparazione in loco. A seconda del fornitore, potrebbe anche essere in grado di prenotare alcune opzioni di garanzia aggiuntive.
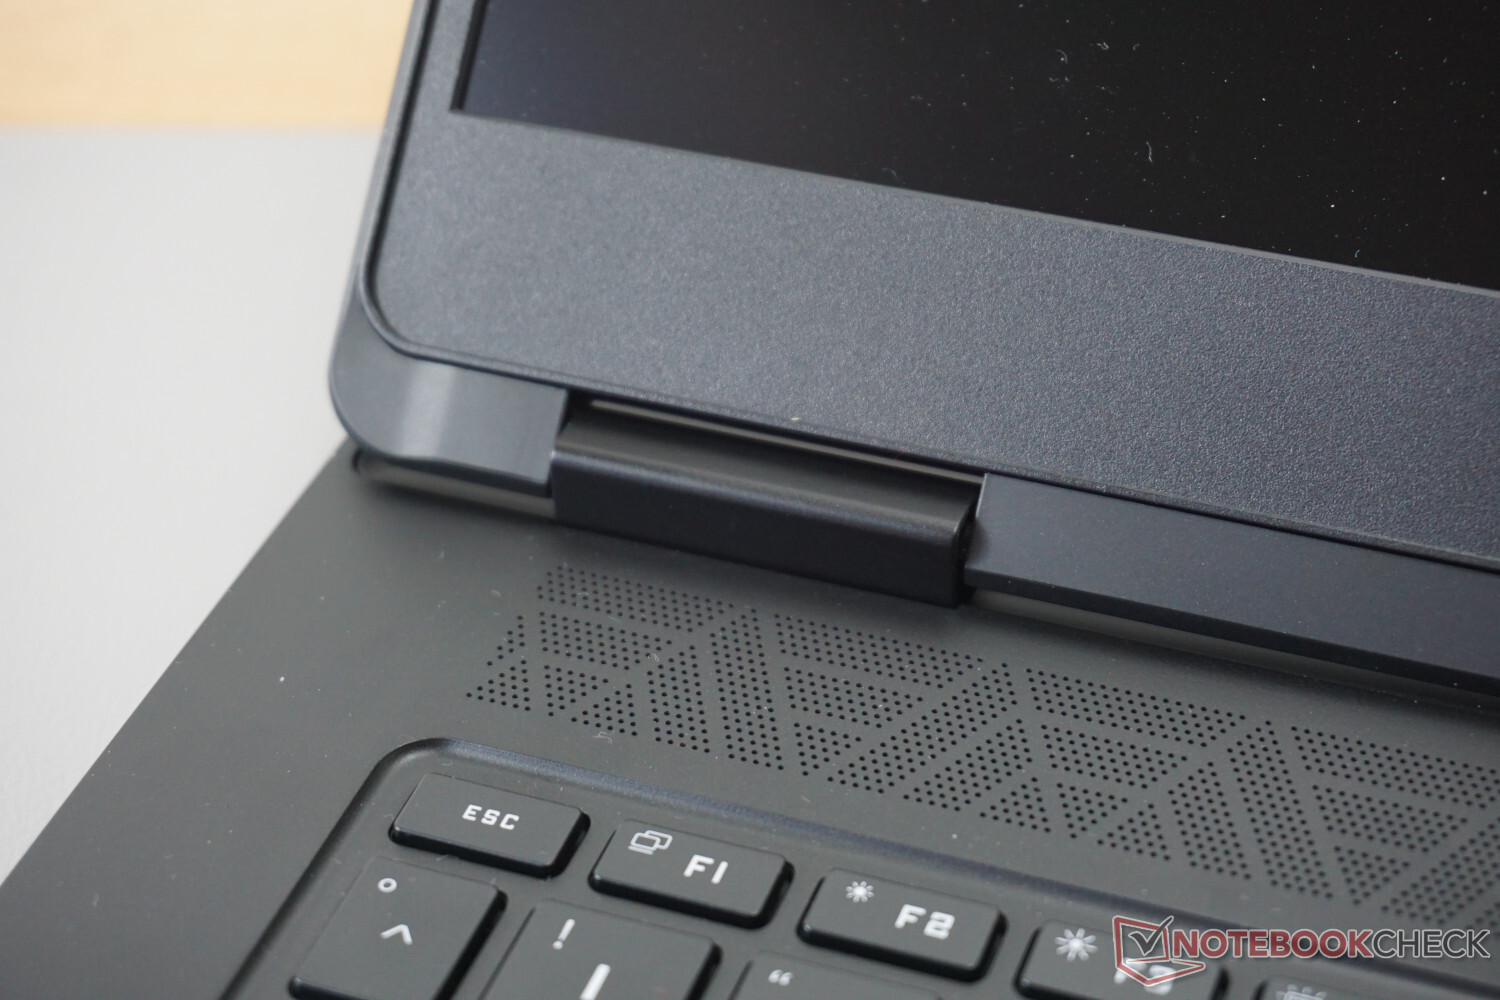
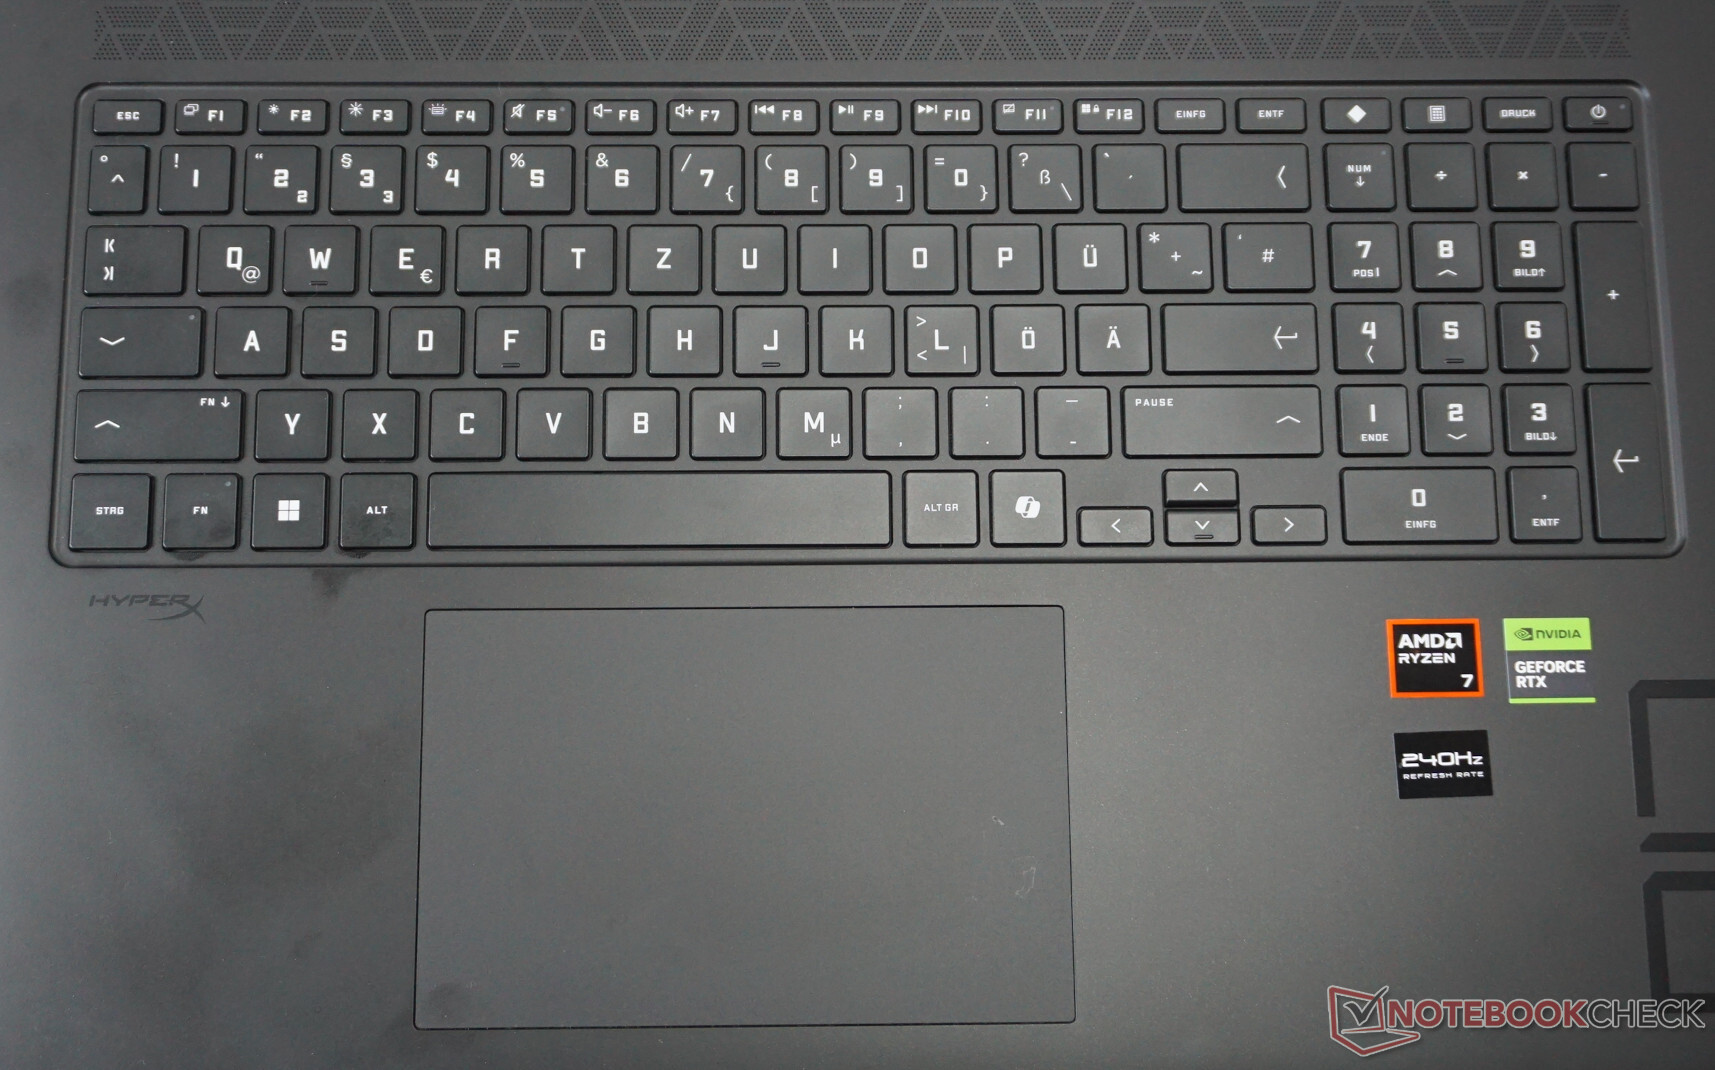
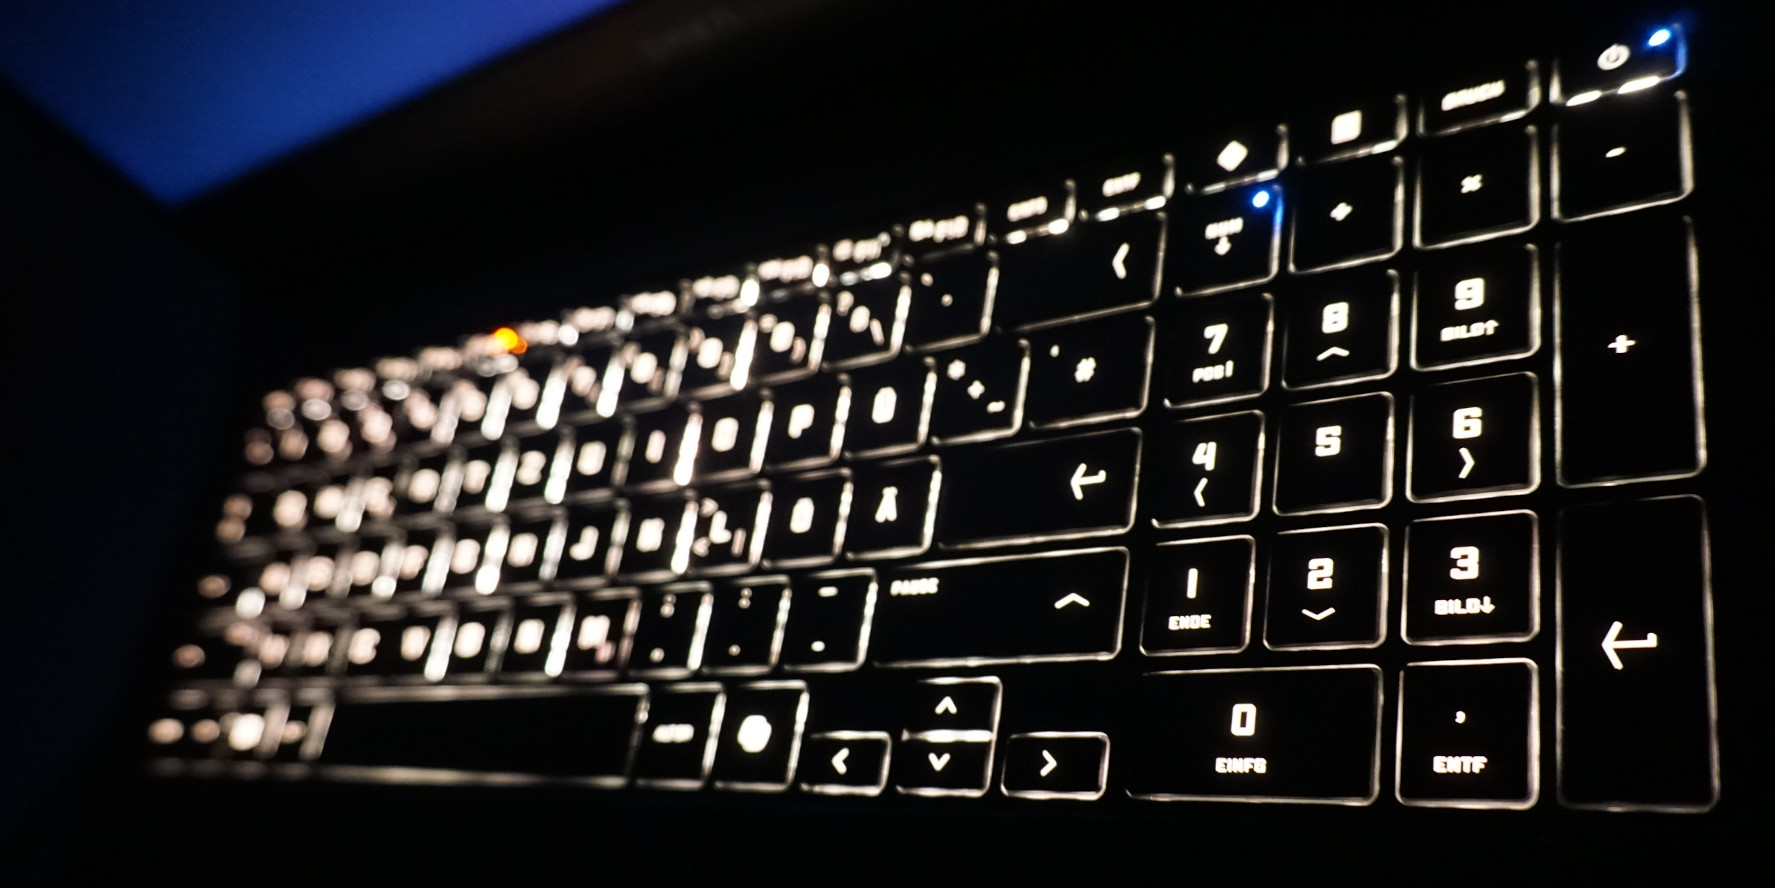
Dispositivi di input - HP Omen 17 offre solo la tariffa standard
La tastiera non sembra adatta a un portatile da gioco. La corsa dei tasti è breve e la resistenza dei tasti è appena percettibile. Inoltre, alla tastiera manca l'illuminazione regolabile individualmente. Anche se è possibile selezionare quasi tutti i colori con regolazioni fini della luminosità, tutti i tasti sono illuminati dello stesso colore. Almeno i tasti freccia avrebbero dovuto essere a grandezza naturale.
Il touchpad mostra un quadro simile. Anche se, con le sue dimensioni di 13 x 8 cm (5,1 x 3,15 pollici), è di dimensioni confortevoli e risponde in modo molto preciso, la pressione dei tasti appare meno ben regolata. Una pressione più forte provoca un evidente ticchettio. Sebbene sia complessivamente sufficiente per le attività di tutti i giorni - la tastiera offre anche una cornice stretta e una buona esperienza di digitazione - coloro che vogliono dedicarsi a giochi più intensi sono quasi costretti a utilizzare dispositivi di input aggiuntivi.
Display - Ben adattato alle prestazioni di gioco offerte
Se pensa a ciò che un buon display da gioco in un computer portatile deve essere in grado di fare, il display QHD di HP Omen 17 è abbastanza preciso. In combinazione con una diagonale di 17 pollici, la risoluzione garantisce un'immagine nitida e dettagliata.
Oltre che per i giochi, il formato 16:9 è adatto anche per lo streaming. I colori del pannello IPS appaiono abbastanza naturali e la superficie opaca evita anche i fastidiosi riflessi.
La frequenza di aggiornamento di 240 Hertz e lo spazio colore sufficientemente ampio assicurano che i vari generi di gioco vengano visualizzati come desiderato. Anche i tempi di risposta nelle nostre misurazioni sono in grado di tenere il passo con quelli dei modelli migliori, raggiungendo un livello considerevolmente più alto rispetto a quelli dell' Asus TUF Gaming 17, ad esempio.
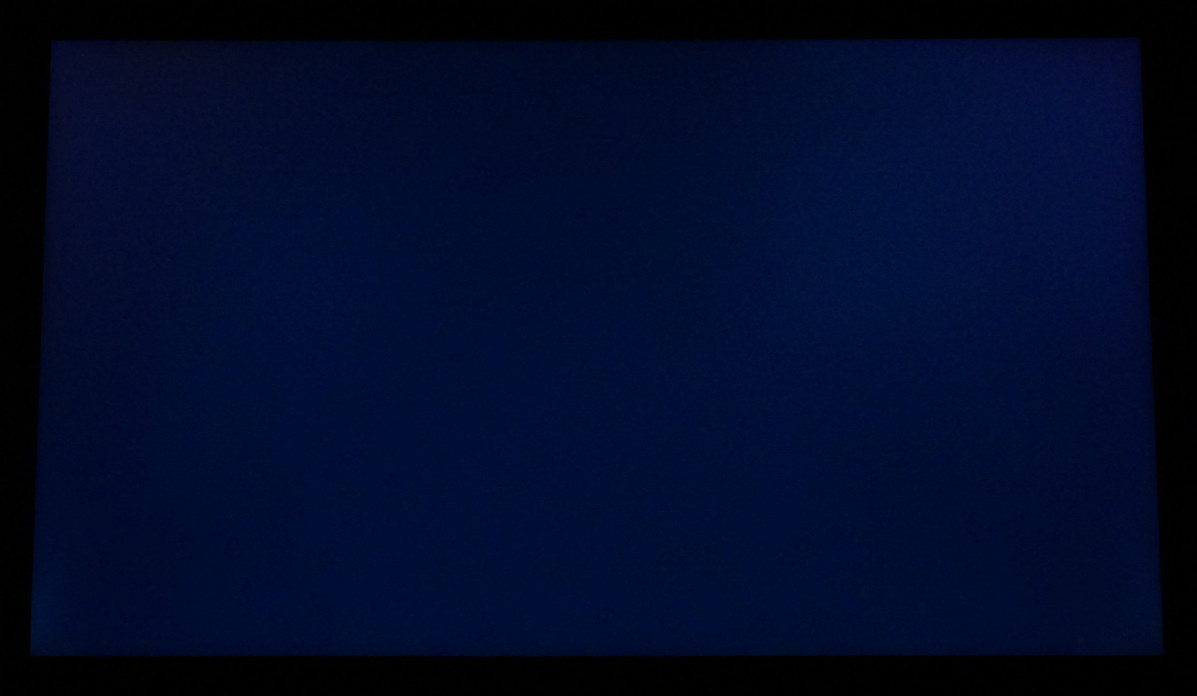
Ciò che è meno impressionante è il contrasto e il valore del nero. Anche per un pannello IPS, dove non ci aspettiamo comunque un nero perfetto, l'immagine appare troppo luminosa, con un'oscurità assoluta. D'altra parte, non siamo riusciti a rilevare alcuno screen bleeding a occhio nudo, o solo in minima parte con un'esposizione prolungata. Inoltre, nel nostro test non abbiamo riscontrato alcuno sfarfallio dovuto alla Pulse Width Modulation.
Inoltre, HP offre anche una versione Full-HD con 144 Hertz, che potrebbe essere un'opzione sensata in combinazione con una RTX 4060.
| |||||||||||||||||||||||||
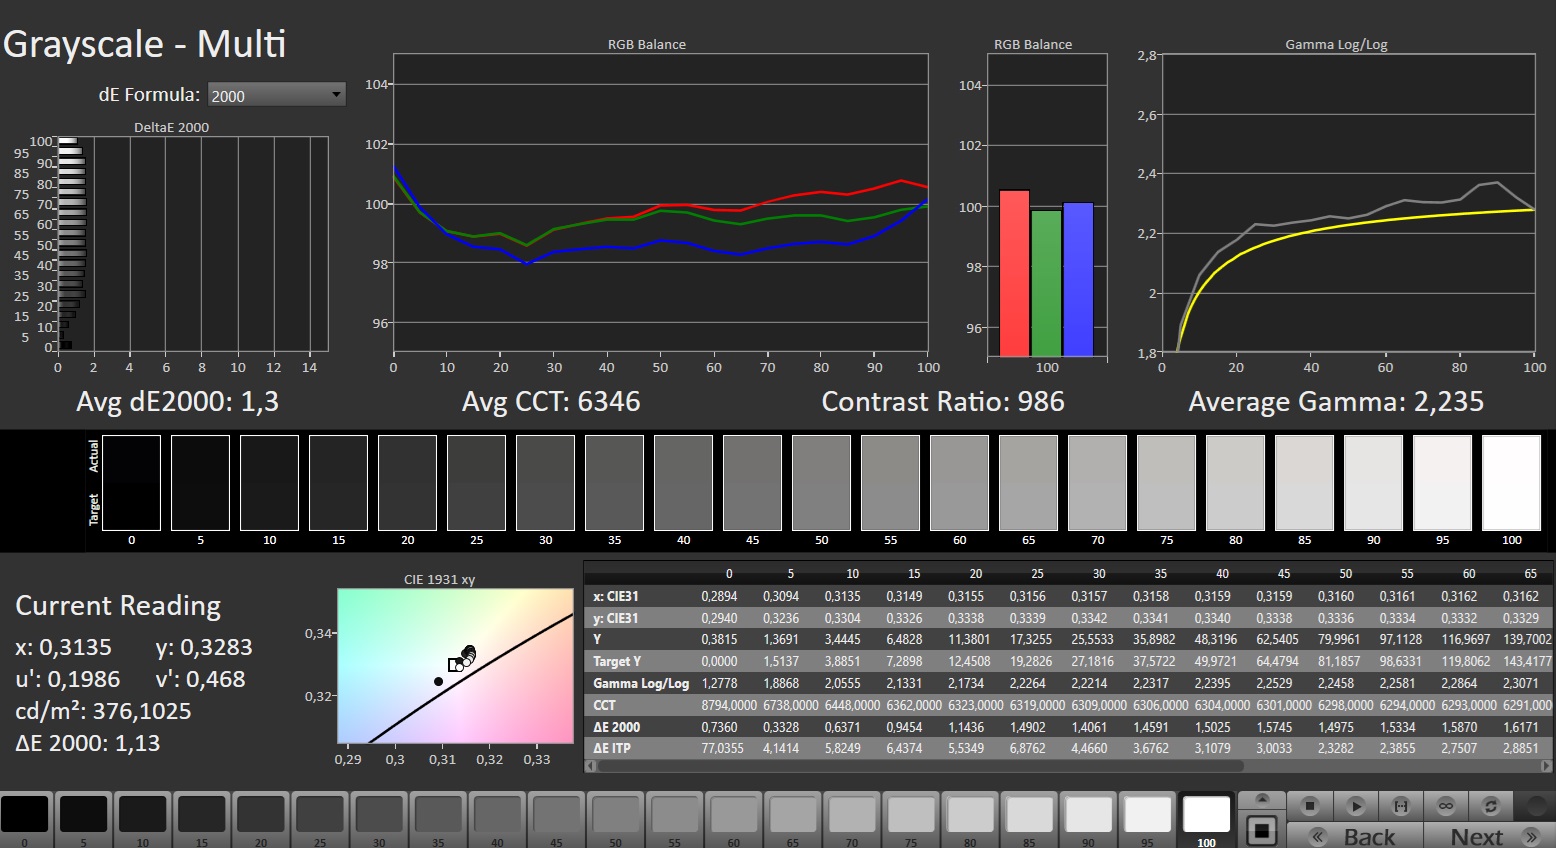
Distribuzione della luminosità: 84 %
Al centro con la batteria: 363 cd/m²
Contrasto: 955:1 (Nero: 0.38 cd/m²)
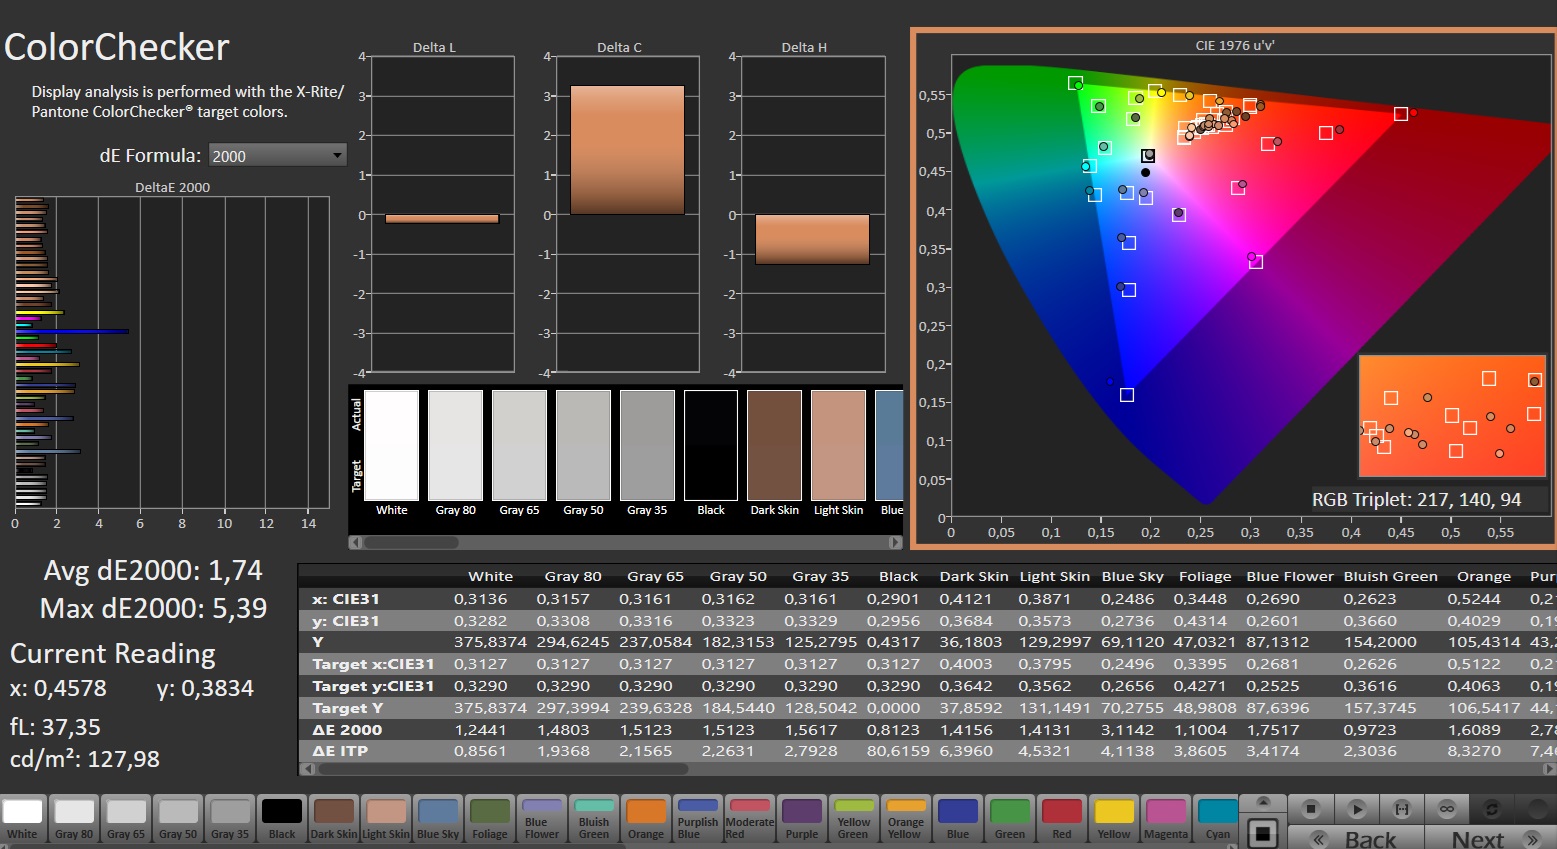
ΔE Color 1.74 | 0.5-29.43 Ø4.95, calibrated: 1.43
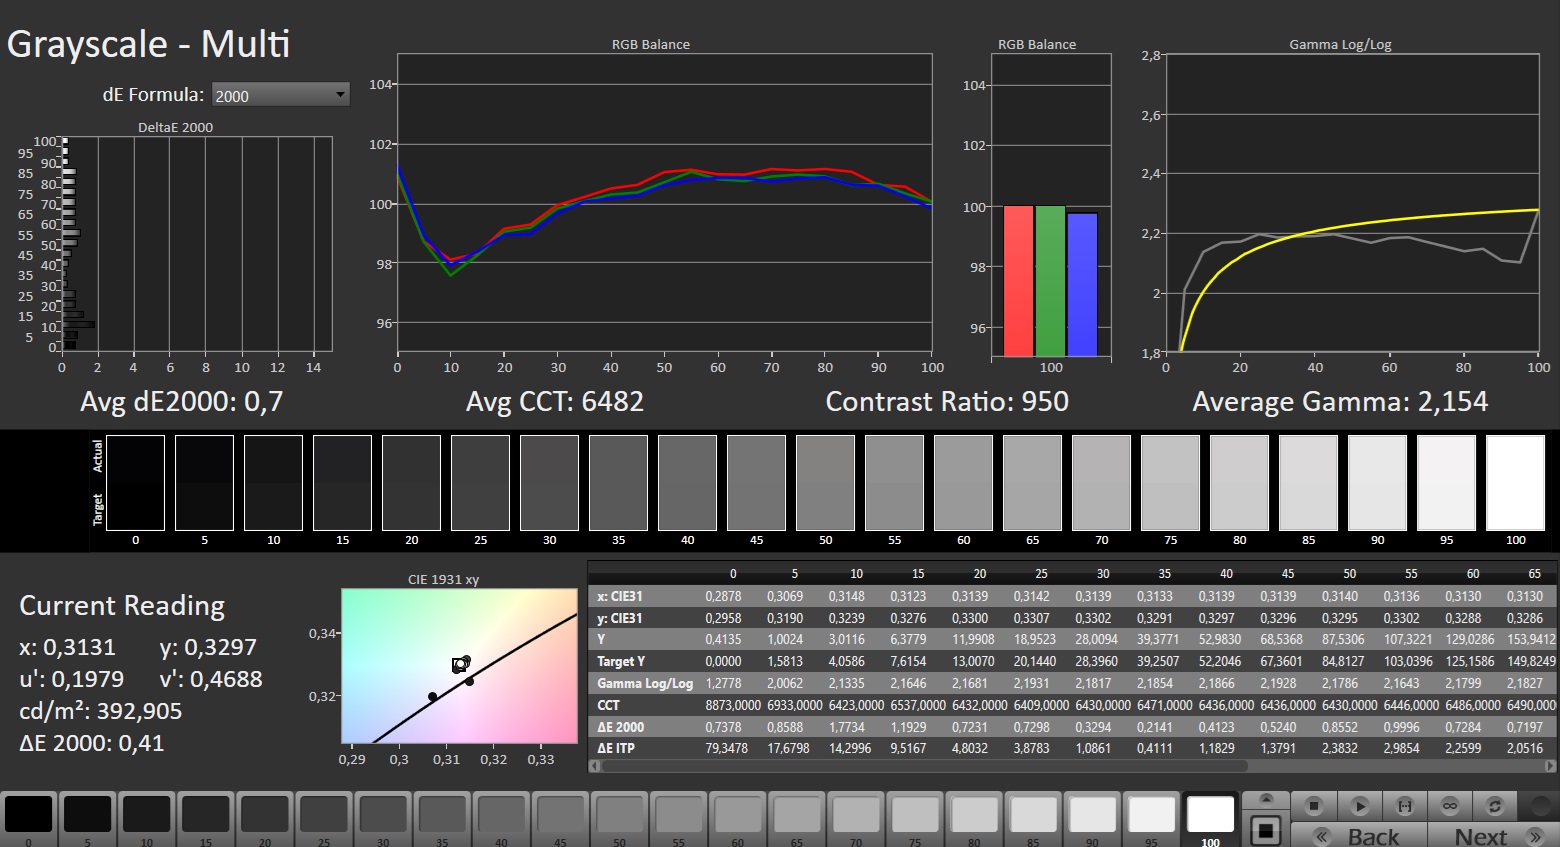
ΔE Greyscale 1.3 | 0.5-98 Ø5.2
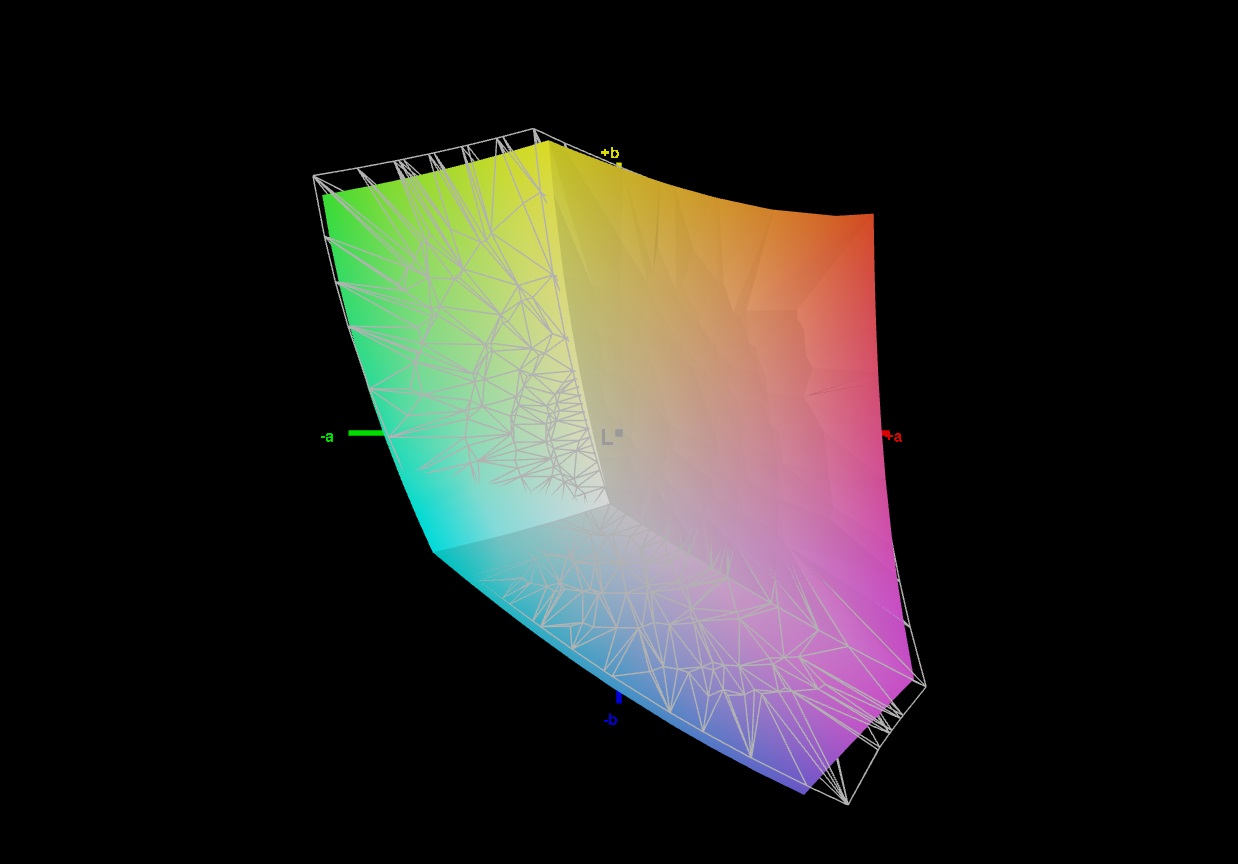
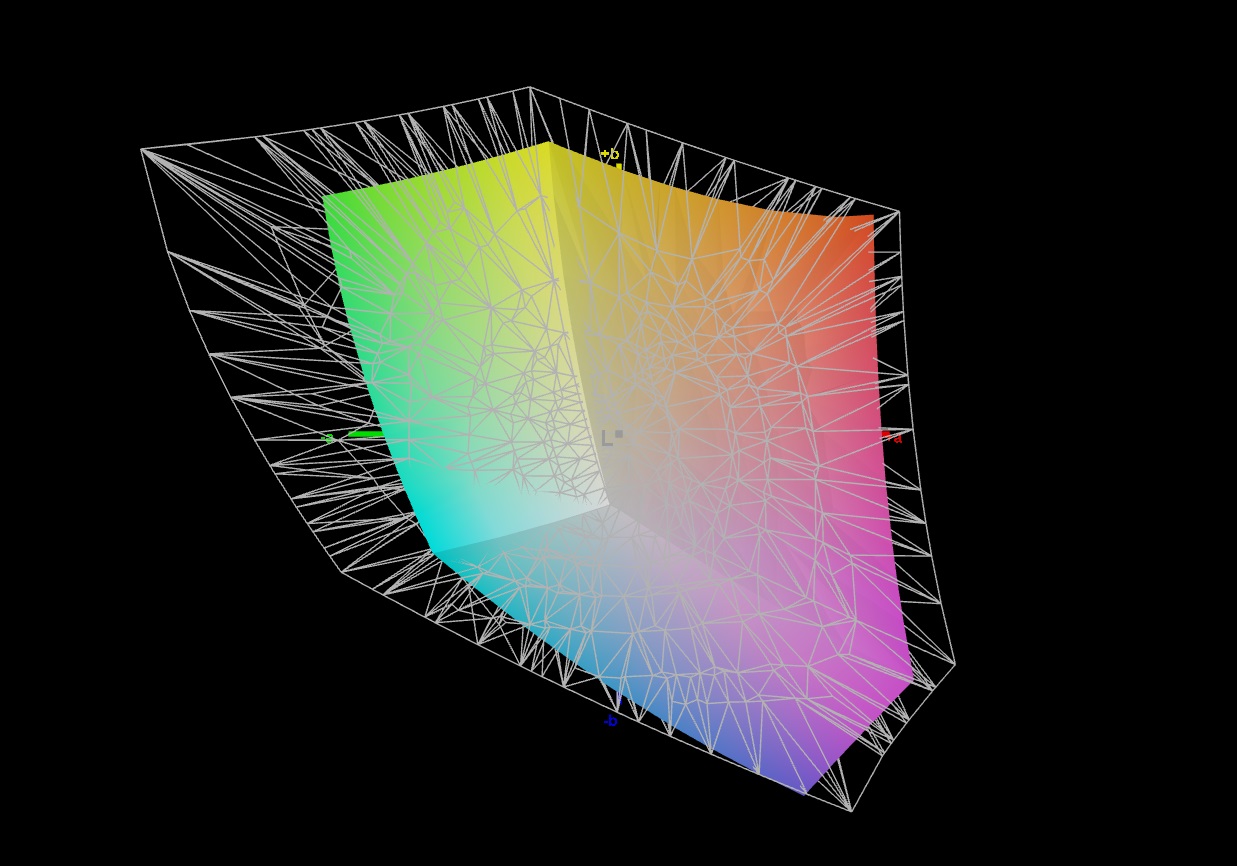
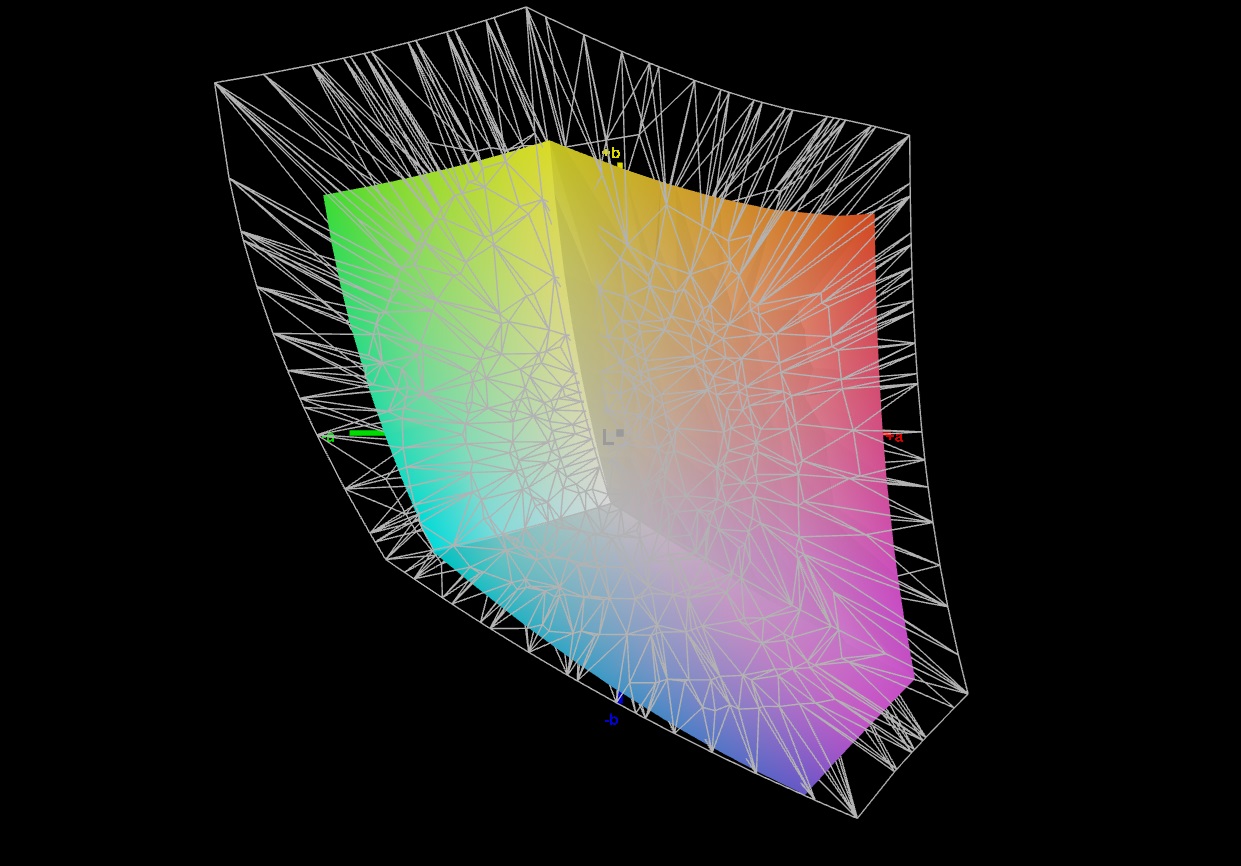
68.1% AdobeRGB 1998 (Argyll 2.2.0 3D)
95.5% sRGB (Argyll 2.2.0 3D)
66.2% Display P3 (Argyll 2.2.0 3D)
Gamma: 2.235
| HP Omen 17-db0079ng BOE0B67, IPS, 2560x1440, 17.3" | Alienware m16 R2 BOE NE16NYH, IPS, 2560x1600, 16" | Asus ROG Strix Scar 16 G634JZR BOE NE160QDM-NM7, Mini LED, 2560x1600, 16" | Acer Predator Helios Neo 16 (2024) Chi Mei N160GME-GTB, LED, 2560x1600, 16" | Asus TUF Gaming A17 FA707XI-NS94 AU Optronics B173HAN04.9, IPS, 1920x1080, 17.3" | Asus TUF Gaming A15 FA507UV AU Optronics B156HAN15.H, IPS, 1920x1080, 15.6" | |
|---|---|---|---|---|---|---|
| Display | 6% | 30% | 26% | -39% | 5% | |
| Display P3 Coverage | 66.2 | 71 7% | 99.8 51% | 95.9 45% | 39.7 -40% | 70.5 6% |
| sRGB Coverage | 95.5 | 100 5% | 100 5% | 99.8 5% | 59.1 -38% | 98.5 3% |
| AdobeRGB 1998 Coverage | 68.1 | 71.4 5% | 90.8 33% | 86.4 27% | 41 -40% | 72.7 7% |
| Response Times | 28% | 20% | 30% | -198% | -148% | |
| Response Time Grey 50% / Grey 80% * | 14.4 ? | 5.7 ? 60% | 5 ? 65% | 5 ? 65% | 39 ? -171% | 31.7 ? -120% |
| Response Time Black / White * | 8.3 ? | 8.7 ? -5% | 10.4 ? -25% | 8.8 ? -6% | 26.9 ? -224% | 22.9 ? -176% |
| PWM Frequency | 2040 ? | |||||
| Screen | 6% | 29% | 7% | -66% | -22% | |
| Brightness middle | 363 | 345.8 -5% | 490 35% | 521 44% | 255.9 -30% | 315 -13% |
| Brightness | 341 | 337 -1% | 487 43% | 506 48% | 248 -27% | 303 -11% |
| Brightness Distribution | 84 | 87 4% | 94 12% | 85 1% | 91 8% | 90 7% |
| Black Level * | 0.38 | 0.3 21% | 0.4 -5% | 0.44 -16% | 0.21 45% | 0.25 34% |
| Contrast | 955 | 1153 21% | 1225 28% | 1184 24% | 1219 28% | 1260 32% |
| Colorchecker dE 2000 * | 1.74 | 1.99 -14% | 1.08 38% | 1.74 -0% | 4.51 -159% | 2.26 -30% |
| Colorchecker dE 2000 max. * | 5.39 | 3.52 35% | 2.38 56% | 3.88 28% | 20.77 -285% | 7.37 -37% |
| Colorchecker dE 2000 calibrated * | 1.43 | 0.62 57% | 0.9 37% | 0.52 64% | 1.82 -27% | 1.03 28% |
| Greyscale dE 2000 * | 1.3 | 2.1 -62% | 1.1 15% | 3 -131% | 3.2 -146% | 4 -208% |
| Gamma | 2.235 98% | 2.32 95% | 2.13 103% | 2.164 102% | 2.08 106% | 2.116 104% |
| CCT | 6346 102% | 6369 102% | 6724 97% | 6816 95% | 6054 107% | 7570 86% |
| Media totale (Programma / Settaggio) | 13% /
9% | 26% /
28% | 21% /
14% | -101% /
-79% | -55% /
-34% |
* ... Meglio usare valori piccoli
La riproduzione dei colori è buona anche senza una calibrazione aggiuntiva. Misuriamo solo una deviazione maggiore con il colore blu, che potrebbe essere percepita anche a occhio nudo. Nelle altre aree cromatiche, compresa la scala di grigi, la riproduzione dei colori è quasi perfetta allo stato di consegna.
Dopo la calibrazione, non ci sono più valori anomali e l'accuratezza del colore è ad un livello elevato in tutto.
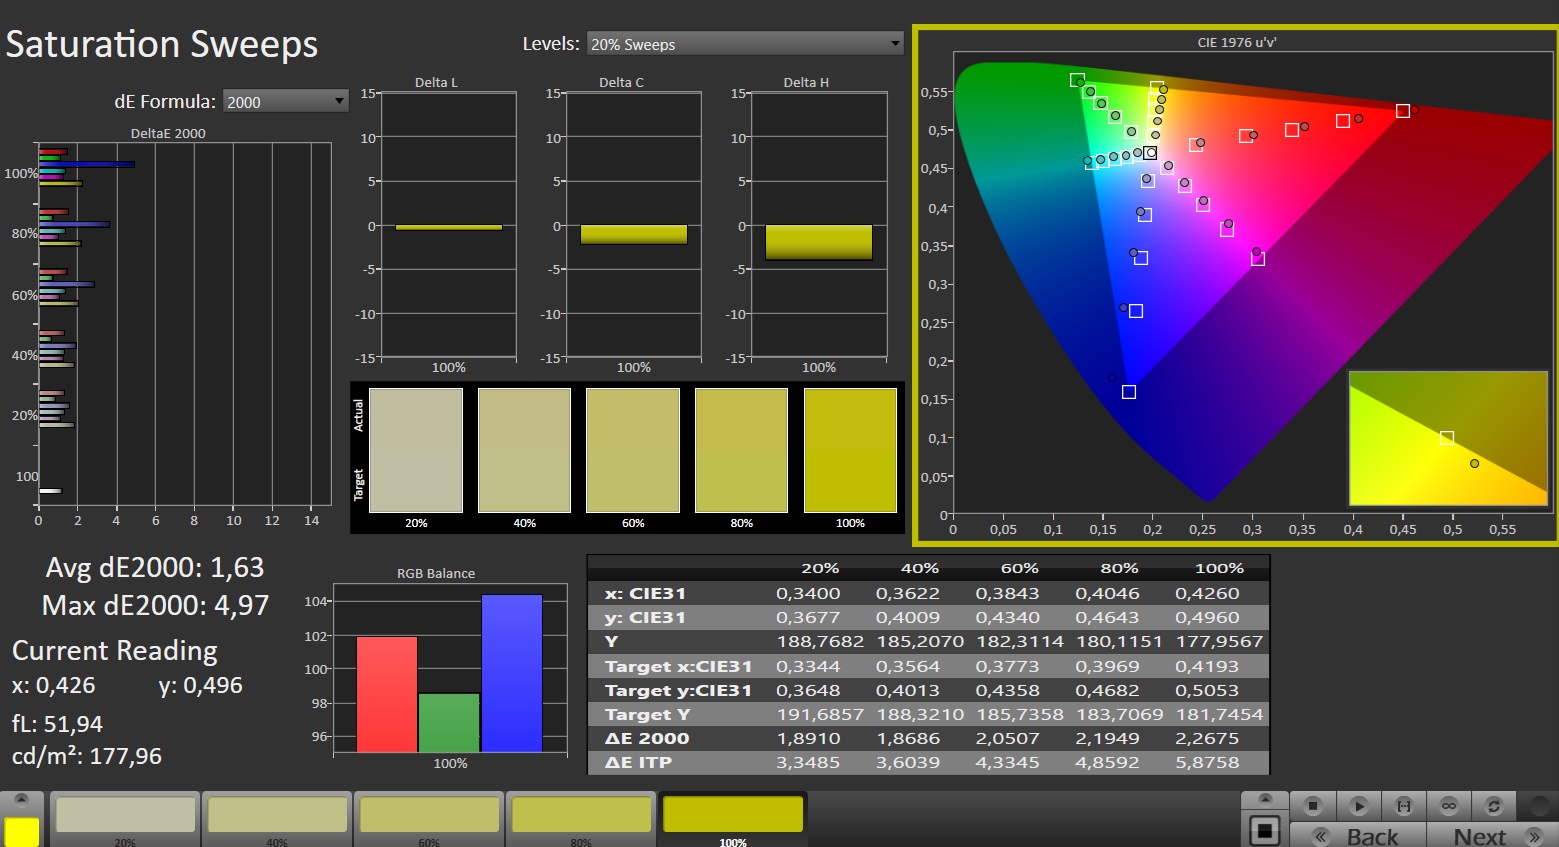
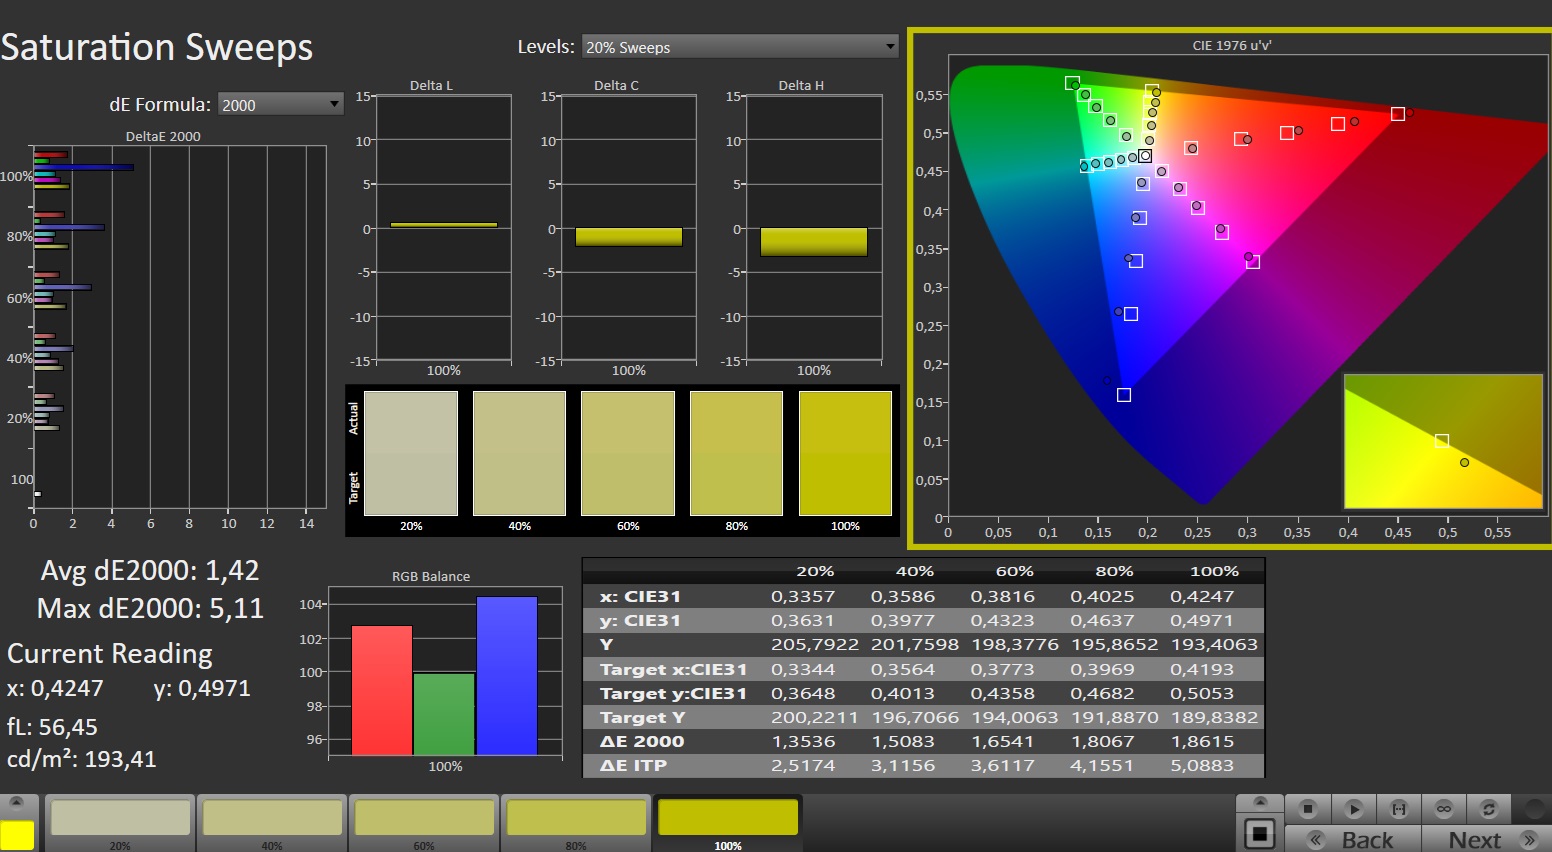
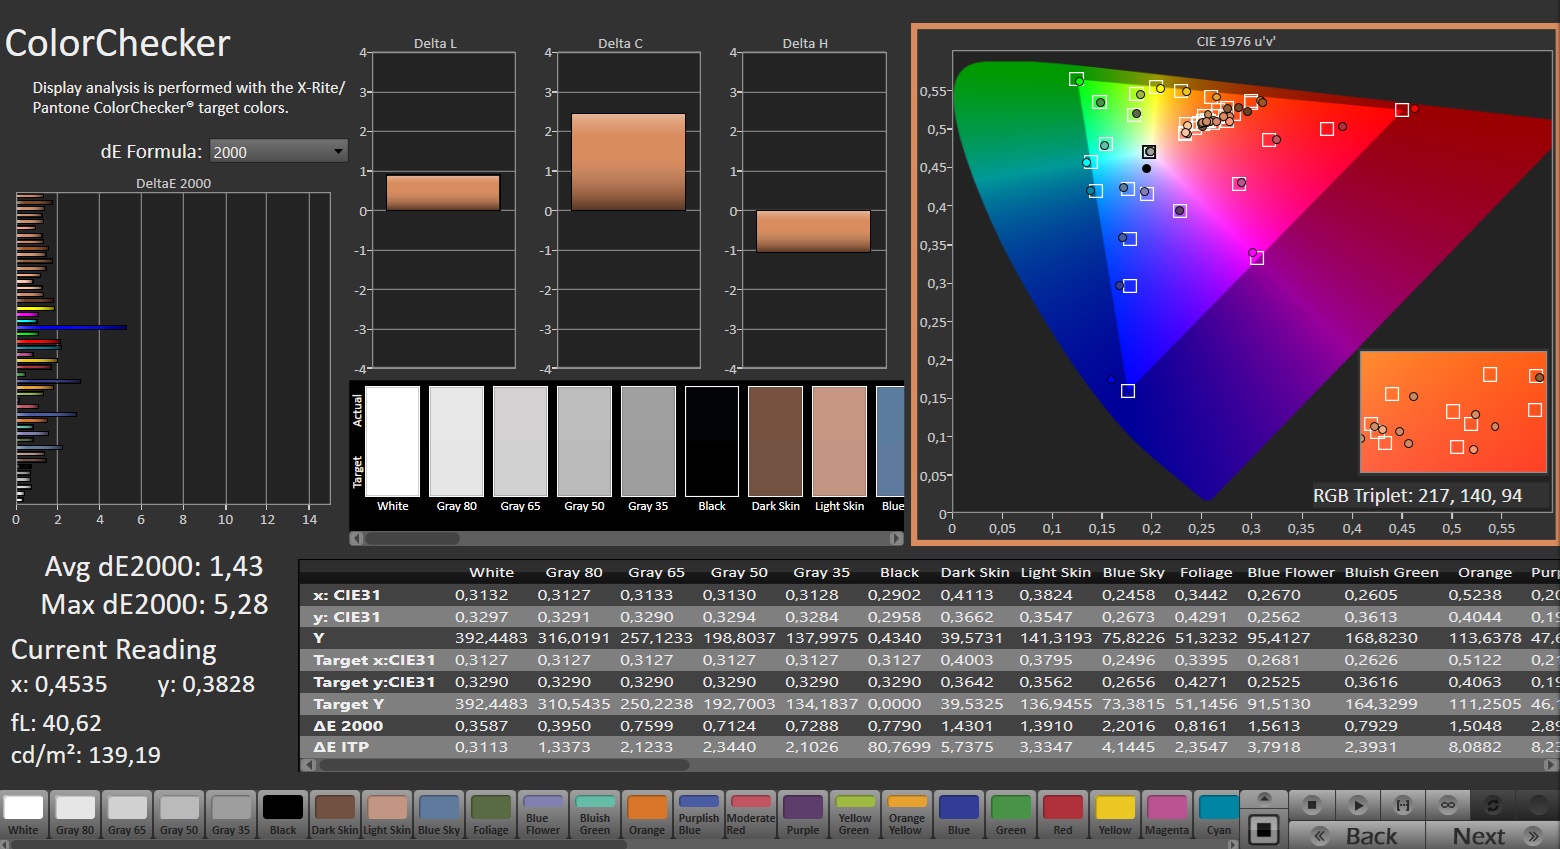
Lo spazio colore sRGB, consigliato per i giochi, non è coperto completamente. Ma questo dovrebbe essere difficilmente percepibile nella pratica, e i display più semplici mostrano un terzo di colori in meno. Tuttavia, alcuni concorrenti come Alienware m16 R2 sono in grado di raggiungere il 100% con la stessa tecnologia del pannello. Se desidera effettuare l'elaborazione di immagini e video, un display di questo tipo è la scelta migliore.
Tempi di risposta del Display
| ↔ Tempi di risposta dal Nero al Bianco | ||
|---|---|---|
| 8.3 ms ... aumenta ↗ e diminuisce ↘ combinato | ↗ 3.5 ms Incremento | 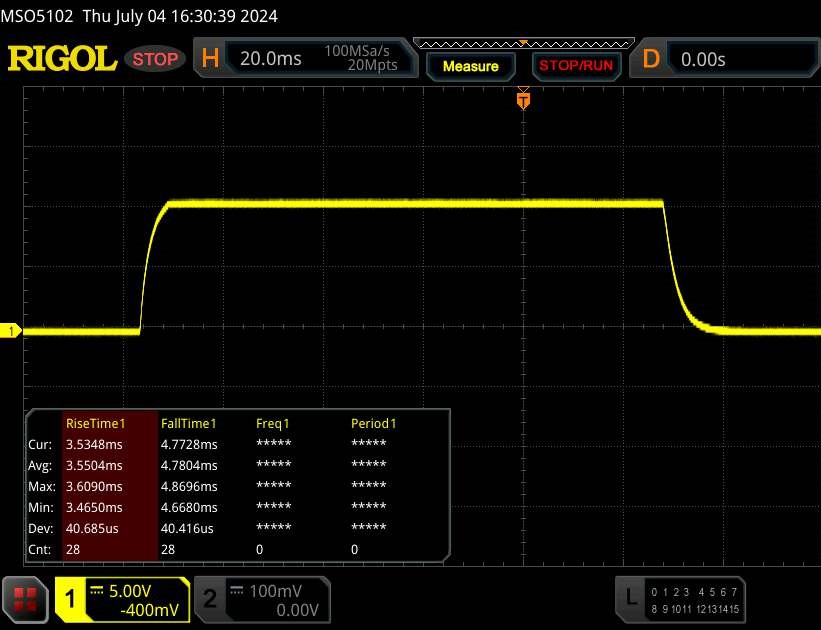 |
| ↘ 4.8 ms Calo | ||
| Lo schermo mostra veloci tempi di risposta durante i nostri tests e dovrebbe esere adatto al gaming In confronto, tutti i dispositivi di test variano da 0.1 (minimo) a 240 (massimo) ms. » 19 % di tutti i dispositivi è migliore. Questo significa che i tempi di risposta rilevati sono migliori rispettto alla media di tutti i dispositivi testati (21.2 ms). | ||
| ↔ Tempo di risposta dal 50% Grigio all'80% Grigio | ||
| 14.4 ms ... aumenta ↗ e diminuisce ↘ combinato | ↗ 6.8 ms Incremento | 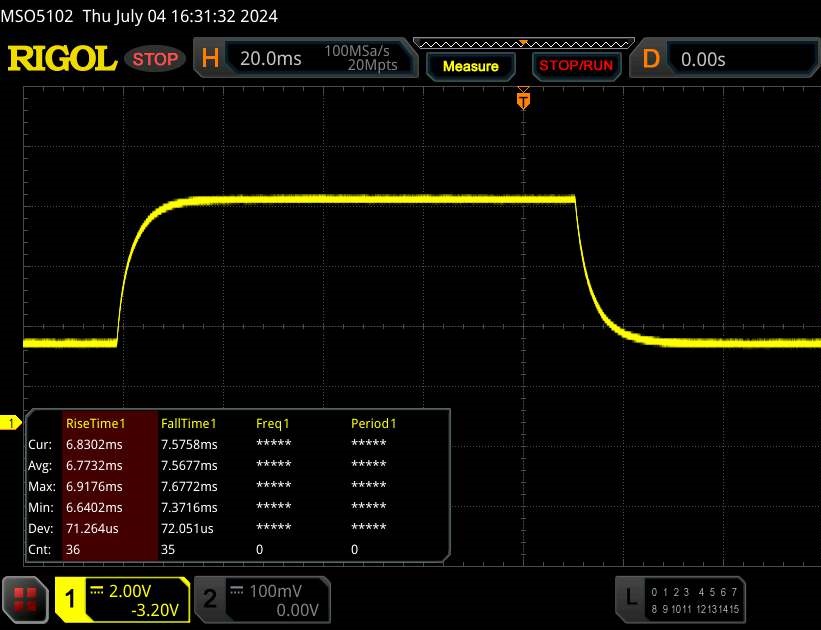 |
| ↘ 7.6 ms Calo | ||
| Lo schermo mostra buoni tempi di risposta durante i nostri tests, ma potrebbe essere troppo lento per i gamers competitivi. In confronto, tutti i dispositivi di test variano da 0.165 (minimo) a 636 (massimo) ms. » 24 % di tutti i dispositivi è migliore. Questo significa che i tempi di risposta rilevati sono migliori rispettto alla media di tutti i dispositivi testati (33.2 ms). | ||
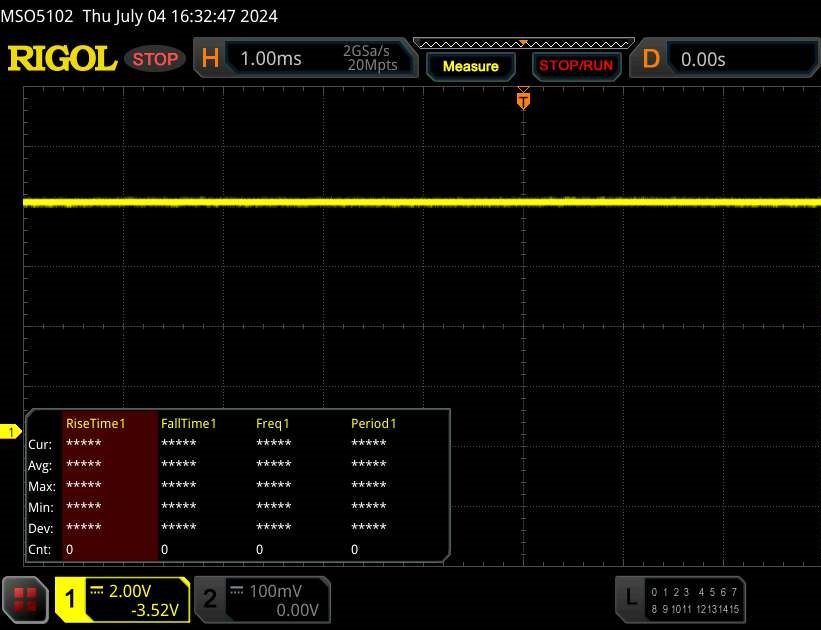
Sfarfallio dello schermo / PWM (Pulse-Width Modulation)
| flickering dello schermo / PWM non rilevato | 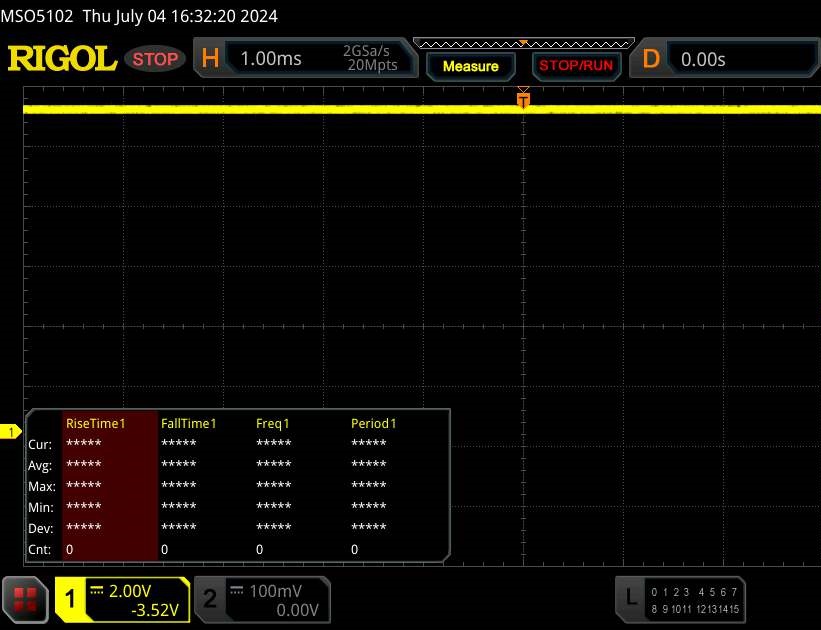 | ||
In confronto: 53 % di tutti i dispositivi testati non utilizza PWM per ridurre la luminosita' del display. Se è rilevato PWM, una media di 17373 (minimo: 5 - massimo: 3846000) Hz è stata rilevata. | |||
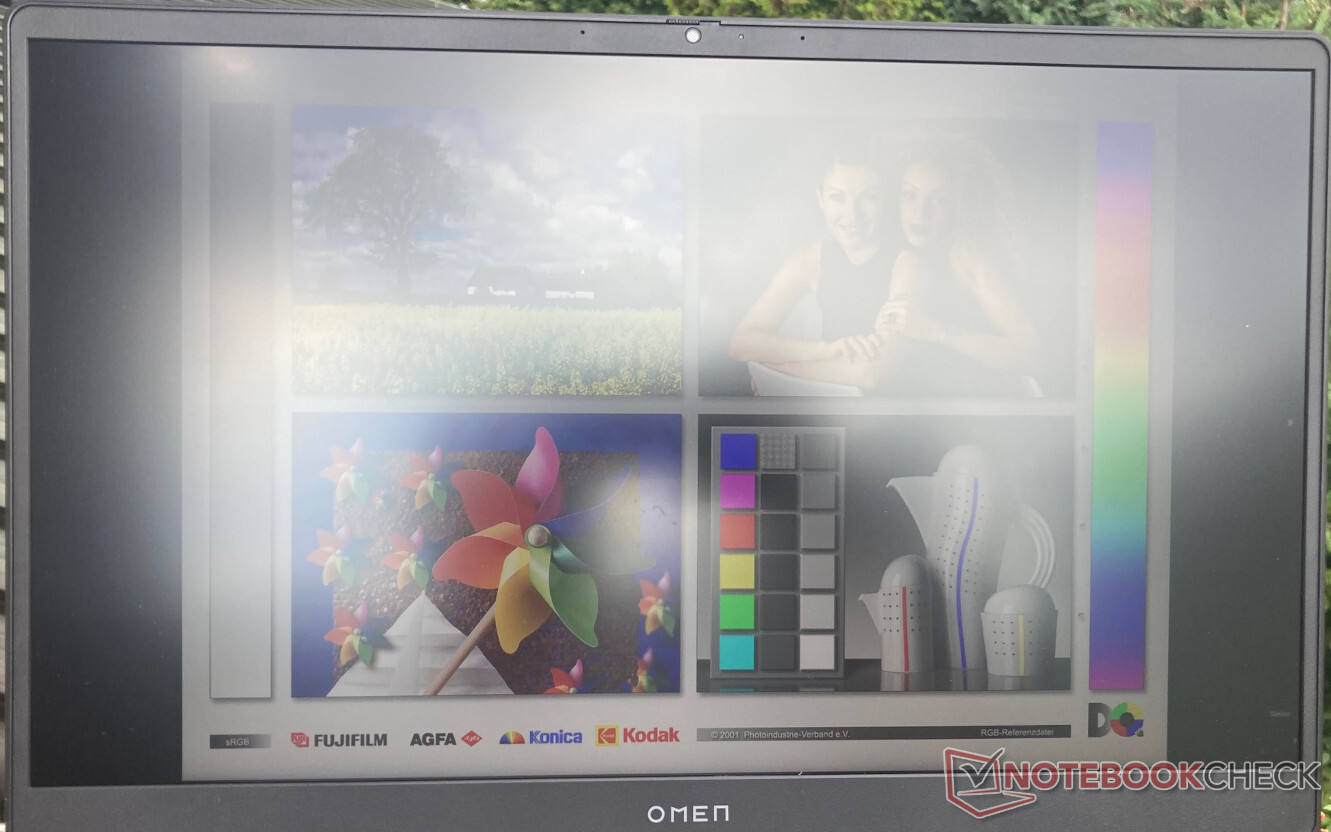
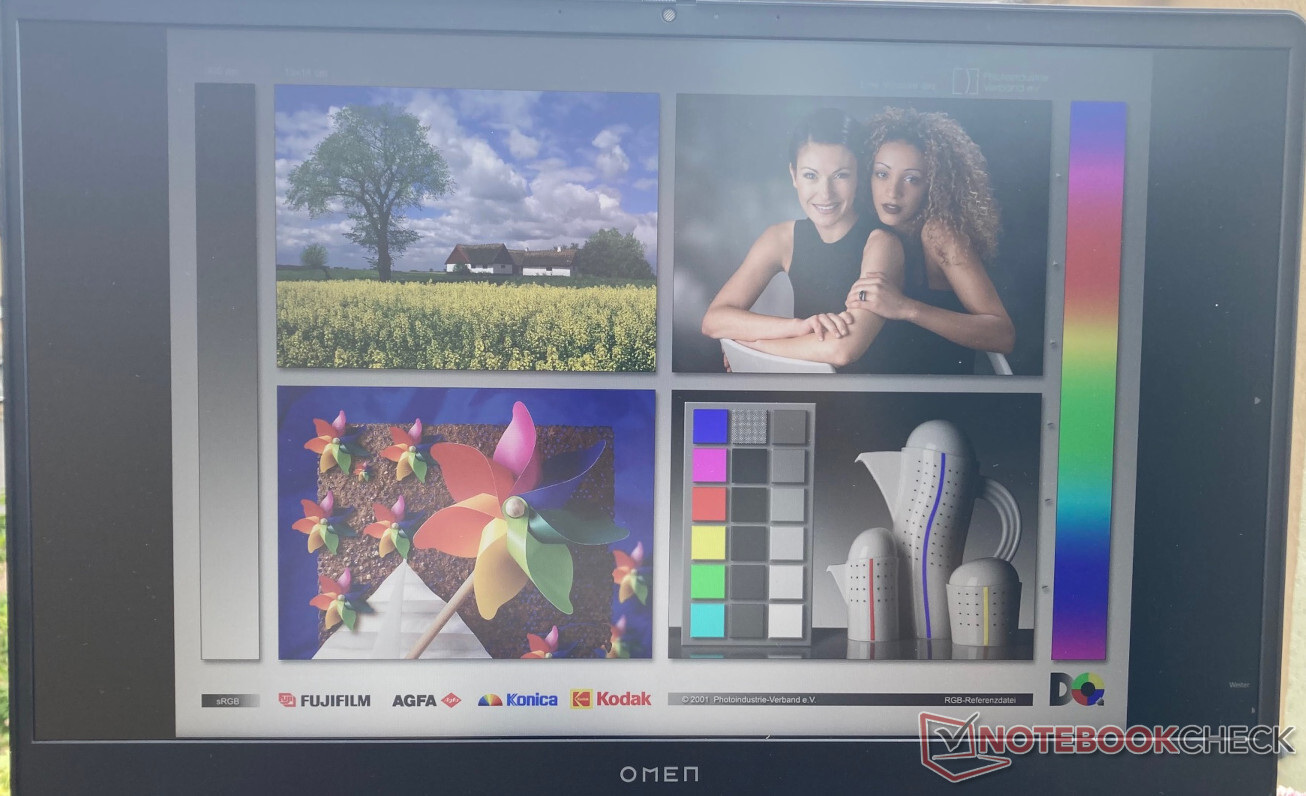
All'aperto, dovrebbe sicuramente sedersi all'ombra se vuole ancora riconoscere qualcosa sullo schermo. La luminosità limitata dell'Omen 17 significa che anche la luminosità di un cielo leggermente coperto può limitare la capacità di vedere qualcosa sul display.
Ma l'immagine appare pallida anche così. I colori non hanno alcuna vivacità all'aperto e sono coperti da un velo grigio. Se vuole godersi il gioco in uno splendore colorato, deve giocare al chiuso.
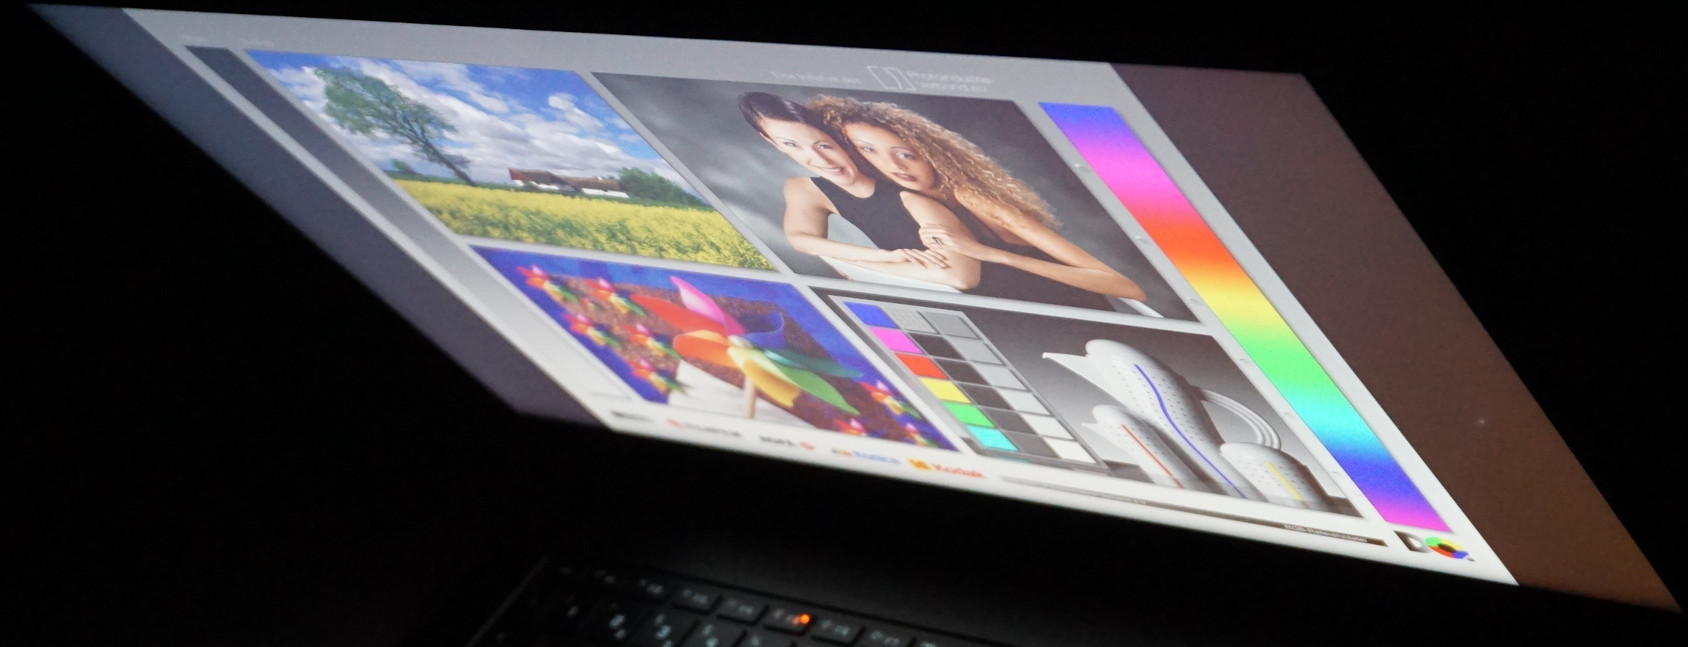
A differenza di ciò che vediamo di solito in un pannello IPS, HP Omen con risoluzione QHD mostra alcuni cambiamenti di colore chiaramente percepibili a partire da angoli di visione di circa 45 gradi. Fino a quel momento, l'immagine rimane facilmente riconoscibile, e non notiamo nemmeno una diminuzione della luminosità prima di quel punto. Oltre i 45 gradi, tutti i colori mostrano una leggera sfumatura gialla.


Prestazioni - L'Omen 17 è un portatile da gioco equilibrato
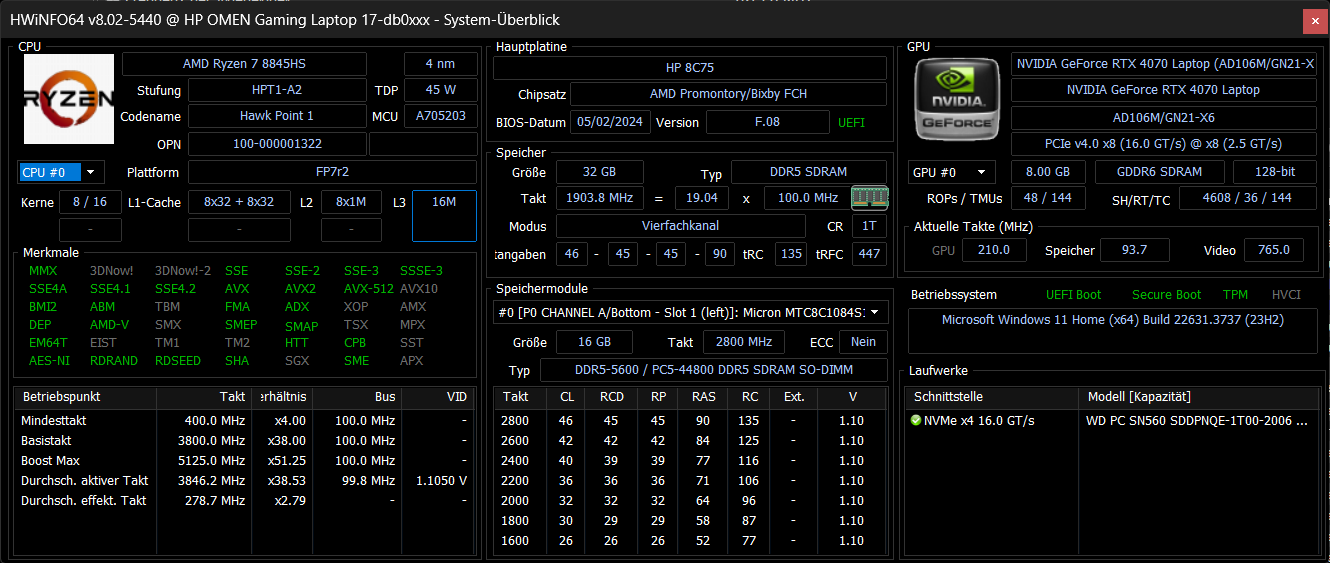
In termini di prestazioni, la nostra unità di prova con il modello AMD Ryzen 7 8845HS e Nvidia GeForce RTX 4070 si colloca nel mezzo del campo dei nostri dispositivi di confronto. Tuttavia, sia la CPU che la GPU hanno prestazioni leggermente inferiori al loro potenziale massimo.
Il Ryzen 7 funziona costantemente a 65 watt, invece di 70 o addirittura 80 watt come nel modello Schenker XMG Core 15, ad esempio. Anche la GPU è leggermente strozzata ed è in grado di utilizzare solo 120 watt invece dei 140 watt massimi possibili. I portatili da gioco comparabili, come l' Asus TUF Gaming A17 FA707 sono in grado di ottenere prestazioni leggermente superiori dalla scheda grafica, anche se questo non ha solo vantaggi e non porterà necessariamente a framerate sensibilmente più elevati.
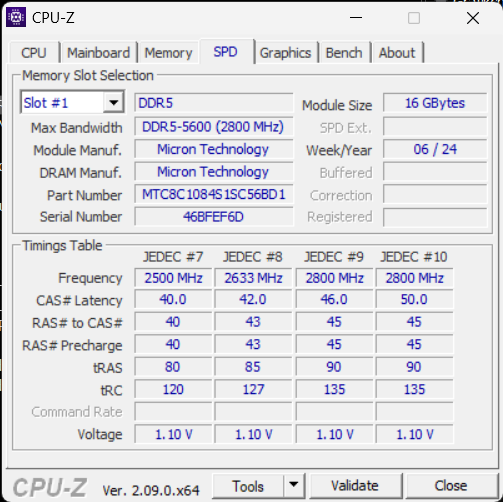
Con 32 Gigabyte di DDR5-5600, anche la dotazione di RAM è solida. Poiché la memoria può essere sostituita facilmente, è anche possibile espanderla in seguito. A questo livello, non ci aspettiamo un effetto limitante dal fatto che sia solo a 5.600 MHz.
È disponibile anche una versione più piccola dell'HP Omen 17 con RTX 4060.
Condizioni del test
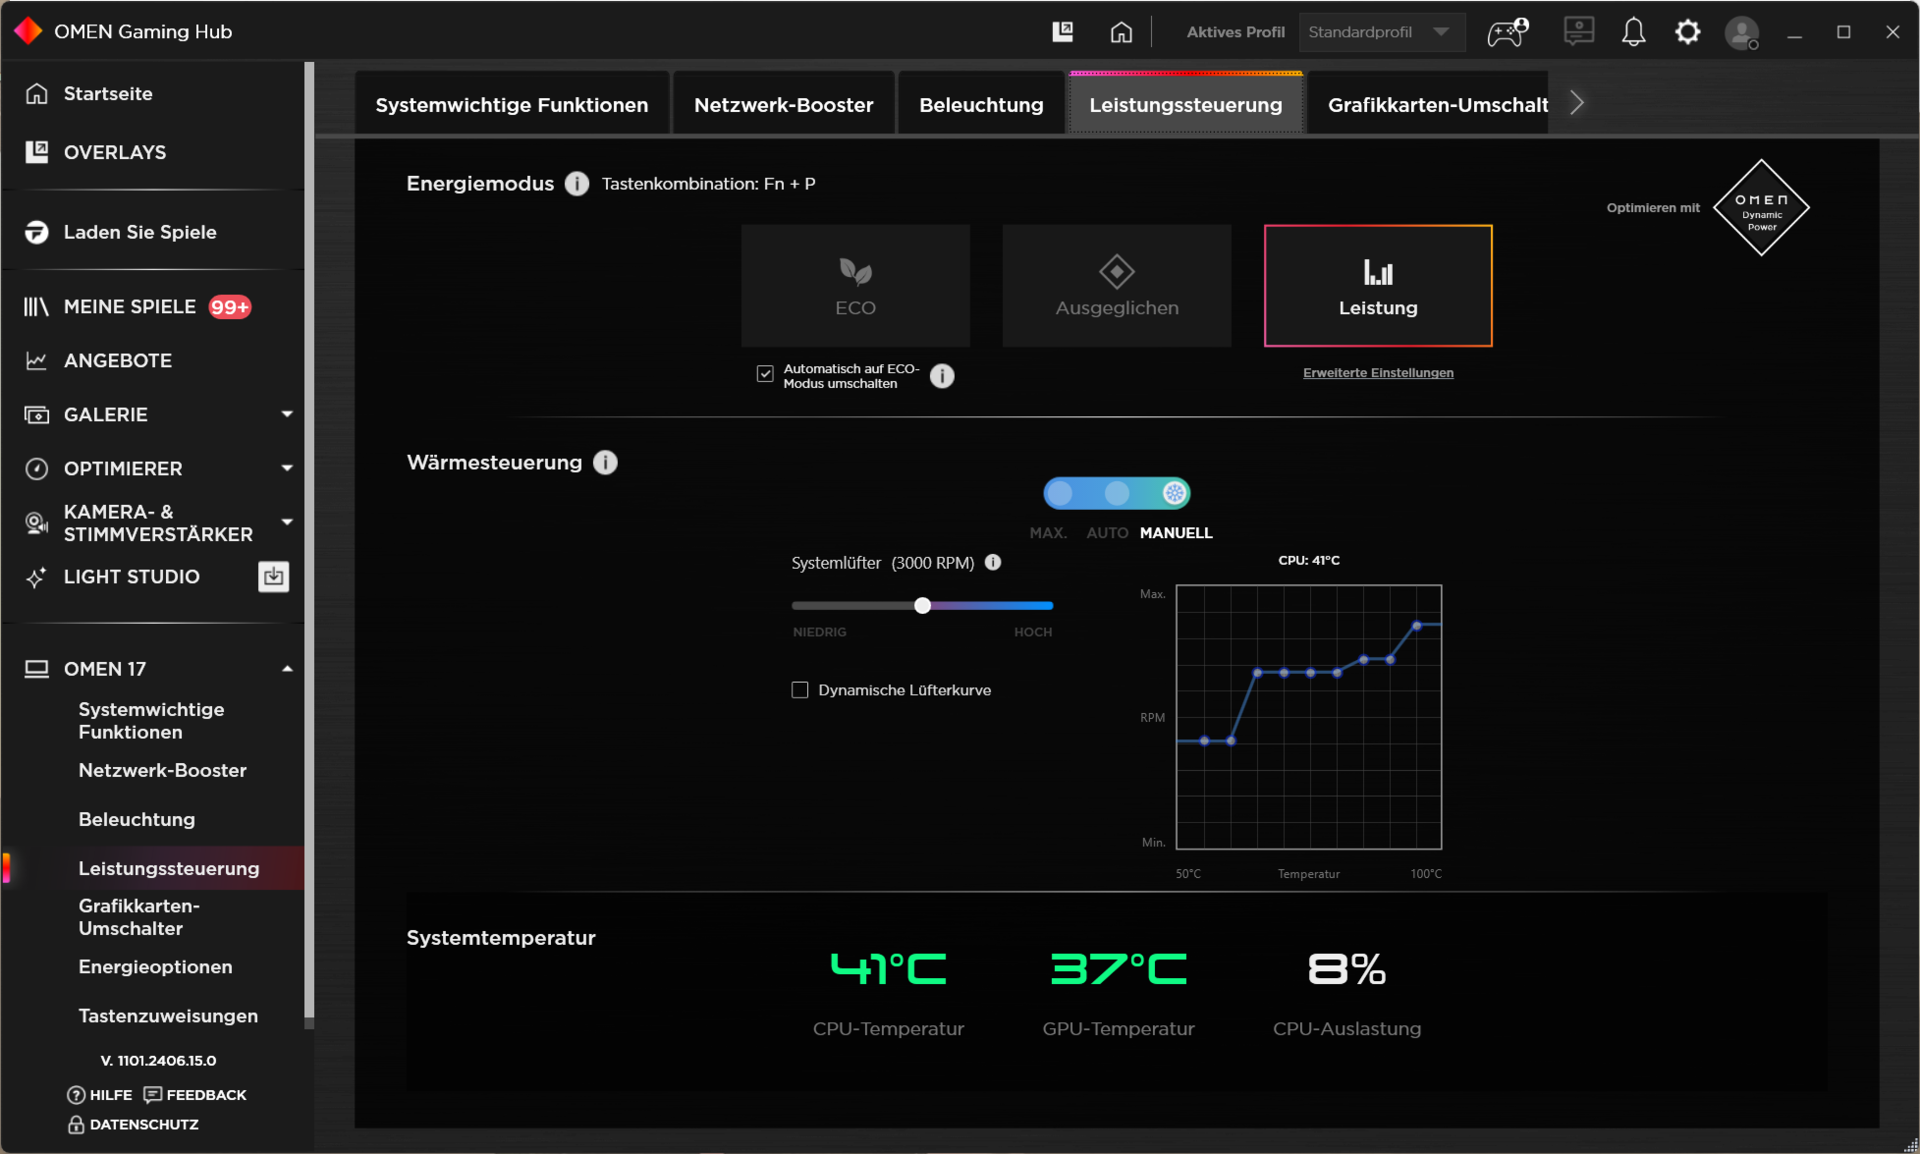
Tre profili di alimentazione le consentono di adattare Omen 17 alla maggior parte degli scenari tipici. Può scoprire l'effetto esatto sul consumo energetico, sul comportamento della ventola e sulle prestazioni di gioco dalla tabella sottostante.
Per i nostri benchmark utilizziamo il profilo "Performance". Inoltre, può effettuare numerose regolazioni che hanno una forte influenza sul comportamento della ventola. Ad esempio, i livelli della ventola possono essere regolati per essere più potenti, oppure possono essere ridotti in modo significativo anche al livello di prestazioni più alto, il che avrebbe un effetto sulle prestazioni massime.
| Profilo di potenza | Carico della CPU | Carico della GPU (incluso boost di 15 Watt) | Steel Nomad | Cyberpunk 2077 QHD Ultra | Rumore massimo della ventola |
|---|---|---|---|---|---|
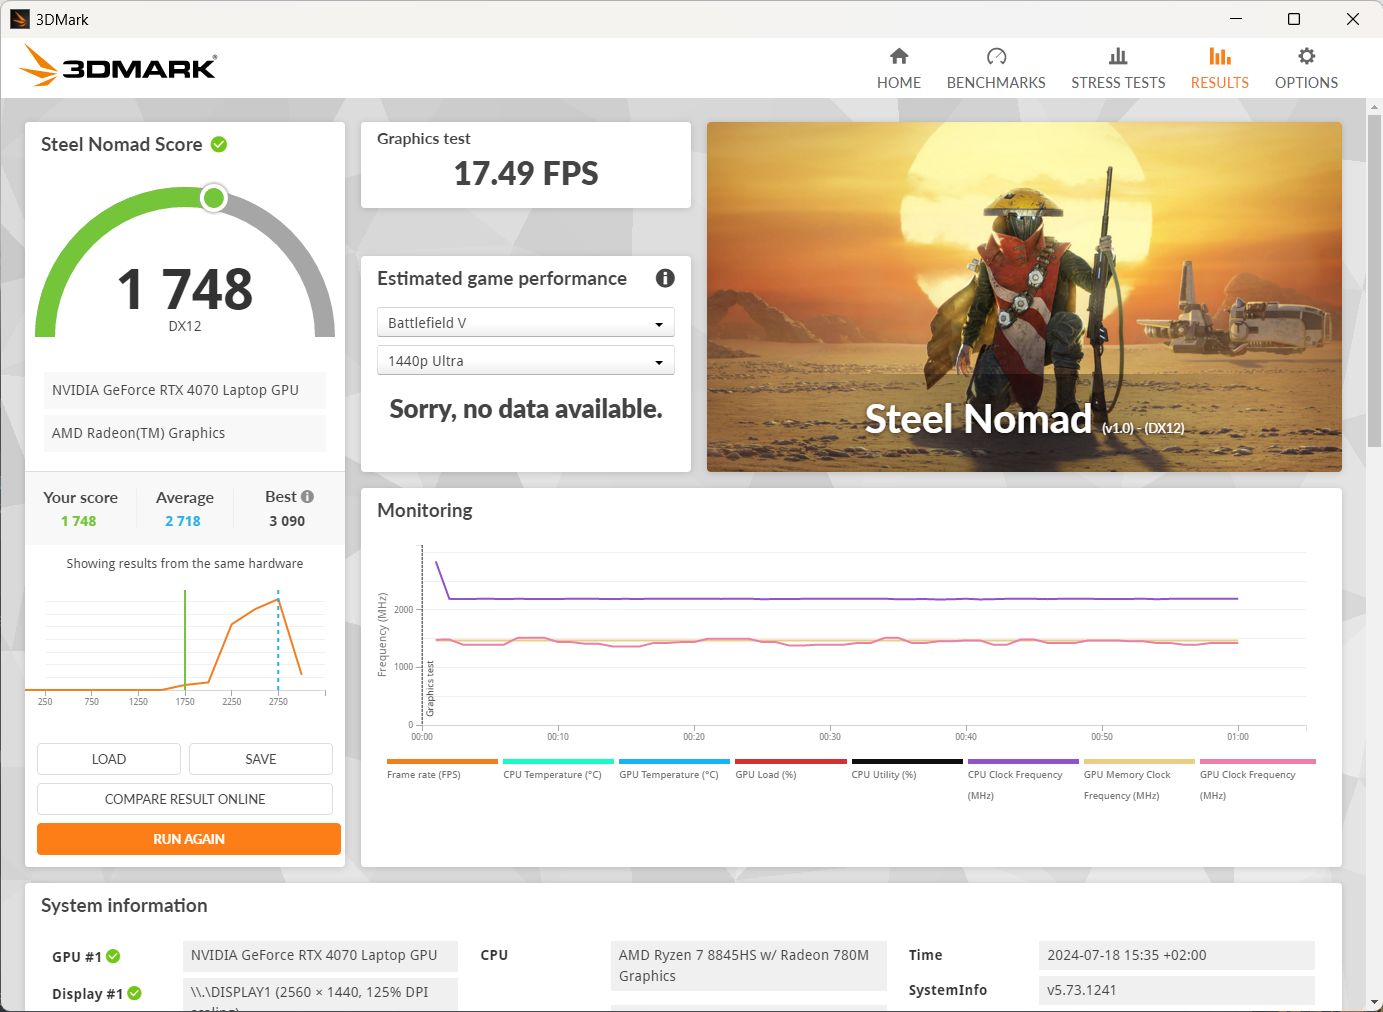
| Eco | 65->35 Watt | 40 Watt | 24,37 FPS | 60 FPS (Lock) | 41 dB(A) |
| Bilanciato | 65->35 Watt | 90 Watt | 25,23 FPS | 75 FPS | 43 dB(A) |
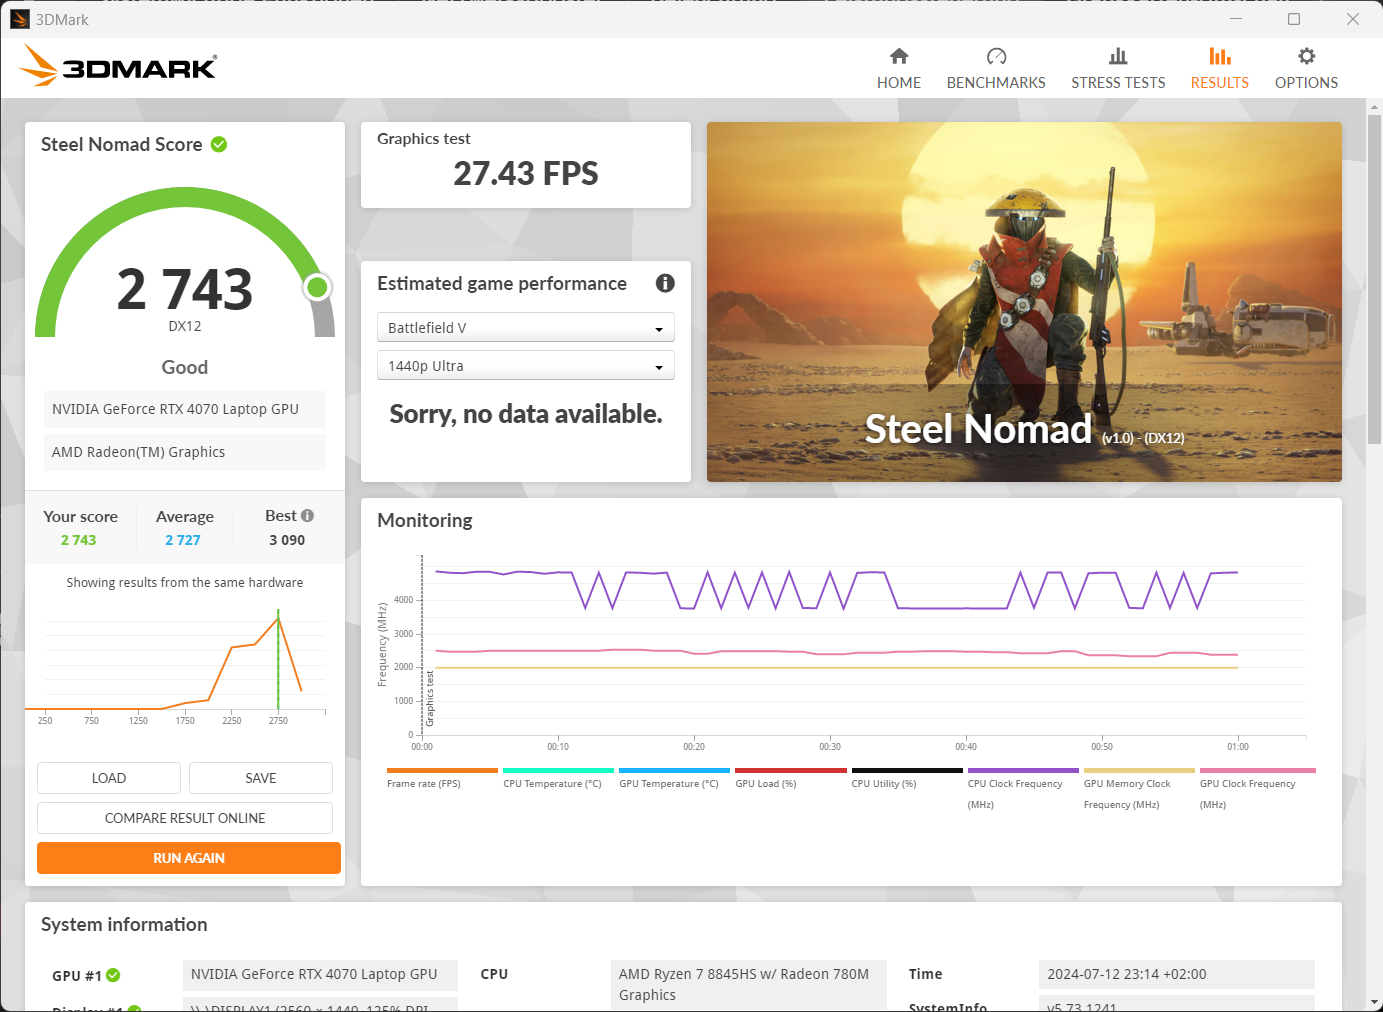
| Prestazioni | 100->65 Watt | 120 Watt | 27,43 FPS | 80 FPS | 48 dB(A) |
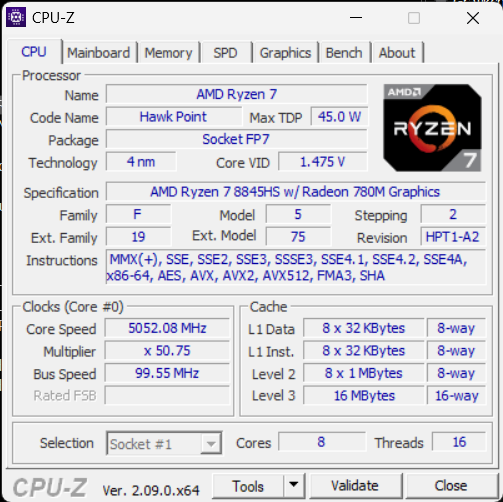
Processore
Il AMD Ryzen 7 8845HS è un processore veloce della serie Hawk Point che utilizza l'architettura Zen 4 e raggiunge quasi le prestazioni di AMD Ryzen 9 7940HS della generazione precedente. Inoltre, le sue prestazioni sono all'altezza di quelle dell'Intel Core i7-13700H Intel Core i7-13700H.
Tuttavia, gli otto core identici del Ryzen 7 sono ripetutamente in grado di ottenere un piccolo vantaggio rispetto ai sei core performanti dell'i7-13700H, in particolare durante il gioco.
Mentre possiamo quasi sempre osservare un leggero calo nelle prestazioni costanti con i concorrenti, la CPU è in grado di fornire prestazioni costanti ad un buon livello in questo caso.
Può trovare ulteriori misurazioni e risultati di test di vari processori nel nostro Elenco dei benchmark della CPU.
Cinebench R15 Multi Constant Load Test
Cinebench R23: Multi Core | Single Core
Cinebench R20: CPU (Multi Core) | CPU (Single Core)
Cinebench R15: CPU Multi 64Bit | CPU Single 64Bit
Blender: v2.79 BMW27 CPU
7-Zip 18.03: 7z b 4 | 7z b 4 -mmt1
Geekbench 6.2: Multi-Core | Single-Core
Geekbench 5.5: Multi-Core | Single-Core
HWBOT x265 Benchmark v2.2: 4k Preset
LibreOffice : 20 Documents To PDF
R Benchmark 2.5: Overall mean
| CPU Performance Rating | |
| Asus ROG Strix Scar 16 G634JZR | |
| Acer Predator Helios Neo 16 (2024) | |
| Media della classe Gaming | |
| Asus TUF Gaming A17 FA707XI-NS94 | |
| Asus TUF Gaming A15 FA507UV | |
| Alienware m16 R2 -1! | |
| Media AMD Ryzen 7 8845HS | |
| Tulpar T7 V20.6 | |
| HP Omen 17-db0079ng | |
| Cinebench R23 / Multi Core | |
| Asus ROG Strix Scar 16 G634JZR | |
| Acer Predator Helios Neo 16 (2024) | |
| Media della classe Gaming (5668 - 36249, n=207, ultimi 2 anni) | |
| Alienware m16 R2 | |
| Tulpar T7 V20.6 | |
| Asus TUF Gaming A17 FA707XI-NS94 | |
| Asus TUF Gaming A15 FA507UV | |
| Media AMD Ryzen 7 8845HS (15889 - 18037, n=6) | |
| HP Omen 17-db0079ng | |
| Cinebench R23 / Single Core | |
| Asus ROG Strix Scar 16 G634JZR | |
| Acer Predator Helios Neo 16 (2024) | |
| Tulpar T7 V20.6 | |
| Media della classe Gaming (1136 - 2235, n=205, ultimi 2 anni) | |
| Asus TUF Gaming A17 FA707XI-NS94 | |
| Asus TUF Gaming A15 FA507UV | |
| Alienware m16 R2 | |
| Media AMD Ryzen 7 8845HS (1623 - 1783, n=6) | |
| HP Omen 17-db0079ng | |
| Cinebench R20 / CPU (Multi Core) | |
| Asus ROG Strix Scar 16 G634JZR | |
| Acer Predator Helios Neo 16 (2024) | |
| Media della classe Gaming (2179 - 13832, n=205, ultimi 2 anni) | |
| Alienware m16 R2 | |
| Tulpar T7 V20.6 | |
| Asus TUF Gaming A17 FA707XI-NS94 | |
| Asus TUF Gaming A15 FA507UV | |
| Media AMD Ryzen 7 8845HS (6231 - 7026, n=6) | |
| HP Omen 17-db0079ng | |
| Cinebench R20 / CPU (Single Core) | |
| Asus ROG Strix Scar 16 G634JZR | |
| Acer Predator Helios Neo 16 (2024) | |
| Tulpar T7 V20.6 | |
| Media della classe Gaming (439 - 855, n=205, ultimi 2 anni) | |
| Asus TUF Gaming A17 FA707XI-NS94 | |
| Media AMD Ryzen 7 8845HS (677 - 698, n=6) | |
| HP Omen 17-db0079ng | |
| Alienware m16 R2 | |
| Asus TUF Gaming A15 FA507UV | |
| Cinebench R15 / CPU Multi 64Bit | |
| Asus ROG Strix Scar 16 G634JZR | |
| Acer Predator Helios Neo 16 (2024) | |
| Media della classe Gaming (905 - 5663, n=211, ultimi 2 anni) | |
| Alienware m16 R2 | |
| Asus TUF Gaming A17 FA707XI-NS94 | |
| Asus TUF Gaming A15 FA507UV | |
| Tulpar T7 V20.6 | |
| Media AMD Ryzen 7 8845HS (2537 - 2908, n=6) | |
| HP Omen 17-db0079ng | |
| Cinebench R15 / CPU Single 64Bit | |
| Asus ROG Strix Scar 16 G634JZR | |
| Acer Predator Helios Neo 16 (2024) | |
| Asus TUF Gaming A17 FA707XI-NS94 | |
| Asus TUF Gaming A15 FA507UV | |
| Tulpar T7 V20.6 | |
| Media AMD Ryzen 7 8845HS (269 - 283, n=6) | |
| Media della classe Gaming (191.9 - 318, n=208, ultimi 2 anni) | |
| HP Omen 17-db0079ng | |
| Alienware m16 R2 | |
| Blender / v2.79 BMW27 CPU | |
| HP Omen 17-db0079ng | |
| Media AMD Ryzen 7 8845HS (179 - 216, n=6) | |
| Asus TUF Gaming A17 FA707XI-NS94 | |
| Asus TUF Gaming A15 FA507UV | |
| Media della classe Gaming (87 - 555, n=200, ultimi 2 anni) | |
| Tulpar T7 V20.6 | |
| Acer Predator Helios Neo 16 (2024) | |
| Asus ROG Strix Scar 16 G634JZR | |
| 7-Zip 18.03 / 7z b 4 | |
| Asus ROG Strix Scar 16 G634JZR | |
| Acer Predator Helios Neo 16 (2024) | |
| Media della classe Gaming (23795 - 140932, n=204, ultimi 2 anni) | |
| Asus TUF Gaming A15 FA507UV | |
| Asus TUF Gaming A17 FA707XI-NS94 | |
| Media AMD Ryzen 7 8845HS (64759 - 74664, n=6) | |
| Alienware m16 R2 | |
| HP Omen 17-db0079ng | |
| Tulpar T7 V20.6 | |
| 7-Zip 18.03 / 7z b 4 -mmt1 | |
| Asus ROG Strix Scar 16 G634JZR | |
| Acer Predator Helios Neo 16 (2024) | |
| Asus TUF Gaming A17 FA707XI-NS94 | |
| Asus TUF Gaming A15 FA507UV | |
| Media AMD Ryzen 7 8845HS (5197 - 6714, n=6) | |
| Media della classe Gaming (4199 - 7581, n=204, ultimi 2 anni) | |
| Tulpar T7 V20.6 | |
| HP Omen 17-db0079ng | |
| Alienware m16 R2 | |
| Geekbench 6.2 / Multi-Core | |
| Asus ROG Strix Scar 16 G634JZR | |
| Acer Predator Helios Neo 16 (2024) | |
| Media della classe Gaming (5340 - 19665, n=105, ultimi 2 anni) | |
| Media AMD Ryzen 7 8845HS (11073 - 14014, n=10) | |
| HP Omen 17-db0079ng | |
| Alienware m16 R2 | |
| Asus TUF Gaming A15 FA507UV | |
| Asus TUF Gaming A17 FA707XI-NS94 | |
| Tulpar T7 V20.6 | |
| Geekbench 6.2 / Single-Core | |
| Asus ROG Strix Scar 16 G634JZR | |
| Acer Predator Helios Neo 16 (2024) | |
| Asus TUF Gaming A17 FA707XI-NS94 | |
| Asus TUF Gaming A15 FA507UV | |
| Media della classe Gaming (1490 - 3129, n=105, ultimi 2 anni) | |
| Media AMD Ryzen 7 8845HS (2540 - 2698, n=8) | |
| Tulpar T7 V20.6 | |
| HP Omen 17-db0079ng | |
| Alienware m16 R2 | |
| Geekbench 5.5 / Multi-Core | |
| Asus ROG Strix Scar 16 G634JZR | |
| Acer Predator Helios Neo 16 (2024) | |
| Media della classe Gaming (4557 - 23194, n=206, ultimi 2 anni) | |
| Alienware m16 R2 | |
| Media AMD Ryzen 7 8845HS (11754 - 12726, n=7) | |
| Asus TUF Gaming A15 FA507UV | |
| HP Omen 17-db0079ng | |
| Asus TUF Gaming A17 FA707XI-NS94 | |
| Tulpar T7 V20.6 | |
| Geekbench 5.5 / Single-Core | |
| Asus ROG Strix Scar 16 G634JZR | |
| Acer Predator Helios Neo 16 (2024) | |
| Asus TUF Gaming A17 FA707XI-NS94 | |
| Asus TUF Gaming A15 FA507UV | |
| Media AMD Ryzen 7 8845HS (1765 - 2004, n=7) | |
| Media della classe Gaming (986 - 2210, n=206, ultimi 2 anni) | |
| Tulpar T7 V20.6 | |
| HP Omen 17-db0079ng | |
| Alienware m16 R2 | |
| HWBOT x265 Benchmark v2.2 / 4k Preset | |
| Asus ROG Strix Scar 16 G634JZR | |
| Acer Predator Helios Neo 16 (2024) | |
| Media della classe Gaming (6.72 - 38.9, n=204, ultimi 2 anni) | |
| Asus TUF Gaming A15 FA507UV | |
| Asus TUF Gaming A17 FA707XI-NS94 | |
| Alienware m16 R2 | |
| Media AMD Ryzen 7 8845HS (18.6 - 22.7, n=6) | |
| HP Omen 17-db0079ng | |
| Tulpar T7 V20.6 | |
| LibreOffice / 20 Documents To PDF | |
| HP Omen 17-db0079ng | |
| Tulpar T7 V20.6 | |
| Media AMD Ryzen 7 8845HS (44.5 - 77, n=6) | |
| Alienware m16 R2 | |
| Asus TUF Gaming A17 FA707XI-NS94 | |
| Media della classe Gaming (31.4 - 96.6, n=201, ultimi 2 anni) | |
| Asus ROG Strix Scar 16 G634JZR | |
| Asus TUF Gaming A15 FA507UV | |
| Acer Predator Helios Neo 16 (2024) | |
| R Benchmark 2.5 / Overall mean | |
| HP Omen 17-db0079ng | |
| Alienware m16 R2 | |
| Media AMD Ryzen 7 8845HS (0.4336 - 0.4935, n=6) | |
| Tulpar T7 V20.6 | |
| Media della classe Gaming (0.3609 - 0.759, n=205, ultimi 2 anni) | |
| Asus TUF Gaming A15 FA507UV | |
| Asus TUF Gaming A17 FA707XI-NS94 | |
| Acer Predator Helios Neo 16 (2024) | |
| Asus ROG Strix Scar 16 G634JZR | |
* ... Meglio usare valori piccoli
AIDA64: FP32 Ray-Trace | FPU Julia | CPU SHA3 | CPU Queen | FPU SinJulia | FPU Mandel | CPU AES | CPU ZLib | FP64 Ray-Trace | CPU PhotoWorxx
| Performance Rating | |
| Asus ROG Strix Scar 16 G634JZR | |
| Asus TUF Gaming A15 FA507UV | |
| Asus TUF Gaming A17 FA707XI-NS94 | |
| Acer Predator Helios Neo 16 (2024) | |
| HP Omen 17-db0079ng | |
| Media AMD Ryzen 7 8845HS | |
| Media della classe Gaming | |
| Alienware m16 R2 | |
| Tulpar T7 V20.6 | |
| AIDA64 / FP32 Ray-Trace | |
| Asus TUF Gaming A17 FA707XI-NS94 | |
| Asus TUF Gaming A15 FA507UV | |
| Media AMD Ryzen 7 8845HS (25916 - 29544, n=6) | |
| HP Omen 17-db0079ng | |
| Asus ROG Strix Scar 16 G634JZR | |
| Acer Predator Helios Neo 16 (2024) | |
| Media della classe Gaming (4986 - 60169, n=201, ultimi 2 anni) | |
| Alienware m16 R2 | |
| Tulpar T7 V20.6 | |
| AIDA64 / FPU Julia | |
| Asus ROG Strix Scar 16 G634JZR | |
| Asus TUF Gaming A17 FA707XI-NS94 | |
| Asus TUF Gaming A15 FA507UV | |
| HP Omen 17-db0079ng | |
| Media AMD Ryzen 7 8845HS (107613 - 125873, n=6) | |
| Acer Predator Helios Neo 16 (2024) | |
| Media della classe Gaming (25360 - 252486, n=201, ultimi 2 anni) | |
| Alienware m16 R2 | |
| Tulpar T7 V20.6 | |
| AIDA64 / CPU SHA3 | |
| Asus ROG Strix Scar 16 G634JZR | |
| Asus TUF Gaming A17 FA707XI-NS94 | |
| Asus TUF Gaming A15 FA507UV | |
| Acer Predator Helios Neo 16 (2024) | |
| Media AMD Ryzen 7 8845HS (4627 - 5180, n=6) | |
| HP Omen 17-db0079ng | |
| Media della classe Gaming (1339 - 10389, n=201, ultimi 2 anni) | |
| Alienware m16 R2 | |
| Tulpar T7 V20.6 | |
| AIDA64 / CPU Queen | |
| Acer Predator Helios Neo 16 (2024) | |
| Asus ROG Strix Scar 16 G634JZR | |
| Asus TUF Gaming A15 FA507UV | |
| Asus TUF Gaming A17 FA707XI-NS94 | |
| Media AMD Ryzen 7 8845HS (114899 - 124695, n=6) | |
| HP Omen 17-db0079ng | |
| Media della classe Gaming (41257 - 200651, n=201, ultimi 2 anni) | |
| Tulpar T7 V20.6 | |
| Alienware m16 R2 | |
| AIDA64 / FPU SinJulia | |
| Asus ROG Strix Scar 16 G634JZR | |
| Asus TUF Gaming A15 FA507UV | |
| Asus TUF Gaming A17 FA707XI-NS94 | |
| Media AMD Ryzen 7 8845HS (14876 - 15519, n=6) | |
| HP Omen 17-db0079ng | |
| Acer Predator Helios Neo 16 (2024) | |
| Media della classe Gaming (3925 - 32988, n=201, ultimi 2 anni) | |
| Tulpar T7 V20.6 | |
| Alienware m16 R2 | |
| AIDA64 / FPU Mandel | |
| Asus TUF Gaming A17 FA707XI-NS94 | |
| Asus TUF Gaming A15 FA507UV | |
| Asus ROG Strix Scar 16 G634JZR | |
| HP Omen 17-db0079ng | |
| Media AMD Ryzen 7 8845HS (57671 - 67367, n=6) | |
| Acer Predator Helios Neo 16 (2024) | |
| Media della classe Gaming (12321 - 134044, n=201, ultimi 2 anni) | |
| Alienware m16 R2 | |
| Tulpar T7 V20.6 | |
| AIDA64 / CPU AES | |
| Asus ROG Strix Scar 16 G634JZR | |
| Media della classe Gaming (19065 - 328679, n=201, ultimi 2 anni) | |
| Media AMD Ryzen 7 8845HS (67393 - 172642, n=6) | |
| Acer Predator Helios Neo 16 (2024) | |
| Asus TUF Gaming A17 FA707XI-NS94 | |
| Asus TUF Gaming A15 FA507UV | |
| HP Omen 17-db0079ng | |
| Alienware m16 R2 | |
| Tulpar T7 V20.6 | |
| AIDA64 / CPU ZLib | |
| Asus ROG Strix Scar 16 G634JZR | |
| Acer Predator Helios Neo 16 (2024) | |
| Media della classe Gaming (269 - 2409, n=201, ultimi 2 anni) | |
| Alienware m16 R2 | |
| Tulpar T7 V20.6 | |
| Asus TUF Gaming A17 FA707XI-NS94 | |
| Asus TUF Gaming A15 FA507UV | |
| HP Omen 17-db0079ng | |
| Media AMD Ryzen 7 8845HS (627 - 1080, n=6) | |
| AIDA64 / FP64 Ray-Trace | |
| Asus TUF Gaming A17 FA707XI-NS94 | |
| Asus TUF Gaming A15 FA507UV | |
| Media AMD Ryzen 7 8845HS (13875 - 15911, n=6) | |
| HP Omen 17-db0079ng | |
| Asus ROG Strix Scar 16 G634JZR | |
| Acer Predator Helios Neo 16 (2024) | |
| Media della classe Gaming (2540 - 31796, n=201, ultimi 2 anni) | |
| Alienware m16 R2 | |
| Tulpar T7 V20.6 | |
| AIDA64 / CPU PhotoWorxx | |
| Asus ROG Strix Scar 16 G634JZR | |
| Acer Predator Helios Neo 16 (2024) | |
| HP Omen 17-db0079ng | |
| Media AMD Ryzen 7 8845HS (38580 - 41668, n=6) | |
| Alienware m16 R2 | |
| Media della classe Gaming (10805 - 60161, n=202, ultimi 2 anni) | |
| Asus TUF Gaming A15 FA507UV | |
| Asus TUF Gaming A17 FA707XI-NS94 | |
| Tulpar T7 V20.6 | |
Prestazioni del sistema
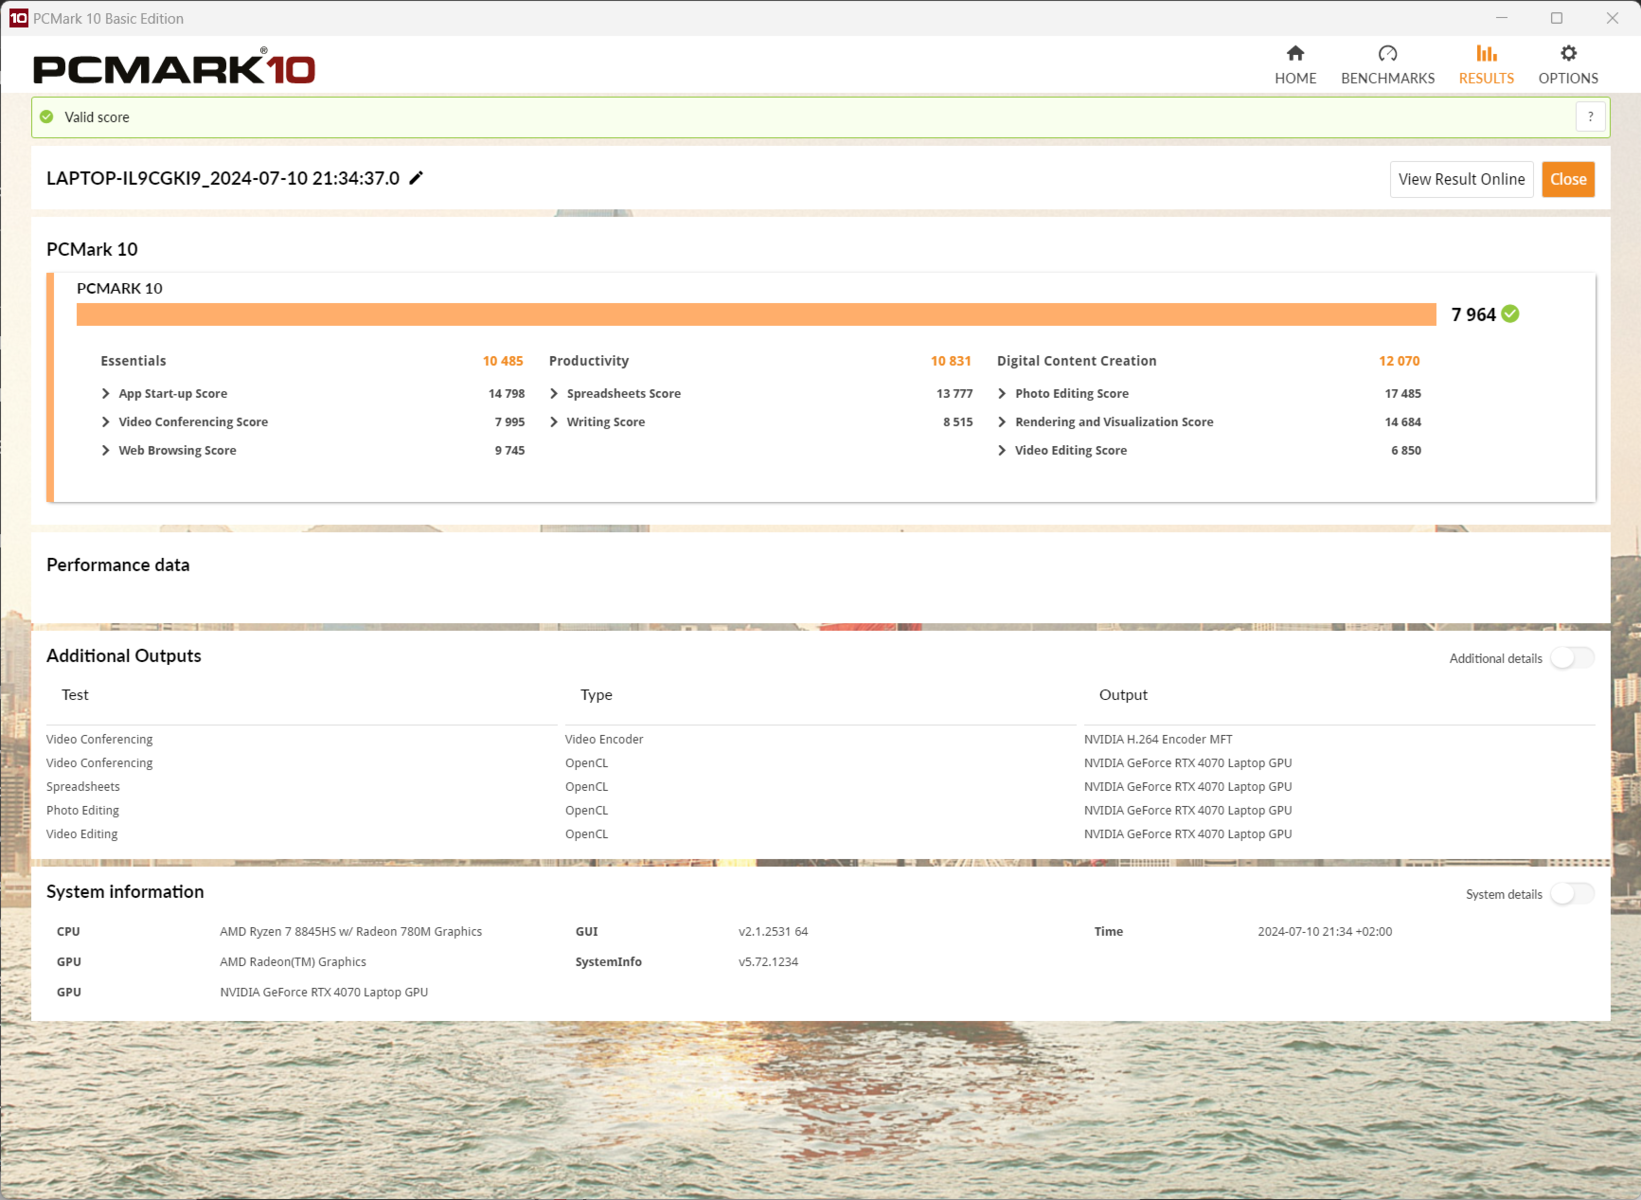
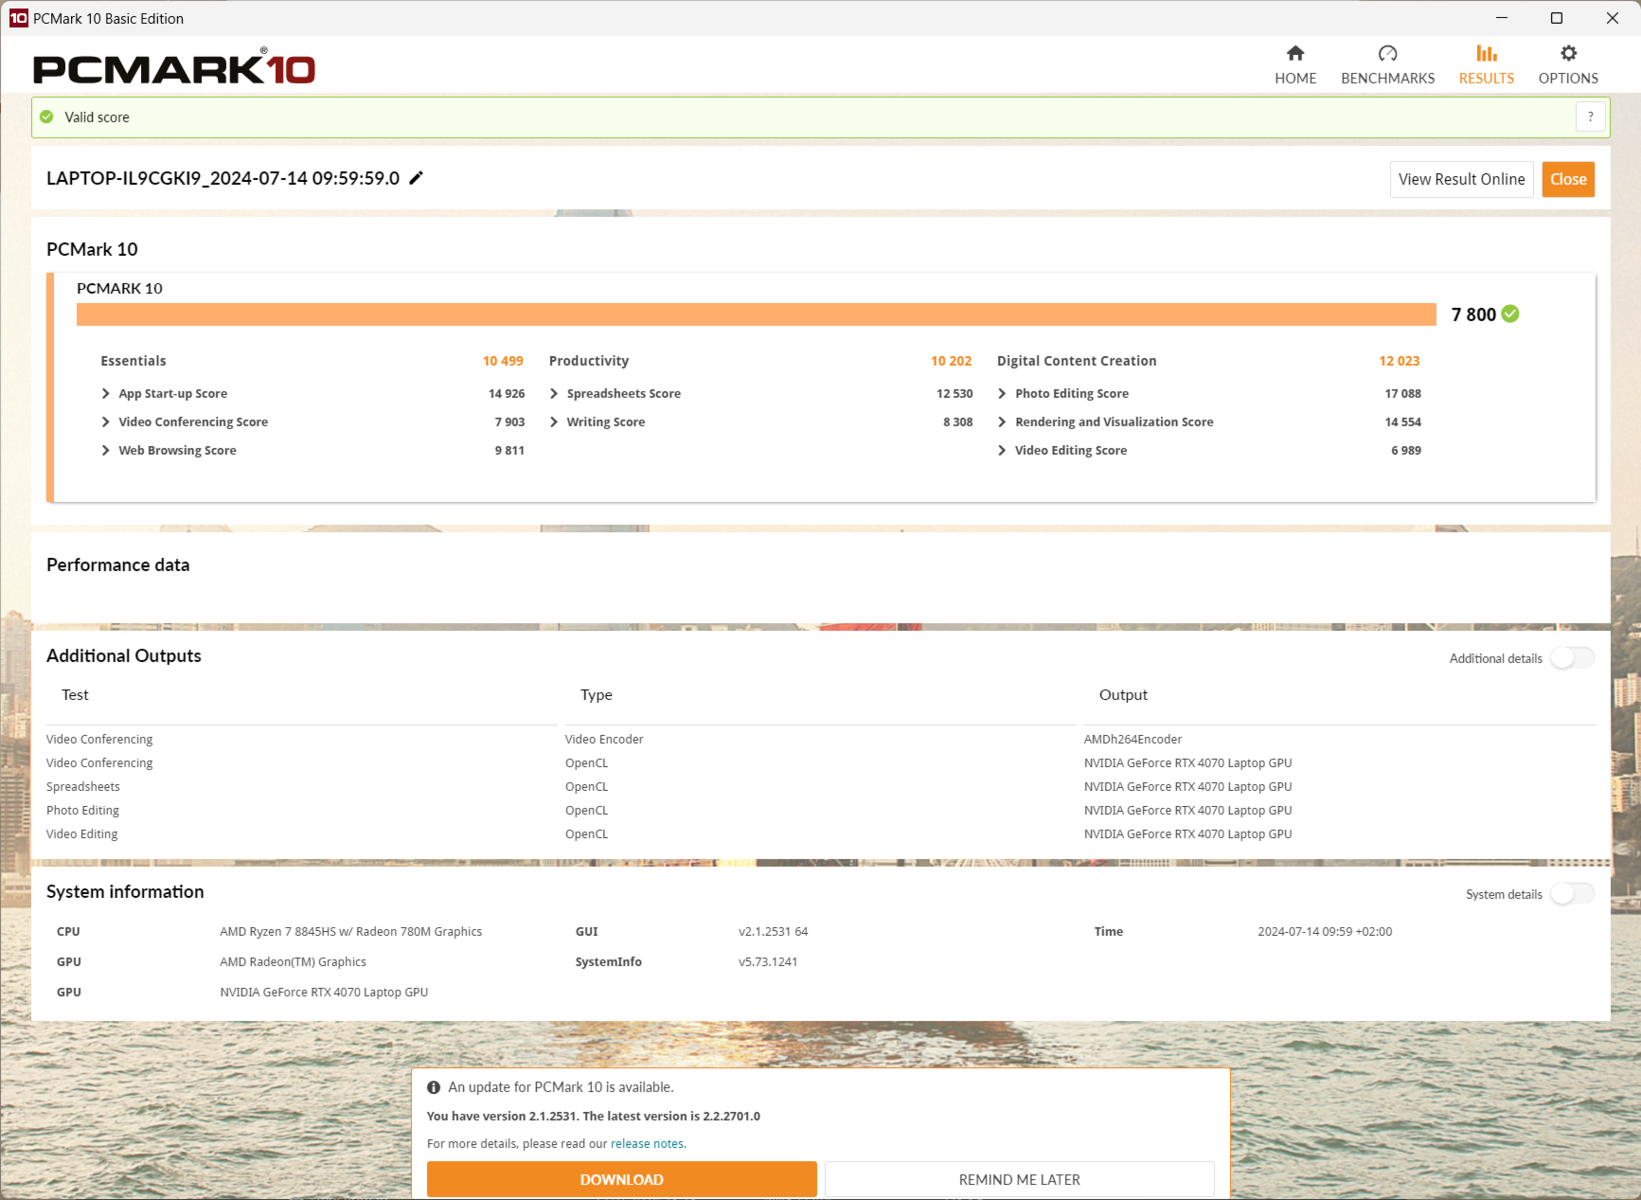
Durante le attività quotidiane che abbiamo valutato con PCMark 10 e altri benchmark simili, non c'è praticamente nessuna differenza evidente rispetto ai sistemi comparabili. I valori sono al livello di un Ryzen 7 8845HS configurato in modo più potente e nel mezzo del campo dei concorrenti, anche se c'è appena un 10% di differenza tra il valore più alto e quello più basso della tabella.
Il portatile è sempre reattivo e non mostra tempi di attesa durante i processi di installazione o quando sono aperti numerosi programmi contemporaneamente. Anche durante l'esecuzione di un gioco impegnativo, continua ad essere possibile passare ad un'altra applicazione, sebbene ciò sia raramente consigliato.

CrossMark: Overall | Productivity | Creativity | Responsiveness
WebXPRT 3: Overall
WebXPRT 4: Overall
Mozilla Kraken 1.1: Total
| PCMark 10 / Score | |
| Acer Predator Helios Neo 16 (2024) | |
| Asus TUF Gaming A17 FA707XI-NS94 | |
| Asus TUF Gaming A15 FA507UV | |
| HP Omen 17-db0079ng | |
| Media AMD Ryzen 7 8845HS, NVIDIA GeForce RTX 4070 Laptop GPU () | |
| Alienware m16 R2 | |
| Media della classe Gaming (5442 - 9852, n=180, ultimi 2 anni) | |
| Asus ROG Strix Scar 16 G634JZR | |
| Tulpar T7 V20.6 | |
| PCMark 10 / Essentials | |
| Acer Predator Helios Neo 16 (2024) | |
| Asus ROG Strix Scar 16 G634JZR | |
| Tulpar T7 V20.6 | |
| Asus TUF Gaming A17 FA707XI-NS94 | |
| Asus TUF Gaming A15 FA507UV | |
| Media della classe Gaming (8829 - 12334, n=179, ultimi 2 anni) | |
| HP Omen 17-db0079ng | |
| Media AMD Ryzen 7 8845HS, NVIDIA GeForce RTX 4070 Laptop GPU () | |
| Alienware m16 R2 | |
| PCMark 10 / Productivity | |
| Acer Predator Helios Neo 16 (2024) | |
| Asus TUF Gaming A15 FA507UV | |
| HP Omen 17-db0079ng | |
| Media AMD Ryzen 7 8845HS, NVIDIA GeForce RTX 4070 Laptop GPU () | |
| Media della classe Gaming (6662 - 14612, n=179, ultimi 2 anni) | |
| Tulpar T7 V20.6 | |
| Asus TUF Gaming A17 FA707XI-NS94 | |
| Alienware m16 R2 | |
| Asus ROG Strix Scar 16 G634JZR | |
| PCMark 10 / Digital Content Creation | |
| Asus ROG Strix Scar 16 G634JZR | |
| Asus TUF Gaming A17 FA707XI-NS94 | |
| Alienware m16 R2 | |
| Acer Predator Helios Neo 16 (2024) | |
| Asus TUF Gaming A15 FA507UV | |
| HP Omen 17-db0079ng | |
| Media AMD Ryzen 7 8845HS, NVIDIA GeForce RTX 4070 Laptop GPU () | |
| Media della classe Gaming (6462 - 18475, n=179, ultimi 2 anni) | |
| Tulpar T7 V20.6 | |
| CrossMark / Overall | |
| Acer Predator Helios Neo 16 (2024) | |
| Asus ROG Strix Scar 16 G634JZR | |
| Media della classe Gaming (1247 - 2344, n=162, ultimi 2 anni) | |
| Asus TUF Gaming A15 FA507UV | |
| Asus TUF Gaming A17 FA707XI-NS94 | |
| Alienware m16 R2 | |
| Tulpar T7 V20.6 | |
| HP Omen 17-db0079ng | |
| Media AMD Ryzen 7 8845HS, NVIDIA GeForce RTX 4070 Laptop GPU () | |
| CrossMark / Productivity | |
| Acer Predator Helios Neo 16 (2024) | |
| Asus ROG Strix Scar 16 G634JZR | |
| Media della classe Gaming (1299 - 2204, n=162, ultimi 2 anni) | |
| Asus TUF Gaming A15 FA507UV | |
| Asus TUF Gaming A17 FA707XI-NS94 | |
| Tulpar T7 V20.6 | |
| Alienware m16 R2 | |
| HP Omen 17-db0079ng | |
| Media AMD Ryzen 7 8845HS, NVIDIA GeForce RTX 4070 Laptop GPU () | |
| CrossMark / Creativity | |
| Acer Predator Helios Neo 16 (2024) | |
| Asus ROG Strix Scar 16 G634JZR | |
| Media della classe Gaming (1275 - 2660, n=162, ultimi 2 anni) | |
| Asus TUF Gaming A17 FA707XI-NS94 | |
| Asus TUF Gaming A15 FA507UV | |
| Alienware m16 R2 | |
| Tulpar T7 V20.6 | |
| HP Omen 17-db0079ng | |
| Media AMD Ryzen 7 8845HS, NVIDIA GeForce RTX 4070 Laptop GPU () | |
| CrossMark / Responsiveness | |
| Acer Predator Helios Neo 16 (2024) | |
| Asus ROG Strix Scar 16 G634JZR | |
| Media della classe Gaming (1030 - 2330, n=162, ultimi 2 anni) | |
| Asus TUF Gaming A15 FA507UV | |
| Alienware m16 R2 | |
| Tulpar T7 V20.6 | |
| Asus TUF Gaming A17 FA707XI-NS94 | |
| HP Omen 17-db0079ng | |
| Media AMD Ryzen 7 8845HS, NVIDIA GeForce RTX 4070 Laptop GPU () | |
| WebXPRT 3 / Overall | |
| Acer Predator Helios Neo 16 (2024) | |
| Asus TUF Gaming A17 FA707XI-NS94 | |
| Asus ROG Strix Scar 16 G634JZR | |
| Asus TUF Gaming A15 FA507UV | |
| Media della classe Gaming (215 - 480, n=181, ultimi 2 anni) | |
| Alienware m16 R2 | |
| Tulpar T7 V20.6 | |
| HP Omen 17-db0079ng | |
| Media AMD Ryzen 7 8845HS, NVIDIA GeForce RTX 4070 Laptop GPU () | |
| WebXPRT 4 / Overall | |
| Asus ROG Strix Scar 16 G634JZR | |
| Acer Predator Helios Neo 16 (2024) | |
| Tulpar T7 V20.6 | |
| Asus TUF Gaming A17 FA707XI-NS94 | |
| Media della classe Gaming (157.9 - 328, n=167, ultimi 2 anni) | |
| Asus TUF Gaming A15 FA507UV | |
| Alienware m16 R2 | |
| Mozilla Kraken 1.1 / Total | |
| HP Omen 17-db0079ng | |
| Media AMD Ryzen 7 8845HS, NVIDIA GeForce RTX 4070 Laptop GPU () | |
| Alienware m16 R2 | |
| Media della classe Gaming (421 - 737, n=193, ultimi 2 anni) | |
| Asus TUF Gaming A15 FA507UV | |
| Tulpar T7 V20.6 | |
| Asus TUF Gaming A17 FA707XI-NS94 | |
| Acer Predator Helios Neo 16 (2024) | |
| Asus ROG Strix Scar 16 G634JZR | |
* ... Meglio usare valori piccoli
| PCMark 10 Score | 7800 punti | |
Aiuto | ||
| AIDA64 / Memory Copy | |
| Asus ROG Strix Scar 16 G634JZR | |
| Acer Predator Helios Neo 16 (2024) | |
| Media AMD Ryzen 7 8845HS (67615 - 69523, n=6) | |
| HP Omen 17-db0079ng | |
| Media della classe Gaming (21842 - 94222, n=201, ultimi 2 anni) | |
| Alienware m16 R2 | |
| Asus TUF Gaming A15 FA507UV | |
| Asus TUF Gaming A17 FA707XI-NS94 | |
| Tulpar T7 V20.6 | |
| AIDA64 / Memory Read | |
| Asus ROG Strix Scar 16 G634JZR | |
| Acer Predator Helios Neo 16 (2024) | |
| Alienware m16 R2 | |
| Media della classe Gaming (23681 - 99713, n=201, ultimi 2 anni) | |
| Asus TUF Gaming A15 FA507UV | |
| Asus TUF Gaming A17 FA707XI-NS94 | |
| HP Omen 17-db0079ng | |
| Media AMD Ryzen 7 8845HS (49866 - 61976, n=6) | |
| Tulpar T7 V20.6 | |
| AIDA64 / Memory Write | |
| Media AMD Ryzen 7 8845HS (85464 - 93239, n=6) | |
| HP Omen 17-db0079ng | |
| Asus TUF Gaming A15 FA507UV | |
| Asus ROG Strix Scar 16 G634JZR | |
| Asus TUF Gaming A17 FA707XI-NS94 | |
| Acer Predator Helios Neo 16 (2024) | |
| Alienware m16 R2 | |
| Media della classe Gaming (22986 - 108954, n=201, ultimi 2 anni) | |
| Tulpar T7 V20.6 | |
| AIDA64 / Memory Latency | |
| Alienware m16 R2 | |
| HP Omen 17-db0079ng | |
| Media AMD Ryzen 7 8845HS (85.6 - 107.1, n=6) | |
| Media della classe Gaming (59.5 - 259, n=201, ultimi 2 anni) | |
| Asus TUF Gaming A15 FA507UV | |
| Asus TUF Gaming A17 FA707XI-NS94 | |
| Acer Predator Helios Neo 16 (2024) | |
| Tulpar T7 V20.6 | |
| Asus ROG Strix Scar 16 G634JZR | |
* ... Meglio usare valori piccoli
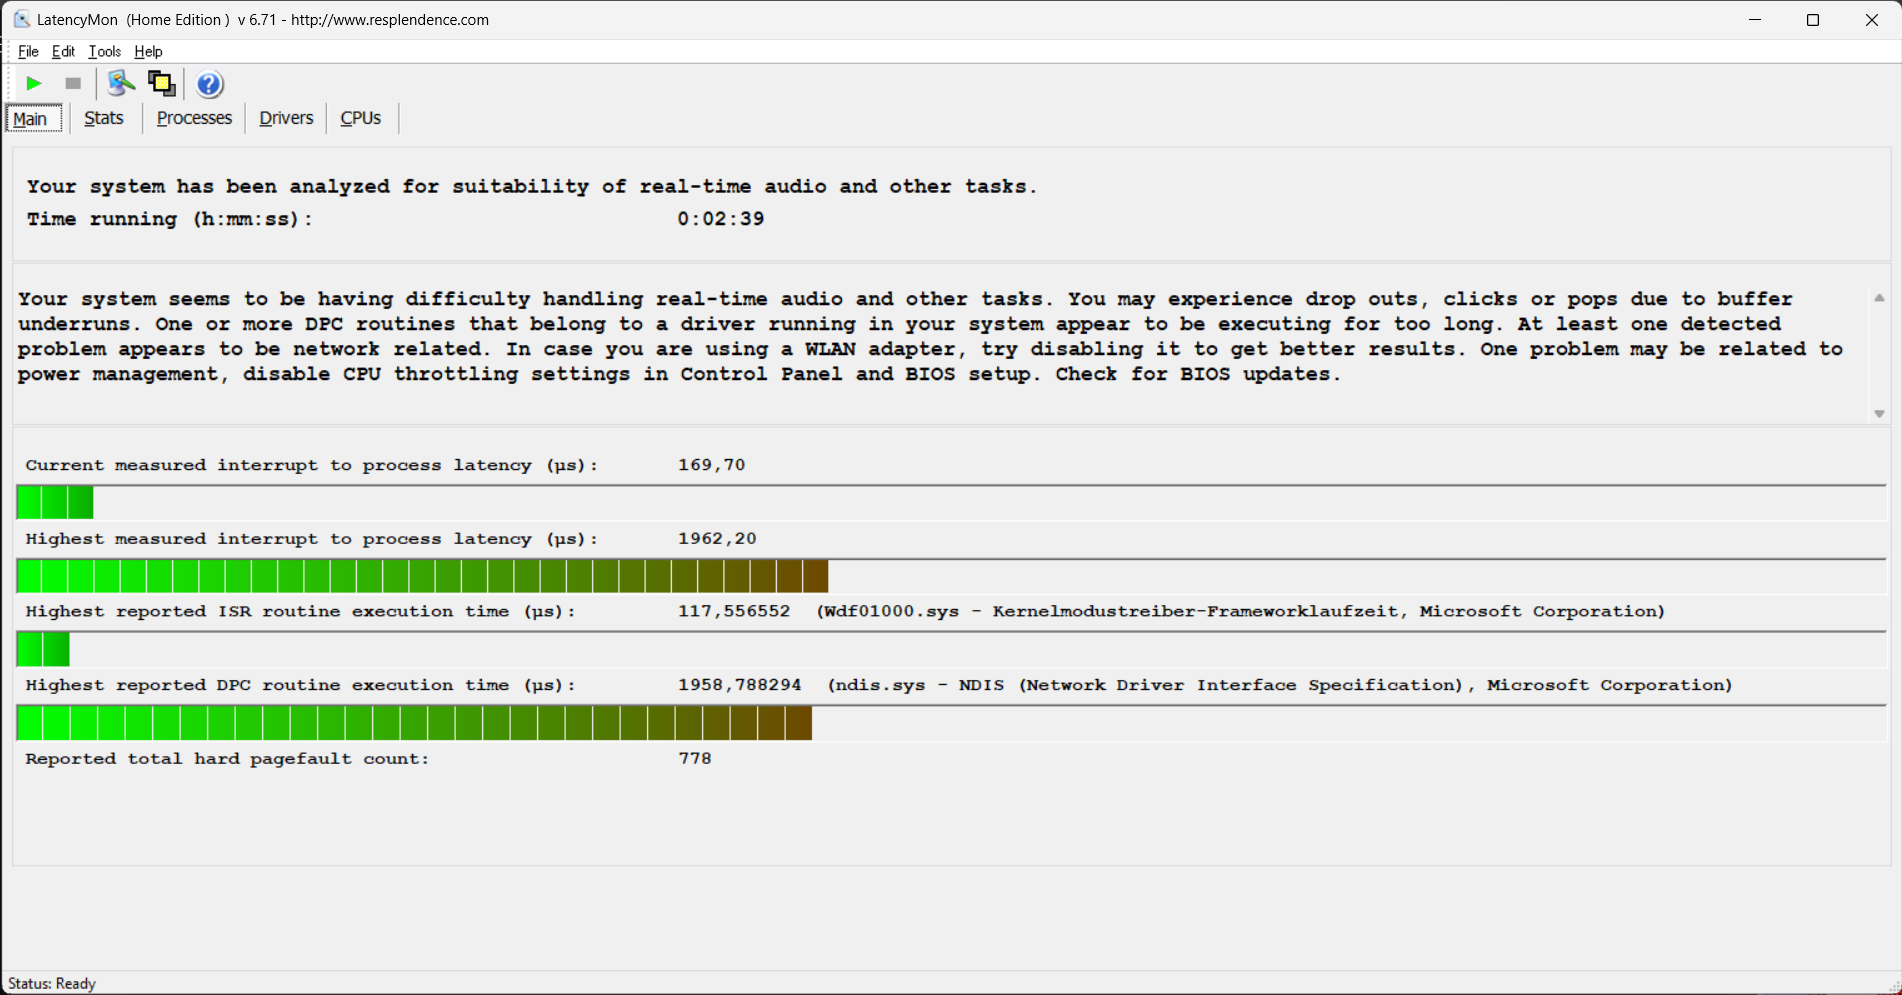
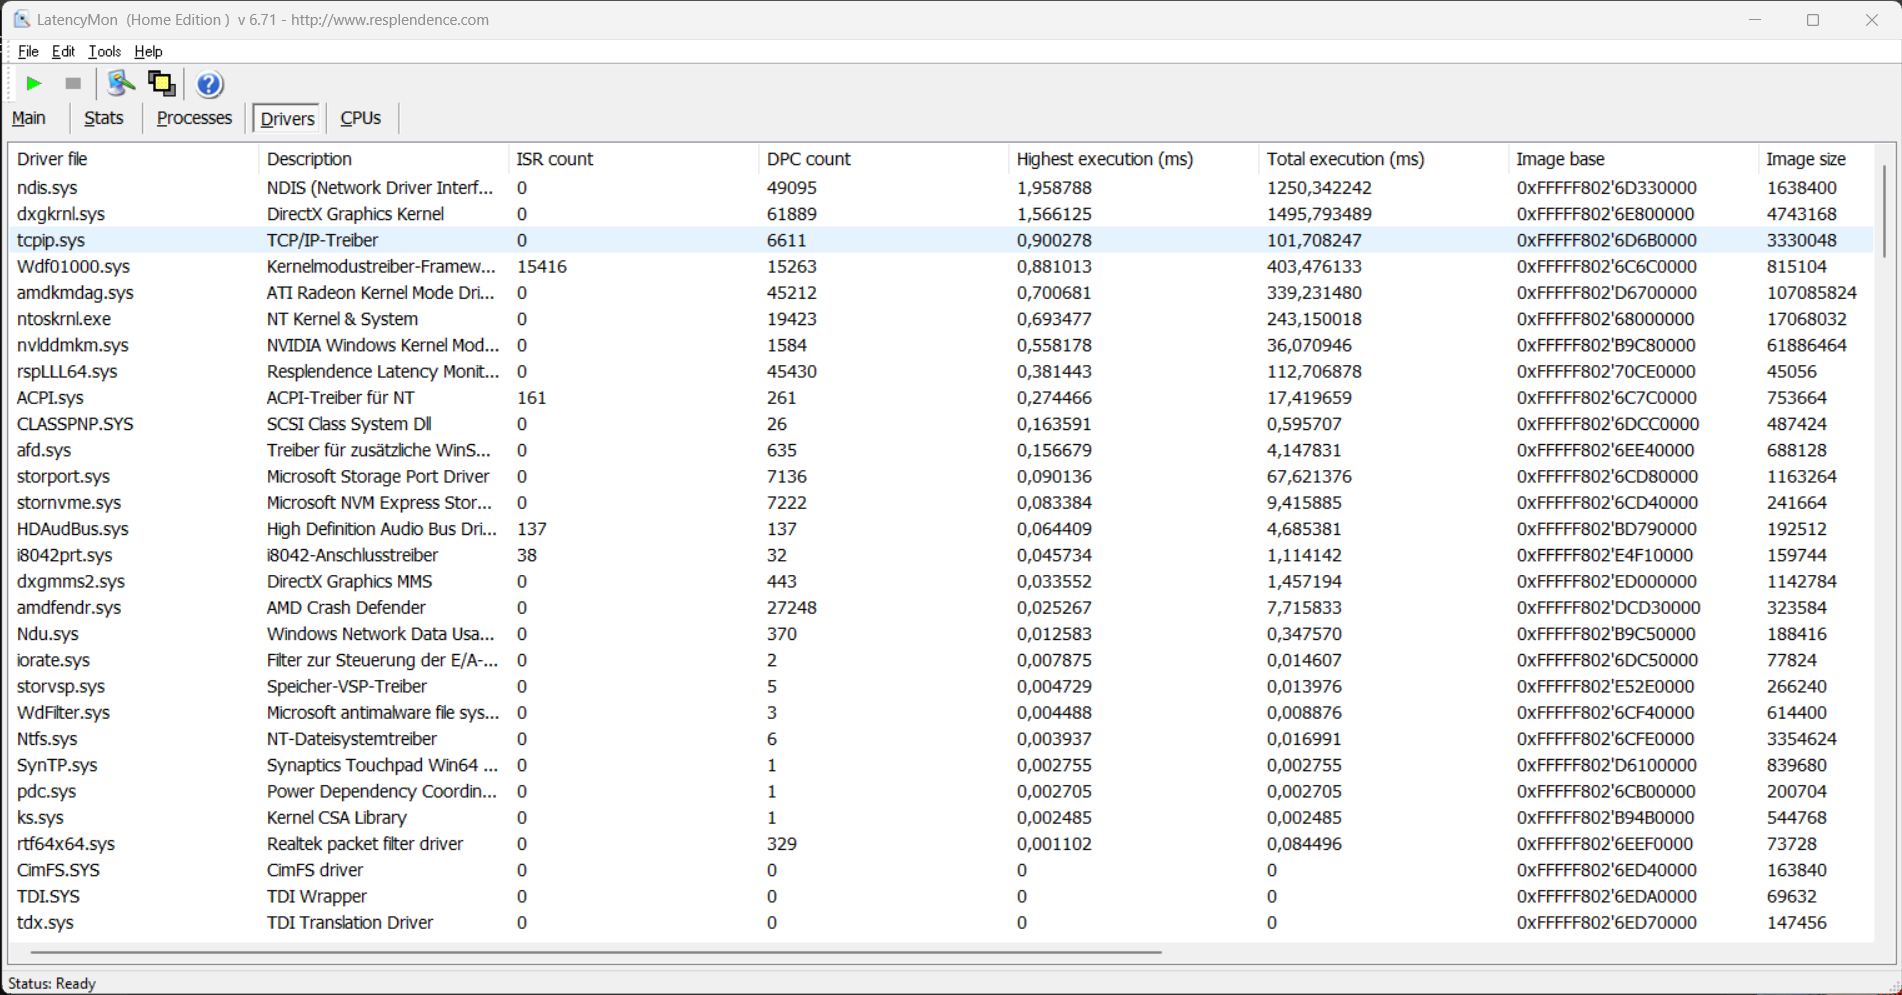
Latenze DPC
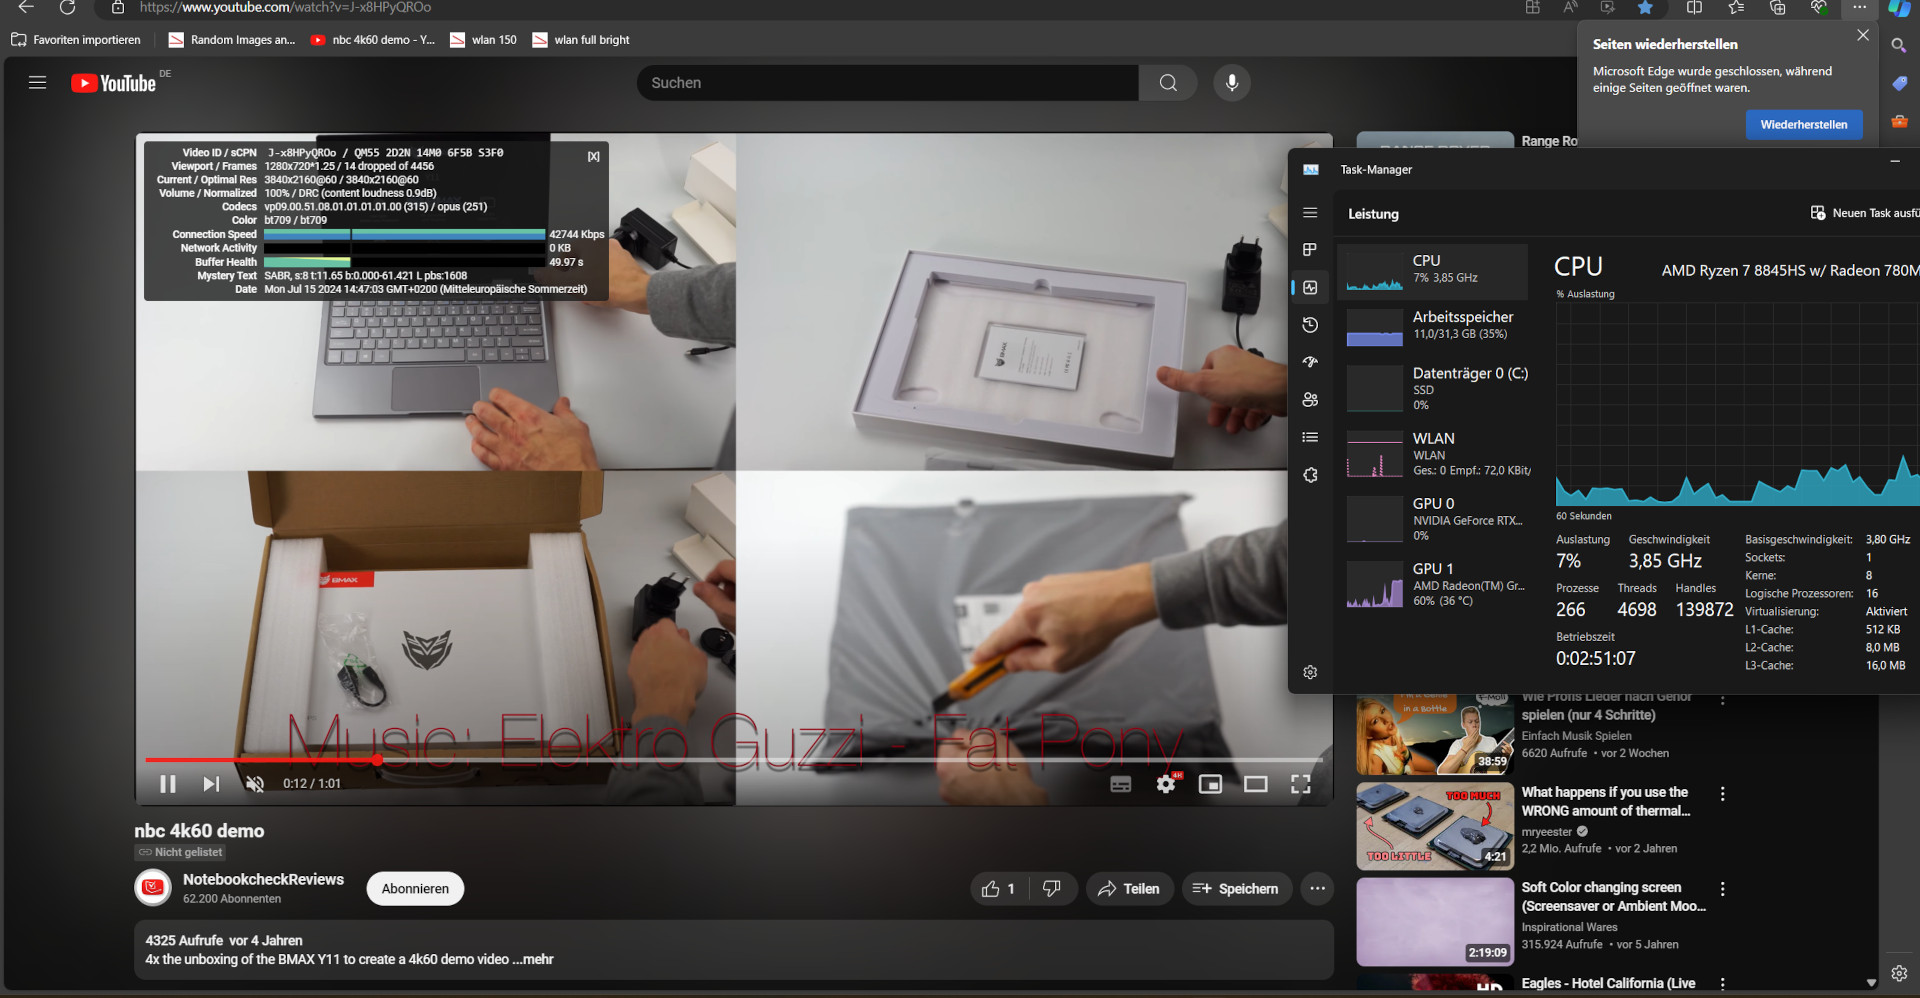
La nostra unità di prova, nella sua configurazione attuale, non è necessariamente adatta all'elaborazione di audio e video in tempo reale, in quanto bisogna aspettarsi alcuni piccoli stutters. I driver di rete e il kernel grafico DirectX impediscono un risultato migliore. Con alcuni driver modificati o un successivo aggiornamento del software, la situazione potrebbe migliorare o addirittura peggiorare.
Ciò che risalta è l'elevato utilizzo dell'iGPU durante la riproduzione di un video 4K. Sebbene un utilizzo del 60% sia ancora difendibile, si tratta di quasi il doppio rispetto alla soluzione grafica integrata di Intel. E anche 13 fotogrammi caduti in un lasso di tempo di un minuto non sono un risultato ottimale.
| DPC Latencies / LatencyMon - interrupt to process latency (max), Web, Youtube, Prime95 | |
| Asus ROG Strix Scar 16 G634JZR | |
| Alienware m16 R2 | |
| HP Omen 17-db0079ng | |
| Asus TUF Gaming A17 FA707XI-NS94 | |
| Acer Predator Helios Neo 16 (2024) | |
| Asus TUF Gaming A15 FA507UV | |
* ... Meglio usare valori piccoli
Soluzione di archiviazione
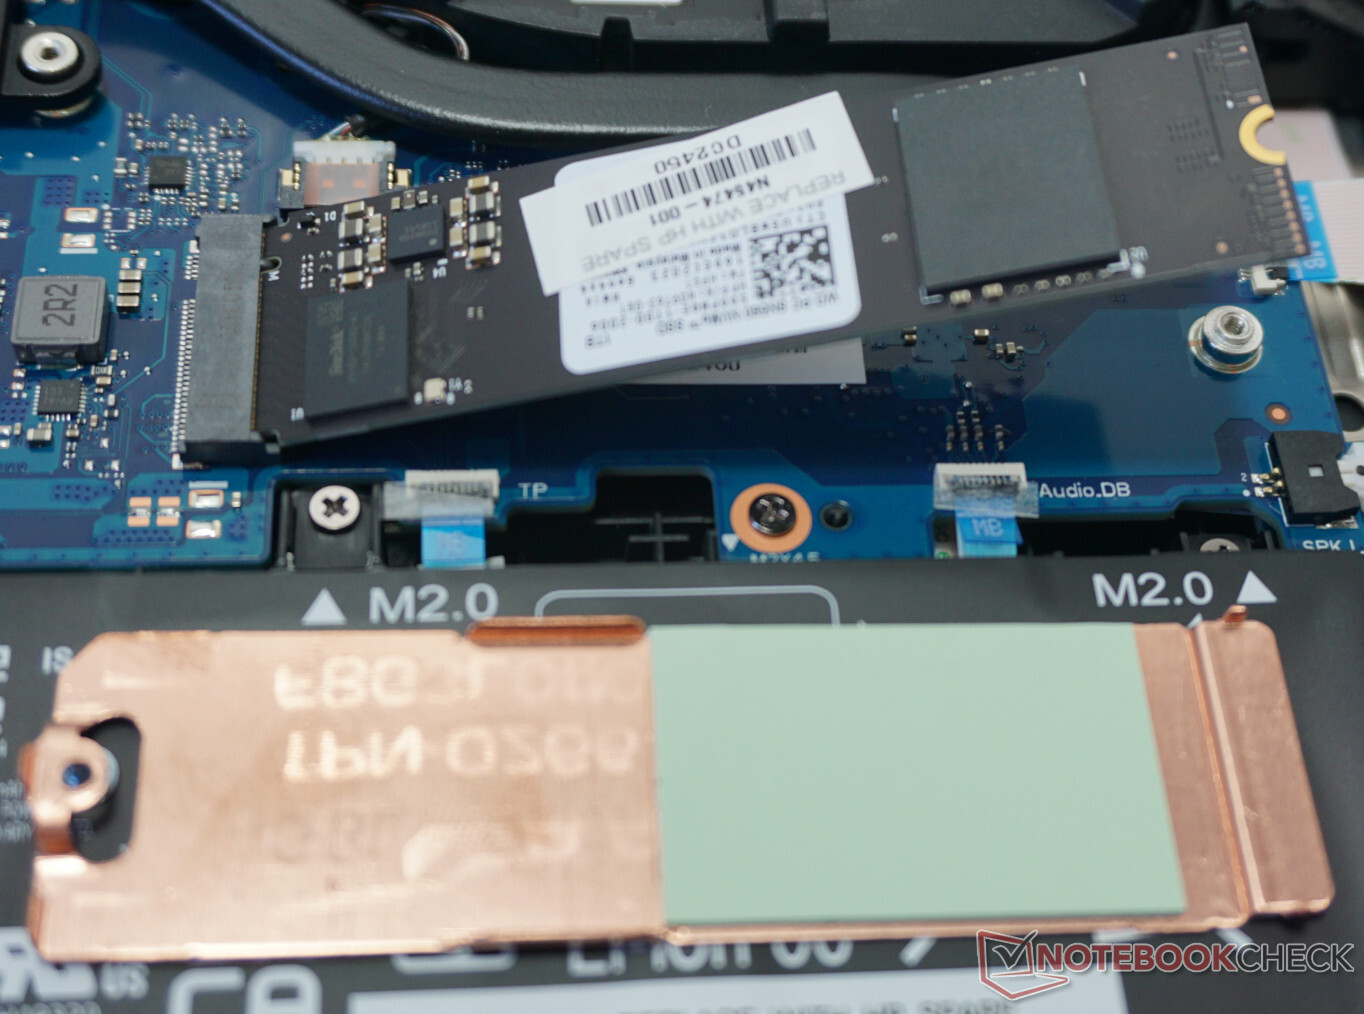
L'SSD utilizzato in questo caso non raggiunge le massime velocità assolute. Ad esempio, la soluzione di archiviazione nella Asus ROG Strix Scar 16 è in grado di offrire prestazioni migliori del 30% in termini di accesso sequenziale. Ma questo contribuisce solo raramente a un aumento dei frame rate durante il gioco. Potremmo osservare un miglioramento minimo, se non nullo, durante il multitasking intenso con molte attività di accesso parallelo.
D'altra parte, l'Omen 17 mostra come dovrebbe essere un buon raffreddamento dell'SSD. A differenza di molti concorrenti costruiti in modo simile, tra cui il ROG Strix Scar, le prestazioni costanti rimangono costantemente a un livello buono, anche se non eccezionale.
Il secondo slot per un'unità SSD M.2-NVMe ha anche un raffreddatore già preinstallato. Quindi, se lo desidera, può aggiungere qui un'unità più veloce o almeno più grande.

* ... Meglio usare valori piccoli
Disk Throttling: DiskSpd Read Loop, Queue Depth 8
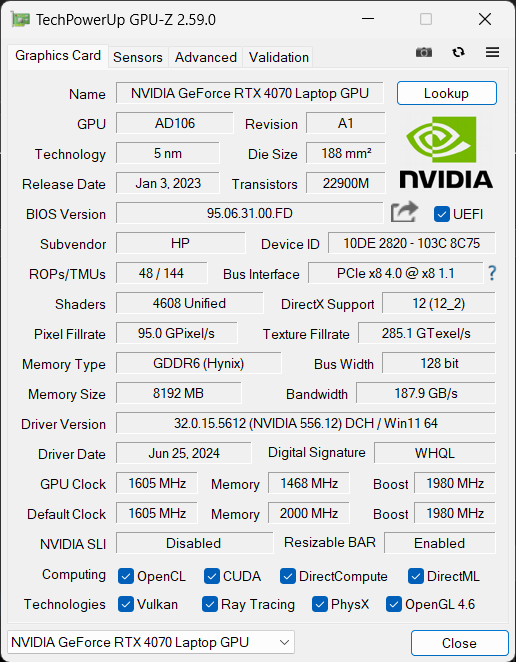
Scheda grafica
L'HP Omen 17 utilizza la Nvidia GeForce RTX 4070 scheda grafica. In alternativa, può anche acquistare una versione più piccola con la scheda grafica RTX 4060. La più grande delle due si adatta bene al display QHD. Abbiamo dovuto rinunciare alle impostazioni di dettaglio massime con i giochi più recenti solo se volevamo ottenere più di 60 FPS.
La RTX 4070 è in grado di consumare un massimo di 120 watt qui, che è inferiore al valore massimo consentito di 140 watt. Ma questo non è molto evidente, soprattutto nei benchmark sintetici di 3DMark, e a volte osserviamo addirittura il contrario. Ad esempio, l' Asus TUF Gaming A17che sulla carta è meglio equipaggiato con una RTX 4070 da 140 watt, rimane indietro del 9% in generale. Tuttavia, la distanza è minore nelle prestazioni di gioco. Probabilmente qui vediamo l'effetto dell'HP Omen 17 che non ha bisogno di accelerare.
I valori di potenza si riducono ulteriormente nelle altre modalità di alimentazione. In modalità "Bilanciata", è ancora di 90 watt, che riduce le prestazioni del 10% al massimo. Il calo di potenza diventa più pronunciato in modalità "Eco" e durante il funzionamento a batteria, dove la scheda grafica può consumare solo 40 watt. Anche se i giochi non così complessi rimangono giocabili, bisogna aspettarsi una frequenza di fotogrammi ridotta di un terzo.
Può trovare altri benchmark e test di gioco nel nostro Elenco di benchmark GPU.
| 3DMark 11 Performance | 35016 punti | |
| 3DMark Cloud Gate Standard Score | 65355 punti | |
| 3DMark Fire Strike Score | 27594 punti | |
| 3DMark Time Spy Score | 12346 punti | |
| 3DMark Steel Nomad Score | 2743 punti | |
Aiuto | ||
* ... Meglio usare valori piccoli
Prestazioni di gioco
Con impostazioni di dettaglio semplicemente elevate anziché massime, l'HP Omen 17 è in grado di superare in modo affidabile la soglia dei 100 FPS con la risoluzione Full-HD. Questo vale anche per i giochi attuali. Con diversi giochi, le differenze rispetto ad altri portatili da gioco con RTX 4070 sono solo di pochi punti percentuali. Il vantaggio del Asus TUF Gaming A15 con una CPU più veloce ma solo una RTX 4060 è appena del 4%. Ma i giochi graficamente impegnativi, come Cyberpunk 2077 2.1, sono molto più giocabili con l'Omen 17. La GPU più piccola è comunque in grado di padroneggiare i giochi più vecchi a livello visivo.
La differenza tra la modalità più silenziosa "Bilanciata" e le prestazioni massime rimane minima. Spesso si raggiungono 100 FPS anche in questo caso. Nel complesso, quindi, possiamo dire che la scelta di un TGP più basso non ha portato alcuno svantaggio serio degno di nota nei giochi. Poiché le prestazioni di calcolo disponibili rimangono stabili, l'Omen 17 ha persino un vantaggio in alcuni momenti di carico costante.


| GTA V - 1920x1080 Highest Settings possible AA:4xMSAA + FX AF:16x | |
| Asus ROG Strix Scar 16 G634JZR | |
| Acer Predator Helios Neo 16 (2024) | |
| Media della classe Gaming (12.1 - 167.7, n=185, ultimi 2 anni) | |
| HP Omen 16 (2024) | |
| Asus ROG Zephyrus M16 GU603Z | |
| Asus TUF Gaming A15 FA507UV | |
| HP Omen 17-db0079ng | |
| HP Omen 16-b0085ng | |
| Cyberpunk 2077 2.1 Phantom Liberty - 1920x1080 Ultra Preset (FSR off) | |
| Asus ROG Strix Scar 16 G634JZR | |
| HP Omen 17-db0079ng | |
| Asus TUF Gaming A17 FA707XI-NS94 | |
| Media della classe Gaming (6.76 - 144.7, n=73, ultimi 2 anni) | |
| HP Omen 16 (2024) | |
| Acer Predator Helios Neo 16 (2024) | |
| Alienware m16 R2 | |
| Asus TUF Gaming A15 FA507UV | |
| F1 23 | |
| 1920x1080 Ultra High Preset AA:T AF:16x | |
| Asus ROG Strix Scar 16 G634JZR | |
| Media della classe Gaming (12.9 - 149.2, n=39, ultimi 2 anni) | |
| Media NVIDIA GeForce RTX 4070 Laptop GPU (49.5 - 100, n=14) | |
| 2560x1440 Ultra High Preset AA:T AF:16x | |
| Asus ROG Strix Scar 16 G634JZR | |
| Media della classe Gaming (17 - 144.6, n=30, ultimi 2 anni) | |
| Media NVIDIA GeForce RTX 4070 Laptop GPU (35.2 - 49, n=13) | |
| F1 24 | |
| 1920x1080 Ultra High Preset AA:T AF:16x | |
| Media della classe Gaming (54.1 - 127, n=12, ultimi 2 anni) | |
| HP Omen 17-db0079ng | |
| Media NVIDIA GeForce RTX 4070 Laptop GPU (64.7 - 74.1, n=5) | |
| Asus TUF Gaming A15 FA507UV | |
| 2560x1440 Ultra High Preset AA:T AF:16x | |
| Media della classe Gaming (36.7 - 84.7, n=9, ultimi 2 anni) | |
| HP Omen 17-db0079ng | |
| Media NVIDIA GeForce RTX 4070 Laptop GPU (41.1 - 48.4, n=5) | |
Anche il test di carico costante con Cyberpunk 2077 2.1 mostra la stabilità delle prestazioni del portatile, con una linea quasi perfettamente retta dall'inizio alla fine. Grazie al consumo energetico ridotto, l'Omen 17 non ha bisogno di accelerare in nessun momento.
Cyberpunk 2077 Ultra FPS Chart
| basso | medio | alto | ultra | QHD | |
| GTA V (2015) | 178.9 | 175.5 | 163.1 | 103.9 | 90.2 |
| Dota 2 Reborn (2015) | 152.5 | 138.8 | 137.3 | 126.3 | |
| Final Fantasy XV Benchmark (2018) | 201 | 155.7 | 117.2 | 88.2 | |
| X-Plane 11.11 (2018) | 128.8 | 115.7 | 89.5 | ||
| Far Cry 5 (2018) | 137 | 123 | 115 | 110 | 108 |
| Strange Brigade (2018) | 318 | 276 | 240 | 213 | 138.3 |
| God of War (2022) | 149 | 129 | 105 | 74 | 60 |
| Hogwarts Legacy (2023) | 103 | 92 | 87 | 76 | 52 |
| Cyberpunk 2077 2.1 Phantom Liberty (2023) | 135.3 | 122 | 102.6 | 88.9 | 54.5 |
| F1 24 (2024) | 205 | 210 | 196.6 | 74.1 | 48.4 |
Emissioni - Non è un aereo a reazione
Livelli di rumore
Il controllo della ventola sotto carico mostra una riuscita implementazione del raffreddamento. Anche nei momenti di massima prestazione, il rumore non diventa mai fastidioso, anche se poi è chiaramente udibile. A differenza di concorrenti come l' Alienware m16 R2le cuffie non saranno assolutamente necessarie in quei momenti, anche se sono comunque consigliate.
L'Omen 17 fa ancora meglio in modalità "Bilanciata", che comporta solo alcune piccole limitazioni nelle prestazioni. Finché il gioco è interessante solo a metà, non dovrebbe quasi più notare il rumore della ventola. Inoltre, il software incluso le consentirà di effettuare facilmente ulteriori regolazioni della velocità della ventola, al fine di ridurre ulteriormente il livello di rumore.
Purtroppo, però, il portatile da gioco non rimane mai assolutamente silenzioso. Anche in assenza di carico, le ventole si alzano di tanto in tanto e, sebbene non raggiungano i livelli di velocità massima, sono comunque molto udibili. L'Omen 17 rimane lontano dal raggiungere temperature critiche.
Rumorosità
| Idle |
| 25 / 29 / 33 dB(A) |
| Sotto carico |
| 45 / 52 dB(A) |
 | ||
30 dB silenzioso 40 dB(A) udibile 50 dB(A) rumoroso |
||
min: | ||
| HP Omen 17-db0079ng NVIDIA GeForce RTX 4070 Laptop GPU, R7 8845HS, WD PC SN560 SDDPNQE-1T00 | Alienware m16 R2 NVIDIA GeForce RTX 4070 Laptop GPU, Ultra 7 155H, Samsung PM9A1 MZVL21T0HCLR | Asus ROG Strix Scar 16 G634JZR NVIDIA GeForce RTX 4080 Laptop GPU, i9-14900HX, SK hynix PC801 HFS002TEJ9X101N | Acer Predator Helios Neo 16 (2024) NVIDIA GeForce RTX 4070 Laptop GPU, i7-14700HX, Samsung PM9A1a MZVL21T0HDLU | Asus TUF Gaming A17 FA707XI-NS94 NVIDIA GeForce RTX 4070 Laptop GPU, R9 7940HS, WD PC SN560 SDDPNQE-1T00 | Asus TUF Gaming A15 FA507UV NVIDIA GeForce RTX 4060 Laptop GPU, R9 8945H, WD PC SN560 SDDPNQE-1T00 | |
|---|---|---|---|---|---|---|
| Noise | 8% | -5% | -3% | -1% | 5% | |
| off /ambiente * | 25 | 24.7 1% | 21.07 16% | 25.2 -1% | 27.9 -12% | 25 -0% |
| Idle Minimum * | 25 | 25.3 -1% | 29.75 -19% | 27.8 -11% | 28.5 -14% | 25 -0% |
| Idle Average * | 29 | 25.3 13% | 29.75 -3% | 32 -10% | 29.8 -3% | 27 7% |
| Idle Maximum * | 33 | 25.3 23% | 29.75 10% | 29.6 10% | 29.8 10% | 33 -0% |
| Load Average * | 45 | 31.7 30% | 54.85 -22% | 45.2 -0% | 34.8 23% | 40 11% |
| Cyberpunk 2077 ultra * | 48 | 45 6% | ||||
| Load Maximum * | 52 | 62 -19% | 58 -12% | 55.8 -7% | 57.3 -10% | 46 12% |
| Witcher 3 ultra * | 53.8 | 57.8 | 57.1 |
* ... Meglio usare valori piccoli
Le temperature
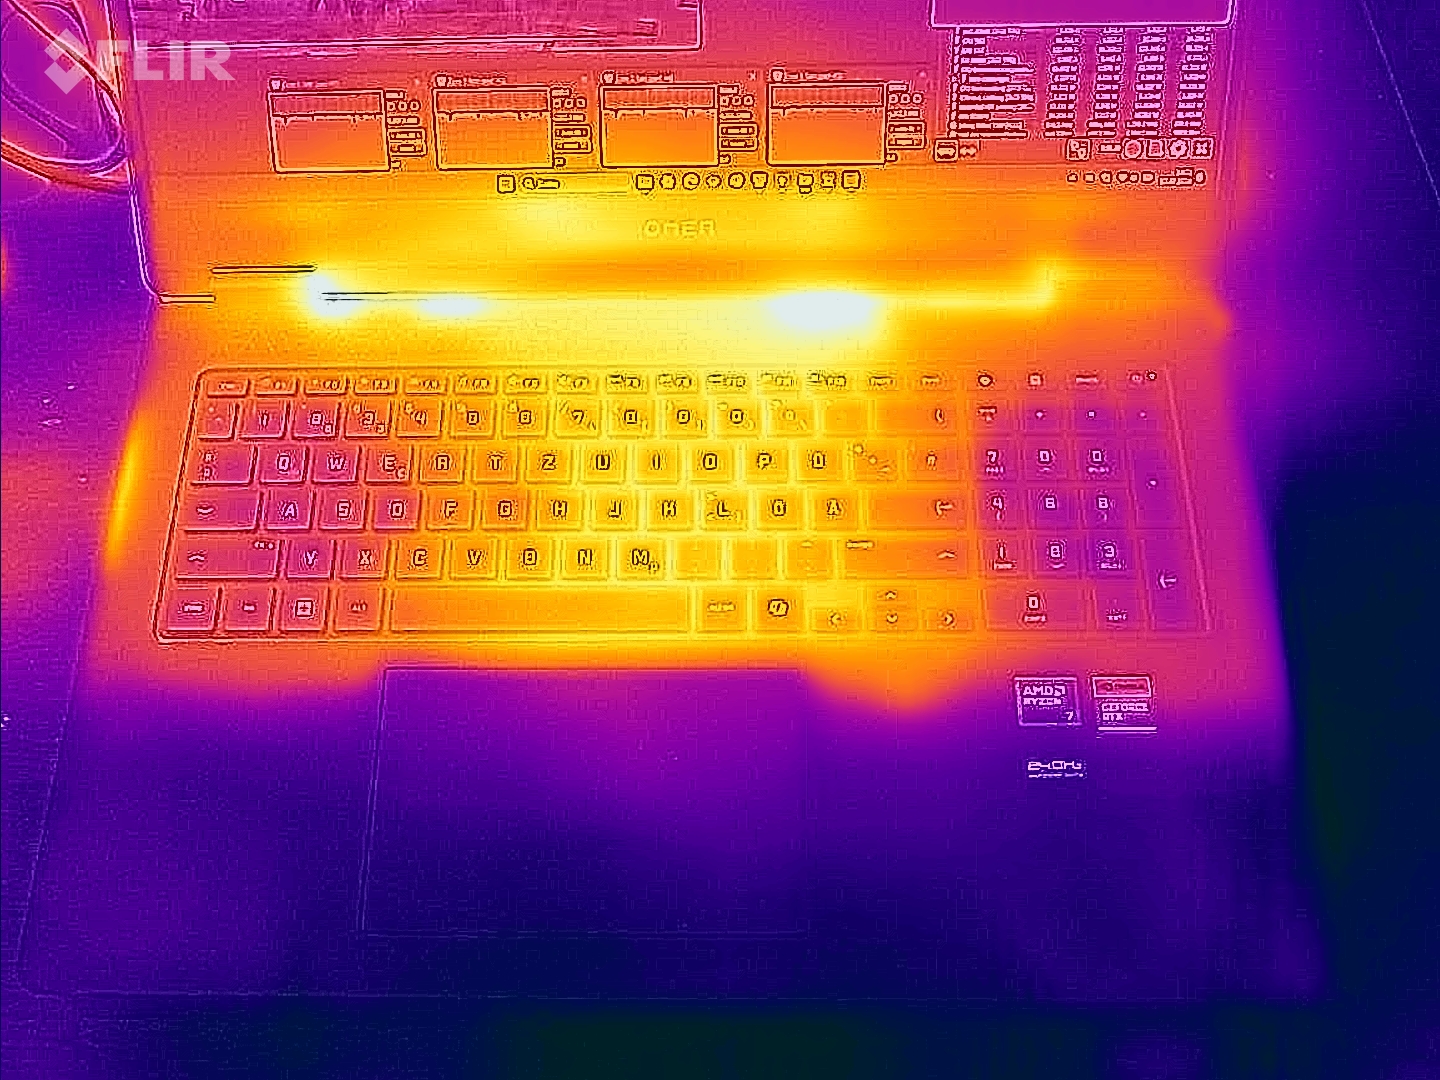
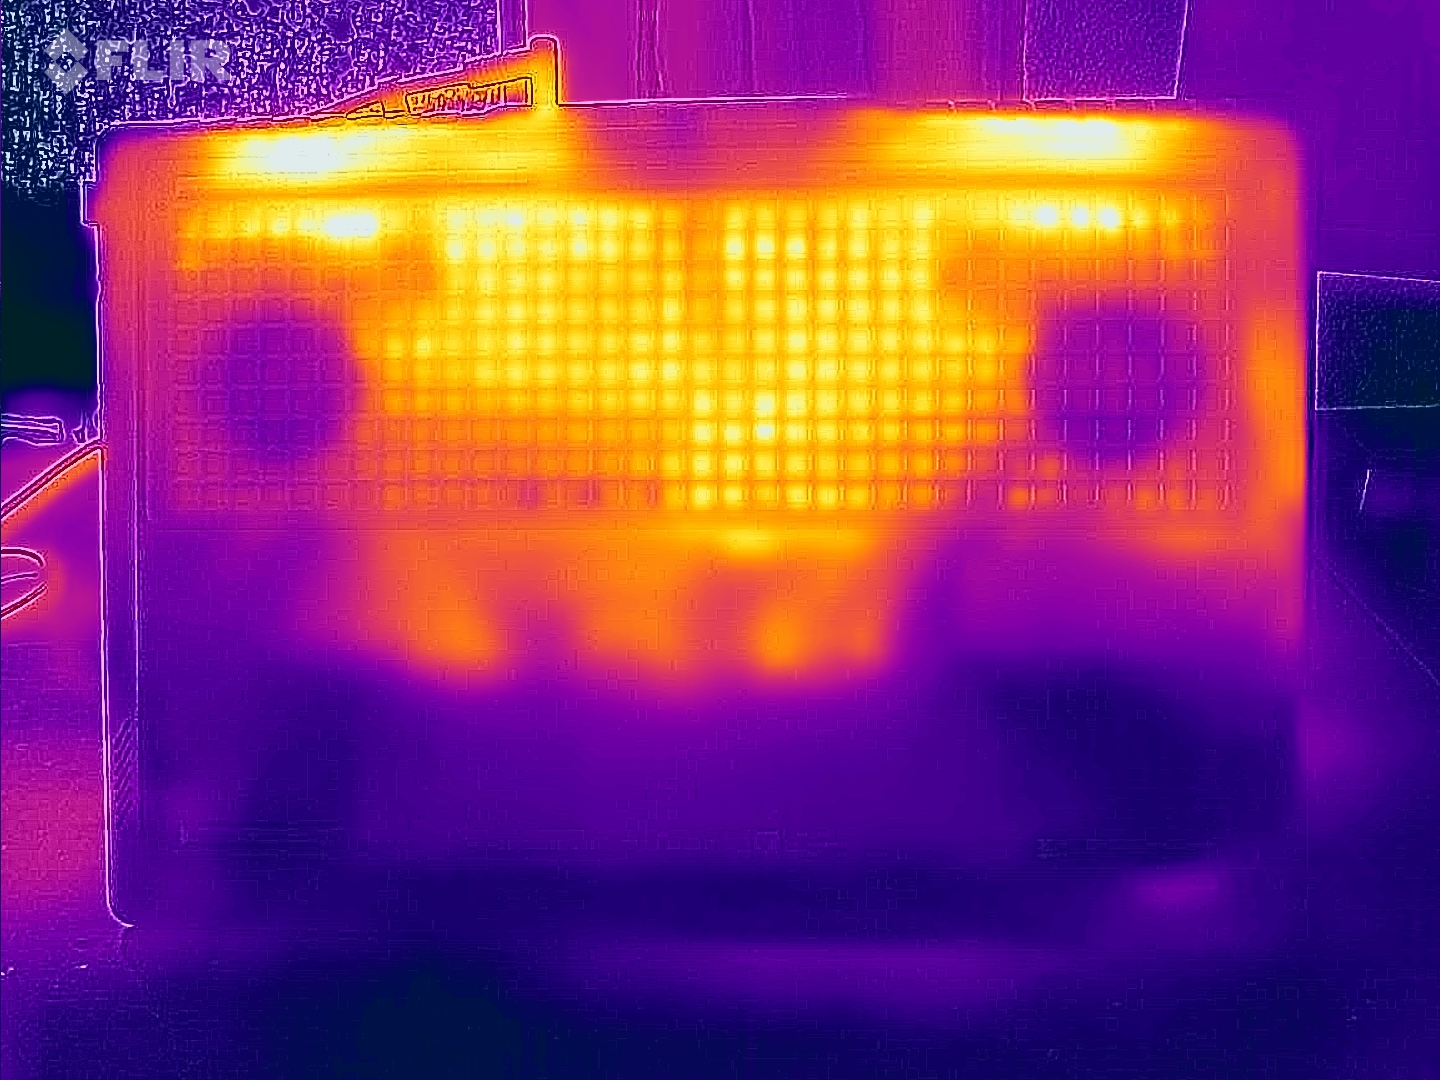
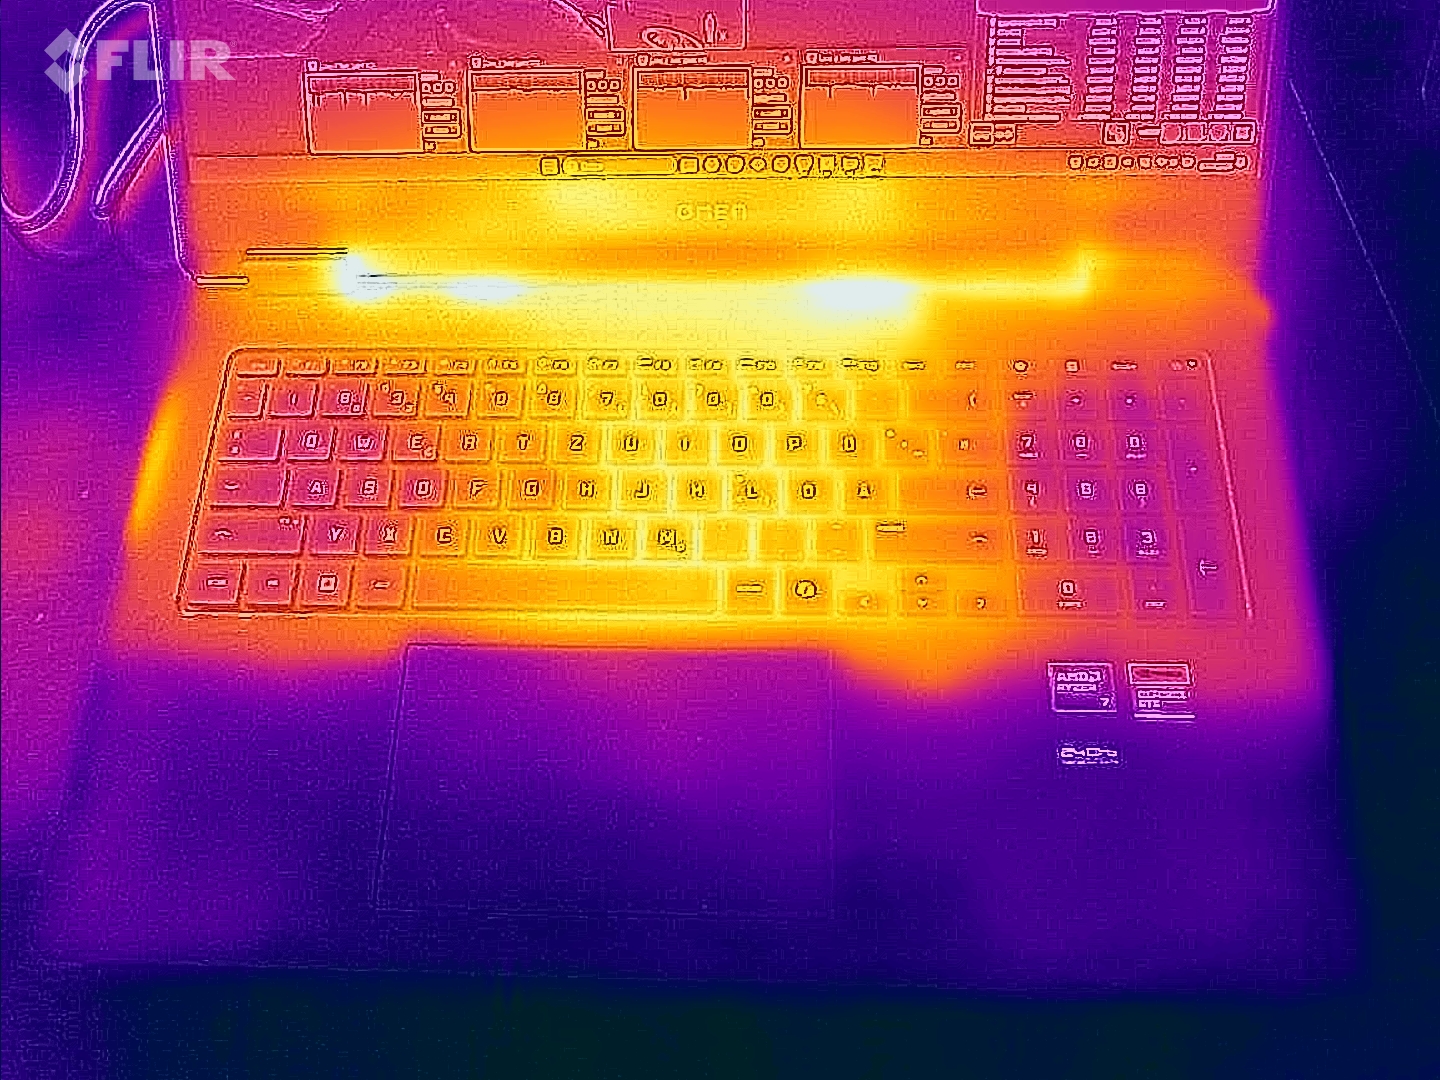
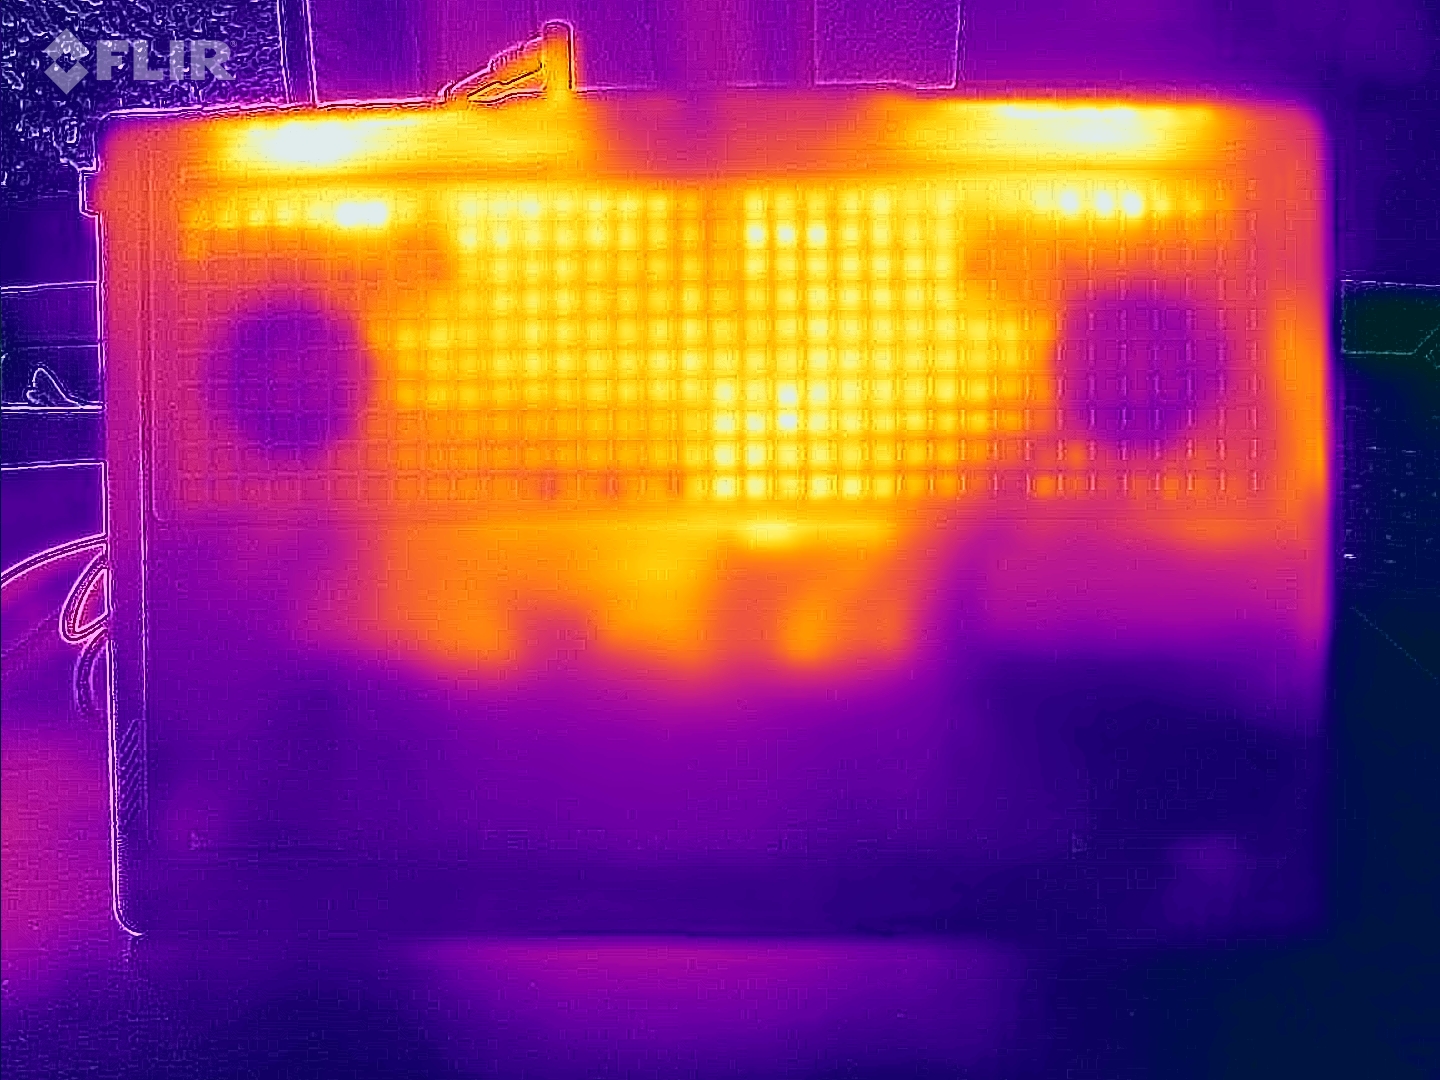
Sia durante il funzionamento al minimo che sotto carico elevato, l'Omen 17 rimane più fresco rispetto a molti dei suoi concorrenti. In particolare, i poggiapolsi non si scaldano quasi mai. Nell'area della tastiera, invece, l'aumento della temperatura si nota chiaramente durante il gioco. In questo caso, si consiglia una soluzione esterna, soprattutto perché la tastiera integrata non è molto impressionante. Durante le attività semplici, come la navigazione in Internet o il lavoro d'ufficio, l'intero dispositivo rimane fresco e comodo da usare. Può anche utilizzarlo comodamente in grembo.
(±) La temperatura massima sul lato superiore è di 44 °C / 111 F, rispetto alla media di 40.4 °C / 105 F, che varia da 21.2 a 68.8 °C per questa classe Gaming.
(±) Il lato inferiore si riscalda fino ad un massimo di 45 °C / 113 F, rispetto alla media di 43.2 °C / 110 F
(+) In idle, la temperatura media del lato superiore è di 25.7 °C / 78 F, rispetto alla media deld ispositivo di 33.9 °C / 93 F.
(±) 3: The average temperature for the upper side is 36.1 °C / 97 F, compared to the average of 33.9 °C / 93 F for the class Gaming.
(+) I poggiapolsi e il touchpad sono piu' freddi della temperatura della pelle con un massimo di 28 °C / 82.4 F e sono quindi freddi al tatto.
(±) La temperatura media della zona del palmo della mano di dispositivi simili e'stata di 28.9 °C / 84 F (+0.9 °C / 1.6 F).
| HP Omen 17-db0079ng AMD Ryzen 7 8845HS, NVIDIA GeForce RTX 4070 Laptop GPU | Alienware m16 R2 Intel Core Ultra 7 155H, NVIDIA GeForce RTX 4070 Laptop GPU | Asus ROG Strix Scar 16 G634JZR Intel Core i9-14900HX, NVIDIA GeForce RTX 4080 Laptop GPU | Acer Predator Helios Neo 16 (2024) Intel Core i7-14700HX, NVIDIA GeForce RTX 4070 Laptop GPU | Asus TUF Gaming A17 FA707XI-NS94 AMD Ryzen 9 7940HS, NVIDIA GeForce RTX 4070 Laptop GPU | Asus TUF Gaming A15 FA507UV AMD Ryzen 9 8945H, NVIDIA GeForce RTX 4060 Laptop GPU | |
|---|---|---|---|---|---|---|
| Heat | -27% | -18% | -23% | 11% | -18% | |
| Maximum Upper Side * | 44 | 44.8 -2% | 47.8 -9% | 58 -32% | 40 9% | 53 -20% |
| Maximum Bottom * | 45 | 48 -7% | 52.2 -16% | 45.2 -0% | 33.6 25% | 46 -2% |
| Idle Upper Side * | 26 | 37.2 -43% | 32.4 -25% | 31.1 -20% | 26.6 -2% | 32 -23% |
| Idle Bottom * | 27 | 42 -56% | 33 -22% | 37.2 -38% | 24.4 10% | 34 -26% |
* ... Meglio usare valori piccoli
Test da sforzo
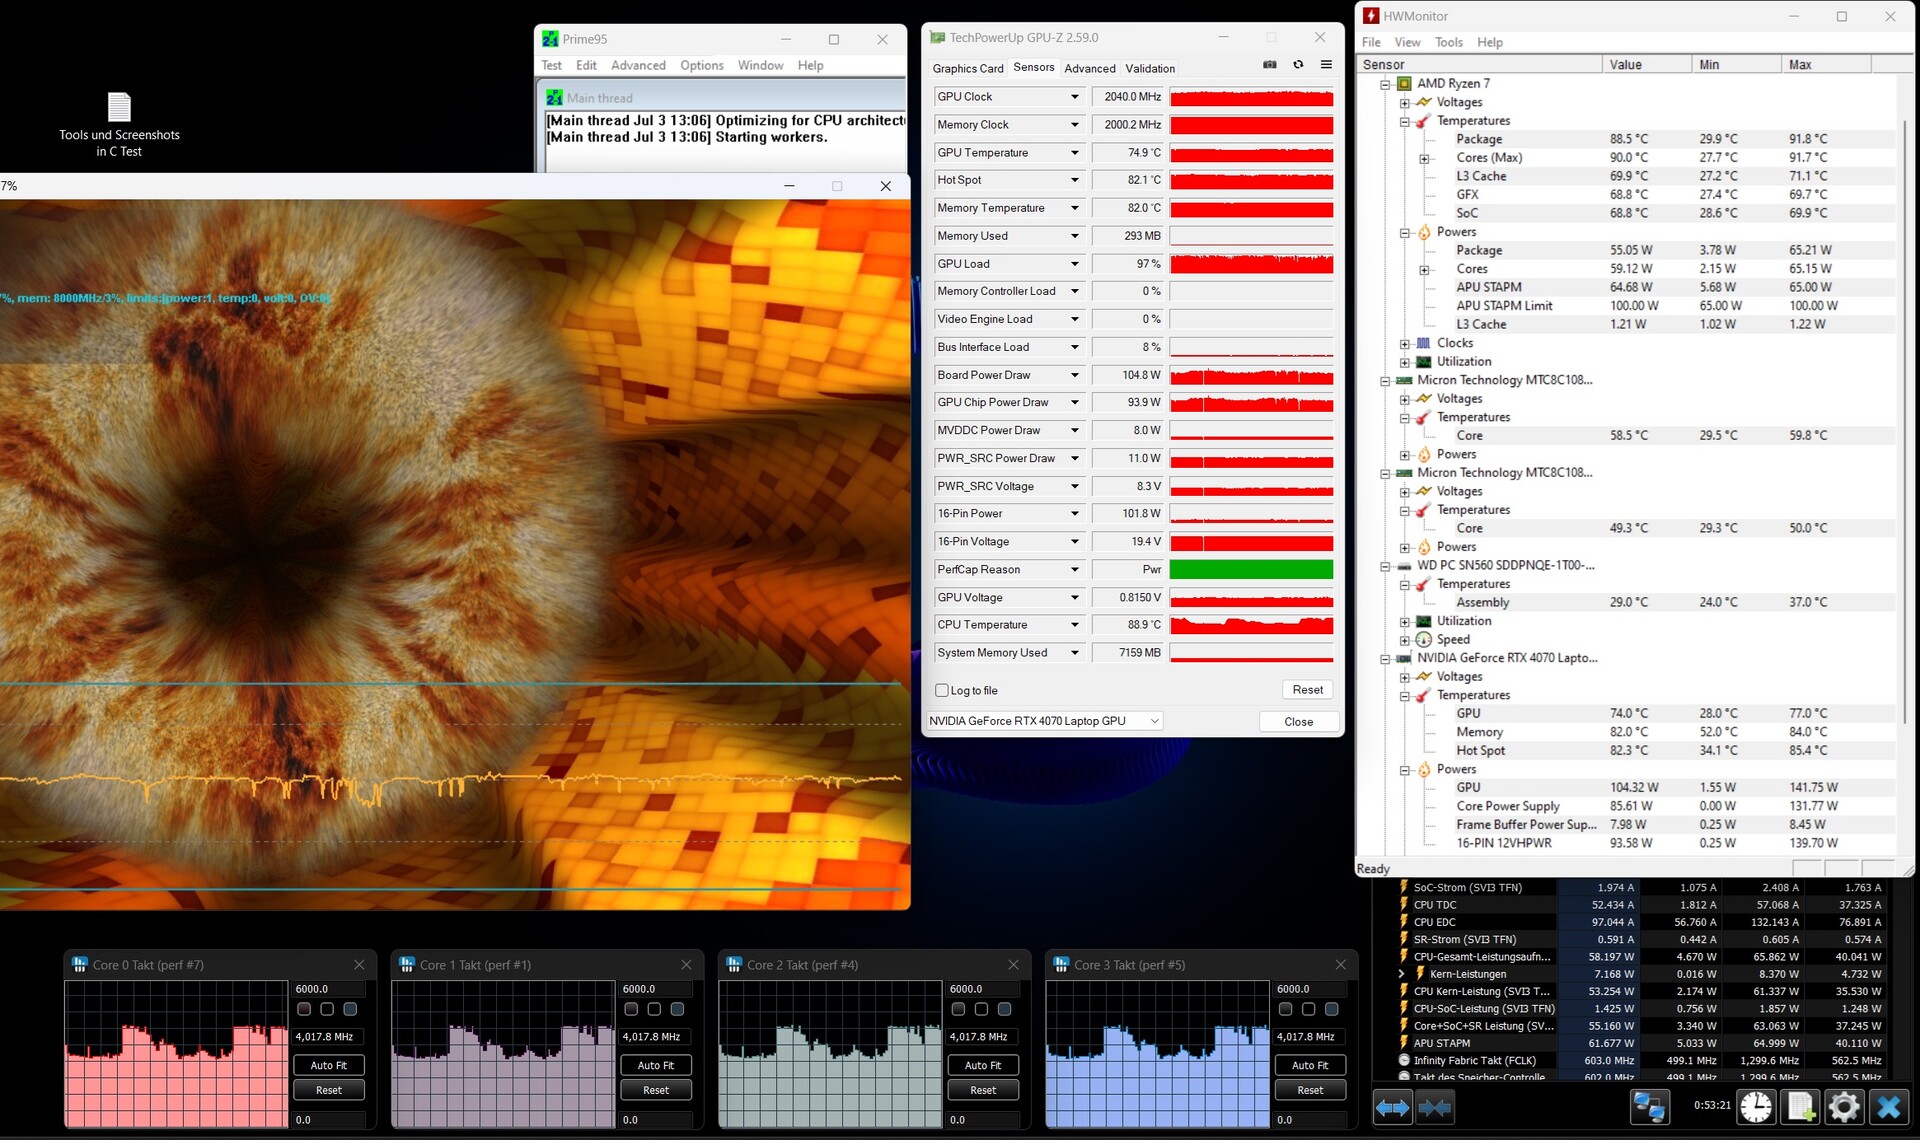
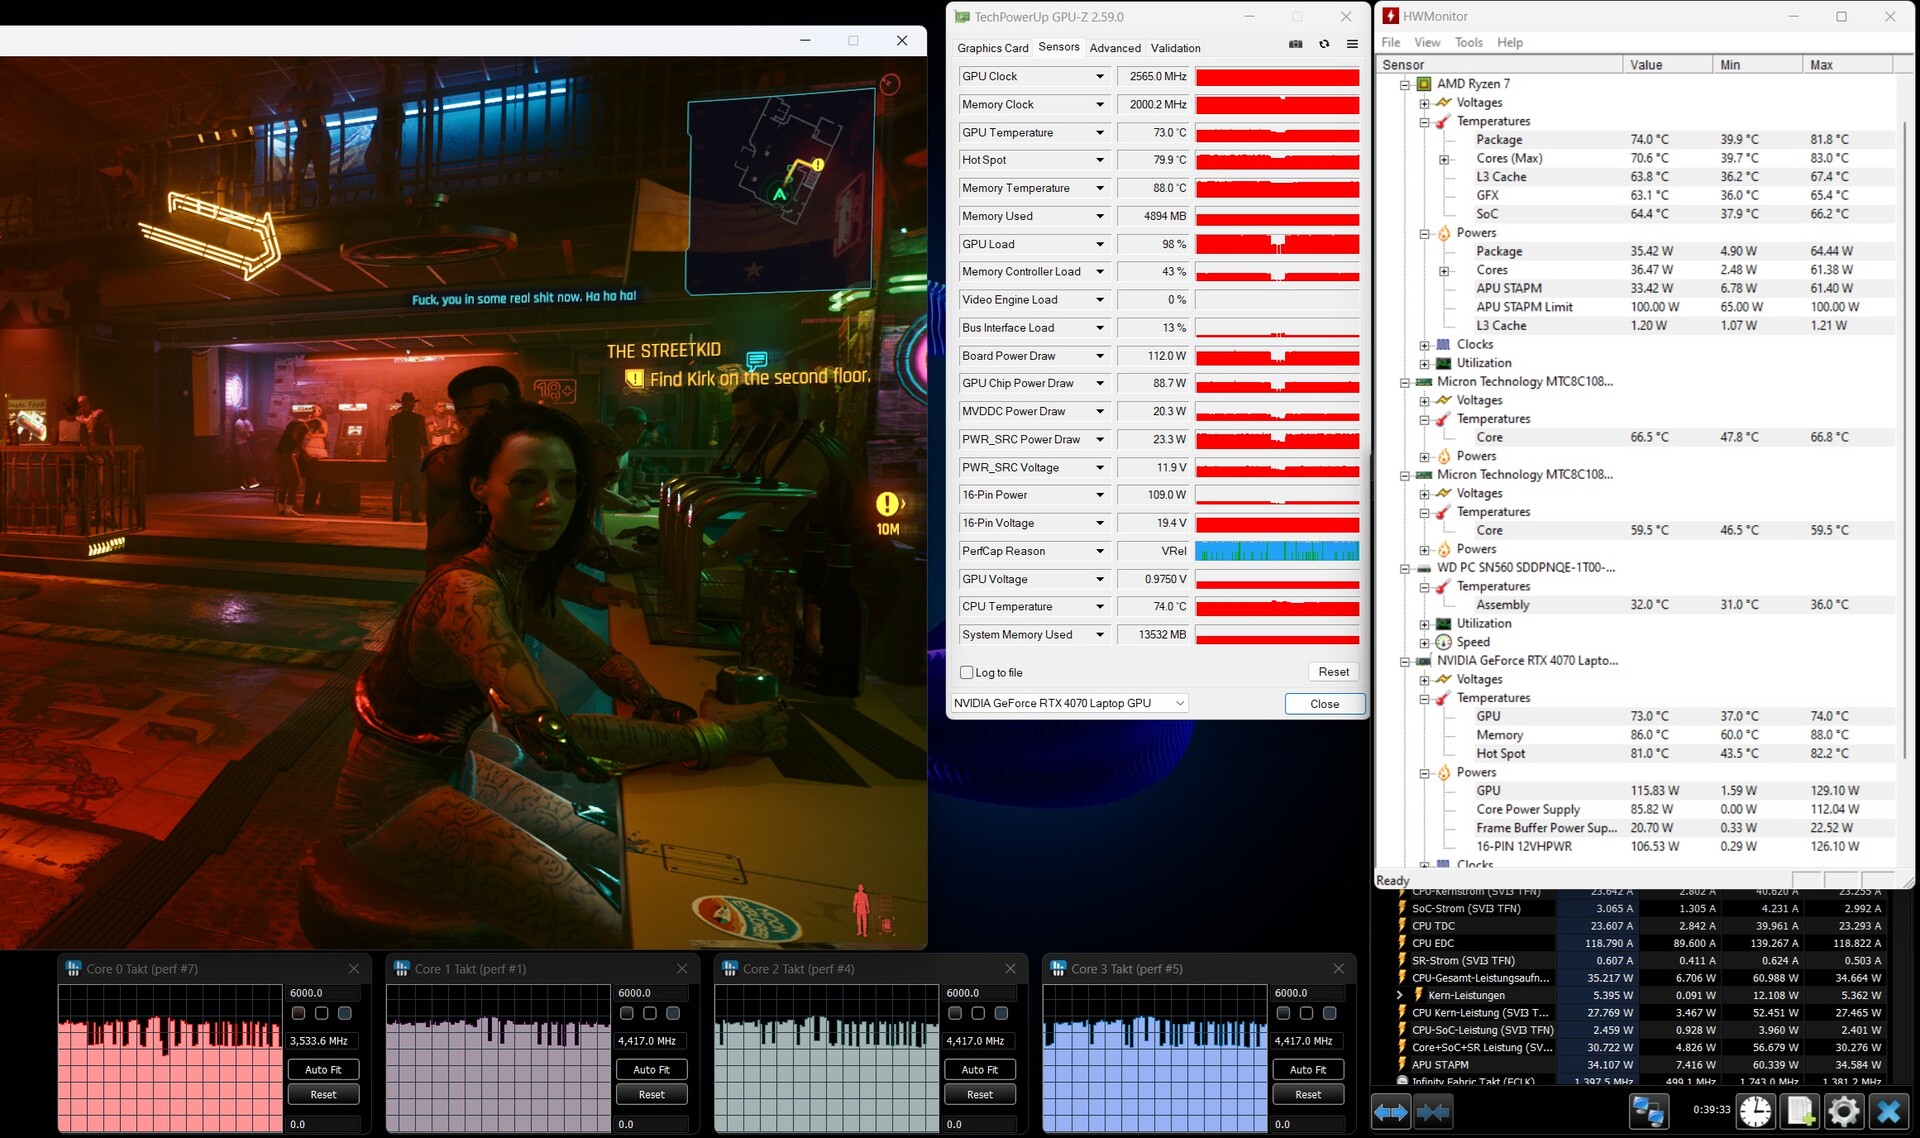
Quando la CPU è sottoposta a pieno carico con Prime95, consuma costantemente i 65 watt consentiti. Sebbene si tratti di un valore inferiore a quello di alcuni concorrenti con la stessa CPU, rimane costante per periodi di tempo più lunghi. La temperatura del core rimane ad un livello accettabile di 80 °C (176 °F) o inferiore.
Solo con un carico supplementare sulla scheda grafica, l'HP Omen 17 raggiunge i suoi limiti. Quando entrambi i componenti funzionano al massimo delle prestazioni, il consumo energetico rimane ai valori massimi di 50 watt per la CPU (meno il boost dinamico per la GPU) e 120 watt per la scheda grafica. Le temperature aumentano fino a quasi 90 °C (194 °F) per la CPU e 75 °C (167 °F) per la GPU.
Durante lo stress test, la velocità di clock della CPU rimane a circa 4.500 MHz, scendendo a circa 4.000 MHz quando viene aggiunto il chip grafico.
Altoparlanti
Gli altoparlanti lasciano un'impressione molto mista. I medio-bassi, utilizzati soprattutto nei giochi d'azione, hanno un suono sorprendentemente buono e potente. Anche le voci suonano in modo naturale e includono una certa profondità nei dettagli.
I bassi profondi non sono affatto presenti e i medi inferiori, la gamma delle chitarre o della batteria, risultano deboli. Si nota anche che le voci possono facilmente perdersi in sottofondo dietro altri rumori. I diffusori vanno bene per i giochi, ma né lo streaming video né l'ascolto di musica dovrebbero essere inclusi negli scenari di utilizzo consigliati per i diffusori complessivamente solo mediocri.
HP Omen 17-db0079ng analisi audio
(±) | potenza degli altiparlanti media ma buona (80 dB)
Bassi 100 - 315 Hz
(-) | quasi nessun basso - in media 19.1% inferiori alla media
(±) | la linearità dei bassi è media (10.3% delta rispetto alla precedente frequenza)
Medi 400 - 2000 Hz
(+) | medi bilanciati - solo only 1.9% rispetto alla media
(+) | medi lineari (4.4% delta rispetto alla precedente frequenza)
Alti 2 - 16 kHz
(+) | Alti bilanciati - appena 3.8% dalla media
(±) | la linearità degli alti è media (7.8% delta rispetto alla precedente frequenza)
Nel complesso 100 - 16.000 Hz
(+) | suono nel complesso lineare (14.3% differenza dalla media)
Rispetto alla stessa classe
» 25% di tutti i dispositivi testati in questa classe è stato migliore, 7% simile, 69% peggiore
» Il migliore ha avuto un delta di 6%, medio di 18%, peggiore di 132%
Rispetto a tutti i dispositivi testati
» 15% di tutti i dispositivi testati in questa classe è stato migliore, 4% similare, 81% peggiore
» Il migliore ha avuto un delta di 4%, medio di 25%, peggiore di 134%
Apple MacBook Pro 16 2021 M1 Pro analisi audio
(+) | gli altoparlanti sono relativamente potenti (84.7 dB)
Bassi 100 - 315 Hz
(+) | bassi buoni - solo 3.8% dalla media
(+) | bassi in lineaa (5.2% delta rispetto alla precedente frequenza)
Medi 400 - 2000 Hz
(+) | medi bilanciati - solo only 1.3% rispetto alla media
(+) | medi lineari (2.1% delta rispetto alla precedente frequenza)
Alti 2 - 16 kHz
(+) | Alti bilanciati - appena 1.9% dalla media
(+) | alti lineari (2.7% delta rispetto alla precedente frequenza)
Nel complesso 100 - 16.000 Hz
(+) | suono nel complesso lineare (4.6% differenza dalla media)
Rispetto alla stessa classe
» 0% di tutti i dispositivi testati in questa classe è stato migliore, 0% simile, 100% peggiore
» Il migliore ha avuto un delta di 5%, medio di 18%, peggiore di 45%
Rispetto a tutti i dispositivi testati
» 0% di tutti i dispositivi testati in questa classe è stato migliore, 0% similare, 100% peggiore
» Il migliore ha avuto un delta di 4%, medio di 25%, peggiore di 134%
Gestione dell'alimentazione - Efficiente per un portatile da gioco
Consumo di energia
Il consumo energetico massimo limitato non è molto sorprendente, poiché sia la CPU che la GPU sono leggermente strozzate. Misuriamo un valore massimo di 230 watt, che è quasi il 10% in meno rispetto al consumo di altri modelli con questa scheda grafica.
Ciò che è davvero notevole, invece, sono le nostre misurazioni del consumo quando non c'è un carico degno di nota. A volte, Omen 17 consuma solo il 50% di quanto consumano i concorrenti. Questo spiega anche l'assenza di riscaldamento, che si registra appena, e la buona durata della batteria.
| Off / Standby | |
| Idle | |
| Sotto carico |
|
Leggenda:
min: Attualmente utilizziamo il Metrahit Energy, un multimetro digitale professionale per la misurazione della qualità della potenza e dell'energia monofase, per le nostre misurazioni. | |
| HP Omen 17-db0079ng R7 8845HS, NVIDIA GeForce RTX 4070 Laptop GPU | Alienware m16 R2 Ultra 7 155H, NVIDIA GeForce RTX 4070 Laptop GPU | Asus ROG Strix Scar 16 G634JZR i9-14900HX, NVIDIA GeForce RTX 4080 Laptop GPU | Acer Predator Helios Neo 16 (2024) i7-14700HX, NVIDIA GeForce RTX 4070 Laptop GPU | Asus TUF Gaming A17 FA707XI-NS94 R9 7940HS, NVIDIA GeForce RTX 4070 Laptop GPU | Asus TUF Gaming A15 FA507UV R9 8945H, NVIDIA GeForce RTX 4060 Laptop GPU | Media NVIDIA GeForce RTX 4070 Laptop GPU | Media della classe Gaming | |
|---|---|---|---|---|---|---|---|---|
| Power Consumption | -38% | -59% | -122% | -20% | 6% | -42% | -58% | |
| Idle Minimum * | 6 | 8.1 -35% | 10.71 -79% | 26.7 -345% | 6.2 -3% | 7 -17% | 12 ? -100% | 13.4 ? -123% |
| Idle Average * | 12 | 13 -8% | 14.75 -23% | 24.4 -103% | 21.8 -82% | 12 -0% | 16.8 ? -40% | 18.9 ? -58% |
| Idle Maximum * | 18 | 40.3 -124% | 30 -67% | 32.7 -82% | 22 -22% | 18 -0% | 23.8 ? -32% | 26.7 ? -48% |
| Load Average * | 71 | 79 -11% | 135 -90% | 122.1 -72% | 59.2 17% | 70 1% | 98 ? -38% | 107.4 ? -51% |
| Cyberpunk 2077 ultra * | 197 | 146.8 25% | ||||||
| Cyberpunk 2077 ultra external monitor * | 191.8 | 146.2 24% | ||||||
| Load Maximum * | 228 | 254.9 -12% | 307 -35% | 241 -6% | 247.8 -9% | 206 10% | 223 ? 2% | 251 ? -10% |
| Witcher 3 ultra * | 188.1 | 286 | 190.6 | 189.7 |
* ... Meglio usare valori piccoli
Power Consumption Cyberpunk / Stress Test
Power Consumption With External Monitor
Durata della batteria
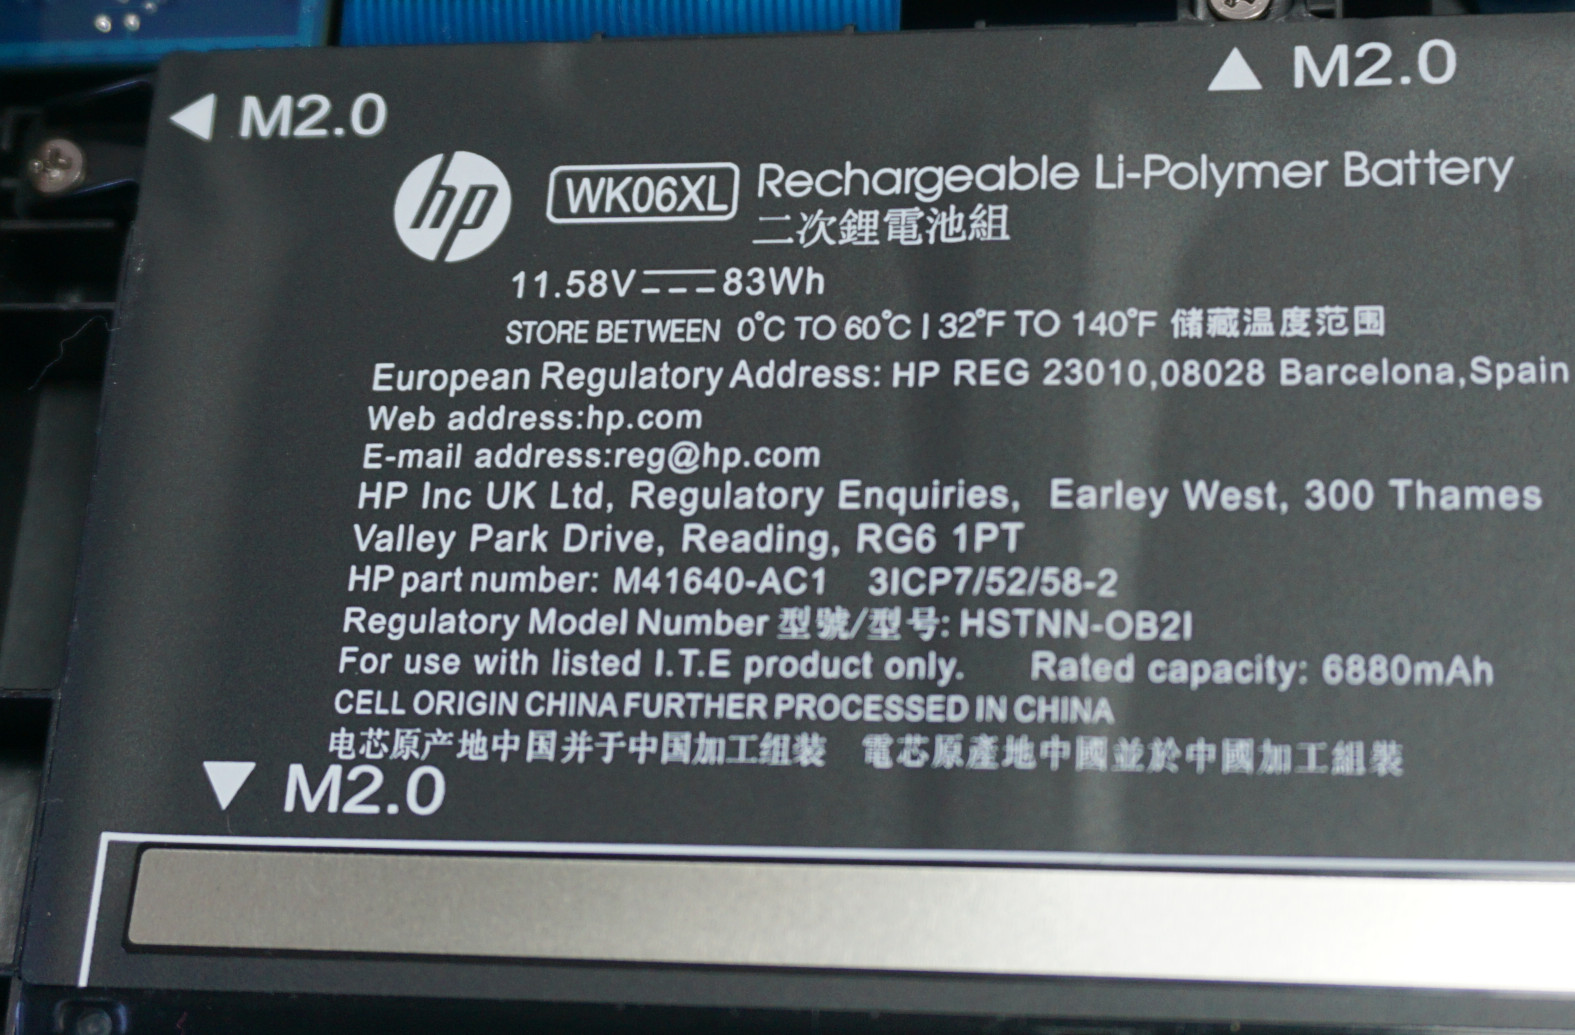
Come ci aspettavamo alla luce del consumo energetico moderato, la durata della batteria è di alto livello, considerando le prestazioni di calcolo. Anche se con una capacità di 83 Wh, la batteria è più piccola rispetto a quelle di altri computer portatili da gioco di fascia media, l'autonomia nel nostro test di navigazione web è leggermente superiore a 9 ore. Durante questo test, la luminosità del display è ridotta a 150 cd/m², che di solito dovrebbe essere sufficiente anche per il lavoro alla scrivania e in generale durante le ore serali.
Alla massima luminosità, l'Omen 17 non è altrettanto efficiente. L'ampio display richiede il dovuto, con il risultato che l'autonomia della batteria si è quasi dimezzata, raggiungendo appena le 5 ore. Anche la riproduzione di video è meno efficiente. Come si nota anche durante lo streaming video, la grafica integrata viene utilizzata al massimo. Ma almeno la durata della batteria raggiunge quasi le 8 ore.
Sebbene la durata della batteria non sia eccezionale nel complesso, è di buon livello per un portatile da gioco.
| HP Omen 17-db0079ng R7 8845HS, NVIDIA GeForce RTX 4070 Laptop GPU, 83 Wh | Alienware m16 R2 Ultra 7 155H, NVIDIA GeForce RTX 4070 Laptop GPU, 90 Wh | Asus ROG Strix Scar 16 G634JZR i9-14900HX, NVIDIA GeForce RTX 4080 Laptop GPU, 90 Wh | Acer Predator Helios Neo 16 (2024) i7-14700HX, NVIDIA GeForce RTX 4070 Laptop GPU, 90.61 Wh | Asus TUF Gaming A17 FA707XI-NS94 R9 7940HS, NVIDIA GeForce RTX 4070 Laptop GPU, 90 Wh | Asus TUF Gaming A15 FA507UV R9 8945H, NVIDIA GeForce RTX 4060 Laptop GPU, 90 Wh | Media della classe Gaming | |
|---|---|---|---|---|---|---|---|
| Autonomia della batteria | -11% | -11% | -53% | 1% | 29% | -21% | |
| H.264 | 462 | 451 -2% | 242 -48% | 416 ? -10% | |||
| WiFi v1.3 | 544 | 483 -11% | 434 -20% | 227 -58% | 548 1% | 702 29% | 377 ? -31% |
| Cyberpunk 2077 ultra 150cd | 59 | ||||||
| Witcher 3 ultra | 57 | 78.3 ? |
Pro
Contro
Verdetto - Il focus sul gioco richiede alcuni compromessi
HP Omen 17 (2024) è un computer portatile da gioco puro che non offre più del necessario. Ciò si traduce in una combinazione di elevate prestazioni di calcolo per i giochi più impegnativi e un prezzo accettabile.
La RTX 4070 e AMD Ryzen 7 di ottava generazione si sposano bene con il display QHD, anche se la sua frequenza di aggiornamento di 240 Hertz è quasi impossibile da raggiungere con i giochi attuali. Purtroppo, il resto delle caratteristiche del display sono insufficienti per poter gestire anche compiti come l'elaborazione delle immagini ad alto livello.
Il gioco veloce con un rumore di ventola sommesso, ma l'Omen 17 non offre molto di più di questo.
Ciò che è riuscito è anche l'implementazione del sistema di raffreddamento. HP configura la CPU e la GPU in modo che funzionino al di sotto delle loro capacità massime e sfrutta bene lo spazio all'interno di un laptop da 17 pollici. Anche sotto il carico più elevato, il rumore della ventola rimane sopportabile. In modalità "Bilanciata", scompare addirittura in secondo piano.
In tutte le altre aree, ci sono alcuni compromessi pesanti. Le connessioni sono limitate e quelle disponibili sono relativamente lente. La webcam e gli altoparlanti soddisfano al massimo le esigenze più basse. Infine, i dispositivi di input sono adatti al gioco solo in misura limitata, per cui non deve aggiungere solo il consueto mouse da gioco, ma anche una tastiera adatta.
Sebbene i concorrenti con prestazioni di gioco paragonabili siano spesso in grado di offrire un pacchetto complessivo migliore, sono anche più costosi. Un'alternativa che non è certo meglio equipaggiata e che ha persino un display più debole, ma che offre almeno una tastiera solida, è l'Asus TUF Gaming A17 F70 Asus TUF Gaming A17 F707. E con due connessioni Thunderbolt 4 e un display eccellente, il modello Acer Predator Helios Neo 16 è chiaramente un computer portatile migliore. Ma se consideriamo solo le prestazioni di gioco pure, nessuno di questi due portatili è significativamente più veloce - ma solo molto più rumoroso.
Prezzo e disponibilità
HP Omen 17 (2024) è disponibile direttamente da HP a partire da 999 dollari. È possibile configurare i componenti e la nostra configurazione testata con RTX 4070 e display QHD costa ~$1660. Amazon offre un modello con lo stesso processore ma con RTX 4050 a ~$1500.
Tenga presente che abbiamo recentemente aggiornato il nostro sistema di valutazione e che i risultati della versione 8 non sono più confrontabili con quelli della versione 7. Può trovare ulteriori informazioni al riguardo qui.
HP Omen 17-db0079ng
-
07/22/2024 v8
Mario Petzold
 Total Sustainability Score:
 Transparency
The present review sample was made available to the author as a loan by the manufacturer or a shop for the purposes of review. The lender had no influence on this review, nor did the manufacturer receive a copy of this review before publication. There was no obligation to publish this review.
Price comparison

