

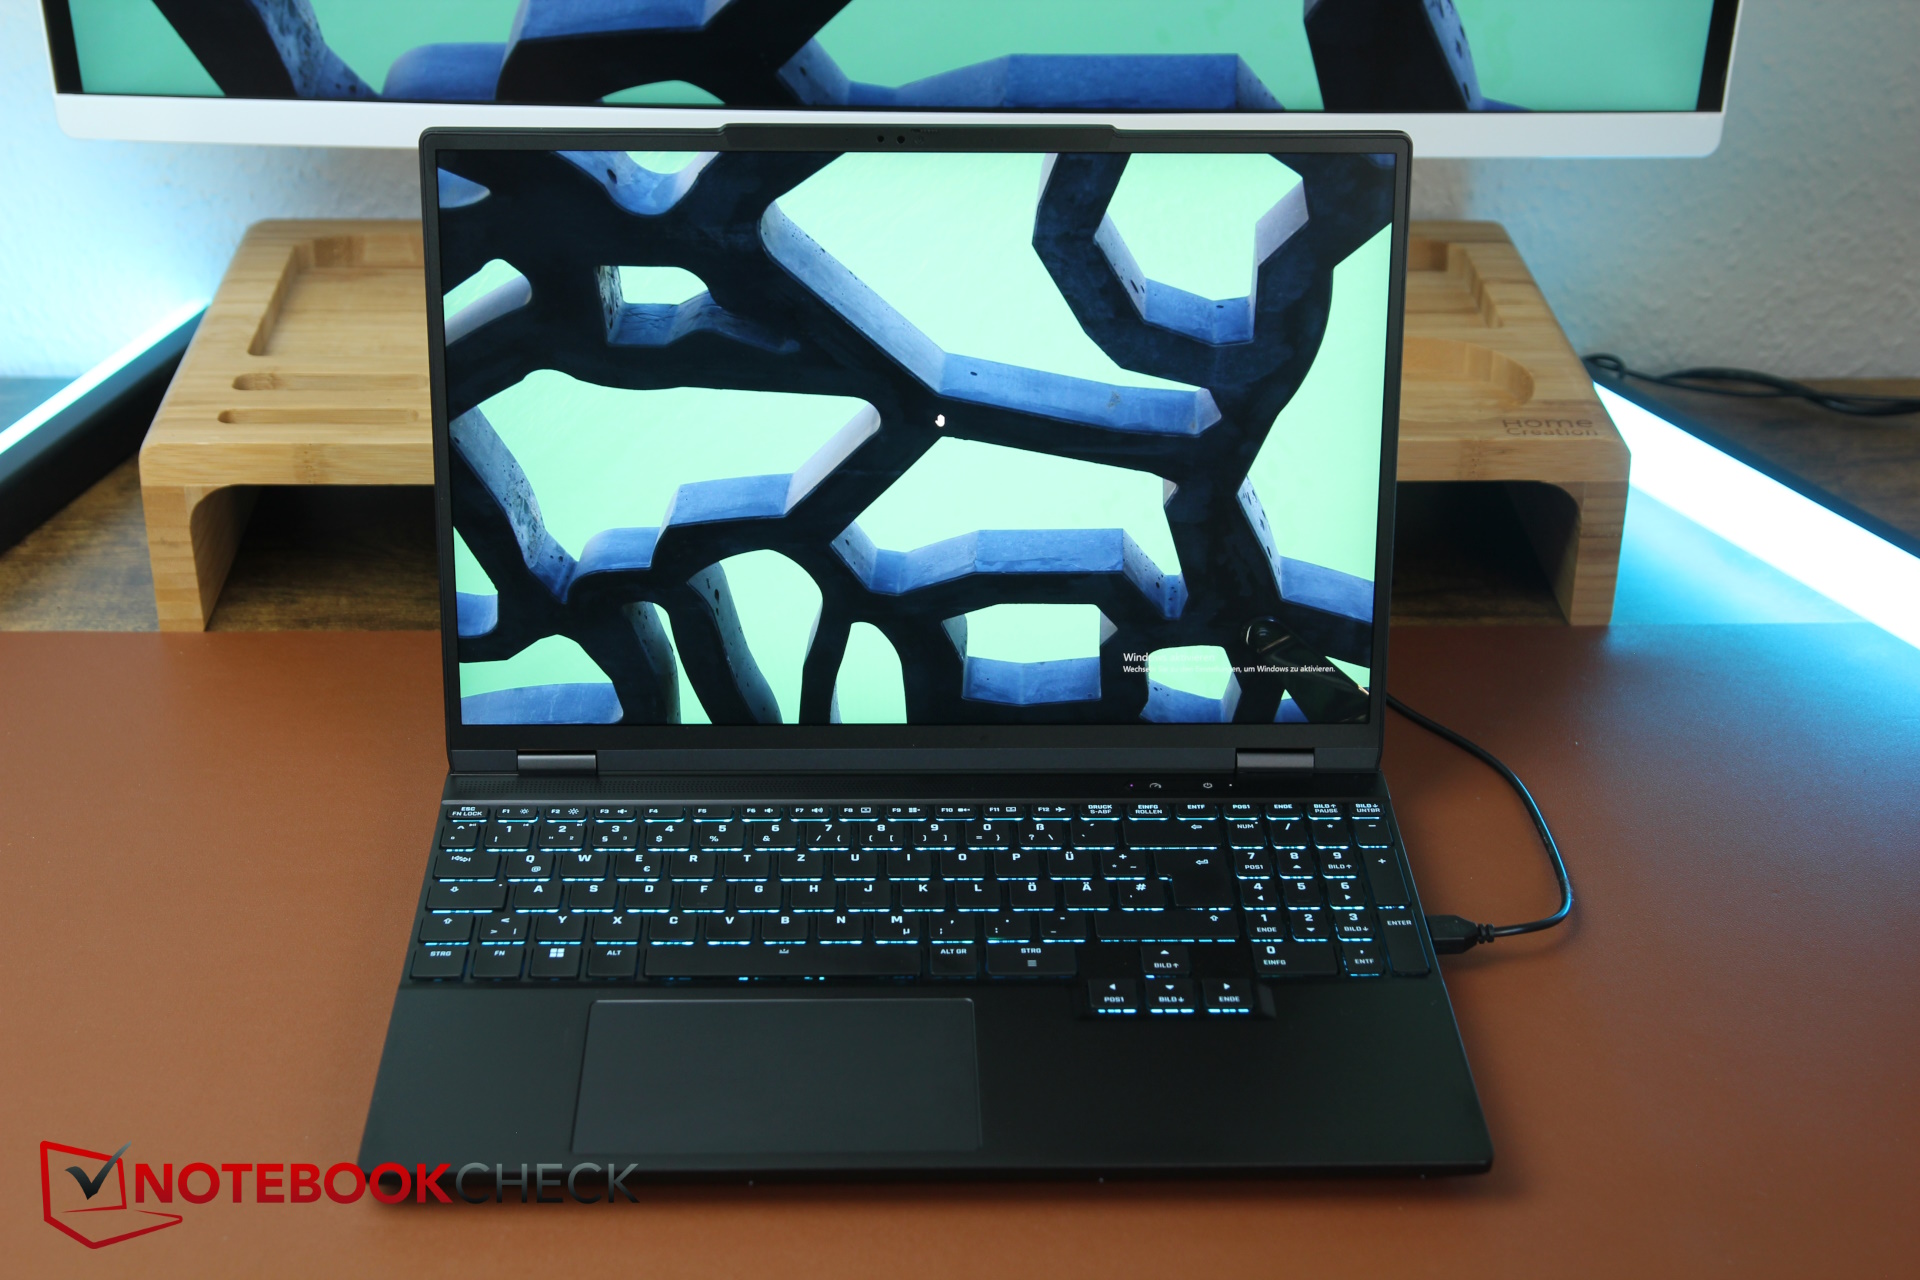
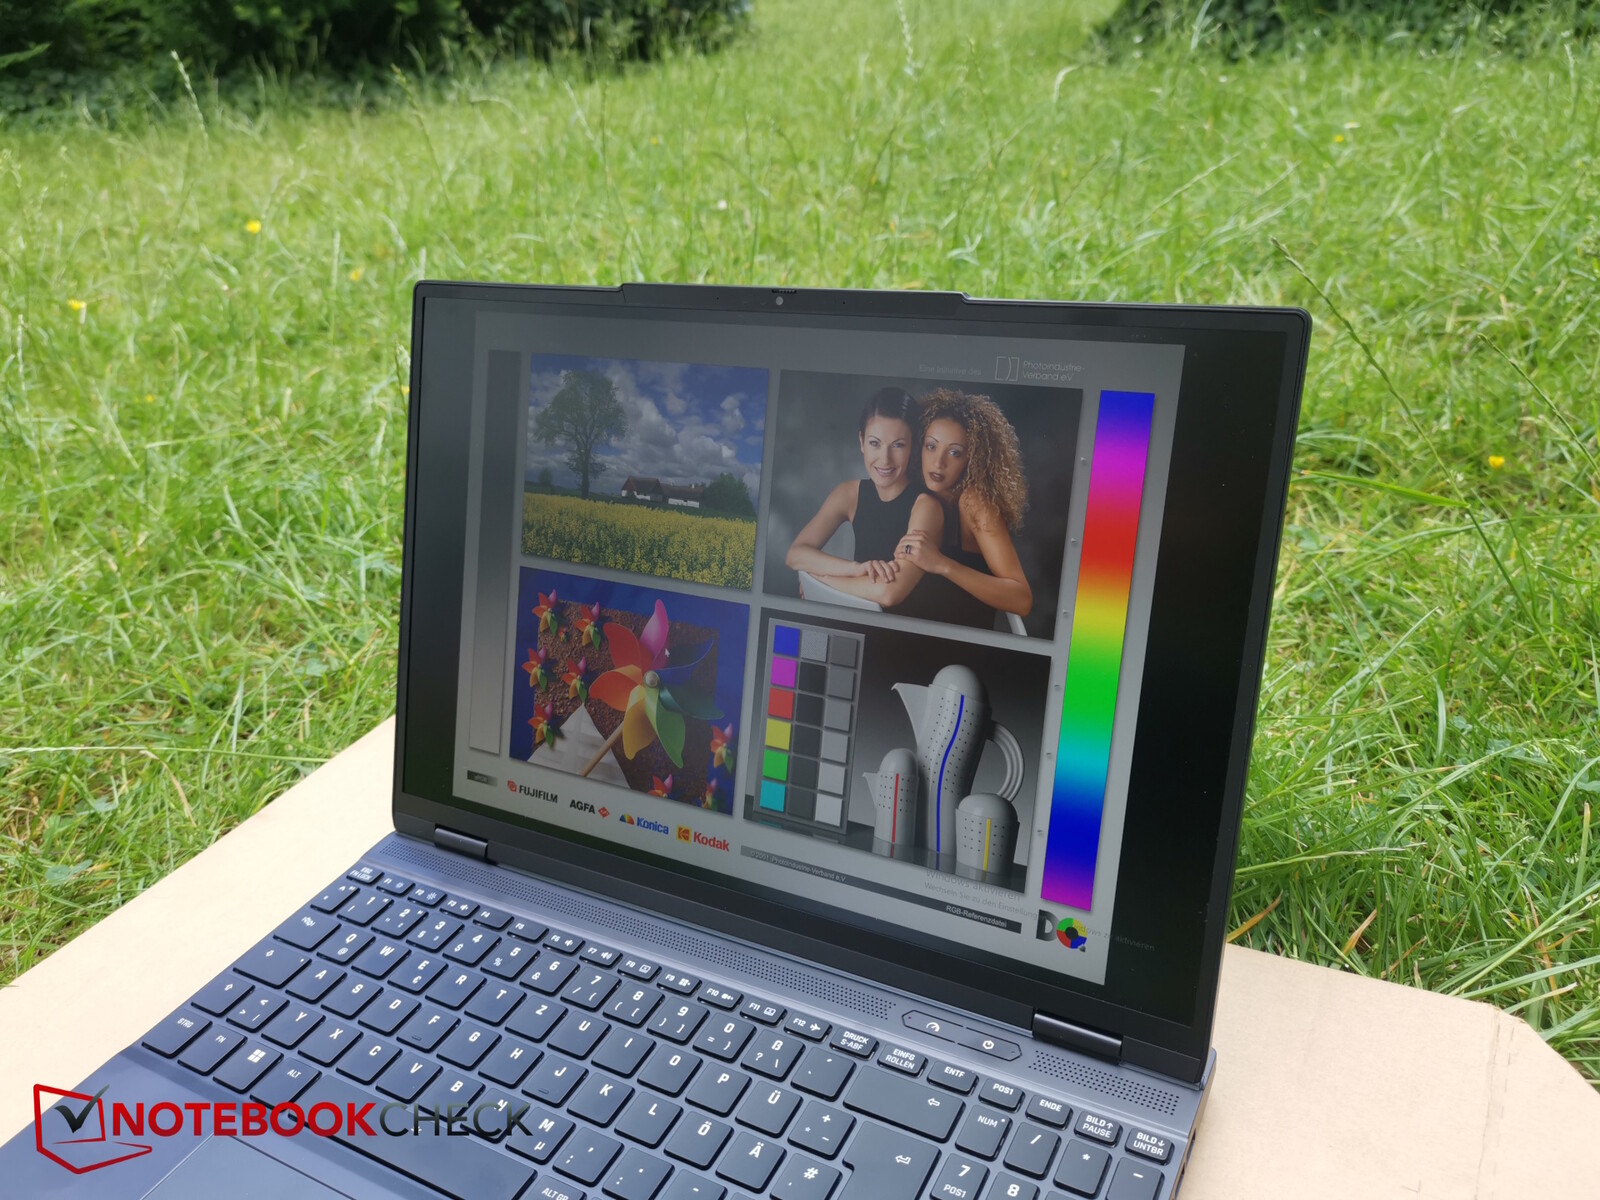
Recensione del computer portatile SCHENKER XMG Core 15 (M24): Una macchina da gioco premium con struttura in metallo dalla Germania

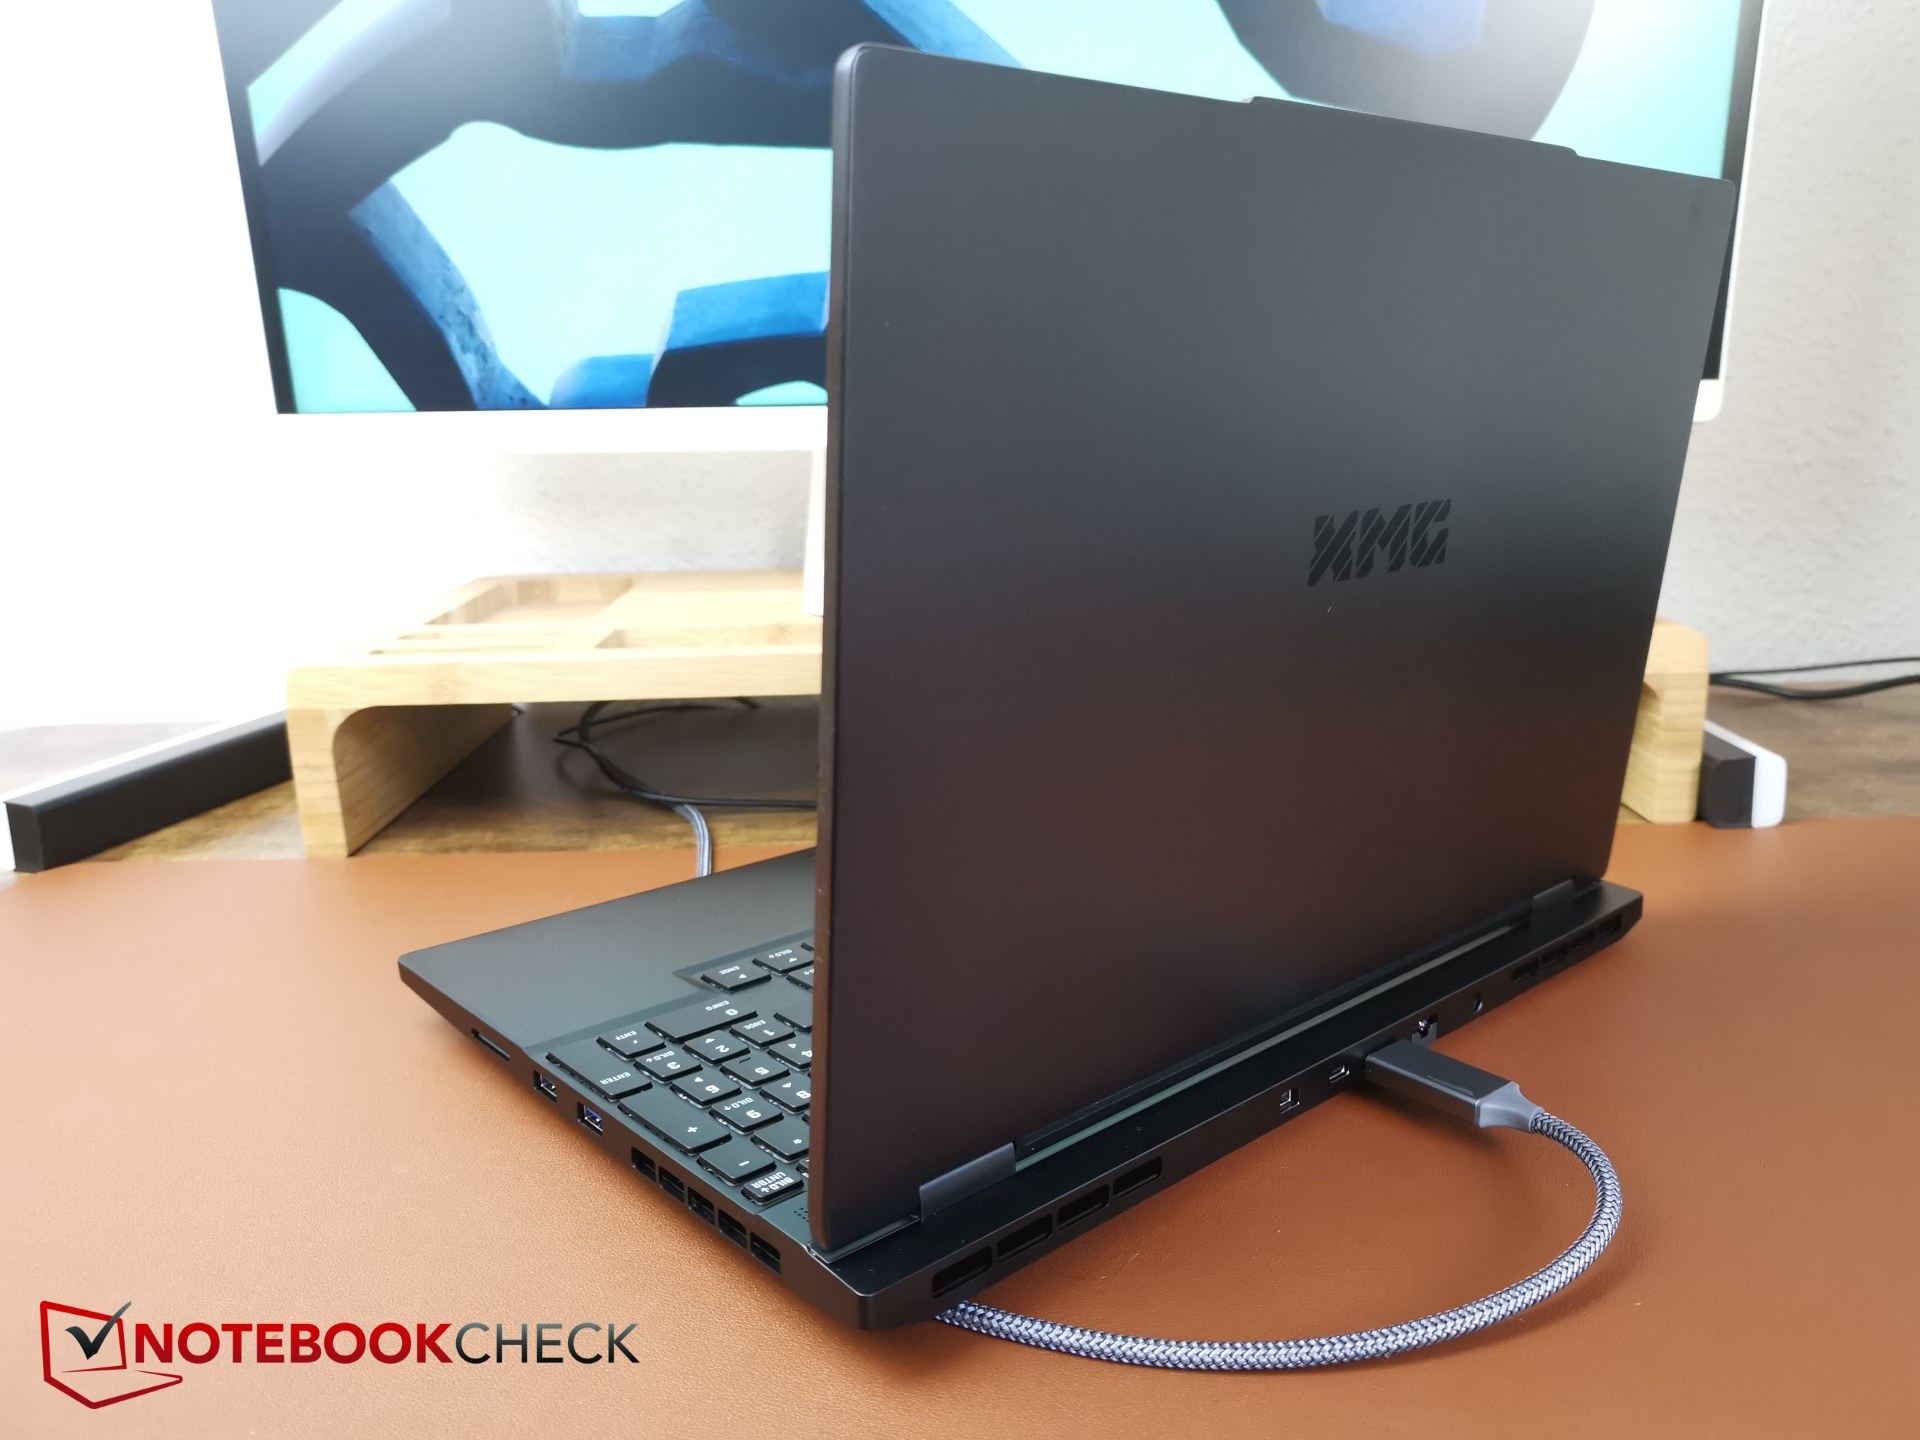
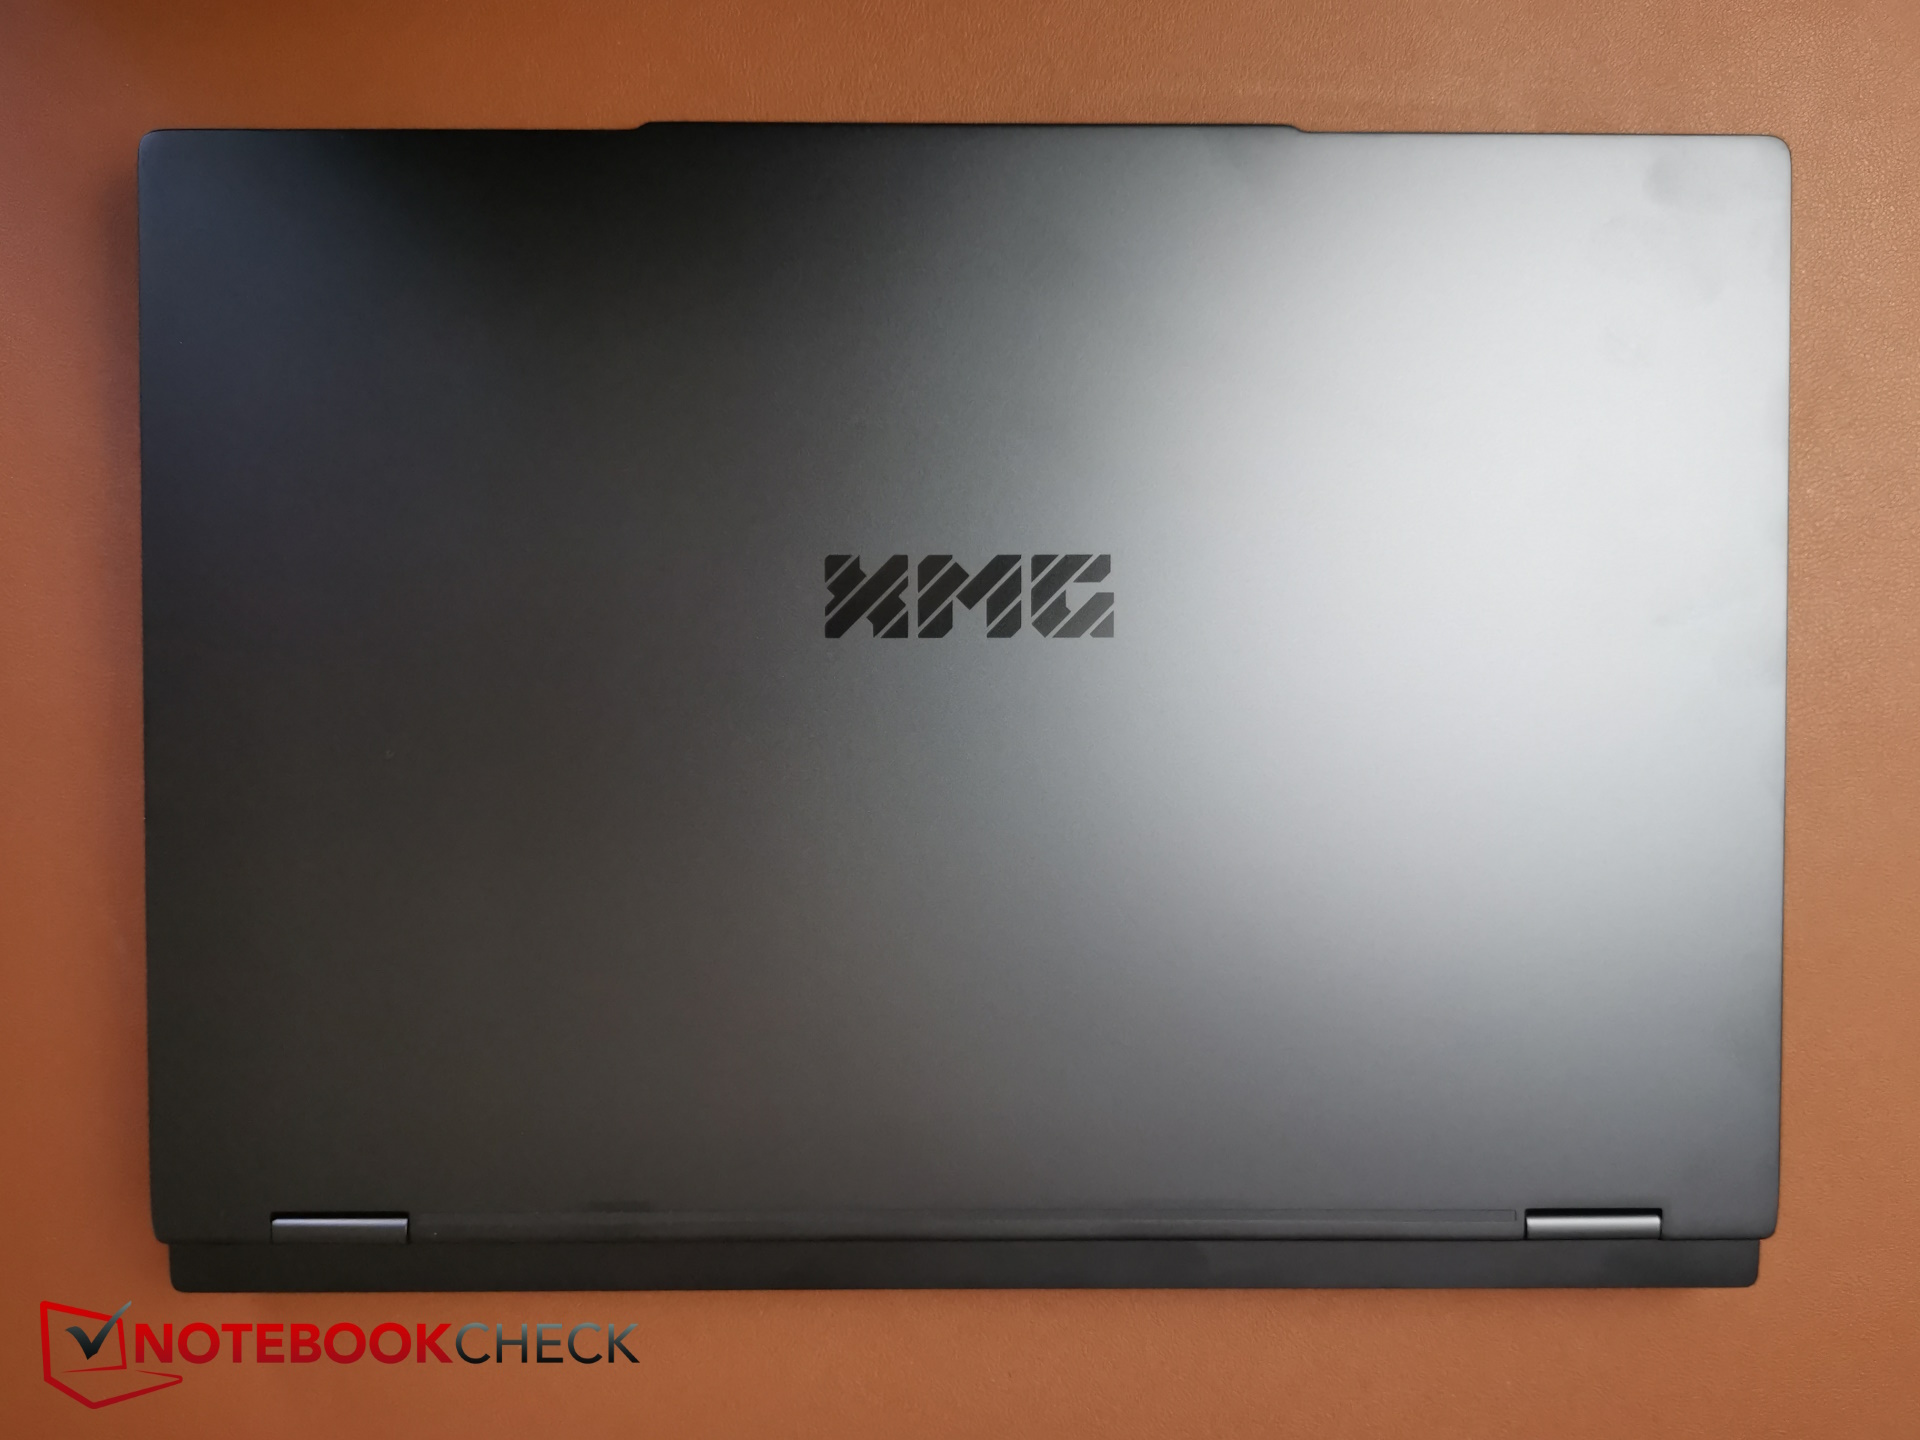
Secondo Schenker, l'attuale Core 15 è un modello leggermente ridotto Fusion 15. Il vantaggio è un prezzo significativamente più basso, tuttavia, nonostante questo, il Core 15 mantiene il suo elegante case in metallo che gli conferisce un buon aspetto e una buona sensazione. Il produttore lo chiama "Undercover Gaming" (gioco in incognito), perché il case in alluminio dovrebbe attirare anche i creatori senza necessariamente urlare laptop da gioco.
Tuttavia, il Core 15 non è solo ridotto, ma cambia anche alcune cose. Ad esempio, il processore del laptop è un AMD Ryzen di ultima generazione invece di una CPU Intel Gen14 HX, che abbassa un po' il prezzo ma non è affatto peggiore.
Dal momento che non esistono più portatili da 15 pollici dotati di una CPU attuale, confrontiamo il Core 15 da 15,3 pollici con i portatili da 16 pollici per il gioco e il multimedia, che sono dotati di un processore RTX 4060 come il Dell G16, il Lenovo Legion 5i 16 G9così come il modello HP Victus 16. Inoltre, abbiamo naturalmente fatto un confronto con il Fusion 15 e abbiamo anche dato un'occhiata a ciò che è cambiato rispetto allo scorso anno Schenker XMG Pro 15 E23.
Attenzione: Il nostro nuovo sistema di valutazione è il V8, il che significa che i punteggi sono ora più bassi. Con il vecchio sistema di valutazione V7, il Core 15 ha ottenuto un punteggio compreso tra l'88 e l'89 percento. Può scoprire le novità qui.
Potenziali concorrenti a confrontos
Punteggio | Data | Modello | Peso | Altezza | Dimensione | Risoluzione | Prezzo |
|---|---|---|---|---|---|---|---|
| 83.7 % | 06/2024 | SCHENKER XMG Core 15 (M24) R7 8845HS, NVIDIA GeForce RTX 4060 Laptop GPU | 2.1 kg | 21.9 mm | 15.30" | 2560x1600 | |
| 89.1 % v7 (old) | 02/2024 | Lenovo Legion 5 16IRX G9 i7-14650HX, NVIDIA GeForce RTX 4060 Laptop GPU | 2.4 kg | 25.2 mm | 16.00" | 2560x1600 | |
| 84.3 % v7 (old) | 05/2024 | HP Victus 16 (2024) i7-14700HX, NVIDIA GeForce RTX 4060 Laptop GPU | 2.4 kg | 23.9 mm | 16.10" | 1920x1080 | |
| 85.5 % v7 (old) | 02/2024 | Dell G16, i7-13650HX, RTX 4060 i7-13650HX, NVIDIA GeForce RTX 4060 Laptop GPU | 2.8 kg | 25.65 mm | 16.00" | 2560x1600 | |
| 88.9 % v7 (old) | 05/2024 | SCHENKER XMG Fusion 15 (Early 24) i9-14900HX, NVIDIA GeForce RTX 4070 Laptop GPU | 2.1 kg | 21.9 mm | 15.30" | 2560x1600 | |
| 86.2 % v7 (old) | 07/2023 | SCHENKER XMG Pro 15 (E23) i9-13900HX, NVIDIA GeForce RTX 4060 Laptop GPU | 2.4 kg | 24.9 mm | 15.60" | 2560x1440 |
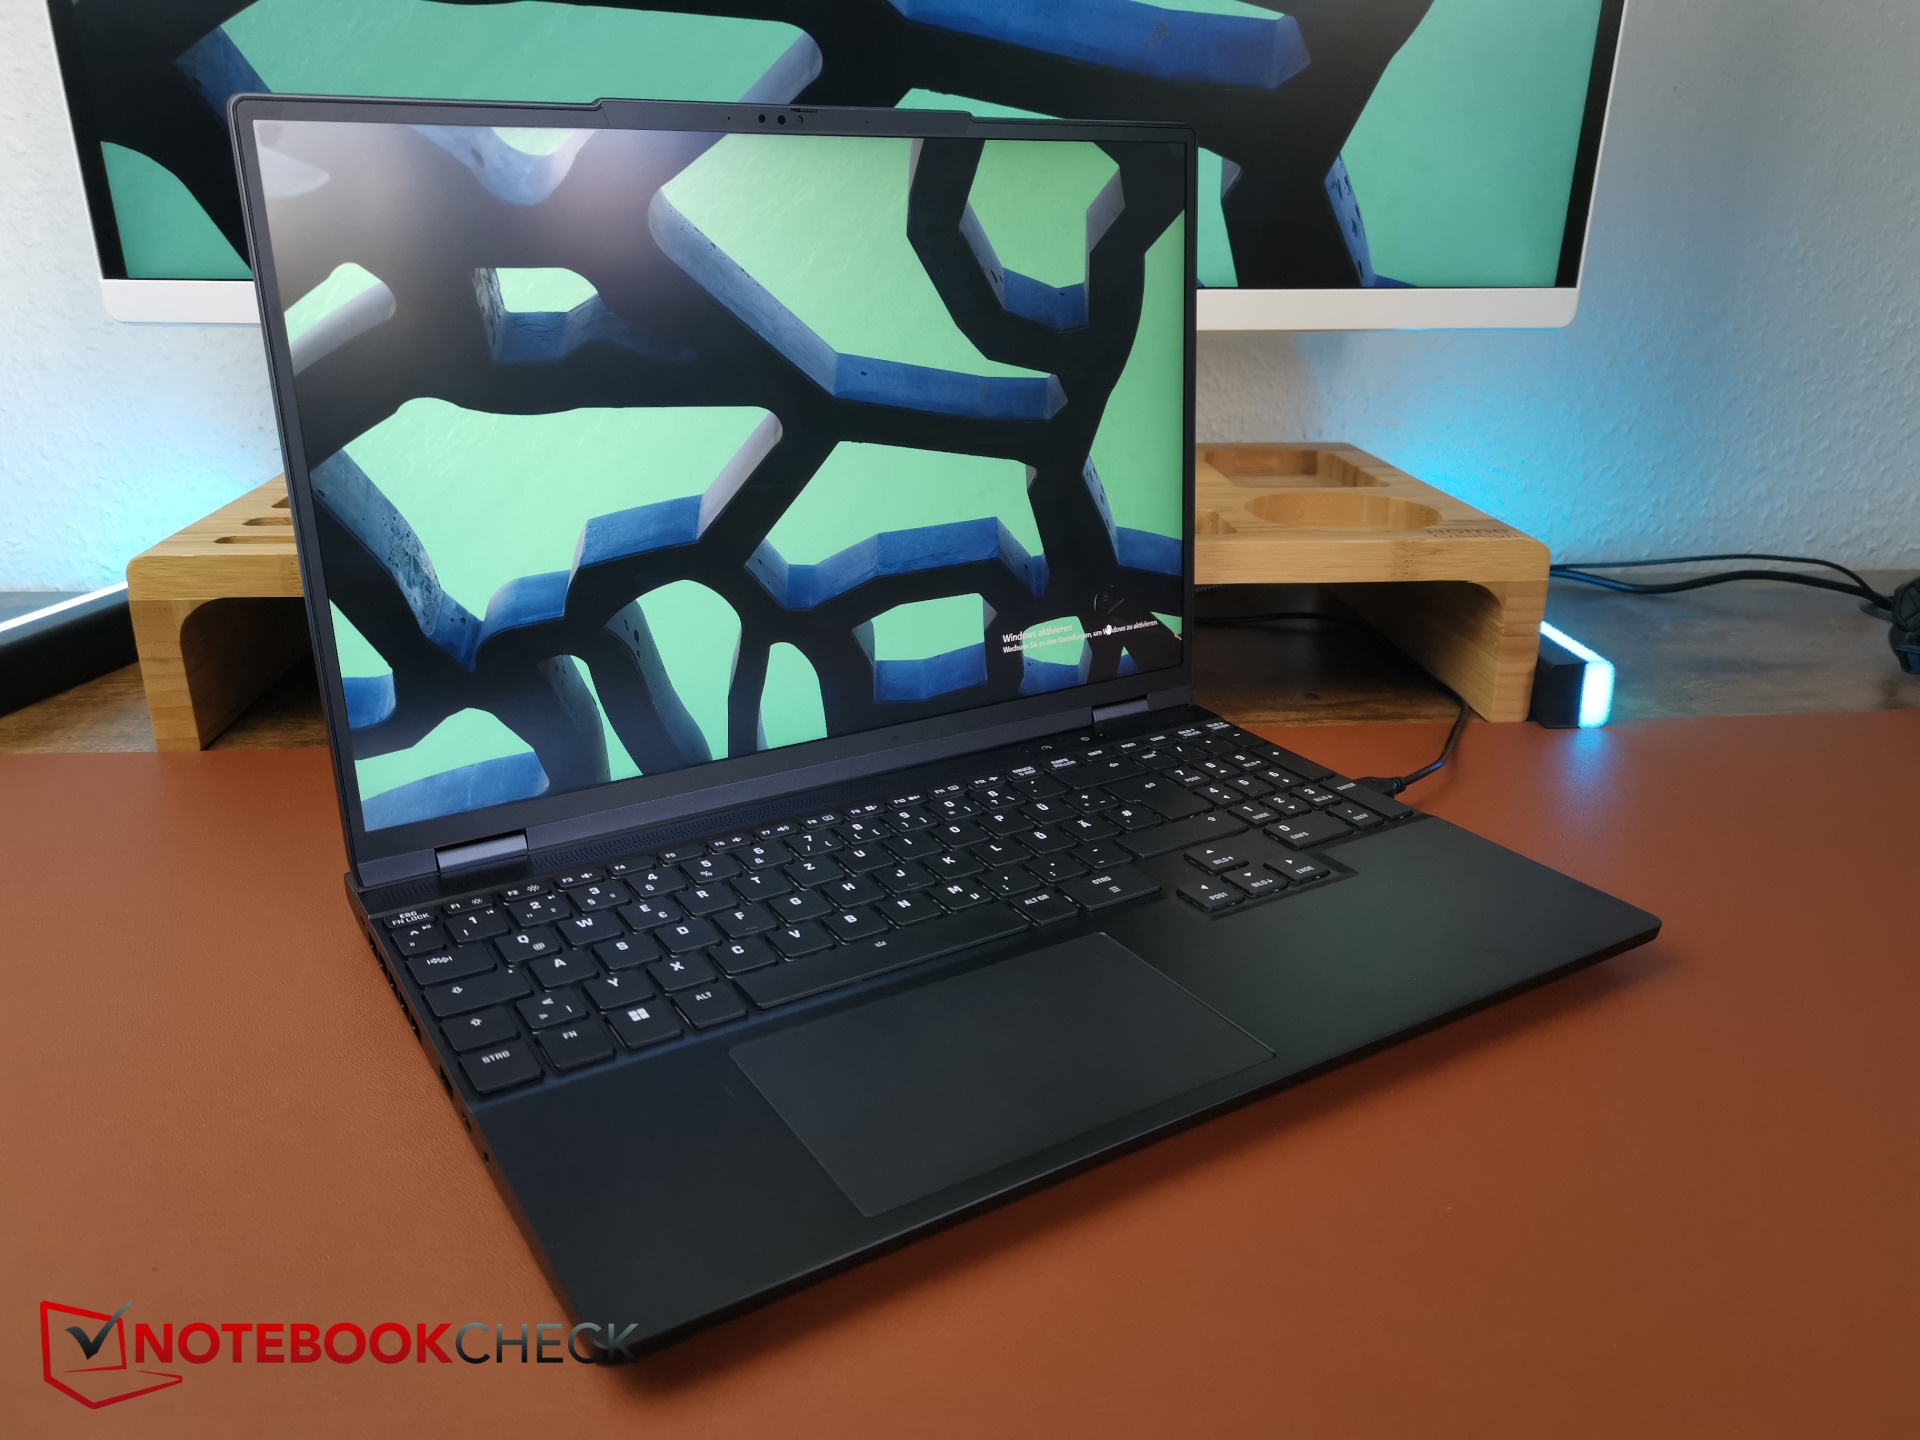
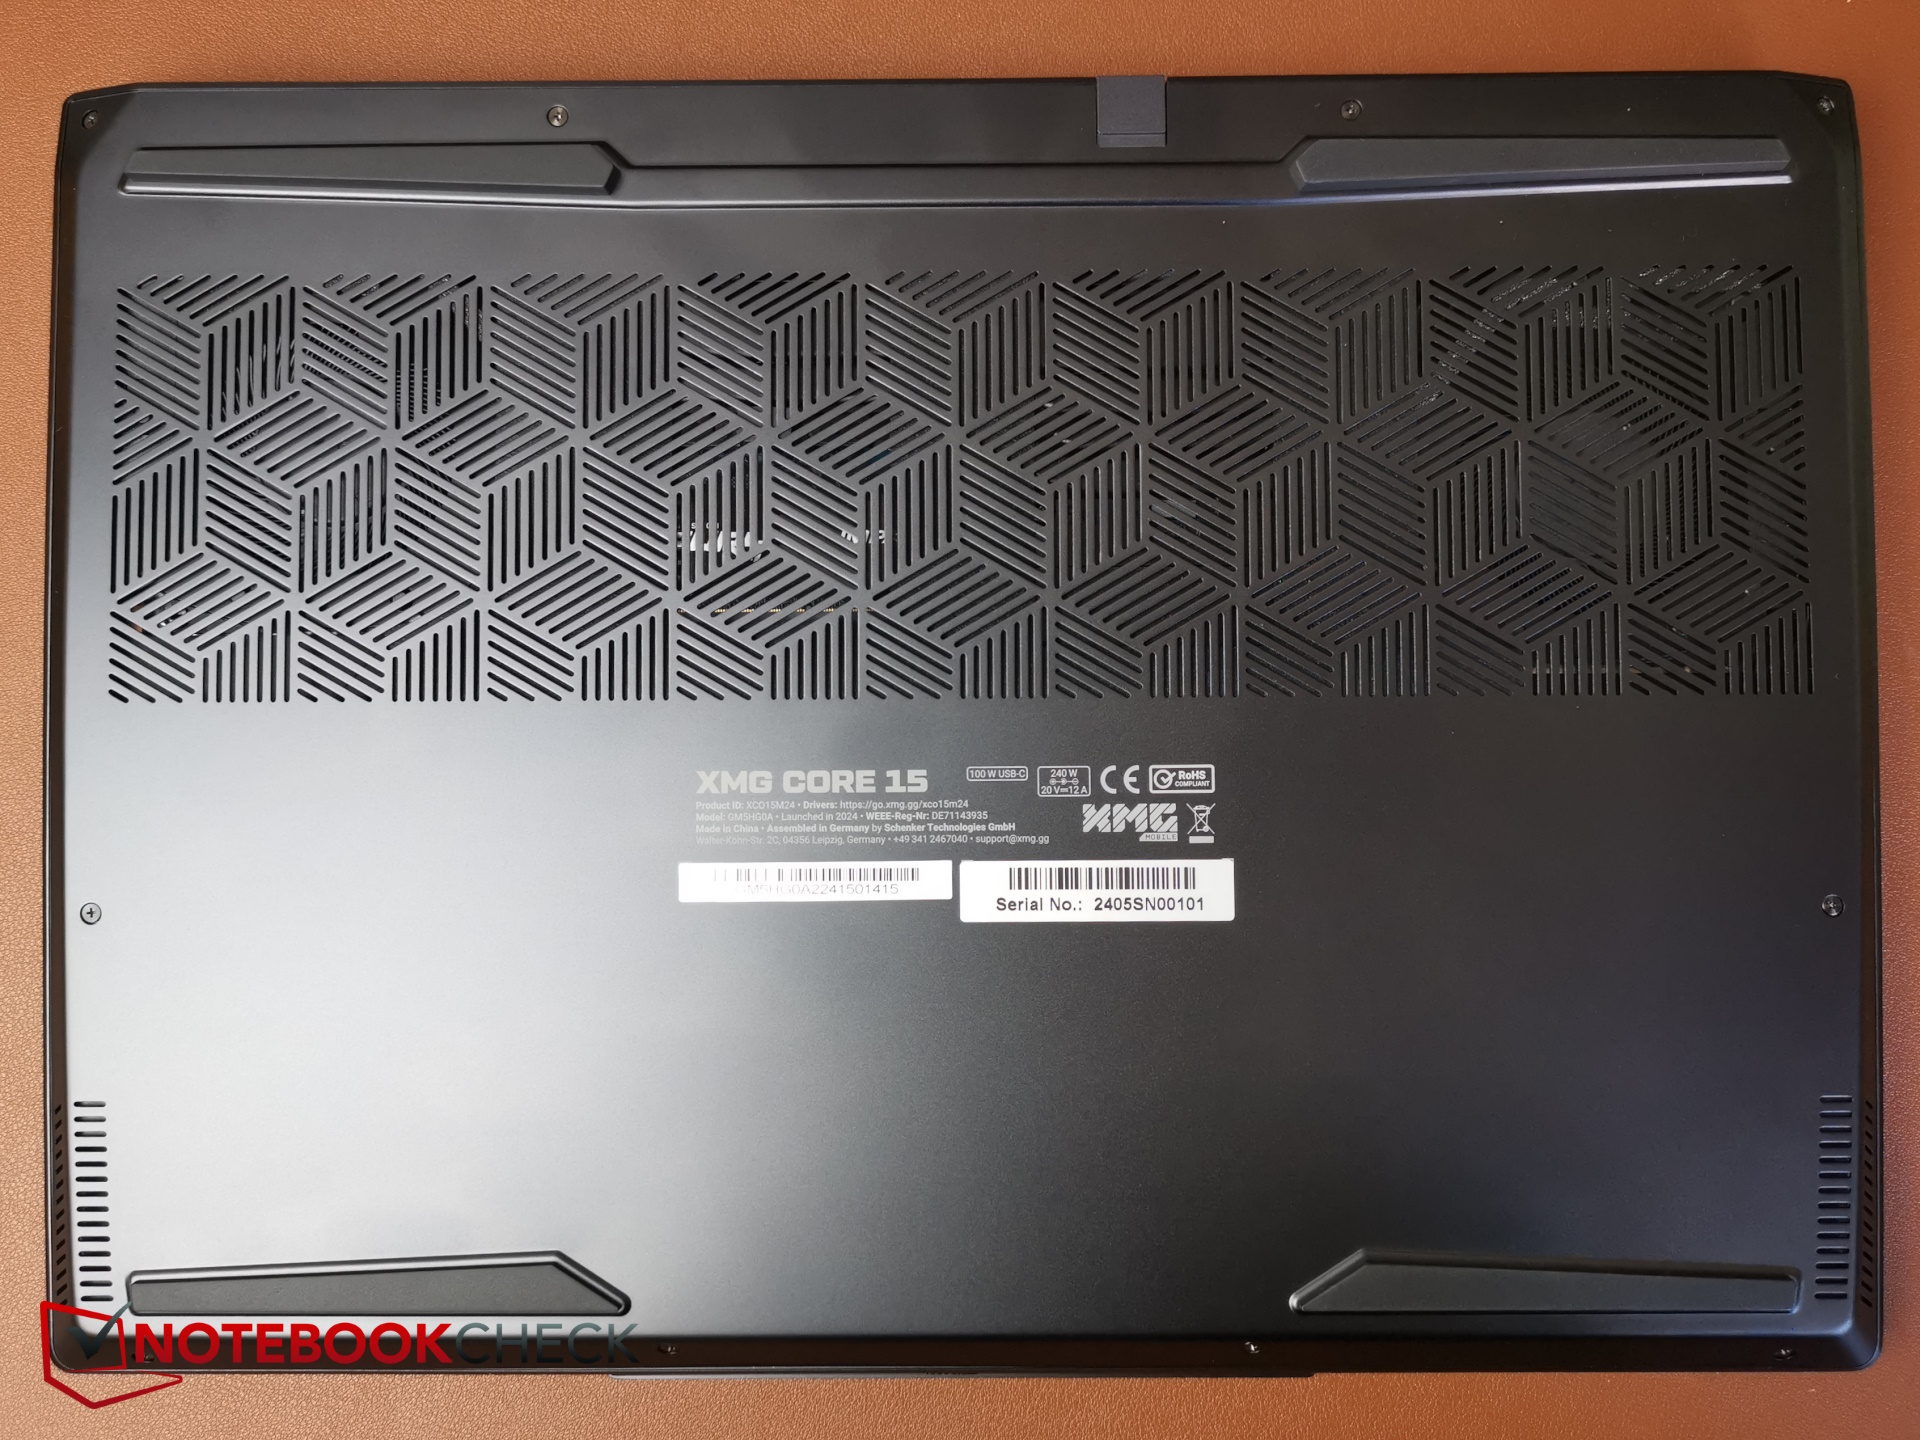
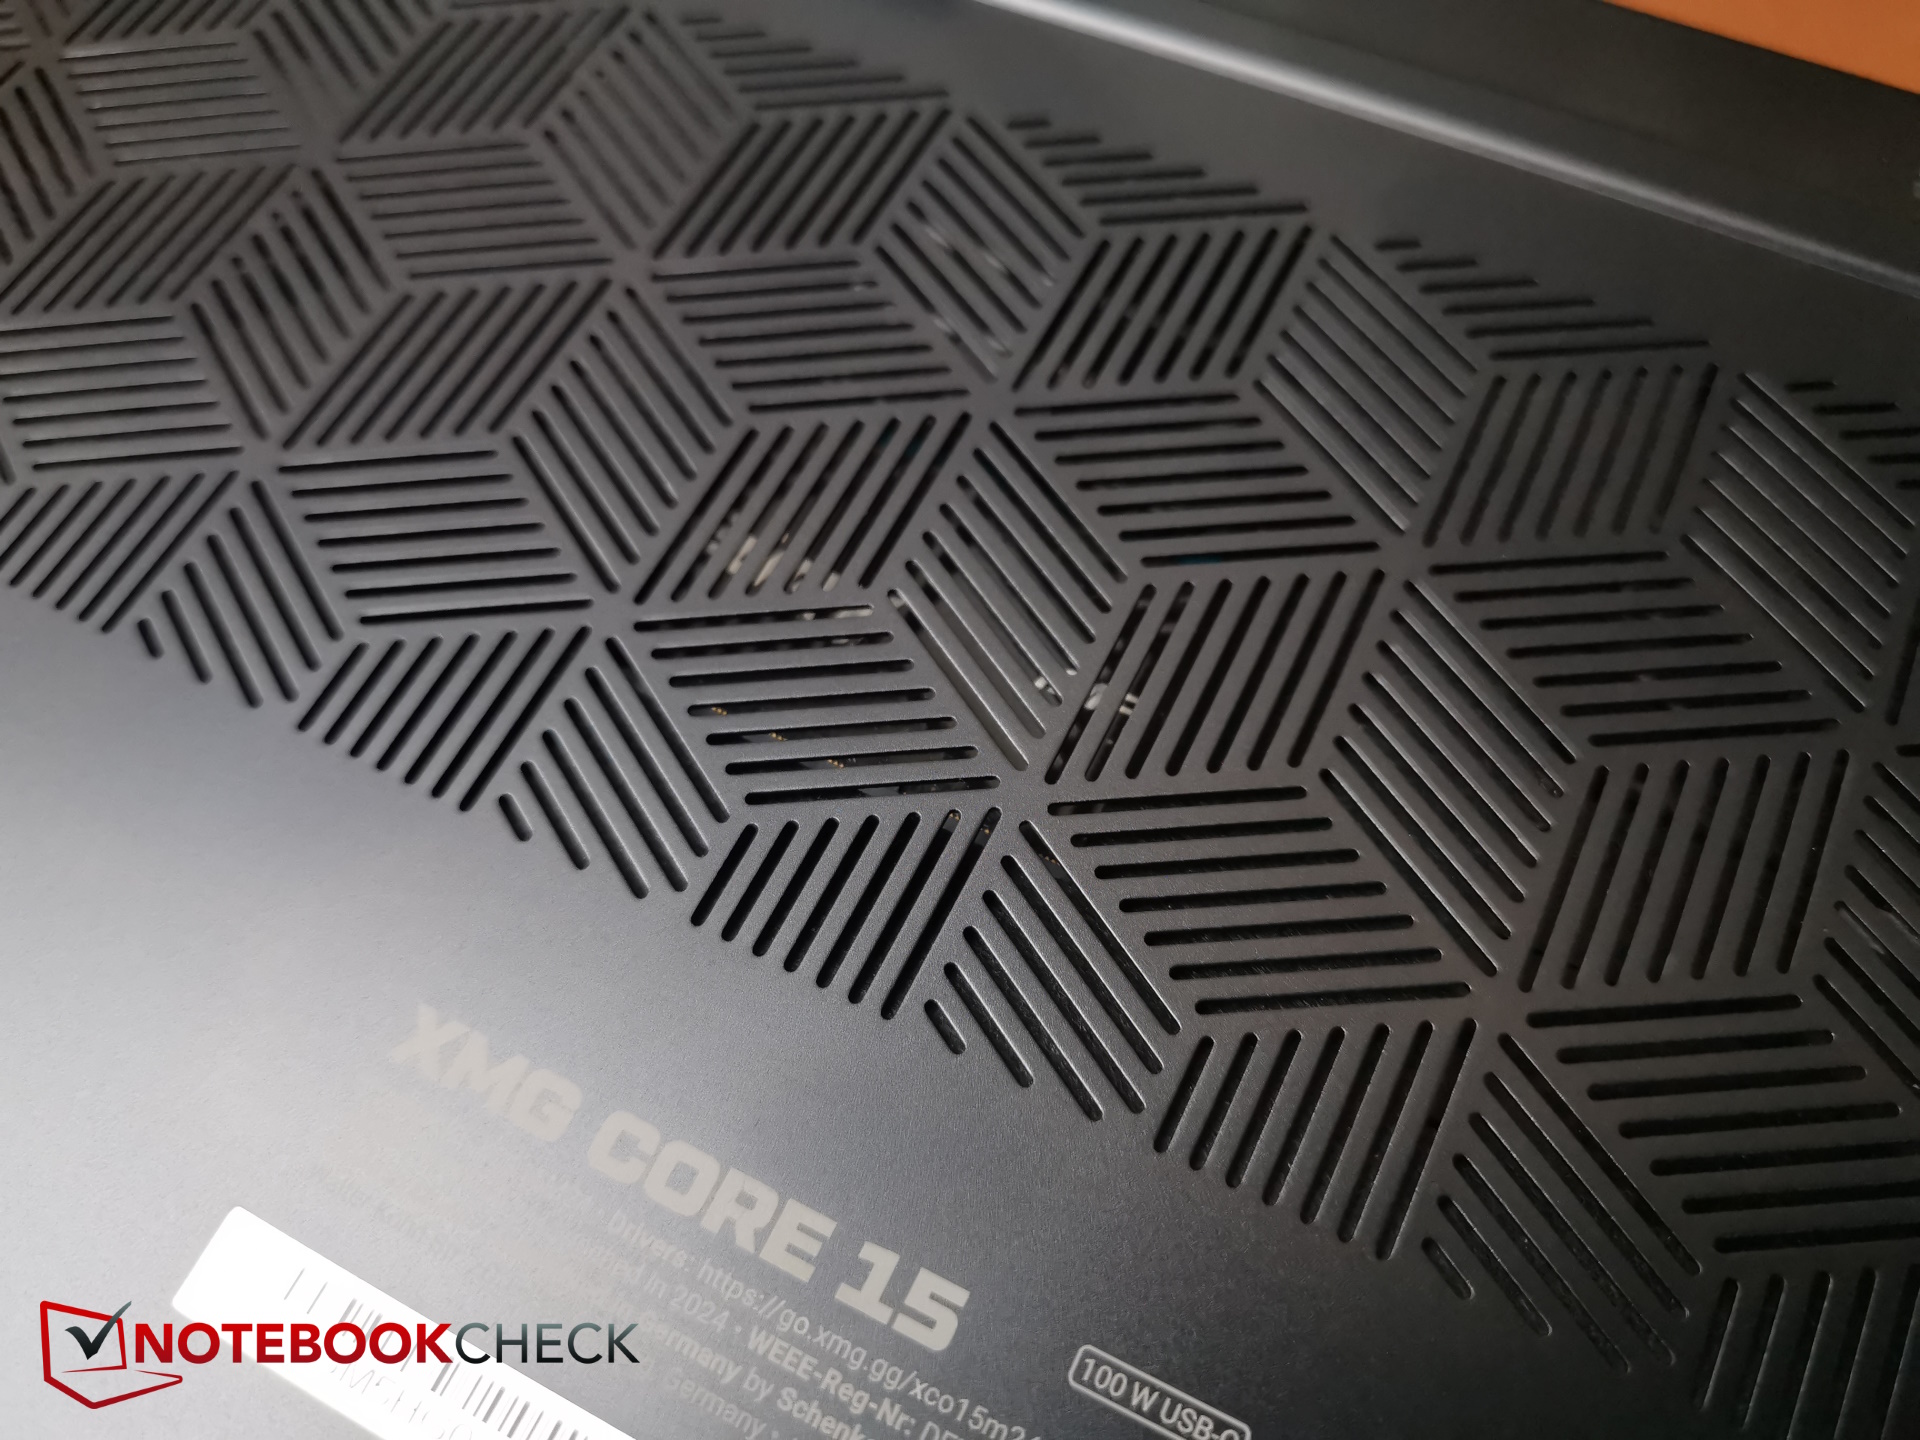
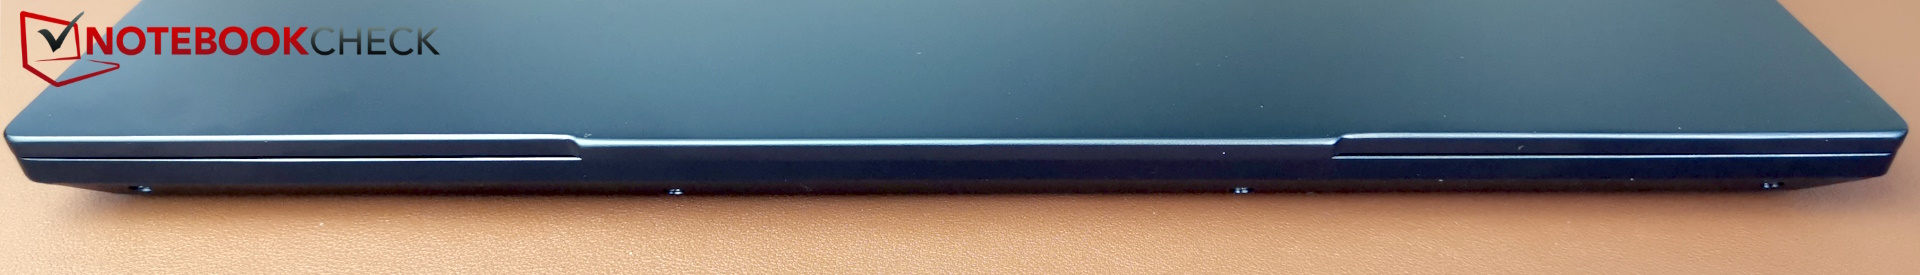
Custodia e caratteristiche: Un'elegante custodia in alluminio
Poiché abbiamo già ampiamente testato le caratteristiche visive, la rimandiamo alla nostra Recensione di XMG Fusion 15 per ulteriori informazioni relative al case, alla manutenzione, alle porte e ai dispositivi di input. Qui elencheremo solo le modifiche apportate a questi aspetti.
Confronto delle dimensioni
Al momento, le macchine da gioco da 15 pollici con una CPU attuale sembrano essersi quasi estinte e una delle caratteristiche uniche del Core 15 è il suo insolito formato da 15,3 pollici. Il produttore sostiene che gli attuali computer portatili da 16 pollici non sono quasi più grandi, il che significa che ora è possibile avere un display più grande in un case di dimensioni quasi uguali.
Tuttavia, con il Core 15, si può notare che alcuni dei concorrenti da 16 pollici sono notevolmente più grandi. Inoltre, sono anche più spessi e più pesanti. Quest'ultimo è il caso nonostante la concorrenza utilizzi una quantità di plastica significativamente maggiore. Questa è un'area in cui il Core 15 ottiene un punto a favore della mobilità.
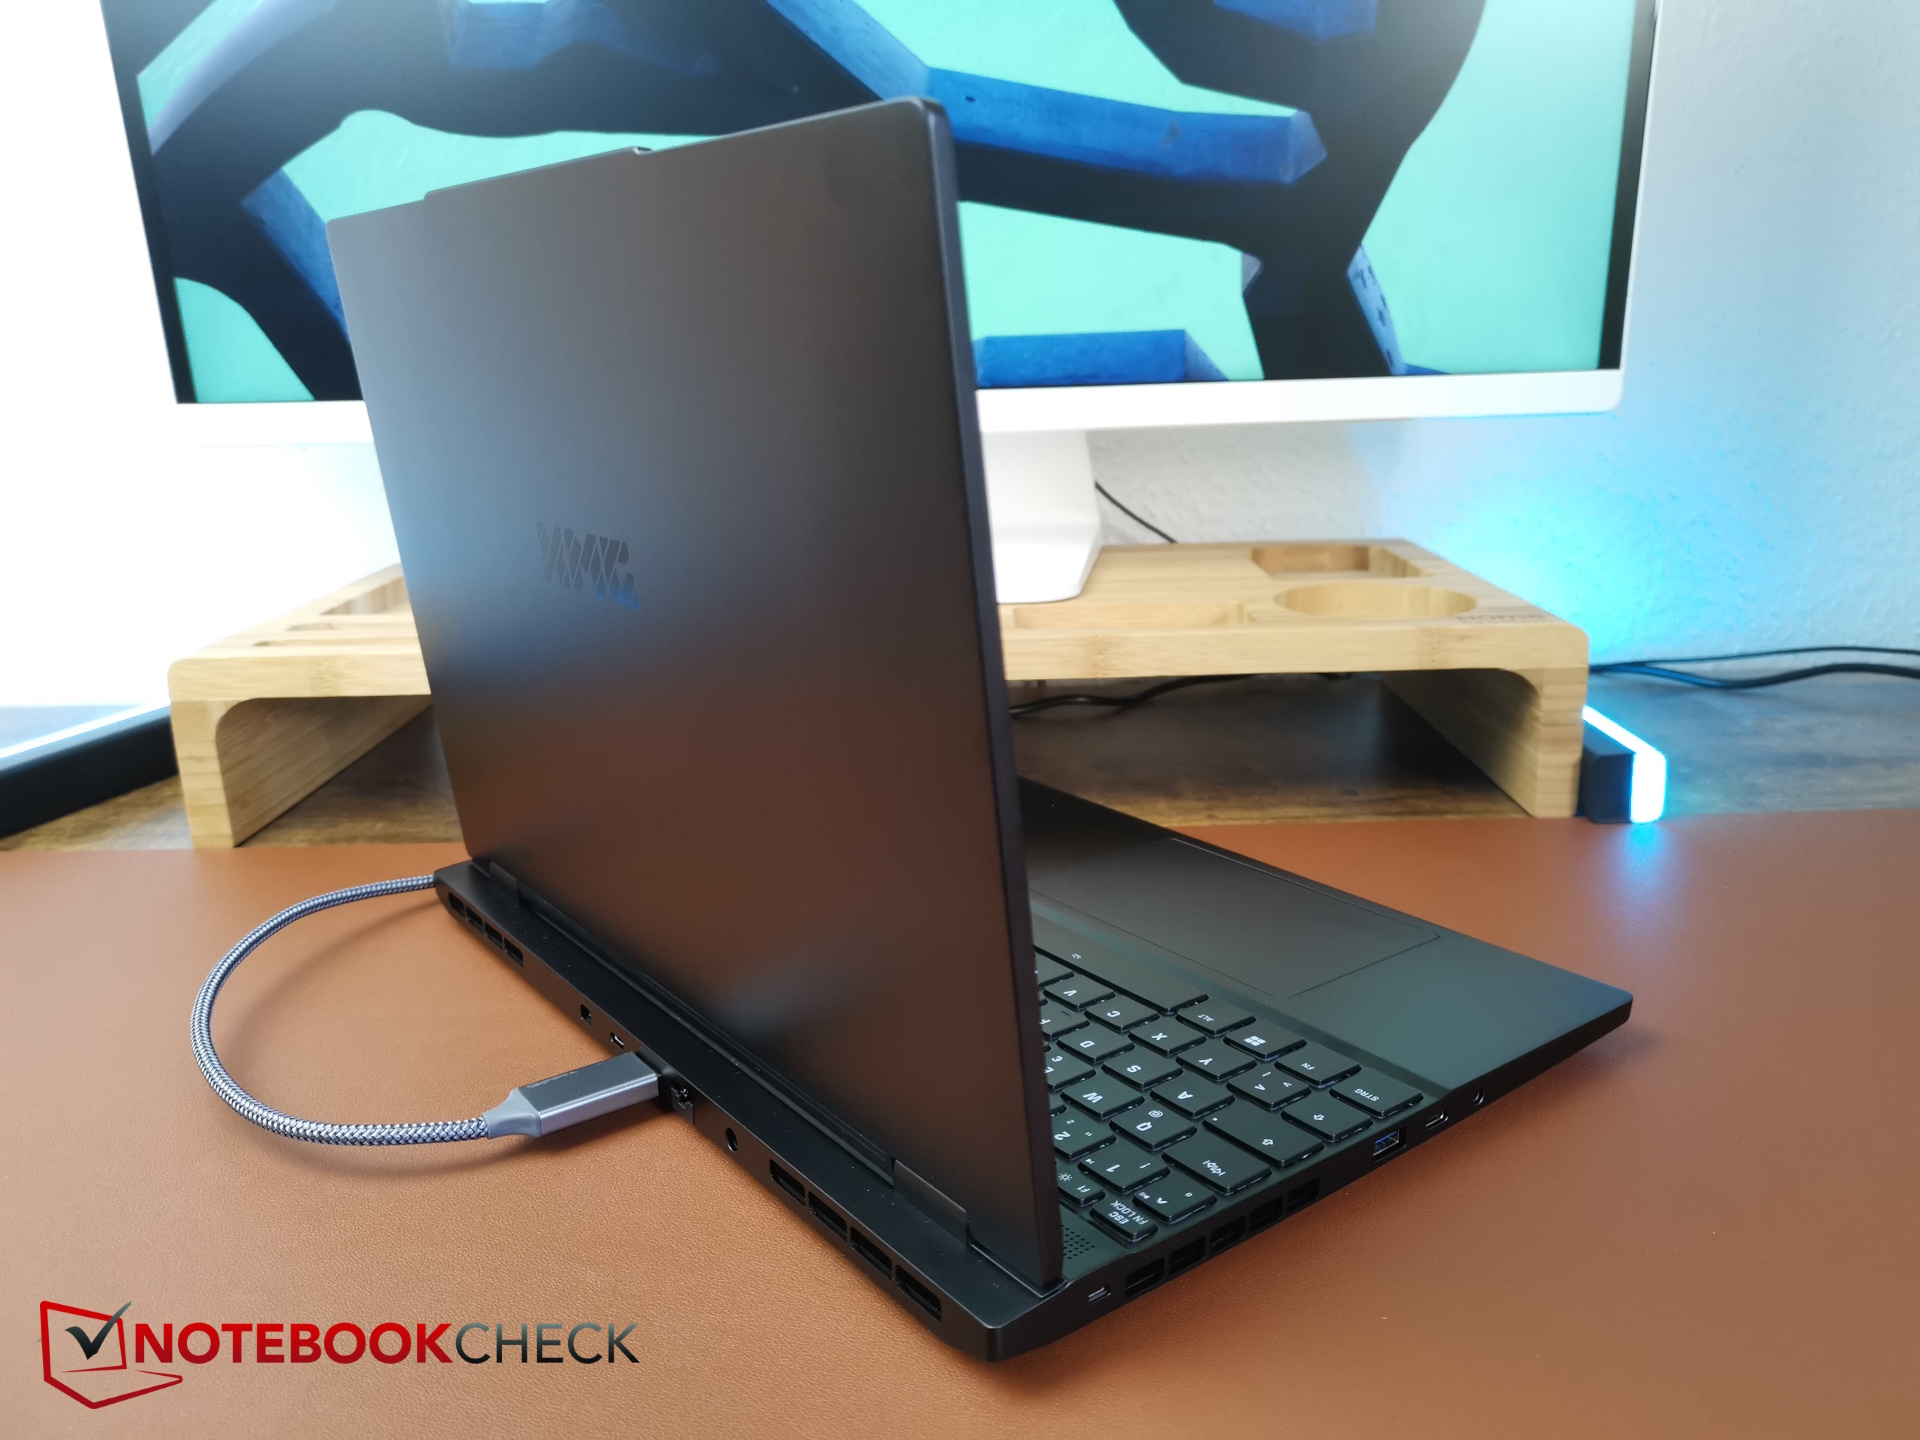
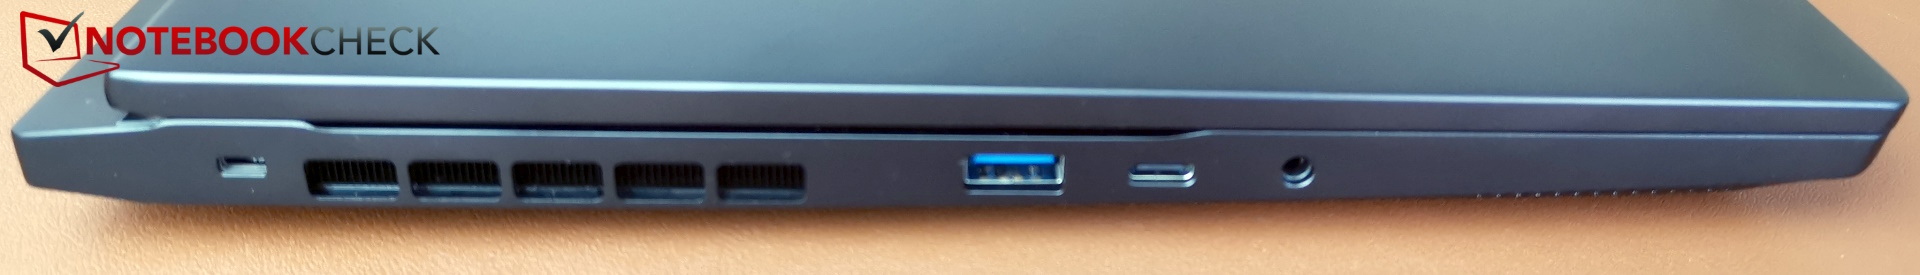
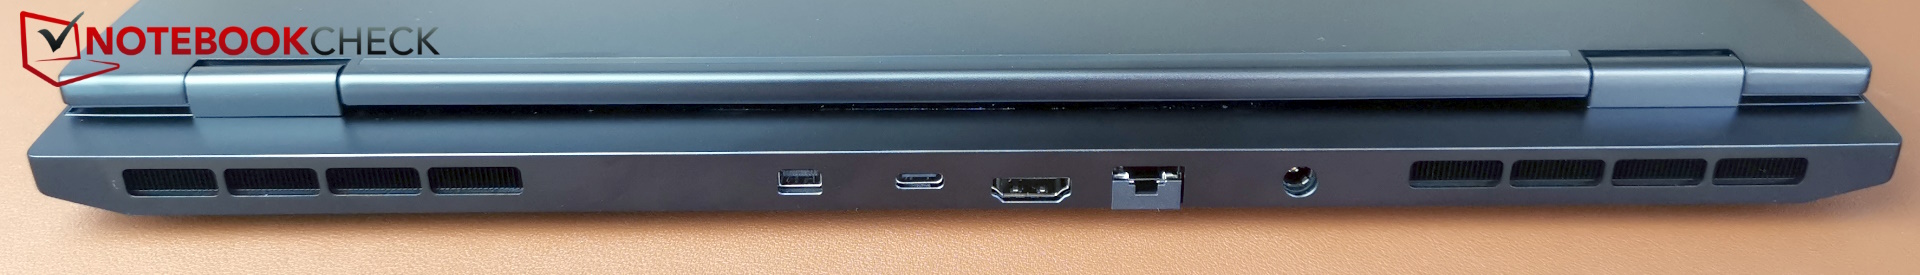
Porti
A differenza del Fusion equipaggiato con CPU Intel, il Core AMD fa a meno di Thunderbolt 4 e USB 4. Al suo posto c'è solo USB-C 3.2 Gen 2, anche se offre Power Delivery fino a 100 W (20 V, 5 A).
C'è un ulteriore vantaggio rispetto al Fusion: Con il Core, si ottiene una mini DisplayPort dedicata, assente nel Fusion.
Una nota a margine interessante: all'inizio del 2023, il nostro core 15 recentemente recensito era ancora dotato di una connessione all'acqua per il raffreddamento esterno, denominata XMG Oasis. Queste porte sono ora assenti nel nuovo e più sottile Core 15 e sembra che XMG abbia rinunciato a sperimentare con questa serie di prodotti.
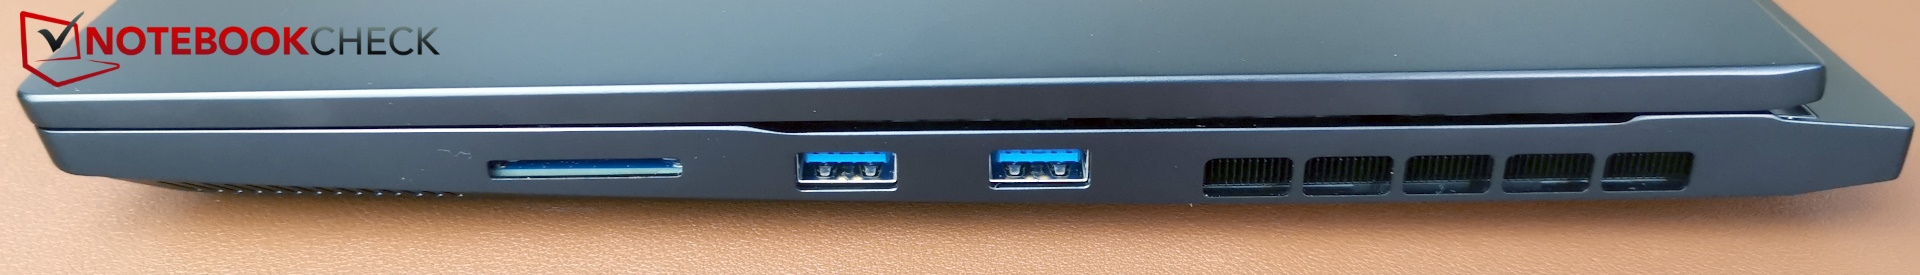
Lettore di schede SD
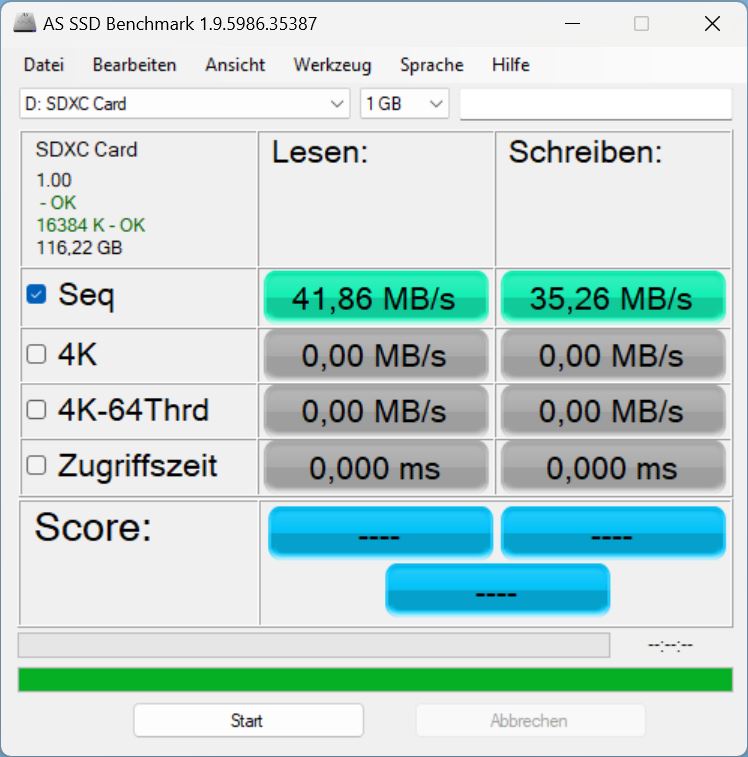
Il lettore SD accetta le schede di dimensioni standard, ma non c'è un meccanismo di blocco e quindi le schede fuoriescono.
Sfortunatamente, le prestazioni del lettore di schede, già mediocre, che si trovava nel Fusion 15, si sono dimezzate di nuovo, il che significa che il Core 15 fa parte delle prestazioni più lente di questa categoria.
| SD Card Reader | |
| average JPG Copy Test (av. of 3 runs) | |
| Media della classe Gaming (19 - 197.3, n=68, ultimi 2 anni) | |
| SCHENKER XMG Pro 15 (E23) | |
| SCHENKER XMG Fusion 15 (Early 24) (AV PRO microSD 128 GB V60) | |
| SCHENKER XMG Core 15 (M24) | |
| Lenovo Legion 5 16IRX G9 | |
| maximum AS SSD Seq Read Test (1GB) | |
| Media della classe Gaming (25.8 - 263, n=67, ultimi 2 anni) | |
| SCHENKER XMG Pro 15 (E23) | |
| SCHENKER XMG Fusion 15 (Early 24) (AV PRO microSD 128 GB V60) | |
| SCHENKER XMG Core 15 (M24) | |
| Lenovo Legion 5 16IRX G9 | |
Comunicazione
Il produttore ci ha informato, dopo aver ricevuto il portatile, che il nostro modello di recensione era accidentalmente dotato di un Intel AX211 WiF, proprio come il Fusion 15. In realtà questo non è il caso del Core 15.
Normalmente, l'Intel AX200 è di serie nel Core 15 e, con soli 15 dollari in più, si ottiene l'AMD Wi-Fi 6E RZ616 con Wi-Fi 6E. Tuttavia, al momento non siamo in grado di testare la sua velocità.

 NVIDIA GeForce RTX 4060 Laptop GPU, R7 8845HS, Samsung 990 Pro 1 TB")
 NVIDIA GeForce RTX 4060 Laptop GPU, R7 8845HS, Samsung 990 Pro 1 TB")
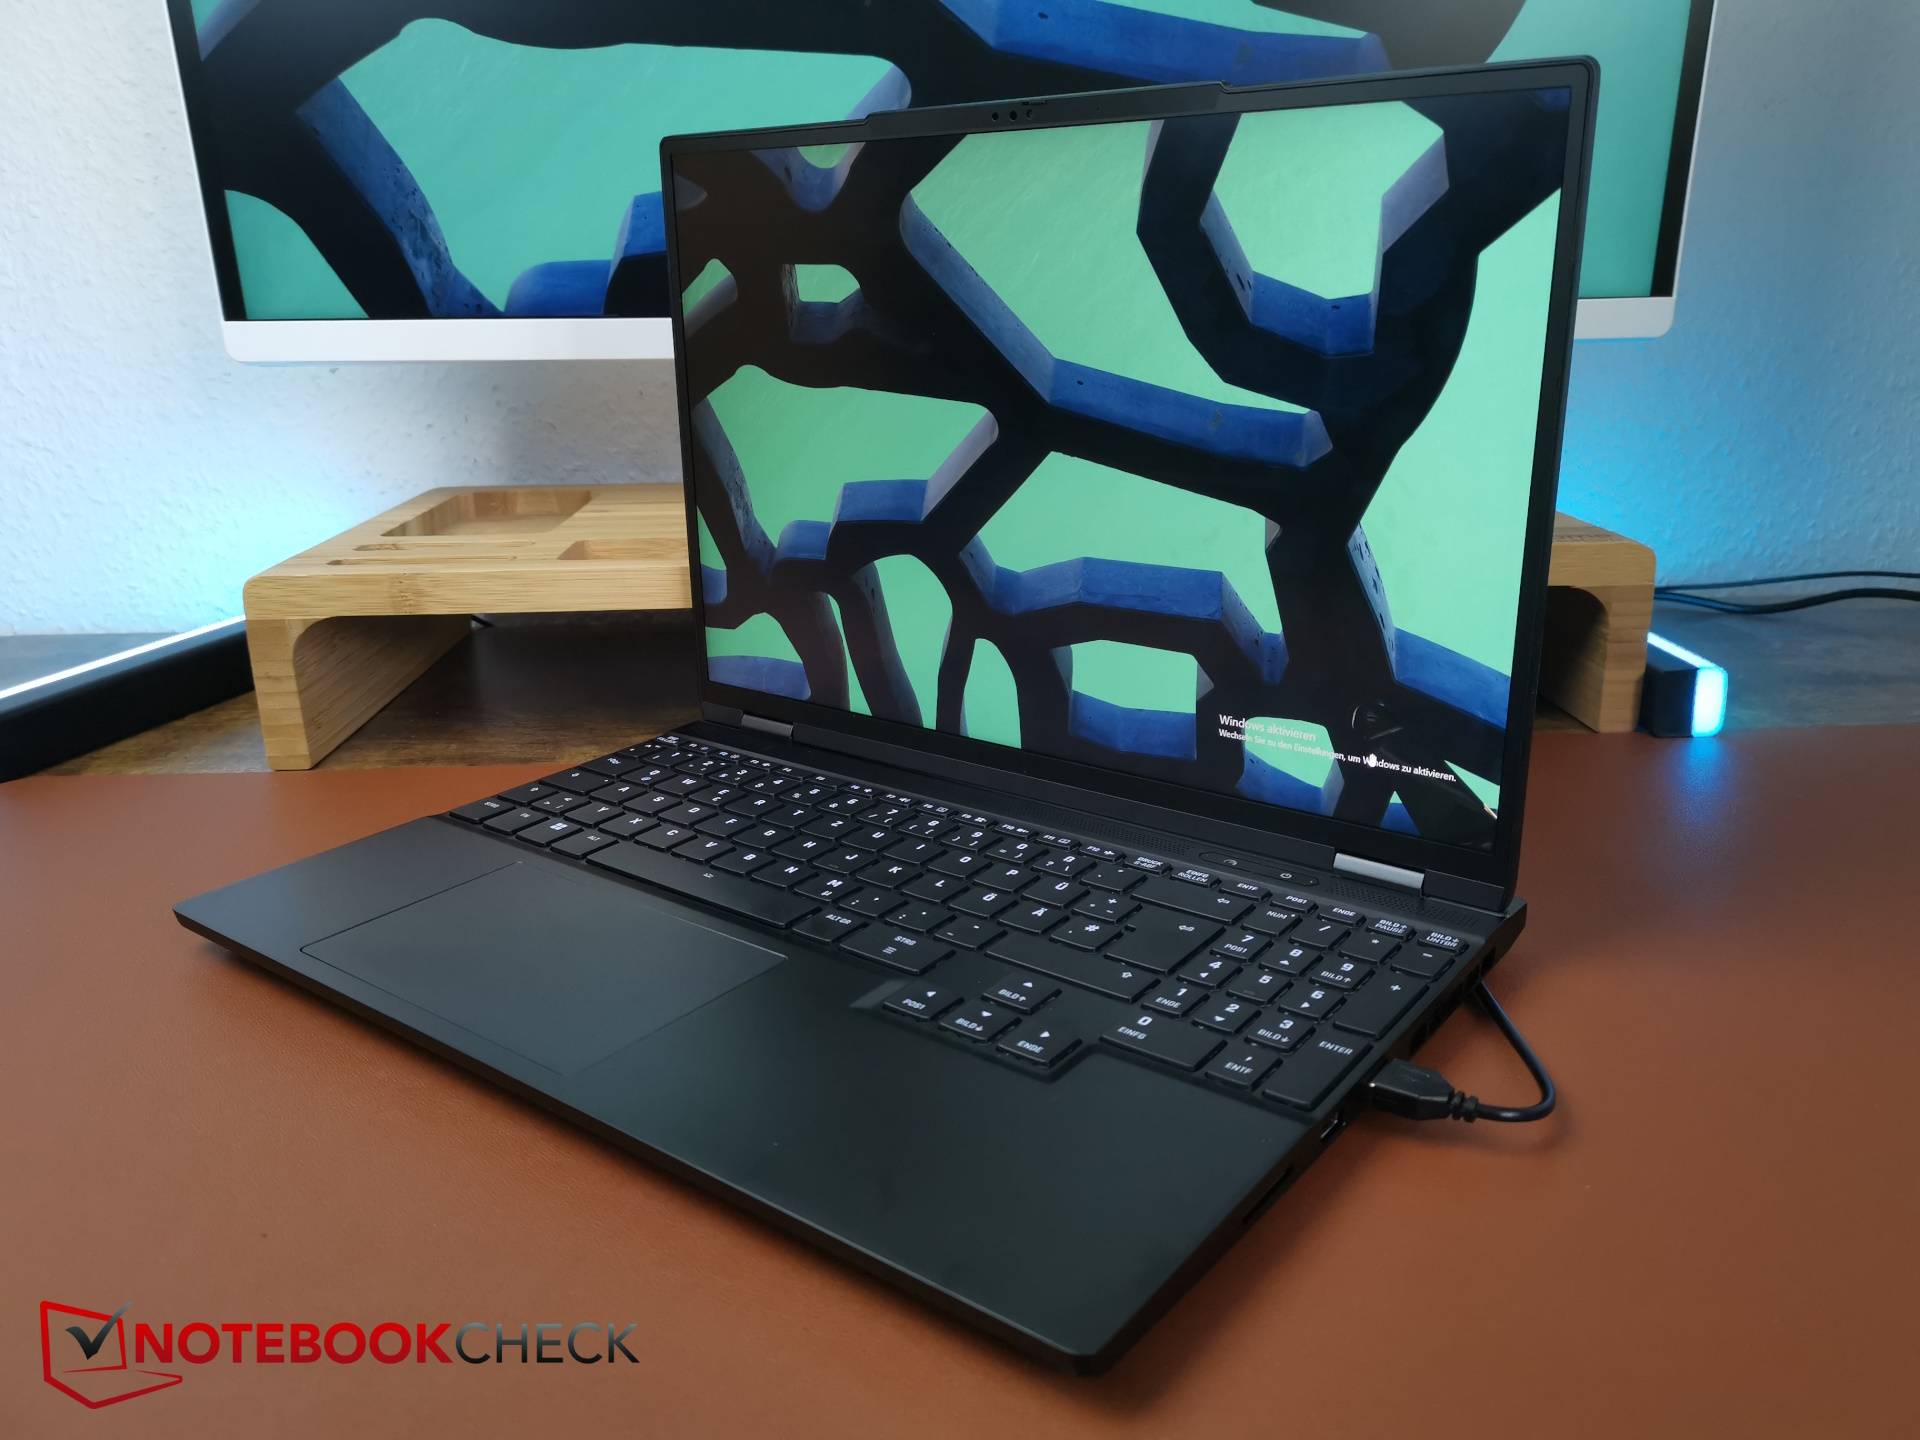
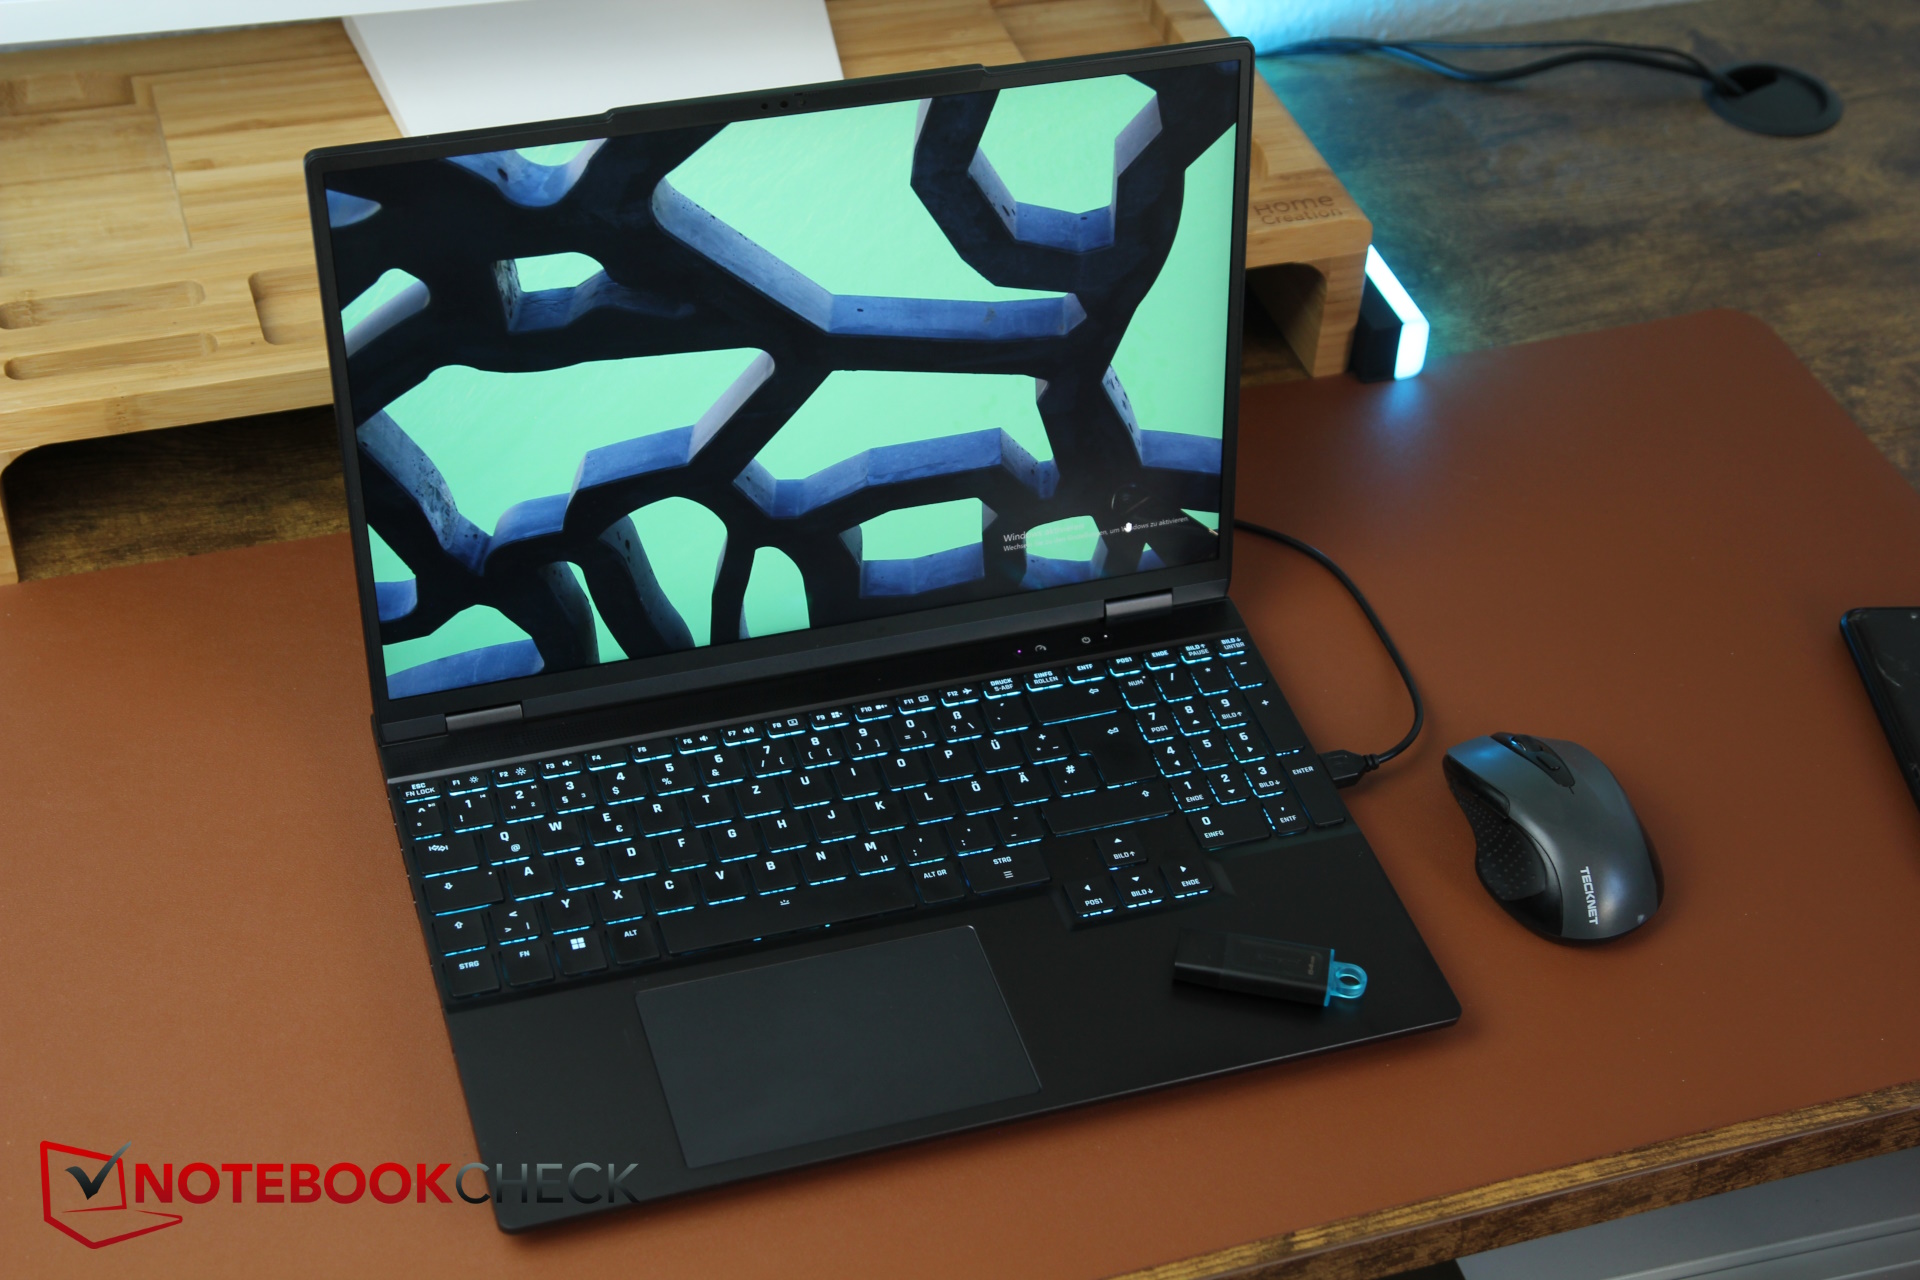
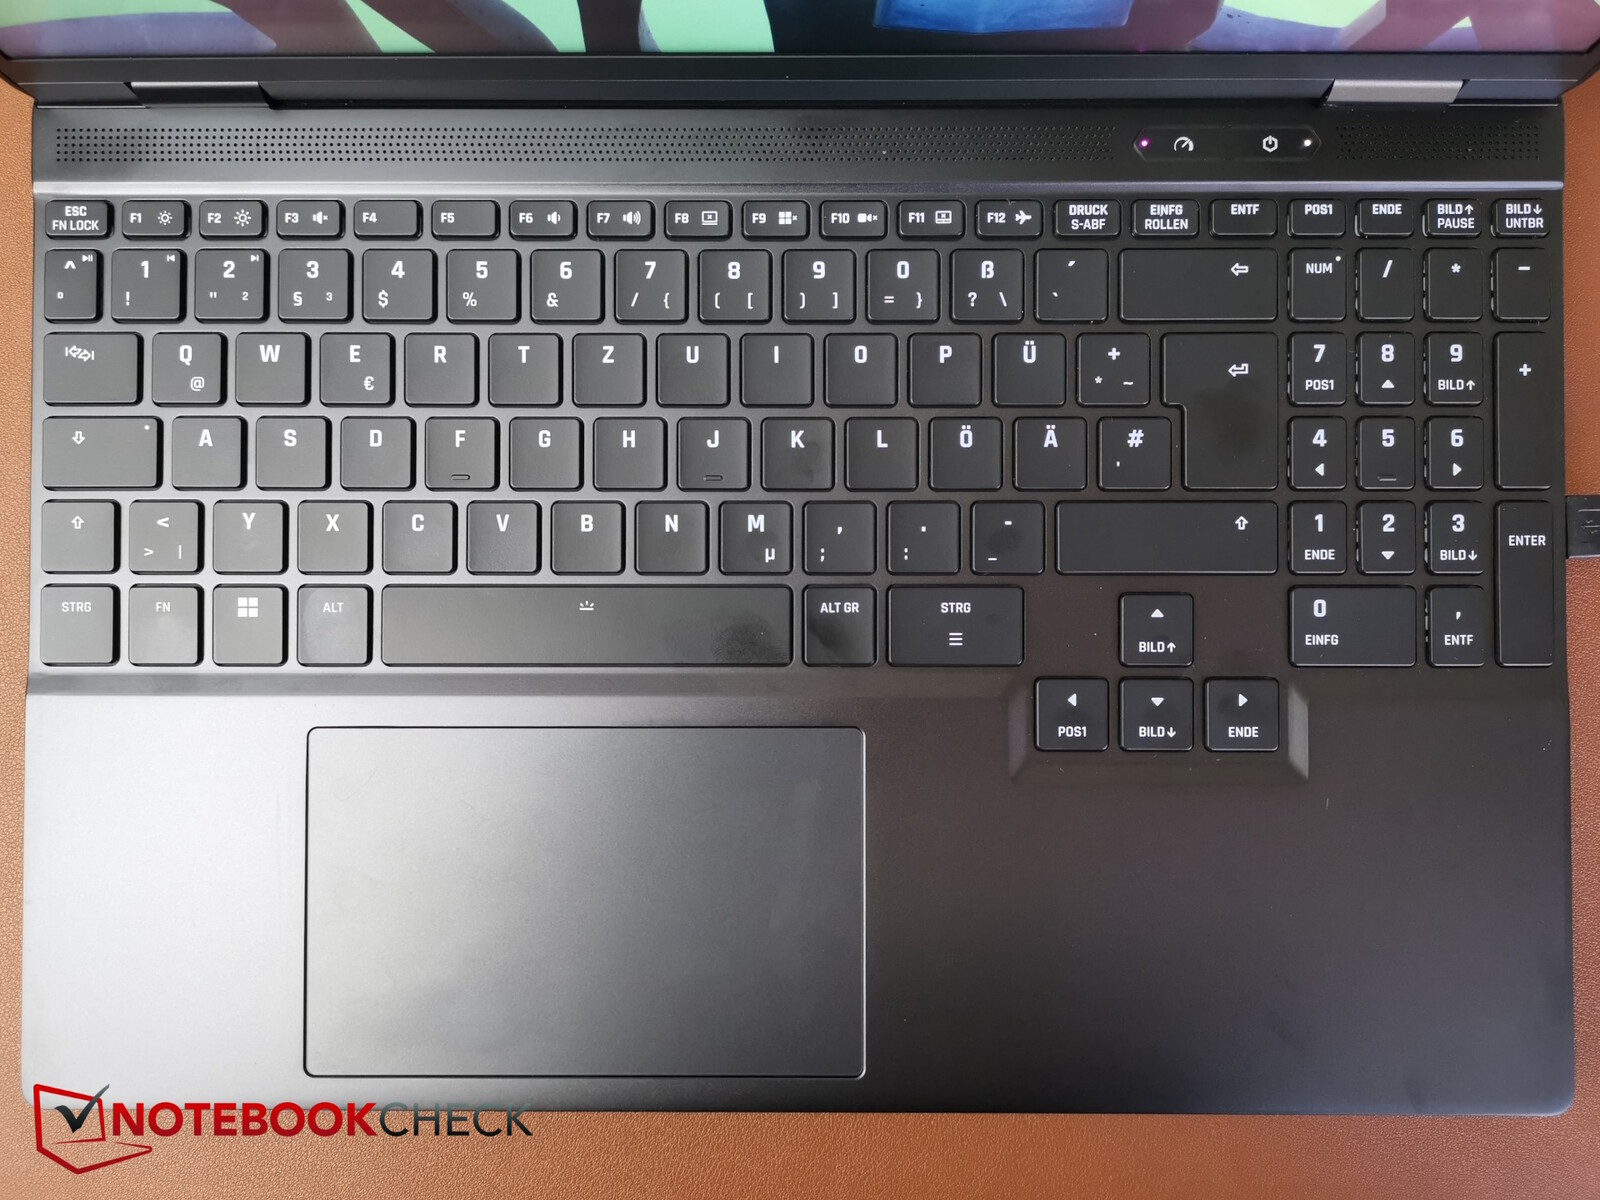
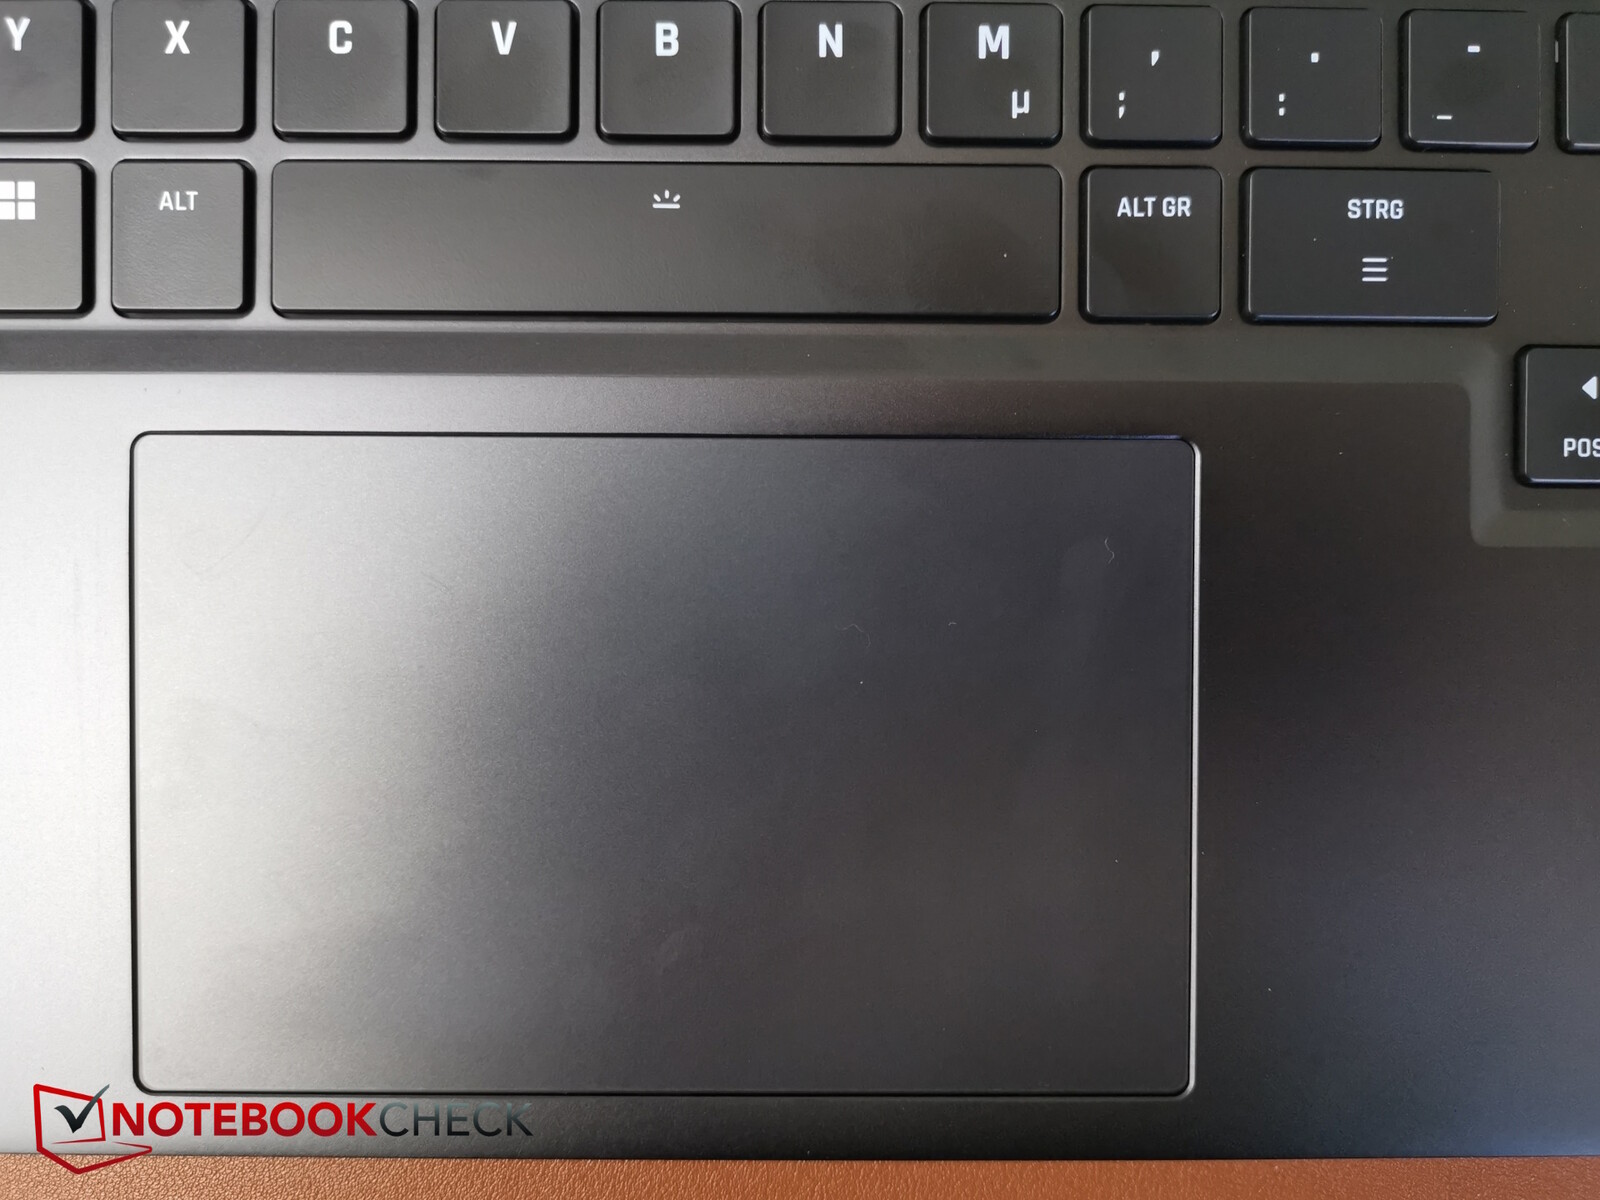
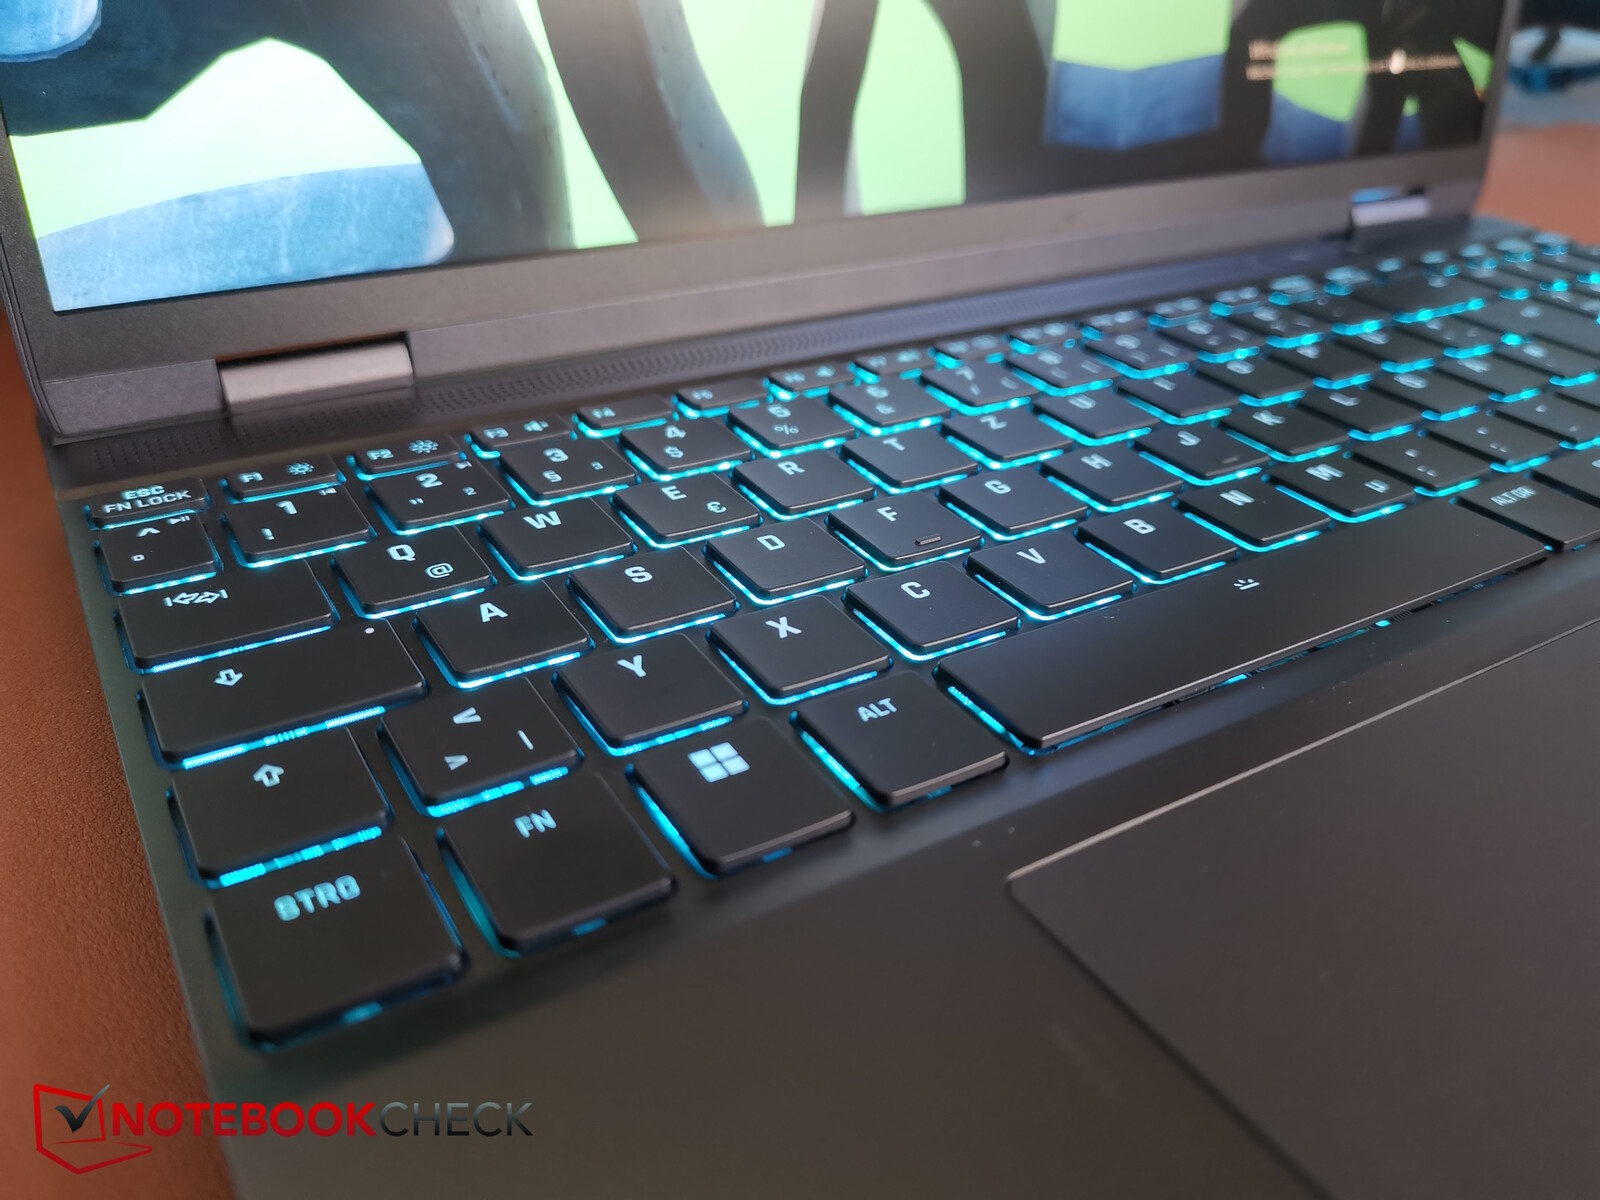
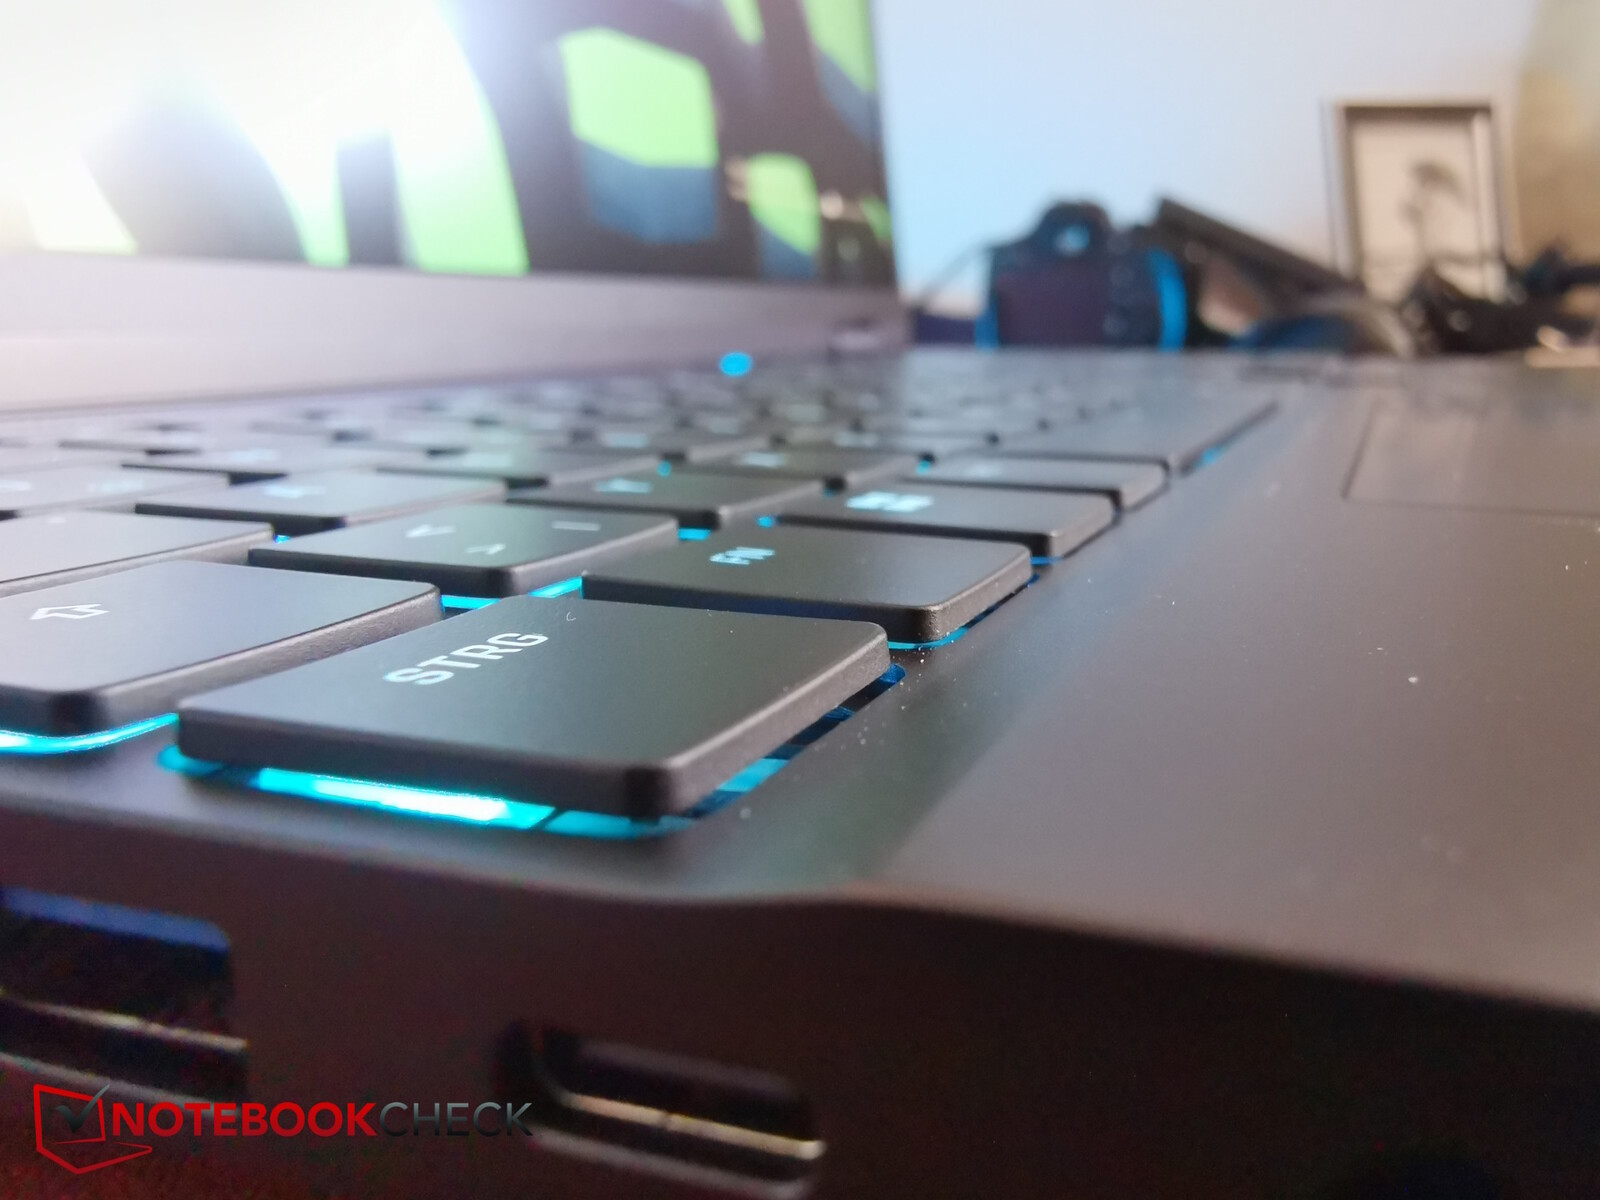
Dispositivi di input - Spazio utilizzato al massimo
A differenza del Fusion 15, il Core 15 non possiede un'illuminazione RGB individuale dei tasti. Al contrario, dispone di un'unica zona di illuminazione. Sebbene non consenta un numero elevato di impostazioni LED opzionali, tutto è comunque visibile.
Alla tastiera manca anche il rollover dei tasti N e l'anti-ghosting, almeno secondo la scheda tecnica. Tuttavia, il tasto con cui è possibile cambiare i profili delle prestazioni è presente a bordo.
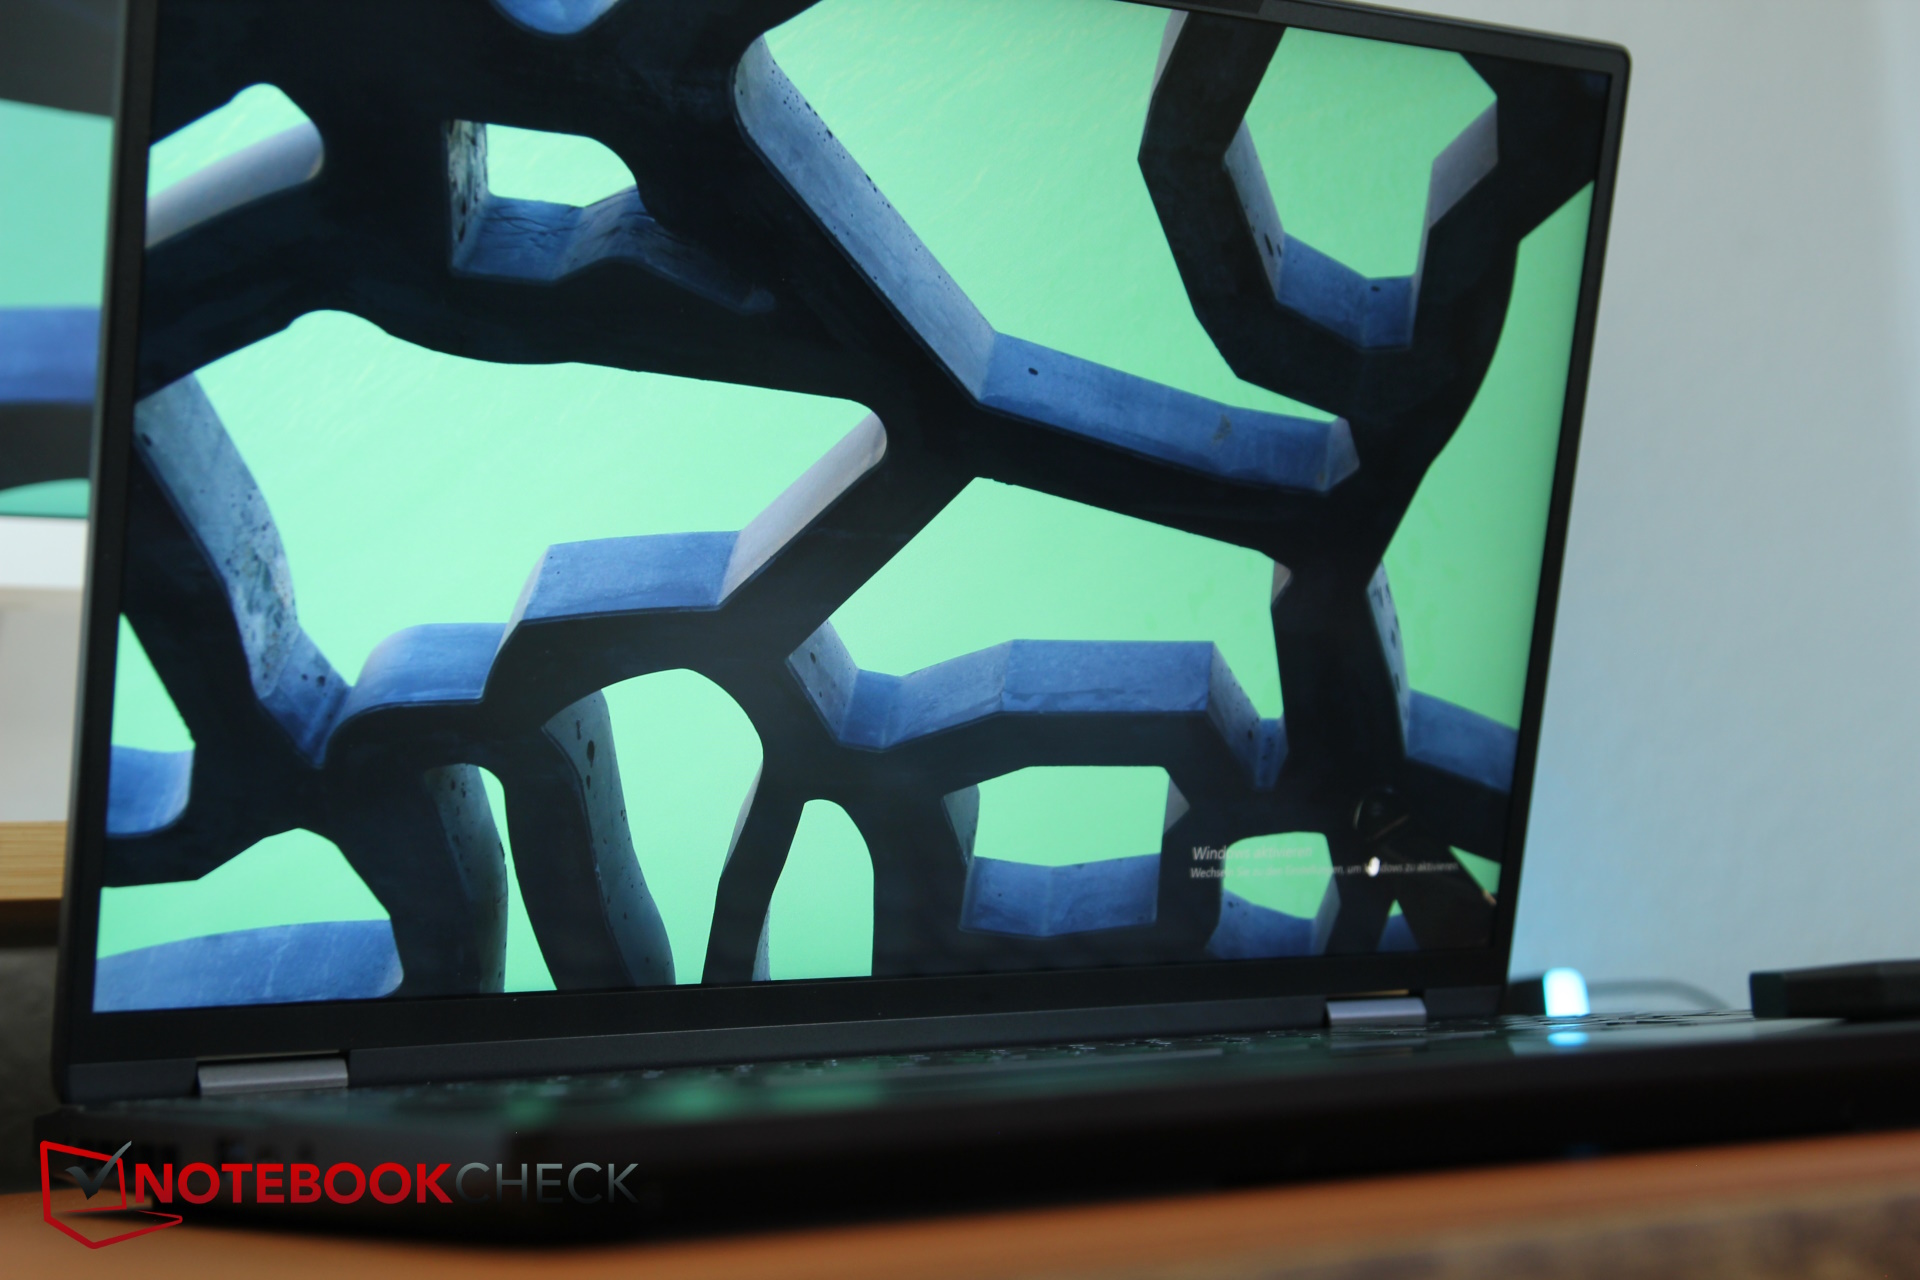
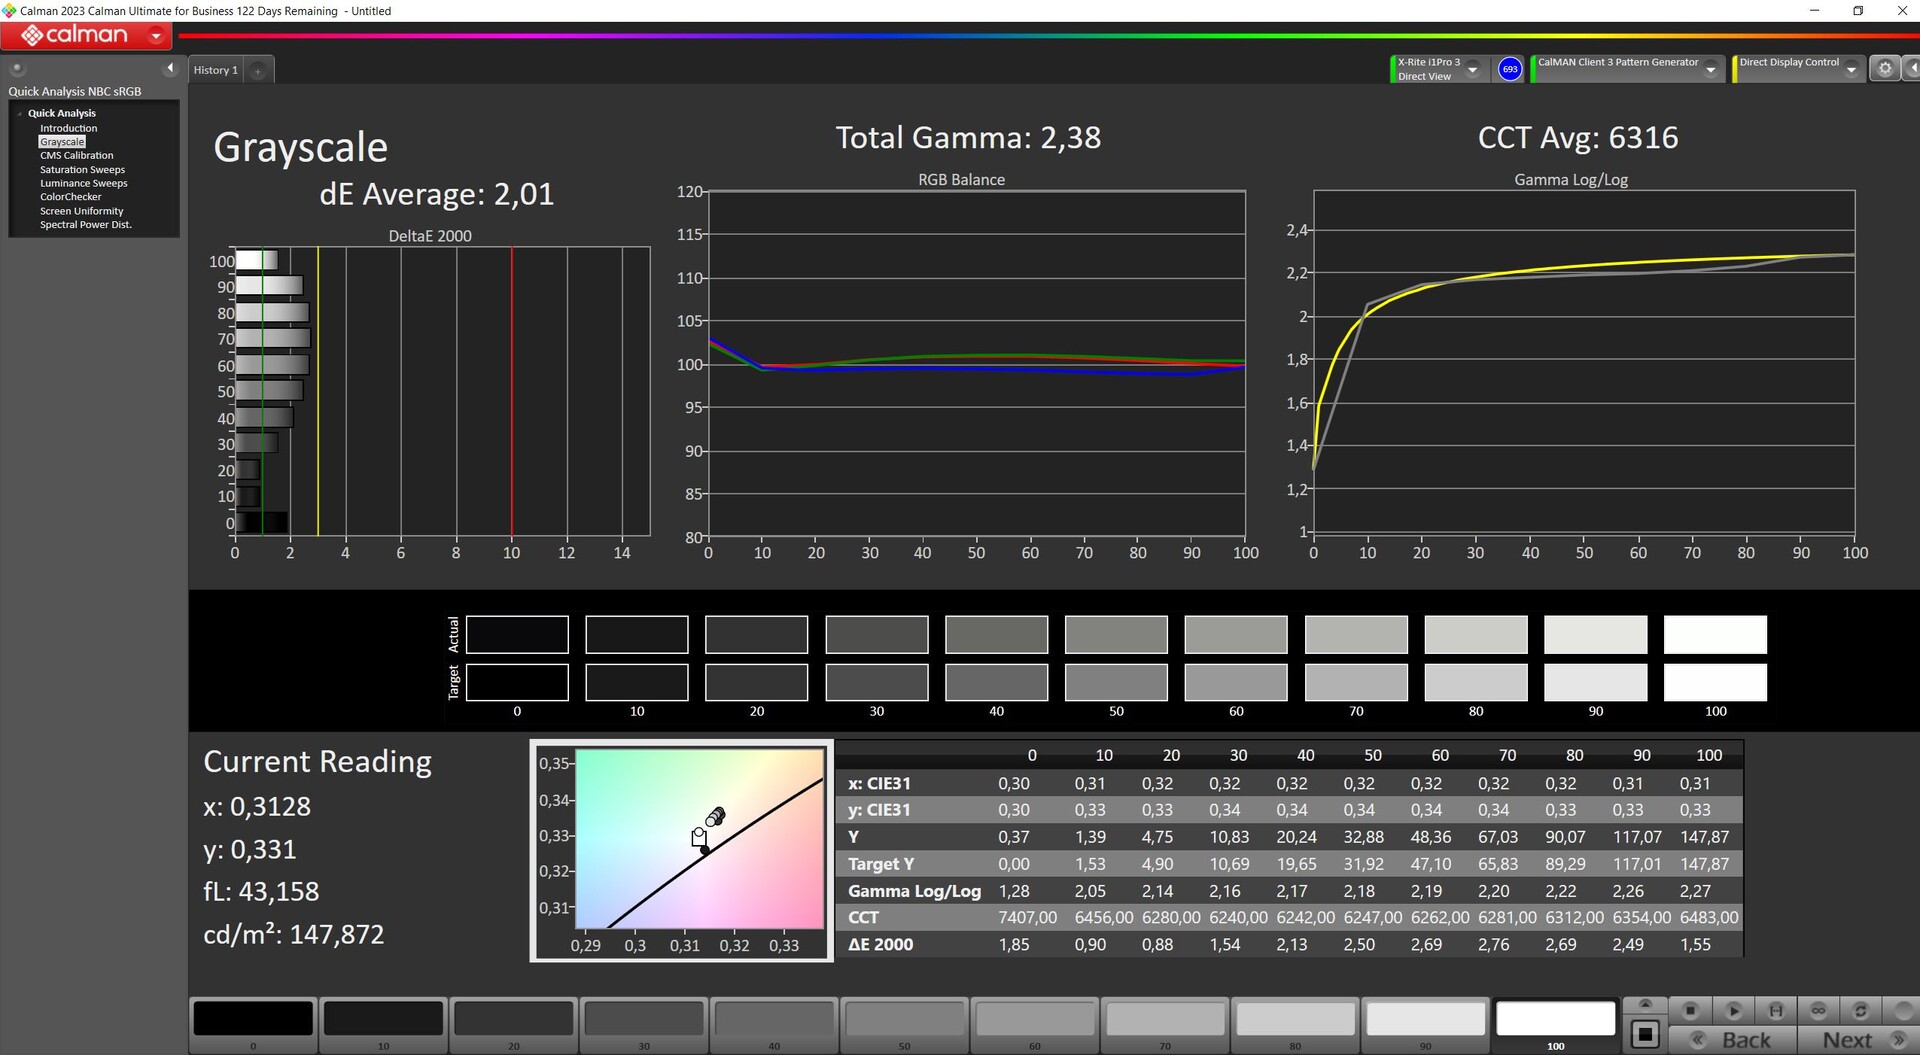
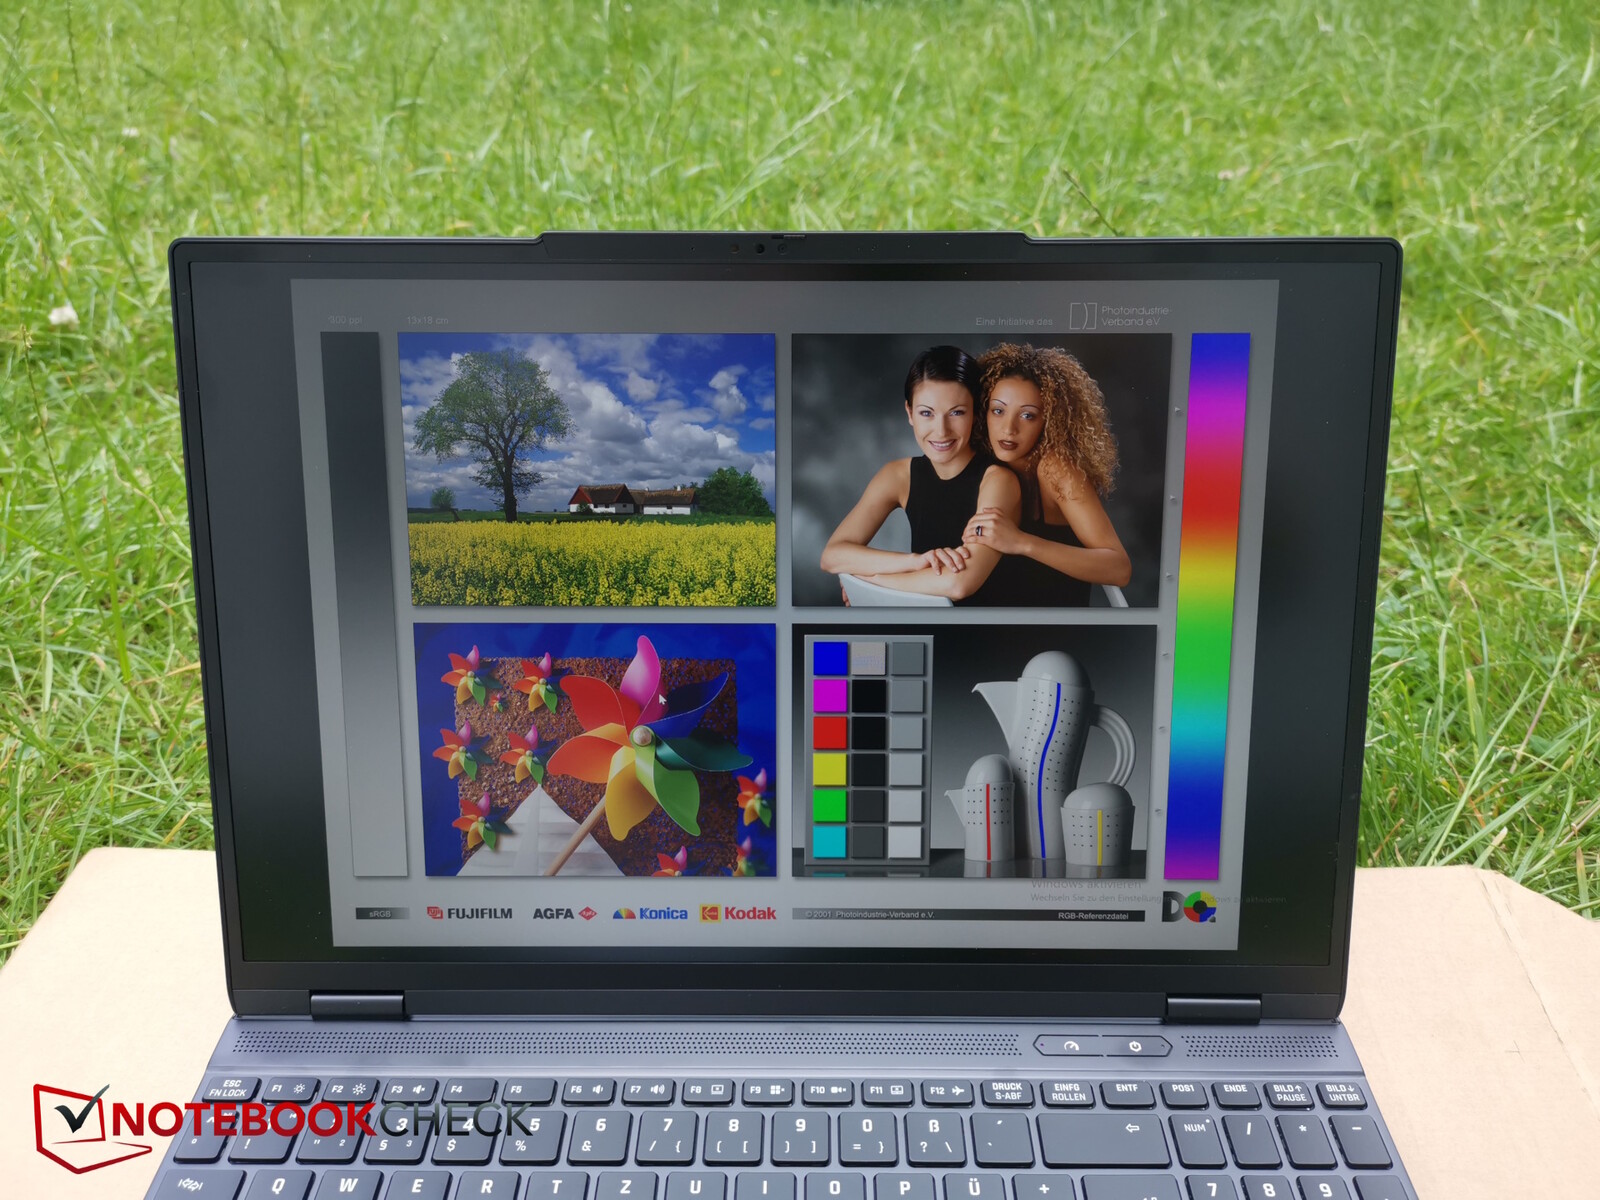
Display - 500 nits, sRGB, 1600p
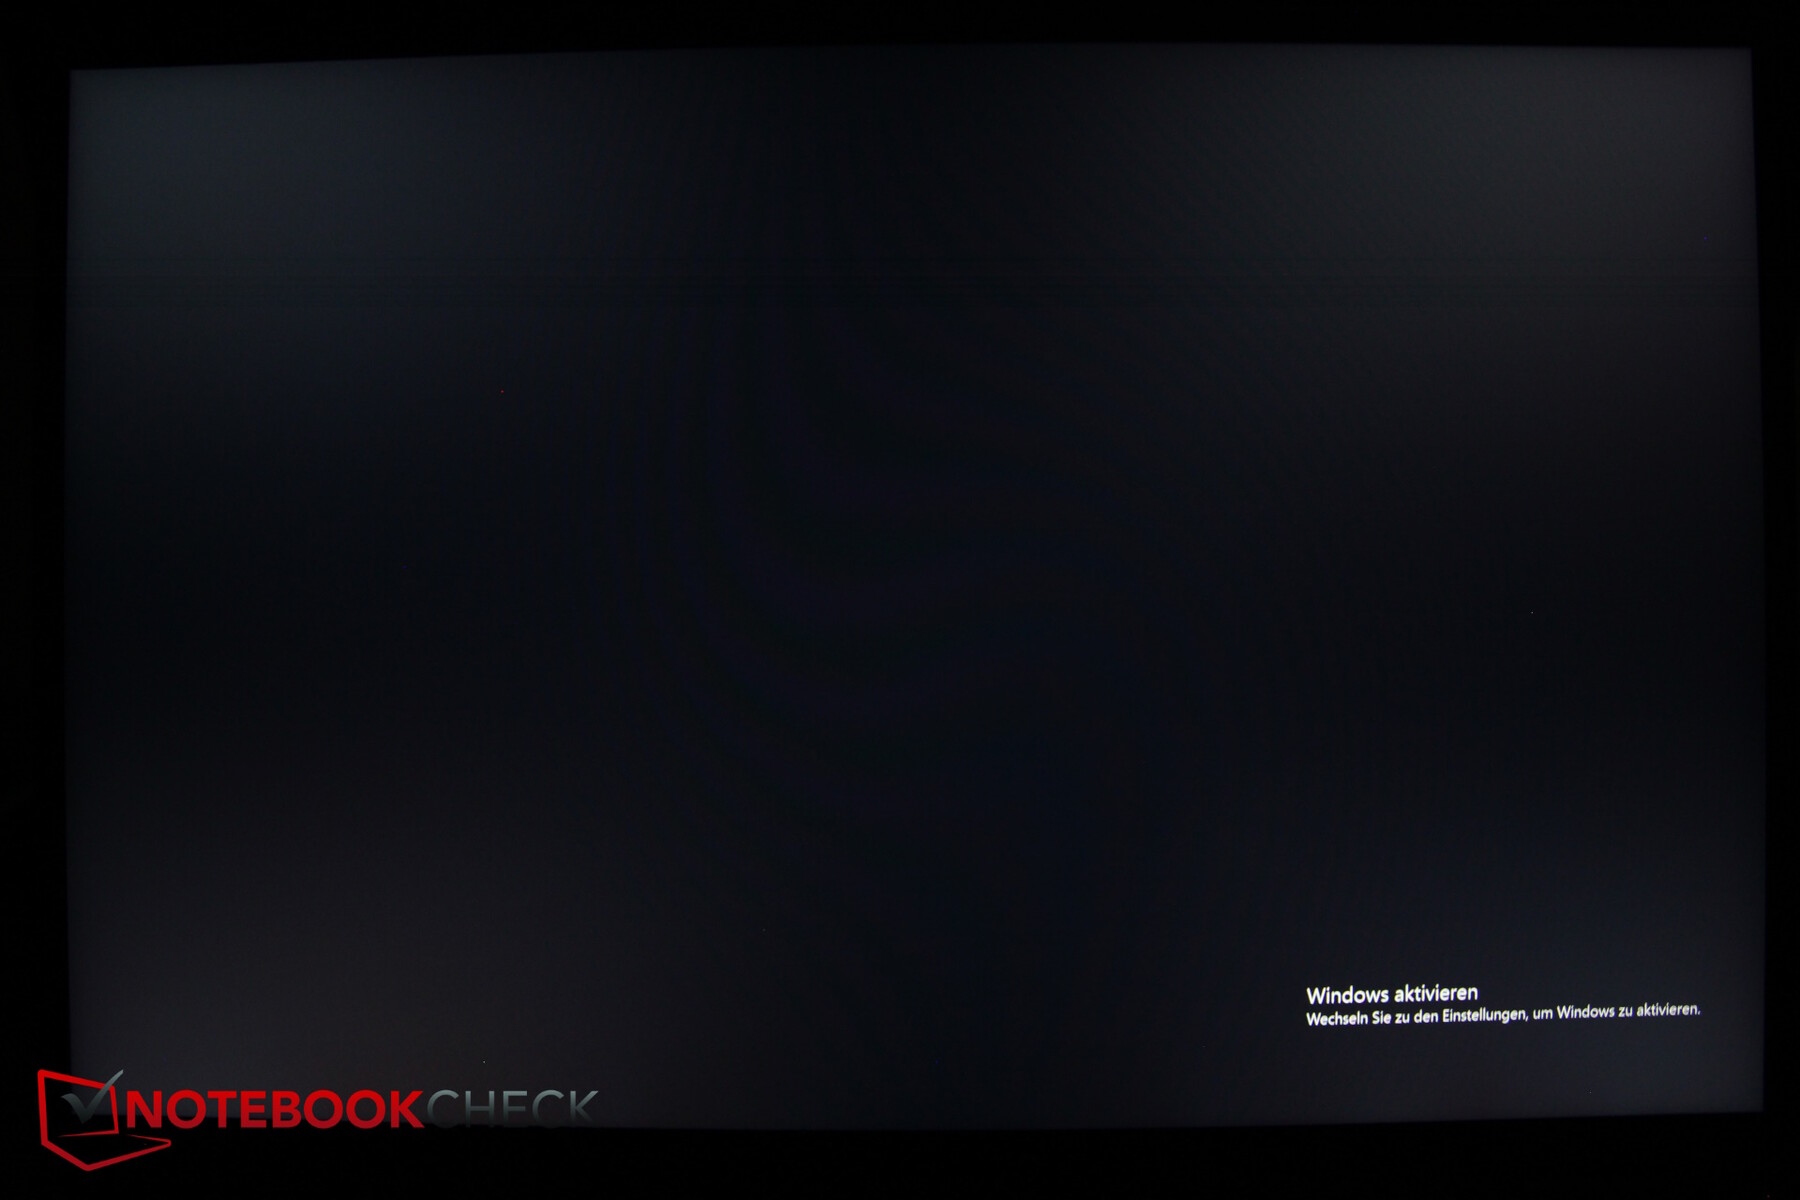
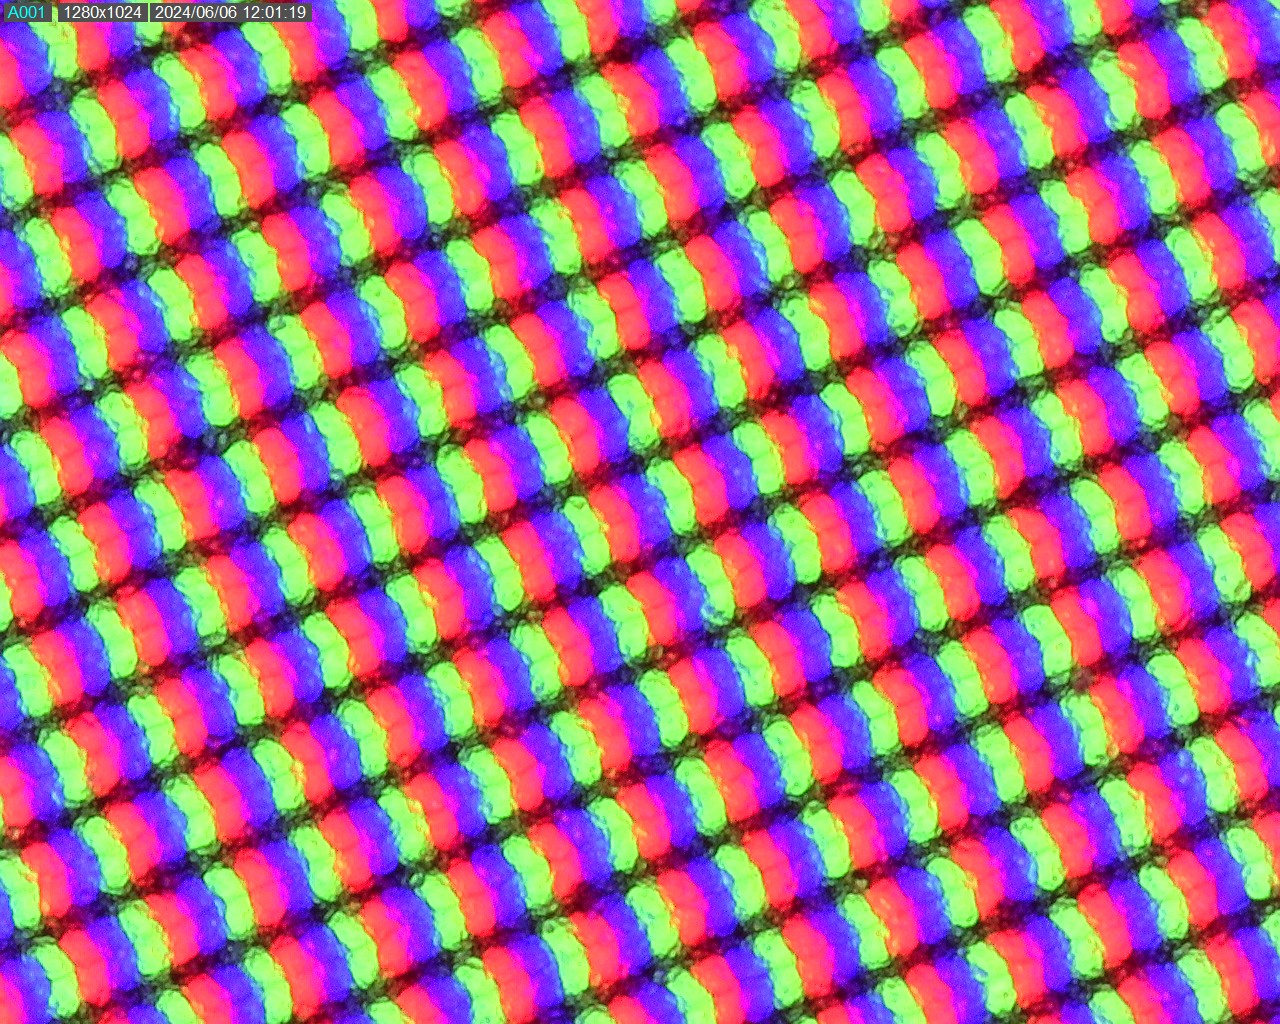
Il Core utilizza lo stesso pannello del Fusion. Anche se abbiamo misurato una luminosità significativamente più elevata (600 contro 460 nits), questo ha un costo per il livello del nero e il contrasto ne risente.
Alla minima luminosità, la retroilluminazione del display è troppo intensa, ma è comunque illuminata in modo abbastanza uniforme.
A circa il 45% di luminosità (150 nits), abbiamo misurato 150 nits. Con un display più scuro, l'accuratezza del colore e, va da sé, il livello del nero sono entrambi un po' migliori
Purtroppo non ci sono opzioni di visualizzazione alternative, ma il display è luminoso, ha tempi di risposta sufficientemente rapidi, non ha PWM e, allo stesso modo, il backlight bleeding non si nota.
| |||||||||||||||||||||||||
Distribuzione della luminosità: 91 %
Al centro con la batteria: 635 cd/m²
Contrasto: 992:1 (Nero: 0.64 cd/m²)
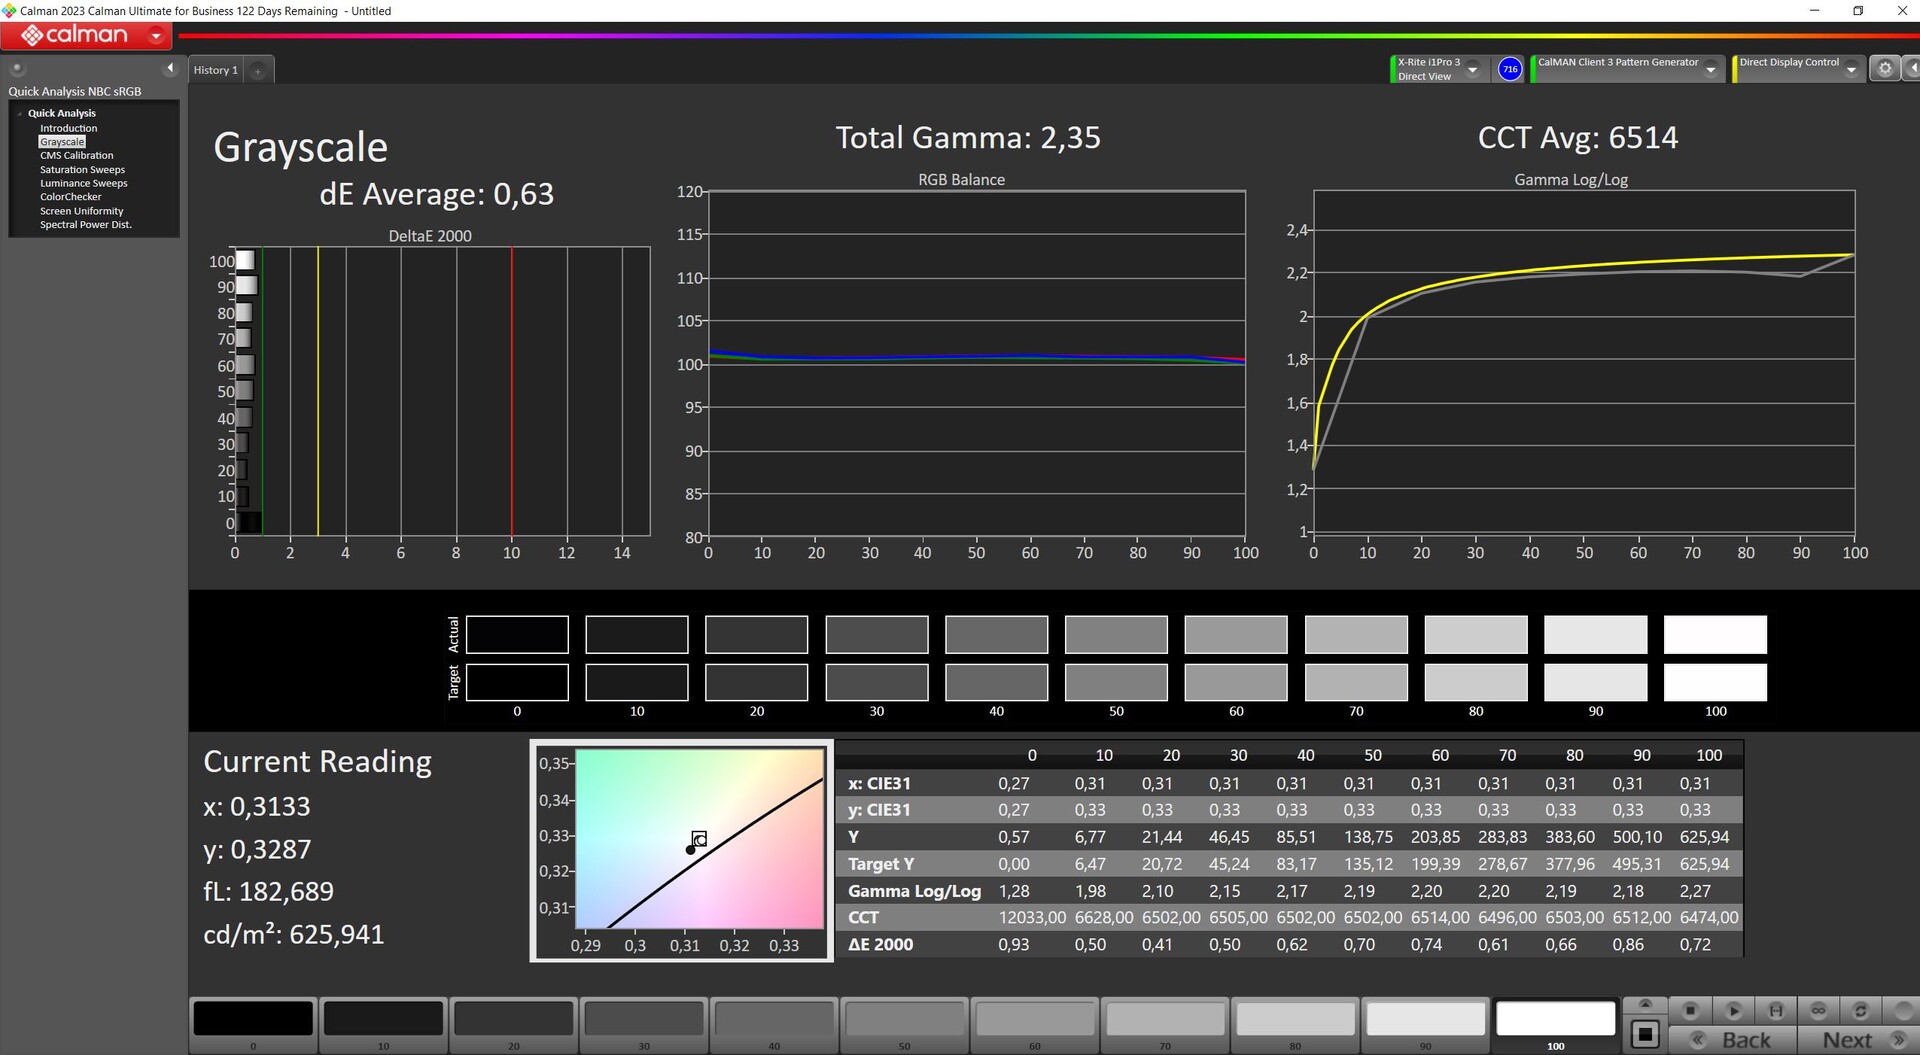
ΔE Color 1.89 | 0.5-29.43 Ø4.87, calibrated: 1.14
ΔE Greyscale 2.53 | 0.5-98 Ø5.1
74.6% AdobeRGB 1998 (Argyll 2.2.0 3D)
100% sRGB (Argyll 2.2.0 3D)
73.2% Display P3 (Argyll 2.2.0 3D)
Gamma: 2.36
| SCHENKER XMG Core 15 (M24) BOE NJ NE153QDM-NZ1 (BOE0C8E), IPS, 2560x1600, 15.3" | Lenovo Legion 5 16IRX G9 NE160QDM-NZ3, IPS, 2560x1600, 16" | HP Victus 16 (2024) Chi Mei CMN163E, IPS, 1920x1080, 16.1" | Dell G16, i7-13650HX, RTX 4060 Chi Mei CMN161D (160GME), IPS, 2560x1600, 16" | SCHENKER XMG Fusion 15 (Early 24) BOE NJ NE153QDM-NZ1, IPS, 2560x1600, 15.3" | SCHENKER XMG Pro 15 (E23) BOE0AD1, IPS, 2560x1440, 15.6" | |
|---|---|---|---|---|---|---|
| Display | -1% | -42% | -5% | 0% | 16% | |
| Display P3 Coverage | 73.2 | 72.4 -1% | 41.3 -44% | 67.5 -8% | 73.5 0% | 97.8 34% |
| sRGB Coverage | 100 | 100 0% | 61.7 -38% | 98.5 -1% | 100 0% | 99.9 0% |
| AdobeRGB 1998 Coverage | 74.6 | 74.1 -1% | 42.7 -43% | 69.3 -7% | 75 1% | 85.4 14% |
| Response Times | -13% | -151% | 4% | 46% | -25% | |
| Response Time Grey 50% / Grey 80% * | 9.6 ? | 12.5 ? -30% | 28.6 ? -198% | 7.6 ? 21% | 5 ? 48% | 14 ? -46% |
| Response Time Black / White * | 9.2 ? | 8.7 ? 5% | 18.7 ? -103% | 10.4 ? -13% | 5.2 ? 43% | 9.6 ? -4% |
| PWM Frequency | ||||||
| Screen | 22% | -114% | -29% | -11% | -24% | |
| Brightness middle | 635 | 526 -17% | 287 -55% | 369 -42% | 491 -23% | 322 -49% |
| Brightness | 604 | 500 -17% | 288 -52% | 344 -43% | 460 -24% | 301 -50% |
| Brightness Distribution | 91 | 87 -4% | 86 -5% | 89 -2% | 89 -2% | 85 -7% |
| Black Level * | 0.64 | 0.33 48% | 0.19 70% | 0.26 59% | 0.47 27% | 0.36 44% |
| Contrast | 992 | 1594 61% | 1511 52% | 1419 43% | 1045 5% | 894 -10% |
| Colorchecker dE 2000 * | 1.89 | 1.2 37% | 5.46 -189% | 3.04 -61% | 2.16 -14% | 1.98 -5% |
| Colorchecker dE 2000 max. * | 3.14 | 2.1 33% | 20.36 -548% | 5.56 -77% | 4.44 -41% | 5.24 -67% |
| Colorchecker dE 2000 calibrated * | 1.14 | 1 12% | 3.52 -209% | 2.35 -106% | 1.14 -0% | 1.98 -74% |
| Greyscale dE 2000 * | 2.53 | 1.3 49% | 4.8 -90% | 3.38 -34% | 3.3 -30% | 2.44 4% |
| Gamma | 2.36 93% | 2.23 99% | 2.108 104% | 2.47 89% | 2.204 100% | 2.42 91% |
| CCT | 6434 101% | 6391 102% | 6442 101% | 6040 108% | 6286 103% | 6984 93% |
| Media totale (Programma / Settaggio) | 3% /
13% | -102% /
-104% | -10% /
-19% | 12% /
-1% | -11% /
-15% |
* ... Meglio usare valori piccoli
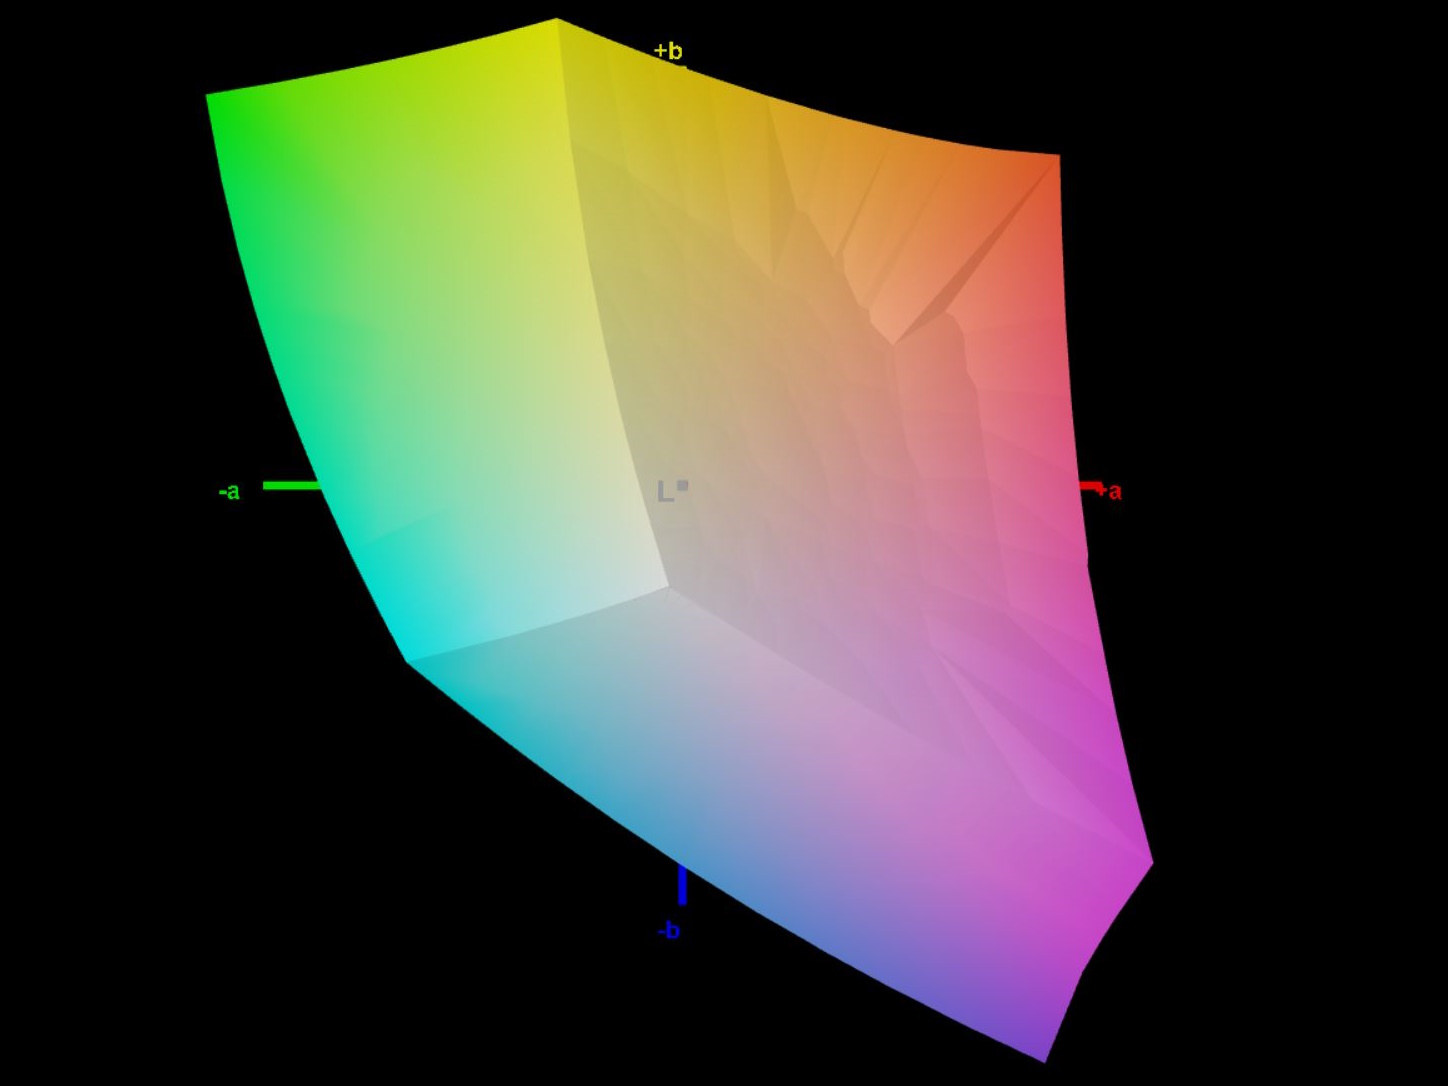
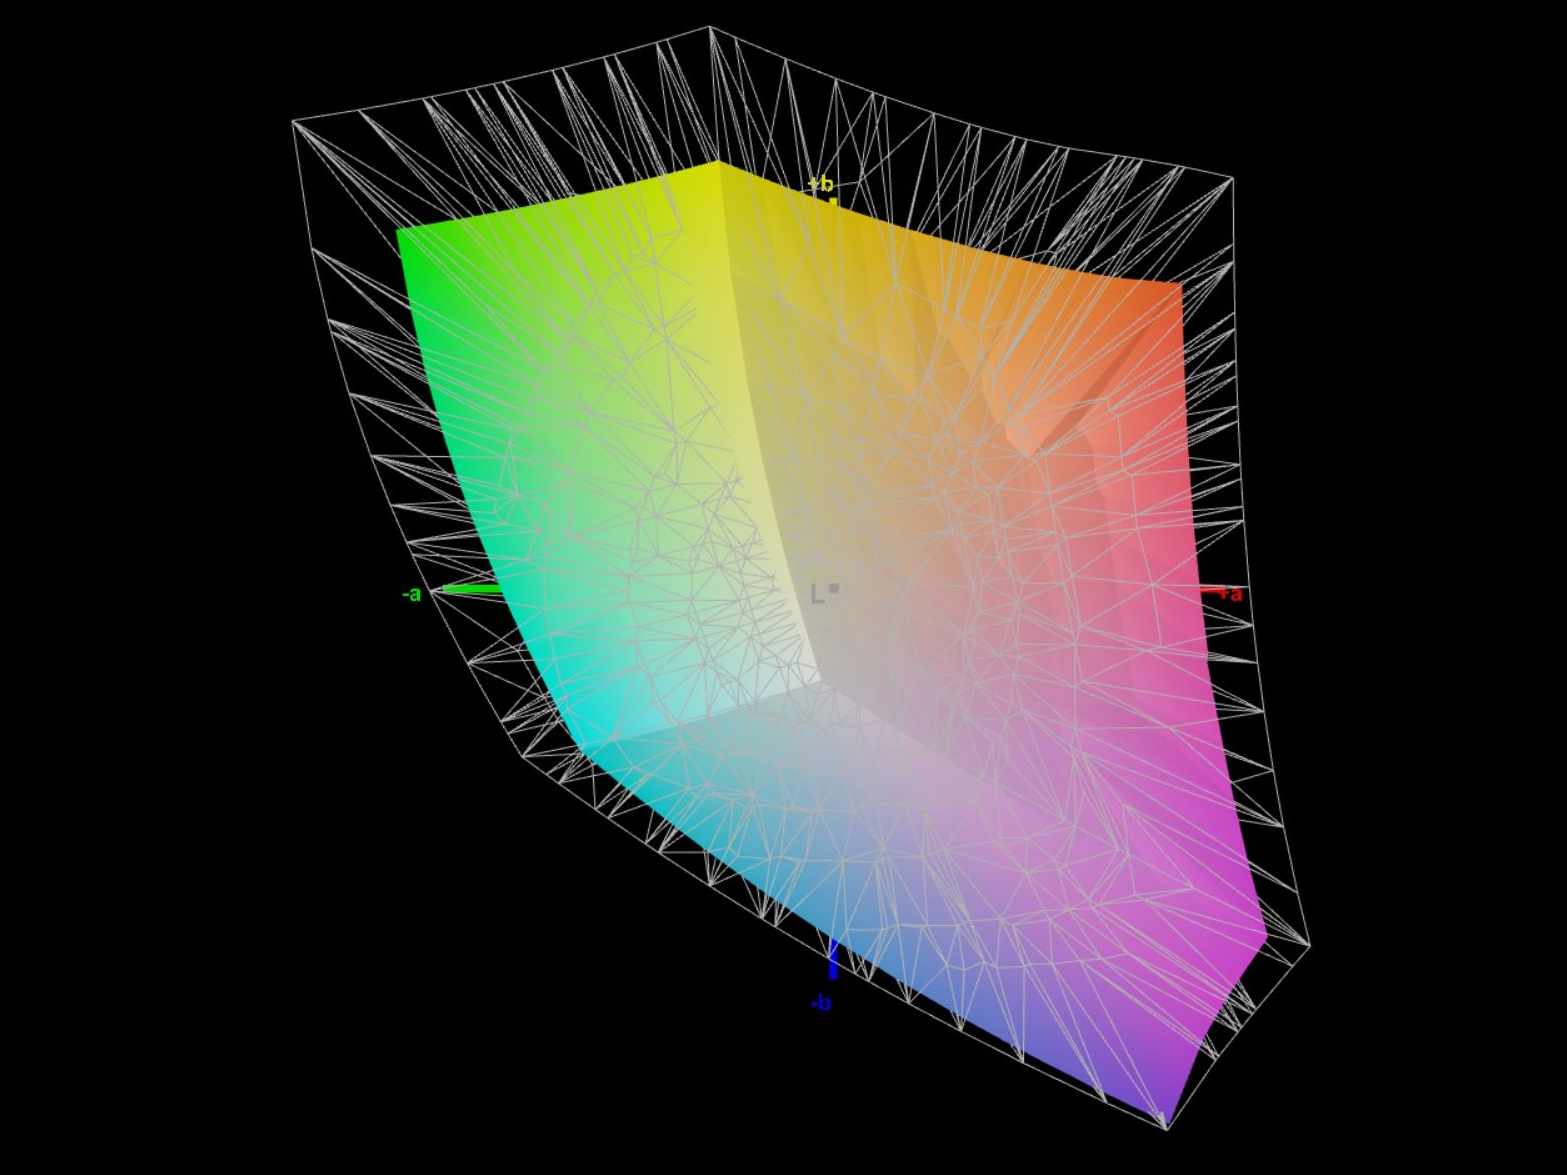
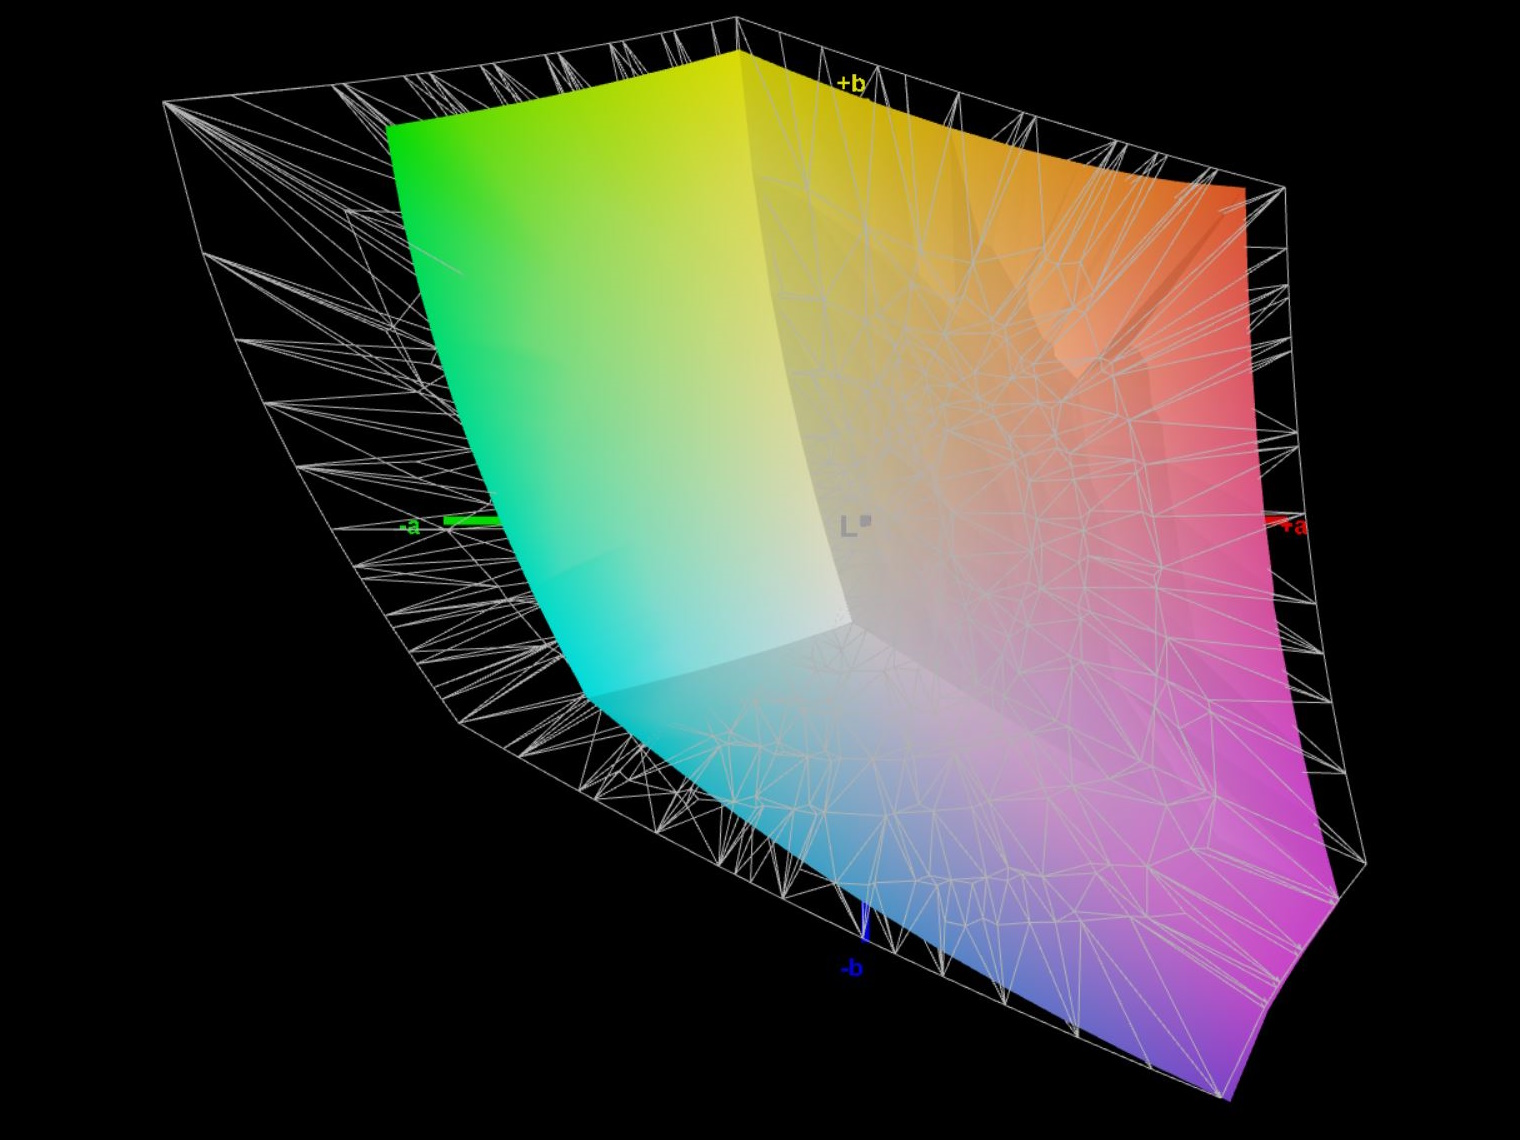
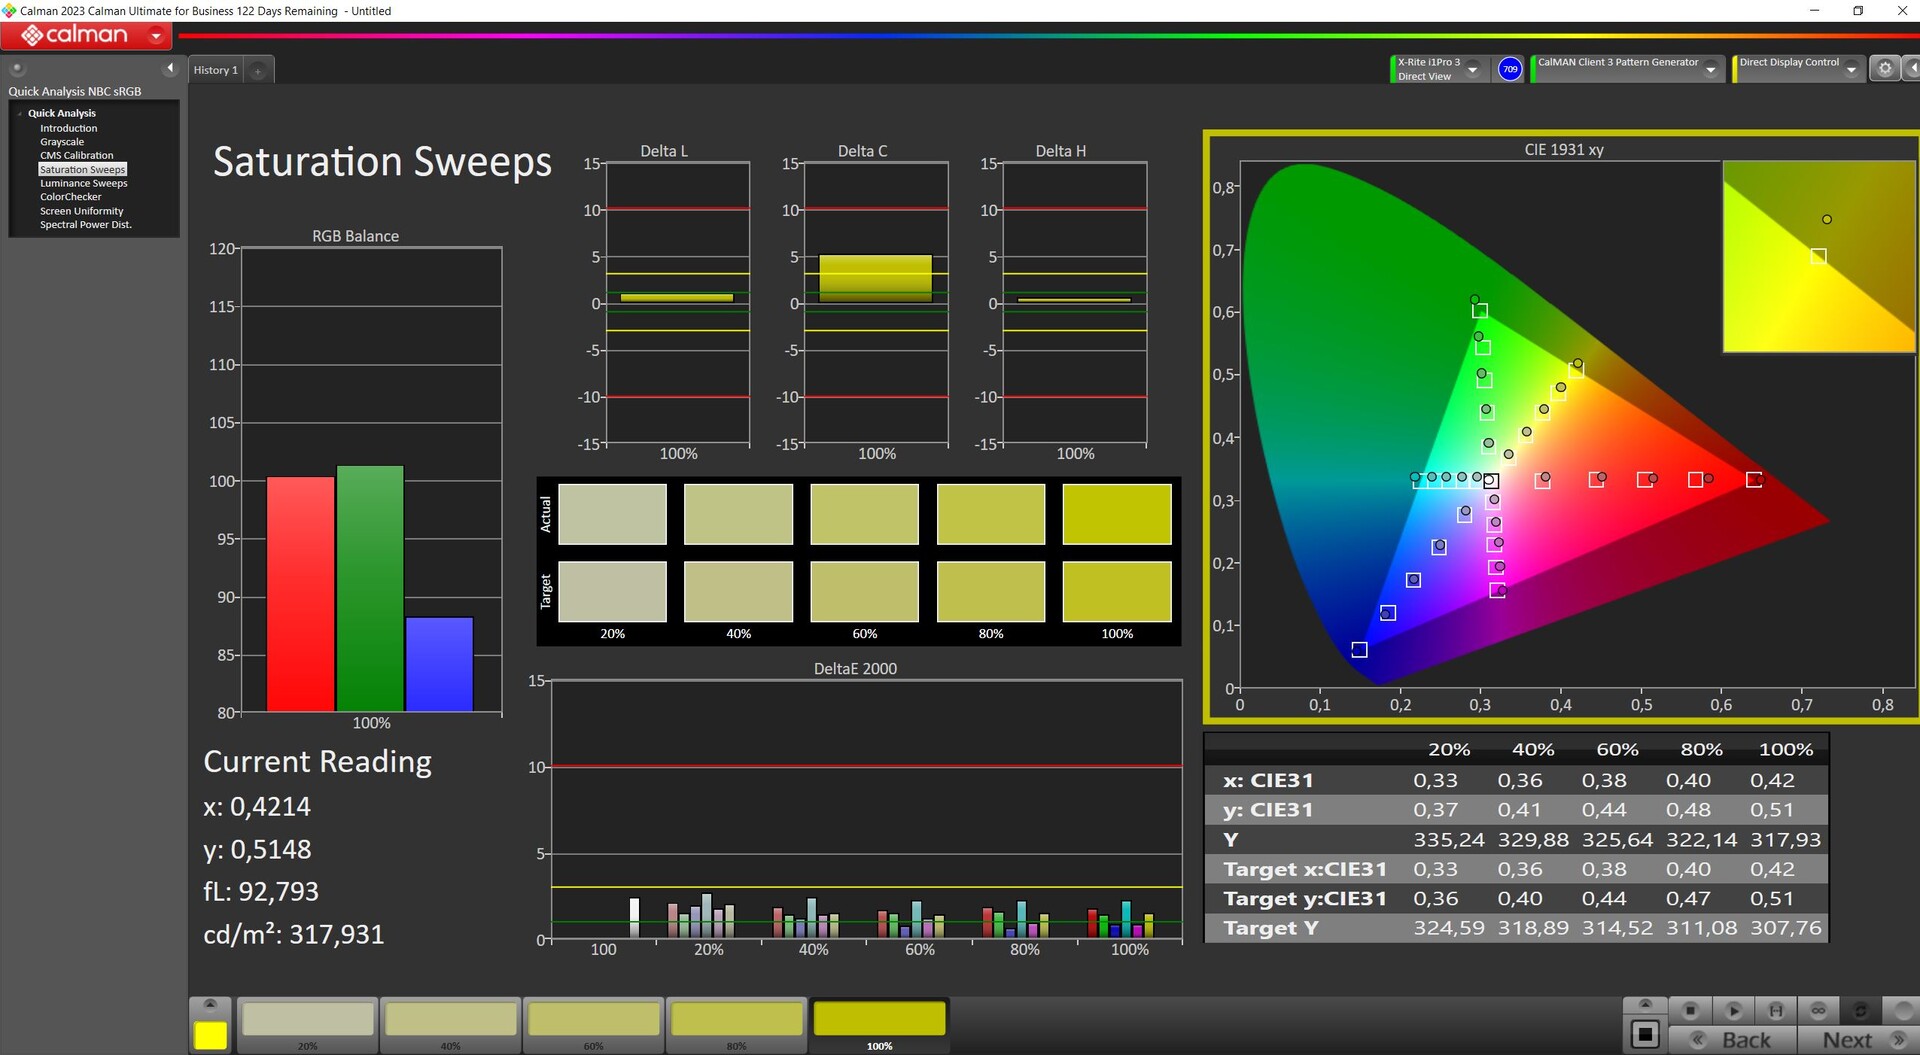
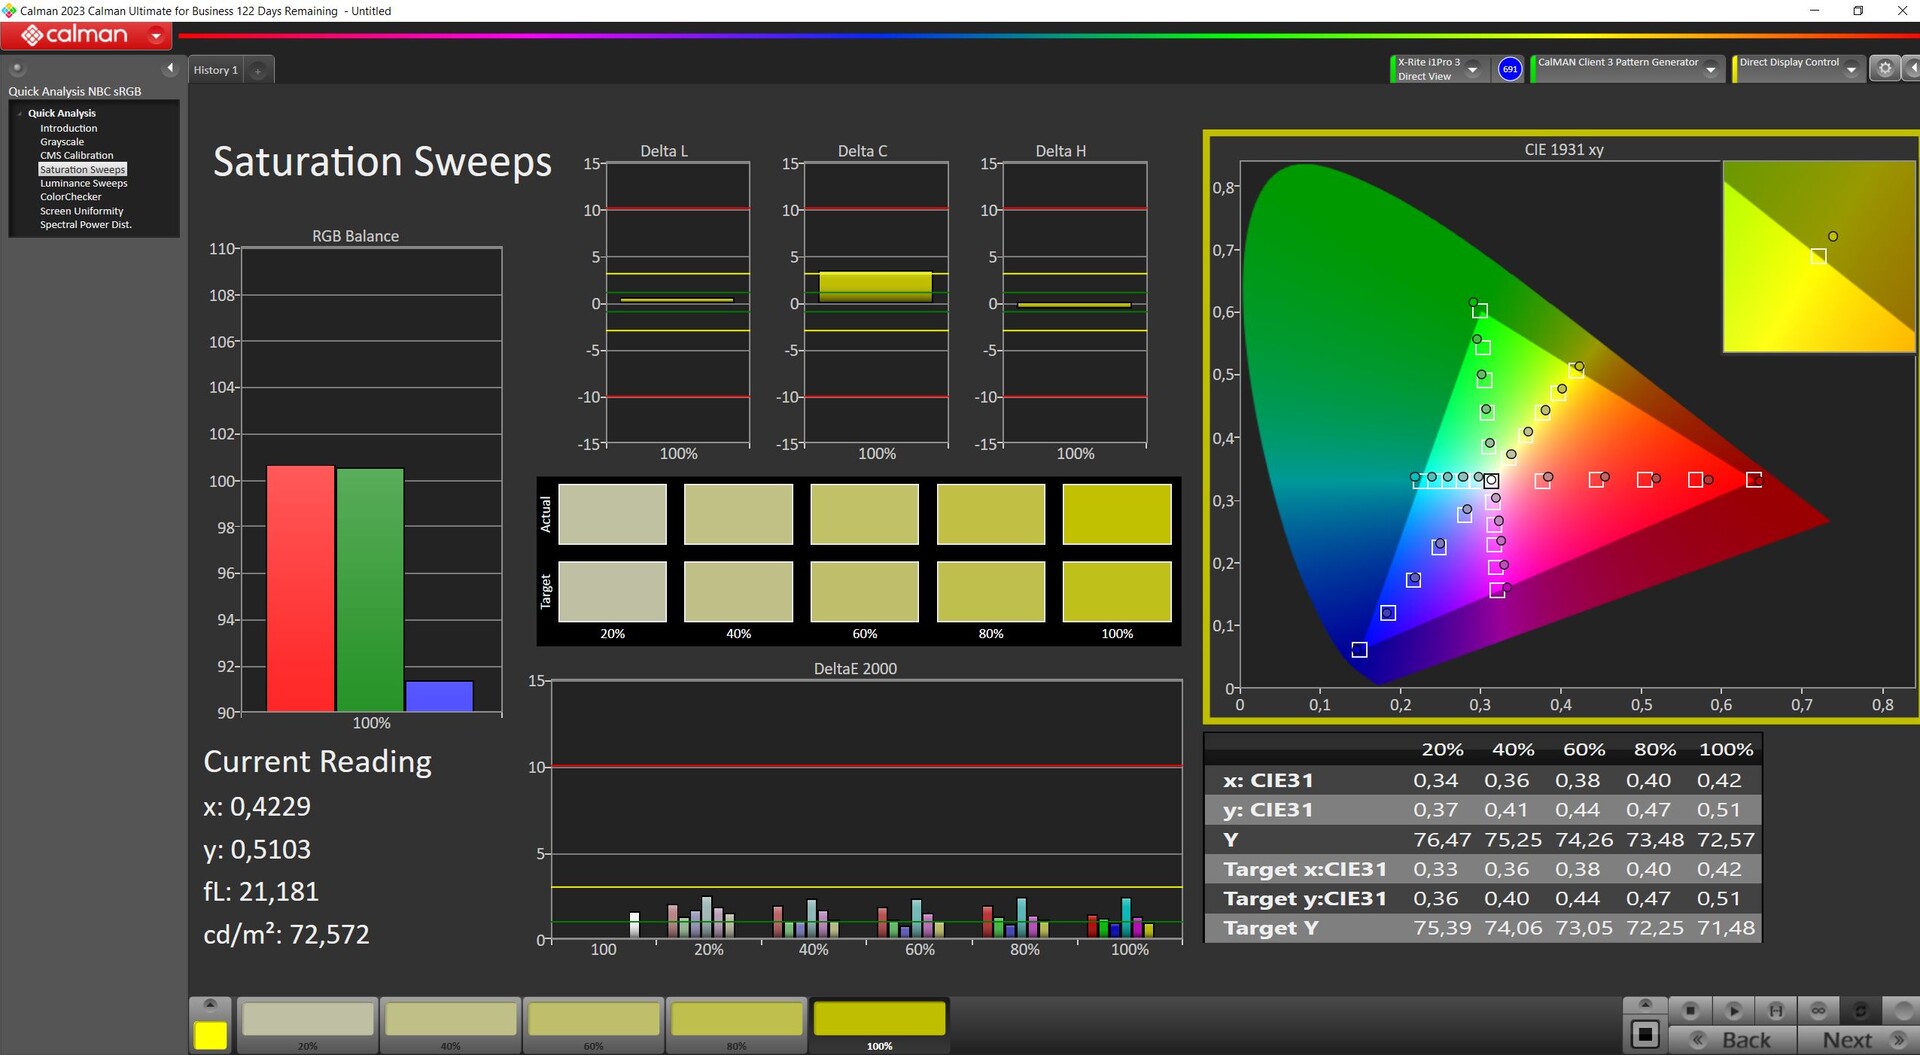
Copertura dello spazio colore
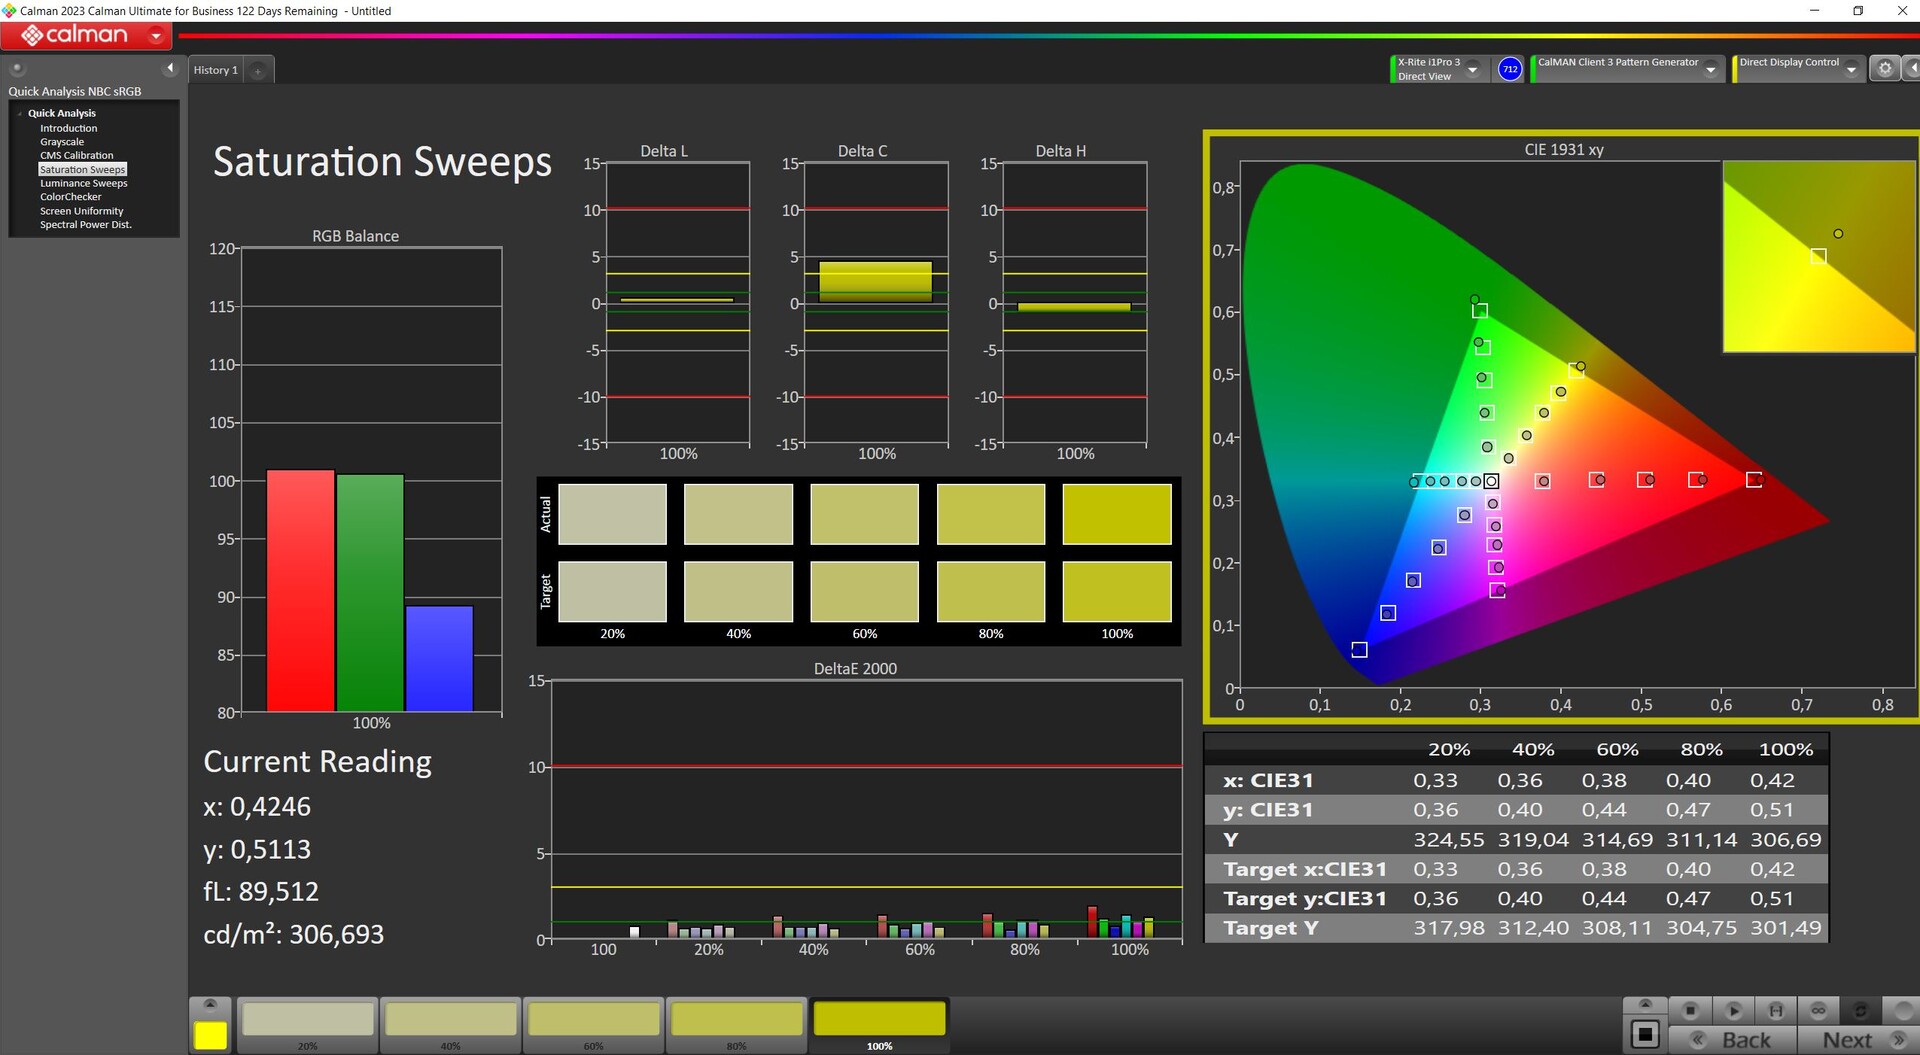
Come nel caso di Fusion 15, sRGB è completamente coperto, con P3 e AdobeRGB che si attestano intorno al 73-75 percento.
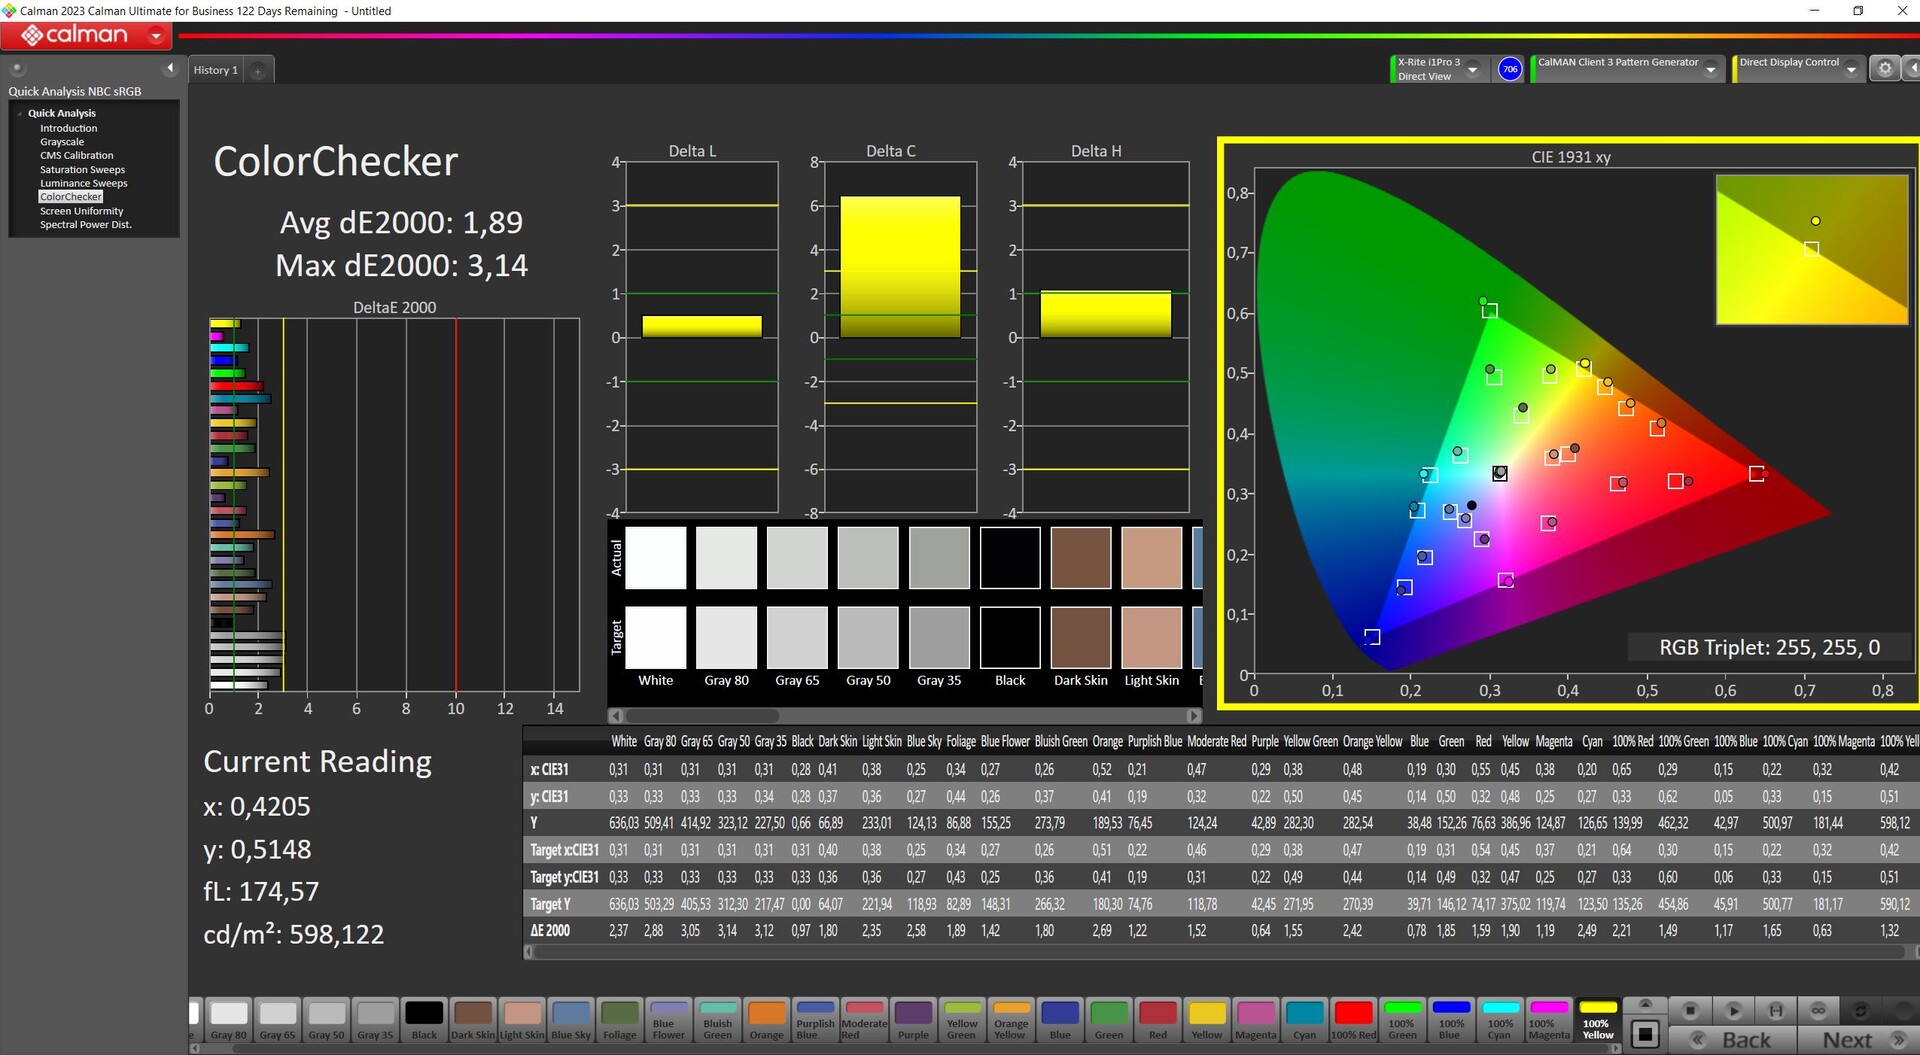
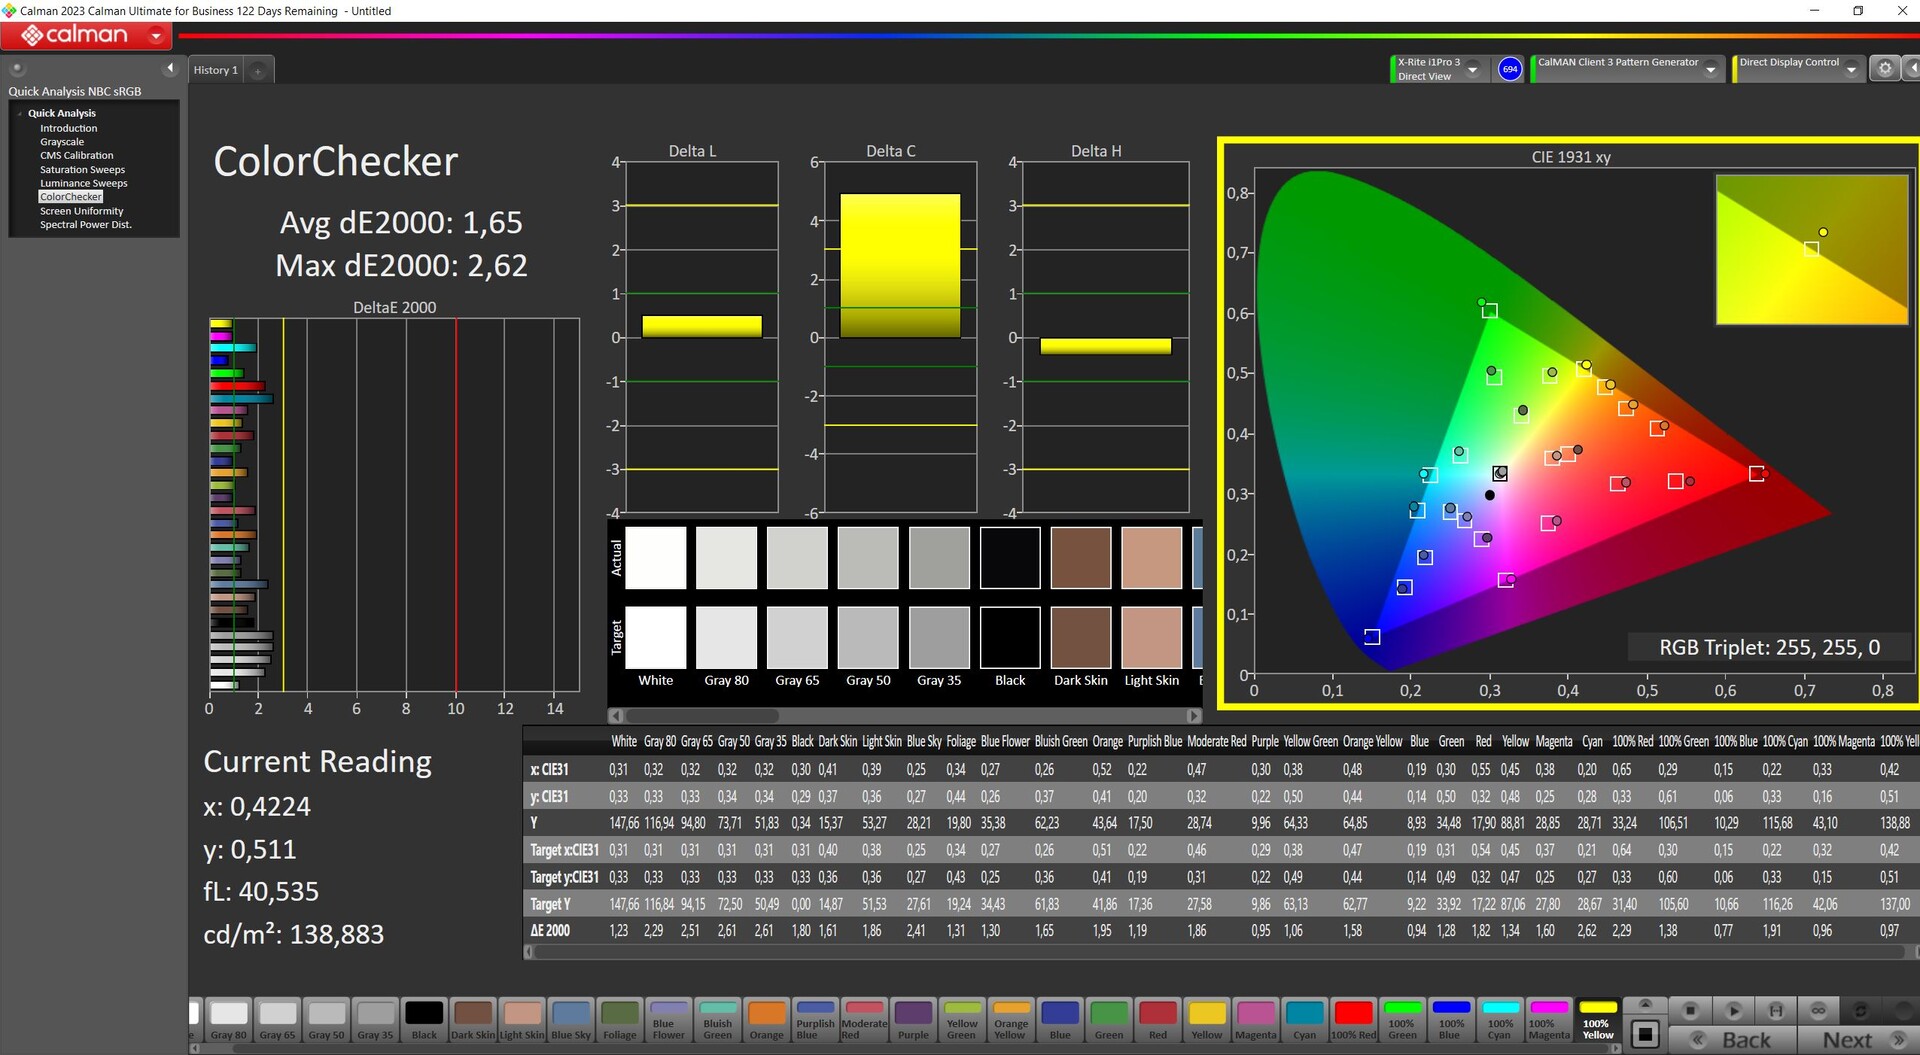
Precisione del colore
Fuori dalla scatola, il pannello è calibrato decentemente, con valori di DeltaE inferiori a 3. Tuttavia, il valore del nero è decisamente troppo alto. Tuttavia, il valore del nero è notevolmente troppo alto. Ridurre la luminosità a 150 nit non solo migliora la situazione, ma fa anche scendere leggermente i valori DeltaE.
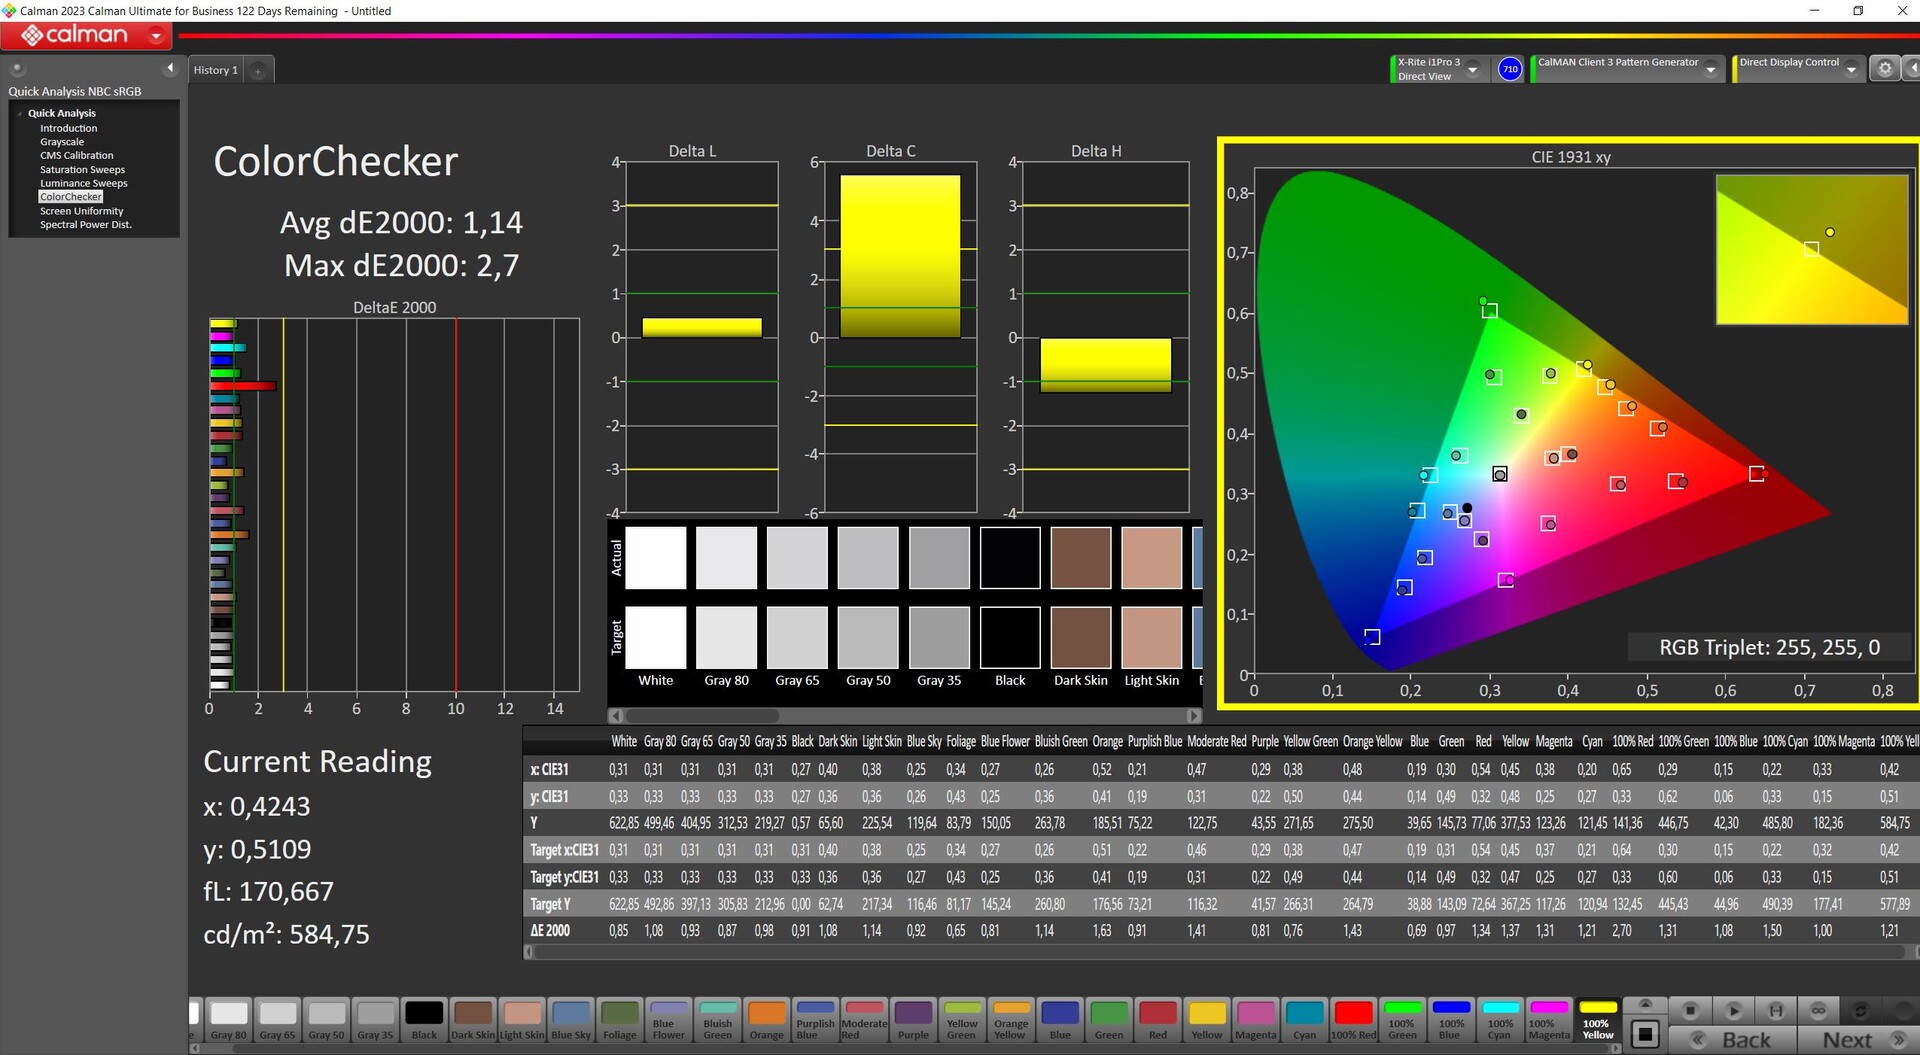
La calibrazione manuale alla luminosità massima nativa funziona a meraviglia, nonostante i valori già decenti, e riesce a minimizzare sensibilmente le deviazioni. Pertanto, il pannello può essere calibrato molto bene e questo porta a un'ottima precisione del colore, almeno in sRGB. Alla massima luminosità, il valore del nero continua ad essere troppo alto e questo fa sì che il contrasto ne risenta.

Tempi di risposta del Display
| ↔ Tempi di risposta dal Nero al Bianco | ||
|---|---|---|
| 9.2 ms ... aumenta ↗ e diminuisce ↘ combinato | ↗ 4.6 ms Incremento | 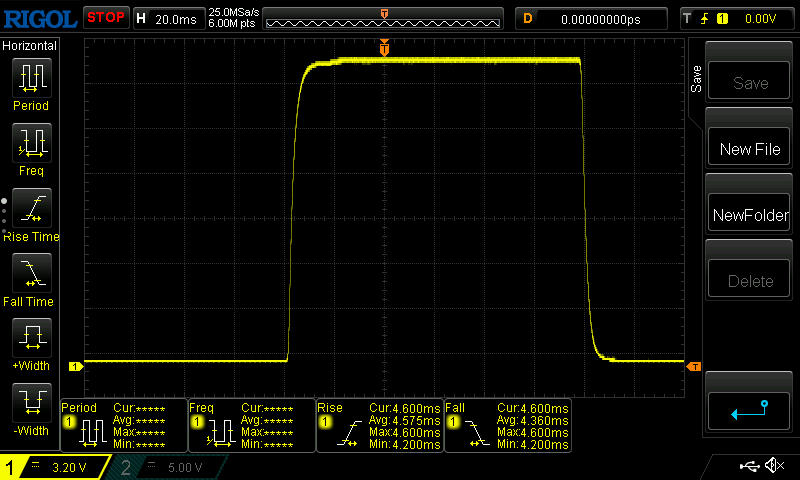 |
| ↘ 4.6 ms Calo | ||
| Lo schermo mostra veloci tempi di risposta durante i nostri tests e dovrebbe esere adatto al gaming In confronto, tutti i dispositivi di test variano da 0.1 (minimo) a 240 (massimo) ms. » 23 % di tutti i dispositivi è migliore. Questo significa che i tempi di risposta rilevati sono migliori rispettto alla media di tutti i dispositivi testati (20.8 ms). | ||
| ↔ Tempo di risposta dal 50% Grigio all'80% Grigio | ||
| 9.6 ms ... aumenta ↗ e diminuisce ↘ combinato | ↗ 4.6 ms Incremento | 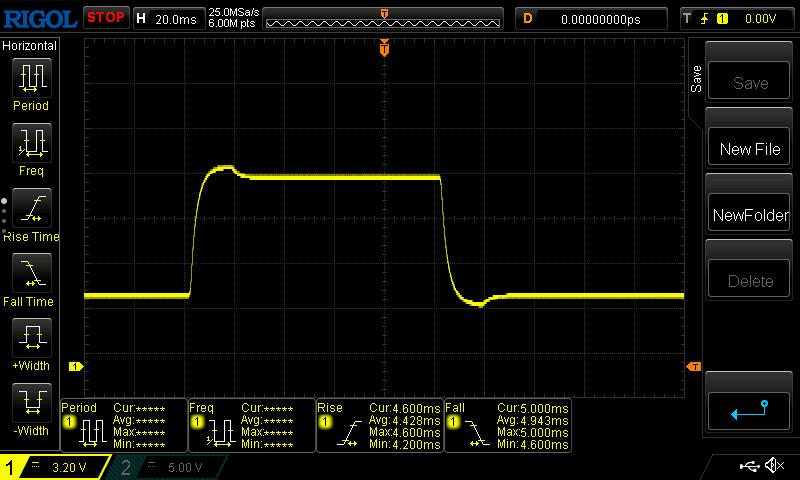 |
| ↘ 5 ms Calo | ||
| Lo schermo mostra veloci tempi di risposta durante i nostri tests e dovrebbe esere adatto al gaming In confronto, tutti i dispositivi di test variano da 0.165 (minimo) a 636 (massimo) ms. » 20 % di tutti i dispositivi è migliore. Questo significa che i tempi di risposta rilevati sono migliori rispettto alla media di tutti i dispositivi testati (32.5 ms). | ||
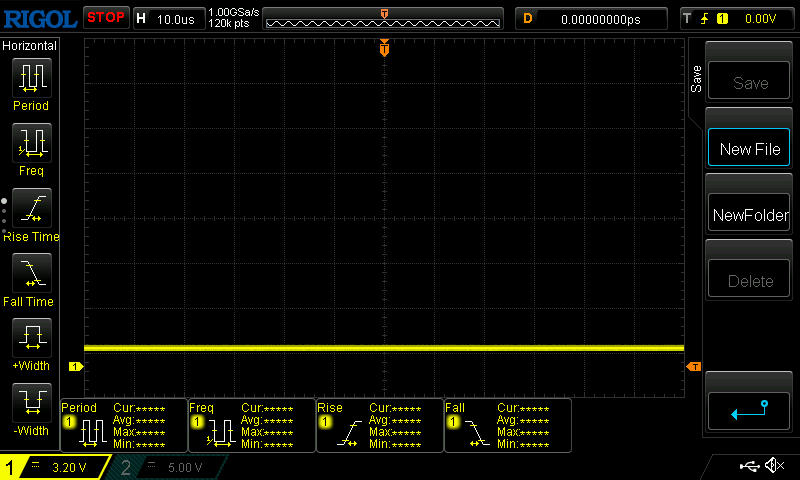
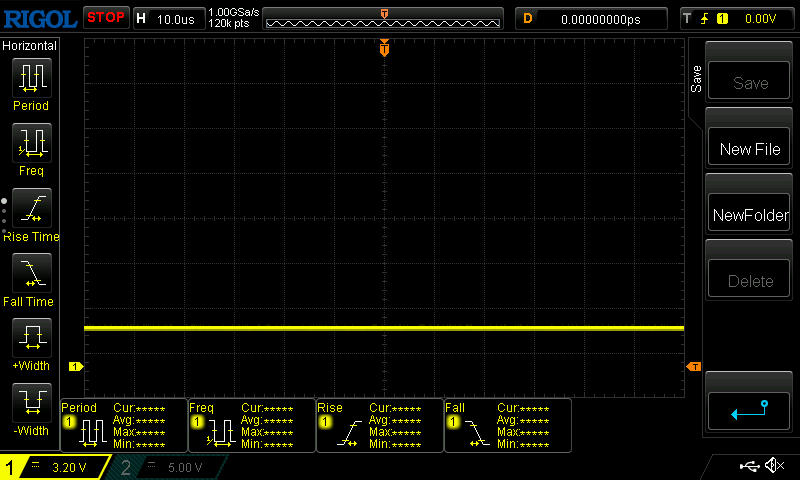
Sfarfallio dello schermo / PWM (Pulse-Width Modulation)
| flickering dello schermo / PWM non rilevato |  | ||
In confronto: 53 % di tutti i dispositivi testati non utilizza PWM per ridurre la luminosita' del display. Se è rilevato PWM, una media di 8516 (minimo: 5 - massimo: 343500) Hz è stata rilevata. | |||
L'elevata luminosità e il display opaco assicurano che non avrà molti problemi ad utilizzare il dispositivo all'ombra, con i contenuti che rimarranno altamente leggibili. Tuttavia, il contrasto potrebbe essere leggermente superiore e dovrebbe evitare la luce diretta del sole.

Prestazioni - 20 % più lento del Fusion con HX e RTX 4070
Con il Ryzen 7 8845HS, RTX 4060 e 32 GB di RAM, XMG Core 15 si posiziona come un laptop da gioco di livello medio ed è anche commercializzato come tale. Il suo case nero, relativamente sottile, elegante e completamente in alluminio conferisce al portatile un look sobrio che potrebbe anche renderlo interessante per i creatori di contenuti. Ciò rende ancora più deplorevole il fatto che Schenker non offra alcuna opzione di visualizzazione aggiuntiva, perché lo schermo ben calibrato può visualizzare "solo" sRGB. Questo potrebbe essere un criterio di rottura inutile per gli editor di foto e, soprattutto, di video. Ecco perché vorremmo vedere anche le opzioni DisplayP3 in futuro.

Condizioni del test
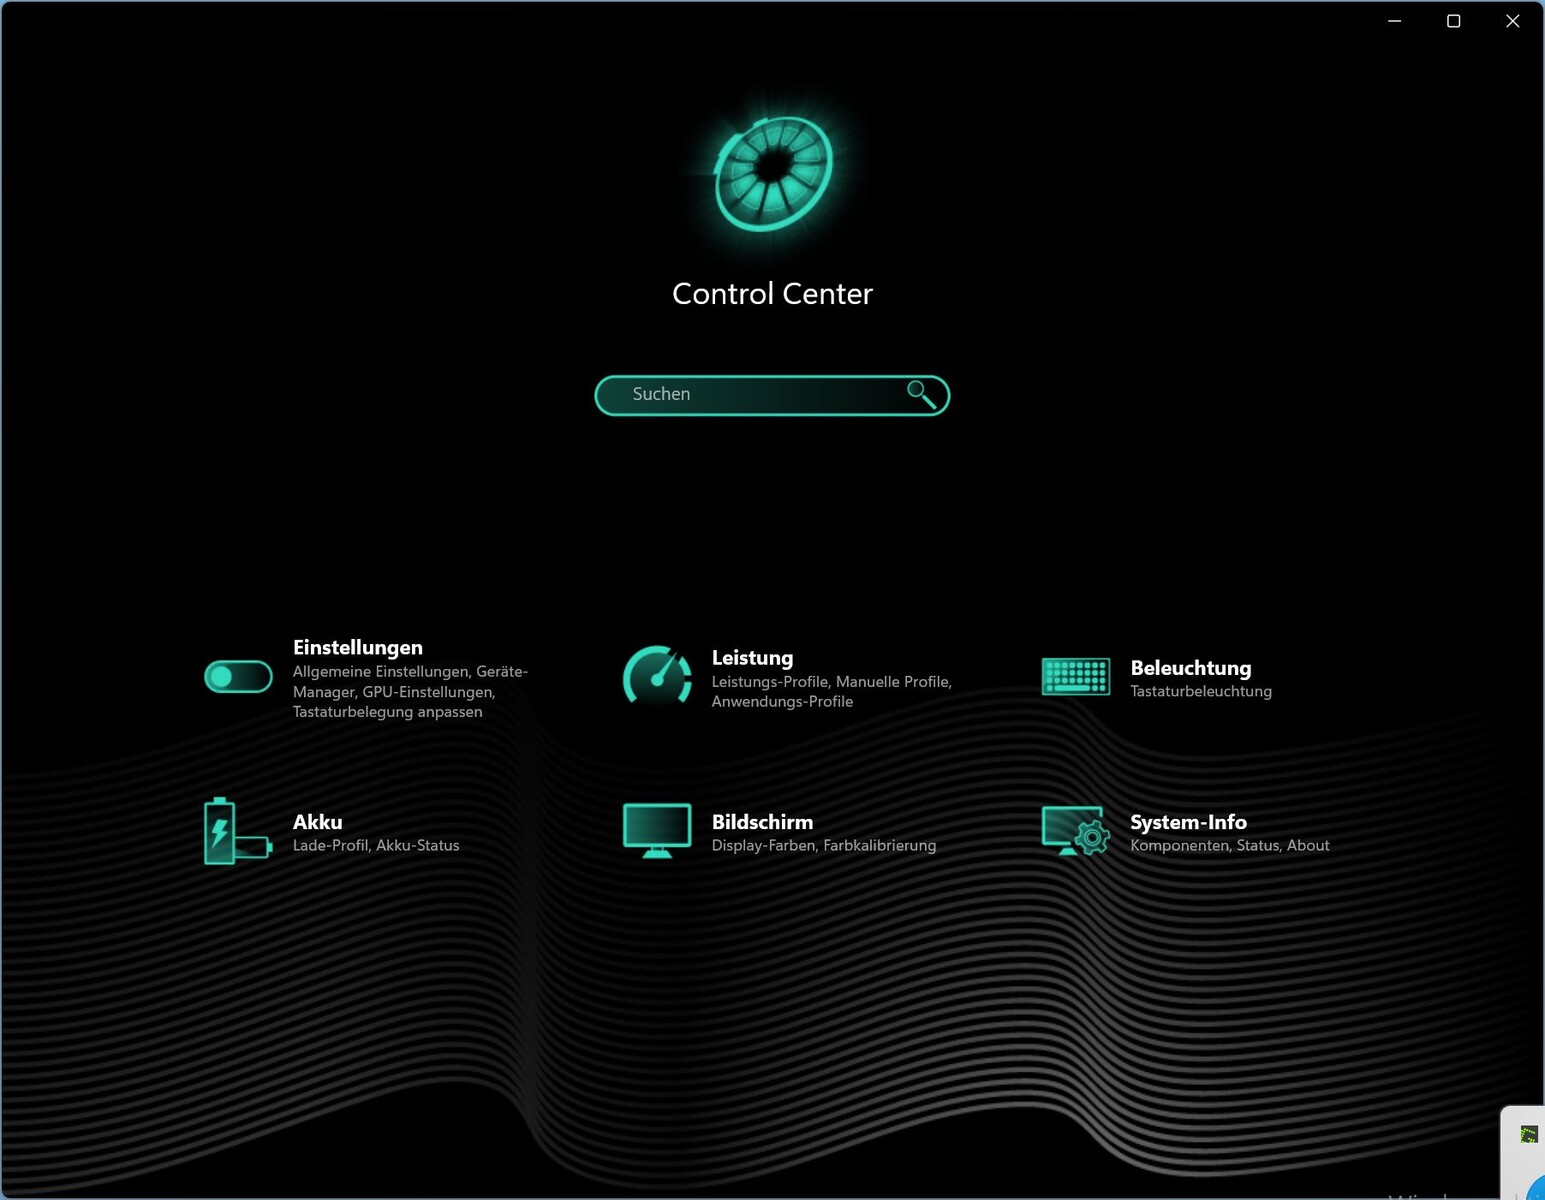
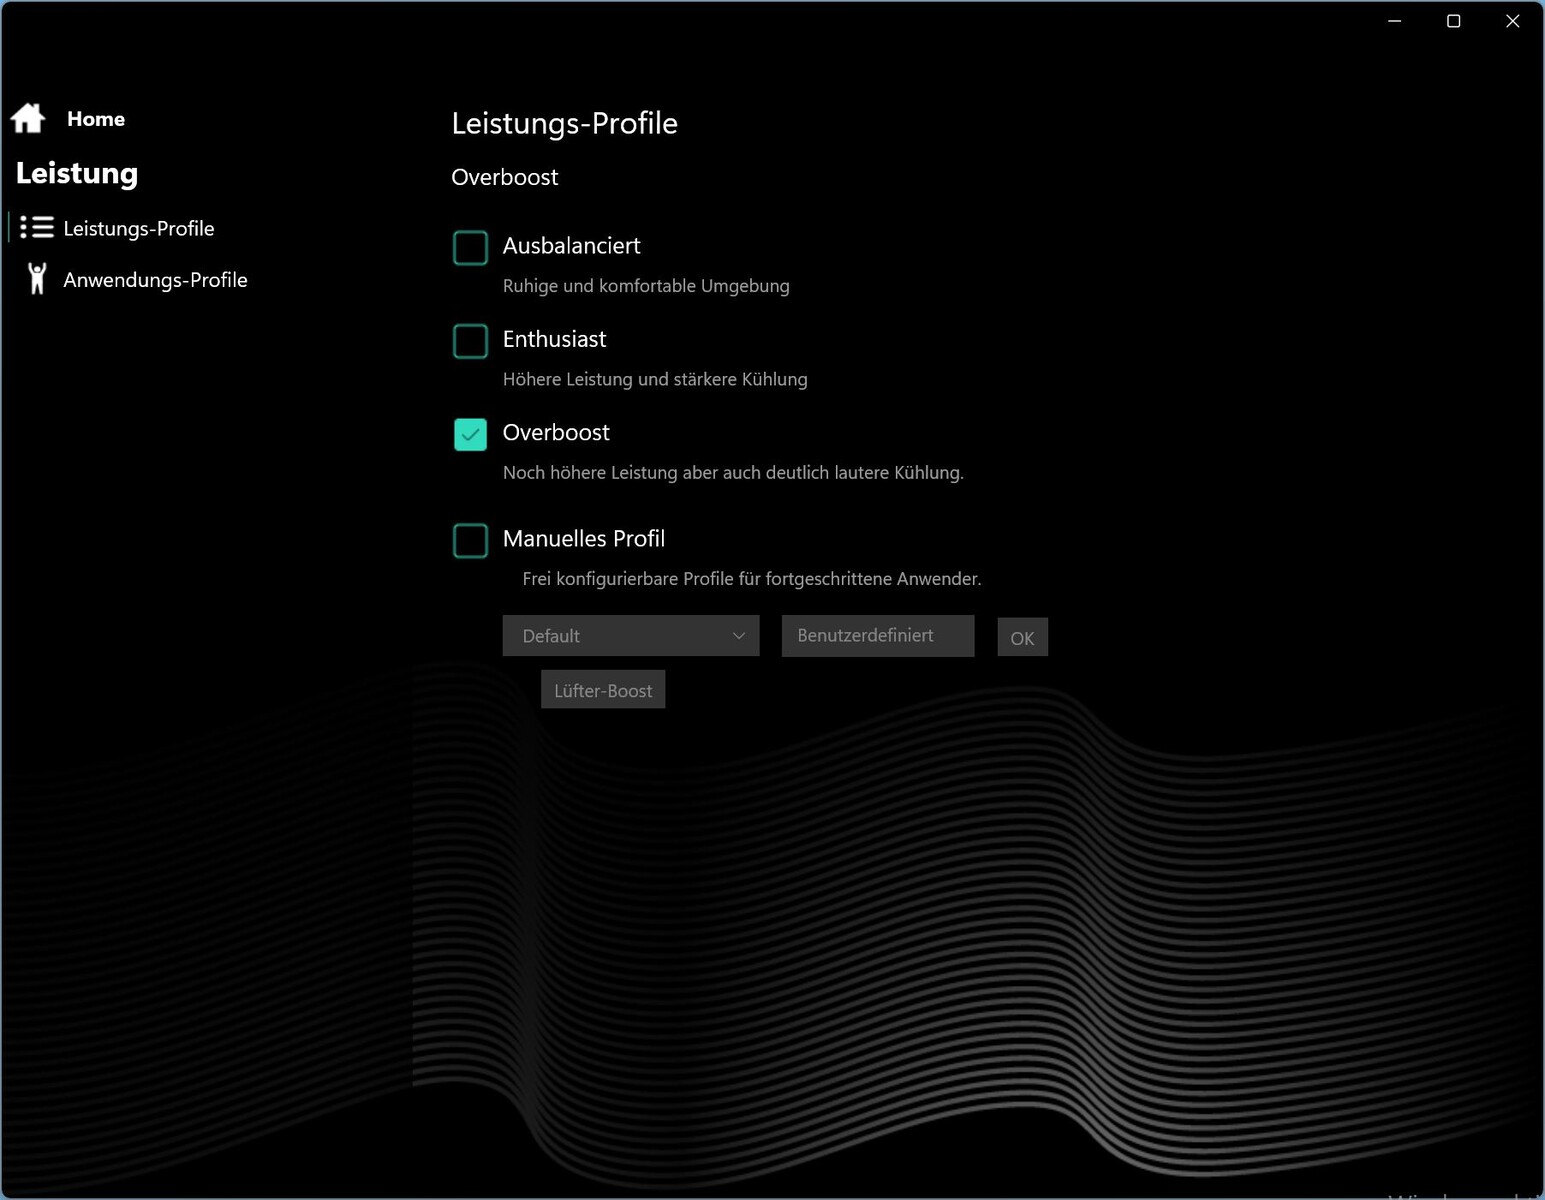
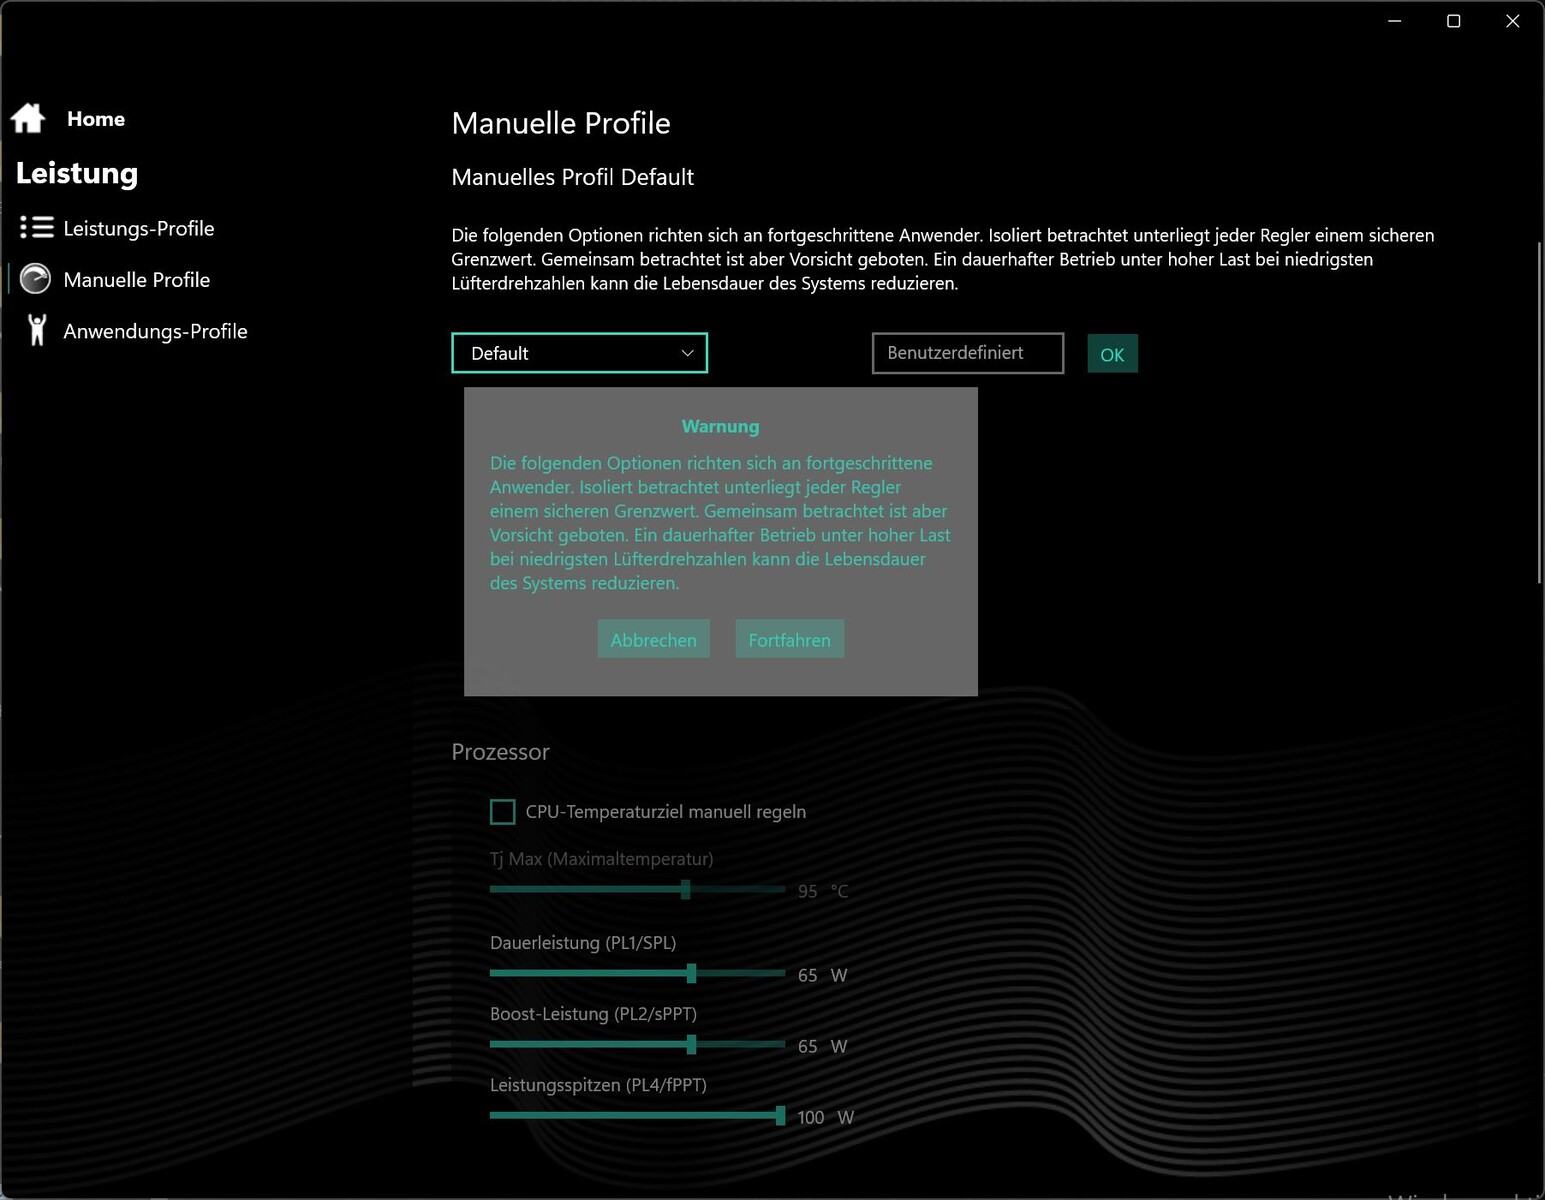
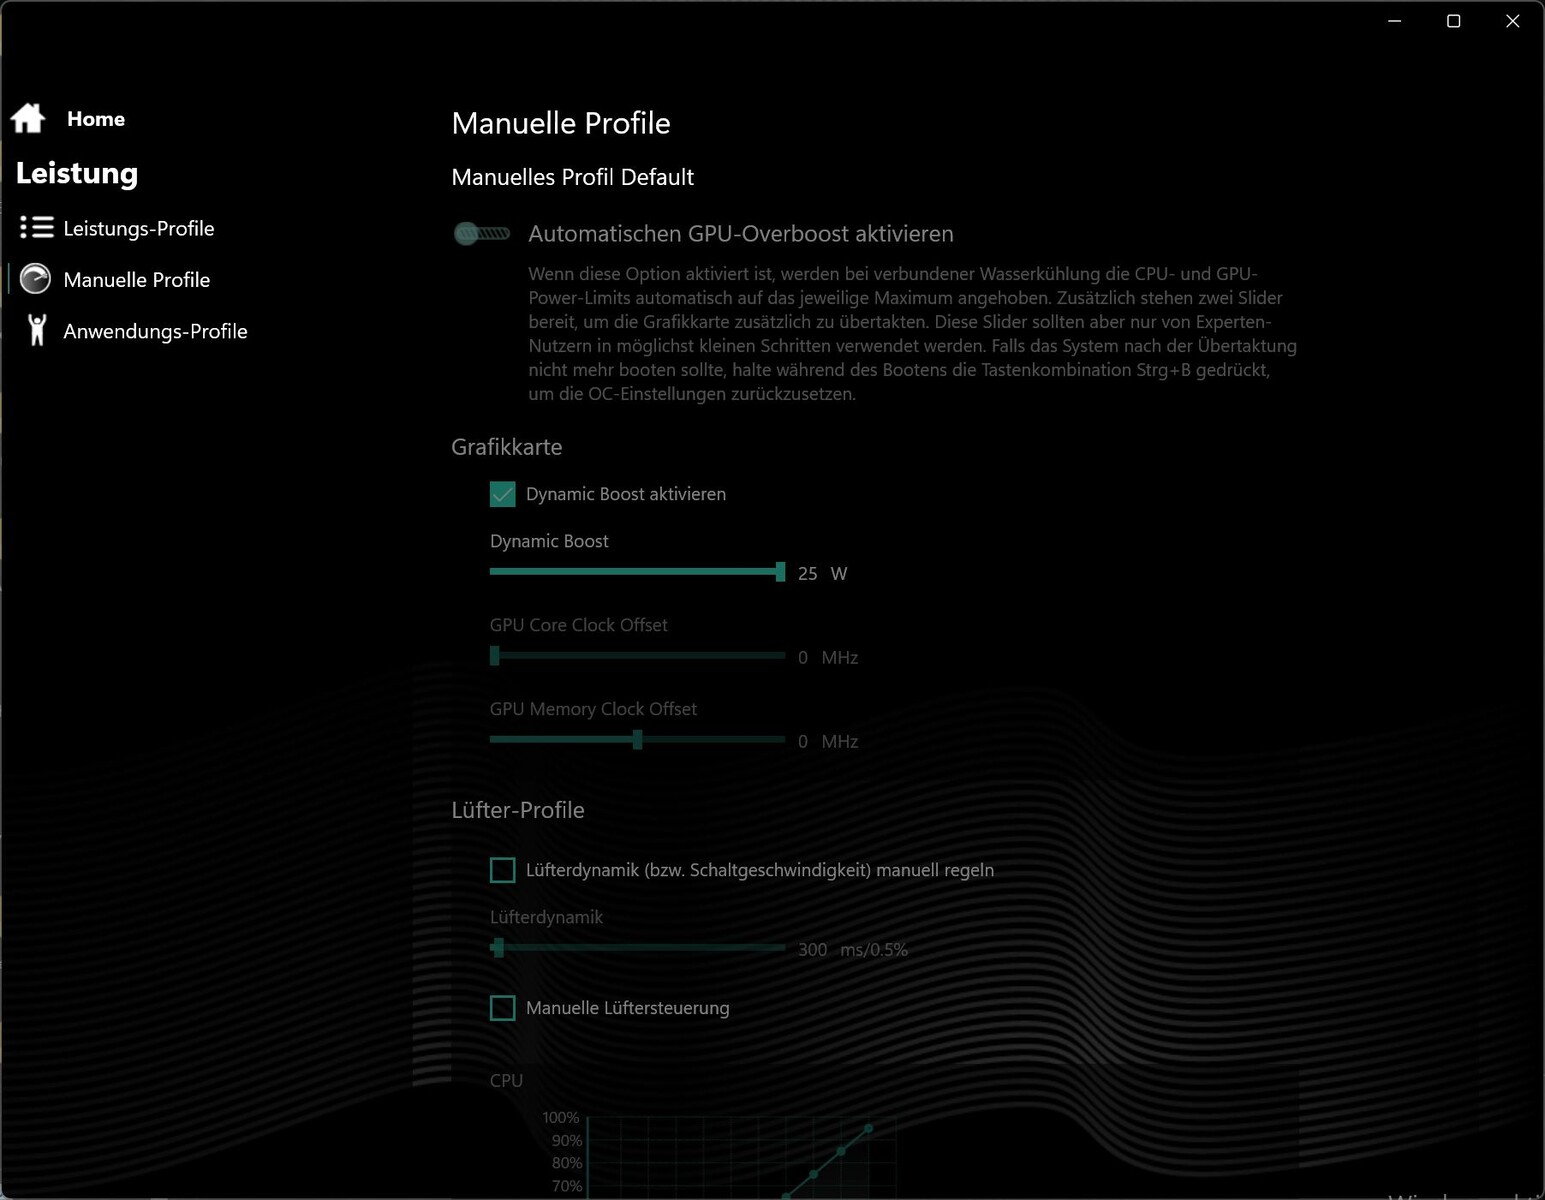
Nel Centro di controllo generico (Tulpar utilizza, ad esempio, lo stesso CC), vengono offerti 3 profili di prestazioni preimpostati (Balanced, Enthusiast, Overboost) e un profilo manuale. In quest'ultimo, è possibile attivare un boost della ventola e definire la temperatura target della CPU, le curve della ventola (e altro ancora). Nelle impostazioni generali tramite MUX, la GPU può essere commutata da ibrida a dGPU, il che richiede un riavvio.
Per i nostri benchmark sulle prestazioni, abbiamo scelto la modalità Overboost e, nel test della batteria, abbiamo usato Balanced. Presentiamo anche i valori delle prestazioni relativi alle altre modalità.
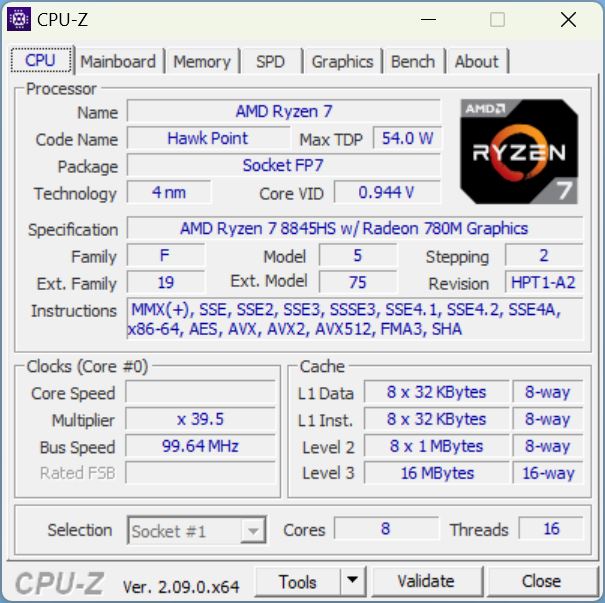
Processore
Tutte le SKU Core 15 sono dotate dello stesso processore. Il AMD Ryzen 7 8845HS è la seconda CPU più veloce della serie Hawk Point con architettura Zen 4. Ha 8 core e hyperthreading, il che significa che può elaborare 16 thread contemporaneamente. Ha 8 core e hyperthreading, il che significa che può elaborare 16 thread contemporaneamente. I core hanno una velocità di clock di base di 3,8 GHz e possono essere overcloccati individualmente fino a 5,1 GHz.
Nel test continuo Cinebench R15, il nostro AMD Core 15 si è comportato in modo molto costante, ma soprattutto a un livello leggermente inferiore ai computer portatili dotati di una CPU Intel Gen14 HX. Questo non è davvero sorprendente, perché la CPU AMD assorbe solo brevemente un massimo di 90 W e 80 W per un periodo più lungo. Con la CPU Intel nel Fusion 15, questi valori sono 140 W e 105 W. Solo il Dell G16 scende al di sotto del livello di prestazioni costante del Ryzen 7 visto nel Core, dopo una migliore prestazione iniziale.
In tutti i test della CPU, il nostro Ryzen 7 è completamente in linea con gli obiettivi. Purtroppo, però, il nostro Core si piazza nuovamente all'ultimo posto, poiché i suoi concorrenti Intel HX sono semplicemente un po' più potenti. Tuttavia, il divario rispetto al Dell G16 o all'HP Victus 16 è davvero minimo. Il Legion 5i o il Fusion 15 alimentato da Intel godono di un vantaggio significativo.
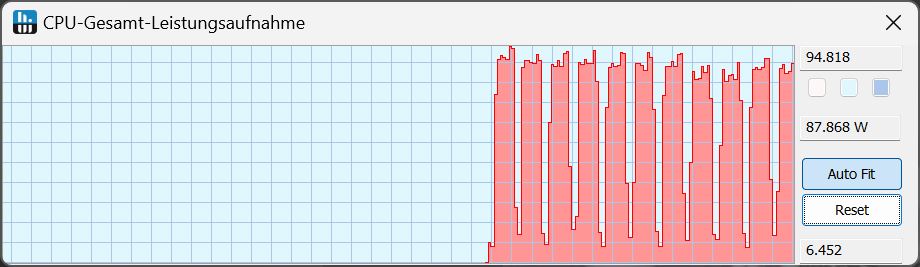
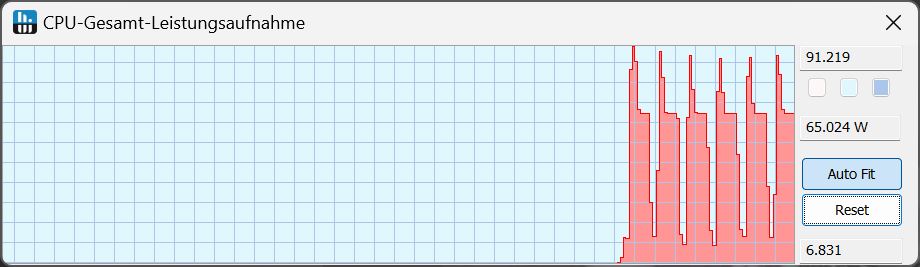
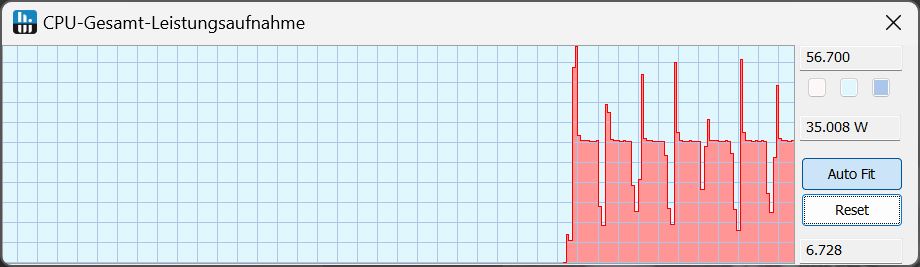
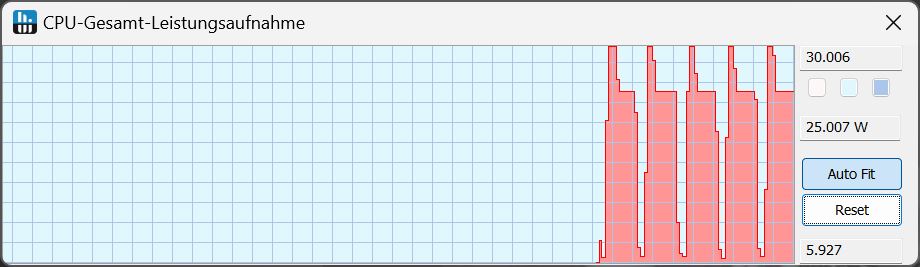
Lontano dal muro, c'è un calo delle prestazioni di circa il 35% nel test multi-core Cinebench R15.
| Profilo delle prestazioni/valore misurato | Punteggio Cinebench R15 nella prima esecuzione | Consumo di potenza della CPU in W |
|---|---|---|
| Overboost | 2.908 | continuamente 80 - 94 |
| Enthusiast | 2.749 | breve 90, poi 65 |
| Bilanciato | 2.277 | brevemente 59, poi 35 |
| Batteria | 1.909 | brevemente 30, poi 25 |
Cinebench R15 Multi Continuous Test
Cinebench R23: Multi Core | Single Core
Cinebench R20: CPU (Multi Core) | CPU (Single Core)
Cinebench R15: CPU Multi 64Bit | CPU Single 64Bit
Blender: v2.79 BMW27 CPU
7-Zip 18.03: 7z b 4 | 7z b 4 -mmt1
Geekbench 6.4: Multi-Core | Single-Core
Geekbench 5.5: Multi-Core | Single-Core
HWBOT x265 Benchmark v2.2: 4k Preset
LibreOffice : 20 Documents To PDF
R Benchmark 2.5: Overall mean
| CPU Performance Rating | |
| SCHENKER XMG Fusion 15 (Early 24) | |
| Lenovo Legion 5 16IRX G9 | |
| SCHENKER XMG Pro 15 (E23) -2! | |
| Media della classe Gaming | |
| HP Victus 16 (2024) | |
| Dell G16, i7-13650HX, RTX 4060 | |
| SCHENKER XMG Core 15 (M24) | |
| Media AMD Ryzen 7 8845HS | |
| Cinebench R23 / Multi Core | |
| SCHENKER XMG Pro 15 (E23) | |
| Lenovo Legion 5 16IRX G9 | |
| HP Victus 16 (2024) | |
| SCHENKER XMG Fusion 15 (Early 24) | |
| Media della classe Gaming (5668 - 39652, n=151, ultimi 2 anni) | |
| Dell G16, i7-13650HX, RTX 4060 | |
| SCHENKER XMG Core 15 (M24) | |
| Media AMD Ryzen 7 8845HS (14895 - 18037, n=12) | |
| Cinebench R23 / Single Core | |
| SCHENKER XMG Fusion 15 (Early 24) | |
| Lenovo Legion 5 16IRX G9 | |
| Dell G16, i7-13650HX, RTX 4060 | |
| Media della classe Gaming (1136 - 2252, n=151, ultimi 2 anni) | |
| SCHENKER XMG Pro 15 (E23) | |
| SCHENKER XMG Core 15 (M24) | |
| Media AMD Ryzen 7 8845HS (1623 - 1783, n=12) | |
| HP Victus 16 (2024) | |
| Cinebench R20 / CPU (Multi Core) | |
| Lenovo Legion 5 16IRX G9 | |
| SCHENKER XMG Pro 15 (E23) | |
| HP Victus 16 (2024) | |
| SCHENKER XMG Fusion 15 (Early 24) | |
| Media della classe Gaming (2179 - 15517, n=151, ultimi 2 anni) | |
| Dell G16, i7-13650HX, RTX 4060 | |
| SCHENKER XMG Core 15 (M24) | |
| Media AMD Ryzen 7 8845HS (5808 - 7026, n=12) | |
| Cinebench R20 / CPU (Single Core) | |
| SCHENKER XMG Fusion 15 (Early 24) | |
| Lenovo Legion 5 16IRX G9 | |
| Media della classe Gaming (439 - 866, n=151, ultimi 2 anni) | |
| SCHENKER XMG Pro 15 (E23) | |
| Dell G16, i7-13650HX, RTX 4060 | |
| SCHENKER XMG Core 15 (M24) | |
| Media AMD Ryzen 7 8845HS (673 - 698, n=12) | |
| HP Victus 16 (2024) | |
| Cinebench R15 / CPU Multi 64Bit | |
| SCHENKER XMG Pro 15 (E23) | |
| HP Victus 16 (2024) | |
| Lenovo Legion 5 16IRX G9 | |
| SCHENKER XMG Fusion 15 (Early 24) | |
| Media della classe Gaming (905 - 6074, n=154, ultimi 2 anni) | |
| Dell G16, i7-13650HX, RTX 4060 | |
| SCHENKER XMG Core 15 (M24) | |
| Media AMD Ryzen 7 8845HS (2342 - 2908, n=12) | |
| Cinebench R15 / CPU Single 64Bit | |
| Lenovo Legion 5 16IRX G9 | |
| SCHENKER XMG Fusion 15 (Early 24) | |
| SCHENKER XMG Core 15 (M24) | |
| Media della classe Gaming (191.9 - 343, n=151, ultimi 2 anni) | |
| Media AMD Ryzen 7 8845HS (269 - 283, n=12) | |
| Dell G16, i7-13650HX, RTX 4060 | |
| SCHENKER XMG Pro 15 (E23) | |
| HP Victus 16 (2024) | |
| Blender / v2.79 BMW27 CPU | |
| Media AMD Ryzen 7 8845HS (179 - 216, n=12) | |
| SCHENKER XMG Core 15 (M24) | |
| Media della classe Gaming (81 - 555, n=144, ultimi 2 anni) | |
| HP Victus 16 (2024) | |
| Dell G16, i7-13650HX, RTX 4060 | |
| SCHENKER XMG Pro 15 (E23) | |
| Lenovo Legion 5 16IRX G9 | |
| SCHENKER XMG Fusion 15 (Early 24) | |
| 7-Zip 18.03 / 7z b 4 | |
| SCHENKER XMG Fusion 15 (Early 24) | |
| Lenovo Legion 5 16IRX G9 | |
| SCHENKER XMG Pro 15 (E23) | |
| HP Victus 16 (2024) | |
| Media della classe Gaming (23795 - 144064, n=149, ultimi 2 anni) | |
| Dell G16, i7-13650HX, RTX 4060 | |
| SCHENKER XMG Core 15 (M24) | |
| Media AMD Ryzen 7 8845HS (62669 - 74664, n=12) | |
| 7-Zip 18.03 / 7z b 4 -mmt1 | |
| SCHENKER XMG Fusion 15 (Early 24) | |
| Lenovo Legion 5 16IRX G9 | |
| SCHENKER XMG Core 15 (M24) | |
| SCHENKER XMG Pro 15 (E23) | |
| Media AMD Ryzen 7 8845HS (5197 - 6714, n=12) | |
| Media della classe Gaming (4199 - 7573, n=149, ultimi 2 anni) | |
| Dell G16, i7-13650HX, RTX 4060 | |
| HP Victus 16 (2024) | |
| Geekbench 6.4 / Multi-Core | |
| SCHENKER XMG Fusion 15 (Early 24) | |
| Lenovo Legion 5 16IRX G9 | |
| HP Victus 16 (2024) | |
| Media della classe Gaming (5340 - 21668, n=119, ultimi 2 anni) | |
| SCHENKER XMG Core 15 (M24) | |
| Dell G16, i7-13650HX, RTX 4060 | |
| Media AMD Ryzen 7 8845HS (11073 - 14014, n=16) | |
| Geekbench 6.4 / Single-Core | |
| SCHENKER XMG Fusion 15 (Early 24) | |
| Lenovo Legion 5 16IRX G9 | |
| SCHENKER XMG Core 15 (M24) | |
| Media della classe Gaming (1490 - 3219, n=119, ultimi 2 anni) | |
| Media AMD Ryzen 7 8845HS (2510 - 2698, n=14) | |
| Dell G16, i7-13650HX, RTX 4060 | |
| HP Victus 16 (2024) | |
| Geekbench 5.5 / Multi-Core | |
| SCHENKER XMG Pro 15 (E23) | |
| SCHENKER XMG Fusion 15 (Early 24) | |
| Lenovo Legion 5 16IRX G9 | |
| HP Victus 16 (2024) | |
| Media della classe Gaming (4557 - 25855, n=148, ultimi 2 anni) | |
| SCHENKER XMG Core 15 (M24) | |
| Dell G16, i7-13650HX, RTX 4060 | |
| Media AMD Ryzen 7 8845HS (11256 - 12726, n=13) | |
| Geekbench 5.5 / Single-Core | |
| SCHENKER XMG Fusion 15 (Early 24) | |
| SCHENKER XMG Core 15 (M24) | |
| Lenovo Legion 5 16IRX G9 | |
| Media AMD Ryzen 7 8845HS (1765 - 2004, n=13) | |
| Media della classe Gaming (986 - 2423, n=148, ultimi 2 anni) | |
| Dell G16, i7-13650HX, RTX 4060 | |
| SCHENKER XMG Pro 15 (E23) | |
| HP Victus 16 (2024) | |
| HWBOT x265 Benchmark v2.2 / 4k Preset | |
| Lenovo Legion 5 16IRX G9 | |
| SCHENKER XMG Fusion 15 (Early 24) | |
| SCHENKER XMG Pro 15 (E23) | |
| Media della classe Gaming (6.72 - 42.9, n=148, ultimi 2 anni) | |
| SCHENKER XMG Core 15 (M24) | |
| HP Victus 16 (2024) | |
| Dell G16, i7-13650HX, RTX 4060 | |
| Media AMD Ryzen 7 8845HS (18.6 - 22.7, n=12) | |
| LibreOffice / 20 Documents To PDF | |
| HP Victus 16 (2024) | |
| Dell G16, i7-13650HX, RTX 4060 | |
| SCHENKER XMG Pro 15 (E23) | |
| Media AMD Ryzen 7 8845HS (44.4 - 77, n=12) | |
| SCHENKER XMG Core 15 (M24) | |
| Media della classe Gaming (19 - 96.6, n=147, ultimi 2 anni) | |
| Lenovo Legion 5 16IRX G9 | |
| SCHENKER XMG Fusion 15 (Early 24) | |
| R Benchmark 2.5 / Overall mean | |
| HP Victus 16 (2024) | |
| SCHENKER XMG Pro 15 (E23) | |
| Media AMD Ryzen 7 8845HS (0.4304 - 0.4935, n=12) | |
| Media della classe Gaming (0.3609 - 0.759, n=150, ultimi 2 anni) | |
| SCHENKER XMG Core 15 (M24) | |
| Dell G16, i7-13650HX, RTX 4060 | |
| Dell G16, i7-13650HX, RTX 4060 | |
| Lenovo Legion 5 16IRX G9 | |
| SCHENKER XMG Fusion 15 (Early 24) | |
* ... Meglio usare valori piccoli
AIDA64: FP32 Ray-Trace | FPU Julia | CPU SHA3 | CPU Queen | FPU SinJulia | FPU Mandel | CPU AES | CPU ZLib | FP64 Ray-Trace | CPU PhotoWorxx
| Performance Rating | |
| SCHENKER XMG Fusion 15 (Early 24) | |
| SCHENKER XMG Core 15 (M24) | |
| Media AMD Ryzen 7 8845HS | |
| Media della classe Gaming | |
| SCHENKER XMG Pro 15 (E23) | |
| Lenovo Legion 5 16IRX G9 | |
| Dell G16, i7-13650HX, RTX 4060 | |
| HP Victus 16 (2024) | |
| AIDA64 / FP32 Ray-Trace | |
| SCHENKER XMG Core 15 (M24) | |
| Media AMD Ryzen 7 8845HS (23708 - 29544, n=12) | |
| Media della classe Gaming (4986 - 81639, n=147, ultimi 2 anni) | |
| SCHENKER XMG Fusion 15 (Early 24) | |
| Lenovo Legion 5 16IRX G9 | |
| Dell G16, i7-13650HX, RTX 4060 | |
| SCHENKER XMG Pro 15 (E23) | |
| HP Victus 16 (2024) | |
| AIDA64 / FPU Julia | |
| SCHENKER XMG Core 15 (M24) | |
| Media AMD Ryzen 7 8845HS (99659 - 125873, n=12) | |
| Media della classe Gaming (25360 - 252486, n=147, ultimi 2 anni) | |
| SCHENKER XMG Fusion 15 (Early 24) | |
| SCHENKER XMG Pro 15 (E23) | |
| Lenovo Legion 5 16IRX G9 | |
| Dell G16, i7-13650HX, RTX 4060 | |
| HP Victus 16 (2024) | |
| AIDA64 / CPU SHA3 | |
| SCHENKER XMG Fusion 15 (Early 24) | |
| SCHENKER XMG Core 15 (M24) | |
| Media della classe Gaming (1339 - 10389, n=147, ultimi 2 anni) | |
| SCHENKER XMG Pro 15 (E23) | |
| Media AMD Ryzen 7 8845HS (4332 - 5180, n=12) | |
| Dell G16, i7-13650HX, RTX 4060 | |
| Lenovo Legion 5 16IRX G9 | |
| HP Victus 16 (2024) | |
| AIDA64 / CPU Queen | |
| SCHENKER XMG Pro 15 (E23) | |
| SCHENKER XMG Fusion 15 (Early 24) | |
| HP Victus 16 (2024) | |
| SCHENKER XMG Core 15 (M24) | |
| Media AMD Ryzen 7 8845HS (109458 - 124695, n=12) | |
| Media della classe Gaming (50699 - 200651, n=147, ultimi 2 anni) | |
| Dell G16, i7-13650HX, RTX 4060 | |
| Lenovo Legion 5 16IRX G9 | |
| AIDA64 / FPU SinJulia | |
| SCHENKER XMG Core 15 (M24) | |
| Media AMD Ryzen 7 8845HS (14062 - 15519, n=12) | |
| SCHENKER XMG Fusion 15 (Early 24) | |
| Media della classe Gaming (4800 - 32988, n=147, ultimi 2 anni) | |
| SCHENKER XMG Pro 15 (E23) | |
| Lenovo Legion 5 16IRX G9 | |
| HP Victus 16 (2024) | |
| Dell G16, i7-13650HX, RTX 4060 | |
| AIDA64 / FPU Mandel | |
| SCHENKER XMG Core 15 (M24) | |
| Media AMD Ryzen 7 8845HS (53436 - 67367, n=12) | |
| Media della classe Gaming (12321 - 134044, n=147, ultimi 2 anni) | |
| SCHENKER XMG Fusion 15 (Early 24) | |
| Lenovo Legion 5 16IRX G9 | |
| Dell G16, i7-13650HX, RTX 4060 | |
| SCHENKER XMG Pro 15 (E23) | |
| HP Victus 16 (2024) | |
| AIDA64 / CPU AES | |
| SCHENKER XMG Fusion 15 (Early 24) | |
| Media della classe Gaming (19065 - 328679, n=147, ultimi 2 anni) | |
| Media AMD Ryzen 7 8845HS (64515 - 172642, n=12) | |
| SCHENKER XMG Pro 15 (E23) | |
| SCHENKER XMG Core 15 (M24) | |
| Lenovo Legion 5 16IRX G9 | |
| Dell G16, i7-13650HX, RTX 4060 | |
| HP Victus 16 (2024) | |
| AIDA64 / CPU ZLib | |
| SCHENKER XMG Fusion 15 (Early 24) | |
| SCHENKER XMG Pro 15 (E23) | |
| Media della classe Gaming (373 - 2531, n=147, ultimi 2 anni) | |
| Lenovo Legion 5 16IRX G9 | |
| Dell G16, i7-13650HX, RTX 4060 | |
| HP Victus 16 (2024) | |
| Media AMD Ryzen 7 8845HS (627 - 1080, n=12) | |
| SCHENKER XMG Core 15 (M24) | |
| AIDA64 / FP64 Ray-Trace | |
| SCHENKER XMG Core 15 (M24) | |
| Media AMD Ryzen 7 8845HS (12361 - 15911, n=12) | |
| Media della classe Gaming (2540 - 43430, n=147, ultimi 2 anni) | |
| SCHENKER XMG Fusion 15 (Early 24) | |
| Dell G16, i7-13650HX, RTX 4060 | |
| Lenovo Legion 5 16IRX G9 | |
| SCHENKER XMG Pro 15 (E23) | |
| HP Victus 16 (2024) | |
| AIDA64 / CPU PhotoWorxx | |
| SCHENKER XMG Pro 15 (E23) | |
| SCHENKER XMG Fusion 15 (Early 24) | |
| SCHENKER XMG Core 15 (M24) | |
| Media della classe Gaming (10805 - 60161, n=147, ultimi 2 anni) | |
| HP Victus 16 (2024) | |
| Media AMD Ryzen 7 8845HS (33192 - 41668, n=12) | |
| Dell G16, i7-13650HX, RTX 4060 | |
| Lenovo Legion 5 16IRX G9 | |
Prestazioni del sistema
Mentre il nostro sistema di recensione rimane un po' indietro per quanto riguarda il punteggio della CPU pura, è in testa alla concorrenza di HX in PCMark 10. Per quanto riguarda gli aspetti essenziali, il punteggio si colloca a metà del gruppo ma, in termini di produttività, è in vantaggio e si colloca tra i primi posti nell'area della creazione di contenuti.
In CrossMark, Dell G16 fa un po' peggio, con gli altri concorrenti che si trovano leggermente davanti al nostro AMD Core 15.
CrossMark: Overall | Productivity | Creativity | Responsiveness
WebXPRT 3: Overall
WebXPRT 4: Overall
Mozilla Kraken 1.1: Total
| PCMark 10 / Score | |
| SCHENKER XMG Core 15 (M24) | |
| SCHENKER XMG Fusion 15 (Early 24) | |
| Media AMD Ryzen 7 8845HS, NVIDIA GeForce RTX 4060 Laptop GPU (7538 - 8822, n=2) | |
| Media della classe Gaming (5776 - 9852, n=133, ultimi 2 anni) | |
| Lenovo Legion 5 16IRX G9 | |
| HP Victus 16 (2024) | |
| SCHENKER XMG Pro 15 (E23) | |
| Dell G16, i7-13650HX, RTX 4060 | |
| PCMark 10 / Essentials | |
| SCHENKER XMG Fusion 15 (Early 24) | |
| SCHENKER XMG Pro 15 (E23) | |
| Lenovo Legion 5 16IRX G9 | |
| HP Victus 16 (2024) | |
| Media della classe Gaming (9057 - 12600, n=133, ultimi 2 anni) | |
| SCHENKER XMG Core 15 (M24) | |
| Media AMD Ryzen 7 8845HS, NVIDIA GeForce RTX 4060 Laptop GPU (9936 - 10061, n=2) | |
| Dell G16, i7-13650HX, RTX 4060 | |
| PCMark 10 / Productivity | |
| SCHENKER XMG Core 15 (M24) | |
| Media AMD Ryzen 7 8845HS, NVIDIA GeForce RTX 4060 Laptop GPU (9789 - 14612, n=2) | |
| SCHENKER XMG Fusion 15 (Early 24) | |
| SCHENKER XMG Pro 15 (E23) | |
| Dell G16, i7-13650HX, RTX 4060 | |
| HP Victus 16 (2024) | |
| Media della classe Gaming (6662 - 14612, n=133, ultimi 2 anni) | |
| Lenovo Legion 5 16IRX G9 | |
| PCMark 10 / Digital Content Creation | |
| SCHENKER XMG Fusion 15 (Early 24) | |
| SCHENKER XMG Core 15 (M24) | |
| Media della classe Gaming (6807 - 18475, n=133, ultimi 2 anni) | |
| Media AMD Ryzen 7 8845HS, NVIDIA GeForce RTX 4060 Laptop GPU (11953 - 12674, n=2) | |
| Lenovo Legion 5 16IRX G9 | |
| Dell G16, i7-13650HX, RTX 4060 | |
| HP Victus 16 (2024) | |
| SCHENKER XMG Pro 15 (E23) | |
| CrossMark / Overall | |
| SCHENKER XMG Fusion 15 (Early 24) | |
| Lenovo Legion 5 16IRX G9 | |
| SCHENKER XMG Pro 15 (E23) | |
| HP Victus 16 (2024) | |
| Media della classe Gaming (1247 - 2344, n=114, ultimi 2 anni) | |
| SCHENKER XMG Core 15 (M24) | |
| Media AMD Ryzen 7 8845HS, NVIDIA GeForce RTX 4060 Laptop GPU (n=1) | |
| Dell G16, i7-13650HX, RTX 4060 | |
| CrossMark / Productivity | |
| SCHENKER XMG Fusion 15 (Early 24) | |
| Lenovo Legion 5 16IRX G9 | |
| SCHENKER XMG Pro 15 (E23) | |
| Media della classe Gaming (1299 - 2204, n=114, ultimi 2 anni) | |
| SCHENKER XMG Core 15 (M24) | |
| Media AMD Ryzen 7 8845HS, NVIDIA GeForce RTX 4060 Laptop GPU (n=1) | |
| HP Victus 16 (2024) | |
| Dell G16, i7-13650HX, RTX 4060 | |
| CrossMark / Creativity | |
| SCHENKER XMG Fusion 15 (Early 24) | |
| Lenovo Legion 5 16IRX G9 | |
| SCHENKER XMG Pro 15 (E23) | |
| HP Victus 16 (2024) | |
| SCHENKER XMG Core 15 (M24) | |
| Media AMD Ryzen 7 8845HS, NVIDIA GeForce RTX 4060 Laptop GPU (n=1) | |
| Media della classe Gaming (1275 - 2660, n=114, ultimi 2 anni) | |
| Dell G16, i7-13650HX, RTX 4060 | |
| CrossMark / Responsiveness | |
| SCHENKER XMG Fusion 15 (Early 24) | |
| Lenovo Legion 5 16IRX G9 | |
| HP Victus 16 (2024) | |
| SCHENKER XMG Pro 15 (E23) | |
| Media della classe Gaming (1030 - 2330, n=114, ultimi 2 anni) | |
| Dell G16, i7-13650HX, RTX 4060 | |
| SCHENKER XMG Core 15 (M24) | |
| Media AMD Ryzen 7 8845HS, NVIDIA GeForce RTX 4060 Laptop GPU (n=1) | |
| WebXPRT 3 / Overall | |
| SCHENKER XMG Fusion 15 (Early 24) | |
| SCHENKER XMG Pro 15 (E23) | |
| Lenovo Legion 5 16IRX G9 | |
| SCHENKER XMG Core 15 (M24) | |
| Media AMD Ryzen 7 8845HS, NVIDIA GeForce RTX 4060 Laptop GPU (305 - 305, n=2) | |
| Media della classe Gaming (215 - 480, n=127, ultimi 2 anni) | |
| HP Victus 16 (2024) | |
| Dell G16, i7-13650HX, RTX 4060 | |
| WebXPRT 4 / Overall | |
| SCHENKER XMG Fusion 15 (Early 24) | |
| Lenovo Legion 5 16IRX G9 | |
| SCHENKER XMG Pro 15 (E23) | |
| Media della classe Gaming (176.4 - 335, n=115, ultimi 2 anni) | |
| SCHENKER XMG Core 15 (M24) | |
| HP Victus 16 (2024) | |
| Media AMD Ryzen 7 8845HS, NVIDIA GeForce RTX 4060 Laptop GPU (176.4 - 264, n=2) | |
| Mozilla Kraken 1.1 / Total | |
| HP Victus 16 (2024) | |
| SCHENKER XMG Pro 15 (E23) | |
| Media AMD Ryzen 7 8845HS, NVIDIA GeForce RTX 4060 Laptop GPU (496 - 523, n=2) | |
| Dell G16, i7-13650HX, RTX 4060 | |
| Media della classe Gaming (409 - 674, n=139, ultimi 2 anni) | |
| SCHENKER XMG Core 15 (M24) | |
| Lenovo Legion 5 16IRX G9 | |
| SCHENKER XMG Fusion 15 (Early 24) | |
* ... Meglio usare valori piccoli
| PCMark 10 Score | 8822 punti | |
Aiuto | ||
| AIDA64 / Memory Copy | |
| SCHENKER XMG Fusion 15 (Early 24) | |
| SCHENKER XMG Pro 15 (E23) | |
| SCHENKER XMG Core 15 (M24) | |
| Media AMD Ryzen 7 8845HS (61459 - 71873, n=12) | |
| HP Victus 16 (2024) | |
| Media della classe Gaming (21750 - 97515, n=147, ultimi 2 anni) | |
| Lenovo Legion 5 16IRX G9 | |
| Dell G16, i7-13650HX, RTX 4060 | |
| AIDA64 / Memory Read | |
| SCHENKER XMG Fusion 15 (Early 24) | |
| SCHENKER XMG Pro 15 (E23) | |
| HP Victus 16 (2024) | |
| Lenovo Legion 5 16IRX G9 | |
| Media della classe Gaming (22956 - 102937, n=147, ultimi 2 anni) | |
| Dell G16, i7-13650HX, RTX 4060 | |
| SCHENKER XMG Core 15 (M24) | |
| Media AMD Ryzen 7 8845HS (49866 - 61976, n=12) | |
| AIDA64 / Memory Write | |
| SCHENKER XMG Core 15 (M24) | |
| Media AMD Ryzen 7 8845HS (68425 - 93239, n=12) | |
| SCHENKER XMG Pro 15 (E23) | |
| SCHENKER XMG Fusion 15 (Early 24) | |
| Media della classe Gaming (22297 - 108954, n=147, ultimi 2 anni) | |
| HP Victus 16 (2024) | |
| Dell G16, i7-13650HX, RTX 4060 | |
| Lenovo Legion 5 16IRX G9 | |
| AIDA64 / Memory Latency | |
| Media AMD Ryzen 7 8845HS (82.5 - 117, n=12) | |
| HP Victus 16 (2024) | |
| Media della classe Gaming (59.5 - 259, n=147, ultimi 2 anni) | |
| Dell G16, i7-13650HX, RTX 4060 | |
| Lenovo Legion 5 16IRX G9 | |
| SCHENKER XMG Core 15 (M24) | |
| SCHENKER XMG Pro 15 (E23) | |
| SCHENKER XMG Fusion 15 (Early 24) | |
* ... Meglio usare valori piccoli
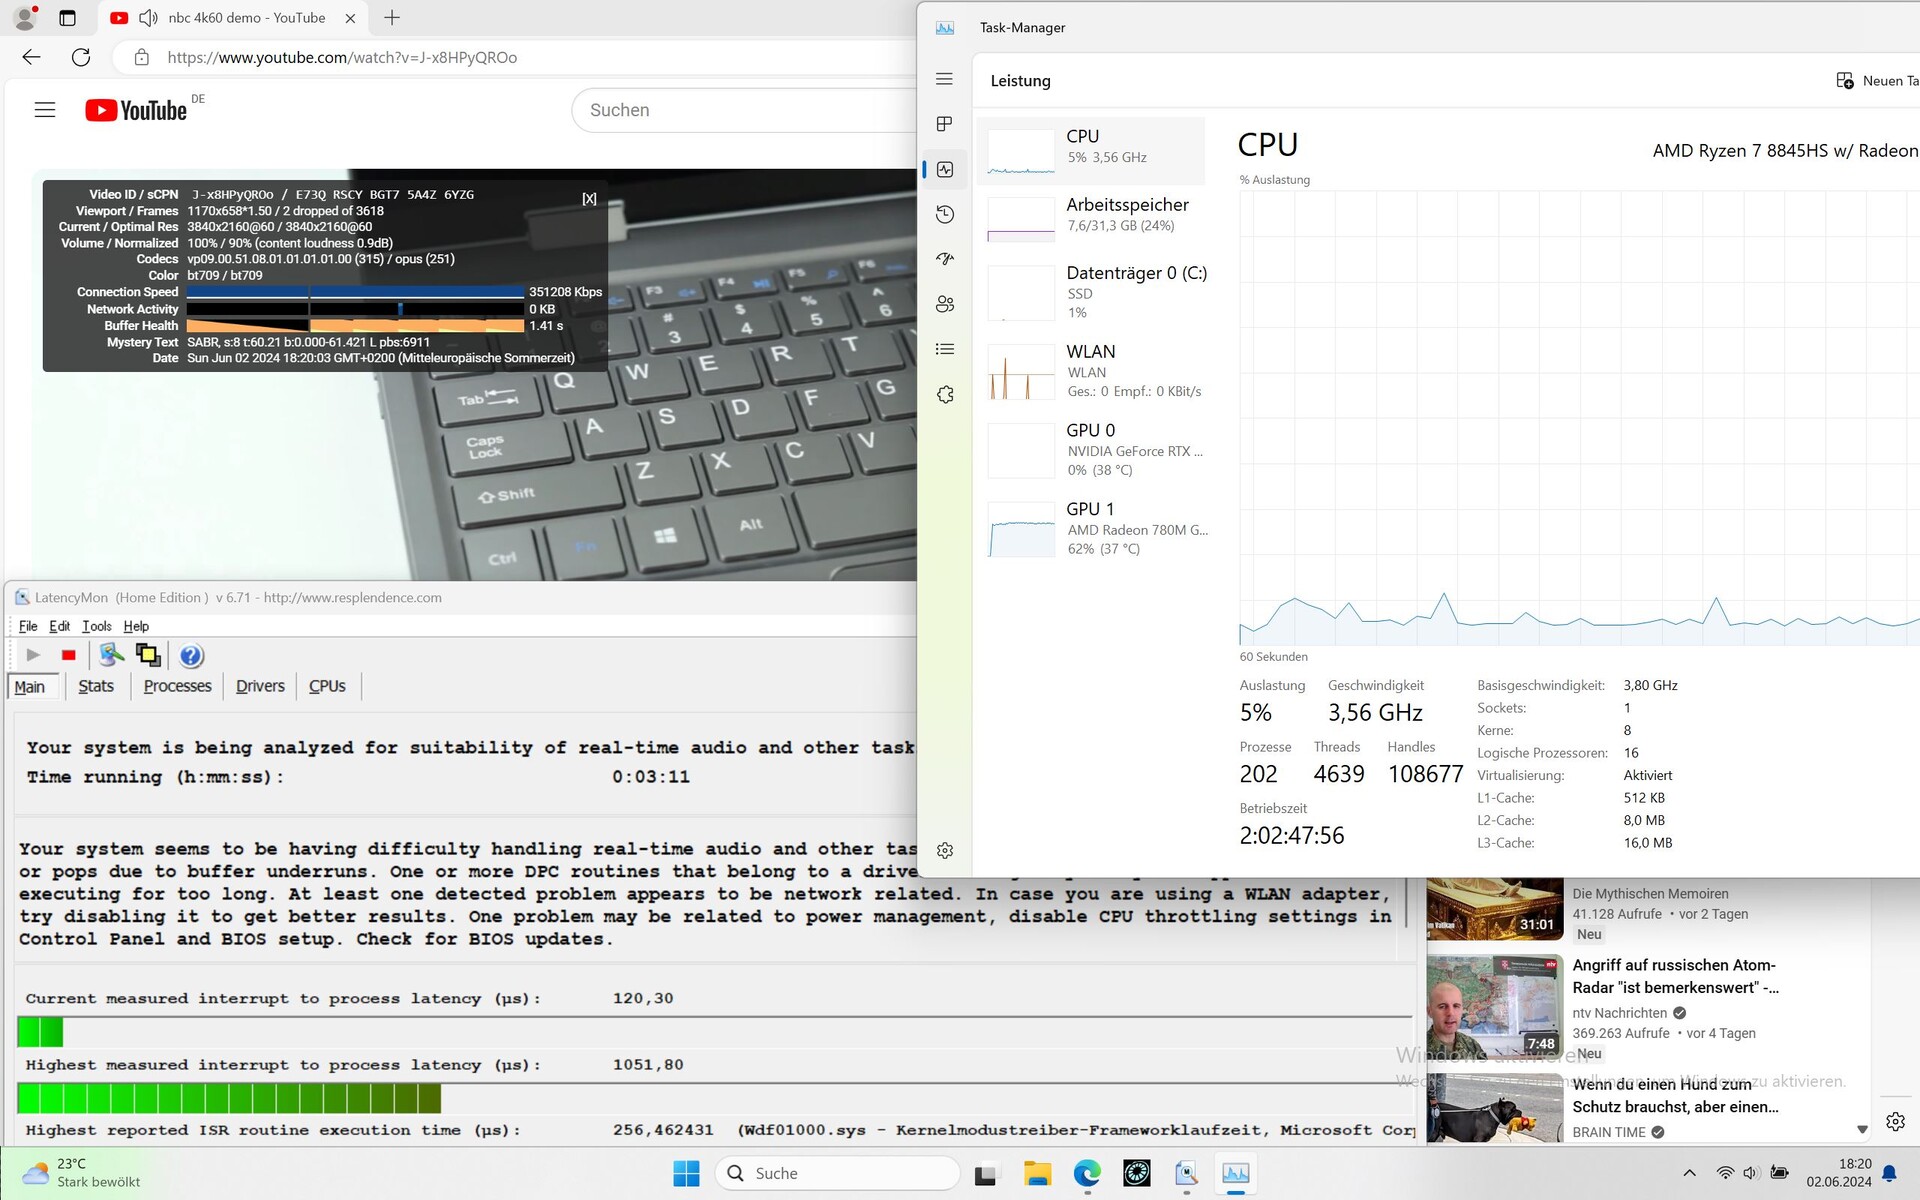
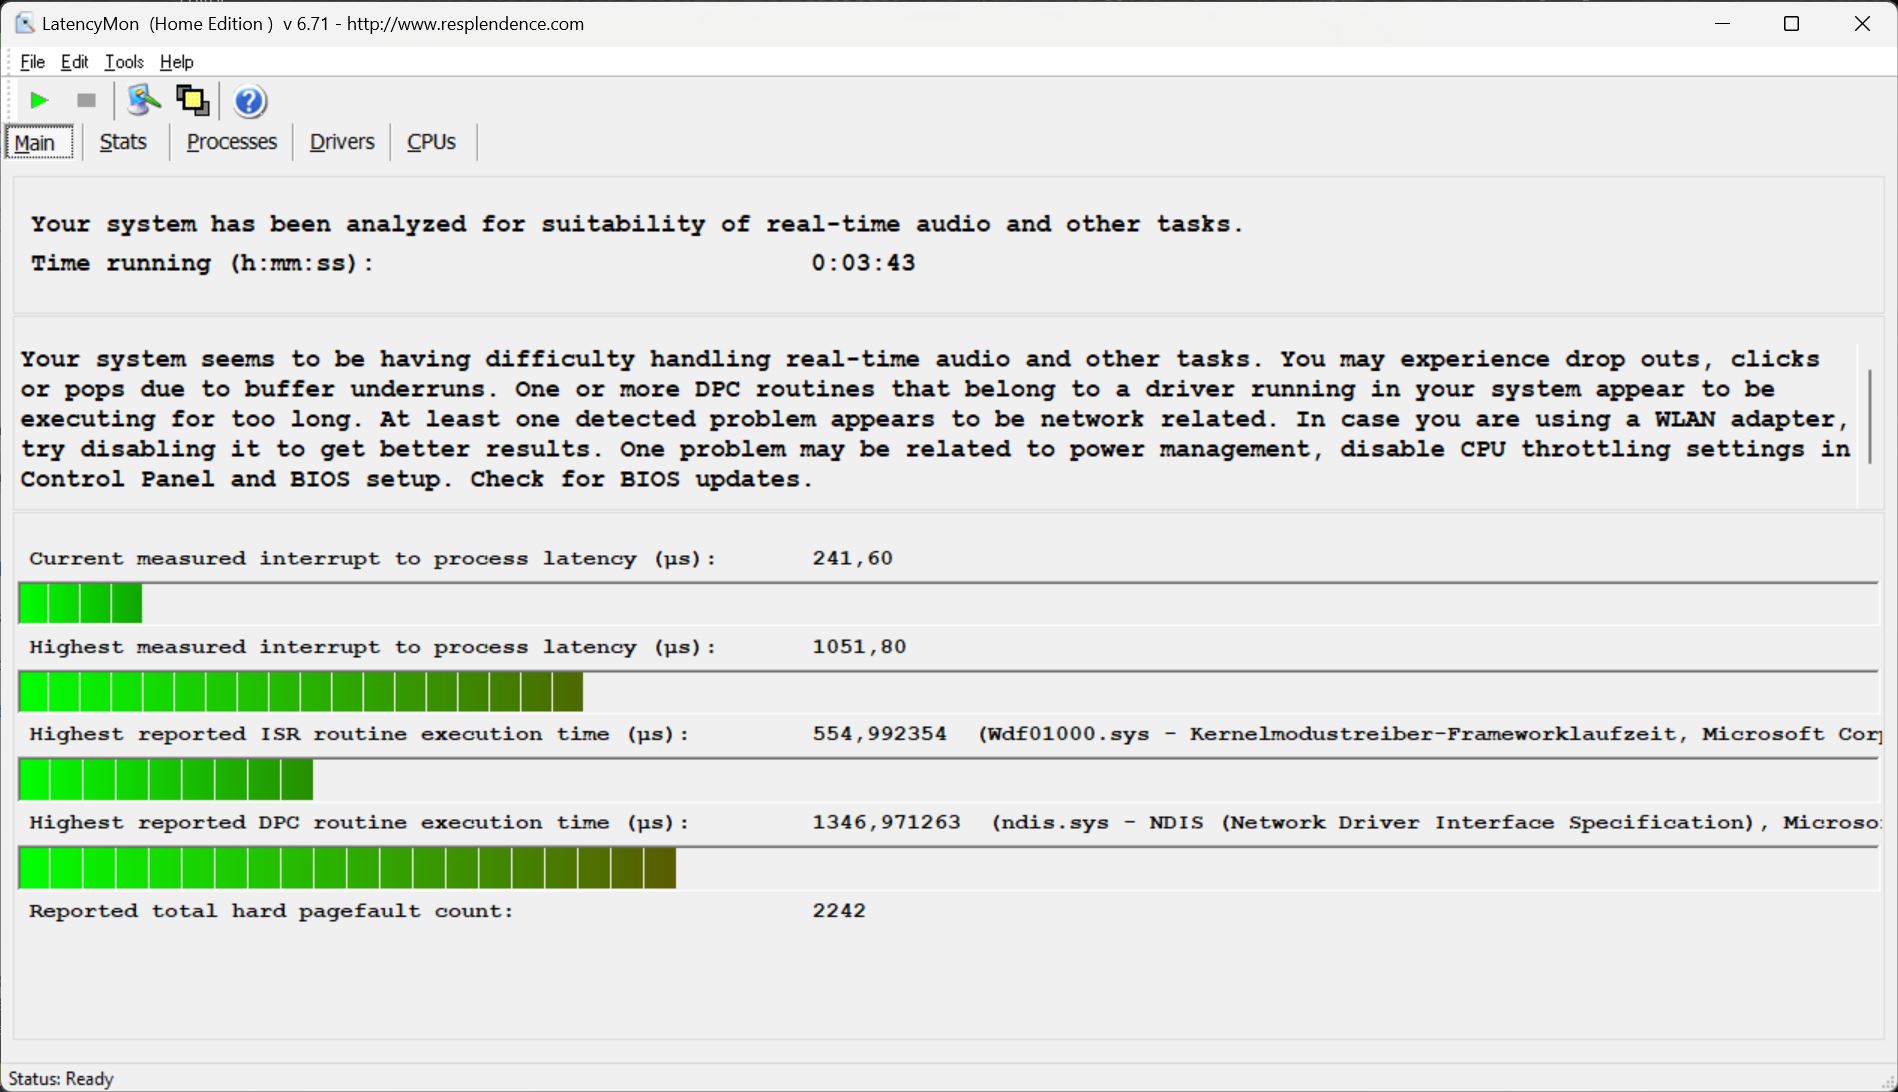
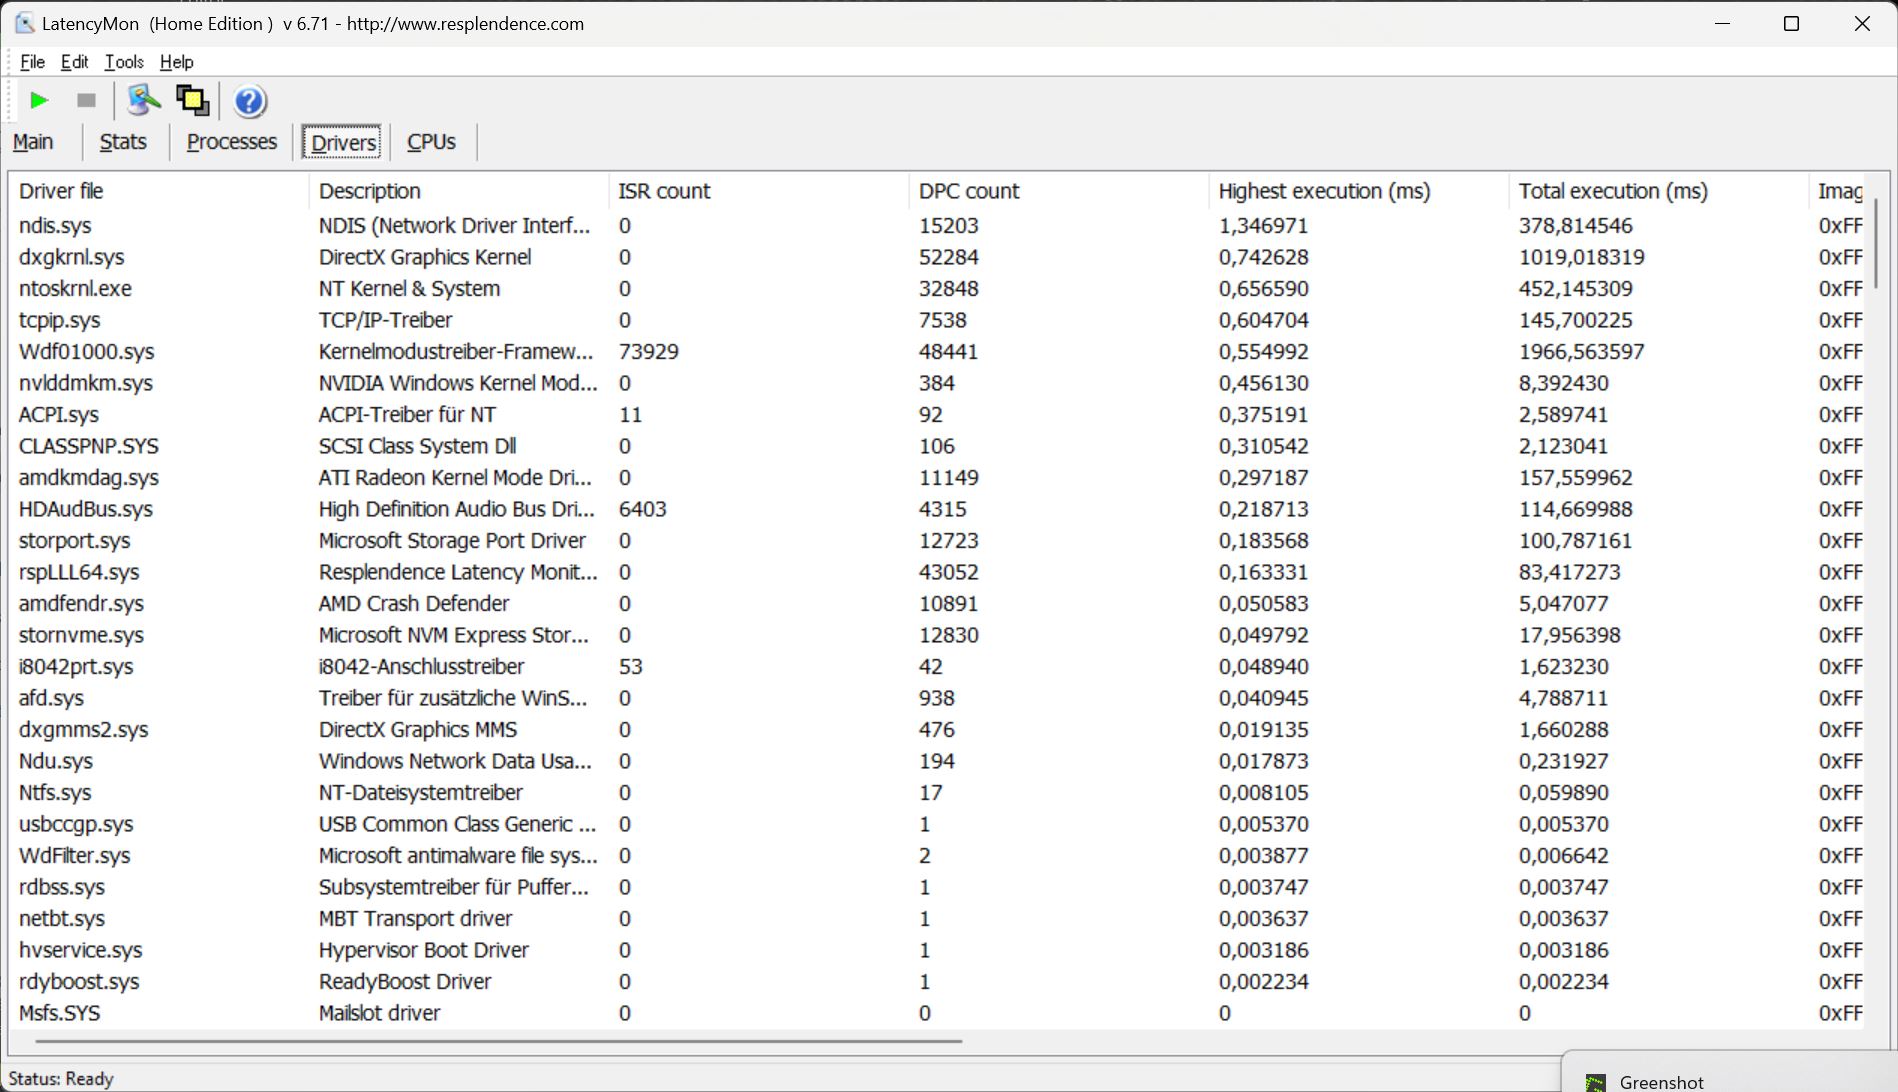
Latenze DPC
All'apertura del browser, le latenze sono minime e non creano problemi - per ora. Quando si aprono più schede del browser, il valore di latenza aumenta leggermente. Questo vale anche per la nostra riproduzione di video YouTube a 4K/60fps e, al 62%, il fattore di carico della GPU interna sembra essere piuttosto elevato. Il risultato sono due fotogrammi che cadono e un inglorioso secondo posto nella classifica della latenza.
| DPC Latencies / LatencyMon - interrupt to process latency (max), Web, Youtube, Prime95 | |
| Lenovo Legion 5 16IRX G9 | |
| SCHENKER XMG Core 15 (M24) | |
| Dell G16, i7-13650HX, RTX 4060 | |
| SCHENKER XMG Pro 15 (E23) | |
| HP Victus 16 (2024) | |
| SCHENKER XMG Fusion 15 (Early 24) | |
* ... Meglio usare valori piccoli
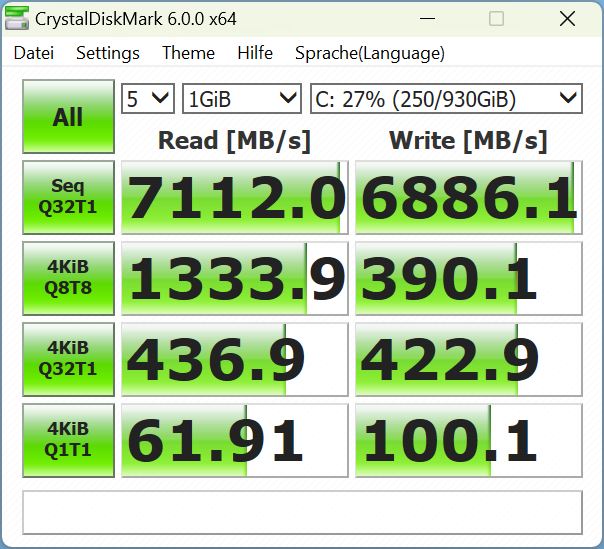
Memoria di massa
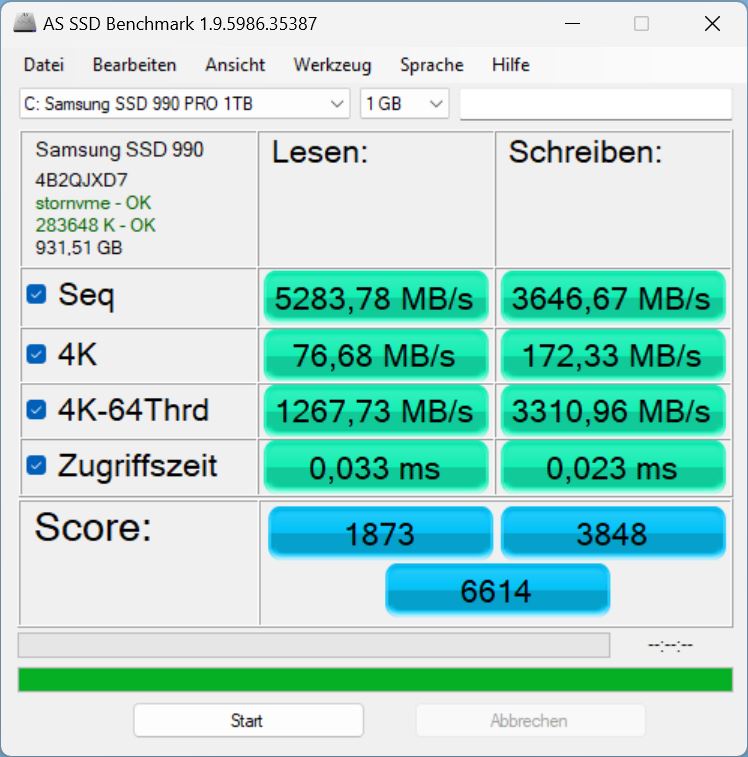
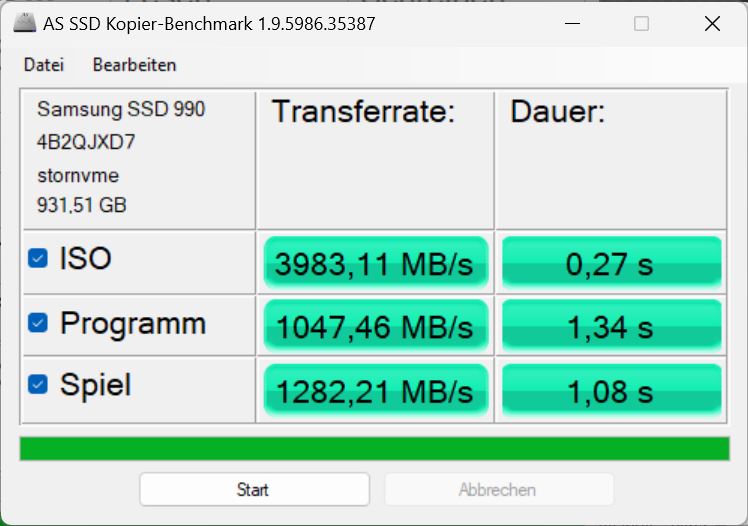
Nel nostro modello di recensione, Schenker ha montato un veloce Samsung 990 Pro con 1 TB di spazio di archiviazione e il Core 15 può essere equipaggiato con SSD di sei aziende diverse, compresi diversi modelli di questo produttore.
A seconda del software di test utilizzato (CrystalDiskMark 6, AS SSD, Disksdp), l'SSD fa meglio o peggio ma, nel complesso, il 990 Pro rimane un SSD PCIe 4.0 NVMe molto veloce, che ha anche dimostrato livelli di prestazioni elevati e costanti nel nostro modello di recensione con il ciclo Diskspd.

* ... Meglio usare valori piccoli
Continuous Performance Read: DiskSpd Read Loop, Queue Depth 8
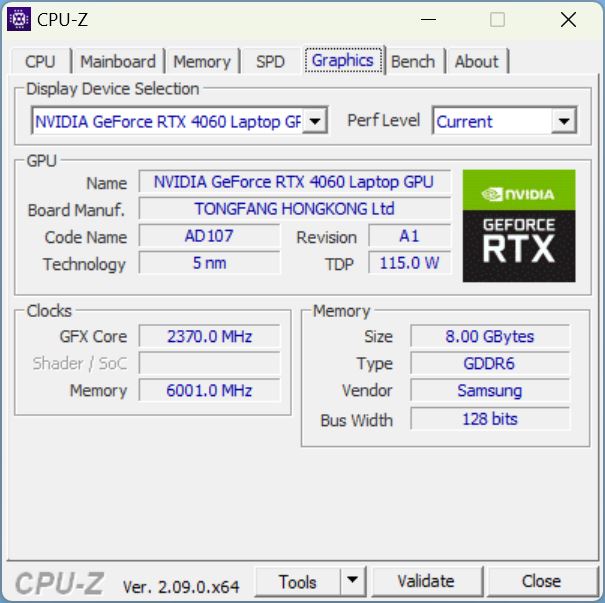
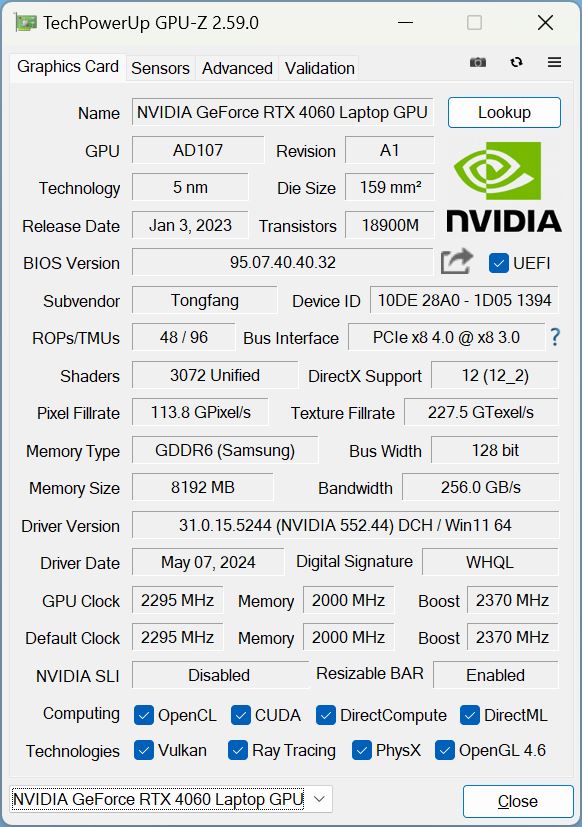
Scheda grafica
Una Nvidia Geforce RTX 4060 serve come GPU, tuttavia, per un costo aggiuntivo di 200 dollari, il Core 15 viene fornito anche con una RTX 4070 come quella presente nel modello Fusion 15.
Nei test 3DMark, il Core 15 si comporta in modo eccezionale. In tutti i test, anche la Fusion equipaggiata con RTX 4070 gode di un vantaggio dell'8%, mentre il Core 15 si colloca al secondo posto, davanti alla concorrenza basata su 4060.
Le prestazioni di gioco non sono così buone come i risultati di 3DMark, ma questo è dovuto esclusivamente ai titoli che richiedono molta CPU, come DOTA 2 Reborn o X-Plane. Mettendo da parte questi titoli, quando si tratta di giochi ad alta intensità di CPU, il Core 15 se la vede con i migliori dispositivi di confronto RTX 4060. Quest'ultima esegue tutti i titoli in Full HD a oltre 60fps e non presenta problemi nemmeno alla risoluzione nativa QHD, anche se titoli come Cyberpunk 2077 a volte scendono sotto i 60fps.
Il grafico di Witcher 3 mostra prestazioni molto stabili per oltre un'ora con il consueto ritmo giorno/notte del gioco. In quest'area, le prestazioni sono allo stesso livello della concorrenza RTX 4060. La tabella sottostante mostra i punteggi relativi ai vari profili di prestazioni, con l'unica incongruenza che si riscontra nella modalità bilanciata. Per i primi minuti, mostra le stesse prestazioni della modalità enthusiast, con la frequenza dei fotogrammi e il consumo che poi calano brevemente e riescono a rimanere al livello della modalità batteria.
In modalità batteria, le prestazioni 3D diminuiscono in Fire Strike di circa il 39 percento.
| Profilo/valore delle prestazioni | Witcher 3 FPS (Avvio - dopo 5 min) | Velocità della GPU | Consumo di energia della GPU | volume | consumo |
|---|---|---|---|---|---|
| Overboost | 103 - 101 | 2.720 MHz | 108,5 W | 50,96 dB | 167 W |
| Enthusiast | 97 - 92 | 2.640 MHz | 102,7 | 49 dB | 156 W |
| Bilanciato | 97 - 65 | 1.880 MHz | 47,86 W | Inizialmente 39,75, poi dopo alcuni minuti un 31 dB costante | Inizialmente 154, poi 67 W |
| 3DMark 11 Performance | 34005 punti | |
| 3DMark Cloud Gate Standard Score | 69309 punti | |
| 3DMark Fire Strike Score | 26988 punti | |
| 3DMark Time Spy Score | 11597 punti | |
Aiuto | ||
* ... Meglio usare valori piccoli
| The Witcher 3 - 1920x1080 Ultra Graphics & Postprocessing (HBAO+) | |
| SCHENKER XMG Pro 15 (E23) | |
| SCHENKER XMG Fusion 15 (Early 24) | |
| Media della classe Gaming (18.4 - 214, n=119, ultimi 2 anni) | |
| SCHENKER XMG Core 15 (M24) | |
| Dell G16, i7-13650HX, RTX 4060 | |
| HP Victus 16 (2024) | |
| Lenovo Legion 5 16IRX G9 | |
| GTA V - 1920x1080 Highest Settings possible AA:4xMSAA + FX AF:16x | |
| SCHENKER XMG Fusion 15 (Early 24) | |
| Lenovo Legion 5 16IRX G9 | |
| Dell G16, i7-13650HX, RTX 4060 | |
| SCHENKER XMG Core 15 (M24) | |
| Media della classe Gaming (12.1 - 168.2, n=132, ultimi 2 anni) | |
| HP Victus 16 (2024) | |
| SCHENKER XMG Pro 15 (E23) | |
| Final Fantasy XV Benchmark - 1920x1080 High Quality | |
| SCHENKER XMG Fusion 15 (Early 24) | |
| Media della classe Gaming (19.2 - 201, n=144, ultimi 2 anni) | |
| SCHENKER XMG Core 15 (M24) | |
| Lenovo Legion 5 16IRX G9 | |
| Dell G16, i7-13650HX, RTX 4060 | |
| HP Victus 16 (2024) | |
| Dota 2 Reborn - 1920x1080 ultra (3/3) best looking | |
| SCHENKER XMG Fusion 15 (Early 24) | |
| Lenovo Legion 5 16IRX G9 | |
| SCHENKER XMG Pro 15 (E23) | |
| HP Victus 16 (2024) | |
| Dell G16, i7-13650HX, RTX 4060 | |
| Media della classe Gaming (65.1 - 220, n=148, ultimi 2 anni) | |
| SCHENKER XMG Core 15 (M24) | |
Witcher 3 FPS diagram
| basso | medio | alto | ultra | QHD | 4K | |
|---|---|---|---|---|---|---|
| GTA V (2015) | 185 | 180.5 | 174.7 | 116.7 | 91.7 | |
| The Witcher 3 (2015) | 402.5 | 337.4 | 215.5 | 111.7 | 83.4 | |
| Dota 2 Reborn (2015) | 165.2 | 150.9 | 145.4 | 135.2 | 131.5 | |
| Final Fantasy XV Benchmark (2018) | 225 | 153.7 | 107.2 | 79.4 | ||
| X-Plane 11.11 (2018) | 143.5 | 125.1 | 97.2 | 90.7 | ||
| Far Cry 5 (2018) | 162 | 142 | 137 | 128 | 108 | |
| Strange Brigade (2018) | 434 | 305 | 242 | 204 | 136.3 | |
| Baldur's Gate 3 (2023) | 160.3 | 125.7 | 110.7 | 105.5 | 72.2 | |
| Cyberpunk 2077 2.2 Phantom Liberty (2023) | 136.1 | 107.2 | 91 | 93.1 | 48.2 | |
| Skull & Bones (2024) | 146 | 127 | 101 | 73 | 57 |
Emissioni ed energia - Una patata bollente ma economica
Emissioni di rumore
Durante il funzionamento inattivo sul desktop, le ventole rimangono per lo più inattive. Tuttavia, anche con il minimo carico quotidiano, come l'apertura di un browser e la navigazione in rete, si attivano e ronzano a 27 dB. Questo è normalmente il tipo di volume con cui si ha a che fare.
In caso di carico pesante, il volume della ventola può aumentare fino a 52 dB ma, una volta terminato il periodo di carico, si calma di nuovo molto rapidamente. Ma poi le cose non tornano ad essere silenziose per un bel po' di tempo, anche quando il sistema funziona al minimo.
A titolo di confronto, l'HP Victus e il Dell G16 sono un po' più silenziosi quando si gioca e, con il Legion 5 sempre più rumoroso, il Core 15 si colloca a metà strada tra i due dispositivi.
Rumorosità
| Idle |
| 23 / 23 / 23 dB(A) |
| Sotto carico |
| 38.92 / 52.09 dB(A) |
 | ||
30 dB silenzioso 40 dB(A) udibile 50 dB(A) rumoroso |
||
min: | ||
| SCHENKER XMG Core 15 (M24) NVIDIA GeForce RTX 4060 Laptop GPU, R7 8845HS, Samsung 990 Pro 1 TB | Lenovo Legion 5 16IRX G9 NVIDIA GeForce RTX 4060 Laptop GPU, i7-14650HX, Samsung PM9A1 MZVL21T0HCLR | HP Victus 16 (2024) NVIDIA GeForce RTX 4060 Laptop GPU, i7-14700HX, Kioxia XG8 KXG80ZNV512G | Dell G16, i7-13650HX, RTX 4060 NVIDIA GeForce RTX 4060 Laptop GPU, i7-13650HX, WD PC SN740 SDDPNQD-1T00 | SCHENKER XMG Fusion 15 (Early 24) NVIDIA GeForce RTX 4070 Laptop GPU, i9-14900HX, Samsung 990 Pro 1 TB | SCHENKER XMG Pro 15 (E23) NVIDIA GeForce RTX 4060 Laptop GPU, i9-13900HX, Crucial P5 Plus 1TB CT1000P5PSSD8 | |
|---|---|---|---|---|---|---|
| Noise | -14% | -13% | 3% | -18% | -9% | |
| off /ambiente * | 23 | 24 -4% | 25 -9% | 23 -0% | 25 -9% | 24 -4% |
| Idle Minimum * | 23 | 24 -4% | 28 -22% | 23 -0% | 27 -17% | 24 -4% |
| Idle Average * | 23 | 28.8 -25% | 29 -26% | 23 -0% | 28 -22% | 24 -4% |
| Idle Maximum * | 23 | 32 -39% | 33 -43% | 27.96 -22% | 33 -43% | 24 -4% |
| Load Average * | 38.92 | 45.5 -17% | 45 -16% | 27.96 28% | 52 -34% | 53.65 -38% |
| Witcher 3 ultra * | 50.96 | 53.1 -4% | 43 16% | 47.89 6% | 51 -0% | 53.53 -5% |
| Cyberpunk 2077 ultra * | 52.06 | |||||
| Load Maximum * | 52.09 | 55.7 -7% | 48 8% | 47.89 8% | 53 -2% | 53.65 -3% |
* ... Meglio usare valori piccoli
Temperatura
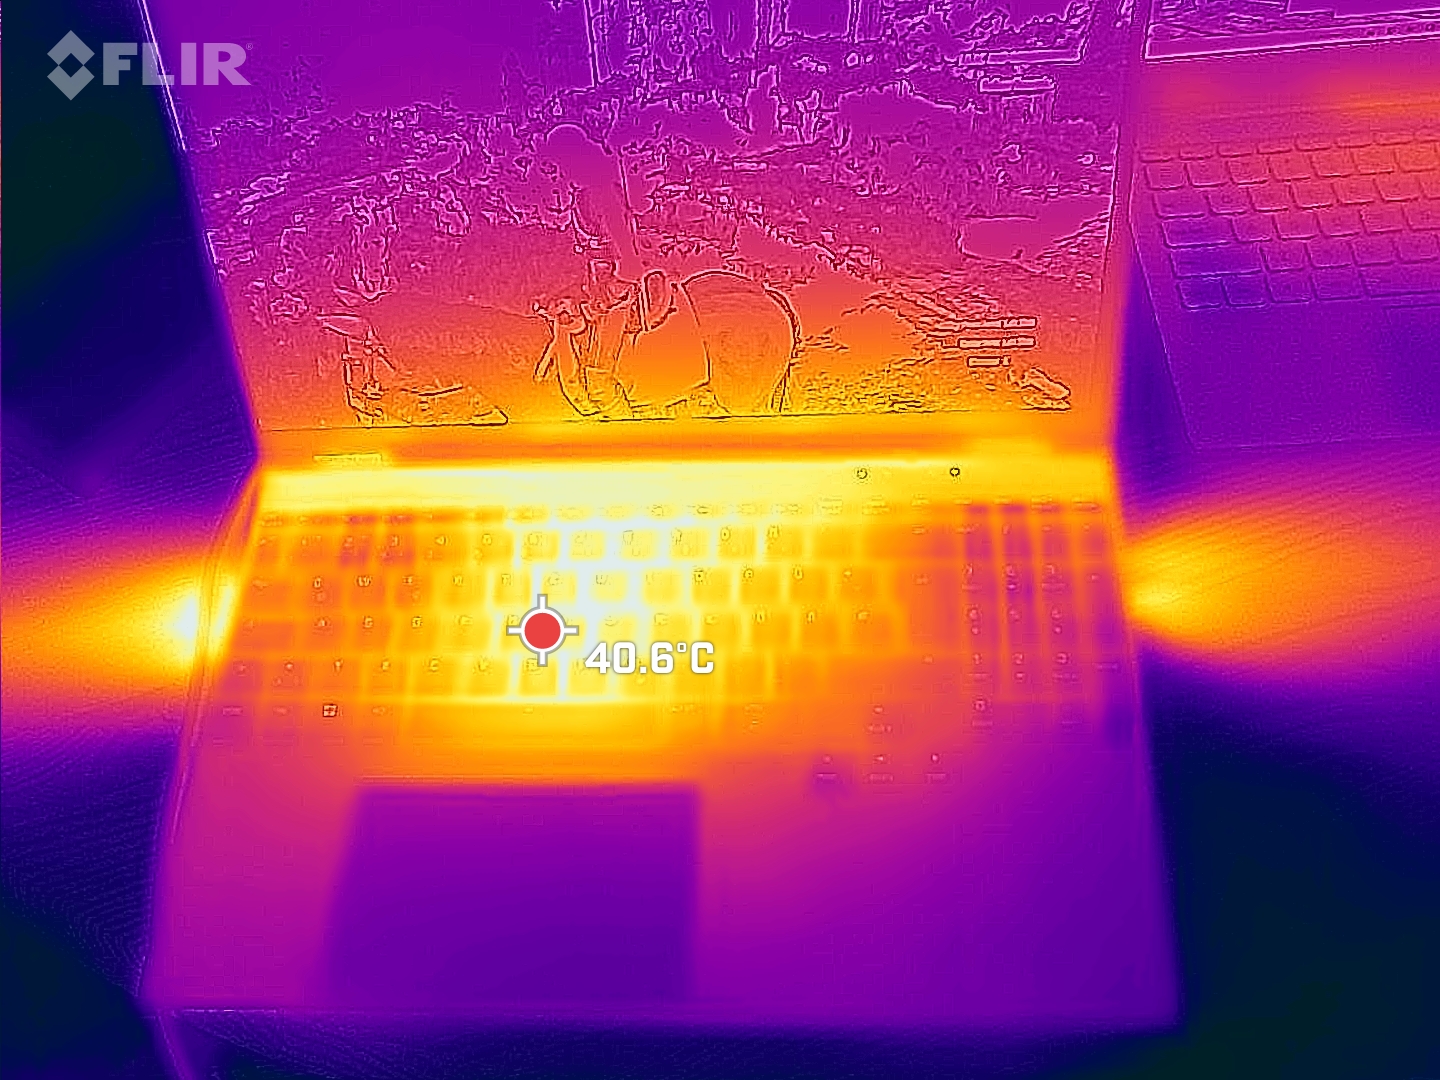
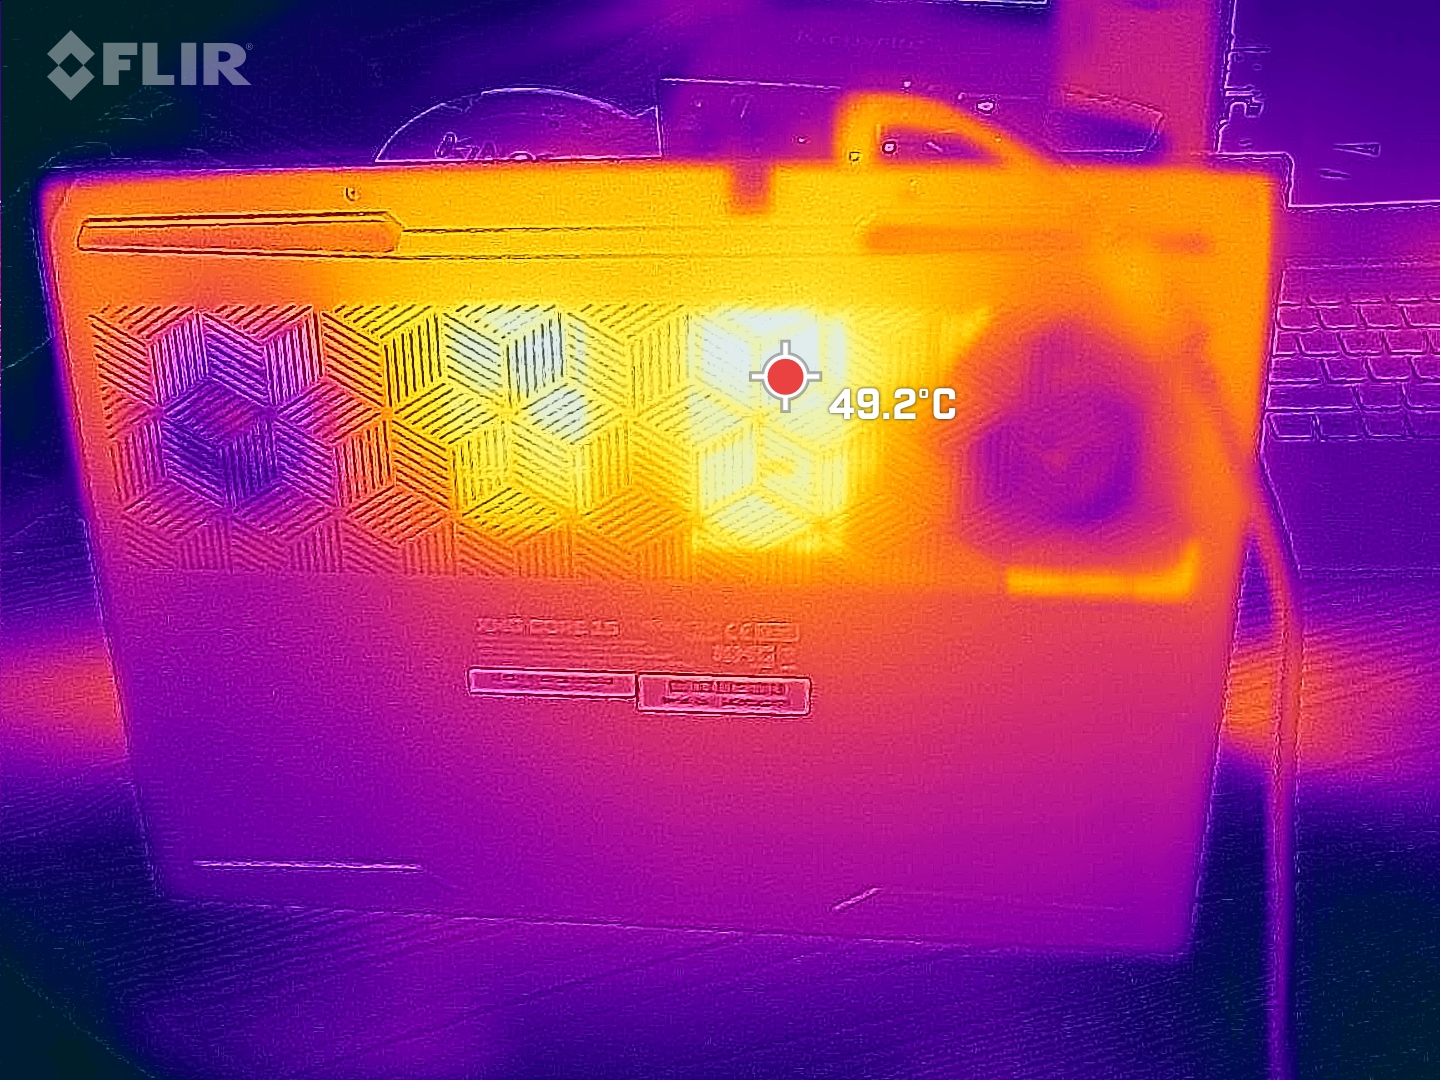
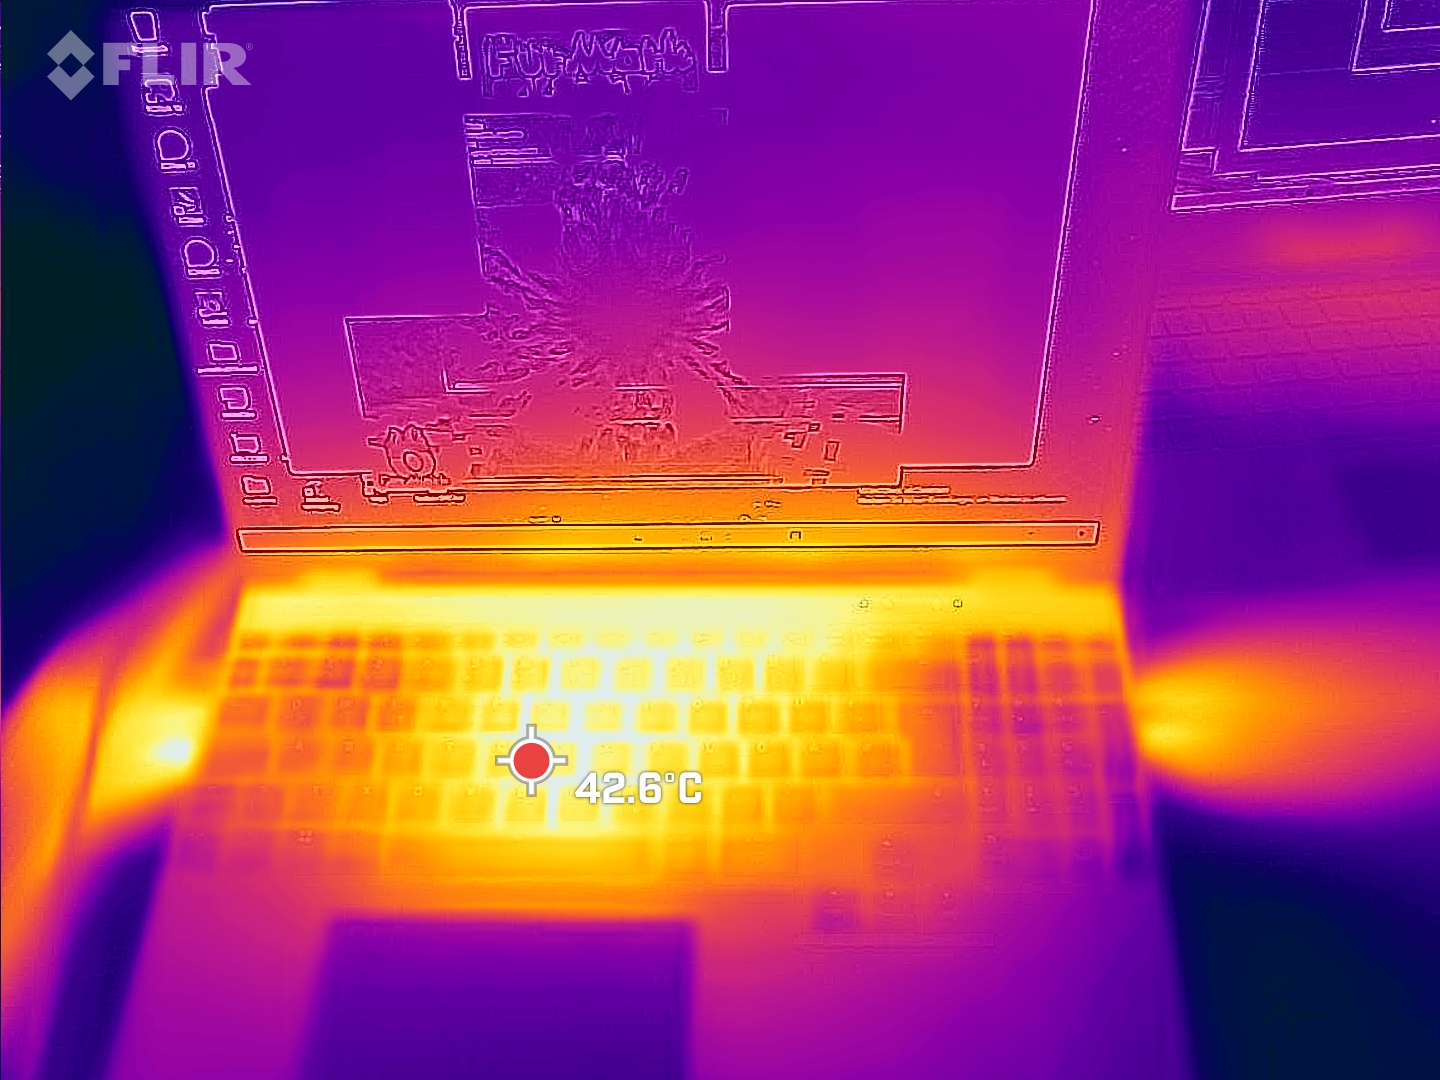
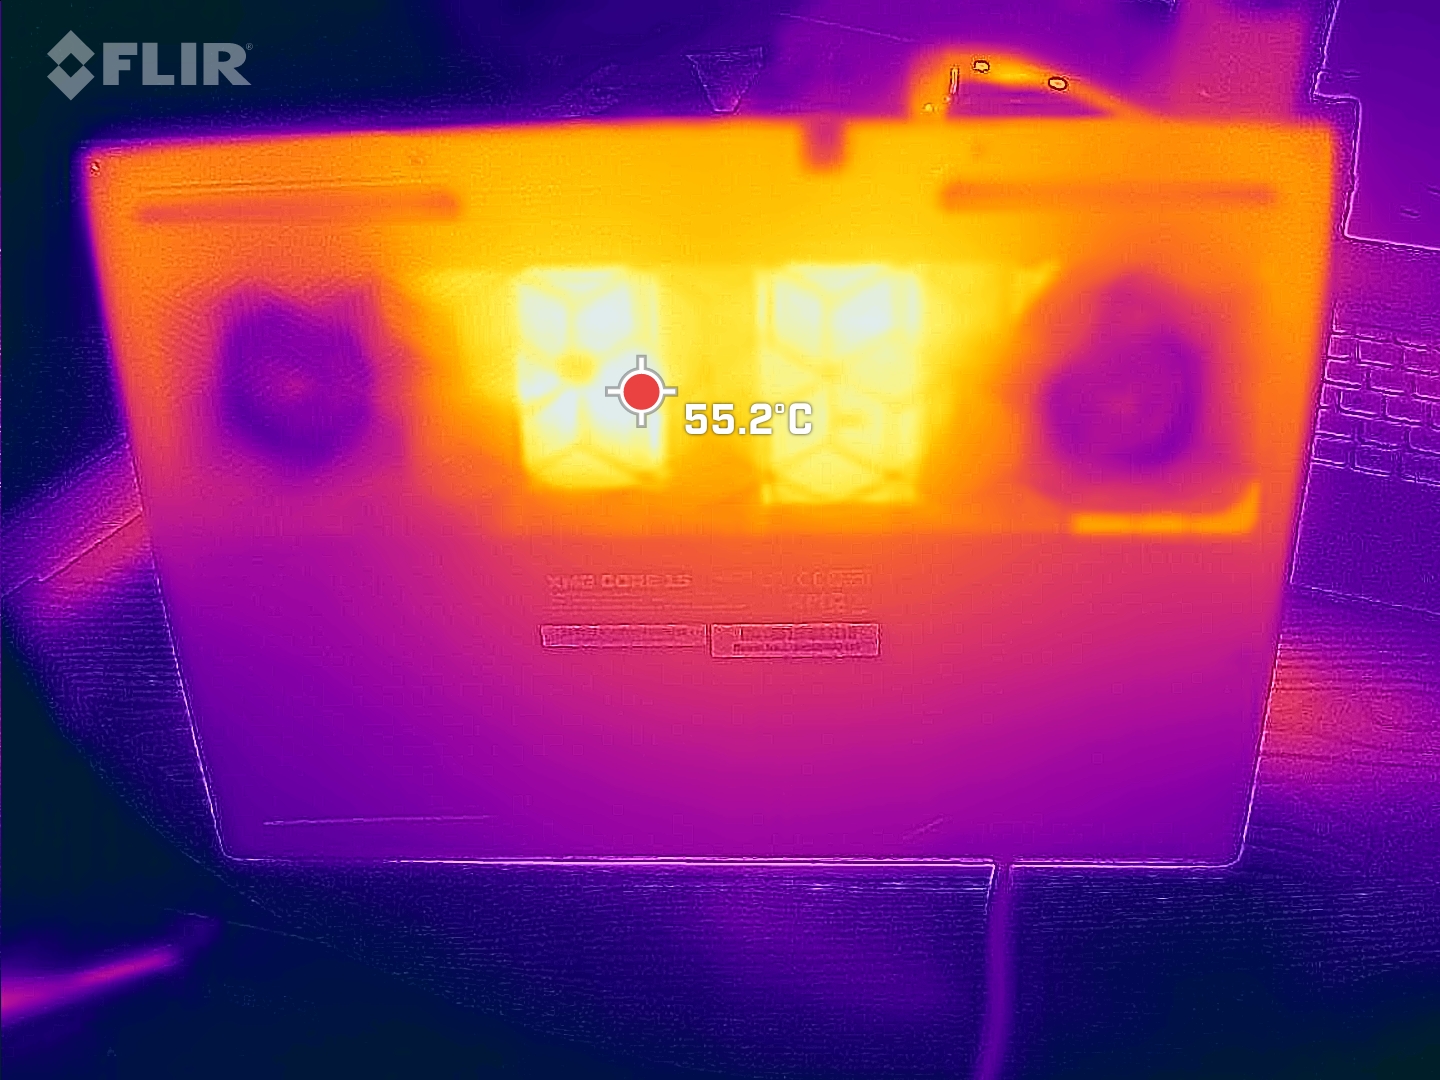
Il Core 15 non rimane davvero fresco, con il case in metallo che si riscalda parecchio e diventa un'ulteriore fonte di calore, soprattutto sulla base dell'unità. I palmari rimangono relativamente freschi.
Anche in modalità idle con le ventole spente, a circa 35 °C, diventa abbastanza caldo, ma entro limiti ragionevoli. Durante il gioco, l'hotspot sulla base del dispositivo, al centro del display, si scalda fino a 55 °C e raggiunge poco più di 60 °C nello stress test. È in quest'area che la concorrenza riesce a rimanere un po' più fredda, persino il Fusion 15 con la sua GPU più potente. Questo potrebbe anche avere un impatto sulla configurazione RTX 4070, con conseguente possibile throttling termico.
(-) La temperatura massima sul lato superiore è di 52 °C / 126 F, rispetto alla media di 40.4 °C / 105 F, che varia da 21.2 a 68.8 °C per questa classe Gaming.
(-) Il lato inferiore si riscalda fino ad un massimo di 61 °C / 142 F, rispetto alla media di 43.2 °C / 110 F
(±) In idle, la temperatura media del lato superiore è di 32.7 °C / 91 F, rispetto alla media deld ispositivo di 33.9 °C / 93 F.
(-) Riproducendo The Witcher 3, la temperatura media per il lato superiore e' di 39.2 °C / 103 F, rispetto alla media del dispositivo di 33.9 °C / 93 F.
(+) I poggiapolsi e il touchpad raggiungono la temperatura massima della pelle (34 °C / 93.2 F) e quindi non sono caldi.
(-) La temperatura media della zona del palmo della mano di dispositivi simili e'stata di 28.9 °C / 84 F (-5.1 °C / -9.2 F).
| SCHENKER XMG Core 15 (M24) AMD Ryzen 7 8845HS, NVIDIA GeForce RTX 4060 Laptop GPU | Lenovo Legion 5 16IRX G9 Intel Core i7-14650HX, NVIDIA GeForce RTX 4060 Laptop GPU | HP Victus 16 (2024) Intel Core i7-14700HX, NVIDIA GeForce RTX 4060 Laptop GPU | Dell G16, i7-13650HX, RTX 4060 Intel Core i7-13650HX, NVIDIA GeForce RTX 4060 Laptop GPU | SCHENKER XMG Fusion 15 (Early 24) Intel Core i9-14900HX, NVIDIA GeForce RTX 4070 Laptop GPU | SCHENKER XMG Pro 15 (E23) Intel Core i9-13900HX, NVIDIA GeForce RTX 4060 Laptop GPU | |
|---|---|---|---|---|---|---|
| Heat | 18% | 21% | 5% | 16% | 12% | |
| Maximum Upper Side * | 52 | 40.4 22% | 50 4% | 49 6% | 48 8% | 50 4% |
| Maximum Bottom * | 61 | 43.8 28% | 50 18% | 58 5% | 56 8% | 50 18% |
| Idle Upper Side * | 35 | 30.3 13% | 25 29% | 35 -0% | 28 20% | 33 6% |
| Idle Bottom * | 39 | 35.3 9% | 26 33% | 35 10% | 29 26% | 32 18% |
* ... Meglio usare valori piccoli
Altoparlanti
Gli alti e i medi sono lineari e bilanciati, ma i bassi sono appena percettibili e i diffusori potrebbero essere più forti. Il collegamento di apparecchiature audio analogiche può essere effettuato tramite la porta per cuffie da 3,5 mm.
SCHENKER XMG Core 15 (M24) analisi audio
(±) | potenza degli altiparlanti media ma buona (79.12 dB)
Bassi 100 - 315 Hz
(-) | quasi nessun basso - in media 16.7% inferiori alla media
(-) | bassi non lineari (15.7% delta rispetto alla precedente frequenza)
Medi 400 - 2000 Hz
(+) | medi bilanciati - solo only 4.5% rispetto alla media
(+) | medi lineari (4.4% delta rispetto alla precedente frequenza)
Alti 2 - 16 kHz
(+) | Alti bilanciati - appena 1% dalla media
(+) | alti lineari (2.7% delta rispetto alla precedente frequenza)
Nel complesso 100 - 16.000 Hz
(+) | suono nel complesso lineare (13.7% differenza dalla media)
Rispetto alla stessa classe
» 20% di tutti i dispositivi testati in questa classe è stato migliore, 6% simile, 74% peggiore
» Il migliore ha avuto un delta di 6%, medio di 18%, peggiore di 132%
Rispetto a tutti i dispositivi testati
» 13% di tutti i dispositivi testati in questa classe è stato migliore, 4% similare, 83% peggiore
» Il migliore ha avuto un delta di 4%, medio di 24%, peggiore di 134%
Apple MacBook Pro 16 2021 M1 Pro analisi audio
(+) | gli altoparlanti sono relativamente potenti (84.7 dB)
Bassi 100 - 315 Hz
(+) | bassi buoni - solo 3.8% dalla media
(+) | bassi in lineaa (5.2% delta rispetto alla precedente frequenza)
Medi 400 - 2000 Hz
(+) | medi bilanciati - solo only 1.3% rispetto alla media
(+) | medi lineari (2.1% delta rispetto alla precedente frequenza)
Alti 2 - 16 kHz
(+) | Alti bilanciati - appena 1.9% dalla media
(+) | alti lineari (2.7% delta rispetto alla precedente frequenza)
Nel complesso 100 - 16.000 Hz
(+) | suono nel complesso lineare (4.6% differenza dalla media)
Rispetto alla stessa classe
» 0% di tutti i dispositivi testati in questa classe è stato migliore, 0% simile, 100% peggiore
» Il migliore ha avuto un delta di 5%, medio di 18%, peggiore di 45%
Rispetto a tutti i dispositivi testati
» 0% di tutti i dispositivi testati in questa classe è stato migliore, 0% similare, 100% peggiore
» Il migliore ha avuto un delta di 4%, medio di 24%, peggiore di 134%
Consumo di energia
Il Core 15 è leggermente più parsimonioso della concorrenza, soprattutto quando funziona in idle - tutto molto buono. Il consumo rimane moderato anche durante i giochi.
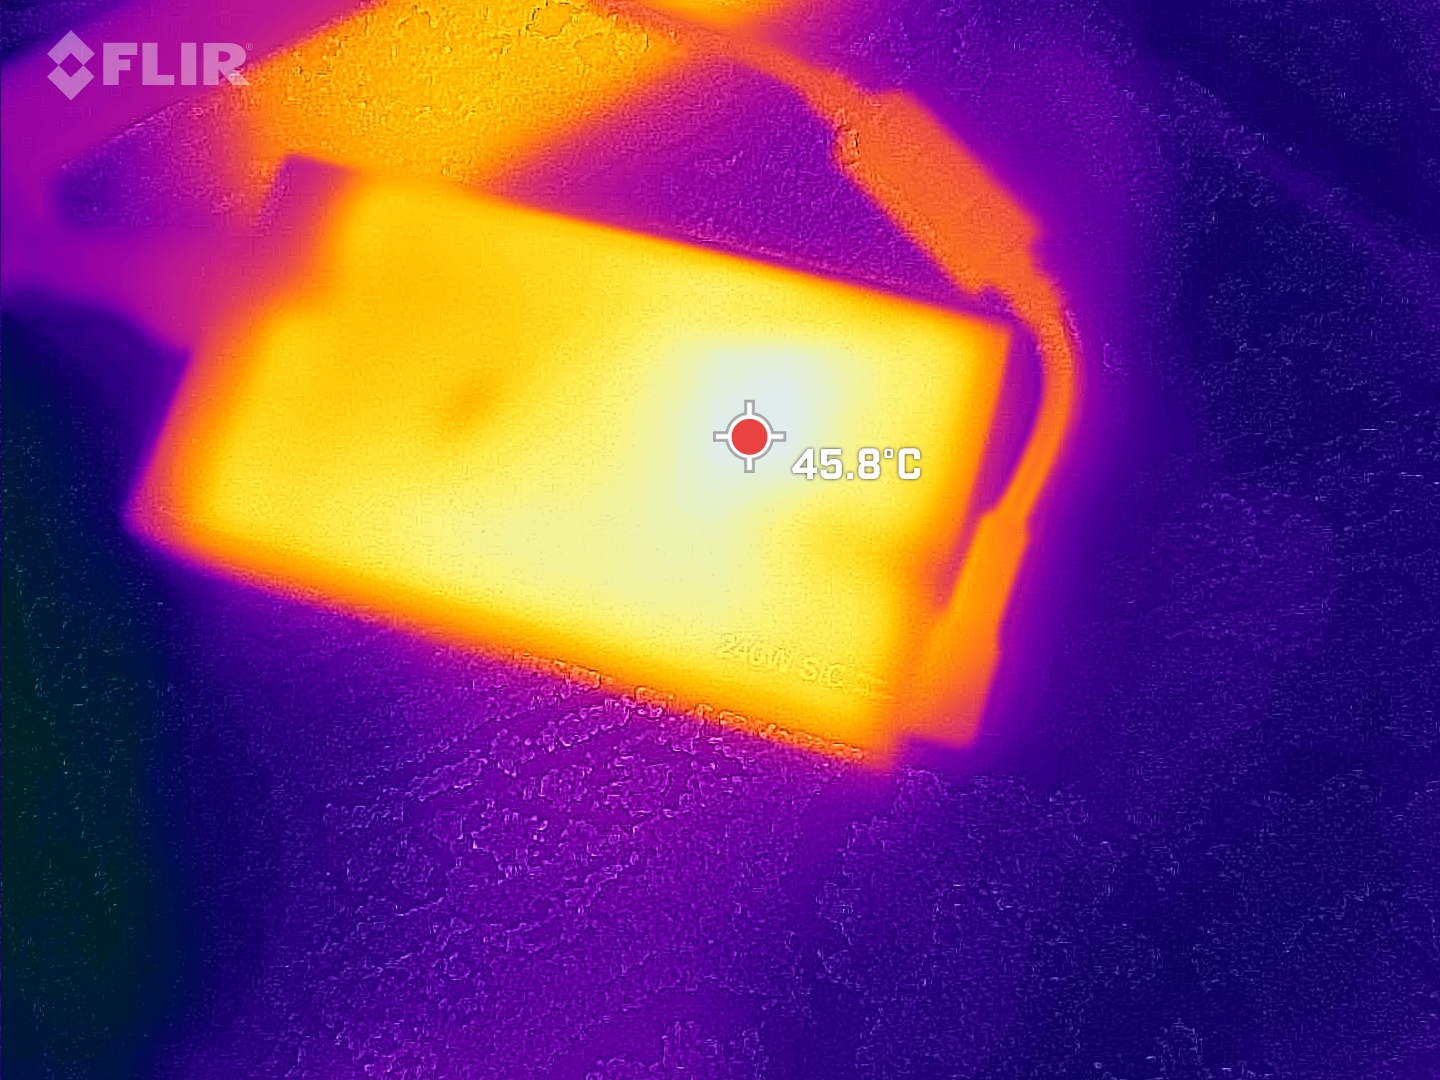
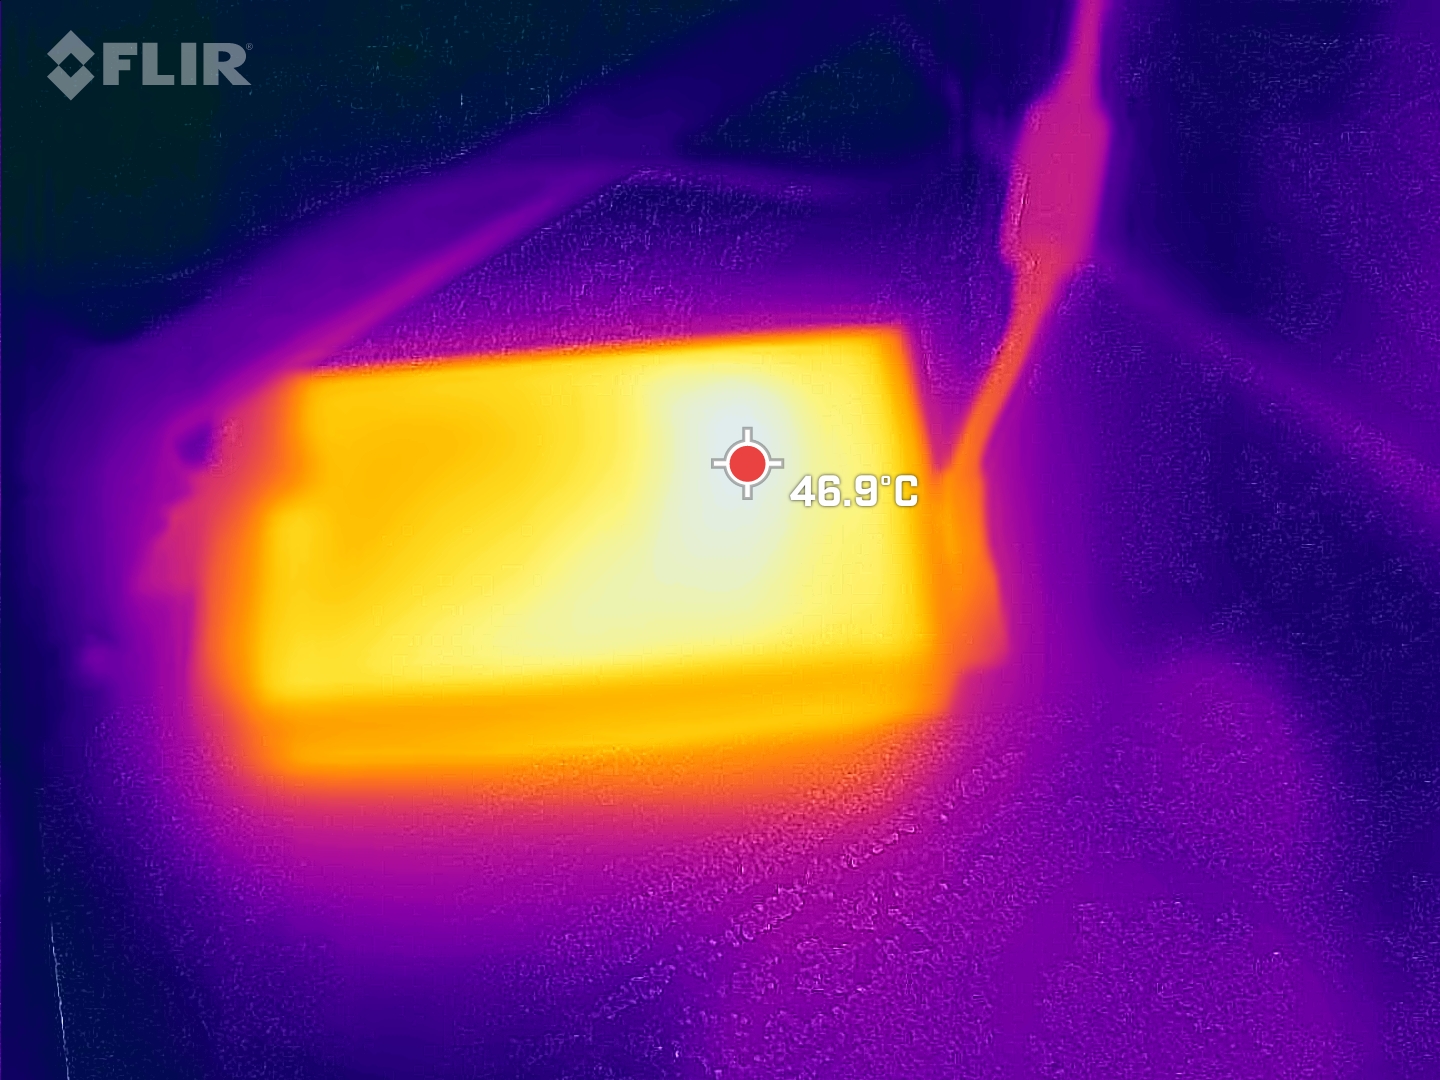
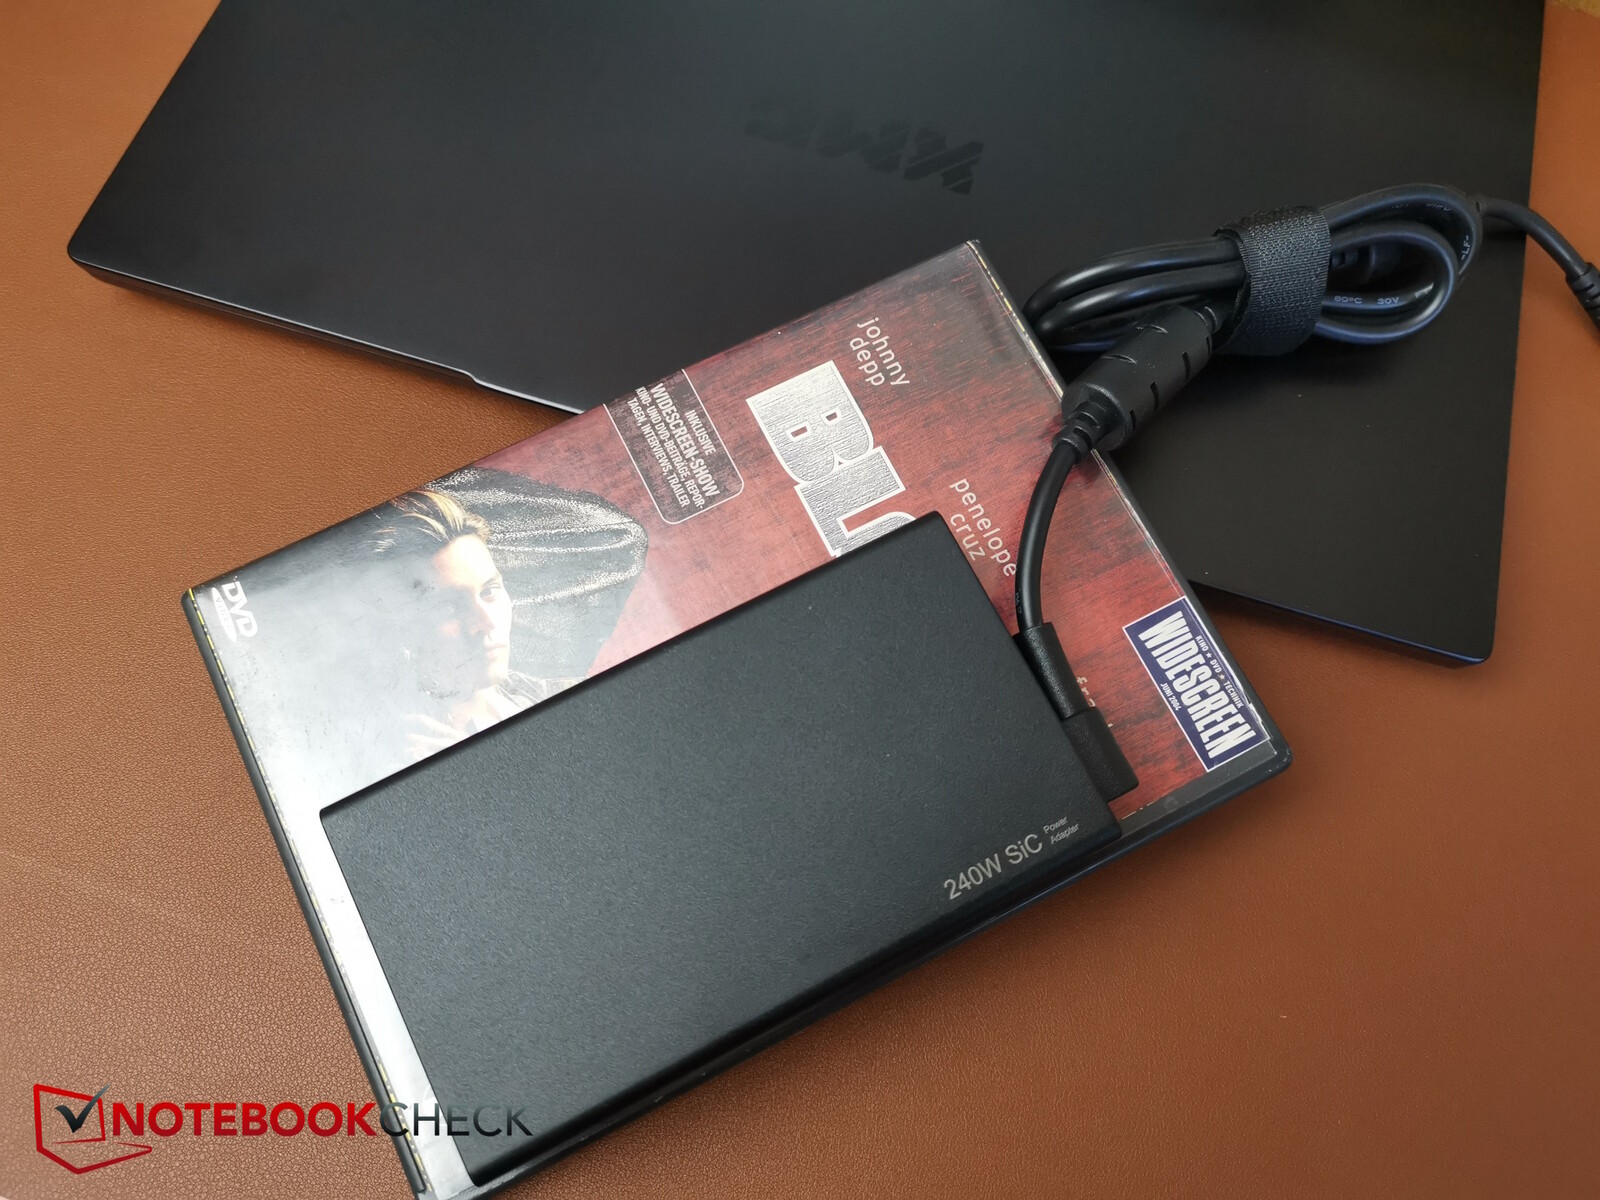
Nel test di stress, abbiamo misurato temporaneamente valori di consumo fino a 286 W, che in teoria potrebbero sovraccaricare l'alimentatore da 240 W. Tuttavia, questi picchi di carico sono davvero solo temporanei. Tuttavia, questi picchi di carico sono davvero solo temporanei. Durante il gioco, abbiamo misurato un consumo medio di soli 167 W e questo è qualcosa che l'alimentatore dovrebbe essere in grado di gestire sempre.
A proposito dell'alimentatore, Schenker sembra aver apportato dei miglioramenti, riducendo le sue dimensioni. Invece dell'ingombrante PSU Chicony da 240 W, il produttore ha optato per un'unità da 240 W, ma con un fattore di forma significativamente più piccolo. Questo è molto vantaggioso per la mobilità.
| Off / Standby | |
| Idle | |
| Sotto carico |
|
Leggenda:
min: | |
| SCHENKER XMG Core 15 (M24) R7 8845HS, NVIDIA GeForce RTX 4060 Laptop GPU, Samsung 990 Pro 1 TB, IPS, 2560x1600, 15.3" | Lenovo Legion 5 16IRX G9 i7-14650HX, NVIDIA GeForce RTX 4060 Laptop GPU, Samsung PM9A1 MZVL21T0HCLR, IPS, 2560x1600, 16" | HP Victus 16 (2024) i7-14700HX, NVIDIA GeForce RTX 4060 Laptop GPU, Kioxia XG8 KXG80ZNV512G, IPS, 1920x1080, 16.1" | Dell G16, i7-13650HX, RTX 4060 i7-13650HX, NVIDIA GeForce RTX 4060 Laptop GPU, WD PC SN740 SDDPNQD-1T00, IPS, 2560x1600, 16" | SCHENKER XMG Fusion 15 (Early 24) i9-14900HX, NVIDIA GeForce RTX 4070 Laptop GPU, Samsung 990 Pro 1 TB, IPS, 2560x1600, 15.3" | SCHENKER XMG Pro 15 (E23) i9-13900HX, NVIDIA GeForce RTX 4060 Laptop GPU, Crucial P5 Plus 1TB CT1000P5PSSD8, IPS, 2560x1440, 15.6" | Media NVIDIA GeForce RTX 4060 Laptop GPU | Media della classe Gaming | |
|---|---|---|---|---|---|---|---|---|
| Power Consumption | -36% | -13% | -13% | -20% | -100% | -20% | -45% | |
| Idle Minimum * | 9.3 | 15.4 -66% | 9 3% | 11 -18% | 8 14% | 21.6 -132% | 11.5 ? -24% | 13.4 ? -44% |
| Idle Average * | 12.9 | 19.7 -53% | 15 -16% | 14.8 -15% | 14 -9% | 29 -125% | 16 ? -24% | 18.9 ? -47% |
| Idle Maximum * | 12.8 | 20.7 -62% | 23 -80% | 16.8 -31% | 26 -103% | 42.7 -234% | 20.3 ? -59% | 26.3 ? -105% |
| Witcher 3 ultra * | 167 | 191.3 -15% | 143.7 14% | 185 -11% | 192.7 -15% | 189 -13% | ||
| Load Maximum * | 286 | 246.6 14% | 241 16% | 255 11% | 244 15% | 269 6% | 210 ? 27% | 244 ? 15% |
| Load Average * | 102.6 | 123 | 103.7 | 118 | 190 | 92.9 ? | 102.7 ? |
* ... Meglio usare valori piccoli
Power consumption Witcher 3 / stress test
Power consumption with an external monitor
Durata della batteria
Come standard, Schenker ha installato una batteria da 80 Wh. Tuttavia, con un sovrapprezzo di circa 70 dollari, il dispositivo può essere configurato con una batteria più grande da 99,8 Wh, che è quella presente nel nostro modello di recensione.
Il Core 15 continua a funzionare per circa 7 ore sia nel test Wi-Fi che in quello video, con una luminosità ridotta a 150 Nits. Se si imposta la luminosità al massimo, le luci si spengono dopo meno di 5 ore nel test Wi-Fi. In generale, abbiamo a che fare con un'ottima durata della batteria, anche se il modello Legion sembra essere in grado di offrire prestazioni simili con una batteria da 80 Wh.
| SCHENKER XMG Core 15 (M24) R7 8845HS, NVIDIA GeForce RTX 4060 Laptop GPU, 99.8 Wh | Lenovo Legion 5 16IRX G9 i7-14650HX, NVIDIA GeForce RTX 4060 Laptop GPU, 80 Wh | HP Victus 16 (2024) i7-14700HX, NVIDIA GeForce RTX 4060 Laptop GPU, 83 Wh | Dell G16, i7-13650HX, RTX 4060 i7-13650HX, NVIDIA GeForce RTX 4060 Laptop GPU, 86 Wh | SCHENKER XMG Fusion 15 (Early 24) i9-14900HX, NVIDIA GeForce RTX 4070 Laptop GPU, 99.8 Wh | SCHENKER XMG Pro 15 (E23) i9-13900HX, NVIDIA GeForce RTX 4060 Laptop GPU, 80 Wh | Media della classe Gaming | |
|---|---|---|---|---|---|---|---|
| Autonomia della batteria | -42% | -43% | -48% | -13% | -43% | -42% | |
| H.264 | 608 | 576 -5% | 381 -37% | 602 -1% | 447 ? -26% | ||
| WiFi v1.3 | 889 | 444 -50% | 511 -43% | 378 -57% | 480 -46% | 343.1 -61% | 387 ? -56% |
| Load | 151 | 46 -70% | 76 -50% | 164 9% | 115 -24% | 84.5 ? -44% | |
| Reader / Idle | 911 | 585 ? |
Pro
Contro
Verdetto - Buono e conveniente con un raffreddamento potenzialmente migliore
Il Core 15 costa almeno 200 dollari in meno rispetto al Fusion 15. Ciò comporta il costo di dover rinunciare alla Thunderbolt e alla CPU più potente. Ciò comporta la rinuncia a Thunderbolt e a una CPU più potente. Quest'ultima comporta una differenza di prestazioni della CPU notevole, pari a quasi il 20 percento. Tuttavia, non si tratta di qualcosa che si noterà davvero nella maggior parte dei giochi 3D. Fusion potrebbe essere più veloce del 20 percento in quest'area, ma ciò è dovuto alla sua RTX 4070. La variante RTX 4060 dovrebbe essere altrettanto veloce.
Abbiamo apprezzato l'artigianalità del Core con il suo case in metallo e le buone opzioni di espandibilità in termini di RAM e SSD. Anche la tastiera, le prestazioni 3D e la durata della batteria sono decenti.
L'"unica" critica è la grande quantità di calore prodotta sulla superficie metallica della base sotto carico pesante. Si tratta di un'area in cui il produttore dovrebbe apportare miglioramenti futuri e forse ottimizzare il sistema di raffreddamento.
XMG Core 15 è un potente gamer 3D con una buona qualità costruttiva, che include un case in metallo che si scalda un po' troppo sotto carico.
Un'alternativa che vale la pena di prendere in considerazione è l'XMG Pro 15 dello scorso anno. La CPU HX dell'anno precedente è ancora più veloce del processore AMD che si trova qui e, oltre a ciò, il Pro dispone anche di Thunderbolt 4. Anche Legion 5i è una possibile alternativa, soprattutto nella variante più economica Campuspoint.
Prezzo e disponibilità
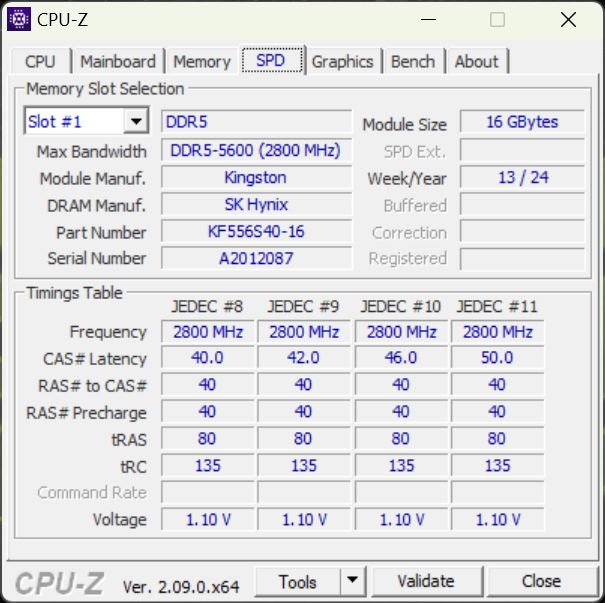
Nel negozio Schenker in Germania, i prezzi del Core 15 partono da circa 1.500 dollari (tasso di conversione attuale). Grazie alla batteria più grande, al Wi-Fi 6E, alla maggiore quantità di RAM e all'SSD Samsung 990 Pro, il nostro modello di recensione costa circa 1.700 dollari. Per contro, i prezzi del Fusion 15 partono da circa 1.600 dollari.
SCHENKER XMG Core 15 (M24)
- 07/17/2024 v8
Christian Hintze
 Total Sustainability Score:
 Transparency
La selezione dei dispositivi da recensire viene effettuata dalla nostra redazione. Il campione di prova è stato fornito all'autore come prestito dal produttore o dal rivenditore ai fini di questa recensione. L'istituto di credito non ha avuto alcuna influenza su questa recensione, né il produttore ne ha ricevuto una copia prima della pubblicazione. Non vi era alcun obbligo di pubblicare questa recensione. Non accettiamo mai compensi o pagamenti in cambio delle nostre recensioni. In quanto società mediatica indipendente, Notebookcheck non è soggetta all'autorità di produttori, rivenditori o editori.
Ecco come Notebookcheck esegue i test
Ogni anno, Notebookcheck esamina in modo indipendente centinaia di laptop e smartphone utilizzando procedure standardizzate per garantire che tutti i risultati siano comparabili. Da circa 20 anni sviluppiamo continuamente i nostri metodi di prova e nel frattempo stabiliamo gli standard di settore. Nei nostri laboratori di prova, tecnici ed editori esperti utilizzano apparecchiature di misurazione di alta qualità. Questi test comportano un processo di validazione in più fasi. Il nostro complesso sistema di valutazione si basa su centinaia di misurazioni e parametri di riferimento ben fondati, che mantengono l'obiettività.Price comparison

