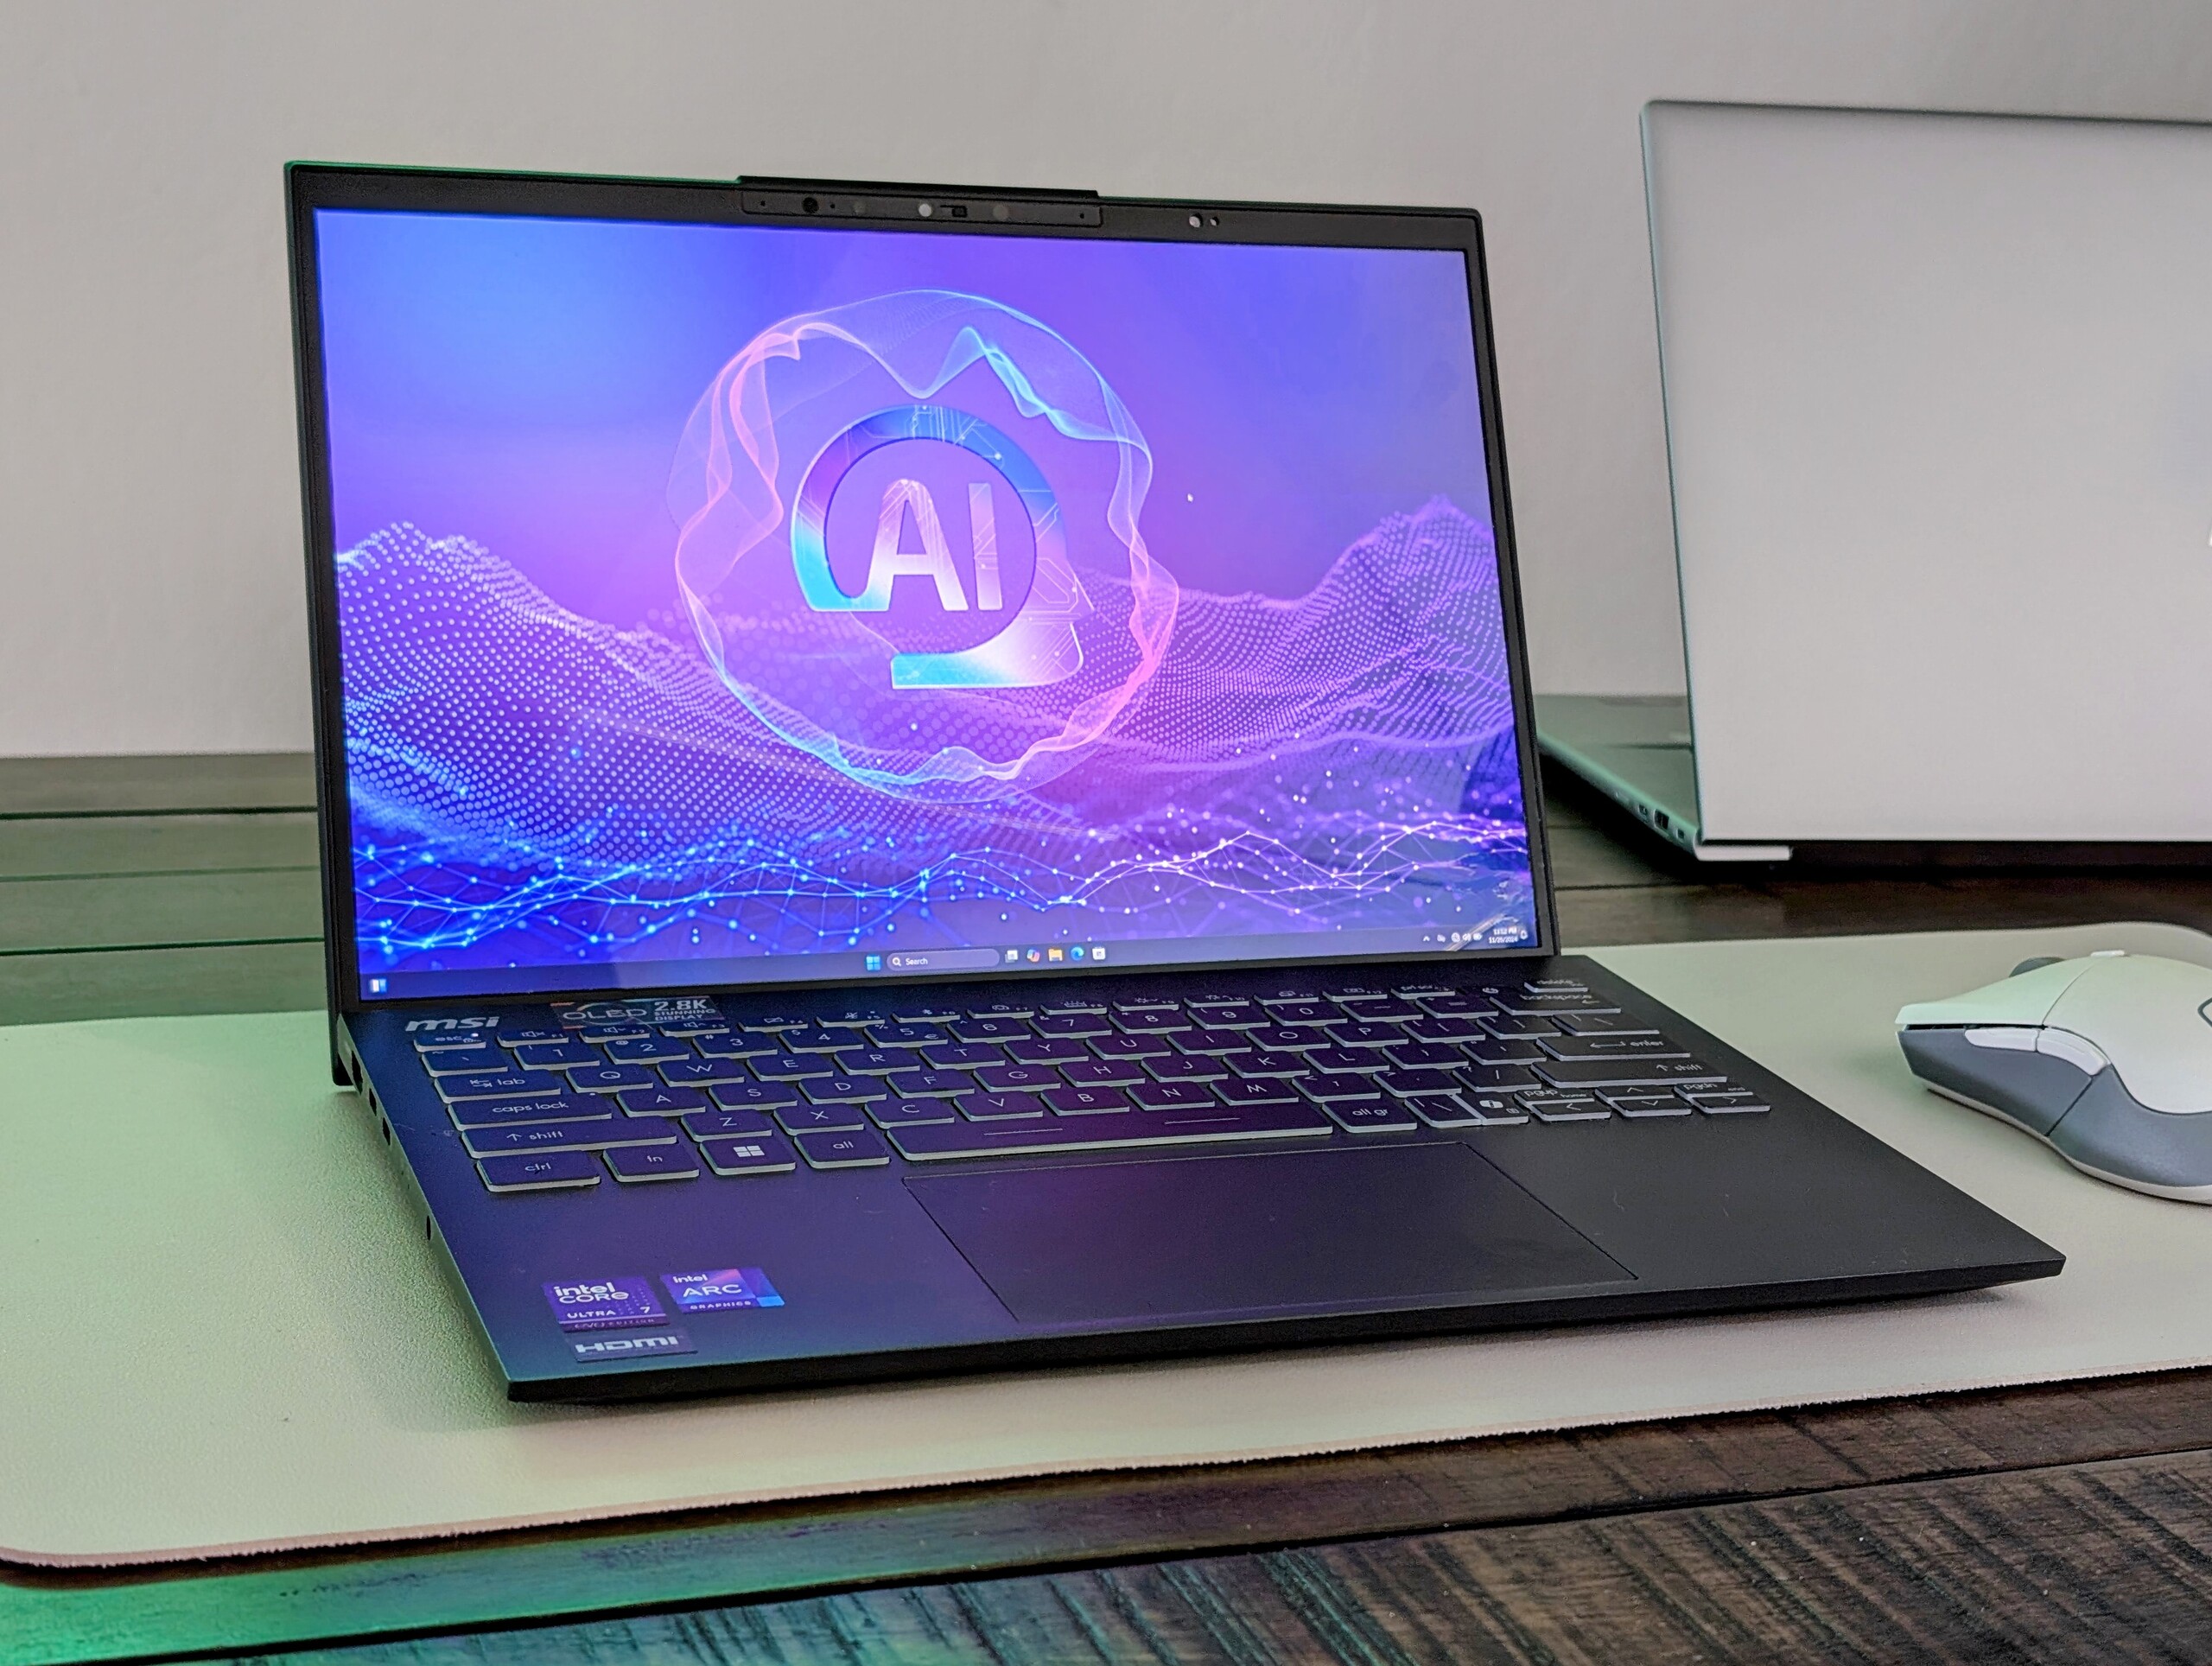
Recensione del portatile MSI Prestige 13 AI Plus Evo: Grandi prestazioni grafiche per meno di 1 kg
Core Ultra 7 258V vs. Core Ultra 7 155H.
MSI ha rinnovato il suo laptop da 13 pollici più leggero con processori Lunar Lake, che sostituiscono le vecchie opzioni Meteor Lake. Le modifiche hanno aumentato la durata della batteria e il potenziale grafico, senza aumentare il rumore della ventola o il peso.Allen Ngo, 👁 Allen Ngo (traduzione a cura di DeepL / Ninh Duy) Pubblicato 🇺🇸 🇫🇷 ...
Verdetto - Prestazioni e porte impressionanti per il peso
Una delle nostre principali lamentele sull'originale Prestige 13 AI Evo era il throttling del processore più marcato del previsto quando si eseguono carichi intensivi della CPU. La nuova CPU Lunar Lake risolve questo problema abbassando il potenziale Turbo Boost massimo e aumentando il livello minimo di prestazioni quando si eseguono tali carichi. Questo ha permesso di ottenere prestazioni più stabili e più veloci nel tempo, che dovrebbero essere apprezzate dai creatori di contenuti o dagli editori che devono elaborare o codificare file o video più grandi. Inoltre, questi vantaggi non sembrano avere un impatto significativo sulla durata della batteria, sulla temperatura o sulla rumorosità della ventola tra il Prestige 13 AI Evo e il nuovo Prestige 13 AI Plus Evo.
Le prestazioni grafiche sono aumentate in modo significativo. da 1,5x a 2x a seconda dell'applicazione. Sebbene non sia una macchina da gioco, l'Arc 140V è comunque impressionante, vista la leggerezza del portatile MSI.
Mentre le prestazioni hanno registrato un aumento quasi universale, tutti gli altri svantaggi che abbiamo menzionato nella nostra recensione di Prestige 13 AI Evo rimangono invariati. Il display OLED da 1800p, pur essendo nitido e vivido, è limitato a soli 60 Hz, senza opzioni VRR o touchscreen. Anche la qualità della webcam e la rigidità del telaio sono un po' inferiori rispetto alle alternative più pesanti di Dell o HP. Tuttavia, MSI offre molte prestazioni e porte, visto il suo peso ridotto.
Pro
Contro
Prezzo e disponibilità
Amazon sta spedendo l'MSI Prestige 13 AI Plus Evo, come recensito, al prezzo di 1400 dollari.
Potenziali concorrenti a confrontos
Immagine | Modello | Prezzo | Peso | Altezza | Schermo |
|---|---|---|---|---|---|
| MSI Prestige 13 AI Plus Evo A2VMG Intel Core Ultra 7 258V ⎘ Intel Arc Graphics 140V ⎘ 32 GB Memoria | Amazon: $1,349.99 Prezzo di listino: 1400 USD | 970 gr | 16.9 mm | 13.30" 2880x1800 255 PPI OLED | |
| MSI Prestige 13 AI Evo Intel Core Ultra 7 155H ⎘ Intel Arc 8-Core iGPU ⎘ 32 GB Memoria, 1024 GB SSD | Amazon: $1,349.99 Prezzo di listino: 1599€ | 967 gr | 16.9 mm | 13.30" 2880x1800 OLED | |
| Dell XPS 13 9350 Intel Core Ultra 7 256V ⎘ Intel Arc Graphics 140V ⎘ 16 GB Memoria, 512 GB SSD | Amazon: 1. $1,499.99 2025 Latest Dell XPS 13 9350... 2. $1,699.00 NewDell XPS 13 9350 Powerful... 3. $1,599.99 Dell XPS 13 9340 Business La... Prezzo di listino: 1400 USD | 1.2 kg | 15.3 mm | 13.40" 1920x1200 169 PPI IPS | |
| Framework Laptop 13.5 Core Ultra 7 155H Intel Core Ultra 7 155H ⎘ Intel Arc 8-Core iGPU ⎘ 32 GB Memoria | Prezzo di listino: 1500 USD | 1.4 kg | 15.85 mm | 13.50" 2880x1920 256 PPI IPS | |
| Lenovo Yoga Book 9 13IMU9 Intel Core Ultra 7 155U ⎘ Intel Graphics 4-Core iGPU (Arc) ⎘ 16 GB Memoria | Amazon: $2,500.00 Prezzo di listino: 2000 USD | 1.4 kg | 15.95 mm | 13.30" 2880x1800 255 PPI OLED | |
| HP Dragonfly G4 Intel Core i7-1365U ⎘ Intel Iris Xe Graphics G7 96EUs ⎘ 16 GB Memoria, 512 GB SSD | Amazon: $1,286.93 Prezzo di listino: 1700 USD | 1.1 kg | 16.3 mm | 13.50" 1920x1280 171 PPI IPS |
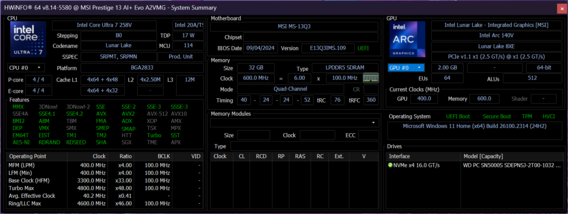
Sono passati solo sei mesi dal lancio del Prestige 13 AI Evo originale e MSI ha già aggiornato il modello con i nuovi processori Intel. Chiamata Prestige 13 AI Plus Evo, l'ultima iterazione è dotata di CPU Lunar Lake anziché Meteor Lake.
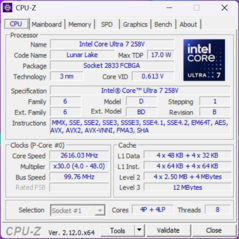
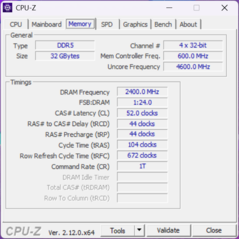
La nostra unità di prova è una configurazione intermedia con Core Ultra 7 258V, 32 GB di RAM LPDDR5x-8533 e display OLED 1800p per circa 1400 dollari. Altre SKU possono essere fornite con un Core Ultra 9 288V o un Core Ultra 7 256V con metà della RAM.
I concorrenti includono altri subnotebook di fascia alta come il modello Dell XPS 13 9350, Framework Laptop 13.5o il HP Dragonfly 14.
Altre recensioni di MSI:
I nostri Top 10
» Top 10 Portatili Multimedia
» Top 10 Portatili Gaming
» Top 10 Portatili Gaming Leggeri
» Top 10 Portatili da Ufficio e Business economici
» Top 10 Portatili Premium da Ufficio/Business
» Top 10 Portatili sotto i 300 Euro
» Top 10 Portatili sotto i 500 Euro
» Top 10 dei Portatili Workstation
» Top 10 Subnotebooks
» Top 10 Ultrabooks
» Top 10 Convertibili
» Top 10 Tablets
» Top 10 Tablets Windows
» Top 10 Smartphones
Specifiche
Caso
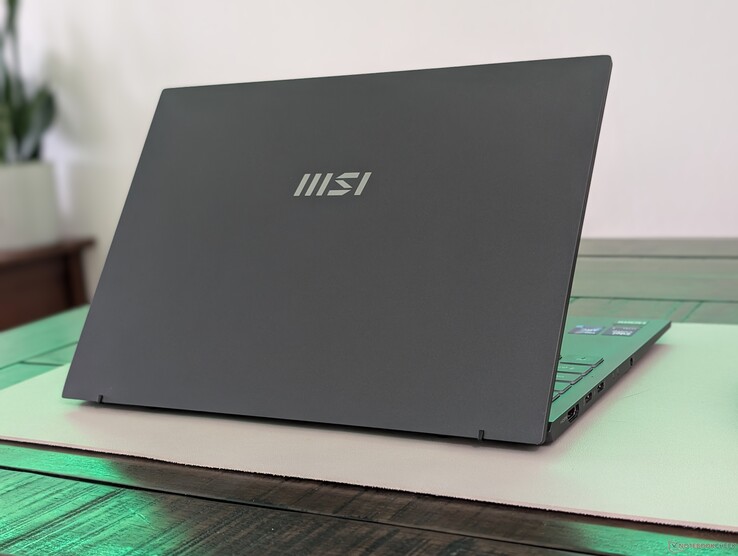
Le consigliamo di consultare la nostra recensione del Prestige 13 AI Evo, poiché non ci sono differenze esterne rispetto al Prestige 13 AI Plus Evo. Il sistema è uno dei subnotebook da 13 pollici più leggeri sul mercato, con un peso inferiore a 1 kg, ma lo chassis tende a flettersi e a scricchiolare più facilmente rispetto ai modelli più pesanti come l'XPS 13.
Connettività
Prestige 13 AI è uno dei pochi subnotebook rimasti con porte HDMI e USB-A integrate. Apprezziamo il fatto che il sistema non si affidi completamente alle sole porte USB-C.
Lettore di schede SD
| SD Card Reader | |
| average JPG Copy Test (av. of 3 runs) | |
| Framework Laptop 13.5 Core Ultra 7 155H (Toshiba Exceria Pro SDXC 64 GB UHS-II) | |
| MSI Prestige 13 AI Evo (Angelbird AV Pro V60) | |
| MSI Prestige 13 AI Plus Evo A2VMG (Angelbird AV Pro V60) | |
| maximum AS SSD Seq Read Test (1GB) | |
| Framework Laptop 13.5 Core Ultra 7 155H (Toshiba Exceria Pro SDXC 64 GB UHS-II) | |
| MSI Prestige 13 AI Evo (Angelbird AV Pro V60) | |
| MSI Prestige 13 AI Plus Evo A2VMG (Angelbird AV Pro V60) | |
Comunicazione
È interessante notare che la nostra unità viene fornita con l'Intel Killer AX1775s anziché con il BE1750W, come si trova nella configurazione Core Ultra 7 155H. L'AX1775s non supporta il Wi-Fi 7, a differenza del BE1750W.
Webcam
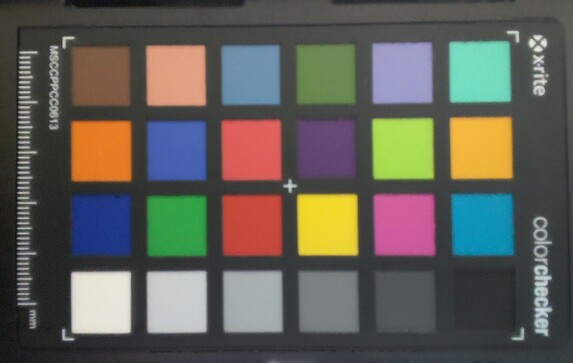
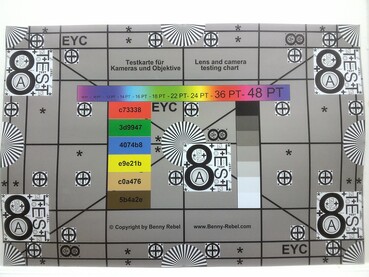
La qualità della webcam è migliorata da 2 MP sul modello originale a 5 MP per immagini più nitide.
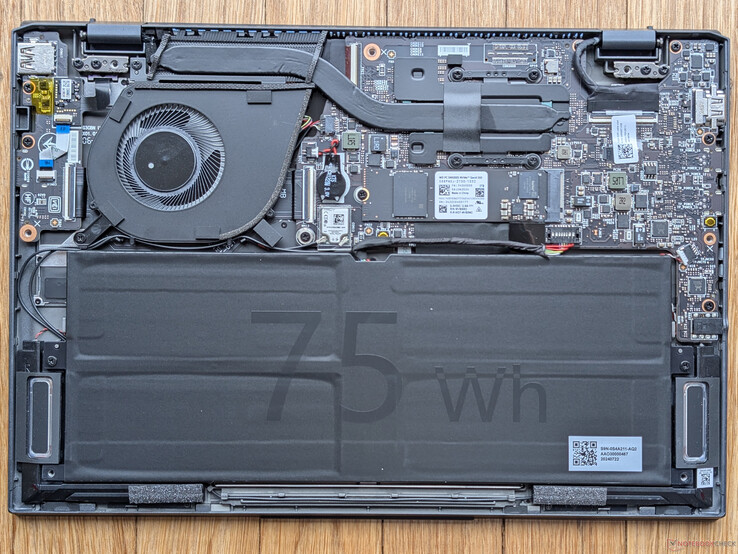
Manutenzione
Sostenibilità
Il modello segue le linee guida EPEAT Silver per la sostenibilità, mentre l'imballaggio è per lo più di cartone e carta, con qualche involucro di plastica intorno al portatile e all'adattatore CA.
Display
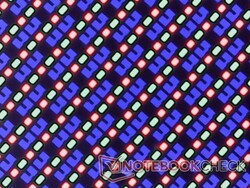
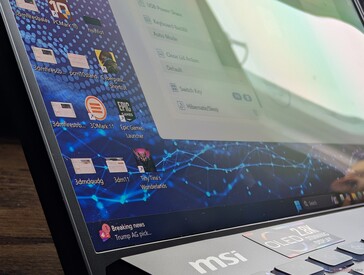
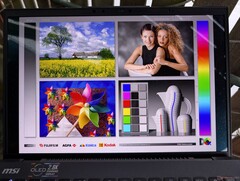
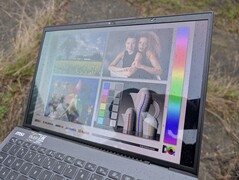
Il display OLED Samsung da 1800p rimane lo stesso di prima. Sebbene la qualità dell'immagine sia eccellente e senza problemi di granulosità, avremmo preferito un aggiornamento della frequenza di aggiornamento a 90 Hz o 120 Hz, in quanto 60 Hz iniziano a sembrare obsoleti per un subnotebook di fascia alta.
La luminosità massima può raggiungere i 598 nit se si attiva la modalità HDR. Altrimenti, raggiunge un picco di 382 nits in modalità SDR.
| |||||||||||||||||||||||||
Distribuzione della luminosità: 99 %
Al centro con la batteria: 382.4 cd/m²
Contrasto: ∞:1 (Nero: 0 cd/m²)
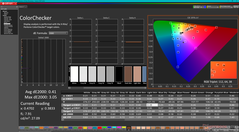
ΔE Color 3.84 | 0.5-29.43 Ø4.87, calibrated: 0.41
ΔE Greyscale 0.7 | 0.5-98 Ø5.1
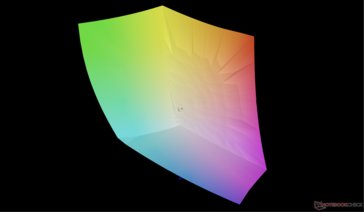
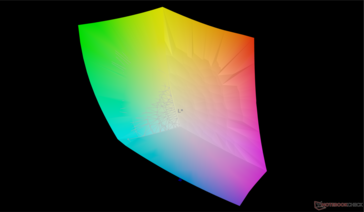
95.8% AdobeRGB 1998 (Argyll 2.2.0 3D)
100% sRGB (Argyll 2.2.0 3D)
99.9% Display P3 (Argyll 2.2.0 3D)
Gamma: 2.23
| MSI Prestige 13 AI Plus Evo A2VMG ATNA33AA07-0, OLED, 2880x1800, 13.3", 60 Hz | MSI Prestige 13 AI Evo ATNA33AA07-0, OLED, 2880x1800, 13.3", 60 Hz | Dell XPS 13 9350 LG Philips 134WU2, IPS, 1920x1200, 13.4", 120 Hz | Framework Laptop 13.5 Core Ultra 7 155H BOE NE135A1M-NY1, IPS, 2880x1920, 13.5", 120 Hz | Lenovo Yoga Book 9 13IMU9 SDC ATNA33AA02-0, OLED, 2880x1800, 13.3", 60 Hz | HP Dragonfly G4 Chi Mei CMN13C0, IPS, 1920x1280, 13.5", 60 Hz | |
|---|---|---|---|---|---|---|
| Display | 1% | -21% | -17% | 0% | -20% | |
| Display P3 Coverage | 99.9 | 99.9 0% | 67.3 -33% | 72.8 -27% | 99.7 0% | 68.4 -32% |
| sRGB Coverage | 100 | 100 0% | 99 -1% | 98.6 -1% | 100 0% | 98.3 -2% |
| AdobeRGB 1998 Coverage | 95.8 | 97.8 2% | 68.6 -28% | 72.9 -24% | 97 1% | 70.4 -27% |
| Response Times | 117% | -1503% | -1567% | -0% | -1933% | |
| Response Time Grey 50% / Grey 80% * | 1.94 ? | 1.54 ? 21% | 37.3 ? -1823% | 41.9 ? -2060% | 1.88 ? 3% | 48.8 ? -2415% |
| Response Time Black / White * | 2.02 ? | 1.44 ? 29% | 25.9 ? -1182% | 23.7 ? -1073% | 2.1 ? -4% | 31.3 ? -1450% |
| PWM Frequency | 60 ? | 240 ? 300% | 60 ? 0% | |||
| Screen | 3% | 17% | -108% | -50% | -27% | |
| Brightness middle | 382.4 | 404 6% | 462.8 21% | 498.5 30% | 362.6 -5% | 408.8 7% |
| Brightness | 383 | 407 6% | 435 14% | 464 21% | 368 -4% | 399 4% |
| Brightness Distribution | 99 | 98 -1% | 87 -12% | 86 -13% | 97 -2% | 90 -9% |
| Black Level * | 0.19 | 0.36 | 0.32 | |||
| Colorchecker dE 2000 * | 3.84 | 2.1 45% | 1.92 50% | 4.27 -11% | 4.66 -21% | 2.02 47% |
| Colorchecker dE 2000 max. * | 6.66 | 4.3 35% | 3.45 48% | 7.08 -6% | 7.25 -9% | 3.84 42% |
| Colorchecker dE 2000 calibrated * | 0.41 | 0.48 -17% | 1.26 -207% | 0.56 -37% | 0.61 -49% | |
| Greyscale dE 2000 * | 0.7 | 1.2 -71% | 0.6 14% | 4.7 -571% | 2.6 -271% | 2.3 -229% |
| Gamma | 2.23 99% | 2.16 102% | 2.19 100% | 2.09 105% | 2.2 100% | 2.2 100% |
| CCT | 6475 100% | 6465 101% | 6539 99% | 7417 88% | 6055 107% | 6203 105% |
| Contrast | 2436 | 1385 | 1278 | |||
| Media totale (Programma / Settaggio) | 40% /
31% | -502% /
-246% | -564% /
-329% | -17% /
-27% | -660% /
-343% |
* ... Meglio usare valori piccoli
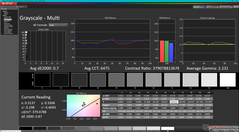
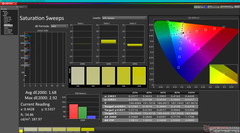
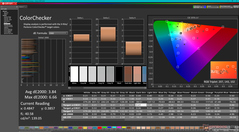
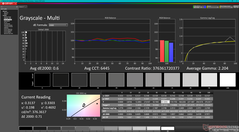
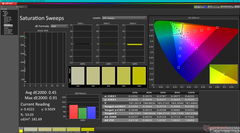
Il display è ben calibrato rispetto allo standard P3, con valori medi di scala di grigi e deltaE di ColorChecker di appena 0,7 e 3,84, rispettivamente.
Tempi di risposta del Display
| ↔ Tempi di risposta dal Nero al Bianco | ||
|---|---|---|
| 2.02 ms ... aumenta ↗ e diminuisce ↘ combinato | ↗ 0.92 ms Incremento | |
| ↘ 1.1 ms Calo | ||
| Lo schermo ha mostrato valori di risposta molto veloci nei nostri tests ed è molto adatto per i gaming veloce. In confronto, tutti i dispositivi di test variano da 0.1 (minimo) a 240 (massimo) ms. » 9 % di tutti i dispositivi è migliore. Questo significa che i tempi di risposta rilevati sono migliori rispettto alla media di tutti i dispositivi testati (20.7 ms). | ||
| ↔ Tempo di risposta dal 50% Grigio all'80% Grigio | ||
| 1.94 ms ... aumenta ↗ e diminuisce ↘ combinato | ↗ 1 ms Incremento | |
| ↘ 0.94 ms Calo | ||
| Lo schermo ha mostrato valori di risposta molto veloci nei nostri tests ed è molto adatto per i gaming veloce. In confronto, tutti i dispositivi di test variano da 0.165 (minimo) a 636 (massimo) ms. » 7 % di tutti i dispositivi è migliore. Questo significa che i tempi di risposta rilevati sono migliori rispettto alla media di tutti i dispositivi testati (32.5 ms). | ||
Sfarfallio dello schermo / PWM (Pulse-Width Modulation)
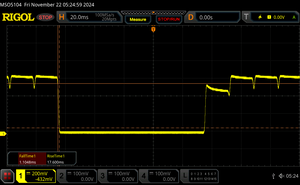
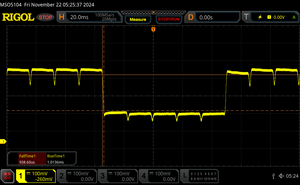
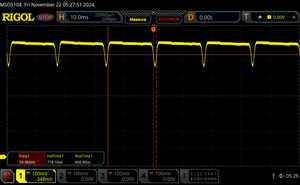
| flickering dello schermo / PWM rilevato | 60 Hz Amplitude: 21.9 % | ≤ 100 % settaggio luminosita' | |
Il display sfarfalla a 60 Hz (Probabilmente a causa dell'uso di PWM) Flickering rilevato ad una luminosita' di 100 % o inferiore. Non dovrebbe verificarsi flickering o PWM sopra questo valore di luminosita'. La frequenza di 60 Hz è molto bassa, quindi il flickering potrebbe causare stanchezza agli occhi e mal di testa con un utilizzo prolungato. In confronto: 53 % di tutti i dispositivi testati non utilizza PWM per ridurre la luminosita' del display. Se è rilevato PWM, una media di 8500 (minimo: 5 - massimo: 343500) Hz è stata rilevata. | |||
Prestazioni
Condizioni del test
Abbiamo impostato sia Windows che MSI Center sulla modalità Prestazioni prima di eseguire i benchmark qui sotto. È disponibile anche la modalità Cooler Boost (alias modalità ventola massima), ma non ha un impatto significativo sulle prestazioni, come dimostrano i nostri benchmark qui sotto.
Processore
Rispetto al Core Ultra 7 155H, il nostro Core Ultra 7 258V ha un potenziale Turbo Boost più lento, ma prestazioni più stabili e veloci per periodi più lunghi. Questo è evidente quando si esegue CineBench R15 xT in un ciclo, come mostra il grafico sottostante, dove la configurazione Core Ultra 7 155H supera la nostra configurazione Core Ultra 7 258V solo all'inizio del test, prima di subire un throttling più pesante dopo il primo ciclo.
Cinebench R15 Multi Loop
Cinebench R23: Multi Core | Single Core
Cinebench R20: CPU (Multi Core) | CPU (Single Core)
Cinebench R15: CPU Multi 64Bit | CPU Single 64Bit
Blender: v2.79 BMW27 CPU
7-Zip 18.03: 7z b 4 | 7z b 4 -mmt1
Geekbench 6.4: Multi-Core | Single-Core
Geekbench 5.5: Multi-Core | Single-Core
HWBOT x265 Benchmark v2.2: 4k Preset
LibreOffice : 20 Documents To PDF
R Benchmark 2.5: Overall mean
* ... Meglio usare valori piccoli
AIDA64: FP32 Ray-Trace | FPU Julia | CPU SHA3 | CPU Queen | FPU SinJulia | FPU Mandel | CPU AES | CPU ZLib | FP64 Ray-Trace | CPU PhotoWorxx
| Performance Rating | |
| Framework Laptop 13.5 Core Ultra 7 155H | |
| MSI Prestige 13 AI Plus Evo A2VMG | |
| Dell XPS 13 9350 | |
| Media Intel Core Ultra 7 258V | |
| Lenovo Yoga Book 9 13IMU9 | |
| MSI Prestige 13 AI Evo | |
| HP Dragonfly G4 | |
| AIDA64 / FP32 Ray-Trace | |
| MSI Prestige 13 AI Plus Evo A2VMG | |
| Dell XPS 13 9350 | |
| Media Intel Core Ultra 7 258V (9215 - 12781, n=14) | |
| Framework Laptop 13.5 Core Ultra 7 155H | |
| Lenovo Yoga Book 9 13IMU9 | |
| HP Dragonfly G4 | |
| MSI Prestige 13 AI Evo | |
| AIDA64 / FPU Julia | |
| MSI Prestige 13 AI Plus Evo A2VMG | |
| Dell XPS 13 9350 | |
| Framework Laptop 13.5 Core Ultra 7 155H | |
| Media Intel Core Ultra 7 258V (48758 - 63401, n=14) | |
| MSI Prestige 13 AI Evo | |
| Lenovo Yoga Book 9 13IMU9 | |
| HP Dragonfly G4 | |
| AIDA64 / CPU SHA3 | |
| MSI Prestige 13 AI Plus Evo A2VMG | |
| Framework Laptop 13.5 Core Ultra 7 155H | |
| Dell XPS 13 9350 | |
| Media Intel Core Ultra 7 258V (2271 - 2817, n=14) | |
| Lenovo Yoga Book 9 13IMU9 | |
| MSI Prestige 13 AI Evo | |
| HP Dragonfly G4 | |
| AIDA64 / CPU Queen | |
| Framework Laptop 13.5 Core Ultra 7 155H | |
| HP Dragonfly G4 | |
| MSI Prestige 13 AI Evo | |
| MSI Prestige 13 AI Plus Evo A2VMG | |
| Media Intel Core Ultra 7 258V (49510 - 49818, n=14) | |
| Dell XPS 13 9350 | |
| Lenovo Yoga Book 9 13IMU9 | |
| AIDA64 / FPU SinJulia | |
| Framework Laptop 13.5 Core Ultra 7 155H | |
| MSI Prestige 13 AI Evo | |
| Lenovo Yoga Book 9 13IMU9 | |
| HP Dragonfly G4 | |
| Dell XPS 13 9350 | |
| MSI Prestige 13 AI Plus Evo A2VMG | |
| Media Intel Core Ultra 7 258V (4103 - 4440, n=14) | |
| AIDA64 / FPU Mandel | |
| MSI Prestige 13 AI Plus Evo A2VMG | |
| Dell XPS 13 9350 | |
| Media Intel Core Ultra 7 258V (25361 - 33565, n=14) | |
| Framework Laptop 13.5 Core Ultra 7 155H | |
| MSI Prestige 13 AI Evo | |
| Lenovo Yoga Book 9 13IMU9 | |
| HP Dragonfly G4 | |
| AIDA64 / CPU AES | |
| Framework Laptop 13.5 Core Ultra 7 155H | |
| MSI Prestige 13 AI Evo | |
| Lenovo Yoga Book 9 13IMU9 | |
| Dell XPS 13 9350 | |
| MSI Prestige 13 AI Plus Evo A2VMG | |
| Media Intel Core Ultra 7 258V (37728 - 40753, n=14) | |
| HP Dragonfly G4 | |
| AIDA64 / CPU ZLib | |
| Framework Laptop 13.5 Core Ultra 7 155H | |
| Lenovo Yoga Book 9 13IMU9 | |
| MSI Prestige 13 AI Plus Evo A2VMG | |
| Media Intel Core Ultra 7 258V (499 - 632, n=14) | |
| MSI Prestige 13 AI Evo | |
| Dell XPS 13 9350 | |
| HP Dragonfly G4 | |
| AIDA64 / FP64 Ray-Trace | |
| MSI Prestige 13 AI Plus Evo A2VMG | |
| Dell XPS 13 9350 | |
| Media Intel Core Ultra 7 258V (4891 - 6930, n=14) | |
| Framework Laptop 13.5 Core Ultra 7 155H | |
| Lenovo Yoga Book 9 13IMU9 | |
| MSI Prestige 13 AI Evo | |
| HP Dragonfly G4 | |
| AIDA64 / CPU PhotoWorxx | |
| MSI Prestige 13 AI Plus Evo A2VMG | |
| Media Intel Core Ultra 7 258V (51323 - 54971, n=14) | |
| Dell XPS 13 9350 | |
| Framework Laptop 13.5 Core Ultra 7 155H | |
| Lenovo Yoga Book 9 13IMU9 | |
| MSI Prestige 13 AI Evo | |
| HP Dragonfly G4 | |
Prestazioni del sistema
CrossMark: Overall | Productivity | Creativity | Responsiveness
WebXPRT 3: Overall
WebXPRT 4: Overall
Mozilla Kraken 1.1: Total
| PCMark 10 / Score | |
| Dell XPS 13 9350 | |
| Media Intel Core Ultra 7 258V, Intel Arc Graphics 140V (6265 - 7314, n=14) | |
| Framework Laptop 13.5 Core Ultra 7 155H | |
| MSI Prestige 13 AI Plus Evo A2VMG | |
| Lenovo Yoga Book 9 13IMU9 | |
| MSI Prestige 13 AI Evo | |
| HP Dragonfly G4 | |
| PCMark 10 / Essentials | |
| Lenovo Yoga Book 9 13IMU9 | |
| HP Dragonfly G4 | |
| Framework Laptop 13.5 Core Ultra 7 155H | |
| Media Intel Core Ultra 7 258V, Intel Arc Graphics 140V (9295 - 11467, n=14) | |
| MSI Prestige 13 AI Plus Evo A2VMG | |
| Dell XPS 13 9350 | |
| MSI Prestige 13 AI Evo | |
| PCMark 10 / Productivity | |
| Dell XPS 13 9350 | |
| Media Intel Core Ultra 7 258V, Intel Arc Graphics 140V (7357 - 9619, n=14) | |
| MSI Prestige 13 AI Evo | |
| Framework Laptop 13.5 Core Ultra 7 155H | |
| MSI Prestige 13 AI Plus Evo A2VMG | |
| Lenovo Yoga Book 9 13IMU9 | |
| HP Dragonfly G4 | |
| PCMark 10 / Digital Content Creation | |
| MSI Prestige 13 AI Plus Evo A2VMG | |
| Dell XPS 13 9350 | |
| Media Intel Core Ultra 7 258V, Intel Arc Graphics 140V (9333 - 10048, n=14) | |
| Framework Laptop 13.5 Core Ultra 7 155H | |
| Lenovo Yoga Book 9 13IMU9 | |
| MSI Prestige 13 AI Evo | |
| HP Dragonfly G4 | |
| CrossMark / Overall | |
| Dell XPS 13 9350 | |
| MSI Prestige 13 AI Plus Evo A2VMG | |
| Media Intel Core Ultra 7 258V, Intel Arc Graphics 140V (1590 - 1742, n=13) | |
| Framework Laptop 13.5 Core Ultra 7 155H | |
| HP Dragonfly G4 | |
| Lenovo Yoga Book 9 13IMU9 | |
| MSI Prestige 13 AI Evo | |
| CrossMark / Productivity | |
| Dell XPS 13 9350 | |
| MSI Prestige 13 AI Plus Evo A2VMG | |
| Media Intel Core Ultra 7 258V, Intel Arc Graphics 140V (1558 - 1684, n=13) | |
| HP Dragonfly G4 | |
| Framework Laptop 13.5 Core Ultra 7 155H | |
| MSI Prestige 13 AI Evo | |
| Lenovo Yoga Book 9 13IMU9 | |
| CrossMark / Creativity | |
| MSI Prestige 13 AI Plus Evo A2VMG | |
| Dell XPS 13 9350 | |
| Media Intel Core Ultra 7 258V, Intel Arc Graphics 140V (1727 - 1977, n=13) | |
| Framework Laptop 13.5 Core Ultra 7 155H | |
| HP Dragonfly G4 | |
| Lenovo Yoga Book 9 13IMU9 | |
| MSI Prestige 13 AI Evo | |
| CrossMark / Responsiveness | |
| HP Dragonfly G4 | |
| Framework Laptop 13.5 Core Ultra 7 155H | |
| Dell XPS 13 9350 | |
| MSI Prestige 13 AI Plus Evo A2VMG | |
| Media Intel Core Ultra 7 258V, Intel Arc Graphics 140V (1251 - 1411, n=13) | |
| MSI Prestige 13 AI Evo | |
| Lenovo Yoga Book 9 13IMU9 | |
| WebXPRT 3 / Overall | |
| Dell XPS 13 9350 | |
| HP Dragonfly G4 | |
| MSI Prestige 13 AI Plus Evo A2VMG | |
| Framework Laptop 13.5 Core Ultra 7 155H | |
| Media Intel Core Ultra 7 258V, Intel Arc Graphics 140V (219 - 314, n=12) | |
| Lenovo Yoga Book 9 13IMU9 | |
| MSI Prestige 13 AI Evo | |
| WebXPRT 4 / Overall | |
| MSI Prestige 13 AI Plus Evo A2VMG | |
| Dell XPS 13 9350 | |
| Media Intel Core Ultra 7 258V, Intel Arc Graphics 140V (199.5 - 291, n=14) | |
| HP Dragonfly G4 | |
| Framework Laptop 13.5 Core Ultra 7 155H | |
| Lenovo Yoga Book 9 13IMU9 | |
| MSI Prestige 13 AI Evo | |
| Mozilla Kraken 1.1 / Total | |
| Lenovo Yoga Book 9 13IMU9 | |
| MSI Prestige 13 AI Evo | |
| Framework Laptop 13.5 Core Ultra 7 155H | |
| HP Dragonfly G4 | |
| Media Intel Core Ultra 7 258V, Intel Arc Graphics 140V (468 - 559, n=14) | |
| MSI Prestige 13 AI Plus Evo A2VMG | |
| Dell XPS 13 9350 | |
* ... Meglio usare valori piccoli
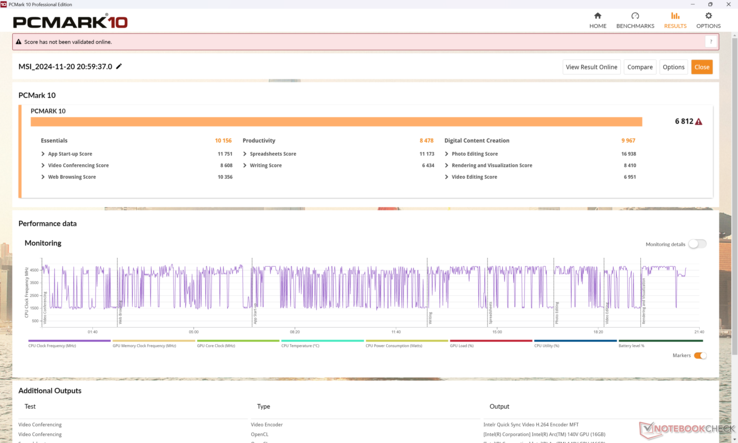
| PCMark 10 Score | 6812 punti | |
Aiuto | ||
| AIDA64 / Memory Copy | |
| Media Intel Core Ultra 7 258V (107682 - 114336, n=14) | |
| MSI Prestige 13 AI Plus Evo A2VMG | |
| Dell XPS 13 9350 | |
| MSI Prestige 13 AI Evo | |
| Lenovo Yoga Book 9 13IMU9 | |
| Framework Laptop 13.5 Core Ultra 7 155H | |
| HP Dragonfly G4 | |
| AIDA64 / Memory Read | |
| Dell XPS 13 9350 | |
| Media Intel Core Ultra 7 258V (82846 - 89417, n=14) | |
| MSI Prestige 13 AI Plus Evo A2VMG | |
| Framework Laptop 13.5 Core Ultra 7 155H | |
| MSI Prestige 13 AI Evo | |
| Lenovo Yoga Book 9 13IMU9 | |
| HP Dragonfly G4 | |
| AIDA64 / Memory Write | |
| MSI Prestige 13 AI Plus Evo A2VMG | |
| Media Intel Core Ultra 7 258V (109734 - 117935, n=14) | |
| Dell XPS 13 9350 | |
| MSI Prestige 13 AI Evo | |
| Framework Laptop 13.5 Core Ultra 7 155H | |
| HP Dragonfly G4 | |
| Lenovo Yoga Book 9 13IMU9 | |
| AIDA64 / Memory Latency | |
| MSI Prestige 13 AI Evo | |
| Lenovo Yoga Book 9 13IMU9 | |
| Framework Laptop 13.5 Core Ultra 7 155H | |
| MSI Prestige 13 AI Plus Evo A2VMG | |
| Dell XPS 13 9350 | |
| Media Intel Core Ultra 7 258V (95 - 101.1, n=14) | |
| HP Dragonfly G4 | |
* ... Meglio usare valori piccoli
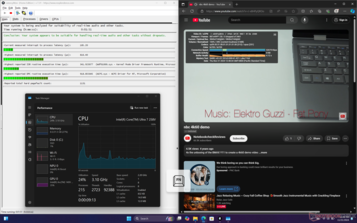
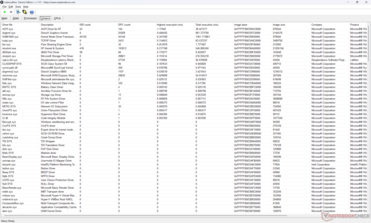
Latenza DPC
| DPC Latencies / LatencyMon - interrupt to process latency (max), Web, Youtube, Prime95 | |
| MSI Prestige 13 AI Evo | |
| Lenovo Yoga Book 9 13IMU9 | |
| HP Dragonfly G4 | |
| MSI Prestige 13 AI Plus Evo A2VMG | |
| Framework Laptop 13.5 Core Ultra 7 155H | |
* ... Meglio usare valori piccoli
Dispositivi di archiviazione
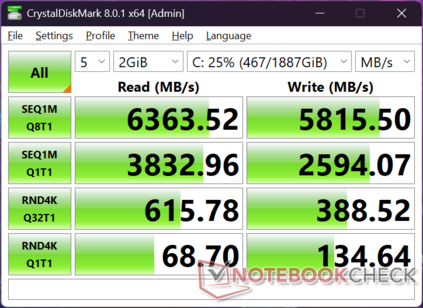
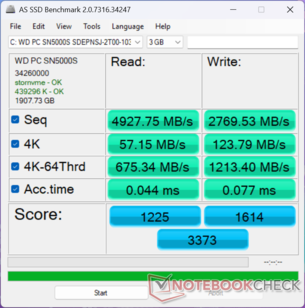
La nostra unità viene fornita con il WD SN5000S invece del Samsung PM9A1, presente nella nostra configurazione Core Ultra 7 155H. L'unità non presenta nessuno dei problemi di throttling che abbiamo riscontrato sul Prestige 13 AI originale.
| Drive Performance Rating - Percent | |
| MSI Prestige 13 AI Evo | |
| Framework Laptop 13.5 Core Ultra 7 155H | |
| HP Dragonfly G4 | |
| MSI Prestige 13 AI Plus Evo A2VMG | |
| Lenovo Yoga Book 9 13IMU9 | |
| Dell XPS 13 9350 | |
* ... Meglio usare valori piccoli
Disk Throttling: DiskSpd Read Loop, Queue Depth 8
Prestazioni della GPU
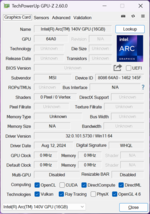
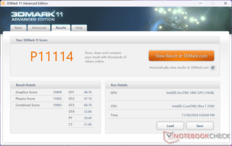
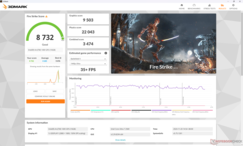
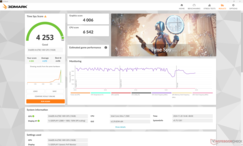
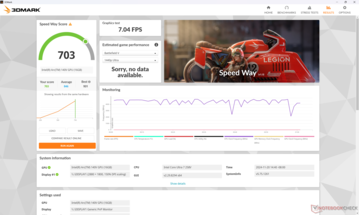
La nuova GPU integrata GPU Arc 140V è probabilmente uno dei maggiori aggiornamenti rispetto al modello Arc 8 nella configurazione Core Ultra 7 155H. i risultati di 3DMark sono da 1,5 a 2 volte più veloci e questo si traduce abbastanza bene in scenari di gioco come GTA V o persino Cyberpunk 2077 , dove la configurazione Core Ultra 7 155H tende a sottoperformare.
| Profilo di potenza | Punteggio grafico | Punteggio Fisica | Punteggio combinato |
| Modalità Prestazioni (Cooler Boost attivo) | 9513 | 21842 | 3426 |
| Modalità Performance (Cooler Boost disattivato) | 9503 | 22043 | 3474 |
| Modalità Bilanciata | 9376 | 21037 | 3019 |
| Alimentazione a batteria | 9471 | 21837 | 3440 |
L'utilizzo del sistema con Cooler Boost abilitato o in modalità Bilanciata o anche solo a batteria non avrà un impatto significativo sulle prestazioni, come dimostra la nostra tabella dei risultati di Fire Strike qui sopra.
| 3DMark 11 Performance | 11114 punti | |
| 3DMark Cloud Gate Standard Score | 33012 punti | |
| 3DMark Fire Strike Score | 8732 punti | |
| 3DMark Time Spy Score | 4253 punti | |
| 3DMark Steel Nomad Score | 681 punti | |
Aiuto | ||
* ... Meglio usare valori piccoli
| Performance Rating - Percent | |
| MSI Prestige 13 AI Plus Evo A2VMG | |
| Dell XPS 13 9350 | |
| Framework Laptop 13.5 Core Ultra 7 155H | |
| MSI Prestige 13 AI Evo -2! | |
| Lenovo Yoga Book 9 13IMU9 -2! | |
| HP Dragonfly G4 -2! | |
| Cyberpunk 2077 2.2 Phantom Liberty - 1920x1080 Ultra Preset (FSR off) | |
| MSI Prestige 13 AI Plus Evo A2VMG | |
| Framework Laptop 13.5 Core Ultra 7 155H | |
| Dell XPS 13 9350 | |
| Lenovo Yoga Book 9 13IMU9 | |
| Baldur's Gate 3 - 1920x1080 Ultra Preset | |
| MSI Prestige 13 AI Plus Evo A2VMG | |
| Framework Laptop 13.5 Core Ultra 7 155H | |
| Dell XPS 13 9350 | |
| GTA V - 1920x1080 Highest Settings possible AA:4xMSAA + FX AF:16x | |
| MSI Prestige 13 AI Plus Evo A2VMG | |
| Dell XPS 13 9350 | |
| Framework Laptop 13.5 Core Ultra 7 155H | |
| HP Dragonfly G4 | |
| MSI Prestige 13 AI Evo | |
| Final Fantasy XV Benchmark - 1920x1080 High Quality | |
| MSI Prestige 13 AI Plus Evo A2VMG | |
| Dell XPS 13 9350 | |
| Framework Laptop 13.5 Core Ultra 7 155H | |
| MSI Prestige 13 AI Evo | |
| HP Dragonfly G4 | |
| Lenovo Yoga Book 9 13IMU9 | |
| Strange Brigade - 1920x1080 ultra AA:ultra AF:16 | |
| Dell XPS 13 9350 | |
| MSI Prestige 13 AI Plus Evo A2VMG | |
| Framework Laptop 13.5 Core Ultra 7 155H | |
| MSI Prestige 13 AI Evo | |
| Lenovo Yoga Book 9 13IMU9 | |
| HP Dragonfly G4 | |
| Dota 2 Reborn - 1920x1080 ultra (3/3) best looking | |
| MSI Prestige 13 AI Plus Evo A2VMG | |
| Dell XPS 13 9350 | |
| Framework Laptop 13.5 Core Ultra 7 155H | |
| Lenovo Yoga Book 9 13IMU9 | |
| HP Dragonfly G4 | |
| MSI Prestige 13 AI Evo | |
| X-Plane 11.11 - 1920x1080 high (fps_test=3) | |
| MSI Prestige 13 AI Plus Evo A2VMG | |
| Framework Laptop 13.5 Core Ultra 7 155H | |
| MSI Prestige 13 AI Evo | |
| Dell XPS 13 9350 | |
| HP Dragonfly G4 | |
| Lenovo Yoga Book 9 13IMU9 | |
Cyberpunk 2077 ultra FPS Chart
| basso | medio | alto | ultra | |
|---|---|---|---|---|
| GTA V (2015) | 161.6 | 155.6 | 67.4 | 26.7 |
| Dota 2 Reborn (2015) | 97.2 | 87.8 | 72.1 | 83 |
| Final Fantasy XV Benchmark (2018) | 84 | 46.2 | 31.7 | |
| X-Plane 11.11 (2018) | 56.6 | 42.6 | 36.9 | |
| Far Cry 5 (2018) | 92 | 57 | 49 | 45 |
| Strange Brigade (2018) | 216 | 74.6 | 63 | 55.4 |
| Tiny Tina's Wonderlands (2022) | 72.1 | 53.3 | 36 | 28 |
| F1 22 (2022) | 96.2 | 88.5 | 63.9 | 19.9 |
| Baldur's Gate 3 (2023) | 39.6 | 33.5 | 29.8 | 29.1 |
| Cyberpunk 2077 2.2 Phantom Liberty (2023) | 46.6 | 37.4 | 32.5 | 28.5 |
Emissioni
Rumore del sistema
Il rumore della ventola è generalmente più forte di prima quando si eseguono carichi più impegnativi come i giochi. Eseguendo Cyberpunk 2077 in modalità Performance, il livello di rumore della ventola è di 45 dB(A), rispetto ai quasi 51 dB(A) della modalità Cooler Boost.
Rumorosità
| Idle |
| 24.8 / 24.8 / 26.7 dB(A) |
| Sotto carico |
| 36.8 / 50.8 dB(A) |
 | ||
30 dB silenzioso 40 dB(A) udibile 50 dB(A) rumoroso |
||
min: | ||
| MSI Prestige 13 AI Plus Evo A2VMG Arc 140V, Core Ultra 7 258V | MSI Prestige 13 AI Evo Arc 8-Core, Ultra 7 155H, Samsung PM9A1 MZVL21T0HCLR | Dell XPS 13 9350 Arc 140V, Core Ultra 7 256V, Micron 2550 512GB | Framework Laptop 13.5 Core Ultra 7 155H Arc 8-Core, Ultra 7 155H | Lenovo Yoga Book 9 13IMU9 Graphics 4-Core, Ultra 7 155U | HP Dragonfly G4 Iris Xe G7 96EUs, i7-1365U, Micron 3400 MTFDKBA512TFH 512GB | |
|---|---|---|---|---|---|---|
| Noise | 6% | 11% | 1% | 16% | 12% | |
| off /ambiente * | 24.1 | 23.4 3% | 24.1 -0% | 24 -0% | 23.3 3% | 23.3 3% |
| Idle Minimum * | 24.8 | 23.4 6% | 24.4 2% | 24.1 3% | 23.3 6% | 23.5 5% |
| Idle Average * | 24.8 | 26.9 -8% | 24.4 2% | 25.1 -1% | 23.3 6% | 23.5 5% |
| Idle Maximum * | 26.7 | 26.9 -1% | 24.4 9% | 27 -1% | 24.6 8% | 26.8 -0% |
| Load Average * | 36.8 | 32 13% | 26.2 29% | 38.4 -4% | 26.2 29% | 27.2 26% |
| Cyberpunk 2077 ultra * | 44.5 | 34.2 23% | 43.7 2% | |||
| Load Maximum * | 50.8 | 40.3 21% | 45.2 11% | 45.8 10% | 27.3 46% | 35 31% |
| Witcher 3 ultra * | 32 | 27.3 | 32.7 |
* ... Meglio usare valori piccoli
Temperatura
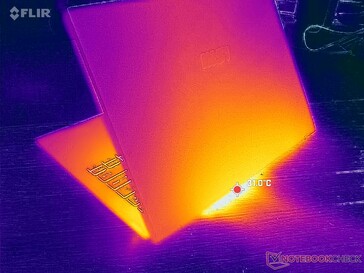
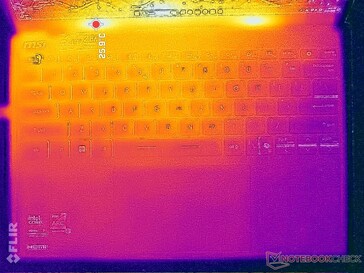
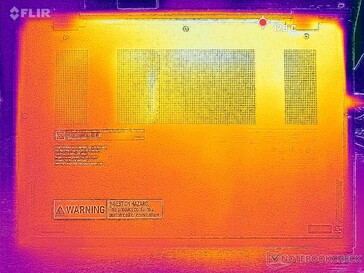
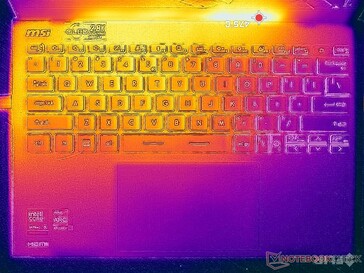
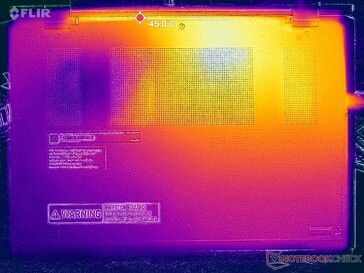
(±) La temperatura massima sul lato superiore è di 43.4 °C / 110 F, rispetto alla media di 35.9 °C / 97 F, che varia da 21.4 a 59 °C per questa classe Subnotebook.
(±) Il lato inferiore si riscalda fino ad un massimo di 42.4 °C / 108 F, rispetto alla media di 39.3 °C / 103 F
(+) In idle, la temperatura media del lato superiore è di 23.4 °C / 74 F, rispetto alla media deld ispositivo di 30.8 °C / 87 F.
(+) I poggiapolsi e il touchpad sono piu' freddi della temperatura della pelle con un massimo di 29.8 °C / 85.6 F e sono quindi freddi al tatto.
(±) La temperatura media della zona del palmo della mano di dispositivi simili e'stata di 28.2 °C / 82.8 F (-1.6 °C / -2.8 F).
| MSI Prestige 13 AI Plus Evo A2VMG Intel Core Ultra 7 258V, Intel Arc Graphics 140V | MSI Prestige 13 AI Evo Intel Core Ultra 7 155H, Intel Arc 8-Core iGPU | Dell XPS 13 9350 Intel Core Ultra 7 256V, Intel Arc Graphics 140V | Framework Laptop 13.5 Core Ultra 7 155H Intel Core Ultra 7 155H, Intel Arc 8-Core iGPU | Lenovo Yoga Book 9 13IMU9 Intel Core Ultra 7 155U, Intel Graphics 4-Core iGPU (Arc) | HP Dragonfly G4 Intel Core i7-1365U, Intel Iris Xe Graphics G7 96EUs | |
|---|---|---|---|---|---|---|
| Heat | 3% | 8% | -6% | -9% | -2% | |
| Maximum Upper Side * | 43.4 | 40.9 6% | 34.8 20% | 42.8 1% | 39.2 10% | 38.6 11% |
| Maximum Bottom * | 42.4 | 40.4 5% | 37.4 12% | 45.2 -7% | 41 3% | 40.4 5% |
| Idle Upper Side * | 25.4 | 25 2% | 25.4 -0% | 27.2 -7% | 32.2 -27% | 28.2 -11% |
| Idle Bottom * | 25.6 | 25.5 -0% | 26.2 -2% | 28.6 -12% | 31.6 -23% | 29 -13% |
* ... Meglio usare valori piccoli
Test da sforzo
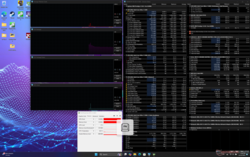
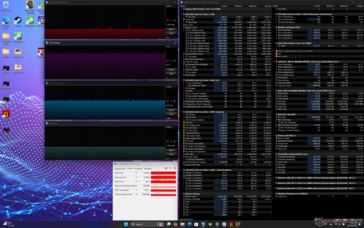
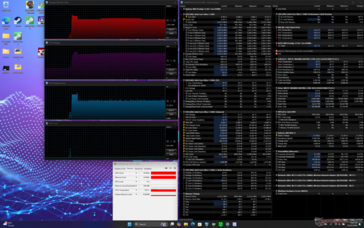
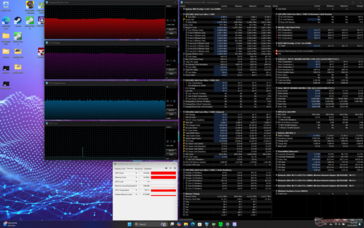
Quando si esegue lo stress Prime95, la CPU sale a 3,6 GHz, 40 W e 82 C per circa 30 secondi. In seguito, scende rapidamente e si stabilizza a 2,9 GHz e 27 W, per mantenere una temperatura del nucleo più fredda di 77 C. Se Cooler Boost è abilitato, la temperatura del nucleo diminuisce leggermente, mentre le velocità di clock rimangono quasi invariate.
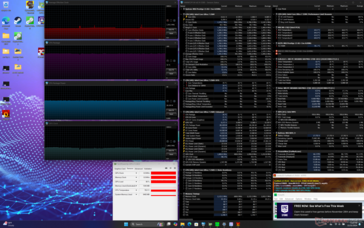
Se si gioca, la temperatura del nucleo si stabilizzerebbe a 75 C rispetto ai 71 C del Dell XPS 13 con una CPU Lunar Lake simile.
| Clock medio della CPU (GHz) | Clock della GPU (MHz) | Temperatura media della CPU (°C) | |
| Sistema inattivo | -- | 400 | 32 |
| Stress Prime95 (Cooler Boost off) | 2,9 | -- | 77 |
| Stress Prime95 (Cooler Boost on) | 3,0 | -- | 75 |
| Prime95 + FurMark Stress | 1,6 | 1800 | 76 |
| Cyberpunk 2077 Stress | 1,5 | 1950 | 75 |
MSI Prestige 13 AI Plus Evo A2VMG analisi audio
(+) | gli altoparlanti sono relativamente potenti (84.5 dB)
Bassi 100 - 315 Hz
(-) | quasi nessun basso - in media 19.4% inferiori alla media
(±) | la linearità dei bassi è media (9.6% delta rispetto alla precedente frequenza)
Medi 400 - 2000 Hz
(±) | medi elevati - circa 6.4% superiore alla media
(+) | medi lineari (5.1% delta rispetto alla precedente frequenza)
Alti 2 - 16 kHz
(±) | alti elevati - circa 6.1% superiori alla media
(+) | alti lineari (4.6% delta rispetto alla precedente frequenza)
Nel complesso 100 - 16.000 Hz
(±) | la linearità complessiva del suono è media (18.2% di differenza rispetto alla media
Rispetto alla stessa classe
» 51% di tutti i dispositivi testati in questa classe è stato migliore, 7% simile, 43% peggiore
» Il migliore ha avuto un delta di 5%, medio di 19%, peggiore di 53%
Rispetto a tutti i dispositivi testati
» 36% di tutti i dispositivi testati in questa classe è stato migliore, 8% similare, 56% peggiore
» Il migliore ha avuto un delta di 4%, medio di 24%, peggiore di 134%
Apple MacBook Pro 16 2021 M1 Pro analisi audio
(+) | gli altoparlanti sono relativamente potenti (84.7 dB)
Bassi 100 - 315 Hz
(+) | bassi buoni - solo 3.8% dalla media
(+) | bassi in lineaa (5.2% delta rispetto alla precedente frequenza)
Medi 400 - 2000 Hz
(+) | medi bilanciati - solo only 1.3% rispetto alla media
(+) | medi lineari (2.1% delta rispetto alla precedente frequenza)
Alti 2 - 16 kHz
(+) | Alti bilanciati - appena 1.9% dalla media
(+) | alti lineari (2.7% delta rispetto alla precedente frequenza)
Nel complesso 100 - 16.000 Hz
(+) | suono nel complesso lineare (4.6% differenza dalla media)
Rispetto alla stessa classe
» 0% di tutti i dispositivi testati in questa classe è stato migliore, 0% simile, 100% peggiore
» Il migliore ha avuto un delta di 5%, medio di 18%, peggiore di 45%
Rispetto a tutti i dispositivi testati
» 0% di tutti i dispositivi testati in questa classe è stato migliore, 0% similare, 100% peggiore
» Il migliore ha avuto un delta di 4%, medio di 24%, peggiore di 134%
Gestione dell'energia
Consumo di energia
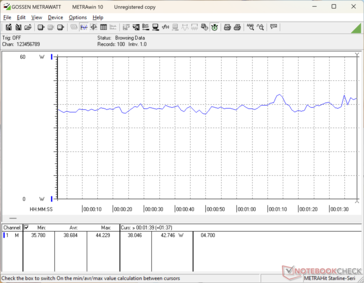
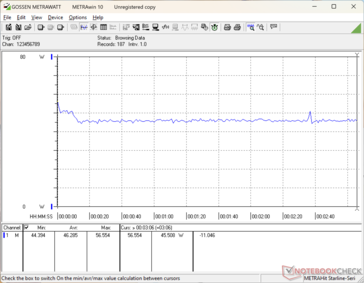
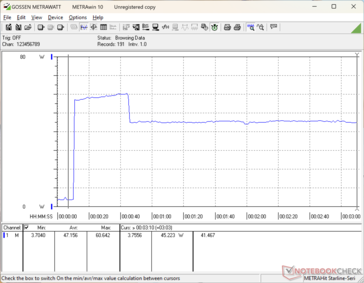
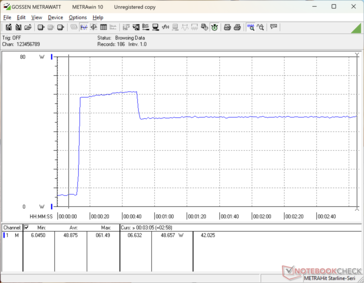
Il sistema diventa più esigente rispetto alla configurazione Core Ultra 7 155H quando si eseguono attività pesanti per la CPU per periodi prolungati, poiché il throttling non è così intenso. Il consumo è anche superiore di circa il 50% quando si gioca, il che si allinea con le prestazioni grafiche molto più veloci.
| Off / Standby | |
| Idle | |
| Sotto carico |
|
Leggenda:
min: | |
| MSI Prestige 13 AI Plus Evo A2VMG Core Ultra 7 258V, Arc 140V, , OLED, 2880x1800, 13.3" | MSI Prestige 13 AI Evo Ultra 7 155H, Arc 8-Core, Samsung PM9A1 MZVL21T0HCLR, OLED, 2880x1800, 13.3" | Dell XPS 13 9350 Core Ultra 7 256V, Arc 140V, Micron 2550 512GB, IPS, 1920x1200, 13.4" | Framework Laptop 13.5 Core Ultra 7 155H Ultra 7 155H, Arc 8-Core, , IPS, 2880x1920, 13.5" | Lenovo Yoga Book 9 13IMU9 Ultra 7 155U, Graphics 4-Core, , OLED, 2880x1800, 13.3" | HP Dragonfly G4 i7-1365U, Iris Xe G7 96EUs, Micron 3400 MTFDKBA512TFH 512GB, IPS, 1920x1280, 13.5" | |
|---|---|---|---|---|---|---|
| Power Consumption | -10% | 27% | 4% | -56% | -5% | |
| Idle Minimum * | 3.5 | 4.5 -29% | 1.3 63% | 2.5 29% | 7.1 -103% | 4.1 -17% |
| Idle Average * | 5.9 | 8 -36% | 2.5 58% | 5.2 12% | 9.1 -54% | 7.5 -27% |
| Idle Maximum * | 10 | 8.7 13% | 4.1 59% | 5.8 42% | 18.4 -84% | 8.2 18% |
| Load Average * | 38.7 | 36.1 7% | 40.1 -4% | 47.5 -23% | 51.3 -33% | 35.5 8% |
| Cyberpunk 2077 ultra external monitor * | 45.6 | 43.1 5% | 52.4 -15% | |||
| Cyberpunk 2077 ultra * | 46.3 | 46.1 -0% | 54.5 -18% | |||
| Load Maximum * | 61.5 | 65 -6% | 57.3 7% | 61.5 -0% | 65.5 -7% | 66.5 -8% |
| Witcher 3 ultra * | 29.7 | 41.5 | 37.5 |
* ... Meglio usare valori piccoli
Power Consumption Cyberpunk / Stress Test
Power Consumption external Monitor
Durata della batteria
I tempi di esecuzione sono quasi due ore più lunghi rispetto alla configurazione Core Ultra 7 155H, grazie al processore Lunar Lake più efficiente.
| MSI Prestige 13 AI Plus Evo A2VMG Core Ultra 7 258V, Arc 140V, 75 Wh | MSI Prestige 13 AI Evo Ultra 7 155H, Arc 8-Core, 75 Wh | Dell XPS 13 9350 Core Ultra 7 256V, Arc 140V, 55 Wh | Framework Laptop 13.5 Core Ultra 7 155H Ultra 7 155H, Arc 8-Core, 61 Wh | Lenovo Yoga Book 9 13IMU9 Ultra 7 155U, Graphics 4-Core, 80 Wh | HP Dragonfly G4 i7-1365U, Iris Xe G7 96EUs, 68 Wh | |
|---|---|---|---|---|---|---|
| Autonomia della batteria | -14% | 54% | -22% | -24% | 19% | |
| WiFi v1.3 | 804 | 694 -14% | 1236 54% | 630 -22% | 608 -24% | 954 19% |
| H.264 | 1002 | |||||
| Load | 169 | 142 | 90 | 192 | ||
| Reader / Idle | 3407 | 2296 | 2550 |
Valutazione Notebookcheck
MSI Prestige 13 AI Plus Evo A2VMG
- 11/26/2024 v8
Allen Ngo
Transparency
La selezione dei dispositivi da recensire viene effettuata dalla nostra redazione. Il campione di prova è stato fornito all'autore come prestito dal produttore o dal rivenditore ai fini di questa recensione. L'istituto di credito non ha avuto alcuna influenza su questa recensione, né il produttore ne ha ricevuto una copia prima della pubblicazione. Non vi era alcun obbligo di pubblicare questa recensione. Non accettiamo mai compensi o pagamenti in cambio delle nostre recensioni. In quanto società mediatica indipendente, Notebookcheck non è soggetta all'autorità di produttori, rivenditori o editori.
Ecco come Notebookcheck esegue i test
Ogni anno, Notebookcheck esamina in modo indipendente centinaia di laptop e smartphone utilizzando procedure standardizzate per garantire che tutti i risultati siano comparabili. Da circa 20 anni sviluppiamo continuamente i nostri metodi di prova e nel frattempo stabiliamo gli standard di settore. Nei nostri laboratori di prova, tecnici ed editori esperti utilizzano apparecchiature di misurazione di alta qualità. Questi test comportano un processo di validazione in più fasi. Il nostro complesso sistema di valutazione si basa su centinaia di misurazioni e parametri di riferimento ben fondati, che mantengono l'obiettività.














 Total Sustainability Score:


