Recensioni Notebook con Intel Arc Graphics 140V la scheda grafica
Recensione del portatile LG Gram Pro 16: Leggero con potenza e 20 ore di autonomia
Come un portatile di lunga durata con un potente Core Ultra 7, LG Gram Pro 16 è un forte compagno di viaggio. Ma il portatile convince anche a casa e per l'intr...
Intel Core Ultra 7 256V | Intel Arc Graphics 140V | 16.00" | 1.2 kgRecensione dell'HP EliteBook X Flip G1i: Un 2-in-1 business di fascia alta per chi guadagna molto
Il nuovo schema di denominazione di HP le consente di far pagare un prezzo elevato per il suo nuovo 2-in-1 da 14 pollici business. Diamo un'occhiata a ciò che o...
Intel Core Ultra 7 258V | Intel Arc Graphics 140V | 14.00" | 1.5 kgRecensione di Lenovo Yoga 7 14 2in1 G10: OLED da 1.000 nit a 120 Hz in un convertibile
Lenovo ha dotato il suo Yoga 7 2in1 di 10ª generazione di un processore Lunar Lake e di un nuovo pannello OLED da 2,8K che, oltre ad una frequenza di aggiorname...
Intel Core Ultra 7 258V | Intel Arc Graphics 140V | 14.00" | 1.4 kgRecensione del Medion SPRCHRGD 14 S2: Intel sfida Qualcomm
Mentre la prima versione dello SPRCHRGD 14 si affidava a un processore di Qualcomm, il suo successore utilizza un modello di Intel. Legga la nostra recensione p...
Intel Core Ultra 7 258V | Intel Arc Graphics 140V | 14.00" | 1.4 kgRecensione del portatile Lenovo ThinkPad X9-14: Il concorrente Windows più vicino al MacBook Air 13
Con il ThinkPad X9-14 Aura Edition, Lenovo ha apportato un'aggiunta completamente nuova alla già abbondante gamma di ThinkPad da 14 pollici. Nella nostra recens...
Intel Core Ultra 7 258V | Intel Arc Graphics 140V | 14.00" | 1.2 kgMicrosoft Surface Laptop 7 15 Lunar Lake: Intel Core Ultra 7 268V, 15.00", 1.7 kg
recensione » Recensione del Microsoft Surface Laptop 7 15 Lunar Lake - Uno schiaffo in faccia a Windows on ARM
HP EliteBook Ultra G1i 14: Intel Core Ultra 7 258V, 14.00", 1.2 kg
recensione » Recensione del portatile HP EliteBook Ultra G1i 14 - La nuova ammiraglia business di HP è un ottimo pacchetto completo
Dell Pro 13 Premium PA13250: Intel Core Ultra 7 268V, 13.30", 1.1 kg
recensione » Recensione di Dell Pro 13 Premium: Il portatile business quasi perfetto
Lenovo Yoga 9 14 2in1 G10: Intel Core Ultra 7 258V, 14.00", 1.3 kg
recensione » Recensione del Lenovo Yoga 9 14 2in1 G10 - Il convertibile di fascia alta soffre a causa del debole OLED 4K
MSI Claw 8 AI+: Intel Core Ultra 7 258V, 8.00", 0.8 kg
recensione » Recensione dell'MSI Claw 8 AI+ - Il miglior portatile per il gaming grazie a Intel Lunar Lake?
Lenovo ThinkPad X9-15 Aura Edition: Intel Core Ultra 7 258V, 15.30", 1.4 kg
recensione » Recensione del portatile Lenovo ThinkPad X9 15 Aura Edition - Il rivale del MacBook Air è molto buono, anche senza TrackPoint
Lenovo Yoga Slim 9 14ILL10: Intel Core Ultra 7 258V, 14.00", 1.2 kg
recensione » Recensione del Lenovo Yoga Slim 9 14 Gen 10: Il primo portatile con una webcam sotto il display da 32 MP
Lenovo ThinkPad X1 Carbon Gen 13 21NS0010GE: Intel Core Ultra 7 258V, 14.00", 1 kg
recensione » Recensione del notebook Lenovo ThinkPad X1 Carbon Gen 13 Aura Edition: L'X1 Carbon è finalmente tornato
MSI Prestige 13 AI Plus Evo A2VMG: Intel Core Ultra 7 258V, 13.30", 1 kg
recensione » Recensione del portatile MSI Prestige 13 AI Plus Evo: Grandi prestazioni grafiche per meno di 1 kg
HP OmniBook Ultra Flip 14: Intel Core Ultra 7 258V, 14.00", 1.3 kg
recensione » Recensione dell'HP OmniBook Ultra Flip 14 convertibile: Più leggero del previsto
Dell XPS 13 9350: Intel Core Ultra 7 256V, 13.40", 1.2 kg
recensione » Recensione del portatile Dell XPS 13 9350: Intel Lunar Lake è perfetto
Asus ExpertBook P5 P5405-NZ0102X: Intel Core Ultra 7 258V, 14.00", 1.3 kg
recensione » Recensione del notebook Asus ExpertBook P5 P5405: è arrivato il momento dell'M1 di Intel in un portatile business
Lenovo Yoga Slim 7 15ILL9 Aura: Intel Core Ultra 7 256V, 15.30", 1.5 kg
recensione » Recensione del computer portatile Lenovo Yoga Slim 7 15 Aura: Debutto delle prestazioni dell'Intel Core Ultra 7 256V
Asus Zenbook S 14 UX5406: Intel Core Ultra 7 258V, 14.00", 1.2 kg
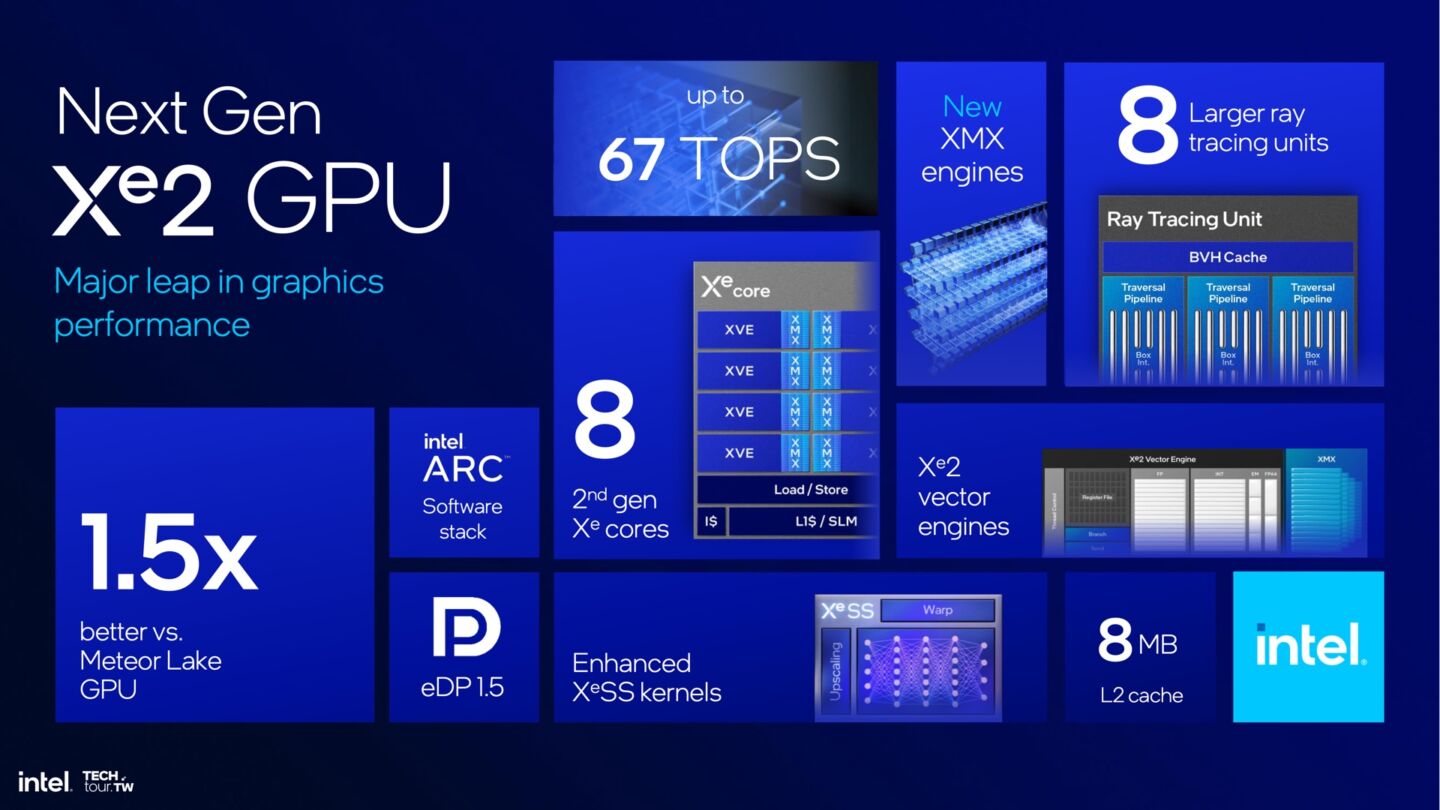
recensione » Analisi dell'iGPU Intel Lunar Lake - l'Arc Graphics 140V è più veloce e più efficiente rispetto alla Radeon 890M
recensione » Analisi dell'iGPU Intel Lunar Lake - l'Arc Graphics 140V è più veloce e più efficiente rispetto alla Radeon 890M
recensione » Recensione del portatile Asus Zenbook S 14 UX5406 - Eccellente portatile per tutti i giorni con Intel Lunar Lake
recensione » Analisi della CPU Intel Lunar Lake - Le prestazioni multi-core del Core Ultra 7 258V sono deludenti, ma la sua efficienza quotidiana è buona
recensione » Analisi della CPU Intel Lunar Lake - Le prestazioni multi-core del Core Ultra 7 258V sono deludenti, ma la sua efficienza quotidiana è buona
Lenovo Yoga Slim 7 14ILL10: Intel Core Ultra 7 258V, 14.00", 1.2 kg
Recensioni esterne » Lenovo Yoga Slim 7 14ILL10
Asus ExpertBook P5 P5405CSA: Intel Core Ultra 7 258V, 14.00", 1.3 kg
Recensioni esterne » Asus ExpertBook P5 P5405CSA
Samsung Galaxy Book5 360: Intel Core Ultra 7 256V, 15.60", 1.5 kg
Recensioni esterne » Samsung Galaxy Book5 360
Asus VivoBook 14 Flip TP3407SA: Intel Core Ultra 7 256V, 14.00", 1.6 kg
Recensioni esterne » Asus VivoBook 14 Flip TP3407SA
Samsung Galaxy Book5 Pro 14: Intel Core Ultra 7 258V, 14.00", 1.2 kg
Recensioni esterne » Samsung Galaxy Book5 Pro 14
Lenovo Yoga Slim 9 14ILL10: Intel Core Ultra 7 258V, 14.00", 1.2 kg
Recensioni esterne » Lenovo Yoga Slim 9 14ILL10
Lenovo ThinkPad X9-14 Gen 1 Aura Edition: Intel Core Ultra 7 258V, 14.00", 1.2 kg
Recensioni esterne » Lenovo ThinkPad X9-14 Gen 1 Aura Edition
MSI Summit 13 AI+ Evo A2VM: Intel Core Ultra 7 258V, 13.30", 1.4 kg
Recensioni esterne » MSI Summit 13 AI+ Evo A2VM
MSI Prestige 14 AI+ Evo C2VMG: Intel Core Ultra 7 258V, 14.00", 1.7 kg
Recensioni esterne » MSI Prestige 14 AI+ Evo C2VMG
MSI Prestige 16 AI+ Evo B2VMG: Intel Core Ultra 9 288V, 16.00", 1.5 kg
Recensioni esterne » MSI Prestige 16 AI+ Evo B2VMG
Acer Swift 16 AI SF16-51, Ultra 7 256V: Intel Core Ultra 7 256V, 16.00", 1.5 kg
Recensioni esterne » Acer Swift 16 AI SF16-51, Ultra 7 256V
Samsung Galaxy Book5 Pro NP960: Intel Core Ultra 7 256V, 16.00", 1.6 kg
Recensioni esterne » Samsung Galaxy Book5 Pro NP960
Fujitsu FMV Note U: Intel Core Ultra 7 258V, 14.00", 0.9 kg
Recensioni esterne » Fujitsu FMV Note U
Asus Vivobook S 14 OLED S5406SA, Ultra 7 256V: Intel Core Ultra 7 256V, 14.00", 1.3 kg
Recensioni esterne » Asus Vivobook S 14 OLED S5406SA, Ultra 7 256V
Acer Swift 16 AI SF16-51: Intel Core Ultra 7 258V, 16.00", 1.5 kg
Recensioni esterne » Acer Swift 16 AI SF16-51
MSI Prestige 13 AI+ Evo A2VMG: Intel Core Ultra 7 258V, 13.30", 1 kg
Recensioni esterne » MSI Prestige 13 AI+ Evo A2VMG
Dell XPS 13 9350: Intel Core Ultra 7 256V, 13.40", 1.2 kg
Recensioni esterne » Dell XPS 13 9350
Lenovo Yoga Slim 7 15ILL9: Intel Core Ultra 7 258V, 15.30", 1.5 kg
Recensioni esterne » Lenovo Yoga Slim 7 15ILL9
Acer Swift 14 AI SF14-51: Intel Core Ultra 7 258V, 14.00", 1.3 kg
Recensioni esterne » Acer Swift 14 AI SF14-51
HP OmniBook Ultra Flip 14: Intel Core Ultra 7 258V, 14.00", 1.3 kg
Recensioni esterne » HP OmniBook Ultra Flip 14
HP OmniBook Ultra Flip 14-fh0000: Intel Core Ultra 7 258V, 14.00", 1.3 kg
Recensioni esterne » HP OmniBook Ultra Flip 14-fh0000
Asus ExpertBook P5 P5405-NZ0102X: Intel Core Ultra 7 258V, 14.00", 1.3 kg
Recensioni esterne » Asus ExpertBook P5 P5405-NZ0102X
Asus Zenbook S 14 UX5406: Intel Core Ultra 7 258V, 14.00", 1.2 kg
Recensioni esterne » Asus Zenbook S 14 UX5406
Samsung Galaxy Book5 Pro 360: Intel Core Ultra 7 256V, 16.00", 1.7 kg
Recensioni esterne » Samsung Galaxy Book5 Pro 360
Lenovo ThinkPad X1 Carbon G13: Intel Core Ultra 7 258V, 14.00", 1 kg
Recensioni esterne » Lenovo ThinkPad X1 Carbon G13
MSI Claw 8 AI+: Intel Core Ultra 7 258V, 8.00", 0.8 kg
Recensioni esterne » MSI Claw 8 AI+
Asus Zenbook S 14 UX5406 Core Ultra 9: Intel Core Ultra 9 288V
Recensioni esterne » Asus Zenbook S 14 UX5406 Core Ultra 9
Lenovo Yoga Slim 7 15ILL9 Aura: Intel Core Ultra 7 256V, 15.30", 1.5 kg
Recensioni esterne » Lenovo Yoga Slim 7 15ILL9 Aura
Lenovo Yoga 7 14 2in1 G10: Intel Core Ultra 7 258V, 14.00", 1.4 kg
» Lo Yoga 7 14 Convertibile di Lenovo non solo è molto più economico dello Yoga 9, ma è anche migliore sotto alcuni aspetti
Lenovo ThinkPad X9-14 Gen 1 Aura Edition: Intel Core Ultra 7 258V, 14.00", 1.2 kg
» Aspetto di uno Yoga, qualità di un ThinkPad, funzionalità di un ThinkBook: Il ThinkPad X9-14 di Lenovo sfuma la linea di confine
HP EliteBook Ultra G1i 14: Intel Core Ultra 7 258V, 14.00", 1.2 kg
» HP EliteBook Ultra G1i vanta un raffreddamento silenzioso ma deve scendere a compromessi
Microsoft Surface Laptop 7 15 Lunar Lake: Intel Core Ultra 7 268V, 15.00", 1.7 kg
» Microsoft dovrebbe consentire agli acquirenti del Surface Laptop 7 di scegliere tra Intel e Qualcomm
Dell Pro 13 Premium PA13250: Intel Core Ultra 7 268V, 13.30", 1.1 kg
» Quasi perfetto con un punteggio del 90%: Verdetto sul Dell Pro 13 Premium
Lenovo Yoga 9 14 2in1 G10: Intel Core Ultra 7 258V, 14.00", 1.3 kg
» Lenovo dovrebbe dotare il convertibile di punta Yoga 9 di un display OLED 4K migliore
Lenovo ThinkPad X1 Carbon Gen 13 21NS0010GE: Intel Core Ultra 7 258V, 14.00", 1 kg
» Ora con touchpad aptico Sensel: Lenovo ThinkPad X1 Carbon Gen 13 riceve un'opzione di personalizzazione
» Aggiunte sorprendenti: Lenovo lancia ufficialmente altre opzioni per ThinkPad X1 Carbon Gen 13
» Il prezzo sta per scendere: In arrivo altre opzioni per il Lenovo ThinkPad X1 Carbon Gen 13, tra cui schermi IPS e CPU Ultra 5
Asus ExpertBook P5 P5405-NZ0102X: Intel Core Ultra 7 258V, 14.00", 1.3 kg
» Intel efficiente ancora una volta: Asus ExpertBook P5 raggiunge 16 ore di durata della batteria con Lunar Lake
Asus Zenbook S 14 UX5406: Intel Core Ultra 7 258V, 14.00", 1.2 kg
» Linux batte Windows 11 sulle CPU Intel Core Ultra 200: un aumento delle prestazioni fino al 20%, ma con gravi limiti