Notebookcheck Logo

Recensione del portatile Asus ROG Zephyrus G16 - Un gamer sottile con una RTX 4090 e un potenziale inespresso
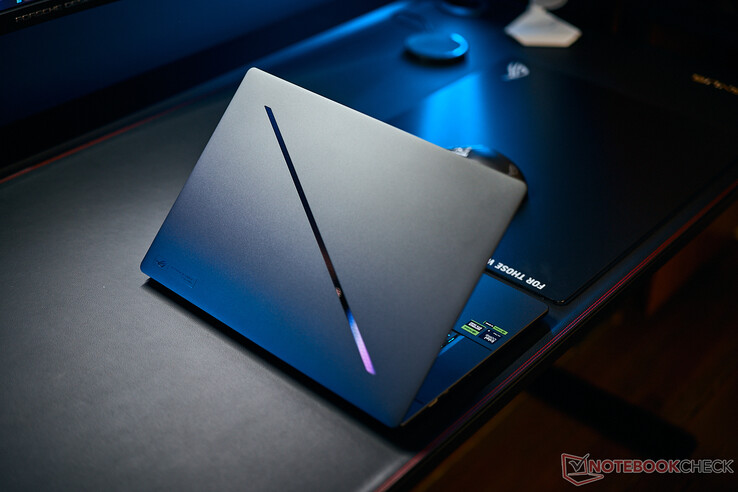
Raffreddamento della camera di vapore.

Asus equipaggia solo i modelli più potenti del ROG Zephyrus G16 con il raffreddamento a camera di vapore. Recensiamo il modello di fascia alta con il Core Ultra 9 185H e il laptop GeForce RTX 4090. Tuttavia, il raffreddamento è davvero migliore di quello visto nella RTX 4070 e quali compromessi si sono dovuti accettare a causa del case compatto?

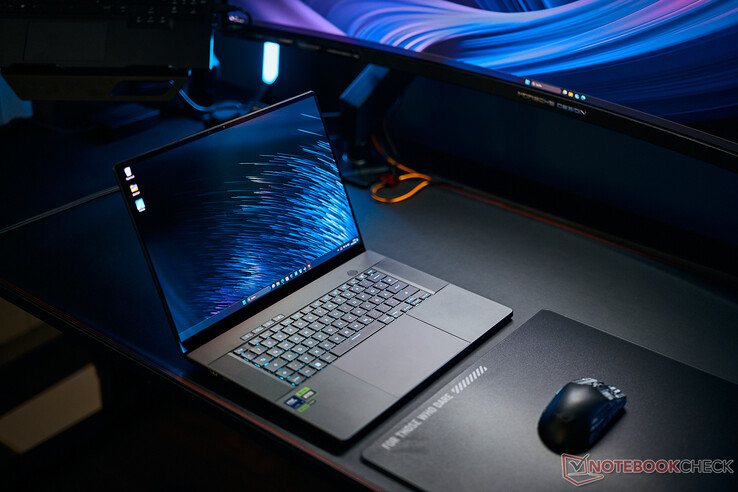
Il ROG Zephyrus G16 è attualmente la stella cadente quando si tratta di portatili da gioco Asus sottili. Qualche mese fa, abbiamo recensito la variante con il Core Ultra 7 155H e la Nvidia GeForce RTX 4070. Ora stiamo esaminando il modello di fascia alta con il Core Ultra 9 185H e la GeForce RTX 4090. Oltre ai componenti più potenti, abbiamo a che fare con un raffreddamento diverso. Sebbene le configurazioni fino al laptop RTX 4070 utilizzino un'unità di raffreddamento convenzionale composta da tre ventole e tubi di calore, i modelli di fascia alta (laptop RTX 4080/4090) utilizzano un raffreddamento a camera di vapore. Naturalmente, vogliamo sapere come il nuovo raffreddamento influisce sulle prestazioni e sulle emissioni.

Il nostro dispositivo di recensione ha il numero GU605MY, costa 3.649 dollari e, oltre al Core Ultra 9 185H e al laptop GeForce RTX 4090, è dotato di 32 GB di RAM e del già noto schermo OLED a 240 Hz. In questa recensione, presteremo particolare attenzione alle differenze tra la configurazione del laptop RTX 4070 e le prestazioni, nonché alle emissioni della variante di fascia alta. Tutte le informazioni aggiuntive riguardanti il case, i dispositivi di input, il display e gli altoparlanti sono disponibili nella nostra recensione del ROG Zephyrus G16 con il laptop RTX 4070.

Asus lancerà presto un aggiornamento con i nuovi processori Strix Point di AMD (Zen5), tuttavia questi modelli saranno dotati solo di GeForce Laptop RTX 4070.

Asus ROG Zephyrus G16 GU605MY (ROG Zephyrus G16 2024 Serie)
Processore
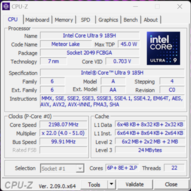
Intel Core Ultra 9 185H 16 x 3.8 - 5.1 GHz, Meteor Lake-H
Scheda grafica
NVIDIA GeForce RTX 4090 Laptop GPU - 16 GB VRAM, Core: 1455 MHz, Memoria: 2250 MHz, GDDR6, 555.99
Memoria
32 GB 
, LPDDR5x-7467, Dual-Channel, onboard
Schermo
16.00 pollici 16:10, 2560 x 1600 pixel 189 PPI, ATNA60DL01-0, OLED, lucido: si, 240 Hz
Scheda madre
Intel Meteor Lake-U/P/H PCH
Harddisk
Samsung PM9A1a MZVL22T0HDLB, 2048 GB 
, M.2 PCIe
Scheda audio
Intel Meteor Lake-U/P/H PCH - cAVS (Audio, Voice, Speech)
Porte di connessione
3 USB 3.1 Gen 2, 1 Thunderbolt, USB-C Power Delivery (PD), 1 HDMI, Connessioni Audio: 3.5mm, Lettore schede: SD
Rete
Intel Wi-Fi 6E AX211 (a/b/g/h/n = Wi-Fi 4/ac = Wi-Fi 5/ax = Wi-Fi 6/ Wi-Fi 6E 6 GHz), Bluetooth 5.3
Dimensioni
altezza x larghezza x profondità (in mm): 16.4 x 354 x 246
Batteria
90 Wh ioni di litio, 4-cell
Sistema Operativo
Microsoft Windows 11 Home
Camera
Fotocamera Principale: 2 MPix
Altre caratteristiche
Casse: -cell, Tastiera: Chiclet, Illuminazione Tastiera: si, 24 Mesi Garanzia
Peso
1.908 kg, Alimentazione: 745 gr
Prezzo
4300 Euro
Amazon
Nota: il produttore potrebbe usare componenti di fornitori diversi pannelli dei diplay, drive o banchi di memoria con specifiche simili.


Potenziali concorrenti a confrontos

Punteggio
Version
Data
Modello
Peso
Altezza
Dimensione
Risoluzione
Miglior Prezzo
86.1 %v8
07/2024
Asus ROG Zephyrus G16 GU605MY
Ultra 9 185H, NVIDIA GeForce RTX 4090 Laptop GPU
1.9 kg16.4 mm16.00"2560x1600
85.5 %v8
06/2024
SCHENKER XMG Neo 16 (Early 24)
i9-14900HX, NVIDIA GeForce RTX 4090 Laptop GPU
2.5 kg26.6 mm16.00"2560x1600
83.9 %v8
06/2024
Lenovo Legion 9 16IRX9, RTX 4090
i9-14900HX, NVIDIA GeForce RTX 4090 Laptop GPU
2.5 kg22.7 mm16.00"3200x2000
88.4 %
v7 (old)
v7 (old)
05/2024
Alienware x16 R2 P120F
Ultra 9 185H, NVIDIA GeForce RTX 4080 Laptop GPU
2.7 kg18.57 mm16.00"2560x1600
91.1 %
v7 (old)
v7 (old)
02/2024
Razer Blade 16 2024, RTX 4090
i9-14900HX, NVIDIA GeForce RTX 4090 Laptop GPU
2.5 kg22 mm16.00"2560x1600

Nota: abbiamo recentemente aggiornato il nostro sistema di valutazione e i risultati della versione 8 non sono paragonabili ai risultati della versione 7. Ulteriori informazioni sono disponibili qui .

Differenze rispetto al G16 con il portatile RTX 4070

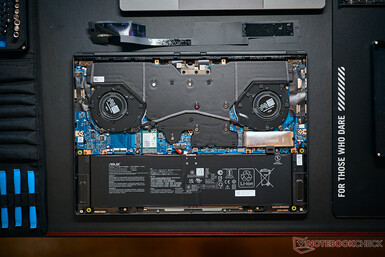
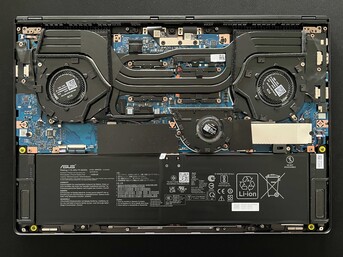
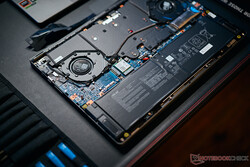
Il modello di fascia alta di ROG Zephyrus G16 è visivamente indistinguibile dal modello più debole dotato di laptop RTX 4070/4060. Tuttavia, internamente le differenze nel sistema di raffreddamento diventano evidenti. Mentre i modelli più deboli utilizzano un totale di tre ventole e tubi di calore regolari, Asus ha optato per un raffreddamento a camera di vapore con due ventole per i modelli più costosi.

Il raffreddamento aumenta il peso da 1,817 kg a 1,908 kg, che è comunque leggero rispetto agli altri portatili RTX 4090 nel segmento da 16 pollici, dato che i dispositivi di confronto sono più pesanti di almeno mezzo chilo. Inoltre, Zephyrus è anche uno dei modelli più sottili e compatti. Le configurazioni fino al laptop RTX 4070 sono dotate di un'unità di alimentazione da 200 watt (583 grammi), mentre a partire dal laptop RTX 4080 si tratta di un'unità più potente da 240 watt (745 grammi).

Computer portatile ROG Zephyrus G16 RTX 4090
Computer portatile ROG Zephyrus G16 RTX 4070

Confronto delle dimensioni

364.74 mm 289.81 mm 18.57 mm 2.7 kg356.7 mm 253 mm 26.6 mm 2.5 kg357.7 mm 277.7 mm 22.7 mm 2.5 kg355 mm 244 mm 22 mm 2.5 kg354 mm 246 mm 16.4 mm 1.9 kg354 mm 246 mm 16.4 mm 1.8 kg297 mm 210 mm 1 mm 5.7 g

Prestazioni - laptop Meteor Lake e RTX 4090

La variante di fascia alta dello Zephyrus è attualmente equipaggiata con il processore Meteor Lake più veloce, il Core Ultra 9 185H. Per quanto riguarda le prestazioni della CPU, è in ritardo rispetto alle CPU HX di Intel. Nella versione da 115 watt qui presente, la scheda Nvidia GeForce RTX 4090 è un po' lontano dal raggiungere le prestazioni massime. La RAM installata è di 32 GB (LPDDR5x 7467) ma, a causa del prezzo e della mancanza di aggiornabilità, avremmo preferito 64 GB.


Condizioni del test

I profili energetici di base rimangono identici e il modello più potente con il laptop RTX 4090 offre anche i profili Quiet, Performance e Turbo. Nella tabella seguente, abbiamo elencato i valori TDP/TGP corrispondenti e l'effetto sulle prestazioni. Sotto di essa, abbiamo aggiunto anche i valori del modello RTX 4070 dello Zephyrus G16, in modo da poter vedere un confronto diretto. In linea di principio, i modelli con il raffreddamento a camera di vapore più potente possono consumare un po' più di energia, ma la differenza è piuttosto piccola, soprattutto quando si tratta del processore. Sia nel profilo Quiet che in quello Performance, il raffreddamento a camera di vapore riesce persino a essere un po' più rumoroso della più debole Variante RTX 4070. Come di consueto, abbiamo effettuato i benchmark e le misurazioni utilizzando la modalità turbo che, tuttavia, è disponibile solo quando è collegata alla rete elettrica.

Asus ROG Zephyrus G16 RTX 4090 Laptop
Profilo energetico Carico della CPU CB R23 Multi Carico della GPU Time Spy Grafica Cyberpunk 2077 QHD Ultra volume massimo della ventola
Silenzioso 60 watt 15.750 punti 55 watt 9.731 punti 40,2fps 41,4 dB(A)
Prestazioni 100->70 Watt 17.452 punti 90 Watt 15.205 punti 60,2fps 48,1 dB(A)
Turbo 110->80 Watt 19.109 punti 115 Watt 19.109 punti 68,1fps 52,3 dB(A)
Asus ROG Zephyrus G16 RTX 4070 Laptop
Profilo energetico Carico CPU CB R23 Multi Carico GPU Time Spy Grafica Cyberpunk 2077 QHD Ultra volume massimo della ventola
Silenziosità 60->45 watt 15.869 punti 65 watta 9.042 punti 32,6fps 41,5 dB(A)
Prestazioni 70->50 watt 17.133 punti 80 watt 10.989 punti 43,7 fps 46,4 dB(A)
Turbo 95->70 watt 18.372 punti 105 watt 12.312 punti 48,7fps 52,4 dB(A)

Processore - Intel Core Ultra 9 185H

Il Core Ultra 9 185H è il processore mobile più veloce della generazione Meteor Lake di Intel, tuttavia si trova chiaramente dietro ai processori HX (aggiornamento Raptor Lake). Come abbiamo appena osservato nella tabella di confronto, non ci sono differenze tangibili tra il Core Ultra 9 e il Core Ultra 7 in entrambi i modelli dello Zephyrus G16 2024 e dell'Alienware x16 R2 Alienware x16 R2. Quest'ultimo ha anche il Core Ultra 9 185H.

Tuttavia, gli altri concorrenti RTX 4090 con il Core i9 14900HX offrono prestazioni della CPU significativamente superiori, soprattutto nei test multi-core. Le prestazioni multi-core di ROG Zephyrus G16 non rimangono sempre del tutto stabili, anche se un deficit di circa il 10% sotto carico sostenuto può essere considerato abbastanza piccolo. In modalità batteria, il processore può assorbire un massimo di 75 watt, ma questo non ha quasi alcun effetto sulle prestazioni multi-core (~8 %). Ulteriori benchmark della CPU sono disponibili qui.

Cinebench R15 Multi Continuous Test

02655307951060132515901855212023852650291531803445371039754240450547705035Tooltip
Asus ROG Zephyrus G16 GU605MY Intel Core Ultra 9 185H: Ø2756 (2704.71-3019.32)
SCHENKER XMG Neo 16 (Early 24) Intel Core i9-14900HX: Ø5001 (4861.45-5267.14)
Lenovo Legion 9 16IRX9, RTX 4090 Intel Core i9-14900HX: Ø4648 (4505.52-4878.64)
Alienware x16 R2 P120F Intel Core Ultra 9 185H: Ø2753 (2708.56-2857.35)
Razer Blade 16 2024, RTX 4090 Intel Core i9-14900HX: Ø4396 (4349.72-4455.83)
Asus ROG Zephyrus G16 2024 GU605M Intel Core Ultra 7 155H: Ø2533 (2383.65-2679.17)
CPU Performance Rating: Percent
Cinebench R23: Multi Core | Single Core
Cinebench R20: CPU (Multi Core) | CPU (Single Core)
Cinebench R15: CPU Multi 64Bit | CPU Single 64Bit
Blender: v2.79 BMW27 CPU
7-Zip 18.03: 7z b 4 | 7z b 4 -mmt1
Geekbench 6.3: Multi-Core | Single-Core
Geekbench 5.5: Multi-Core | Single-Core
HWBOT x265 Benchmark v2.2: 4k Preset
LibreOffice : 20 Documents To PDF
R Benchmark 2.5: Overall mean
CPU Performance Rating
SCHENKER XMG Neo 16 (Early 24)
Intel Core i9-14900HX
88.5 pt
Razer Blade 16 2024, RTX 4090
Intel Core i9-14900HX
77.8 pt
Lenovo Legion 9 16IRX9, RTX 4090
Intel Core i9-14900HX
71.5 pt
Media della classe Gaming
 
62.4 pt
Asus ROG Zephyrus G16 GU605MY
Intel Core Ultra 9 185H
59.7 pt
Media Intel Core Ultra 9 185H
 
55.3 pt
Asus ROG Zephyrus G16 2024 GU605M
Intel Core Ultra 7 155H
54.2 pt
Alienware x16 R2 P120F
Intel Core Ultra 9 185H
52.5 pt
Cinebench R23 / Multi Core
SCHENKER XMG Neo 16 (Early 24)
Intel Core i9-14900HX
36249 Points +90%
Lenovo Legion 9 16IRX9, RTX 4090
Intel Core i9-14900HX
31889 Points +67%
Razer Blade 16 2024, RTX 4090
Intel Core i9-14900HX
28867 Points +51%
Media della classe Gaming
  (5668 - 36249, n=193, ultimi 2 anni)
21651 Points +13%
Asus ROG Zephyrus G16 GU605MY
Intel Core Ultra 9 185H
19110 Points
Alienware x16 R2 P120F
Intel Core Ultra 9 185H
18338 (17139.2min - 18337.8max) Points -4%
Media Intel Core Ultra 9 185H
  (12688 - 19851, n=17)
17669 Points -8%
Asus ROG Zephyrus G16 2024 GU605M
Intel Core Ultra 7 155H
17267 Points -10%
Cinebench R23 / Single Core
SCHENKER XMG Neo 16 (Early 24)
Intel Core i9-14900HX
2209 Points +18%
Razer Blade 16 2024, RTX 4090
Intel Core i9-14900HX
2117 Points +13%
Media della classe Gaming
  (1088 - 2235, n=191, ultimi 2 anni)
1877 Points 0%
Asus ROG Zephyrus G16 GU605MY
Intel Core Ultra 9 185H
1876 Points
Media Intel Core Ultra 9 185H
  (1166 - 1912, n=17)
1787 Points -5%
Lenovo Legion 9 16IRX9, RTX 4090
Intel Core i9-14900HX
1720 Points -8%
Asus ROG Zephyrus G16 2024 GU605M
Intel Core Ultra 7 155H
1681 Points -10%
Alienware x16 R2 P120F
Intel Core Ultra 9 185H
1620 Points -14%
Cinebench R20 / CPU (Multi Core)
SCHENKER XMG Neo 16 (Early 24)
Intel Core i9-14900HX
13824 Points +89%
Lenovo Legion 9 16IRX9, RTX 4090
Intel Core i9-14900HX
11960 Points +64%
Razer Blade 16 2024, RTX 4090
Intel Core i9-14900HX
10968 Points +50%
Media della classe Gaming
  (2179 - 13832, n=191, ultimi 2 anni)
8240 Points +13%
Asus ROG Zephyrus G16 GU605MY
Intel Core Ultra 9 185H
7299 Points
Alienware x16 R2 P120F
Intel Core Ultra 9 185H
7081 Points -3%
Media Intel Core Ultra 9 185H
  (4843 - 7651, n=17)
6818 Points -7%
Asus ROG Zephyrus G16 2024 GU605M
Intel Core Ultra 7 155H
6682 Points -8%
Cinebench R20 / CPU (Single Core)
SCHENKER XMG Neo 16 (Early 24)
Intel Core i9-14900HX
844 Points +18%
Razer Blade 16 2024, RTX 4090
Intel Core i9-14900HX
810 Points +13%
Media della classe Gaming
  (427 - 856, n=191, ultimi 2 anni)
722 Points +1%
Asus ROG Zephyrus G16 GU605MY
Intel Core Ultra 9 185H
718 Points
Asus ROG Zephyrus G16 2024 GU605M
Intel Core Ultra 7 155H
693 Points -3%
Media Intel Core Ultra 9 185H
  (442 - 735, n=17)
690 Points -4%
Lenovo Legion 9 16IRX9, RTX 4090
Intel Core i9-14900HX
657 Points -8%
Alienware x16 R2 P120F
Intel Core Ultra 9 185H
622 Points -13%
Cinebench R15 / CPU Multi 64Bit
SCHENKER XMG Neo 16 (Early 24)
Intel Core i9-14900HX
5267 Points +74%
Lenovo Legion 9 16IRX9, RTX 4090
Intel Core i9-14900HX
4879 (4505.52min - 4878.64max) Points +62%
Razer Blade 16 2024, RTX 4090
Intel Core i9-14900HX
4456 (4349.72min - 4455.83max) Points +48%
Media della classe Gaming
  (905 - 5663, n=198, ultimi 2 anni)
3394 Points +12%
Asus ROG Zephyrus G16 GU605MY
Intel Core Ultra 9 185H
3019 (2704.71min - 3019.32max) Points
Alienware x16 R2 P120F
Intel Core Ultra 9 185H
2857 (2708.56min - 2857.35max) Points -5%
Media Intel Core Ultra 9 185H
  (1582 - 3165, n=19)
2712 Points -10%
Asus ROG Zephyrus G16 2024 GU605M
Intel Core Ultra 7 155H
2679 (2383.65min - 2679.17max) Points -11%
Cinebench R15 / CPU Single 64Bit
Razer Blade 16 2024, RTX 4090
Intel Core i9-14900HX
311 Points +13%
SCHENKER XMG Neo 16 (Early 24)
Intel Core i9-14900HX
310 Points +13%
Media della classe Gaming
  (176.6 - 318, n=195, ultimi 2 anni)
276 Points 0%
Asus ROG Zephyrus G16 GU605MY
Intel Core Ultra 9 185H
275 Points
Asus ROG Zephyrus G16 2024 GU605M
Intel Core Ultra 7 155H
264 Points -4%
Media Intel Core Ultra 9 185H
  (191.9 - 281, n=17)
263 Points -4%
Lenovo Legion 9 16IRX9, RTX 4090
Intel Core i9-14900HX
247 Points -10%
Alienware x16 R2 P120F
Intel Core Ultra 9 185H
238 Points -13%
Blender / v2.79 BMW27 CPU
Asus ROG Zephyrus G16 2024 GU605M
Intel Core Ultra 7 155H
193 Seconds * -9%
Media Intel Core Ultra 9 185H
  (163 - 285, n=17)
192.7 Seconds * -9%
Alienware x16 R2 P120F
Intel Core Ultra 9 185H
178 Seconds * -1%
Asus ROG Zephyrus G16 GU605MY
Intel Core Ultra 9 185H
177 Seconds *
Media della classe Gaming
  (87 - 555, n=186, ultimi 2 anni)
172.1 Seconds * +3%
Razer Blade 16 2024, RTX 4090
Intel Core i9-14900HX
113 Seconds * +36%
Lenovo Legion 9 16IRX9, RTX 4090
Intel Core i9-14900HX
106 Seconds * +40%
SCHENKER XMG Neo 16 (Early 24)
Intel Core i9-14900HX
95 Seconds * +46%
7-Zip 18.03 / 7z b 4
SCHENKER XMG Neo 16 (Early 24)
Intel Core i9-14900HX
135229 MIPS +86%
Lenovo Legion 9 16IRX9, RTX 4090
Intel Core i9-14900HX
125676 MIPS +73%
Razer Blade 16 2024, RTX 4090
Intel Core i9-14900HX
115695 MIPS +59%
Media della classe Gaming
  (23795 - 140932, n=190, ultimi 2 anni)
84653 MIPS +17%
Asus ROG Zephyrus G16 GU605MY
Intel Core Ultra 9 185H
72583 MIPS
Media Intel Core Ultra 9 185H
  (51738 - 76331, n=17)
68832 MIPS -5%
Asus ROG Zephyrus G16 2024 GU605M
Intel Core Ultra 7 155H
68500 MIPS -6%
Alienware x16 R2 P120F
Intel Core Ultra 9 185H
67227 MIPS -7%
7-Zip 18.03 / 7z b 4 -mmt1
SCHENKER XMG Neo 16 (Early 24)
Intel Core i9-14900HX
7406 MIPS +31%
Razer Blade 16 2024, RTX 4090
Intel Core i9-14900HX
7018 MIPS +24%
Media della classe Gaming
  (4168 - 7581, n=190, ultimi 2 anni)
6281 MIPS +11%
Asus ROG Zephyrus G16 GU605MY
Intel Core Ultra 9 185H
5651 MIPS
Lenovo Legion 9 16IRX9, RTX 4090
Intel Core i9-14900HX
5452 MIPS -4%
Asus ROG Zephyrus G16 2024 GU605M
Intel Core Ultra 7 155H
5439 MIPS -4%
Media Intel Core Ultra 9 185H
  (4199 - 5781, n=17)
5414 MIPS -4%
Alienware x16 R2 P120F
Intel Core Ultra 9 185H
4502 MIPS -20%
Geekbench 6.3 / Multi-Core
SCHENKER XMG Neo 16 (Early 24)
Intel Core i9-14900HX
19451 Points +34%
Razer Blade 16 2024, RTX 4090
Intel Core i9-14900HX
17559 Points +21%
Lenovo Legion 9 16IRX9, RTX 4090
Intel Core i9-14900HX
17499 Points +20%
Asus ROG Zephyrus G16 GU605MY
Intel Core Ultra 9 185H
14540 Points
Media della classe Gaming
  (5340 - 19665, n=110, ultimi 2 anni)
14171 Points -3%
Media Intel Core Ultra 9 185H
  (9140 - 14540, n=17)
13555 Points -7%
Asus ROG Zephyrus G16 2024 GU605M
Intel Core Ultra 7 155H
13323 Points -8%
Alienware x16 R2 P120F
Intel Core Ultra 9 185H
12825 Points -12%
Geekbench 6.3 / Single-Core
SCHENKER XMG Neo 16 (Early 24)
Intel Core i9-14900HX
3129 Points +22%
Razer Blade 16 2024, RTX 4090
Intel Core i9-14900HX
2964 Points +16%
Media della classe Gaming
  (1490 - 3129, n=110, ultimi 2 anni)
2641 Points +3%
Asus ROG Zephyrus G16 GU605MY
Intel Core Ultra 9 185H
2559 Points
Media Intel Core Ultra 9 185H
  (1490 - 2573, n=17)
2428 Points -5%
Lenovo Legion 9 16IRX9, RTX 4090
Intel Core i9-14900HX
2419 Points -5%
Asus ROG Zephyrus G16 2024 GU605M
Intel Core Ultra 7 155H
2410 Points -6%
Alienware x16 R2 P120F
Intel Core Ultra 9 185H
2199 Points -14%
Geekbench 5.5 / Multi-Core
SCHENKER XMG Neo 16 (Early 24)
Intel Core i9-14900HX
23086 Points +63%
Lenovo Legion 9 16IRX9, RTX 4090
Intel Core i9-14900HX
21642 Points +53%
Razer Blade 16 2024, RTX 4090
Intel Core i9-14900HX
19372 Points +37%
Media della classe Gaming
  (4557 - 23194, n=191, ultimi 2 anni)
14891 Points +5%
Asus ROG Zephyrus G16 GU605MY
Intel Core Ultra 9 185H
14137 Points
Media Intel Core Ultra 9 185H
  (9330 - 14230, n=17)
13087 Points -7%
Asus ROG Zephyrus G16 2024 GU605M
Intel Core Ultra 7 155H
12905 Points -9%
Alienware x16 R2 P120F
Intel Core Ultra 9 185H
12759 Points -10%
Geekbench 5.5 / Single-Core
SCHENKER XMG Neo 16 (Early 24)
Intel Core i9-14900HX
2195 Points +19%
Razer Blade 16 2024, RTX 4090
Intel Core i9-14900HX
2131 Points +15%
Media della classe Gaming
  (986 - 2210, n=191, ultimi 2 anni)
1882 Points +2%
Asus ROG Zephyrus G16 GU605MY
Intel Core Ultra 9 185H
1846 Points
Media Intel Core Ultra 9 185H
  (986 - 1902, n=17)
1778 Points -4%
Asus ROG Zephyrus G16 2024 GU605M
Intel Core Ultra 7 155H
1755 Points -5%
Lenovo Legion 9 16IRX9, RTX 4090
Intel Core i9-14900HX
1729 Points -6%
Alienware x16 R2 P120F
Intel Core Ultra 9 185H
1700 Points -8%
HWBOT x265 Benchmark v2.2 / 4k Preset
SCHENKER XMG Neo 16 (Early 24)
Intel Core i9-14900HX
35.3 fps +66%
Lenovo Legion 9 16IRX9, RTX 4090
Intel Core i9-14900HX
30.7 fps +44%
Razer Blade 16 2024, RTX 4090
Intel Core i9-14900HX
30.1 fps +41%
Media della classe Gaming
  (6.72 - 38.9, n=190, ultimi 2 anni)
23.3 fps +9%
Asus ROG Zephyrus G16 GU605MY
Intel Core Ultra 9 185H
21.3 fps
Alienware x16 R2 P120F
Intel Core Ultra 9 185H
20.7 fps -3%
Asus ROG Zephyrus G16 2024 GU605M
Intel Core Ultra 7 155H
19.9 fps -7%
Media Intel Core Ultra 9 185H
  (14.1 - 22.7, n=17)
19.9 fps -7%
LibreOffice / 20 Documents To PDF
Lenovo Legion 9 16IRX9, RTX 4090
Intel Core i9-14900HX
53.6 s * -25%
Asus ROG Zephyrus G16 2024 GU605M
Intel Core Ultra 7 155H
49.6 s * -16%
Media della classe Gaming
  (31.4 - 96.6, n=187, ultimi 2 anni)
47.6 s * -11%
Razer Blade 16 2024, RTX 4090
Intel Core i9-14900HX
47.5 s * -11%
Alienware x16 R2 P120F
Intel Core Ultra 9 185H
45.9 s * -7%
Media Intel Core Ultra 9 185H
  (34.5 - 62, n=17)
44.6 s * -4%
Asus ROG Zephyrus G16 GU605MY
Intel Core Ultra 9 185H
42.9 s *
SCHENKER XMG Neo 16 (Early 24)
Intel Core i9-14900HX
32.9 s * +23%
R Benchmark 2.5 / Overall mean
Alienware x16 R2 P120F
Intel Core Ultra 9 185H
0.503 sec * -17%
Lenovo Legion 9 16IRX9, RTX 4090
Intel Core i9-14900HX
0.4859 sec * -13%
Media Intel Core Ultra 9 185H
  (0.4313 - 0.759, n=18)
0.4721 sec * -9%
Asus ROG Zephyrus G16 2024 GU605M
Intel Core Ultra 7 155H
0.4654 sec * -8%
Media della classe Gaming
  (0.3609 - 0.759, n=191, ultimi 2 anni)
0.4402 sec * -2%
Asus ROG Zephyrus G16 GU605MY
Intel Core Ultra 9 185H
0.4313 sec *
Razer Blade 16 2024, RTX 4090
Intel Core i9-14900HX
0.3789 sec * +12%
SCHENKER XMG Neo 16 (Early 24)
Intel Core i9-14900HX
0.3658 sec * +15%

* ... Meglio usare valori piccoli

Cinebench R15 CPU Multi 64Bit
3019 Points
Cinebench R15 OpenGL 64Bit
192.9 fps
Cinebench R15 Ref. Match 64Bit
99.6 %
Cinebench R15 CPU Single 64Bit
275 Points
Cinebench R20 CPU (Multi Core)
7299 Points
Cinebench R20 CPU (Single Core)
718 Points
Cinebench R23 Single Core
1876 Points
Cinebench R23 Multi Core
19110 Points
Aiuto
Performance Rating
SCHENKER XMG Neo 16 (Early 24)
Intel Core i9-14900HX, NVIDIA GeForce RTX 4090 Laptop GPU
99 pt
Lenovo Legion 9 16IRX9, RTX 4090
Intel Core i9-14900HX, NVIDIA GeForce RTX 4090 Laptop GPU
91.1 pt
Razer Blade 16 2024, RTX 4090
Intel Core i9-14900HX, NVIDIA GeForce RTX 4090 Laptop GPU
85.6 pt
Media della classe Gaming
 
70.3 pt
Alienware x16 R2 P120F
Intel Core Ultra 9 185H, NVIDIA GeForce RTX 4080 Laptop GPU
64.9 pt
Asus ROG Zephyrus G16 GU605MY
Intel Core Ultra 9 185H, NVIDIA GeForce RTX 4090 Laptop GPU
61.8 pt
Media Intel Core Ultra 9 185H
 
58.7 pt
Asus ROG Zephyrus G16 2024 GU605M
Intel Core Ultra 7 155H, NVIDIA GeForce RTX 4070 Laptop GPU
58 pt
AIDA64 / FP32 Ray-Trace
SCHENKER XMG Neo 16 (Early 24)
Intel Core i9-14900HX, NVIDIA GeForce RTX 4090 Laptop GPU
30829 KRay/s +77%
Lenovo Legion 9 16IRX9, RTX 4090
Intel Core i9-14900HX, NVIDIA GeForce RTX 4090 Laptop GPU
27535 KRay/s +58%
Razer Blade 16 2024, RTX 4090
Intel Core i9-14900HX, NVIDIA GeForce RTX 4090 Laptop GPU
25682 KRay/s +47%
Media della classe Gaming
  (4986 - 60169, n=187, ultimi 2 anni)
21640 KRay/s +24%
Alienware x16 R2 P120F
Intel Core Ultra 9 185H, NVIDIA GeForce RTX 4080 Laptop GPU
18676 KRay/s +7%
Asus ROG Zephyrus G16 GU605MY
Intel Core Ultra 9 185H, NVIDIA GeForce RTX 4090 Laptop GPU
17461 KRay/s
Asus ROG Zephyrus G16 2024 GU605M
Intel Core Ultra 7 155H, NVIDIA GeForce RTX 4070 Laptop GPU
16431 KRay/s -6%
Media Intel Core Ultra 9 185H
  (9220 - 18676, n=17)
16246 KRay/s -7%
AIDA64 / FPU Julia
SCHENKER XMG Neo 16 (Early 24)
Intel Core i9-14900HX, NVIDIA GeForce RTX 4090 Laptop GPU
150728 Points +66%
Lenovo Legion 9 16IRX9, RTX 4090
Intel Core i9-14900HX, NVIDIA GeForce RTX 4090 Laptop GPU
136486 Points +50%
Razer Blade 16 2024, RTX 4090
Intel Core i9-14900HX, NVIDIA GeForce RTX 4090 Laptop GPU
127908 Points +41%
Media della classe Gaming
  (25360 - 252486, n=187, ultimi 2 anni)
106090 Points +17%
Alienware x16 R2 P120F
Intel Core Ultra 9 185H, NVIDIA GeForce RTX 4080 Laptop GPU
96463 Points +6%
Asus ROG Zephyrus G16 GU605MY
Intel Core Ultra 9 185H, NVIDIA GeForce RTX 4090 Laptop GPU
90983 Points
Asus ROG Zephyrus G16 2024 GU605M
Intel Core Ultra 7 155H, NVIDIA GeForce RTX 4070 Laptop GPU
85461 Points -6%
Media Intel Core Ultra 9 185H
  (48865 - 96463, n=17)
84257 Points -7%
AIDA64 / CPU SHA3
SCHENKER XMG Neo 16 (Early 24)
Intel Core i9-14900HX, NVIDIA GeForce RTX 4090 Laptop GPU
7588 MB/s +77%
Lenovo Legion 9 16IRX9, RTX 4090
Intel Core i9-14900HX, NVIDIA GeForce RTX 4090 Laptop GPU
7000 MB/s +64%
Razer Blade 16 2024, RTX 4090
Intel Core i9-14900HX, NVIDIA GeForce RTX 4090 Laptop GPU
6188 MB/s +45%
Media della classe Gaming
  (1339 - 10389, n=187, ultimi 2 anni)
4852 MB/s +13%
Alienware x16 R2 P120F
Intel Core Ultra 9 185H, NVIDIA GeForce RTX 4080 Laptop GPU
4534 MB/s +6%
Asus ROG Zephyrus G16 GU605MY
Intel Core Ultra 9 185H, NVIDIA GeForce RTX 4090 Laptop GPU
4278 MB/s
Media Intel Core Ultra 9 185H
  (2394 - 4534, n=17)
3948 MB/s -8%
Asus ROG Zephyrus G16 2024 GU605M
Intel Core Ultra 7 155H, NVIDIA GeForce RTX 4070 Laptop GPU
3814 MB/s -11%
AIDA64 / CPU Queen
SCHENKER XMG Neo 16 (Early 24)
Intel Core i9-14900HX, NVIDIA GeForce RTX 4090 Laptop GPU
148966 Points +63%
Razer Blade 16 2024, RTX 4090
Intel Core i9-14900HX, NVIDIA GeForce RTX 4090 Laptop GPU
138473 Points +52%
Lenovo Legion 9 16IRX9, RTX 4090
Intel Core i9-14900HX, NVIDIA GeForce RTX 4090 Laptop GPU
130803 Points +43%
Media della classe Gaming
  (50699 - 200651, n=187, ultimi 2 anni)
116237 Points +27%
Alienware x16 R2 P120F
Intel Core Ultra 9 185H, NVIDIA GeForce RTX 4080 Laptop GPU
94794 Points +4%
Asus ROG Zephyrus G16 GU605MY
Intel Core Ultra 9 185H, NVIDIA GeForce RTX 4090 Laptop GPU
91400 Points
Asus ROG Zephyrus G16 2024 GU605M
Intel Core Ultra 7 155H, NVIDIA GeForce RTX 4070 Laptop GPU
90347 Points -1%
Media Intel Core Ultra 9 185H
  (66785 - 95241, n=17)
89325 Points -2%
AIDA64 / FPU SinJulia
SCHENKER XMG Neo 16 (Early 24)
Intel Core i9-14900HX, NVIDIA GeForce RTX 4090 Laptop GPU
18114 Points +63%
Lenovo Legion 9 16IRX9, RTX 4090
Intel Core i9-14900HX, NVIDIA GeForce RTX 4090 Laptop GPU
16268 Points +47%
Razer Blade 16 2024, RTX 4090
Intel Core i9-14900HX, NVIDIA GeForce RTX 4090 Laptop GPU
15857 Points +43%
Media della classe Gaming
  (4800 - 32988, n=187, ultimi 2 anni)
13175 Points +19%
Alienware x16 R2 P120F
Intel Core Ultra 9 185H, NVIDIA GeForce RTX 4080 Laptop GPU
11095 Points 0%
Asus ROG Zephyrus G16 GU605MY
Intel Core Ultra 9 185H, NVIDIA GeForce RTX 4090 Laptop GPU
11092 Points
Asus ROG Zephyrus G16 2024 GU605M
Intel Core Ultra 7 155H, NVIDIA GeForce RTX 4070 Laptop GPU
10641 Points -4%
Media Intel Core Ultra 9 185H
  (7255 - 11392, n=17)
10466 Points -6%
AIDA64 / FPU Mandel
SCHENKER XMG Neo 16 (Early 24)
Intel Core i9-14900HX, NVIDIA GeForce RTX 4090 Laptop GPU
76668 Points +70%
Lenovo Legion 9 16IRX9, RTX 4090
Intel Core i9-14900HX, NVIDIA GeForce RTX 4090 Laptop GPU
68467 Points +52%
Razer Blade 16 2024, RTX 4090
Intel Core i9-14900HX, NVIDIA GeForce RTX 4090 Laptop GPU
64134 Points +42%
Media della classe Gaming
  (12321 - 134044, n=187, ultimi 2 anni)
53471 Points +18%
Alienware x16 R2 P120F
Intel Core Ultra 9 185H, NVIDIA GeForce RTX 4080 Laptop GPU
48020 Points +6%
Asus ROG Zephyrus G16 GU605MY
Intel Core Ultra 9 185H, NVIDIA GeForce RTX 4090 Laptop GPU
45127 Points
Asus ROG Zephyrus G16 2024 GU605M
Intel Core Ultra 7 155H, NVIDIA GeForce RTX 4070 Laptop GPU
41806 Points -7%
Media Intel Core Ultra 9 185H
  (24004 - 48020, n=17)
41320 Points -8%
AIDA64 / CPU AES
SCHENKER XMG Neo 16 (Early 24)
Intel Core i9-14900HX, NVIDIA GeForce RTX 4090 Laptop GPU
145389 MB/s +72%
Lenovo Legion 9 16IRX9, RTX 4090
Intel Core i9-14900HX, NVIDIA GeForce RTX 4090 Laptop GPU
133395 MB/s +57%
Razer Blade 16 2024, RTX 4090
Intel Core i9-14900HX, NVIDIA GeForce RTX 4090 Laptop GPU
122937 MB/s +45%
Media della classe Gaming
  (19065 - 328679, n=187, ultimi 2 anni)
109176 MB/s +29%
Media Intel Core Ultra 9 185H
  (53116 - 154066, n=17)
91796 MB/s +8%
Alienware x16 R2 P120F
Intel Core Ultra 9 185H, NVIDIA GeForce RTX 4080 Laptop GPU
88763 MB/s +5%
Asus ROG Zephyrus G16 GU605MY
Intel Core Ultra 9 185H, NVIDIA GeForce RTX 4090 Laptop GPU
84774 MB/s
Asus ROG Zephyrus G16 2024 GU605M
Intel Core Ultra 7 155H, NVIDIA GeForce RTX 4070 Laptop GPU
79475 MB/s -6%
AIDA64 / CPU ZLib
SCHENKER XMG Neo 16 (Early 24)
Intel Core i9-14900HX, NVIDIA GeForce RTX 4090 Laptop GPU
2239 MB/s +86%
Lenovo Legion 9 16IRX9, RTX 4090
Intel Core i9-14900HX, NVIDIA GeForce RTX 4090 Laptop GPU
2043 MB/s +70%
Razer Blade 16 2024, RTX 4090
Intel Core i9-14900HX, NVIDIA GeForce RTX 4090 Laptop GPU
1863 MB/s +55%
Media della classe Gaming
  (373 - 2409, n=187, ultimi 2 anni)
1349 MB/s +12%
Alienware x16 R2 P120F
Intel Core Ultra 9 185H, NVIDIA GeForce RTX 4080 Laptop GPU
1298 MB/s +8%
Asus ROG Zephyrus G16 GU605MY
Intel Core Ultra 9 185H, NVIDIA GeForce RTX 4090 Laptop GPU
1201 MB/s
Media Intel Core Ultra 9 185H
  (678 - 1341, n=17)
1152 MB/s -4%
Asus ROG Zephyrus G16 2024 GU605M
Intel Core Ultra 7 155H, NVIDIA GeForce RTX 4070 Laptop GPU
1128 MB/s -6%
AIDA64 / FP64 Ray-Trace
SCHENKER XMG Neo 16 (Early 24)
Intel Core i9-14900HX, NVIDIA GeForce RTX 4090 Laptop GPU
16655 KRay/s +79%
Lenovo Legion 9 16IRX9, RTX 4090
Intel Core i9-14900HX, NVIDIA GeForce RTX 4090 Laptop GPU
14791 KRay/s +59%
Razer Blade 16 2024, RTX 4090
Intel Core i9-14900HX, NVIDIA GeForce RTX 4090 Laptop GPU
13993 KRay/s +50%
Media della classe Gaming
  (2540 - 31796, n=187, ultimi 2 anni)
11654 KRay/s +25%
Alienware x16 R2 P120F
Intel Core Ultra 9 185H, NVIDIA GeForce RTX 4080 Laptop GPU
10078 KRay/s +8%
Asus ROG Zephyrus G16 GU605MY
Intel Core Ultra 9 185H, NVIDIA GeForce RTX 4090 Laptop GPU
9329 KRay/s
Media Intel Core Ultra 9 185H
  (4428 - 10078, n=17)
8522 KRay/s -9%
Asus ROG Zephyrus G16 2024 GU605M
Intel Core Ultra 7 155H, NVIDIA GeForce RTX 4070 Laptop GPU
8449 KRay/s -9%
AIDA64 / CPU PhotoWorxx
Lenovo Legion 9 16IRX9, RTX 4090
Intel Core i9-14900HX, NVIDIA GeForce RTX 4090 Laptop GPU
54702 MPixel/s +5%
Alienware x16 R2 P120F
Intel Core Ultra 9 185H, NVIDIA GeForce RTX 4080 Laptop GPU
53242 MPixel/s +2%
Asus ROG Zephyrus G16 GU605MY
Intel Core Ultra 9 185H, NVIDIA GeForce RTX 4090 Laptop GPU
52181 MPixel/s
Razer Blade 16 2024, RTX 4090
Intel Core i9-14900HX, NVIDIA GeForce RTX 4090 Laptop GPU
49616 MPixel/s -5%
SCHENKER XMG Neo 16 (Early 24)
Intel Core i9-14900HX, NVIDIA GeForce RTX 4090 Laptop GPU
49305 MPixel/s -6%
Asus ROG Zephyrus G16 2024 GU605M
Intel Core Ultra 7 155H, NVIDIA GeForce RTX 4070 Laptop GPU
49238 MPixel/s -6%
Media Intel Core Ultra 9 185H
  (44809 - 53918, n=17)
48878 MPixel/s -6%
Media della classe Gaming
  (10805 - 60161, n=188, ultimi 2 anni)
39919 MPixel/s -23%

Prestazioni del sistema

Un po' meno sorprendente è il fatto che la variante di fascia alta dello Zephyrus G16 è un portatile molto reattivo. Sebbene anche i risultati dei benchmark siano buoni, ancora una volta la concorrenza dotata di processore HX si comporta meglio. Tuttavia, questo non si nota nelle situazioni quotidiane. A causa della commutazione della grafica Advanced Optimus, si verifica occasionalmente un breve blocco all'avvio dei giochi quando il sistema passa alla dGPU, ma questo è del tutto normale.

PCMark 10 / Score
SCHENKER XMG Neo 16 (Early 24)
NVIDIA GeForce RTX 4090 Laptop GPU, i9-14900HX, Samsung 990 Pro 1 TB
9017 Points +13%
Razer Blade 16 2024, RTX 4090
NVIDIA GeForce RTX 4090 Laptop GPU, i9-14900HX, Samsung PM9A1 MZVL22T0HBLB
8401 Points +5%
Lenovo Legion 9 16IRX9, RTX 4090
NVIDIA GeForce RTX 4090 Laptop GPU, i9-14900HX, Micron 3400 2TB MTFDKBA2T0TFH
8239 Points +3%
Asus ROG Zephyrus G16 GU605MY
NVIDIA GeForce RTX 4090 Laptop GPU, Ultra 9 185H, Samsung PM9A1a MZVL22T0HDLB
7993 Points
Media Intel Core Ultra 9 185H, NVIDIA GeForce RTX 4090 Laptop GPU
  ()
7993 Points 0%
Media della classe Gaming
  (5776 - 9852, n=168, ultimi 2 anni)
7774 Points -3%
Alienware x16 R2 P120F
NVIDIA GeForce RTX 4080 Laptop GPU, Ultra 9 185H, WDC PC SN810 1TB
7251 Points -9%
Asus ROG Zephyrus G16 2024 GU605M
NVIDIA GeForce RTX 4070 Laptop GPU, Ultra 7 155H, WD PC SN560 SDDPNQE-1T00
7123 Points -11%
PCMark 10 / Essentials
SCHENKER XMG Neo 16 (Early 24)
NVIDIA GeForce RTX 4090 Laptop GPU, i9-14900HX, Samsung 990 Pro 1 TB
11065 Points +2%
Lenovo Legion 9 16IRX9, RTX 4090
NVIDIA GeForce RTX 4090 Laptop GPU, i9-14900HX, Micron 3400 2TB MTFDKBA2T0TFH
11007 Points +2%
Razer Blade 16 2024, RTX 4090
NVIDIA GeForce RTX 4090 Laptop GPU, i9-14900HX, Samsung PM9A1 MZVL22T0HBLB
10915 Points +1%
Media della classe Gaming
  (9057 - 12334, n=167, ultimi 2 anni)
10836 Points 0%
Asus ROG Zephyrus G16 GU605MY
NVIDIA GeForce RTX 4090 Laptop GPU, Ultra 9 185H, Samsung PM9A1a MZVL22T0HDLB
10835 Points
Media Intel Core Ultra 9 185H, NVIDIA GeForce RTX 4090 Laptop GPU
  ()
10835 Points 0%
Asus ROG Zephyrus G16 2024 GU605M
NVIDIA GeForce RTX 4070 Laptop GPU, Ultra 7 155H, WD PC SN560 SDDPNQE-1T00
10038 Points -7%
Alienware x16 R2 P120F
NVIDIA GeForce RTX 4080 Laptop GPU, Ultra 9 185H, WDC PC SN810 1TB
10036 Points -7%
PCMark 10 / Productivity
SCHENKER XMG Neo 16 (Early 24)
NVIDIA GeForce RTX 4090 Laptop GPU, i9-14900HX, Samsung 990 Pro 1 TB
11681 Points +18%
Razer Blade 16 2024, RTX 4090
NVIDIA GeForce RTX 4090 Laptop GPU, i9-14900HX, Samsung PM9A1 MZVL22T0HBLB
11150 Points +12%
Lenovo Legion 9 16IRX9, RTX 4090
NVIDIA GeForce RTX 4090 Laptop GPU, i9-14900HX, Micron 3400 2TB MTFDKBA2T0TFH
10202 Points +3%
Asus ROG Zephyrus G16 GU605MY
NVIDIA GeForce RTX 4090 Laptop GPU, Ultra 9 185H, Samsung PM9A1a MZVL22T0HDLB
9937 Points
Media Intel Core Ultra 9 185H, NVIDIA GeForce RTX 4090 Laptop GPU
  ()
9937 Points 0%
Media della classe Gaming
  (6662 - 14612, n=167, ultimi 2 anni)
9878 Points -1%
Asus ROG Zephyrus G16 2024 GU605M
NVIDIA GeForce RTX 4070 Laptop GPU, Ultra 7 155H, WD PC SN560 SDDPNQE-1T00
9208 Points -7%
Alienware x16 R2 P120F
NVIDIA GeForce RTX 4080 Laptop GPU, Ultra 9 185H, WDC PC SN810 1TB
7934 Points -20%
PCMark 10 / Digital Content Creation
SCHENKER XMG Neo 16 (Early 24)
NVIDIA GeForce RTX 4090 Laptop GPU, i9-14900HX, Samsung 990 Pro 1 TB
15394 Points +20%
Lenovo Legion 9 16IRX9, RTX 4090
NVIDIA GeForce RTX 4090 Laptop GPU, i9-14900HX, Micron 3400 2TB MTFDKBA2T0TFH
13516 Points +5%
Razer Blade 16 2024, RTX 4090
NVIDIA GeForce RTX 4090 Laptop GPU, i9-14900HX, Samsung PM9A1 MZVL22T0HBLB
13219 Points +3%
Alienware x16 R2 P120F
NVIDIA GeForce RTX 4080 Laptop GPU, Ultra 9 185H, WDC PC SN810 1TB
12994 Points +1%
Asus ROG Zephyrus G16 GU605MY
NVIDIA GeForce RTX 4090 Laptop GPU, Ultra 9 185H, Samsung PM9A1a MZVL22T0HDLB
12872 Points
Media Intel Core Ultra 9 185H, NVIDIA GeForce RTX 4090 Laptop GPU
  ()
12872 Points 0%
Media della classe Gaming
  (6703 - 18475, n=167, ultimi 2 anni)
12030 Points -7%
Asus ROG Zephyrus G16 2024 GU605M
NVIDIA GeForce RTX 4070 Laptop GPU, Ultra 7 155H, WD PC SN560 SDDPNQE-1T00
10612 Points -18%
CrossMark / Overall
SCHENKER XMG Neo 16 (Early 24)
NVIDIA GeForce RTX 4090 Laptop GPU, i9-14900HX, Samsung 990 Pro 1 TB
2344 Points +29%
Razer Blade 16 2024, RTX 4090
NVIDIA GeForce RTX 4090 Laptop GPU, i9-14900HX, Samsung PM9A1 MZVL22T0HBLB
2149 Points +18%
Lenovo Legion 9 16IRX9, RTX 4090
NVIDIA GeForce RTX 4090 Laptop GPU, i9-14900HX, Micron 3400 2TB MTFDKBA2T0TFH
1939 Points +7%
Media della classe Gaming
  (1247 - 2344, n=151, ultimi 2 anni)
1899 Points +5%
Asus ROG Zephyrus G16 GU605MY
NVIDIA GeForce RTX 4090 Laptop GPU, Ultra 9 185H, Samsung PM9A1a MZVL22T0HDLB
1815 Points
Media Intel Core Ultra 9 185H, NVIDIA GeForce RTX 4090 Laptop GPU
  ()
1815 Points 0%
Asus ROG Zephyrus G16 2024 GU605M
NVIDIA GeForce RTX 4070 Laptop GPU, Ultra 7 155H, WD PC SN560 SDDPNQE-1T00
1721 Points -5%
Alienware x16 R2 P120F
NVIDIA GeForce RTX 4080 Laptop GPU, Ultra 9 185H, WDC PC SN810 1TB
1589 Points -12%
CrossMark / Productivity
SCHENKER XMG Neo 16 (Early 24)
NVIDIA GeForce RTX 4090 Laptop GPU, i9-14900HX, Samsung 990 Pro 1 TB
2162 Points +27%
Razer Blade 16 2024, RTX 4090
NVIDIA GeForce RTX 4090 Laptop GPU, i9-14900HX, Samsung PM9A1 MZVL22T0HBLB
2007 Points +18%
Media della classe Gaming
  (1299 - 2204, n=151, ultimi 2 anni)
1801 Points +6%
Lenovo Legion 9 16IRX9, RTX 4090
NVIDIA GeForce RTX 4090 Laptop GPU, i9-14900HX, Micron 3400 2TB MTFDKBA2T0TFH
1755 Points +3%
Asus ROG Zephyrus G16 GU605MY
NVIDIA GeForce RTX 4090 Laptop GPU, Ultra 9 185H, Samsung PM9A1a MZVL22T0HDLB
1700 Points
Media Intel Core Ultra 9 185H, NVIDIA GeForce RTX 4090 Laptop GPU
  ()
1700 Points 0%
Asus ROG Zephyrus G16 2024 GU605M
NVIDIA GeForce RTX 4070 Laptop GPU, Ultra 7 155H, WD PC SN560 SDDPNQE-1T00
1624 Points -4%
Alienware x16 R2 P120F
NVIDIA GeForce RTX 4080 Laptop GPU, Ultra 9 185H, WDC PC SN810 1TB
1584 Points -7%
CrossMark / Creativity
SCHENKER XMG Neo 16 (Early 24)
NVIDIA GeForce RTX 4090 Laptop GPU, i9-14900HX, Samsung 990 Pro 1 TB
2660 Points +29%
Razer Blade 16 2024, RTX 4090
NVIDIA GeForce RTX 4090 Laptop GPU, i9-14900HX, Samsung PM9A1 MZVL22T0HBLB
2418 Points +17%
Lenovo Legion 9 16IRX9, RTX 4090
NVIDIA GeForce RTX 4090 Laptop GPU, i9-14900HX, Micron 3400 2TB MTFDKBA2T0TFH
2207 Points +7%
Media della classe Gaming
  (1275 - 2660, n=151, ultimi 2 anni)
2083 Points +1%
Asus ROG Zephyrus G16 GU605MY
NVIDIA GeForce RTX 4090 Laptop GPU, Ultra 9 185H, Samsung PM9A1a MZVL22T0HDLB
2070 Points
Media Intel Core Ultra 9 185H, NVIDIA GeForce RTX 4090 Laptop GPU
  ()
2070 Points 0%
Asus ROG Zephyrus G16 2024 GU605M
NVIDIA GeForce RTX 4070 Laptop GPU, Ultra 7 155H, WD PC SN560 SDDPNQE-1T00
1942 Points -6%
Alienware x16 R2 P120F
NVIDIA GeForce RTX 4080 Laptop GPU, Ultra 9 185H, WDC PC SN810 1TB
1583 Points -24%
CrossMark / Responsiveness
SCHENKER XMG Neo 16 (Early 24)
NVIDIA GeForce RTX 4090 Laptop GPU, i9-14900HX, Samsung 990 Pro 1 TB
2045 Points +37%
Razer Blade 16 2024, RTX 4090
NVIDIA GeForce RTX 4090 Laptop GPU, i9-14900HX, Samsung PM9A1 MZVL22T0HBLB
1851 Points +24%
Lenovo Legion 9 16IRX9, RTX 4090
NVIDIA GeForce RTX 4090 Laptop GPU, i9-14900HX, Micron 3400 2TB MTFDKBA2T0TFH
1769 Points +19%
Media della classe Gaming
  (1030 - 2330, n=151, ultimi 2 anni)
1699 Points +14%
Alienware x16 R2 P120F
NVIDIA GeForce RTX 4080 Laptop GPU, Ultra 9 185H, WDC PC SN810 1TB
1621 Points +9%
Asus ROG Zephyrus G16 GU605MY
NVIDIA GeForce RTX 4090 Laptop GPU, Ultra 9 185H, Samsung PM9A1a MZVL22T0HDLB
1490 Points
Media Intel Core Ultra 9 185H, NVIDIA GeForce RTX 4090 Laptop GPU
  ()
1490 Points 0%
Asus ROG Zephyrus G16 2024 GU605M
NVIDIA GeForce RTX 4070 Laptop GPU, Ultra 7 155H, WD PC SN560 SDDPNQE-1T00
1424 Points -4%
WebXPRT 3 / Overall
SCHENKER XMG Neo 16 (Early 24)
NVIDIA GeForce RTX 4090 Laptop GPU, i9-14900HX, Samsung 990 Pro 1 TB
336 Points +20%
Razer Blade 16 2024, RTX 4090
NVIDIA GeForce RTX 4090 Laptop GPU, i9-14900HX, Samsung PM9A1 MZVL22T0HBLB
330 Points +17%
Media della classe Gaming
  (215 - 480, n=165, ultimi 2 anni)
303 Points +8%
Asus ROG Zephyrus G16 2024 GU605M
NVIDIA GeForce RTX 4070 Laptop GPU, Ultra 7 155H, WD PC SN560 SDDPNQE-1T00
283 Points +1%
Asus ROG Zephyrus G16 GU605MY
NVIDIA GeForce RTX 4090 Laptop GPU, Ultra 9 185H, Samsung PM9A1a MZVL22T0HDLB
281 Points
Media Intel Core Ultra 9 185H, NVIDIA GeForce RTX 4090 Laptop GPU
  ()
281 Points 0%
Lenovo Legion 9 16IRX9, RTX 4090
NVIDIA GeForce RTX 4090 Laptop GPU, i9-14900HX, Micron 3400 2TB MTFDKBA2T0TFH
279 Points -1%
Alienware x16 R2 P120F
NVIDIA GeForce RTX 4080 Laptop GPU, Ultra 9 185H, WDC PC SN810 1TB
237 Points -16%
WebXPRT 4 / Overall
SCHENKER XMG Neo 16 (Early 24)
NVIDIA GeForce RTX 4090 Laptop GPU, i9-14900HX, Samsung 990 Pro 1 TB
306 Points +14%
Asus ROG Zephyrus G16 GU605MY
NVIDIA GeForce RTX 4090 Laptop GPU, Ultra 9 185H, Samsung PM9A1a MZVL22T0HDLB
269 Points
Media Intel Core Ultra 9 185H, NVIDIA GeForce RTX 4090 Laptop GPU
  ()
269 Points 0%
Media della classe Gaming
  (157.9 - 328, n=153, ultimi 2 anni)
266 Points -1%
Asus ROG Zephyrus G16 2024 GU605M
NVIDIA GeForce RTX 4070 Laptop GPU, Ultra 7 155H, WD PC SN560 SDDPNQE-1T00
256 Points -5%
Lenovo Legion 9 16IRX9, RTX 4090
NVIDIA GeForce RTX 4090 Laptop GPU, i9-14900HX, Micron 3400 2TB MTFDKBA2T0TFH
246 Points -9%
Alienware x16 R2 P120F
NVIDIA GeForce RTX 4080 Laptop GPU, Ultra 9 185H, WDC PC SN810 1TB
237 Points -12%
Mozilla Kraken 1.1 / Total
Alienware x16 R2 P120F
NVIDIA GeForce RTX 4080 Laptop GPU, Ultra 9 185H, WDC PC SN810 1TB
594 ms * -14%
Asus ROG Zephyrus G16 2024 GU605M
NVIDIA GeForce RTX 4070 Laptop GPU, Ultra 7 155H, WD PC SN560 SDDPNQE-1T00
548 ms * -5%
Lenovo Legion 9 16IRX9, RTX 4090
NVIDIA GeForce RTX 4090 Laptop GPU, i9-14900HX, Micron 3400 2TB MTFDKBA2T0TFH
535 ms * -2%
Asus ROG Zephyrus G16 GU605MY
NVIDIA GeForce RTX 4090 Laptop GPU, Ultra 9 185H, Samsung PM9A1a MZVL22T0HDLB
522 ms *
Media Intel Core Ultra 9 185H, NVIDIA GeForce RTX 4090 Laptop GPU
  ()
522 ms * -0%
Media della classe Gaming
  (421 - 779, n=179, ultimi 2 anni)
506 ms * +3%
Razer Blade 16 2024, RTX 4090
NVIDIA GeForce RTX 4090 Laptop GPU, i9-14900HX, Samsung PM9A1 MZVL22T0HBLB
450 ms * +14%
SCHENKER XMG Neo 16 (Early 24)
NVIDIA GeForce RTX 4090 Laptop GPU, i9-14900HX, Samsung 990 Pro 1 TB
428 ms * +18%

* ... Meglio usare valori piccoli

PCMark 10 Score
7993 punti
Aiuto
AIDA64 / Memory Copy
Asus ROG Zephyrus G16 GU605MY
Intel Core Ultra 9 185H, NVIDIA GeForce RTX 4090 Laptop GPU
93766 MB/s
Alienware x16 R2 P120F
Intel Core Ultra 9 185H, NVIDIA GeForce RTX 4080 Laptop GPU
89701 MB/s -4%
Asus ROG Zephyrus G16 2024 GU605M
Intel Core Ultra 7 155H, NVIDIA GeForce RTX 4070 Laptop GPU
89414 MB/s -5%
Media Intel Core Ultra 9 185H
  (69929 - 95718, n=17)
85040 MB/s -9%
Lenovo Legion 9 16IRX9, RTX 4090
Intel Core i9-14900HX, NVIDIA GeForce RTX 4090 Laptop GPU
81940 MB/s -13%
SCHENKER XMG Neo 16 (Early 24)
Intel Core i9-14900HX, NVIDIA GeForce RTX 4090 Laptop GPU
78897 MB/s -16%
Razer Blade 16 2024, RTX 4090
Intel Core i9-14900HX, NVIDIA GeForce RTX 4090 Laptop GPU
78799 MB/s -16%
Media della classe Gaming
  (21842 - 94222, n=187, ultimi 2 anni)
64907 MB/s -31%
AIDA64 / Memory Read
SCHENKER XMG Neo 16 (Early 24)
Intel Core i9-14900HX, NVIDIA GeForce RTX 4090 Laptop GPU
86939 MB/s +1%
Asus ROG Zephyrus G16 2024 GU605M
Intel Core Ultra 7 155H, NVIDIA GeForce RTX 4070 Laptop GPU
86576 MB/s +1%
Razer Blade 16 2024, RTX 4090
Intel Core i9-14900HX, NVIDIA GeForce RTX 4090 Laptop GPU
86387 MB/s 0%
Asus ROG Zephyrus G16 GU605MY
Intel Core Ultra 9 185H, NVIDIA GeForce RTX 4090 Laptop GPU
86010 MB/s
Alienware x16 R2 P120F
Intel Core Ultra 9 185H, NVIDIA GeForce RTX 4080 Laptop GPU
85092 MB/s -1%
Lenovo Legion 9 16IRX9, RTX 4090
Intel Core i9-14900HX, NVIDIA GeForce RTX 4090 Laptop GPU
84192 MB/s -2%
Media Intel Core Ultra 9 185H
  (64619 - 87768, n=17)
80024 MB/s -7%
Media della classe Gaming
  (23681 - 99713, n=187, ultimi 2 anni)
68658 MB/s -20%
AIDA64 / Memory Write
Lenovo Legion 9 16IRX9, RTX 4090
Intel Core i9-14900HX, NVIDIA GeForce RTX 4090 Laptop GPU
80589 MB/s +6%
SCHENKER XMG Neo 16 (Early 24)
Intel Core i9-14900HX, NVIDIA GeForce RTX 4090 Laptop GPU
77562 MB/s +2%
Asus ROG Zephyrus G16 GU605MY
Intel Core Ultra 9 185H, NVIDIA GeForce RTX 4090 Laptop GPU
75937 MB/s
Razer Blade 16 2024, RTX 4090
Intel Core i9-14900HX, NVIDIA GeForce RTX 4090 Laptop GPU
75421 MB/s -1%
Asus ROG Zephyrus G16 2024 GU605M
Intel Core Ultra 7 155H, NVIDIA GeForce RTX 4070 Laptop GPU
73337 MB/s -3%
Alienware x16 R2 P120F
Intel Core Ultra 9 185H, NVIDIA GeForce RTX 4080 Laptop GPU
73199 MB/s -4%
Media Intel Core Ultra 9 185H
  (51114 - 93871, n=17)
72271 MB/s -5%
Media della classe Gaming
  (22986 - 108954, n=187, ultimi 2 anni)
66727 MB/s -12%
AIDA64 / Memory Latency
Media Intel Core Ultra 9 185H
  (121.4 - 259, n=17)
146.9 ns * -7%
Alienware x16 R2 P120F
Intel Core Ultra 9 185H, NVIDIA GeForce RTX 4080 Laptop GPU
142.3 ns * -3%
Asus ROG Zephyrus G16 2024 GU605M
Intel Core Ultra 7 155H, NVIDIA GeForce RTX 4070 Laptop GPU
140 ns * -2%
Asus ROG Zephyrus G16 GU605MY
Intel Core Ultra 9 185H, NVIDIA GeForce RTX 4090 Laptop GPU
137.9 ns *
Lenovo Legion 9 16IRX9, RTX 4090
Intel Core i9-14900HX, NVIDIA GeForce RTX 4090 Laptop GPU
96.2 ns * +30%
Media della classe Gaming
  (59.5 - 259, n=187, ultimi 2 anni)
94.1 ns * +32%
Razer Blade 16 2024, RTX 4090
Intel Core i9-14900HX, NVIDIA GeForce RTX 4090 Laptop GPU
83.4 ns * +40%
SCHENKER XMG Neo 16 (Early 24)
Intel Core i9-14900HX, NVIDIA GeForce RTX 4090 Laptop GPU
76.1 ns * +45%

* ... Meglio usare valori piccoli

Latenze DPC

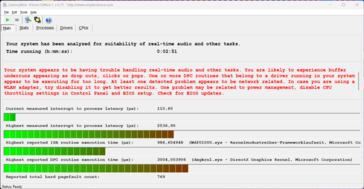
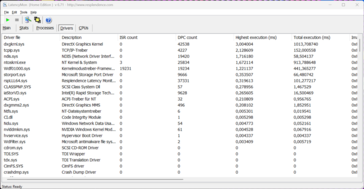
Nel nostro test di latenza standardizzato (navigazione in Internet, riproduzione di YouTube in 4K, carico della CPU), con il BIOS attuale, il dispositivo recensito ha mostrato dei limiti quando si trattava di utilizzare applicazioni audio in tempo reale. Tuttavia, questo era già il caso con il modello Modello RTX 4070.

LatencyMon - Panoramica
LatencyMon - Driver
LatencyMon - Driver
DPC Latencies / LatencyMon - interrupt to process latency (max), Web, Youtube, Prime95
Alienware x16 R2 P120F
NVIDIA GeForce RTX 4080 Laptop GPU, Ultra 9 185H, WDC PC SN810 1TB
16146 μs * -536%
Asus ROG Zephyrus G16 GU605MY
NVIDIA GeForce RTX 4090 Laptop GPU, Ultra 9 185H, Samsung PM9A1a MZVL22T0HDLB
2536.9 μs *
Asus ROG Zephyrus G16 2024 GU605M
NVIDIA GeForce RTX 4070 Laptop GPU, Ultra 7 155H, WD PC SN560 SDDPNQE-1T00
2484.4 μs * +2%
SCHENKER XMG Neo 16 (Early 24)
NVIDIA GeForce RTX 4090 Laptop GPU, i9-14900HX, Samsung 990 Pro 1 TB
2478.6 μs * +2%
Lenovo Legion 9 16IRX9, RTX 4090
NVIDIA GeForce RTX 4090 Laptop GPU, i9-14900HX, Micron 3400 2TB MTFDKBA2T0TFH
2448.1 μs * +4%
Razer Blade 16 2024, RTX 4090
NVIDIA GeForce RTX 4090 Laptop GPU, i9-14900HX, Samsung PM9A1 MZVL22T0HBLB
1389.7 μs * +45%

* ... Meglio usare valori piccoli

Memoria di massa

Il modello RTX 4090 offre anche due slot M.2 2280.

Zephyrus G16 offre due slot PCIe 4.0 veloci per SSD M.2 2280, il che significa che la capacità di archiviazione può essere aggiornata in modo rapido e conveniente. Il nostro dispositivo di recensione è dotato di un'unità Samsung PM9A1a da 2 TB, sebbene 1,76 TB siano disponibili per l'utente dopo la prima installazione. Nei test sintetici, l'SSD non ha soddisfatto le nostre aspettative, ma abbiamo comunque a che fare con un'unità di archiviazione molto veloce, con velocità di trasferimento che rimangono perfettamente costanti anche sotto carico sostenuto. Ulteriori benchmark sull'SSD sono disponibili qui.

Samsung PM9A1a MZVL22T0HDLB
CDM 5/6 Read Seq Q32T1: 7104 MB/s
CDM 5/6 Write Seq Q32T1: 5141 MB/s
CDM 5/6 Read 4K Q32T1: 397 MB/s
CDM 5/6 Write 4K Q32T1: 415 MB/s
CDM 5/6 Read 4K: 70.1 MB/s
CDM 5/6 Write 4K: 130.1 MB/s
CDM 6 Write 4K Q8T8: 364 MB/s
CDM 6 Read 4K Q8T8: 1030 MB/s
Drive Performance Rating - Percent
SCHENKER XMG Neo 16 (Early 24)
Samsung 990 Pro 1 TB
91.7 pt
Alienware x16 R2 P120F
WDC PC SN810 1TB
79.9 pt
Razer Blade 16 2024, RTX 4090
Samsung PM9A1 MZVL22T0HBLB
76 pt
Media Samsung PM9A1a MZVL22T0HDLB
 
75.1 pt
Lenovo Legion 9 16IRX9, RTX 4090
Micron 3400 2TB MTFDKBA2T0TFH
70.5 pt
Media della classe Gaming
 
69.9 pt
Asus ROG Zephyrus G16 GU605MY
Samsung PM9A1a MZVL22T0HDLB
65.4 pt
Asus ROG Zephyrus G16 2024 GU605M
WD PC SN560 SDDPNQE-1T00
47.4 pt
DiskSpd
seq read
Alienware x16 R2 P120F
WDC PC SN810 1TB
4224 (3741.6min - 4224.02max) MB/s +19%
Razer Blade 16 2024, RTX 4090
Samsung PM9A1 MZVL22T0HBLB
3795 (3693.04min - 3794.8max) MB/s +7%
Media Samsung PM9A1a MZVL22T0HDLB
  (3541 - 3908, n=2)
3725 MB/s +5%
Asus ROG Zephyrus G16 GU605MY
Samsung PM9A1a MZVL22T0HDLB
3541 (3501.11min - 3540.88max) MB/s
Media della classe Gaming
  (1319 - 7045, n=168, ultimi 2 anni)
3487 MB/s -2%
Lenovo Legion 9 16IRX9, RTX 4090
Micron 3400 2TB MTFDKBA2T0TFH
3347 (3203.49min - 3347.47max) MB/s -5%
Asus ROG Zephyrus G16 2024 GU605M
WD PC SN560 SDDPNQE-1T00
3202 (3129.61min - 3201.93max) MB/s -10%
SCHENKER XMG Neo 16 (Early 24)
Samsung 990 Pro 1 TB
3015 (2943.98min - 3014.55max) MB/s -15%
seq write
Alienware x16 R2 P120F
WDC PC SN810 1TB
4899 (4625.25min - 4898.53max) MB/s +55%
SCHENKER XMG Neo 16 (Early 24)
Samsung 990 Pro 1 TB
4826 (4760.33min - 4825.54max) MB/s +53%
Media della classe Gaming
  (535 - 9307, n=168, ultimi 2 anni)
3797 MB/s +20%
Razer Blade 16 2024, RTX 4090
Samsung PM9A1 MZVL22T0HBLB
3794 (3745.51min - 3793.5max) MB/s +20%
Lenovo Legion 9 16IRX9, RTX 4090
Micron 3400 2TB MTFDKBA2T0TFH
3750 (3377.21min - 3749.92max) MB/s +19%
Media Samsung PM9A1a MZVL22T0HDLB
  (3160 - 4335, n=2)
3748 MB/s +19%
Asus ROG Zephyrus G16 GU605MY
Samsung PM9A1a MZVL22T0HDLB
3160 (3033.95min - 3160.41max) MB/s
Asus ROG Zephyrus G16 2024 GU605M
WD PC SN560 SDDPNQE-1T00
2526 (2498.97min - 2525.81max) MB/s -20%
seq q8 t1 read
SCHENKER XMG Neo 16 (Early 24)
Samsung 990 Pro 1 TB
7140 (5903.9min - 7139.54max) MB/s 0%
Asus ROG Zephyrus G16 GU605MY
Samsung PM9A1a MZVL22T0HDLB
7106 (6065.83min - 7105.62max) MB/s
Media Samsung PM9A1a MZVL22T0HDLB
  (7084 - 7106, n=2)
7095 MB/s 0%
Alienware x16 R2 P120F
WDC PC SN810 1TB
6823 (5715.47min - 6822.87max) MB/s -4%
Razer Blade 16 2024, RTX 4090
Samsung PM9A1 MZVL22T0HBLB
6673 (5801.28min - 6672.72max) MB/s -6%
Lenovo Legion 9 16IRX9, RTX 4090
Micron 3400 2TB MTFDKBA2T0TFH
6523 (5649.96min - 6522.56max) MB/s -8%
Media della classe Gaming
  (2594 - 16089, n=168, ultimi 2 anni)
6328 MB/s -11%
Asus ROG Zephyrus G16 2024 GU605M
WD PC SN560 SDDPNQE-1T00
5008 (4421.01min - 5007.74max) MB/s -30%
seq q8 t1 write
SCHENKER XMG Neo 16 (Early 24)
Samsung 990 Pro 1 TB
6860 (6824.33min - 6859.91max) MB/s +31%
Media Samsung PM9A1a MZVL22T0HDLB
  (5248 - 5255, n=2)
5252 MB/s 0%
Asus ROG Zephyrus G16 GU605MY
Samsung PM9A1a MZVL22T0HDLB
5248 (5141.58min - 5248.1max) MB/s
Alienware x16 R2 P120F
WDC PC SN810 1TB
5208 (5161.3min - 5208.07max) MB/s -1%
Lenovo Legion 9 16IRX9, RTX 4090
Micron 3400 2TB MTFDKBA2T0TFH
5092 (4641.78min - 5091.77max) MB/s -3%
Razer Blade 16 2024, RTX 4090
Samsung PM9A1 MZVL22T0HBLB
4936 (4909.47min - 4936.28max) MB/s -6%
Media della classe Gaming
  (539 - 14571, n=168, ultimi 2 anni)
4823 MB/s -8%
Asus ROG Zephyrus G16 2024 GU605M
WD PC SN560 SDDPNQE-1T00
3230 (3169.22min - 3230.03max) MB/s -38%
4k q1 t1 read
Alienware x16 R2 P120F
WDC PC SN810 1TB
79.3 (64.25min - 79.25max) MB/s +13%
Media Samsung PM9A1a MZVL22T0HDLB
  (69.9 - 80.7, n=2)
75.3 MB/s +8%
Razer Blade 16 2024, RTX 4090
Samsung PM9A1 MZVL22T0HBLB
71.4 (66.19min - 71.35max) MB/s +2%
Asus ROG Zephyrus G16 GU605MY
Samsung PM9A1a MZVL22T0HDLB
69.9 (69.26min - 69.89max) MB/s
Media della classe Gaming
  (30.6 - 95.9, n=168, ultimi 2 anni)
65.8 MB/s -6%
SCHENKER XMG Neo 16 (Early 24)
Samsung 990 Pro 1 TB
60.5 (49.54min - 60.46max) MB/s -13%
Lenovo Legion 9 16IRX9, RTX 4090
Micron 3400 2TB MTFDKBA2T0TFH
59.1 (58.3min - 59.06max) MB/s -15%
Asus ROG Zephyrus G16 2024 GU605M
WD PC SN560 SDDPNQE-1T00
52.9 (51.15min - 52.91max) MB/s -24%
4k q1 t1 write
Alienware x16 R2 P120F
WDC PC SN810 1TB
244 (238.59min - 244.13max) MB/s +87%
Media della classe Gaming
  (66.6 - 397, n=168, ultimi 2 anni)
222 MB/s +70%
Lenovo Legion 9 16IRX9, RTX 4090
Micron 3400 2TB MTFDKBA2T0TFH
209 (203.44min - 208.84max) MB/s +60%
Razer Blade 16 2024, RTX 4090
Samsung PM9A1 MZVL22T0HBLB
205 (202.97min - 204.75max) MB/s +57%
Media Samsung PM9A1a MZVL22T0HDLB
  (130.3 - 230, n=2)
180.2 MB/s +38%
SCHENKER XMG Neo 16 (Early 24)
Samsung 990 Pro 1 TB
174.4 (160.08min - 174.38max) MB/s +34%
Asus ROG Zephyrus G16 GU605MY
Samsung PM9A1a MZVL22T0HDLB
130.3 (127.94min - 130.31max) MB/s
Asus ROG Zephyrus G16 2024 GU605M
WD PC SN560 SDDPNQE-1T00
128.4 (126.56min - 128.36max) MB/s -1%
4k q32 t16 read
SCHENKER XMG Neo 16 (Early 24)
Samsung 990 Pro 1 TB
4920 (4883.21min - 4920.02max) MB/s +724%
Alienware x16 R2 P120F
WDC PC SN810 1TB
4245 (4210.56min - 4245.12max) MB/s +611%
Razer Blade 16 2024, RTX 4090
Samsung PM9A1 MZVL22T0HBLB
3726 (3704.12min - 3725.6max) MB/s +524%
Lenovo Legion 9 16IRX9, RTX 4090
Micron 3400 2TB MTFDKBA2T0TFH
2997 (2834.64min - 2996.72max) MB/s +402%
Media della classe Gaming
  (417 - 6172, n=168, ultimi 2 anni)
2555 MB/s +328%
Media Samsung PM9A1a MZVL22T0HDLB
  (597 - 3732, n=2)
2165 MB/s +263%
Asus ROG Zephyrus G16 2024 GU605M
WD PC SN560 SDDPNQE-1T00
604 (565.74min - 603.6max) MB/s +1%
Asus ROG Zephyrus G16 GU605MY
Samsung PM9A1a MZVL22T0HDLB
597 (590.16min - 596.69max) MB/s
4k q32 t16 write
SCHENKER XMG Neo 16 (Early 24)
Samsung 990 Pro 1 TB
4522 (4451.05min - 4521.93max) MB/s +1051%
Razer Blade 16 2024, RTX 4090
Samsung PM9A1 MZVL22T0HBLB
3548 (3533.85min - 3548.33max) MB/s +803%
Alienware x16 R2 P120F
WDC PC SN810 1TB
2907 (2737.8min - 2907.05max) MB/s +640%
Lenovo Legion 9 16IRX9, RTX 4090
Micron 3400 2TB MTFDKBA2T0TFH
2673 (2401.6min - 2673.33max) MB/s +580%
Media della classe Gaming
  (162.3 - 4869, n=168, ultimi 2 anni)
2101 MB/s +435%
Media Samsung PM9A1a MZVL22T0HDLB
  (393 - 2900, n=2)
1647 MB/s +319%
Asus ROG Zephyrus G16 2024 GU605M
WD PC SN560 SDDPNQE-1T00
402 (389.17min - 402.07max) MB/s +2%
Asus ROG Zephyrus G16 GU605MY
Samsung PM9A1a MZVL22T0HDLB
393 (388.68min - 393.4max) MB/s
AS SSD
Score Total
SCHENKER XMG Neo 16 (Early 24)
Samsung 990 Pro 1 TB
9365 Points +67%
Alienware x16 R2 P120F
WDC PC SN810 1TB
8139 Points +45%
Razer Blade 16 2024, RTX 4090
Samsung PM9A1 MZVL22T0HBLB
7040 Points +26%
Media Samsung PM9A1a MZVL22T0HDLB
  (5595 - 8367, n=2)
6981 Points +25%
Lenovo Legion 9 16IRX9, RTX 4090
Micron 3400 2TB MTFDKBA2T0TFH
6847 Points +22%
Media della classe Gaming
  (2271 - 13854, n=159, ultimi 2 anni)
6737 Points +20%
Asus ROG Zephyrus G16 GU605MY
Samsung PM9A1a MZVL22T0HDLB
5595 Points
Asus ROG Zephyrus G16 2024 GU605M
WD PC SN560 SDDPNQE-1T00
3272 Points -42%
Score Read
SCHENKER XMG Neo 16 (Early 24)
Samsung 990 Pro 1 TB
3496 Points +149%
Alienware x16 R2 P120F
WDC PC SN810 1TB
3204 Points +129%
Razer Blade 16 2024, RTX 4090
Samsung PM9A1 MZVL22T0HBLB
2848 Points +103%
Lenovo Legion 9 16IRX9, RTX 4090
Micron 3400 2TB MTFDKBA2T0TFH
2722 Points +94%
Media della classe Gaming
  (776 - 4721, n=159, ultimi 2 anni)
2441 Points +74%
Media Samsung PM9A1a MZVL22T0HDLB
  (1402 - 3272, n=2)
2337 Points +67%
Asus ROG Zephyrus G16 GU605MY
Samsung PM9A1a MZVL22T0HDLB
1402 Points
Asus ROG Zephyrus G16 2024 GU605M
WD PC SN560 SDDPNQE-1T00
1020 Points -27%
Score Write
SCHENKER XMG Neo 16 (Early 24)
Samsung 990 Pro 1 TB
4062 Points +13%
Asus ROG Zephyrus G16 GU605MY
Samsung PM9A1a MZVL22T0HDLB
3588 Points
Media Samsung PM9A1a MZVL22T0HDLB
  (3490 - 3588, n=2)
3539 Points -1%
Alienware x16 R2 P120F
WDC PC SN810 1TB
3341 Points -7%
Media della classe Gaming
  (515 - 7208, n=159, ultimi 2 anni)
3113 Points -13%
Razer Blade 16 2024, RTX 4090
Samsung PM9A1 MZVL22T0HBLB
2766 Points -23%
Lenovo Legion 9 16IRX9, RTX 4090
Micron 3400 2TB MTFDKBA2T0TFH
2686 Points -25%
Asus ROG Zephyrus G16 2024 GU605M
WD PC SN560 SDDPNQE-1T00
1808 Points -50%
Seq Read
SCHENKER XMG Neo 16 (Early 24)
Samsung 990 Pro 1 TB
5684.15 MB/s +6%
Alienware x16 R2 P120F
WDC PC SN810 1TB
5642.41 MB/s +5%
Media Samsung PM9A1a MZVL22T0HDLB
  (5351 - 5637, n=2)
5494 MB/s +3%
Asus ROG Zephyrus G16 GU605MY
Samsung PM9A1a MZVL22T0HDLB
5351 MB/s
Media della classe Gaming
  (2260 - 12763, n=159, ultimi 2 anni)
4944 MB/s -8%
Razer Blade 16 2024, RTX 4090
Samsung PM9A1 MZVL22T0HBLB
4371 MB/s -18%
Asus ROG Zephyrus G16 2024 GU605M
WD PC SN560 SDDPNQE-1T00
3662 MB/s -32%
Lenovo Legion 9 16IRX9, RTX 4090
Micron 3400 2TB MTFDKBA2T0TFH
2272 MB/s -58%
Seq Write
SCHENKER XMG Neo 16 (Early 24)
Samsung 990 Pro 1 TB
5612.29 MB/s +107%
Alienware x16 R2 P120F
WDC PC SN810 1TB
4787.7 MB/s +76%
Razer Blade 16 2024, RTX 4090
Samsung PM9A1 MZVL22T0HBLB
3791 MB/s +40%
Media della classe Gaming
  (495 - 11316, n=159, ultimi 2 anni)
3720 MB/s +37%
Media Samsung PM9A1a MZVL22T0HDLB
  (2713 - 4295, n=2)
3504 MB/s +29%
Lenovo Legion 9 16IRX9, RTX 4090
Micron 3400 2TB MTFDKBA2T0TFH
3289 MB/s +21%
Asus ROG Zephyrus G16 GU605MY
Samsung PM9A1a MZVL22T0HDLB
2713 MB/s
Asus ROG Zephyrus G16 2024 GU605M
WD PC SN560 SDDPNQE-1T00
1921 MB/s -29%
4K Read
Media Samsung PM9A1a MZVL22T0HDLB
  (72.9 - 75.6, n=2)
74.2 MB/s +2%
Asus ROG Zephyrus G16 GU605MY
Samsung PM9A1a MZVL22T0HDLB
72.9 MB/s
Alienware x16 R2 P120F
WDC PC SN810 1TB
70.48 MB/s -3%
Media della classe Gaming
  (27.8 - 112.1, n=159, ultimi 2 anni)
65.1 MB/s -11%
Razer Blade 16 2024, RTX 4090
Samsung PM9A1 MZVL22T0HBLB
61.1 MB/s -16%
SCHENKER XMG Neo 16 (Early 24)
Samsung 990 Pro 1 TB
59.28 MB/s -19%
Lenovo Legion 9 16IRX9, RTX 4090
Micron 3400 2TB MTFDKBA2T0TFH
55.9 MB/s -23%
Asus ROG Zephyrus G16 2024 GU605M
WD PC SN560 SDDPNQE-1T00
42.2 MB/s -42%
4K Write
SCHENKER XMG Neo 16 (Early 24)
Samsung 990 Pro 1 TB
248.48 MB/s +38%
Alienware x16 R2 P120F
WDC PC SN810 1TB
213.62 MB/s +18%
Media della classe Gaming
  (108.8 - 512, n=159, ultimi 2 anni)
211 MB/s +17%
Media Samsung PM9A1a MZVL22T0HDLB
  (180.5 - 207, n=2)
193.9 MB/s +7%
Lenovo Legion 9 16IRX9, RTX 4090
Micron 3400 2TB MTFDKBA2T0TFH
188.6 MB/s +4%
Asus ROG Zephyrus G16 GU605MY
Samsung PM9A1a MZVL22T0HDLB
180.5 MB/s
Razer Blade 16 2024, RTX 4090
Samsung PM9A1 MZVL22T0HBLB
160.6 MB/s -11%
Asus ROG Zephyrus G16 2024 GU605M
WD PC SN560 SDDPNQE-1T00
157.9 MB/s -13%
4K-64 Read
SCHENKER XMG Neo 16 (Early 24)
Samsung 990 Pro 1 TB
2933.61 MB/s +269%
Alienware x16 R2 P120F
WDC PC SN810 1TB
2569.34 MB/s +224%
Lenovo Legion 9 16IRX9, RTX 4090
Micron 3400 2TB MTFDKBA2T0TFH
2439 MB/s +207%
Razer Blade 16 2024, RTX 4090
Samsung PM9A1 MZVL22T0HBLB
2350 MB/s +196%
Media della classe Gaming
  (451 - 3475, n=159, ultimi 2 anni)
1876 MB/s +136%
Media Samsung PM9A1a MZVL22T0HDLB
  (794 - 2637, n=2)
1715 MB/s +116%
Asus ROG Zephyrus G16 GU605MY
Samsung PM9A1a MZVL22T0HDLB
794 MB/s
Asus ROG Zephyrus G16 2024 GU605M
WD PC SN560 SDDPNQE-1T00
612 MB/s -23%
4K-64 Write
SCHENKER XMG Neo 16 (Early 24)
Samsung 990 Pro 1 TB
3252.43 MB/s +4%
Asus ROG Zephyrus G16 GU605MY
Samsung PM9A1a MZVL22T0HDLB
3136 MB/s
Media Samsung PM9A1a MZVL22T0HDLB
  (2867 - 3136, n=2)
3001 MB/s -4%
Alienware x16 R2 P120F
WDC PC SN810 1TB
2648.4 MB/s -16%
Media della classe Gaming
  (277 - 5909, n=159, ultimi 2 anni)
2533 MB/s -19%
Razer Blade 16 2024, RTX 4090
Samsung PM9A1 MZVL22T0HBLB
2226 MB/s -29%
Lenovo Legion 9 16IRX9, RTX 4090
Micron 3400 2TB MTFDKBA2T0TFH
2168 MB/s -31%
Asus ROG Zephyrus G16 2024 GU605M
WD PC SN560 SDDPNQE-1T00
1458 MB/s -54%
Access Time Read
Alienware x16 R2 P120F
WDC PC SN810 1TB
0.09 ms * -275%
Media della classe Gaming
  (0.016 - 0.379, n=158, ultimi 2 anni)
0.05509 ms * -130%
Media Samsung PM9A1a MZVL22T0HDLB
  (0.024 - 0.046, n=2)
0.035 ms * -46%
Lenovo Legion 9 16IRX9, RTX 4090
Micron 3400 2TB MTFDKBA2T0TFH
0.034 ms * -42%
Razer Blade 16 2024, RTX 4090
Samsung PM9A1 MZVL22T0HBLB
0.033 ms * -38%
Asus ROG Zephyrus G16 2024 GU605M
WD PC SN560 SDDPNQE-1T00
0.032 ms * -33%
Asus ROG Zephyrus G16 GU605MY
Samsung PM9A1a MZVL22T0HDLB
0.024 ms *
SCHENKER XMG Neo 16 (Early 24)
Samsung 990 Pro 1 TB
0.024 ms * -0%
Access Time Write
Alienware x16 R2 P120F
WDC PC SN810 1TB
0.055 ms * -139%
Media della classe Gaming
  (0.011 - 1.028, n=159, ultimi 2 anni)
0.04843 ms * -111%
Razer Blade 16 2024, RTX 4090
Samsung PM9A1 MZVL22T0HBLB
0.025 ms * -9%
Asus ROG Zephyrus G16 2024 GU605M
WD PC SN560 SDDPNQE-1T00
0.023 ms * -0%
Asus ROG Zephyrus G16 GU605MY
Samsung PM9A1a MZVL22T0HDLB
0.023 ms *
Lenovo Legion 9 16IRX9, RTX 4090
Micron 3400 2TB MTFDKBA2T0TFH
0.023 ms * -0%
Media Samsung PM9A1a MZVL22T0HDLB
  (0.022 - 0.023, n=2)
0.0225 ms * +2%
SCHENKER XMG Neo 16 (Early 24)
Samsung 990 Pro 1 TB
0.016 ms * +30%

* ... Meglio usare valori piccoli

Continuous Performance Read: DiskSpd Read Loop, Queue Depth 8

036072010801440180021602520288032403600396043204680504054005760612064806840Tooltip
Asus ROG Zephyrus G16 GU605MY; diskspd 2.0.17 f: Ø7094 (6297.96-7117.29)

Scheda grafica - GeForce RTX 4090 laptop

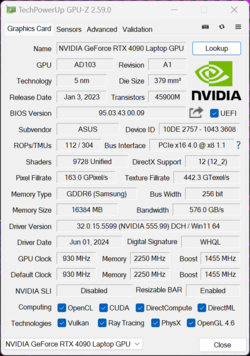
GPU-Z GeForce RTX 4090 laptop

Zephyrus G16 è disponibile con l'intera gamma degli attuali modelli di laptop GeForce RTX (4050-4090), tuttavia il design sottile si fa notare nelle varianti veloci. Nella modalità turbo, il GeForce Laptop RTX 4090 funziona solo con un TGP di 95 watt + 20 watt di boost dinamico, il che significa che è un po' lontano dalla configurazione massima di 175 watt (150 TGP + 25 watt di boost dinamico). Questo è un aspetto che i potenziali acquirenti dovrebbero conoscere per evitare delusioni successive. Nei benchmark della GPU, possiamo vedere chiaramente lo svantaggio rispetto ad altri modelli di laptop RTX 4090, che sono tra il 15 e il 26% più veloci. Anche il laptop Laptop RTX 4080 che si trova nel modello Alienware x16 R2 (175W) è un po' più veloce della RTX 4090 alloggiata nello Zephyrus G16.

Il vantaggio rispetto allo Zephyrus G16 con il laptop RTX 4070 si attesta al 50%, che ovviamente è ancora enorme, soprattutto se si considera il case compatto. Fondamentalmente, il laptop RTX 4070 (e anche le versioni più deboli) può raggiungere meglio il suo potenziale quando è abbinato allo Zephyrus G16. A seconda del caso d'uso, una quantità maggiore di memoria video (16 GB) può rappresentare un ulteriore vantaggio, ad esempio per l'editing di video.

Sotto carico sostenuto, le prestazioni della GPU rimangono stabili, tuttavia, in modalità batteria, la GPU può assorbire un massimo di 55 watt e questo è il motivo per cui le prestazioni della GPU si riducono in modo significativo (-52%). Altri benchmark della GPU sono disponibili qui.

3DMark Performance Rating - Percent
SCHENKER XMG Neo 16 (Early 24)
NVIDIA GeForce RTX 4090 Laptop GPU, Intel Core i9-14900HX
100 pt
Media NVIDIA GeForce RTX 4090 Laptop GPU
 
93.9 pt
Lenovo Legion 9 16IRX9, RTX 4090
NVIDIA GeForce RTX 4090 Laptop GPU, Intel Core i9-14900HX
92.1 pt
Razer Blade 16 2024, RTX 4090
NVIDIA GeForce RTX 4090 Laptop GPU, Intel Core i9-14900HX
90.4 pt
Alienware x16 R2 P120F
NVIDIA GeForce RTX 4080 Laptop GPU, Intel Core Ultra 9 185H
82 pt
Asus ROG Zephyrus G16 GU605MY
NVIDIA GeForce RTX 4090 Laptop GPU, Intel Core Ultra 9 185H
79.1 pt
Media della classe Gaming
 
60.5 pt
Asus ROG Zephyrus G16 2024 GU605M
NVIDIA GeForce RTX 4070 Laptop GPU, Intel Core Ultra 7 155H
52.7 pt
3DMark 11 - 1280x720 Performance GPU
SCHENKER XMG Neo 16 (Early 24)
NVIDIA GeForce RTX 4090 Laptop GPU, Intel Core i9-14900HX
69606 Points +29%
Razer Blade 16 2024, RTX 4090
NVIDIA GeForce RTX 4090 Laptop GPU, Intel Core i9-14900HX
65956 Points +22%
Media NVIDIA GeForce RTX 4090 Laptop GPU
  (54073 - 73027, n=42)
65041 Points +20%
Lenovo Legion 9 16IRX9, RTX 4090
NVIDIA GeForce RTX 4090 Laptop GPU, Intel Core i9-14900HX
64341 Points +19%
Alienware x16 R2 P120F
NVIDIA GeForce RTX 4080 Laptop GPU, Intel Core Ultra 9 185H
56772 Points +5%
Asus ROG Zephyrus G16 GU605MY
NVIDIA GeForce RTX 4090 Laptop GPU, Intel Core Ultra 9 185H
54073 Points
Media della classe Gaming
  (1029 - 72178, n=186, ultimi 2 anni)
43521 Points -20%
Asus ROG Zephyrus G16 2024 GU605M
NVIDIA GeForce RTX 4070 Laptop GPU, Intel Core Ultra 7 155H
37313 Points -31%
3DMark
1920x1080 Fire Strike Graphics
SCHENKER XMG Neo 16 (Early 24)
NVIDIA GeForce RTX 4090 Laptop GPU, Intel Core i9-14900HX
51946 Points +29%
Razer Blade 16 2024, RTX 4090
NVIDIA GeForce RTX 4090 Laptop GPU, Intel Core i9-14900HX
46527 Points +16%
Media NVIDIA GeForce RTX 4090 Laptop GPU
  (40259 - 53059, n=41)
46365 Points +15%
Lenovo Legion 9 16IRX9, RTX 4090
NVIDIA GeForce RTX 4090 Laptop GPU, Intel Core i9-14900HX
43518 Points +8%
Alienware x16 R2 P120F
NVIDIA GeForce RTX 4080 Laptop GPU, Intel Core Ultra 9 185H
42558 Points +6%
Asus ROG Zephyrus G16 GU605MY
NVIDIA GeForce RTX 4090 Laptop GPU, Intel Core Ultra 9 185H
40259 Points
Media della classe Gaming
  (781 - 53059, n=196, ultimi 2 anni)
31245 Points -22%
Asus ROG Zephyrus G16 2024 GU605M
NVIDIA GeForce RTX 4070 Laptop GPU, Intel Core Ultra 7 155H
26568 Points -34%
2560x1440 Time Spy Graphics
SCHENKER XMG Neo 16 (Early 24)
NVIDIA GeForce RTX 4090 Laptop GPU, Intel Core i9-14900HX
22134 Points +31%
Media NVIDIA GeForce RTX 4090 Laptop GPU
  (16950 - 23292, n=43)
20950 Points +24%
Lenovo Legion 9 16IRX9, RTX 4090
NVIDIA GeForce RTX 4090 Laptop GPU, Intel Core i9-14900HX
20416 Points +20%
Razer Blade 16 2024, RTX 4090
NVIDIA GeForce RTX 4090 Laptop GPU, Intel Core i9-14900HX
19878 Points +17%
Alienware x16 R2 P120F
NVIDIA GeForce RTX 4080 Laptop GPU, Intel Core Ultra 9 185H
18627 Points +10%
Asus ROG Zephyrus G16 GU605MY
NVIDIA GeForce RTX 4090 Laptop GPU, Intel Core Ultra 9 185H
16950 Points
Media della classe Gaming
  (224 - 22717, n=191, ultimi 2 anni)
13034 Points -23%
Asus ROG Zephyrus G16 2024 GU605M
NVIDIA GeForce RTX 4070 Laptop GPU, Intel Core Ultra 7 155H
10989 Points -35%
Geekbench 6.3 - GPU OpenCL
SCHENKER XMG Neo 16 (Early 24)
NVIDIA GeForce RTX 4090 Laptop GPU, Intel Core i9-14900HX
190820 Points +18%
Lenovo Legion 9 16IRX9, RTX 4090
NVIDIA GeForce RTX 4090 Laptop GPU, Intel Core i9-14900HX
190540 Points +18%
Media NVIDIA GeForce RTX 4090 Laptop GPU
  (159127 - 209521, n=20)
187721 Points +16%
Razer Blade 16 2024, RTX 4090
NVIDIA GeForce RTX 4090 Laptop GPU, Intel Core i9-14900HX
167047 Points +3%
Asus ROG Zephyrus G16 GU605MY
NVIDIA GeForce RTX 4090 Laptop GPU, Intel Core Ultra 9 185H
161798 Points
Alienware x16 R2 P120F
NVIDIA GeForce RTX 4080 Laptop GPU, Intel Core Ultra 9 185H
153327 Points -5%
Media della classe Gaming
  (4321 - 207373, n=109, ultimi 2 anni)
115663 Points -29%
Asus ROG Zephyrus G16 2024 GU605M
NVIDIA GeForce RTX 4070 Laptop GPU, Intel Core Ultra 7 155H
107953 Points -33%
3DMark 11 Performance
38012 punti
3DMark Fire Strike Score
30964 punti
3DMark Time Spy Score
15660 punti
3DMark Steel Nomad Score
3915 punti
Aiuto
Blender / v3.3 Classroom OPTIX/RTX
Asus ROG Zephyrus G16 2024 GU605M
NVIDIA GeForce RTX 4070 Laptop GPU, Intel Core Ultra 7 155H
22 Seconds * -69%
Media della classe Gaming
  (9 - 95, n=177, ultimi 2 anni)
21 Seconds * -62%
Alienware x16 R2 P120F
NVIDIA GeForce RTX 4080 Laptop GPU, Intel Core Ultra 9 185H
15 Seconds * -15%
Asus ROG Zephyrus G16 GU605MY
NVIDIA GeForce RTX 4090 Laptop GPU, Intel Core Ultra 9 185H
13 Seconds *
Lenovo Legion 9 16IRX9, RTX 4090
NVIDIA GeForce RTX 4090 Laptop GPU, Intel Core i9-14900HX
13 Seconds * -0%
SCHENKER XMG Neo 16 (Early 24)
NVIDIA GeForce RTX 4090 Laptop GPU, Intel Core i9-14900HX
13 Seconds * -0%
Media NVIDIA GeForce RTX 4090 Laptop GPU
  (9 - 19, n=39)
12.1 Seconds * +7%
Razer Blade 16 2024, RTX 4090
NVIDIA GeForce RTX 4090 Laptop GPU, Intel Core i9-14900HX
12 Seconds * +8%
Blender / v3.3 Classroom CUDA
Media della classe Gaming
  (16 - 175, n=183, ultimi 2 anni)
36.7 Seconds * -84%
Asus ROG Zephyrus G16 2024 GU605M
NVIDIA GeForce RTX 4070 Laptop GPU, Intel Core Ultra 7 155H
34 Seconds * -70%
Alienware x16 R2 P120F
NVIDIA GeForce RTX 4080 Laptop GPU, Intel Core Ultra 9 185H
22 Seconds * -10%
Asus ROG Zephyrus G16 GU605MY
NVIDIA GeForce RTX 4090 Laptop GPU, Intel Core Ultra 9 185H
20 Seconds *
Media NVIDIA GeForce RTX 4090 Laptop GPU
  (16 - 24, n=39)
18.3 Seconds * +8%
Razer Blade 16 2024, RTX 4090
NVIDIA GeForce RTX 4090 Laptop GPU, Intel Core i9-14900HX
18 Seconds * +10%
Lenovo Legion 9 16IRX9, RTX 4090
NVIDIA GeForce RTX 4090 Laptop GPU, Intel Core i9-14900HX
18 Seconds * +10%
SCHENKER XMG Neo 16 (Early 24)
NVIDIA GeForce RTX 4090 Laptop GPU, Intel Core i9-14900HX
17 Seconds * +15%
Blender / v3.3 Classroom CPU
Asus ROG Zephyrus G16 2024 GU605M
NVIDIA GeForce RTX 4070 Laptop GPU, Intel Core Ultra 7 155H
330 Seconds * -8%
Asus ROG Zephyrus G16 GU605MY
NVIDIA GeForce RTX 4090 Laptop GPU, Intel Core Ultra 9 185H
305 Seconds *
Alienware x16 R2 P120F
NVIDIA GeForce RTX 4080 Laptop GPU, Intel Core Ultra 9 185H
305 Seconds * -0%
Media della classe Gaming
  (138 - 962, n=191, ultimi 2 anni)
297 Seconds * +3%
Razer Blade 16 2024, RTX 4090
NVIDIA GeForce RTX 4090 Laptop GPU, Intel Core i9-14900HX
202 Seconds * +34%
Media NVIDIA GeForce RTX 4090 Laptop GPU
  (144 - 305, n=39)
199.1 Seconds * +35%
Lenovo Legion 9 16IRX9, RTX 4090
NVIDIA GeForce RTX 4090 Laptop GPU, Intel Core i9-14900HX
193 Seconds * +37%
SCHENKER XMG Neo 16 (Early 24)
NVIDIA GeForce RTX 4090 Laptop GPU, Intel Core i9-14900HX
167 Seconds * +45%

* ... Meglio usare valori piccoli

Prestazioni di gioco

L'immagine dipinta nei test della GPU continua anche nei benchmark di gioco, poiché il laptop RTX 4090 trovato nello Zephyrus G16 abbinato al Core Ultra 185H rimane notevolmente indietro rispetto alla concorrenza equipaggiata sia con le CPU HX che con il laptop RTX 4090. Il Alienware x16 R2 abbinato al Core Ultra 9 e al laptop RTX 4080 offre anche prestazioni di gioco leggermente migliori. Ancora una volta, lo Zephyrus G16 con il computer portatile RTX 4070 viene battuto nettamente, soprattutto nei test QHD.

Nel complesso, lo Zephyrus G16 con il laptop RTX 4090 e il veloce pannello OLED sono meravigliosamente adatti al gioco. Con la risoluzione QHD nativa, è possibile giocare senza problemi a tutti i titoli attuali con il massimo dei dettagli. Tuttavia, il nostro ciclo Cyberpunk 2077 mostra che le prestazioni di gioco quando si eseguono titoli impegnativi non sono del tutto stabili e che ci sono piccoli cali di prestazioni. Ulteriori benchmark di gioco sono disponibili qui.

Performance Rating - Percent
SCHENKER XMG Neo 16 (Early 24)
Intel Core i9-14900HX, NVIDIA GeForce RTX 4090 Laptop GPU
99.8 pt
Lenovo Legion 9 16IRX9, RTX 4090
Intel Core i9-14900HX, NVIDIA GeForce RTX 4090 Laptop GPU
88 pt
Razer Blade 16 2024, RTX 4090
Intel Core i9-14900HX, NVIDIA GeForce RTX 4090 Laptop GPU
85.8 pt
Alienware x16 R2 P120F -1!
Intel Core Ultra 9 185H, NVIDIA GeForce RTX 4080 Laptop GPU
69.8 pt
Asus ROG Zephyrus G16 GU605MY
Intel Core Ultra 9 185H, NVIDIA GeForce RTX 4090 Laptop GPU
68.7 pt
Media della classe Gaming
 
67.2 pt
Asus ROG Zephyrus G16 2024 GU605M
Intel Core Ultra 7 155H, NVIDIA GeForce RTX 4070 Laptop GPU
53.5 pt
GTA V - 1920x1080 Highest Settings possible AA:4xMSAA + FX AF:16x
SCHENKER XMG Neo 16 (Early 24)
Intel Core i9-14900HX, NVIDIA GeForce RTX 4090 Laptop GPU
159.3 (3.25min, 125P1) fps +49%
Razer Blade 16 2024, RTX 4090
Intel Core i9-14900HX, NVIDIA GeForce RTX 4090 Laptop GPU
138.1 (4.19min, 83.3P1) fps +29%
Lenovo Legion 9 16IRX9, RTX 4090
Intel Core i9-14900HX, NVIDIA GeForce RTX 4090 Laptop GPU
136.2 (0.938min, 111.1P1) fps +27%
Media della classe Gaming
  (12.1 - 167.7, n=171, ultimi 2 anni)
113 fps +6%
Asus ROG Zephyrus G16 GU605MY
Intel Core Ultra 9 185H, NVIDIA GeForce RTX 4090 Laptop GPU
107.1 (3.03min, 66.7P1) fps
Asus ROG Zephyrus G16 2024 GU605M
Intel Core Ultra 7 155H, NVIDIA GeForce RTX 4070 Laptop GPU
98.8 (3.78min, 58.8P1) fps -8%
Cyberpunk 2077 2.1 Phantom Liberty - 1920x1080 Ultra Preset (FSR off)
SCHENKER XMG Neo 16 (Early 24)
Intel Core i9-14900HX, NVIDIA GeForce RTX 4090 Laptop GPU
131.5 (62.2min) fps +41%
Lenovo Legion 9 16IRX9, RTX 4090
Intel Core i9-14900HX, NVIDIA GeForce RTX 4090 Laptop GPU
127 (70.6min) fps +36%
Alienware x16 R2 P120F
Intel Core Ultra 9 185H, NVIDIA GeForce RTX 4080 Laptop GPU
99.7 (13.5min) fps +7%
Razer Blade 16 2024, RTX 4090
Intel Core i9-14900HX, NVIDIA GeForce RTX 4090 Laptop GPU
95.35 (70.51min) fps +2%
Asus ROG Zephyrus G16 GU605MY
Intel Core Ultra 9 185H, NVIDIA GeForce RTX 4090 Laptop GPU
93.1 (64.5min) fps
Media della classe Gaming
  (6.76 - 144.7, n=79, ultimi 2 anni)
85.9 fps -8%
Asus ROG Zephyrus G16 2024 GU605M
Intel Core Ultra 7 155H, NVIDIA GeForce RTX 4070 Laptop GPU
69 fps -26%
Final Fantasy XV Benchmark - 1920x1080 High Quality
SCHENKER XMG Neo 16 (Early 24)
Intel Core i9-14900HX, NVIDIA GeForce RTX 4090 Laptop GPU
196.9 fps +43%
Lenovo Legion 9 16IRX9, RTX 4090
Intel Core i9-14900HX, NVIDIA GeForce RTX 4090 Laptop GPU
165.1 fps +20%
Alienware x16 R2 P120F
Intel Core Ultra 9 185H, NVIDIA GeForce RTX 4080 Laptop GPU
139.8 fps +1%
Asus ROG Zephyrus G16 GU605MY
Intel Core Ultra 9 185H, NVIDIA GeForce RTX 4090 Laptop GPU
138 fps
Razer Blade 16 2024, RTX 4090
Intel Core i9-14900HX, NVIDIA GeForce RTX 4090 Laptop GPU
137.5 fps 0%
Media della classe Gaming
  (19.2 - 201, n=184, ultimi 2 anni)
119 fps -14%
Asus ROG Zephyrus G16 2024 GU605M
Intel Core Ultra 7 155H, NVIDIA GeForce RTX 4070 Laptop GPU
100.8 fps -27%
Strange Brigade - 1920x1080 ultra AA:ultra AF:16
SCHENKER XMG Neo 16 (Early 24)
Intel Core i9-14900HX, NVIDIA GeForce RTX 4090 Laptop GPU
403 (101.2min, 295P1) fps +40%
Lenovo Legion 9 16IRX9, RTX 4090
Intel Core i9-14900HX, NVIDIA GeForce RTX 4090 Laptop GPU
369 (5min, 269P1) fps +28%
Razer Blade 16 2024, RTX 4090
Intel Core i9-14900HX, NVIDIA GeForce RTX 4090 Laptop GPU
359.8 (30.2min, 253P1) fps +25%
Alienware x16 R2 P120F
Intel Core Ultra 9 185H, NVIDIA GeForce RTX 4080 Laptop GPU
293 (38.3min, 184.1P1) fps +2%
Asus ROG Zephyrus G16 GU605MY
Intel Core Ultra 9 185H, NVIDIA GeForce RTX 4090 Laptop GPU
288 fps
Media della classe Gaming
  (38.9 - 421, n=182, ultimi 2 anni)
227 fps -21%
Asus ROG Zephyrus G16 2024 GU605M
Intel Core Ultra 7 155H, NVIDIA GeForce RTX 4070 Laptop GPU
129.3 (30.4min, 84.7P1) fps -55%
Dota 2 Reborn - 1920x1080 ultra (3/3) best looking
SCHENKER XMG Neo 16 (Early 24)
Intel Core i9-14900HX, NVIDIA GeForce RTX 4090 Laptop GPU
194.6 (165.7min) fps +40%
Razer Blade 16 2024, RTX 4090
Intel Core i9-14900HX, NVIDIA GeForce RTX 4090 Laptop GPU
188.1 (155.2min) fps +36%
Lenovo Legion 9 16IRX9, RTX 4090
Intel Core i9-14900HX, NVIDIA GeForce RTX 4090 Laptop GPU
164.5 (136min) fps +19%
Media della classe Gaming
  (30.8 - 220, n=190, ultimi 2 anni)
149.3 fps +8%
Asus ROG Zephyrus G16 GU605MY
Intel Core Ultra 9 185H, NVIDIA GeForce RTX 4090 Laptop GPU
138.7 (119.5min) fps
Alienware x16 R2 P120F
Intel Core Ultra 9 185H, NVIDIA GeForce RTX 4080 Laptop GPU
133 (114.6min) fps -4%
Asus ROG Zephyrus G16 2024 GU605M
Intel Core Ultra 7 155H, NVIDIA GeForce RTX 4070 Laptop GPU
131.6 (114.5min) fps -5%
X-Plane 11.11 - 1920x1080 high (fps_test=3)
Razer Blade 16 2024, RTX 4090
Intel Core i9-14900HX, NVIDIA GeForce RTX 4090 Laptop GPU
146.2 fps +62%
SCHENKER XMG Neo 16 (Early 24)
Intel Core i9-14900HX, NVIDIA GeForce RTX 4090 Laptop GPU
144.5 fps +61%
Lenovo Legion 9 16IRX9, RTX 4090
Intel Core i9-14900HX, NVIDIA GeForce RTX 4090 Laptop GPU
125.6 fps +40%
Media della classe Gaming
  (31.5 - 166.2, n=196, ultimi 2 anni)
107.2 fps +19%
Asus ROG Zephyrus G16 GU605MY
Intel Core Ultra 9 185H, NVIDIA GeForce RTX 4090 Laptop GPU
90 fps
Alienware x16 R2 P120F
Intel Core Ultra 9 185H, NVIDIA GeForce RTX 4080 Laptop GPU
89.3 fps -1%
Asus ROG Zephyrus G16 2024 GU605M
Intel Core Ultra 7 155H, NVIDIA GeForce RTX 4070 Laptop GPU
81.2 fps -10%
Cyberpunk 2077 2.1 Phantom Liberty
1920x1080 Ultra Preset (FSR off)
SCHENKER XMG Neo 16 (Early 24)
Intel Core i9-14900HX, NVIDIA GeForce RTX 4090 Laptop GPU
131.5 (62.2min) fps +41%
Lenovo Legion 9 16IRX9, RTX 4090
Intel Core i9-14900HX, NVIDIA GeForce RTX 4090 Laptop GPU
127 (70.6min) fps +36%
Media NVIDIA GeForce RTX 4090 Laptop GPU
  (93.1 - 144.7, n=19)
120.8 fps +30%
Alienware x16 R2 P120F
Intel Core Ultra 9 185H, NVIDIA GeForce RTX 4080 Laptop GPU
99.7 (13.5min) fps +7%
Razer Blade 16 2024, RTX 4090
Intel Core i9-14900HX, NVIDIA GeForce RTX 4090 Laptop GPU
95.35 (70.51min) fps +2%
Asus ROG Zephyrus G16 GU605MY
Intel Core Ultra 9 185H, NVIDIA GeForce RTX 4090 Laptop GPU
93.1 (64.5min) fps
Media della classe Gaming
  (6.76 - 144.7, n=79, ultimi 2 anni)
85.9 fps -8%
Asus ROG Zephyrus G16 2024 GU605M
Intel Core Ultra 7 155H, NVIDIA GeForce RTX 4070 Laptop GPU
69 fps -26%
2560x1440 Ultra Preset (FSR off)
SCHENKER XMG Neo 16 (Early 24)
Intel Core i9-14900HX, NVIDIA GeForce RTX 4090 Laptop GPU
93.8 (53.7min) fps +38%
Media NVIDIA GeForce RTX 4090 Laptop GPU
  (68.1 - 103.9, n=19)
89.9 fps +32%
Lenovo Legion 9 16IRX9, RTX 4090
Intel Core i9-14900HX, NVIDIA GeForce RTX 4090 Laptop GPU
86 (70.4min) fps +26%
Razer Blade 16 2024, RTX 4090
Intel Core i9-14900HX, NVIDIA GeForce RTX 4090 Laptop GPU
83.39 (67.14min) fps +22%
Alienware x16 R2 P120F
Intel Core Ultra 9 185H, NVIDIA GeForce RTX 4080 Laptop GPU
75.4 (25.4min) fps +11%
Asus ROG Zephyrus G16 GU605MY
Intel Core Ultra 9 185H, NVIDIA GeForce RTX 4090 Laptop GPU
68.1 (55.3min) fps
Media della classe Gaming
  (24.8 - 110, n=69, ultimi 2 anni)
64.9 fps -5%
Asus ROG Zephyrus G16 2024 GU605M
Intel Core Ultra 7 155H, NVIDIA GeForce RTX 4070 Laptop GPU
43.7 fps -36%
F1 23
1920x1080 Ultra High Preset AA:T AF:16x
Lenovo Legion 9 16IRX9, RTX 4090
Intel Core i9-14900HX, NVIDIA GeForce RTX 4090 Laptop GPU
149.2 (10min, 97P1) fps +73%
Media NVIDIA GeForce RTX 4090 Laptop GPU
  (86.2 - 149.2, n=9)
120.4 fps +40%
Razer Blade 16 2024, RTX 4090
Intel Core i9-14900HX, NVIDIA GeForce RTX 4090 Laptop GPU
113.2 (94min, 78P1) fps +31%
Asus ROG Zephyrus G16 GU605MY
Intel Core Ultra 9 185H, NVIDIA GeForce RTX 4090 Laptop GPU
86.2 (59min, 67P1) fps
Media della classe Gaming
  (12.9 - 149.2, n=40, ultimi 2 anni)
70.8 fps -18%
Asus ROG Zephyrus G16 2024 GU605M
Intel Core Ultra 7 155H, NVIDIA GeForce RTX 4070 Laptop GPU
55.8 (45min, 43P1) fps -35%
2560x1440 Ultra High Preset AA:T AF:16x
Lenovo Legion 9 16IRX9, RTX 4090
Intel Core i9-14900HX, NVIDIA GeForce RTX 4090 Laptop GPU
144.6 (2min, 80P1) fps +149%
Media NVIDIA GeForce RTX 4090 Laptop GPU
  (58 - 144.6, n=9)
83.7 fps +44%
Razer Blade 16 2024, RTX 4090
Intel Core i9-14900HX, NVIDIA GeForce RTX 4090 Laptop GPU
72.4 (58min, 56P1) fps +25%
Asus ROG Zephyrus G16 GU605MY
Intel Core Ultra 9 185H, NVIDIA GeForce RTX 4090 Laptop GPU
58 (36min, 46P1) fps
Media della classe Gaming
  (17 - 144.6, n=31, ultimi 2 anni)
50.5 fps -13%
Asus ROG Zephyrus G16 2024 GU605M
Intel Core Ultra 7 155H, NVIDIA GeForce RTX 4070 Laptop GPU
36 (22min, 28P1) fps -38%
F1 24
1920x1080 Ultra High Preset AA:T AF:16x
SCHENKER XMG Neo 16 (Early 24)
Intel Core i9-14900HX, NVIDIA GeForce RTX 4090 Laptop GPU
127 (78min, 90P1) fps +44%
Lenovo Legion 9 16IRX9, RTX 4090
Intel Core i9-14900HX, NVIDIA GeForce RTX 4090 Laptop GPU
113.6 (14min, 69P1) fps +29%
Media NVIDIA GeForce RTX 4090 Laptop GPU
  (88 - 127, n=4)
112.2 fps +28%
Asus ROG Zephyrus G16 GU605MY
Intel Core Ultra 9 185H, NVIDIA GeForce RTX 4090 Laptop GPU
88 (55min, 58P1) fps
Media della classe Gaming
  (54.1 - 127, n=14, ultimi 2 anni)
78.2 fps -11%
2560x1440 Ultra High Preset AA:T AF:16x
SCHENKER XMG Neo 16 (Early 24)
Intel Core i9-14900HX, NVIDIA GeForce RTX 4090 Laptop GPU
84.7 (69min, 68P1) fps +45%
Media NVIDIA GeForce RTX 4090 Laptop GPU
  (58.5 - 84.7, n=4)
73.6 fps +26%
Lenovo Legion 9 16IRX9, RTX 4090
Intel Core i9-14900HX, NVIDIA GeForce RTX 4090 Laptop GPU
72.1 (2min, 56P1) fps +23%
Asus ROG Zephyrus G16 GU605MY
Intel Core Ultra 9 185H, NVIDIA GeForce RTX 4090 Laptop GPU
58.5 (49min, 47P1) fps
Media della classe Gaming
  (36.7 - 84.7, n=11, ultimi 2 anni)
54.6 fps -7%
Baldur's Gate 3
1920x1080 Ultra Preset
Media NVIDIA GeForce RTX 4090 Laptop GPU
  (118 - 208, n=7)
177.5 fps +50%
Alienware x16 R2 P120F
Intel Core Ultra 9 185H, NVIDIA GeForce RTX 4080 Laptop GPU
159.4 fps +35%
Asus ROG Zephyrus G16 GU605MY
Intel Core Ultra 9 185H, NVIDIA GeForce RTX 4090 Laptop GPU
118 fps
Media della classe Gaming
  (21.2 - 208, n=44, ultimi 2 anni)
102.1 fps -13%
2560x1440 Ultra Preset
Media NVIDIA GeForce RTX 4090 Laptop GPU
  (99 - 155.2, n=7)
133.2 fps +35%
Alienware x16 R2 P120F
Intel Core Ultra 9 185H, NVIDIA GeForce RTX 4080 Laptop GPU
124.3 fps +26%
Asus ROG Zephyrus G16 GU605MY
Intel Core Ultra 9 185H, NVIDIA GeForce RTX 4090 Laptop GPU
99 fps
Media della classe Gaming
  (44 - 155.2, n=34, ultimi 2 anni)
82.2 fps -17%
Horizon Forbidden West
1920x1080 Very High Preset AA:T
SCHENKER XMG Neo 16 (Early 24)
Intel Core i9-14900HX, NVIDIA GeForce RTX 4090 Laptop GPU
125.2 (73.2min, 82.8P0.1, 91.6P1) fps +55%
Media NVIDIA GeForce RTX 4090 Laptop GPU
  (81 - 125.2, n=3)
100 fps +23%
Asus ROG Zephyrus G16 GU605MY
Intel Core Ultra 9 185H, NVIDIA GeForce RTX 4090 Laptop GPU
81 fps
Media della classe Gaming
  (14.7 - 125.2, n=10, ultimi 2 anni)
66.7 fps -18%
2560x1440 Very High Preset AA:T
SCHENKER XMG Neo 16 (Early 24)
Intel Core i9-14900HX, NVIDIA GeForce RTX 4090 Laptop GPU
98 (65.7min, 67.6P0.1, 76.8P1) fps +48%
Media NVIDIA GeForce RTX 4090 Laptop GPU
  (66 - 98, n=3)
79.7 fps +21%
Asus ROG Zephyrus G16 GU605MY
Intel Core Ultra 9 185H, NVIDIA GeForce RTX 4090 Laptop GPU
66 fps
Media della classe Gaming
  (24.1 - 98, n=9, ultimi 2 anni)
57.1 fps -13%
Call of Duty Modern Warfare 3 2023
1920x1080 Extreme Preset
Razer Blade 16 2024, RTX 4090
Intel Core i9-14900HX, NVIDIA GeForce RTX 4090 Laptop GPU
179 fps +21%
Media NVIDIA GeForce RTX 4090 Laptop GPU
  (148 - 205, n=7)
175.1 fps +18%
Asus ROG Zephyrus G16 GU605MY
Intel Core Ultra 9 185H, NVIDIA GeForce RTX 4090 Laptop GPU
148 fps
Media della classe Gaming
  (27 - 205, n=18, ultimi 2 anni)
112.5 fps -24%
Asus ROG Zephyrus G16 2024 GU605M
Intel Core Ultra 7 155H, NVIDIA GeForce RTX 4070 Laptop GPU
94 fps -36%
2560x1440 Extreme Preset
Media NVIDIA GeForce RTX 4090 Laptop GPU
  (113 - 162, n=7)
138.6 fps +23%
Razer Blade 16 2024, RTX 4090
Intel Core i9-14900HX, NVIDIA GeForce RTX 4090 Laptop GPU
138 fps +22%
Asus ROG Zephyrus G16 GU605MY
Intel Core Ultra 9 185H, NVIDIA GeForce RTX 4090 Laptop GPU
113 fps
Media della classe Gaming
  (48 - 162, n=15, ultimi 2 anni)
95.9 fps -15%
Asus ROG Zephyrus G16 2024 GU605M
Intel Core Ultra 7 155H, NVIDIA GeForce RTX 4070 Laptop GPU
64 fps -43%

Cyberpunk 2077 ultra FPS diagram

05101520253035404550556065707580Tooltip
Asus ROG Zephyrus G16 GU605MY Ultra 9 185H, NVIDIA GeForce RTX 4090 Laptop GPU: Ø70.9 (62.3-84.9)
bassomedioaltoultraQHD DLSSQHD4K DLSS4K
GTA V (2015) 172.6 107.1 103.4 139.9
Dota 2 Reborn (2015) 172.2 150.8 150.3 138.7 135.8
Final Fantasy XV Benchmark (2018) 183.5 168.4 138 113.3 68.9
X-Plane 11.11 (2018) 138.3 111.7 90 75.7
Far Cry 5 (2018) 138 128 117 115 80
Strange Brigade (2018) 431 340 314 288 225 120
Star Wars Jedi Survivor (2023) 173 166 154 148 114 59
F1 23 (2023) 215 217 211 86.2 58 50.1 30.2
Baldur's Gate 3 (2023) 144 126 123 118 99 57
Cyberpunk 2077 2.1 Phantom Liberty (2023) 119.8 106.6 109.6 93.1 68.1 32.9
Call of Duty Modern Warfare 3 2023 (2023) 204 189 155 148 113 73
Horizon Forbidden West (2024) 117 110 89 81 66 42.5
F1 24 (2024) 230 232 216 88 58.5 49.8 30.3
Black Myth: Wukong (2024) 67 40 44 39

Emissioni - la camera a vapore è spesso più rumorosa

Emissioni di rumore

Il volume della ventola dipende in gran parte dal profilo energetico selezionato. Nell'uso in idle e sotto carico ridotto, Zephyrus G16 rimane molto silenzioso, anche nei profili più veloci. Quando si gioca e si utilizzano entrambi i profili Quiet e Performance, il raffreddamento della camera di vapore diventa un po' più rumoroso rispetto al modello RTX 4070 e, senza cuffie, è possibile giocare correttamente solo con il profilo Quiet . Nella modalità turbo, questo raggiunge 52,3 dB(A), che rappresenta il volume massimo della ventola della variante RTX 4070. Tuttavia, la concorrenza diventa leggermente più rumorosa, con l'unica eccezione del Blade 16 - anche se non si possono definire 50 dB(A) silenziosi. Il nostro dispositivo di recensione non ha emesso altri rumori elettronici. Secondo Asus, il problema che abbiamo riscontrato con la terza ventola nella nostra recensione della variante RTX 4070 dovrebbe essere stato risolto tramite un aggiornamento del BIOS.

ROG Zephyrus G16 RTX 4070 Laptop
Profilo energetico 3DMark 06 Cyberpunk 2077 stress test
Silenziosità 30,9 dB(A) 41,4 dB(A) 41,4 dB(A)
Prestazioni 36,1 dB(A) 48,1 dB(A) 48,1 dB(A)
Turbo 49,2 dB(A) 52,3 dB(A) 52,3 dB(A)
ROG Zephyrus G16 RTX 4070 Laptop
Profilo energetico 3DMark 06 Cyberpunk 2077 stress test
Silenziosità 30,4 dB(A) 41,5 dB(A) 41,5 dB(A)
Prestazioni 34,2 dB(A) 46,4 dB(A) 46,4 dB(A)
Turbo 41,5 dB(A) 52,4 dB(A) 52,4 dB(A)

Rumorosità

Idle
24.6 / 27.8 / 31.9 dB(A)
Sotto carico
49.2 / 52.3 dB(A)
  red to green bar
 
 
30 dB
silenzioso
40 dB(A)
udibile
50 dB(A)
rumoroso
 
min: dark, med: mid, max: light   Earthworks M23R, Arta (15 cm di distanza)   Rumorosità ambientale: 24.6 dB(A)
dB(A) 0102030405060708090Deep BassMiddle BassHigh BassLower RangeMidsHigher MidsLower HighsMid HighsUpper HighsSuper Highs2044.441.143.540.840.240.62538.538.432.435.430.637.3313434.627.129.128.332.74031.532.528.231.130.6315026.730.62425.724.8296327.62824.225.527.528.68027.228.621.421.824.9271002627.421.323.322.226.612528.22720.521.421.428.116026.929.219.420.920.128.12003331.321.421.719.131.725029.831.821.621.121.732.831530.333.118.719.515.632.140031.833.818.320.314.13350032.335.517.421.21234.663030.934.216.218.61233.480034.437.416.420.311.336.4100037.141.516.921.71139125038.342.417.723.610.940.9160039.342.116.424.2114220004043.915.520.711.142.7250038.643.914.819.811.441.8315035.540.213.616.211.939.4400032.338.113.414.512.236.2500031.837.1141412.535.5630031.738.513.913.712.536.5800026.535.213.413.412.732.61000021.729.913.213.212.927.11250019.427.313.213.512.624.6160001521.812.512.511.718.8SPL4852.327.831.924.651N5.8811.40.67.3median 31.8median 35.2median 16.4median 20.3median 12.5median 33.4Delta4.55.22.62.82.65hearing rangehide median Fan NoiseAsus ROG Zephyrus G16 GU605MY
Asus ROG Zephyrus G16 GU605MY
NVIDIA GeForce RTX 4090 Laptop GPU, Ultra 9 185H, Samsung PM9A1a MZVL22T0HDLB
SCHENKER XMG Neo 16 (Early 24)
NVIDIA GeForce RTX 4090 Laptop GPU, i9-14900HX, Samsung 990 Pro 1 TB
Lenovo Legion 9 16IRX9, RTX 4090
NVIDIA GeForce RTX 4090 Laptop GPU, i9-14900HX, Micron 3400 2TB MTFDKBA2T0TFH
Alienware x16 R2 P120F
NVIDIA GeForce RTX 4080 Laptop GPU, Ultra 9 185H, WDC PC SN810 1TB
Razer Blade 16 2024, RTX 4090
NVIDIA GeForce RTX 4090 Laptop GPU, i9-14900HX, Samsung PM9A1 MZVL22T0HBLB
Asus ROG Zephyrus G16 2024 GU605M
NVIDIA GeForce RTX 4070 Laptop GPU, Ultra 7 155H, WD PC SN560 SDDPNQE-1T00
Noise
-5%
12%
9%
10%
9%
off /ambiente *
24.6
26
-6%
23
7%
23.4
5%
23
7%
23.9
3%
Idle Minimum *
24.6
28
-14%
23
7%
23.8
3%
23
7%
23.9
3%
Idle Average *
27.8
29
-4%
23
17%
28.5
-3%
23
17%
27.8
-0%
Idle Maximum *
31.9
31
3%
23
28%
28.5
11%
27.66
13%
30.1
6%
Load Average *
49.2
51
-4%
39
21%
28.8
41%
43.76
11%
34.2
30%
Cyberpunk 2077 ultra *
52.3
Load Maximum *
52.3
56
-7%
55.56
-6%
54.2
-4%
50.37
4%
46.4
11%
Witcher 3 ultra *
54
55.32
49.5
46.81
46.4

* ... Meglio usare valori piccoli

Temperatura

Nell'uso idele e nell'esecuzione di compiti semplici, le superfici metalliche del case rimangono molto fresche e si può appoggiare il dispositivo sulle ginocchia senza alcuna esitazione. Durante i giochi e lo stress test, abbiamo misurato temperature dell'unità base fino a 47 °C al centro dell'area posteriore. Non è un motivo di preoccupazione, ma non dovrebbe utilizzare il dispositivo sulle ginocchia in questi scenari. Sul lato superiore dell'unità base, l'area centrale sopra la tastiera è soggetta a riscaldamento, ma la tastiera stessa rimane significativamente più fresca, con temperature massime di 40 °C al centro e circa 36 °C su entrambi i lati. Ciò significa che la digitazione avviene senza problemi e che anche il gioco è un'esperienza illimitata.

Carico massimo
 43.1 °C45.9 °C44.5 °C 
 34.9 °C39.9 °C36.9 °C 
 30.8 °C29.2 °C30.5 °C 
Massima: 45.9 °C
Media: 37.3 °C
47.5 °C46.1 °C47.2 °C
32.8 °C44.5 °C39.5 °C
30.4 °C32.1 °C31.2 °C
Massima: 47.5 °C
Media: 39 °C
Alimentazione (max)  45.9 °C | Temperatura della stanza 21.8 °C | Fluke t3000FC (calibrated), Voltcraft IR-900
(±) La temperatura media del lato superiore sotto carico massimo e' di 37.3 °C / 99 F, rispetto alla media di 33.9 °C / 93 F per i dispositivi di questa classe Gaming.
(-) La temperatura massima sul lato superiore è di 45.9 °C / 115 F, rispetto alla media di 40.5 °C / 105 F, che varia da 21.2 a 68.8 °C per questa classe Gaming.
(-) Il lato inferiore si riscalda fino ad un massimo di 47.5 °C / 118 F, rispetto alla media di 43.2 °C / 110 F
(+) In idle, la temperatura media del lato superiore è di 25.3 °C / 78 F, rispetto alla media deld ispositivo di 33.9 °C / 93 F.
(±) 3: The average temperature for the upper side is 36.7 °C / 98 F, compared to the average of 33.9 °C / 93 F for the class Gaming.
(+) I poggiapolsi e il touchpad sono piu' freddi della temperatura della pelle con un massimo di 30.8 °C / 87.4 F e sono quindi freddi al tatto.
(±) La temperatura media della zona del palmo della mano di dispositivi simili e'stata di 28.9 °C / 84 F (-1.9 °C / -3.4 F).
Temperature superficiali della prova di stress (in alto)
Temperature superficiali della prova di stress (in basso)
Asus ROG Zephyrus G16 GU605MY
Intel Core Ultra 9 185H, NVIDIA GeForce RTX 4090 Laptop GPU
SCHENKER XMG Neo 16 (Early 24)
Intel Core i9-14900HX, NVIDIA GeForce RTX 4090 Laptop GPU
Lenovo Legion 9 16IRX9, RTX 4090
Intel Core i9-14900HX, NVIDIA GeForce RTX 4090 Laptop GPU
Alienware x16 R2 P120F
Intel Core Ultra 9 185H, NVIDIA GeForce RTX 4080 Laptop GPU
Razer Blade 16 2024, RTX 4090
Intel Core i9-14900HX, NVIDIA GeForce RTX 4090 Laptop GPU
Asus ROG Zephyrus G16 2024 GU605M
Intel Core Ultra 7 155H, NVIDIA GeForce RTX 4070 Laptop GPU
Heat
-6%
-32%
-23%
-4%
-8%
Maximum Upper Side *
45.9
47
-2%
56
-22%
51
-11%
45
2%
50.3
-10%
Maximum Bottom *
47.5
56
-18%
53
-12%
50.8
-7%
45
5%
48
-1%
Idle Upper Side *
26.1
27
-3%
38
-46%
36.6
-40%
29
-11%
28.8
-10%
Idle Bottom *
26.6
27
-2%
39
-47%
35.2
-32%
30
-13%
29.8
-12%

* ... Meglio usare valori piccoli

Test da sforzo

Nel test di stress con carico combinato CPU/GPU, il modello di punta Zephyrus non è stato in grado di fornire prestazioni costanti. Il consumo energetico della CPU oscillava periodicamente tra 40-80 watt e, dopo un'ora, si è attestato su una media di 53 watt. La scheda grafica non è soggetta a fluttuazioni così ampie, ma funziona comunque 'solo' a circa 58 watt. Secondo Asus, in questo scenario, questi valori dovrebbero essere di 35 watt per il processore e 95 watt per la scheda grafica, tuttavia non siamo riusciti a riprodurre questi valori.

Dati del test di stress CPU/GPU

Altoparlanti

dB(A) 0102030405060708090Deep BassMiddle BassHigh BassLower RangeMidsHigher MidsLower HighsMid HighsUpper HighsSuper Highs2040.246.32530.637.43128.3364030.637.25024.839.26327.543.98024.951.810022.263.112521.468.116020.165.820019.17125021.772.731515.673.140014.173.95001272.86301274.980011.37610001172.4125010.97316001169.7200011.168250011.469315011.968400012.270.6500012.568.5630012.564.8800012.769.51000012.966.61250012.663.31600011.761.6SPL24.683N0.663.4median 12.5median 69.5Delta2.6338.136.532.836.844.146.527.830.520.533.626.43217.438.721.549.818.447.619.255.422.260.819.163.217.561.71664.515.570.913.475.21275.113.275.612.875.91475.613.373.212.873.113.174.713.273.21377.813.574.913.972.714.465.31360.612.555.525.986.40.871.1median 13.5median 72.727.132.124.832.128.423.428.429.728.229.725.716.525.729.222.129.232.123.832.135.412.335.441.319.741.344.314.944.350.61150.654.616.554.655.414.755.46412.46466.110.966.165.89.265.8667.86670.78.770.768.88.668.867.8967.867.59.867.571.210.171.266.31166.366.811.266.861.111.761.161.511.861.563.21263.264.212.164.264.812.164.864.812.564.865.711.165.779237945.80.445.8median 64.8median 11.2median 64.84.81.94.837.831.737.838.824.638.841.621.341.641.718.741.744.720.444.745.119.245.152.820.152.859.717.359.764.414.164.472.614.472.676.213.876.281.514.581.582.414.182.480.813.680.879.911.779.981.411.481.476.71276.773.51173.577.310.577.37811.17880.511.880.58011.88079.511.379.573.711.473.774.311.774.373.912.173.971137173.212.873.269.311.969.369.611.469.689.923.989.993.70.593.7median 76.7median 11.9median 76.73.81.33.83032.83030.931.430.935.742.935.723.728.123.726.219.726.231.216.431.245.113.845.145.919.845.951.414.551.45913.95964.117.864.168.614.368.667.19.667.167.68.567.672.97.572.977.47.477.4717.77164.88.164.865.88.265.867.58.867.568.89.868.868.710.568.77010.67066.410.966.467.311.267.36411.56464.711.664.767126763.211.863.25510.75581.222.581.254.70.454.7median 67median 10.7median 673.62.53.6hearing rangehide median Pink NoiseAsus ROG Zephyrus G16 GU605MYSCHENKER XMG Neo 16 (Early 24)Lenovo Legion 9 16IRX9, RTX 4090Alienware x16 R2 P120FRazer Blade 16 2024, RTX 4090
Diagramma frequenza (le caselle possono essere selezionate/deselezionate per confrontare i dispositivi)
Asus ROG Zephyrus G16 GU605MY analisi audio

(+) | gli altoparlanti sono relativamente potenti (83 dB)
Bassi 100 - 315 Hz
(+) | bassi buoni - solo 3.3% dalla media
(±) | la linearità dei bassi è media (7.6% delta rispetto alla precedente frequenza)
Medi 400 - 2000 Hz
(+) | medi bilanciati - solo only 3.4% rispetto alla media
(+) | medi lineari (3.1% delta rispetto alla precedente frequenza)
Alti 2 - 16 kHz
(+) | Alti bilanciati - appena 1.7% dalla media
(+) | alti lineari (4.6% delta rispetto alla precedente frequenza)
Nel complesso 100 - 16.000 Hz
(+) | suono nel complesso lineare (6.5% differenza dalla media)
Rispetto alla stessa classe
» 0% di tutti i dispositivi testati in questa classe è stato migliore, 0% simile, 100% peggiore
» Il migliore ha avuto un delta di 6%, medio di 18%, peggiore di 132%
Rispetto a tutti i dispositivi testati
» 1% di tutti i dispositivi testati in questa classe è stato migliore, 0% similare, 99% peggiore
» Il migliore ha avuto un delta di 4%, medio di 25%, peggiore di 134%

SCHENKER XMG Neo 16 (Early 24) analisi audio

(+) | gli altoparlanti sono relativamente potenti (86 dB)
Bassi 100 - 315 Hz
(-) | quasi nessun basso - in media 16.3% inferiori alla media
(±) | la linearità dei bassi è media (8.6% delta rispetto alla precedente frequenza)
Medi 400 - 2000 Hz
(+) | medi bilanciati - solo only 3% rispetto alla media
(+) | medi lineari (3.6% delta rispetto alla precedente frequenza)
Alti 2 - 16 kHz
(+) | Alti bilanciati - appena 2.5% dalla media
(+) | alti lineari (4.9% delta rispetto alla precedente frequenza)
Nel complesso 100 - 16.000 Hz
(+) | suono nel complesso lineare (12.4% differenza dalla media)
Rispetto alla stessa classe
» 14% di tutti i dispositivi testati in questa classe è stato migliore, 3% simile, 83% peggiore
» Il migliore ha avuto un delta di 6%, medio di 18%, peggiore di 132%
Rispetto a tutti i dispositivi testati
» 9% di tutti i dispositivi testati in questa classe è stato migliore, 2% similare, 89% peggiore
» Il migliore ha avuto un delta di 4%, medio di 25%, peggiore di 134%

Lenovo Legion 9 16IRX9, RTX 4090 analisi audio

(±) | potenza degli altiparlanti media ma buona (78.96 dB)
Bassi 100 - 315 Hz
(±) | bassi ridotti - in media 13.2% inferiori alla media
(±) | la linearità dei bassi è media (8.9% delta rispetto alla precedente frequenza)
Medi 400 - 2000 Hz
(+) | medi bilanciati - solo only 3.2% rispetto alla media
(+) | medi lineari (3.4% delta rispetto alla precedente frequenza)
Alti 2 - 16 kHz
(+) | Alti bilanciati - appena 1.8% dalla media
(+) | alti lineari (4% delta rispetto alla precedente frequenza)
Nel complesso 100 - 16.000 Hz
(+) | suono nel complesso lineare (11.3% differenza dalla media)
Rispetto alla stessa classe
» 8% di tutti i dispositivi testati in questa classe è stato migliore, 3% simile, 89% peggiore
» Il migliore ha avuto un delta di 6%, medio di 18%, peggiore di 132%
Rispetto a tutti i dispositivi testati
» 6% di tutti i dispositivi testati in questa classe è stato migliore, 2% similare, 92% peggiore
» Il migliore ha avuto un delta di 4%, medio di 25%, peggiore di 134%

Alienware x16 R2 P120F analisi audio

(+) | gli altoparlanti sono relativamente potenti (89.9 dB)
Bassi 100 - 315 Hz
(±) | bassi ridotti - in media 7.4% inferiori alla media
(±) | la linearità dei bassi è media (7.6% delta rispetto alla precedente frequenza)
Medi 400 - 2000 Hz
(+) | medi bilanciati - solo only 2.6% rispetto alla media
(+) | medi lineari (3.6% delta rispetto alla precedente frequenza)
Alti 2 - 16 kHz
(+) | Alti bilanciati - appena 3.4% dalla media
(+) | alti lineari (2.8% delta rispetto alla precedente frequenza)
Nel complesso 100 - 16.000 Hz
(+) | suono nel complesso lineare (8.2% differenza dalla media)
Rispetto alla stessa classe
» 1% di tutti i dispositivi testati in questa classe è stato migliore, 1% simile, 98% peggiore
» Il migliore ha avuto un delta di 6%, medio di 18%, peggiore di 132%
Rispetto a tutti i dispositivi testati
» 1% di tutti i dispositivi testati in questa classe è stato migliore, 1% similare, 98% peggiore
» Il migliore ha avuto un delta di 4%, medio di 25%, peggiore di 134%

Razer Blade 16 2024, RTX 4090 analisi audio

(±) | potenza degli altiparlanti media ma buona (81.16 dB)
Bassi 100 - 315 Hz
(±) | bassi ridotti - in media 8.2% inferiori alla media
(±) | la linearità dei bassi è media (7.4% delta rispetto alla precedente frequenza)
Medi 400 - 2000 Hz
(+) | medi bilanciati - solo only 3.3% rispetto alla media
(+) | medi lineari (5.9% delta rispetto alla precedente frequenza)
Alti 2 - 16 kHz
(+) | Alti bilanciati - appena 1.6% dalla media
(+) | alti lineari (3.1% delta rispetto alla precedente frequenza)
Nel complesso 100 - 16.000 Hz
(+) | suono nel complesso lineare (9.2% differenza dalla media)
Rispetto alla stessa classe
» 3% di tutti i dispositivi testati in questa classe è stato migliore, 1% simile, 96% peggiore
» Il migliore ha avuto un delta di 6%, medio di 18%, peggiore di 132%
Rispetto a tutti i dispositivi testati
» 3% di tutti i dispositivi testati in questa classe è stato migliore, 1% similare, 97% peggiore
» Il migliore ha avuto un delta di 4%, medio di 25%, peggiore di 134%

Gestione dell'energia - Più resistenza della concorrenza

Consumo di energia

In modalità idle, i valori di consumo rappresentano la variante più debole di ROG Zephyrus G16 e questo non sorprende se si considerano gli identici pannelli OLED. Durante il gioco, con circa 170 watt, Zephyrus G16 è notevolmente più efficiente della concorrenza RTX 4090, che consuma almeno 230 watt durante il gioco. Nello stress test, abbiamo osservato brevemente un consumo massimo di 232 watt, che poi si è stabilizzato rapidamente a circa 160 watt. Ciò significa che l'alimentatore da 240 watt in dotazione è adeguatamente dimensionato.

Consumo di corrente
Off / Standbydarklight 0.43 / 1.7 Watt
Idledarkmidlight 7.8 / 10.9 / 11.6 Watt
Sotto carico midlight 98.7 / 232 Watt
 color bar
Leggenda: min: dark, med: mid, max: light        Metrahit Energy
Asus ROG Zephyrus G16 GU605MY
Ultra 9 185H, NVIDIA GeForce RTX 4090 Laptop GPU, Samsung PM9A1a MZVL22T0HDLB, OLED, 2560x1600, 16"
SCHENKER XMG Neo 16 (Early 24)
i9-14900HX, NVIDIA GeForce RTX 4090 Laptop GPU, Samsung 990 Pro 1 TB, IPS, 2560x1600, 16"
Lenovo Legion 9 16IRX9, RTX 4090
i9-14900HX, NVIDIA GeForce RTX 4090 Laptop GPU, Micron 3400 2TB MTFDKBA2T0TFH, MiniLED, 3200x2000, 16"
Alienware x16 R2 P120F
Ultra 9 185H, NVIDIA GeForce RTX 4080 Laptop GPU, WDC PC SN810 1TB, IPS, 2560x1600, 16"
Razer Blade 16 2024, RTX 4090
i9-14900HX, NVIDIA GeForce RTX 4090 Laptop GPU, Samsung PM9A1 MZVL22T0HBLB, OLED, 2560x1600, 16"
Asus ROG Zephyrus G16 2024 GU605M
Ultra 7 155H, NVIDIA GeForce RTX 4070 Laptop GPU, WD PC SN560 SDDPNQE-1T00, OLED, 2560x1600, 16"
Media NVIDIA GeForce RTX 4090 Laptop GPU
 
Media della classe Gaming
 
Power Consumption
-51%
-108%
-57%
-64%
5%
-102%
-58%
Idle Minimum *
7.8
6
23%
20.5
-163%
9.9
-27%
16.9
-117%
8.3
-6%
16.9 ?(6 - 33.8, n=29)
-117%
Idle Average *
10.9
16
-47%
27.7
-154%
14.5
-33%
17.8
-63%
12.5
-15%
Idle Maximum *
11.6
28
-141%
32.1
-177%
33.5
-189%
19.6
-69%
12.8
-10%
35.1 ?(11.6 - 57.9, n=29)
-203%
Load Average *
98.7
130
-32%
105
-6%
97.5
1%
128
-30%
71.3
28%
130.5 ?(79 - 201, n=29)
-32%
Cyberpunk 2077 ultra *
157.3
Cyberpunk 2077 ultra external monitor *
165.5
Load Maximum *
232
361
-56%
323
-39%
315.2
-36%
328
-41%
169.1
27%
324 ?(221 - 418, n=29)
-40%
Witcher 3 ultra *
302
246
230
243
127.5

* ... Meglio usare valori piccoli

Power consumption Cyberpunk / stress test

0153045607590105120135150165180195210225Tooltip
Asus ROG Zephyrus G16 GU605MY; 1280x720 Prime95 28.10 and Furmark 1.25: Ø162.6 (146.8-232)
Asus ROG Zephyrus G16 GU605MY; Idle 150cd/m2: Ø9.99 (4.38-19)
Asus ROG Zephyrus G16 GU605MY; Cyberpunk 2077 FHD ultra no FSR 150cd: Ø157.3 (139.6-164.6)

Power consumption with an external monitor

0102030405060708090100110120130140150160170180190Tooltip
Asus ROG Zephyrus G16 GU605MY; Prime95 V2810 Stress (external Monitor): Ø137.1 (124.9-148.9)
Asus ROG Zephyrus G16 GU605MY; Cinebench R15 Multi (external Monitor): Ø146.2 (145.5-147.1)
Asus ROG Zephyrus G16 GU605MY; Cinebench R23 Single (external Monitor): Ø51 (42.9-59.3)
Asus ROG Zephyrus G16 GU605MY; Cinebench R23 Multi (external Monitor): Ø142.4 (133.8-147.6)
Asus ROG Zephyrus G16 GU605MY; 1280x720 FurMark 1.19 GPU Stress Test (external Monitor): Ø148.5 (143.7-157)
Asus ROG Zephyrus G16 GU605MY; Idle 1min (external Monitor): Ø21.4 (20.1-23.4)
Asus ROG Zephyrus G16 GU605MY; Cyberpunk 2077 FHD ultra no FSR - external Monitor: Ø165.5 (143.1-192.6)

Durata della batteria

La batteria da 90 watt-ora è identica in ogni versione di Zephyrus G16 2024 ma, nel test Wi-Fi, i tempi di esecuzione della batteria sono inferiori di circa 30 minuti rispetto alla variante RTX 4070. La competizione di gioco diretta con il laptop RTX 4090 viene comunque superata. Nel test Wi-Fi a 150 cd/m² e 60 Hz, si ottengono 6,5 ore (5,5 ore a 120 Hz) e 5 ore (60 Hz) a piena luminosità (4,5 ore a 120 Hz). Con il dispositivo acceso, un ciclo di ricarica completo richiede 104 minuti; l'80% della capacità è disponibile dopo 47 minuti.

Autonomia della batteria
WiFi Websurfing
6ore 31minuti
WiFi Websurfing max. Brightness
5ore 03minuti
Battery Runtime
WiFi Websurfing
Asus ROG Zephyrus G16 2024 GU605M
Ultra 7 155H, NVIDIA GeForce RTX 4070 Laptop GPU, 90 Wh
435 min +11%
Asus ROG Zephyrus G16 GU605MY
Ultra 9 185H, NVIDIA GeForce RTX 4090 Laptop GPU, 90 Wh
391 min
Media della classe Gaming
  (85 - 889, n=157, ultimi 2 anni)
376 min -4%
SCHENKER XMG Neo 16 (Early 24)
i9-14900HX, NVIDIA GeForce RTX 4090 Laptop GPU, 99.8 Wh
350 min -10%
Razer Blade 16 2024, RTX 4090
i9-14900HX, NVIDIA GeForce RTX 4090 Laptop GPU, 95.2 Wh
329 min -16%
Lenovo Legion 9 16IRX9, RTX 4090
i9-14900HX, NVIDIA GeForce RTX 4090 Laptop GPU, 99.99 Wh
290 min -26%
Alienware x16 R2 P120F
Ultra 9 185H, NVIDIA GeForce RTX 4080 Laptop GPU, 90 Wh
193 min -51%
WiFi Websurfing max. Brightness
Asus ROG Zephyrus G16 2024 GU605M
Ultra 7 155H, NVIDIA GeForce RTX 4070 Laptop GPU, 90 Wh
345 min +14%
Asus ROG Zephyrus G16 GU605MY
Ultra 9 185H, NVIDIA GeForce RTX 4090 Laptop GPU, 90 Wh
303 min
Media della classe Gaming
  (156 - 578, n=48, ultimi 2 anni)
299 min -1%
Razer Blade 16 2024, RTX 4090
i9-14900HX, NVIDIA GeForce RTX 4090 Laptop GPU, 95.2 Wh
265 min -13%
Lenovo Legion 9 16IRX9, RTX 4090
i9-14900HX, NVIDIA GeForce RTX 4090 Laptop GPU, 99.99 Wh
197 min -35%

Pro

+ Custodia molto premium e compatta
+ Brillante display OLED da 240 Hz, G-Sync
+ Ottime prestazioni di gioco
+ Altoparlanti eccellenti
+ Meravigliosi dispositivi di input
+ 2x slot SSD
+ Buone prestazioni di sistema

Contro

- Il laptop RTX 4090 non raggiunge il suo potenziale
- RAM saldata, massimo 32 GB
- Luminosità HDR massima limitata
- Assenza di Wi-Fi 7

Verdetto - Il portatile RTX 4090 non soddisfa il suo potenziale

Recensione di Asus ROG Zephyrus G16 2024: Asus ROG Zephyrus G16 2024. Dispositivo per la recensione fornito da Asus Germania.

L'Asus Zephyrus G16 2024 è un portatile da gioco sottile e relativamente leggero, adatto anche ad altri gruppi target come i creatori di contenuti e gli utenti multimediali. L'aver scelto il laptop RTX 4090 significa, ovviamente, che le prestazioni grafiche sono l'obiettivo principale, ma è proprio qui che si trova un problema. In linea di principio, è positivo che Asus offra i modelli di GPU più veloci, ma il case sottile richiede dei compromessi, nonostante il raffreddamento migliorato della camera di vapore. Con un consumo energetico massimo di 115 watt in modalità Turbo , il laptop RTX 4090 non è in grado di sfruttare il suo potenziale, rimanendo generalmente indietro del 20-25% rispetto alla concorrenza (persino il laptop RTX 4080 presente nell'Alienware x16 è leggermente più veloce). Nonostante ciò, il laptop RTX 4090 le costerà l'intero prezzo richiesto. Si tratta semplicemente di un compromesso da accettare per il case più compatto, ma è qualcosa di cui i potenziali acquirenti dovrebbero essere consapevoli.

La camera di vapore aumenta il peso rispetto al raffreddamento convenzionale (modelli fino al laptop RTX 4070) di circa 100 grammi ed è leggermente più rumorosa sia nel profilo energetico Quiet che in quello Performance. Entrambe le configurazioni sono indistinguibili l'una dall'altra solo nella modalità Turbo. In effetti, questo significa che dovrebbe indossare le cuffie quando gioca.

Con ROG Zephyrus G16, Asus offre un computer portatile da 16 pollici molto compatto con GeForce RTX 4090. Tuttavia, una buona mobilità richiede dei compromessi in termini di prestazioni e altri modelli RTX 4090 presentano dei vantaggi in termini di prestazioni di gioco.

Gli altri vantaggi e svantaggi di Zephyrus G16 si applicano anche alla configurazione di fascia alta, compresi i meravigliosi altoparlanti e il brillante pannello OLED a 240 Hz. Tuttavia, un grande svantaggio è la RAM saldata e non si ottengono nemmeno 64 GB di RAM nella variante di fascia alta da 3.649 dollari.

Chi è alla ricerca delle massime prestazioni grafiche in un portatile da 16 pollici potenzialmente compatto, sarà ben servito da ROG Zephyrus G16. Tuttavia, non deve aspettarsi le stesse prestazioni che troverebbe nei concorrenti più pesanti/più grandi. Se l'obiettivo è la pura prestazione di gioco, modelli come l' XMG Neo 16 o l' Alienware x16 R2 offrono semplicemente più potenza.

Prezzo e disponibilità

Il ROG Zephyrus G16 con Intel Core Ultra 9 185H e un computer portatile Nvidia GeForce RTX 4090 ha un RRP di 3.649 dollari e il dispositivo può essere attualmente acquistato su Amazon.

Nota: abbiamo recentemente aggiornato il nostro sistema di valutazione e i risultati della versione 8 non sono paragonabili ai risultati della versione 7. Ulteriori informazioni sono disponibili qui .

Asus ROG Zephyrus G16 GU605MY - 07/12/2024 v8
Andreas Osthoff

Chassis
90 / 98 → 92%
Tastiera
92%
Dispositivo di puntamento
100%
Connettività
63 / 80 → 79%
Peso
64 / 10-68 → 93%
Batteria
69 / 95 → 73%
Display
87%
Prestazioni di gioco
86%
Prestazioni Applicazioni
86%
Temperatura
87 / 95 → 91%
Rumorosità
67 / 90 → 75%
Audio
91%
Fotocamera
38 / 75 → 51%
Media
65%
86%
Gaming - Media ponderata
CO2 Emissions
No Data
Materials
50%
Packaging
50%
Power Use
73.2%
Repairability
40%
Software Updates
22.3%
Recycle Logo Total Sustainability Score: 39.3%

Transparency

The selection of devices to be reviewed is made by our editorial team. The test sample was provided to the author as a loan by the manufacturer or retailer for the purpose of this review. The lender had no influence on this review, nor did the manufacturer receive a copy of this review before publication. There was no obligation to publish this review. We never accept compensation or payment in return for our reviews. As an independent media company, Notebookcheck is not subjected to the authority of manufacturers, retailers or publishers.

This is how Notebookcheck is testing

Every year, Notebookcheck independently reviews hundreds of laptops and smartphones using standardized procedures to ensure that all results are comparable. We have continuously developed our test methods for around 20 years and set industry standards in the process. In our test labs, high-quality measuring equipment is utilized by experienced technicians and editors. These tests involve a multi-stage validation process. Our complex rating system is based on hundreds of well-founded measurements and benchmarks, which maintains objectivity. Further information on our test methods can be found here.

Price comparison

Please share our article, every link counts!
Mail Logo
> Recensioni e prove di notebook, tablets e smartphones > Recensioni e prove > Recensioni e prove > Recensione del portatile Asus ROG Zephyrus G16 - Un gamer sottile con una RTX 4090 e un potenziale inespresso
Andreas Osthoff, 2024-07-16 (Update: 2024-07-16)