

Recensione del laptop Maingear ML-16 MK2: prestante GeForce RTX 4070 a un prezzo decente

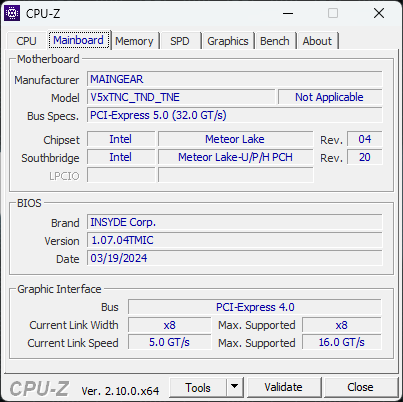
Come Schenker o Eurocom, Maingear è un rivenditore di computer portatili white label ad alte prestazioni, progettati per attirare giocatori e professionisti. Questo approccio è in contrasto con i produttori di PC più noti, come Dell, Lenovo o HP, che progettano i loro computer portatili internamente. L'ultimo modello di Maingear è l'ML-16 MK2, dotato della più recente CPU Intel Meteor Lake e della GPU Nvidia.
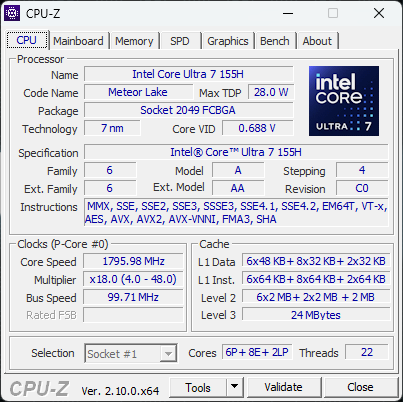
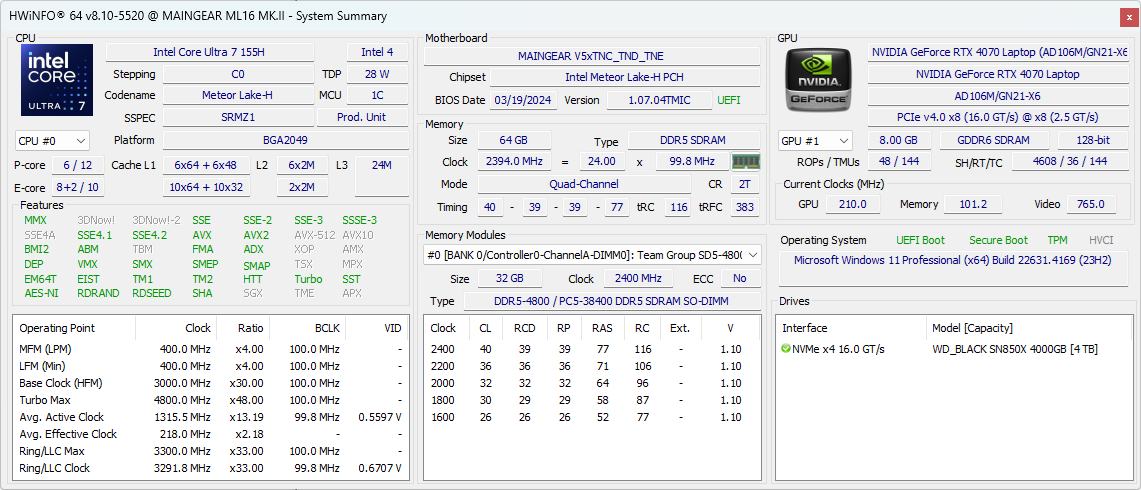
La nostra unità di prova è stata completamente configurata con il Core Ultra 7 155H, la RTX 4070 da 105 W GeForce e il display IPS da 240 Hz 1600p per circa 2000 dollari. Le SKU inferiori sono dotate di RTX 4060, ma la CPU e il display rimangono fissi.
I concorrenti dell'ML-16 MK2 includono altri portatili da gioco ultrasottili da 16 pollici come il Razer Blade 16, Alienware x16 R2, Asus ROG Zephyrus G16o il Lenovo Legion Pro 7 16.
Altre recensioni di Maingear:
Potenziali concorrenti a confrontos
Punteggio | Versione | Data | Modello | Peso | Altezza | Dimensione | Risoluzione | Prezzo |
|---|---|---|---|---|---|---|---|---|
| 80.9 % | v8 | 09/2024 | Maingear ML-16 MK2 Ultra 7 155H, NVIDIA GeForce RTX 4070 Laptop GPU | 2.1 kg | 19.9 mm | 16.00" | 2560x1600 | |
| 85.9 % | v8 | 08/2024 | Asus ROG Zephyrus G16 GA605WV Ryzen AI 9 HX 370, NVIDIA GeForce RTX 4060 Laptop GPU | 1.8 kg | 17.2 mm | 16.00" | 2560x1600 | |
| 84.3 % v7 (old) | v7 (old) | 05/2024 | HP Victus 16 (2024) i7-14700HX, NVIDIA GeForce RTX 4060 Laptop GPU | 2.4 kg | 23.9 mm | 16.10" | 1920x1080 | |
| 88.4 % v7 (old) | v7 (old) | 05/2024 | Alienware x16 R2 P120F Ultra 9 185H, NVIDIA GeForce RTX 4080 Laptop GPU | 2.7 kg | 18.57 mm | 16.00" | 2560x1600 | |
| 89.3 % v7 (old) | v7 (old) | 04/2024 | Lenovo Legion Pro 5 16IRX9 i9-14900HX, NVIDIA GeForce RTX 4070 Laptop GPU | 2.5 kg | 26.95 mm | 16.00" | 2560x1600 | |
| 91.1 % v7 (old) | v7 (old) | 02/2024 | Razer Blade 16 2024, RTX 4090 i9-14900HX, NVIDIA GeForce RTX 4090 Laptop GPU | 2.5 kg | 22 mm | 16.00" | 2560x1600 |
Nota: abbiamo recentemente aggiornato il nostro sistema di valutazione e i risultati della versione 8 non sono paragonabili ai risultati della versione 7. Ulteriori informazioni sono disponibili qui .
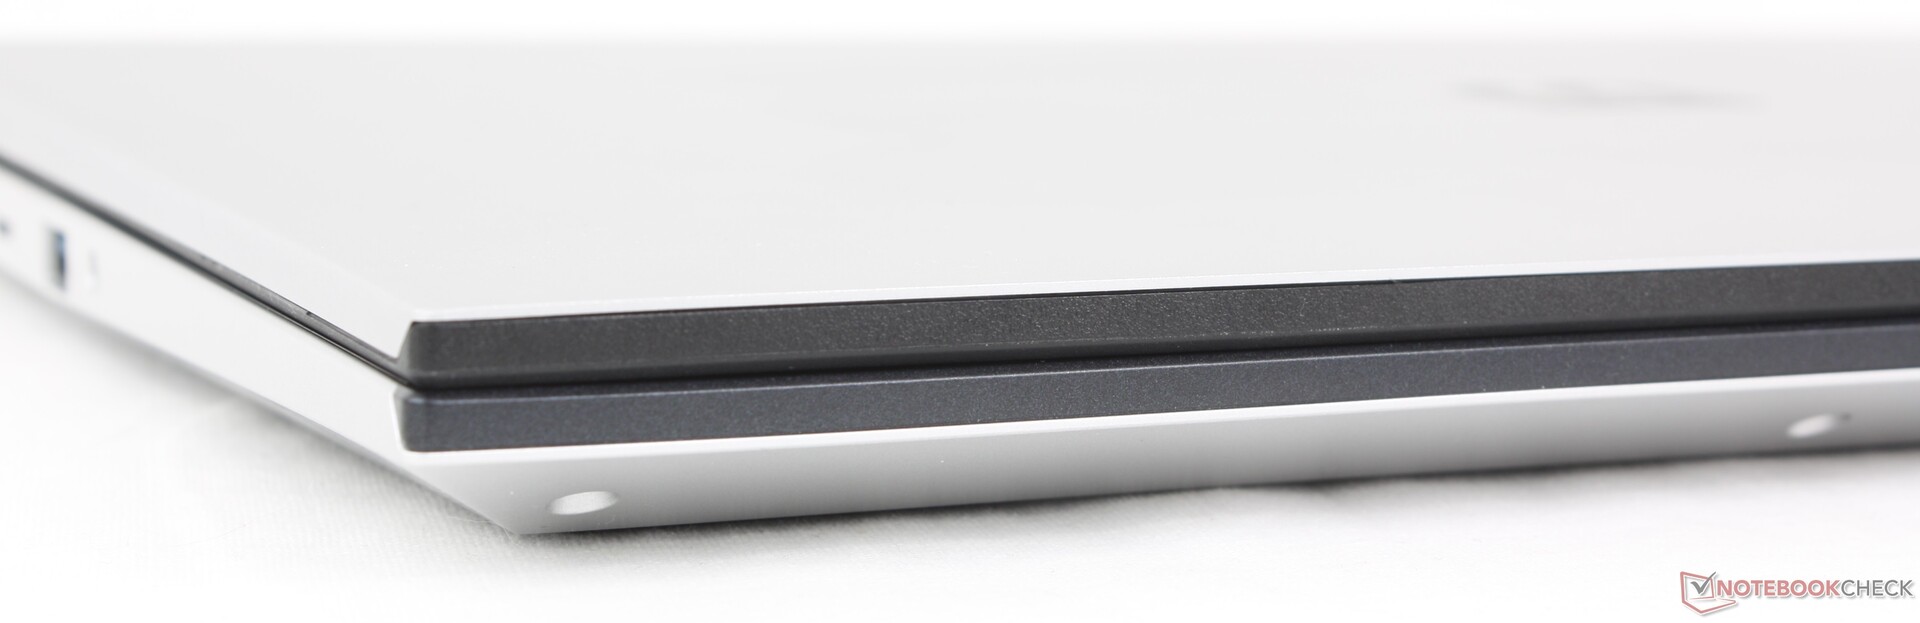
Custodia - Sottile e affilata
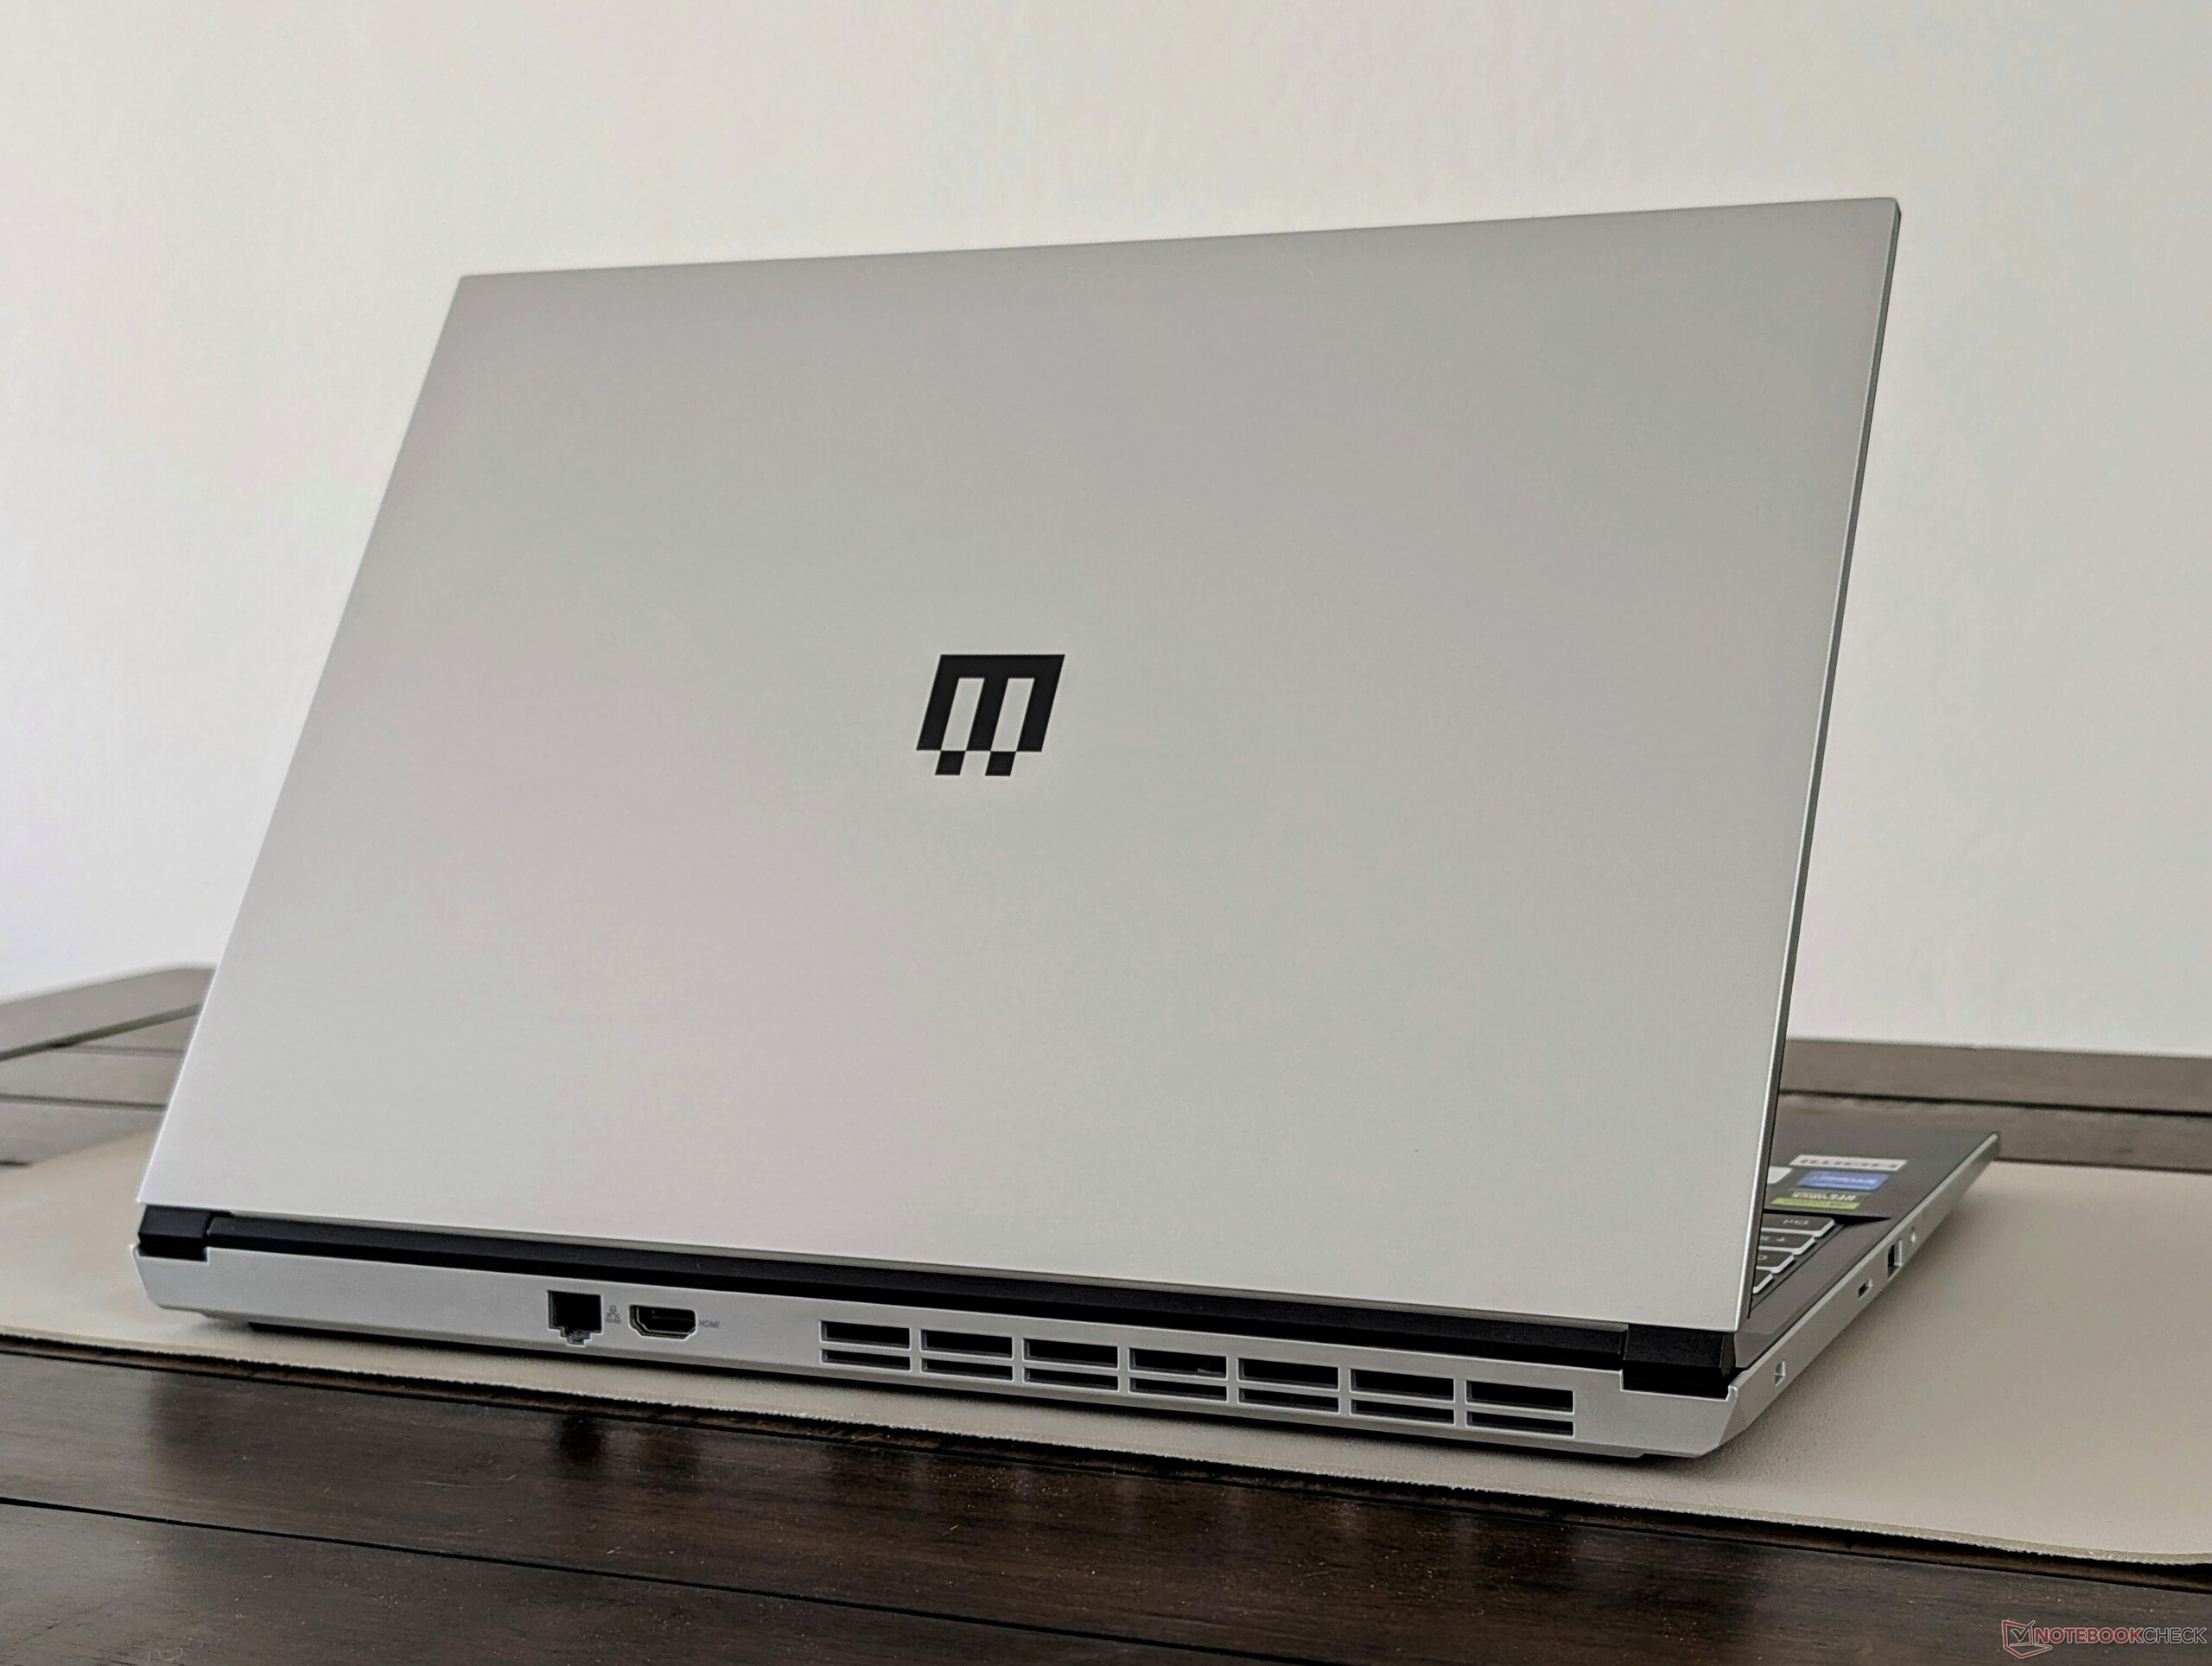
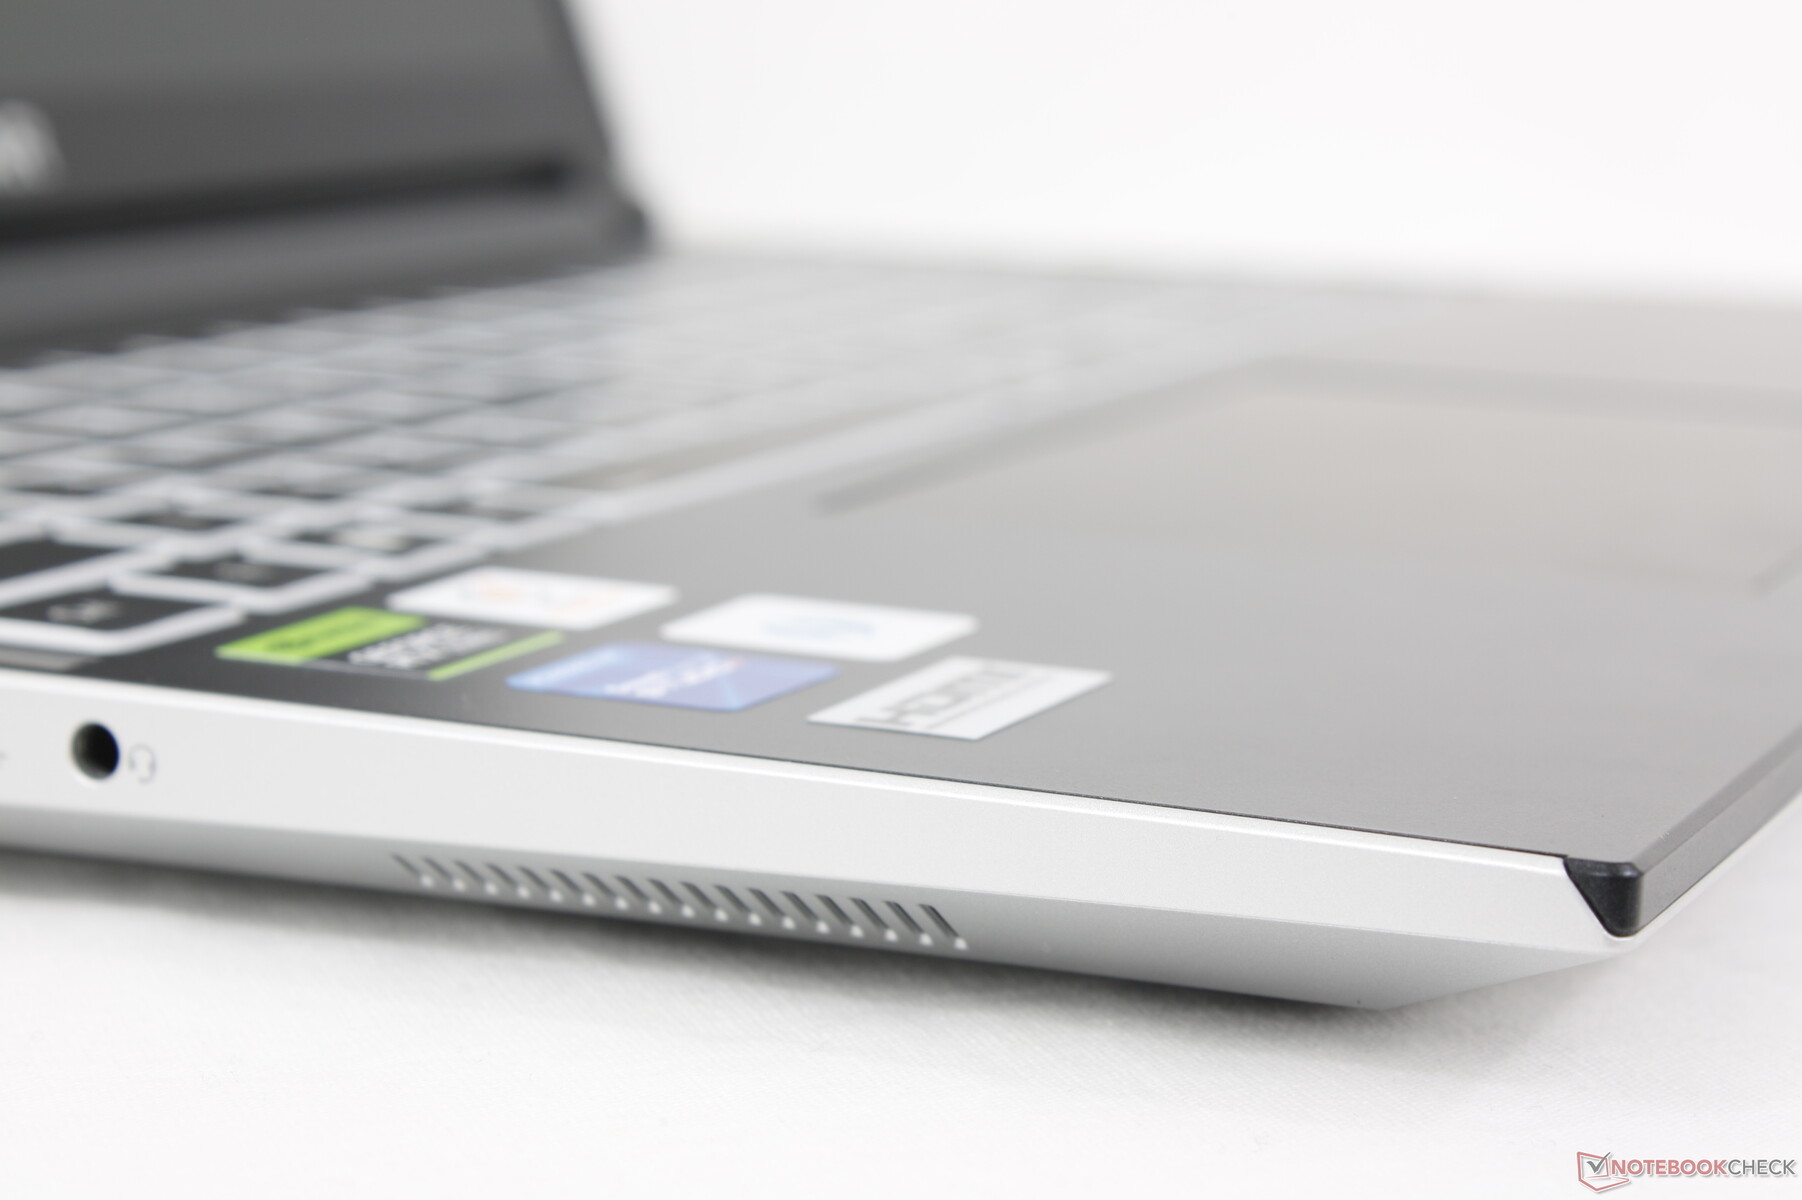
Lo chassis può essere ricondotto a Clevo (V560TNE-S) in base al produttore di origine. È costituito principalmente da alluminio metallico per il coperchio esterno e il fondo, mentre il piano tastiera nero è in plastica. I due colori contrastanti funzionano bene insieme per aiutare a distinguere visivamente il modello dal solito laptop da gioco completamente nero o bianco opaco.
La qualità del telaio, tuttavia, non riflette il prezzo elevato richiesto. Le superfici si deformano più facilmente e non si sentono così rigide come i concorrenti come il Razer Blade 16 o Alienware x16 R2. Ad esempio, premendo con un dito sul centro della tastiera o sul coperchio esterno, le superfici si deprimono sensibilmente. Anche il coperchio traballa più facilmente quando si regolano gli angoli. Dovrà fare più attenzione quando maneggia l'ML-16 MK2, altrimenti rischia di danneggiare le piccole cerniere.
Il peso e lo spessore sono più leggeri e sottili rispetto ai principali concorrenti, tra cui Blade 16 o Lenovo Legion Pro 5 16IRX9. L'Asus ROG Zephyrus G16 è ancora più sottile e leggero del nostro Maingear, ma ha anche un prezzo di vendita superiore di centinaia di dollari.
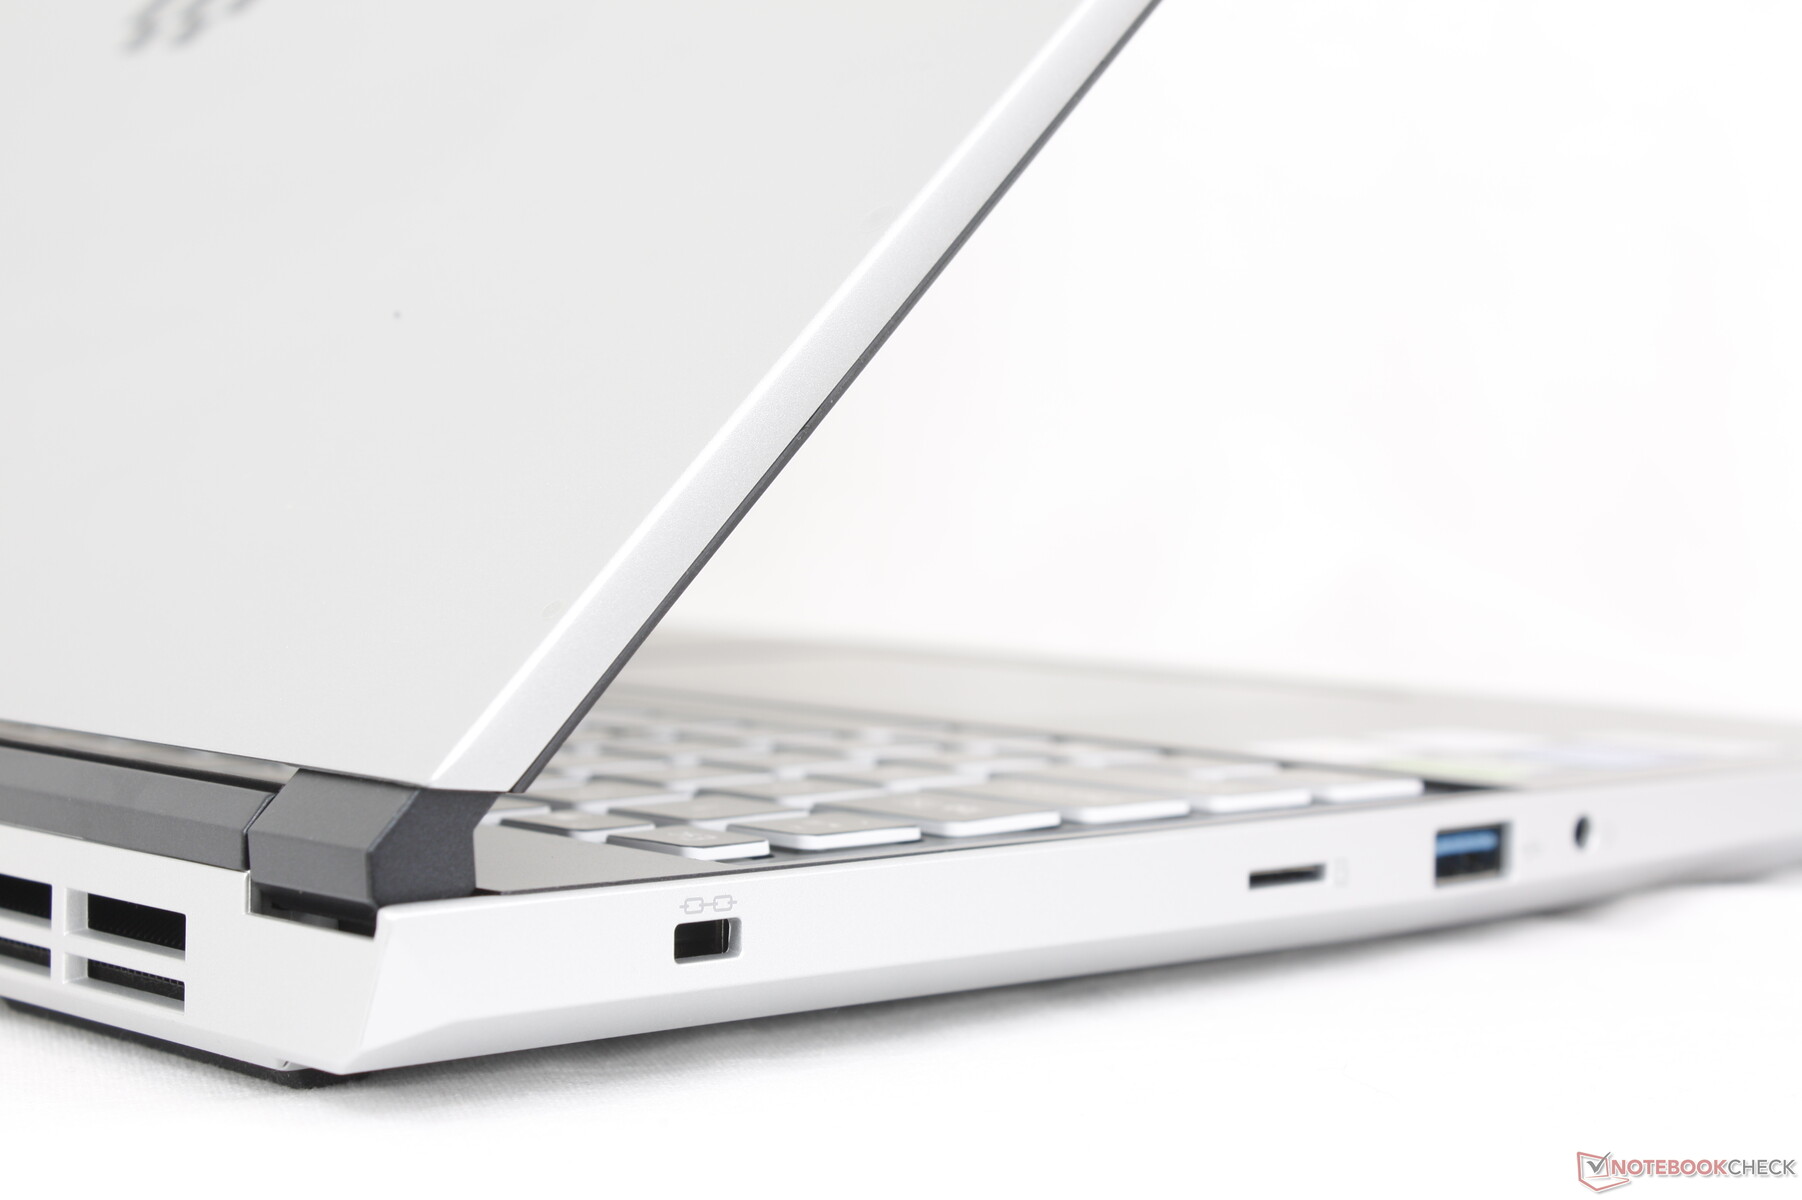
Connettività
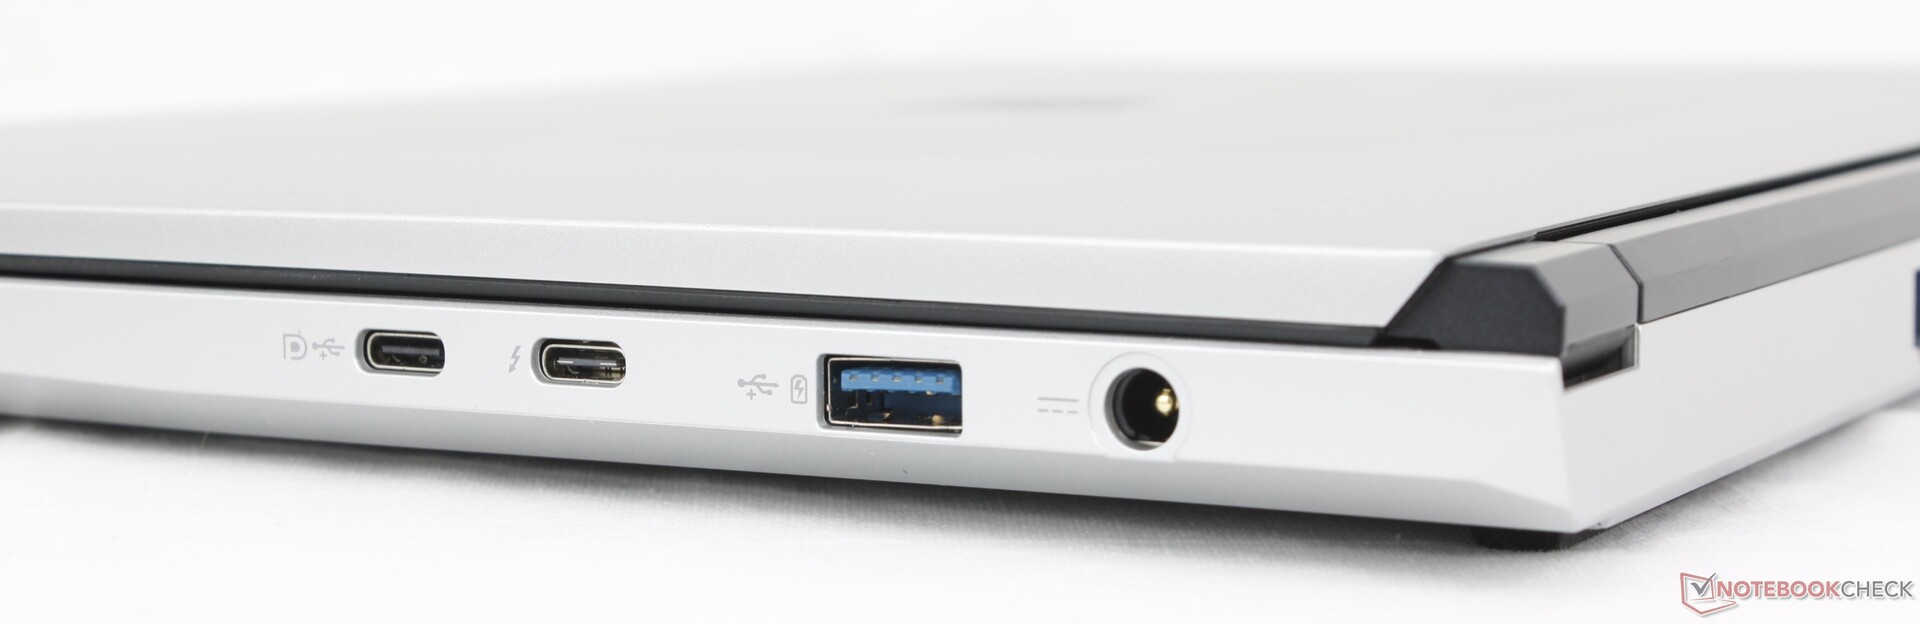
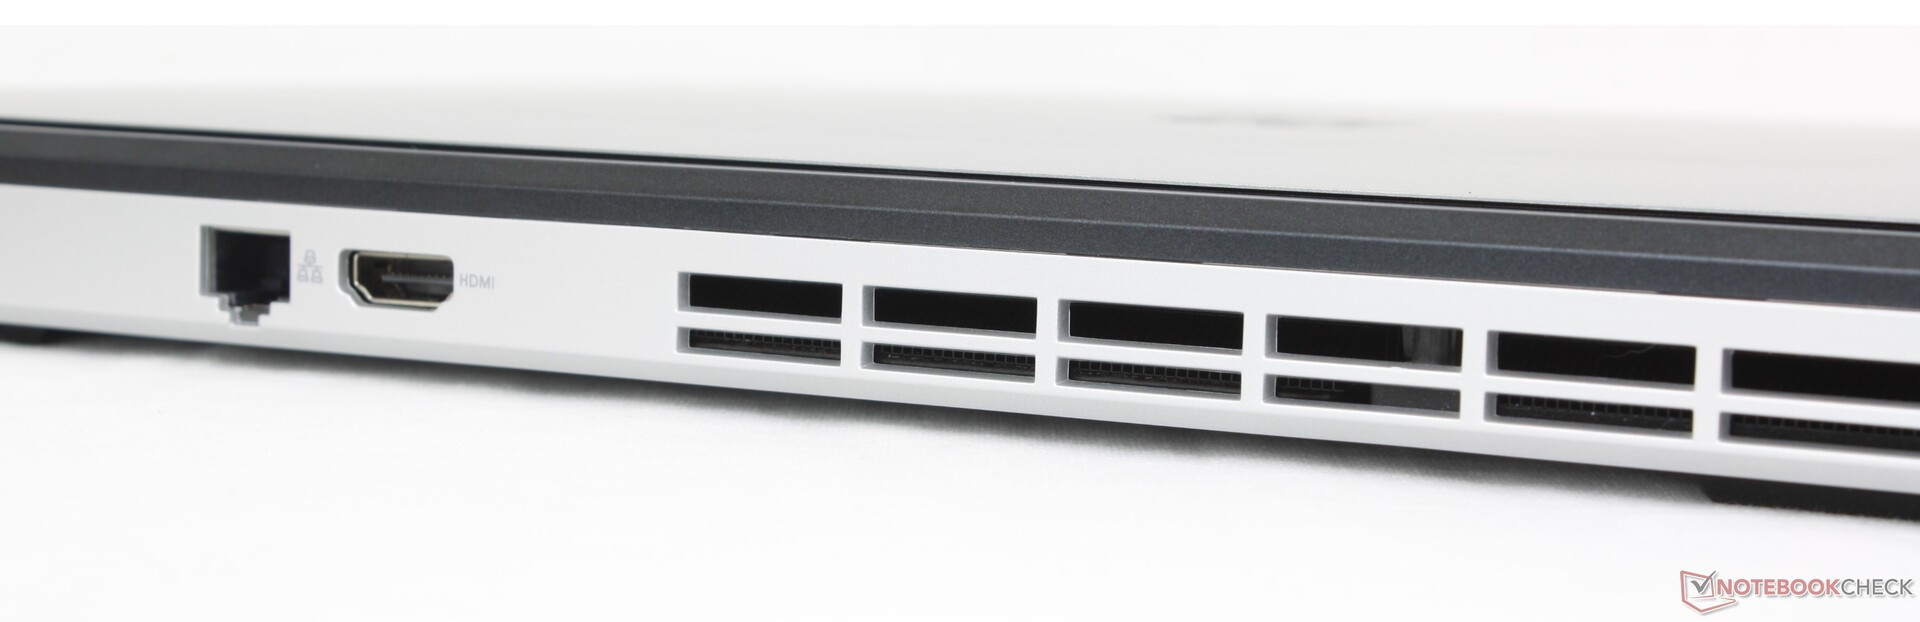
Le porte sono abbondanti, anche se ne mancano un paio. Il Blade 16, ad esempio, include più porte USB-A, mentre l'Alienware x16 R2 include una porta mini-Display. Il posizionamento delle porte è buono e non troppo affollato, a differenza del sistema Alienware citato in precedenza.
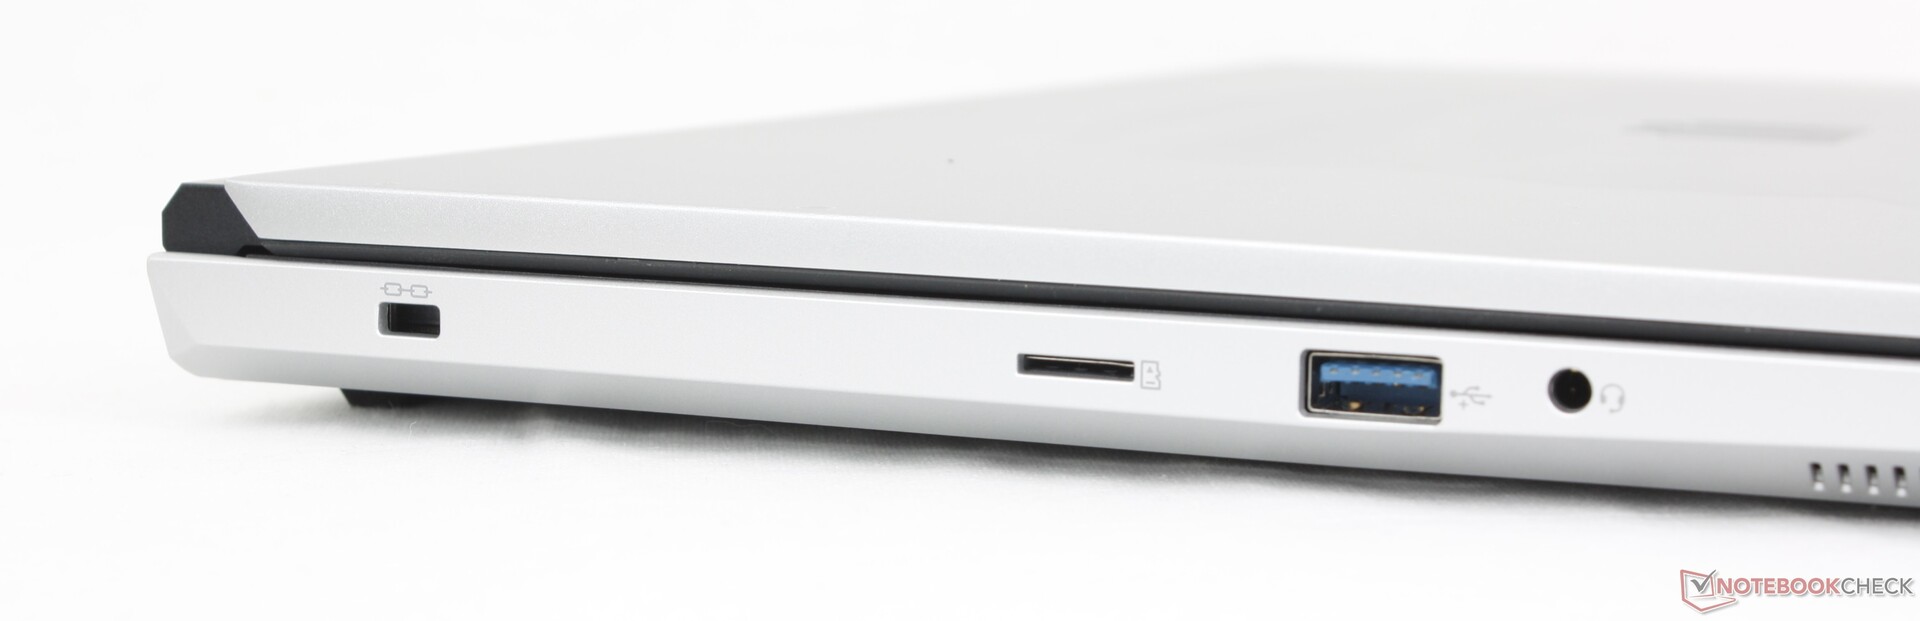
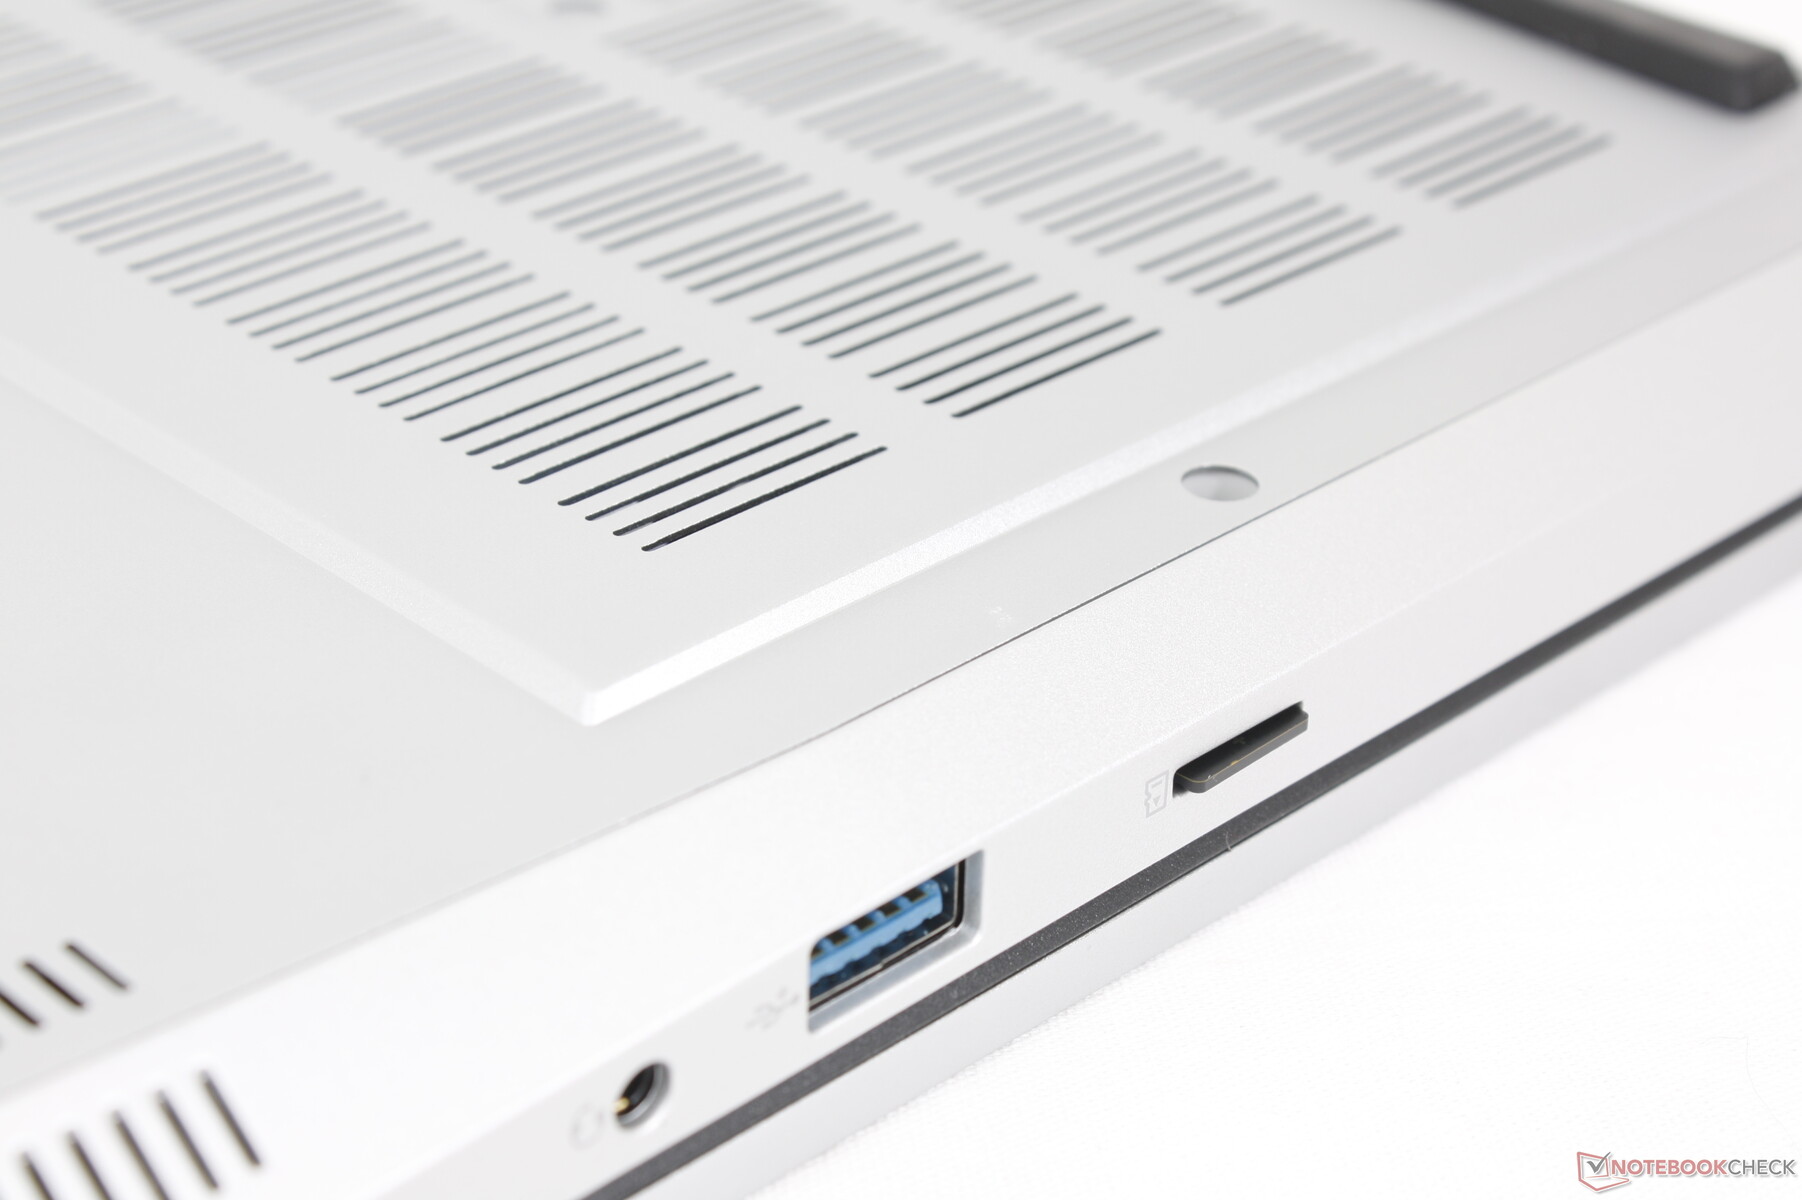
Lettore di schede SD
Anche se apprezziamo il fatto di avere un piccolo lettore MicroSD invece di non avere alcun lettore SD, quello presente è lento, soprattutto per un portatile da gioco da 16 pollici. Il trasferimento di 1 GB di immagini dalla nostra scheda di test UHS-II richiede circa 25 secondi, rispetto ai soli 6 secondi del Blade 16.
| SD Card Reader | |
| average JPG Copy Test (av. of 3 runs) | |
| Razer Blade 16 2024, RTX 4090 | |
| Alienware x16 R2 P120F (AV PRO microSD 128 GB V60) | |
| Maingear ML-16 MK2 (AV PRO microSD 128 GB V60) | |
| maximum AS SSD Seq Read Test (1GB) | |
| Alienware x16 R2 P120F (AV PRO microSD 128 GB V60) | |
| Razer Blade 16 2024, RTX 4090 | |
| Maingear ML-16 MK2 (AV PRO microSD 128 GB V60) | |
Comunicazione
L'Intel AX211 è dotato di connettività Wi-Fi 6E e Bluetooth 5.3 di serie. Abbiamo riscontrato velocità di trasferimento costanti e nessun problema quando è stato accoppiato al nostro router di prova AXE11000.
Webcam
Una webcam da 2 MP con IR e un otturatore elettronico sono di serie per essere paragonabili ai rivali.


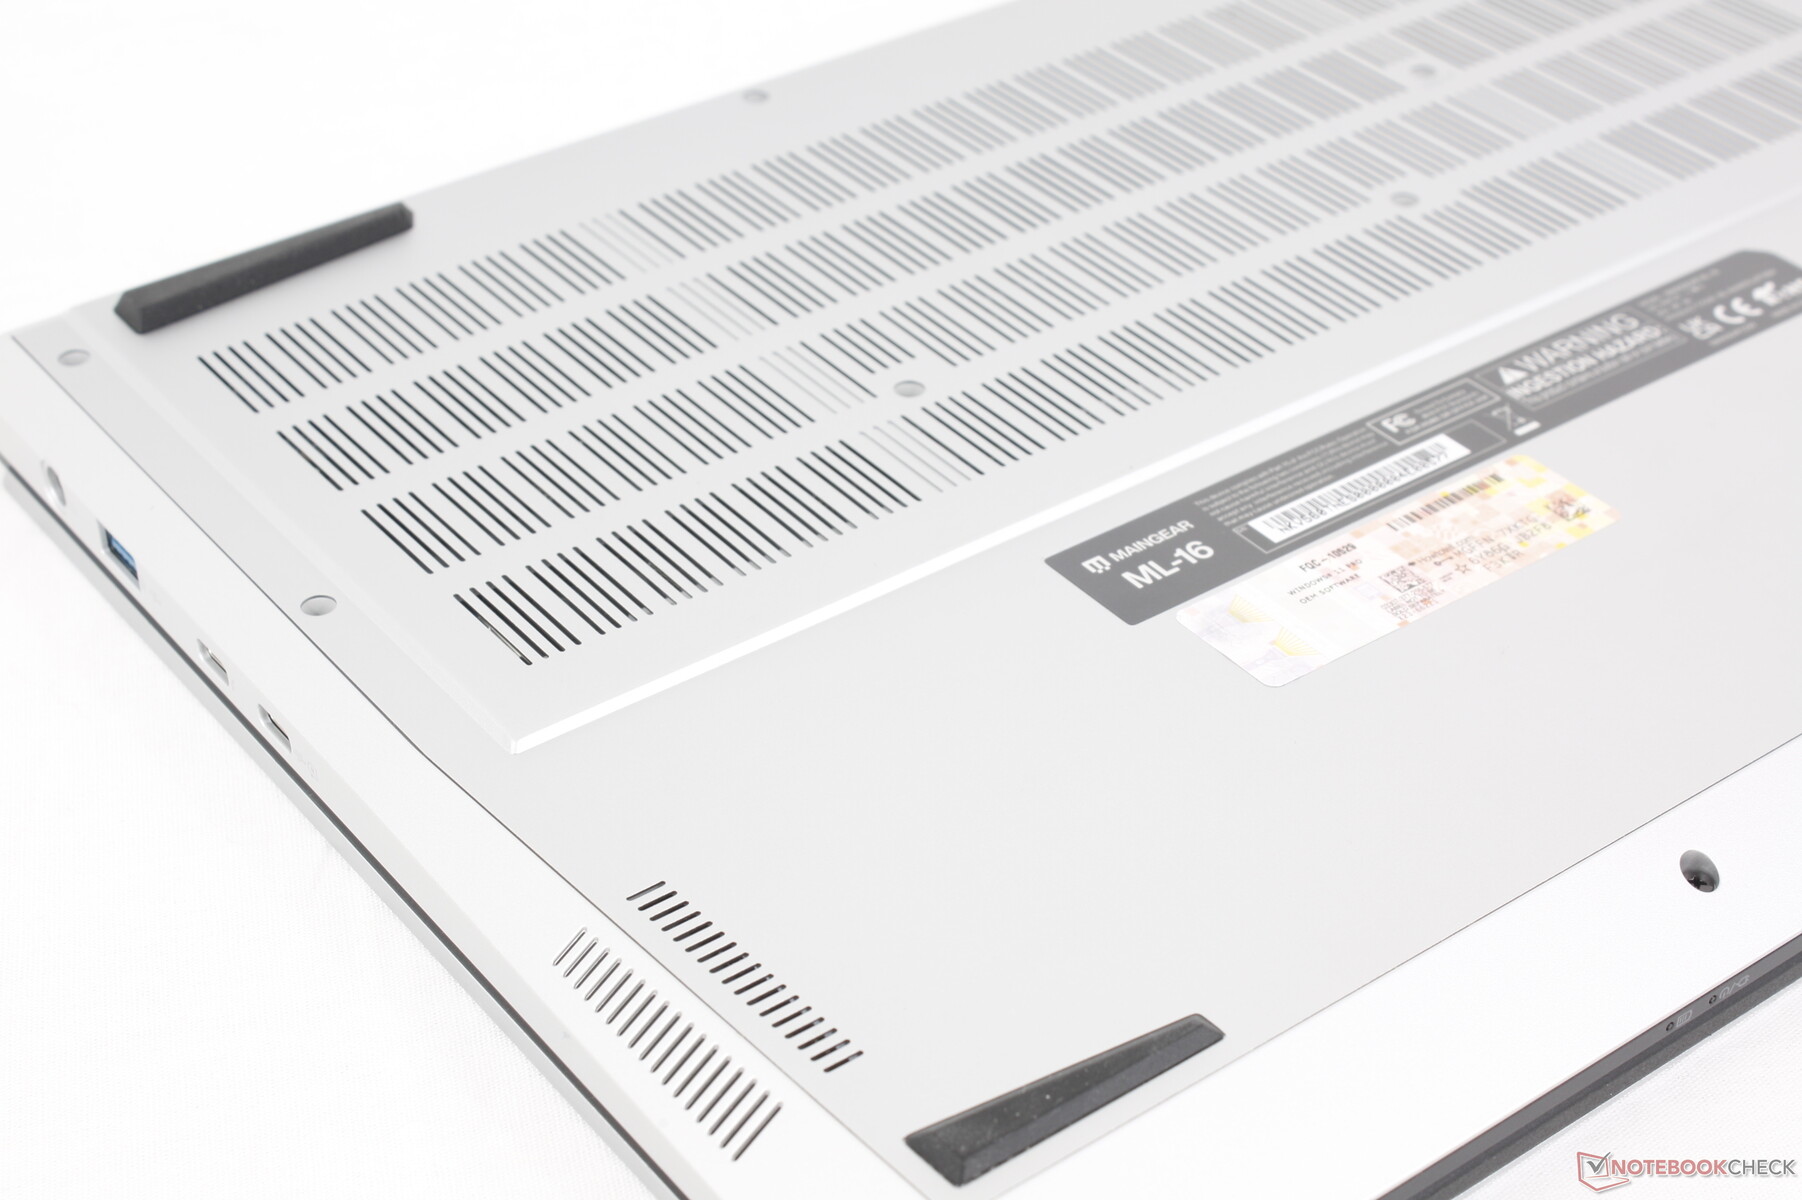
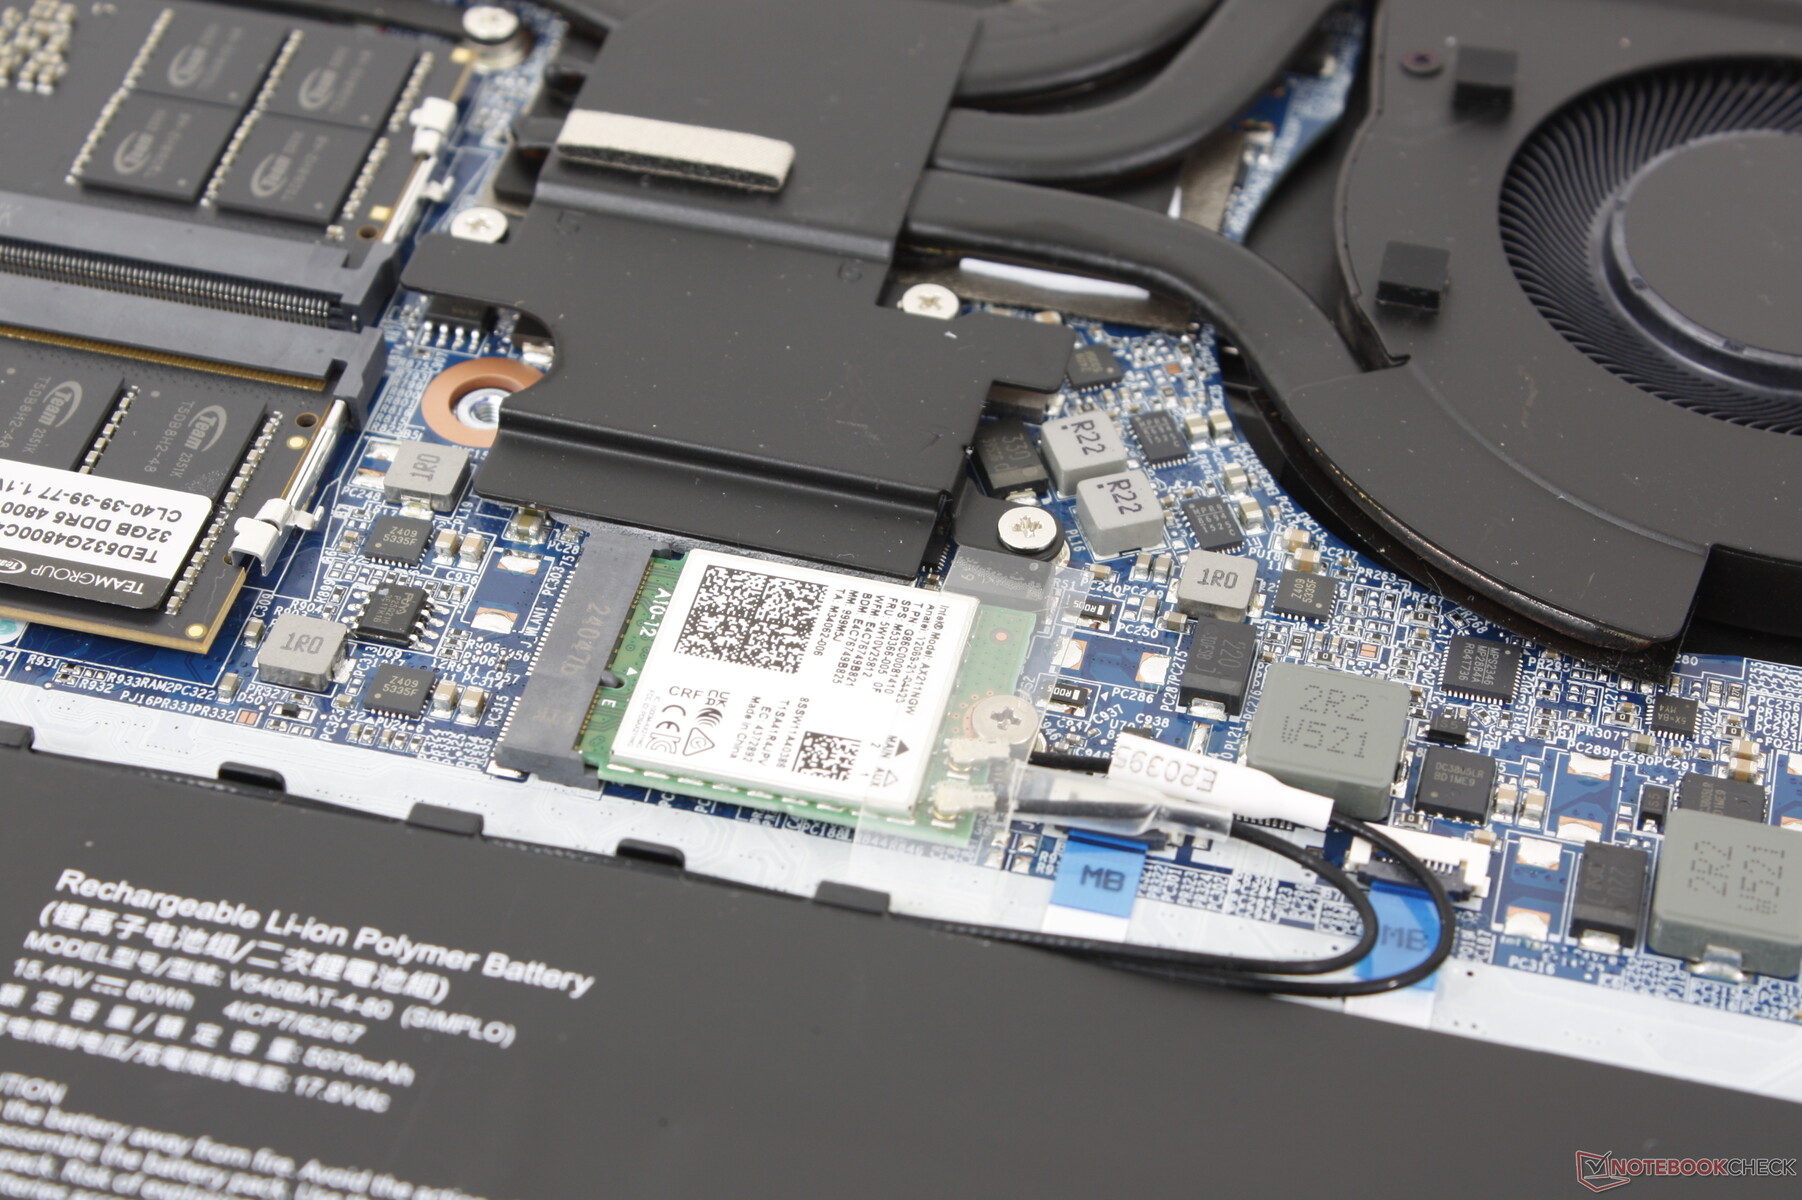
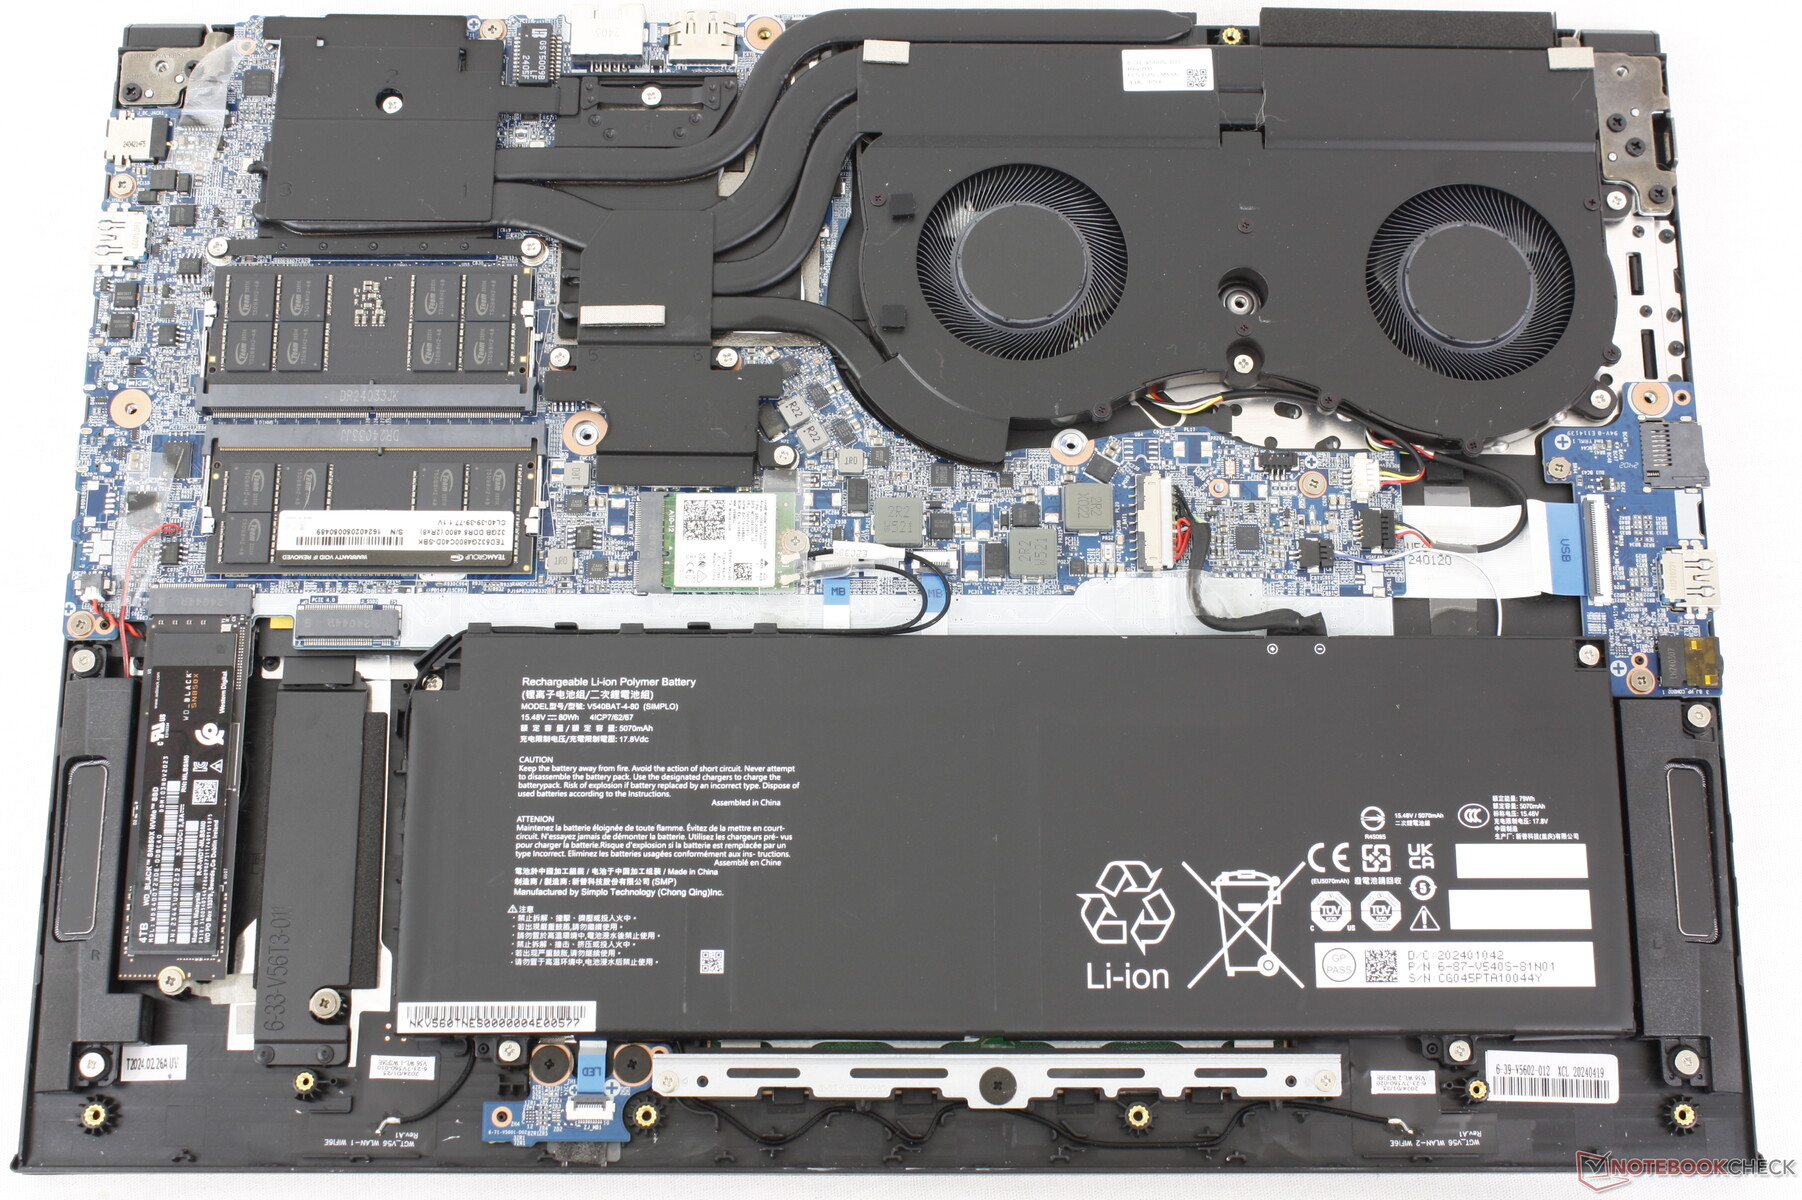
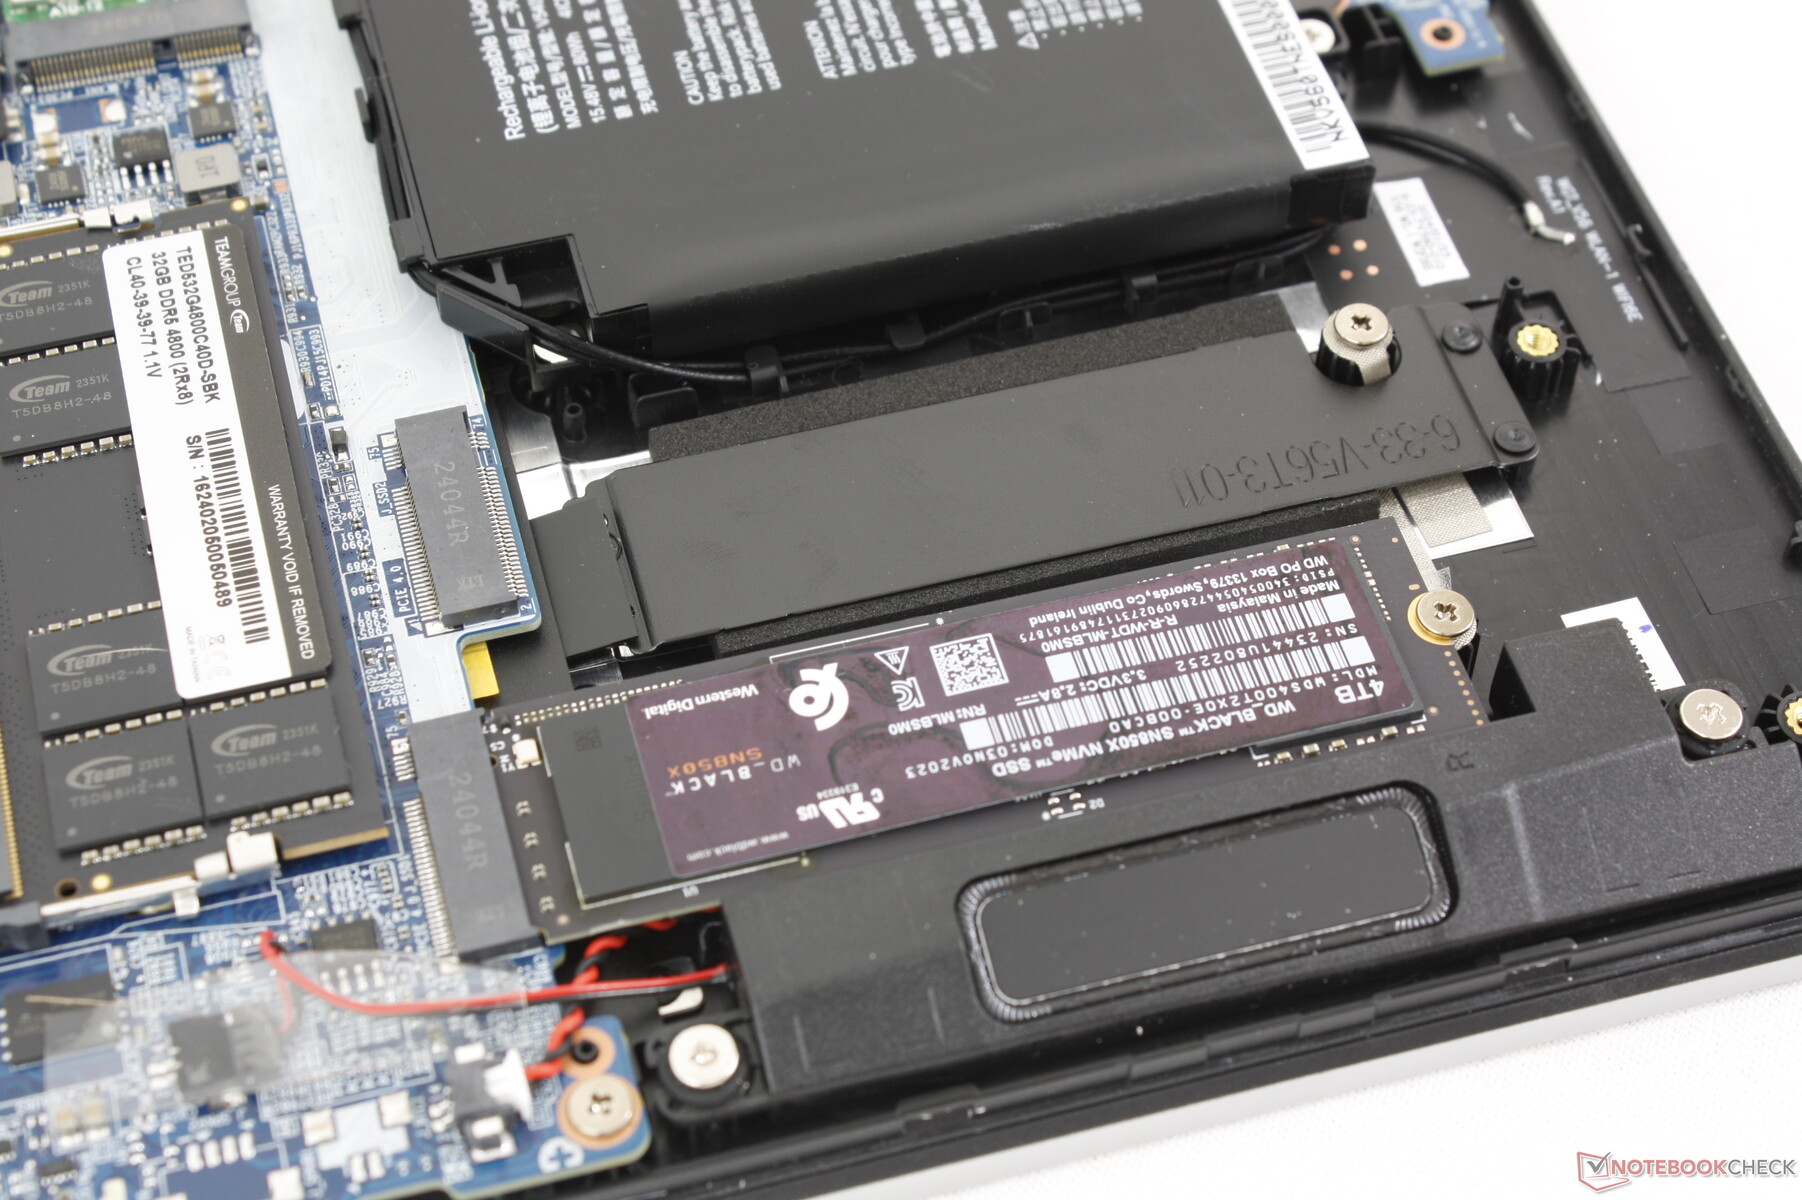
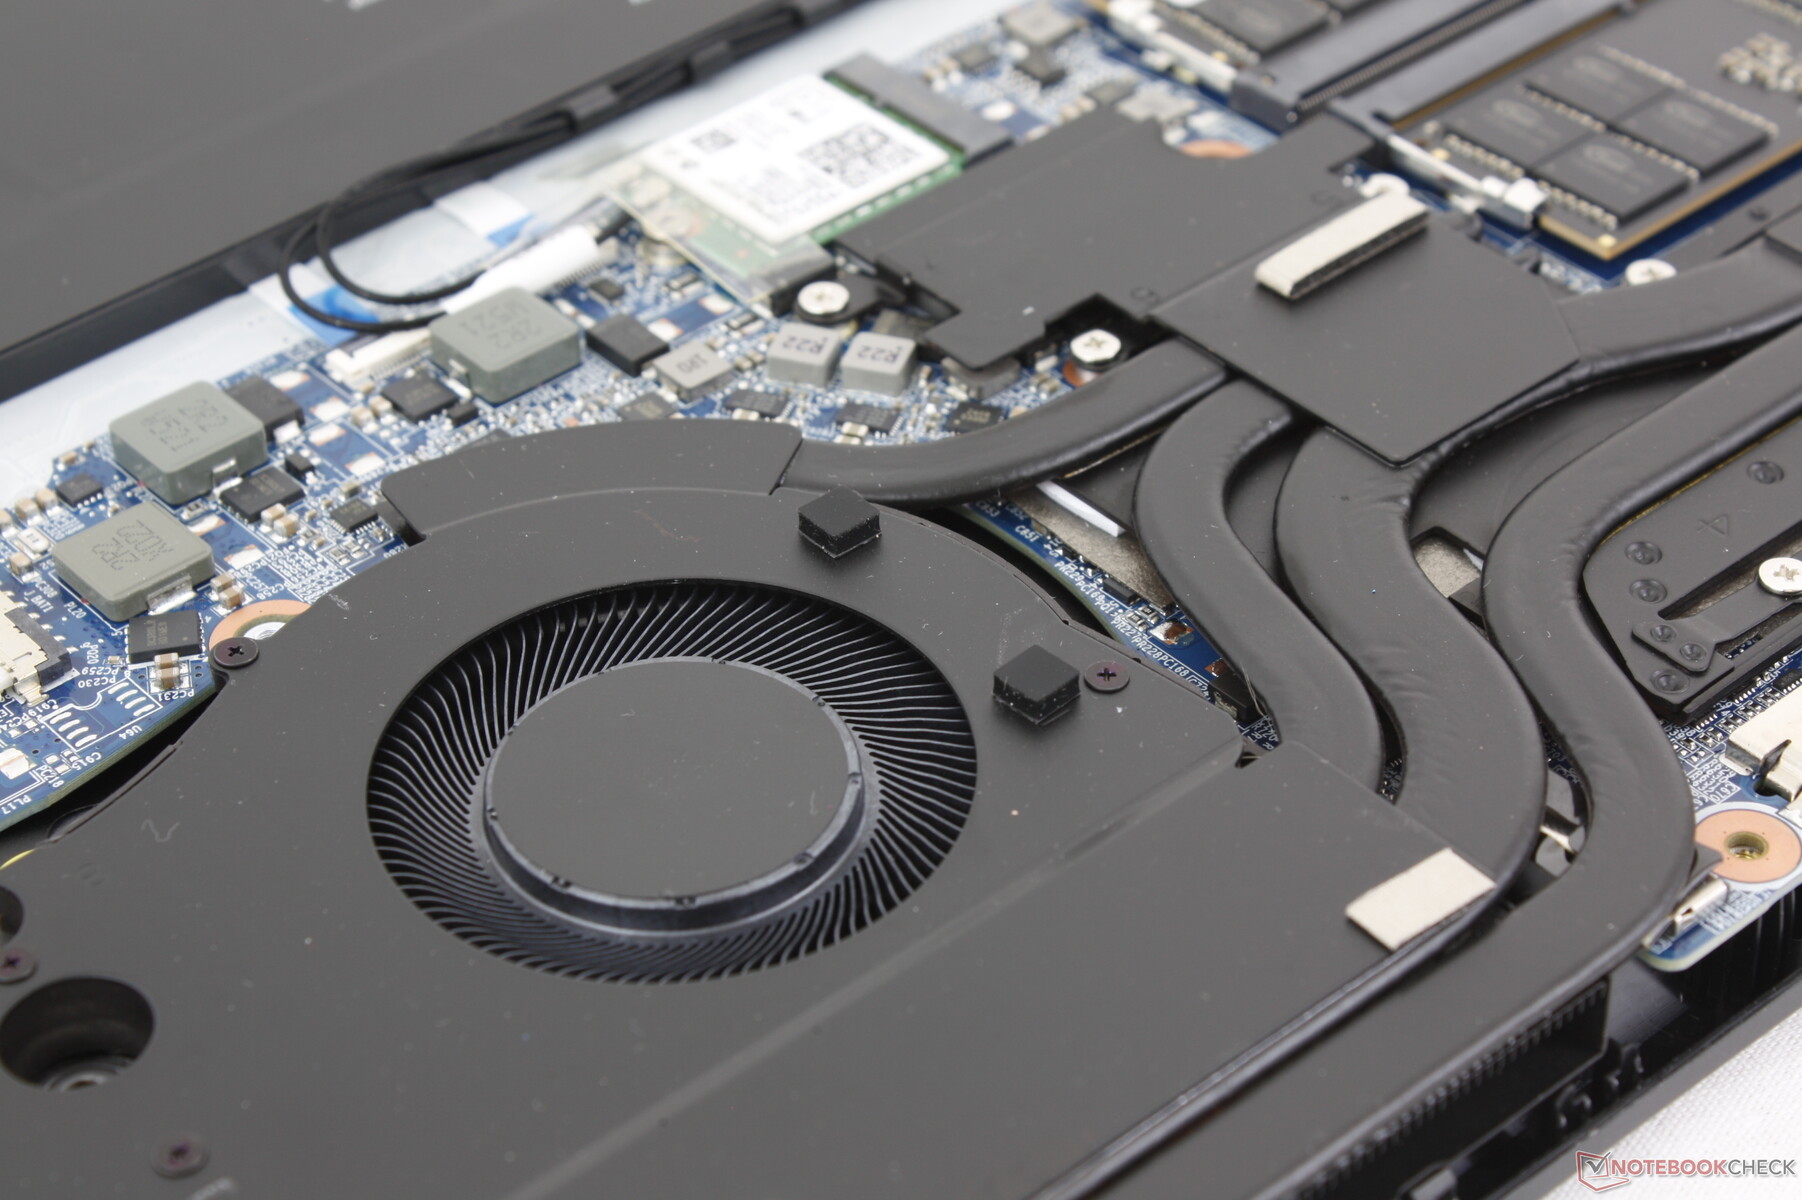
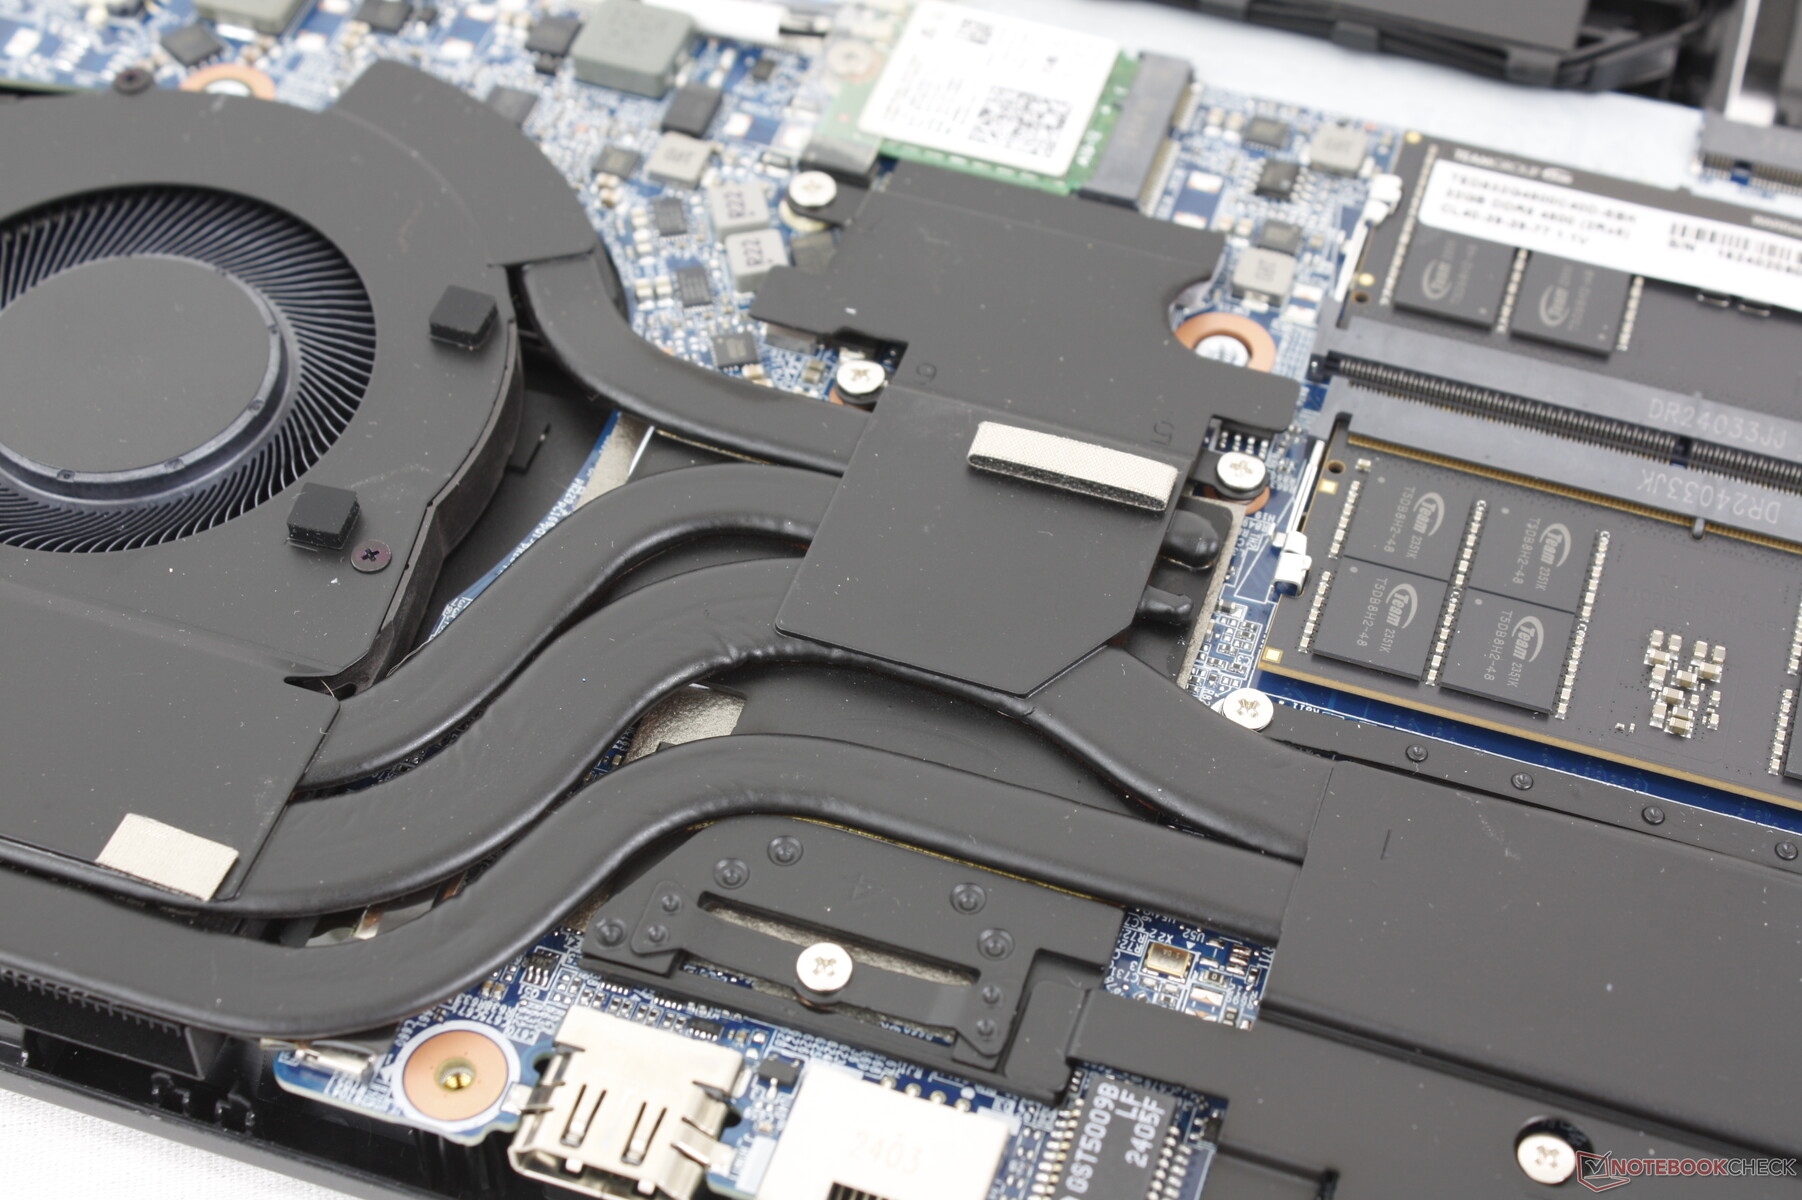
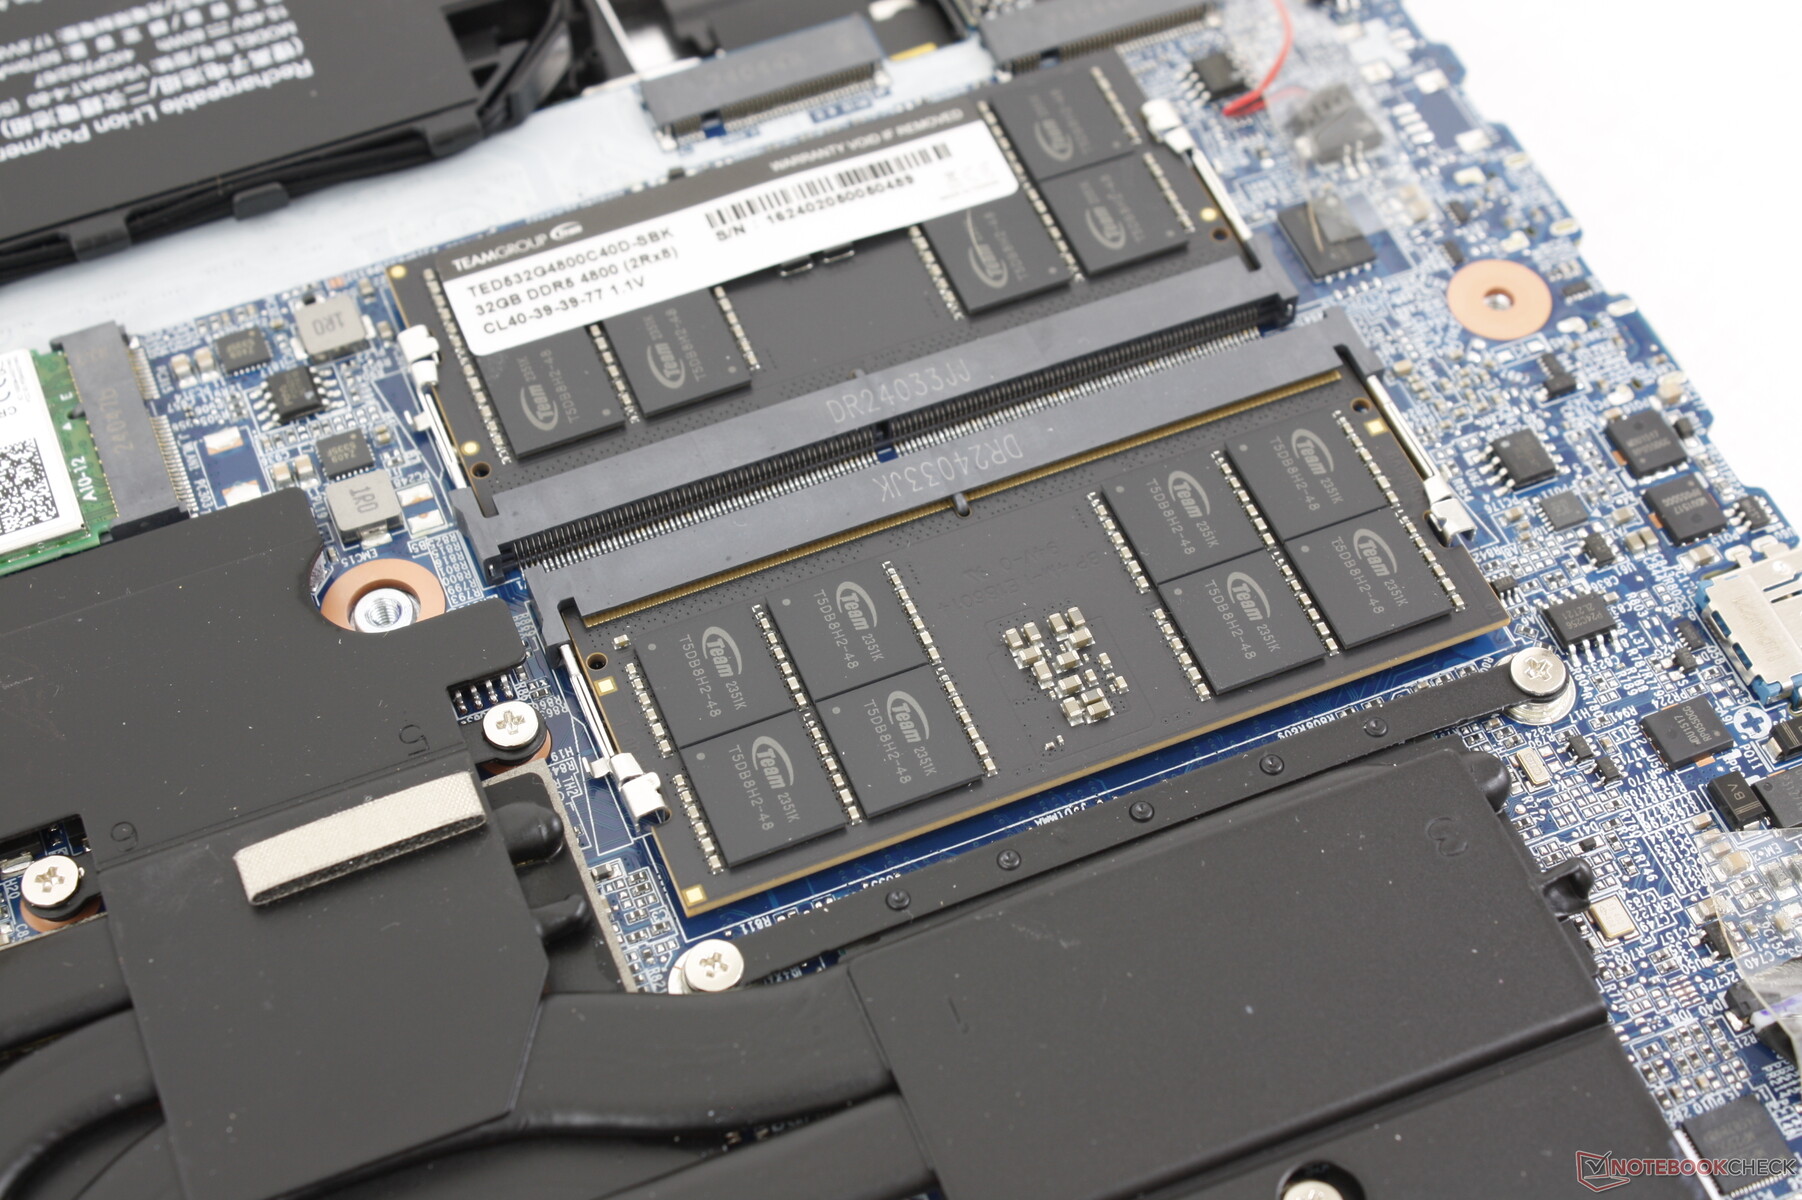
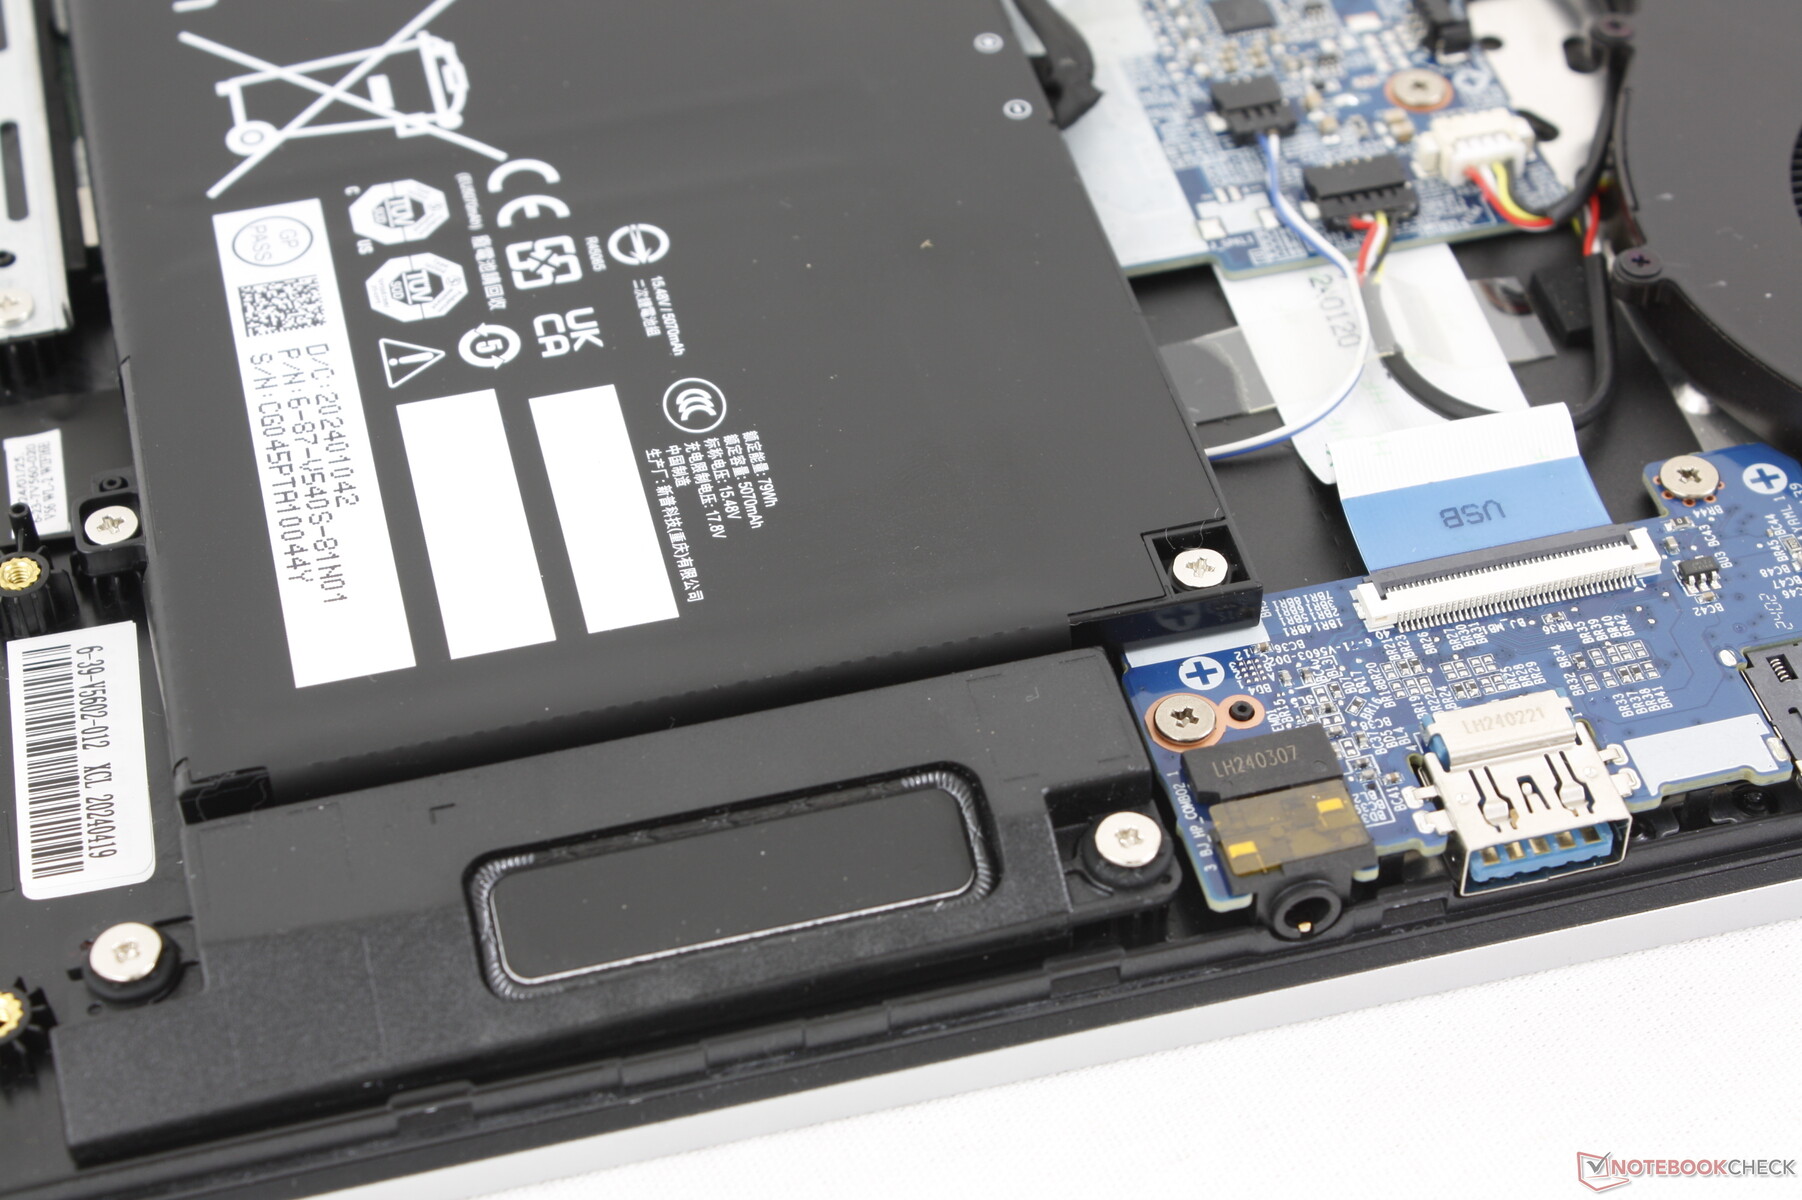
Manutenzione
Il pannello inferiore richiede un po' di pazienza per essere rimosso, poiché è fissato da 13 viti Phillips. Per il resto, si toglie senza troppa resistenza per accedere facilmente ai due alloggiamenti M.2 PCIe4 x4 2280, ai due slot SODIMM, alla batteria e al modulo WLAN rimovibile. Queste opzioni sono paragonabili a quelle di Razer Blade 16, pur essendo migliori di quelle di Alienware x16 R2 che non ha alcuna RAM aggiornabile dall'utente.
Sostenibilità
Maingear pubblicizza l'assenza di materiali riciclati utilizzati per la produzione del portatile.
L'imballaggio è composto da cartone, involucri di plastica e LDPE non riciclabile.
Accessori e garanzia
La confezione non contiene altri extra oltre all'adattatore CA e alla documentazione cartacea. Se acquistato negli Stati Uniti, si applica la consueta garanzia limitata di un anno del produttore.
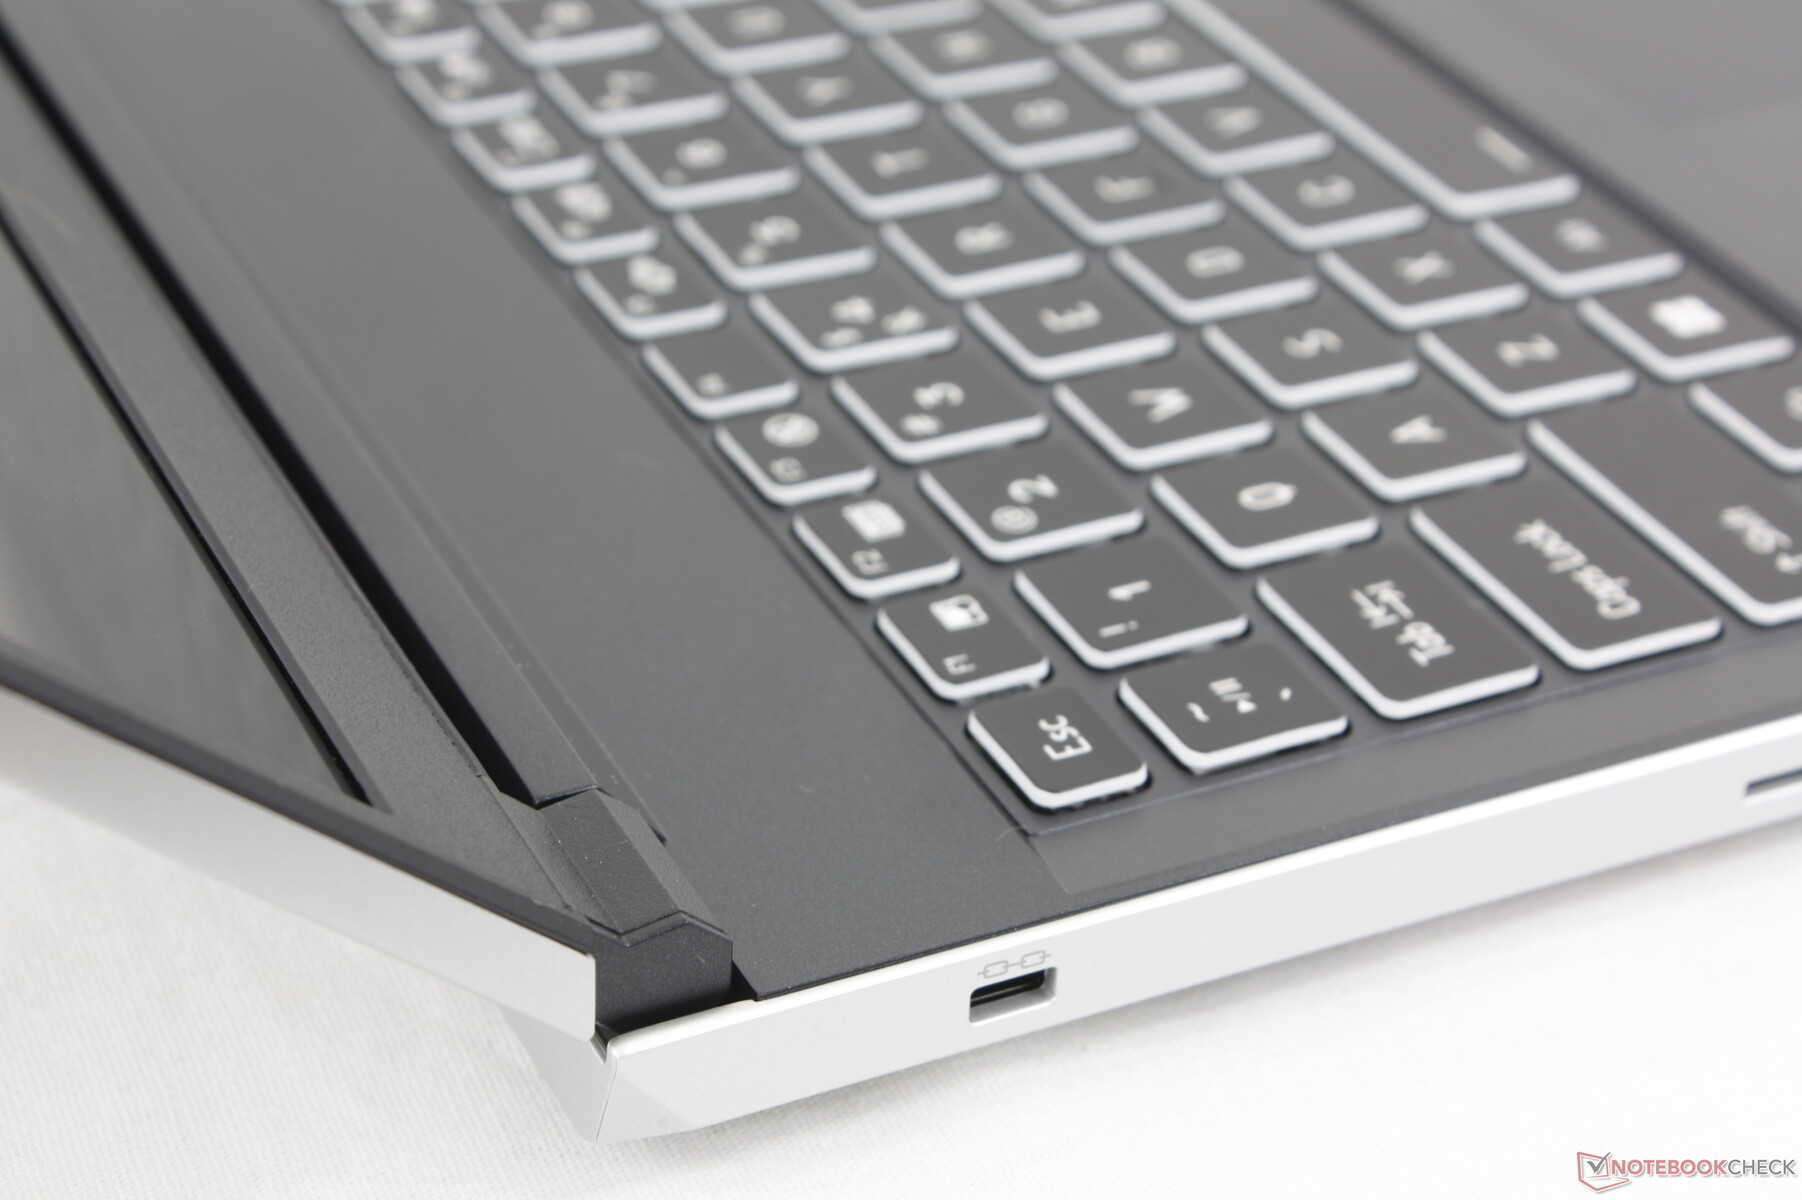
Dispositivi di ingresso
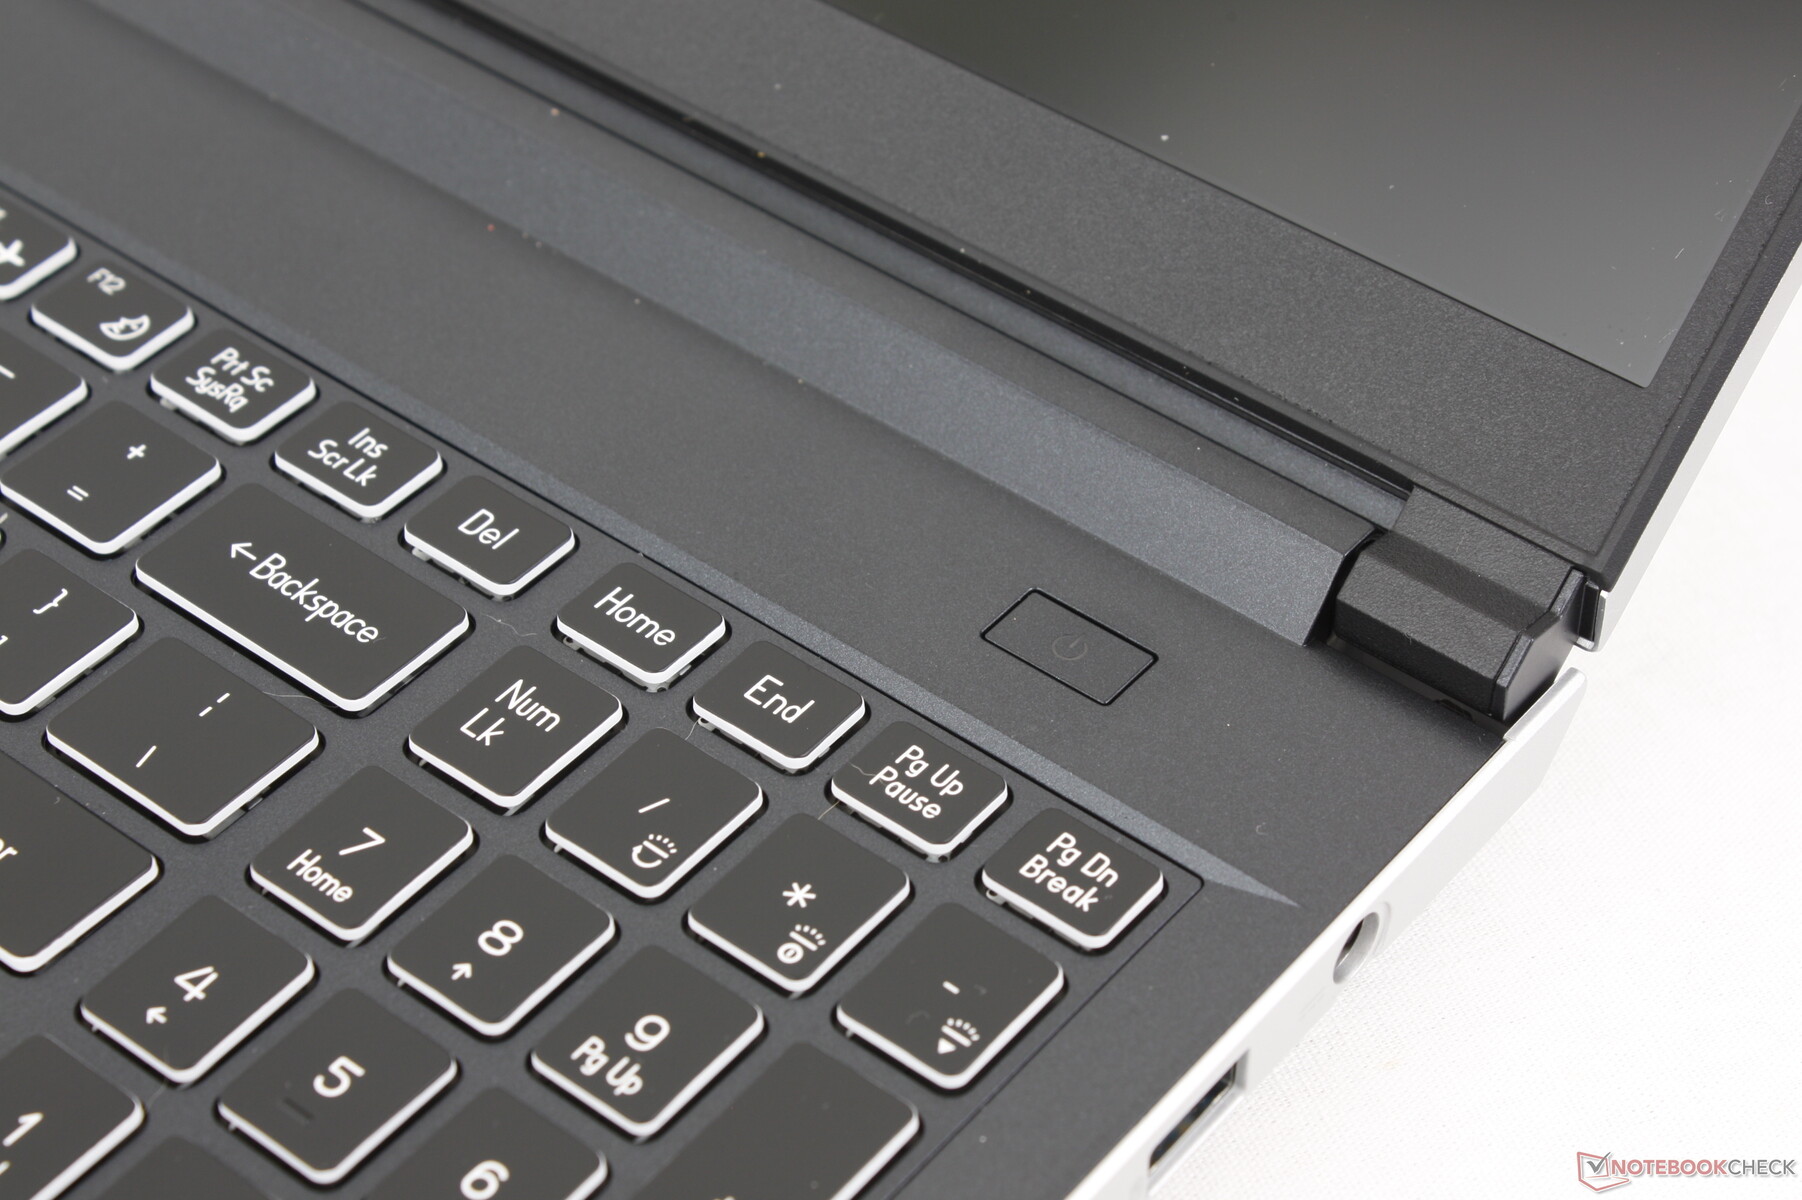
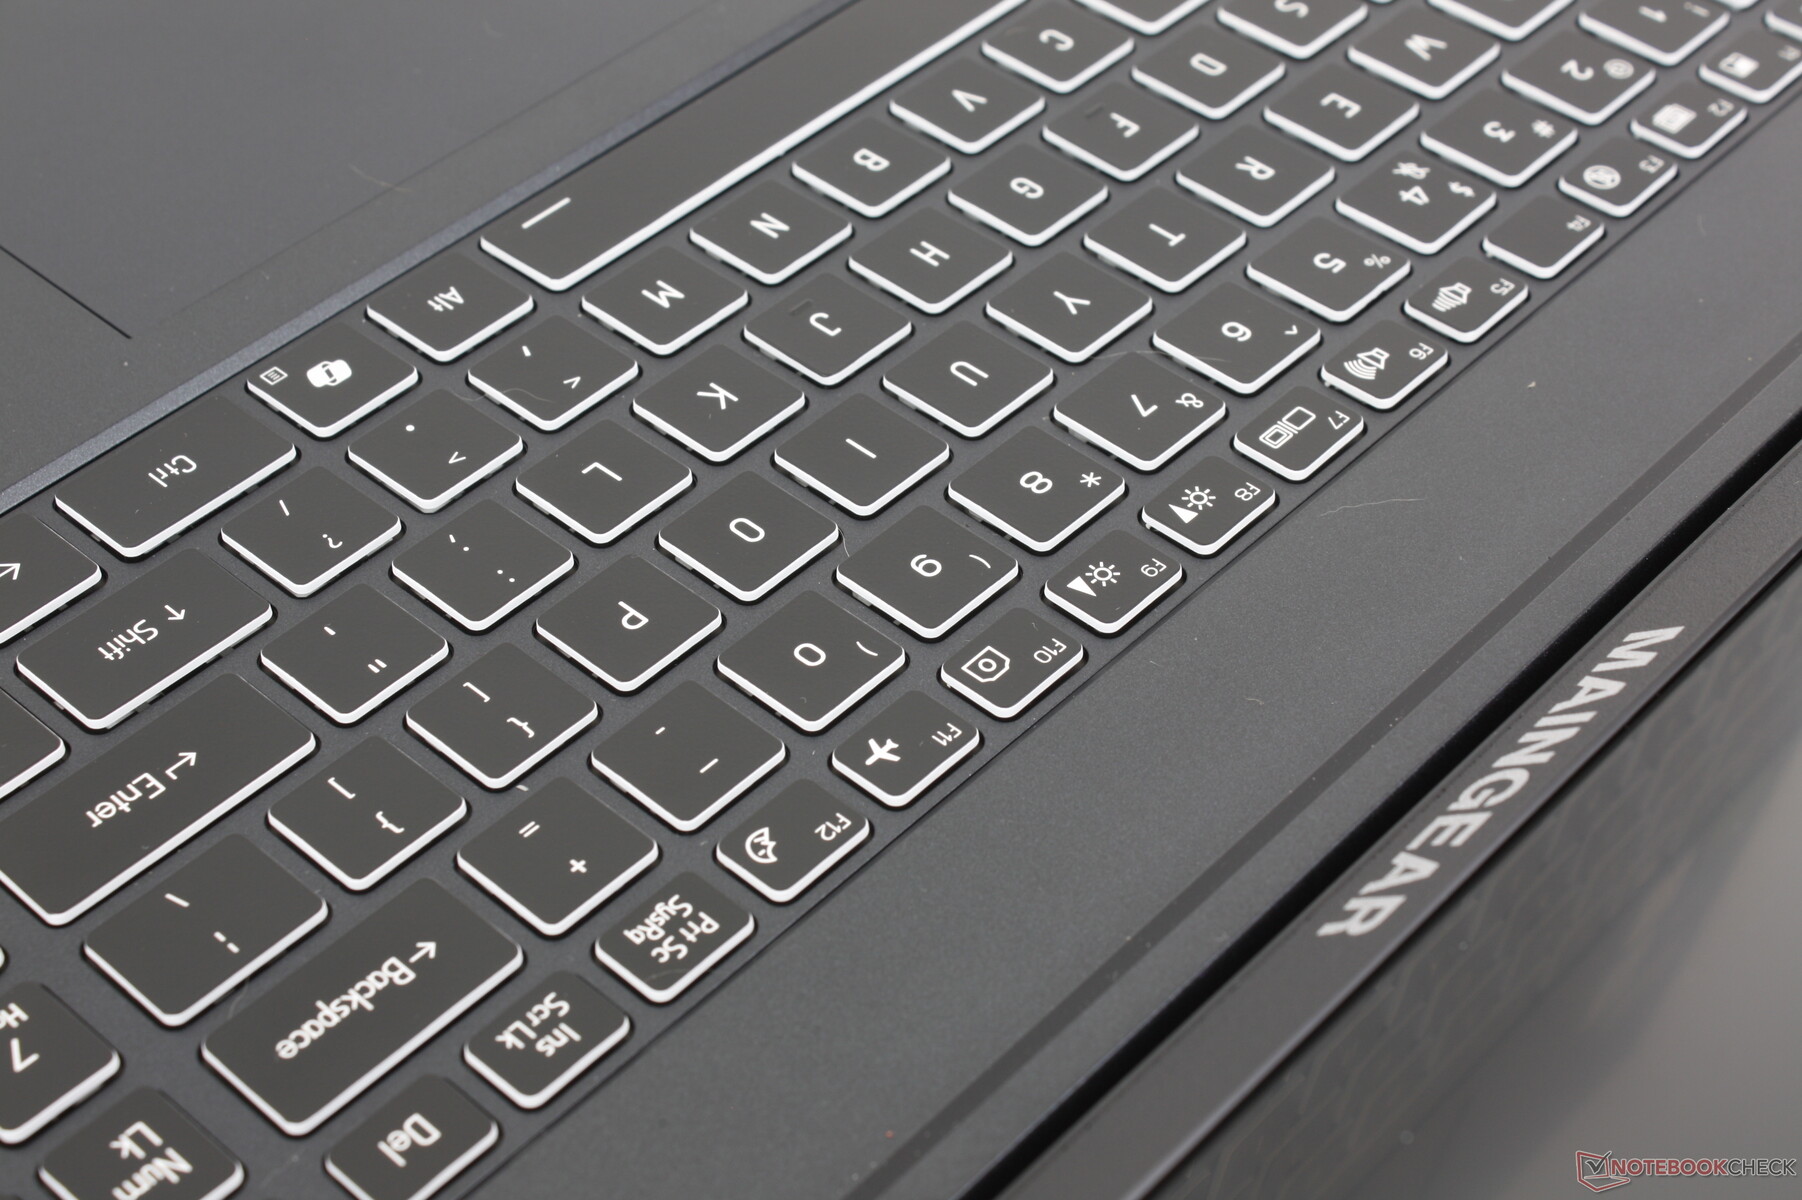
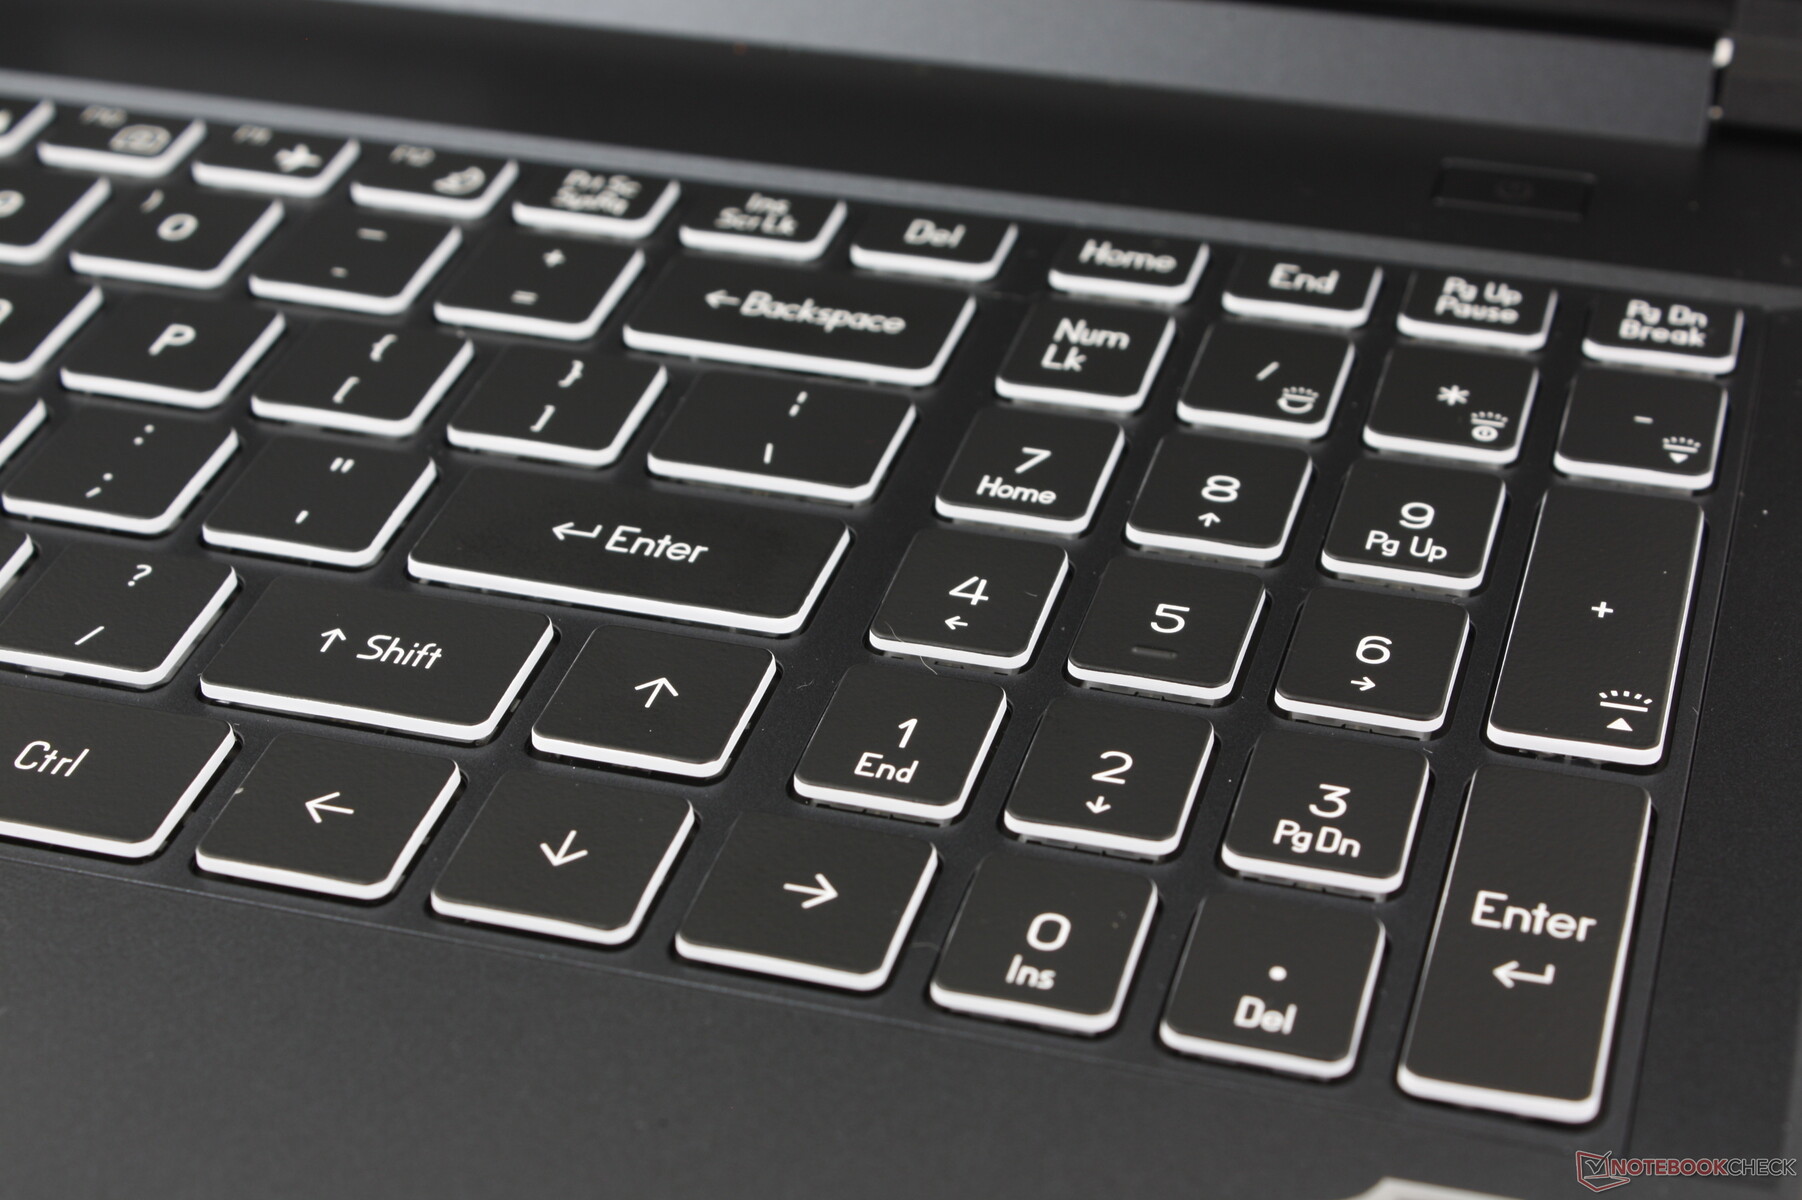
Tastiera
L'esperienza di digitazione è più rumorosa rispetto alla maggior parte degli altri computer portatili, a causa del rumore acuto dei tasti QWERTY principali. Un forte tintinnio di solito significa un feedback più solido e soddisfacente, ma questo non è il caso di ML-16 MK2, poiché la corsa è ancora poco profonda, mentre il feedback morbido non è all'altezza del livello di rumore acuto. Le tastiere di Legion Pro 5 16 o di Victus 16 che risultano più familiari in confronto e a cui è più facile abituarsi.
La retroilluminazione RGB a zona singola è standard, senza opzioni RGB per tasto o quadrupla zona.
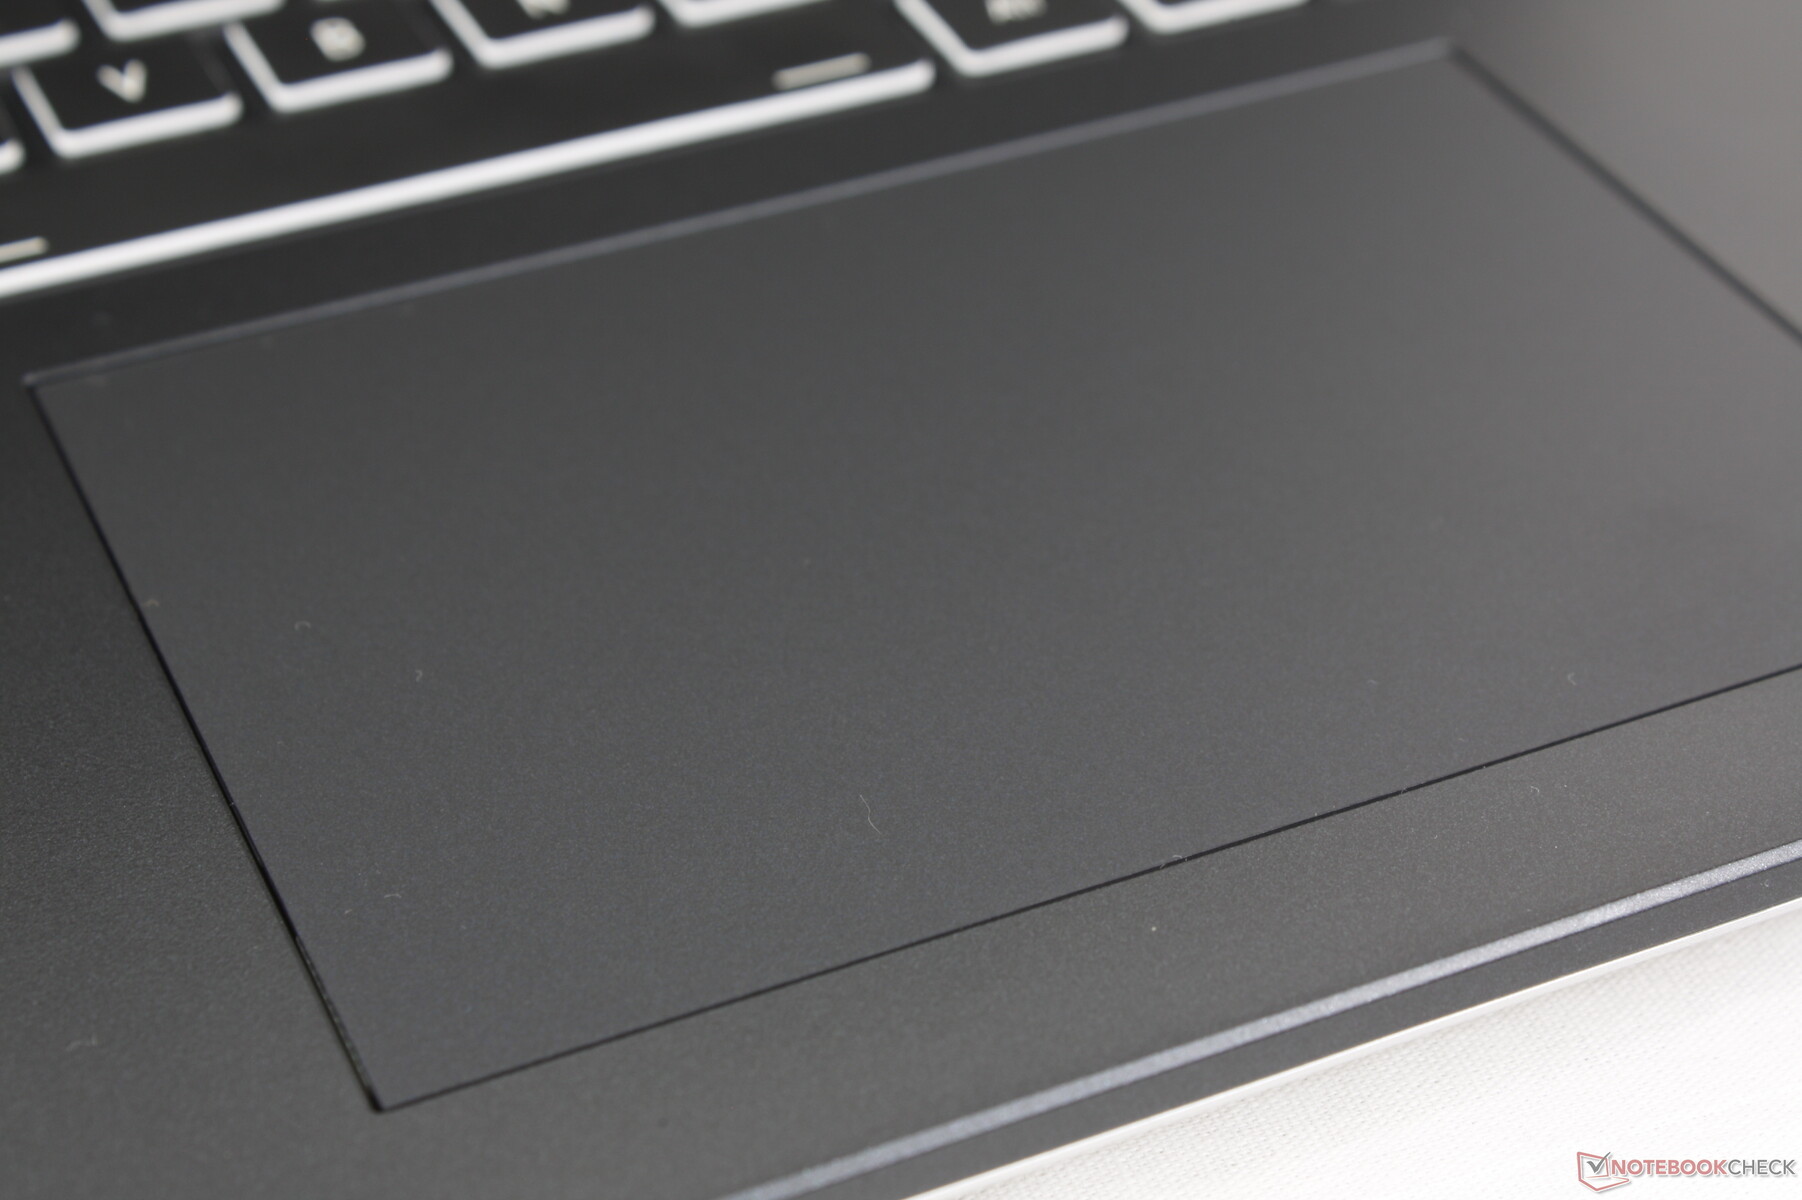
Touchpad
Il clickpad (12,2 x 8,3 cm) è più piccolo di quello del Blade 16 (17 x 9,7 cm) ma più grande di quello di Legion Pro 5 16IRX9 (12 x 7,5 cm). È spazioso, con un feedback solido e cliccabile quando viene premuto. Lo scorrimento, tuttavia, è quasi troppo fluido, soprattutto alle velocità più basse, il che rende più difficili i clic di precisione o le azioni di trascinamento. In confronto, il dito tende ad aderire quando si muove a velocità più basse sulla maggior parte degli altri computer portatili per aiutare la precisione.


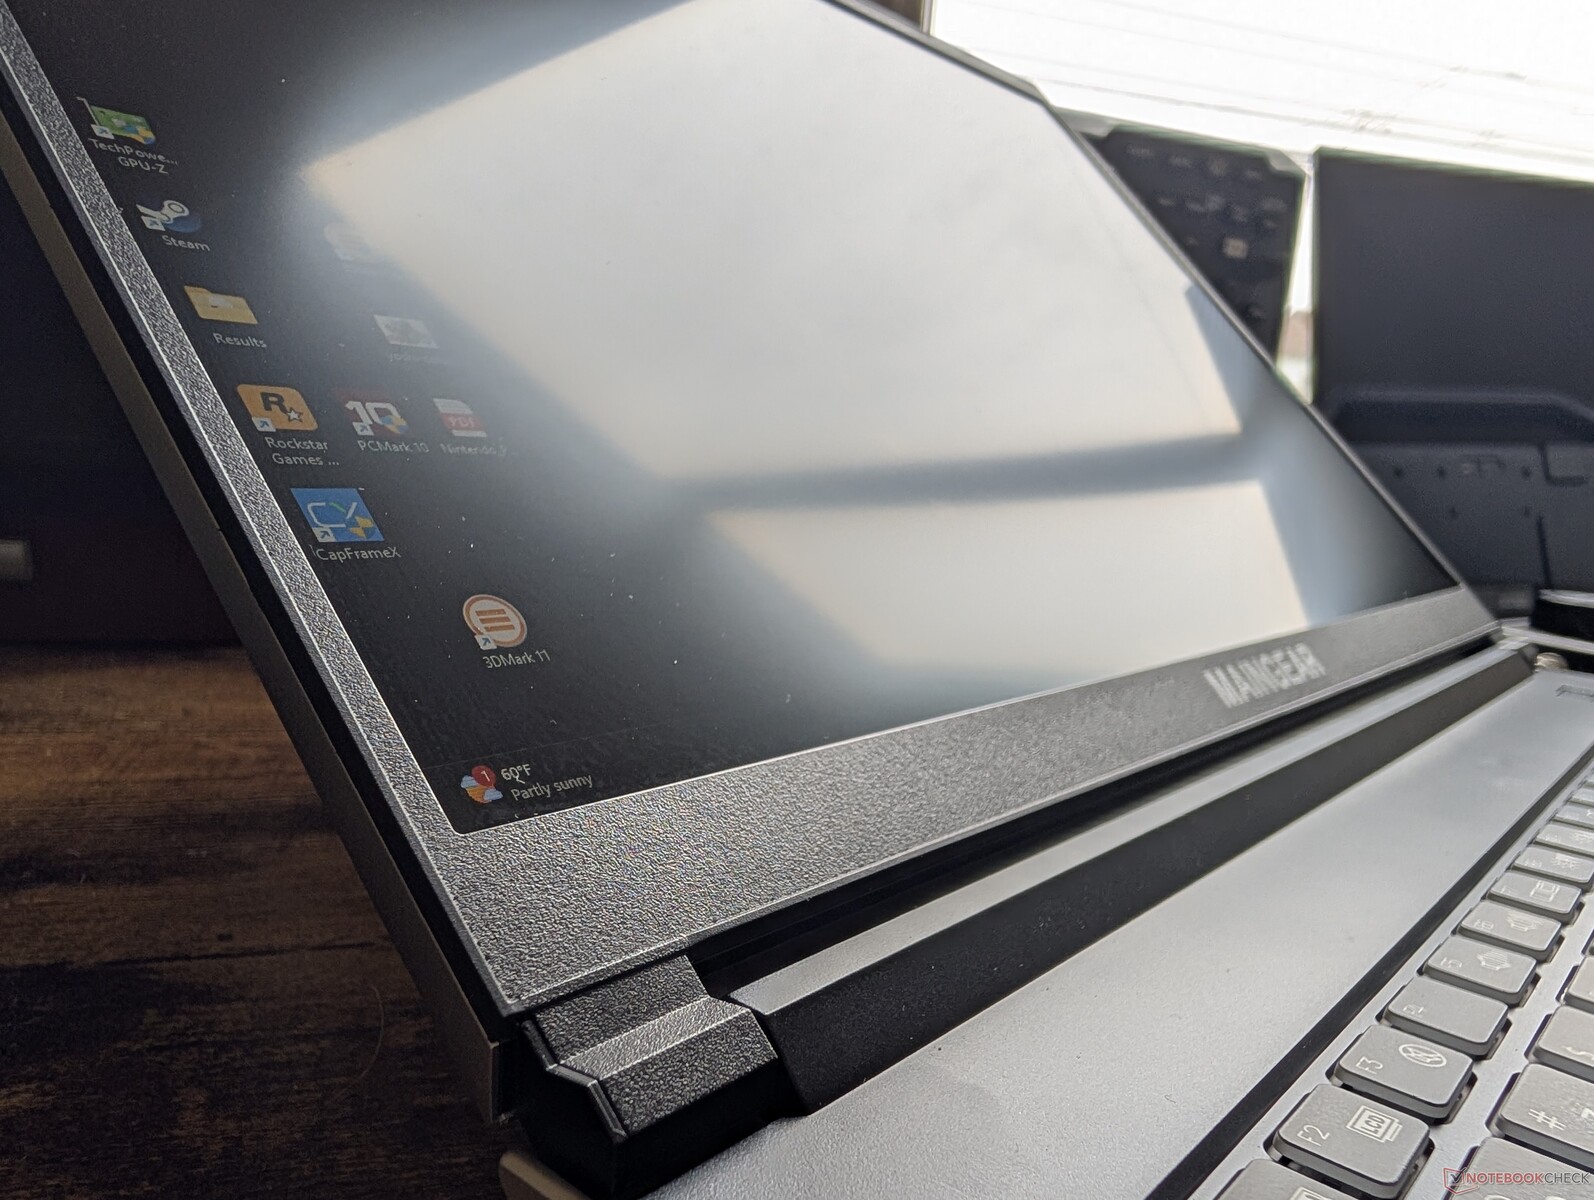
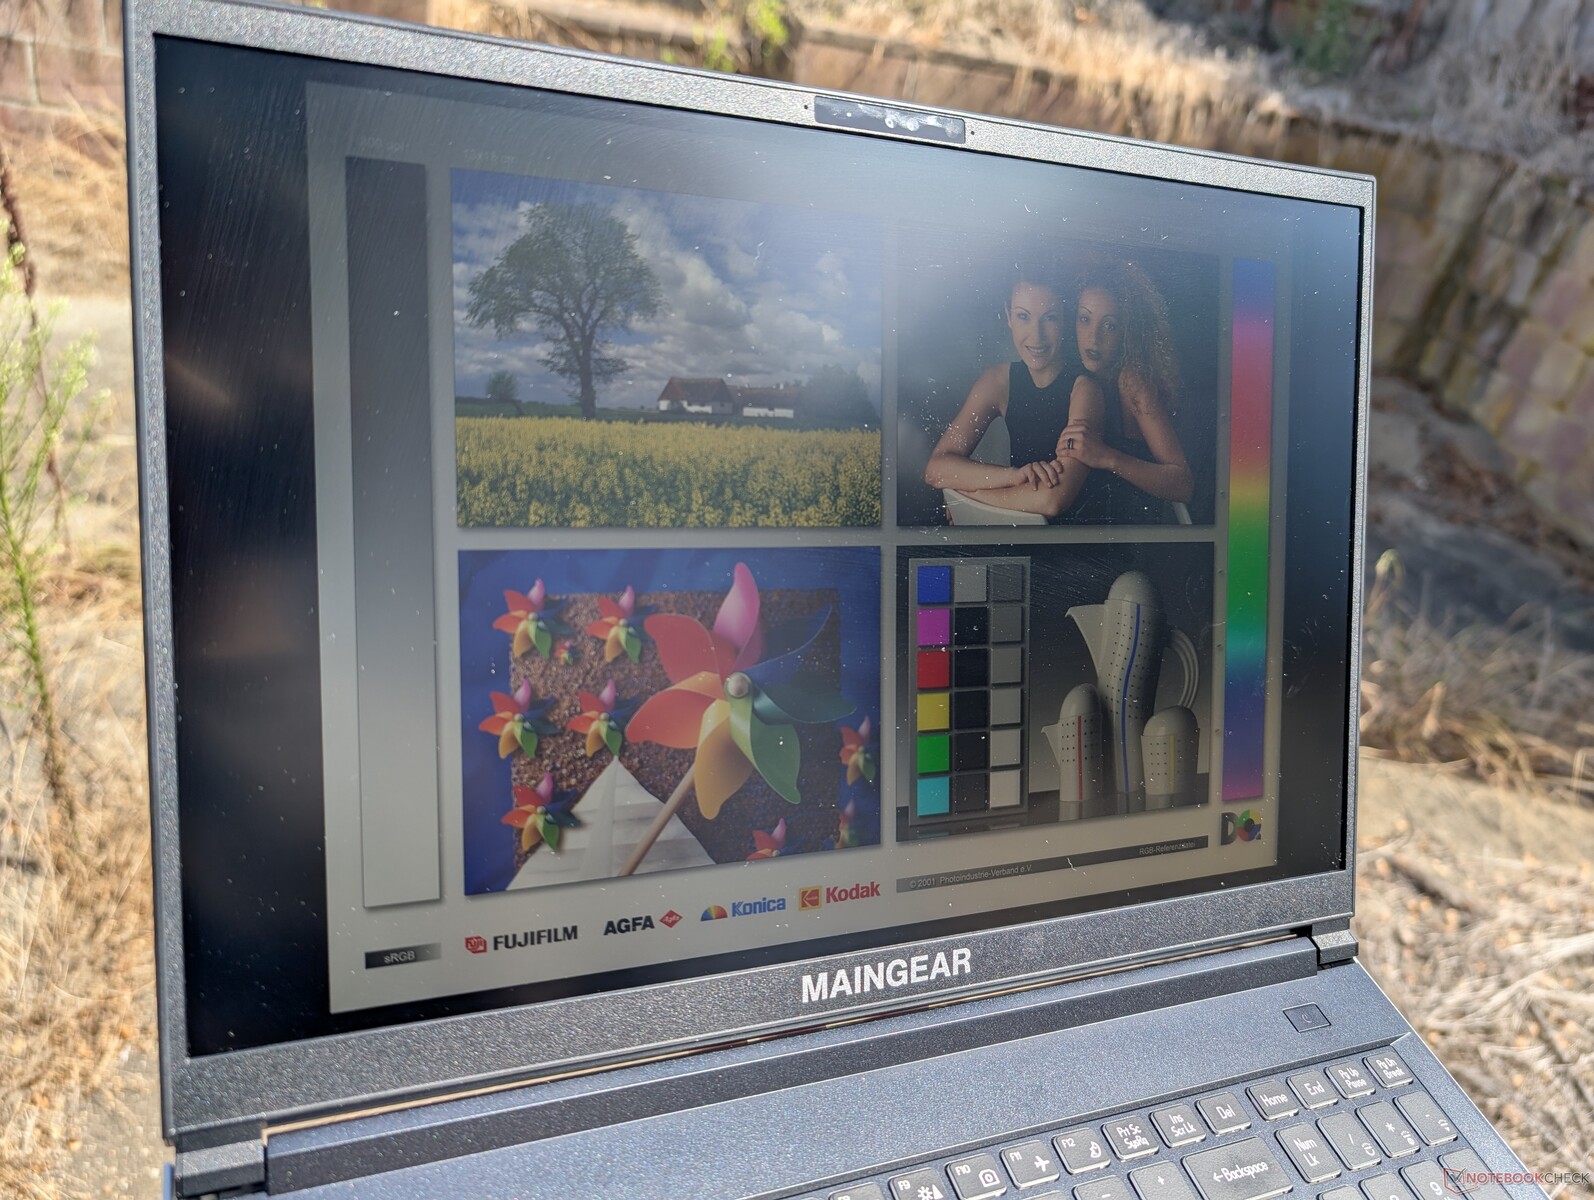
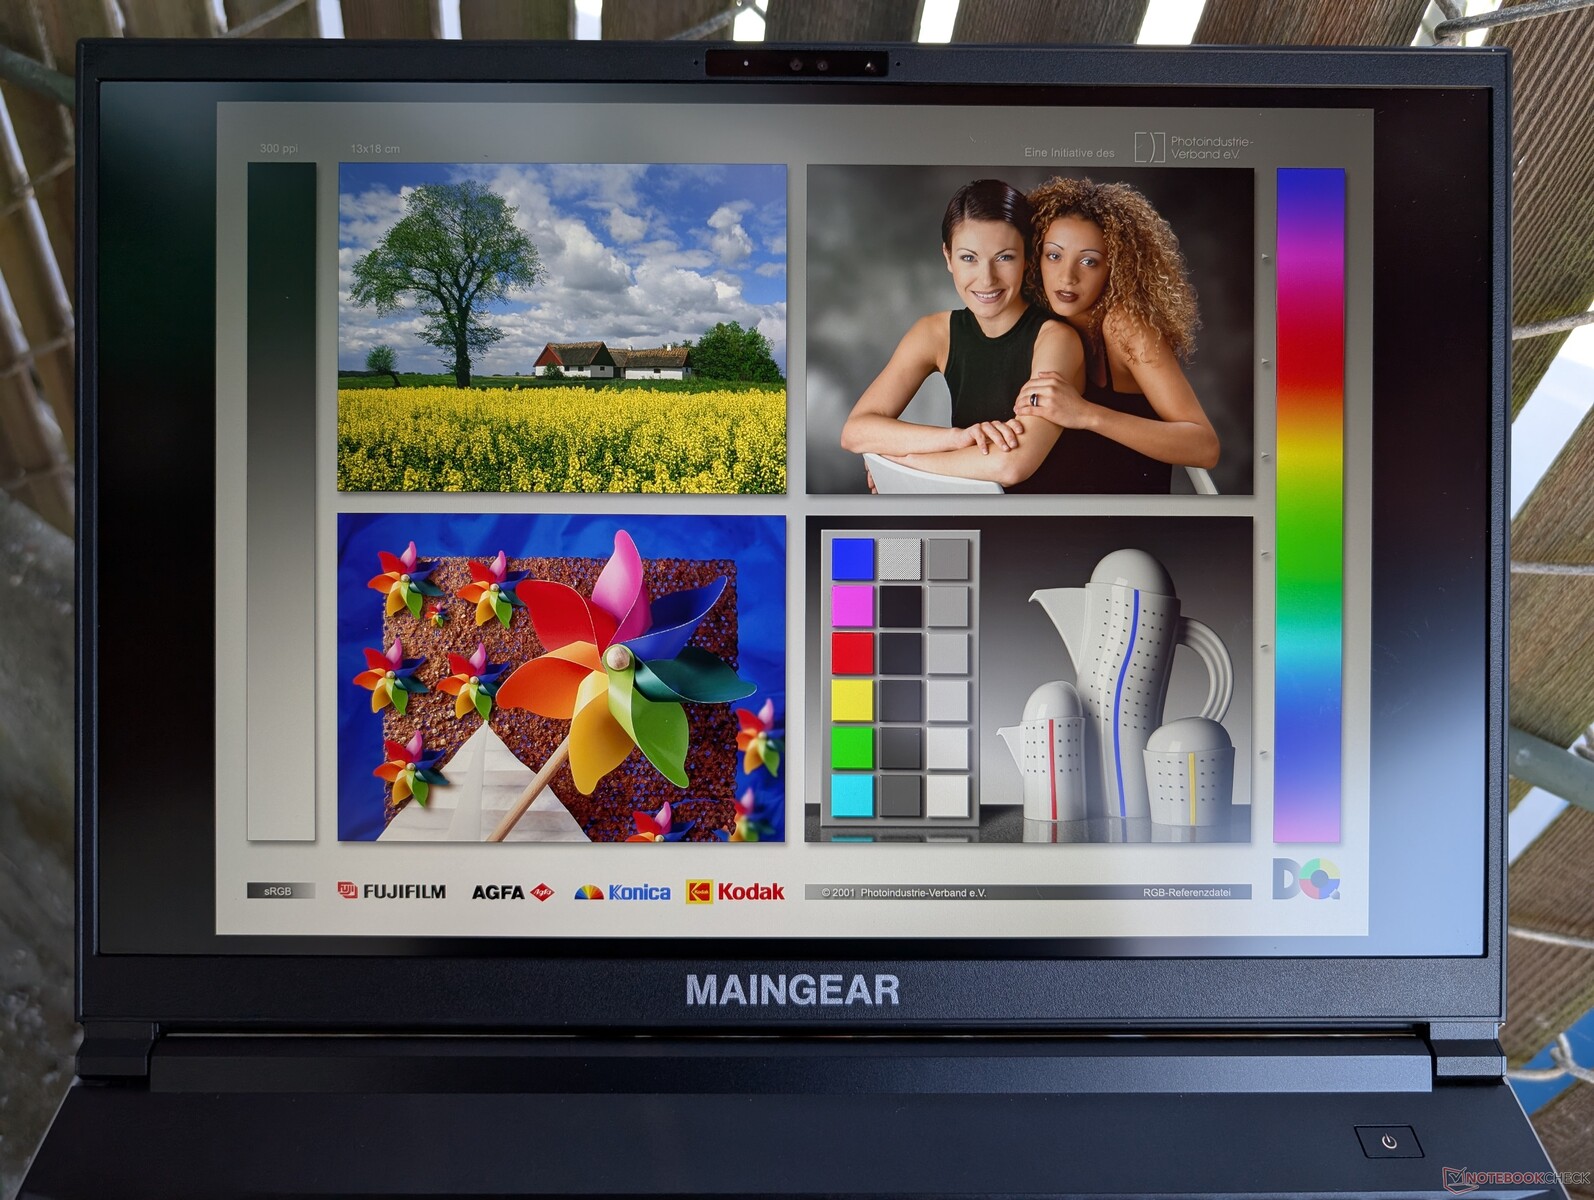
Display - IPS da gioco
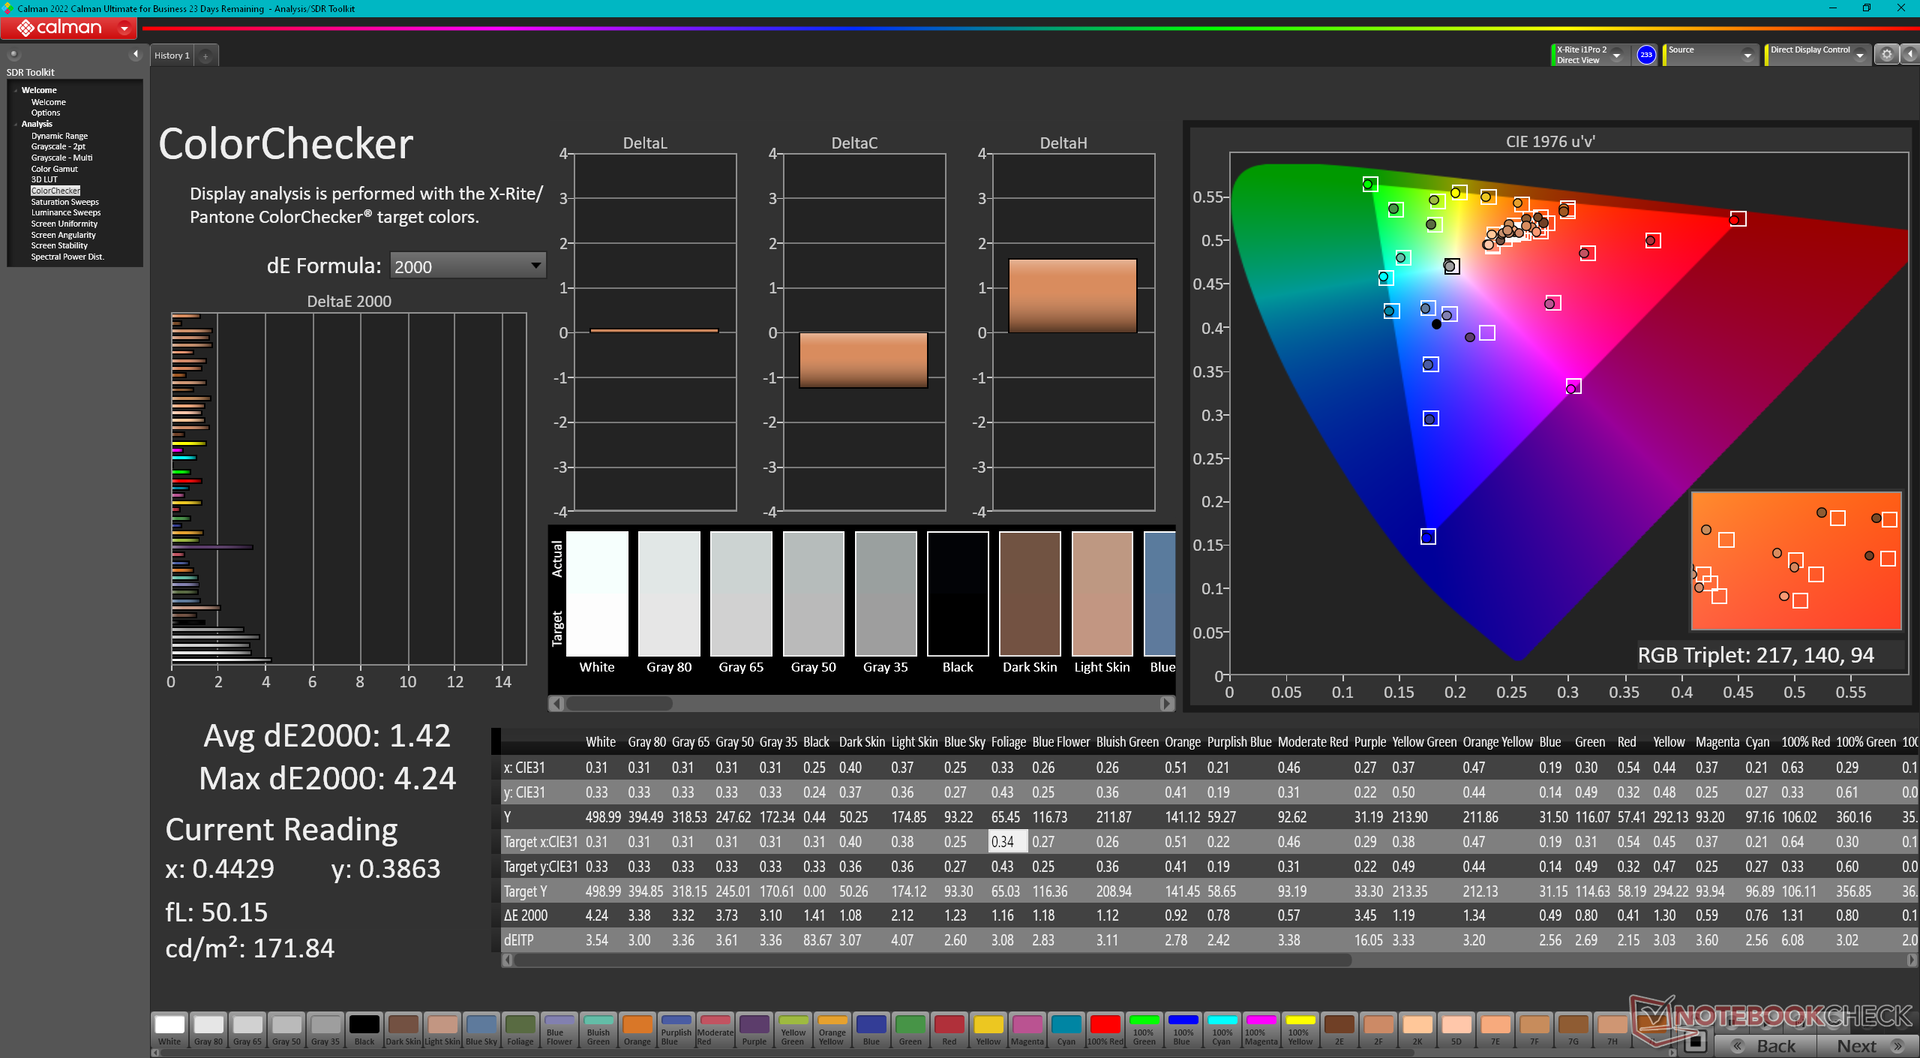
ML-16 MK2 è il primo modello del nostro database ad essere fornito con il pannello IPS TL160ADMP11-0 da 240 Hz. È paragonabile al pannello BOE B160QAN dell'Alienware x16 R2 in termini di frequenza di aggiornamento, rapporto di contrasto e risoluzione, ma non riesce ad eguagliare il display Dell per quanto riguarda la riproduzione dei colori o i tempi di risposta. Di conseguenza, il display ML-16 MK2 può essere considerato di fascia media, ma è comunque molto adatto per i giochi e per la maggior parte dell'editing grafico amatoriale.
Le funzioni più avanzate come G-Sync o HDR non sono supportate.


| |||||||||||||||||||||||||
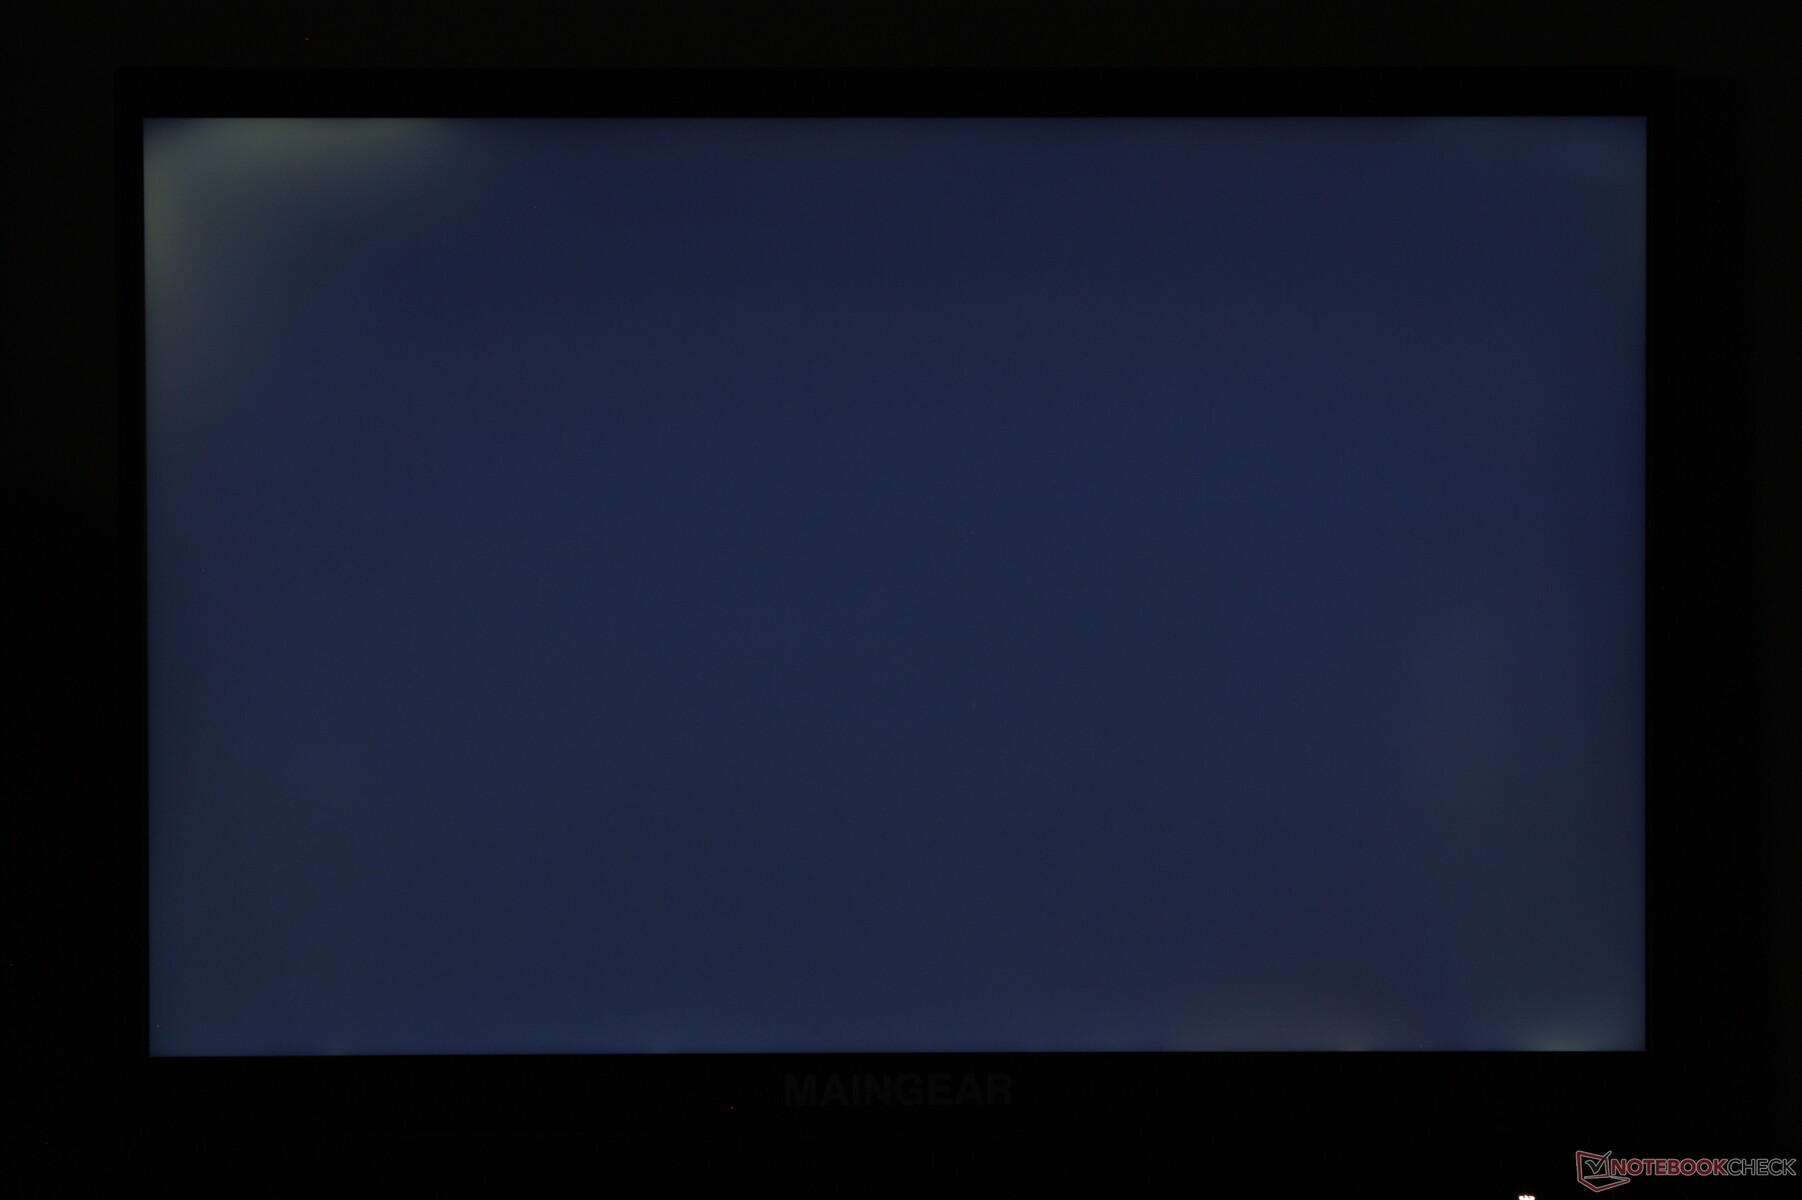
Distribuzione della luminosità: 90 %
Al centro con la batteria: 518.2 cd/m²
Contrasto: 1296:1 (Nero: 0.4 cd/m²)
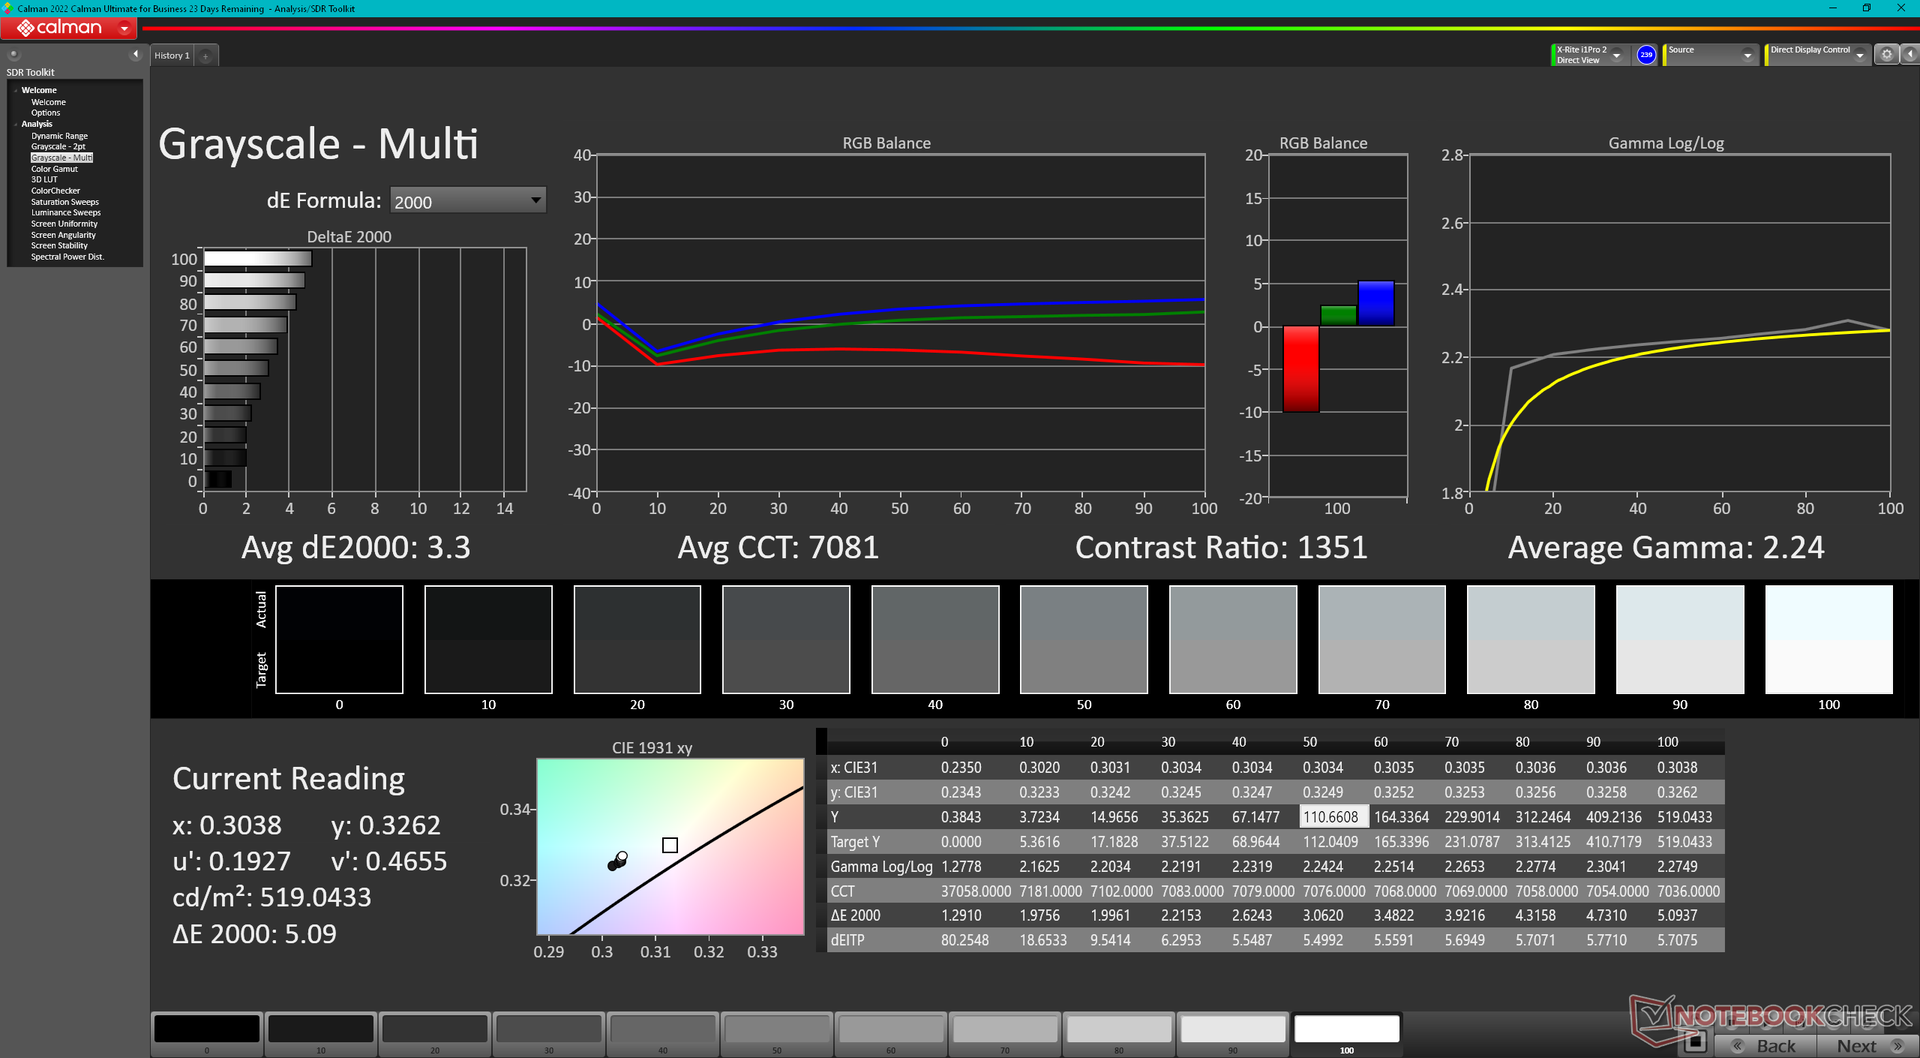
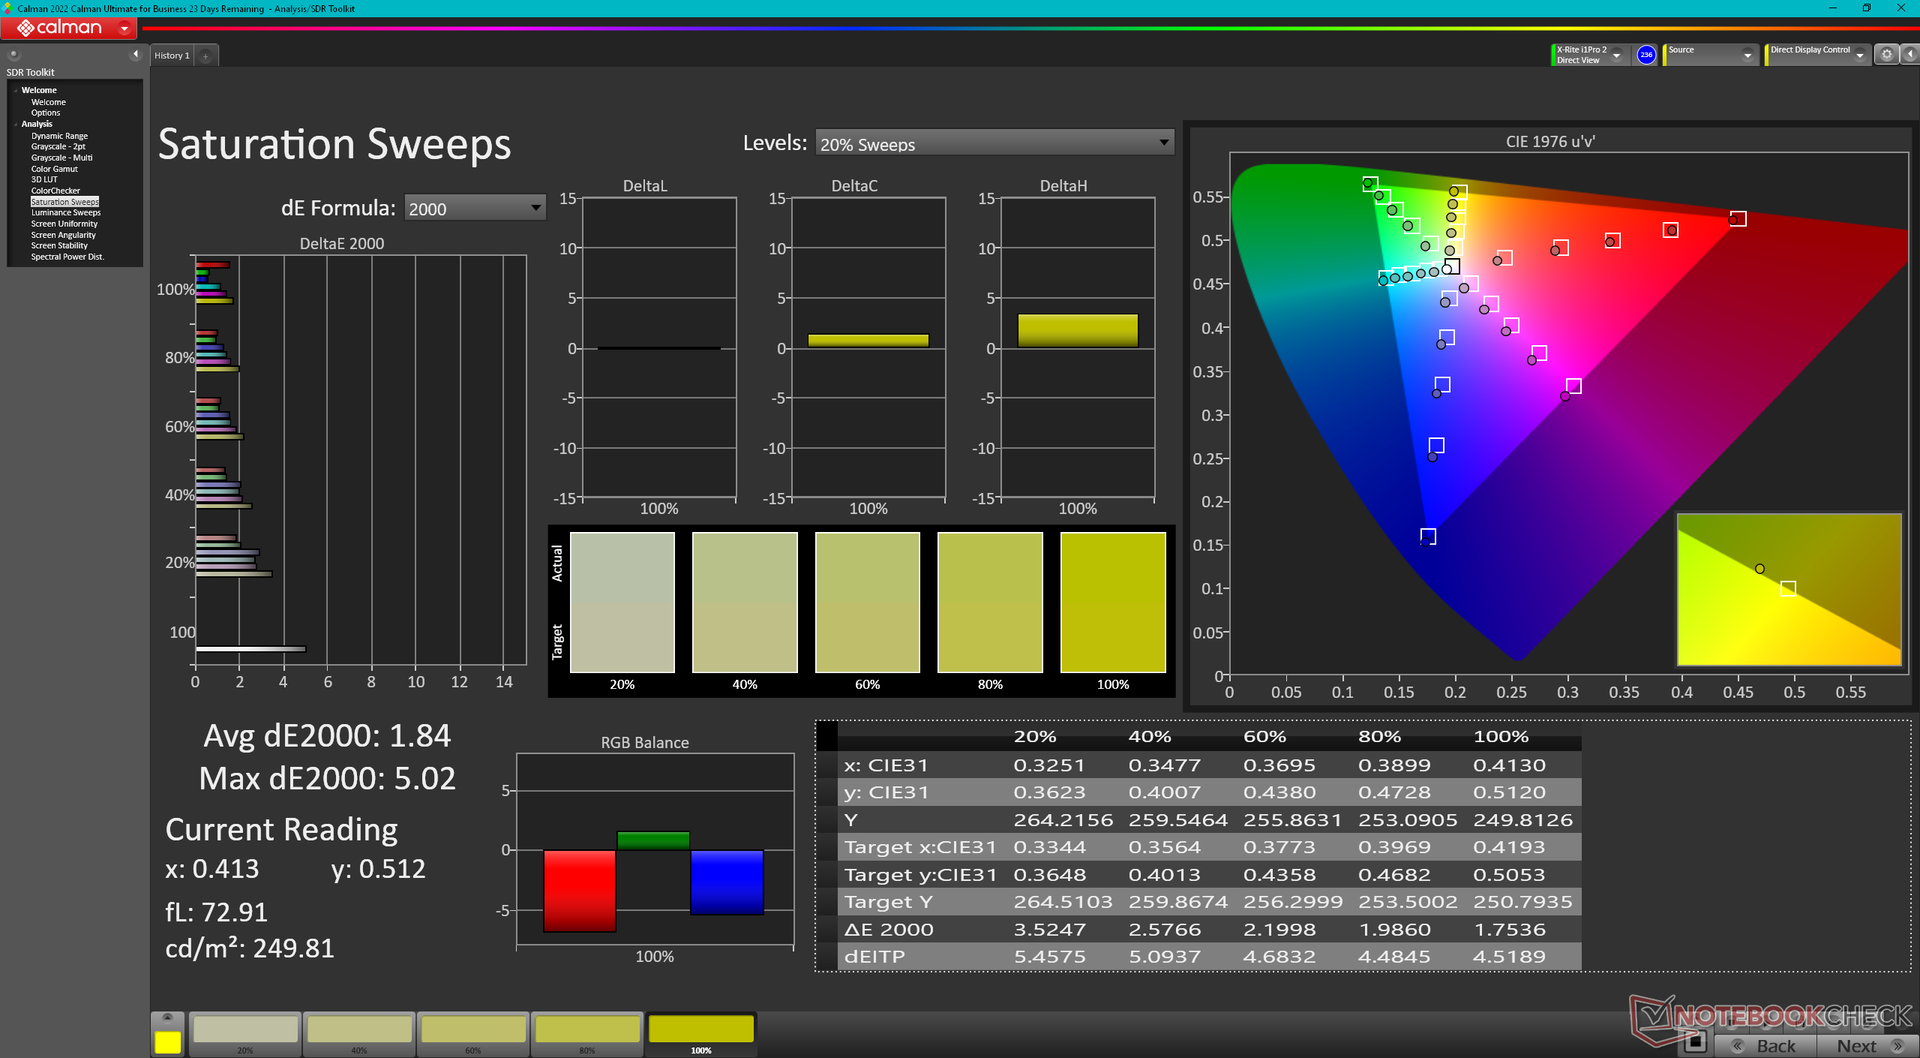
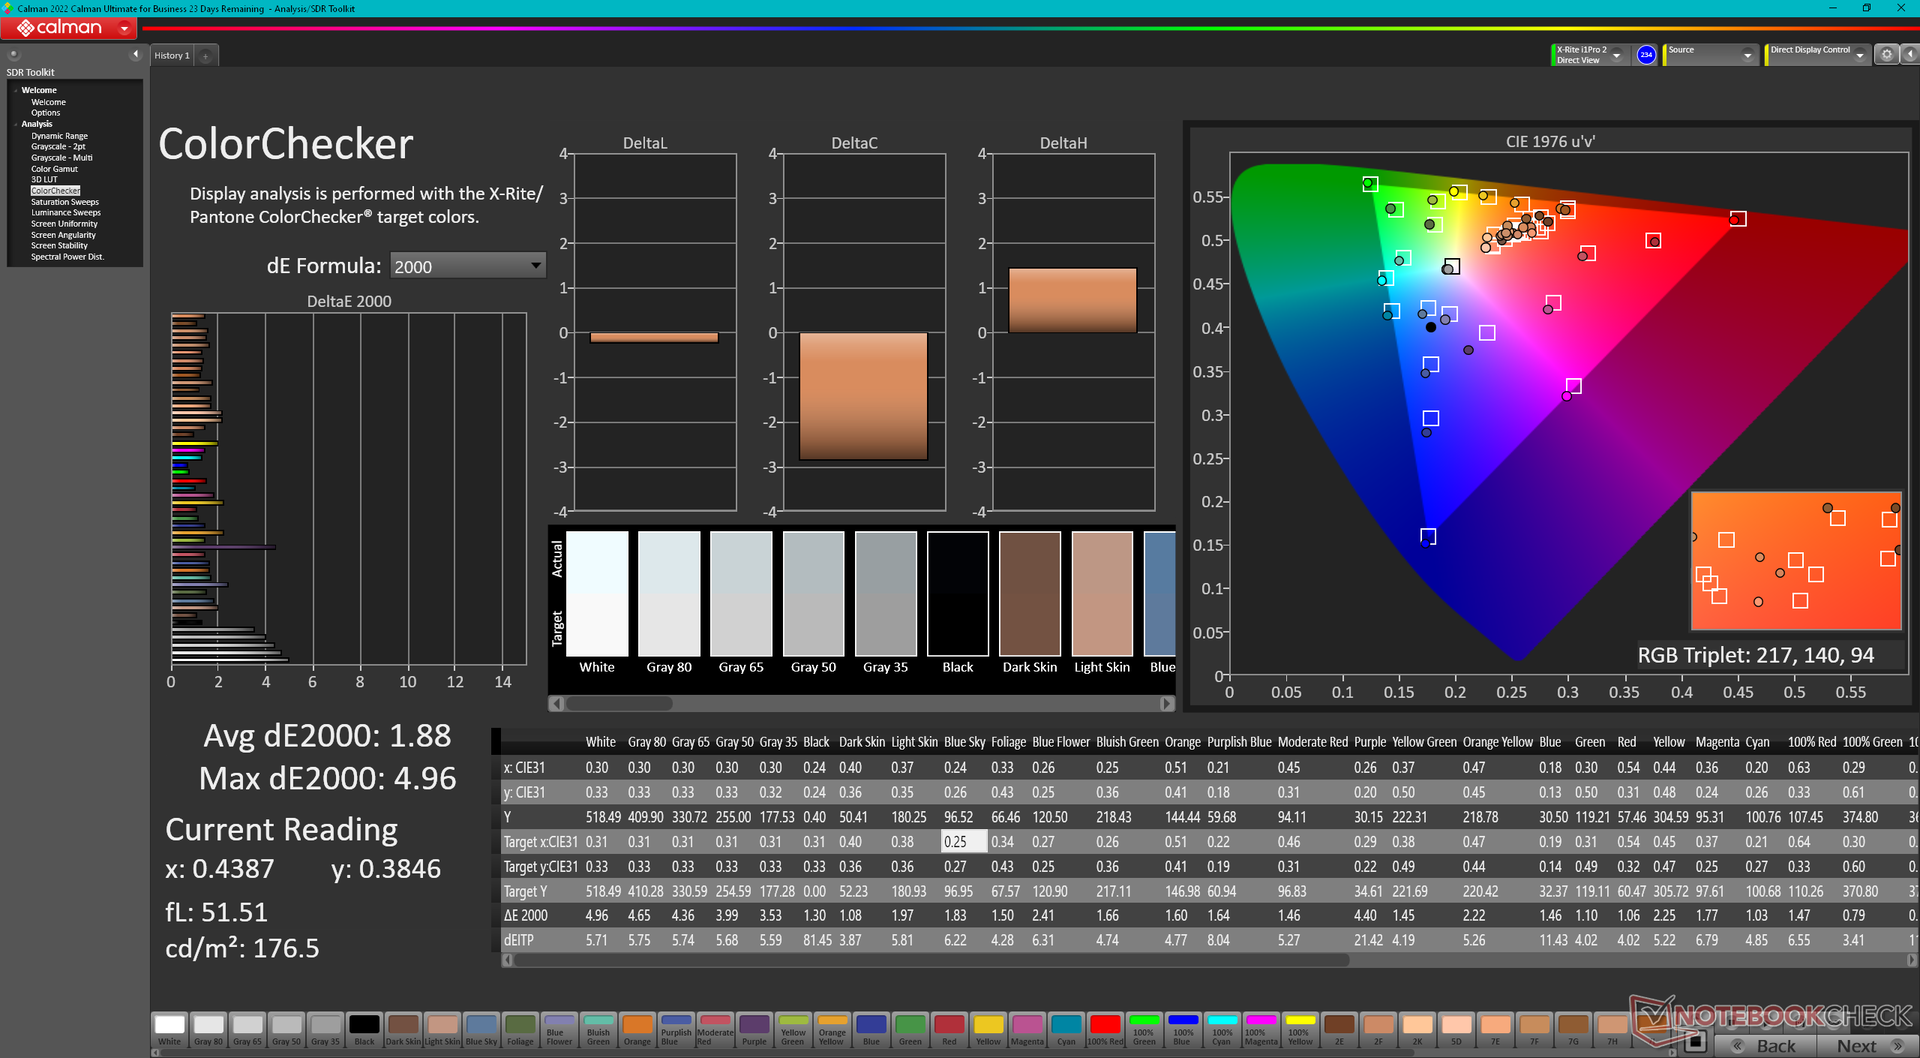
ΔE Color 1.88 | 0.5-29.43 Ø4.9, calibrated: 1.42
ΔE Greyscale 3.3 | 0.5-98 Ø5.2
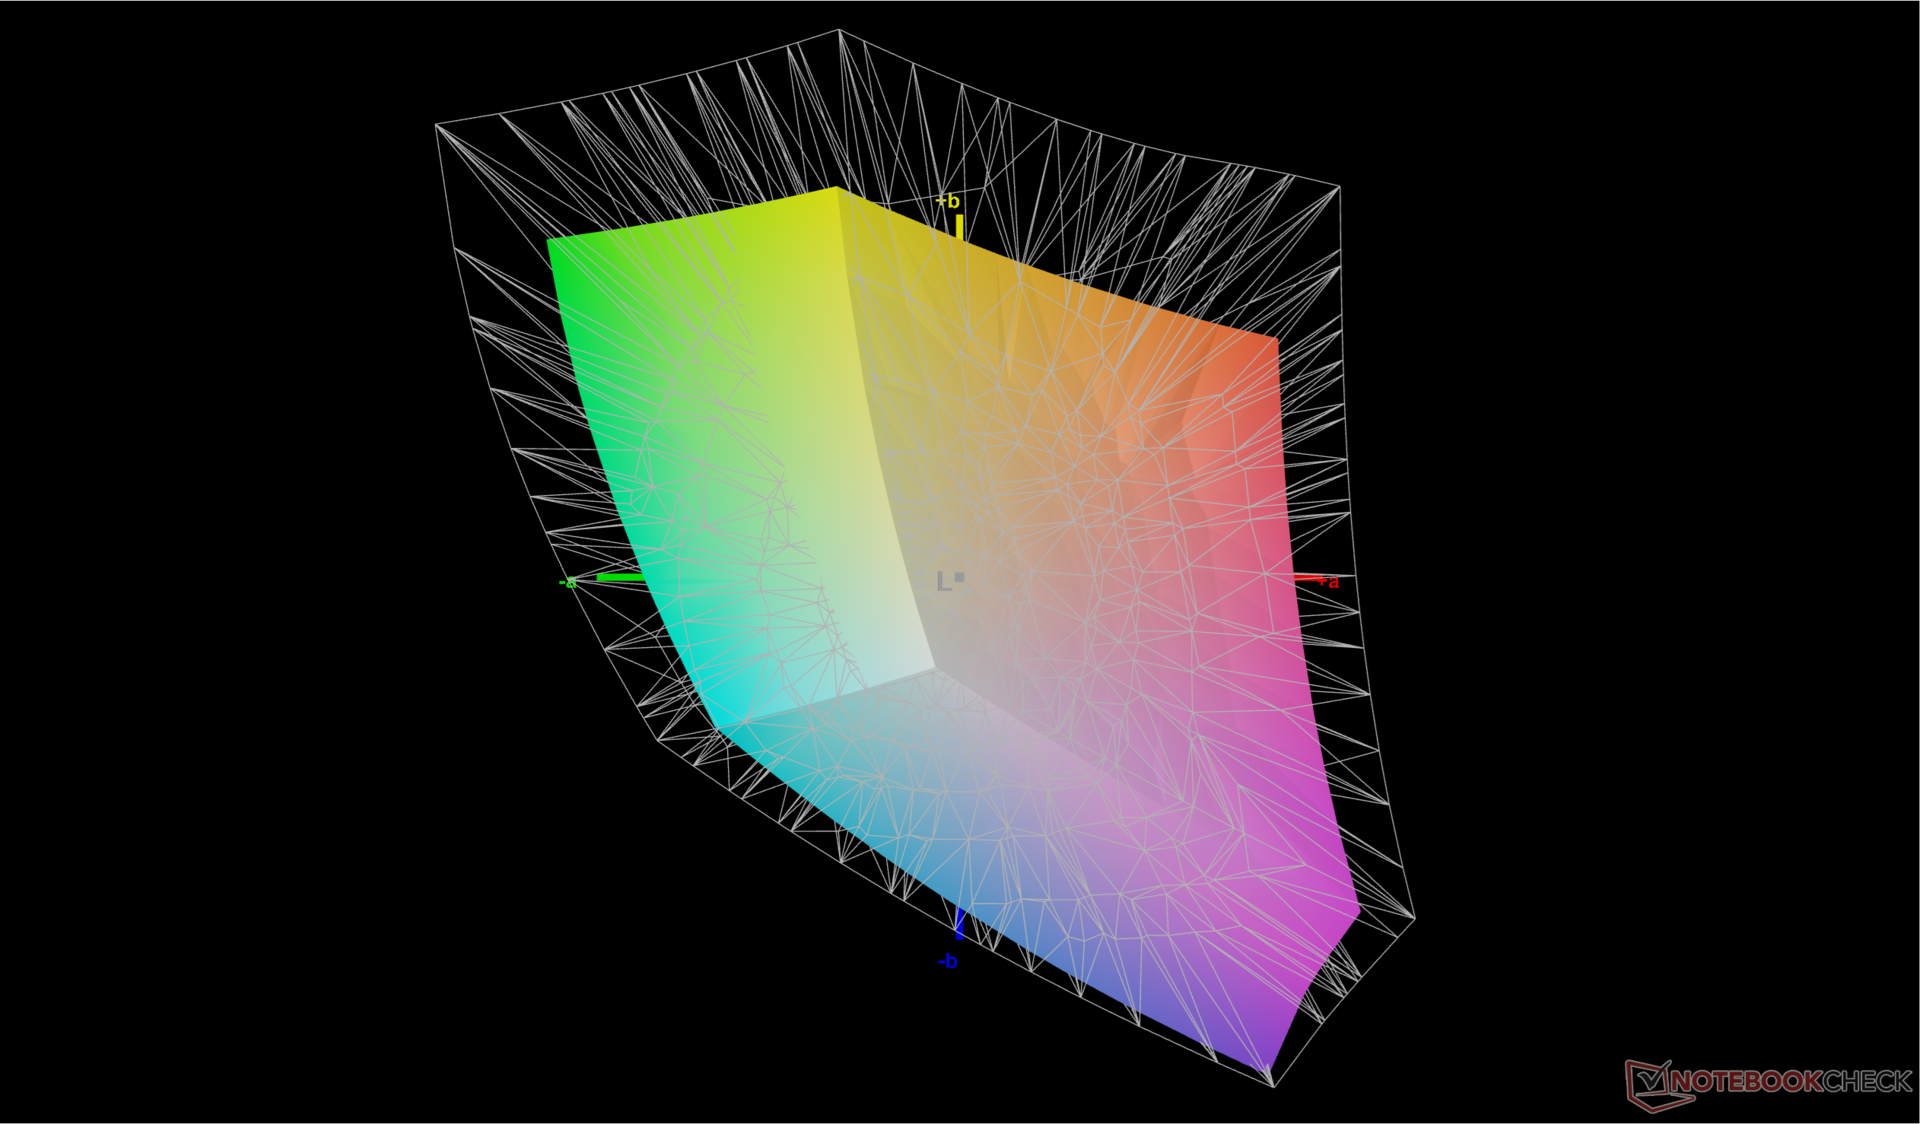
69.2% AdobeRGB 1998 (Argyll 2.2.0 3D)
98.2% sRGB (Argyll 2.2.0 3D)
67.3% Display P3 (Argyll 2.2.0 3D)
Gamma: 2.24
| Maingear ML-16 MK2 TL160ADMP11-0, IPS, 2560x1600, 16", 240 Hz | Asus ROG Zephyrus G16 GA605WV ATNA60DL04-0, OLED, 2560x1600, 16", 240 Hz | HP Victus 16 (2024) Chi Mei CMN163E, IPS, 1920x1080, 16.1", 144 Hz | Alienware x16 R2 P120F BOE B160QAN, IPS, 2560x1600, 16", 240 Hz | Lenovo Legion Pro 5 16IRX9 BOE NE160QDM-NYC, IPS, 2560x1600, 16", 165 Hz | Razer Blade 16 2024, RTX 4090 Samsung SDC41AB (ATNA60DL03-0), OLED, 2560x1600, 16", 240 Hz | |
|---|---|---|---|---|---|---|
| Display | 30% | -38% | 25% | 2% | 29% | |
| Display P3 Coverage | 67.3 | 99.9 48% | 41.3 -39% | 98.3 46% | 69.3 3% | 99.1 47% |
| sRGB Coverage | 98.2 | 100 2% | 61.7 -37% | 100 2% | 99.4 1% | 99.9 2% |
| AdobeRGB 1998 Coverage | 69.2 | 96.9 40% | 42.7 -38% | 88.8 28% | 70.1 1% | 95.6 38% |
| Response Times | 98% | -117% | 42% | 4% | 97% | |
| Response Time Grey 50% / Grey 80% * | 12.5 ? | 0.22 ? 98% | 28.6 ? -129% | 3.9 ? 69% | 11.9 ? 5% | 0.24 ? 98% |
| Response Time Black / White * | 9.1 ? | 0.25 ? 97% | 18.7 ? -105% | 7.8 ? 14% | 8.9 ? 2% | 0.4 ? 96% |
| PWM Frequency | 960 | 960 | ||||
| Screen | 11% | -79% | -3% | 14% | 193% | |
| Brightness middle | 518.2 | 416 -20% | 287 -45% | 348.4 -33% | 384 -26% | 418 -19% |
| Brightness | 487 | 418 -14% | 288 -41% | 340 -30% | 366 -25% | 420 -14% |
| Brightness Distribution | 90 | 96 7% | 86 -4% | 90 0% | 91 1% | 98 9% |
| Black Level * | 0.4 | 0.19 52% | 0.33 17% | 0.35 12% | 0.02 95% | |
| Contrast | 1296 | 1511 17% | 1056 -19% | 1097 -15% | 20900 1513% | |
| Colorchecker dE 2000 * | 1.88 | 1.6 15% | 5.46 -190% | 2.68 -43% | 0.97 48% | 1.07 43% |
| Colorchecker dE 2000 max. * | 4.96 | 2.1 58% | 20.36 -310% | 4.14 17% | 3.57 28% | 4.04 19% |
| Colorchecker dE 2000 calibrated * | 1.42 | 3.52 -148% | 0.42 70% | 0.77 46% | 1.07 25% | |
| Greyscale dE 2000 * | 3.3 | 2.7 18% | 4.8 -45% | 3.4 -3% | 1.5 55% | 1.12 66% |
| Gamma | 2.24 98% | 2.16 102% | 2.108 104% | 2.41 91% | 2.24 98% | 2.29 96% |
| CCT | 7081 92% | 6331 103% | 6442 101% | 6083 107% | 6709 97% | 6417 101% |
| Media totale (Programma / Settaggio) | 46% /
32% | -78% /
-76% | 21% /
10% | 7% /
10% | 106% /
144% |
* ... Meglio usare valori piccoli
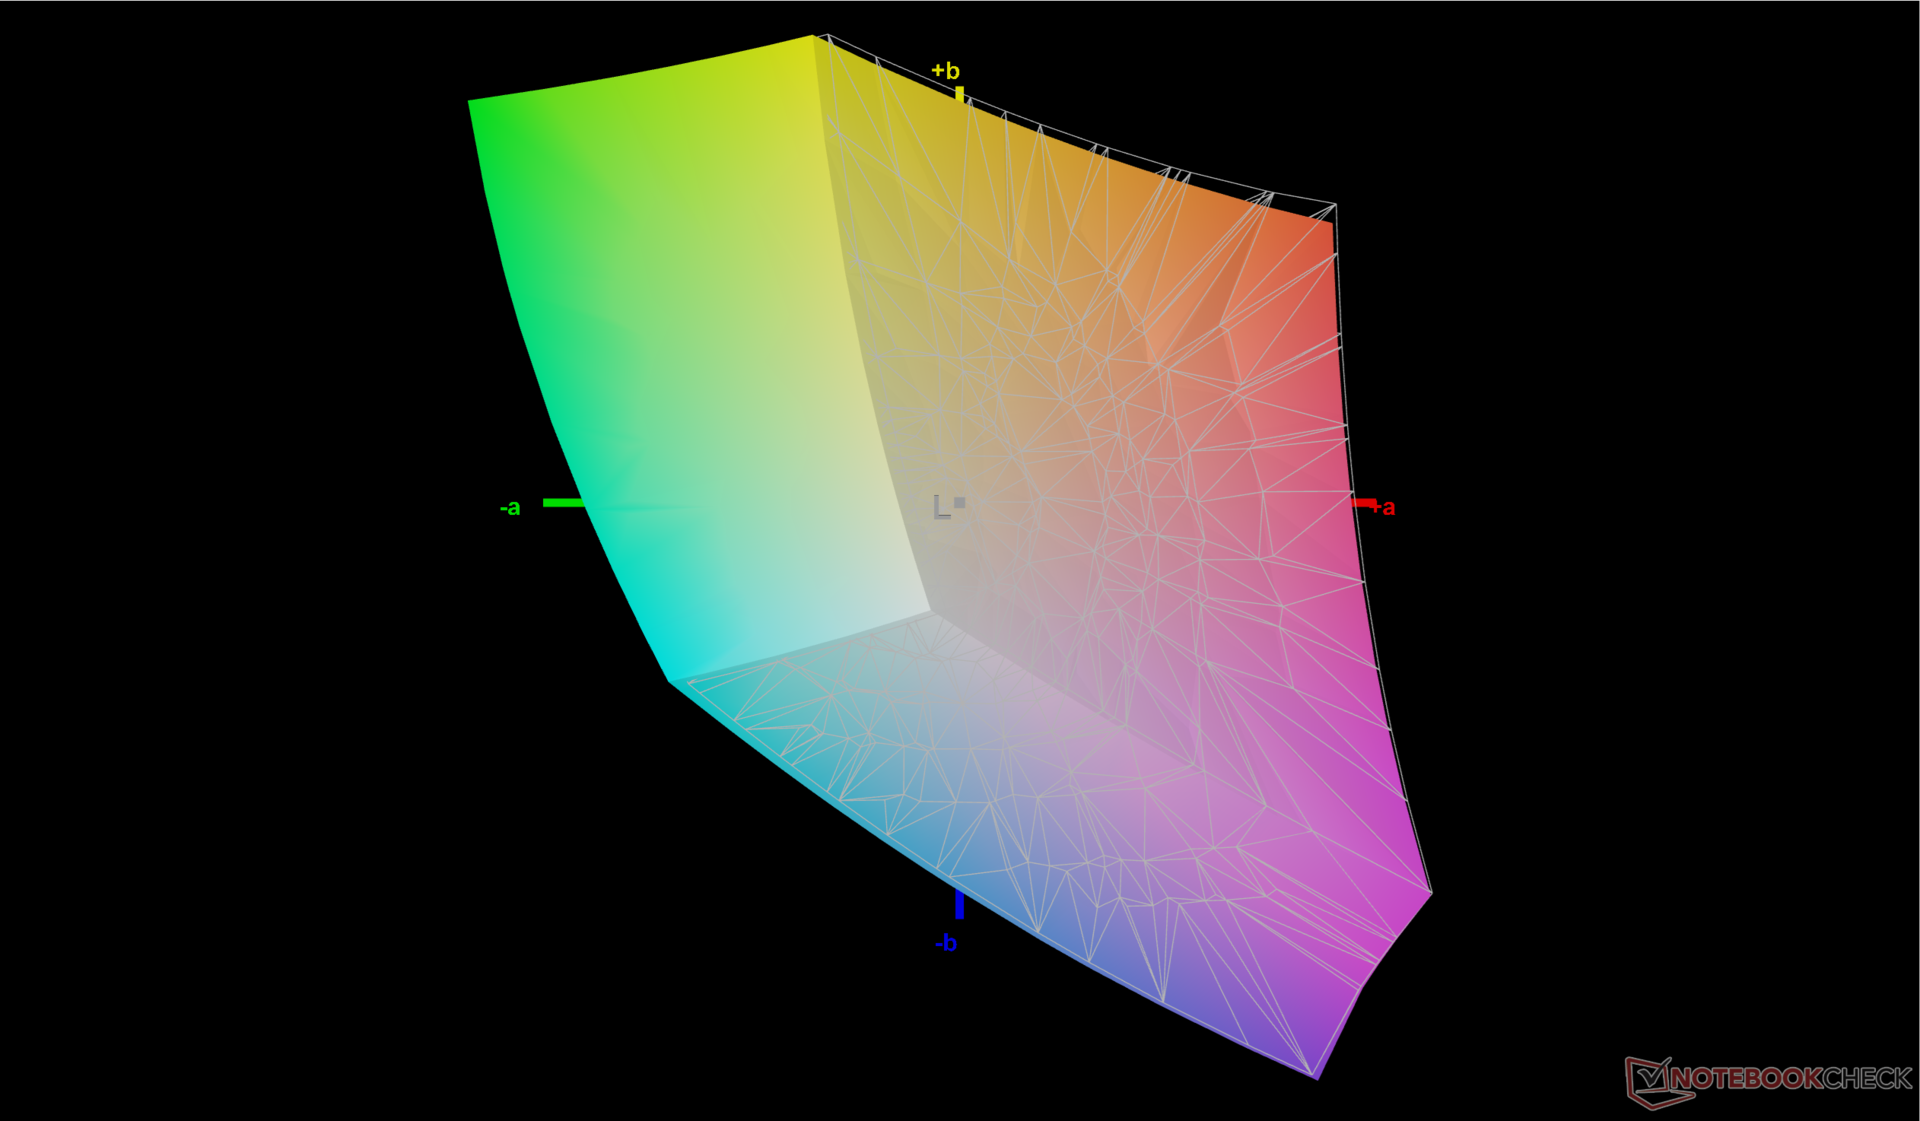
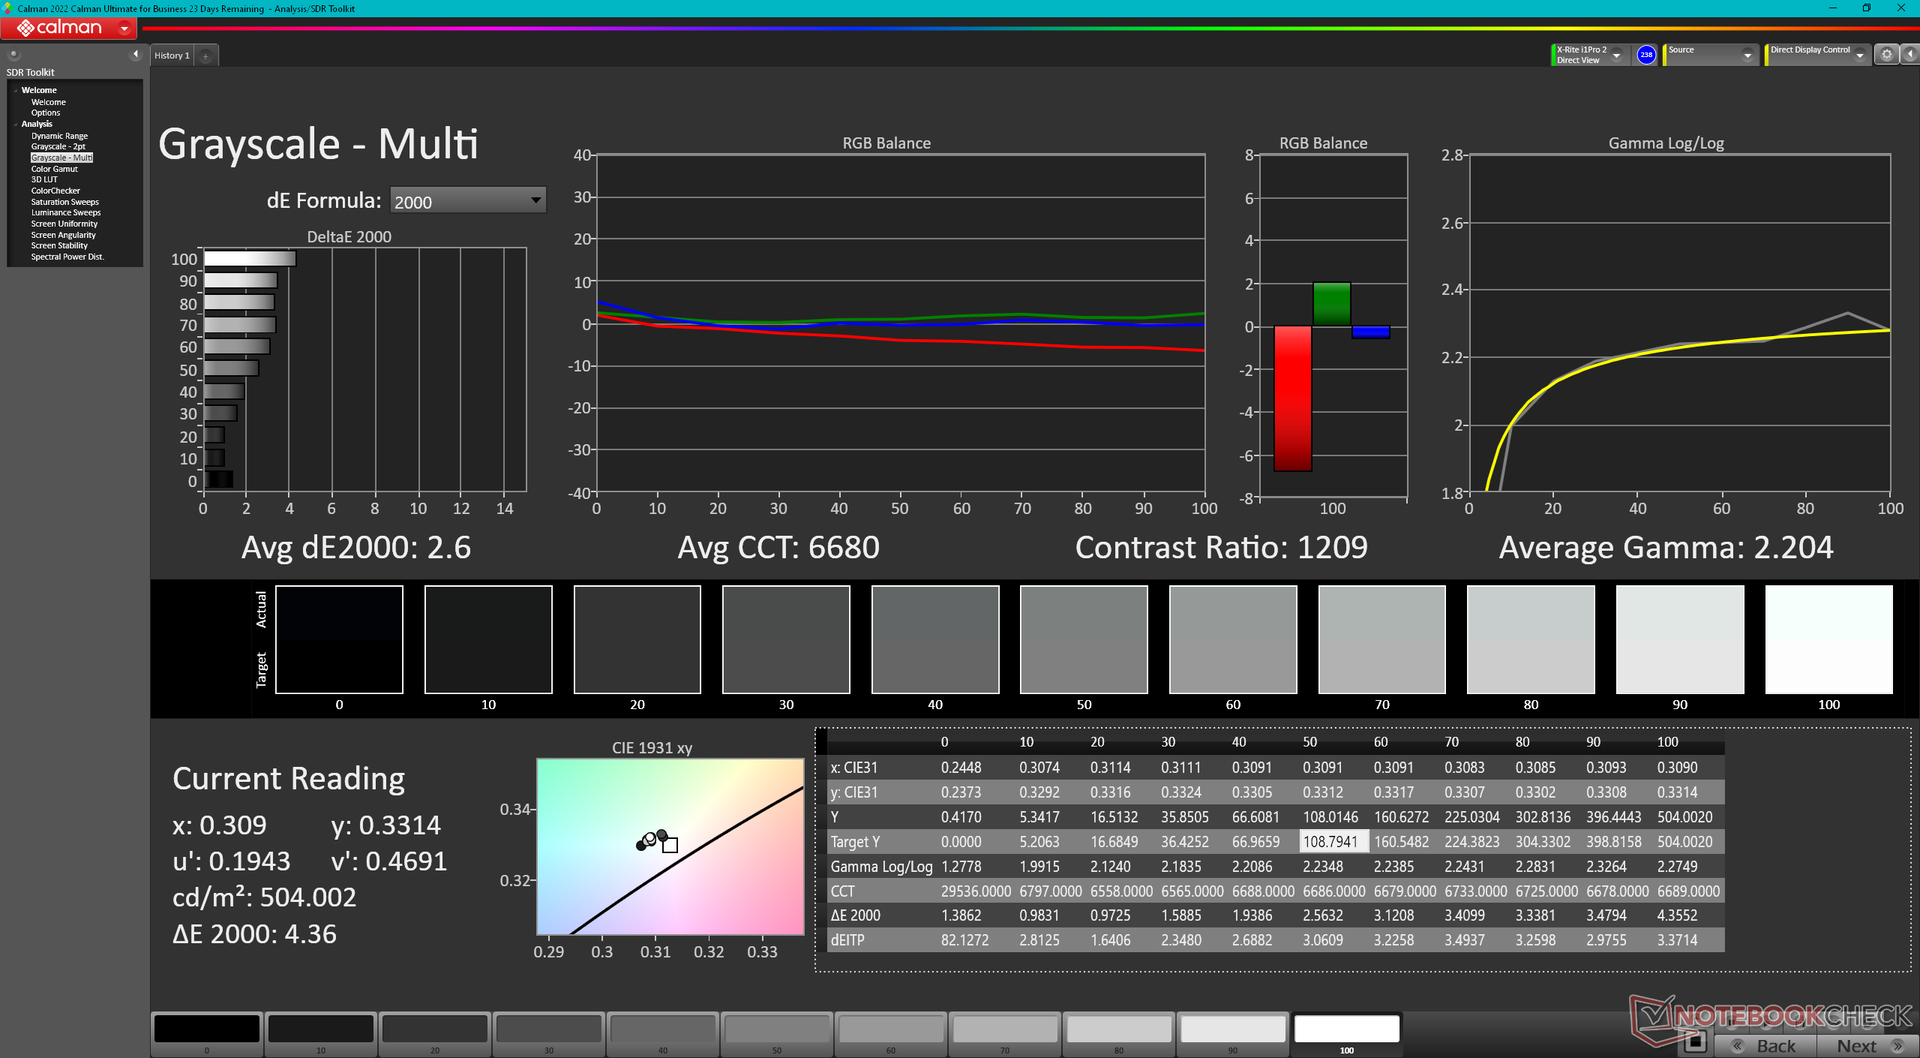
Sebbene il display non sia calibrato in fabbrica, i valori medi del DeltaE della scala di grigi e del colore sono abbastanza buoni, rispettivamente 3,3 e 1,8. La temperatura del colore è leggermente troppo fredda, quasi 7100, ma la calibrazione con il nostro colorimetro X-Rite risolve questo problema e migliora leggermente i valori deltaE medi. Gli utenti possono applicare gratuitamente il nostro profilo ICM calibrato qui sopra.

Tempi di risposta del Display
| ↔ Tempi di risposta dal Nero al Bianco | ||
|---|---|---|
| 9.1 ms ... aumenta ↗ e diminuisce ↘ combinato | ↗ 5 ms Incremento | 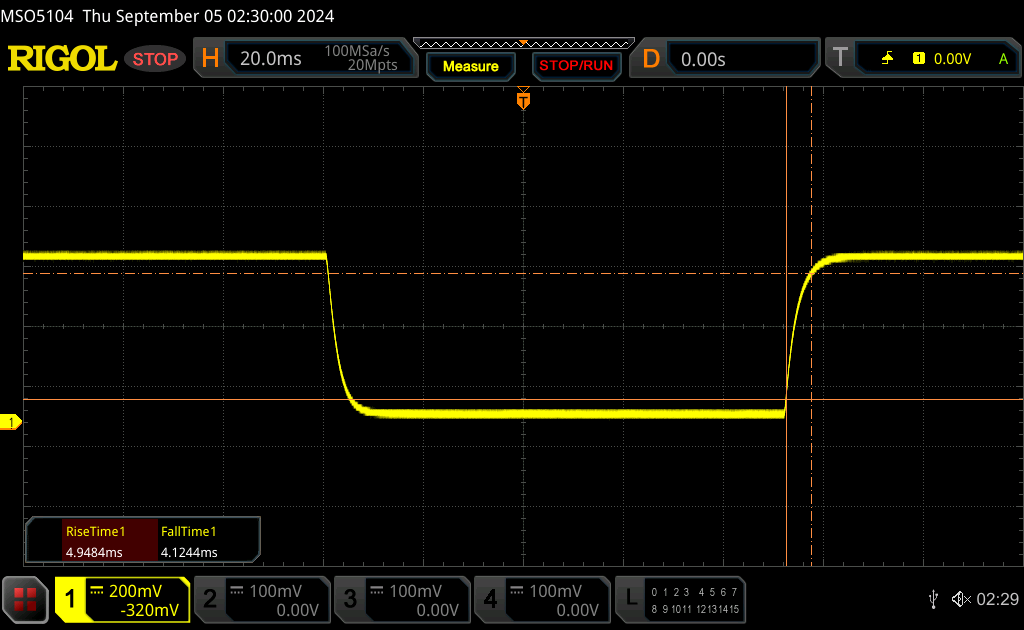 |
| ↘ 4.1 ms Calo | ||
| Lo schermo mostra veloci tempi di risposta durante i nostri tests e dovrebbe esere adatto al gaming In confronto, tutti i dispositivi di test variano da 0.1 (minimo) a 240 (massimo) ms. » 22 % di tutti i dispositivi è migliore. Questo significa che i tempi di risposta rilevati sono migliori rispettto alla media di tutti i dispositivi testati (20.9 ms). | ||
| ↔ Tempo di risposta dal 50% Grigio all'80% Grigio | ||
| 12.5 ms ... aumenta ↗ e diminuisce ↘ combinato | ↗ 5.6 ms Incremento | 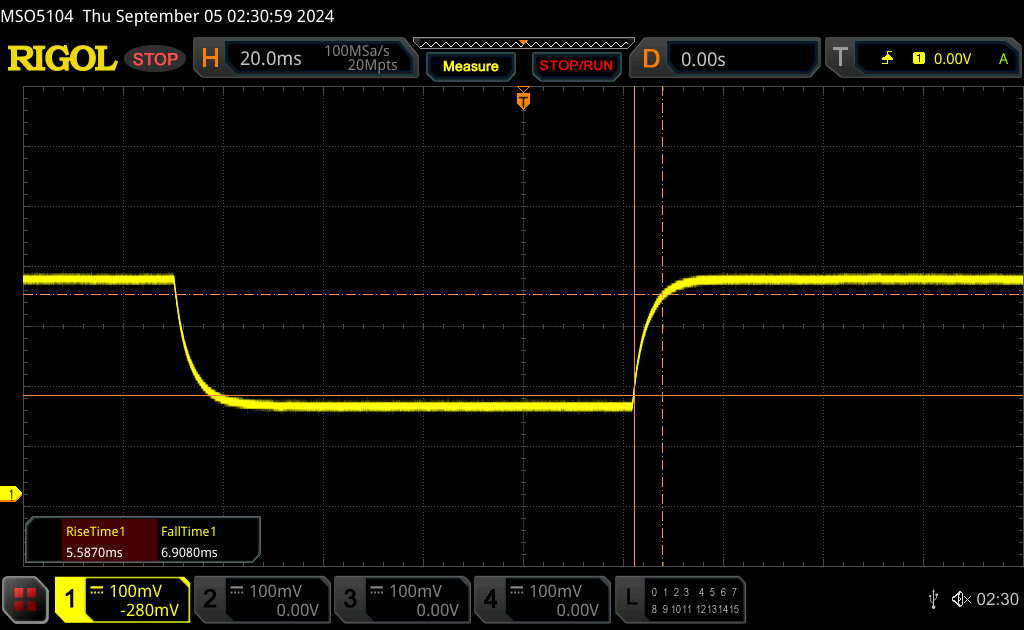 |
| ↘ 6.9 ms Calo | ||
| Lo schermo mostra buoni tempi di risposta durante i nostri tests, ma potrebbe essere troppo lento per i gamers competitivi. In confronto, tutti i dispositivi di test variano da 0.165 (minimo) a 636 (massimo) ms. » 23 % di tutti i dispositivi è migliore. Questo significa che i tempi di risposta rilevati sono migliori rispettto alla media di tutti i dispositivi testati (32.8 ms). | ||
Sfarfallio dello schermo / PWM (Pulse-Width Modulation)
| flickering dello schermo / PWM non rilevato | 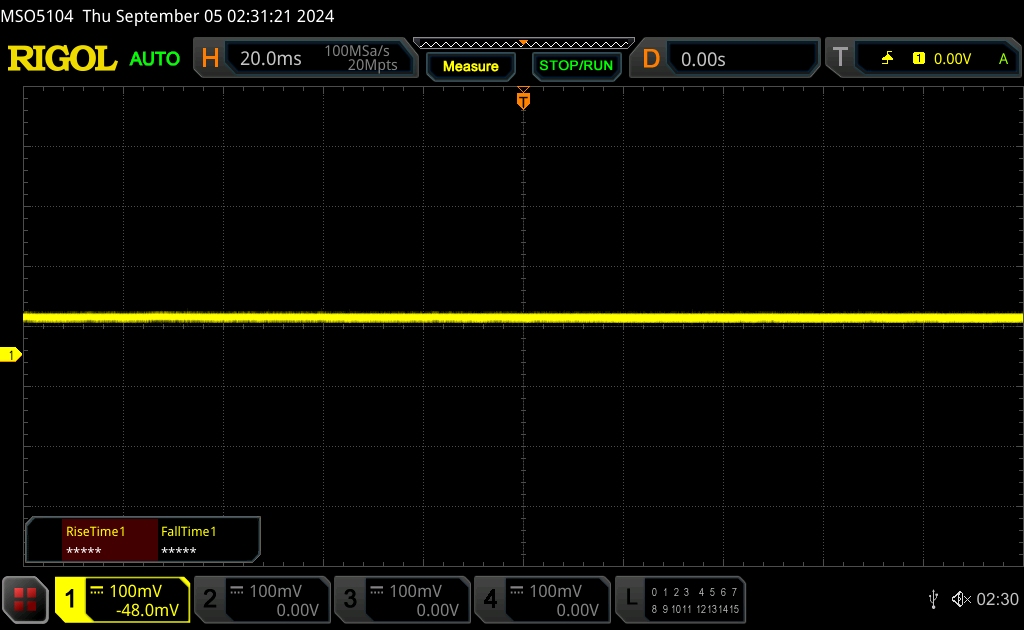 | ||
In confronto: 53 % di tutti i dispositivi testati non utilizza PWM per ridurre la luminosita' del display. Se è rilevato PWM, una media di 8687 (minimo: 5 - massimo: 343500) Hz è stata rilevata. | |||
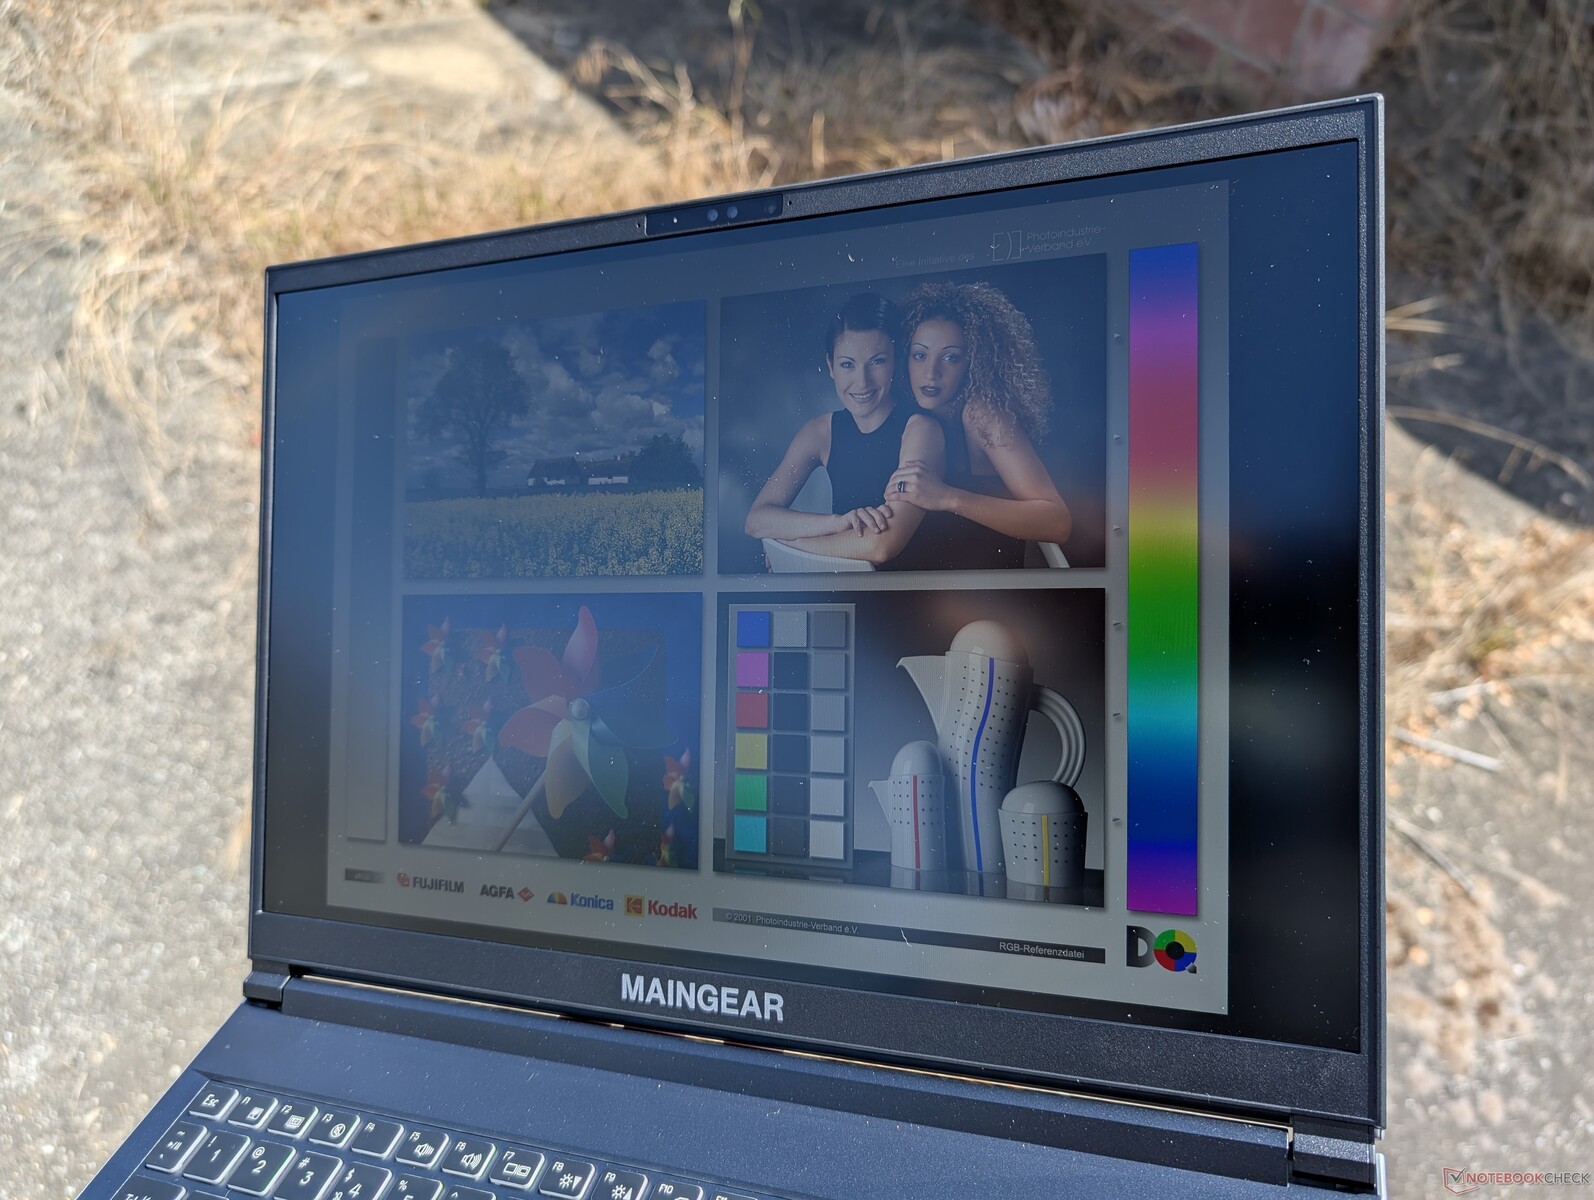
La visibilità all'aperto è migliore rispetto alla maggior parte degli altri portatili da gioco da 16 pollici, grazie alla retroilluminazione relativamente luminosa da 500 nit. Il Victus 16, Alienware x16 R2 e Blade 16, ad esempio, raggiungono un massimo di soli 400 nit o anche solo 300 nit per essere sensibilmente più scarsi. Dovrà comunque evitare la luce diretta del sole per preservare il più possibile i colori.

Prestazioni - Aggiornamento Meteor Lake anziché Raptor Lake
Condizioni del test
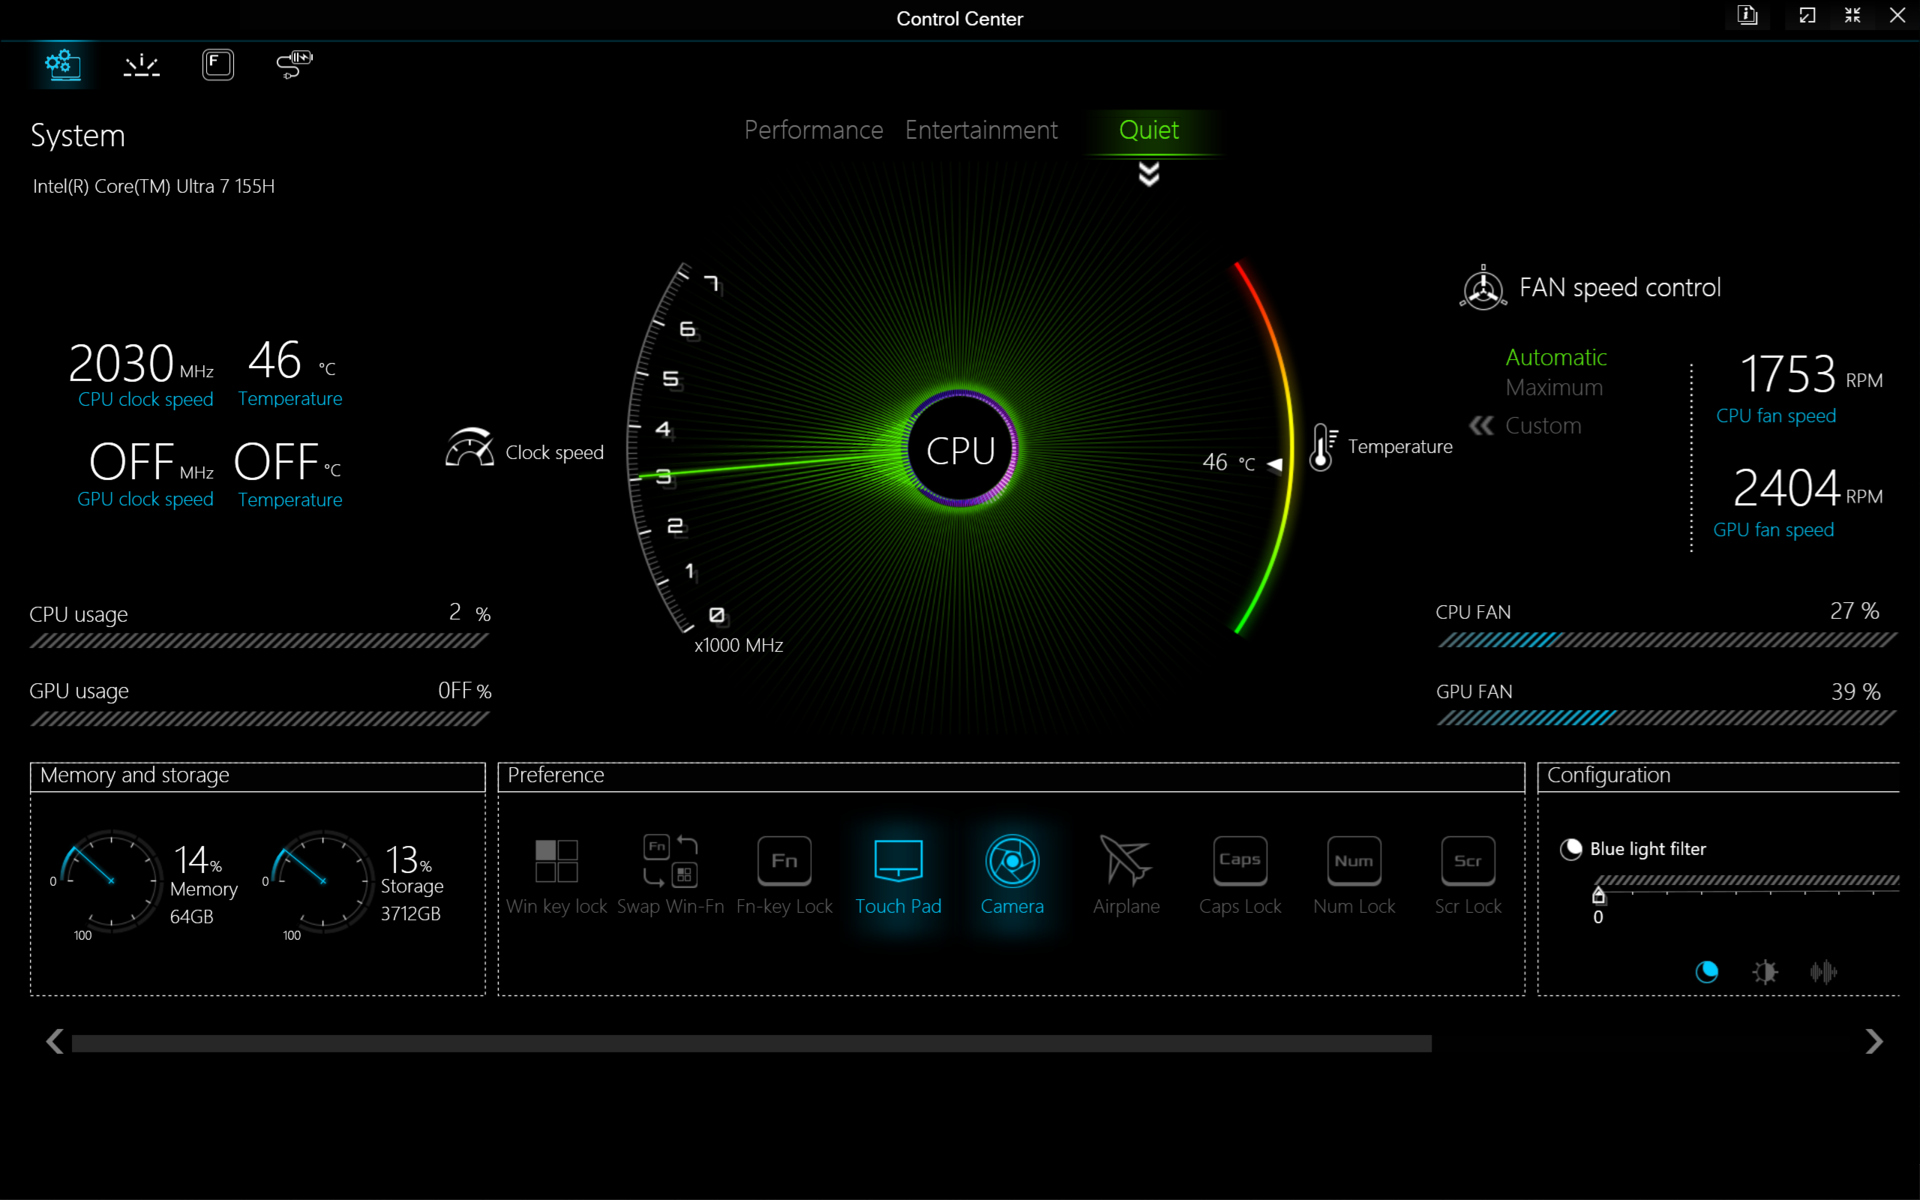
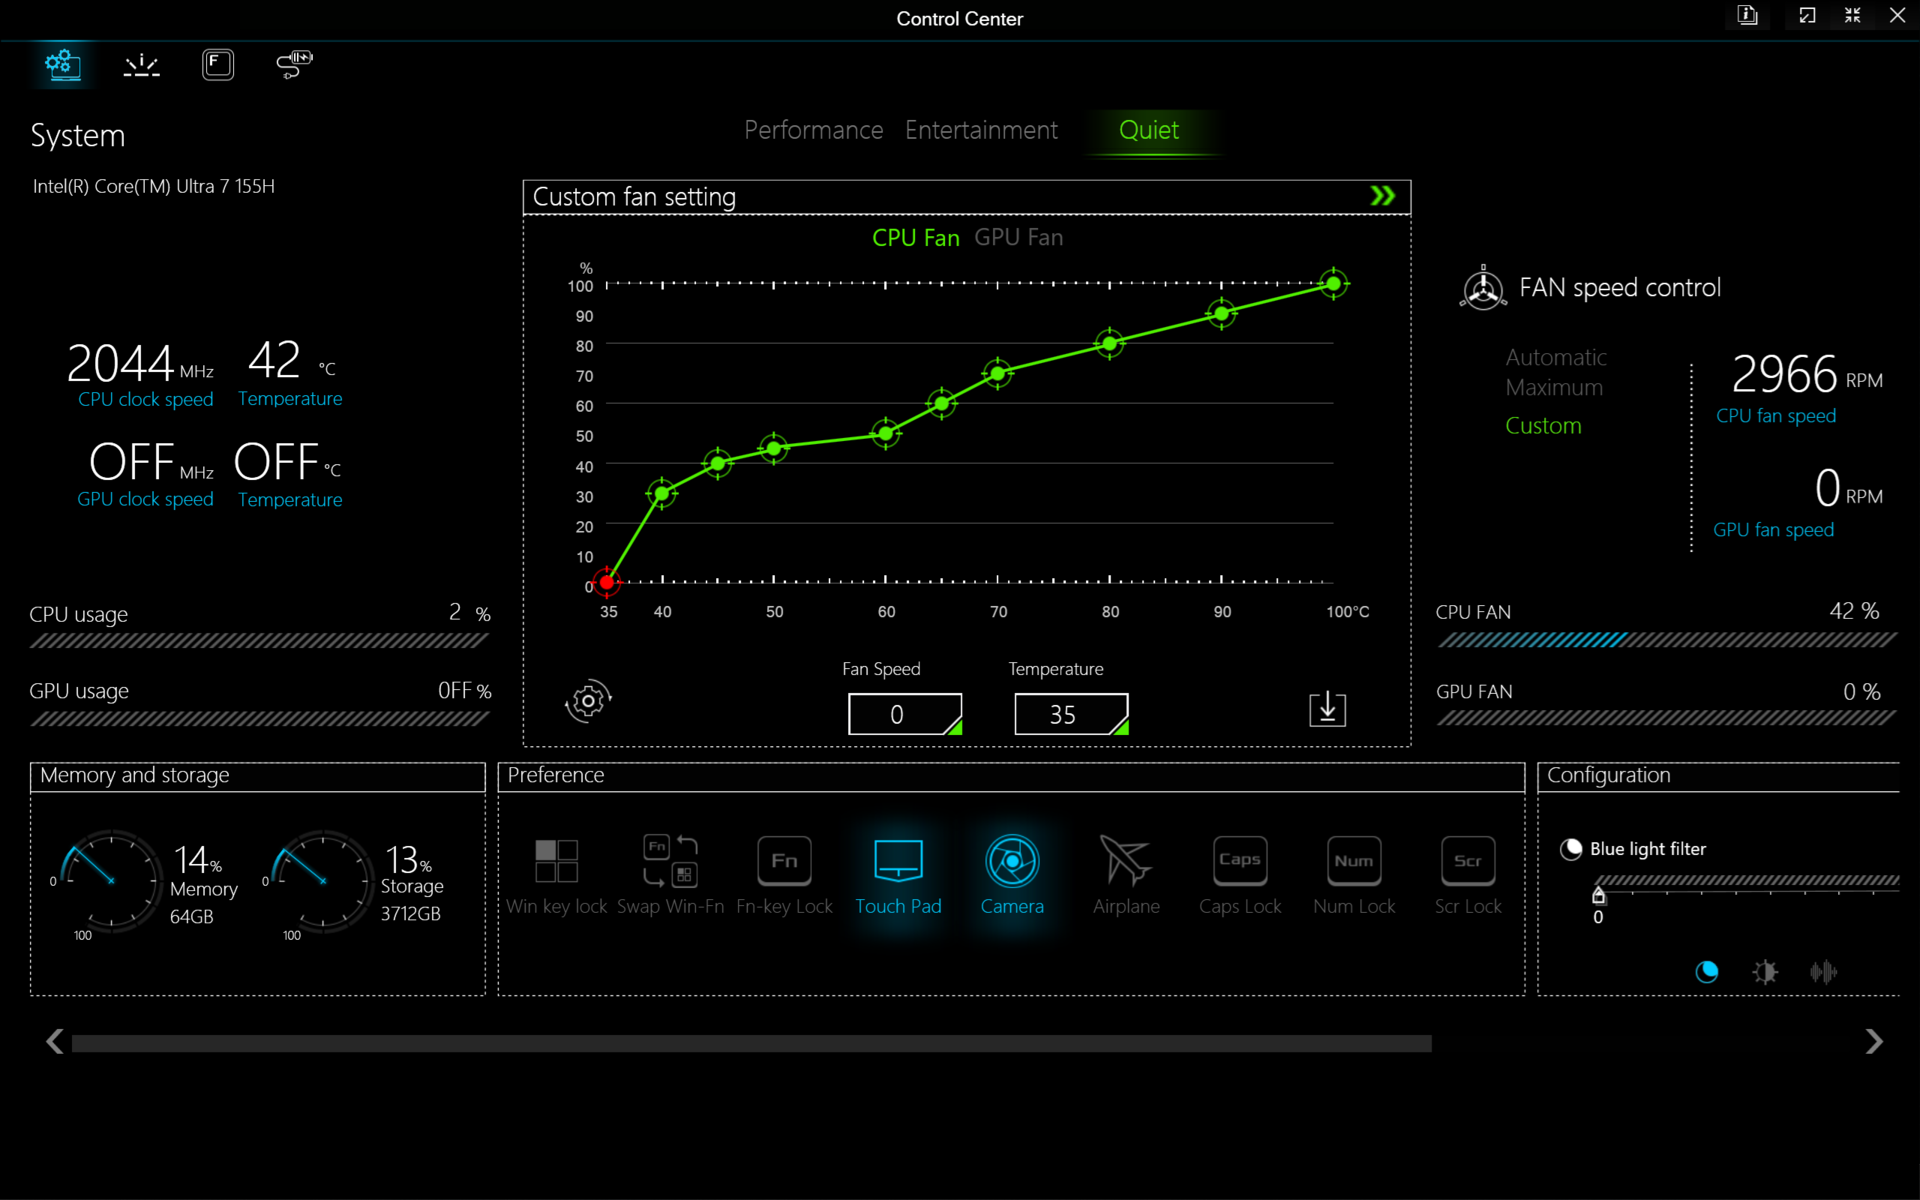
Abbiamo impostato Windows e Control Center sulla modalità Prestazioni prima di eseguire i benchmark qui sotto. I proprietari dovrebbero familiarizzare con il software Control Center preinstallato, in quanto è l'hub per regolare le funzioni chiave, tra cui il comportamento della ventola, l'otturatore elettronico della fotocamera, i tasti RGB e l'interruttore MUX manuale della GPU. Si noti che quest'ultimo è fastidiosamente nascosto in un sottomenu che richiede ulteriori clic per accedervi.
Sono supportati solo Optimus e MUX standard, senza Optimus avanzato. Pertanto, è necessario un riavvio quando si passa dalla modalità dGPU a quella MSHybrid.

Processore
Il Core Ultra 7 155H succede al Core i7-13700Hma l'aumento delle prestazioni è relativamente marginale, tra il 5 e il 15 percento. Ciò è dovuto al fatto che la nuova piattaforma Meteor Lake riserva gran parte dello spazio del die alla nuova NPU integrata e quindi i vantaggi in termini di prestazioni grezze sono passati in secondo piano quest'anno. Il Core i7-14700HX avrebbe aumentato le prestazioni grezze in modo molto più significativo rispetto al Core Ultra 7 155H, ma è anche un processore più avido di energia.
La NPU integrata è purtroppo di uso molto limitato, in quanto non è compatibile con Co-Pilot+; il servizio Microsoft richiede almeno un processore Lunar Lake o l'equivalente AMD/Qualcomm. Anche la maggior parte dei giochi non utilizza ancora la NPU.
Cinebench R15 Multi Loop
Cinebench R23: Multi Core | Single Core
Cinebench R20: CPU (Multi Core) | CPU (Single Core)
Cinebench R15: CPU Multi 64Bit | CPU Single 64Bit
Blender: v2.79 BMW27 CPU
7-Zip 18.03: 7z b 4 | 7z b 4 -mmt1
Geekbench 6.3: Multi-Core | Single-Core
Geekbench 5.5: Multi-Core | Single-Core
HWBOT x265 Benchmark v2.2: 4k Preset
LibreOffice : 20 Documents To PDF
R Benchmark 2.5: Overall mean
| CPU Performance Rating | |
| Razer Blade 16 2024, RTX 4090 | |
| Asus ROG Zephyrus G16 GA605WV | |
| HP Victus 16 (2024) | |
| Asus TUF Gaming A16 FA617XS -2! | |
| MSI Stealth 16 Mercedes-AMG Motorsport A13VG | |
| Lenovo Legion Slim 7 16APH8 | |
| Dell Inspiron 16 Plus 7630 | |
| HP Victus 16-r0076TX -3! | |
| Alienware x16 R2 P120F | |
| Maingear ML-16 MK2 | |
| Media Intel Core Ultra 7 155H | |
| HP Victus 16-r0077ng | |
| CSL GameStar Notebook VenomGamer G16 | |
| HP Omen 16-n0033dx -2! | |
| Acer Nitro 16 AN16-41-R7YE | |
| Cinebench R23 / Multi Core | |
| Razer Blade 16 2024, RTX 4090 | |
| HP Victus 16 (2024) | |
| Asus ROG Zephyrus G16 GA605WV | |
| MSI Stealth 16 Mercedes-AMG Motorsport A13VG | |
| Alienware x16 R2 P120F | |
| HP Victus 16-r0076TX | |
| Maingear ML-16 MK2 | |
| Asus TUF Gaming A16 FA617XS | |
| Lenovo Legion Slim 7 16APH8 | |
| Dell Inspiron 16 Plus 7630 | |
| HP Victus 16-r0077ng | |
| Media Intel Core Ultra 7 155H (9769 - 19007, n=50) | |
| CSL GameStar Notebook VenomGamer G16 | |
| HP Omen 16-n0033dx | |
| Acer Nitro 16 AN16-41-R7YE | |
| Cinebench R23 / Single Core | |
| Razer Blade 16 2024, RTX 4090 | |
| MSI Stealth 16 Mercedes-AMG Motorsport A13VG | |
| Asus ROG Zephyrus G16 GA605WV | |
| Dell Inspiron 16 Plus 7630 | |
| Asus TUF Gaming A16 FA617XS | |
| Lenovo Legion Slim 7 16APH8 | |
| Media Intel Core Ultra 7 155H (1496 - 1815, n=50) | |
| HP Victus 16 (2024) | |
| HP Victus 16-r0076TX | |
| HP Victus 16-r0077ng | |
| Maingear ML-16 MK2 | |
| Alienware x16 R2 P120F | |
| CSL GameStar Notebook VenomGamer G16 | |
| HP Omen 16-n0033dx | |
| Acer Nitro 16 AN16-41-R7YE | |
| Cinebench R20 / CPU (Multi Core) | |
| Razer Blade 16 2024, RTX 4090 | |
| HP Victus 16 (2024) | |
| Asus ROG Zephyrus G16 GA605WV | |
| MSI Stealth 16 Mercedes-AMG Motorsport A13VG | |
| Alienware x16 R2 P120F | |
| HP Victus 16-r0076TX | |
| Maingear ML-16 MK2 | |
| Asus TUF Gaming A16 FA617XS | |
| Lenovo Legion Slim 7 16APH8 | |
| Dell Inspiron 16 Plus 7630 | |
| HP Victus 16-r0077ng | |
| Media Intel Core Ultra 7 155H (3798 - 7409, n=48) | |
| CSL GameStar Notebook VenomGamer G16 | |
| HP Omen 16-n0033dx | |
| Acer Nitro 16 AN16-41-R7YE | |
| Cinebench R20 / CPU (Single Core) | |
| Razer Blade 16 2024, RTX 4090 | |
| Asus ROG Zephyrus G16 GA605WV | |
| MSI Stealth 16 Mercedes-AMG Motorsport A13VG | |
| Dell Inspiron 16 Plus 7630 | |
| Asus TUF Gaming A16 FA617XS | |
| Lenovo Legion Slim 7 16APH8 | |
| Media Intel Core Ultra 7 155H (601 - 696, n=48) | |
| HP Victus 16 (2024) | |
| HP Victus 16-r0077ng | |
| HP Victus 16-r0076TX | |
| Maingear ML-16 MK2 | |
| Alienware x16 R2 P120F | |
| HP Omen 16-n0033dx | |
| CSL GameStar Notebook VenomGamer G16 | |
| Acer Nitro 16 AN16-41-R7YE | |
| Cinebench R15 / CPU Multi 64Bit | |
| Razer Blade 16 2024, RTX 4090 | |
| HP Victus 16 (2024) | |
| Asus ROG Zephyrus G16 GA605WV | |
| MSI Stealth 16 Mercedes-AMG Motorsport A13VG | |
| HP Victus 16-r0076TX | |
| Alienware x16 R2 P120F | |
| Maingear ML-16 MK2 | |
| Asus TUF Gaming A16 FA617XS | |
| Lenovo Legion Slim 7 16APH8 | |
| Media Intel Core Ultra 7 155H (1932 - 2880, n=54) | |
| Dell Inspiron 16 Plus 7630 | |
| HP Victus 16-r0077ng | |
| CSL GameStar Notebook VenomGamer G16 | |
| HP Omen 16-n0033dx | |
| Acer Nitro 16 AN16-41-R7YE | |
| Cinebench R15 / CPU Single 64Bit | |
| Razer Blade 16 2024, RTX 4090 | |
| Asus ROG Zephyrus G16 GA605WV | |
| Asus TUF Gaming A16 FA617XS | |
| MSI Stealth 16 Mercedes-AMG Motorsport A13VG | |
| Lenovo Legion Slim 7 16APH8 | |
| Dell Inspiron 16 Plus 7630 | |
| CSL GameStar Notebook VenomGamer G16 | |
| Media Intel Core Ultra 7 155H (99.6 - 268, n=50) | |
| HP Victus 16-r0077ng | |
| HP Omen 16-n0033dx | |
| HP Victus 16-r0076TX | |
| Maingear ML-16 MK2 | |
| Acer Nitro 16 AN16-41-R7YE | |
| HP Victus 16 (2024) | |
| Alienware x16 R2 P120F | |
| Blender / v2.79 BMW27 CPU | |
| Acer Nitro 16 AN16-41-R7YE | |
| HP Omen 16-n0033dx | |
| MSI Stealth 16 Mercedes-AMG Motorsport A13VG | |
| Media Intel Core Ultra 7 155H (175 - 381, n=46) | |
| Maingear ML-16 MK2 | |
| Dell Inspiron 16 Plus 7630 | |
| HP Victus 16-r0077ng | |
| CSL GameStar Notebook VenomGamer G16 | |
| Lenovo Legion Slim 7 16APH8 | |
| HP Victus 16-r0076TX | |
| Asus TUF Gaming A16 FA617XS | |
| Alienware x16 R2 P120F | |
| HP Victus 16 (2024) | |
| Asus ROG Zephyrus G16 GA605WV | |
| Razer Blade 16 2024, RTX 4090 | |
| 7-Zip 18.03 / 7z b 4 | |
| Razer Blade 16 2024, RTX 4090 | |
| HP Victus 16 (2024) | |
| Asus ROG Zephyrus G16 GA605WV | |
| HP Victus 16-r0076TX | |
| Lenovo Legion Slim 7 16APH8 | |
| Asus TUF Gaming A16 FA617XS | |
| Alienware x16 R2 P120F | |
| HP Victus 16-r0077ng | |
| Maingear ML-16 MK2 | |
| CSL GameStar Notebook VenomGamer G16 | |
| Dell Inspiron 16 Plus 7630 | |
| Media Intel Core Ultra 7 155H (41739 - 70254, n=48) | |
| HP Omen 16-n0033dx | |
| MSI Stealth 16 Mercedes-AMG Motorsport A13VG | |
| Acer Nitro 16 AN16-41-R7YE | |
| 7-Zip 18.03 / 7z b 4 -mmt1 | |
| Razer Blade 16 2024, RTX 4090 | |
| Asus TUF Gaming A16 FA617XS | |
| Lenovo Legion Slim 7 16APH8 | |
| MSI Stealth 16 Mercedes-AMG Motorsport A13VG | |
| Asus ROG Zephyrus G16 GA605WV | |
| CSL GameStar Notebook VenomGamer G16 | |
| Dell Inspiron 16 Plus 7630 | |
| Acer Nitro 16 AN16-41-R7YE | |
| HP Omen 16-n0033dx | |
| HP Victus 16 (2024) | |
| HP Victus 16-r0077ng | |
| HP Victus 16-r0076TX | |
| Media Intel Core Ultra 7 155H (4795 - 5621, n=48) | |
| Maingear ML-16 MK2 | |
| Alienware x16 R2 P120F | |
| Geekbench 6.3 / Multi-Core | |
| Razer Blade 16 2024, RTX 4090 | |
| Asus ROG Zephyrus G16 GA605WV | |
| HP Victus 16 (2024) | |
| Dell Inspiron 16 Plus 7630 | |
| Lenovo Legion Slim 7 16APH8 | |
| Alienware x16 R2 P120F | |
| Media Intel Core Ultra 7 155H (7732 - 13656, n=53) | |
| MSI Stealth 16 Mercedes-AMG Motorsport A13VG | |
| Maingear ML-16 MK2 | |
| HP Victus 16-r0077ng | |
| CSL GameStar Notebook VenomGamer G16 | |
| Acer Nitro 16 AN16-41-R7YE | |
| Geekbench 6.3 / Single-Core | |
| Razer Blade 16 2024, RTX 4090 | |
| Asus ROG Zephyrus G16 GA605WV | |
| MSI Stealth 16 Mercedes-AMG Motorsport A13VG | |
| Dell Inspiron 16 Plus 7630 | |
| Lenovo Legion Slim 7 16APH8 | |
| HP Victus 16-r0077ng | |
| HP Victus 16 (2024) | |
| Media Intel Core Ultra 7 155H (1901 - 2473, n=50) | |
| Maingear ML-16 MK2 | |
| Alienware x16 R2 P120F | |
| CSL GameStar Notebook VenomGamer G16 | |
| Acer Nitro 16 AN16-41-R7YE | |
| Geekbench 5.5 / Multi-Core | |
| Razer Blade 16 2024, RTX 4090 | |
| HP Victus 16 (2024) | |
| Asus ROG Zephyrus G16 GA605WV | |
| Dell Inspiron 16 Plus 7630 | |
| Alienware x16 R2 P120F | |
| HP Victus 16-r0076TX | |
| Maingear ML-16 MK2 | |
| Asus TUF Gaming A16 FA617XS | |
| Media Intel Core Ultra 7 155H (10017 - 13556, n=50) | |
| Lenovo Legion Slim 7 16APH8 | |
| HP Victus 16-r0077ng | |
| MSI Stealth 16 Mercedes-AMG Motorsport A13VG | |
| CSL GameStar Notebook VenomGamer G16 | |
| HP Omen 16-n0033dx | |
| Acer Nitro 16 AN16-41-R7YE | |
| Geekbench 5.5 / Single-Core | |
| Razer Blade 16 2024, RTX 4090 | |
| Asus ROG Zephyrus G16 GA605WV | |
| Asus TUF Gaming A16 FA617XS | |
| MSI Stealth 16 Mercedes-AMG Motorsport A13VG | |
| Lenovo Legion Slim 7 16APH8 | |
| Dell Inspiron 16 Plus 7630 | |
| Media Intel Core Ultra 7 155H (1462 - 1824, n=50) | |
| HP Victus 16 (2024) | |
| Alienware x16 R2 P120F | |
| HP Victus 16-r0076TX | |
| HP Victus 16-r0077ng | |
| Maingear ML-16 MK2 | |
| CSL GameStar Notebook VenomGamer G16 | |
| HP Omen 16-n0033dx | |
| Acer Nitro 16 AN16-41-R7YE | |
| HWBOT x265 Benchmark v2.2 / 4k Preset | |
| Razer Blade 16 2024, RTX 4090 | |
| Asus ROG Zephyrus G16 GA605WV | |
| HP Victus 16 (2024) | |
| Asus TUF Gaming A16 FA617XS | |
| Alienware x16 R2 P120F | |
| HP Victus 16-r0076TX | |
| Lenovo Legion Slim 7 16APH8 | |
| CSL GameStar Notebook VenomGamer G16 | |
| Maingear ML-16 MK2 | |
| HP Victus 16-r0077ng | |
| Media Intel Core Ultra 7 155H (9.93 - 21.2, n=48) | |
| HP Omen 16-n0033dx | |
| Dell Inspiron 16 Plus 7630 | |
| MSI Stealth 16 Mercedes-AMG Motorsport A13VG | |
| Acer Nitro 16 AN16-41-R7YE | |
| LibreOffice / 20 Documents To PDF | |
| Lenovo Legion Slim 7 16APH8 | |
| CSL GameStar Notebook VenomGamer G16 | |
| HP Victus 16-r0077ng | |
| HP Omen 16-n0033dx | |
| MSI Stealth 16 Mercedes-AMG Motorsport A13VG | |
| HP Victus 16 (2024) | |
| Asus ROG Zephyrus G16 GA605WV | |
| Media Intel Core Ultra 7 155H (37.5 - 79.2, n=47) | |
| Razer Blade 16 2024, RTX 4090 | |
| Acer Nitro 16 AN16-41-R7YE | |
| Alienware x16 R2 P120F | |
| Dell Inspiron 16 Plus 7630 | |
| Maingear ML-16 MK2 | |
| Asus TUF Gaming A16 FA617XS | |
| R Benchmark 2.5 / Overall mean | |
| Maingear ML-16 MK2 | |
| HP Victus 16-r0077ng | |
| Acer Nitro 16 AN16-41-R7YE | |
| Alienware x16 R2 P120F | |
| HP Omen 16-n0033dx | |
| HP Victus 16 (2024) | |
| HP Victus 16-r0076TX | |
| CSL GameStar Notebook VenomGamer G16 | |
| Media Intel Core Ultra 7 155H (0.4457 - 0.53, n=47) | |
| Lenovo Legion Slim 7 16APH8 | |
| Dell Inspiron 16 Plus 7630 | |
| MSI Stealth 16 Mercedes-AMG Motorsport A13VG | |
| Asus TUF Gaming A16 FA617XS | |
| Asus ROG Zephyrus G16 GA605WV | |
| Razer Blade 16 2024, RTX 4090 | |
Cinebench R23: Multi Core | Single Core
Cinebench R20: CPU (Multi Core) | CPU (Single Core)
Cinebench R15: CPU Multi 64Bit | CPU Single 64Bit
Blender: v2.79 BMW27 CPU
7-Zip 18.03: 7z b 4 | 7z b 4 -mmt1
Geekbench 6.3: Multi-Core | Single-Core
Geekbench 5.5: Multi-Core | Single-Core
HWBOT x265 Benchmark v2.2: 4k Preset
LibreOffice : 20 Documents To PDF
R Benchmark 2.5: Overall mean
* ... Meglio usare valori piccoli
AIDA64: FP32 Ray-Trace | FPU Julia | CPU SHA3 | CPU Queen | FPU SinJulia | FPU Mandel | CPU AES | CPU ZLib | FP64 Ray-Trace | CPU PhotoWorxx
| Performance Rating | |
| Asus ROG Zephyrus G16 GA605WV | |
| Razer Blade 16 2024, RTX 4090 | |
| Lenovo Legion Pro 5 16IRX9 | |
| Alienware x16 R2 P120F | |
| HP Victus 16 (2024) | |
| Maingear ML-16 MK2 | |
| Media Intel Core Ultra 7 155H | |
| AIDA64 / FP32 Ray-Trace | |
| Asus ROG Zephyrus G16 GA605WV | |
| Razer Blade 16 2024, RTX 4090 | |
| Lenovo Legion Pro 5 16IRX9 | |
| Alienware x16 R2 P120F | |
| HP Victus 16 (2024) | |
| Maingear ML-16 MK2 | |
| Media Intel Core Ultra 7 155H (6670 - 18470, n=48) | |
| AIDA64 / FPU Julia | |
| Asus ROG Zephyrus G16 GA605WV | |
| Lenovo Legion Pro 5 16IRX9 | |
| Razer Blade 16 2024, RTX 4090 | |
| Alienware x16 R2 P120F | |
| HP Victus 16 (2024) | |
| Maingear ML-16 MK2 | |
| Media Intel Core Ultra 7 155H (40905 - 93181, n=48) | |
| AIDA64 / CPU SHA3 | |
| Lenovo Legion Pro 5 16IRX9 | |
| Razer Blade 16 2024, RTX 4090 | |
| Asus ROG Zephyrus G16 GA605WV | |
| Alienware x16 R2 P120F | |
| HP Victus 16 (2024) | |
| Maingear ML-16 MK2 | |
| Media Intel Core Ultra 7 155H (1940 - 4436, n=48) | |
| AIDA64 / CPU Queen | |
| Lenovo Legion Pro 5 16IRX9 | |
| Razer Blade 16 2024, RTX 4090 | |
| HP Victus 16 (2024) | |
| Alienware x16 R2 P120F | |
| Asus ROG Zephyrus G16 GA605WV | |
| Maingear ML-16 MK2 | |
| Media Intel Core Ultra 7 155H (64698 - 94181, n=48) | |
| AIDA64 / FPU SinJulia | |
| Asus ROG Zephyrus G16 GA605WV | |
| Razer Blade 16 2024, RTX 4090 | |
| Lenovo Legion Pro 5 16IRX9 | |
| HP Victus 16 (2024) | |
| Alienware x16 R2 P120F | |
| Maingear ML-16 MK2 | |
| Media Intel Core Ultra 7 155H (5639 - 10647, n=48) | |
| AIDA64 / FPU Mandel | |
| Asus ROG Zephyrus G16 GA605WV | |
| Razer Blade 16 2024, RTX 4090 | |
| Lenovo Legion Pro 5 16IRX9 | |
| Alienware x16 R2 P120F | |
| HP Victus 16 (2024) | |
| Maingear ML-16 MK2 | |
| Media Intel Core Ultra 7 155H (18236 - 47685, n=48) | |
| AIDA64 / CPU AES | |
| Maingear ML-16 MK2 | |
| Razer Blade 16 2024, RTX 4090 | |
| Lenovo Legion Pro 5 16IRX9 | |
| Alienware x16 R2 P120F | |
| HP Victus 16 (2024) | |
| Asus ROG Zephyrus G16 GA605WV | |
| Media Intel Core Ultra 7 155H (45713 - 152179, n=48) | |
| AIDA64 / CPU ZLib | |
| Lenovo Legion Pro 5 16IRX9 | |
| Razer Blade 16 2024, RTX 4090 | |
| Asus ROG Zephyrus G16 GA605WV | |
| Alienware x16 R2 P120F | |
| Maingear ML-16 MK2 | |
| HP Victus 16 (2024) | |
| Media Intel Core Ultra 7 155H (557 - 1250, n=48) | |
| AIDA64 / FP64 Ray-Trace | |
| Asus ROG Zephyrus G16 GA605WV | |
| Razer Blade 16 2024, RTX 4090 | |
| Lenovo Legion Pro 5 16IRX9 | |
| Alienware x16 R2 P120F | |
| HP Victus 16 (2024) | |
| Maingear ML-16 MK2 | |
| Media Intel Core Ultra 7 155H (3569 - 9802, n=48) | |
| AIDA64 / CPU PhotoWorxx | |
| Alienware x16 R2 P120F | |
| Lenovo Legion Pro 5 16IRX9 | |
| Razer Blade 16 2024, RTX 4090 | |
| Asus ROG Zephyrus G16 GA605WV | |
| Media Intel Core Ultra 7 155H (32719 - 54223, n=48) | |
| HP Victus 16 (2024) | |
| Maingear ML-16 MK2 | |
Test da sforzo
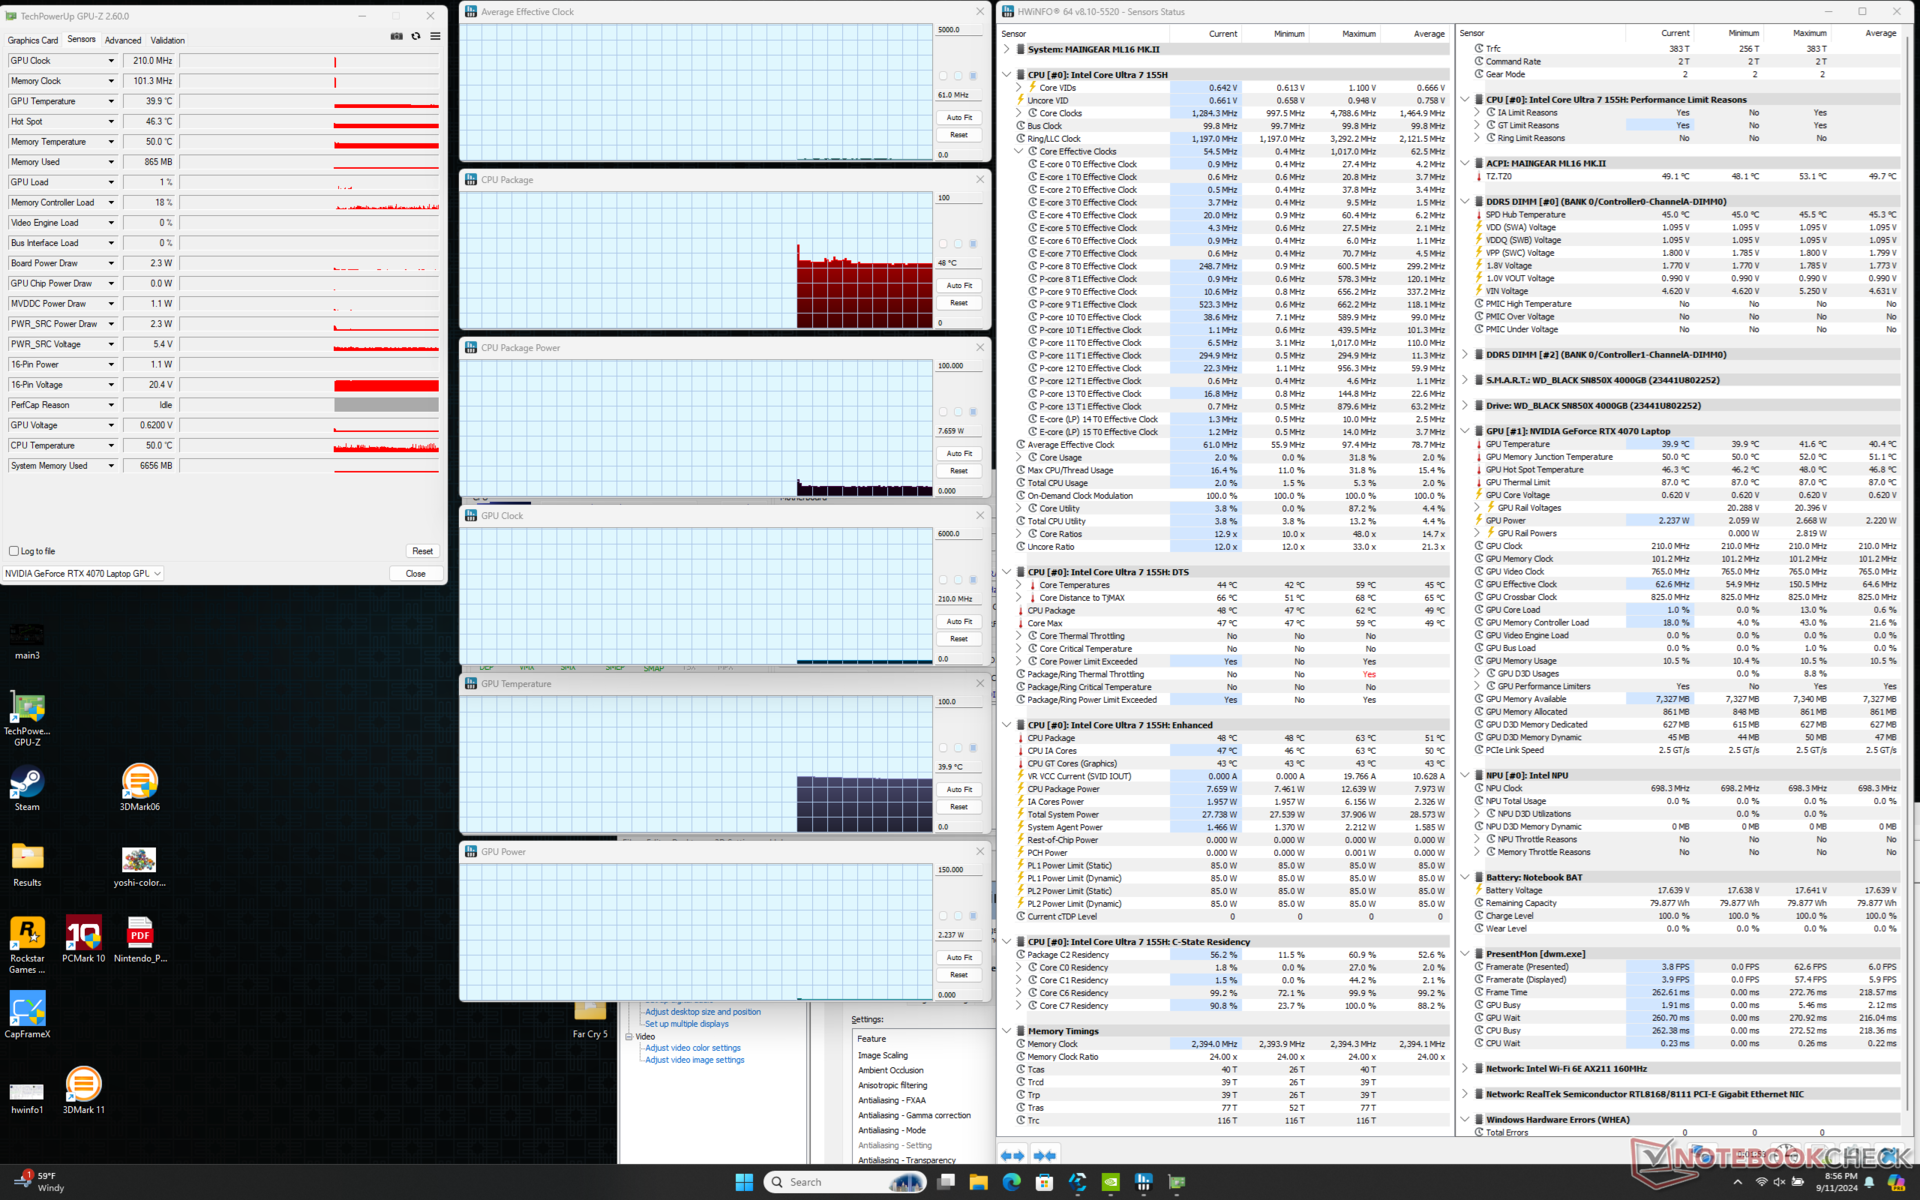
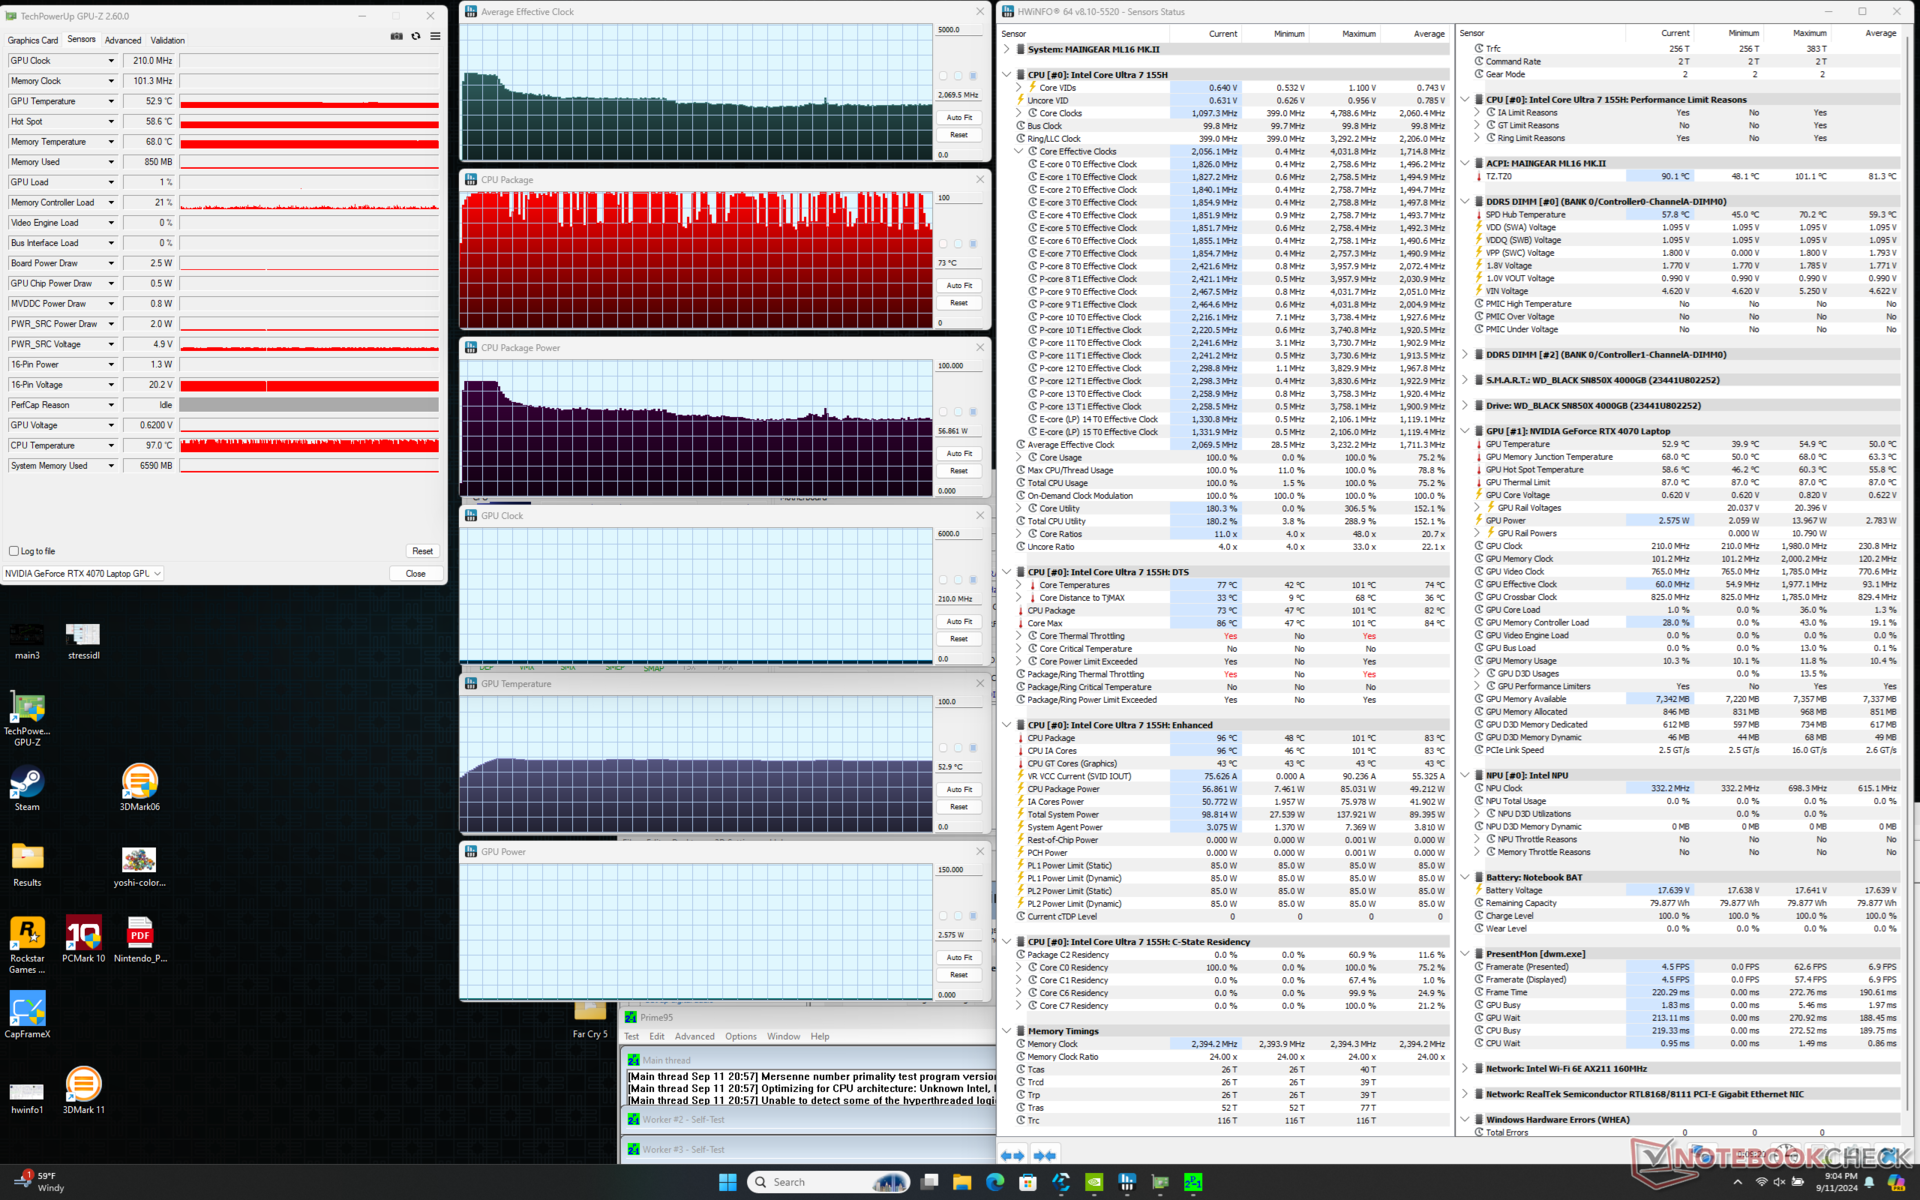
La CPU saliva a 3,2 GHz, 100 C e 85 W quando si avviava lo stress Prime95. Dopo alcuni secondi, tuttavia, la CPU scendeva a 2,6 GHz e 69 W, per poi stabilizzarsi a 2,1 GHz e 57 W. La temperatura del core oscillava tra 73 C e 100 C, con il throttling termico rilevato secondo HWiNFO. Queste temperature elevate del core sono più calde che sul Razer Blade 16 in condizioni simili e sono responsabili anche delle temperature superficiali molto calde.
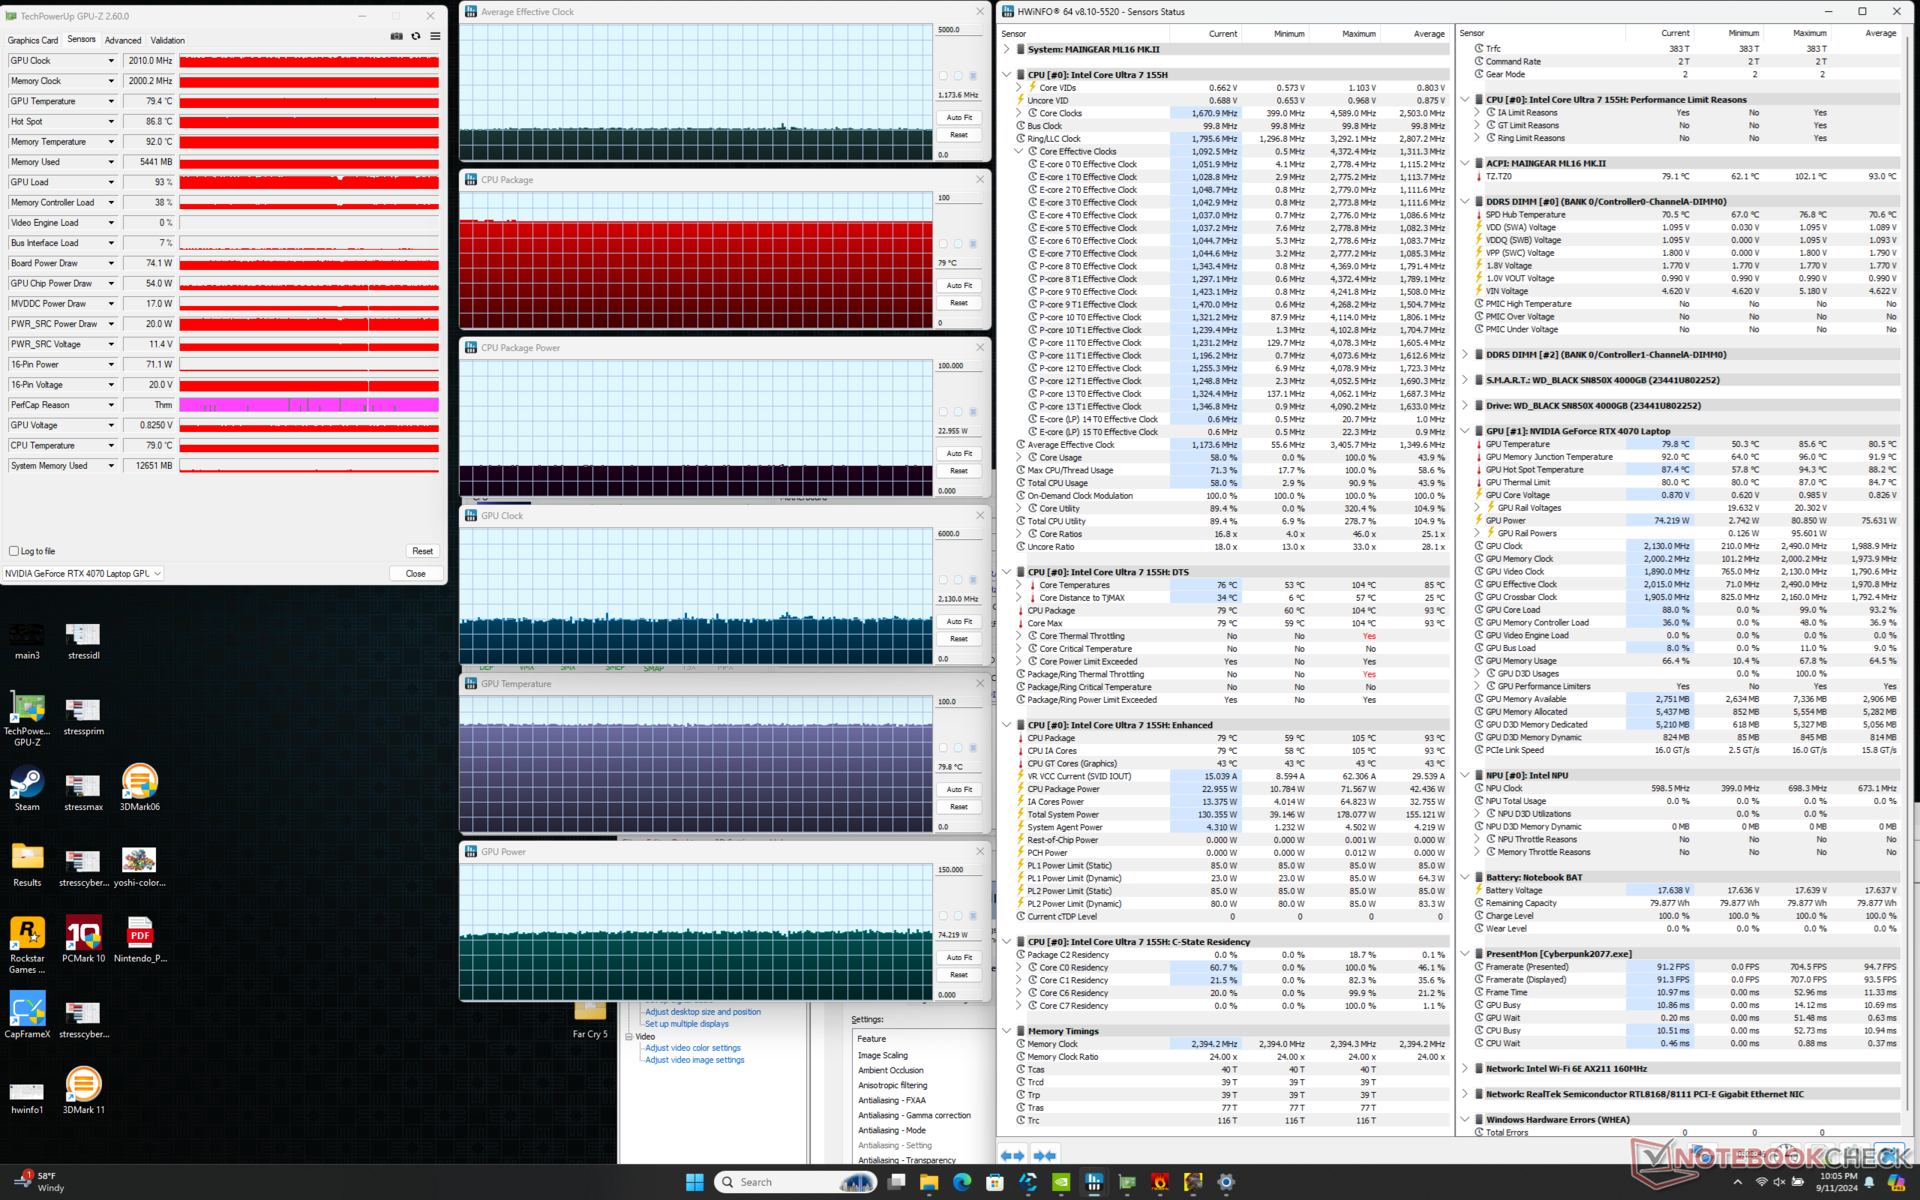
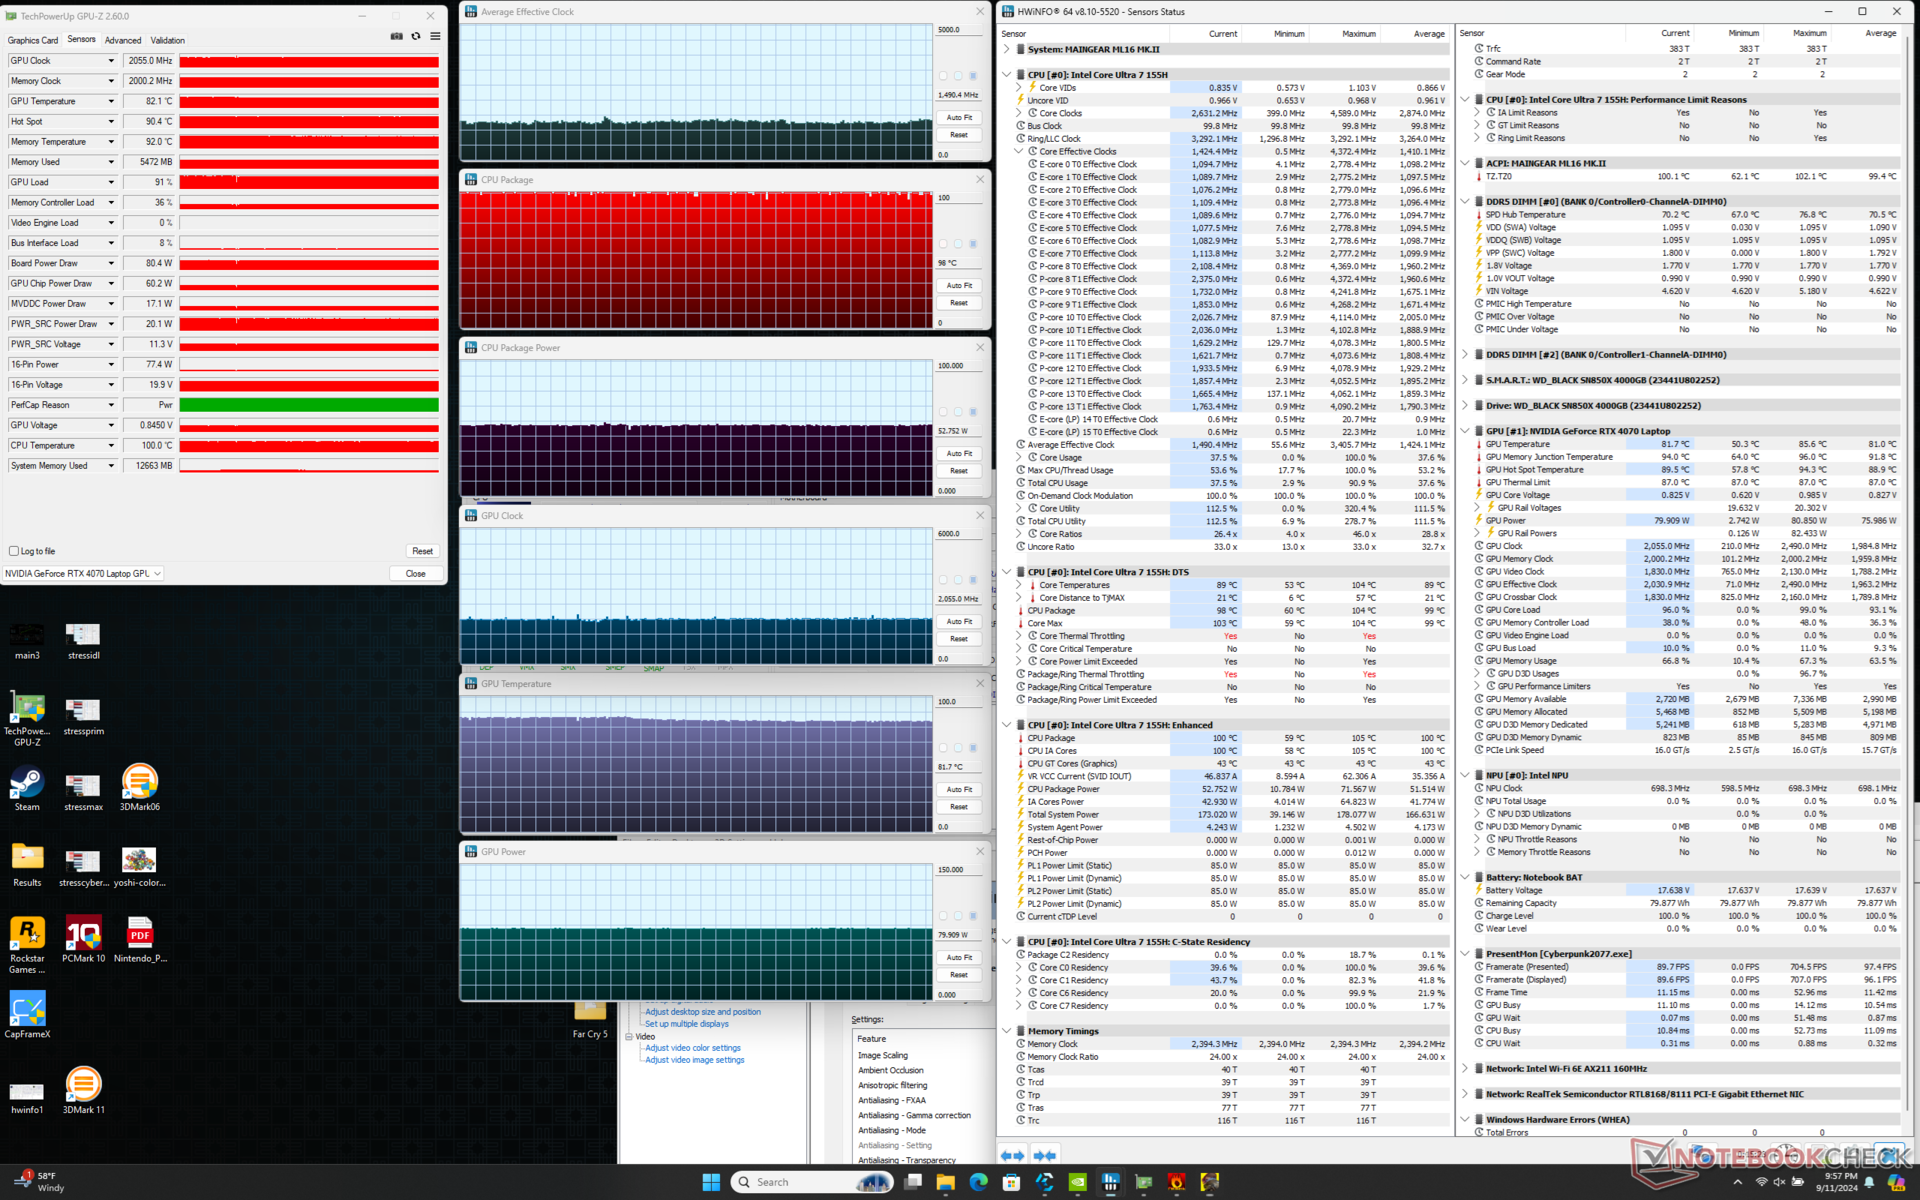
Quando si esegue Cyberpunk 2077 in modalità Performance, la GPU si stabilizza a 2160 MHz, 85 C e 80 W, rispetto ai 2010 MHz, 80 C e 74 W della più tranquilla modalità Balanced. Se il suo gioco non è pesante per la CPU, l'esecuzione in modalità Bilanciata potrebbe essere preferibile, in quanto la GPU non subisce un forte impatto. Si noti che il Pannello di controllo Nvidia indica un TGP di 105 W, ma secondo GPU-Z siamo in grado di raggiungere solo un massimo di 80 W durante il gioco.
Le temperature complessive del core durante il gioco sono molto più calde rispetto a quelle di alternative come il Blade 16. La nostra CPU e GPU si stabilizzerebbero rispettivamente a 101 C e 85 C, rispetto ai 78 C e 75 C del Razer. L'attivazione della modalità ventola massima ridurrebbe le temperature del core solo di pochi gradi C, senza migliorare le prestazioni.

| Clock medio della CPU (GHz) | Clock della GPU (MHz) | Temperatura media della CPU (°C) | Temperatura media della GPU (°C) | |
| Sistema inattivo | -- | -- | 48 | 40 |
| Stress Prime95 | 2.1 | -- | 73 - 101 | 53 |
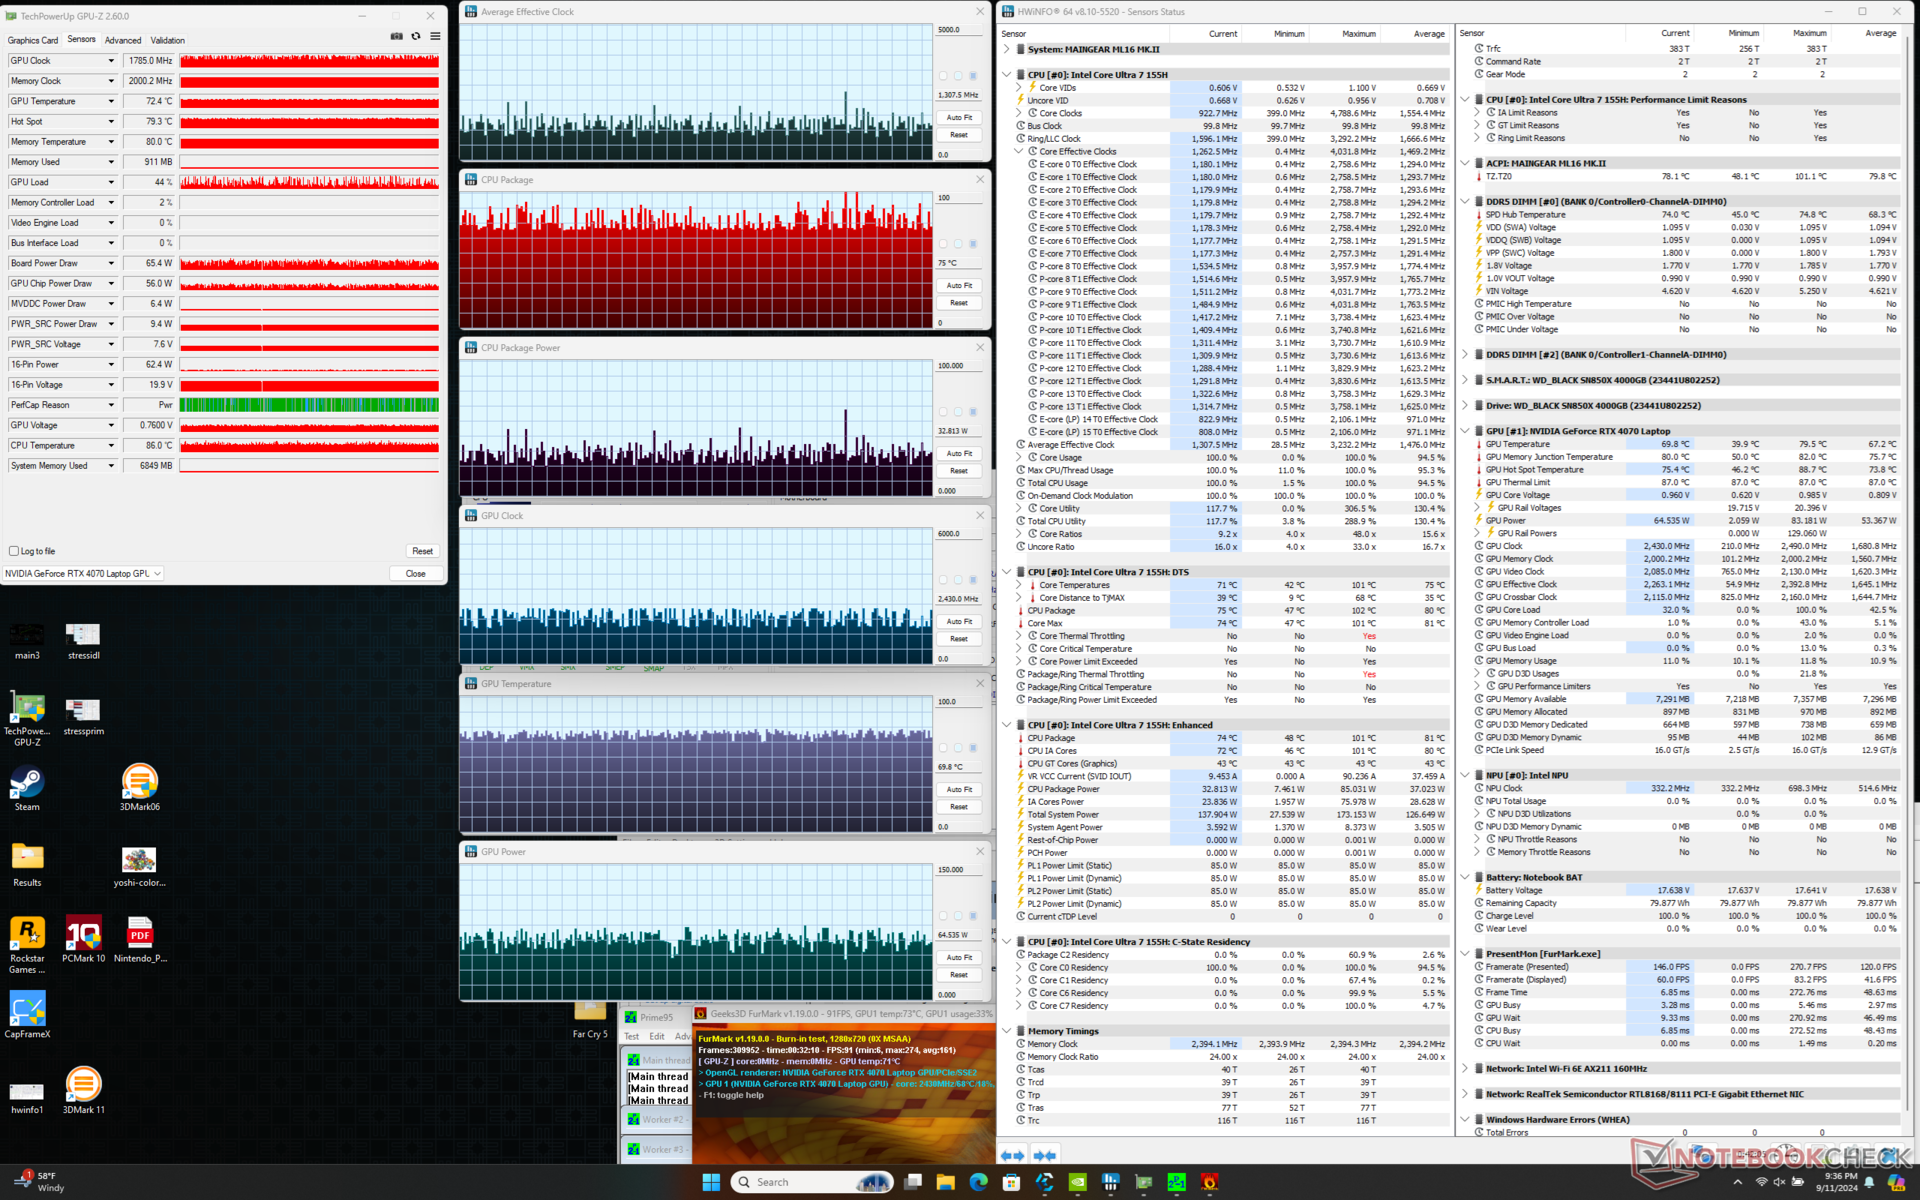
| Prime95 + FurMark Stress | 1.1 - 1.4 | ~1785 | 75 - 95 | ~70 |
| Cyberpunk 2077 Stress (modalità bilanciata) | 1.2 | 2010 | 79 | 80 |
| Cyberpunk 2077 Stress (modalità Performance con ventola massima disattivata) | 1.4 | 2160 | 101 | 85 |
| Cyberpunk 2077 Stress (modalità Performance con ventola massima attivata) | 1.5 | 2055 | 98 | 82 |
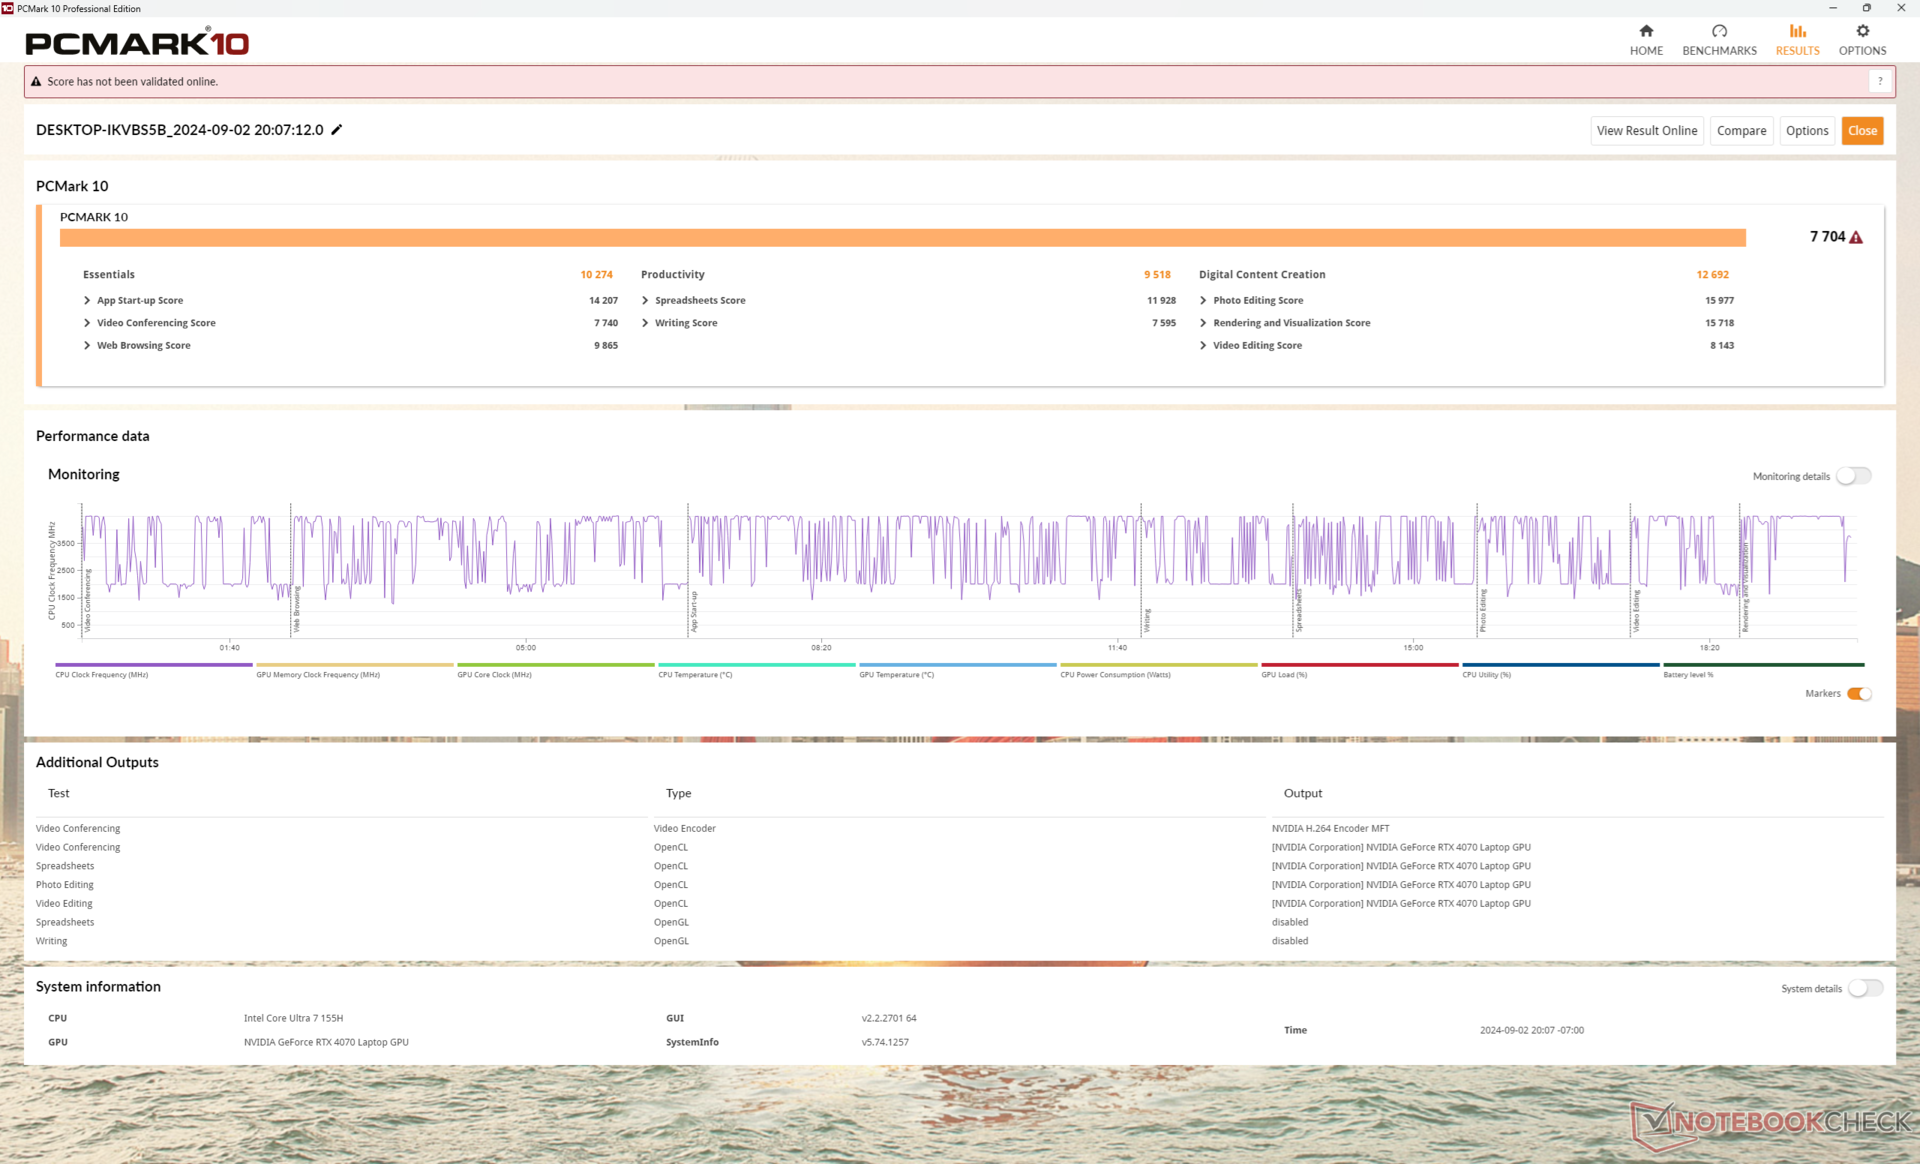
Prestazioni del sistema
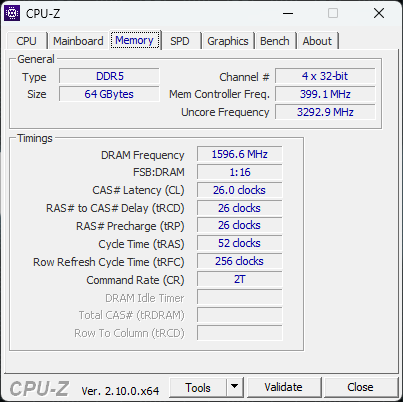
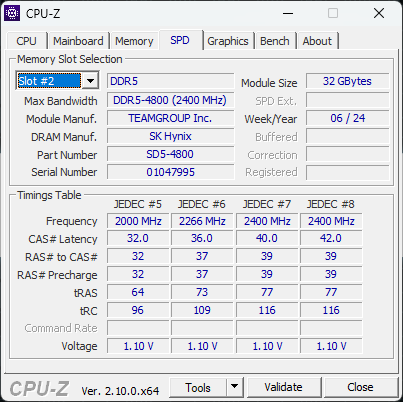
I punteggi di PCMark sono paragonabili a quelli di macchine concorrenti come HP Victus 16 o Asus ROG Zephyrus G16 per dimostrare che la maggior parte delle attività quotidiane non vengono eseguite in modo significativamente più veloce o più lento su Maingear, nonostante le differenze di specifiche. Tuttavia, i risultati di CrossMark e della memoria AIDA64 sono entrambi più bassi del previsto, a causa delle nostre prestazioni CPU grezze relativamente più lente e della RAM DDR5-4800. Concorrenti come il Blade 16 o l'Alienware m16 R2 sono dotati di DDR5-5600 o LPDDR5-7467 più veloci, rispettivamente.
CrossMark: Overall | Productivity | Creativity | Responsiveness
WebXPRT 3: Overall
WebXPRT 4: Overall
Mozilla Kraken 1.1: Total
| PCMark 10 / Score | |
| Lenovo Legion Pro 5 16IRX9 | |
| Razer Blade 16 2024, RTX 4090 | |
| Asus ROG Zephyrus G16 GA605WV | |
| Maingear ML-16 MK2 | |
| HP Victus 16 (2024) | |
| Media Intel Core Ultra 7 155H, NVIDIA GeForce RTX 4070 Laptop GPU (7084 - 7761, n=4) | |
| Alienware x16 R2 P120F | |
| PCMark 10 / Essentials | |
| Lenovo Legion Pro 5 16IRX9 | |
| Razer Blade 16 2024, RTX 4090 | |
| HP Victus 16 (2024) | |
| Maingear ML-16 MK2 | |
| Media Intel Core Ultra 7 155H, NVIDIA GeForce RTX 4070 Laptop GPU (10038 - 10393, n=4) | |
| Asus ROG Zephyrus G16 GA605WV | |
| Alienware x16 R2 P120F | |
| PCMark 10 / Productivity | |
| Razer Blade 16 2024, RTX 4090 | |
| Lenovo Legion Pro 5 16IRX9 | |
| Asus ROG Zephyrus G16 GA605WV | |
| HP Victus 16 (2024) | |
| Maingear ML-16 MK2 | |
| Media Intel Core Ultra 7 155H, NVIDIA GeForce RTX 4070 Laptop GPU (9192 - 9518, n=4) | |
| Alienware x16 R2 P120F | |
| PCMark 10 / Digital Content Creation | |
| Lenovo Legion Pro 5 16IRX9 | |
| Asus ROG Zephyrus G16 GA605WV | |
| Razer Blade 16 2024, RTX 4090 | |
| Alienware x16 R2 P120F | |
| Maingear ML-16 MK2 | |
| Media Intel Core Ultra 7 155H, NVIDIA GeForce RTX 4070 Laptop GPU (10100 - 13035, n=4) | |
| HP Victus 16 (2024) | |
| CrossMark / Overall | |
| Razer Blade 16 2024, RTX 4090 | |
| Lenovo Legion Pro 5 16IRX9 | |
| HP Victus 16 (2024) | |
| Asus ROG Zephyrus G16 GA605WV | |
| Media Intel Core Ultra 7 155H, NVIDIA GeForce RTX 4070 Laptop GPU (1687 - 1848, n=4) | |
| Maingear ML-16 MK2 | |
| Alienware x16 R2 P120F | |
| CrossMark / Productivity | |
| Razer Blade 16 2024, RTX 4090 | |
| Lenovo Legion Pro 5 16IRX9 | |
| HP Victus 16 (2024) | |
| Media Intel Core Ultra 7 155H, NVIDIA GeForce RTX 4070 Laptop GPU (1589 - 1750, n=4) | |
| Asus ROG Zephyrus G16 GA605WV | |
| Maingear ML-16 MK2 | |
| Alienware x16 R2 P120F | |
| CrossMark / Creativity | |
| Razer Blade 16 2024, RTX 4090 | |
| Lenovo Legion Pro 5 16IRX9 | |
| Asus ROG Zephyrus G16 GA605WV | |
| HP Victus 16 (2024) | |
| Media Intel Core Ultra 7 155H, NVIDIA GeForce RTX 4070 Laptop GPU (1860 - 2014, n=4) | |
| Maingear ML-16 MK2 | |
| Alienware x16 R2 P120F | |
| CrossMark / Responsiveness | |
| Razer Blade 16 2024, RTX 4090 | |
| HP Victus 16 (2024) | |
| Lenovo Legion Pro 5 16IRX9 | |
| Alienware x16 R2 P120F | |
| Media Intel Core Ultra 7 155H, NVIDIA GeForce RTX 4070 Laptop GPU (1424 - 1683, n=4) | |
| Maingear ML-16 MK2 | |
| Asus ROG Zephyrus G16 GA605WV | |
| WebXPRT 3 / Overall | |
| Razer Blade 16 2024, RTX 4090 | |
| Lenovo Legion Pro 5 16IRX9 | |
| Media Intel Core Ultra 7 155H, NVIDIA GeForce RTX 4070 Laptop GPU (264 - 294, n=4) | |
| HP Victus 16 (2024) | |
| Maingear ML-16 MK2 | |
| Alienware x16 R2 P120F | |
| WebXPRT 4 / Overall | |
| Lenovo Legion Pro 5 16IRX9 | |
| Asus ROG Zephyrus G16 GA605WV | |
| Media Intel Core Ultra 7 155H, NVIDIA GeForce RTX 4070 Laptop GPU (247 - 257, n=4) | |
| HP Victus 16 (2024) | |
| Maingear ML-16 MK2 | |
| Alienware x16 R2 P120F | |
| Mozilla Kraken 1.1 / Total | |
| Alienware x16 R2 P120F | |
| Maingear ML-16 MK2 | |
| Media Intel Core Ultra 7 155H, NVIDIA GeForce RTX 4070 Laptop GPU (546 - 568, n=3) | |
| HP Victus 16 (2024) | |
| Razer Blade 16 2024, RTX 4090 | |
| Lenovo Legion Pro 5 16IRX9 | |
| Asus ROG Zephyrus G16 GA605WV | |
* ... Meglio usare valori piccoli
| PCMark 10 Score | 7704 punti | |
Aiuto | ||
| AIDA64 / Memory Copy | |
| Alienware x16 R2 P120F | |
| Asus ROG Zephyrus G16 GA605WV | |
| Media Intel Core Ultra 7 155H (62397 - 96791, n=48) | |
| Lenovo Legion Pro 5 16IRX9 | |
| Razer Blade 16 2024, RTX 4090 | |
| HP Victus 16 (2024) | |
| Maingear ML-16 MK2 | |
| AIDA64 / Memory Read | |
| Asus ROG Zephyrus G16 GA605WV | |
| Razer Blade 16 2024, RTX 4090 | |
| Lenovo Legion Pro 5 16IRX9 | |
| Alienware x16 R2 P120F | |
| HP Victus 16 (2024) | |
| Media Intel Core Ultra 7 155H (60544 - 90647, n=48) | |
| Maingear ML-16 MK2 | |
| AIDA64 / Memory Write | |
| Asus ROG Zephyrus G16 GA605WV | |
| Lenovo Legion Pro 5 16IRX9 | |
| Razer Blade 16 2024, RTX 4090 | |
| Alienware x16 R2 P120F | |
| Media Intel Core Ultra 7 155H (58692 - 93451, n=48) | |
| HP Victus 16 (2024) | |
| Maingear ML-16 MK2 | |
| AIDA64 / Memory Latency | |
| Maingear ML-16 MK2 | |
| Media Intel Core Ultra 7 155H (116.2 - 233, n=48) | |
| Alienware x16 R2 P120F | |
| Asus ROG Zephyrus G16 GA605WV | |
| HP Victus 16 (2024) | |
| Razer Blade 16 2024, RTX 4090 | |
| Lenovo Legion Pro 5 16IRX9 | |
* ... Meglio usare valori piccoli
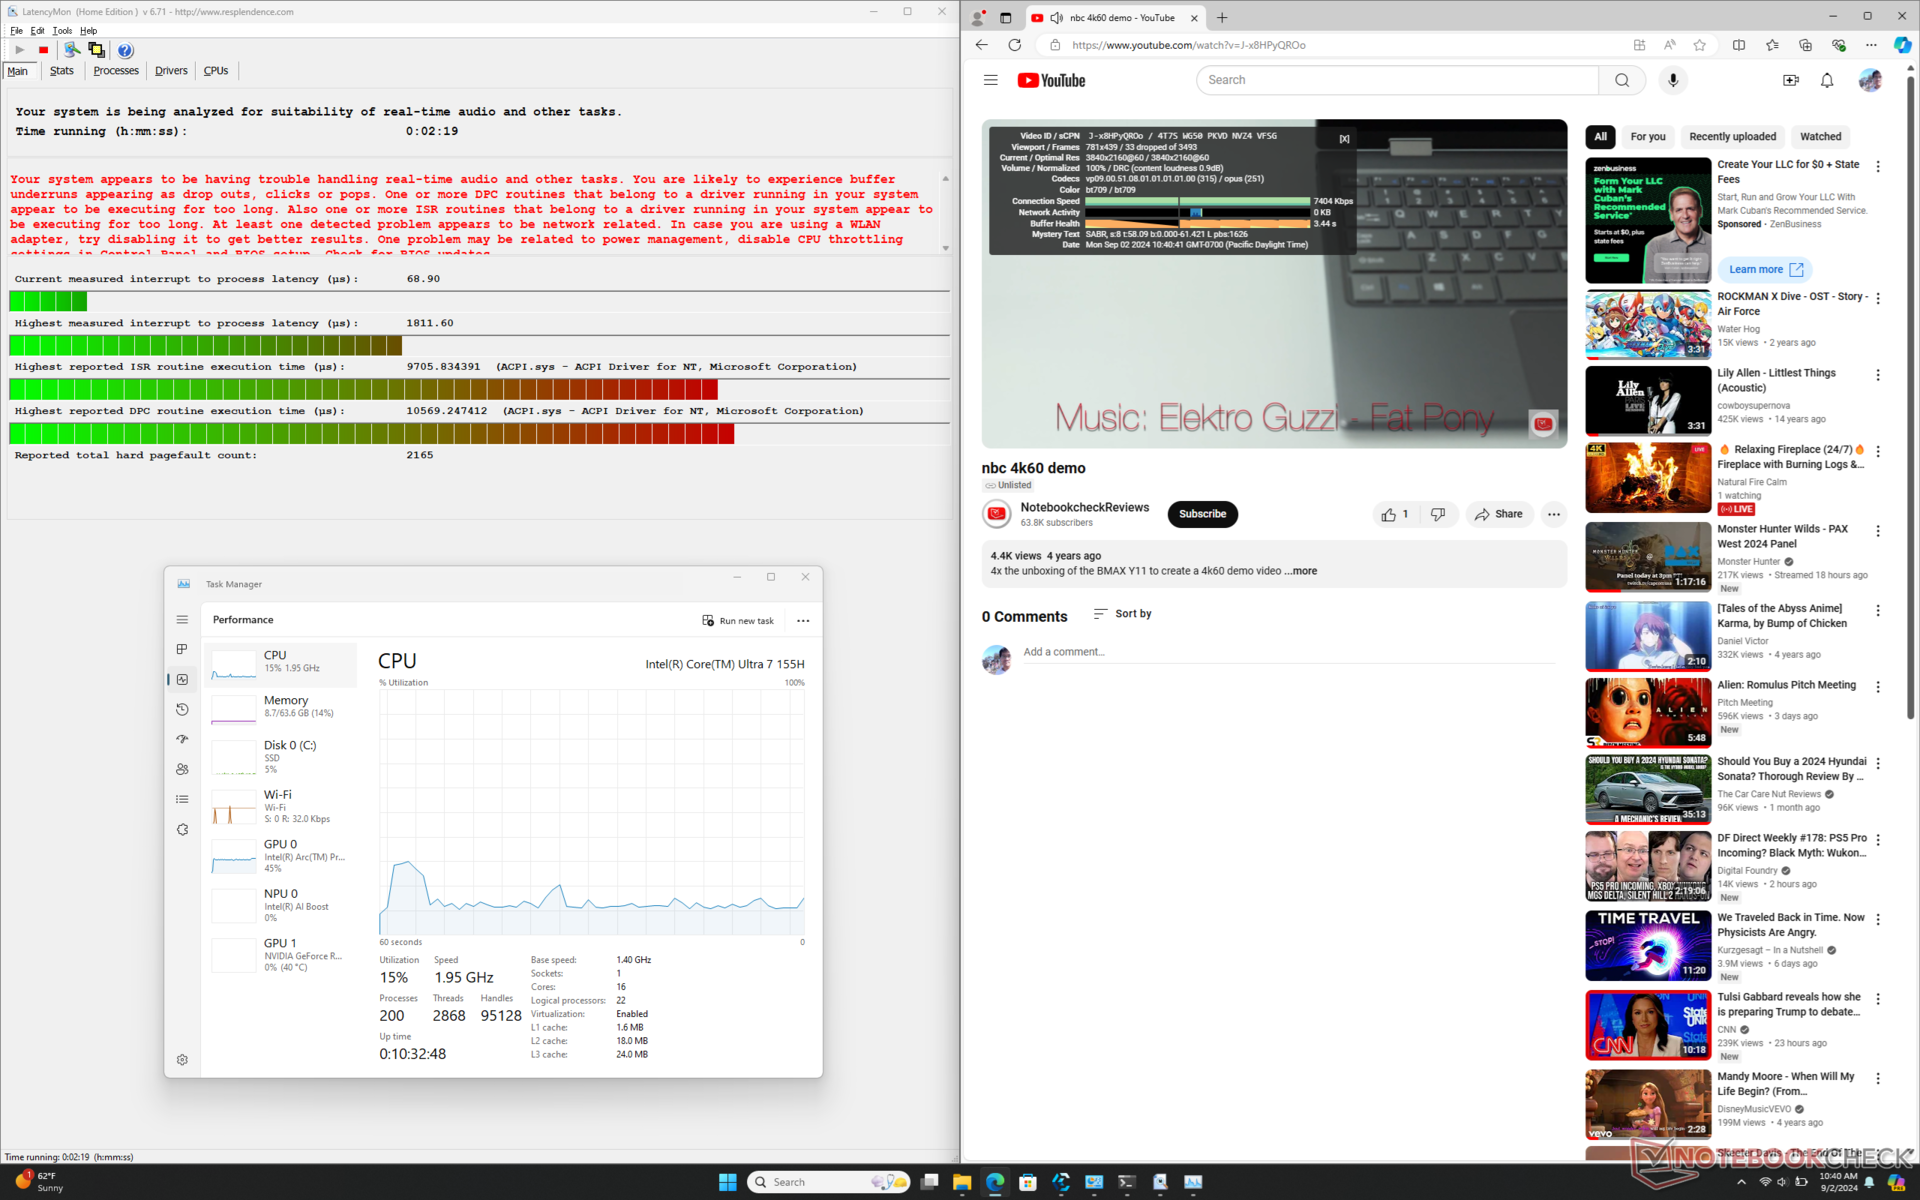
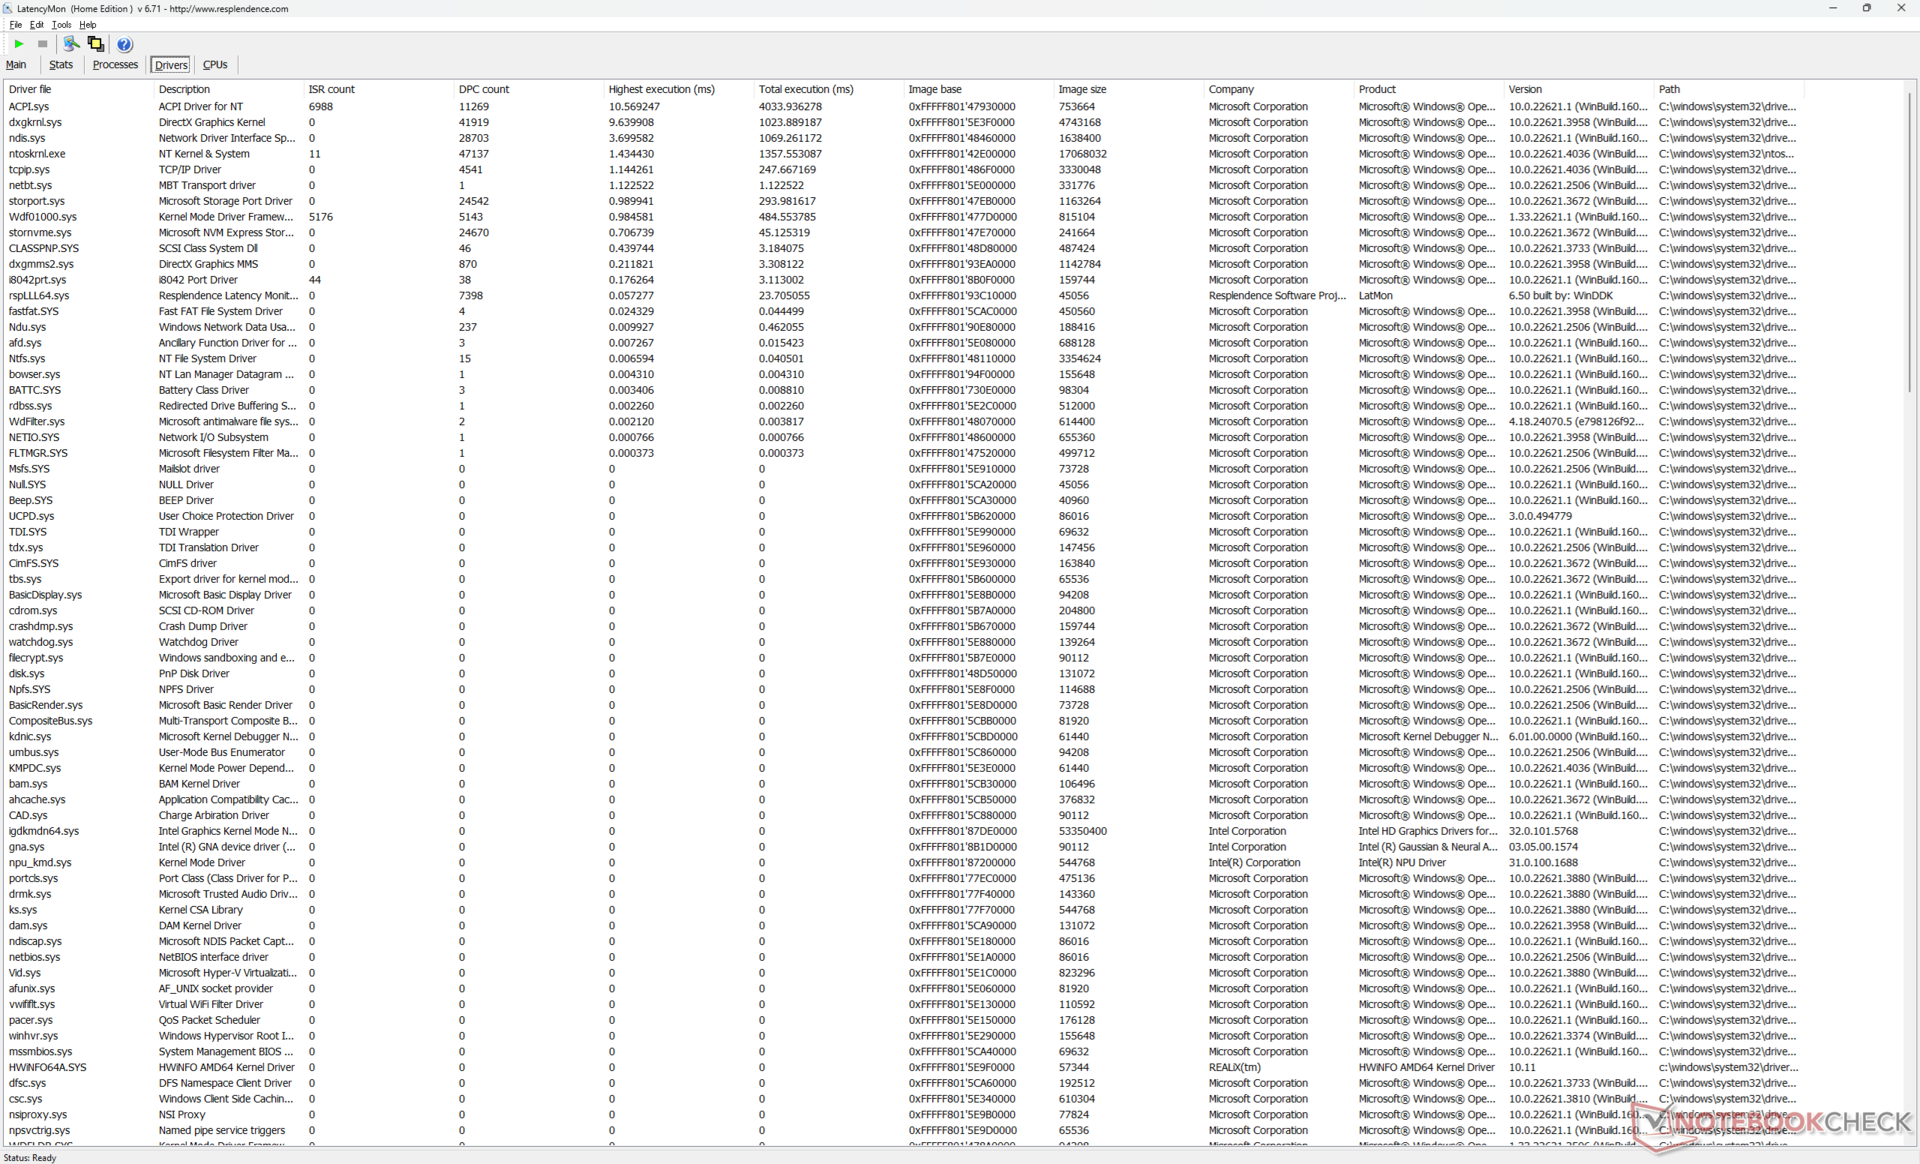
Latenza DPC
LatencyMon rivela problemi di DPC più grandi del previsto, legati ai driver ACPI, anche quando è in modalità MSHybrid. Inoltre, siamo riusciti a registrare 33 fotogrammi caduti durante un video di test 4K60 di 60 secondi, quando dovrebbero essere zero, soprattutto considerando la CPU Meteor Lake-H all'interno. Queste cadute di fotogrammi si manifestano come balbuzie durante lo streaming di video 4K e suggeriscono un problema di driver sottostante o una cattiva gestione delle attività in background che possono interrompere la finestra principale.
| DPC Latencies / LatencyMon - interrupt to process latency (max), Web, Youtube, Prime95 | |
| Alienware x16 R2 P120F | |
| Maingear ML-16 MK2 | |
| Razer Blade 16 2024, RTX 4090 | |
| Lenovo Legion Pro 5 16IRX9 | |
| HP Victus 16 (2024) | |
| Asus ROG Zephyrus G16 GA605WV | |
* ... Meglio usare valori piccoli
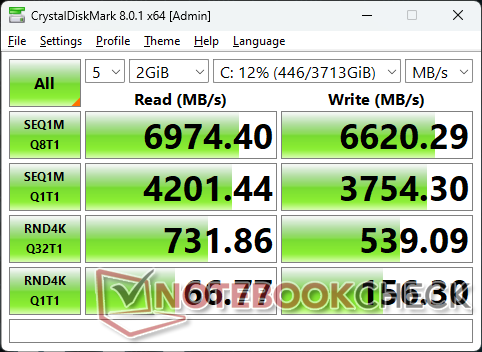
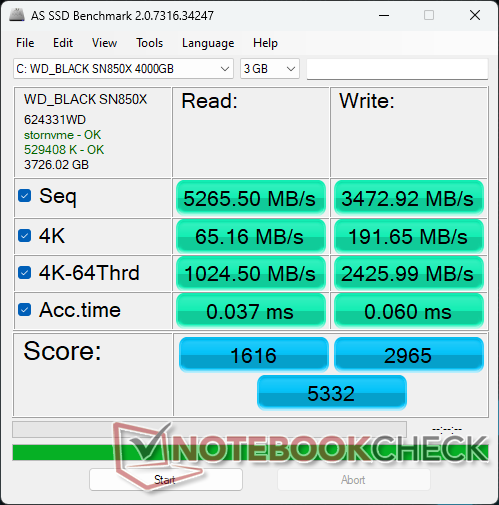
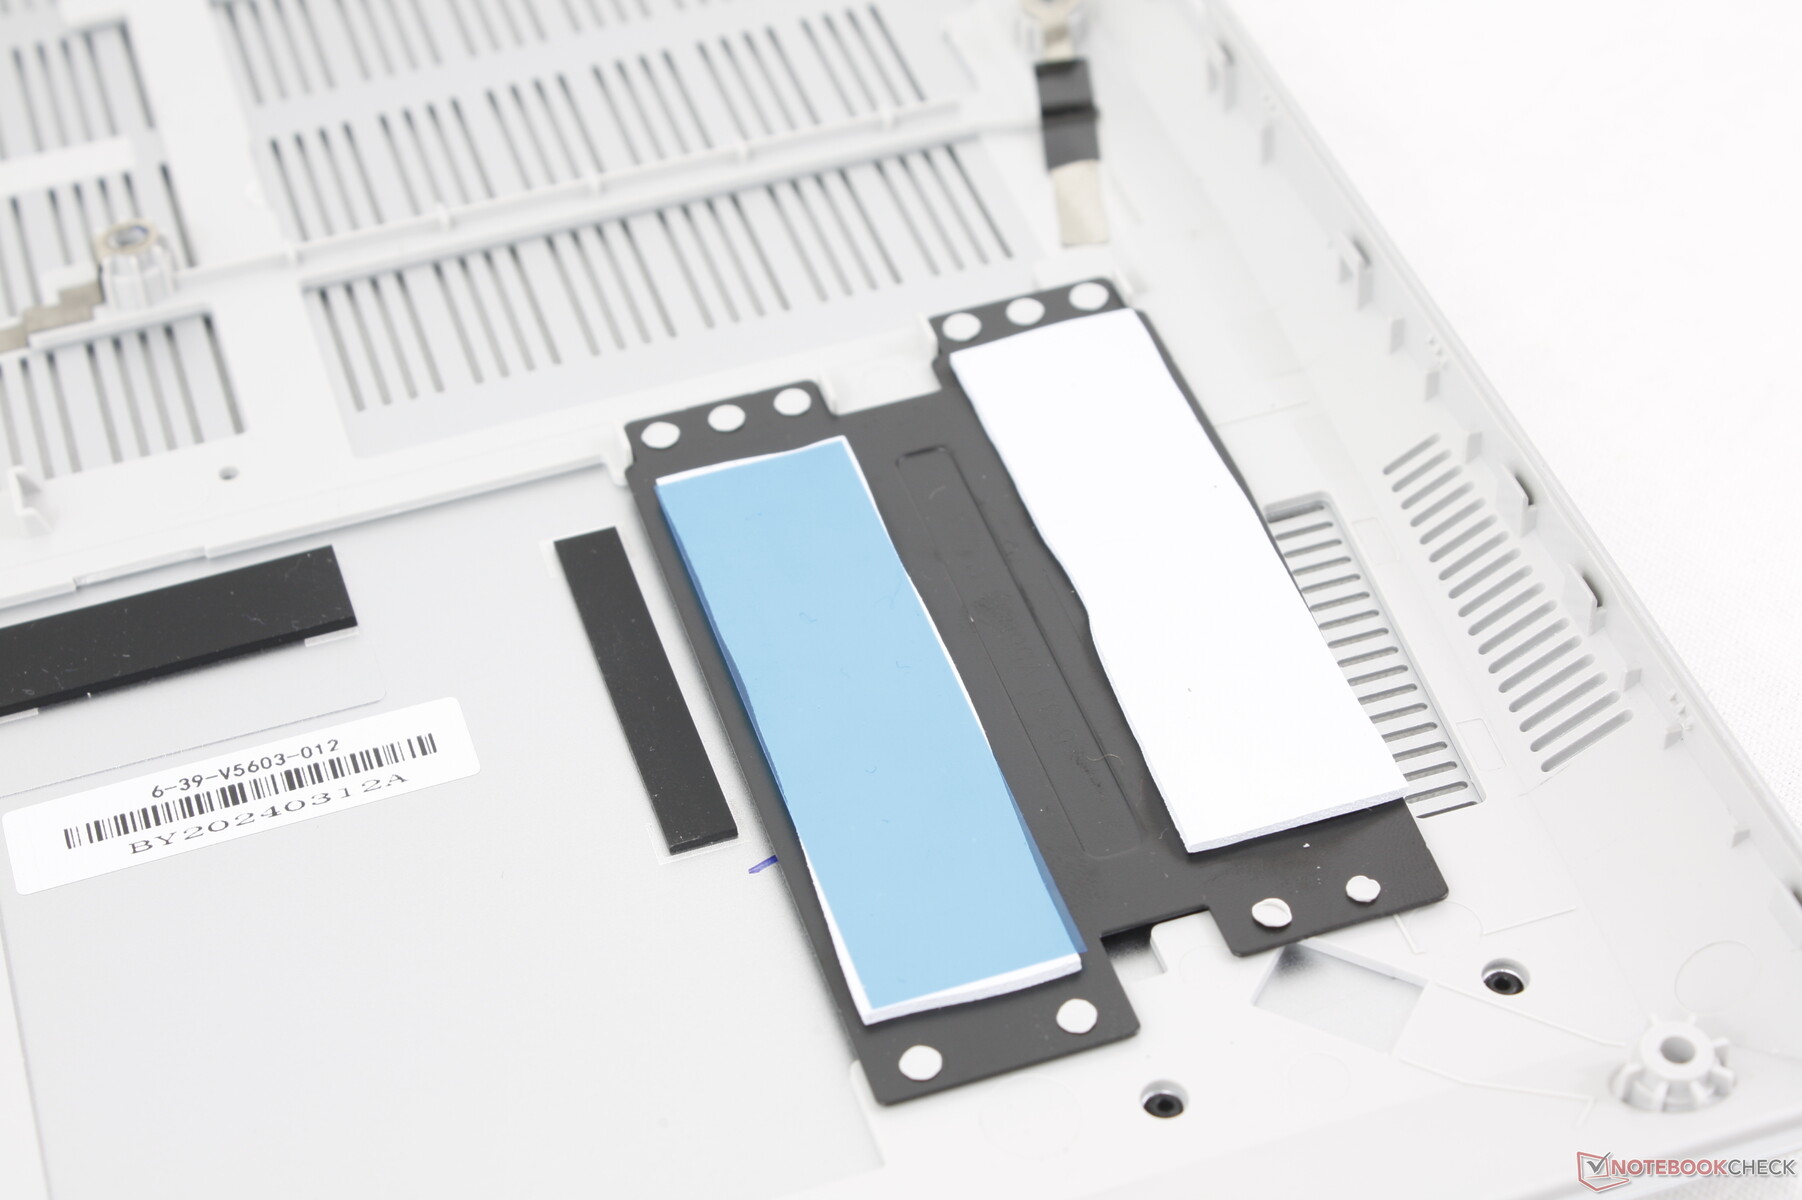
Dispositivi di archiviazione
Il Maingear è uno dei pochi sistemi che vengono forniti con 4 TB WD Black SN850X PCIe4 x4 NVMe. Le velocità di trasferimento sono eccellenti, con quasi 7000 MB/s e nessun throttling rilevato quando viene sollecitato. Apprezziamo il fatto che il dissipatore di calore e i pad termici siano forniti di serie per aiutare a dissipare il calore.

| Drive Performance Rating - Percent | |
| Lenovo Legion Pro 5 16IRX9 | |
| Alienware x16 R2 P120F | |
| Razer Blade 16 2024, RTX 4090 | |
| HP Victus 16 (2024) | |
| Maingear ML-16 MK2 | |
| Asus ROG Zephyrus G16 GA605WV | |
* ... Meglio usare valori piccoli
Disk Throttling: DiskSpd Read Loop, Queue Depth 8
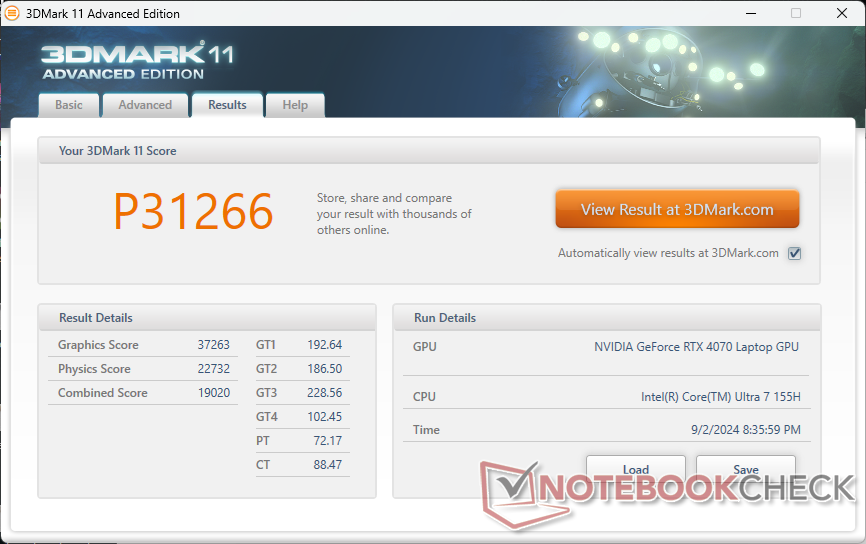
Prestazioni della GPU
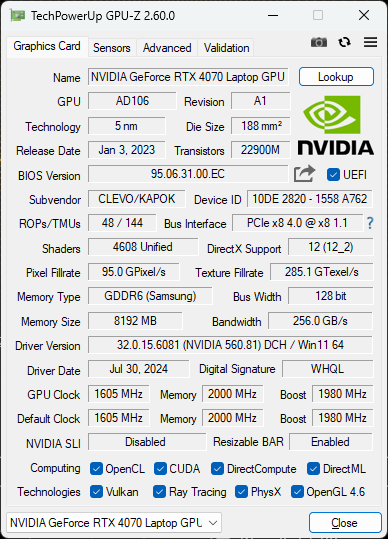
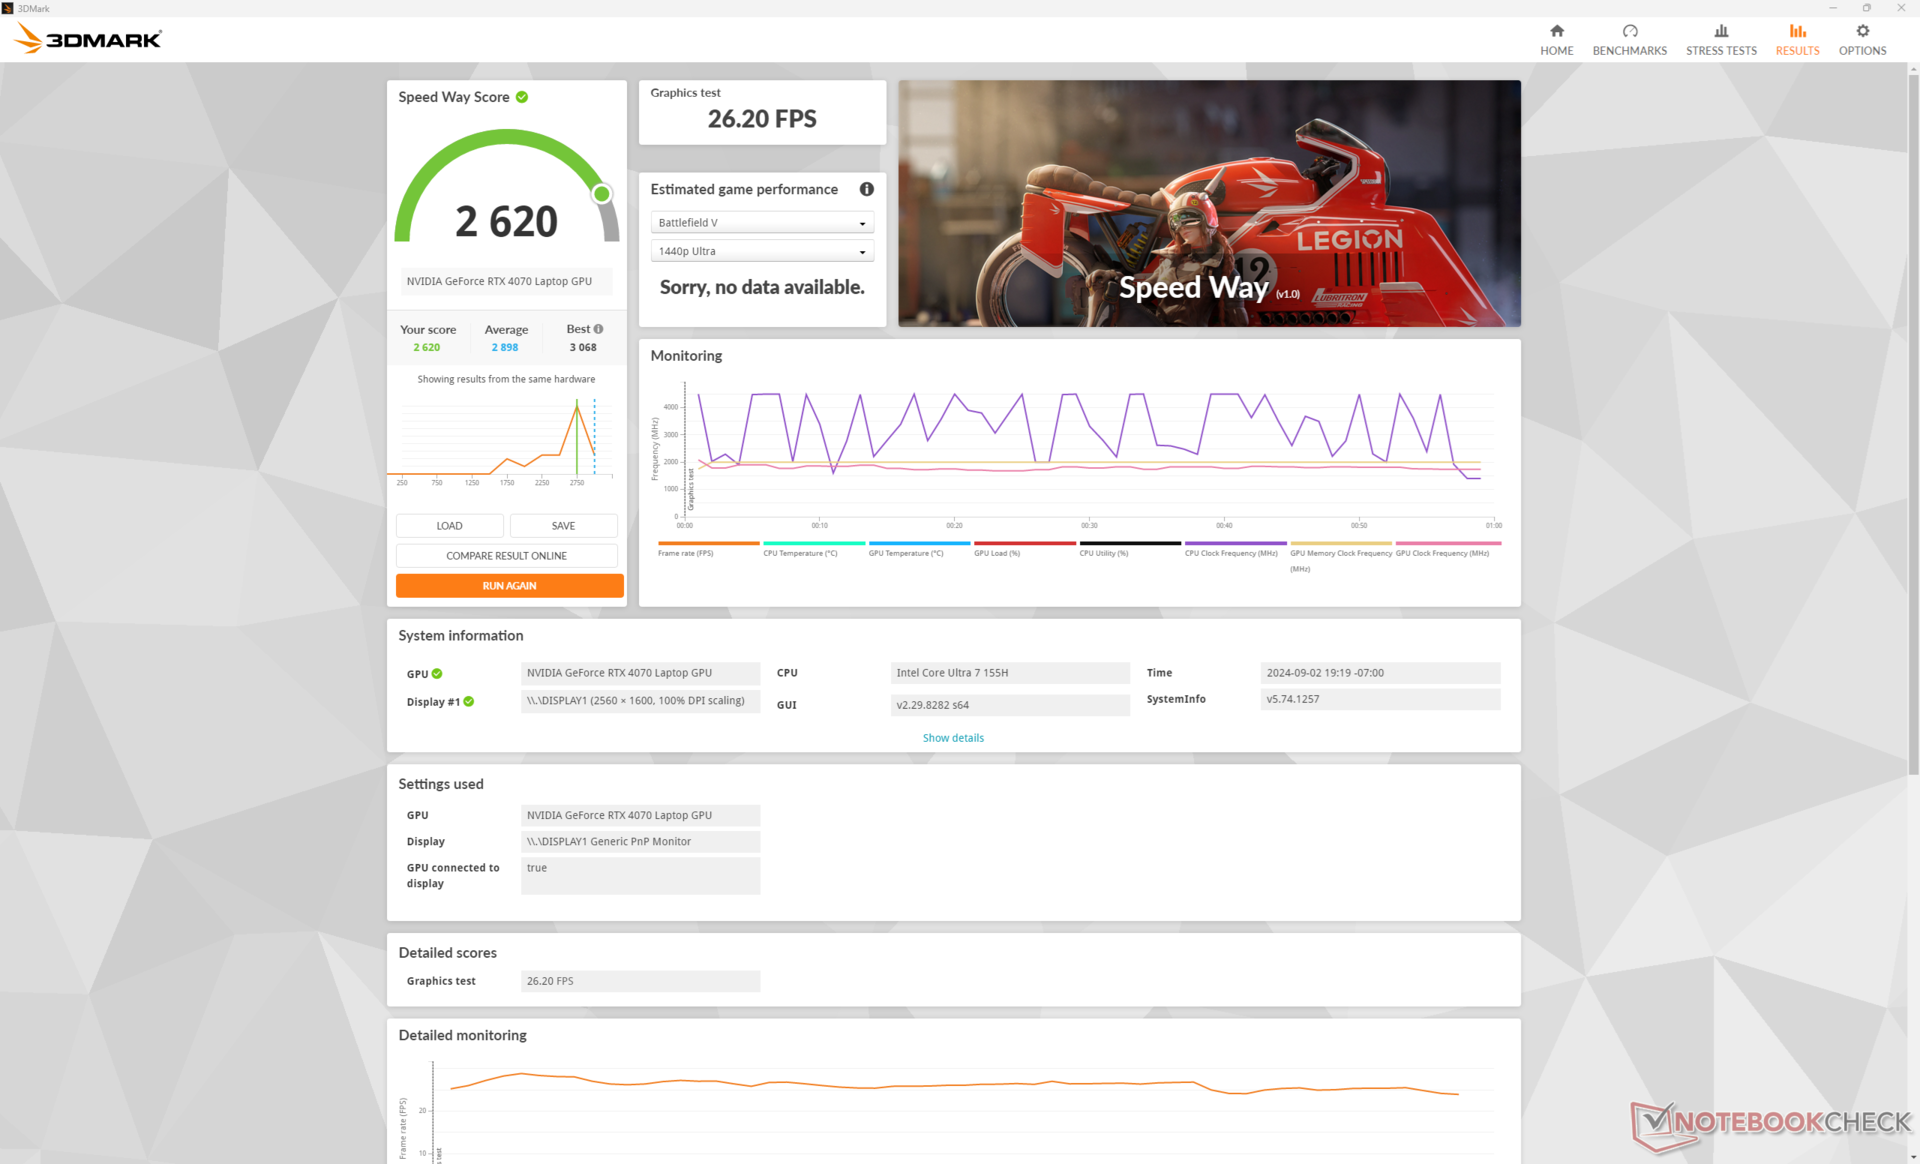
Il mobile GeForce RTX 4070 ha prestazioni di pochi punti percentuali più lente rispetto al laptop medio del nostro database con la stessa opzione GPU. Le prestazioni complessive sono migliori solo del 5-15% rispetto alla GPU di base RTX 4060 o circa il 15 percento in più rispetto alla più vecchia RTX 3070 Ti. Il divario diventa molto più ampio quando si confronta la RTX 4070 mobile con la RTX 4080 mobile rTX 4080 mobilema quest'ultima non è configurabile su questo modello.
Tenga presente che la RTX 4070 mobile è molto più lenta della sua controparte desktop di circa il 35-40%.
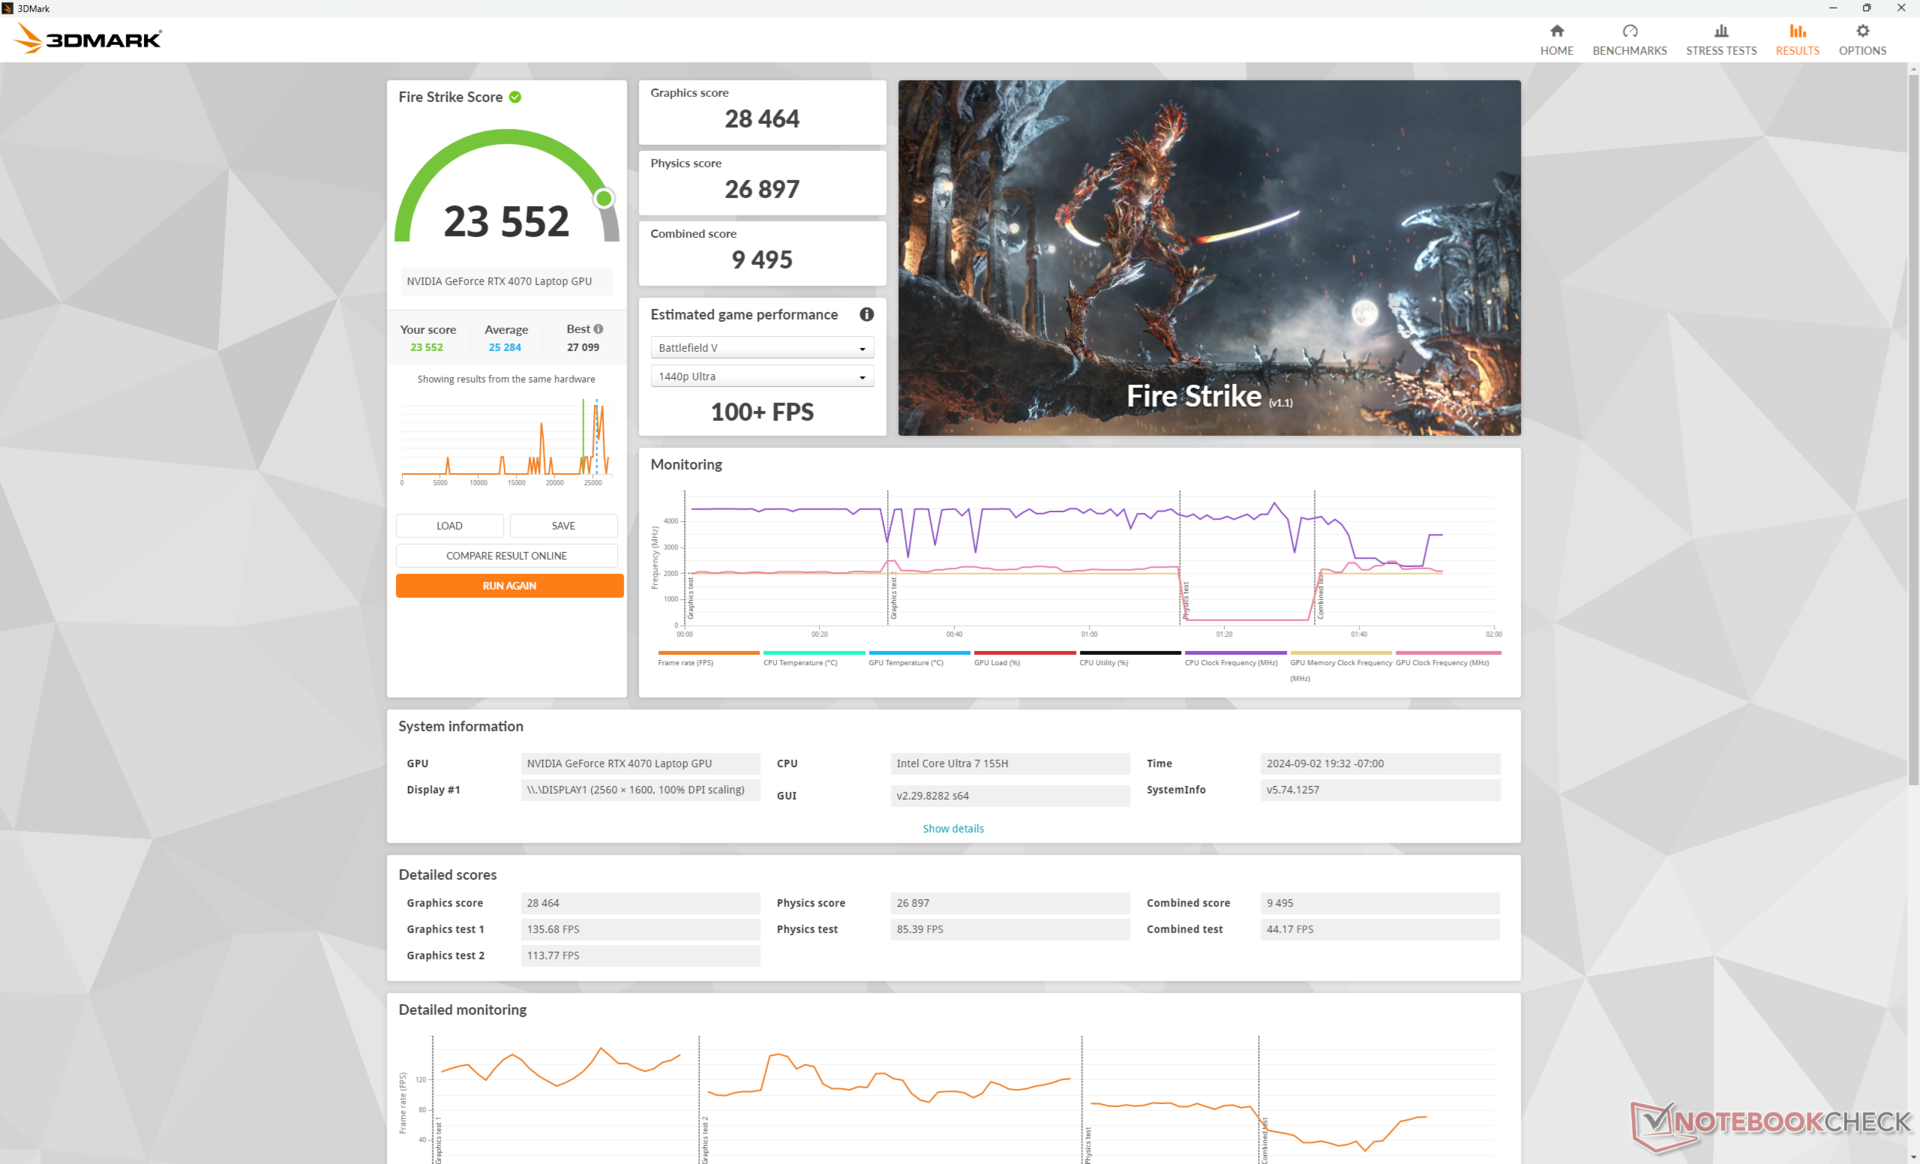
| Profilo di potenza | Punteggio grafico | Punteggio di fisica | Punteggio combinato |
| Modalità prestazioni | 28464 | 26897 | 9495 |
| Modalità equilibrata | 28238 (-0%) | 16060 (-40%) | 8049 (-15%) |
| Potenza della batteria | 5539 (-81%) | 12186 (-55%) | 1715 (-82%) |
L'esecuzione in modalità Bilanciata invece che in modalità Prestazioni ha un impatto significativo sulle prestazioni della CPU, mentre le prestazioni grafiche rimangono inalterate, secondo la nostra tabella dei risultati Fire Strike qui sopra. Ciò è in linea con le nostre osservazioni nella sezione Stress Test di cui sopra. Il funzionamento a batteria ha un ulteriore impatto sulle prestazioni complessive, anche quando è impostato sulla modalità Prestazioni.
| 3DMark Performance Rating - Percent | |
| Razer Blade 16 2024, RTX 4090 -1! | |
| KFA2 GeForce RTX 4070 EX Gamer | |
| Alienware x16 R2 P120F | |
| Lenovo Yoga Pro 9 16IMH9 -1! | |
| Media NVIDIA GeForce RTX 4070 Laptop GPU | |
| Maingear ML-16 MK2 | |
| HP Victus 16 (2024) -1! | |
| HP Omen 16-b0085ng -1! | |
| CSL GameStar Notebook VenomGamer G16 -1! | |
| Asus ROG Zephyrus M16 GU603Z -1! | |
| Asus TUF Gaming A16 FA617XS | |
| HP Victus 16-r0076TX | |
| HP Omen 16-n0033dx | |
| Acer Nitro 16 AN16-41-R7YE | |
| Lenovo Legion C7 15IMH05 82EH0030GE -1! | |
| 3DMark 11 Performance | 31266 punti | |
| 3DMark Cloud Gate Standard Score | 57717 punti | |
| 3DMark Fire Strike Score | 23552 punti | |
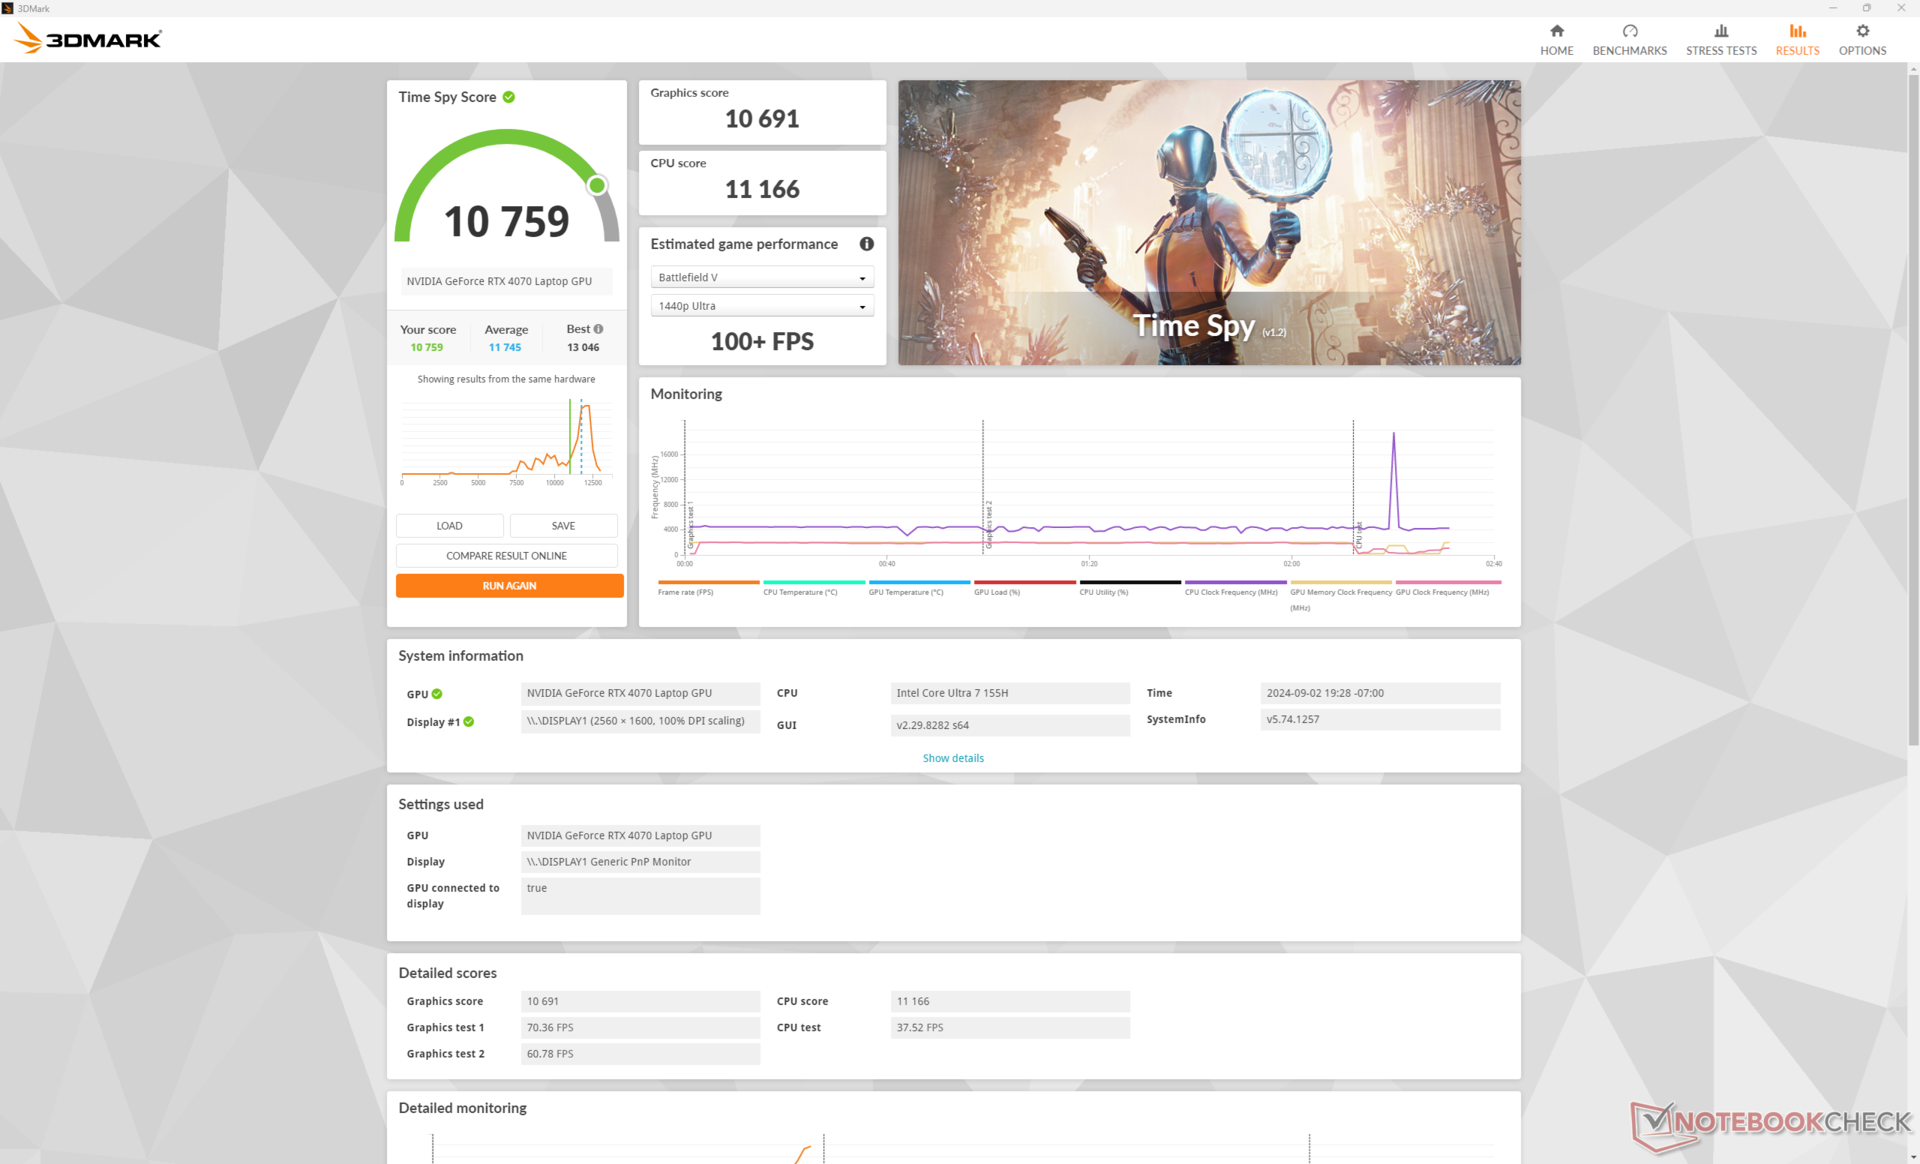
| 3DMark Time Spy Score | 10759 punti | |
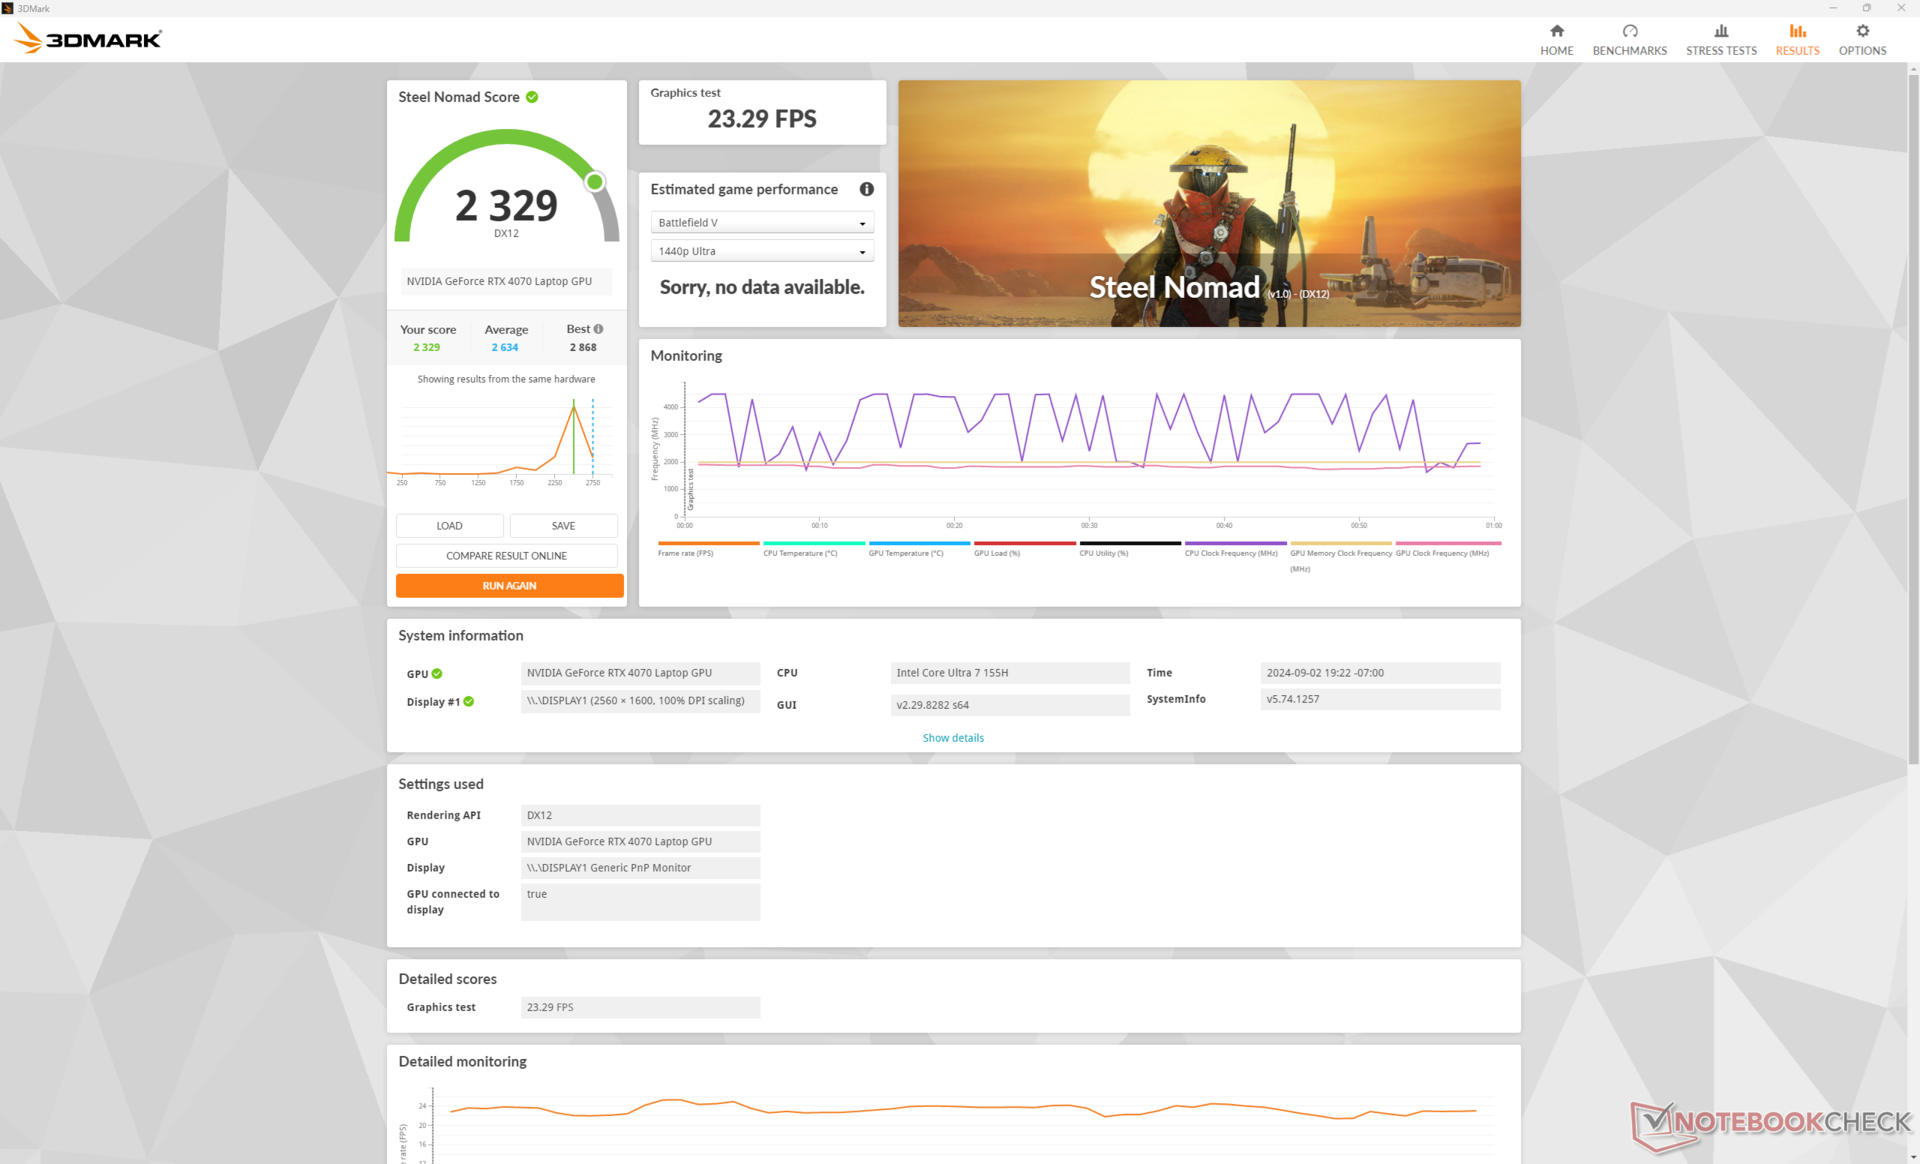
| 3DMark Steel Nomad Score | 2329 punti | |
Aiuto | ||
* ... Meglio usare valori piccoli
Prestazioni di gioco
La RTX 4070 mobile è abbastanza potente da far girare i titoli moderni con le impostazioni massime alla risoluzione nativa QHD+. Anche titoli più impegnativi come Cyberpunk 2077 sono possibili, sebbene richiedano DLSS per raggiungere 60 FPS o più. Eseguendo il benchmark in-game con impostazioni Ultra RT e 1600p nativi, ad esempio, si otterrebbe un frame rate medio di soli 20,2 contro 63,1 con DLSS 3 Balanced attivato.
| Performance Rating - Percent | |
| Razer Blade 16 2024, RTX 4090 | |
| Lenovo Legion Pro 5 16IRX9 | |
| Alienware x16 R2 P120F -1! | |
| Maingear ML-16 MK2 | |
| HP Victus 16 (2024) -1! | |
| Asus ROG Zephyrus G16 GA605WV | |
| GTA V - 1920x1080 Highest Settings possible AA:4xMSAA + FX AF:16x | |
| Razer Blade 16 2024, RTX 4090 | |
| Lenovo Legion Pro 5 16IRX9 | |
| Maingear ML-16 MK2 | |
| HP Victus 16 (2024) | |
| Asus ROG Zephyrus G16 GA605WV | |
| Final Fantasy XV Benchmark - 1920x1080 High Quality | |
| Alienware x16 R2 P120F | |
| Razer Blade 16 2024, RTX 4090 | |
| Lenovo Legion Pro 5 16IRX9 | |
| Maingear ML-16 MK2 | |
| HP Victus 16 (2024) | |
| Asus ROG Zephyrus G16 GA605WV | |
| Strange Brigade - 1920x1080 ultra AA:ultra AF:16 | |
| Razer Blade 16 2024, RTX 4090 | |
| Alienware x16 R2 P120F | |
| Lenovo Legion Pro 5 16IRX9 | |
| Maingear ML-16 MK2 | |
| HP Victus 16 (2024) | |
| Asus ROG Zephyrus G16 GA605WV | |
| Dota 2 Reborn - 1920x1080 ultra (3/3) best looking | |
| Razer Blade 16 2024, RTX 4090 | |
| Lenovo Legion Pro 5 16IRX9 | |
| HP Victus 16 (2024) | |
| Asus ROG Zephyrus G16 GA605WV | |
| Maingear ML-16 MK2 | |
| Alienware x16 R2 P120F | |
| X-Plane 11.11 - 1920x1080 high (fps_test=3) | |
| Razer Blade 16 2024, RTX 4090 | |
| Lenovo Legion Pro 5 16IRX9 | |
| HP Victus 16 (2024) | |
| Maingear ML-16 MK2 | |
| Alienware x16 R2 P120F | |
| Asus ROG Zephyrus G16 GA605WV | |
| Far Cry 5 - 1920x1080 Ultra Preset AA:T | |
| Lenovo Legion Pro 5 16IRX9 | |
| Razer Blade 16 2024, RTX 4090 | |
| Alienware x16 R2 P120F | |
| Maingear ML-16 MK2 | |
| Asus ROG Zephyrus G16 GA605WV | |
| Baldur's Gate 3 | |
| 1920x1080 High Preset | |
| Alienware x16 R2 P120F | |
| Lenovo Yoga Pro 9 16IMH9 | |
| Maingear ML-16 MK2 | |
| Media NVIDIA GeForce RTX 4070 Laptop GPU (72.7 - 129.3, n=25) | |
| CSL GameStar Notebook VenomGamer G16 | |
| 1920x1080 Ultra Preset | |
| Alienware x16 R2 P120F | |
| Lenovo Yoga Pro 9 16IMH9 | |
| Maingear ML-16 MK2 | |
| Media NVIDIA GeForce RTX 4070 Laptop GPU (66.7 - 128.5, n=26) | |
| CSL GameStar Notebook VenomGamer G16 | |
| 2560x1440 Ultra Preset | |
| Alienware x16 R2 P120F | |
| Lenovo Yoga Pro 9 16IMH9 | |
| Media NVIDIA GeForce RTX 4070 Laptop GPU (54.4 - 89.6, n=22) | |
| Maingear ML-16 MK2 | |
| CSL GameStar Notebook VenomGamer G16 | |
| Tiny Tina's Wonderlands | |
| 1920x1080 High Preset (DX12) | |
| KFA2 GeForce RTX 4070 EX Gamer | |
| Alienware x16 R2 P120F | |
| Media NVIDIA GeForce RTX 4070 Laptop GPU (74.3 - 151.4, n=13) | |
| Maingear ML-16 MK2 | |
| Asus TUF Gaming A16 FA617XS | |
| 1920x1080 Badass Preset (DX12) | |
| KFA2 GeForce RTX 4070 EX Gamer | |
| Alienware x16 R2 P120F | |
| Media NVIDIA GeForce RTX 4070 Laptop GPU (58.6 - 115.9, n=16) | |
| Maingear ML-16 MK2 | |
| Asus TUF Gaming A16 FA617XS | |
| 2560x1440 Badass Preset (DX12) | |
| KFA2 GeForce RTX 4070 EX Gamer | |
| Alienware x16 R2 P120F | |
| Media NVIDIA GeForce RTX 4070 Laptop GPU (49.8 - 79.5, n=16) | |
| Maingear ML-16 MK2 | |
| Cyberpunk 2077 2.1 Phantom Liberty | |
| 1920x1080 Medium Preset (FSR off) | |
| Alienware x16 R2 P120F | |
| Media NVIDIA GeForce RTX 4070 Laptop GPU (81.6 - 124.5, n=28) | |
| Lenovo Yoga Pro 9 16IMH9 | |
| Maingear ML-16 MK2 | |
| HP Victus 16 (2024) | |
| CSL GameStar Notebook VenomGamer G16 | |
| 1920x1080 High Preset (FSR off) | |
| Alienware x16 R2 P120F | |
| Media NVIDIA GeForce RTX 4070 Laptop GPU (74.7 - 103.6, n=29) | |
| Lenovo Yoga Pro 9 16IMH9 | |
| Maingear ML-16 MK2 | |
| HP Victus 16 (2024) | |
| CSL GameStar Notebook VenomGamer G16 | |
| 1920x1080 Ultra Preset (FSR off) | |
| Alienware x16 R2 P120F | |
| Razer Blade 16 2024, RTX 4090 | |
| Media NVIDIA GeForce RTX 4070 Laptop GPU (30.7 - 90.7, n=36) | |
| Lenovo Yoga Pro 9 16IMH9 | |
| Maingear ML-16 MK2 | |
| HP Victus 16 (2024) | |
| CSL GameStar Notebook VenomGamer G16 | |
| 2560x1440 Ultra Preset (FSR off) | |
| Razer Blade 16 2024, RTX 4090 | |
| Alienware x16 R2 P120F | |
| Media NVIDIA GeForce RTX 4070 Laptop GPU (24.8 - 57.1, n=34) | |
| Lenovo Yoga Pro 9 16IMH9 | |
| Maingear ML-16 MK2 | |
| CSL GameStar Notebook VenomGamer G16 | |
Cyberpunk 2077 ultra FPS Chart
| basso | medio | alto | ultra | QHD | |
|---|---|---|---|---|---|
| GTA V (2015) | 183.3 | 180.4 | 175 | 115.1 | 90.6 |
| Dota 2 Reborn (2015) | 173.4 | 152.8 | 145.3 | 139.2 | |
| Final Fantasy XV Benchmark (2018) | 187.6 | 146.3 | 110.6 | 80 | |
| X-Plane 11.11 (2018) | 139.9 | 124.4 | 89.8 | ||
| Far Cry 5 (2018) | 125 | 125 | 114 | 101 | |
| Strange Brigade (2018) | 477 | 284 | 224 | 192.8 | 127.9 |
| Tiny Tina's Wonderlands (2022) | 218.7 | 180.9 | 119.4 | 92.9 | 62.7 |
| F1 22 (2022) | 252 | 250 | 206 | 69.2 | 42.9 |
| Baldur's Gate 3 (2023) | 152 | 125.9 | 108.2 | 106.8 | 70.6 |
| Cyberpunk 2077 2.1 Phantom Liberty (2023) | 130 | 106.1 | 88.1 | 76.4 | 44.3 |
Emissioni - Calde e rumorose
Rumore del sistema
Il rumore della ventola durante la navigazione o lo streaming video tende a raggiungere i 27 dB(A) contro uno sfondo silenzioso di 23 dB(A), per essere percepibile ma tollerabile quando si imposta la modalità Quiet. Se si gioca in modalità Performance, il rumore della ventola diventa molto forte, con un valore di poco superiore a 55 dB(A), più forte di quello di concorrenti come Victus 16, Alienware x16 R2o Legion Pro 5 16. Abilitando il rumore massimo della ventola, il rumore della ventola aumenterebbe ulteriormente fino a quasi 58 dB(A).

Rumorosità
| Idle |
| 24.1 / 24.1 / 25.6 dB(A) |
| Sotto carico |
| 44.3 / 57.8 dB(A) |
 | ||
30 dB silenzioso 40 dB(A) udibile 50 dB(A) rumoroso |
||
min: | ||
| Maingear ML-16 MK2 NVIDIA GeForce RTX 4070 Laptop GPU, Ultra 7 155H | Asus ROG Zephyrus G16 GA605WV NVIDIA GeForce RTX 4060 Laptop GPU, Ryzen AI 9 HX 370, Micron 2400 MTFDKBA1T0QFM | HP Victus 16 (2024) NVIDIA GeForce RTX 4060 Laptop GPU, i7-14700HX, Kioxia XG8 KXG80ZNV512G | Alienware x16 R2 P120F NVIDIA GeForce RTX 4080 Laptop GPU, Ultra 9 185H, WDC PC SN810 1TB | Lenovo Legion Pro 5 16IRX9 NVIDIA GeForce RTX 4070 Laptop GPU, i9-14900HX, Samsung PM9A1 MZVL21T0HCLR | Razer Blade 16 2024, RTX 4090 NVIDIA GeForce RTX 4090 Laptop GPU, i9-14900HX, Samsung PM9A1 MZVL22T0HBLB | |
|---|---|---|---|---|---|---|
| Noise | -4% | -10% | 2% | -3% | 3% | |
| off /ambiente * | 23 | 24.6 -7% | 25 -9% | 23.4 -2% | 23.9 -4% | 23 -0% |
| Idle Minimum * | 24.1 | 28.6 -19% | 28 -16% | 23.8 1% | 24.3 -1% | 23 5% |
| Idle Average * | 24.1 | 28.6 -19% | 29 -20% | 28.5 -18% | 24.3 -1% | 23 5% |
| Idle Maximum * | 25.6 | 28.6 -12% | 33 -29% | 28.5 -11% | 28.9 -13% | 27.66 -8% |
| Load Average * | 44.3 | 42.8 3% | 45 -2% | 28.8 35% | 45.8 -3% | 43.76 1% |
| Cyberpunk 2077 ultra * | 55.4 | 48.3 13% | ||||
| Load Maximum * | 57.8 | 48.3 16% | 48 17% | 54.2 6% | 56.6 2% | 50.37 13% |
| Witcher 3 ultra * | 43 | 49.5 | 51 | 46.81 |
* ... Meglio usare valori piccoli
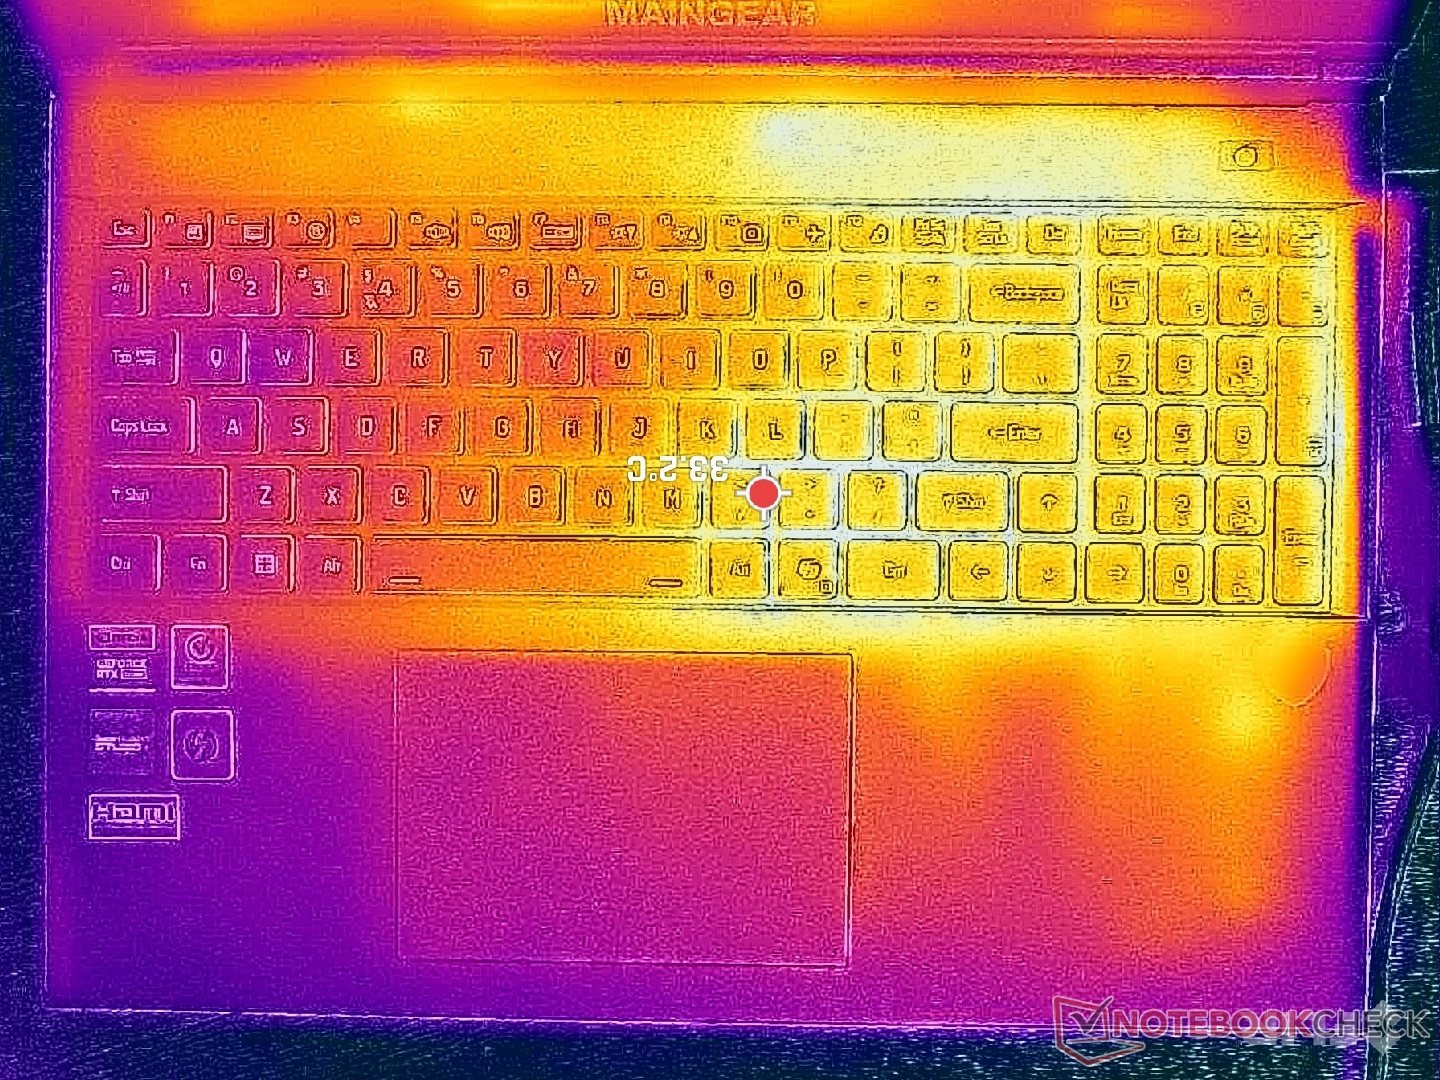
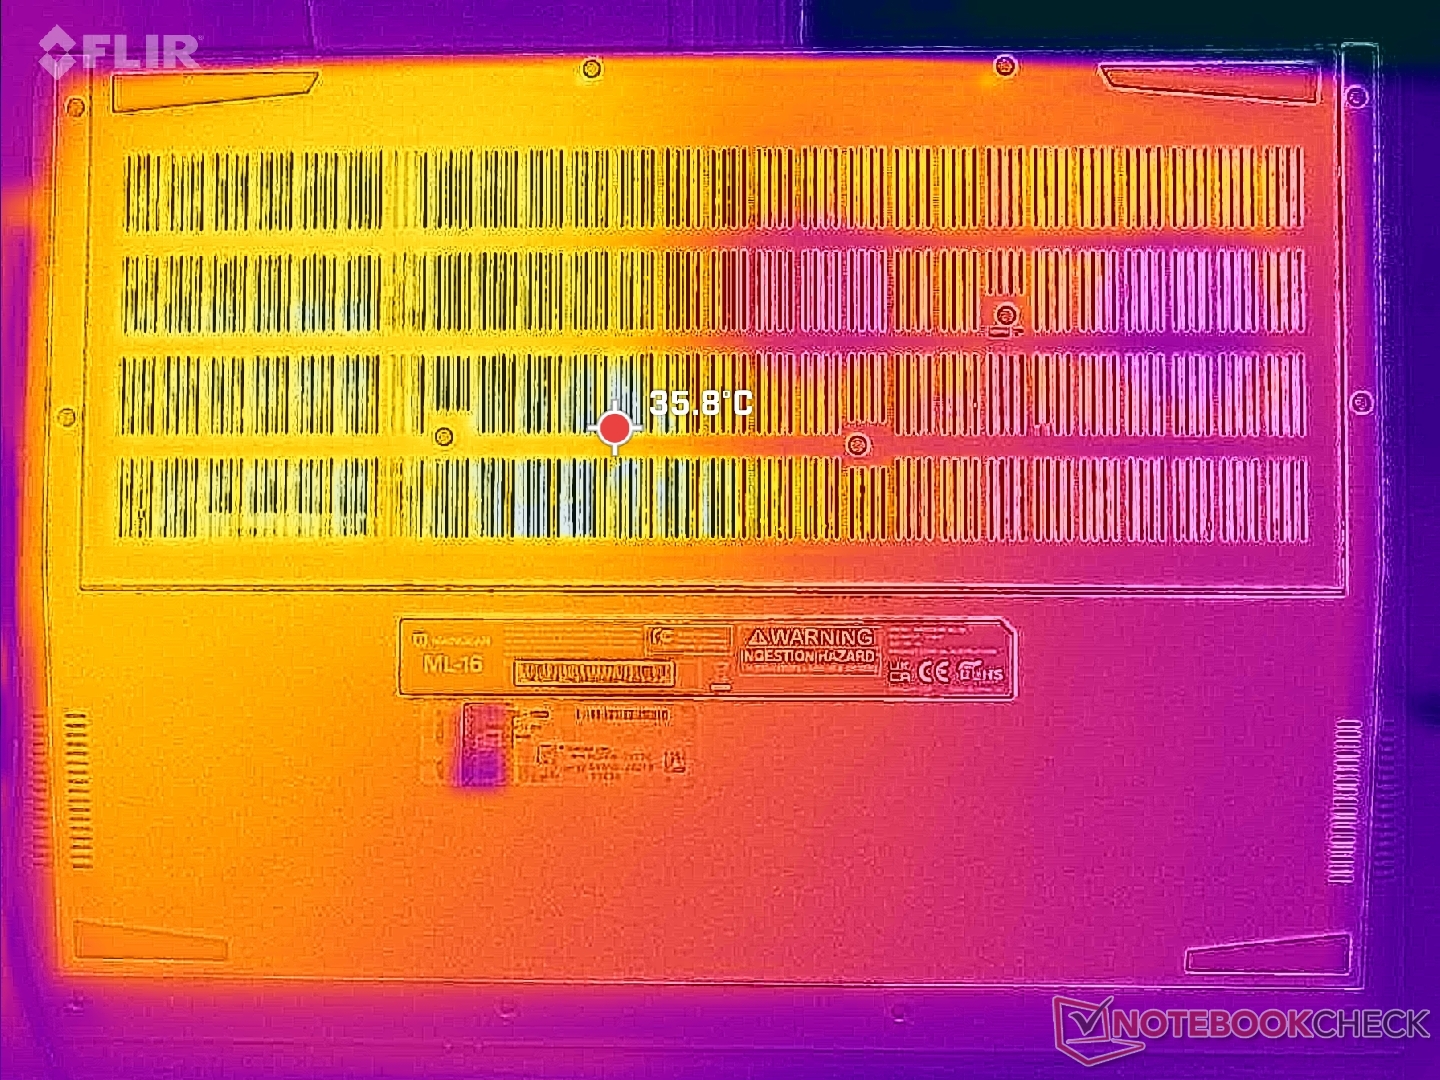
Temperatura
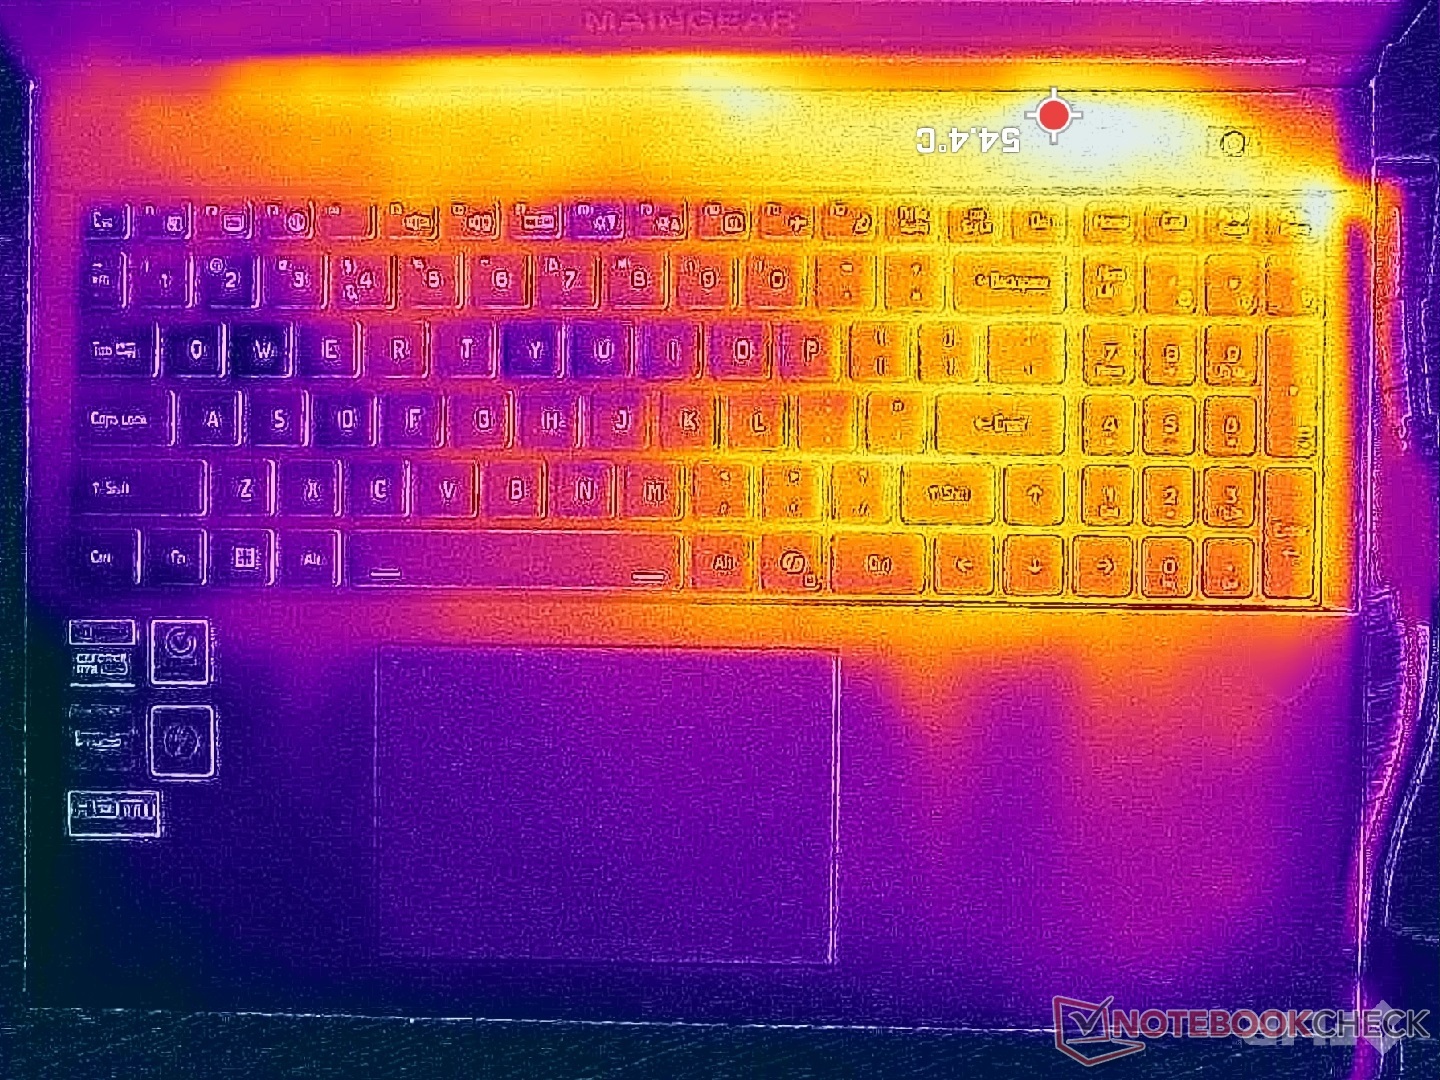
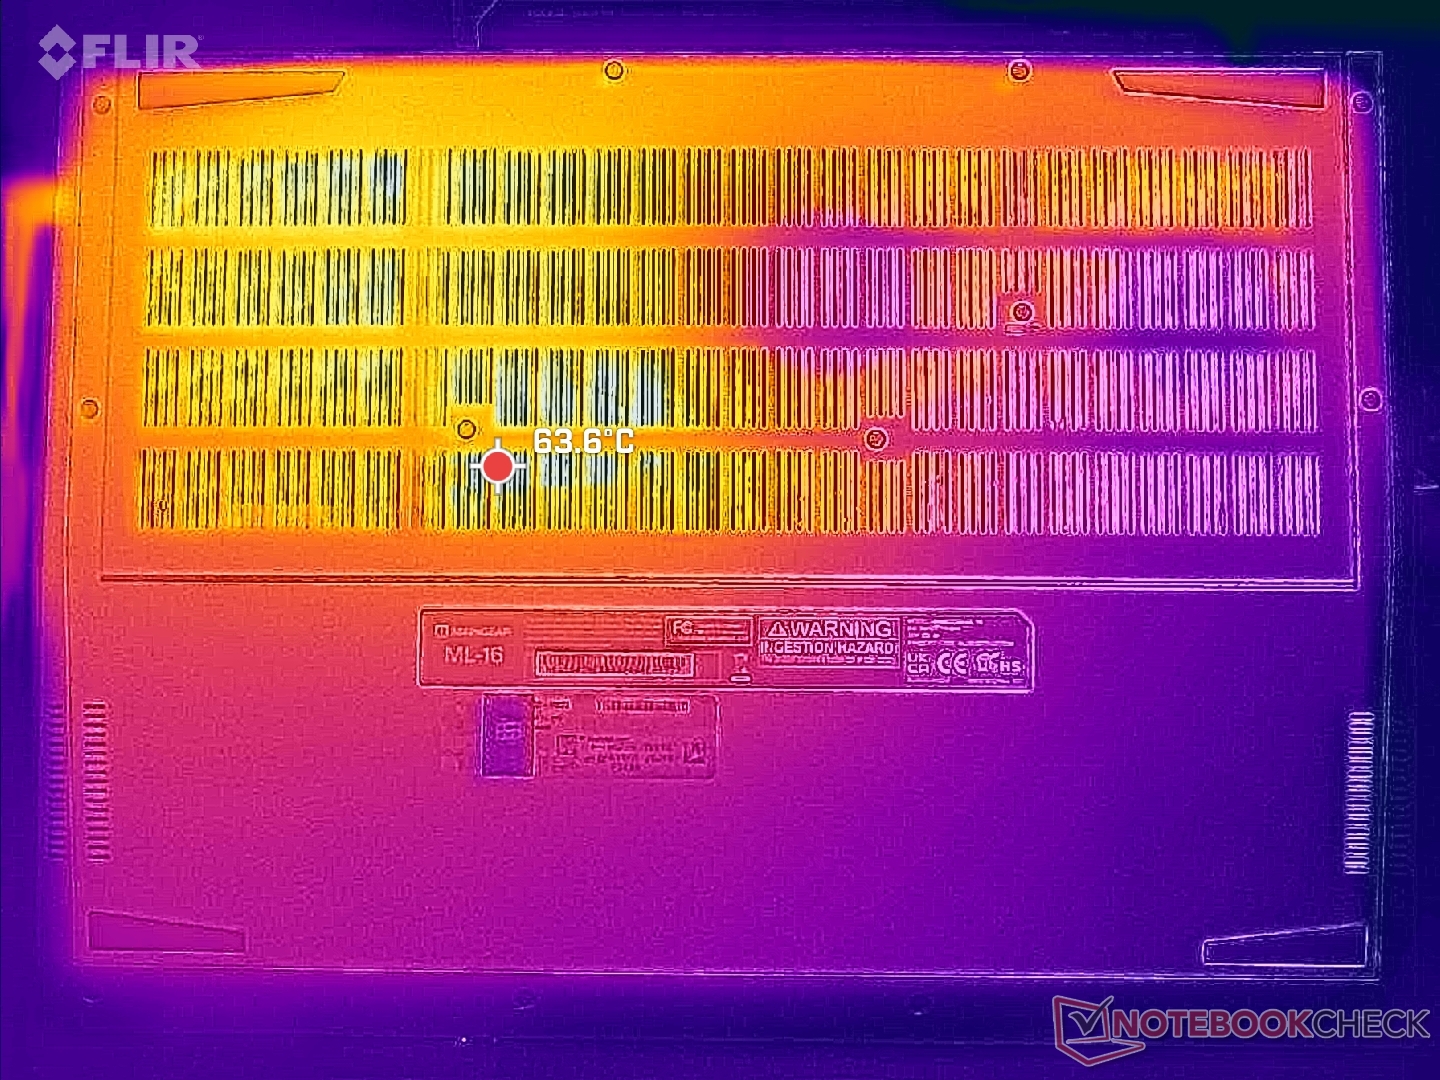
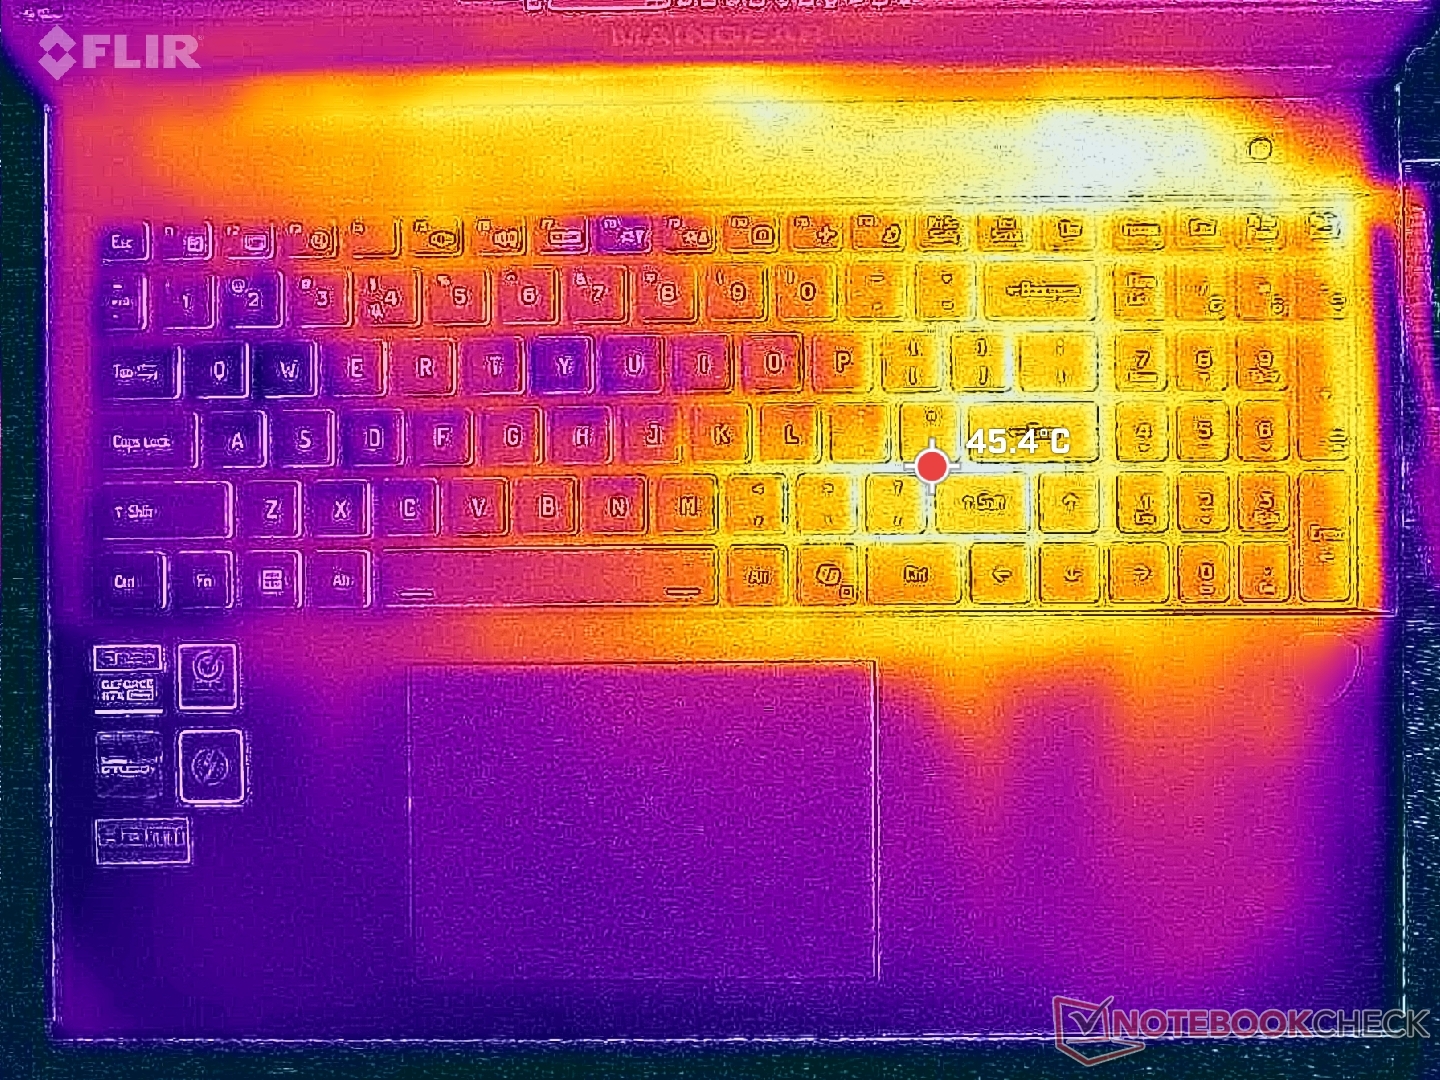
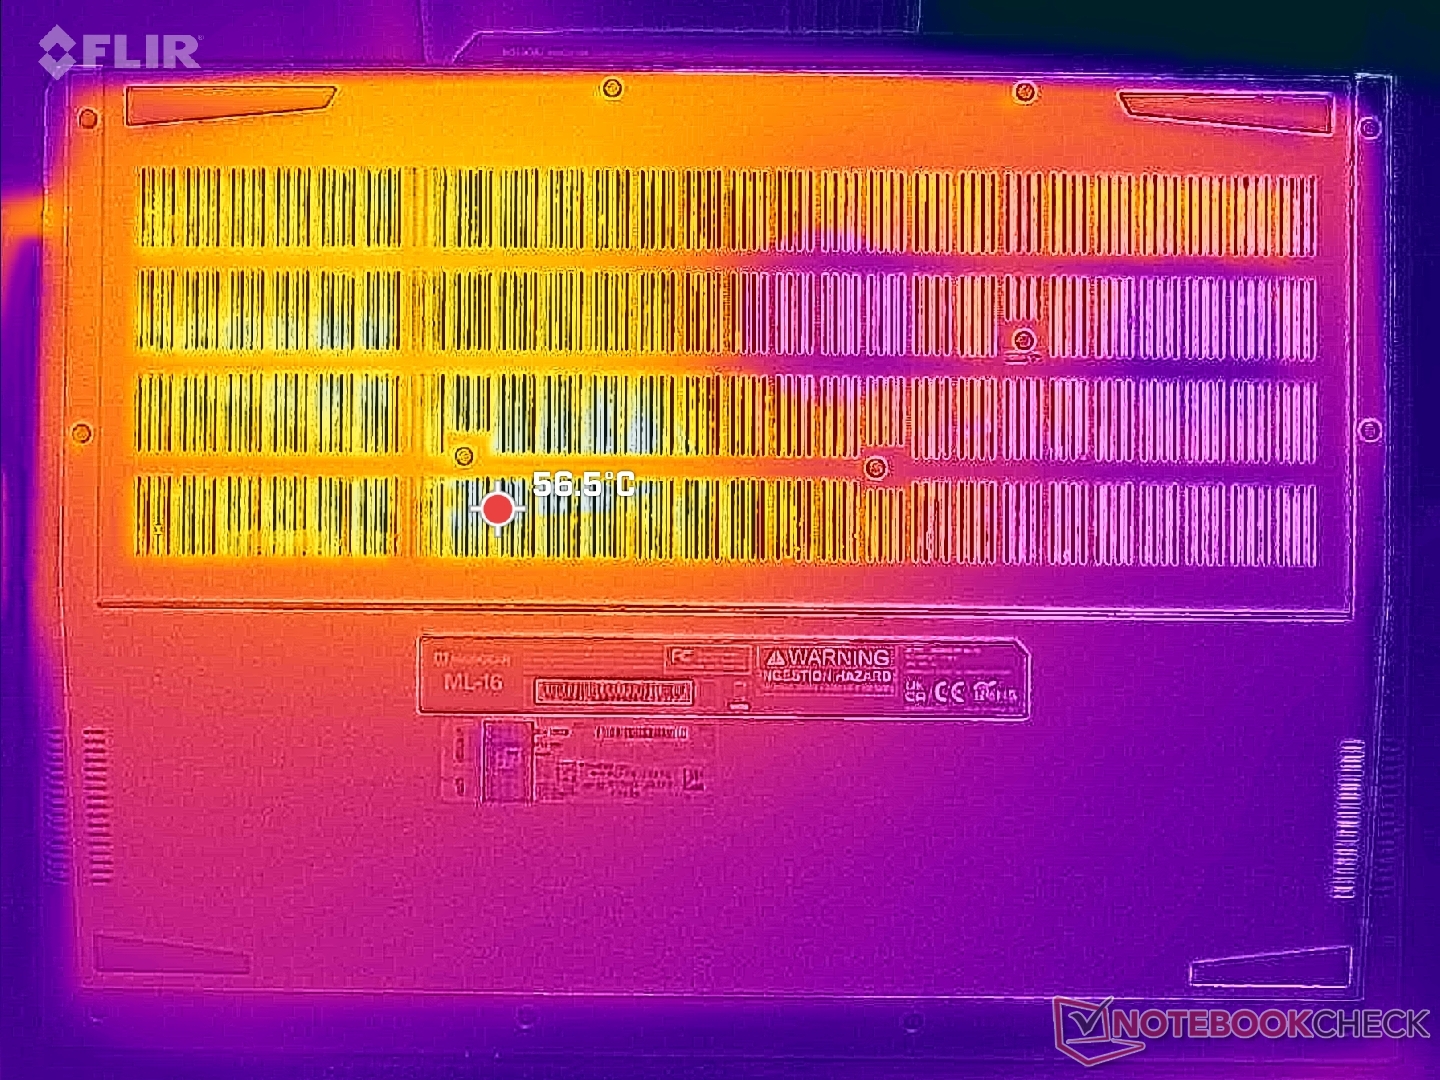
Le temperature di funzionamento molto calde, come menzionato in precedenza, portano a temperature superficiali più calde della media. I punti caldi durante il gioco possono raggiungere oltre 54 C e 56 C sulla parte superiore e inferiore, rispettivamente, rispetto agli appena 40 C del Blade 16 o 47 C su Legion Pro 5 16IRX9.
Inoltre, la soluzione di raffreddamento asimmetrica significa che la metà destra dello chassis o della tastiera sarà molto più calda della parte sinistra. Questo è in contrasto con la maggior parte degli altri computer portatili da gioco, dove le soluzioni di raffreddamento simmetriche sono comuni. Questo non è un grosso problema, dato che la maggior parte dei giochi utilizza solo i tasti WASD sulla metà sinistra della tastiera, ma può aspettarsi un palmo sudato se il gioco richiede input dal tastierino numerico.
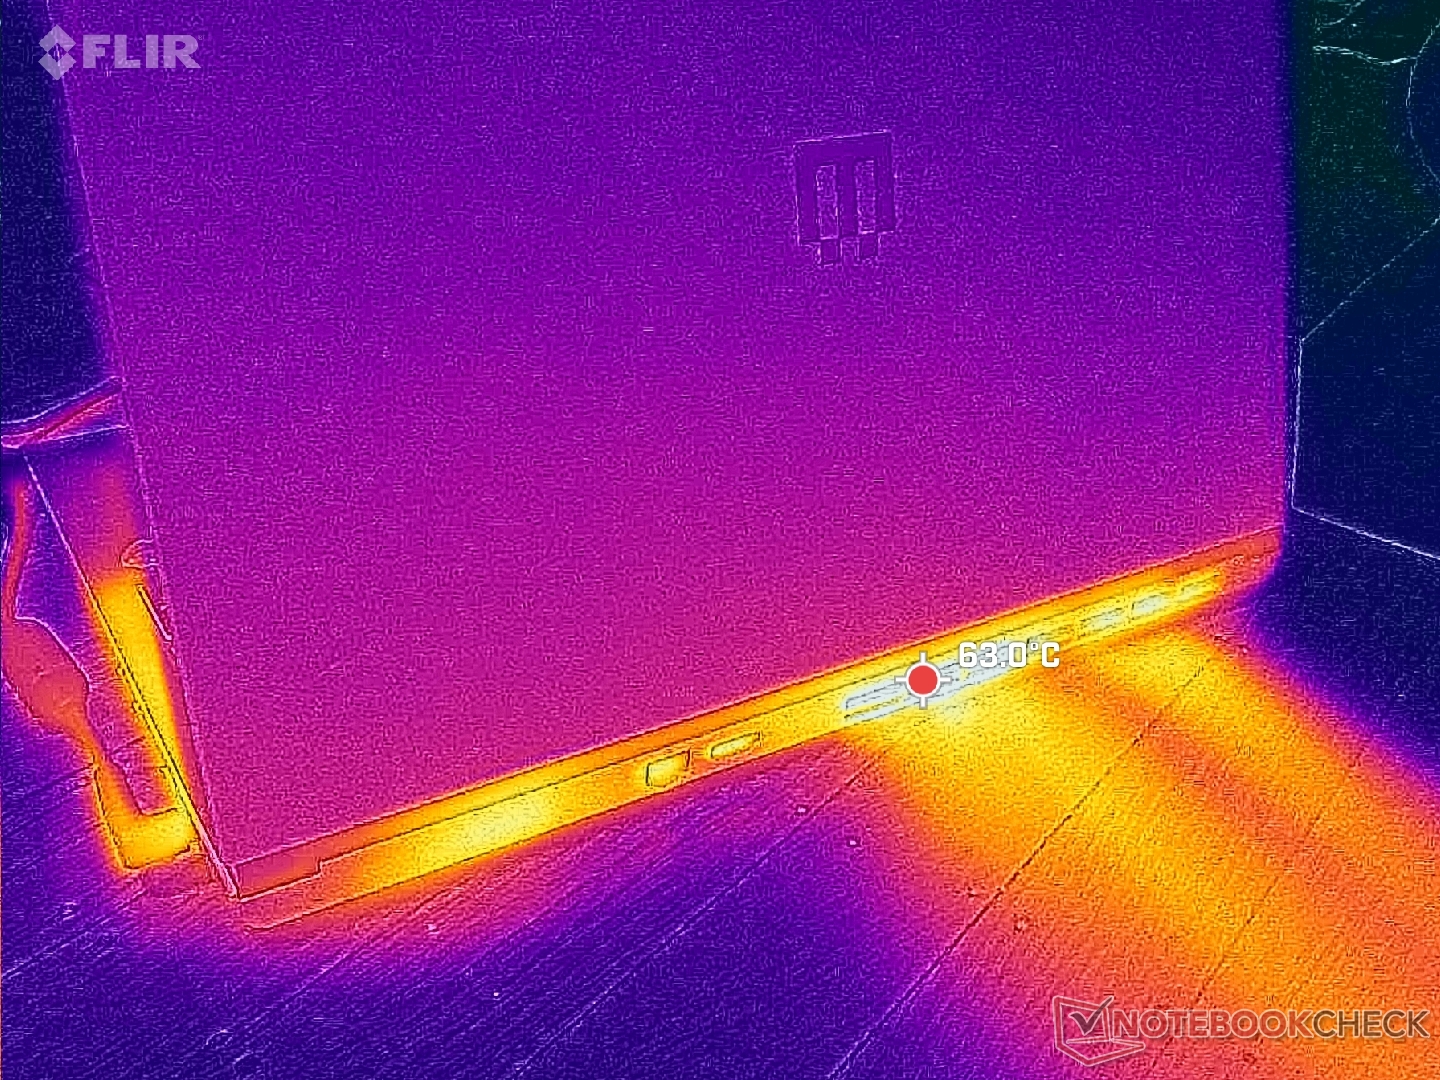
(-) La temperatura massima sul lato superiore è di 45.2 °C / 113 F, rispetto alla media di 40.5 °C / 105 F, che varia da 21.2 a 68.8 °C per questa classe Gaming.
(-) Il lato inferiore si riscalda fino ad un massimo di 48.8 °C / 120 F, rispetto alla media di 43.2 °C / 110 F
(+) In idle, la temperatura media del lato superiore è di 31.9 °C / 89 F, rispetto alla media deld ispositivo di 33.9 °C / 93 F.
(-) 3: The average temperature for the upper side is 40 °C / 104 F, compared to the average of 33.9 °C / 93 F for the class Gaming.
(+) I poggiapolsi e il touchpad raggiungono la temperatura massima della pelle (34.6 °C / 94.3 F) e quindi non sono caldi.
(-) La temperatura media della zona del palmo della mano di dispositivi simili e'stata di 28.9 °C / 84 F (-5.7 °C / -10.3 F).
| Maingear ML-16 MK2 Intel Core Ultra 7 155H, NVIDIA GeForce RTX 4070 Laptop GPU | Asus ROG Zephyrus G16 GA605WV AMD Ryzen AI 9 HX 370, NVIDIA GeForce RTX 4060 Laptop GPU | HP Victus 16 (2024) Intel Core i7-14700HX, NVIDIA GeForce RTX 4060 Laptop GPU | Alienware x16 R2 P120F Intel Core Ultra 9 185H, NVIDIA GeForce RTX 4080 Laptop GPU | Lenovo Legion Pro 5 16IRX9 Intel Core i9-14900HX, NVIDIA GeForce RTX 4070 Laptop GPU | Razer Blade 16 2024, RTX 4090 Intel Core i9-14900HX, NVIDIA GeForce RTX 4090 Laptop GPU | |
|---|---|---|---|---|---|---|
| Heat | 8% | 12% | -4% | 0% | 12% | |
| Maximum Upper Side * | 45.2 | 48.2 -7% | 50 -11% | 51 -13% | 43.8 3% | 45 -0% |
| Maximum Bottom * | 48.8 | 51.3 -5% | 50 -2% | 50.8 -4% | 55.4 -14% | 45 8% |
| Idle Upper Side * | 34.8 | 28 20% | 25 28% | 36.6 -5% | 32.8 6% | 29 17% |
| Idle Bottom * | 38.2 | 28.8 25% | 26 32% | 35.2 8% | 36 6% | 30 21% |
* ... Meglio usare valori piccoli
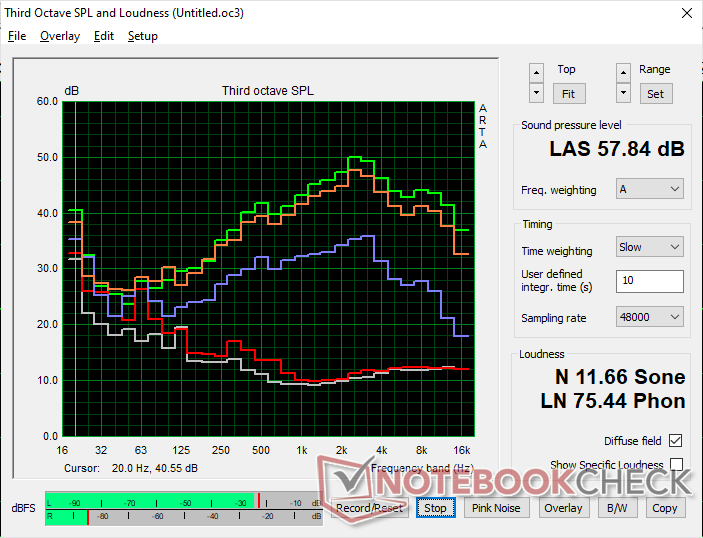
Altoparlanti
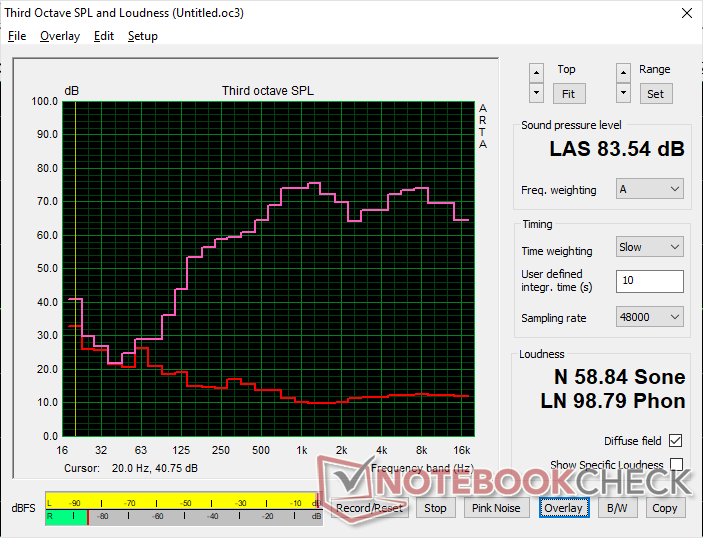
Maingear ML-16 MK2 analisi audio
(+) | gli altoparlanti sono relativamente potenti (83.5 dB)
Bassi 100 - 315 Hz
(-) | quasi nessun basso - in media 16.1% inferiori alla media
(±) | la linearità dei bassi è media (9.2% delta rispetto alla precedente frequenza)
Medi 400 - 2000 Hz
(+) | medi bilanciati - solo only 4.9% rispetto alla media
(+) | medi lineari (4.9% delta rispetto alla precedente frequenza)
Alti 2 - 16 kHz
(+) | Alti bilanciati - appena 3.3% dalla media
(+) | alti lineari (5.1% delta rispetto alla precedente frequenza)
Nel complesso 100 - 16.000 Hz
(+) | suono nel complesso lineare (13.7% differenza dalla media)
Rispetto alla stessa classe
» 20% di tutti i dispositivi testati in questa classe è stato migliore, 6% simile, 74% peggiore
» Il migliore ha avuto un delta di 6%, medio di 18%, peggiore di 132%
Rispetto a tutti i dispositivi testati
» 13% di tutti i dispositivi testati in questa classe è stato migliore, 3% similare, 84% peggiore
» Il migliore ha avuto un delta di 4%, medio di 25%, peggiore di 134%
Apple MacBook Pro 16 2021 M1 Pro analisi audio
(+) | gli altoparlanti sono relativamente potenti (84.7 dB)
Bassi 100 - 315 Hz
(+) | bassi buoni - solo 3.8% dalla media
(+) | bassi in lineaa (5.2% delta rispetto alla precedente frequenza)
Medi 400 - 2000 Hz
(+) | medi bilanciati - solo only 1.3% rispetto alla media
(+) | medi lineari (2.1% delta rispetto alla precedente frequenza)
Alti 2 - 16 kHz
(+) | Alti bilanciati - appena 1.9% dalla media
(+) | alti lineari (2.7% delta rispetto alla precedente frequenza)
Nel complesso 100 - 16.000 Hz
(+) | suono nel complesso lineare (4.6% differenza dalla media)
Rispetto alla stessa classe
» 0% di tutti i dispositivi testati in questa classe è stato migliore, 0% simile, 100% peggiore
» Il migliore ha avuto un delta di 5%, medio di 18%, peggiore di 45%
Rispetto a tutti i dispositivi testati
» 0% di tutti i dispositivi testati in questa classe è stato migliore, 0% similare, 100% peggiore
» Il migliore ha avuto un delta di 4%, medio di 25%, peggiore di 134%
Gestione dell'energia
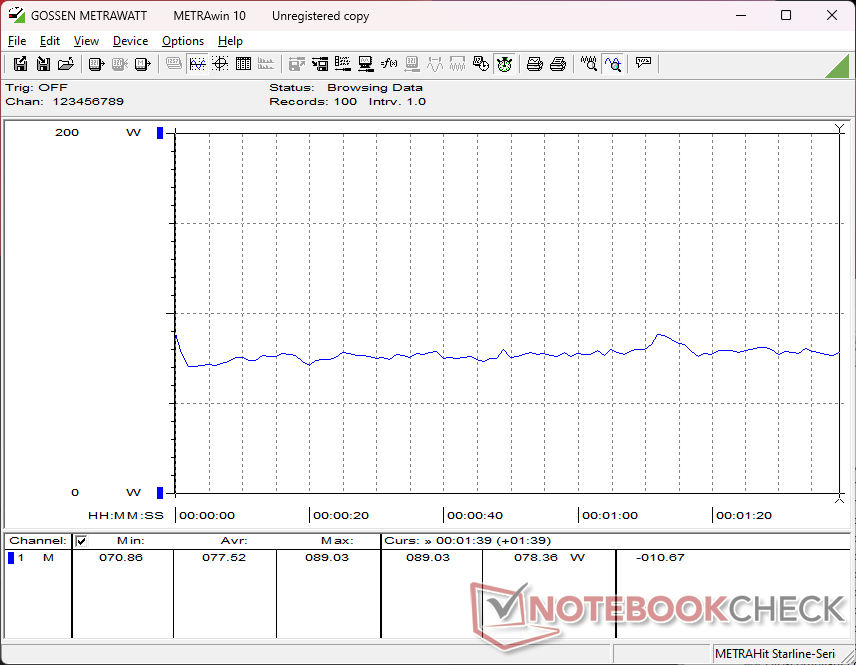
Consumo di energia
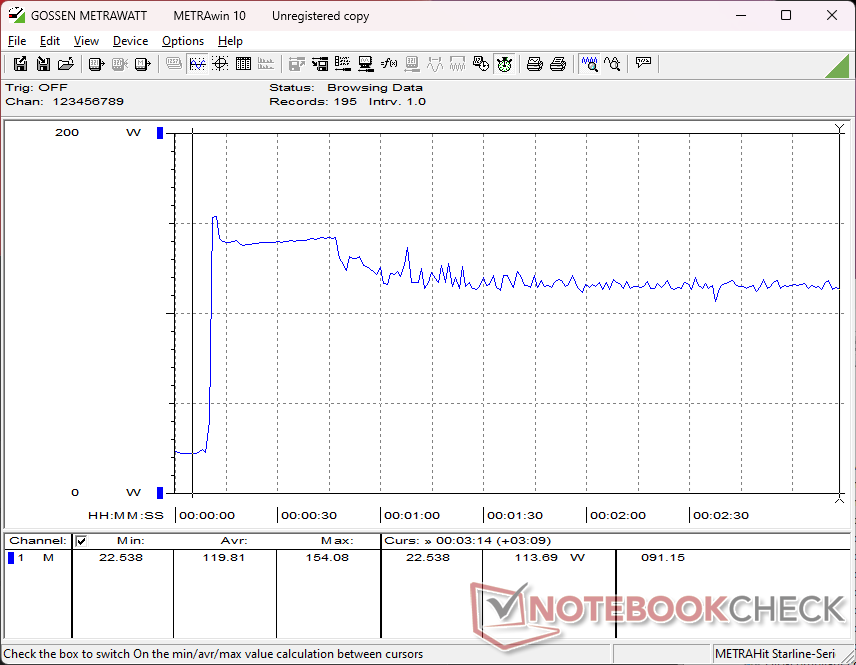
Il consumo energetico al minimo varia da 7 W a 27 W a seconda dell'impostazione della GPU e del livello di luminosità, un intervallo più ampio rispetto ai concorrenti. Questo spiegherebbe anche la durata relativamente breve della batteria nella sezione successiva. Abilitando semplicemente la modalità dGPU e la luminosità massima del display, il consumo passa da 7 W a 23 W. Per questo motivo si consiglia di utilizzare la modalità MSHybrid se la durata della batteria è importante.
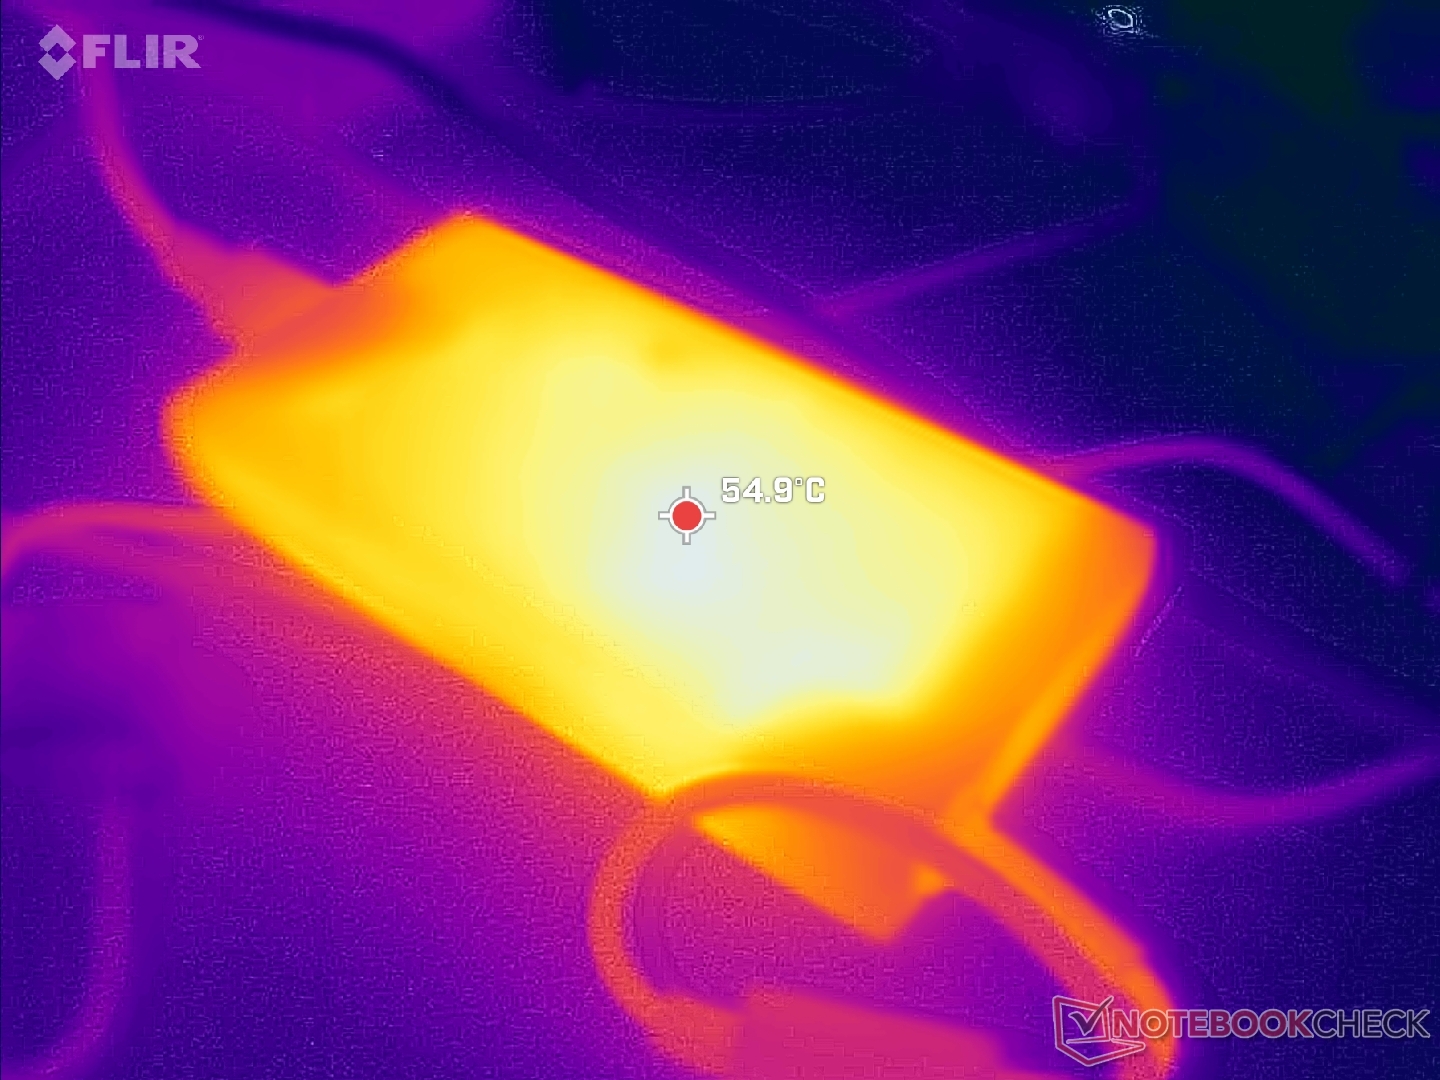
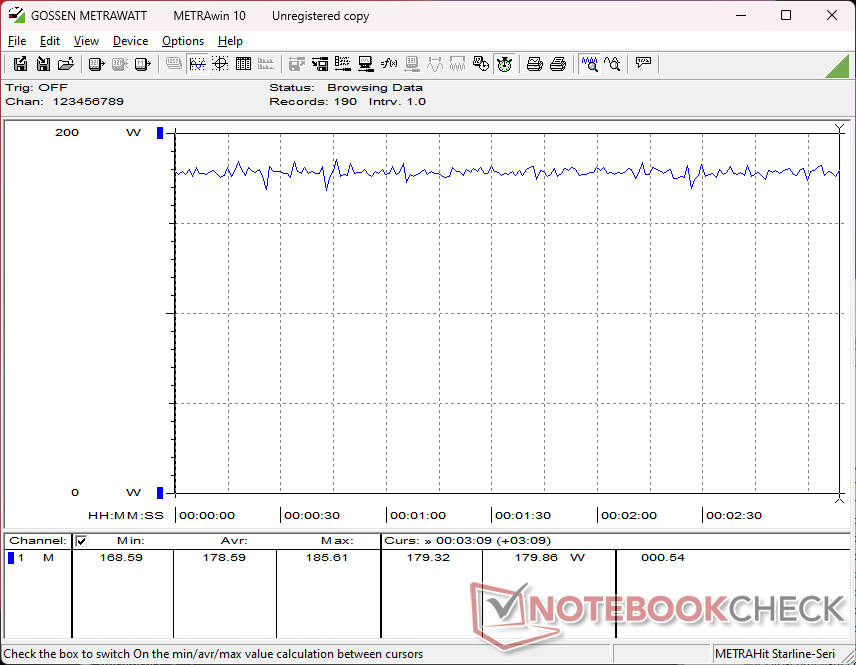
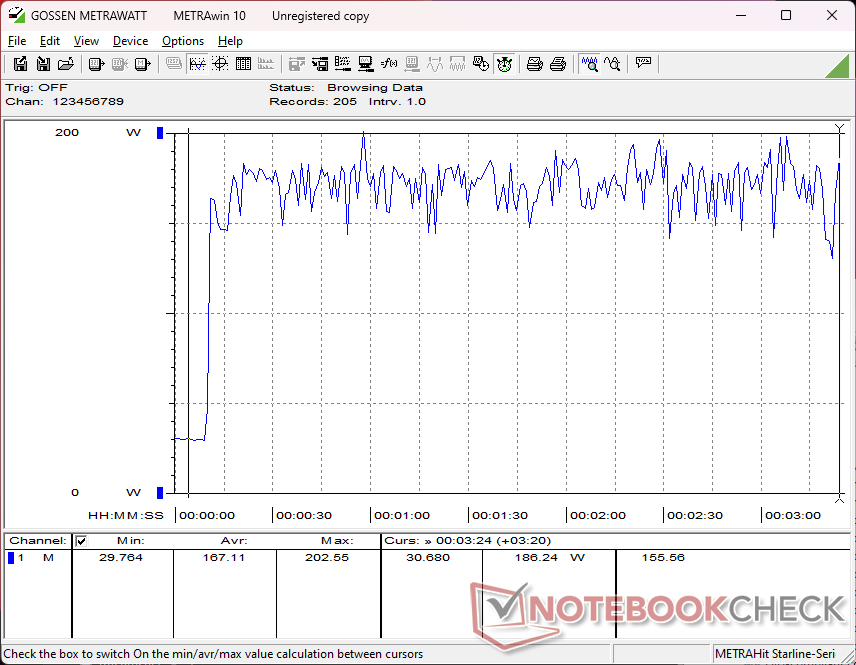
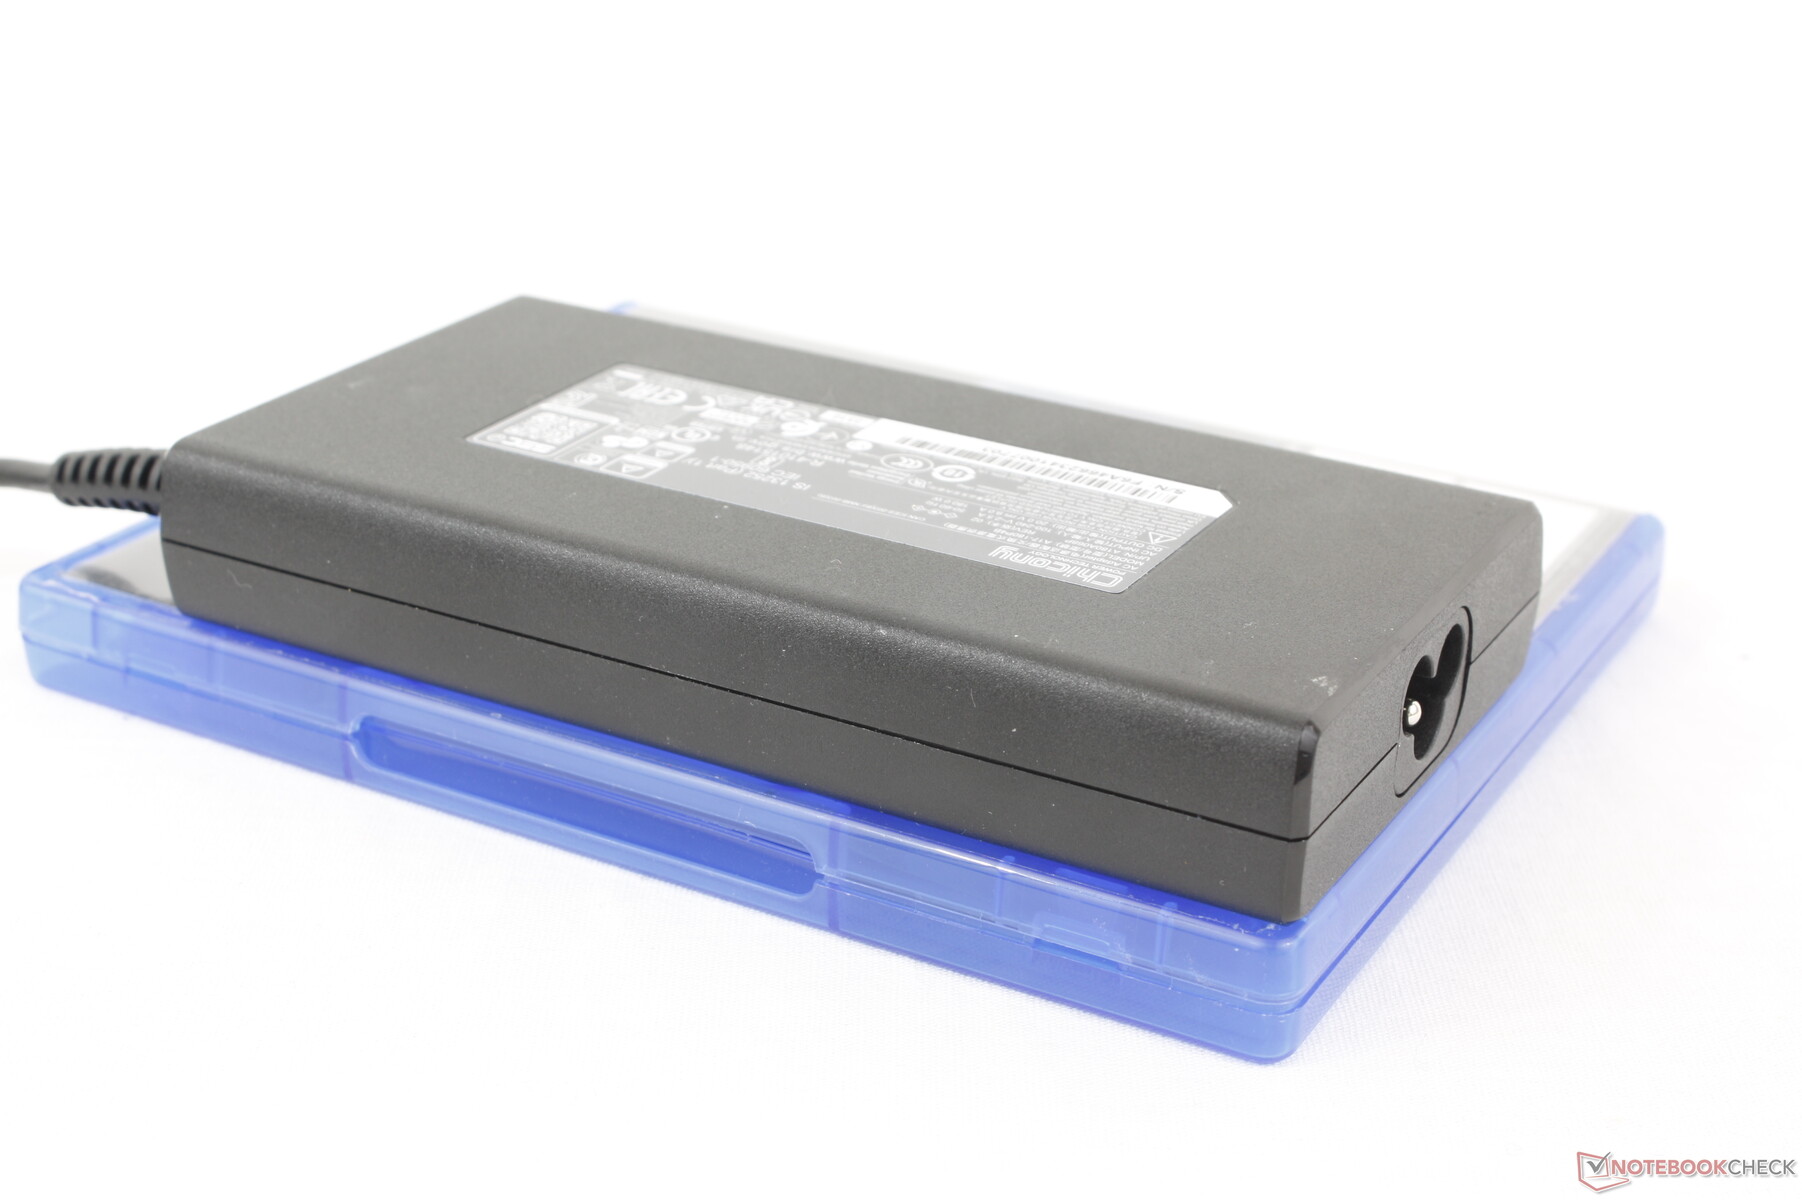
Il gioco richiede circa 179 W in media dall'adattatore CA di medie dimensioni (~14,4 x 7,5 x 2,3 cm) da 180 W. Ciò significa che la velocità di carica rallenterà fino a scomparire se si eseguono giochi simultaneamente e suggerisce anche che le prestazioni avrebbero potuto essere più rapide se il modello fosse stato fornito con un adattatore CA da 230 W più grande. In effetti, siamo in grado di registrare un assorbimento massimo di 203 W quando la CPU e la GPU sono al massimo dell'utilizzo, per dimostrare che il sistema può richiedere più di quanto l'adattatore CA possa fornire in modo sicuro. Questo è simile a quanto abbiamo osservato sul Lenovo Yoga Pro 9i 16 G9 dove abbiamo trovato che il suo adattatore CA da 170 W era troppo piccolo per la CPU Core Ultra H e la GPU RTX 4070.
| Off / Standby | |
| Idle | |
| Sotto carico |
|
Leggenda:
min: | |
| Maingear ML-16 MK2 Ultra 7 155H, NVIDIA GeForce RTX 4070 Laptop GPU, , IPS, 2560x1600, 16" | Asus ROG Zephyrus G16 GA605WV Ryzen AI 9 HX 370, NVIDIA GeForce RTX 4060 Laptop GPU, Micron 2400 MTFDKBA1T0QFM, OLED, 2560x1600, 16" | HP Victus 16 (2024) i7-14700HX, NVIDIA GeForce RTX 4060 Laptop GPU, Kioxia XG8 KXG80ZNV512G, IPS, 1920x1080, 16.1" | Alienware x16 R2 P120F Ultra 9 185H, NVIDIA GeForce RTX 4080 Laptop GPU, WDC PC SN810 1TB, IPS, 2560x1600, 16" | Lenovo Legion Pro 5 16IRX9 i9-14900HX, NVIDIA GeForce RTX 4070 Laptop GPU, Samsung PM9A1 MZVL21T0HCLR, IPS, 2560x1600, 16" | Razer Blade 16 2024, RTX 4090 i9-14900HX, NVIDIA GeForce RTX 4090 Laptop GPU, Samsung PM9A1 MZVL22T0HBLB, OLED, 2560x1600, 16" | |
|---|---|---|---|---|---|---|
| Power Consumption | 24% | -9% | -20% | -29% | -39% | |
| Idle Minimum * | 7.7 | 6.9 10% | 9 -17% | 9.9 -29% | 12.5 -62% | 16.9 -119% |
| Idle Average * | 22.9 | 12.6 45% | 15 34% | 14.5 37% | 24.6 -7% | 17.8 22% |
| Idle Maximum * | 26.7 | 13 51% | 23 14% | 33.5 -25% | 24.8 7% | 19.6 27% |
| Load Average * | 77.5 | 84.1 -9% | 123 -59% | 97.5 -26% | 109.6 -41% | 128 -65% |
| Cyberpunk 2077 ultra external monitor * | 178.9 | 124.5 30% | ||||
| Cyberpunk 2077 ultra * | 178.6 | 127.2 29% | ||||
| Load Maximum * | 202.6 | 177.6 12% | 241 -19% | 315.2 -56% | 284.9 -41% | 328 -62% |
| Witcher 3 ultra * | 143.7 | 230 | 218 | 243 |
* ... Meglio usare valori piccoli
Power Consumption Cyberpunk / Stress Test
Power Consumption external Monitor
Durata della batteria
La capacità della batteria di 80 Wh è nella media per le dimensioni dello schermo da 16 pollici. I tempi di esecuzione, tuttavia, sono inferiori alla media per un portatile da gioco. Siamo riusciti a registrare solo poco più di 3,5 ore di navigazione WLAN nel mondo reale, anche quando è stato impostato il profilo energetico Bilanciato con MSHybrid attivo, rispetto a oltre il doppio di quanto registrato dal modello Asus ROG Zephyrus G16 o HP Victus 16.
La ricarica da vuoto a pieno regime è relativamente veloce, da 1 a 1,5 ore. Il sistema può essere ricaricato anche tramite adattatori CA USB-C di terze parti, anche se a un ritmo più lento. Tenga presente che solo una delle due porte USB-C supporta la ricarica.
| Maingear ML-16 MK2 Ultra 7 155H, NVIDIA GeForce RTX 4070 Laptop GPU, 80 Wh | Asus ROG Zephyrus G16 GA605WV Ryzen AI 9 HX 370, NVIDIA GeForce RTX 4060 Laptop GPU, 90 Wh | HP Victus 16 (2024) i7-14700HX, NVIDIA GeForce RTX 4060 Laptop GPU, 83 Wh | Alienware x16 R2 P120F Ultra 9 185H, NVIDIA GeForce RTX 4080 Laptop GPU, 90 Wh | Lenovo Legion Pro 5 16IRX9 i9-14900HX, NVIDIA GeForce RTX 4070 Laptop GPU, 80 Wh | Razer Blade 16 2024, RTX 4090 i9-14900HX, NVIDIA GeForce RTX 4090 Laptop GPU, 95.2 Wh | |
|---|---|---|---|---|---|---|
| Autonomia della batteria | 62% | 134% | -11% | -13% | 16% | |
| Reader / Idle | 651 | 403 -38% | ||||
| WiFi v1.3 | 218 | 478 119% | 511 134% | 193 -11% | 290 33% | 329 51% |
| Load | 98 | 103 5% | 65 -34% | 79 -19% | ||
| H.264 | 824 | 456 |
Pro
Contro
Verdetto - Sorprendentemente leggero, ma un po' troppo caldo
Il Maingear ML-16 MK2 ha alcuni punti a suo favore rispetto ai grandi concorrenti. I più importanti sono la sua leggerezza e il display relativamente luminoso, per aiutare gli utenti che non giocano sempre a casa. Nel frattempo, il tastierino numerico integrato può rivelarsi utile per alcuni tipi di giochi e fogli di calcolo, mentre la facilità di manutenzione è sempre apprezzata dagli appassionati.
Purtroppo, il modello soffre di un lungo elenco di svantaggi. Per prima cosa, la sua soluzione di raffreddamento è relativamente piccola e non è così efficiente come quella dei portatili da gioco da 16 pollici della concorrenza. Le temperature del core, le temperature della superficie e il rumore della ventola sono quindi più calde e più rumorose rispetto alle alternative come il più pesante Razer Blade 16 o Lenovo Legion Pro. Anche la rigidità del telaio è più debole rispetto ai concorrenti, per una prima impressione peggiore. Questi inconvenienti possono essere in parte attribuiti al peso ridotto, poiché di conseguenza sono stati fatti dei tagli allo chassis e alla soluzione di raffreddamento. In altre parole, dovrà fare alcuni sacrifici fondamentali per un peso più leggero e portatile.
Maingear ML-16 MK2 è più leggero e più luminoso di quanto ci aspettassimo. Tuttavia, manca di diverse funzioni avanzate, mentre le temperature e il rumore della ventola avrebbero potuto essere migliori.
Altre funzioni avanzate come Optimus 2.0, HDR, OLED, illuminazione RGB per tasto, raffreddamento a camera di vapore e interfaccia in metallo liquido non sono disponibili su ML-16 MK2. Queste omissioni possono essere accettabili in una fascia di prezzo di 1500 dollari, ma ci aspettavamo un po' di più considerando il prezzo di 2000 dollari richiesto per la nostra configurazione RTX 4070.
Prezzo e disponibilità
Maingear sta spedendo mL-16 Mark 2 a 1.800 dollari con GeForce RTX 4060 o a 2.000 dollari con RTX 4070, come da recensione.
Nota: abbiamo recentemente aggiornato il nostro sistema di valutazione e i risultati della versione 8 non sono paragonabili ai risultati della versione 7. Ulteriori informazioni sono disponibili qui .
Maingear ML-16 MK2
- 09/17/2024 v8
Allen Ngo
 Total Sustainability Score:
 Transparency
La selezione dei dispositivi da recensire viene effettuata dalla nostra redazione. Il campione di prova è stato fornito all'autore come prestito dal produttore o dal rivenditore ai fini di questa recensione. L'istituto di credito non ha avuto alcuna influenza su questa recensione, né il produttore ne ha ricevuto una copia prima della pubblicazione. Non vi era alcun obbligo di pubblicare questa recensione. Non accettiamo mai compensi o pagamenti in cambio delle nostre recensioni. In quanto società mediatica indipendente, Notebookcheck non è soggetta all'autorità di produttori, rivenditori o editori.
Ecco come Notebookcheck esegue i test
Ogni anno, Notebookcheck esamina in modo indipendente centinaia di laptop e smartphone utilizzando procedure standardizzate per garantire che tutti i risultati siano comparabili. Da circa 20 anni sviluppiamo continuamente i nostri metodi di prova e nel frattempo stabiliamo gli standard di settore. Nei nostri laboratori di prova, tecnici ed editori esperti utilizzano apparecchiature di misurazione di alta qualità. Questi test comportano un processo di validazione in più fasi. Il nostro complesso sistema di valutazione si basa su centinaia di misurazioni e parametri di riferimento ben fondati, che mantengono l'obiettività.Price comparison

