Notebookcheck Logo
Teaser

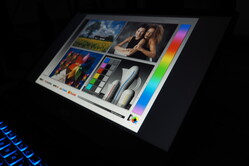
Recensione del laptop MSI Katana A15 AI: gamer RTX 4070 penalizzato dalle misure di risparmio

Vicino, ma senza sigaro.

MSI si avventura nel competitivo settore dei laptop da gioco di fascia media con il Katana A15 AI. Questo laptop da 15 pollici è dotato di un potente processore Ryzen e di una GeForce RTX 4060 o RTX 4070 - e delude enormemente in un'area cruciale.
Florian Glaser, 👁 Florian Glaser (traduzione a cura di DeepL / Ninh Duy) Published 🇺🇸 🇩🇪 ...
AMD Ryzen (Zen) Nvidia Geforce Gaming Laptop / Notebook MSI

Verdetto - MSI taglia troppi angoli

Il Katana A15 AI presenta la stessa serie di carenze dell'Acer Nitro V 16 ANV16 recentemente recensito. Il suo display non è all'altezza del prezzo, che è piuttosto elevato. Mentre alcuni laptop RTX 4070 più convenienti come Lenovo LOQ 15ARP9, Asus TUF Gaming F15 FX507ZI4-LP031 e HP Victus 16-s0177ng offrono una copertura sRGB del 100% (almeno secondo le rispettive schede tecniche), il laptop MSI non riesce a raggiungere il 70%, rendendo l'immagine visualizzata piuttosto pallida e poco brillante.

MSI avrebbe dovuto impegnarsi di più anche in altre aree, come il case sgangherato e dall'aspetto economico, la scarsa capacità e autonomia della batteria, il touchpad piccolo e gli altoparlanti mediocri. Non c'è USB 4 e il layout non convenzionale della tastiera potrebbe richiedere un po' di tempo per abituarsi.

Il Katana A15 si distingue dalla massa solo per alcuni aspetti positivi, con le due RAM e i due slot M.2 particolarmente lodevoli. Nel complesso, è difficile consigliare l'acquisto di questo portatile a causa dei numerosi problemi che abbiamo riscontrato, soprattutto considerando il prezzo (la SKU di prova parte da 1.500 euro). Diversi sistemi rivali sono notevolmente più veloci. Alcuni sono anche più economici.

Pro

+ MSI Center ha un aspetto pulito, offre molte opzioni e modalità
+ due slot per RAM e due SSD
+ buone prestazioni di sistema
+ Interruttore MUX

Contro

- la custodia scricchiola, ha un aspetto economico e attira le impronte digitali
- display a bassa luminosità e a basso colore
- il layout della tastiera richiede un po' di tempo per abituarsi
- il suono e la webcam potrebbero essere migliori
- batteria piccola, durata ridotta
- nessuna USB 4, nessun lettore di schede

Prezzo e disponibilità

Negli Stati Uniti, MSI Katana A15 AI è disponibile su Amazon, tra le altre opzioni.

Amazon Logo
$1,599.00
MSI Katana A15 AI 15.6” 165Hz QHD Gaming Laptop: Ryzen 9-8945HS, NVIDIA Geforce RTX 4070, 32GB DDR5, 1TB NVMe SSD, Cooler Boost 5, Win 11: Black B8VG-450US

Possibili alternative a confronto

Image
Modello
Price
Peso
Altezza
Display
1.
76.4%
MSI Katana A15 AI B8VG
AMD Ryzen 9 8945HS ⎘
NVIDIA GeForce RTX 4070 Laptop GPU ⎘
16 GB Memoria, 1024 GB SSD
Amazon:
1. $1,599.00
MSI Katana A15 AI 15.6” 16...
2. $1,889.49
MSI Katana A15 AI B8VG-423US...
3. $1,734.49
MSI Katana A15 AI B8VG-423US...
List Price: 1500 EUR
2.3 kg24.9 mm15.60"
1920x1080
141 PPI
IPS
2.
86.6% v7 (old)
HP Omen 16-xf0376ng
HP Omen 16-xf0376ng
AMD Ryzen 7 7840HS ⎘
NVIDIA GeForce RTX 4070 Laptop GPU ⎘
16 GB Memoria, 512 GB SSD
Amazon: $1,250.00
List Price: 1900 EUR
2.4 kg23.5 mm16.10"
1920x1080
137 PPI
IPS
3.
85.1% v7 (old)
HP Victus 16-r0077ng
Intel Core i7-13700H ⎘
NVIDIA GeForce RTX 4070 Laptop GPU ⎘
16 GB Memoria, 1024 GB SSD
Amazon:
1. $989.49
HP - Victus 16.1" Gaming Lap...
2. $115.99
19.5V 11.8A Power Supply 230...
List Price: 1630 EUR
2.4 kg24 mm16.10"
1920x1080
137 PPI
IPS
4.
85.7% v7 (old)
Aorus 15 BSF
Aorus 15 BSF
Intel Core i7-13700H ⎘
NVIDIA GeForce RTX 4070 Laptop GPU ⎘
16 GB Memoria, 1024 GB SSD
Amazon:
1. $52.99
240W 230W Laptop Charger for...
2. $59.99
230W 180W AC Charger Fit for...
3. $45.99
Smatree Hard EVA Protective ...
List Price: 1749 Euro
2.4 kg20.9 mm15.60"
2560x1440
188 PPI
IPS
5.
88.4% v7 (old)
Lenovo Legion Pro 5 16ARX8
AMD Ryzen 7 7745HX ⎘
NVIDIA GeForce RTX 4070 Laptop GPU ⎘
16 GB Memoria, 1024 GB SSD
Amazon: $999.99
List Price: 1600 USD
2.5 kg26.8 mm16.00"
2560x1600
189 PPI
IPS

In Germania, dove si sono svolti i test, la Katana A15 AI è attualmente offerta in due configurazioni. Il modello B8VG-451, che costa più di 1.100 euro, è dotato di Ryzen 7 8845HS, GeForce RTX 4060 Laptop e un SSD da 512 GB, mentre il nostro modello di prova, il B8VG-459, ha un prezzo di 1.500 euro ed è dotato di Ryzen 9 8945HS Ryzen 9 8945HS, GeForce RTX 4070 Laptop e un SSD da 1 TB. Entrambe le SKU sono dotate di un display Full-HD IPS opaco a 144 Hz e 16 GB di RAM DDR5-5600.

Specifiche

MSI Katana A15 AI B8VG (Katana 15 2024 Serie)
Processore
AMD Ryzen 9 8945HS 8 x 4 - 5.2 GHz, 54 W PL2 / Short Burst, 50 W PL1 / Sustained, Hawk Point-HS (Zen 4)
Scheda grafica
NVIDIA GeForce RTX 4070 Laptop GPU - 8 GB VRAM, Core: 1605 MHz, Memoria: 2000 MHz, 105 W TDP, GDDR6, ForceWare 566.36, MUX-Switch
Memoria
16 GB 
, 2x 8 GB SO-DIMM DDR5-5600, two slots (both in use)
Schermo
15.60 pollici 16:9, 1920 x 1080 pixel 141 PPI, CMN N156HRA-EA1, IPS, Full-HD, lucido: no, 144 Hz
Scheda madre
AMD Promontory/Bixby FCH
Harddisk
WD PC SN560 SDDPNQE-1T00, 1024 GB 
, NVMe SSD, two M.2 slots (one empty)
Scheda audio
Realtek ALC256 @ AMD K19.7 - Audio Processor - High Definition Audio Controller
Porte di connessione
1 USB 2.0, 3 USB 3.0 / 3.1, 1 HDMI, 1 DisplayPort, Connessioni Audio: Combined (Headset/Mic)
Rete
Realtek PCIe GBE Family Controller (10/100/1000MBit/s), MediaTek RZ616 (a/b/g/n = Wi-Fi 4/ac = Wi-Fi 5/ax = Wi-Fi 6/ Wi-Fi 6E 6 GHz), Bluetooth 5.3
Dimensioni
altezza x larghezza x profondità (in mm): 24.9 x 359 x 259
Batteria
53.5 Wh polimeri di litio, 3-cell
Sistema Operativo
Microsoft Windows 11 Home
Camera
Webcam: HD 720p
Altre caratteristiche
Casse: Stereo, Tastiera: Chiclet, 4 zones, Illuminazione Tastiera: si, 200 W Power Supply, MSI Center, 24 Mesi Garanzia
Peso
2.3 kg, Alimentazione: 733 gr
Prezzo
1500 EUR
Nota: il produttore potrebbe usare componenti di fornitori diversi pannelli dei diplay, drive o banchi di memoria con specifiche simili.


Caso

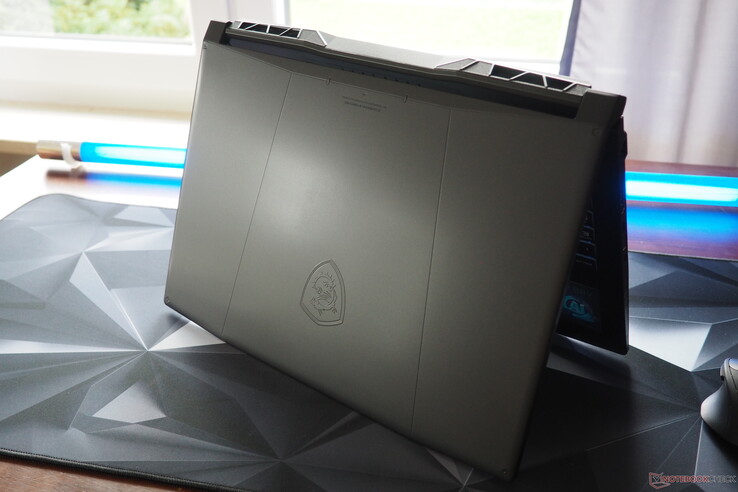
Gli acquirenti di computer portatili da gioco economici spesso devono accontentarsi di custodie di scarsa qualità. Lo stesso vale per la Katana. Il case non sembra particolarmente di alta qualità, soprattutto a causa dell'ampio uso di plastica. Il suo colore scuro lo rende anche molto incline alle impronte digitali, e la sua stabilità è mediocre. Il lato positivo è che il portatile è relativamente ben fatto e ha un generoso angolo di apertura massimo di 180°, che è sempre un tocco di classe.

MSI Katana A15 AI
MSI Katana A15 AI
MSI Katana A15 AI
MSI Katana A15 AI
MSI Katana A15 AI
MSI Katana A15 AI
MSI Katana A15 AI
MSI Katana A15 AI
MSI Katana A15 AI

Le dimensioni e il peso del portatile MSI sono in linea con la concorrenza. Con un peso di 2,3 kg, il sistema è leggermente più leggero dei suoi rivali di 2,4-2,5 kg.

Confronto delle dimensioni

369 mm 259 mm 24 mm 2.4 kg369 mm 259 mm 23.5 mm 2.4 kg363.4 mm 260.4 mm 26.8 mm 2.5 kg359 mm 259 mm 24.9 mm 2.3 kg360 mm 272 mm 20.9 mm 2.4 kg297 mm 210 mm 1 mm 5.7 g

Connettività

Per coloro che possono fare a meno di un lettore di schede e di porte USB di ultima generazione, Katana A15 AI offre una solida selezione di porte. Il bordo sinistro presenta una porta di alimentazione e due porte USB (una 3.0, l'altra 2.0), mentre il lato destro ospita un jack audio, USB-A 3.0, USB-C 3.0 (con DisplayPort), HDMI 2.1 e una porta RJ45 Gigabit LAN. Poiché alcune porte sono posizionate al centro del bordo del case, i cavi potrebbero intralciare la mano dell'utente che tiene il mouse.

Sinistra: Alimentazione, USB-A 3.0, USB-A 2.0
A destra: Audio 3,5 mm, USB-A 3.0, USB-C 3.0 (incl. DisplayPort), HDMI 2.1, RJ45 Gigabit LAN

Comunicazione

Il modulo integrato RZ616 Wi-Fi 6E di MediaTek offre una velocità di upload leggermente inferiore alla media e una velocità di download leggermente superiore alla media.

Networking
iperf3 transmit AXE11000
Aorus 15 BSF
Intel Wi-Fi 6E AX211
1418 (735min - 1503max) MBit/s +56%
HP Omen 16-xf0376ng
Realtek 8852CE
1326 (976min - 1449max) MBit/s +46%
Media della classe Gaming
  (469 - 1843, n=147, ultimi 2 anni)
1231 MBit/s +35%
Lenovo Legion Pro 5 16ARX8
MediaTek Wi-Fi 6E MT7922 160MHz Wireless LAN Card
1173 (839min - 1366max) MBit/s +29%
Media MediaTek RZ616
  (593 - 1793, n=16)
1155 MBit/s +27%
MSI Katana A15 AI B8VG
MediaTek RZ616
910 (364min - 1017max) MBit/s
HP Victus 16-r0077ng
MediaTek MT7921
714 (679min - 745max) MBit/s -22%
iperf3 receive AXE11000
MSI Katana A15 AI B8VG
MediaTek RZ616
1716 (1651min - 1742max) MBit/s
Aorus 15 BSF
Intel Wi-Fi 6E AX211
1636 (1534min - 1678max) MBit/s -5%
Media MediaTek RZ616
  (750 - 1752, n=16)
1527 MBit/s -11%
HP Omen 16-xf0376ng
Realtek 8852CE
1481 (741min - 1496max) MBit/s -14%
Lenovo Legion Pro 5 16ARX8
MediaTek Wi-Fi 6E MT7922 160MHz Wireless LAN Card
1438 (767min - 1513max) MBit/s -16%
Media della classe Gaming
  (680 - 1890, n=147, ultimi 2 anni)
1399 MBit/s -18%
HP Victus 16-r0077ng
MediaTek MT7921
726 (714min - 732max) MBit/s -58%
050100150200250300350400450500550600650700750800850900950100010501100115012001250130013501400145015001550160016501700Tooltip
MSI Katana A15 AI B8VG MediaTek RZ616; iperf3 transmit AXE11000; iperf 3.1.3: Ø898 (364-1017)
HP Omen 16-xf0376ng Realtek 8852CE; iperf3 transmit AXE11000; iperf 3.1.3: Ø1326 (976-1449)
HP Victus 16-r0077ng MediaTek MT7921; iperf3 transmit AXE11000; iperf 3.1.3: Ø714 (679-745)
Aorus 15 BSF Intel Wi-Fi 6E AX211; iperf3 transmit AXE11000; iperf 3.1.3: Ø1394 (735-1503)
Lenovo Legion Pro 5 16ARX8 MediaTek Wi-Fi 6E MT7922 160MHz Wireless LAN Card; iperf3 transmit AXE11000; iperf 3.1.3: Ø1174 (839-1366)
MSI Katana A15 AI B8VG MediaTek RZ616; iperf3 receive AXE11000; iperf 3.1.3: Ø1716 (1651-1742)
HP Omen 16-xf0376ng Realtek 8852CE; iperf3 receive AXE11000; iperf 3.1.3: Ø1456 (741-1496)
HP Victus 16-r0077ng MediaTek MT7921; iperf3 receive AXE11000; iperf 3.1.3: Ø726 (714-732)
Aorus 15 BSF Intel Wi-Fi 6E AX211; iperf3 receive AXE11000; iperf 3.1.3: Ø1635 (1534-1678)
Lenovo Legion Pro 5 16ARX8 MediaTek Wi-Fi 6E MT7922 160MHz Wireless LAN Card; iperf3 receive AXE11000; iperf 3.1.3: Ø1412 (767-1513)

Webcam

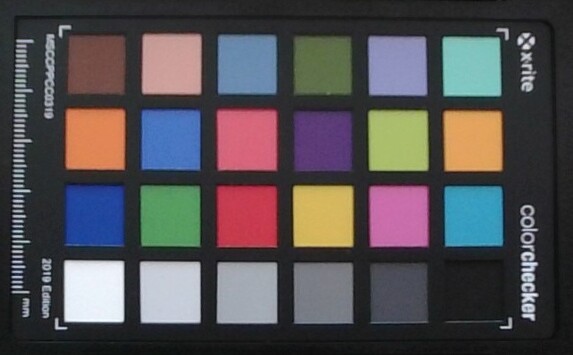
Come previsto, la webcam da 720p produce immagini non molto nitide, con una precisione dei colori che si colloca nella fascia media. Non c'è una copertura per la privacy.
ColorChecker
4 ∆E
6.9 ∆E
6.1 ∆E
2.1 ∆E
6.2 ∆E
6.5 ∆E
7.8 ∆E
11.2 ∆E
6.8 ∆E
3.4 ∆E
6.1 ∆E
7.5 ∆E
4.9 ∆E
5 ∆E
6.8 ∆E
8.9 ∆E
6.9 ∆E
9.5 ∆E
4.7 ∆E
5.3 ∆E
5.1 ∆E
5.8 ∆E
6.9 ∆E
7.4 ∆E
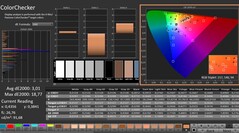
ColorChecker MSI Katana A15 AI B8VG: 6.33 ∆E min: 2.15 - max: 11.22 ∆E

Accessori

Il notebook viene fornito con diversi opuscoli informativi e un caricatore da 200 watt (incluso il cavo) che pesa circa 0,7 kg.

Manutenzione

Poiché una delle viti è coperta da un adesivo 'factory seal' e il dispositivo era un'unità di vendita, ci siamo astenuti dall'aprire lo chassis. Tuttavia, se la manutenzione e gli aggiornamenti vengono eseguiti in modo professionale, l'adesivo dovrebbe poter essere rimosso (almeno in Germania).

Sostenibilità

Il cartone è il principale materiale di imballaggio utilizzato, anche se MSI impiega anche pellicole di plastica per alcuni componenti, come il portatile, il caricabatterie (compreso il suo cavo) e i libretti informativi.

Garanzia

In Germania, si applica la consueta garanzia di 2 anni.

Dispositivi di ingresso

Tastiera

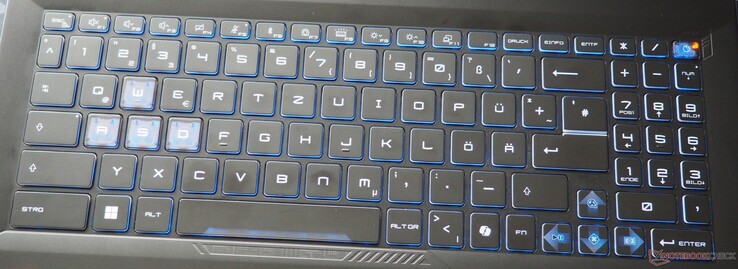
I dispositivi di input sono complessivamente solidi, anche se c'è ancora spazio per i miglioramenti. Per cominciare, il layout della tastiera potrebbe non piacere ad alcuni utenti. MSI continua a utilizzare il suo layout non convenzionale, che si discosta dallo standard tedesco in diversi modi. Il tastierino numerico a tre colonne invece del solito layout a quattro colonne richiede un po' di tempo per abituarsi. Sebbene l'esperienza di digitazione sia decente per un computer portatile da gioco, la sensazione di digitazione non è così buona come quella che si avrebbe con una tastiera meccanica e il feedback non è così raffinato. Il lato positivo è che chi ama le configurazioni colorate apprezzerà gli effetti di illuminazione RGB.

MSI Katana A15 AI

Touchpad

Il touchpad è relativamente piccolo per un notebook da 15 pollici, con dimensioni di 10,5 x 6,5 cm. Sebbene la sua superficie appaia abbastanza liscia, le sue proprietà di scorrimento lasciano spazio a miglioramenti. Lo stesso vale per la sua precisione, che non è esattamente ideale. Inoltre, il touchpad tende a vibrare durante l'uso, il che non dà un'impressione di alta qualità. Questo ricorda la qualità costruttiva inferiore del case.

Display

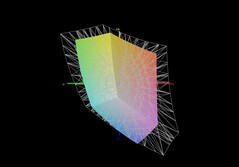
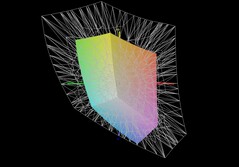
Mentre il touchpad non è eccezionale, il punto debole più grande del Katana A15 è il suo display che, come già detto, ha una copertura dello spazio colore molto scarsa, solo il 65% di sRGB.

276
cd/m²
284
cd/m²
286
cd/m²
255
cd/m²
277
cd/m²
256
cd/m²
220
cd/m²
244
cd/m²
233
cd/m²
Distribuzione della luminosità
CMN N156HRA-EA1 tested with X-Rite i1Pro 2
Massima: 286 cd/m² (Nits) Media: 259 cd/m² Minimum: 13 cd/m²
Distribuzione della luminosità: 77 %
Al centro con la batteria: 277 cd/m²
Contrasto: 1458:1 (Nero: 0.19 cd/m²)
ΔE Color 4.3 | 0.5-29.43 Ø4.9, calibrated: 3.01
ΔE Greyscale 3.6 | 0.5-98 Ø5.2
45.1% AdobeRGB 1998 (Argyll 2.2.0 3D)
65.1% sRGB (Argyll 2.2.0 3D)
43.6% Display P3 (Argyll 2.2.0 3D)
Gamma: 2.322
MSI Katana A15 AI B8VG
CMN N156HRA-EA1, IPS, 1920x1080, 15.6", 144 Hz
HP Omen 16-xf0376ng
BOE0B81, IPS, 1920x1080, 16.1", 165 Hz
HP Victus 16-r0077ng
CMN162D, IPS, 1920x1080, 16.1", 144 Hz
Aorus 15 BSF
Sharp LQ156T1JW05, IPS, 2560x1440, 15.6", 165 Hz
Lenovo Legion Pro 5 16ARX8
CSOT T3 MNG007DA1-Q, IPS, 2560x1600, 16", 165 Hz
Display
59%
52%
89%
58%
Display P3 Coverage
43.6
72.1
65%
66.7
53%
98.2
125%
70.4
61%
sRGB Coverage
65.1
99.6
53%
98
51%
99.9
53%
99.6
53%
AdobeRGB 1998 Coverage
45.1
72.3
60%
69
53%
85.7
90%
72.6
61%
Response Times
59%
54%
61%
63%
Response Time Grey 50% / Grey 80% *
28.5 ?(13.6, 14.9)
12.3 ?(5.9, 6.4)
57%
13.3 ?(6, 7.3)
53%
11.3 ?(5.2, 6.1)
60%
7 ?(3.2, 3.8)
75%
Response Time Black / White *
18.3 ?(9.9, 8.4)
7.2 ?(4, 3.2)
61%
8.2 ?(4.5, 3.7)
55%
7 ?(3.4, 3.6)
62%
9.1 ?(4.9, 4.2)
50%
PWM Frequency
Screen
8%
29%
9%
33%
Brightness middle
277
350
26%
308
11%
299
8%
355.3
28%
Brightness
259
338
31%
285
10%
282
9%
340
31%
Brightness Distribution
77
91
18%
85
10%
82
6%
91
18%
Black Level *
0.19
0.35
-84%
0.25
-32%
0.31
-63%
0.32
-68%
Contrast
1458
1000
-31%
1232
-16%
965
-34%
1110
-24%
Colorchecker dE 2000 *
4.3
3.29
23%
1.3
70%
2.24
48%
1.13
74%
Colorchecker dE 2000 max. *
19.14
8.47
56%
2.76
86%
4.29
78%
2.78
85%
Colorchecker dE 2000 calibrated *
3.01
2.23
26%
0.92
69%
2.62
13%
0.32
89%
Greyscale dE 2000 *
3.6
3.2
11%
1.7
53%
3
17%
1.4
61%
Gamma
2.322 95%
2.131 103%
2.167 102%
2.086 105%
2.24 98%
CCT
7182 91%
6317 103%
6767 96%
6289 103%
6372 102%
Media totale (Programma / Settaggio)
42% / 27%
45% / 38%
53% / 34%
51% / 42%

* ... Meglio usare valori piccoli

Quanto sopra, unito a una luminosità della retroilluminazione molto moderata (~259 cd/m²), significa che il contenuto del display può essere spesso difficile da distinguere. In poche parole, questi pannelli di visualizzazione sono del tutto inadeguati per un prodotto di questa fascia di prezzo.

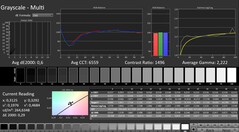
CalMAN: Scala di grigi
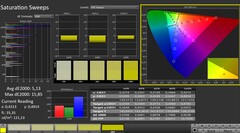
CalMAN: Sweep di saturazione
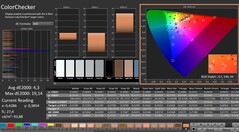
CalMAN: ColorChecker
CalMAN: Scala di grigi (calibrata)
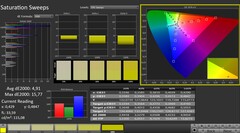
CalMAN: Sweep di saturazione (calibrato)
CalMAN: ColorChecker (calibrato)

Lo schermo a 144 Hz è effettivamente buono sotto alcuni aspetti, almeno per gli standard IPS. Non che faccia molta differenza. Il suo rapporto di contrasto è abbastanza decente, pari a 1458:1, e anche il valore del nero di 0,19 cd/m² non è da meno.

MSI Katana A15 AI vs sRGB
MSI Katana A15 AI vs AdobeRGB
MSI Katana A15 AI vs DCI-P3

D'altra parte, i suoi tempi di risposta sono indietro rispetto alla concorrenza. Meno male che qui non c'è lo sfarfallio PWM comune ai pannelli OLED.

Gli angoli di visione sono decenti, anche se non particolarmente impressionanti.

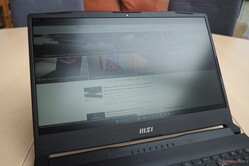
La Katana A15 AI alla luce del giorno
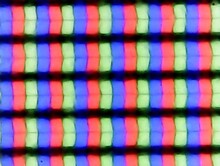
Subpixel
Subpixel
Angoli di visione
Angoli di visione

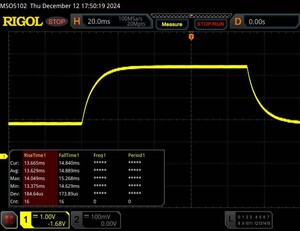
Tempi di risposta del Display

I tempi di risposta del display mostrano quanto sia veloce lo schermo a cambaire da un colore all'altro. Tempi di risposta lenti possono creare sovrapposizioni negloi oggetti in movimento. Specialmente i giocatori patiti del 3D dovrebbero usare uno schermo con tempi di risposta bassi.
       Tempi di risposta dal Nero al Bianco
18.3 ms ... aumenta ↗ e diminuisce ↘ combinato↗ 9.9 ms Incremento
↘ 8.4 ms Calo
Lo schermo mostra buoni tempi di risposta durante i nostri tests, ma potrebbe essere troppo lento per i gamers competitivi.
In confronto, tutti i dispositivi di test variano da 0.1 (minimo) a 240 (massimo) ms. » 37 % di tutti i dispositivi è migliore.
Questo significa che i tempi di risposta rilevati sono migliori rispettto alla media di tutti i dispositivi testati (20.9 ms).
       Tempo di risposta dal 50% Grigio all'80% Grigio
28.5 ms ... aumenta ↗ e diminuisce ↘ combinato↗ 13.6 ms Incremento
↘ 14.9 ms Calo
Lo schermo mostra tempi di risposta relativamente lenti nei nostri tests e potrebbe essere troppo lento per i gamers.
In confronto, tutti i dispositivi di test variano da 0.165 (minimo) a 636 (massimo) ms. » 35 % di tutti i dispositivi è migliore.
Questo significa che i tempi di risposta rilevati sono migliori rispettto alla media di tutti i dispositivi testati (32.8 ms).

Sfarfallio dello schermo / PWM (Pulse-Width Modulation)

Per ridurre la luminosità dello schermo, alcuni portatili accendono e spengono la retroilluminazione in rapida successione - un metodo chiamato Pulse Width Modulation (PWM). Questa frequenza di ciclo a livello ideale non dovrebbe essere percepibile dall'occhi umano. Se tale frequenza è troppo bassa, gli utenti con occhi sensibili potrebbero stancarsi gli occhi o avere mal di testa o anche notare uno sfarfallio.
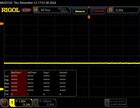
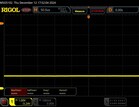
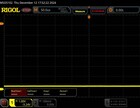
flickering dello schermo / PWM non rilevato

In confronto: 53 % di tutti i dispositivi testati non utilizza PWM per ridurre la luminosita' del display. Se è rilevato PWM, una media di 8687 (minimo: 5 - massimo: 343500) Hz è stata rilevata.

100 % di luminosità
100 % di luminosità
75 % di luminosità
75 % di luminosità
50 % di luminosità
50 % di luminosità
25 % di luminosità
25 % di luminosità
0 % di luminosità
0 % di luminosità

Prestazioni

Sia la RTX 4060 e la RTX 4070 sono dotate di 8 GB di VRAM, che non sono molti. Questo rende essenzialmente il Katana A15 AI un portatile da gioco di fascia media. Tuttavia, i chip Ryzen utilizzati dovrebbero avere potenza sufficiente per le applicazioni più impegnative per gli anni a venire. Inoltre, la RAM e lo storage possono essere aggiornati o sostituiti se necessario.

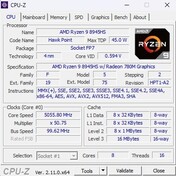
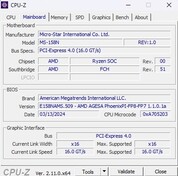
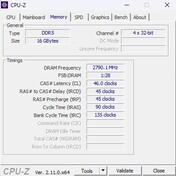
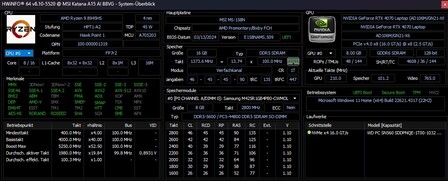
CPU-Z
CPU-Z
CPU-Z
CPU-Z
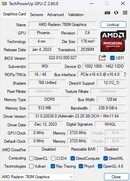
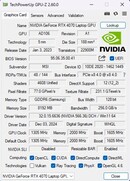
GPU-Z
GPU-Z
HWiNFO
 

Condizioni del test

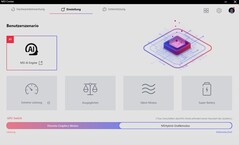
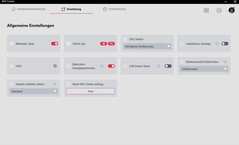
L'MSI Center, un po' lento, offre varie modalità sotto la voce 'Scenario utente', che vanno da 'Super batteria' a 'Prestazioni estreme', con alcune modalità che fanno cambiare drasticamente il comportamento della ventola. Tutte le nostre misurazioni e i nostri test sono stati condotti con la modalità 'MSI AI Engine' attiva, che massimizza le prestazioni grafiche mantenendo il TDP della CPU al livello della modalità 'Bilanciata'.

Centro MSI
Centro MSI
Centro MSI
Cyberpunk 2077 Loop (FHD/Ultra) MSI AI Engine Prestazioni estreme Bilanciato Modalità silenziosa
Rumore 52 dB(A) 52 dB(A) 48 dB(A) 39 dB(A)
Prestazioni 74 fps 74 fps 64 fps 62 fps
CPU PL1 (HWiNFO) 50 W 54 W 50 W 35 W
CPU PL2 (HWiNFO) 54 W 65 W 54 W 40 W

Processore

Il Ryzen 9 8945HS nella Katana A15 AI offre prestazioni che non sono né particolarmente impressionanti né deludenti. I suoi risultati sono paragonabili a quelli del Ryzen 7 7840HS nell'HP Omen 16, mentre il Ryzen 7 7745HX nel Lenovo Legion Pro 5 16 è circa il 10% più veloce in tutti i test. Il modello 8945HS dispone di otto core di CPU in grado di elaborare fino a 16 thread simultaneamente tramite SMT. Con la commutazione grafica integrata, le attività semplici come il lavoro d'ufficio, la riproduzione di video e la navigazione sul Web sono gestite dal processore integrato Radeon 780M integrato nel processorerisparmiando energia. L'interruttore MUX consente di disattivare la GPU integrata e di affidarsi esclusivamente alla scheda grafica Nvidia.

Cinebench R15 Multi loop

01503004506007509001050120013501500165018001950210022502400255027002850Tooltip
MSI Katana A15 AI B8VG AMD Ryzen 9 8945HS: Ø2571 (2495.48-2619.69)
HP Omen 16-xf0376ng AMD Ryzen 7 7840HS: Ø2531 (2518.1-2561.97)
HP Victus 16-r0077ng Intel Core i7-13700H: Ø2242 (2203.13-2316.56)
Aorus 15 BSF Intel Core i7-13700H: Ø2187 (2043.32-2737.16)
Lenovo Legion Pro 5 16ARX8 AMD Ryzen 7 7745HX: Ø2918 (2861.03-2977.96)
CPU Performance Rating - Percent
Media della classe Gaming
 
83.6 pt
Lenovo Legion Pro 5 16ARX8 -2!
AMD Ryzen 7 7745HX
78.2 pt
Media AMD Ryzen 9 8945HS
 
74.3 pt
Aorus 15 BSF
Intel Core i7-13700H
73.2 pt
HP Omen 16-xf0376ng
AMD Ryzen 7 7840HS
71.6 pt
MSI Katana A15 AI B8VG
AMD Ryzen 9 8945HS
71 pt
HP Victus 16-r0077ng
Intel Core i7-13700H
64.4 pt
Cinebench R23
Multi Core
Media della classe Gaming
  (5668 - 36249, n=187, ultimi 2 anni)
22019 Points +34%
Lenovo Legion Pro 5 16ARX8
AMD Ryzen 7 7745HX
18060 (17729.5min - 18059.9max) Points +10%
Aorus 15 BSF
Intel Core i7-13700H
17219 Points +5%
Media AMD Ryzen 9 8945HS
  (16463 - 17376, n=5)
16958 Points +3%
MSI Katana A15 AI B8VG
AMD Ryzen 9 8945HS
16463 Points
HP Omen 16-xf0376ng
AMD Ryzen 7 7840HS
16188 Points -2%
HP Victus 16-r0077ng
Intel Core i7-13700H
15410 Points -6%
Single Core
Aorus 15 BSF
Intel Core i7-13700H
1899 Points +10%
Media della classe Gaming
  (1136 - 2235, n=185, ultimi 2 anni)
1893 Points +10%
Lenovo Legion Pro 5 16ARX8
AMD Ryzen 7 7745HX
1846 Points +7%
Media AMD Ryzen 9 8945HS
  (1719 - 1825, n=5)
1792 Points +4%
HP Omen 16-xf0376ng
AMD Ryzen 7 7840HS
1785 Points +4%
MSI Katana A15 AI B8VG
AMD Ryzen 9 8945HS
1719 Points
HP Victus 16-r0077ng
Intel Core i7-13700H
1687 Points -2%
Cinebench R20
CPU (Multi Core)
Media della classe Gaming
  (2179 - 13832, n=185, ultimi 2 anni)
8379 Points +31%
Lenovo Legion Pro 5 16ARX8
AMD Ryzen 7 7745HX
7072 Points +10%
Aorus 15 BSF
Intel Core i7-13700H
6650 Points +4%
Media AMD Ryzen 9 8945HS
  (6404 - 6785, n=5)
6617 Points +3%
MSI Katana A15 AI B8VG
AMD Ryzen 9 8945HS
6404 Points
HP Omen 16-xf0376ng
AMD Ryzen 7 7840HS
6224 Points -3%
HP Victus 16-r0077ng
Intel Core i7-13700H
5895 Points -8%
CPU (Single Core)
Aorus 15 BSF
Intel Core i7-13700H
732 Points +8%
Media della classe Gaming
  (439 - 856, n=185, ultimi 2 anni)
727 Points +8%
Lenovo Legion Pro 5 16ARX8
AMD Ryzen 7 7745HX
717 Points +6%
Media AMD Ryzen 9 8945HS
  (676 - 711, n=5)
696 Points +3%
HP Omen 16-xf0376ng
AMD Ryzen 7 7840HS
693 Points +3%
MSI Katana A15 AI B8VG
AMD Ryzen 9 8945HS
676 Points
HP Victus 16-r0077ng
Intel Core i7-13700H
649 Points -4%
Cinebench R15
CPU Multi 64Bit
Media della classe Gaming
  (905 - 5663, n=192, ultimi 2 anni)
3445 Points +31%
Lenovo Legion Pro 5 16ARX8
AMD Ryzen 7 7745HX
2978 (2861.03min - 2977.96max) Points +14%
Aorus 15 BSF
Intel Core i7-13700H
2737 Points +4%
Media AMD Ryzen 9 8945HS
  (2620 - 2775, n=5)
2671 Points +2%
MSI Katana A15 AI B8VG
AMD Ryzen 9 8945HS
2620 (2495.48min - 2619.69max) Points
HP Omen 16-xf0376ng
AMD Ryzen 7 7840HS
2562 (2518.1min - 2561.97max) Points -2%
HP Victus 16-r0077ng
Intel Core i7-13700H
2317 (2203.13min - 2316.56max) Points -12%
CPU Single 64Bit
Lenovo Legion Pro 5 16ARX8
AMD Ryzen 7 7745HX
294 Points +11%
HP Omen 16-xf0376ng
AMD Ryzen 7 7840HS
280 Points +6%
Media AMD Ryzen 9 8945HS
  (265 - 287, n=5)
279 Points +5%
Media della classe Gaming
  (191.9 - 318, n=189, ultimi 2 anni)
278 Points +5%
Aorus 15 BSF
Intel Core i7-13700H
272 Points +3%
MSI Katana A15 AI B8VG
AMD Ryzen 9 8945HS
265 Points
HP Victus 16-r0077ng
Intel Core i7-13700H
245 Points -8%
Blender - v2.79 BMW27 CPU
Aorus 15 BSF
Intel Core i7-13700H
220 Seconds * -11%
HP Victus 16-r0077ng
Intel Core i7-13700H
215 Seconds * -9%
HP Omen 16-xf0376ng
AMD Ryzen 7 7840HS
198 Seconds * -0%
MSI Katana A15 AI B8VG
AMD Ryzen 9 8945HS
198 Seconds *
Media AMD Ryzen 9 8945HS
  (186 - 198, n=5)
192.8 Seconds * +3%
Lenovo Legion Pro 5 16ARX8
AMD Ryzen 7 7745HX
174 Seconds * +12%
Media della classe Gaming
  (87 - 555, n=180, ultimi 2 anni)
169 Seconds * +15%
7-Zip 18.03
7z b 4
Media della classe Gaming
  (23795 - 140932, n=184, ultimi 2 anni)
85971 MIPS +25%
Lenovo Legion Pro 5 16ARX8
AMD Ryzen 7 7745HX
75557 MIPS +10%
Media AMD Ryzen 9 8945HS
  (68889 - 72821, n=5)
71330 MIPS +4%
MSI Katana A15 AI B8VG
AMD Ryzen 9 8945HS
68889 MIPS
HP Omen 16-xf0376ng
AMD Ryzen 7 7840HS
68646 MIPS 0%
HP Victus 16-r0077ng
Intel Core i7-13700H
65405 MIPS -5%
Aorus 15 BSF
Intel Core i7-13700H
62343 MIPS -10%
7z b 4 -mmt1
Lenovo Legion Pro 5 16ARX8
AMD Ryzen 7 7745HX
7244 MIPS +11%
HP Omen 16-xf0376ng
AMD Ryzen 7 7840HS
6640 MIPS +2%
MSI Katana A15 AI B8VG
AMD Ryzen 9 8945HS
6501 MIPS
Media AMD Ryzen 9 8945HS
  (5994 - 6668, n=5)
6332 MIPS -3%
Media della classe Gaming
  (4199 - 7581, n=184, ultimi 2 anni)
6324 MIPS -3%
Aorus 15 BSF
Intel Core i7-13700H
6197 MIPS -5%
HP Victus 16-r0077ng
Intel Core i7-13700H
5559 MIPS -14%
Geekbench 6.3
Multi-Core
Media della classe Gaming
  (5340 - 19665, n=113, ultimi 2 anni)
14205 Points +18%
Aorus 15 BSF
Intel Core i7-13700H
13493 Points +12%
Media AMD Ryzen 9 8945HS
  (12015 - 13715, n=6)
13157 Points +10%
HP Omen 16-xf0376ng
AMD Ryzen 7 7840HS
12111 Points +1%
MSI Katana A15 AI B8VG
AMD Ryzen 9 8945HS
12015 Points
HP Victus 16-r0077ng
Intel Core i7-13700H
11741 Points -2%
Single-Core
HP Omen 16-xf0376ng
AMD Ryzen 7 7840HS
2670 Points +11%
Media della classe Gaming
  (1490 - 3129, n=113, ultimi 2 anni)
2649 Points +10%
Aorus 15 BSF
Intel Core i7-13700H
2627 Points +10%
Media AMD Ryzen 9 8945HS
  (2399 - 2707, n=6)
2625 Points +9%
MSI Katana A15 AI B8VG
AMD Ryzen 9 8945HS
2399 Points
HP Victus 16-r0077ng
Intel Core i7-13700H
2395 Points 0%
Geekbench 5.5
Multi-Core
Media della classe Gaming
  (4557 - 23194, n=185, ultimi 2 anni)
15135 Points +38%
Aorus 15 BSF
Intel Core i7-13700H
13409 Points +22%
Lenovo Legion Pro 5 16ARX8
AMD Ryzen 7 7745HX
12378 Points +13%
Media AMD Ryzen 9 8945HS
  (10985 - 12481, n=6)
11890 Points +8%
HP Victus 16-r0077ng
Intel Core i7-13700H
11504 Points +5%
HP Omen 16-xf0376ng
AMD Ryzen 7 7840HS
11414 Points +4%
MSI Katana A15 AI B8VG
AMD Ryzen 9 8945HS
10985 Points
Single-Core
Lenovo Legion Pro 5 16ARX8
AMD Ryzen 7 7745HX
2040 Points +5%
HP Omen 16-xf0376ng
AMD Ryzen 7 7840HS
2005 Points +3%
MSI Katana A15 AI B8VG
AMD Ryzen 9 8945HS
1950 Points
Media AMD Ryzen 9 8945HS
  (1835 - 2039, n=6)
1937 Points -1%
Media della classe Gaming
  (986 - 2210, n=185, ultimi 2 anni)
1899 Points -3%
Aorus 15 BSF
Intel Core i7-13700H
1880 Points -4%
HP Victus 16-r0077ng
Intel Core i7-13700H
1685 Points -14%
HWBOT x265 Benchmark v2.2 - 4k Preset
Media della classe Gaming
  (6.72 - 38.9, n=184, ultimi 2 anni)
23.6 fps +19%
Lenovo Legion Pro 5 16ARX8
AMD Ryzen 7 7745HX
23.2 fps +17%
Media AMD Ryzen 9 8945HS
  (19.8 - 22.2, n=5)
21.1 fps +7%
HP Omen 16-xf0376ng
AMD Ryzen 7 7840HS
19.8 fps 0%
MSI Katana A15 AI B8VG
AMD Ryzen 9 8945HS
19.8 fps
HP Victus 16-r0077ng
Intel Core i7-13700H
16.6 fps -16%
Aorus 15 BSF
Intel Core i7-13700H
16.4 fps -17%
LibreOffice - 20 Documents To PDF
HP Omen 16-xf0376ng
AMD Ryzen 7 7840HS
65.1 s * -19%
HP Victus 16-r0077ng
Intel Core i7-13700H
61.5 s * -12%
MSI Katana A15 AI B8VG
AMD Ryzen 9 8945HS
54.9 s *
Media AMD Ryzen 9 8945HS
  (48.4 - 54.9, n=4)
51.6 s * +6%
Media della classe Gaming
  (19 - 96.6, n=181, ultimi 2 anni)
47.3 s * +14%
Aorus 15 BSF
Intel Core i7-13700H
47.1 s * +14%
Lenovo Legion Pro 5 16ARX8
AMD Ryzen 7 7745HX
37.9 s * +31%
R Benchmark 2.5 - Overall mean
HP Victus 16-r0077ng
Intel Core i7-13700H
0.504 sec * -16%
Aorus 15 BSF
Intel Core i7-13700H
0.4421 sec * -1%
Media AMD Ryzen 9 8945HS
  (0.4294 - 0.4452, n=4)
0.4362 sec * -0%
Media della classe Gaming
  (0.3609 - 0.759, n=185, ultimi 2 anni)
0.4362 sec * -0%
MSI Katana A15 AI B8VG
AMD Ryzen 9 8945HS
0.4357 sec *
HP Omen 16-xf0376ng
AMD Ryzen 7 7840HS
0.4309 sec * +1%
Lenovo Legion Pro 5 16ARX8
AMD Ryzen 7 7745HX
0.421 sec * +3%

* ... Meglio usare valori piccoli

Cinebench R15 CPU Multi 64Bit
2620 Points
Cinebench R15 Ref. Match 64Bit
99.6 %
Cinebench R15 CPU Single 64Bit
265 Points
Cinebench R20 CPU (Multi Core)
6404 Points
Cinebench R20 CPU (Single Core)
676 Points
Cinebench R23 Single Core
1719 Points
Cinebench R23 Multi Core
16463 Points
Aiuto
Performance Rating
Media AMD Ryzen 9 8945HS
 
93.6 pt
Lenovo Legion Pro 5 16ARX8
AMD Ryzen 7 7745HX, NVIDIA GeForce RTX 4070 Laptop GPU
91.3 pt
MSI Katana A15 AI B8VG
AMD Ryzen 9 8945HS, NVIDIA GeForce RTX 4070 Laptop GPU
88.8 pt
Media della classe Gaming
 
88.8 pt
HP Omen 16-xf0376ng
AMD Ryzen 7 7840HS, NVIDIA GeForce RTX 4070 Laptop GPU
85 pt
Aorus 15 BSF
Intel Core i7-13700H, NVIDIA GeForce RTX 4070 Laptop GPU
66.8 pt
HP Victus 16-r0077ng
Intel Core i7-13700H, NVIDIA GeForce RTX 4070 Laptop GPU
62.8 pt
AIDA64 / FP32 Ray-Trace
Lenovo Legion Pro 5 16ARX8
AMD Ryzen 7 7745HX, NVIDIA GeForce RTX 4070 Laptop GPU
29656 KRay/s +11%
Media AMD Ryzen 9 8945HS
  (26817 - 28836, n=4)
27600 KRay/s +3%
MSI Katana A15 AI B8VG
AMD Ryzen 9 8945HS, NVIDIA GeForce RTX 4070 Laptop GPU
26817 KRay/s
HP Omen 16-xf0376ng
AMD Ryzen 7 7840HS, NVIDIA GeForce RTX 4070 Laptop GPU
25896 KRay/s -3%
Media della classe Gaming
  (4986 - 60169, n=181, ultimi 2 anni)
22026 KRay/s -18%
HP Victus 16-r0077ng
Intel Core i7-13700H, NVIDIA GeForce RTX 4070 Laptop GPU
14470 KRay/s -46%
Aorus 15 BSF
Intel Core i7-13700H, NVIDIA GeForce RTX 4070 Laptop GPU
13479 KRay/s -50%
AIDA64 / FPU Julia
Lenovo Legion Pro 5 16ARX8
AMD Ryzen 7 7745HX, NVIDIA GeForce RTX 4070 Laptop GPU
120974 Points +7%
Media AMD Ryzen 9 8945HS
  (113231 - 122633, n=4)
116809 Points +3%
MSI Katana A15 AI B8VG
AMD Ryzen 9 8945HS, NVIDIA GeForce RTX 4070 Laptop GPU
113231 Points
HP Omen 16-xf0376ng
AMD Ryzen 7 7840HS, NVIDIA GeForce RTX 4070 Laptop GPU
109633 Points -3%
Media della classe Gaming
  (25360 - 252486, n=181, ultimi 2 anni)
107276 Points -5%
HP Victus 16-r0077ng
Intel Core i7-13700H, NVIDIA GeForce RTX 4070 Laptop GPU
72193 Points -36%
Aorus 15 BSF
Intel Core i7-13700H, NVIDIA GeForce RTX 4070 Laptop GPU
69345 Points -39%
AIDA64 / CPU SHA3
Lenovo Legion Pro 5 16ARX8
AMD Ryzen 7 7745HX, NVIDIA GeForce RTX 4070 Laptop GPU
4974 MB/s +3%
Media AMD Ryzen 9 8945HS
  (4839 - 5077, n=4)
4955 MB/s +2%
Media della classe Gaming
  (1339 - 10389, n=181, ultimi 2 anni)
4933 MB/s +2%
MSI Katana A15 AI B8VG
AMD Ryzen 9 8945HS, NVIDIA GeForce RTX 4070 Laptop GPU
4839 MB/s
HP Omen 16-xf0376ng
AMD Ryzen 7 7840HS, NVIDIA GeForce RTX 4070 Laptop GPU
4602 MB/s -5%
HP Victus 16-r0077ng
Intel Core i7-13700H, NVIDIA GeForce RTX 4070 Laptop GPU
3326 MB/s -31%
Aorus 15 BSF
Intel Core i7-13700H, NVIDIA GeForce RTX 4070 Laptop GPU
3238 MB/s -33%
AIDA64 / CPU Queen
Lenovo Legion Pro 5 16ARX8
AMD Ryzen 7 7745HX, NVIDIA GeForce RTX 4070 Laptop GPU
126954 Points +6%
Media AMD Ryzen 9 8945HS
  (119279 - 125044, n=4)
121122 Points +2%
MSI Katana A15 AI B8VG
AMD Ryzen 9 8945HS, NVIDIA GeForce RTX 4070 Laptop GPU
119279 Points
Media della classe Gaming
  (50699 - 200651, n=181, ultimi 2 anni)
117382 Points -2%
HP Omen 16-xf0376ng
AMD Ryzen 7 7840HS, NVIDIA GeForce RTX 4070 Laptop GPU
117257 Points -2%
Aorus 15 BSF
Intel Core i7-13700H, NVIDIA GeForce RTX 4070 Laptop GPU
105776 Points -11%
HP Victus 16-r0077ng
Intel Core i7-13700H, NVIDIA GeForce RTX 4070 Laptop GPU
91638 Points -23%
AIDA64 / FPU SinJulia
Lenovo Legion Pro 5 16ARX8
AMD Ryzen 7 7745HX, NVIDIA GeForce RTX 4070 Laptop GPU
15887 Points +4%
Media AMD Ryzen 9 8945HS
  (15026 - 15661, n=4)
15352 Points 0%
MSI Katana A15 AI B8VG
AMD Ryzen 9 8945HS, NVIDIA GeForce RTX 4070 Laptop GPU
15308 Points
HP Omen 16-xf0376ng
AMD Ryzen 7 7840HS, NVIDIA GeForce RTX 4070 Laptop GPU
15036 Points -2%
Media della classe Gaming
  (4800 - 32988, n=181, ultimi 2 anni)
13326 Points -13%
Aorus 15 BSF
Intel Core i7-13700H, NVIDIA GeForce RTX 4070 Laptop GPU
9143 Points -40%
HP Victus 16-r0077ng
Intel Core i7-13700H, NVIDIA GeForce RTX 4070 Laptop GPU
8677 Points -43%
AIDA64 / FPU Mandel
Lenovo Legion Pro 5 16ARX8
AMD Ryzen 7 7745HX, NVIDIA GeForce RTX 4070 Laptop GPU
64255 Points +6%
Media AMD Ryzen 9 8945HS
  (60420 - 65746, n=4)
62427 Points +3%
MSI Katana A15 AI B8VG
AMD Ryzen 9 8945HS, NVIDIA GeForce RTX 4070 Laptop GPU
60420 Points
HP Omen 16-xf0376ng
AMD Ryzen 7 7840HS, NVIDIA GeForce RTX 4070 Laptop GPU
58454 Points -3%
Media della classe Gaming
  (12321 - 134044, n=181, ultimi 2 anni)
53979 Points -11%
HP Victus 16-r0077ng
Intel Core i7-13700H, NVIDIA GeForce RTX 4070 Laptop GPU
36179 Points -40%
Aorus 15 BSF
Intel Core i7-13700H, NVIDIA GeForce RTX 4070 Laptop GPU
33785 Points -44%
AIDA64 / CPU AES
Aorus 15 BSF
Intel Core i7-13700H, NVIDIA GeForce RTX 4070 Laptop GPU
119772 MB/s +38%
Media della classe Gaming
  (19065 - 328679, n=181, ultimi 2 anni)
109221 MB/s +26%
Media AMD Ryzen 9 8945HS
  (86495 - 169431, n=4)
109074 MB/s +26%
MSI Katana A15 AI B8VG
AMD Ryzen 9 8945HS, NVIDIA GeForce RTX 4070 Laptop GPU
86495 MB/s
Lenovo Legion Pro 5 16ARX8
AMD Ryzen 7 7745HX, NVIDIA GeForce RTX 4070 Laptop GPU
71191 MB/s -18%
HP Omen 16-xf0376ng
AMD Ryzen 7 7840HS, NVIDIA GeForce RTX 4070 Laptop GPU
67389 MB/s -22%
HP Victus 16-r0077ng
Intel Core i7-13700H, NVIDIA GeForce RTX 4070 Laptop GPU
66484 MB/s -23%
AIDA64 / CPU ZLib
Media della classe Gaming
  (373 - 2409, n=181, ultimi 2 anni)
1373 MB/s +28%
Lenovo Legion Pro 5 16ARX8
AMD Ryzen 7 7745HX, NVIDIA GeForce RTX 4070 Laptop GPU
1147 MB/s +7%
Media AMD Ryzen 9 8945HS
  (1029 - 1135, n=4)
1089 MB/s +1%
MSI Katana A15 AI B8VG
AMD Ryzen 9 8945HS, NVIDIA GeForce RTX 4070 Laptop GPU
1076 MB/s
HP Omen 16-xf0376ng
AMD Ryzen 7 7840HS, NVIDIA GeForce RTX 4070 Laptop GPU
1062 MB/s -1%
HP Victus 16-r0077ng
Intel Core i7-13700H, NVIDIA GeForce RTX 4070 Laptop GPU
950 MB/s -12%
Aorus 15 BSF
Intel Core i7-13700H, NVIDIA GeForce RTX 4070 Laptop GPU
917 MB/s -15%
AIDA64 / FP64 Ray-Trace
Lenovo Legion Pro 5 16ARX8
AMD Ryzen 7 7745HX, NVIDIA GeForce RTX 4070 Laptop GPU
15975 KRay/s +12%
Media AMD Ryzen 9 8945HS
  (14216 - 15588, n=4)
14748 KRay/s +4%
MSI Katana A15 AI B8VG
AMD Ryzen 9 8945HS, NVIDIA GeForce RTX 4070 Laptop GPU
14216 KRay/s
HP Omen 16-xf0376ng
AMD Ryzen 7 7840HS, NVIDIA GeForce RTX 4070 Laptop GPU
13731 KRay/s -3%
Media della classe Gaming
  (2540 - 31796, n=181, ultimi 2 anni)
11862 KRay/s -17%
HP Victus 16-r0077ng
Intel Core i7-13700H, NVIDIA GeForce RTX 4070 Laptop GPU
7770 KRay/s -45%
Aorus 15 BSF
Intel Core i7-13700H, NVIDIA GeForce RTX 4070 Laptop GPU
7334 KRay/s -48%
AIDA64 / CPU PhotoWorxx
Media della classe Gaming
  (10805 - 60161, n=182, ultimi 2 anni)
40511 MPixel/s +21%
HP Victus 16-r0077ng
Intel Core i7-13700H, NVIDIA GeForce RTX 4070 Laptop GPU
39045 MPixel/s +17%
Media AMD Ryzen 9 8945HS
  (33371 - 40815, n=4)
38308 MPixel/s +15%
Aorus 15 BSF
Intel Core i7-13700H, NVIDIA GeForce RTX 4070 Laptop GPU
37932 MPixel/s +14%
HP Omen 16-xf0376ng
AMD Ryzen 7 7840HS, NVIDIA GeForce RTX 4070 Laptop GPU
33395 MPixel/s 0%
MSI Katana A15 AI B8VG
AMD Ryzen 9 8945HS, NVIDIA GeForce RTX 4070 Laptop GPU
33371 MPixel/s
Lenovo Legion Pro 5 16ARX8
AMD Ryzen 7 7745HX, NVIDIA GeForce RTX 4070 Laptop GPU
28499 MPixel/s -15%

Prestazioni del sistema

Le prestazioni del sistema sono costantemente buone, con la Katana che si comporta in modo simile ai suoi concorrenti in PCMark 10. Le velocità di trasferimento dei dati della RAM sono impressionanti per i moduli da 5.600 MT/s.

PCMark 10 / Score
Lenovo Legion Pro 5 16ARX8
NVIDIA GeForce RTX 4070 Laptop GPU, R7 7745HX, Samsung PM9A1 MZVL21T0HCLR
8206 Points +10%
HP Omen 16-xf0376ng
NVIDIA GeForce RTX 4070 Laptop GPU, R7 7840HS, WDC PC SN810 512GB
8167 Points +9%
Media della classe Gaming
  (5776 - 9852, n=163, ultimi 2 anni)
7825 Points +5%
Media AMD Ryzen 9 8945HS, NVIDIA GeForce RTX 4070 Laptop GPU
  (7436 - 8312, n=3)
7740 Points +4%
MSI Katana A15 AI B8VG
NVIDIA GeForce RTX 4070 Laptop GPU, R9 8945HS, WD PC SN560 SDDPNQE-1T00
7473 Points
Aorus 15 BSF
NVIDIA GeForce RTX 4070 Laptop GPU, i7-13700H, Gigabyte AG470S1TB-SI B10
7309 Points -2%
HP Victus 16-r0077ng
NVIDIA GeForce RTX 4070 Laptop GPU, i7-13700H, Kioxia XG8 KXG80ZNV1T02
7158 Points -4%
PCMark 10 / Essentials
HP Omen 16-xf0376ng
NVIDIA GeForce RTX 4070 Laptop GPU, R7 7840HS, WDC PC SN810 512GB
11250 Points +16%
Lenovo Legion Pro 5 16ARX8
NVIDIA GeForce RTX 4070 Laptop GPU, R7 7745HX, Samsung PM9A1 MZVL21T0HCLR
11074 Points +14%
Media della classe Gaming
  (9057 - 12600, n=162, ultimi 2 anni)
10842 Points +12%
Aorus 15 BSF
NVIDIA GeForce RTX 4070 Laptop GPU, i7-13700H, Gigabyte AG470S1TB-SI B10
10812 Points +12%
HP Victus 16-r0077ng
NVIDIA GeForce RTX 4070 Laptop GPU, i7-13700H, Kioxia XG8 KXG80ZNV1T02
10707 Points +11%
Media AMD Ryzen 9 8945HS, NVIDIA GeForce RTX 4070 Laptop GPU
  (9672 - 11290, n=3)
10274 Points +6%
MSI Katana A15 AI B8VG
NVIDIA GeForce RTX 4070 Laptop GPU, R9 8945HS, WD PC SN560 SDDPNQE-1T00
9672 Points
PCMark 10 / Productivity
Lenovo Legion Pro 5 16ARX8
NVIDIA GeForce RTX 4070 Laptop GPU, R7 7745HX, Samsung PM9A1 MZVL21T0HCLR
10235 Points +7%
HP Omen 16-xf0376ng
NVIDIA GeForce RTX 4070 Laptop GPU, R7 7840HS, WDC PC SN810 512GB
10179 Points +6%
Media della classe Gaming
  (6662 - 14612, n=162, ultimi 2 anni)
9918 Points +3%
Media AMD Ryzen 9 8945HS, NVIDIA GeForce RTX 4070 Laptop GPU
  (9502 - 10332, n=3)
9809 Points +2%
MSI Katana A15 AI B8VG
NVIDIA GeForce RTX 4070 Laptop GPU, R9 8945HS, WD PC SN560 SDDPNQE-1T00
9593 Points
Aorus 15 BSF
NVIDIA GeForce RTX 4070 Laptop GPU, i7-13700H, Gigabyte AG470S1TB-SI B10
9033 Points -6%
HP Victus 16-r0077ng
NVIDIA GeForce RTX 4070 Laptop GPU, i7-13700H, Kioxia XG8 KXG80ZNV1T02
8974 Points -6%
PCMark 10 / Digital Content Creation
Lenovo Legion Pro 5 16ARX8
NVIDIA GeForce RTX 4070 Laptop GPU, R7 7745HX, Samsung PM9A1 MZVL21T0HCLR
13229 Points +8%
HP Omen 16-xf0376ng
NVIDIA GeForce RTX 4070 Laptop GPU, R7 7840HS, WDC PC SN810 512GB
12908 Points +6%
Media AMD Ryzen 9 8945HS, NVIDIA GeForce RTX 4070 Laptop GPU
  (11907 - 13363, n=3)
12492 Points +2%
MSI Katana A15 AI B8VG
NVIDIA GeForce RTX 4070 Laptop GPU, R9 8945HS, WD PC SN560 SDDPNQE-1T00
12207 Points
Media della classe Gaming
  (6807 - 18475, n=162, ultimi 2 anni)
12205 Points 0%
Aorus 15 BSF
NVIDIA GeForce RTX 4070 Laptop GPU, i7-13700H, Gigabyte AG470S1TB-SI B10
10847 Points -11%
HP Victus 16-r0077ng
NVIDIA GeForce RTX 4070 Laptop GPU, i7-13700H, Kioxia XG8 KXG80ZNV1T02
10358 Points -15%
CrossMark / Overall
Aorus 15 BSF
NVIDIA GeForce RTX 4070 Laptop GPU, i7-13700H, Gigabyte AG470S1TB-SI B10
2073 Points
Lenovo Legion Pro 5 16ARX8
NVIDIA GeForce RTX 4070 Laptop GPU, R7 7745HX, Samsung PM9A1 MZVL21T0HCLR
2027 Points
Media della classe Gaming
  (1247 - 2344, n=143, ultimi 2 anni)
1915 Points
Media AMD Ryzen 9 8945HS, NVIDIA GeForce RTX 4070 Laptop GPU
  (1767 - 1830, n=2)
1799 Points
CrossMark / Productivity
Aorus 15 BSF
NVIDIA GeForce RTX 4070 Laptop GPU, i7-13700H, Gigabyte AG470S1TB-SI B10
2006 Points
Lenovo Legion Pro 5 16ARX8
NVIDIA GeForce RTX 4070 Laptop GPU, R7 7745HX, Samsung PM9A1 MZVL21T0HCLR
1930 Points
Media della classe Gaming
  (1299 - 2204, n=143, ultimi 2 anni)
1813 Points
Media AMD Ryzen 9 8945HS, NVIDIA GeForce RTX 4070 Laptop GPU
  (1686 - 1783, n=2)
1735 Points
CrossMark / Creativity
Lenovo Legion Pro 5 16ARX8
NVIDIA GeForce RTX 4070 Laptop GPU, R7 7745HX, Samsung PM9A1 MZVL21T0HCLR
2222 Points
Media della classe Gaming
  (1275 - 2660, n=143, ultimi 2 anni)
2104 Points
Aorus 15 BSF
NVIDIA GeForce RTX 4070 Laptop GPU, i7-13700H, Gigabyte AG470S1TB-SI B10
2100 Points
Media AMD Ryzen 9 8945HS, NVIDIA GeForce RTX 4070 Laptop GPU
  (1935 - 1960, n=2)
1948 Points
CrossMark / Responsiveness
Aorus 15 BSF
NVIDIA GeForce RTX 4070 Laptop GPU, i7-13700H, Gigabyte AG470S1TB-SI B10
2202 Points
Lenovo Legion Pro 5 16ARX8
NVIDIA GeForce RTX 4070 Laptop GPU, R7 7745HX, Samsung PM9A1 MZVL21T0HCLR
1785 Points
Media della classe Gaming
  (1030 - 2330, n=143, ultimi 2 anni)
1711 Points
Media AMD Ryzen 9 8945HS, NVIDIA GeForce RTX 4070 Laptop GPU
  (1489 - 1672, n=2)
1581 Points
WebXPRT 3 / Overall
Lenovo Legion Pro 5 16ARX8
NVIDIA GeForce RTX 4070 Laptop GPU, R7 7745HX, Samsung PM9A1 MZVL21T0HCLR
345 Points +29%
HP Omen 16-xf0376ng
NVIDIA GeForce RTX 4070 Laptop GPU, R7 7840HS, WDC PC SN810 512GB
325 Points +21%
HP Omen 16-xf0376ng
NVIDIA GeForce RTX 4070 Laptop GPU, R7 7840HS, WDC PC SN810 512GB
325 Points +21%
Aorus 15 BSF
NVIDIA GeForce RTX 4070 Laptop GPU, i7-13700H, Gigabyte AG470S1TB-SI B10
310 Points +16%
Media della classe Gaming
  (215 - 480, n=160, ultimi 2 anni)
304 Points +13%
Media AMD Ryzen 9 8945HS, NVIDIA GeForce RTX 4070 Laptop GPU
  (268 - 324, n=3)
298 Points +11%
HP Victus 16-r0077ng
NVIDIA GeForce RTX 4070 Laptop GPU, i7-13700H, Kioxia XG8 KXG80ZNV1T02
277 Points +3%
HP Victus 16-r0077ng
NVIDIA GeForce RTX 4070 Laptop GPU, i7-13700H, Kioxia XG8 KXG80ZNV1T02
277 Points +3%
MSI Katana A15 AI B8VG
NVIDIA GeForce RTX 4070 Laptop GPU, R9 8945HS, WD PC SN560 SDDPNQE-1T00
268 Points
WebXPRT 4 / Overall
Lenovo Legion Pro 5 16ARX8
NVIDIA GeForce RTX 4070 Laptop GPU, R7 7745HX, Samsung PM9A1 MZVL21T0HCLR
283 Points +25%
Aorus 15 BSF
NVIDIA GeForce RTX 4070 Laptop GPU, i7-13700H, Gigabyte AG470S1TB-SI B10
277 Points +23%
Media della classe Gaming
  (176.4 - 328, n=149, ultimi 2 anni)
268 Points +19%
HP Omen 16-xf0376ng
NVIDIA GeForce RTX 4070 Laptop GPU, R7 7840HS, WDC PC SN810 512GB
263 Points +16%
HP Omen 16-xf0376ng
NVIDIA GeForce RTX 4070 Laptop GPU, R7 7840HS, WDC PC SN810 512GB
263 Points +16%
Media AMD Ryzen 9 8945HS, NVIDIA GeForce RTX 4070 Laptop GPU
  (226 - 269, n=3)
248 Points +10%
HP Victus 16-r0077ng
NVIDIA GeForce RTX 4070 Laptop GPU, i7-13700H, Kioxia XG8 KXG80ZNV1T02
246 Points +9%
HP Victus 16-r0077ng
NVIDIA GeForce RTX 4070 Laptop GPU, i7-13700H, Kioxia XG8 KXG80ZNV1T02
246 Points +9%
MSI Katana A15 AI B8VG
NVIDIA GeForce RTX 4070 Laptop GPU, R9 8945HS, WD PC SN560 SDDPNQE-1T00
226 Points
Mozilla Kraken 1.1 / Total
MSI Katana A15 AI B8VG
NVIDIA GeForce RTX 4070 Laptop GPU, R9 8945HS, WD PC SN560 SDDPNQE-1T00
586 ms *
MSI Katana A15 AI B8VG
NVIDIA GeForce RTX 4070 Laptop GPU, R9 8945HS, WD PC SN560 SDDPNQE-1T00
586 ms * -0%
HP Victus 16-r0077ng
NVIDIA GeForce RTX 4070 Laptop GPU, i7-13700H, Kioxia XG8 KXG80ZNV1T02
543 ms * +7%
HP Victus 16-r0077ng
NVIDIA GeForce RTX 4070 Laptop GPU, i7-13700H, Kioxia XG8 KXG80ZNV1T02
543 ms * +7%
Media AMD Ryzen 9 8945HS, NVIDIA GeForce RTX 4070 Laptop GPU
  (488 - 586, n=4)
542 ms * +8%
Media della classe Gaming
  (421 - 674, n=175, ultimi 2 anni)
502 ms * +14%
HP Omen 16-xf0376ng
NVIDIA GeForce RTX 4070 Laptop GPU, R7 7840HS, WDC PC SN810 512GB
498 ms * +15%
HP Omen 16-xf0376ng
NVIDIA GeForce RTX 4070 Laptop GPU, R7 7840HS, WDC PC SN810 512GB
498 ms * +15%
Aorus 15 BSF
NVIDIA GeForce RTX 4070 Laptop GPU, i7-13700H, Gigabyte AG470S1TB-SI B10
494 ms * +16%
Lenovo Legion Pro 5 16ARX8
NVIDIA GeForce RTX 4070 Laptop GPU, R7 7745HX, Samsung PM9A1 MZVL21T0HCLR
471 ms * +20%

* ... Meglio usare valori piccoli

PCMark 10 Score
7473 punti
Aiuto
AIDA64 / Memory Copy
Media AMD Ryzen 9 8945HS
  (62371 - 68976, n=4)
67176 MB/s +8%
Media della classe Gaming
  (21842 - 94222, n=181, ultimi 2 anni)
65865 MB/s +6%
MSI Katana A15 AI B8VG
AMD Ryzen 9 8945HS, NVIDIA GeForce RTX 4070 Laptop GPU
62371 MB/s
HP Omen 16-xf0376ng
AMD Ryzen 7 7840HS, NVIDIA GeForce RTX 4070 Laptop GPU
62231 MB/s 0%
HP Victus 16-r0077ng
Intel Core i7-13700H, NVIDIA GeForce RTX 4070 Laptop GPU
60917 MB/s -2%
Aorus 15 BSF
Intel Core i7-13700H, NVIDIA GeForce RTX 4070 Laptop GPU
59991 MB/s -4%
Lenovo Legion Pro 5 16ARX8
AMD Ryzen 7 7745HX, NVIDIA GeForce RTX 4070 Laptop GPU
50007 MB/s -20%
AIDA64 / Memory Read
HP Victus 16-r0077ng
Intel Core i7-13700H, NVIDIA GeForce RTX 4070 Laptop GPU
70121 MB/s +14%
Media della classe Gaming
  (23681 - 99713, n=181, ultimi 2 anni)
69737 MB/s +13%
Aorus 15 BSF
Intel Core i7-13700H, NVIDIA GeForce RTX 4070 Laptop GPU
67672 MB/s +10%
MSI Katana A15 AI B8VG
AMD Ryzen 9 8945HS, NVIDIA GeForce RTX 4070 Laptop GPU
61532 MB/s
HP Omen 16-xf0376ng
AMD Ryzen 7 7840HS, NVIDIA GeForce RTX 4070 Laptop GPU
61147 MB/s -1%
Media AMD Ryzen 9 8945HS
  (49966 - 61710, n=4)
58659 MB/s -5%
Lenovo Legion Pro 5 16ARX8
AMD Ryzen 7 7745HX, NVIDIA GeForce RTX 4070 Laptop GPU
50703 MB/s -18%
AIDA64 / Memory Write
Aorus 15 BSF
Intel Core i7-13700H, NVIDIA GeForce RTX 4070 Laptop GPU
99898 MB/s +28%
Media AMD Ryzen 9 8945HS
  (78351 - 93153, n=4)
86433 MB/s +10%
HP Omen 16-xf0376ng
AMD Ryzen 7 7840HS, NVIDIA GeForce RTX 4070 Laptop GPU
78406 MB/s 0%
MSI Katana A15 AI B8VG
AMD Ryzen 9 8945HS, NVIDIA GeForce RTX 4070 Laptop GPU
78351 MB/s
Media della classe Gaming
  (22986 - 108954, n=181, ultimi 2 anni)
67587 MB/s -14%
HP Victus 16-r0077ng
Intel Core i7-13700H, NVIDIA GeForce RTX 4070 Laptop GPU
61520 MB/s -21%
Lenovo Legion Pro 5 16ARX8
AMD Ryzen 7 7745HX, NVIDIA GeForce RTX 4070 Laptop GPU
54587 MB/s -30%
AIDA64 / Memory Latency
Media AMD Ryzen 9 8945HS
  (91.2 - 110.4, n=4)
97.1 ns * -6%
HP Victus 16-r0077ng
Intel Core i7-13700H, NVIDIA GeForce RTX 4070 Laptop GPU
94.1 ns * -3%
Media della classe Gaming
  (59.5 - 259, n=181, ultimi 2 anni)
94.1 ns * -3%
Aorus 15 BSF
Intel Core i7-13700H, NVIDIA GeForce RTX 4070 Laptop GPU
91.8 ns * -1%
MSI Katana A15 AI B8VG
AMD Ryzen 9 8945HS, NVIDIA GeForce RTX 4070 Laptop GPU
91.3 ns *
HP Omen 16-xf0376ng
AMD Ryzen 7 7840HS, NVIDIA GeForce RTX 4070 Laptop GPU
89.8 ns * +2%
Lenovo Legion Pro 5 16ARX8
AMD Ryzen 7 7745HX, NVIDIA GeForce RTX 4070 Laptop GPU
86.5 ns * +5%

* ... Meglio usare valori piccoli

Latenze DPC

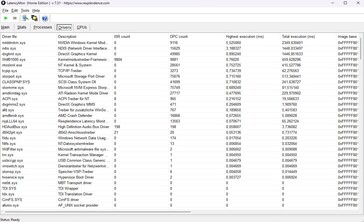
Le cose sono molto meno impressionanti in questo reparto. Secondo lo strumento LatencyMon, le latenze possono avere un picco durante alcune attività. Detto questo, tra i sistemi rivali, solo Legion Pro 5 riesce a rimanere sotto i 1000 µs.
LatenzaMon
LatenzaMon
DPC Latencies / LatencyMon - interrupt to process latency (max), Web, Youtube, Prime95
MSI Katana A15 AI B8VG
NVIDIA GeForce RTX 4070 Laptop GPU, R9 8945HS, WD PC SN560 SDDPNQE-1T00
2467.1 μs *
HP Omen 16-xf0376ng
NVIDIA GeForce RTX 4070 Laptop GPU, R7 7840HS, WDC PC SN810 512GB
2185.9 μs * +11%
HP Victus 16-r0077ng
NVIDIA GeForce RTX 4070 Laptop GPU, i7-13700H, Kioxia XG8 KXG80ZNV1T02
1697 μs * +31%
Aorus 15 BSF
NVIDIA GeForce RTX 4070 Laptop GPU, i7-13700H, Gigabyte AG470S1TB-SI B10
1664.7 μs * +33%
Lenovo Legion Pro 5 16ARX8
NVIDIA GeForce RTX 4070 Laptop GPU, R7 7745HX, Samsung PM9A1 MZVL21T0HCLR
603 μs * +76%

* ... Meglio usare valori piccoli

Dispositivi di archiviazione

L'SSD da 1 TB di WDC (modello PC SN560) potrebbe non essere tra i più veloci della sua categoria, ma le sue prestazioni sono tutt'altro che deludenti. Anche se il nostro loop test ha rivelato alcune fluttuazioni delle prestazioni nel corso del tempo, queste sono rimaste entro limiti accettabili, cosa che non possiamo dire per il Legion Pro 5.

WD PC SN560 SDDPNQE-1T00
CDM 5/6 Read Seq Q32T1: 4931 MB/s
CDM 5/6 Write Seq Q32T1: 3255 MB/s
CDM 5/6 Read 4K Q32T1: 831.3 MB/s
CDM 5/6 Write 4K Q32T1: 682.1 MB/s
CDM 5 Read Seq: 3569 MB/s
CDM 5 Write Seq: 3249 MB/s
CDM 5/6 Read 4K: 72.18 MB/s
CDM 5/6 Write 4K: 245.4 MB/s
Drive Performance Rating - Percent
Aorus 15 BSF
Gigabyte AG470S1TB-SI B10
90.5 pt
Lenovo Legion Pro 5 16ARX8
Samsung PM9A1 MZVL21T0HCLR
81 pt
Media della classe Gaming
 
66.3 pt
HP Omen 16-xf0376ng
WDC PC SN810 512GB
58.9 pt
HP Victus 16-r0077ng
Kioxia XG8 KXG80ZNV1T02
56.5 pt
MSI Katana A15 AI B8VG
WD PC SN560 SDDPNQE-1T00
56.3 pt
Media WD PC SN560 SDDPNQE-1T00
 
47.7 pt
DiskSpd
seq read
Lenovo Legion Pro 5 16ARX8
Samsung PM9A1 MZVL21T0HCLR
4677 (4664.17min - 4676.56max) MB/s +53%
Aorus 15 BSF
Gigabyte AG470S1TB-SI B10
4224 (3897.73min - 4223.61max) MB/s +38%
HP Omen 16-xf0376ng
WDC PC SN810 512GB
3550 (3505.51min - 3549.67max) MB/s +16%
Media della classe Gaming
  (1319 - 7045, n=163, ultimi 2 anni)
3475 MB/s +14%
Media WD PC SN560 SDDPNQE-1T00
  (2406 - 4128, n=20)
3165 MB/s +4%
MSI Katana A15 AI B8VG
WD PC SN560 SDDPNQE-1T00
3057 (3033.1min - 3057.23max) MB/s
HP Victus 16-r0077ng
Kioxia XG8 KXG80ZNV1T02
2735 (2694.63min - 2735.3max) MB/s -11%
seq write
Lenovo Legion Pro 5 16ARX8
Samsung PM9A1 MZVL21T0HCLR
4326 (4313.21min - 4326.48max) MB/s +42%
Media della classe Gaming
  (535 - 9307, n=163, ultimi 2 anni)
3827 MB/s +26%
HP Omen 16-xf0376ng
WDC PC SN810 512GB
3783 (3552.81min - 3782.83max) MB/s +24%
HP Victus 16-r0077ng
Kioxia XG8 KXG80ZNV1T02
3641 (3537min - 3640.66max) MB/s +19%
Aorus 15 BSF
Gigabyte AG470S1TB-SI B10
3300 (3281.98min - 3300.19max) MB/s +8%
MSI Katana A15 AI B8VG
WD PC SN560 SDDPNQE-1T00
3047 (3017.8min - 3046.74max) MB/s
Media WD PC SN560 SDDPNQE-1T00
  (2235 - 3416, n=20)
2924 MB/s -4%
seq q8 t1 read
HP Omen 16-xf0376ng
WDC PC SN810 512GB
6889 (5972.9min - 6888.72max) MB/s +39%
Aorus 15 BSF
Gigabyte AG470S1TB-SI B10
6864 (6443.08min - 6863.98max) MB/s +38%
Lenovo Legion Pro 5 16ARX8
Samsung PM9A1 MZVL21T0HCLR
6660 (6017.57min - 6659.93max) MB/s +34%
Media della classe Gaming
  (2594 - 16089, n=163, ultimi 2 anni)
6317 MB/s +27%
HP Victus 16-r0077ng
Kioxia XG8 KXG80ZNV1T02
6169 (5196.32min - 6168.56max) MB/s +24%
MSI Katana A15 AI B8VG
WD PC SN560 SDDPNQE-1T00
4964 (4657.56min - 4964.38max) MB/s
Media WD PC SN560 SDDPNQE-1T00
  (3728 - 5023, n=20)
4908 MB/s -1%
seq q8 t1 write
HP Victus 16-r0077ng
Kioxia XG8 KXG80ZNV1T02
5355 (5315.44min - 5354.87max) MB/s +71%
Lenovo Legion Pro 5 16ARX8
Samsung PM9A1 MZVL21T0HCLR
4943 (4926min - 4942.6max) MB/s +58%
Media della classe Gaming
  (539 - 14571, n=163, ultimi 2 anni)
4866 MB/s +55%
HP Omen 16-xf0376ng
WDC PC SN810 512GB
4459 (4352.43min - 4459.27max) MB/s +42%
Aorus 15 BSF
Gigabyte AG470S1TB-SI B10
3683 MB/s +18%
Media WD PC SN560 SDDPNQE-1T00
  (2957 - 3464, n=20)
3226 MB/s +3%
MSI Katana A15 AI B8VG
WD PC SN560 SDDPNQE-1T00
3133 (3095.61min - 3133.38max) MB/s
4k q1 t1 read
Aorus 15 BSF
Gigabyte AG470S1TB-SI B10
91 (90.05min - 91max) MB/s +36%
Lenovo Legion Pro 5 16ARX8
Samsung PM9A1 MZVL21T0HCLR
80.1 (78.57min - 80.12max) MB/s +20%
MSI Katana A15 AI B8VG
WD PC SN560 SDDPNQE-1T00
67 (65.53min - 66.98max) MB/s
HP Omen 16-xf0376ng
WDC PC SN810 512GB
66.1 (65.3min - 66.08max) MB/s -1%
Media della classe Gaming
  (30.6 - 95.9, n=163, ultimi 2 anni)
65.9 MB/s -2%
Media WD PC SN560 SDDPNQE-1T00
  (41.9 - 73.3, n=20)
57 MB/s -15%
HP Victus 16-r0077ng
Kioxia XG8 KXG80ZNV1T02
56.6 (54min - 56.56max) MB/s -16%
4k q1 t1 write
Aorus 15 BSF
Gigabyte AG470S1TB-SI B10
341 (323.98min - 341.02max) MB/s +45%
Lenovo Legion Pro 5 16ARX8
Samsung PM9A1 MZVL21T0HCLR
244 (243min - 243.65max) MB/s +4%
MSI Katana A15 AI B8VG
WD PC SN560 SDDPNQE-1T00
235 (232.56min - 235.28max) MB/s
Media della classe Gaming
  (78 - 397, n=163, ultimi 2 anni)
223 MB/s -5%
Media WD PC SN560 SDDPNQE-1T00
  (78 - 318, n=20)
177.4 MB/s -25%
HP Omen 16-xf0376ng
WDC PC SN810 512GB
155.1 (147.48min - 155.14max) MB/s -34%
HP Victus 16-r0077ng
Kioxia XG8 KXG80ZNV1T02
142.3 (140.08min - 142.3max) MB/s -39%
4k q32 t16 read
Lenovo Legion Pro 5 16ARX8
Samsung PM9A1 MZVL21T0HCLR
4173 (4166.98min - 4173.4max) MB/s +172%
Aorus 15 BSF
Gigabyte AG470S1TB-SI B10
3429 (3303.46min - 3428.75max) MB/s +123%
Media della classe Gaming
  (417 - 6172, n=163, ultimi 2 anni)
2587 MB/s +69%
MSI Katana A15 AI B8VG
WD PC SN560 SDDPNQE-1T00
1535 (1532.27min - 1535.13max) MB/s
HP Omen 16-xf0376ng
WDC PC SN810 512GB
1217 (1195.73min - 1216.61max) MB/s -21%
Media WD PC SN560 SDDPNQE-1T00
  (592 - 1544, n=20)
1085 MB/s -29%
HP Victus 16-r0077ng
Kioxia XG8 KXG80ZNV1T02
1004 (933.19min - 1004.48max) MB/s -35%
4k q32 t16 write
Aorus 15 BSF
Gigabyte AG470S1TB-SI B10
3667 (3605.94min - 3667.28max) MB/s +55%
Lenovo Legion Pro 5 16ARX8
Samsung PM9A1 MZVL21T0HCLR
3552 (3546.24min - 3551.63max) MB/s +51%
MSI Katana A15 AI B8VG
WD PC SN560 SDDPNQE-1T00
2359 (2065.68min - 2358.59max) MB/s
Media della classe Gaming
  (162.3 - 4869, n=163, ultimi 2 anni)
2141 MB/s -9%
Media WD PC SN560 SDDPNQE-1T00
  (227 - 2783, n=20)
1079 MB/s -54%
HP Victus 16-r0077ng
Kioxia XG8 KXG80ZNV1T02
488 (476.91min - 488.32max) MB/s -79%
HP Omen 16-xf0376ng
WDC PC SN810 512GB
486 (470.43min - 486.44max) MB/s -79%
AS SSD
Score Total
Aorus 15 BSF
Gigabyte AG470S1TB-SI B10
10783 Points +104%
Lenovo Legion Pro 5 16ARX8
Samsung PM9A1 MZVL21T0HCLR
8963 Points +70%
Media della classe Gaming
  (2271 - 13854, n=155, ultimi 2 anni)
6753 Points +28%
MSI Katana A15 AI B8VG
WD PC SN560 SDDPNQE-1T00
5282 Points
HP Omen 16-xf0376ng
WDC PC SN810 512GB
5262 Points 0%
HP Victus 16-r0077ng
Kioxia XG8 KXG80ZNV1T02
4988 Points -6%
Media WD PC SN560 SDDPNQE-1T00
  (2750 - 5610, n=18)
4125 Points -22%
Score Read
Aorus 15 BSF
Gigabyte AG470S1TB-SI B10
3628 Points +107%
Lenovo Legion Pro 5 16ARX8
Samsung PM9A1 MZVL21T0HCLR
3449 Points +97%
Media della classe Gaming
  (776 - 4721, n=155, ultimi 2 anni)
2448 Points +40%
MSI Katana A15 AI B8VG
WD PC SN560 SDDPNQE-1T00
1752 Points
HP Omen 16-xf0376ng
WDC PC SN810 512GB
1638 Points -7%
HP Victus 16-r0077ng
Kioxia XG8 KXG80ZNV1T02
1480 Points -16%
Media WD PC SN560 SDDPNQE-1T00
  (872 - 1761, n=18)
1349 Points -23%
Score Write
Aorus 15 BSF
Gigabyte AG470S1TB-SI B10
5339 Points +99%
Lenovo Legion Pro 5 16ARX8
Samsung PM9A1 MZVL21T0HCLR
3832 Points +43%
Media della classe Gaming
  (515 - 7208, n=155, ultimi 2 anni)
3116 Points +16%
HP Omen 16-xf0376ng
WDC PC SN810 512GB
2885 Points +8%
HP Victus 16-r0077ng
Kioxia XG8 KXG80ZNV1T02
2858 Points +7%
MSI Katana A15 AI B8VG
WD PC SN560 SDDPNQE-1T00
2682 Points
Media WD PC SN560 SDDPNQE-1T00
  (651 - 3010, n=18)
2156 Points -20%
Seq Read
Lenovo Legion Pro 5 16ARX8
Samsung PM9A1 MZVL21T0HCLR
5621.18 MB/s +33%
Aorus 15 BSF
Gigabyte AG470S1TB-SI B10
5549.04 MB/s +31%
HP Victus 16-r0077ng
Kioxia XG8 KXG80ZNV1T02
5265.97 MB/s +24%
HP Omen 16-xf0376ng
WDC PC SN810 512GB
5080.22 MB/s +20%
Media della classe Gaming
  (2260 - 12763, n=155, ultimi 2 anni)
4953 MB/s +17%
MSI Katana A15 AI B8VG
WD PC SN560 SDDPNQE-1T00
4237.61 MB/s
Media WD PC SN560 SDDPNQE-1T00
  (3074 - 4328, n=18)
3885 MB/s -8%
Seq Write
Aorus 15 BSF
Gigabyte AG470S1TB-SI B10
4476.18 MB/s +45%
Lenovo Legion Pro 5 16ARX8
Samsung PM9A1 MZVL21T0HCLR
4010.3 MB/s +30%
Media della classe Gaming
  (495 - 11316, n=155, ultimi 2 anni)
3775 MB/s +23%
MSI Katana A15 AI B8VG
WD PC SN560 SDDPNQE-1T00
3080.08 MB/s
HP Victus 16-r0077ng
Kioxia XG8 KXG80ZNV1T02
2831.66 MB/s -8%
HP Omen 16-xf0376ng
WDC PC SN810 512GB
2824.64 MB/s -8%
Media WD PC SN560 SDDPNQE-1T00
  (1536 - 3101, n=18)
2315 MB/s -25%
4K Read
Aorus 15 BSF
Gigabyte AG470S1TB-SI B10
112.08 MB/s +90%
Lenovo Legion Pro 5 16ARX8
Samsung PM9A1 MZVL21T0HCLR
73.46 MB/s +25%
HP Omen 16-xf0376ng
WDC PC SN810 512GB
65.35 MB/s +11%
Media della classe Gaming
  (27.8 - 112.1, n=155, ultimi 2 anni)
64.9 MB/s +10%
HP Victus 16-r0077ng
Kioxia XG8 KXG80ZNV1T02
61.43 MB/s +4%
MSI Katana A15 AI B8VG
WD PC SN560 SDDPNQE-1T00
58.84 MB/s
Media WD PC SN560 SDDPNQE-1T00
  (36.6 - 61.3, n=18)
50.1 MB/s -15%
4K Write
Aorus 15 BSF
Gigabyte AG470S1TB-SI B10
358.18 MB/s +87%
Lenovo Legion Pro 5 16ARX8
Samsung PM9A1 MZVL21T0HCLR
211.54 MB/s +10%
Media della classe Gaming
  (79.4 - 512, n=155, ultimi 2 anni)
211 MB/s +10%
HP Victus 16-r0077ng
Kioxia XG8 KXG80ZNV1T02
209.28 MB/s +9%
Media WD PC SN560 SDDPNQE-1T00
  (117 - 512, n=18)
204 MB/s +6%
HP Omen 16-xf0376ng
WDC PC SN810 512GB
194.78 MB/s +2%
MSI Katana A15 AI B8VG
WD PC SN560 SDDPNQE-1T00
191.64 MB/s
4K-64 Read
Aorus 15 BSF
Gigabyte AG470S1TB-SI B10
2960.59 MB/s +133%
Lenovo Legion Pro 5 16ARX8
Samsung PM9A1 MZVL21T0HCLR
2813.87 MB/s +122%
Media della classe Gaming
  (451 - 3475, n=155, ultimi 2 anni)
1882 MB/s +48%
MSI Katana A15 AI B8VG
WD PC SN560 SDDPNQE-1T00
1269.87 MB/s
HP Omen 16-xf0376ng
WDC PC SN810 512GB
1064.22 MB/s -16%
Media WD PC SN560 SDDPNQE-1T00
  (457 - 1272, n=18)
910 MB/s -28%
HP Victus 16-r0077ng
Kioxia XG8 KXG80ZNV1T02
892.37 MB/s -30%
4K-64 Write
Aorus 15 BSF
Gigabyte AG470S1TB-SI B10
4533.18 MB/s +108%
Lenovo Legion Pro 5 16ARX8
Samsung PM9A1 MZVL21T0HCLR
3219.74 MB/s +48%
Media della classe Gaming
  (277 - 5909, n=155, ultimi 2 anni)
2530 MB/s +16%
HP Omen 16-xf0376ng
WDC PC SN810 512GB
2408.24 MB/s +10%
HP Victus 16-r0077ng
Kioxia XG8 KXG80ZNV1T02
2365.53 MB/s +8%
MSI Katana A15 AI B8VG
WD PC SN560 SDDPNQE-1T00
2181.93 MB/s
Media WD PC SN560 SDDPNQE-1T00
  (172.9 - 2500, n=18)
1736 MB/s -20%
Access Time Read
MSI Katana A15 AI B8VG
WD PC SN560 SDDPNQE-1T00
0.083 ms *
Media WD PC SN560 SDDPNQE-1T00
  (0.026 - 0.17, n=18)
0.07078 ms * +15%
Aorus 15 BSF
Gigabyte AG470S1TB-SI B10
0.065 ms * +22%
Media della classe Gaming
  (0.016 - 0.379, n=154, ultimi 2 anni)
0.05554 ms * +33%
HP Victus 16-r0077ng
Kioxia XG8 KXG80ZNV1T02
0.052 ms * +37%
HP Omen 16-xf0376ng
WDC PC SN810 512GB
0.051 ms * +39%
Lenovo Legion Pro 5 16ARX8
Samsung PM9A1 MZVL21T0HCLR
0.031 ms * +63%
Access Time Write
Lenovo Legion Pro 5 16ARX8
Samsung PM9A1 MZVL21T0HCLR
0.064 ms * -237%
Media della classe Gaming
  (0.011 - 1.028, n=155, ultimi 2 anni)
0.04707 ms * -148%
Media WD PC SN560 SDDPNQE-1T00
  (0.016 - 0.088, n=18)
0.03311 ms * -74%
HP Victus 16-r0077ng
Kioxia XG8 KXG80ZNV1T02
0.02 ms * -5%
HP Omen 16-xf0376ng
WDC PC SN810 512GB
0.019 ms * -0%
MSI Katana A15 AI B8VG
WD PC SN560 SDDPNQE-1T00
0.019 ms *
Aorus 15 BSF
Gigabyte AG470S1TB-SI B10
0.011 ms * +42%

* ... Meglio usare valori piccoli

Reading continuous performance: DiskSpd Read Loop, Queue Depth 8

035070010501400175021002450280031503500385042004550490052505600595063006650Tooltip
MSI Katana A15 AI B8VG WD PC SN560 SDDPNQE-1T00; diskspd 2.0.17 f: Ø4772 (4090.08-4974.23)
HP Omen 16-xf0376ng WDC PC SN810 512GB: Ø6732 (5625.82-6897.16)
HP Victus 16-r0077ng Kioxia XG8 KXG80ZNV1T02: Ø5244 (4542.22-6091.41)
Aorus 15 BSF Gigabyte AG470S1TB-SI B10: Ø6908 (6337.08-6965.69)
Lenovo Legion Pro 5 16ARX8 Samsung PM9A1 MZVL21T0HCLR: Ø6087 (3287.84-6658.98)

Prestazioni della GPU

La RTX 4070 di GeForce dovrebbe essere sostituita da un nuovo modello nelle prossime settimane o mesi. Sebbene rimanga una GPU di gioco molto veloce nel settore dei notebook a partire dal 2024, i suoi limitati 8 GB di VRAM si rivelano sempre più spesso un collo di bottiglia, a volte anche in Full HD. I titoli rilasciati di recente, come Indiana Jonesevidenziano che chi vuole giocare seriamente sarebbe meglio servito da una scheda grafica con almeno 12 GB di VRAM. In altre parole, la RTX 4070 potrebbe non essere un buon investimento a lungo termine.

L'altra cosa da considerare è che MSI ha optato per un TGP relativamente basso di 105 watt per la RTX 4070, anche se la GPU supporta fino a 140 watt. Questa decisione si riflette nei risultati dei benchmark, che vedono la Katana in ritardo rispetto alla concorrenza. In media, i suoi rivali dotati di RTX 4070 la superano dal 9 al 16% nei test grafici sintetici.

3DMark Performance Rating - Percent
HP Omen 16-xf0376ng
NVIDIA GeForce RTX 4070 Laptop GPU, AMD Ryzen 7 7840HS
96.5 pt
Lenovo Legion Pro 5 16ARX8 -1!
NVIDIA GeForce RTX 4070 Laptop GPU, AMD Ryzen 7 7745HX
95.5 pt
Media della classe Gaming
 
93.6 pt
Aorus 15 BSF
NVIDIA GeForce RTX 4070 Laptop GPU, Intel Core i7-13700H
91.5 pt
HP Victus 16-r0077ng
NVIDIA GeForce RTX 4070 Laptop GPU, Intel Core i7-13700H
90.3 pt
Media NVIDIA GeForce RTX 4070 Laptop GPU
 
86.6 pt
MSI Katana A15 AI B8VG
NVIDIA GeForce RTX 4070 Laptop GPU, AMD Ryzen 9 8945HS
83 pt
3DMark 11 - 1280x720 Performance GPU
Media della classe Gaming
  (1029 - 72178, n=181, ultimi 2 anni)
44043 Points +25%
HP Omen 16-xf0376ng
NVIDIA GeForce RTX 4070 Laptop GPU, AMD Ryzen 7 7840HS
42142 Points +20%
Aorus 15 BSF
NVIDIA GeForce RTX 4070 Laptop GPU, Intel Core i7-13700H
41438 Points +18%
Lenovo Legion Pro 5 16ARX8
NVIDIA GeForce RTX 4070 Laptop GPU, AMD Ryzen 7 7745HX
41090 Points +17%
Media NVIDIA GeForce RTX 4070 Laptop GPU
  (24229 - 46434, n=65)
40385 Points +15%
HP Victus 16-r0077ng
NVIDIA GeForce RTX 4070 Laptop GPU, Intel Core i7-13700H
39951 Points +13%
MSI Katana A15 AI B8VG
NVIDIA GeForce RTX 4070 Laptop GPU, AMD Ryzen 9 8945HS
35251 Points
3DMark
1280x720 Cloud Gate Standard Graphics
HP Omen 16-xf0376ng
NVIDIA GeForce RTX 4070 Laptop GPU, AMD Ryzen 7 7840HS
193851 Points +9%
MSI Katana A15 AI B8VG
NVIDIA GeForce RTX 4070 Laptop GPU, AMD Ryzen 9 8945HS
177332 Points
HP Victus 16-r0077ng
NVIDIA GeForce RTX 4070 Laptop GPU, Intel Core i7-13700H
175566 Points -1%
Aorus 15 BSF
NVIDIA GeForce RTX 4070 Laptop GPU, Intel Core i7-13700H
165849 Points -6%
Media NVIDIA GeForce RTX 4070 Laptop GPU
  (54238 - 193851, n=28)
145941 Points -18%
Media della classe Gaming
  (15902 - 193851, n=101, ultimi 2 anni)
144496 Points -19%
1920x1080 Fire Strike Graphics
HP Omen 16-xf0376ng
NVIDIA GeForce RTX 4070 Laptop GPU, AMD Ryzen 7 7840HS
31698 Points +17%
Media della classe Gaming
  (781 - 53059, n=193, ultimi 2 anni)
31600 Points +17%
Lenovo Legion Pro 5 16ARX8
NVIDIA GeForce RTX 4070 Laptop GPU, AMD Ryzen 7 7745HX
30936 Points +14%
HP Victus 16-r0077ng
NVIDIA GeForce RTX 4070 Laptop GPU, Intel Core i7-13700H
30239 Points +12%
Aorus 15 BSF
NVIDIA GeForce RTX 4070 Laptop GPU, Intel Core i7-13700H
30081 Points +11%
Media NVIDIA GeForce RTX 4070 Laptop GPU
  (12242 - 33451, n=69)
29068 Points +7%
MSI Katana A15 AI B8VG
NVIDIA GeForce RTX 4070 Laptop GPU, AMD Ryzen 9 8945HS
27080 Points
2560x1440 Time Spy Graphics
Media della classe Gaming
  (224 - 22717, n=188, ultimi 2 anni)
13211 Points +33%
Lenovo Legion Pro 5 16ARX8
NVIDIA GeForce RTX 4070 Laptop GPU, AMD Ryzen 7 7745HX
12617 Points +27%
Aorus 15 BSF
NVIDIA GeForce RTX 4070 Laptop GPU, Intel Core i7-13700H
12079 Points +22%
HP Omen 16-xf0376ng
NVIDIA GeForce RTX 4070 Laptop GPU, AMD Ryzen 7 7840HS
11907 Points +20%
Media NVIDIA GeForce RTX 4070 Laptop GPU
  (5012 - 13391, n=67)
11602 Points +17%
HP Victus 16-r0077ng
NVIDIA GeForce RTX 4070 Laptop GPU, Intel Core i7-13700H
11168 Points +12%
MSI Katana A15 AI B8VG
NVIDIA GeForce RTX 4070 Laptop GPU, AMD Ryzen 9 8945HS
9933 Points
3DMark 11 Performance
28162 punti
3DMark Ice Storm Standard Score
147014 punti
3DMark Cloud Gate Standard Score
61833 punti
3DMark Fire Strike Score
23834 punti
3DMark Time Spy Score
9759 punti
Aiuto
Blender
v3.3 Classroom OPTIX/RTX
Aorus 15 BSF
NVIDIA GeForce RTX 4070 Laptop GPU, Intel Core i7-13700H
23 Seconds * -0%
HP Victus 16-r0077ng
NVIDIA GeForce RTX 4070 Laptop GPU, Intel Core i7-13700H
23 Seconds * -0%
MSI Katana A15 AI B8VG
NVIDIA GeForce RTX 4070 Laptop GPU, AMD Ryzen 9 8945HS
23 Seconds *
Media NVIDIA GeForce RTX 4070 Laptop GPU
  (18 - 30, n=66)
21.5 Seconds * +7%
HP Omen 16-xf0376ng
NVIDIA GeForce RTX 4070 Laptop GPU, AMD Ryzen 7 7840HS
21 Seconds * +9%
Media della classe Gaming
  (9 - 95, n=177, ultimi 2 anni)
20.7 Seconds * +10%
Lenovo Legion Pro 5 16ARX8
NVIDIA GeForce RTX 4070 Laptop GPU, AMD Ryzen 7 7745HX
19 Seconds * +17%
v3.3 Classroom CUDA
Media NVIDIA GeForce RTX 4070 Laptop GPU
  (32 - 181, n=68)
40.1 Seconds * -11%
Media della classe Gaming
  (16 - 175, n=182, ultimi 2 anni)
36.1 Seconds * -0%
Aorus 15 BSF
NVIDIA GeForce RTX 4070 Laptop GPU, Intel Core i7-13700H
36 Seconds * -0%
HP Victus 16-r0077ng
NVIDIA GeForce RTX 4070 Laptop GPU, Intel Core i7-13700H
36 Seconds * -0%
MSI Katana A15 AI B8VG
NVIDIA GeForce RTX 4070 Laptop GPU, AMD Ryzen 9 8945HS
36 Seconds *
HP Omen 16-xf0376ng
NVIDIA GeForce RTX 4070 Laptop GPU, AMD Ryzen 7 7840HS
35 Seconds * +3%
Lenovo Legion Pro 5 16ARX8
NVIDIA GeForce RTX 4070 Laptop GPU, AMD Ryzen 7 7745HX
33 Seconds * +8%
v3.3 Classroom CPU
Aorus 15 BSF
NVIDIA GeForce RTX 4070 Laptop GPU, Intel Core i7-13700H
390 Seconds * -22%
HP Victus 16-r0077ng
NVIDIA GeForce RTX 4070 Laptop GPU, Intel Core i7-13700H
379 Seconds * -18%
HP Omen 16-xf0376ng
NVIDIA GeForce RTX 4070 Laptop GPU, AMD Ryzen 7 7840HS
320 Seconds * -0%
MSI Katana A15 AI B8VG
NVIDIA GeForce RTX 4070 Laptop GPU, AMD Ryzen 9 8945HS
320 Seconds *
Media della classe Gaming
  (138 - 962, n=186, ultimi 2 anni)
293 Seconds * +8%
Media NVIDIA GeForce RTX 4070 Laptop GPU
  (158 - 440, n=65)
289 Seconds * +10%
Lenovo Legion Pro 5 16ARX8
NVIDIA GeForce RTX 4070 Laptop GPU, AMD Ryzen 7 7745HX
277 Seconds * +13%

* ... Meglio usare valori piccoli

Prestazioni di gioco

Fortunatamente, il 15 pollici se la cava leggermente meglio nei giochi che nei benchmark, con risultati che lo mettono sullo stesso piano del laptop medio con RTX 4070 nel nostro database. In generale, la scheda grafica è in grado di gestire senza problemi quasi tutti i titoli moderni con le impostazioni massime alla risoluzione nativa di 1.920 x 1.080. Tuttavia, nei giochi estremamente intensivi dal punto di vista della CPU o scarsamente ottimizzati, come ad esempio Star Wars Outlawspotrebbe faticare a garantire un tasso di fps sufficientemente elevato. In questi casi, la tecnologia di upscaling DLSS si rivela utile.

Performance Rating - Percent
Lenovo Legion Pro 5 16ARX8 -2!
AMD Ryzen 7 7745HX, NVIDIA GeForce RTX 4070 Laptop GPU
99.1 pt
Media della classe Gaming
 
96.2 pt
Media NVIDIA GeForce RTX 4070 Laptop GPU
 
89.8 pt
MSI Katana A15 AI B8VG -1!
AMD Ryzen 9 8945HS, NVIDIA GeForce RTX 4070 Laptop GPU
88.6 pt
Aorus 15 BSF -2!
Intel Core i7-13700H, NVIDIA GeForce RTX 4070 Laptop GPU
87.6 pt
HP Victus 16-r0077ng -1!
Intel Core i7-13700H, NVIDIA GeForce RTX 4070 Laptop GPU
86.3 pt
HP Omen 16-xf0376ng -2!
AMD Ryzen 7 7840HS, NVIDIA GeForce RTX 4070 Laptop GPU
84.2 pt
Cyberpunk 2077 2.1 Phantom Liberty - 1920x1080 Ultra Preset (FSR off)
Media della classe Gaming
  (6.76 - 144.7, n=82, ultimi 2 anni)
86.5 fps +3%
MSI Katana A15 AI B8VG
AMD Ryzen 9 8945HS, NVIDIA GeForce RTX 4070 Laptop GPU
84 (69min) fps
Media NVIDIA GeForce RTX 4070 Laptop GPU
  (30.7 - 90.7, n=36)
79.1 fps -6%
Baldur's Gate 3 - 1920x1080 Ultra Preset
MSI Katana A15 AI B8VG
AMD Ryzen 9 8945HS, NVIDIA GeForce RTX 4070 Laptop GPU
104.9 (21.8min, 32.8P0.1, 61.8P1) fps
Media della classe Gaming
  (34.5 - 208, n=47, ultimi 2 anni)
104 fps -1%
Media NVIDIA GeForce RTX 4070 Laptop GPU
  (66.7 - 128.5, n=26)
101 fps -4%
HP Victus 16-r0077ng
Intel Core i7-13700H, NVIDIA GeForce RTX 4070 Laptop GPU
95.4 (26.9min, 35P0.1, 50.4P1) fps -9%
Aorus 15 BSF
Intel Core i7-13700H, NVIDIA GeForce RTX 4070 Laptop GPU
88.5 (29.4min, 33.7P0.1, 62.1P1) fps -16%
GTA V - 1920x1080 Highest Settings possible AA:4xMSAA + FX AF:16x
Lenovo Legion Pro 5 16ARX8
AMD Ryzen 7 7745HX, NVIDIA GeForce RTX 4070 Laptop GPU
119.9 (3.81min, 76.9P1) fps +10%
Media della classe Gaming
  (12.1 - 167.7, n=168, ultimi 2 anni)
114 fps +5%
HP Victus 16-r0077ng
Intel Core i7-13700H, NVIDIA GeForce RTX 4070 Laptop GPU
112.8 (4.13min, 66.7P1) fps +4%
Media NVIDIA GeForce RTX 4070 Laptop GPU
  (48.3 - 141.6, n=61)
111.1 fps +2%
MSI Katana A15 AI B8VG
AMD Ryzen 9 8945HS, NVIDIA GeForce RTX 4070 Laptop GPU
108.7 (19.6min, 76.9P1) fps
HP Omen 16-xf0376ng
AMD Ryzen 7 7840HS, NVIDIA GeForce RTX 4070 Laptop GPU
105.9 (19.5min, 76.9P1) fps -3%
Final Fantasy XV Benchmark - 1920x1080 High Quality
Media della classe Gaming
  (19.2 - 201, n=180, ultimi 2 anni)
120.5 fps +19%
Lenovo Legion Pro 5 16ARX8
AMD Ryzen 7 7745HX, NVIDIA GeForce RTX 4070 Laptop GPU
119.9 fps +19%
Aorus 15 BSF
Intel Core i7-13700H, NVIDIA GeForce RTX 4070 Laptop GPU
115.4 fps +14%
Media NVIDIA GeForce RTX 4070 Laptop GPU
  (41 - 131.9, n=63)
110.9 fps +10%
HP Victus 16-r0077ng
Intel Core i7-13700H, NVIDIA GeForce RTX 4070 Laptop GPU
109.3 fps +8%
HP Omen 16-xf0376ng
AMD Ryzen 7 7840HS, NVIDIA GeForce RTX 4070 Laptop GPU
108.7 fps +8%
MSI Katana A15 AI B8VG
AMD Ryzen 9 8945HS, NVIDIA GeForce RTX 4070 Laptop GPU
101.1 fps
Strange Brigade - 1920x1080 ultra AA:ultra AF:16
Media della classe Gaming
  (38.9 - 421, n=176, ultimi 2 anni)
230 fps
Lenovo Legion Pro 5 16ARX8
AMD Ryzen 7 7745HX, NVIDIA GeForce RTX 4070 Laptop GPU
223 (89min, 167.8P1) fps
Aorus 15 BSF
Intel Core i7-13700H, NVIDIA GeForce RTX 4070 Laptop GPU
202 (30.6min, 150.9P1) fps
Media NVIDIA GeForce RTX 4070 Laptop GPU
  (76.3 - 234, n=62)
196.3 fps
HP Victus 16-r0077ng
Intel Core i7-13700H, NVIDIA GeForce RTX 4070 Laptop GPU
192 (24.8min, 138.8P1) fps
HP Omen 16-xf0376ng
AMD Ryzen 7 7840HS, NVIDIA GeForce RTX 4070 Laptop GPU
190.3 (22.4min, 141.8P1) fps
Dota 2 Reborn - 1920x1080 ultra (3/3) best looking
Lenovo Legion Pro 5 16ARX8
AMD Ryzen 7 7745HX, NVIDIA GeForce RTX 4070 Laptop GPU
182 (152.8min) fps +40%
Media della classe Gaming
  (65.1 - 220, n=185, ultimi 2 anni)
151.4 fps +17%
Aorus 15 BSF
Intel Core i7-13700H, NVIDIA GeForce RTX 4070 Laptop GPU
149.9 (129.9min) fps +15%
Media NVIDIA GeForce RTX 4070 Laptop GPU
  (89.7 - 191.2, n=65)
147.9 fps +14%
HP Omen 16-xf0376ng
AMD Ryzen 7 7840HS, NVIDIA GeForce RTX 4070 Laptop GPU
137.8 (120.3min) fps +6%
HP Victus 16-r0077ng
Intel Core i7-13700H, NVIDIA GeForce RTX 4070 Laptop GPU
131.6 (112.7min) fps +1%
MSI Katana A15 AI B8VG
AMD Ryzen 9 8945HS, NVIDIA GeForce RTX 4070 Laptop GPU
129.9 (111.1min) fps
bassomedioaltoultra
GTA V (2015) 174.9 164.8 108.7
Dota 2 Reborn (2015) 158.8 136.1 138.6 129.9
Final Fantasy XV Benchmark (2018) 135.6 101.1
X-Plane 11.11 (2018) 80.6 74.7 52.1
Baldur's Gate 3 (2023) 130.5 108.2 104.9
Cyberpunk 2077 2.1 Phantom Liberty (2023) 113.8 96.2 84
Prince of Persia The Lost Crown (2024) 323 322 321
Star Wars Outlaws (2024) 45.9 39.6 31.9
Space Marine 2 (2024) 75.2 74.2 73.1
Final Fantasy XVI (2024) 68.1 59 50.6
God of War Ragnarök (2024) 111.7 97.9 90.5
Until Dawn (2024) 88.2 62.7 46.9
Call of Duty Black Ops 6 (2024) 121 87 81
Stalker 2 (2024) 54.5 49.9 43.5
Cyberpunk 2077 2.1 Phantom Liberty
1920x1080 High Preset (FSR off)
MSI Katana A15 AI B8VG
AMD Ryzen 9 8945HS, NVIDIA GeForce RTX 4070 Laptop GPU
96.2 (81min) fps
Media NVIDIA GeForce RTX 4070 Laptop GPU
  (74.7 - 103.6, n=29)
92.1 fps -4%
Media della classe Gaming
  (7.4 - 164.5, n=61, ultimi 2 anni)
92.1 fps -4%
1920x1080 Ultra Preset (FSR off)
Media della classe Gaming
  (6.76 - 144.7, n=82, ultimi 2 anni)
86.5 fps +3%
MSI Katana A15 AI B8VG
AMD Ryzen 9 8945HS, NVIDIA GeForce RTX 4070 Laptop GPU
84 (69min) fps
Media NVIDIA GeForce RTX 4070 Laptop GPU
  (30.7 - 90.7, n=36)
79.1 fps -6%

Abbiamo verificato le prestazioni 3D sostenute del sistema eseguendo Cyberpunk 2077 per circa 30 minuti. Il risultato: Katana A15 ha fornito una frequenza di fotogrammi stabile, senza cali di fps inaspettati.

Cyberpunk 2077 Ultra fps chart

051015202530354045505560657075Tooltip
MSI Katana A15 AI B8VG R9 8945HS, NVIDIA GeForce RTX 4070 Laptop GPU: Ø79.1 (71.6-79.7)

Emissioni

Emissioni di rumore

La modalità AI mantiene i livelli di rumore moderati quando il sistema è al minimo, a parte gli occasionali scoppi di attività della ventola, ma genera molto rumore quando il sistema è stressato. Durante l'esecuzione di Cyberpunk 2077, il sistema raggiungeva un volume di 52 dB(A), che molti utenti probabilmente troveranno sgradevole, soprattutto se non si utilizzano le cuffie.

Rumorosità

Idle
25 / 26 / 27 dB(A)
Sotto carico
40 / 50 dB(A)
  red to green bar
 
 
30 dB
silenzioso
40 dB(A)
udibile
50 dB(A)
rumoroso
 
min: dark, med: mid, max: light   Earthworks M23R, Arta (15 cm di distanza)   Rumorosità ambientale: 25 dB(A)
dB(A) 0102030405060708090Deep BassMiddle BassHigh BassLower RangeMidsHigher MidsLower HighsMid HighsUpper HighsSuper Highs20494142.747.738.752.32540.844.737.742.238.940.73150.452.5554946.848.4403536.339.134.431.137.45036.73635.228.927.135.56326.928.525.632.827.828.98020.823.622.917.916.923.410019.420.320.915.614.327.312516.717.323.617.315.630.316020.619.422.518.217.229.320024.624.524.922.320.228.725018.519.623.317.615.329.931515.718.523.113.514.929.840016.318.726.11212.632.350015.415.627.113.112.133.463012.212.928.211.310.534.780011.613.327.911.310.934.7100011.712.329.811.310.936.21250121230.211.411.337160011.912.531.811.611.340200012.112.730.512.111.640250012.412.53112.61241.5315012.613.527.713.212.639400013.214.527.413.61339.5500013.614251413.738.5630013.917.918.914.313.731.1800013.915.518.114.514.226.91000013.915.619.914.213.422.41250013.714.320.713.812.818.91600012.41320.112.512.114.8SPL25.72740.425.424.849.8N0.70.93.30.70.66.6median 13.7median 14.5median 25median 13.5median 12.8median 32.3Delta2.634.11.91.45hearing rangehide median Fan NoiseMSI Katana A15 AI B8VG
MSI Katana A15 AI B8VG
R9 8945HS, NVIDIA GeForce RTX 4070 Laptop GPU
HP Omen 16-xf0376ng
R7 7840HS, NVIDIA GeForce RTX 4070 Laptop GPU
HP Victus 16-r0077ng
i7-13700H, NVIDIA GeForce RTX 4070 Laptop GPU
Aorus 15 BSF
i7-13700H, NVIDIA GeForce RTX 4070 Laptop GPU
Lenovo Legion Pro 5 16ARX8
R7 7745HX, NVIDIA GeForce RTX 4070 Laptop GPU
Noise
-5%
-7%
-16%
7%
off /ambiente *
25
24
4%
25
-0%
24
4%
23.2
7%
Idle Minimum *
25
25
-0%
28
-12%
25
-0%
23.2
7%
Idle Average *
26
29
-12%
29
-12%
31
-19%
23.2
11%
Idle Maximum *
27
32
-19%
30
-11%
37
-37%
26.2
3%
Load Average *
40
44
-10%
43
-8%
51
-28%
31.4
21%
Cyberpunk 2077 ultra *
52
Load Maximum *
50
46
8%
48
4%
57
-14%
53.8
-8%
Witcher 3 ultra *
44
46
48.4

* ... Meglio usare valori piccoli

Temperatura

I notebook da gioco tendono a riscaldarsi in modo significativo quando si eseguono applicazioni ad alta intensità grafica. È improbabile che questo sia una sorpresa per tutti. Il Katana A15 raggiunge un massimo di 47 °C nella parte superiore e 46 °C in quella inferiore, il che lo rende un po' scomodo per interagire, ma comunque più fresco di alcuni dei suoi concorrenti (dia un'occhiata alla tabella).

Il lato positivo è che il poggiapolsi rimane relativamente fresco in tutte le condizioni, garantendo un certo comfort durante l'uso.

Carico massimo
 48 °C47 °C45 °C 
 47 °C46 °C39 °C 
 31 °C31 °C30 °C 
Massima: 48 °C
Media: 40.4 °C
45 °C43 °C46 °C
35 °C40 °C35 °C
27 °C27 °C24 °C
Massima: 46 °C
Media: 35.8 °C
Alimentazione (max)  48 °C | Temperatura della stanza 21 °C | Fluke t3000FC (calibrated), Voltcraft IR-900
(-) La temperatura media del lato superiore sotto carico massimo e' di 40.4 °C / 105 F, rispetto alla media di 33.9 °C / 93 F per i dispositivi di questa classe Gaming.
(-) La temperatura massima sul lato superiore è di 48 °C / 118 F, rispetto alla media di 40.5 °C / 105 F, che varia da 21.2 a 68.8 °C per questa classe Gaming.
(-) Il lato inferiore si riscalda fino ad un massimo di 46 °C / 115 F, rispetto alla media di 43.2 °C / 110 F
(+) In idle, la temperatura media del lato superiore è di 31.1 °C / 88 F, rispetto alla media deld ispositivo di 33.9 °C / 93 F.
(-) 3: The average temperature for the upper side is 41.6 °C / 107 F, compared to the average of 33.9 °C / 93 F for the class Gaming.
(+) I poggiapolsi e il touchpad raggiungono la temperatura massima della pelle (34 °C / 93.2 F) e quindi non sono caldi.
(-) La temperatura media della zona del palmo della mano di dispositivi simili e'stata di 28.9 °C / 84 F (-5.1 °C / -9.2 F).
MSI Katana A15 AI B8VG
R9 8945HS, NVIDIA GeForce RTX 4070 Laptop GPU
HP Omen 16-xf0376ng
R7 7840HS, NVIDIA GeForce RTX 4070 Laptop GPU
HP Victus 16-r0077ng
i7-13700H, NVIDIA GeForce RTX 4070 Laptop GPU
Aorus 15 BSF
i7-13700H, NVIDIA GeForce RTX 4070 Laptop GPU
Lenovo Legion Pro 5 16ARX8
R7 7745HX, NVIDIA GeForce RTX 4070 Laptop GPU
Heat
-2%
-4%
-5%
12%
Maximum Upper Side *
48
49
-2%
51
-6%
48
-0%
41.8
13%
Maximum Bottom *
46
57
-24%
54
-17%
47
-2%
41.4
10%
Idle Upper Side *
34
31
9%
37
-9%
39
-15%
29
15%
Idle Bottom *
34
31
9%
29
15%
35
-3%
30.4
11%

* ... Meglio usare valori piccoli

Test da sforzo

A causa delle frequenze di clock più elevate, i componenti raggiungono temperature più alte sotto il carico di gioco di Cyberpunk 2077 rispetto ai nostri test di stress con Furmark e Prime95. Il gioco di ruolo fa sì che sia la CPU che la GPU si riscaldino fino a quasi 80 °C.

Furmark & Prime95
Furmark & Prime95
Furmark & Prime95
Furmark & Prime95
Furmark & Prime95
Furmark & Prime95
Cyberpunk 2077
Cyberpunk 2077
Cyberpunk 2077
Cyberpunk 2077
Cyberpunk 2077
Cyberpunk 2077

Altoparlanti

I diffusori 2.0 offrono prestazioni poco impressionanti. Vanno bene solo quando si tratta di alti. La nostra analisi audio rivela che i toni bassi e medi sono altrettanto insoddisfacenti. I produttori concorrenti, come HP (si veda l'Omen 16 per un confronto), tendono ad impegnarsi di più nei loro sistemi audio. Anche il volume massimo di 81 dB lascia spazio a miglioramenti.

dB(A) 0102030405060708090Deep BassMiddle BassHigh BassLower RangeMidsHigher MidsLower HighsMid HighsUpper HighsSuper Highs2038.744.22538.939.93146.844.84031.1325027.129.96327.829.18016.920.410014.324.312515.634.916017.239.920020.247.625015.349.731514.950.440012.657.150012.16163010.566.880010.970.1100010.972.4125011.366160011.371.4200011.67225001273.5315012.666.840001362.7500013.763.5630013.760.7800014.263.71000013.461.61250012.858.61600012.163.7SPL24.880.8N0.645.9median 12.8median 62.7Delta1.48.63644.231.740.939.245.127.83722.533.122.628.615.731.614.42614.438.514.352.217.457.714.363.311.363.210.465.410.568.612.170.211.975.510.473.110.571.910.569.411.26811.661.812.460.912.760.112.765.113.162.114.269.813.770.812.868.411.862.224.381.10.651.3median 12.4median 65.11.45.6hearing rangehide median Pink NoiseMSI Katana A15 AI B8VGHP Omen 16-xf0376ng
Diagramma frequenza (le caselle possono essere selezionate/deselezionate per confrontare i dispositivi)
MSI Katana A15 AI B8VG analisi audio

(±) | potenza degli altiparlanti media ma buona (81 dB)
Bassi 100 - 315 Hz
(-) | quasi nessun basso - in media 21.6% inferiori alla media
(±) | la linearità dei bassi è media (10% delta rispetto alla precedente frequenza)
Medi 400 - 2000 Hz
(±) | medi elevati - circa 6.2% superiore alla media
(±) | linearità dei medi adeguata (8.6% delta rispetto alla precedente frequenza)
Alti 2 - 16 kHz
(+) | Alti bilanciati - appena 2.8% dalla media
(+) | alti lineari (6% delta rispetto alla precedente frequenza)
Nel complesso 100 - 16.000 Hz
(±) | la linearità complessiva del suono è media (19.2% di differenza rispetto alla media
Rispetto alla stessa classe
» 63% di tutti i dispositivi testati in questa classe è stato migliore, 7% simile, 30% peggiore
» Il migliore ha avuto un delta di 6%, medio di 18%, peggiore di 132%
Rispetto a tutti i dispositivi testati
» 43% di tutti i dispositivi testati in questa classe è stato migliore, 7% similare, 50% peggiore
» Il migliore ha avuto un delta di 4%, medio di 25%, peggiore di 134%

HP Omen 16-xf0376ng analisi audio

(±) | potenza degli altiparlanti media ma buona (81 dB)
Bassi 100 - 315 Hz
(±) | bassi ridotti - in media 14.9% inferiori alla media
(±) | la linearità dei bassi è media (13.6% delta rispetto alla precedente frequenza)
Medi 400 - 2000 Hz
(±) | medi elevati - circa 5.2% superiore alla media
(+) | medi lineari (4.7% delta rispetto alla precedente frequenza)
Alti 2 - 16 kHz
(+) | Alti bilanciati - appena 3.7% dalla media
(+) | alti lineari (6.6% delta rispetto alla precedente frequenza)
Nel complesso 100 - 16.000 Hz
(+) | suono nel complesso lineare (14.6% differenza dalla media)
Rispetto alla stessa classe
» 26% di tutti i dispositivi testati in questa classe è stato migliore, 7% simile, 67% peggiore
» Il migliore ha avuto un delta di 6%, medio di 18%, peggiore di 132%
Rispetto a tutti i dispositivi testati
» 16% di tutti i dispositivi testati in questa classe è stato migliore, 4% similare, 80% peggiore
» Il migliore ha avuto un delta di 4%, medio di 25%, peggiore di 134%

Gestione dell'energia

Consumo di energia

I chip AMD Ryzen sono molto apprezzati per il loro consumo energetico moderato. Sebbene questo sia vero sotto carico, il consumo del sistema quando è al minimo è sospettosamente alto. Anche con la commutazione grafica attivata, Katana A15 consuma da 13 a 23 watt in modalità AI, superando i valori che abbiamo ottenuto testando i sistemi concorrenti.

Consumo di corrente
Off / Standbydarklight 0.1 / 2.8 Watt
Idledarkmidlight 13 / 18 / 23 Watt
Sotto carico midlight 63 / 159 Watt
 color bar
Leggenda: min: dark, med: mid, max: light        Metrahit Energy
MSI Katana A15 AI B8VG
R9 8945HS, NVIDIA GeForce RTX 4070 Laptop GPU
HP Omen 16-xf0376ng
R7 7840HS, NVIDIA GeForce RTX 4070 Laptop GPU
HP Victus 16-r0077ng
i7-13700H, NVIDIA GeForce RTX 4070 Laptop GPU
Aorus 15 BSF
i7-13700H, NVIDIA GeForce RTX 4070 Laptop GPU
Lenovo Legion Pro 5 16ARX8
R7 7745HX, NVIDIA GeForce RTX 4070 Laptop GPU
Media della classe Gaming
 
Power Consumption
4%
-3%
-2%
-24%
-31%
Idle Minimum *
13
9
31%
8
38%
7
46%
8.1
38%
Idle Average *
18
14
22%
13
28%
12
33%
15.9
12%
Idle Maximum *
23
20
13%
22
4%
20
13%
37.2
-62%
Load Average *
63
84
-33%
86
-37%
94
-49%
90.9
-44%
Cyberpunk 2077 ultra external monitor *
156
Cyberpunk 2077 ultra *
156.8
Load Maximum *
159
176
-11%
233
-47%
247
-55%
263.5
-66%
Witcher 3 ultra *
140.9
141.8
175.8
189.6

* ... Meglio usare valori piccoli

Power consumption - Cyberpunk 2077

0102030405060708090100110120130140150160Tooltip
MSI Katana A15 AI B8VG; 1280x720 Prime95 28.10 and Furmark 1.25: Ø129.9 (122.2-146.9)
MSI Katana A15 AI B8VG; Idle 150cd/m2: Ø17.6 (13.2-22.7)
MSI Katana A15 AI B8VG; Cyberpunk 2077 FHD ultra no FSR 150cd: Ø156.8 (154.6-164.4)

Power consumption - external monitor

0102030405060708090100110120130140150160Tooltip
MSI Katana A15 AI B8VG; Prime95 V2810 Stress (external Monitor): Ø80.8 (79.1-96)
MSI Katana A15 AI B8VG; Cinebench R23 Multi (external Monitor): Ø84.5 (80.8-96.3)
MSI Katana A15 AI B8VG; 1280x720 FurMark 1.19 GPU Stress Test (external Monitor): Ø109.1 (106.1-116.3)
MSI Katana A15 AI B8VG; Idle 1min (external Monitor): Ø17.1 (12.7-27.4)
MSI Katana A15 AI B8VG; Cyberpunk 2077 FHD ultra no FSR (external Monitor): Ø156 (152.1-163.6)

Durata della batteria

Il consumo di energia quando è al minimo è piuttosto elevato e la capacità della batteria di soli 53,5 Wh è piuttosto modesta. La combinazione di questi due fattori si traduce in una durata della batteria non impressionante. Nel nostro test di navigazione Web Wi-Fi con luminosità del display impostata a 150 cd/m², il Katana A15 dura a malapena 4 ore, un risultato piuttosto insoddisfacente. La maggior parte dei concorrenti ha prestazioni nettamente superiori, spesso aiutate da batterie di maggiore capacità.
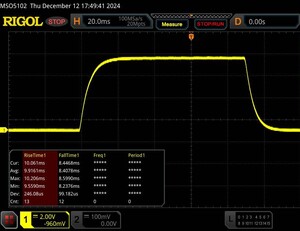
Autonomia della batteria
WiFi Websurfing
3ore 57minuti
MSI Katana A15 AI B8VG
R9 8945HS, NVIDIA GeForce RTX 4070 Laptop GPU, 53.5 Wh
HP Omen 16-xf0376ng
R7 7840HS, NVIDIA GeForce RTX 4070 Laptop GPU, 83 Wh
HP Victus 16-r0077ng
i7-13700H, NVIDIA GeForce RTX 4070 Laptop GPU, 83 Wh
Aorus 15 BSF
i7-13700H, NVIDIA GeForce RTX 4070 Laptop GPU, 99 Wh
Lenovo Legion Pro 5 16ARX8
R7 7745HX, NVIDIA GeForce RTX 4070 Laptop GPU, 80 Wh
Media della classe Gaming
 
Autonomia della batteria
45%
80%
161%
1%
59%
WiFi v1.3
237
344
45%
426
80%
619
161%
240
1%
Reader / Idle
654
392
H.264
541
Load
132
61

Valutazione Notebookcheck

Se Katana A15 AI avesse un case di qualità superiore, un display migliore e una batteria più grande, il suo prezzo sarebbe molto più facile da accettare. Allo stato attuale delle cose, tuttavia, il sistema è a malapena competitivo e ha un prezzo eccessivo rispetto ad alcuni rivali.
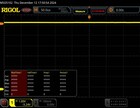
MSI Katana A15 AI B8VG - 12/20/2024 v8
Florian Glaser

Chassis
69 / 98 → 70%
Tastiera
77%
Dispositivo di puntamento
72%
Connettività
54 / 80 → 68%
Peso
61 / 10-68 → 88%
Batteria
57 / 95 → 60%
Display
73%
Prestazioni di gioco
85%
Prestazioni Applicazioni
84%
AI Performance
74%
Temperatura
84 / 95 → 89%
Rumorosità
75 / 90 → 83%
Audio
69%
Fotocamera
34 / 75 → 45%
Media
57%
76%
Gaming - Media ponderata
CO2 Emissions
No Data
Materials
0%
Packaging
50%
Power Use
73.1%
Repairability
50%
Software Updates
22.3%
Recycle Logo Total Sustainability Score: 32.6%

Transparency

The selection of devices to be reviewed is made by our editorial team. The test sample was provided to the author as a loan by the manufacturer or retailer for the purpose of this review. The lender had no influence on this review, nor did the manufacturer receive a copy of this review before publication. There was no obligation to publish this review. We never accept compensation or payment in return for our reviews. As an independent media company, Notebookcheck is not subjected to the authority of manufacturers, retailers or publishers.

This is how Notebookcheck is testing

Every year, Notebookcheck independently reviews hundreds of laptops and smartphones using standardized procedures to ensure that all results are comparable. We have continuously developed our test methods for around 20 years and set industry standards in the process. In our test labs, high-quality measuring equipment is utilized by experienced technicians and editors. These tests involve a multi-stage validation process. Our complex rating system is based on hundreds of well-founded measurements and benchmarks, which maintains objectivity. Further information on our test methods can be found here.

Please share our article, every link counts!
Mail Logo
> Recensioni e prove di notebook, tablets e smartphones > Recensioni e prove > Recensioni e prove > Recensione del laptop MSI Katana A15 AI: gamer RTX 4070 penalizzato dalle misure di risparmio
Florian Glaser, 2025-01- 5 (Update: 2025-01-13)