Notebookcheck Logo
Teaser

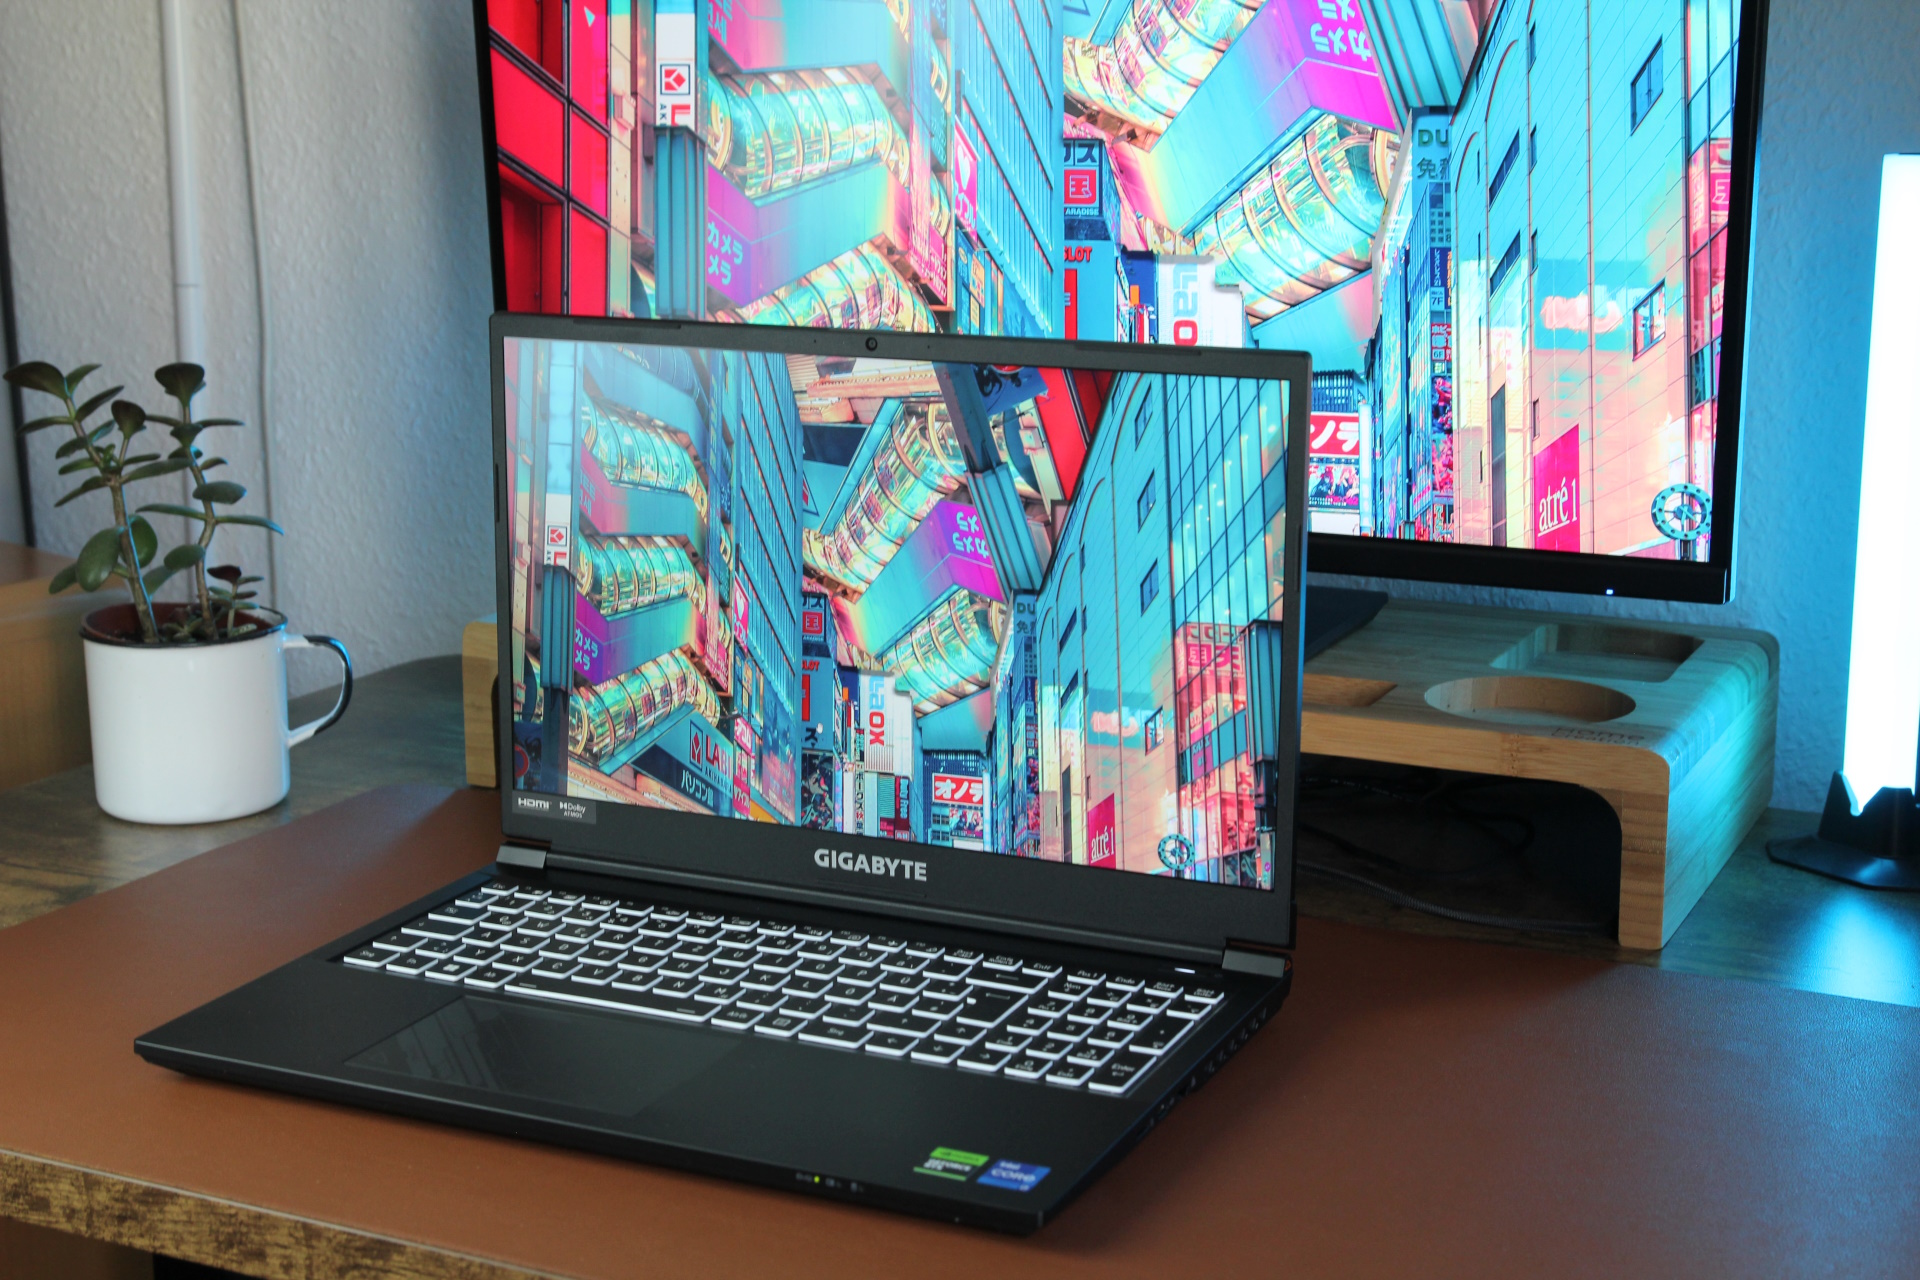
Recensione del computer portatile Gigabyte G5 KF5 2024: gaming con una RTX 4060 a un prezzo stracciato. Un buon affare?
Un mega affare?

Intel Core i7-13620H, una RTX 4060, più 16 GB di RAM e un SSD da 1 TB - tutto per 899 euro. Al momento non è possibile trovare un gamer RTX 4060 molto più economico. Verifichiamo se l'ultimo G5 vale il prezzo e si candida per la nostra lista dei portatili da gioco più convenienti.
Christian Hintze, 👁 Christian Hintze (traduzione a cura di DeepL / Ninh Duy) Published 🇺🇸 🇩🇪 ...
Alder Lake Deal Gaming Geforce GPU Laptop / Notebook Nvidia Raptor Lake

Verdetto - Il sistema di raffreddamento come area problematica

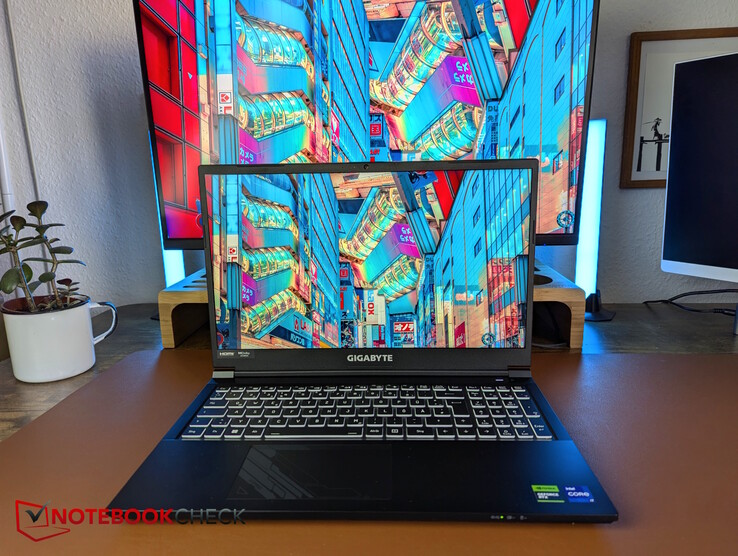
Un laptop RTX 4060 a soli 899 euro ha il suo fascino, e si può accettare una webcam 720p, la mancanza di una porta Thunderbolt e forse anche una rumorosità leggermente superiore. Il G5 fa anche alcune cose sorprendentemente bene: il design sottile è piacevole, la tastiera è più che solida, il display piuttosto medio brilla con un'elevata precisione dei colori e le prestazioni della CPU sono leggermente superiori alla media.

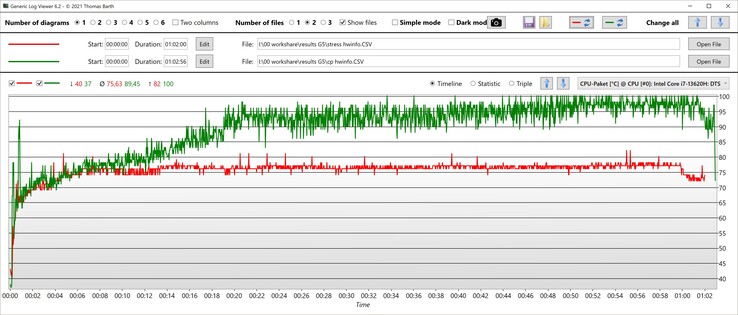
Ciò che non va bene, tuttavia, è il sistema di raffreddamento: se la CPU raggiunge costantemente i 100 °C durante il gioco, ciò non favorisce necessariamente la durata dell'hardware. Non c'è da stupirsi che il portatile sia anche piuttosto rumoroso. Questo potrebbe essere un difetto del nostro modello di prova, ma anche il predecessore aveva problemi di temperatura. Non capiamo perché Gigabyte non abbia risolto questo punto debole tra le due generazioni di laptop. Se il produttore scopre un difetto nel nostro modello, aggiorneremo il test.

Pro

+ prezzo basso
+ 2 slot per SSD M.2
+ buona tastiera
+ il display calibrato è molto fedele ai colori (sRGB)
+ buone prestazioni della CPU

Contro

- niente Thunderbolt
- webcam 720p
- nessun interruttore MUX
- La CPU si scalda troppo durante il gioco
- Strozzatura dell'SSD
- latenze elevate
- prestazioni grafiche un po' inferiori alla media
- sistema di raffreddamento sovraccarico
- relativamente rumoroso
Bestpreis 939€ hardwarecamp24
GIGABYTE G5 KF5-H3DE554KD, Core i7-13620H, 16GB RAM, 1TB SSD, GeForce RTX 4060, DE

Price comparison

Potenziali concorrenti a confrontos

Image
Modello
Geizhals
Peso
Altezza
Display
1.
76.3%
Gigabyte G5 KF5 2024
Intel Core i7-13620H ⎘
NVIDIA GeForce RTX 4060 Laptop GPU ⎘
16 GB Memoria, 1024 GB SSD
Bestpreis 939€ hardwarecamp24
2 kg22.7 mm15.60"
1920x1080
141 PPI
IPS
2.
79%
Lenovo LOQ 15IRX9
Lenovo LOQ 15IRX9
Intel Core i5-13450HX ⎘
NVIDIA GeForce RTX 4060 Laptop GPU ⎘
16 GB Memoria, 1024 GB SSD
Bestpreis 995€ computeruniverse.net
2. 995€ Cyberport.de
3. 999€ hardwarecamp24
2.4 kg23.9 mm15.60"
1920x1080
141 PPI
IPS
3.
80.3%
Asus TUF Gaming A15 FA507UV
AMD Ryzen 9 8945H ⎘
NVIDIA GeForce RTX 4060 Laptop GPU ⎘
16 GB Memoria, 1024 GB SSD
Bestpreis 1268.26€ TechnikLaden
2. 1268.28€ 1ashop.at
3. 1268.28€ haym.infotec
2.1 kg22.4 mm15.60"
1920x1080
141 PPI
IPS
4.
82.3%
Lenovo Legion Pro 5 16IRX9 G9
Intel Core i7-14700HX ⎘
NVIDIA GeForce RTX 4060 Laptop GPU ⎘
32 GB Memoria, 1024 GB SSD
Bestpreis 1568.98€ Jacob Elektronik direkt
2. 1569€ PC-KING
3. 1582.16€ Jacob Elektronik direkt (AT)
2.5 kg26.55 mm16.00"
2560x1600
189 PPI
IPS
5.
83.4%
Dell Inspiron 16 Plus 7640
Intel Core Ultra 7 155H ⎘
NVIDIA GeForce RTX 4060 Laptop GPU ⎘
16 GB Memoria, 1024 GB SSD
Listenpreis 1300 USD
Geizhals Suche
2.2 kg19.9 mm16.00"
2560x1600
189 PPI
IPS

La serie G5 segna l'ingresso conveniente di Gigabyte nei computer portatili da gioco. Rispetto al predecessore con Intel Gen12 Alder Lake, il modello 2024 riceve un aggiornamento a Intel Gen13 Raptor Lake, vale a dire il Core i7-13620H e la RTX 4060 rimane ovviamente, così come la RAM da 16 GB, mentre la capacità dell'SSD è stata raddoppiata a 1 TB. A soli 899 euro, è ancora più economico del suo predecessore, il che lo rende uno dei prezzi più bassi in assoluto in questo segmento di prestazioni. Verifichiamo se l'attuale G5 KF5 è interessante per chi cerca di risparmiare o se taglia troppi angoli.

Oltre al suo predecessore, confrontiamo il sistema con altri computer portatili da gioco economici come il LOQ 15e il Asus TUF Gaming A15 (2024) ma anche con i dispositivi più costosi a causa della mancanza di alternative Lenovo Legion Pro 5 16IRX9 G9 e Dell Inspiron 16 Plus 7640.

Specifiche - Core i7-13620H e RTX 4060 per meno di 900 euro

G5 KF5 (G5 Serie)
Processore
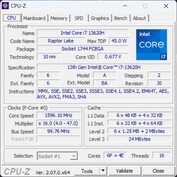
Intel Core i7-13620H 10 x 1.8 - 4.9 GHz, Raptor Lake-H
Scheda grafica
NVIDIA GeForce RTX 4060 Laptop GPU - 8 GB VRAM, 75 W TDP, Geforce 565.90, Optimus
Memoria
16 GB 
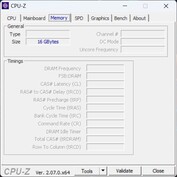
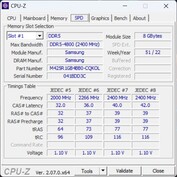
, 2x 8 GB Samsung DDR5-4800
Schermo
15.60 pollici 16:9, 1920 x 1080 pixel 141 PPI, Sharp SHP153F (LQ156M1JW30), IPS, lucido: no, HDR, 360 Hz
Scheda madre
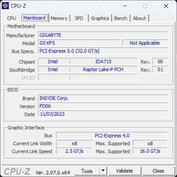
Intel Alder Lake-P PCH
Harddisk
Gigabyte AG450E1024-SI, 1024 GB 
, 876 GB libera
Scheda audio
Intel Raptor Lake-P/U/H PCH - cAVS
Porte di connessione
1 USB 2.0, 1 USB 3.0 / 3.1, 2 USB 3.1 Gen 2, 1 HDMI, 1 DisplayPort, 1 Kensington Lock, Connessioni Audio: Headset + Microphone, Lettore schede: MicroSD Reader
Rete
Realtek Semiconductor RTL8168/8111 PCI-E Gigabit Ethernet NIC (10/100/1000MBit/s), Intel Wi-Fi 6E AX211 (a/b/g/h/n = Wi-Fi 4/ac = Wi-Fi 5/ax = Wi-Fi 6/ Wi-Fi 6E 6 GHz), Bluetooth Bluetooth 5.2
Dimensioni
altezza x larghezza x profondità (in mm): 22.7 x 360 x 238
Batteria
54 Wh ioni di litio
Sistema Operativo
Microsoft Windows 11 Home
Camera
Webcam: 720p IR Webcam
Fotocamera Principale: 0.9 MPix
Altre caratteristiche
Tastiera: Chiclet 1 Zone RGB, Illuminazione Tastiera: si, 24 Mesi Garanzia
Peso
2.018 kg, Alimentazione: 478 gr
Prezzo
899 Euro
Nota: il produttore potrebbe usare componenti di fornitori diversi pannelli dei diplay, drive o banchi di memoria con specifiche simili.


Cassa e caratteristiche: Custodia in plastica in grigio ferro

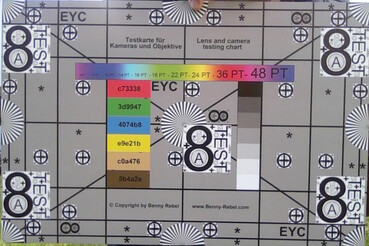
Esternamente, non è cambiato praticamente nulla rispetto al suo predecessore, poiché ha copiato anche il suo design Clevo in plastica ("Iron Gray") dal modello Gigabyte G5 KE (all'epoca ancora con RTX 3060). È interessante notare che il precedente supporto Thunderbolt 4 della porta USB-C sinistra è stato rimosso. Sono stati fatti dei risparmi anche sulla webcam, che ha solo una risoluzione di 720p ed è piuttosto sfocata; presenta inoltre elevate deviazioni di colore.

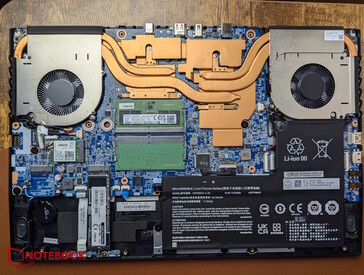
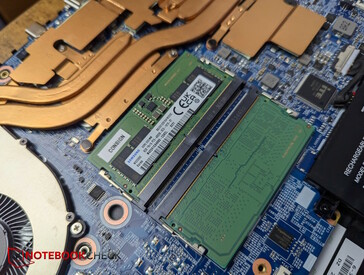
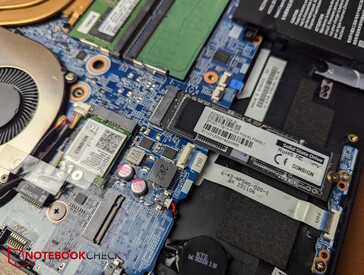
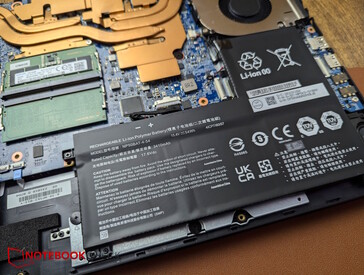
Per la manutenzione, è necessario rimuovere 13 viti Phillips, due delle quali sono coperte da un adesivo sigillante, che potrebbe invalidare la garanzia se non viene eseguito correttamente. All'interno, è possibile accedere ai due slot SSD M.2, al modulo WiFi rimovibile, alla batteria, ai due slot RAM e al sistema di raffreddamento.

Senza piastra di base
RAM DDR5
RAM DDR5
Due slot SSD M.2 più modulo WiFi
La batteria
La batteria

La base si incrina e scricchiola leggermente quando si cerca di ruotarla. Il coperchio oscilla solo leggermente quando viene regolato e si apre a un massimo di 140 gradi.

Confronto delle dimensioni

363.4 mm 261.75 mm 26.55 mm 2.5 kg359.86 mm 258.7 mm 23.9 mm 2.4 kg360 mm 238 mm 22.7 mm 2 kg360 mm 238 mm 22.7 mm 1.9 kg356.78 mm 250.6 mm 19.9 mm 2.2 kg354 mm 251 mm 22.4 mm 2.1 kg297 mm 210 mm 1 mm 5.7 g
A sinistra: Kensington, USB-A 3.0, USB-A 2.0, jack microfono, jack cuffie
A destra: Lettore MicroSD, USB-C 3.2 Gen2, LAN (1 GbE)
Posteriore: USB-C 3.2 Gen2, HDMI 2.1, MiniDP 1.4, alimentazione
SD Card Reader
average JPG Copy Test (av. of 3 runs)
Media della classe Gaming
  (19 - 202, n=87, ultimi 2 anni)
95.9 MB/s +36%
Gigabyte G5 KF5 2024
Intel Core i7-13620H
70.6 (55.19min - 75.59max) MB/s
Gigabyte G5 KF
Intel Core i5-12500H
69.8 (63.44min - 75.35max) MB/s -1%
Dell Inspiron 16 Plus 7640
Intel Core Ultra 7 155H (Angelbird AV Pro V60)
22.2 MB/s -69%
maximum AS SSD Seq Read Test (1GB)
Media della classe Gaming
  (25.8 - 269, n=87, ultimi 2 anni)
120.4 MB/s +33%
Gigabyte G5 KF5 2024
Intel Core i7-13620H
90.74 MB/s
Gigabyte G5 KF
Intel Core i5-12500H
89.47 MB/s -1%
Dell Inspiron 16 Plus 7640
Intel Core Ultra 7 155H (Angelbird AV Pro V60)
28.7 MB/s -68%
Networking
iperf3 transmit AXE11000
Lenovo Legion Pro 5 16IRX9 G9
Intel Wi-Fi 6E AX211
1549 (752min - 1707max) MBit/s +8%
Gigabyte G5 KF5 2024
Intel Wi-Fi 6E AX211
1432 (1380min - 1467max) MBit/s
Gigabyte G5 KF
Intel Wi-Fi 6E AX211
1347 (1198min - 1410max) MBit/s -6%
Media Intel Wi-Fi 6E AX211
  (64 - 1921, n=242)
1231 MBit/s -14%
Media della classe Gaming
  (469 - 1843, n=147, ultimi 2 anni)
1227 MBit/s -14%
Lenovo LOQ 15IRX9
Realtek RTL8852BE
830 (747min - 873max) MBit/s -42%
Dell Inspiron 16 Plus 7640
Intel Wi-Fi 6E AX211
811 (428min - 1008max) MBit/s -43%
Asus TUF Gaming A15 FA507UV
Realtek RTL8852BE
806 (513min - 843max) MBit/s -44%
iperf3 receive AXE11000
Gigabyte G5 KF5 2024
Intel Wi-Fi 6E AX211
1650 (1563min - 1691max) MBit/s
Gigabyte G5 KF
Intel Wi-Fi 6E AX211
1631 (1392min - 1669max) MBit/s -1%
Lenovo Legion Pro 5 16IRX9 G9
Intel Wi-Fi 6E AX211
1477 (1386min - 1517max) MBit/s -10%
Media della classe Gaming
  (680 - 1890, n=147, ultimi 2 anni)
1390 MBit/s -16%
Media Intel Wi-Fi 6E AX211
  (582 - 1890, n=242)
1382 MBit/s -16%
Dell Inspiron 16 Plus 7640
Intel Wi-Fi 6E AX211
1000 (899min - 1078max) MBit/s -39%
Lenovo LOQ 15IRX9
Realtek RTL8852BE
975 (950min - 986max) MBit/s -41%
Asus TUF Gaming A15 FA507UV
Realtek RTL8852BE
956 (936min - 974max) MBit/s -42%
iperf3 transmit AXE11000 6GHz
Gigabyte G5 KF
Intel Wi-Fi 6E AX211
1594 (1547min - 1650max) MBit/s +2%
Lenovo Legion Pro 5 16IRX9 G9
Intel Wi-Fi 6E AX211
1585 (1369min - 1655max) MBit/s +1%
Gigabyte G5 KF5 2024
Intel Wi-Fi 6E AX211
1566 (780min - 1615max) MBit/s
Media della classe Gaming
  (648 - 1878, n=68, ultimi 2 anni)
1429 MBit/s -9%
Media Intel Wi-Fi 6E AX211
  (385 - 1851, n=214)
1368 MBit/s -13%
Dell Inspiron 16 Plus 7640
Intel Wi-Fi 6E AX211
705 (634min - 769max) MBit/s -55%
iperf3 receive AXE11000 6GHz
Gigabyte G5 KF
Intel Wi-Fi 6E AX211
1654 (1581min - 1671max) MBit/s +4%
Gigabyte G5 KF5 2024
Intel Wi-Fi 6E AX211
1585 (1568min - 1606max) MBit/s
Lenovo Legion Pro 5 16IRX9 G9
Intel Wi-Fi 6E AX211
1540 (774min - 1556max) MBit/s -3%
Media Intel Wi-Fi 6E AX211
  (700 - 1857, n=213)
1493 MBit/s -6%
Media della classe Gaming
  (853 - 1788, n=68, ultimi 2 anni)
1488 MBit/s -6%
Dell Inspiron 16 Plus 7640
Intel Wi-Fi 6E AX211
700 (607min - 805max) MBit/s -56%
05010015020025030035040045050055060065070075080085090095010001050110011501200125013001350140014501500155016001650Tooltip
Gigabyte G5 KF5 2024 Intel Wi-Fi 6E AX211; iperf3 transmit AXE11000 6GHz; iperf 3.1.3: Ø1540 (780-1615)
Gigabyte G5 KF5 2024 Intel Wi-Fi 6E AX211; iperf3 receive AXE11000 6GHz; iperf 3.1.3: Ø1584 (1568-1606)
Gigabyte G5 KF5 2024 Intel Wi-Fi 6E AX211; iperf3 transmit AXE11000; iperf 3.1.3: Ø1432 (1380-1467)
Lenovo LOQ 15IRX9 Realtek RTL8852BE; iperf3 transmit AXE11000; iperf 3.1.3: Ø830 (747-873)
Asus TUF Gaming A15 FA507UV Realtek RTL8852BE; iperf3 transmit AXE11000; iperf 3.1.3: Ø806 (513-843)
Gigabyte G5 KF5 2024 Intel Wi-Fi 6E AX211; iperf3 receive AXE11000; iperf 3.1.3: Ø1649 (1563-1691)
Lenovo LOQ 15IRX9 Realtek RTL8852BE; iperf3 receive AXE11000; iperf 3.1.3: Ø974 (950-986)
Asus TUF Gaming A15 FA507UV Realtek RTL8852BE; iperf3 receive AXE11000; iperf 3.1.3: Ø956 (936-974)
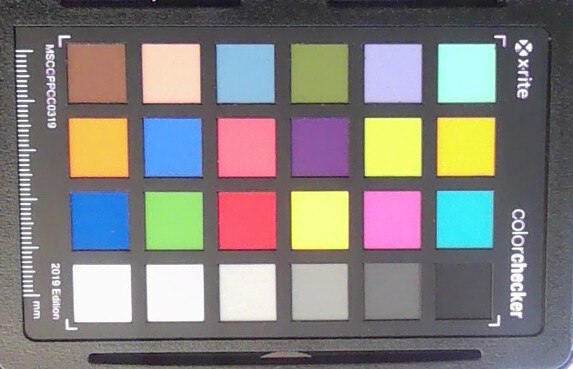
ColorChecker
19.3 ∆E
18.5 ∆E
23.1 ∆E
23.1 ∆E
20.4 ∆E
18 ∆E
23.3 ∆E
27.9 ∆E
17.2 ∆E
14 ∆E
17.4 ∆E
25.2 ∆E
26.2 ∆E
24.5 ∆E
20.6 ∆E
15.6 ∆E
19.3 ∆E
29.3 ∆E
1.8 ∆E
10.7 ∆E
20.7 ∆E
22.4 ∆E
21.5 ∆E
12.8 ∆E
ColorChecker Gigabyte G5 KF5 2024: 19.7 ∆E min: 1.76 - max: 29.31 ∆E

Sostenibilità

Sebbene Gigabyte spedisca il G5 in una scatola di cartone, il portatile da gioco e l'alimentatore sono ancora avvolti in sacchetti di plastica all'interno e protetti dagli urti da materiali Styrodur. A quanto pare non vengono utilizzati materiali riciclati e il produttore non fornisce alcuna informazione sulle emissioni di CO2 durante la produzione del G5.

Dispositivi di input - G5 con buoni dispositivi di input

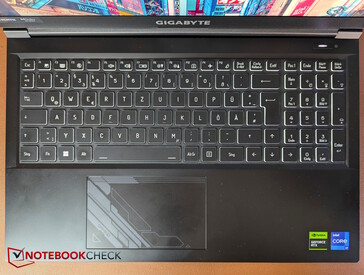
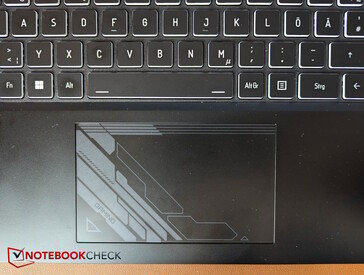
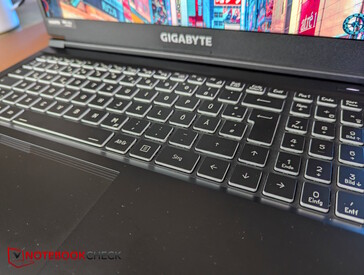
Il layout e l'etichettatura sono leggermente diversi da quelli di G5 KE, ma seguono il predecessore diretto G5 KF con il suo tasto di invio più grande e l'etichettatura più sottile e chiara. Il layout è chiaro e le scritte sono facili da leggere anche senza retroilluminazione. L'illuminazione della tastiera a zona singola può essere configurata nei colori e la luminosità può essere regolata su quattro livelli. Il punto di pressione è piacevole con una corsa media, mentre il feedback è buono. La digitazione è rapida con emissioni di rumore moderate.

Il touchpad misura circa 12 x 7,2 cm e offre discrete proprietà di scorrimento, che si indeboliscono leggermente solo con movimenti molto lenti. I rumori dei pulsanti del mouse integrato sono moderati.

La tastiera
La tastiera
Il touchpad
Il touchpad
I pulsanti senza illuminazione
La retroilluminazione

Display - Gigabyte con un nitido display FHD

Nessuna grave perdita di luminosità della retroilluminazione
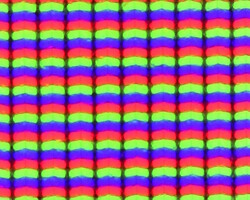
Struttura del subpixel

Gigabyte ha cambiato il display del G5. Gli ultimi modelli di G5 utilizzavano un pannello Chi-Mei, ma il nostro campione di prova ha ora uno schermo IPS Full HD opaco di Sharp con una frequenza di aggiornamento massima di 144 Hz.

In media, lo schermo brilla a poco più di 300 nits, che al giorno d'oggi si colloca nella fascia bassa. L'uniformità dell'illuminazione è un buon 87%.

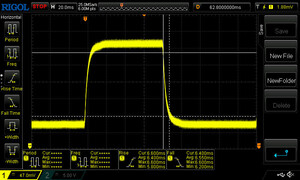
Il livello di nero e il contrasto sono nella media. Il pannello non commuta i pixel in modo eccessivamente rapido, ma non è nemmeno particolarmente lento. Il backlight bleeding non è un problema, così come il PWM.

Riassumendo soggettivamente, abbiamo un display decente per il prezzo complessivo, che non è certamente uno dei migliori della sua categoria, ma svolge il suo lavoro in modo affidabile. Per ottenere risoluzioni più elevate, colori e contrasti più brillanti e altre tecnologie di pannello (OLED, MiniLED), dovrà scavare più a fondo nelle sue tasche.

297
cd/m²
306
cd/m²
302
cd/m²
307
cd/m²
342
cd/m²
317
cd/m²
299
cd/m²
299
cd/m²
299
cd/m²
Distribuzione della luminosità
Sharp SHP153F (LQ156M1JW30) tested with X-Rite i1Pro 3
Massima: 342 cd/m² (Nits) Media: 307.6 cd/m² Minimum: 18.8 cd/m²
Distribuzione della luminosità: 87 %
Al centro con la batteria: 342 cd/m²
Contrasto: 1179:1 (Nero: 0.29 cd/m²)
ΔE Color 2.46 | 0.5-29.43 Ø4.91, calibrated: 0.82
ΔE Greyscale 3.03 | 0.5-98 Ø5.2
68.8% AdobeRGB 1998 (Argyll 2.2.0 3D)
98.9% sRGB (Argyll 2.2.0 3D)
67.9% Display P3 (Argyll 2.2.0 3D)
Gamma: 2.51
Gigabyte G5 KF5 2024
Sharp SHP153F (LQ156M1JW30), IPS, 1920x1080, 15.6", 360 Hz
Gigabyte G5 KF
Chi Mei N156HRA-EA1, IPS, 1920x1080, 15.6", 144 Hz
Lenovo LOQ 15IRX9
BOE NJ NE156FHM-NX9, IPS, 1920x1080, 15.6", 144 Hz
Asus TUF Gaming A15 FA507UV
AU Optronics B156HAN15.H, IPS, 1920x1080, 15.6", 144 Hz
Lenovo Legion Pro 5 16IRX9 G9
BOE NE160QDM-NZB, IPS, 2560x1600, 16", 240 Hz
Dell Inspiron 16 Plus 7640
AU Optronics B160QAN, IPS, 2560x1600, 16", 120 Hz
Display
-35%
5%
3%
25%
8%
Display P3 Coverage
67.9
43.2
-36%
73.7
9%
70.5
4%
99.22
46%
76
12%
sRGB Coverage
98.9
64.3
-35%
99.1
0%
98.5
0%
99.93
1%
99.8
1%
AdobeRGB 1998 Coverage
68.8
44.7
-35%
72.6
6%
72.7
6%
87.81
28%
76.7
11%
Response Times
-58%
-191%
-152%
29%
-99%
Response Time Grey 50% / Grey 80% *
13 ?(6.6, 6.4)
25.1 ?(11.7, 13.4)
-93%
42.2 ?(19.1, 23.1)
-225%
31.7 ?(14.7, 17)
-144%
4.8 ?(2.2, 2.6)
63%
25.6 ?(12.3, 13.3)
-97%
Response Time Black / White *
8.8 ?(4.6, 4.2)
10.8 ?(9.9, 7.9)
-23%
22.6 ?(11.2, 11.4)
-157%
22.9 ?(11.7, 11.2)
-160%
9.2 ?(4.6, 4.6)
-5%
17.6 ?(8.5, 9.1)
-100%
PWM Frequency
Screen
-134%
-3%
-13%
-4%
8%
Brightness middle
342
297
-13%
306
-11%
315
-8%
518
51%
314.7
-8%
Brightness
308
275
-11%
287
-7%
303
-2%
491
59%
291
-6%
Brightness Distribution
87
85
-2%
88
1%
90
3%
90
3%
89
2%
Black Level *
0.29
0.34
-17%
0.21
28%
0.25
14%
0.36
-24%
0.28
3%
Contrast
1179
874
-26%
1457
24%
1260
7%
1439
22%
1124
-5%
Colorchecker dE 2000 *
2.46
6.23
-153%
2.25
9%
2.26
8%
4.32
-76%
1.62
34%
Colorchecker dE 2000 max. *
4.12
20.93
-408%
4.84
-17%
7.37
-79%
6.37
-55%
2.94
29%
Colorchecker dE 2000 calibrated *
0.82
4.74
-478%
1.45
-77%
1.03
-26%
0.75
9%
1.08
-32%
Greyscale dE 2000 *
3.03
5.92
-95%
2.4
21%
4
-32%
3.66
-21%
1.3
57%
Gamma
2.51 88%
2.49 88%
2.259 97%
2.116 104%
2.19 100%
2.26 97%
CCT
7056 92%
6279 104%
6790 96%
7570 86%
6841 95%
6385 102%
Media totale (Programma / Settaggio)
-76% / -102%
-63% / -28%
-54% / -29%
17% / 7%
-28% / -7%

* ... Meglio usare valori piccoli

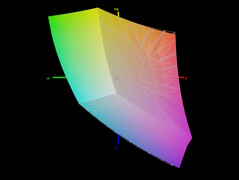
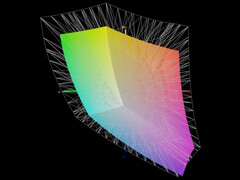
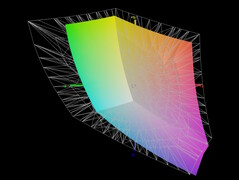
Con il pannello utilizzato, non è certo sorprendente che dei consueti spazi colore, solo sRGB sia quasi completamente coperto.

sRGB
sRGB
Display P3
Display P3
AdobeRGB
AdobeRGB

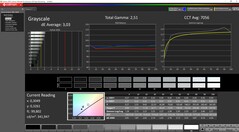
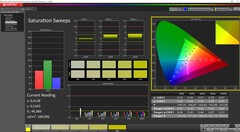
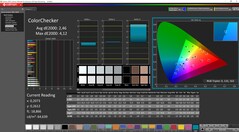
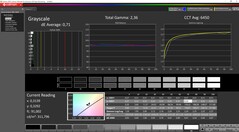
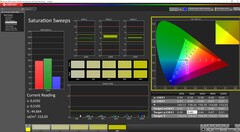
I colori e la scala di grigi del display sono buoni ex fabbrica, ma i valori DeltaE possono essere ridotti in modo significativo utilizzando la nostra calibrazione manuale tramite il colorimetro Xrite e il software Calman, in modo che le deviazioni nella scala di grigi scendano da 3,03 a soli 0,71 e da 2,46 a soli 0,82 nel ColorChecker. Il pannello è quindi abbastanza accurato dal punto di vista cromatico ed è persino adatto a compiti di editing di foto e video leggeri, a condizione che lo spazio colore sRGB sia sufficiente.

Scala di grigi
Scala di grigi
Saturazione
Saturazione
ColorChecker
ColorChecker
Scala di grigi calibrata
Saturazione calibrata
ColorChecker calibrato

Tempi di risposta del Display

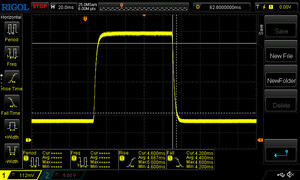
I tempi di risposta del display mostrano quanto sia veloce lo schermo a cambaire da un colore all'altro. Tempi di risposta lenti possono creare sovrapposizioni negloi oggetti in movimento. Specialmente i giocatori patiti del 3D dovrebbero usare uno schermo con tempi di risposta bassi.
       Tempi di risposta dal Nero al Bianco
8.8 ms ... aumenta ↗ e diminuisce ↘ combinato↗ 4.6 ms Incremento
↘ 4.2 ms Calo
Lo schermo mostra veloci tempi di risposta durante i nostri tests e dovrebbe esere adatto al gaming
In confronto, tutti i dispositivi di test variano da 0.1 (minimo) a 240 (massimo) ms. » 21 % di tutti i dispositivi è migliore.
Questo significa che i tempi di risposta rilevati sono migliori rispettto alla media di tutti i dispositivi testati (20.9 ms).
       Tempo di risposta dal 50% Grigio all'80% Grigio
13 ms ... aumenta ↗ e diminuisce ↘ combinato↗ 6.6 ms Incremento
↘ 6.4 ms Calo
Lo schermo mostra buoni tempi di risposta durante i nostri tests, ma potrebbe essere troppo lento per i gamers competitivi.
In confronto, tutti i dispositivi di test variano da 0.165 (minimo) a 636 (massimo) ms. » 23 % di tutti i dispositivi è migliore.
Questo significa che i tempi di risposta rilevati sono migliori rispettto alla media di tutti i dispositivi testati (32.8 ms).

Sfarfallio dello schermo / PWM (Pulse-Width Modulation)

Per ridurre la luminosità dello schermo, alcuni portatili accendono e spengono la retroilluminazione in rapida successione - un metodo chiamato Pulse Width Modulation (PWM). Questa frequenza di ciclo a livello ideale non dovrebbe essere percepibile dall'occhi umano. Se tale frequenza è troppo bassa, gli utenti con occhi sensibili potrebbero stancarsi gli occhi o avere mal di testa o anche notare uno sfarfallio.
flickering dello schermo / PWM non rilevato

In confronto: 53 % di tutti i dispositivi testati non utilizza PWM per ridurre la luminosita' del display. Se è rilevato PWM, una media di 8710 (minimo: 5 - massimo: 343500) Hz è stata rilevata.

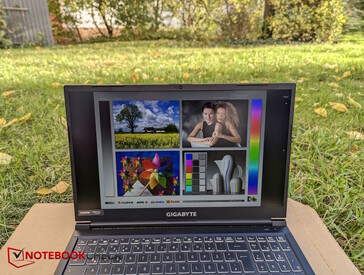
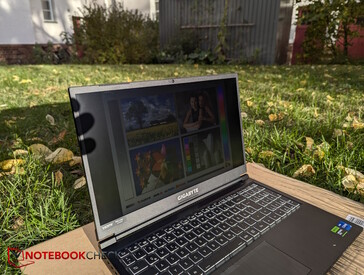
All'esterno, i 300 nit non sono ideali, ma utilizzabili. La luce del sole deve essere evitata a tutti i costi.

Fuori all'ombra
Fuori all'ombra
All'aperto, alla luce diretta del sole
Angoli di visione IPS stabili

Prestazioni - CPU top, GPU meno

Il nostro G5 KF5 è equipaggiato con un Intel Core i7-13620H e una RTX 4060 oltre a 16 GB di RAM DDR5 e un SSD da 1 TB. Il G5 è disponibile anche come modello MF5, nel qual caso una più debole RTX 4050 più debole, che sembra essere l'unica differenza. Con questa combinazione di hardware, il G5 si posiziona come gamer economico ed è anche in grado di gestire alcuni compiti leggeri di Creator.

Condizioni del test

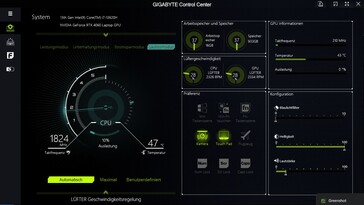
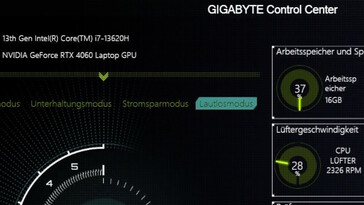
Il Gigabyte Control Center è preinstallato sul G5. Il software non è particolarmente completo (nessun interruttore MUX) e raramente abbiamo visto un centro di controllo così pixelato e poco attraente. Almeno troviamo quattro profili di prestazioni (silenzioso, risparmio energetico, intrattenimento, prestazioni) oltre alle impostazioni della tastiera. Abbiamo selezionato la modalità prestazioni per i nostri benchmark e abbiamo utilizzato la modalità risparmio energetico per i test della batteria. Poiché non è affatto chiaro come queste modalità interagiscano o influenzino le modalità di alimentazione di Windows, abbiamo anche impostato Windows in modalità prestazioni (o modalità risparmio energetico per i test della batteria).

Il Centro di controllo Gigabyte
L'aspetto pixelato non è molto bello (ingrandito).
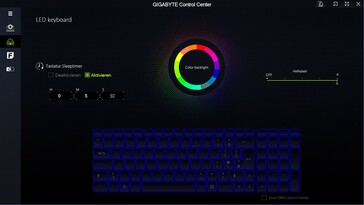
Macro tastiera e retroilluminazione
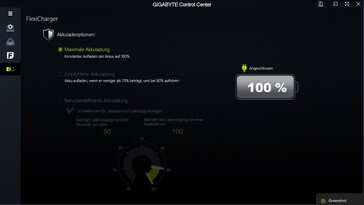
Impostazioni di carica della batteria

Processore

Il Intel Core i7-13620H è una CPU di fascia alta per computer portatili con 6 core P e 4 core E, un totale di 16 thread e una frequenza di clock da 1,8 (core E con clock di base) a 4,9 GHz (core P turbo single-core). È integrata un'unità grafica Intel Xe con solo 64 dei 96 EU.

Nel nostro test di resistenza Cinebench R15, c'è solo un leggero calo di punti nei primi quattro cicli, dopodiché le prestazioni rimangono costanti. Complessivamente, il processore del G5 ha prestazioni leggermente migliori rispetto alla media dei computer portatili con la stessa CPU del nostro database e batte addirittura il Core i5-13450HX nel LOQ 15. Rispetto al predecessore, le prestazioni della CPU sono aumentate del 21%.

In modalità batteria, le prestazioni in Cinebench R15 diminuiscono di circa il 35%.

Cinebench R15/Modalità Prestazioni Intrattenimento Silenzioso Risparmio energetico Batteria
Punteggio 2.396 2.296 840 768 1.555
TDP prima 93, scende a 65 W nel tempo prima 85, poi brevemente 65, poi 45 W prima 28, poi 20, poi 15 W 15 W 36 W

Cinebench R15 Multi loop

0210420630840105012601470168018902100231025202730294031503360357037803990Tooltip
Gigabyte G5 KF5 2024 Intel Core i7-13620H: Ø2161 (2113.38-2395.78)
Gigabyte G5 KF Intel Core i5-12500H: Ø1808 (1783.56-2001.16)
Lenovo LOQ 15IRX9 Intel Core i5-13450HX: Ø2170 (2104.93-2503.76)
Asus TUF Gaming A15 FA507UV AMD Ryzen 9 8945H: Ø2688 (2638-2777.2)
Lenovo Legion Pro 5 16IRX9 G9 Intel Core i7-14700HX: Ø3774 (3668.72-4136.93)
Dell Inspiron 16 Plus 7640 Intel Core Ultra 7 155H: Ø2341 (1793.16-2787.26)
CPU Performance Rating: Percent
Cinebench R23: Multi Core | Single Core
Cinebench R20: CPU (Multi Core) | CPU (Single Core)
Cinebench R15: CPU Multi 64Bit | CPU Single 64Bit
Blender: v2.79 BMW27 CPU
7-Zip 18.03: 7z b 4 | 7z b 4 -mmt1
Geekbench 6.3: Multi-Core | Single-Core
Geekbench 5.5: Multi-Core | Single-Core
HWBOT x265 Benchmark v2.2: 4k Preset
LibreOffice : 20 Documents To PDF
R Benchmark 2.5: Overall mean
CPU Performance Rating
Lenovo Legion Pro 5 16IRX9 G9
Intel Core i7-14700HX
86.7 pt
Media della classe Gaming
 
73.7 pt
Asus TUF Gaming A15 FA507UV
AMD Ryzen 9 8945H
68.1 pt
Dell Inspiron 16 Plus 7640
Intel Core Ultra 7 155H
63.8 pt
Gigabyte G5 KF5 2024
Intel Core i7-13620H
61.6 pt
Media Intel Core i7-13620H
 
59.9 pt
Lenovo LOQ 15IRX9
Intel Core i5-13450HX
58.4 pt
Gigabyte G5 KF
Intel Core i5-12500H
51 pt
Cinebench R23 / Multi Core
Lenovo Legion Pro 5 16IRX9 G9
Intel Core i7-14700HX
28122 Points +91%
Media della classe Gaming
  (5668 - 36249, n=189, ultimi 2 anni)
21994 Points +50%
Dell Inspiron 16 Plus 7640
Intel Core Ultra 7 155H
17675 (14726min - 17675max) Points +20%
Asus TUF Gaming A15 FA507UV
AMD Ryzen 9 8945H
17423 Points +19%
Lenovo LOQ 15IRX9
Intel Core i5-13450HX
16797 Points +14%
Gigabyte G5 KF5 2024
Intel Core i7-13620H
14686 Points
Media Intel Core i7-13620H
  (10819 - 15496, n=5)
14303 Points -3%
Gigabyte G5 KF
Intel Core i5-12500H
13471 Points -8%
Cinebench R23 / Single Core
Lenovo Legion Pro 5 16IRX9 G9
Intel Core i7-14700HX
2128 Points +14%
Media della classe Gaming
  (1136 - 2235, n=188, ultimi 2 anni)
1894 Points +2%
Gigabyte G5 KF5 2024
Intel Core i7-13620H
1862 Points
Media Intel Core i7-13620H
  (1805 - 1871, n=5)
1843 Points -1%
Asus TUF Gaming A15 FA507UV
AMD Ryzen 9 8945H
1814 Points -3%
Dell Inspiron 16 Plus 7640
Intel Core Ultra 7 155H
1733 Points -7%
Lenovo LOQ 15IRX9
Intel Core i5-13450HX
1710 Points -8%
Gigabyte G5 KF
Intel Core i5-12500H
1690 Points -9%
Cinebench R20 / CPU (Multi Core)
Lenovo Legion Pro 5 16IRX9 G9
Intel Core i7-14700HX
10498 Points +89%
Media della classe Gaming
  (2179 - 13832, n=186, ultimi 2 anni)
8352 Points +50%
Asus TUF Gaming A15 FA507UV
AMD Ryzen 9 8945H
6859 Points +23%
Dell Inspiron 16 Plus 7640
Intel Core Ultra 7 155H
6807 Points +22%
Lenovo LOQ 15IRX9
Intel Core i5-13450HX
6532 Points +18%
Gigabyte G5 KF5 2024
Intel Core i7-13620H
5558 Points
Media Intel Core i7-13620H
  (4214 - 5905, n=5)
5426 Points -2%
Gigabyte G5 KF
Intel Core i5-12500H
5115 Points -8%
Cinebench R20 / CPU (Single Core)
Lenovo Legion Pro 5 16IRX9 G9
Intel Core i7-14700HX
818 Points +17%
Media della classe Gaming
  (439 - 856, n=186, ultimi 2 anni)
727 Points +4%
Media Intel Core i7-13620H
  (693 - 719, n=5)
704 Points +1%
Gigabyte G5 KF5 2024
Intel Core i7-13620H
697 Points
Asus TUF Gaming A15 FA507UV
AMD Ryzen 9 8945H
670 Points -4%
Dell Inspiron 16 Plus 7640
Intel Core Ultra 7 155H
666 Points -4%
Lenovo LOQ 15IRX9
Intel Core i5-13450HX
652 Points -6%
Gigabyte G5 KF
Intel Core i5-12500H
651 Points -7%
Cinebench R15 / CPU Multi 64Bit
Lenovo Legion Pro 5 16IRX9 G9
Intel Core i7-14700HX
4137 (3668.72min - 4136.93max) Points +73%
Media della classe Gaming
  (905 - 5663, n=193, ultimi 2 anni)
3440 Points +44%
Dell Inspiron 16 Plus 7640
Intel Core Ultra 7 155H
2787 (1793.16min - 2787.26max) Points +16%
Asus TUF Gaming A15 FA507UV
AMD Ryzen 9 8945H
2777 Points +16%
Lenovo LOQ 15IRX9
Intel Core i5-13450HX
2503 Points +4%
Gigabyte G5 KF5 2024
Intel Core i7-13620H
2396 (2113.38min - 2395.78max) Points
Media Intel Core i7-13620H
  (1681 - 2492, n=5)
2239 Points -7%
Gigabyte G5 KF
Intel Core i5-12500H
2001 Points -16%
Cinebench R15 / CPU Single 64Bit
Lenovo Legion Pro 5 16IRX9 G9
Intel Core i7-14700HX
300 Points +12%
Asus TUF Gaming A15 FA507UV
AMD Ryzen 9 8945H
284 Points +6%
Media della classe Gaming
  (191.9 - 318, n=190, ultimi 2 anni)
278 Points +3%
Gigabyte G5 KF5 2024
Intel Core i7-13620H
269 Points
Media Intel Core i7-13620H
  (258 - 269, n=5)
263 Points -2%
Dell Inspiron 16 Plus 7640
Intel Core Ultra 7 155H
255 Points -5%
Lenovo LOQ 15IRX9
Intel Core i5-13450HX
239 Points -11%
Gigabyte G5 KF
Intel Core i5-12500H
233 Points -13%
Blender / v2.79 BMW27 CPU
Gigabyte G5 KF
Intel Core i5-12500H
256 Seconds * -17%
Media Intel Core i7-13620H
  (215 - 289, n=5)
238 Seconds * -9%
Lenovo LOQ 15IRX9
Intel Core i5-13450HX
229 Seconds * -5%
Gigabyte G5 KF5 2024
Intel Core i7-13620H
218 Seconds *
Dell Inspiron 16 Plus 7640
Intel Core Ultra 7 155H
191 Seconds * +12%
Asus TUF Gaming A15 FA507UV
AMD Ryzen 9 8945H
182 Seconds * +17%
Media della classe Gaming
  (87 - 555, n=181, ultimi 2 anni)
169.4 Seconds * +22%
Lenovo Legion Pro 5 16IRX9 G9
Intel Core i7-14700HX
126 Seconds * +42%
7-Zip 18.03 / 7z b 4
Lenovo Legion Pro 5 16IRX9 G9
Intel Core i7-14700HX
104730 MIPS +73%
Media della classe Gaming
  (23795 - 140932, n=185, ultimi 2 anni)
85738 MIPS +42%
Asus TUF Gaming A15 FA507UV
AMD Ryzen 9 8945H
73222 MIPS +21%
Dell Inspiron 16 Plus 7640
Intel Core Ultra 7 155H
61730 MIPS +2%
Gigabyte G5 KF5 2024
Intel Core i7-13620H
60545 MIPS
Lenovo LOQ 15IRX9
Intel Core i5-13450HX
59026 MIPS -3%
Media Intel Core i7-13620H
  (45983 - 62324, n=5)
56733 MIPS -6%
Gigabyte G5 KF
Intel Core i5-12500H
49343 MIPS -19%
7-Zip 18.03 / 7z b 4 -mmt1
Lenovo Legion Pro 5 16IRX9 G9
Intel Core i7-14700HX
6979 MIPS +14%
Asus TUF Gaming A15 FA507UV
AMD Ryzen 9 8945H
6615 MIPS +9%
Media della classe Gaming
  (4199 - 7581, n=185, ultimi 2 anni)
6322 MIPS +4%
Gigabyte G5 KF5 2024
Intel Core i7-13620H
6096 MIPS
Media Intel Core i7-13620H
  (5742 - 6326, n=5)
5994 MIPS -2%
Dell Inspiron 16 Plus 7640
Intel Core Ultra 7 155H
5461 MIPS -10%
Lenovo LOQ 15IRX9
Intel Core i5-13450HX
5370 MIPS -12%
Gigabyte G5 KF
Intel Core i5-12500H
5258 MIPS -14%
Geekbench 6.3 / Multi-Core
Lenovo Legion Pro 5 16IRX9 G9
Intel Core i7-14700HX
17562 Points +37%
Media della classe Gaming
  (5340 - 19665, n=112, ultimi 2 anni)
14207 Points +11%
Dell Inspiron 16 Plus 7640
Intel Core Ultra 7 155H
13018 Points +2%
Gigabyte G5 KF5 2024
Intel Core i7-13620H
12779 Points
Lenovo LOQ 15IRX9
Intel Core i5-13450HX
12684 Points -1%
Asus TUF Gaming A15 FA507UV
AMD Ryzen 9 8945H
12662 Points -1%
Media Intel Core i7-13620H
  (9131 - 13077, n=4)
11886 Points -7%
Gigabyte G5 KF
Intel Core i5-12500H
8714 Points -32%
Geekbench 6.3 / Single-Core
Lenovo Legion Pro 5 16IRX9 G9
Intel Core i7-14700HX
2884 Points +13%
Asus TUF Gaming A15 FA507UV
AMD Ryzen 9 8945H
2711 Points +7%
Media della classe Gaming
  (1490 - 3129, n=112, ultimi 2 anni)
2651 Points +4%
Media Intel Core i7-13620H
  (2544 - 2605, n=4)
2586 Points +2%
Gigabyte G5 KF5 2024
Intel Core i7-13620H
2544 Points
Dell Inspiron 16 Plus 7640
Intel Core Ultra 7 155H
2401 Points -6%
Lenovo LOQ 15IRX9
Intel Core i5-13450HX
2381 Points -6%
Gigabyte G5 KF
Intel Core i5-12500H
2239 Points -12%
Geekbench 5.5 / Multi-Core
Lenovo Legion Pro 5 16IRX9 G9
Intel Core i7-14700HX
19597 Points +68%
Media della classe Gaming
  (4557 - 23194, n=186, ultimi 2 anni)
15098 Points +29%
Dell Inspiron 16 Plus 7640
Intel Core Ultra 7 155H
12600 Points +8%
Lenovo LOQ 15IRX9
Intel Core i5-13450HX
12005 Points +3%
Asus TUF Gaming A15 FA507UV
AMD Ryzen 9 8945H
11949 Points +2%
Gigabyte G5 KF5 2024
Intel Core i7-13620H
11699 Points
Media Intel Core i7-13620H
  (8357 - 12223, n=5)
11000 Points -6%
Gigabyte G5 KF
Intel Core i5-12500H
8194 Points -30%
Geekbench 5.5 / Single-Core
Lenovo Legion Pro 5 16IRX9 G9
Intel Core i7-14700HX
2133 Points +19%
Asus TUF Gaming A15 FA507UV
AMD Ryzen 9 8945H
1991 Points +11%
Media della classe Gaming
  (986 - 2210, n=186, ultimi 2 anni)
1898 Points +6%
Media Intel Core i7-13620H
  (1793 - 1865, n=5)
1823 Points +1%
Gigabyte G5 KF5 2024
Intel Core i7-13620H
1799 Points
Dell Inspiron 16 Plus 7640
Intel Core Ultra 7 155H
1793 Points 0%
Lenovo LOQ 15IRX9
Intel Core i5-13450HX
1696 Points -6%
Gigabyte G5 KF
Intel Core i5-12500H
1618 Points -10%
HWBOT x265 Benchmark v2.2 / 4k Preset
Lenovo Legion Pro 5 16IRX9 G9
Intel Core i7-14700HX
27.4 fps +55%
Media della classe Gaming
  (6.72 - 38.9, n=185, ultimi 2 anni)
23.6 fps +33%
Asus TUF Gaming A15 FA507UV
AMD Ryzen 9 8945H
21.9 fps +24%
Dell Inspiron 16 Plus 7640
Intel Core Ultra 7 155H
19.5 fps +10%
Gigabyte G5 KF5 2024
Intel Core i7-13620H
17.7 fps
Lenovo LOQ 15IRX9
Intel Core i5-13450HX
17.5 fps -1%
Media Intel Core i7-13620H
  (12.9 - 17.7, n=5)
16.2 fps -8%
Gigabyte G5 KF
Intel Core i5-12500H
14.2 fps -20%
LibreOffice / 20 Documents To PDF
Lenovo LOQ 15IRX9
Intel Core i5-13450HX
59.3 s * -15%
Lenovo Legion Pro 5 16IRX9 G9
Intel Core i7-14700HX
52.3 s * -2%
Gigabyte G5 KF5 2024
Intel Core i7-13620H
51.4 s *
Gigabyte G5 KF
Intel Core i5-12500H
50.1 s * +3%
Media della classe Gaming
  (31.4 - 199, n=182, ultimi 2 anni)
48.1 s * +6%
Media Intel Core i7-13620H
  (41.5 - 56.8, n=5)
47.8 s * +7%
Asus TUF Gaming A15 FA507UV
AMD Ryzen 9 8945H
47.5 s * +8%
Dell Inspiron 16 Plus 7640
Intel Core Ultra 7 155H
43.5 s * +15%
R Benchmark 2.5 / Overall mean
Gigabyte G5 KF
Intel Core i5-12500H
0.535 sec * -20%
Lenovo LOQ 15IRX9
Intel Core i5-13450HX
0.4838 sec * -8%
Dell Inspiron 16 Plus 7640
Intel Core Ultra 7 155H
0.4709 sec * -6%
Media Intel Core i7-13620H
  (0.4438 - 0.4509, n=5)
0.4471 sec * -0%
Gigabyte G5 KF5 2024
Intel Core i7-13620H
0.446 sec *
Media della classe Gaming
  (0.3609 - 0.759, n=186, ultimi 2 anni)
0.4366 sec * +2%
Asus TUF Gaming A15 FA507UV
AMD Ryzen 9 8945H
0.4298 sec * +4%
Lenovo Legion Pro 5 16IRX9 G9
Intel Core i7-14700HX
0.4003 sec * +10%

* ... Meglio usare valori piccoli

Cinebench R15 CPU Multi 64Bit
2396 Points
Cinebench R15 OpenGL 64Bit
209 fps
Cinebench R15 Ref. Match 64Bit
99.6 %
Cinebench R15 CPU Single 64Bit
269 Points
Cinebench R20 CPU (Multi Core)
5558 Points
Cinebench R20 CPU (Single Core)
697 Points
Cinebench R23 Single Core
1862 Points
Cinebench R23 Multi Core
14686 Points
Aiuto
Performance Rating
Lenovo Legion Pro 5 16IRX9 G9
Intel Core i7-14700HX, NVIDIA GeForce RTX 4060 Laptop GPU
94.1 pt
Asus TUF Gaming A15 FA507UV
AMD Ryzen 9 8945H, NVIDIA GeForce RTX 4060 Laptop GPU
89 pt
Media della classe Gaming
 
83.1 pt
Dell Inspiron 16 Plus 7640
Intel Core Ultra 7 155H, NVIDIA GeForce RTX 4060 Laptop GPU
58.8 pt
Lenovo LOQ 15IRX9
Intel Core i5-13450HX, NVIDIA GeForce RTX 4060 Laptop GPU
58.2 pt
Gigabyte G5 KF
Intel Core i5-12500H, NVIDIA GeForce RTX 4060 Laptop GPU
52.7 pt
Gigabyte G5 KF5 2024
Intel Core i7-13620H, NVIDIA GeForce RTX 4060 Laptop GPU
49.7 pt
Media Intel Core i7-13620H
 
49.4 pt
AIDA64 / FP32 Ray-Trace
Asus TUF Gaming A15 FA507UV
AMD Ryzen 9 8945H, NVIDIA GeForce RTX 4060 Laptop GPU
28698 KRay/s +125%
Lenovo Legion Pro 5 16IRX9 G9
Intel Core i7-14700HX, NVIDIA GeForce RTX 4060 Laptop GPU
23676 KRay/s +86%
Media della classe Gaming
  (4986 - 60169, n=182, ultimi 2 anni)
21963 KRay/s +72%
Dell Inspiron 16 Plus 7640
Intel Core Ultra 7 155H, NVIDIA GeForce RTX 4060 Laptop GPU
14038 KRay/s +10%
Lenovo LOQ 15IRX9
Intel Core i5-13450HX, NVIDIA GeForce RTX 4060 Laptop GPU
13747 KRay/s +8%
Gigabyte G5 KF5 2024
Intel Core i7-13620H, NVIDIA GeForce RTX 4060 Laptop GPU
12760 KRay/s
Media Intel Core i7-13620H
  (10779 - 13601, n=5)
12202 KRay/s -4%
Gigabyte G5 KF
Intel Core i5-12500H, NVIDIA GeForce RTX 4060 Laptop GPU
11802 KRay/s -8%
AIDA64 / FPU Julia
Asus TUF Gaming A15 FA507UV
AMD Ryzen 9 8945H, NVIDIA GeForce RTX 4060 Laptop GPU
122466 Points +88%
Lenovo Legion Pro 5 16IRX9 G9
Intel Core i7-14700HX, NVIDIA GeForce RTX 4060 Laptop GPU
116556 Points +79%
Media della classe Gaming
  (25360 - 252486, n=182, ultimi 2 anni)
106952 Points +64%
Lenovo LOQ 15IRX9
Intel Core i5-13450HX, NVIDIA GeForce RTX 4060 Laptop GPU
71834 Points +10%
Dell Inspiron 16 Plus 7640
Intel Core Ultra 7 155H, NVIDIA GeForce RTX 4060 Laptop GPU
70839 Points +9%
Gigabyte G5 KF5 2024
Intel Core i7-13620H, NVIDIA GeForce RTX 4060 Laptop GPU
65073 Points
Media Intel Core i7-13620H
  (54287 - 67187, n=5)
62844 Points -3%
Gigabyte G5 KF
Intel Core i5-12500H, NVIDIA GeForce RTX 4060 Laptop GPU
59683 Points -8%
AIDA64 / CPU SHA3
Lenovo Legion Pro 5 16IRX9 G9
Intel Core i7-14700HX, NVIDIA GeForce RTX 4060 Laptop GPU
5567 MB/s +110%
Asus TUF Gaming A15 FA507UV
AMD Ryzen 9 8945H, NVIDIA GeForce RTX 4060 Laptop GPU
5113 MB/s +92%
Media della classe Gaming
  (1339 - 10389, n=182, ultimi 2 anni)
4920 MB/s +85%
Lenovo LOQ 15IRX9
Intel Core i5-13450HX, NVIDIA GeForce RTX 4060 Laptop GPU
3530 MB/s +33%
Dell Inspiron 16 Plus 7640
Intel Core Ultra 7 155H, NVIDIA GeForce RTX 4060 Laptop GPU
3277 MB/s +23%
Gigabyte G5 KF
Intel Core i5-12500H, NVIDIA GeForce RTX 4060 Laptop GPU
2983 MB/s +12%
Gigabyte G5 KF5 2024
Intel Core i7-13620H, NVIDIA GeForce RTX 4060 Laptop GPU
2657 MB/s
Media Intel Core i7-13620H
  (2357 - 2773, n=5)
2605 MB/s -2%
AIDA64 / CPU Queen
Lenovo Legion Pro 5 16IRX9 G9
Intel Core i7-14700HX, NVIDIA GeForce RTX 4060 Laptop GPU
152200 Points +94%
Asus TUF Gaming A15 FA507UV
AMD Ryzen 9 8945H, NVIDIA GeForce RTX 4060 Laptop GPU
125950 Points +60%
Media della classe Gaming
  (50699 - 200651, n=182, ultimi 2 anni)
117347 Points +49%
Dell Inspiron 16 Plus 7640
Intel Core Ultra 7 155H, NVIDIA GeForce RTX 4060 Laptop GPU
87819 Points +12%
Lenovo LOQ 15IRX9
Intel Core i5-13450HX, NVIDIA GeForce RTX 4060 Laptop GPU
86148 Points +10%
Gigabyte G5 KF
Intel Core i5-12500H, NVIDIA GeForce RTX 4060 Laptop GPU
79989 Points +2%
Gigabyte G5 KF5 2024
Intel Core i7-13620H, NVIDIA GeForce RTX 4060 Laptop GPU
78523 Points
Media Intel Core i7-13620H
  (66885 - 78867, n=5)
76259 Points -3%
AIDA64 / FPU SinJulia
Asus TUF Gaming A15 FA507UV
AMD Ryzen 9 8945H, NVIDIA GeForce RTX 4060 Laptop GPU
15856 Points +95%
Lenovo Legion Pro 5 16IRX9 G9
Intel Core i7-14700HX, NVIDIA GeForce RTX 4060 Laptop GPU
14434 Points +78%
Media della classe Gaming
  (4800 - 32988, n=182, ultimi 2 anni)
13290 Points +64%
Dell Inspiron 16 Plus 7640
Intel Core Ultra 7 155H, NVIDIA GeForce RTX 4060 Laptop GPU
9893 Points +22%
Lenovo LOQ 15IRX9
Intel Core i5-13450HX, NVIDIA GeForce RTX 4060 Laptop GPU
9344 Points +15%
Gigabyte G5 KF5 2024
Intel Core i7-13620H, NVIDIA GeForce RTX 4060 Laptop GPU
8124 Points
Media Intel Core i7-13620H
  (6737 - 8421, n=5)
7775 Points -4%
Gigabyte G5 KF
Intel Core i5-12500H, NVIDIA GeForce RTX 4060 Laptop GPU
7322 Points -10%
AIDA64 / FPU Mandel
Asus TUF Gaming A15 FA507UV
AMD Ryzen 9 8945H, NVIDIA GeForce RTX 4060 Laptop GPU
65523 Points +108%
Lenovo Legion Pro 5 16IRX9 G9
Intel Core i7-14700HX, NVIDIA GeForce RTX 4060 Laptop GPU
58380 Points +85%
Media della classe Gaming
  (12321 - 134044, n=182, ultimi 2 anni)
53819 Points +71%
Dell Inspiron 16 Plus 7640
Intel Core Ultra 7 155H, NVIDIA GeForce RTX 4060 Laptop GPU
35006 Points +11%
Lenovo LOQ 15IRX9
Intel Core i5-13450HX, NVIDIA GeForce RTX 4060 Laptop GPU
34956 Points +11%
Gigabyte G5 KF5 2024
Intel Core i7-13620H, NVIDIA GeForce RTX 4060 Laptop GPU
31508 Points
Media Intel Core i7-13620H
  (27242 - 32787, n=5)
30835 Points -2%
Gigabyte G5 KF
Intel Core i5-12500H, NVIDIA GeForce RTX 4060 Laptop GPU
29112 Points -8%
AIDA64 / CPU AES
Lenovo Legion Pro 5 16IRX9 G9
Intel Core i7-14700HX, NVIDIA GeForce RTX 4060 Laptop GPU
113157 MB/s +109%
Media della classe Gaming
  (19065 - 328679, n=182, ultimi 2 anni)
109208 MB/s +102%
Gigabyte G5 KF
Intel Core i5-12500H, NVIDIA GeForce RTX 4060 Laptop GPU
105881 MB/s +96%
Asus TUF Gaming A15 FA507UV
AMD Ryzen 9 8945H, NVIDIA GeForce RTX 4060 Laptop GPU
90481 MB/s +67%
Lenovo LOQ 15IRX9
Intel Core i5-13450HX, NVIDIA GeForce RTX 4060 Laptop GPU
70330 MB/s +30%
Dell Inspiron 16 Plus 7640
Intel Core Ultra 7 155H, NVIDIA GeForce RTX 4060 Laptop GPU
68050 MB/s +26%
Media Intel Core i7-13620H
  (52697 - 85895, n=5)
61535 MB/s +14%
Gigabyte G5 KF5 2024
Intel Core i7-13620H, NVIDIA GeForce RTX 4060 Laptop GPU
54096 MB/s
AIDA64 / CPU ZLib
Lenovo Legion Pro 5 16IRX9 G9
Intel Core i7-14700HX, NVIDIA GeForce RTX 4060 Laptop GPU
1682 MB/s +115%
Media della classe Gaming
  (373 - 2409, n=182, ultimi 2 anni)
1369 MB/s +75%
Asus TUF Gaming A15 FA507UV
AMD Ryzen 9 8945H, NVIDIA GeForce RTX 4060 Laptop GPU
1150 MB/s +47%
Dell Inspiron 16 Plus 7640
Intel Core Ultra 7 155H, NVIDIA GeForce RTX 4060 Laptop GPU
1045 MB/s +34%
Lenovo LOQ 15IRX9
Intel Core i5-13450HX, NVIDIA GeForce RTX 4060 Laptop GPU
1002 MB/s +28%
Gigabyte G5 KF
Intel Core i5-12500H, NVIDIA GeForce RTX 4060 Laptop GPU
864 MB/s +10%
Gigabyte G5 KF5 2024
Intel Core i7-13620H, NVIDIA GeForce RTX 4060 Laptop GPU
782 MB/s
Media Intel Core i7-13620H
  (697 - 835, n=5)
778 MB/s -1%
AIDA64 / FP64 Ray-Trace
Asus TUF Gaming A15 FA507UV
AMD Ryzen 9 8945H, NVIDIA GeForce RTX 4060 Laptop GPU
15513 KRay/s +128%
Lenovo Legion Pro 5 16IRX9 G9
Intel Core i7-14700HX, NVIDIA GeForce RTX 4060 Laptop GPU
12928 KRay/s +90%
Media della classe Gaming
  (2540 - 31796, n=182, ultimi 2 anni)
11830 KRay/s +74%
Lenovo LOQ 15IRX9
Intel Core i5-13450HX, NVIDIA GeForce RTX 4060 Laptop GPU
7428 KRay/s +9%
Dell Inspiron 16 Plus 7640
Intel Core Ultra 7 155H, NVIDIA GeForce RTX 4060 Laptop GPU
7347 KRay/s +8%
Gigabyte G5 KF5 2024
Intel Core i7-13620H, NVIDIA GeForce RTX 4060 Laptop GPU
6800 KRay/s
Media Intel Core i7-13620H
  (6077 - 7364, n=5)
6709 KRay/s -1%
Gigabyte G5 KF
Intel Core i5-12500H, NVIDIA GeForce RTX 4060 Laptop GPU
6169 KRay/s -9%
AIDA64 / CPU PhotoWorxx
Lenovo Legion Pro 5 16IRX9 G9
Intel Core i7-14700HX, NVIDIA GeForce RTX 4060 Laptop GPU
49671 MPixel/s +59%
Media della classe Gaming
  (10805 - 60161, n=183, ultimi 2 anni)
40303 MPixel/s +29%
Dell Inspiron 16 Plus 7640
Intel Core Ultra 7 155H, NVIDIA GeForce RTX 4060 Laptop GPU
39530 MPixel/s +27%
Lenovo LOQ 15IRX9
Intel Core i5-13450HX, NVIDIA GeForce RTX 4060 Laptop GPU
36764 MPixel/s +18%
Asus TUF Gaming A15 FA507UV
AMD Ryzen 9 8945H, NVIDIA GeForce RTX 4060 Laptop GPU
33410 MPixel/s +7%
Media Intel Core i7-13620H
  (22766 - 34544, n=5)
31208 MPixel/s 0%
Gigabyte G5 KF5 2024
Intel Core i7-13620H, NVIDIA GeForce RTX 4060 Laptop GPU
31165 MPixel/s
Gigabyte G5 KF
Intel Core i5-12500H, NVIDIA GeForce RTX 4060 Laptop GPU
27635 MPixel/s -11%

Prestazioni del sistema

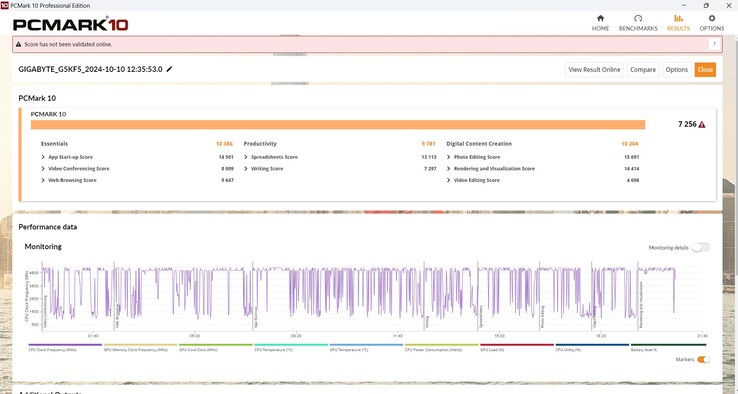
I risultati del G5 in PCMark 10 non sono degni di nota e si colloca a metà classifica. In CrossMark, il nostro Gigabyte si comporta più o meno al livello previsto. Raramente abbiamo notato problemi in modalità Windows, solo durante lo scorrimento del browser si può riscontrare qualche intoppo.

PCMark 10
PCMark 10
PCMark 10 / Score
Lenovo Legion Pro 5 16IRX9 G9
NVIDIA GeForce RTX 4060 Laptop GPU, i7-14700HX, Samsung PM9A1 MZVL21T0HCLR
8278 Points +14%
Asus TUF Gaming A15 FA507UV
NVIDIA GeForce RTX 4060 Laptop GPU, R9 8945H, WD PC SN560 SDDPNQE-1T00
7943 Points +9%
Media della classe Gaming
  (5776 - 9852, n=163, ultimi 2 anni)
7813 Points +8%
Gigabyte G5 KF5 2024
NVIDIA GeForce RTX 4060 Laptop GPU, i7-13620H, Gigabyte AG450E1024-SI
7256 Points
Dell Inspiron 16 Plus 7640
NVIDIA GeForce RTX 4060 Laptop GPU, Ultra 7 155H, SK hynix BC901 HFS001TEJ4X164N
7042 Points -3%
Media Intel Core i7-13620H, NVIDIA GeForce RTX 4060 Laptop GPU
  (6678 - 7256, n=3)
7031 Points -3%
Lenovo LOQ 15IRX9
NVIDIA GeForce RTX 4060 Laptop GPU, i5-13450HX, Micron 2400 MTFDKCD1T0QFM
6929 Points -5%
Gigabyte G5 KF
NVIDIA GeForce RTX 4060 Laptop GPU, i5-12500H, SSSTC CA6-8D512
6318 Points -13%
PCMark 10 / Essentials
Lenovo Legion Pro 5 16IRX9 G9
NVIDIA GeForce RTX 4060 Laptop GPU, i7-14700HX, Samsung PM9A1 MZVL21T0HCLR
11087 Points +7%
Asus TUF Gaming A15 FA507UV
NVIDIA GeForce RTX 4060 Laptop GPU, R9 8945H, WD PC SN560 SDDPNQE-1T00
10873 Points +5%
Media della classe Gaming
  (9057 - 12334, n=162, ultimi 2 anni)
10836 Points +4%
Gigabyte G5 KF5 2024
NVIDIA GeForce RTX 4060 Laptop GPU, i7-13620H, Gigabyte AG450E1024-SI
10386 Points
Media Intel Core i7-13620H, NVIDIA GeForce RTX 4060 Laptop GPU
  (9909 - 10809, n=3)
10368 Points 0%
Gigabyte G5 KF
NVIDIA GeForce RTX 4060 Laptop GPU, i5-12500H, SSSTC CA6-8D512
10328 Points -1%
Dell Inspiron 16 Plus 7640
NVIDIA GeForce RTX 4060 Laptop GPU, Ultra 7 155H, SK hynix BC901 HFS001TEJ4X164N
10279 Points -1%
Lenovo LOQ 15IRX9
NVIDIA GeForce RTX 4060 Laptop GPU, i5-13450HX, Micron 2400 MTFDKCD1T0QFM
9379 Points -10%
PCMark 10 / Productivity
Asus TUF Gaming A15 FA507UV
NVIDIA GeForce RTX 4060 Laptop GPU, R9 8945H, WD PC SN560 SDDPNQE-1T00
10269 Points +5%
Media della classe Gaming
  (6662 - 14612, n=162, ultimi 2 anni)
9909 Points +1%
Lenovo Legion Pro 5 16IRX9 G9
NVIDIA GeForce RTX 4060 Laptop GPU, i7-14700HX, Samsung PM9A1 MZVL21T0HCLR
9823 Points 0%
Gigabyte G5 KF5 2024
NVIDIA GeForce RTX 4060 Laptop GPU, i7-13620H, Gigabyte AG450E1024-SI
9781 Points
Gigabyte G5 KF
NVIDIA GeForce RTX 4060 Laptop GPU, i5-12500H, SSSTC CA6-8D512
9736 Points 0%
Media Intel Core i7-13620H, NVIDIA GeForce RTX 4060 Laptop GPU
  (8642 - 9781, n=3)
9244 Points -5%
Lenovo LOQ 15IRX9
NVIDIA GeForce RTX 4060 Laptop GPU, i5-13450HX, Micron 2400 MTFDKCD1T0QFM
8800 Points -10%
Dell Inspiron 16 Plus 7640
NVIDIA GeForce RTX 4060 Laptop GPU, Ultra 7 155H, SK hynix BC901 HFS001TEJ4X164N
8079 Points -17%
PCMark 10 / Digital Content Creation
Lenovo Legion Pro 5 16IRX9 G9
NVIDIA GeForce RTX 4060 Laptop GPU, i7-14700HX, Samsung PM9A1 MZVL21T0HCLR
14135 Points +39%
Asus TUF Gaming A15 FA507UV
NVIDIA GeForce RTX 4060 Laptop GPU, R9 8945H, WD PC SN560 SDDPNQE-1T00
12182 Points +19%
Media della classe Gaming
  (6807 - 18475, n=162, ultimi 2 anni)
12168 Points +19%
Dell Inspiron 16 Plus 7640
NVIDIA GeForce RTX 4060 Laptop GPU, Ultra 7 155H, SK hynix BC901 HFS001TEJ4X164N
11413 Points +12%
Lenovo LOQ 15IRX9
NVIDIA GeForce RTX 4060 Laptop GPU, i5-13450HX, Micron 2400 MTFDKCD1T0QFM
10937 Points +7%
Gigabyte G5 KF5 2024
NVIDIA GeForce RTX 4060 Laptop GPU, i7-13620H, Gigabyte AG450E1024-SI
10204 Points
Media Intel Core i7-13620H, NVIDIA GeForce RTX 4060 Laptop GPU
  (9437 - 10204, n=3)
9848 Points -3%
Gigabyte G5 KF
NVIDIA GeForce RTX 4060 Laptop GPU, i5-12500H, SSSTC CA6-8D512
6807 Points -33%
CrossMark / Overall
Lenovo Legion Pro 5 16IRX9 G9
NVIDIA GeForce RTX 4060 Laptop GPU, i7-14700HX, Samsung PM9A1 MZVL21T0HCLR
2132 Points +7%
Gigabyte G5 KF5 2024
NVIDIA GeForce RTX 4060 Laptop GPU, i7-13620H, Gigabyte AG450E1024-SI
1986 Points
Media Intel Core i7-13620H, NVIDIA GeForce RTX 4060 Laptop GPU
  (1857 - 1986, n=3)
1929 Points -3%
Media della classe Gaming
  (1247 - 2344, n=144, ultimi 2 anni)
1910 Points -4%
Lenovo LOQ 15IRX9
NVIDIA GeForce RTX 4060 Laptop GPU, i5-13450HX, Micron 2400 MTFDKCD1T0QFM
1804 Points -9%
Asus TUF Gaming A15 FA507UV
NVIDIA GeForce RTX 4060 Laptop GPU, R9 8945H, WD PC SN560 SDDPNQE-1T00
1800 Points -9%
Gigabyte G5 KF
NVIDIA GeForce RTX 4060 Laptop GPU, i5-12500H, SSSTC CA6-8D512
1744 Points -12%
Dell Inspiron 16 Plus 7640
NVIDIA GeForce RTX 4060 Laptop GPU, Ultra 7 155H, SK hynix BC901 HFS001TEJ4X164N
1685 Points -15%
CrossMark / Productivity
Lenovo Legion Pro 5 16IRX9 G9
NVIDIA GeForce RTX 4060 Laptop GPU, i7-14700HX, Samsung PM9A1 MZVL21T0HCLR
1973 Points +3%
Gigabyte G5 KF5 2024
NVIDIA GeForce RTX 4060 Laptop GPU, i7-13620H, Gigabyte AG450E1024-SI
1908 Points
Media Intel Core i7-13620H, NVIDIA GeForce RTX 4060 Laptop GPU
  (1765 - 1908, n=3)
1847 Points -3%
Media della classe Gaming
  (1299 - 2204, n=144, ultimi 2 anni)
1809 Points -5%
Asus TUF Gaming A15 FA507UV
NVIDIA GeForce RTX 4060 Laptop GPU, R9 8945H, WD PC SN560 SDDPNQE-1T00
1761 Points -8%
Lenovo LOQ 15IRX9
NVIDIA GeForce RTX 4060 Laptop GPU, i5-13450HX, Micron 2400 MTFDKCD1T0QFM
1728 Points -9%
Gigabyte G5 KF
NVIDIA GeForce RTX 4060 Laptop GPU, i5-12500H, SSSTC CA6-8D512
1708 Points -10%
Dell Inspiron 16 Plus 7640
NVIDIA GeForce RTX 4060 Laptop GPU, Ultra 7 155H, SK hynix BC901 HFS001TEJ4X164N
1592 Points -17%
CrossMark / Creativity
Lenovo Legion Pro 5 16IRX9 G9
NVIDIA GeForce RTX 4060 Laptop GPU, i7-14700HX, Samsung PM9A1 MZVL21T0HCLR
2399 Points +16%
Media della classe Gaming
  (1275 - 2660, n=144, ultimi 2 anni)
2099 Points +2%
Gigabyte G5 KF5 2024
NVIDIA GeForce RTX 4060 Laptop GPU, i7-13620H, Gigabyte AG450E1024-SI
2067 Points
Media Intel Core i7-13620H, NVIDIA GeForce RTX 4060 Laptop GPU
  (2013 - 2067, n=3)
2042 Points -1%
Dell Inspiron 16 Plus 7640
NVIDIA GeForce RTX 4060 Laptop GPU, Ultra 7 155H, SK hynix BC901 HFS001TEJ4X164N
1929 Points -7%
Asus TUF Gaming A15 FA507UV
NVIDIA GeForce RTX 4060 Laptop GPU, R9 8945H, WD PC SN560 SDDPNQE-1T00
1918 Points -7%
Lenovo LOQ 15IRX9
NVIDIA GeForce RTX 4060 Laptop GPU, i5-13450HX, Micron 2400 MTFDKCD1T0QFM
1904 Points -8%
Gigabyte G5 KF
NVIDIA GeForce RTX 4060 Laptop GPU, i5-12500H, SSSTC CA6-8D512
1760 Points -15%
CrossMark / Responsiveness
Gigabyte G5 KF5 2024
NVIDIA GeForce RTX 4060 Laptop GPU, i7-13620H, Gigabyte AG450E1024-SI
1989 Points
Lenovo Legion Pro 5 16IRX9 G9
NVIDIA GeForce RTX 4060 Laptop GPU, i7-14700HX, Samsung PM9A1 MZVL21T0HCLR
1885 Points -5%
Media Intel Core i7-13620H, NVIDIA GeForce RTX 4060 Laptop GPU
  (1734 - 1989, n=3)
1866 Points -6%
Gigabyte G5 KF
NVIDIA GeForce RTX 4060 Laptop GPU, i5-12500H, SSSTC CA6-8D512
1804 Points -9%
Lenovo LOQ 15IRX9
NVIDIA GeForce RTX 4060 Laptop GPU, i5-13450HX, Micron 2400 MTFDKCD1T0QFM
1748 Points -12%
Media della classe Gaming
  (1030 - 2330, n=144, ultimi 2 anni)
1707 Points -14%
Asus TUF Gaming A15 FA507UV
NVIDIA GeForce RTX 4060 Laptop GPU, R9 8945H, WD PC SN560 SDDPNQE-1T00
1593 Points -20%
Dell Inspiron 16 Plus 7640
NVIDIA GeForce RTX 4060 Laptop GPU, Ultra 7 155H, SK hynix BC901 HFS001TEJ4X164N
1333 Points -33%
WebXPRT 3 / Overall
Media Intel Core i7-13620H, NVIDIA GeForce RTX 4060 Laptop GPU
  (292 - 319, n=3)
310 Points
Asus TUF Gaming A15 FA507UV
NVIDIA GeForce RTX 4060 Laptop GPU, R9 8945H, WD PC SN560 SDDPNQE-1T00
308 Points
Media della classe Gaming
  (215 - 480, n=160, ultimi 2 anni)
304 Points
Lenovo Legion Pro 5 16IRX9 G9
NVIDIA GeForce RTX 4060 Laptop GPU, i7-14700HX, Samsung PM9A1 MZVL21T0HCLR
301 Points
Dell Inspiron 16 Plus 7640
NVIDIA GeForce RTX 4060 Laptop GPU, Ultra 7 155H, SK hynix BC901 HFS001TEJ4X164N
290 Points
Lenovo LOQ 15IRX9
NVIDIA GeForce RTX 4060 Laptop GPU, i5-13450HX, Micron 2400 MTFDKCD1T0QFM
262 Points
Gigabyte G5 KF
NVIDIA GeForce RTX 4060 Laptop GPU, i5-12500H, SSSTC CA6-8D512
246 Points
WebXPRT 4 / Overall
Lenovo Legion Pro 5 16IRX9 G9
NVIDIA GeForce RTX 4060 Laptop GPU, i7-14700HX, Samsung PM9A1 MZVL21T0HCLR
273 Points
Media Intel Core i7-13620H, NVIDIA GeForce RTX 4060 Laptop GPU
  ()
270 Points
Media della classe Gaming
  (176.4 - 328, n=149, ultimi 2 anni)
268 Points
Asus TUF Gaming A15 FA507UV
NVIDIA GeForce RTX 4060 Laptop GPU, R9 8945H, WD PC SN560 SDDPNQE-1T00
263 Points
Dell Inspiron 16 Plus 7640
NVIDIA GeForce RTX 4060 Laptop GPU, Ultra 7 155H, SK hynix BC901 HFS001TEJ4X164N
257 Points
Lenovo LOQ 15IRX9
NVIDIA GeForce RTX 4060 Laptop GPU, i5-13450HX, Micron 2400 MTFDKCD1T0QFM
243 Points
Mozilla Kraken 1.1 / Total
Gigabyte G5 KF
NVIDIA GeForce RTX 4060 Laptop GPU, i5-12500H, SSSTC CA6-8D512
562 ms * -10%
Gigabyte G5 KF
NVIDIA GeForce RTX 4060 Laptop GPU, i5-12500H, SSSTC CA6-8D512
562 ms * -10%
Lenovo LOQ 15IRX9
NVIDIA GeForce RTX 4060 Laptop GPU, i5-13450HX, Micron 2400 MTFDKCD1T0QFM
550 ms * -7%
Dell Inspiron 16 Plus 7640
NVIDIA GeForce RTX 4060 Laptop GPU, Ultra 7 155H, SK hynix BC901 HFS001TEJ4X164N
519 ms * -1%
Gigabyte G5 KF5 2024
NVIDIA GeForce RTX 4060 Laptop GPU, i7-13620H, Gigabyte AG450E1024-SI
513 ms *
Media Intel Core i7-13620H, NVIDIA GeForce RTX 4060 Laptop GPU
  (508 - 516, n=4)
511 ms * -0%
Asus TUF Gaming A15 FA507UV
NVIDIA GeForce RTX 4060 Laptop GPU, R9 8945H, WD PC SN560 SDDPNQE-1T00
505 ms * +2%
Media della classe Gaming
  (421 - 674, n=175, ultimi 2 anni)
502 ms * +2%
Lenovo Legion Pro 5 16IRX9 G9
NVIDIA GeForce RTX 4060 Laptop GPU, i7-14700HX, Samsung PM9A1 MZVL21T0HCLR
467 ms * +9%

* ... Meglio usare valori piccoli

PCMark 10 Score
7256 punti
Aiuto
AIDA64 / Memory Copy
Lenovo Legion Pro 5 16IRX9 G9
Intel Core i7-14700HX, NVIDIA GeForce RTX 4060 Laptop GPU
78742 MB/s +53%
Media della classe Gaming
  (21842 - 94222, n=182, ultimi 2 anni)
65546 MB/s +28%
Dell Inspiron 16 Plus 7640
Intel Core Ultra 7 155H, NVIDIA GeForce RTX 4060 Laptop GPU
63520 MB/s +24%
Asus TUF Gaming A15 FA507UV
AMD Ryzen 9 8945H, NVIDIA GeForce RTX 4060 Laptop GPU
61823 MB/s +20%
Lenovo LOQ 15IRX9
Intel Core i5-13450HX, NVIDIA GeForce RTX 4060 Laptop GPU
58673 MB/s +14%
Gigabyte G5 KF5 2024
Intel Core i7-13620H, NVIDIA GeForce RTX 4060 Laptop GPU
51393 MB/s
Media Intel Core i7-13620H
  (38066 - 53927, n=5)
50052 MB/s -3%
Gigabyte G5 KF
Intel Core i5-12500H, NVIDIA GeForce RTX 4060 Laptop GPU
43470 MB/s -15%
AIDA64 / Memory Read
Lenovo Legion Pro 5 16IRX9 G9
Intel Core i7-14700HX, NVIDIA GeForce RTX 4060 Laptop GPU
86175 MB/s +47%
Dell Inspiron 16 Plus 7640
Intel Core Ultra 7 155H, NVIDIA GeForce RTX 4060 Laptop GPU
77153 MB/s +31%
Media della classe Gaming
  (23681 - 99713, n=182, ultimi 2 anni)
69486 MB/s +18%
Lenovo LOQ 15IRX9
Intel Core i5-13450HX, NVIDIA GeForce RTX 4060 Laptop GPU
68109 MB/s +16%
Asus TUF Gaming A15 FA507UV
AMD Ryzen 9 8945H, NVIDIA GeForce RTX 4060 Laptop GPU
61696 MB/s +5%
Gigabyte G5 KF5 2024
Intel Core i7-13620H, NVIDIA GeForce RTX 4060 Laptop GPU
58755 MB/s
Media Intel Core i7-13620H
  (40342 - 61853, n=5)
56860 MB/s -3%
Gigabyte G5 KF
Intel Core i5-12500H, NVIDIA GeForce RTX 4060 Laptop GPU
47117 MB/s -20%
AIDA64 / Memory Write
Asus TUF Gaming A15 FA507UV
AMD Ryzen 9 8945H, NVIDIA GeForce RTX 4060 Laptop GPU
78716 MB/s +54%
Lenovo Legion Pro 5 16IRX9 G9
Intel Core i7-14700HX, NVIDIA GeForce RTX 4060 Laptop GPU
76689 MB/s +50%
Media della classe Gaming
  (22986 - 108954, n=182, ultimi 2 anni)
67309 MB/s +31%
Dell Inspiron 16 Plus 7640
Intel Core Ultra 7 155H, NVIDIA GeForce RTX 4060 Laptop GPU
65616 MB/s +28%
Lenovo LOQ 15IRX9
Intel Core i5-13450HX, NVIDIA GeForce RTX 4060 Laptop GPU
59981 MB/s +17%
Gigabyte G5 KF5 2024
Intel Core i7-13620H, NVIDIA GeForce RTX 4060 Laptop GPU
51235 MB/s
Media Intel Core i7-13620H
  (38595 - 54111, n=5)
49719 MB/s -3%
Gigabyte G5 KF
Intel Core i5-12500H, NVIDIA GeForce RTX 4060 Laptop GPU
46588 MB/s -9%
AIDA64 / Memory Latency
Dell Inspiron 16 Plus 7640
Intel Core Ultra 7 155H, NVIDIA GeForce RTX 4060 Laptop GPU
120.2 ns * -14%
Gigabyte G5 KF5 2024
Intel Core i7-13620H, NVIDIA GeForce RTX 4060 Laptop GPU
105.6 ns *
Media Intel Core i7-13620H
  (75.9 - 108.2, n=5)
99.8 ns * +5%
Lenovo LOQ 15IRX9
Intel Core i5-13450HX, NVIDIA GeForce RTX 4060 Laptop GPU
94.2 ns * +11%
Media della classe Gaming
  (59.5 - 259, n=182, ultimi 2 anni)
93.8 ns * +11%
Asus TUF Gaming A15 FA507UV
AMD Ryzen 9 8945H, NVIDIA GeForce RTX 4060 Laptop GPU
92.6 ns * +12%
Gigabyte G5 KF
Intel Core i5-12500H, NVIDIA GeForce RTX 4060 Laptop GPU
83.8 ns * +21%
Lenovo Legion Pro 5 16IRX9 G9
Intel Core i7-14700HX, NVIDIA GeForce RTX 4060 Laptop GPU
82.7 ns * +22%

* ... Meglio usare valori piccoli

Latenze DPC

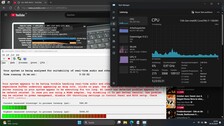
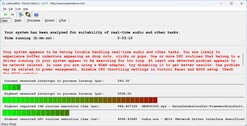
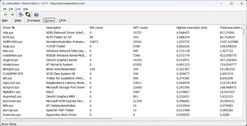
Anche quando si sposta il puntatore del mouse dopo aver avviato LatencyMon, vengono rilevate latenze più elevate, che aumentano ad ogni nuova azione (aprire il browser, aprire più schede, riprodurre un video). Il nostro video di YouTube presenta anche due fotogrammi caduti. Nel complesso, i valori di latenza sono chiaramente troppo alti, anche in confronto. Si nota anche il carico estremamente elevato dell'iGPU, pari all'89% durante la riproduzione del video di YouTube.

YouTube
YouTube
LatencyMon Principale
Driver LatencyMon
Driver LatencyMon
DPC Latencies / LatencyMon - interrupt to process latency (max), Web, Youtube, Prime95
Gigabyte G5 KF5 2024
NVIDIA GeForce RTX 4060 Laptop GPU, i7-13620H, Gigabyte AG450E1024-SI
5596.5 μs *
Gigabyte G5 KF
NVIDIA GeForce RTX 4060 Laptop GPU, i5-12500H, SSSTC CA6-8D512
1905 μs * +66%
Lenovo LOQ 15IRX9
NVIDIA GeForce RTX 4060 Laptop GPU, i5-13450HX, Micron 2400 MTFDKCD1T0QFM
1689.3 μs * +70%
Lenovo Legion Pro 5 16IRX9 G9
NVIDIA GeForce RTX 4060 Laptop GPU, i7-14700HX, Samsung PM9A1 MZVL21T0HCLR
951.7 μs * +83%
Asus TUF Gaming A15 FA507UV
NVIDIA GeForce RTX 4060 Laptop GPU, R9 8945H, WD PC SN560 SDDPNQE-1T00
790.8 μs * +86%
Dell Inspiron 16 Plus 7640
NVIDIA GeForce RTX 4060 Laptop GPU, Ultra 7 155H, SK hynix BC901 HFS001TEJ4X164N
770.1 μs * +86%

* ... Meglio usare valori piccoli

Memoria di massa

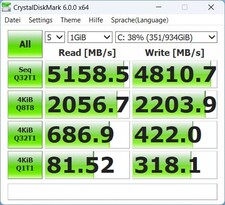
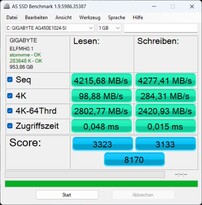
Il produttore utilizza un SSD NVMe con 1 TB di memoria del proprio marchio Gigabyte nel nostro campione di prova. Offre velocità di trasferimento sequenziale da 4.000 a 5.000 MB/s. Ciò significa che di solito è anche leggermente più veloce dei concorrenti qui elencati.

Tuttavia, non riesce a mantenere queste prestazioni a causa del throttling termico nel nostro test di resistenza dopo il 16° passaggio DiskSpd. Dopo di che, le prestazioni fluttuano notevolmente e si riducono drasticamente di continuo.

Crystaldiskmark 6
Crystaldiskmark 6
AS SSD
AS SSD
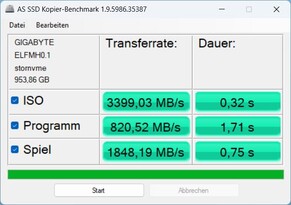
Copia AS SSD
Copia AS SSD
Gigabyte AG450E1024-SI
CDM 5/6 Read Seq Q32T1: 5159 MB/s
CDM 5/6 Write Seq Q32T1: 4811 MB/s
CDM 5/6 Read 4K Q32T1: 687 MB/s
CDM 5/6 Write 4K Q32T1: 422 MB/s
CDM 5/6 Read 4K: 81.5 MB/s
CDM 5/6 Write 4K: 318 MB/s
CDM 6 Write 4K Q8T8: 2204 MB/s
CDM 6 Read 4K Q8T8: 2057 MB/s
Drive Performance Rating - Percent
Gigabyte G5 KF5 2024
Gigabyte AG450E1024-SI
90.1 pt
Media Gigabyte AG450E1024-SI
 
86.6 pt
Lenovo Legion Pro 5 16IRX9 G9
Samsung PM9A1 MZVL21T0HCLR
86.4 pt
Gigabyte G5 KF
SSSTC CA6-8D512
86.3 pt
Media della classe Gaming
 
77.3 pt
Lenovo LOQ 15IRX9
Micron 2400 MTFDKCD1T0QFM
68.8 pt
Asus TUF Gaming A15 FA507UV
WD PC SN560 SDDPNQE-1T00
63.7 pt
Dell Inspiron 16 Plus 7640
SK hynix BC901 HFS001TEJ4X164N
44.7 pt
DiskSpd
seq read
Gigabyte G5 KF
SSSTC CA6-8D512
4094 (1992.5min - 4093.83max) MB/s +37%
Lenovo Legion Pro 5 16IRX9 G9
Samsung PM9A1 MZVL21T0HCLR
3497 (3441.46min - 3497.42max) MB/s +17%
Media della classe Gaming
  (1319 - 7045, n=164, ultimi 2 anni)
3477 MB/s +17%
Gigabyte G5 KF5 2024
Gigabyte AG450E1024-SI
2981 (2922.38min - 2980.98max) MB/s
Asus TUF Gaming A15 FA507UV
WD PC SN560 SDDPNQE-1T00
2943 (2931.61min - 2942.92max) MB/s -1%
Media Gigabyte AG450E1024-SI
  (2366 - 2981, n=3)
2656 MB/s -11%
Lenovo LOQ 15IRX9
Micron 2400 MTFDKCD1T0QFM
2364 (2348.18min - 2364.12max) MB/s -21%
Dell Inspiron 16 Plus 7640
SK hynix BC901 HFS001TEJ4X164N
2253 (2222.1min - 2252.66max) MB/s -24%
seq write
Gigabyte G5 KF5 2024
Gigabyte AG450E1024-SI
4772 (4589.99min - 4772.17max) MB/s
Media Gigabyte AG450E1024-SI
  (4659 - 4772, n=3)
4729 MB/s -1%
Gigabyte G5 KF
SSSTC CA6-8D512
3870 (2222.52min - 3870.29max) MB/s -19%
Media della classe Gaming
  (535 - 9307, n=164, ultimi 2 anni)
3818 MB/s -20%
Lenovo Legion Pro 5 16IRX9 G9
Samsung PM9A1 MZVL21T0HCLR
3403 (3360.48min - 3402.53max) MB/s -29%
Asus TUF Gaming A15 FA507UV
WD PC SN560 SDDPNQE-1T00
3126 (3069.81min - 3126.43max) MB/s -34%
Lenovo LOQ 15IRX9
Micron 2400 MTFDKCD1T0QFM
3103 (3061.84min - 3102.82max) MB/s -35%
Dell Inspiron 16 Plus 7640
SK hynix BC901 HFS001TEJ4X164N
2368 (2226.29min - 2367.89max) MB/s -50%
seq q8 t1 read
Gigabyte G5 KF
SSSTC CA6-8D512
6922 (6017.7min - 6922.07max) MB/s +41%
Lenovo Legion Pro 5 16IRX9 G9
Samsung PM9A1 MZVL21T0HCLR
6599 (5813.31min - 6598.9max) MB/s +35%
Media della classe Gaming
  (2594 - 16089, n=164, ultimi 2 anni)
6318 MB/s +29%
Media Gigabyte AG450E1024-SI
  (4897 - 5181, n=3)
5077 MB/s +4%
Gigabyte G5 KF5 2024
Gigabyte AG450E1024-SI
4897 (4033.03min - 4896.79max) MB/s
Asus TUF Gaming A15 FA507UV
WD PC SN560 SDDPNQE-1T00
4869 (4298.53min - 4868.87max) MB/s -1%
Lenovo LOQ 15IRX9
Micron 2400 MTFDKCD1T0QFM
4611 (4173.71min - 4610.79max) MB/s -6%
Dell Inspiron 16 Plus 7640
SK hynix BC901 HFS001TEJ4X164N
3290 (2756.65min - 3289.51max) MB/s -33%
seq q8 t1 write
Lenovo Legion Pro 5 16IRX9 G9
Samsung PM9A1 MZVL21T0HCLR
4934 (4925.79min - 4933.55max) MB/s +2%
Media della classe Gaming
  (539 - 14571, n=164, ultimi 2 anni)
4859 MB/s +1%
Gigabyte G5 KF5 2024
Gigabyte AG450E1024-SI
4817 (4142.4min - 4817.36max) MB/s
Media Gigabyte AG450E1024-SI
  (4775 - 4821, n=3)
4804 MB/s 0%
Dell Inspiron 16 Plus 7640
SK hynix BC901 HFS001TEJ4X164N
4053 (3806.69min - 4053.03max) MB/s -16%
Gigabyte G5 KF
SSSTC CA6-8D512
3975 (1794.3min - 3974.73max) MB/s -17%
Lenovo LOQ 15IRX9
Micron 2400 MTFDKCD1T0QFM
3612 (3558.24min - 3612.04max) MB/s -25%
Asus TUF Gaming A15 FA507UV
WD PC SN560 SDDPNQE-1T00
3140 (3055.76min - 3139.87max) MB/s -35%
4k q1 t1 read
Gigabyte G5 KF
SSSTC CA6-8D512
81.7 MB/s 0%
Gigabyte G5 KF5 2024
Gigabyte AG450E1024-SI
81.5 (80.26min - 81.51max) MB/s
Lenovo Legion Pro 5 16IRX9 G9
Samsung PM9A1 MZVL21T0HCLR
80.5 (78.06min - 80.5max) MB/s -1%
Media della classe Gaming
  (30.6 - 95.9, n=164, ultimi 2 anni)
65.9 MB/s -19%
Asus TUF Gaming A15 FA507UV
WD PC SN560 SDDPNQE-1T00
62.9 (61.89min - 62.92max) MB/s -23%
Media Gigabyte AG450E1024-SI
  (47.2 - 81.5, n=3)
61.6 MB/s -24%
Lenovo LOQ 15IRX9
Micron 2400 MTFDKCD1T0QFM
54.4 (52.28min - 54.35max) MB/s -33%
Dell Inspiron 16 Plus 7640
SK hynix BC901 HFS001TEJ4X164N
44.5 (43.13min - 44.5max) MB/s -45%
4k q1 t1 write
Gigabyte G5 KF5 2024
Gigabyte AG450E1024-SI
330 (328.21min - 330.19max) MB/s
Media Gigabyte AG450E1024-SI
  (298 - 340, n=3)
323 MB/s -2%
Gigabyte G5 KF
SSSTC CA6-8D512
296 (231.06min - 296.08max) MB/s -10%
Lenovo LOQ 15IRX9
Micron 2400 MTFDKCD1T0QFM
266 (259.13min - 265.64max) MB/s -19%
Lenovo Legion Pro 5 16IRX9 G9
Samsung PM9A1 MZVL21T0HCLR
251 (246.36min - 251.38max) MB/s -24%
Asus TUF Gaming A15 FA507UV
WD PC SN560 SDDPNQE-1T00
229 (227.99min - 229max) MB/s -31%
Media della classe Gaming
  (78 - 397, n=164, ultimi 2 anni)
223 MB/s -32%
Dell Inspiron 16 Plus 7640
SK hynix BC901 HFS001TEJ4X164N
123 (117.55min - 122.97max) MB/s -63%
4k q32 t16 read
Lenovo Legion Pro 5 16IRX9 G9
Samsung PM9A1 MZVL21T0HCLR
4117 (4077.22min - 4117.27max) MB/s +18%
Gigabyte G5 KF5 2024
Gigabyte AG450E1024-SI
3485 (3458.58min - 3485.22max) MB/s
Media Gigabyte AG450E1024-SI
  (3293 - 3485, n=3)
3360 MB/s -4%
Gigabyte G5 KF
SSSTC CA6-8D512
3181 (1310.9min - 3180.87max) MB/s -9%
Lenovo LOQ 15IRX9
Micron 2400 MTFDKCD1T0QFM
2852 (1702.21min - 2851.88max) MB/s -18%
Media della classe Gaming
  (417 - 6172, n=164, ultimi 2 anni)
2565 MB/s -26%
Asus TUF Gaming A15 FA507UV
WD PC SN560 SDDPNQE-1T00
1544 (1272.83min - 1543.53max) MB/s -56%
Dell Inspiron 16 Plus 7640
SK hynix BC901 HFS001TEJ4X164N
575 (568.91min - 575.1max) MB/s -84%
4k q32 t16 write
Lenovo Legion Pro 5 16IRX9 G9
Samsung PM9A1 MZVL21T0HCLR
3534 (3522.28min - 3534.26max) MB/s +11%
Media Gigabyte AG450E1024-SI
  (3074 - 3443, n=3)
3237 MB/s +1%
Gigabyte G5 KF5 2024
Gigabyte AG450E1024-SI
3195 (3175.09min - 3194.61max) MB/s
Lenovo LOQ 15IRX9
Micron 2400 MTFDKCD1T0QFM
2535 (2457.97min - 2535.38max) MB/s -21%
Gigabyte G5 KF
SSSTC CA6-8D512
2147 (1232.2min - 2146.52max) MB/s -33%
Media della classe Gaming
  (162.3 - 4869, n=164, ultimi 2 anni)
2128 MB/s -33%
Asus TUF Gaming A15 FA507UV
WD PC SN560 SDDPNQE-1T00
2038 (1836.85min - 2038.27max) MB/s -36%
Dell Inspiron 16 Plus 7640
SK hynix BC901 HFS001TEJ4X164N
394 (375.37min - 394.14max) MB/s -88%
AS SSD
Score Total
Media Gigabyte AG450E1024-SI
  (7807 - 8778, n=3)
8252 Points +1%
Gigabyte G5 KF5 2024
Gigabyte AG450E1024-SI
8170 Points
Lenovo Legion Pro 5 16IRX9 G9
Samsung PM9A1 MZVL21T0HCLR
7769 Points -5%
Gigabyte G5 KF
SSSTC CA6-8D512
7237 Points -11%
Media della classe Gaming
  (2271 - 13854, n=155, ultimi 2 anni)
6733 Points -18%
Lenovo LOQ 15IRX9
Micron 2400 MTFDKCD1T0QFM
5947 Points -27%
Asus TUF Gaming A15 FA507UV
WD PC SN560 SDDPNQE-1T00
5043 Points -38%
Dell Inspiron 16 Plus 7640
SK hynix BC901 HFS001TEJ4X164N
4307 Points -47%
Score Read
Gigabyte G5 KF5 2024
Gigabyte AG450E1024-SI
3323 Points
Media Gigabyte AG450E1024-SI
  (3051 - 3323, n=3)
3175 Points -4%
Gigabyte G5 KF
SSSTC CA6-8D512
3127 Points -6%
Lenovo Legion Pro 5 16IRX9 G9
Samsung PM9A1 MZVL21T0HCLR
2963 Points -11%
Media della classe Gaming
  (776 - 4721, n=155, ultimi 2 anni)
2440 Points -27%
Lenovo LOQ 15IRX9
Micron 2400 MTFDKCD1T0QFM
2363 Points -29%
Asus TUF Gaming A15 FA507UV
WD PC SN560 SDDPNQE-1T00
1749 Points -47%
Dell Inspiron 16 Plus 7640
SK hynix BC901 HFS001TEJ4X164N
1260 Points -62%
Score Write
Media Gigabyte AG450E1024-SI
  (3133 - 4006, n=3)
3443 Points +10%
Lenovo Legion Pro 5 16IRX9 G9
Samsung PM9A1 MZVL21T0HCLR
3262 Points +4%
Gigabyte G5 KF5 2024
Gigabyte AG450E1024-SI
3133 Points
Media della classe Gaming
  (515 - 7208, n=155, ultimi 2 anni)
3109 Points -1%
Gigabyte G5 KF
SSSTC CA6-8D512
2608 Points -17%
Dell Inspiron 16 Plus 7640
SK hynix BC901 HFS001TEJ4X164N
2482 Points -21%
Asus TUF Gaming A15 FA507UV
WD PC SN560 SDDPNQE-1T00
2449 Points -22%
Lenovo LOQ 15IRX9
Micron 2400 MTFDKCD1T0QFM
2414 Points -23%
Seq Read
Gigabyte G5 KF
SSSTC CA6-8D512
5712.7 MB/s +36%
Media della classe Gaming
  (2260 - 12763, n=155, ultimi 2 anni)
4948 MB/s +17%
Asus TUF Gaming A15 FA507UV
WD PC SN560 SDDPNQE-1T00
4260.13 MB/s +1%
Gigabyte G5 KF5 2024
Gigabyte AG450E1024-SI
4215 MB/s
Media Gigabyte AG450E1024-SI
  (4161 - 4215, n=3)
4196 MB/s 0%
Dell Inspiron 16 Plus 7640
SK hynix BC901 HFS001TEJ4X164N
4056.14 MB/s -4%
Lenovo LOQ 15IRX9
Micron 2400 MTFDKCD1T0QFM
3796.49 MB/s -10%
Lenovo Legion Pro 5 16IRX9 G9
Samsung PM9A1 MZVL21T0HCLR
3027 MB/s -28%
Seq Write
Media Gigabyte AG450E1024-SI
  (4234 - 4432, n=3)
4314 MB/s +1%
Gigabyte G5 KF5 2024
Gigabyte AG450E1024-SI
4277 MB/s
Media della classe Gaming
  (495 - 11316, n=155, ultimi 2 anni)
3759 MB/s -12%
Gigabyte G5 KF
SSSTC CA6-8D512
3701.25 MB/s -13%
Lenovo Legion Pro 5 16IRX9 G9
Samsung PM9A1 MZVL21T0HCLR
3510 MB/s -18%
Asus TUF Gaming A15 FA507UV
WD PC SN560 SDDPNQE-1T00
3100.95 MB/s -27%
Lenovo LOQ 15IRX9
Micron 2400 MTFDKCD1T0QFM
3051.23 MB/s -29%
Dell Inspiron 16 Plus 7640
SK hynix BC901 HFS001TEJ4X164N
2267 MB/s -47%
4K Read
Gigabyte G5 KF5 2024
Gigabyte AG450E1024-SI
98.9 MB/s
Media Gigabyte AG450E1024-SI
  (61.9 - 98.9, n=3)
79.7 MB/s -19%
Gigabyte G5 KF
SSSTC CA6-8D512
79.16 MB/s -20%
Lenovo Legion Pro 5 16IRX9 G9
Samsung PM9A1 MZVL21T0HCLR
75.4 MB/s -24%
Media della classe Gaming
  (27.8 - 112.1, n=155, ultimi 2 anni)
65 MB/s -34%
Asus TUF Gaming A15 FA507UV
WD PC SN560 SDDPNQE-1T00
56.75 MB/s -43%
Lenovo LOQ 15IRX9
Micron 2400 MTFDKCD1T0QFM
53.84 MB/s -46%
Dell Inspiron 16 Plus 7640
SK hynix BC901 HFS001TEJ4X164N
49.59 MB/s -50%
4K Write
Gigabyte G5 KF5 2024
Gigabyte AG450E1024-SI
284 MB/s
Gigabyte G5 KF
SSSTC CA6-8D512
282.28 MB/s -1%
Media Gigabyte AG450E1024-SI
  (255 - 284, n=3)
274 MB/s -4%
Lenovo LOQ 15IRX9
Micron 2400 MTFDKCD1T0QFM
226.41 MB/s -20%
Lenovo Legion Pro 5 16IRX9 G9
Samsung PM9A1 MZVL21T0HCLR
217 MB/s -24%
Media della classe Gaming
  (108.8 - 512, n=155, ultimi 2 anni)
212 MB/s -25%
Asus TUF Gaming A15 FA507UV
WD PC SN560 SDDPNQE-1T00
187.56 MB/s -34%
Dell Inspiron 16 Plus 7640
SK hynix BC901 HFS001TEJ4X164N
164.61 MB/s -42%
4K-64 Read
Gigabyte G5 KF5 2024
Gigabyte AG450E1024-SI
2803 MB/s
Media Gigabyte AG450E1024-SI
  (2551 - 2803, n=3)
2676 MB/s -5%
Lenovo Legion Pro 5 16IRX9 G9
Samsung PM9A1 MZVL21T0HCLR
2585 MB/s -8%
Gigabyte G5 KF
SSSTC CA6-8D512
2476.84 MB/s -12%
Lenovo LOQ 15IRX9
Micron 2400 MTFDKCD1T0QFM
1929.3 MB/s -31%
Media della classe Gaming
  (451 - 3475, n=155, ultimi 2 anni)
1874 MB/s -33%
Asus TUF Gaming A15 FA507UV
WD PC SN560 SDDPNQE-1T00
1266.17 MB/s -55%
Dell Inspiron 16 Plus 7640
SK hynix BC901 HFS001TEJ4X164N
804.71 MB/s -71%
4K-64 Write
Media Gigabyte AG450E1024-SI
  (2421 - 3279, n=3)
2738 MB/s +13%
Lenovo Legion Pro 5 16IRX9 G9
Samsung PM9A1 MZVL21T0HCLR
2694 MB/s +11%
Media della classe Gaming
  (277 - 5909, n=155, ultimi 2 anni)
2524 MB/s +4%
Gigabyte G5 KF5 2024
Gigabyte AG450E1024-SI
2421 MB/s
Dell Inspiron 16 Plus 7640
SK hynix BC901 HFS001TEJ4X164N
2090.45 MB/s -14%
Gigabyte G5 KF
SSSTC CA6-8D512
1955.15 MB/s -19%
Asus TUF Gaming A15 FA507UV
WD PC SN560 SDDPNQE-1T00
1951.29 MB/s -19%
Lenovo LOQ 15IRX9
Micron 2400 MTFDKCD1T0QFM
1882 MB/s -22%
Access Time Read
Dell Inspiron 16 Plus 7640
SK hynix BC901 HFS001TEJ4X164N
0.093 ms * -94%
Media Gigabyte AG450E1024-SI
  (0.048 - 0.088, n=3)
0.06767 ms * -41%
Asus TUF Gaming A15 FA507UV
WD PC SN560 SDDPNQE-1T00
0.063 ms * -31%
Media della classe Gaming
  (0.016 - 0.379, n=154, ultimi 2 anni)
0.05551 ms * -16%
Gigabyte G5 KF5 2024
Gigabyte AG450E1024-SI
0.048 ms *
Lenovo LOQ 15IRX9
Micron 2400 MTFDKCD1T0QFM
0.033 ms * +31%
Lenovo Legion Pro 5 16IRX9 G9
Samsung PM9A1 MZVL21T0HCLR
0.032 ms * +33%
Gigabyte G5 KF
SSSTC CA6-8D512
0.025 ms * +48%
Access Time Write
Dell Inspiron 16 Plus 7640
SK hynix BC901 HFS001TEJ4X164N
0.318 ms * -2020%
Lenovo LOQ 15IRX9
Micron 2400 MTFDKCD1T0QFM
0.097 ms * -547%
Media della classe Gaming
  (0.011 - 1.028, n=155, ultimi 2 anni)
0.04751 ms * -217%
Lenovo Legion Pro 5 16IRX9 G9
Samsung PM9A1 MZVL21T0HCLR
0.02 ms * -33%
Asus TUF Gaming A15 FA507UV
WD PC SN560 SDDPNQE-1T00
0.02 ms * -33%
Gigabyte G5 KF
SSSTC CA6-8D512
0.017 ms * -13%
Gigabyte G5 KF5 2024
Gigabyte AG450E1024-SI
0.015 ms *
Media Gigabyte AG450E1024-SI
  (0.015 - 0.015, n=3)
0.015 ms * -0%

* ... Meglio usare valori piccoli

Continuous read: DiskSpd Read Loop, Queue Depth 8

033567010051340167520102345268030153350368540204355469050255360569560306365Tooltip
Gigabyte G5 KF5 2024 Gigabyte AG450E1024-SI; diskspd 2.0.17 f: Ø3808 (1282.15-5176.82)
Lenovo LOQ 15IRX9 Micron 2400 MTFDKCD1T0QFM; diskspd 2.0.17 f: Ø3364 (2261.87-4608.28)
Asus TUF Gaming A15 FA507UV WD PC SN560 SDDPNQE-1T00; diskspd 2.0.17 f: Ø4300 (3774.46-4795.98)
Lenovo Legion Pro 5 16IRX9 G9 Samsung PM9A1 MZVL21T0HCLR; diskspd 2.0.17 f: Ø4251 (3284.07-6624.06)

Grafica

La RTX 4060 è consentito un TGP massimo di 75 W nel G5, che è un valore piuttosto medio. Probabilmente è anche per questo che il G5 delude nei benchmark 3D sintetici. Solo nel test Cloud Gate, che non è più supportato, raggiunge un valore inaspettatamente buono. Gli altri risultati rispecchiano maggiormente il suo predecessore e sono peggiori di circa il 6% rispetto alla media dei laptop con RTX 4060 del nostro database. Ad eccezione del Dell Inspiron 16 Plus 7640 tutti i concorrenti sono più veloci, soprattutto Legion 5 Pro, almeno se si esclude il test Cloud Gate.

Il quadro è simile nei giochi: Il G5 si comporta ancora bene nei titoli pesanti per la CPU, ma non riesce a tenere il passo con la concorrenza nei giochi ad alta intensità di GPU. Inoltre, a differenza della maggior parte degli altri computer portatili, il nostro test di resistenza di Cyberpunk 2077 mostra un calo continuo della frequenza dei fotogrammi nel tempo. Questo comportamento instabile indica un sistema di raffreddamento sovraccarico e anche il throttling dell'SSD ne è un'indicazione, come si vedrà più avanti. Nonostante le prestazioni relativamente deboli, è possibile giocare a quasi tutti i giochi in Full HD con dettagli medi o massimi con la RTX 4060 nel G5.

In modalità batteria, un intero 73% delle prestazioni 3D si perde in un'altra esecuzione di Fire Strike.

3DMark 11
3DMark 11
Cloud Gate
Cloud Gate
Fire Strike
Fire Strike
Time Spy
Time Spy
3DMark Performance Rating - Percent
Media della classe Gaming
 
96.2 pt
Lenovo Legion Pro 5 16IRX9 G9
NVIDIA GeForce RTX 4060 Laptop GPU, Intel Core i7-14700HX
83.7 pt
Asus TUF Gaming A15 FA507UV -1!
NVIDIA GeForce RTX 4060 Laptop GPU, AMD Ryzen 9 8945H
83.2 pt
Gigabyte G5 KF5 2024
NVIDIA GeForce RTX 4060 Laptop GPU, Intel Core i7-13620H
81.5 pt
Media NVIDIA GeForce RTX 4060 Laptop GPU
 
81.2 pt
Lenovo LOQ 15IRX9 -1!
NVIDIA GeForce RTX 4060 Laptop GPU, Intel Core i5-13450HX
80.6 pt
Gigabyte G5 KF
NVIDIA GeForce RTX 4060 Laptop GPU, Intel Core i5-12500H
78.1 pt
Dell Inspiron 16 Plus 7640 -1!
NVIDIA GeForce RTX 4060 Laptop GPU, Intel Core Ultra 7 155H
67.5 pt
3DMark 11 - 1280x720 Performance GPU
Media della classe Gaming
  (1029 - 72178, n=182, ultimi 2 anni)
43891 Points +33%
Lenovo Legion Pro 5 16IRX9 G9
NVIDIA GeForce RTX 4060 Laptop GPU, Intel Core i7-14700HX
36945 Points +12%
Asus TUF Gaming A15 FA507UV
NVIDIA GeForce RTX 4060 Laptop GPU, AMD Ryzen 9 8945H
36493 Points +11%
Lenovo LOQ 15IRX9
NVIDIA GeForce RTX 4060 Laptop GPU, Intel Core i5-13450HX
35608 Points +8%
Media NVIDIA GeForce RTX 4060 Laptop GPU
  (28136 - 38912, n=56)
34832 Points +6%
Gigabyte G5 KF
NVIDIA GeForce RTX 4060 Laptop GPU, Intel Core i5-12500H
33490 Points +2%
Gigabyte G5 KF5 2024
NVIDIA GeForce RTX 4060 Laptop GPU, Intel Core i7-13620H
32903 Points
Dell Inspiron 16 Plus 7640
NVIDIA GeForce RTX 4060 Laptop GPU, Intel Core Ultra 7 155H
30097 Points -9%
3DMark
1280x720 Cloud Gate Standard Graphics
Gigabyte G5 KF5 2024
NVIDIA GeForce RTX 4060 Laptop GPU, Intel Core i7-13620H
170179 Points
Media NVIDIA GeForce RTX 4060 Laptop GPU
  (81407 - 180228, n=28)
149832 Points -12%
Gigabyte G5 KF
NVIDIA GeForce RTX 4060 Laptop GPU, Intel Core i5-12500H
148762 Points -13%
Media della classe Gaming
  (15902 - 193851, n=100, ultimi 2 anni)
144470 Points -15%
Lenovo Legion Pro 5 16IRX9 G9
NVIDIA GeForce RTX 4060 Laptop GPU, Intel Core i7-14700HX
138926 Points -18%
1920x1080 Fire Strike Graphics
Media della classe Gaming
  (781 - 53059, n=193, ultimi 2 anni)
31461 Points +23%
Asus TUF Gaming A15 FA507UV
NVIDIA GeForce RTX 4060 Laptop GPU, AMD Ryzen 9 8945H
28015 Points +10%
Lenovo Legion Pro 5 16IRX9 G9
NVIDIA GeForce RTX 4060 Laptop GPU, Intel Core i7-14700HX
27046 Points +6%
Lenovo LOQ 15IRX9
NVIDIA GeForce RTX 4060 Laptop GPU, Intel Core i5-13450HX
27026 Points +6%
Media NVIDIA GeForce RTX 4060 Laptop GPU
  (20533 - 29656, n=53)
25748 Points +1%
Gigabyte G5 KF5 2024
NVIDIA GeForce RTX 4060 Laptop GPU, Intel Core i7-13620H
25556 Points
Gigabyte G5 KF
NVIDIA GeForce RTX 4060 Laptop GPU, Intel Core i5-12500H
24789 Points -3%
Dell Inspiron 16 Plus 7640
NVIDIA GeForce RTX 4060 Laptop GPU, Intel Core Ultra 7 155H
22476 Points -12%
2560x1440 Time Spy Graphics
Media della classe Gaming
  (224 - 22717, n=188, ultimi 2 anni)
13142 Points +43%
Lenovo Legion Pro 5 16IRX9 G9
NVIDIA GeForce RTX 4060 Laptop GPU, Intel Core i7-14700HX
10919 Points +19%
Asus TUF Gaming A15 FA507UV
NVIDIA GeForce RTX 4060 Laptop GPU, AMD Ryzen 9 8945H
10189 Points +11%
Media NVIDIA GeForce RTX 4060 Laptop GPU
  (7484 - 11451, n=55)
9936 Points +8%
Lenovo LOQ 15IRX9
NVIDIA GeForce RTX 4060 Laptop GPU, Intel Core i5-13450HX
9830 Points +7%
Gigabyte G5 KF
NVIDIA GeForce RTX 4060 Laptop GPU, Intel Core i5-12500H
9199 Points 0%
Gigabyte G5 KF5 2024
NVIDIA GeForce RTX 4060 Laptop GPU, Intel Core i7-13620H
9183 Points
Dell Inspiron 16 Plus 7640
NVIDIA GeForce RTX 4060 Laptop GPU, Intel Core Ultra 7 155H
8229 Points -10%
3DMark 11 Performance
29001 punti
3DMark Cloud Gate Standard Score
58918 punti
3DMark Fire Strike Score
20767 punti
3DMark Time Spy Score
9497 punti
Aiuto
Blender
v3.3 Classroom OPTIX/RTX
Lenovo LOQ 15IRX9
NVIDIA GeForce RTX 4060 Laptop GPU, Intel Core i5-13450HX
25 Seconds * -0%
Gigabyte G5 KF5 2024
NVIDIA GeForce RTX 4060 Laptop GPU, Intel Core i7-13620H
25 Seconds *
Gigabyte G5 KF
NVIDIA GeForce RTX 4060 Laptop GPU, Intel Core i5-12500H
24 Seconds * +4%
Dell Inspiron 16 Plus 7640
NVIDIA GeForce RTX 4060 Laptop GPU, Intel Core Ultra 7 155H
24 Seconds * +4%
Media NVIDIA GeForce RTX 4060 Laptop GPU
  (19 - 28, n=52)
23 Seconds * +8%
Lenovo Legion Pro 5 16IRX9 G9
NVIDIA GeForce RTX 4060 Laptop GPU, Intel Core i7-14700HX
21 Seconds * +16%
Asus TUF Gaming A15 FA507UV
NVIDIA GeForce RTX 4060 Laptop GPU, AMD Ryzen 9 8945H
21 Seconds * +16%
Media della classe Gaming
  (9 - 95, n=178, ultimi 2 anni)
20.8 Seconds * +17%
v3.3 Classroom CUDA
Dell Inspiron 16 Plus 7640
NVIDIA GeForce RTX 4060 Laptop GPU, Intel Core Ultra 7 155H
44 Seconds * -2%
Lenovo LOQ 15IRX9
NVIDIA GeForce RTX 4060 Laptop GPU, Intel Core i5-13450HX
44 Seconds * -2%
Media NVIDIA GeForce RTX 4060 Laptop GPU
  (39 - 53, n=52)
43.2 Seconds * -0%
Gigabyte G5 KF5 2024
NVIDIA GeForce RTX 4060 Laptop GPU, Intel Core i7-13620H
43 Seconds *
Gigabyte G5 KF
NVIDIA GeForce RTX 4060 Laptop GPU, Intel Core i5-12500H
42 Seconds * +2%
Lenovo Legion Pro 5 16IRX9 G9
NVIDIA GeForce RTX 4060 Laptop GPU, Intel Core i7-14700HX
41 Seconds * +5%
Asus TUF Gaming A15 FA507UV
NVIDIA GeForce RTX 4060 Laptop GPU, AMD Ryzen 9 8945H
41 Seconds * +5%
Media della classe Gaming
  (16 - 175, n=184, ultimi 2 anni)
36.9 Seconds * +14%
v3.3 Classroom CPU
Gigabyte G5 KF
NVIDIA GeForce RTX 4060 Laptop GPU, Intel Core i5-12500H
452 Seconds * -20%
Lenovo LOQ 15IRX9
NVIDIA GeForce RTX 4060 Laptop GPU, Intel Core i5-13450HX
397 Seconds * -5%
Gigabyte G5 KF5 2024
NVIDIA GeForce RTX 4060 Laptop GPU, Intel Core i7-13620H
378 Seconds *
Dell Inspiron 16 Plus 7640
NVIDIA GeForce RTX 4060 Laptop GPU, Intel Core Ultra 7 155H
365 Seconds * +3%
Media NVIDIA GeForce RTX 4060 Laptop GPU
  (189 - 452, n=52)
311 Seconds * +18%
Asus TUF Gaming A15 FA507UV
NVIDIA GeForce RTX 4060 Laptop GPU, AMD Ryzen 9 8945H
293 Seconds * +22%
Media della classe Gaming
  (138 - 962, n=187, ultimi 2 anni)
293 Seconds * +22%
Lenovo Legion Pro 5 16IRX9 G9
NVIDIA GeForce RTX 4060 Laptop GPU, Intel Core i7-14700HX
228 Seconds * +40%

* ... Meglio usare valori piccoli

Performance Rating - Percent
Media della classe Gaming
 
92.3 pt
Lenovo Legion Pro 5 16IRX9 G9
Intel Core i7-14700HX, NVIDIA GeForce RTX 4060 Laptop GPU
90 pt
Asus TUF Gaming A15 FA507UV
AMD Ryzen 9 8945H, NVIDIA GeForce RTX 4060 Laptop GPU
80.8 pt
Lenovo LOQ 15IRX9 -1!
Intel Core i5-13450HX, NVIDIA GeForce RTX 4060 Laptop GPU
79.6 pt
Gigabyte G5 KF5 2024
Intel Core i7-13620H, NVIDIA GeForce RTX 4060 Laptop GPU
79.1 pt
Gigabyte G5 KF
Intel Core i5-12500H, NVIDIA GeForce RTX 4060 Laptop GPU
74.4 pt
Dell Inspiron 16 Plus 7640 -1!
Intel Core Ultra 7 155H, NVIDIA GeForce RTX 4060 Laptop GPU
68.9 pt
Baldur's Gate 3 - 1920x1080 Ultra Preset
Media della classe Gaming
  (34.5 - 208, n=45, ultimi 2 anni)
103.5 fps +23%
Asus TUF Gaming A15 FA507UV
AMD Ryzen 9 8945H, NVIDIA GeForce RTX 4060 Laptop GPU
93.9 (67.7min, 75.2P0.1, 79P1) fps +12%
Gigabyte G5 KF5 2024
Intel Core i7-13620H, NVIDIA GeForce RTX 4060 Laptop GPU
84 fps
Dell Inspiron 16 Plus 7640
Intel Core Ultra 7 155H, NVIDIA GeForce RTX 4060 Laptop GPU
76.7 fps -9%
Gigabyte G5 KF
Intel Core i5-12500H, NVIDIA GeForce RTX 4060 Laptop GPU
75.1 (28.1min, 36.6P0.1, 54.5P1) fps -11%
Lenovo Legion Pro 5 16IRX9 G9
Intel Core i7-14700HX, NVIDIA GeForce RTX 4060 Laptop GPU
66.5 fps -21%
GTA V - 1920x1080 Highest Settings possible AA:4xMSAA + FX AF:16x
Lenovo Legion Pro 5 16IRX9 G9
Intel Core i7-14700HX, NVIDIA GeForce RTX 4060 Laptop GPU
124.9 (3.49min, 76.9P1) fps +22%
Media della classe Gaming
  (12.1 - 167.7, n=169, ultimi 2 anni)
113.8 fps +11%
Lenovo LOQ 15IRX9
Intel Core i5-13450HX, NVIDIA GeForce RTX 4060 Laptop GPU
112.6 (5.45min, 76.9P1) fps +10%
Gigabyte G5 KF
Intel Core i5-12500H, NVIDIA GeForce RTX 4060 Laptop GPU
107.6 (4.17min, 66.7P1) fps +5%
Asus TUF Gaming A15 FA507UV
AMD Ryzen 9 8945H, NVIDIA GeForce RTX 4060 Laptop GPU
107.2 (4.45min, 76.9P1) fps +5%
Gigabyte G5 KF5 2024
Intel Core i7-13620H, NVIDIA GeForce RTX 4060 Laptop GPU
102.4 (8.53min, 71.4P1) fps
Final Fantasy XV Benchmark - 1920x1080 High Quality
Media della classe Gaming
  (19.2 - 201, n=181, ultimi 2 anni)
120.1 fps +29%
Lenovo Legion Pro 5 16IRX9 G9
Intel Core i7-14700HX, NVIDIA GeForce RTX 4060 Laptop GPU
106.1 fps +14%
Asus TUF Gaming A15 FA507UV
AMD Ryzen 9 8945H, NVIDIA GeForce RTX 4060 Laptop GPU
100.7 fps +8%
Lenovo LOQ 15IRX9
Intel Core i5-13450HX, NVIDIA GeForce RTX 4060 Laptop GPU
99.9 fps +7%
Gigabyte G5 KF5 2024
Intel Core i7-13620H, NVIDIA GeForce RTX 4060 Laptop GPU
93.2 fps
Gigabyte G5 KF
Intel Core i5-12500H, NVIDIA GeForce RTX 4060 Laptop GPU
91.9 fps -1%
Dell Inspiron 16 Plus 7640
Intel Core Ultra 7 155H, NVIDIA GeForce RTX 4060 Laptop GPU
78.8 fps -15%
Strange Brigade - 1920x1080 ultra AA:ultra AF:16
Media della classe Gaming
  (38.9 - 421, n=178, ultimi 2 anni)
229 fps +34%
Lenovo Legion Pro 5 16IRX9 G9
Intel Core i7-14700HX, NVIDIA GeForce RTX 4060 Laptop GPU
199.9 (40.2min, 143.4P1) fps +17%
Asus TUF Gaming A15 FA507UV
AMD Ryzen 9 8945H, NVIDIA GeForce RTX 4060 Laptop GPU
184.2 (41min, 136.6P1) fps +8%
Lenovo LOQ 15IRX9
Intel Core i5-13450HX, NVIDIA GeForce RTX 4060 Laptop GPU
182.7 (43.5min, 133.1P1) fps +7%
Gigabyte G5 KF
Intel Core i5-12500H, NVIDIA GeForce RTX 4060 Laptop GPU
172.1 (71.6min, 126.4P1) fps +1%
Gigabyte G5 KF5 2024
Intel Core i7-13620H, NVIDIA GeForce RTX 4060 Laptop GPU
170.8 (53.4min, 126.3P1) fps
Dell Inspiron 16 Plus 7640
Intel Core Ultra 7 155H, NVIDIA GeForce RTX 4060 Laptop GPU
153.5 (48min, 114.7P1) fps -10%
Dota 2 Reborn - 1920x1080 ultra (3/3) best looking
Lenovo Legion Pro 5 16IRX9 G9
Intel Core i7-14700HX, NVIDIA GeForce RTX 4060 Laptop GPU
183.8 (158.1min) fps +19%
Gigabyte G5 KF5 2024
Intel Core i7-13620H, NVIDIA GeForce RTX 4060 Laptop GPU
154.5 (133.1min) fps
Media della classe Gaming
  (65.1 - 220, n=186, ultimi 2 anni)
151.2 fps -2%
Lenovo LOQ 15IRX9
Intel Core i5-13450HX, NVIDIA GeForce RTX 4060 Laptop GPU
141 (122.7min) fps -9%
Asus TUF Gaming A15 FA507UV
AMD Ryzen 9 8945H, NVIDIA GeForce RTX 4060 Laptop GPU
139.5 (122.4min) fps -10%
Dell Inspiron 16 Plus 7640
Intel Core Ultra 7 155H, NVIDIA GeForce RTX 4060 Laptop GPU
135.1 (116.3min) fps -13%
Gigabyte G5 KF
Intel Core i5-12500H, NVIDIA GeForce RTX 4060 Laptop GPU
131.2 (115min) fps -15%
X-Plane 11.11 - 1920x1080 high (fps_test=3)
Lenovo Legion Pro 5 16IRX9 G9
Intel Core i7-14700HX, NVIDIA GeForce RTX 4060 Laptop GPU
135.1 fps +32%
Media della classe Gaming
  (32.8 - 166.2, n=193, ultimi 2 anni)
108.5 fps +6%
Gigabyte G5 KF5 2024
Intel Core i7-13620H, NVIDIA GeForce RTX 4060 Laptop GPU
102 fps
Lenovo LOQ 15IRX9
Intel Core i5-13450HX, NVIDIA GeForce RTX 4060 Laptop GPU
92.2 fps -10%
Asus TUF Gaming A15 FA507UV
AMD Ryzen 9 8945H, NVIDIA GeForce RTX 4060 Laptop GPU
91.7 fps -10%
Gigabyte G5 KF
Intel Core i5-12500H, NVIDIA GeForce RTX 4060 Laptop GPU
87.1 fps -15%
Dell Inspiron 16 Plus 7640
Intel Core Ultra 7 155H, NVIDIA GeForce RTX 4060 Laptop GPU
86.5 fps -15%

Cyberpunk 2077 ultra FPS chart

05101520253035404550556065Tooltip
Gigabyte G5 KF5 2024 i7-13620H, NVIDIA GeForce RTX 4060 Laptop GPU: Ø57.1 (51.9-62.1)
Lenovo LOQ 15IRX9 i5-13450HX, NVIDIA GeForce RTX 4060 Laptop GPU: Ø65.1 (61.4-65.8)
Asus TUF Gaming A15 FA507UV R9 8945H, NVIDIA GeForce RTX 4060 Laptop GPU: Ø66.8 (63.8-67.8)
Lenovo Legion Pro 5 16IRX9 G9 i7-14700HX, NVIDIA GeForce RTX 4060 Laptop GPU: Ø68.5 (65-69.4)
bassomedioaltoultra
GTA V (2015) 186.4 181.2 170.6 102.4
Dota 2 Reborn (2015) 188.7 172.3 164.9 154.5
Final Fantasy XV Benchmark (2018) 187.2 129.6 93.2
X-Plane 11.11 (2018) 159.3 131.1 102
Strange Brigade (2018) 441 253 192.3 170.8
Baldur's Gate 3 (2023) 125 98 86 84
Cyberpunk 2077 2.1 Phantom Liberty (2023) 114 91 77.2 68.2

Emissioni ed energia - Sistema di raffreddamento sovraccarico

Emissioni di rumore

In modalità prestazioni, le ventole sono spesso attive e il rumore è di circa 27,87 dB. Nel nostro test 3dMark06, le ventole rimangono a lungo a questo livello, ma poi aumentano fino alla velocità massima di 54,82 dB poco prima della fine, che abbiamo misurato anche in Cyberpoint 2077 o nel nostro stress test. Anche il predecessore era così rumoroso, la concorrenza diretta rimane un po' più silenziosa, il Legion Pro 5 raggiunge almeno livelli di rumorosità simili, ma si comporta anche meglio del nostro G5.

Inoltre, un forte rumore di clic sotto carichi 3D pesanti è inquietante nel nostro modello di prova. Sembra che qualcosa all'interno urti periodicamente (circa 2 - 3 Hz) contro l'involucro, il che non fa una buona impressione. Se solleviamo il portatile e cambiamo la sua posizione nella mano, il rumore cambia e può anche scomparire completamente. Se lo mettiamo di nuovo a terra, il rumore di solito si ripresenta. Per quanto riguarda la parte di manutenzione, abbiamo aperto l'involucro solo dopo questi risultati, ma non siamo riusciti a scoprire alcuna parte allentata.

Rumorosità

Idle
23 / 23 / 27.87 dB(A)
Sotto carico
54.82 / 54.82 dB(A)
  red to green bar
 
 
30 dB
silenzioso
40 dB(A)
udibile
50 dB(A)
rumoroso
 
min: dark, med: mid, max: light   Earthworks M23R, Arta (15 cm di distanza)   Rumorosità ambientale: 23 dB(A)
dB(A) 0102030405060708090Deep BassMiddle BassHigh BassLower RangeMidsHigher MidsLower HighsMid HighsUpper HighsSuper Highs2032.534.832.52525.525.325.53128.926.528.94024.620.824.65025.423.225.46326.828.226.88024.118.524.110023.822.223.812522.114.822.116025.713.925.720027.121.227.12503014.83031533.811.333.840034.69.834.650035.49.935.463036.510.336.580037.710.237.7100043.110.243.1125043.610.243.6160045.910.545.920004511.245250045.31245.3315043.611.643.6400043.812.243.8500042.912.642.9630041.112.441.1800036.712.436.71000033.912.733.9125003112.5311600025.911.725.9SPL54.823.954.8N9.30.59.3median 36.5median 12median 36.5Delta7.61.87.641.636.235.645.641.438.637.929.637.136.147.848.141.344.245.134.232.428.231.132.830.429.730.130.928.340.529.725.326.237.628.920.619.818.52931.422.320.41929.432.822.824.717.329.129.526.126.219.128.831.82422.520.730.532.122.722.116.430.730.921.722.21431.935.425.825.412.834.53731.235.812.538.636.425.527.7123837.325.426.311.738.538.924.926.911.940.438.221.923.912.14038.221.323.312.240.436.420.121.412.438.835.718.620.313.13836.117.818.313.138.33416.716.113.336.431.614.814.913.134.530.114.813.913.233.625.116.113.913.628.721.515.413.513.225.317.714.813.112.721.515.113.612.312.117.847.734.136.425.149.76.11.92.20.76.9median 32.8median 21.7median 22.1median 13.1median 34.55.44.45.21.85hearing rangehide median Fan NoiseGigabyte G5 KF5 2024Lenovo LOQ 15IRX9
Gigabyte G5 KF5 2024
NVIDIA GeForce RTX 4060 Laptop GPU, i7-13620H, Gigabyte AG450E1024-SI
Gigabyte G5 KF
NVIDIA GeForce RTX 4060 Laptop GPU, i5-12500H, SSSTC CA6-8D512
Lenovo LOQ 15IRX9
NVIDIA GeForce RTX 4060 Laptop GPU, i5-13450HX, Micron 2400 MTFDKCD1T0QFM
Asus TUF Gaming A15 FA507UV
NVIDIA GeForce RTX 4060 Laptop GPU, R9 8945H, WD PC SN560 SDDPNQE-1T00
Lenovo Legion Pro 5 16IRX9 G9
NVIDIA GeForce RTX 4060 Laptop GPU, i7-14700HX, Samsung PM9A1 MZVL21T0HCLR
Dell Inspiron 16 Plus 7640
NVIDIA GeForce RTX 4060 Laptop GPU, Ultra 7 155H, SK hynix BC901 HFS001TEJ4X164N
Noise
7%
-9%
1%
5%
9%
off /ambiente *
23
23
-0%
25
-9%
25
-9%
23
-0%
23.8
-3%
Idle Minimum *
23
23
-0%
26
-13%
25
-9%
23
-0%
24.2
-5%
Idle Average *
23
23
-0%
34
-48%
27
-17%
23
-0%
24.2
-5%
Idle Maximum *
27.87
28
-0%
36
-29%
33
-18%
25
10%
24.2
13%
Load Average *
54.82
29.94
45%
48
12%
40
27%
45.18
18%
28.9
47%
Cyberpunk 2077 ultra *
54.82
48
12%
45
18%
52.69
4%
Load Maximum *
54.82
55.5
-1%
50
9%
46
16%
53.13
3%
51
7%
Witcher 3 ultra *
55.05
51

* ... Meglio usare valori piccoli

Temperatura

Nonostante le ventole piuttosto rumorose sotto sforzo, le temperature superficiali non sono affatto basse. Abbiamo misurato un punto caldo fino a 67 °C sul lato inferiore, al centro verso il display. Questo è un po' troppo per i nostri gusti. Purtroppo, Gigabyte non è riuscita a ottimizzare il predecessore, altrettanto caldo.

La temperatura della GPU sale a 88 °C sia nei test di stress che in quelli di gioco. La temperatura della CPU è ancora peggiore: mentre è già tra 76 e 82 °C nel test di stress, sale continuamente fino a 100 °C nel gioco e non scende ulteriormente. Questo è tutt'altro che ideale per la durata dell'hardware! Allo stesso tempo, questo spiega il continuo calo di fps in Cyberpunk 2077 mostrato sopra.

La temperatura della CPU sale a 100 °C durante il gioco!
Carico massimo
 45 °C50 °C39 °C 
 41 °C41 °C32 °C 
 25 °C33 °C27 °C 
Massima: 50 °C
Media: 37 °C
44 °C66 °C53 °C
31 °C39 °C28 °C
29 °C24 °C23 °C
Massima: 66 °C
Media: 37.4 °C
Alimentazione (max)  56 °C | Temperatura della stanza 18.5 °C | Fluke t3000FC (calibrated), Fluke 62 Mini
(±) La temperatura media del lato superiore sotto carico massimo e' di 37 °C / 99 F, rispetto alla media di 33.9 °C / 93 F per i dispositivi di questa classe Gaming.
(-) La temperatura massima sul lato superiore è di 50 °C / 122 F, rispetto alla media di 40.5 °C / 105 F, che varia da 21.2 a 68.8 °C per questa classe Gaming.
(-) Il lato inferiore si riscalda fino ad un massimo di 66 °C / 151 F, rispetto alla media di 43.2 °C / 110 F
(+) In idle, la temperatura media del lato superiore è di 27.9 °C / 82 F, rispetto alla media deld ispositivo di 33.9 °C / 93 F.
(±) 3: The average temperature for the upper side is 36.8 °C / 98 F, compared to the average of 33.9 °C / 93 F for the class Gaming.
(+) I poggiapolsi e il touchpad raggiungono la temperatura massima della pelle (33 °C / 91.4 F) e quindi non sono caldi.
(-) La temperatura media della zona del palmo della mano di dispositivi simili e'stata di 28.9 °C / 84 F (-4.1 °C / -7.4 F).
Gigabyte G5 KF5 2024
Intel Core i7-13620H, NVIDIA GeForce RTX 4060 Laptop GPU
Gigabyte G5 KF
Intel Core i5-12500H, NVIDIA GeForce RTX 4060 Laptop GPU
Lenovo LOQ 15IRX9
Intel Core i5-13450HX, NVIDIA GeForce RTX 4060 Laptop GPU
Asus TUF Gaming A15 FA507UV
AMD Ryzen 9 8945H, NVIDIA GeForce RTX 4060 Laptop GPU
Lenovo Legion Pro 5 16IRX9 G9
Intel Core i7-14700HX, NVIDIA GeForce RTX 4060 Laptop GPU
Dell Inspiron 16 Plus 7640
Intel Core Ultra 7 155H, NVIDIA GeForce RTX 4060 Laptop GPU
Heat
-1%
5%
8%
-1%
15%
Maximum Upper Side *
50
54
-8%
47
6%
53
-6%
50
-0%
43.4
13%
Maximum Bottom *
66
61
8%
58
12%
46
30%
57
14%
41.6
37%
Idle Upper Side *
32
34
-6%
32
-0%
32
-0%
36
-13%
32.8
-3%
Idle Bottom *
37
36
3%
36
3%
34
8%
39
-5%
32.4
12%

* ... Meglio usare valori piccoli

Altoparlante

I due altoparlanti stereo si trovano ai lati verso la parte anteriore e irradiano verso il basso. Non sono particolarmente rumorosi e mancano di molti bassi, anche se gli alti sono lineari. Si consiglia di collegare le cuffie al jack audio quando si gioca.

dB(A) 0102030405060708090Deep BassMiddle BassHigh BassLower RangeMidsHigher MidsLower HighsMid HighsUpper HighsSuper Highs2027.634.827.62524.225.324.23125.826.525.84021.620.821.65022.723.222.76324.628.224.68017.418.517.410020.422.220.412519.114.819.116018.313.918.320028.721.228.725037.714.837.731547.111.347.1400539.85350057.29.957.263058.210.358.280068.610.268.610007110.271125059.410.259.4160070.510.570.520007311.273250071.21271.2315066.611.666.6400067.212.267.2500063.312.663.3630059.312.459.3800059.512.459.51000054.712.754.7125004812.5481600047.511.747.5SPL79.823.979.8N41.10.541.1median 58.2median 12median 58.2Delta12.91.812.945.63937.135.844.251.331.134.430.931.326.234.518.529.2193617.343.719.147.920.75216.458.31458.412.861.712.566.61267.811.767.311.966.912.163.712.263.712.464.913.16413.16013.358.513.166.313.271.813.677.113.272.712.768.812.167.425.180.70.747.7median 13.1median 641.85.3hearing rangehide median Pink NoiseGigabyte G5 KF5 2024Lenovo LOQ 15IRX9
Diagramma frequenza (le caselle possono essere selezionate/deselezionate per confrontare i dispositivi)
Gigabyte G5 KF5 2024 analisi audio

(±) | potenza degli altiparlanti media ma buona (79.8 dB)
Bassi 100 - 315 Hz
(-) | quasi nessun basso - in media 29.6% inferiori alla media
(±) | la linearità dei bassi è media (12.3% delta rispetto alla precedente frequenza)
Medi 400 - 2000 Hz
(±) | medi elevati - circa 7.2% superiore alla media
(±) | linearità dei medi adeguata (13.3% delta rispetto alla precedente frequenza)
Alti 2 - 16 kHz
(±) | alti elevati - circa 5.9% superiori alla media
(+) | alti lineari (6.1% delta rispetto alla precedente frequenza)
Nel complesso 100 - 16.000 Hz
(±) | la linearità complessiva del suono è media (29.1% di differenza rispetto alla media
Rispetto alla stessa classe
» 94% di tutti i dispositivi testati in questa classe è stato migliore, 2% simile, 4% peggiore
» Il migliore ha avuto un delta di 6%, medio di 18%, peggiore di 132%
Rispetto a tutti i dispositivi testati
» 85% di tutti i dispositivi testati in questa classe è stato migliore, 3% similare, 12% peggiore
» Il migliore ha avuto un delta di 4%, medio di 25%, peggiore di 134%

Lenovo LOQ 15IRX9 analisi audio

(±) | potenza degli altiparlanti media ma buona (81 dB)
Bassi 100 - 315 Hz
(±) | bassi ridotti - in media 14.6% inferiori alla media
(±) | la linearità dei bassi è media (9.6% delta rispetto alla precedente frequenza)
Medi 400 - 2000 Hz
(+) | medi bilanciati - solo only 2.1% rispetto alla media
(+) | medi lineari (3.6% delta rispetto alla precedente frequenza)
Alti 2 - 16 kHz
(±) | alti elevati - circa 5.9% superiori alla media
(±) | la linearità degli alti è media (8.2% delta rispetto alla precedente frequenza)
Nel complesso 100 - 16.000 Hz
(+) | suono nel complesso lineare (14.7% differenza dalla media)
Rispetto alla stessa classe
» 27% di tutti i dispositivi testati in questa classe è stato migliore, 7% simile, 66% peggiore
» Il migliore ha avuto un delta di 6%, medio di 18%, peggiore di 132%
Rispetto a tutti i dispositivi testati
» 17% di tutti i dispositivi testati in questa classe è stato migliore, 4% similare, 79% peggiore
» Il migliore ha avuto un delta di 4%, medio di 25%, peggiore di 134%

Consumo di energia

In modalità risparmio energetico, il consumo in idle è di soli 5,2 W. Negli altri profili di prestazioni, tuttavia, il consumo balza a circa 20 W.

Nel gioco (Cyberpunk 2077), abbiamo misurato un consumo medio di 144 W. Nel test di stress si registrano fino a 165 W per brevi periodi. Il piccolo alimentatore (circa 13,6 x 6,7 x 2,3 cm (L x L x A)) è progettato per 150 W e dovrebbe essere in grado di far fronte a tutti i consumi medi misurati e di assorbire i brevi picchi. Tuttavia, non rimane molto spazio per la ricarica durante le sessioni di gioco più impegnative.

Consumo di corrente
Off / Standbydarklight 0.1 / 1 Watt
Idledarkmidlight 5.2 / 19.6 / 23 Watt
Sotto carico midlight 84 / 165 Watt
 color bar
Leggenda: min: dark, med: mid, max: light        Metrahit Energy

Energieaufnahme Cyberpunk / Stresstest

0102030405060708090100110120130140150160Tooltip
Gigabyte G5 KF5 2024; 1280x720 Prime95 28.10 and Furmark 1.25: Ø141.1 (137.37-165.27)
Gigabyte G5 KF5 2024; Idle 150cd/m2: Ø21.7 (20.81-27.463)
Gigabyte G5 KF5 2024; Cyberpunk 2077 FHD ultra no FSR 150cd: Ø143.9 (137.73-151.57)

Power consumption with the external monitor

0102030405060708090100110120130140Tooltip
Gigabyte G5 KF5 2024; Prime95 V2810 Stress (external Monitor): Ø111.5 (97.03-142.09)
Gigabyte G5 KF5 2024; Cinebench R15 Multi (external Monitor): Ø125.6 (119.31-140.51)
Gigabyte G5 KF5 2024; Cinebench R23 Multi (external Monitor): Ø128.4 (110.8-142.44)
Gigabyte G5 KF5 2024; 1280x720 FurMark 1.19 GPU Stress Test (external Monitor): Ø125.5 (119.52-130.45)
Gigabyte G5 KF5 2024; Idle 1min (external Monitor): Ø19.2 (18.333-20.862)
Gigabyte G5 KF5 2024; Cyberpunk 2077 FHD ultra no FSR (external Monitor): Ø144 (140.8-147.04)

Durata della batteria

Il prezzo basso si riflette anche nella capacità della batteria di soli 54 Wh. La concorrenza elencata offre da 60 a 90 Wh. Tuttavia, il nostro G5 si comporta abbastanza bene in termini di durata della batteria, soprattutto rispetto al LOQ 15 (60 Wh) e al Legion Pro 5 (80 Wh), dove riesce persino a ottenere tempi migliori per il WiFi (da 5,5 a 7 ore) e per i video (6 ore).

Autonomia della batteria
WiFi Websurfing
7ore 15minuti
WiFi Websurfing max. Brightness
5ore 23minuti
Big Buck Bunny H.264 1080p
6ore 03minuti
Sotto carico (max luminosità)
1ore 05minuti
Gigabyte G5 KF5 2024
i7-13620H, NVIDIA GeForce RTX 4060 Laptop GPU, 54 Wh
Gigabyte G5 KF
i5-12500H, NVIDIA GeForce RTX 4060 Laptop GPU, 54 Wh
Lenovo LOQ 15IRX9
i5-13450HX, NVIDIA GeForce RTX 4060 Laptop GPU, 60 Wh
Asus TUF Gaming A15 FA507UV
R9 8945H, NVIDIA GeForce RTX 4060 Laptop GPU, 90 Wh
Lenovo Legion Pro 5 16IRX9 G9
i7-14700HX, NVIDIA GeForce RTX 4060 Laptop GPU, 80 Wh
Dell Inspiron 16 Plus 7640
Ultra 7 155H, NVIDIA GeForce RTX 4060 Laptop GPU, 90 Wh
Media della classe Gaming
 
Autonomia della batteria
-3%
-26%
61%
6%
84%
11%
H.264
363
268
-26%
312
-14%
WiFi v1.3
435
316
-27%
320
-26%
702
61%
308
-29%
799
84%
Load
65
94
45%
105
62%
Reader / Idle
514

Valutazione complessiva di Notebookcheck

Un portatile RTX 4060 a 899 euro: Nonostante alcuni compromessi come la webcam a 720p e la mancanza di una porta Thunderbolt, il Gigabyte G5 colpisce per il suo design solido, la buona tastiera e l'elevata precisione dei colori del display. Tuttavia, il suo sistema di raffreddamento sembra essere troppo debole, il che ci impedisce di raccomandarne l'acquisto.

Gigabyte G5 KF5 2024 - 10/17/2024 v8
Christian Hintze

Chassis
73 / 98 → 75%
Tastiera
84%
Dispositivo di puntamento
82%
Connettività
61 / 80 → 77%
Peso
63 / 10-68 → 91%
Batteria
76 / 95 → 79%
Display
81%
Prestazioni di gioco
73%
Prestazioni Applicazioni
84%
AI Performance
94%
Temperatura
75 / 95 → 79%
Rumorosità
67 / 90 → 75%
Audio
60%
Fotocamera
24 / 75 → 32%
Media
57%
76%
Gaming - Media ponderata
CO2 Emissions
No Data
Materials
0%
Packaging
15%
Power Use
77.1%
Repairability
50%
Software Updates
22.3%
Recycle Logo Total Sustainability Score: 27.4%

Transparency

The selection of devices to be reviewed is made by our editorial team. The test sample was provided to the author as a loan by the manufacturer or retailer for the purpose of this review. The lender had no influence on this review, nor did the manufacturer receive a copy of this review before publication. There was no obligation to publish this review. We never accept compensation or payment in return for our reviews. As an independent media company, Notebookcheck is not subjected to the authority of manufacturers, retailers or publishers.

This is how Notebookcheck is testing

Every year, Notebookcheck independently reviews hundreds of laptops and smartphones using standardized procedures to ensure that all results are comparable. We have continuously developed our test methods for around 20 years and set industry standards in the process. In our test labs, high-quality measuring equipment is utilized by experienced technicians and editors. These tests involve a multi-stage validation process. Our complex rating system is based on hundreds of well-founded measurements and benchmarks, which maintains objectivity. Further information on our test methods can be found here.

Please share our article, every link counts!
Mail Logo
> Recensioni e prove di notebook, tablets e smartphones > Recensioni e prove > Recensioni e prove > Recensione del computer portatile Gigabyte G5 KF5 2024: gaming con una RTX 4060 a un prezzo stracciato. Un buon affare?
Christian Hintze, 2024-10-24 (Update: 2024-10-26)