

Recensione del Lenovo LOQ 15: Il computer portatile per il gaming FHD con RTX 4060 da circa 1.000 dollari
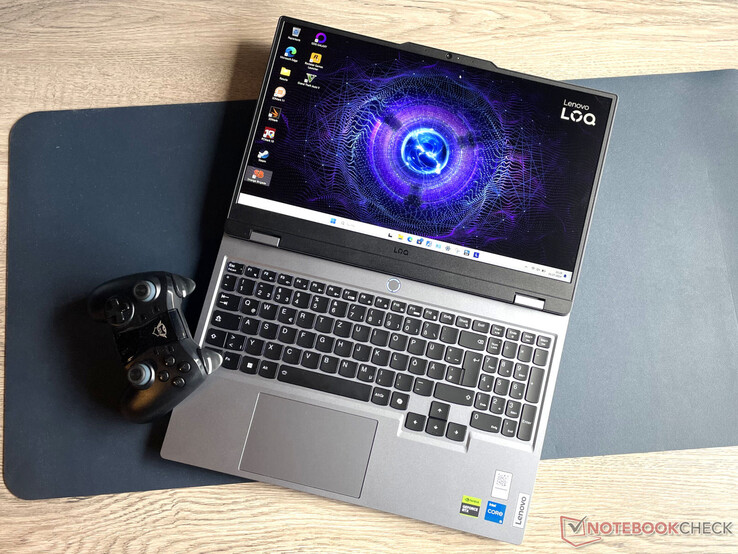
All'interno del catalogo di Lenovo, la serie LOQ è costituita da computer portatili da gioco economici. Il presente dispositivo di prova rientra perfettamente in questa categoria: Il produttore chiede poco più di 1.000 dollari (senza Windows) o 1.300 dollari (con Windows 11) per questo pacchetto composto da un processore Core i5, GeForce RTX 4060, 16 GB di RAM e un SSD da 1 TB. Il prezzo del laptop ha il suo peso: ha un case in plastica, una capacità della batteria relativamente bassa e non è dotato di Thunderbolt 4 o USB 4. I concorrenti includono dispositivi come il computer portatile e la batteria. I concorrenti includono dispositivi come il Gigabyte G6X 9KG (2024), Dell G16, XMG Core 15 (M24) o il HP Victus 16 (2024).
Il case di Lenovo LOQ 15IRX9 non è identico a quello dei suoi modelli gemelli che abbiamo già testato (Ryzen 7/RTX 4050, Core i7/RTX 4050).
Potenziali concorrenti a confrontos
Punteggio | Versione | Data | Modello | Peso | Altezza | Dimensione | Risoluzione | Prezzo |
|---|---|---|---|---|---|---|---|---|
| 79 % | v8 | 07/2024 | Lenovo LOQ 15IRX9 i5-13450HX, NVIDIA GeForce RTX 4060 Laptop GPU | 2.4 kg | 23.9 mm | 15.60" | 1920x1080 | |
| 83.7 % | v8 | 06/2024 | SCHENKER XMG Core 15 (M24) R7 8845HS, NVIDIA GeForce RTX 4060 Laptop GPU | 2.1 kg | 21.9 mm | 15.30" | 2560x1600 | |
| 83.2 % v7 (old) | v7 (old) | 03/2024 | Gigabyte G6X 9KG (2024) i7-13650HX, NVIDIA GeForce RTX 4060 Laptop GPU | 2.6 kg | 25.1 mm | 16.00" | 1920x1200 | |
| 84.3 % v7 (old) | v7 (old) | 05/2024 | HP Victus 16 (2024) i7-14700HX, NVIDIA GeForce RTX 4060 Laptop GPU | 2.4 kg | 23.9 mm | 16.10" | 1920x1080 | |
| 85.5 % v7 (old) | v7 (old) | 02/2024 | Dell G16, i7-13650HX, RTX 4060 i7-13650HX, NVIDIA GeForce RTX 4060 Laptop GPU | 2.8 kg | 25.65 mm | 16.00" | 2560x1600 |
Nota bene: abbiamo recentemente aggiornato il nostro sistema di valutazione e i risultati della versione 8 non sono confrontabili con quelli della versione 7. Ulteriori informazioni sono disponibili qui .
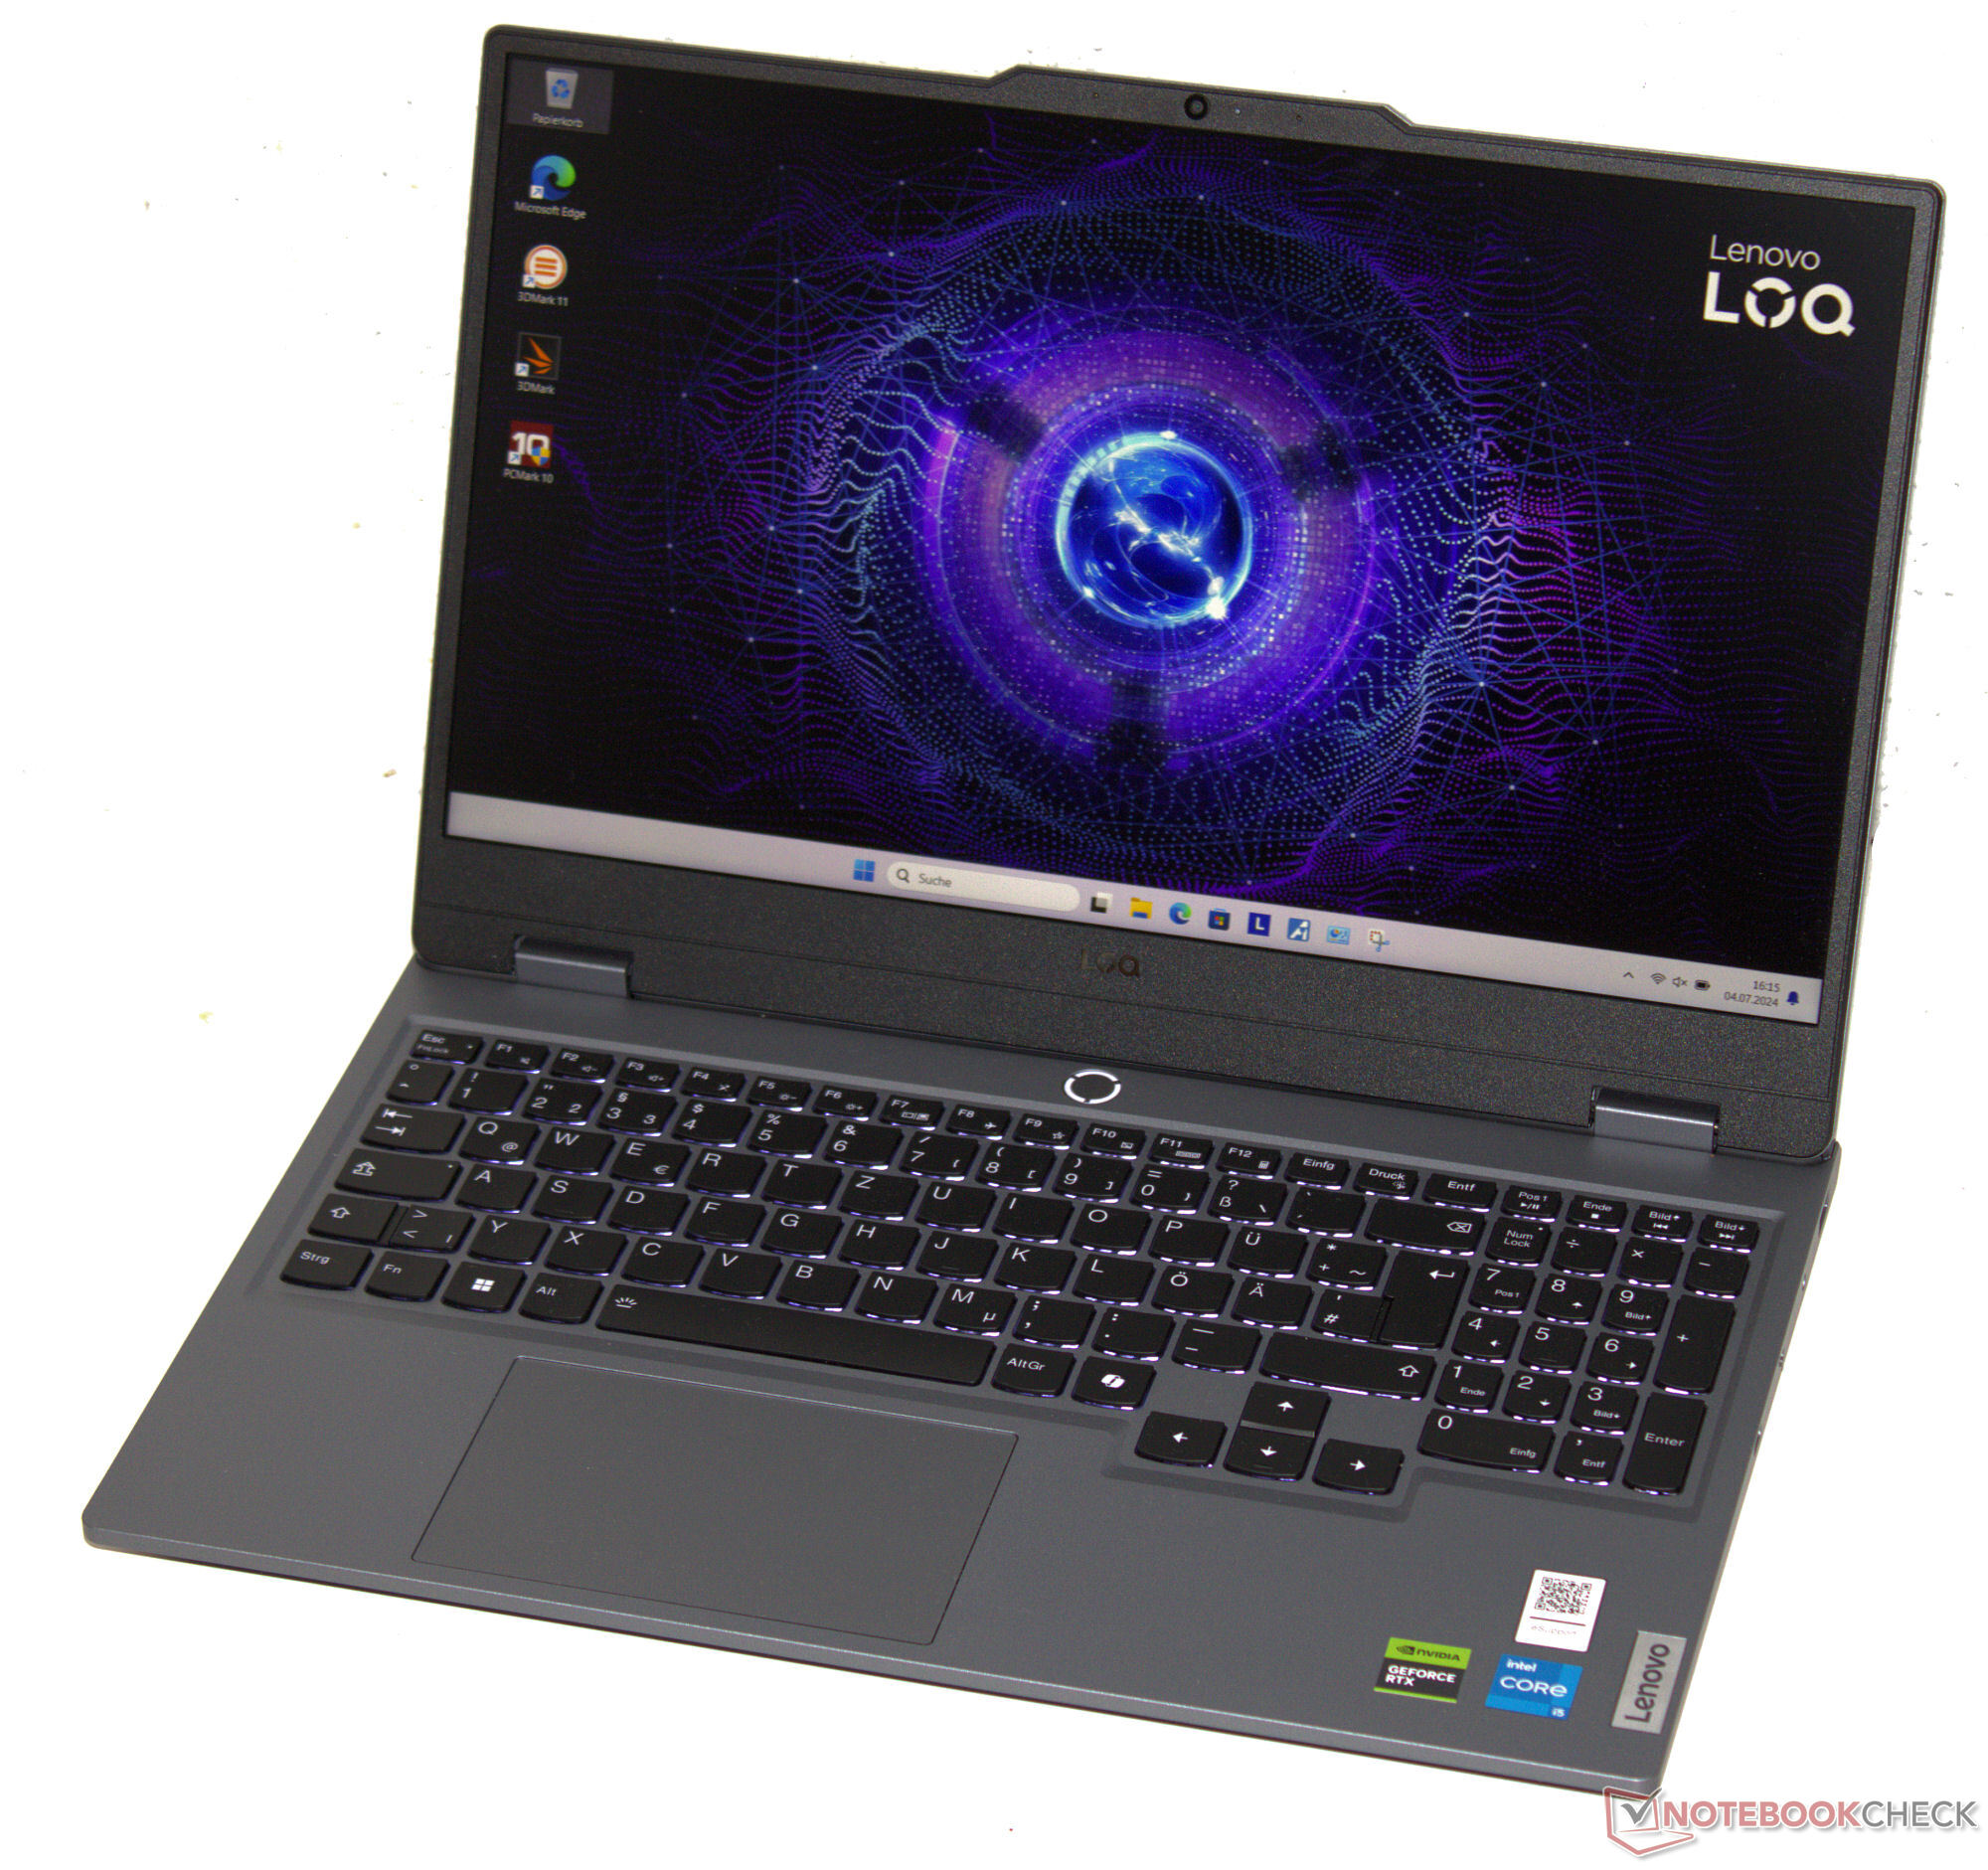
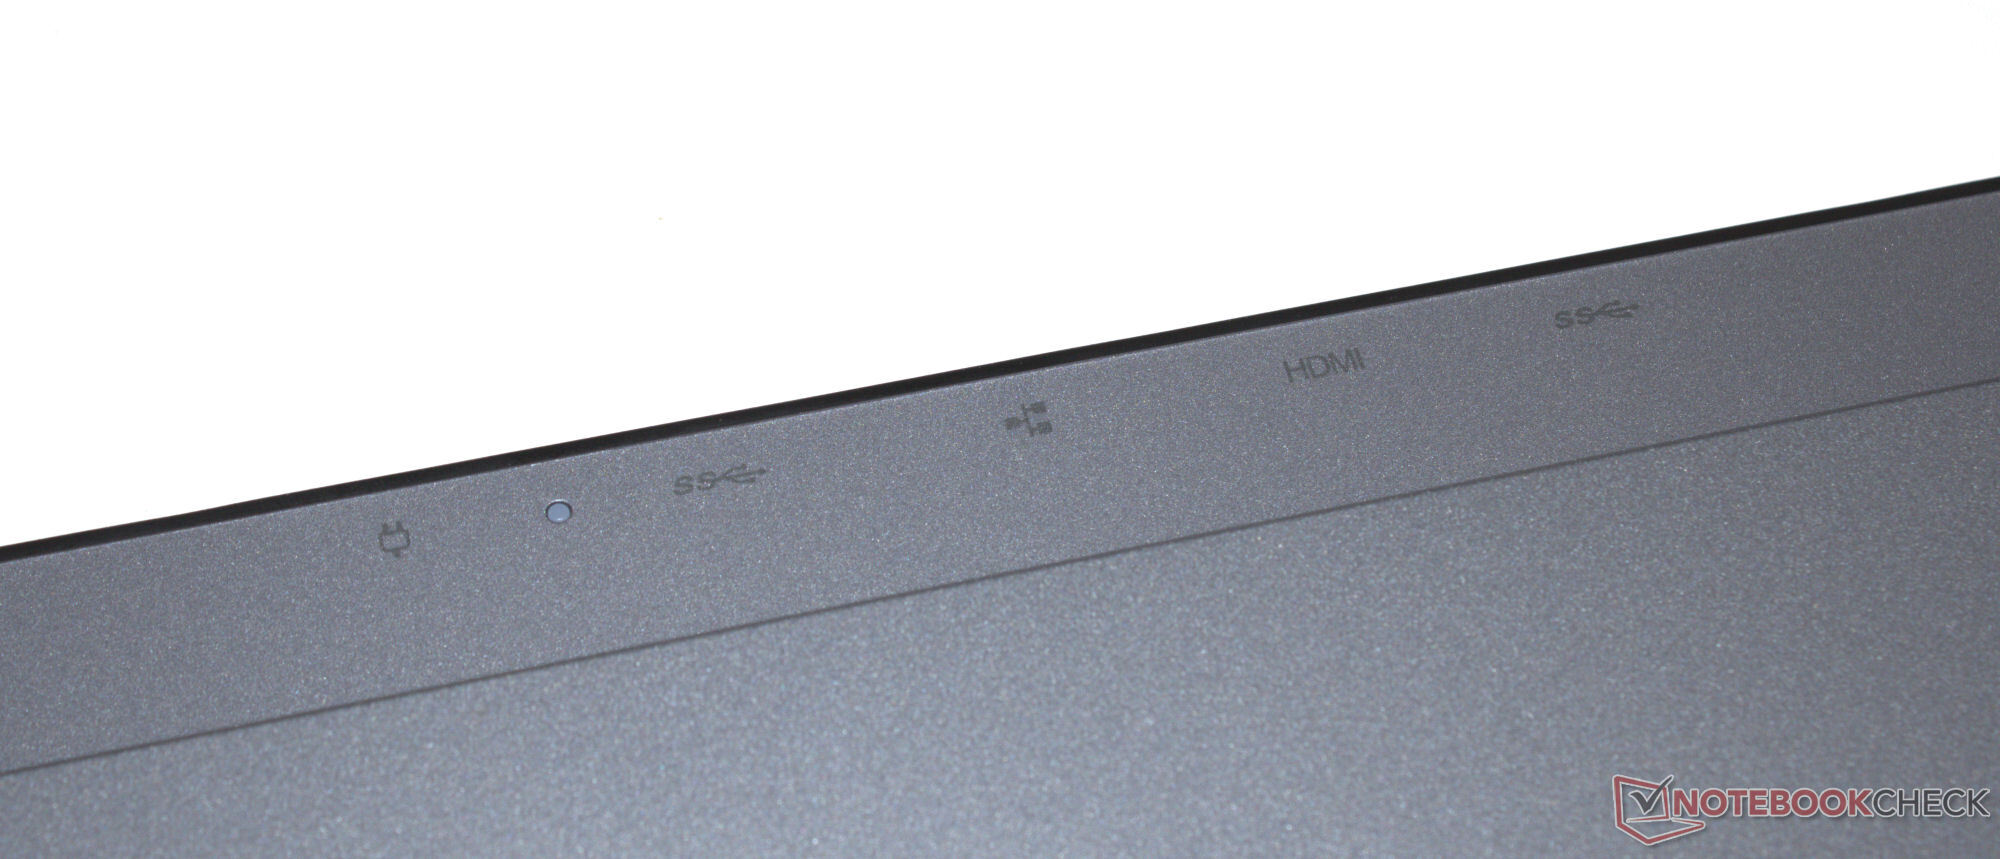
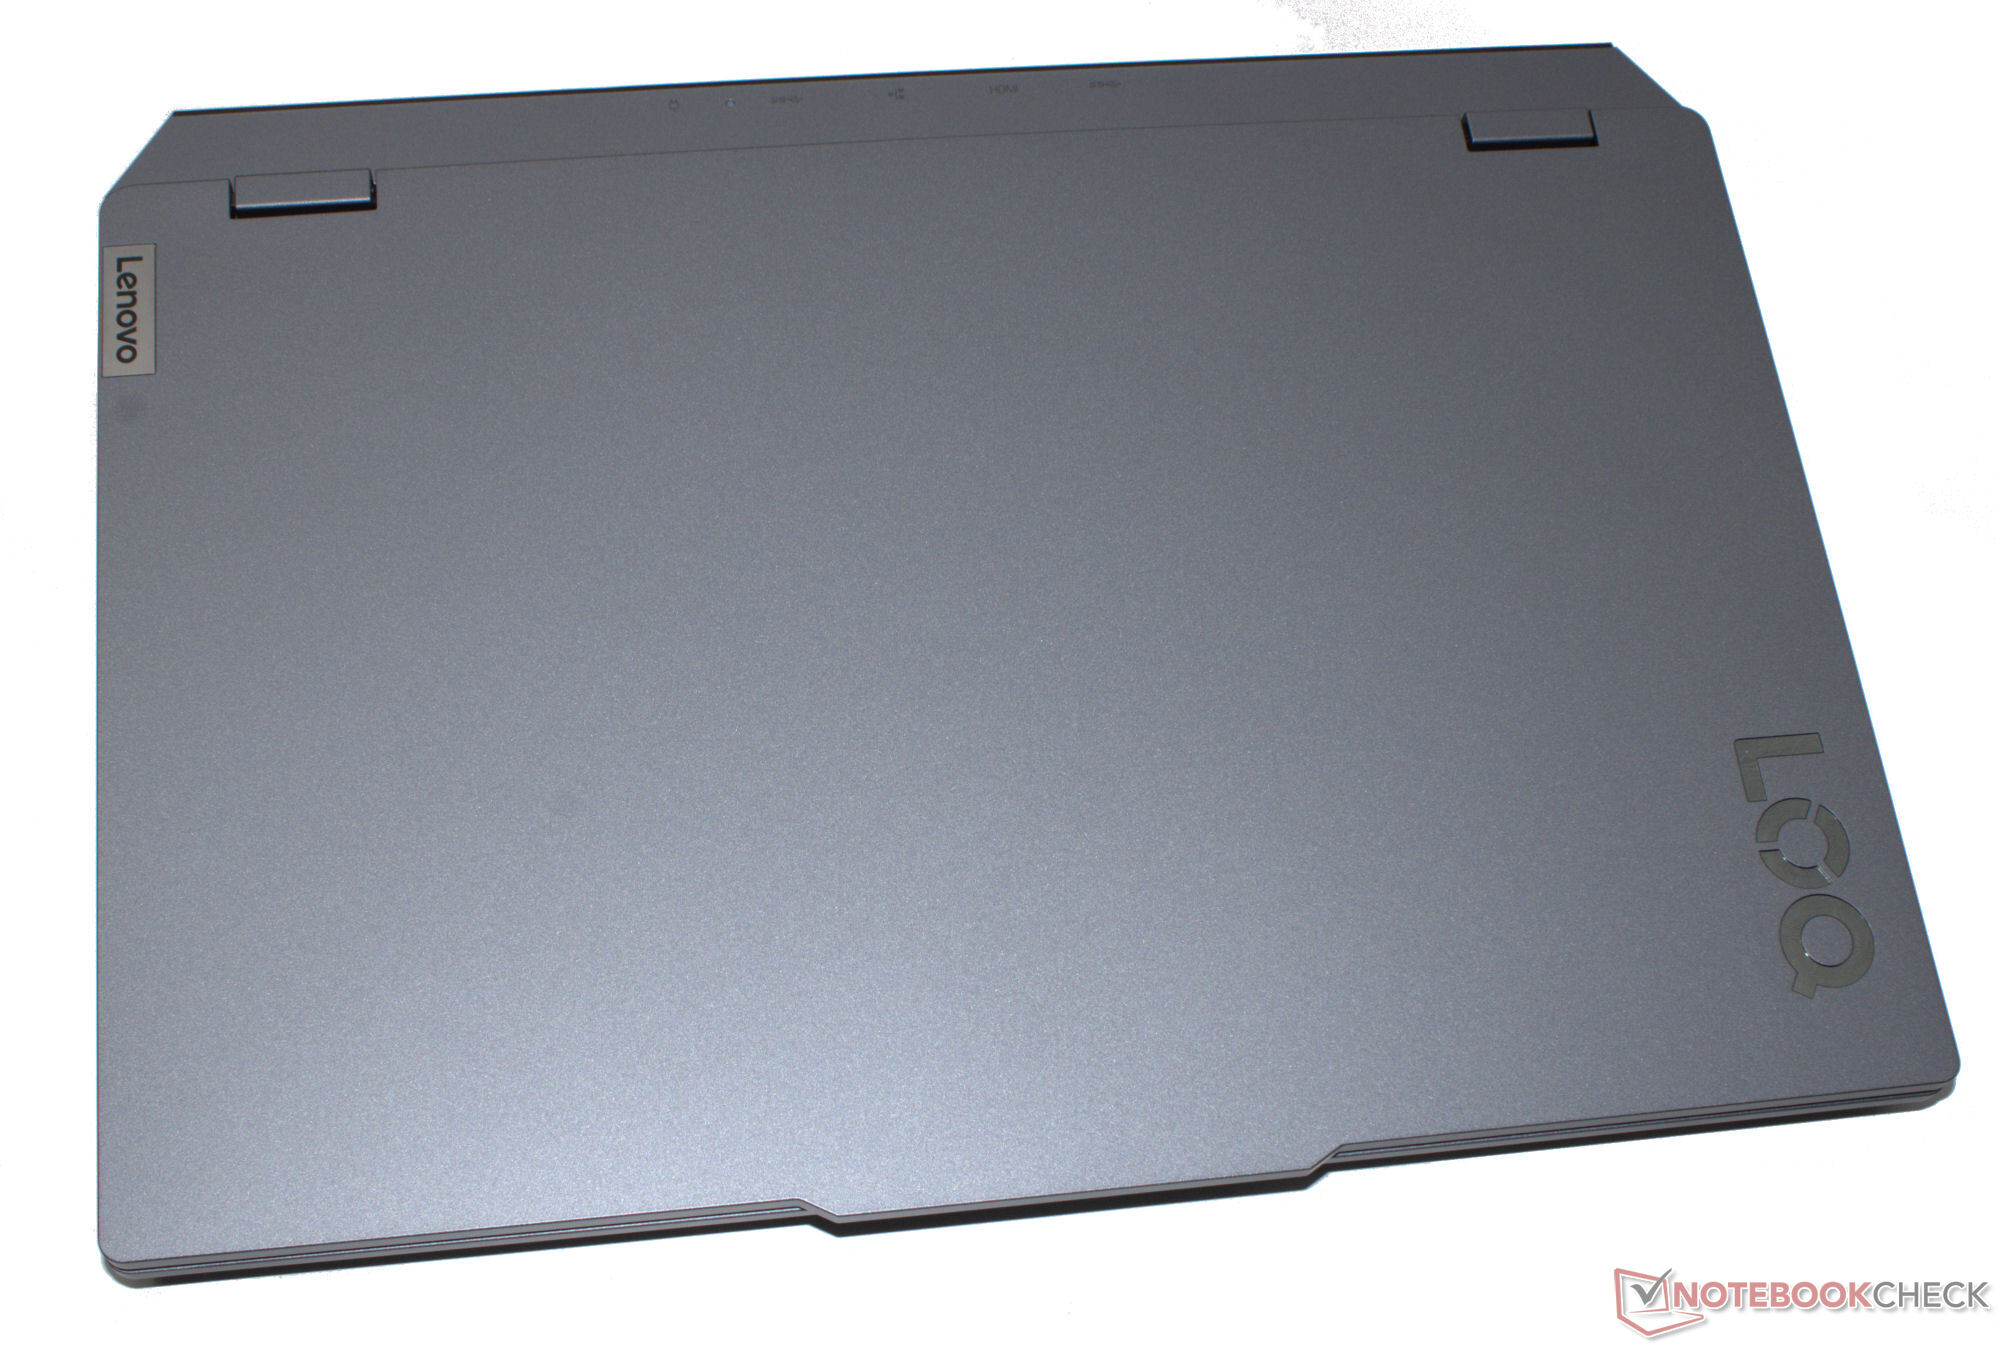
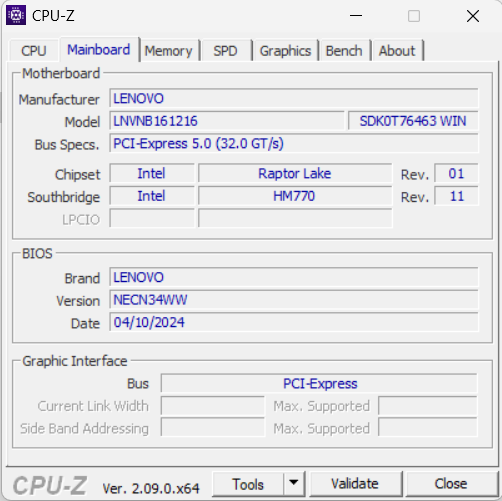
Custodia e connettività - Il LOQ senza USB 4 ma con Power Delivery
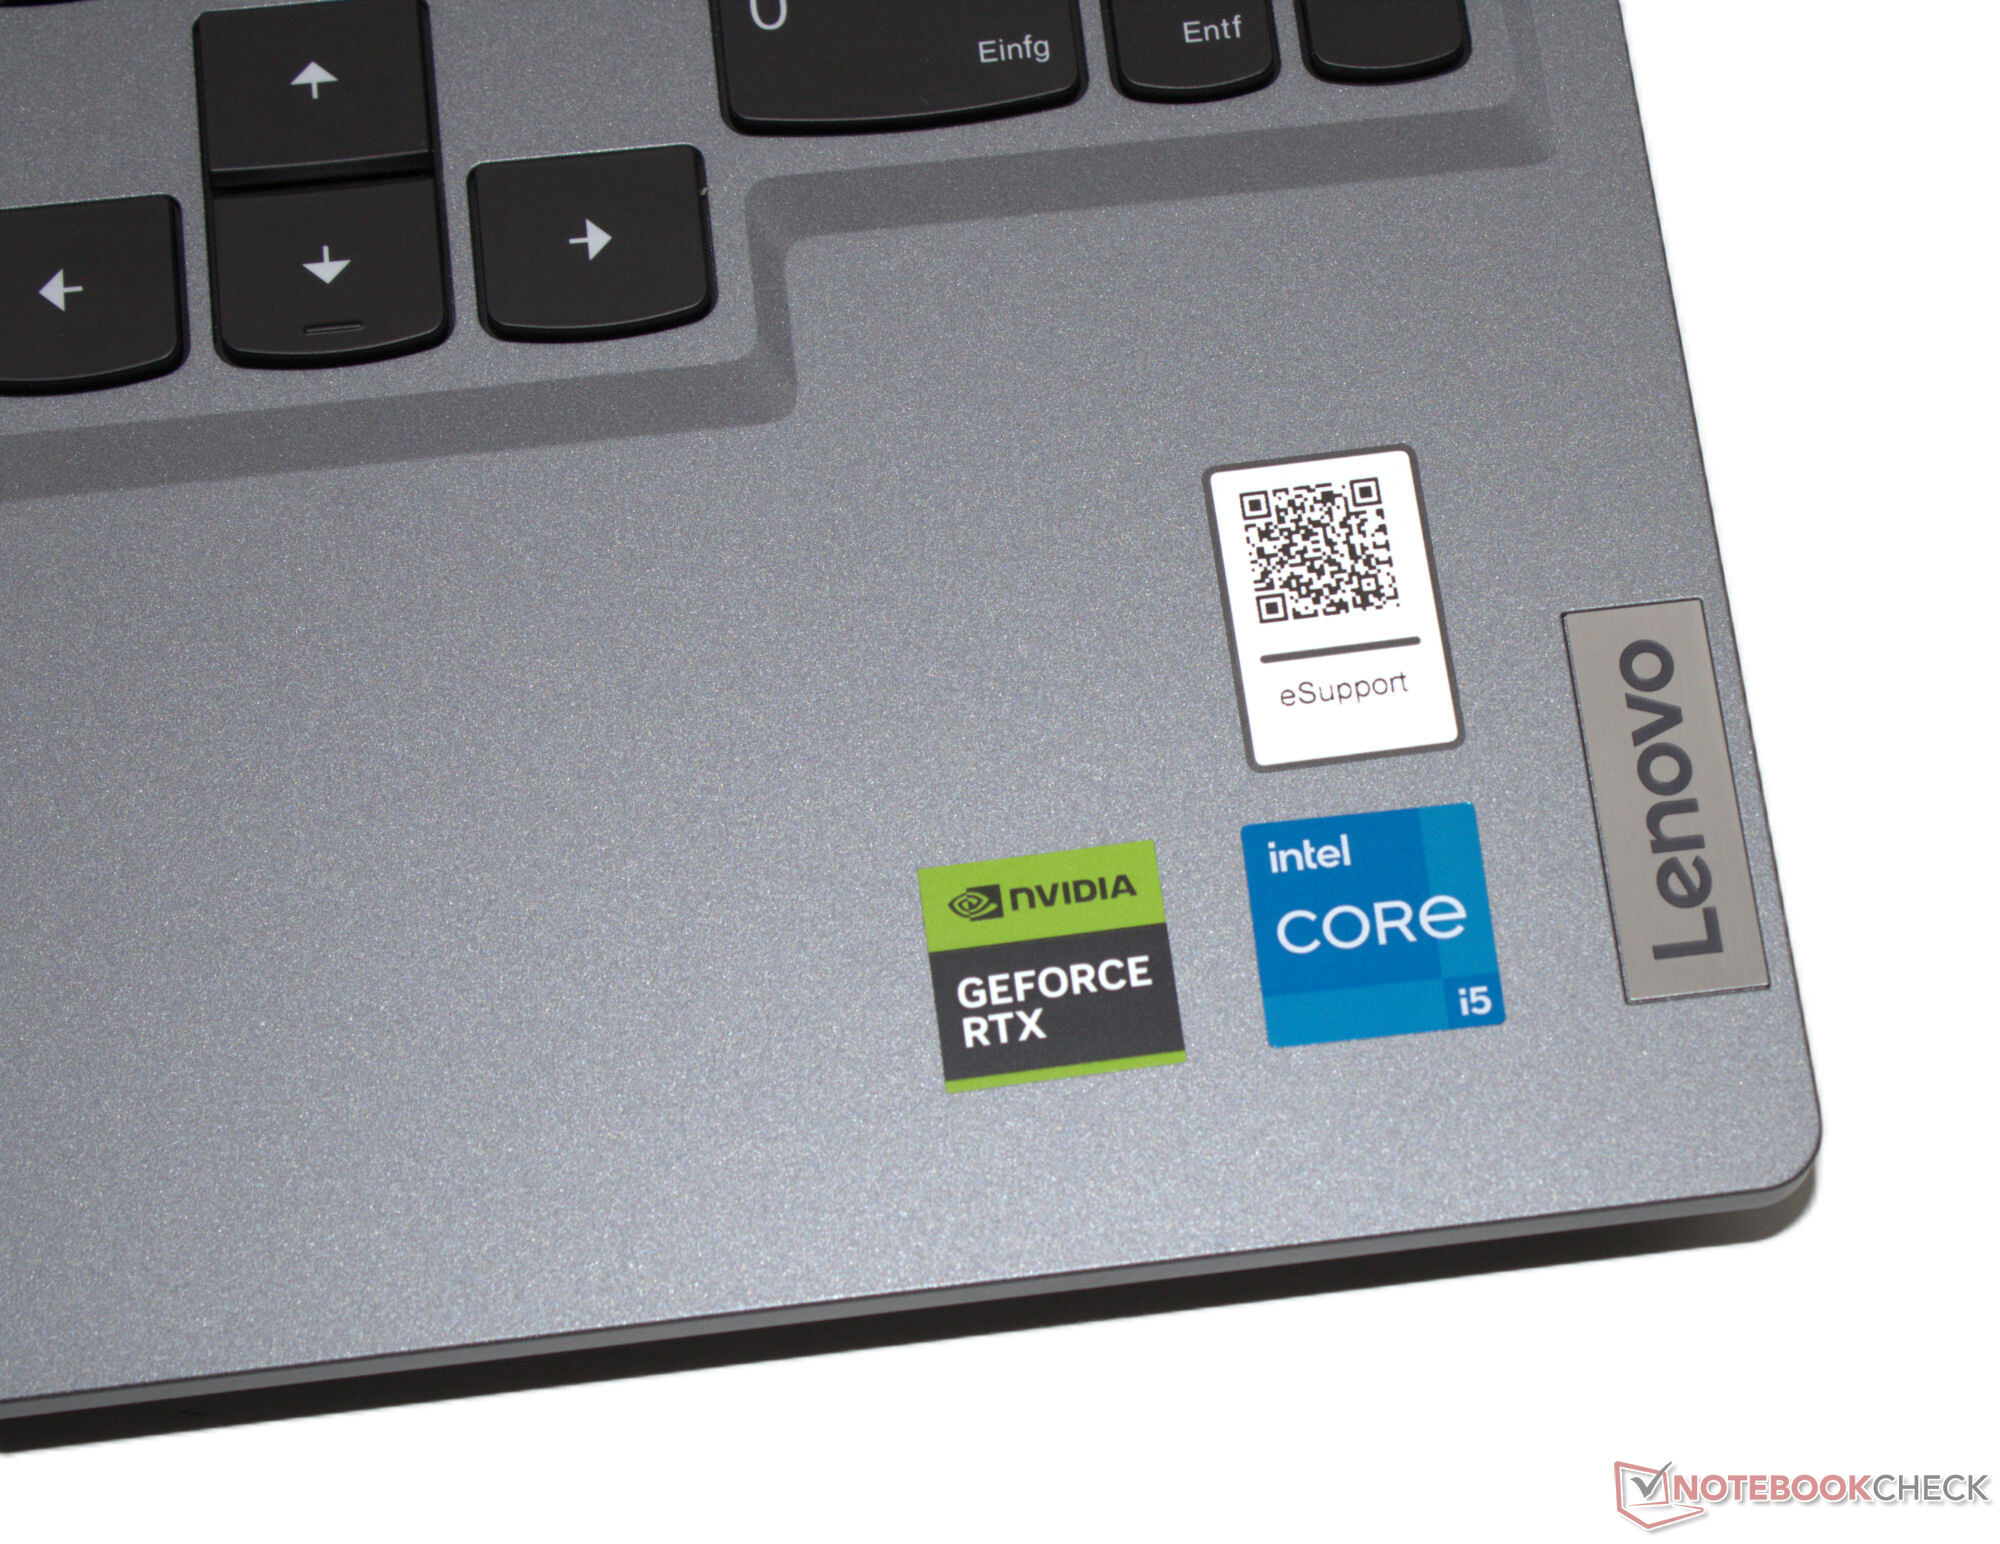
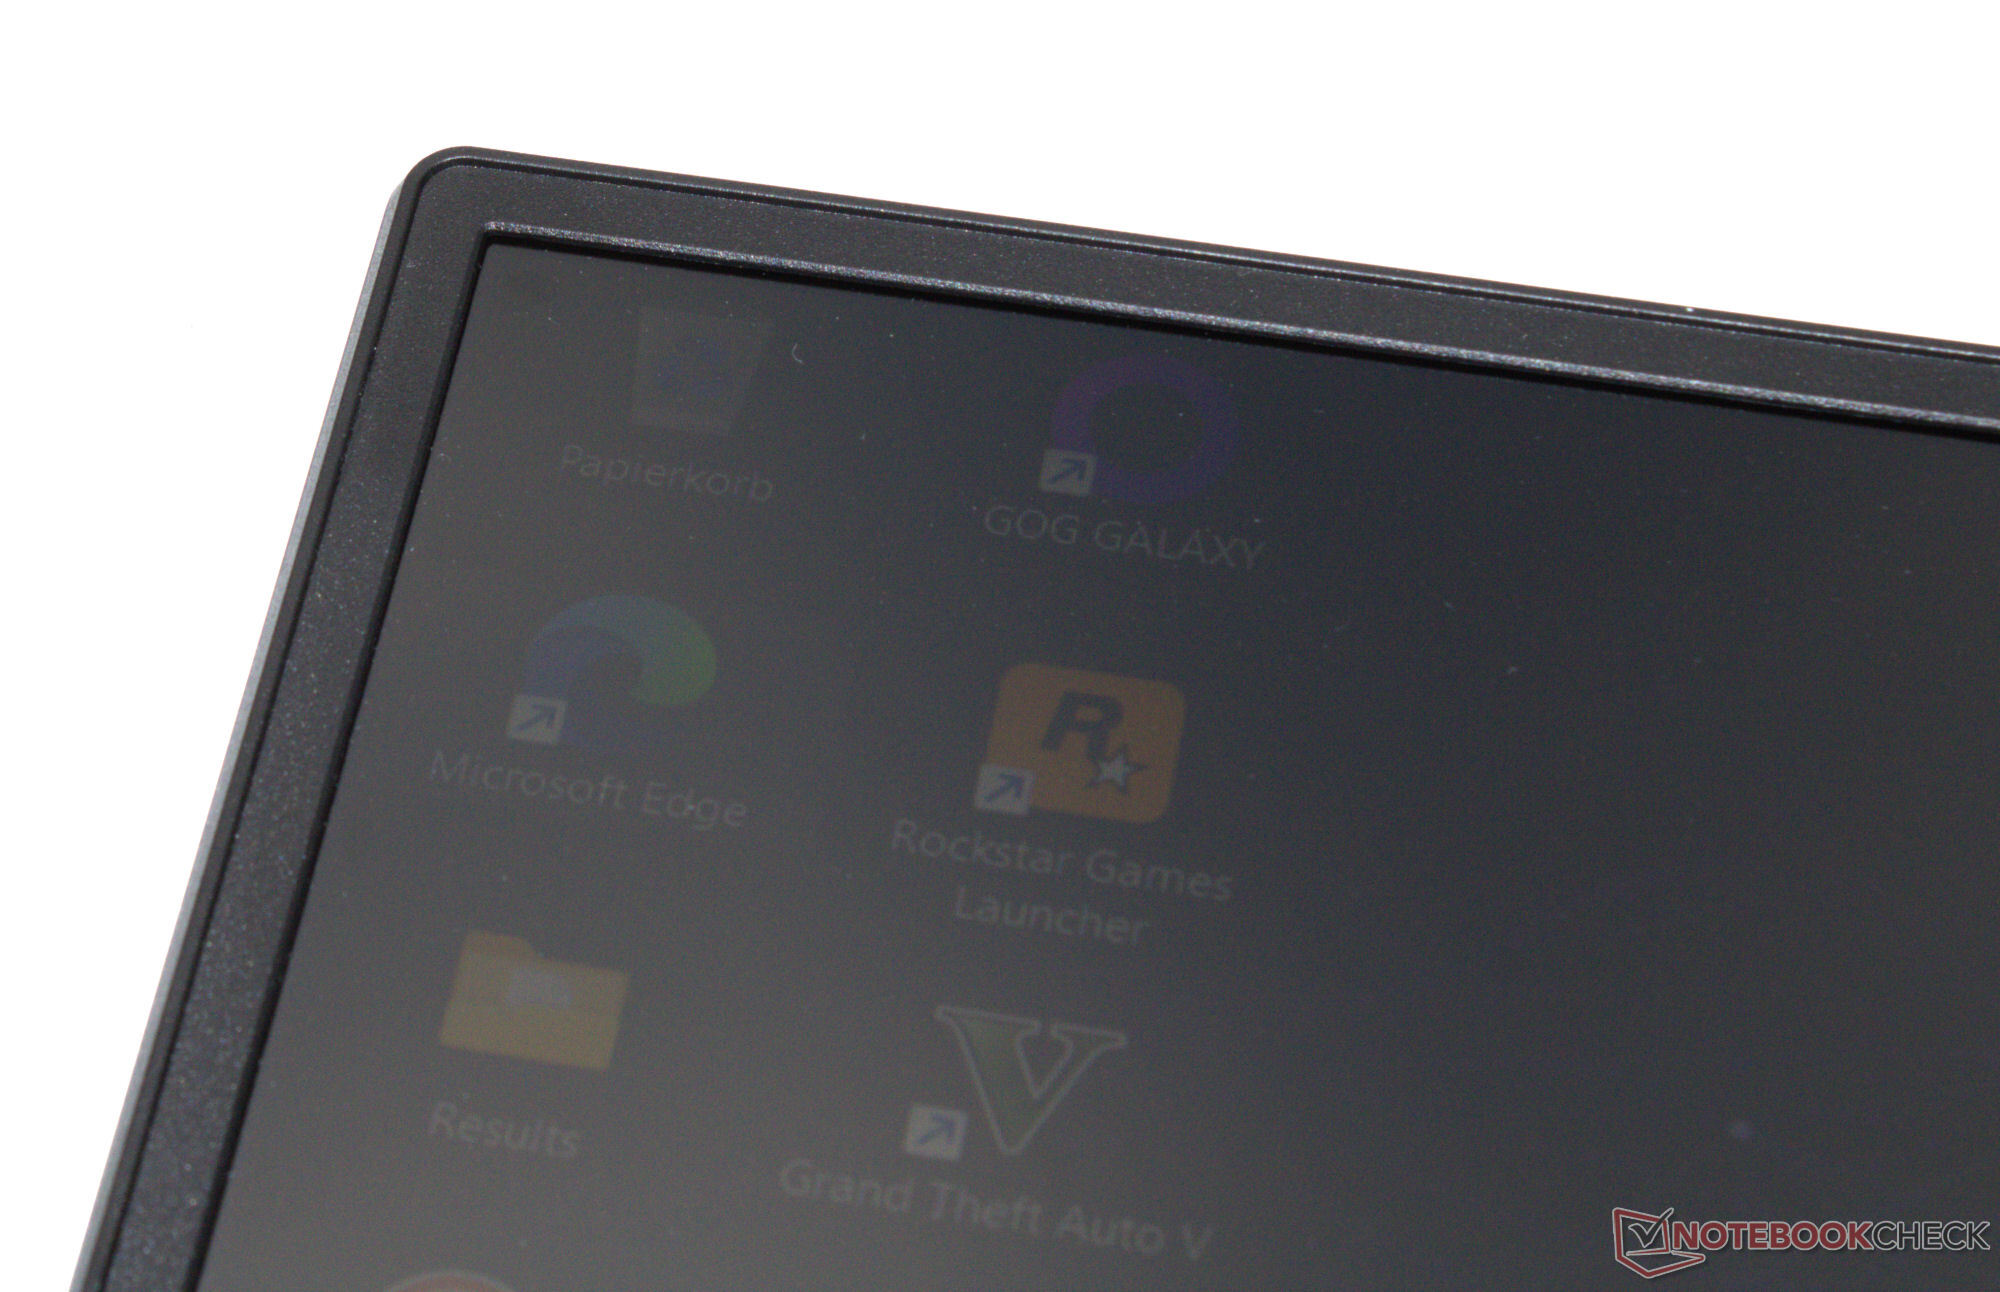
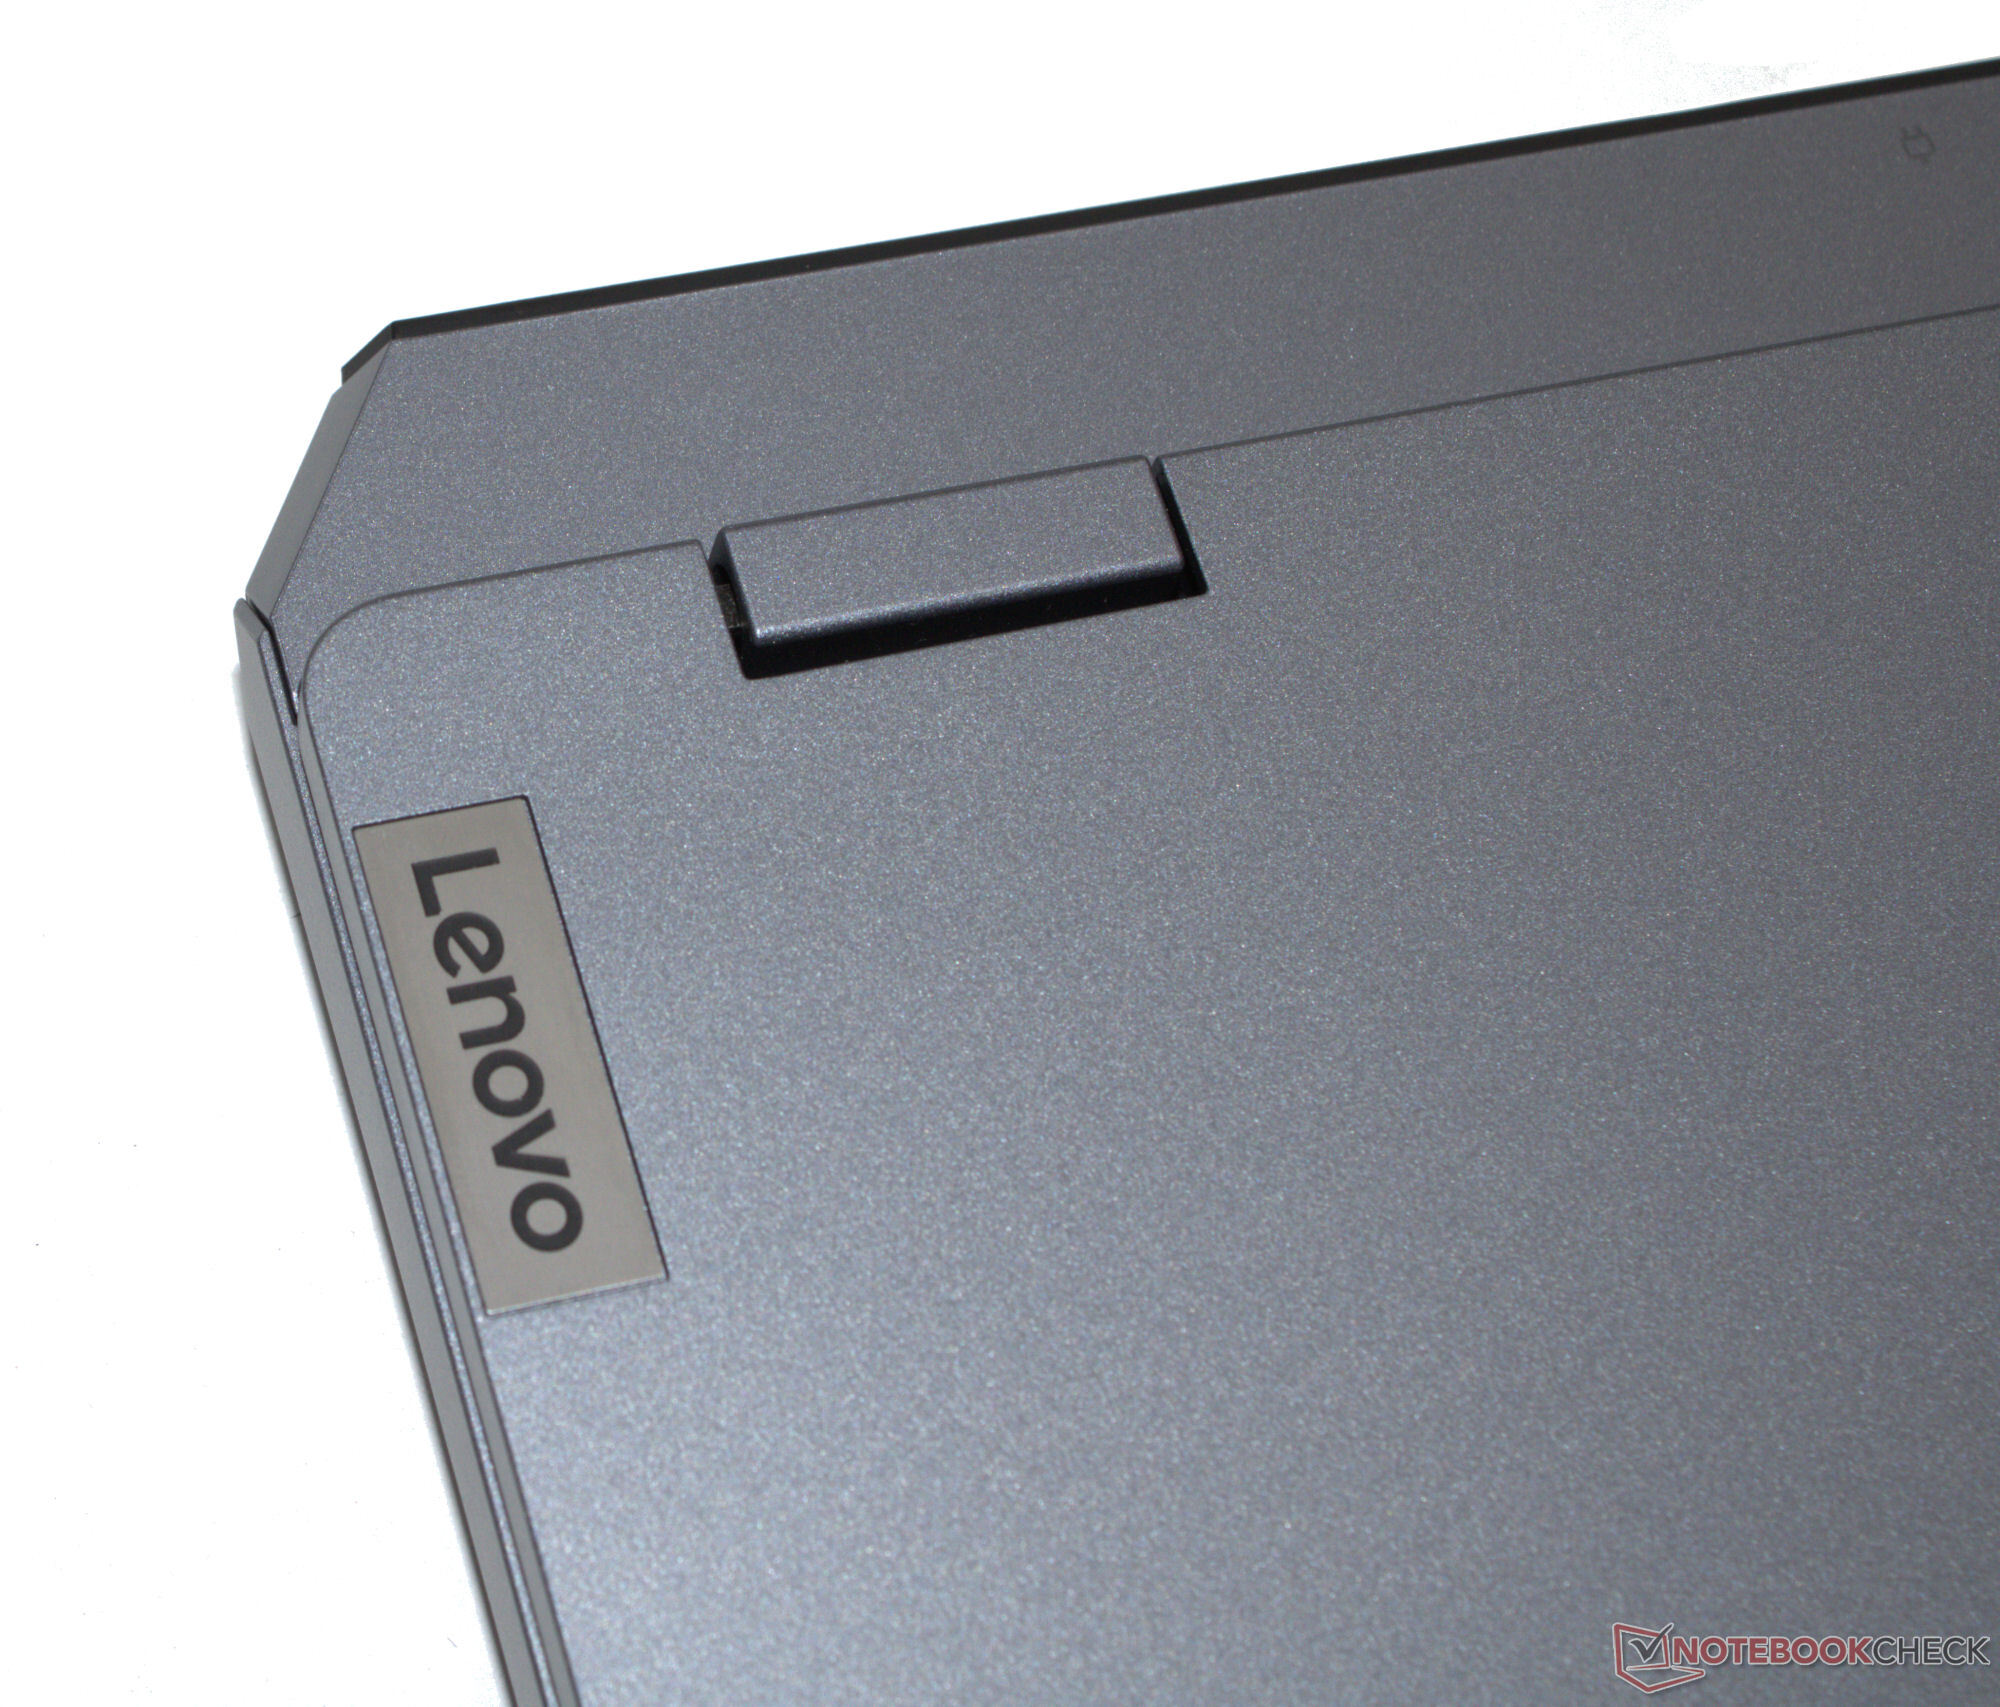
L'hardware del portatile è alloggiato all'interno di un involucro di plastica grigio opaco (Luna Gray) che in generale ha un aspetto piuttosto elegante. Il coperchio e l'unità di base possono essere leggermente ruotati, ma questo è ancora accettabile. La stabilità è buona. Il coperchio consente un angolo di apertura massimo di 180 gradi. Le strisce LED tipiche dei computer portatili da gioco non sono presenti in questo modello.
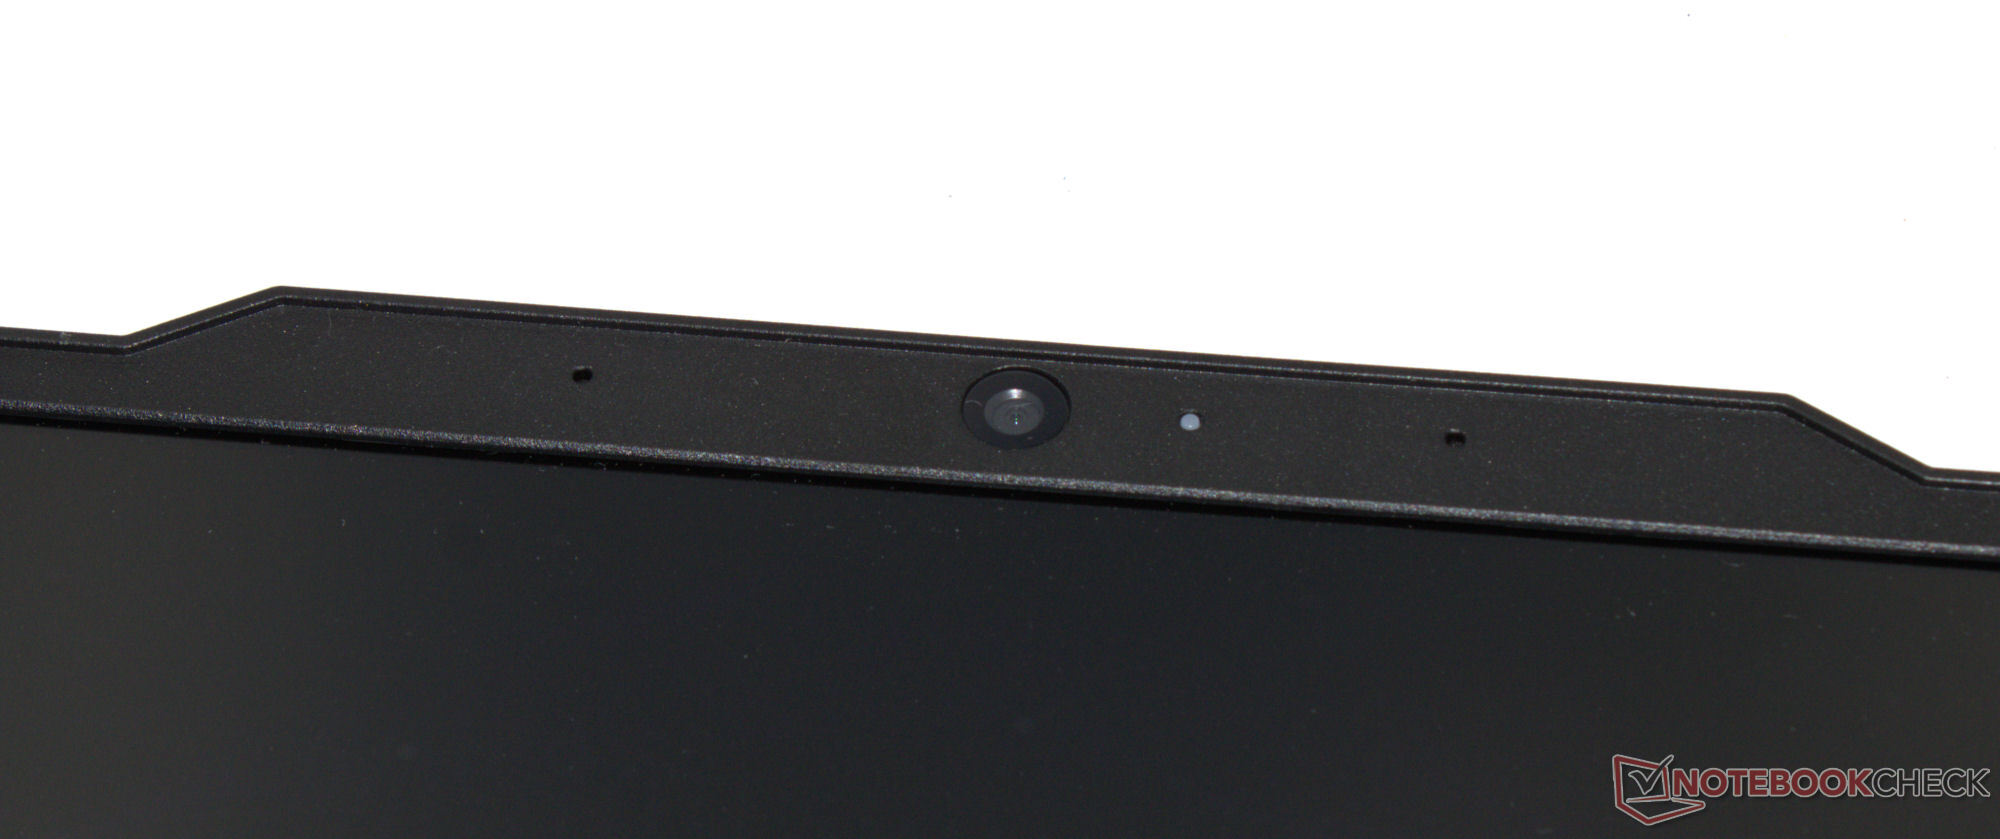
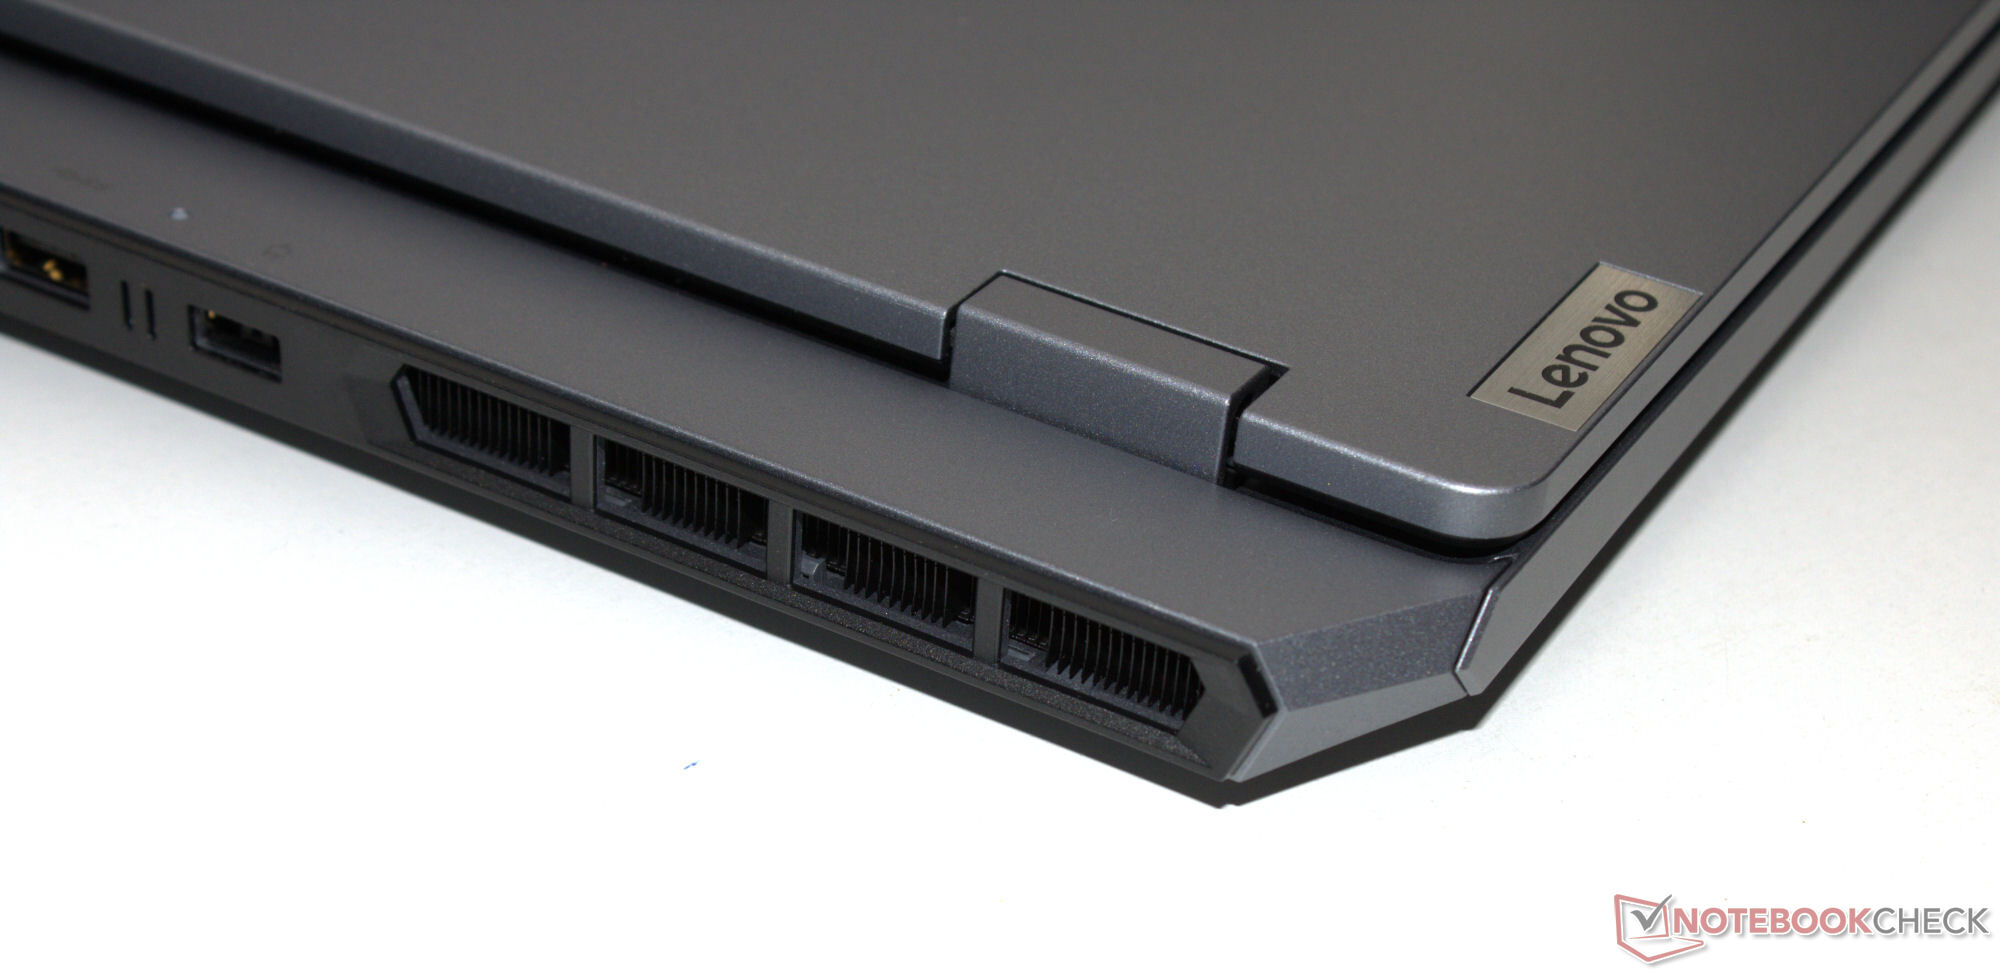
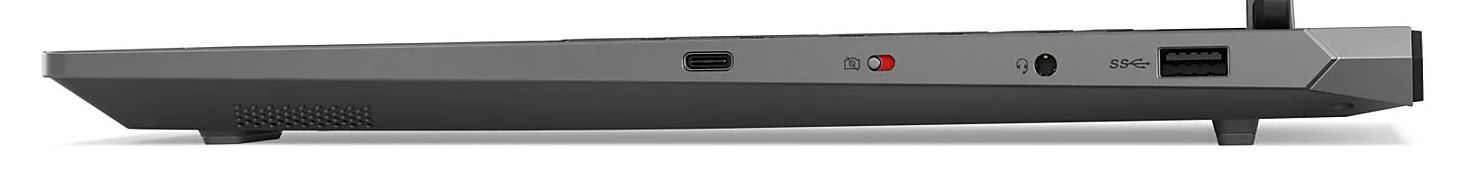
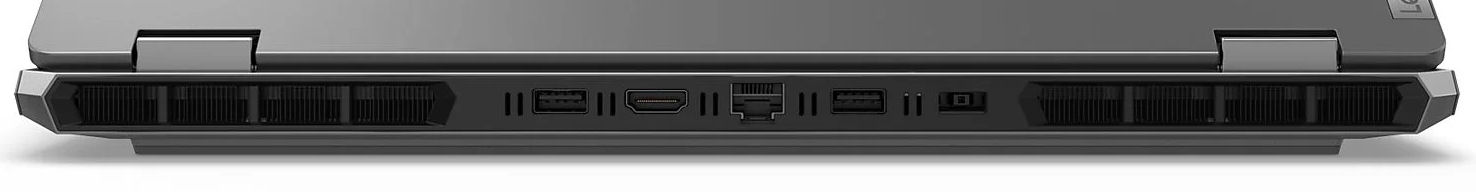
Tre connessioni USB-A (USB 3.2 Gen 1) e una porta USB-C (USB 3.2 Gen 2) dovrebbero essere sufficienti per la maggior parte degli utenti. Quest'ultima supporta Power Delivery e la modalità Display ALT. In totale, il portatile dispone di due uscite video (1x HDMI, 1x DP). La sua webcam (2,1 MP, con interruttore on/off) offre risultati medi. Lenovo non ha ritenuto necessario un lettore di schede SD.
Le velocità di trasmissione dati WiFi che abbiamo misurato sono solide, ma sono inferiori a quelle possibili al giorno d'oggi. Il chip Realtek WiFi 6 (RTL8852BE) del portatile Lenovo non può raggiungere le stesse velocità dei chip Intel installati in molti dei suoi concorrenti.


Sostenibilità
Il computer portatile e l'alimentatore sono imballati ciascuno in una busta di plastica, mentre il LOQ è protetto durante la trasmissione da inserti di schiuma. I tipi di plastica utilizzati sono indicati dal produttore. Una copertura di carta protegge l'alimentatore dai graffi. Il tutto è alloggiato all'interno di una scatola di cartone; secondo l'etichettatura, il legno utilizzato proviene da una silvicoltura sostenibile.
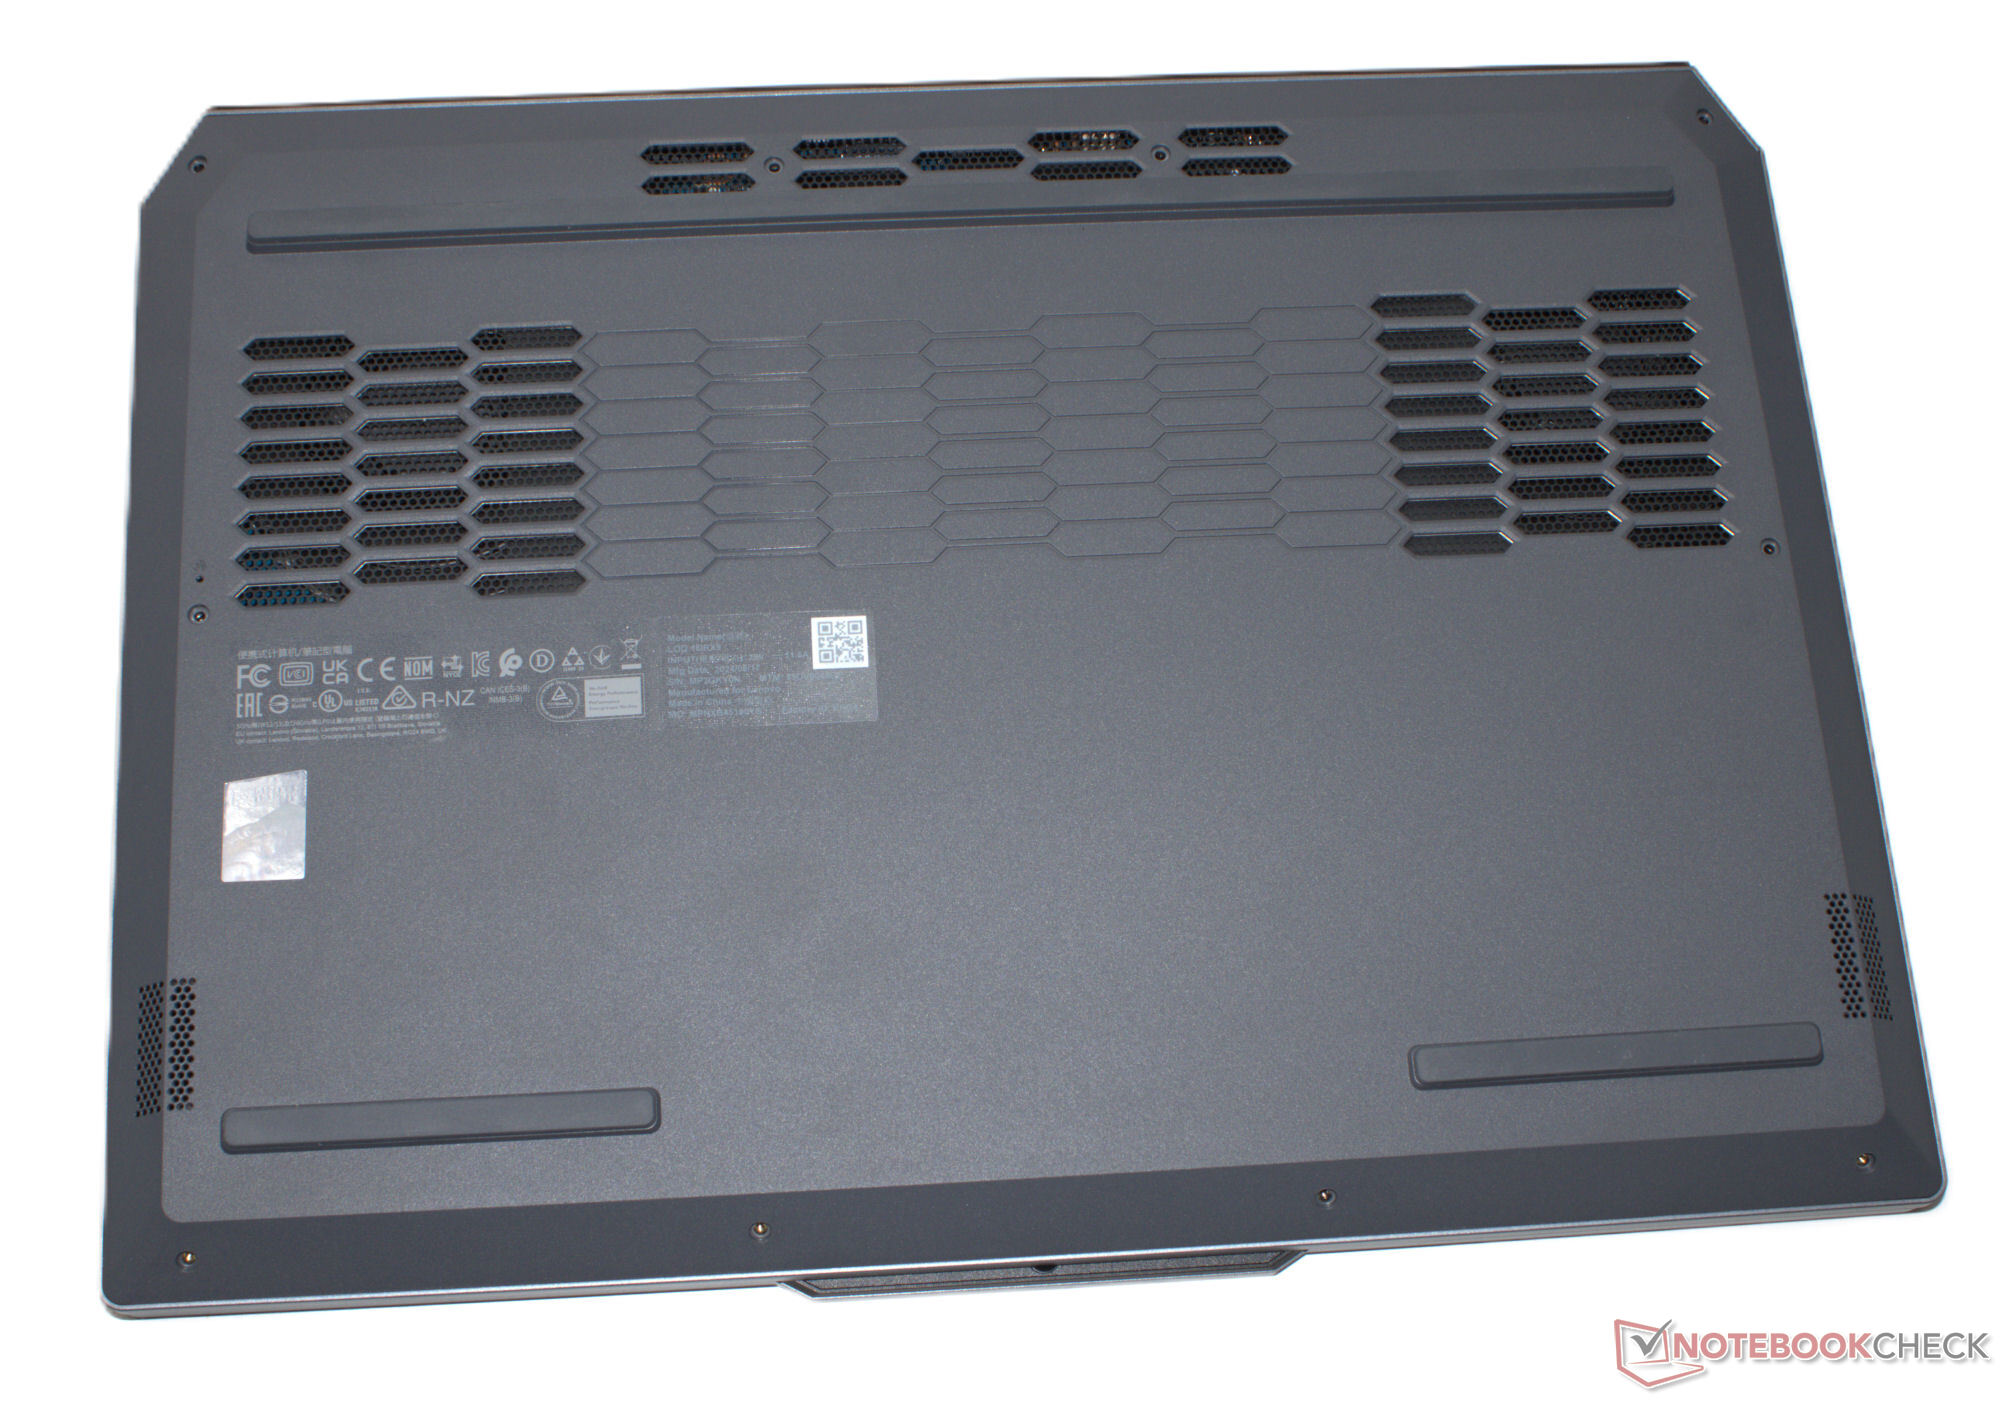
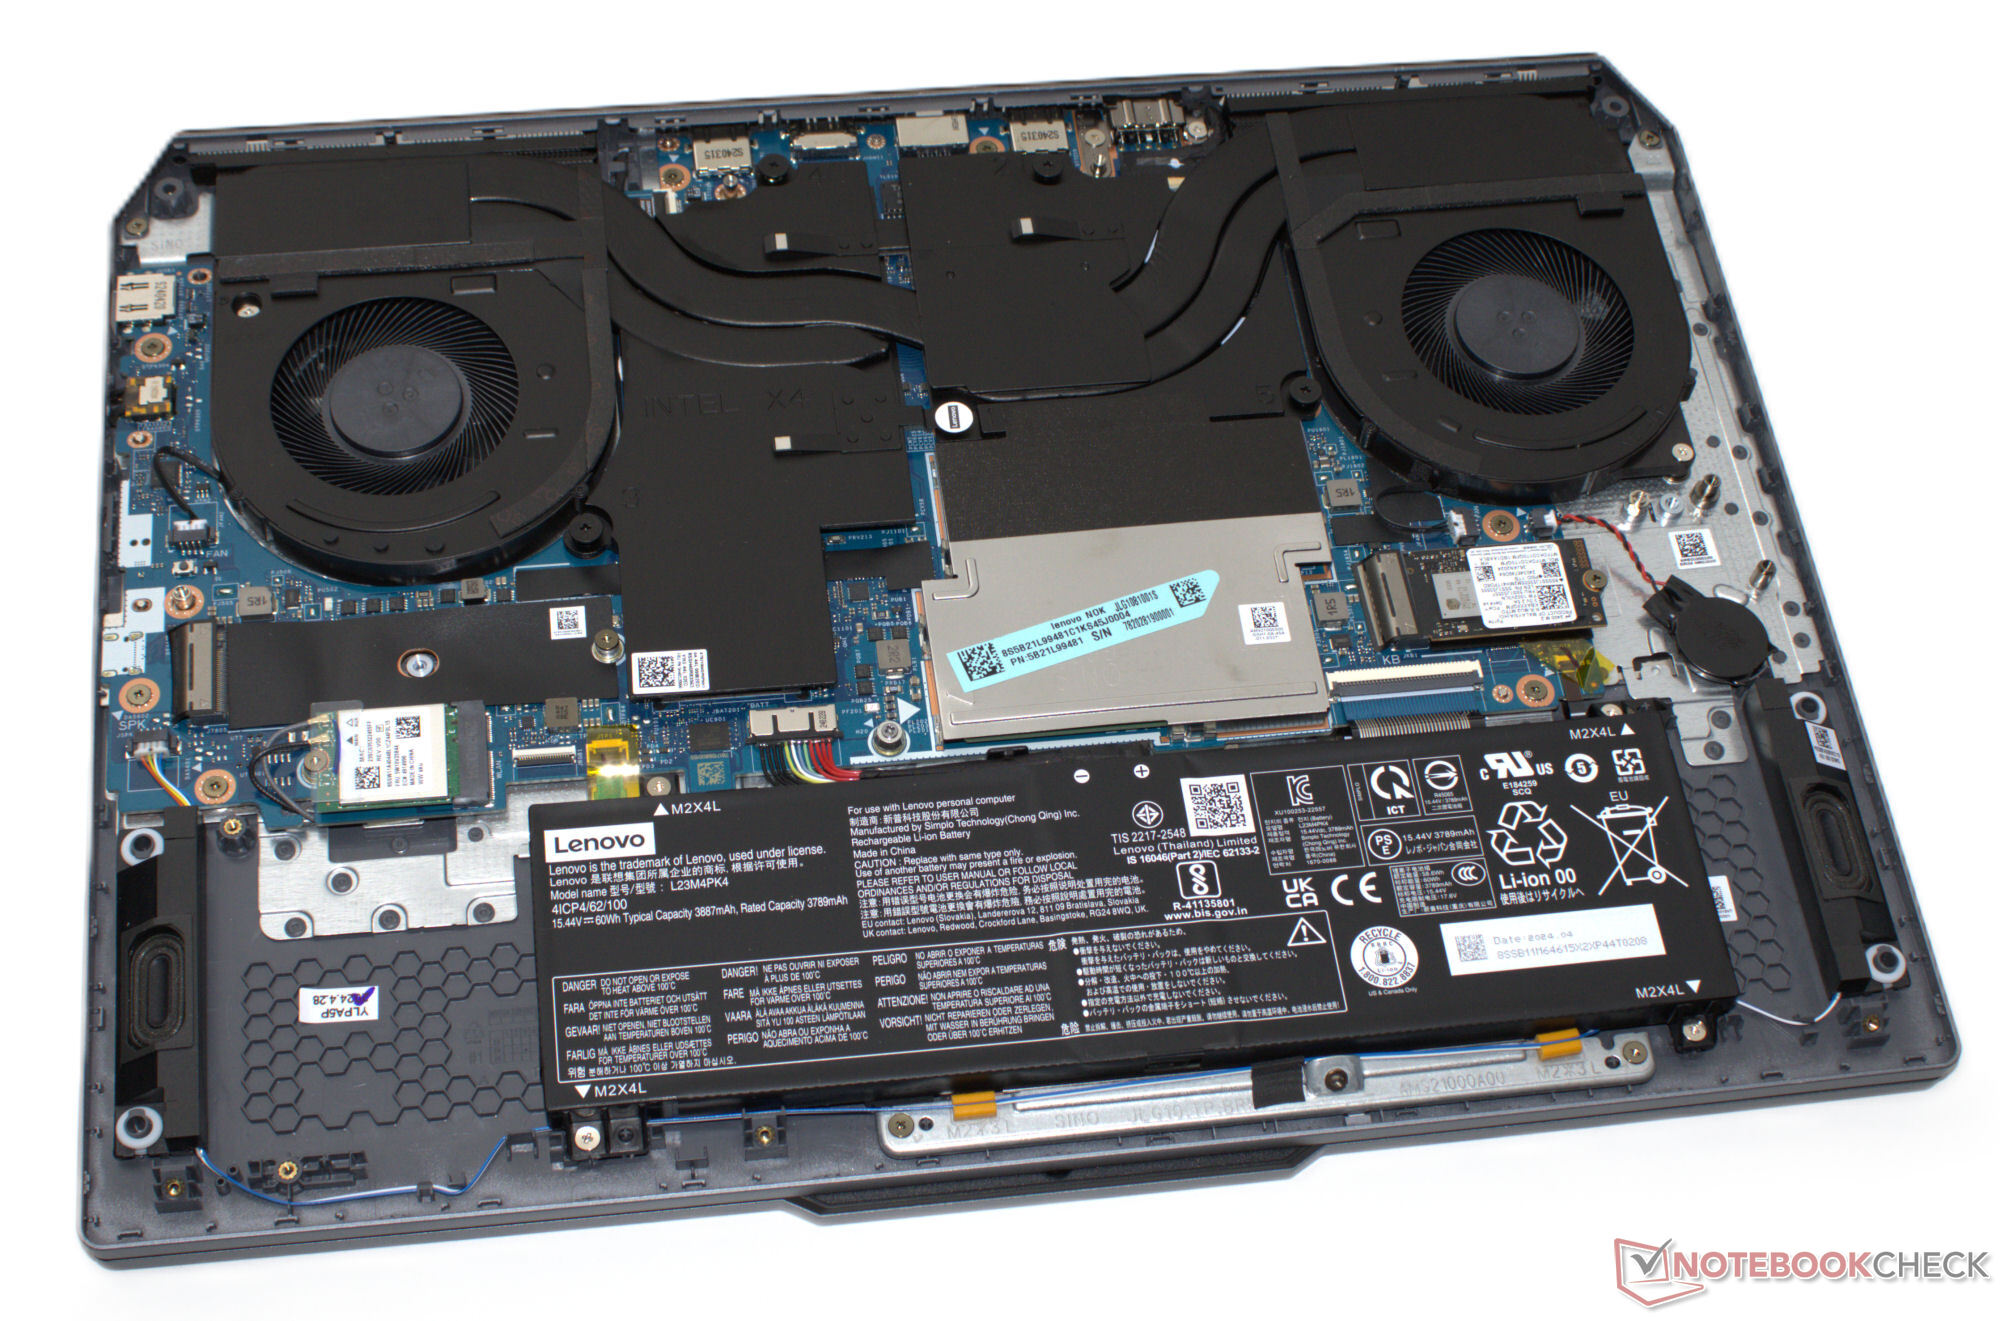
Dovrebbe essere abbastanza facile riparare il dispositivo: La piastra inferiore può essere rimossa senza problemi, consentendo così di accedere a tutto l'hardware. Non abbiamo trovato parti incollate all'interno del case. Poiché Windows 11 viene utilizzato come sistema operativo, gli aggiornamenti software dovrebbero essere garantiti per i prossimi anni. Il supporto di Lenovo termina il 31 dicembre 2029.
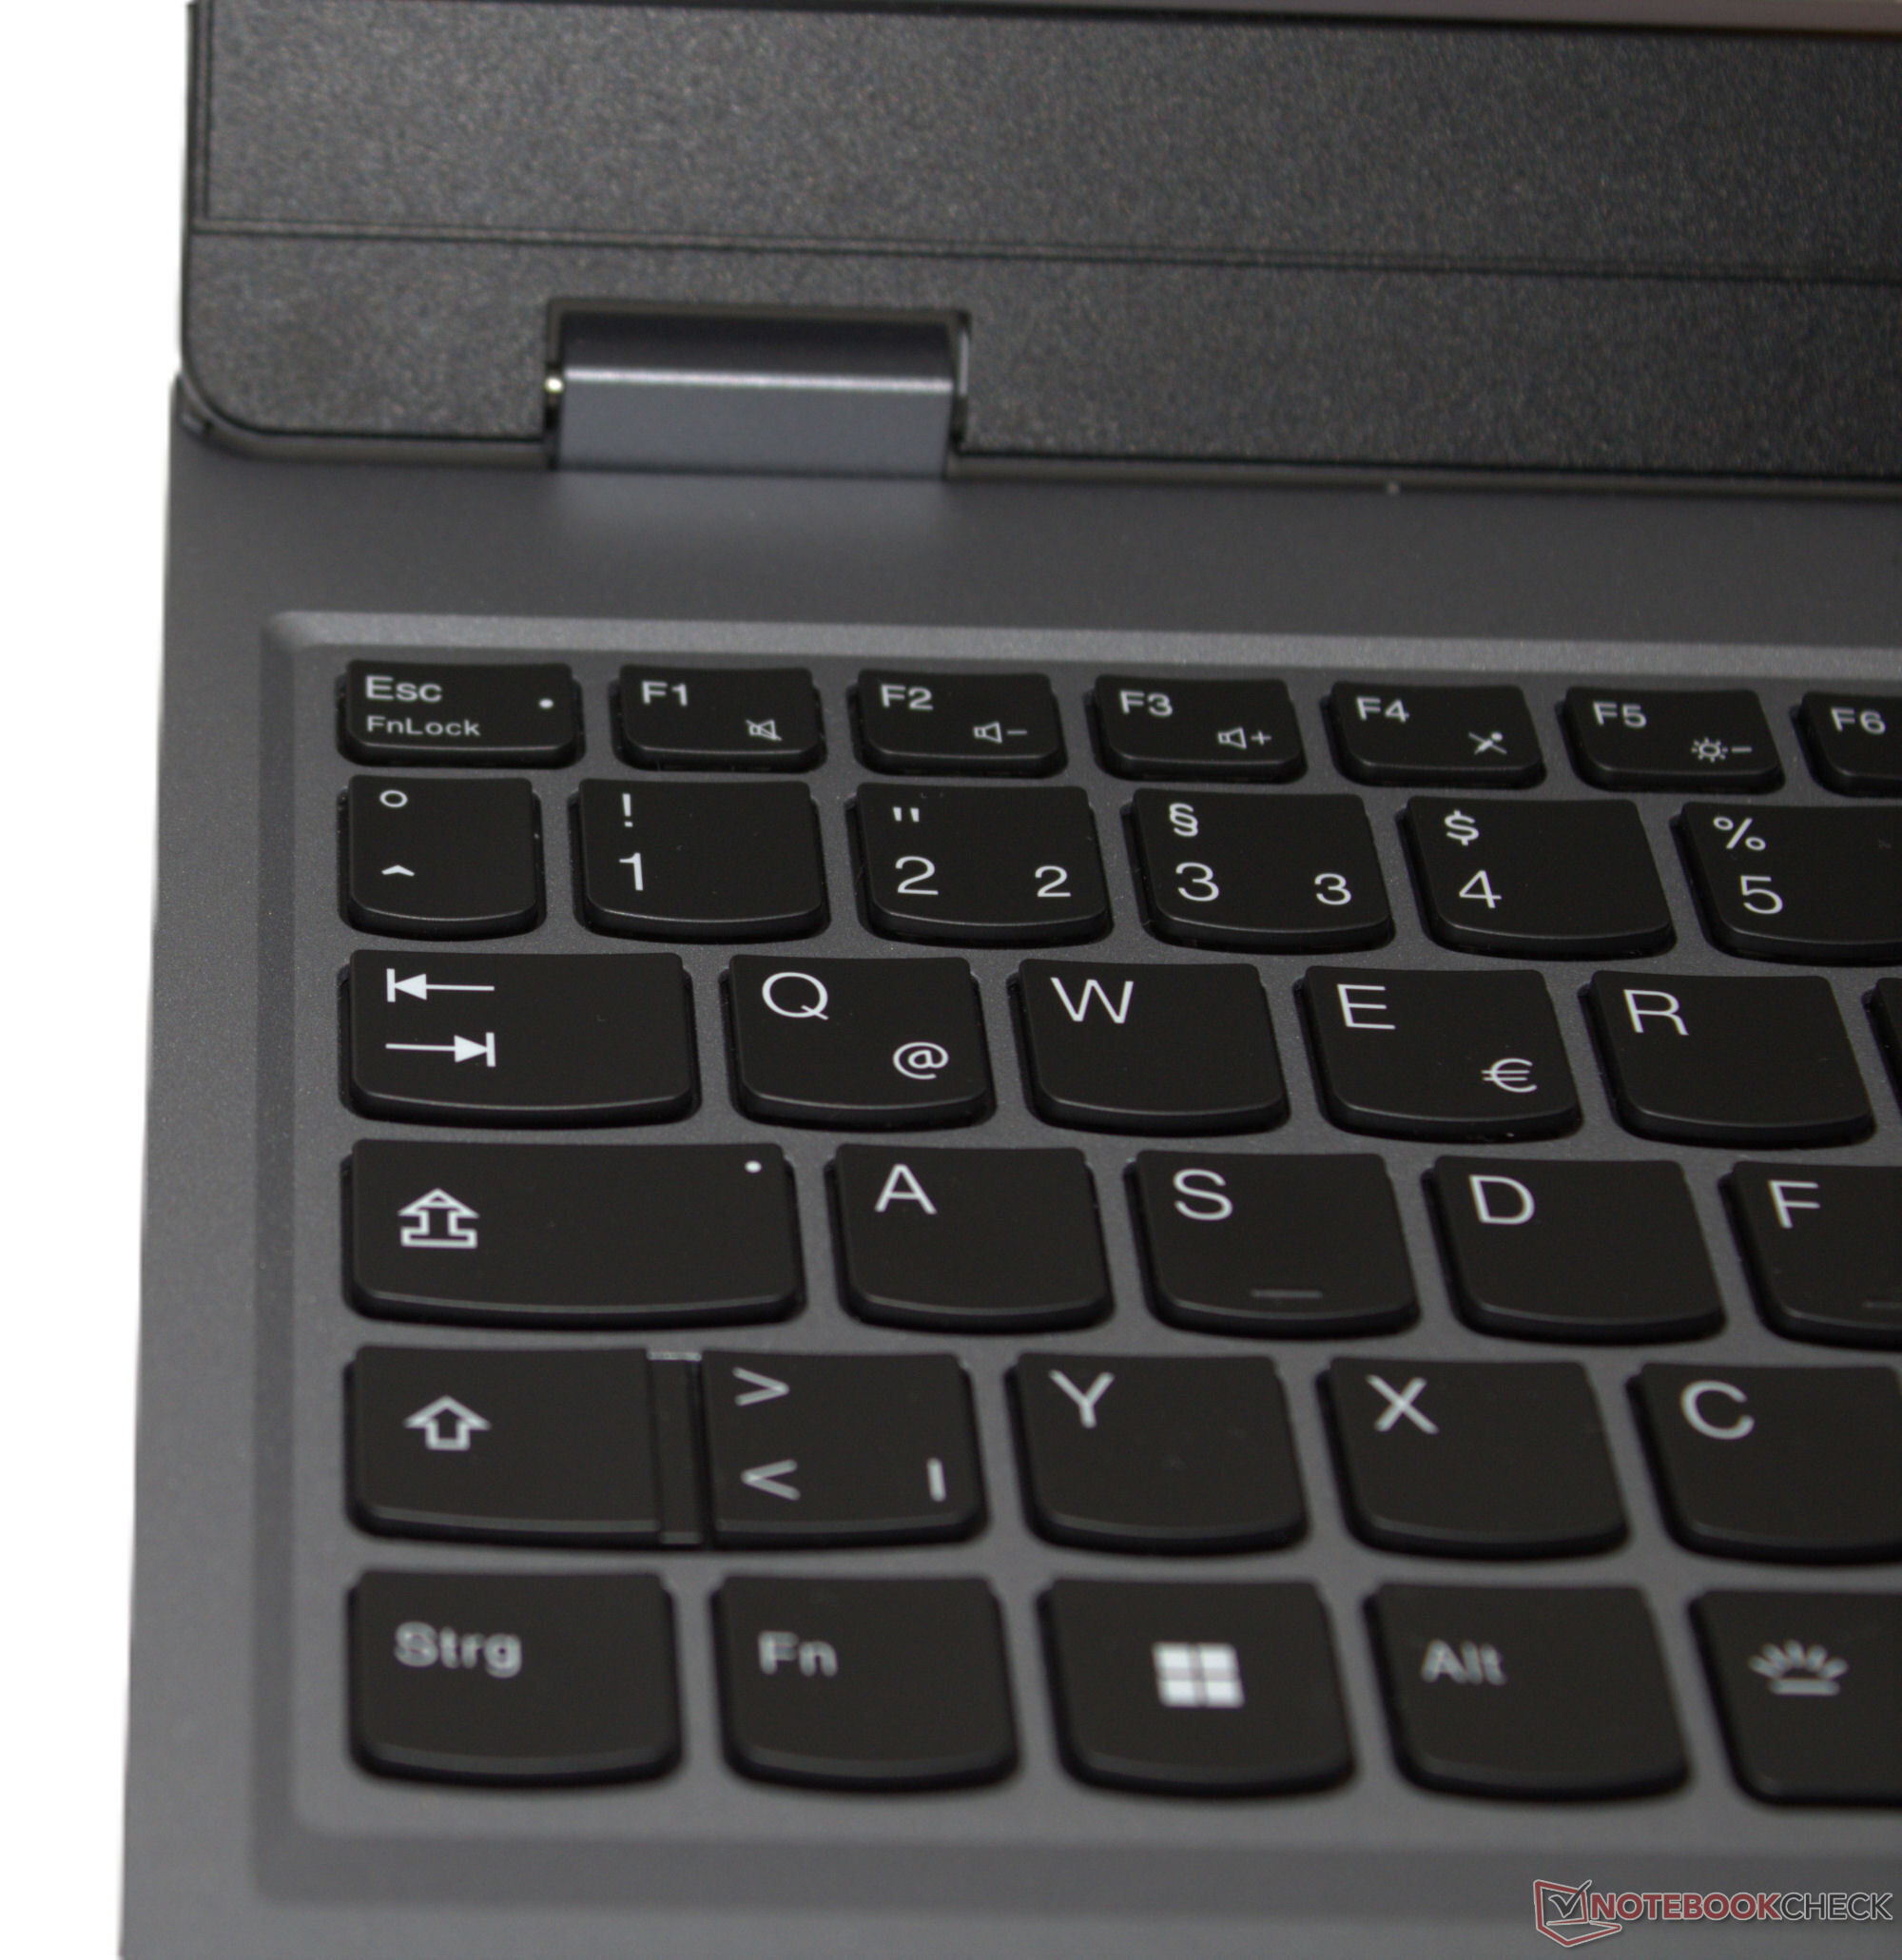
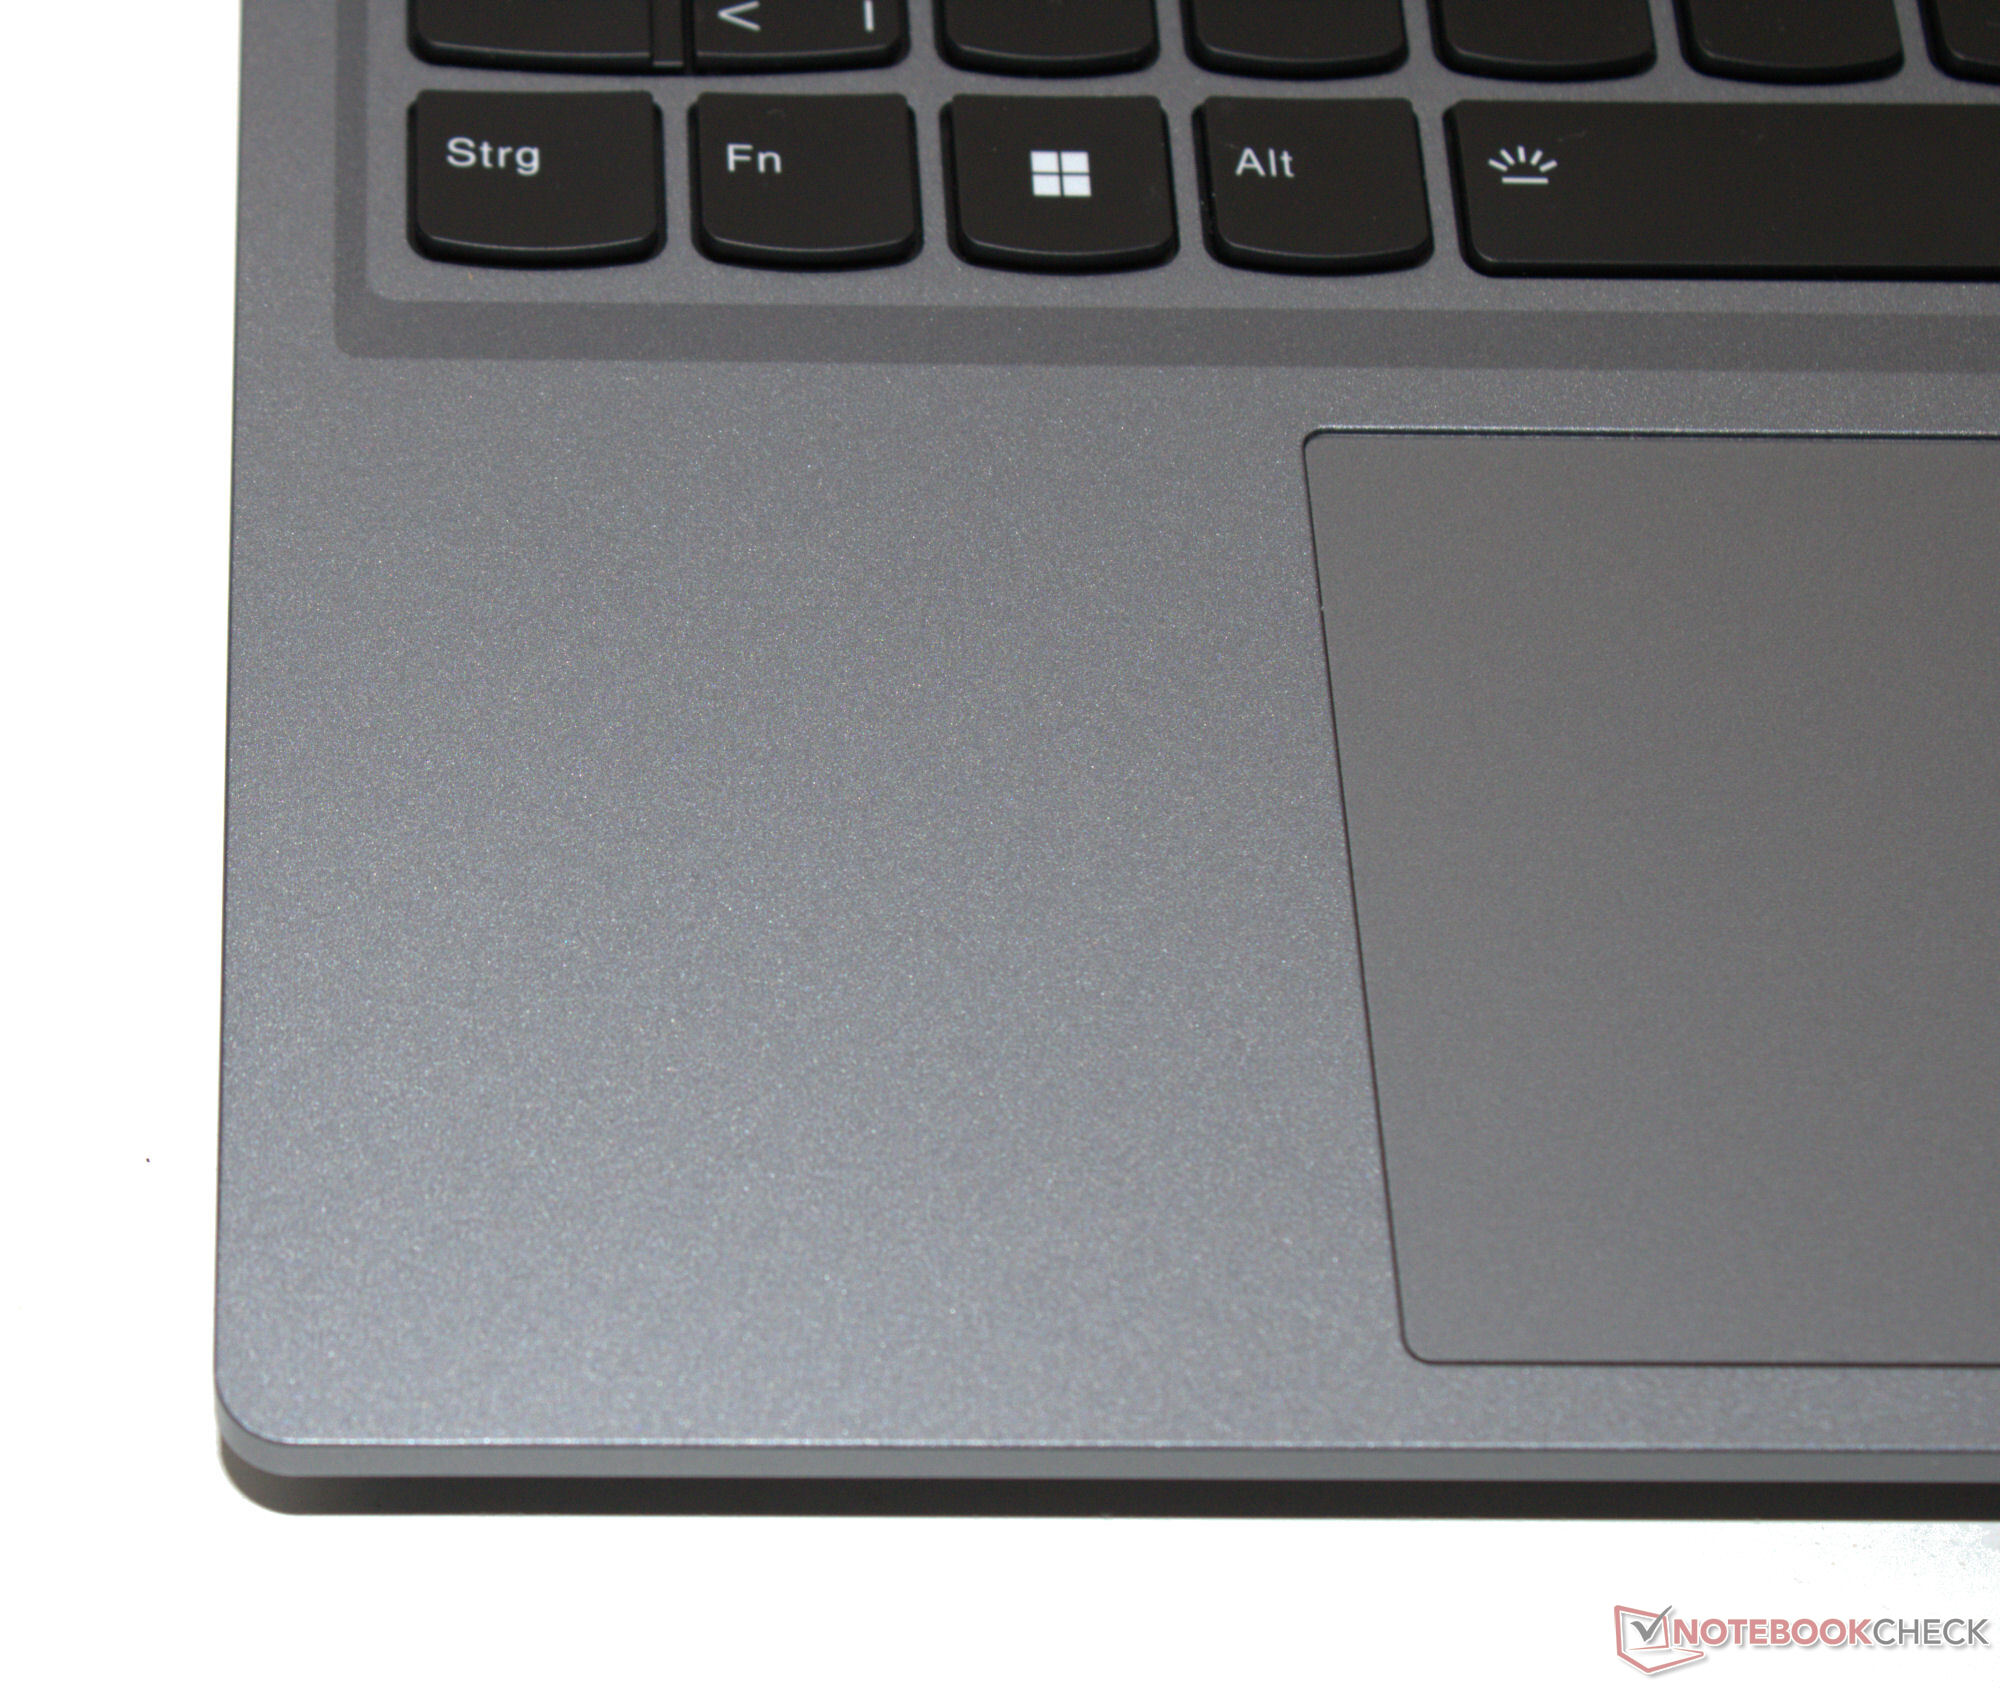
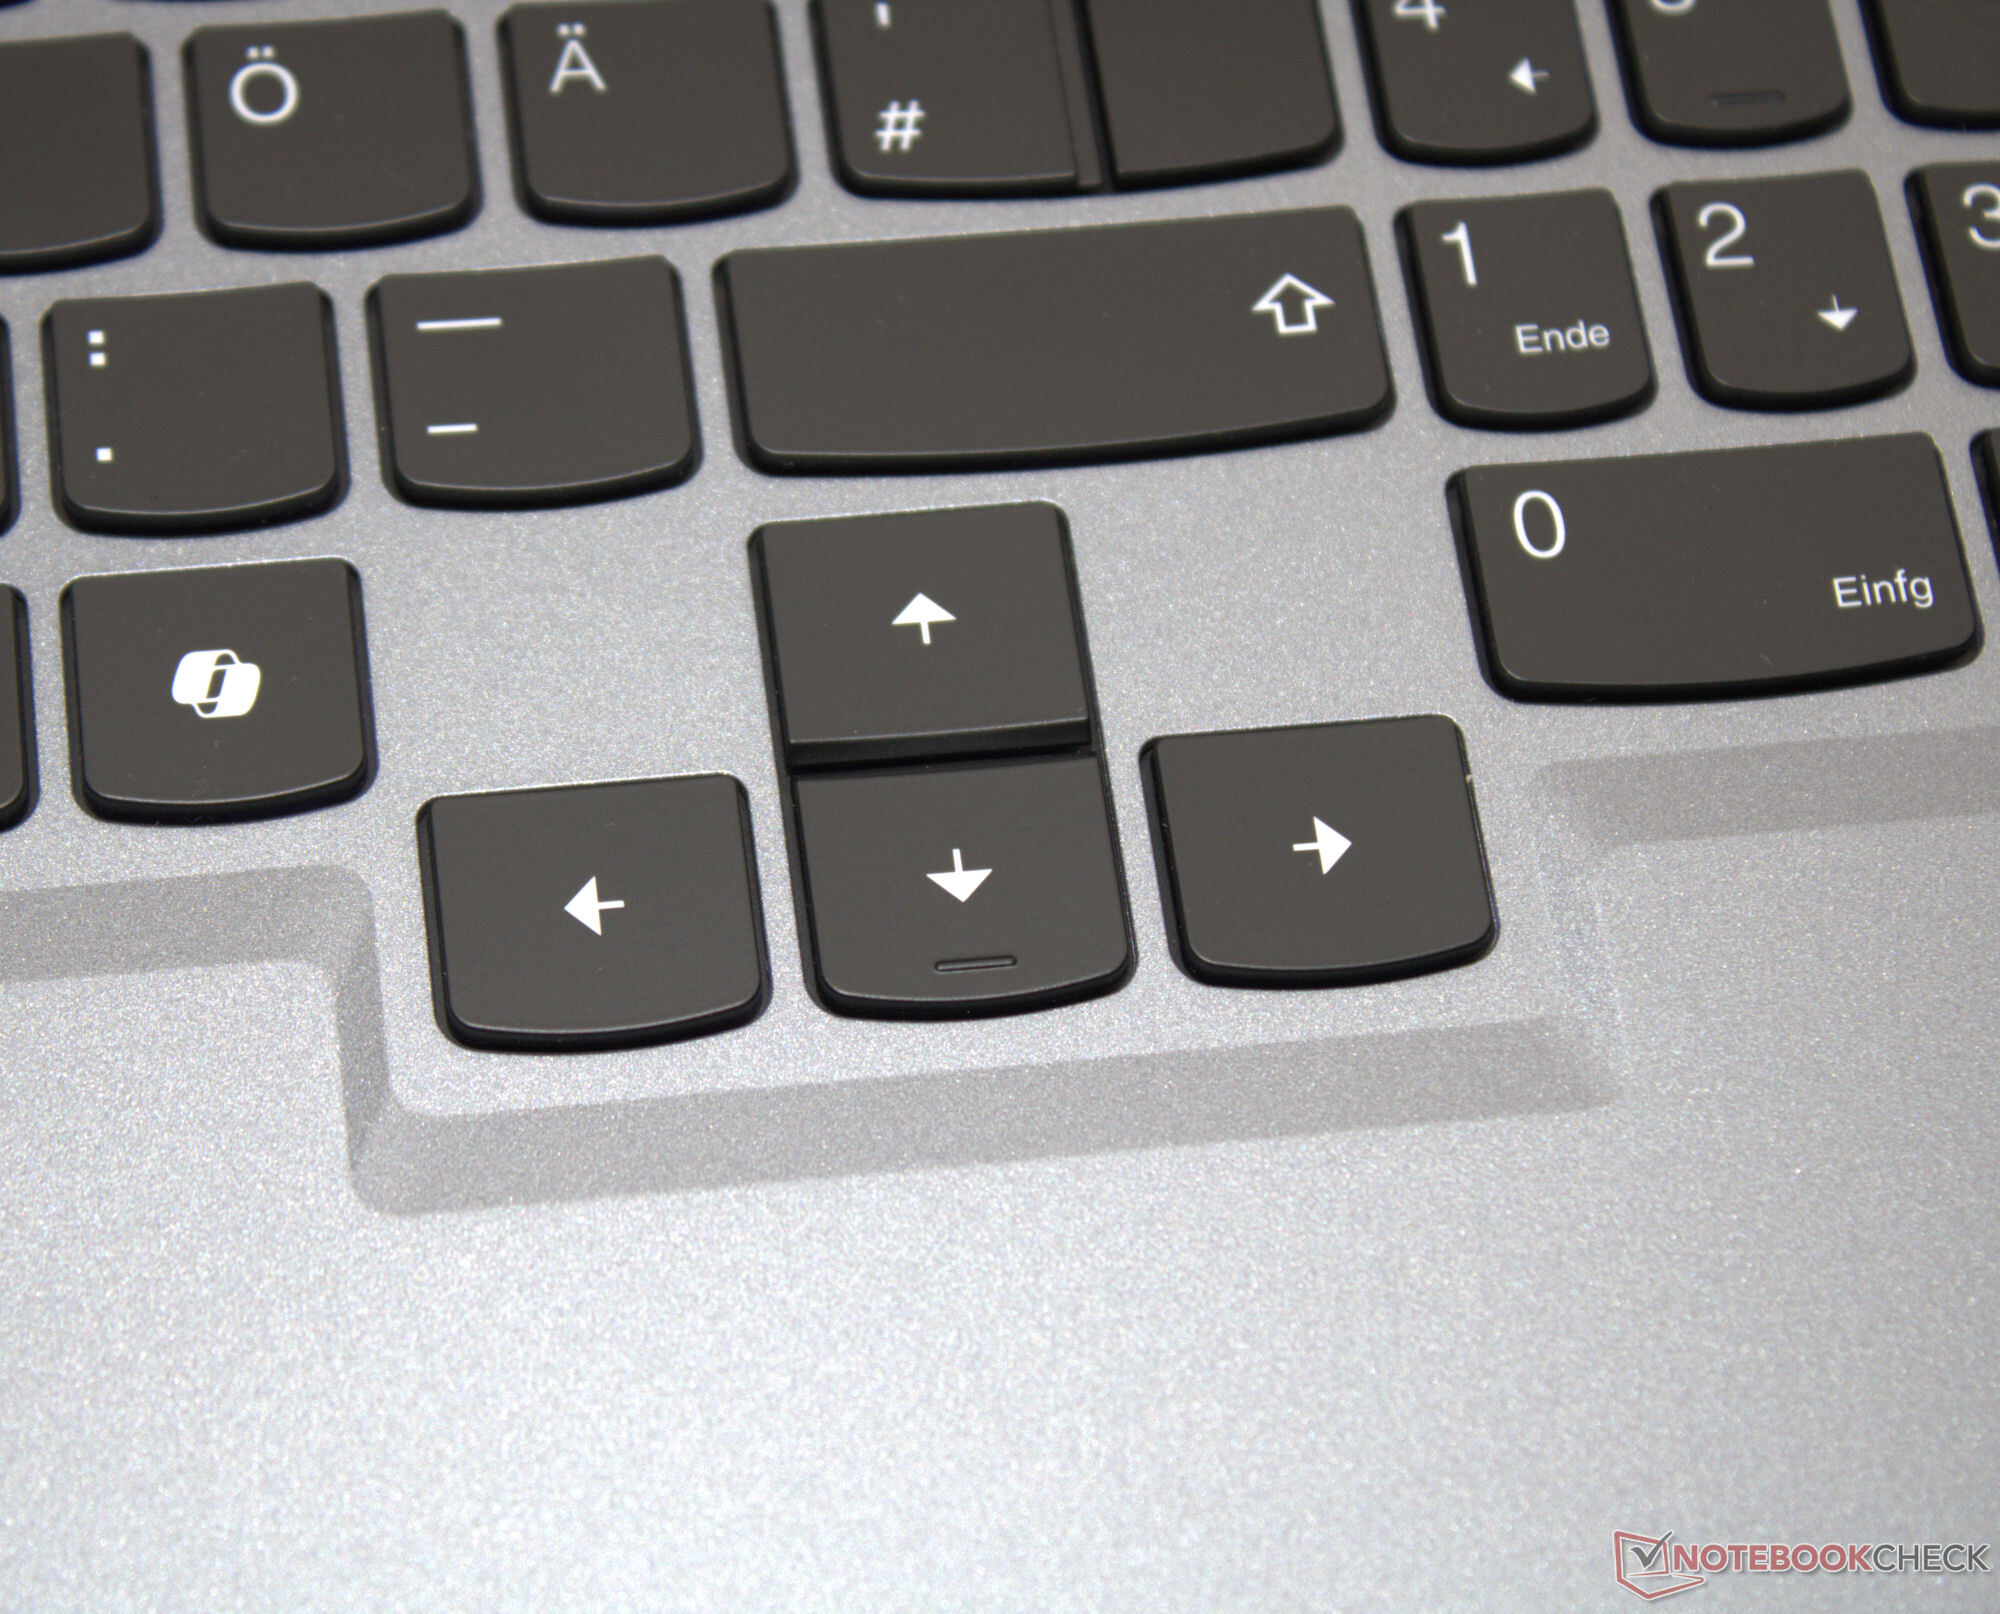
Dispositivi di input - Il portatile Lenovo è dotato di grandi tasti freccia
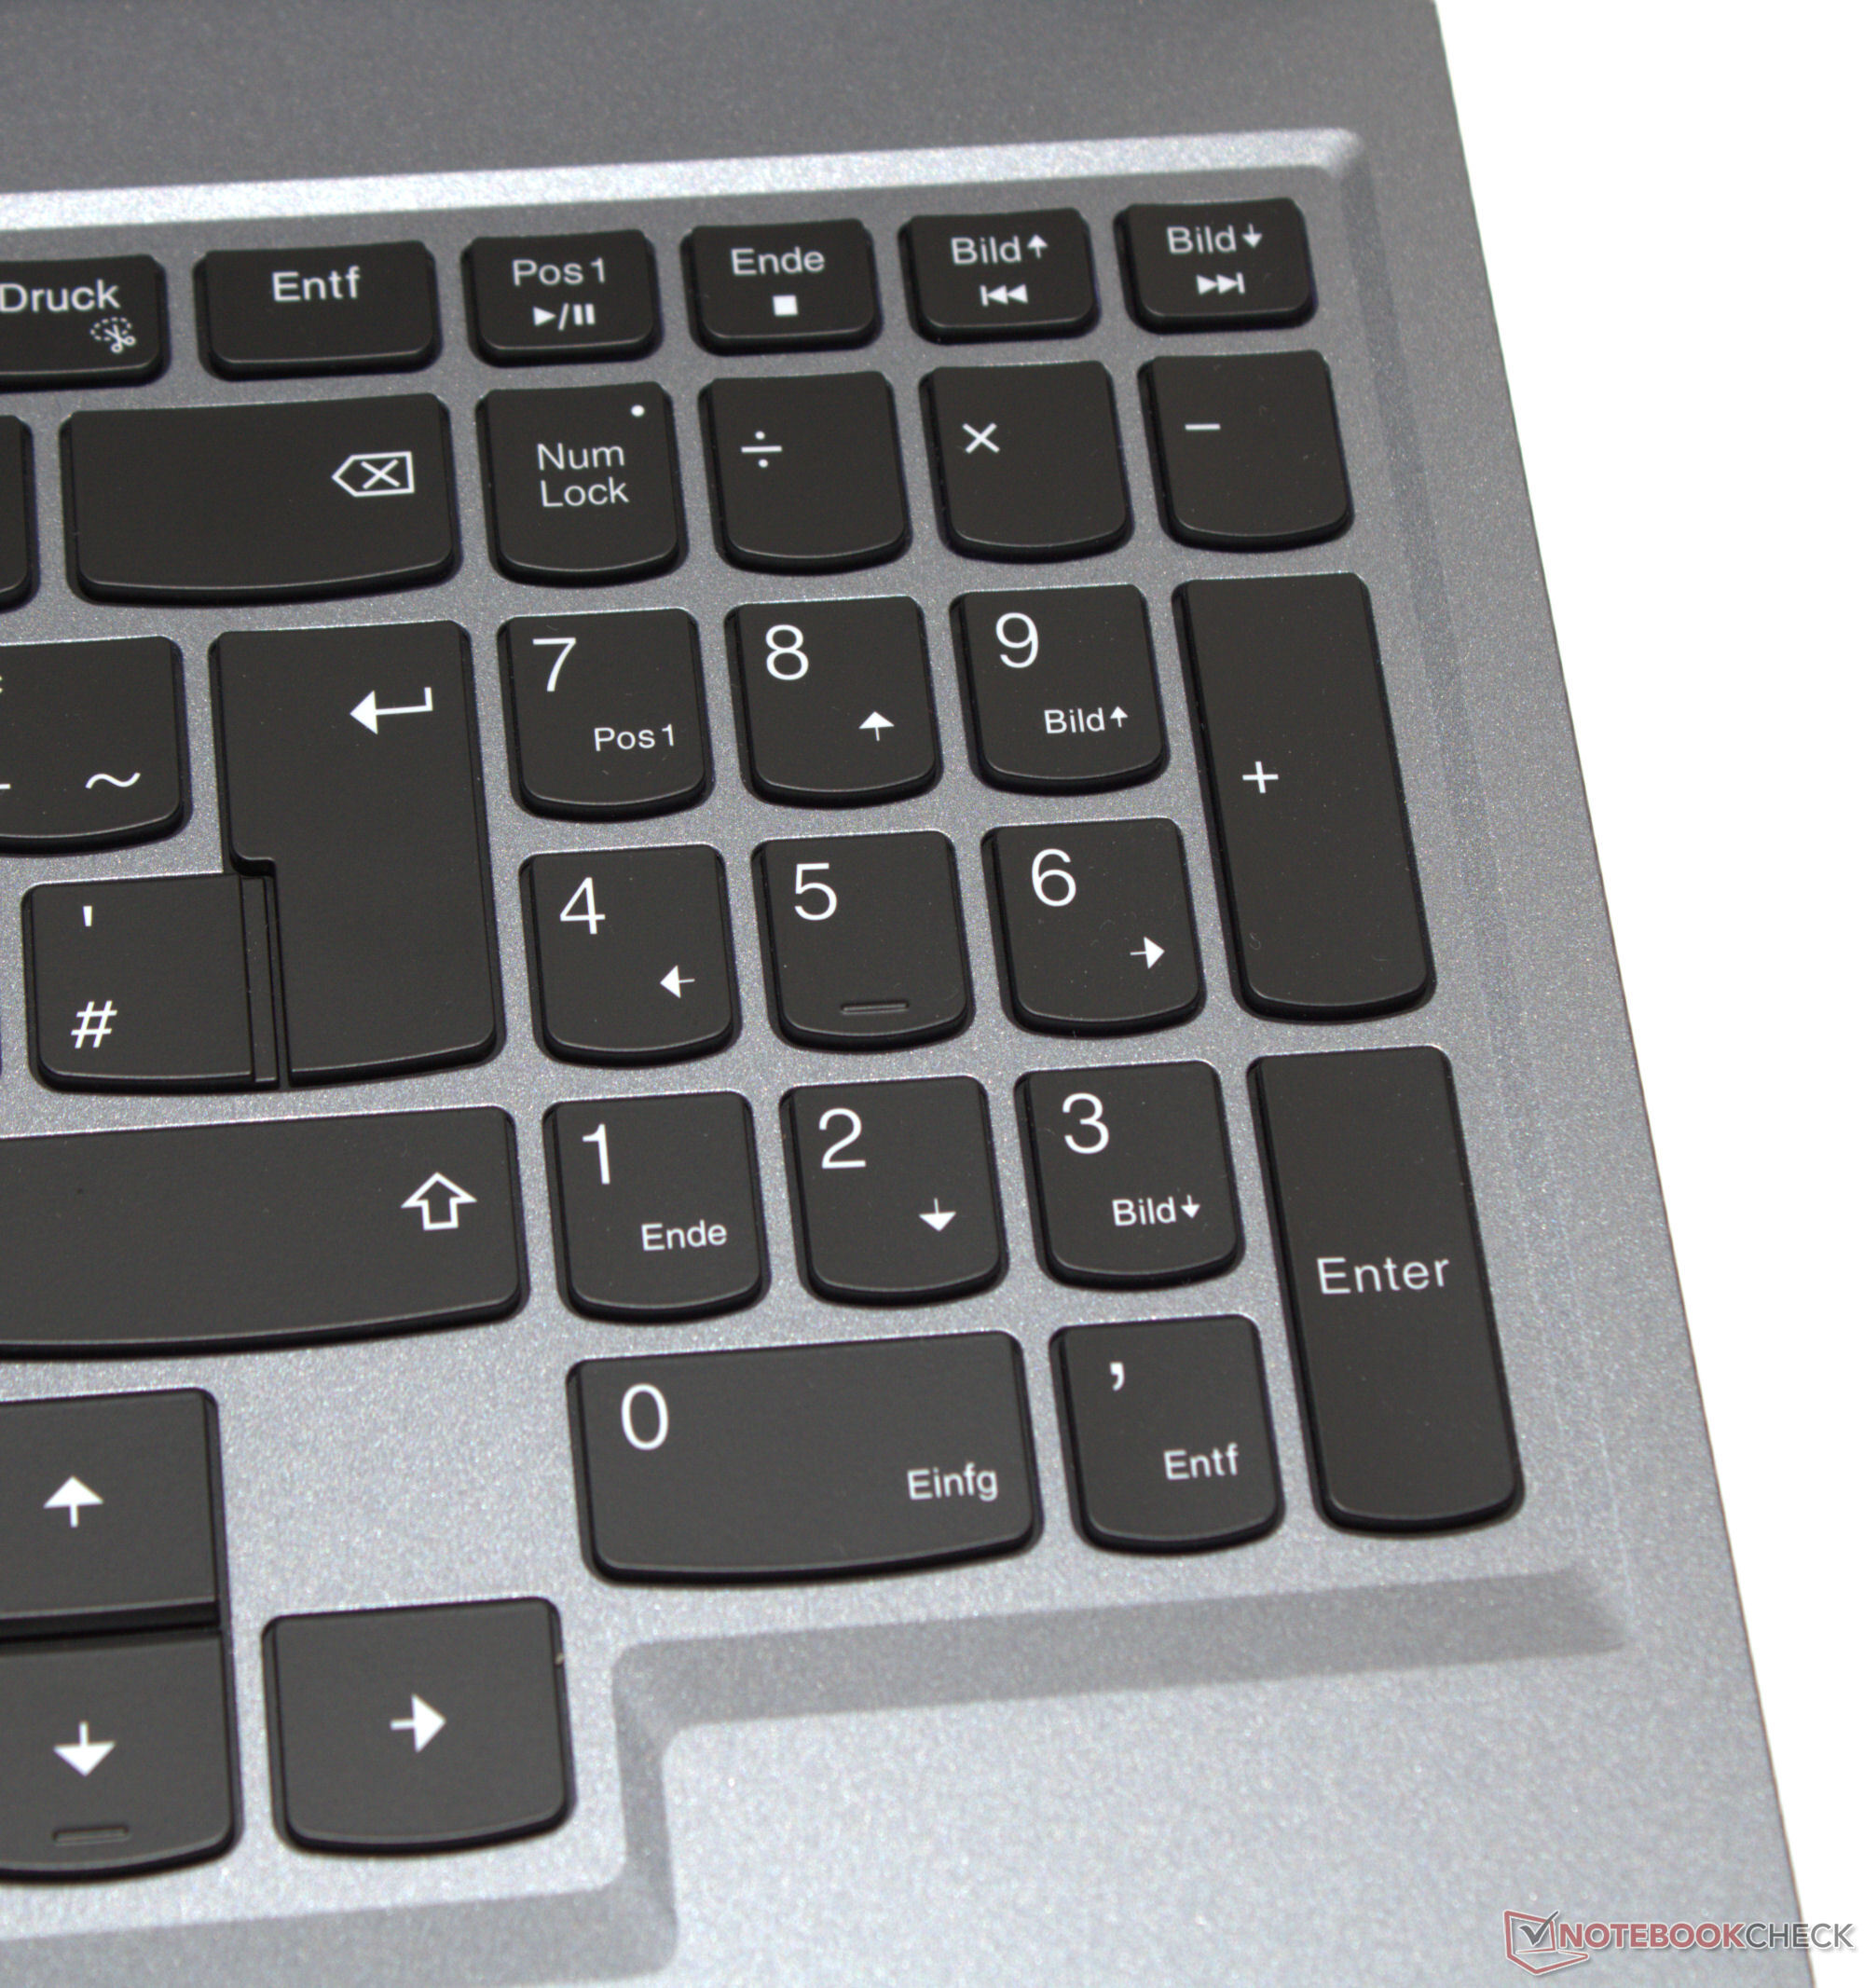
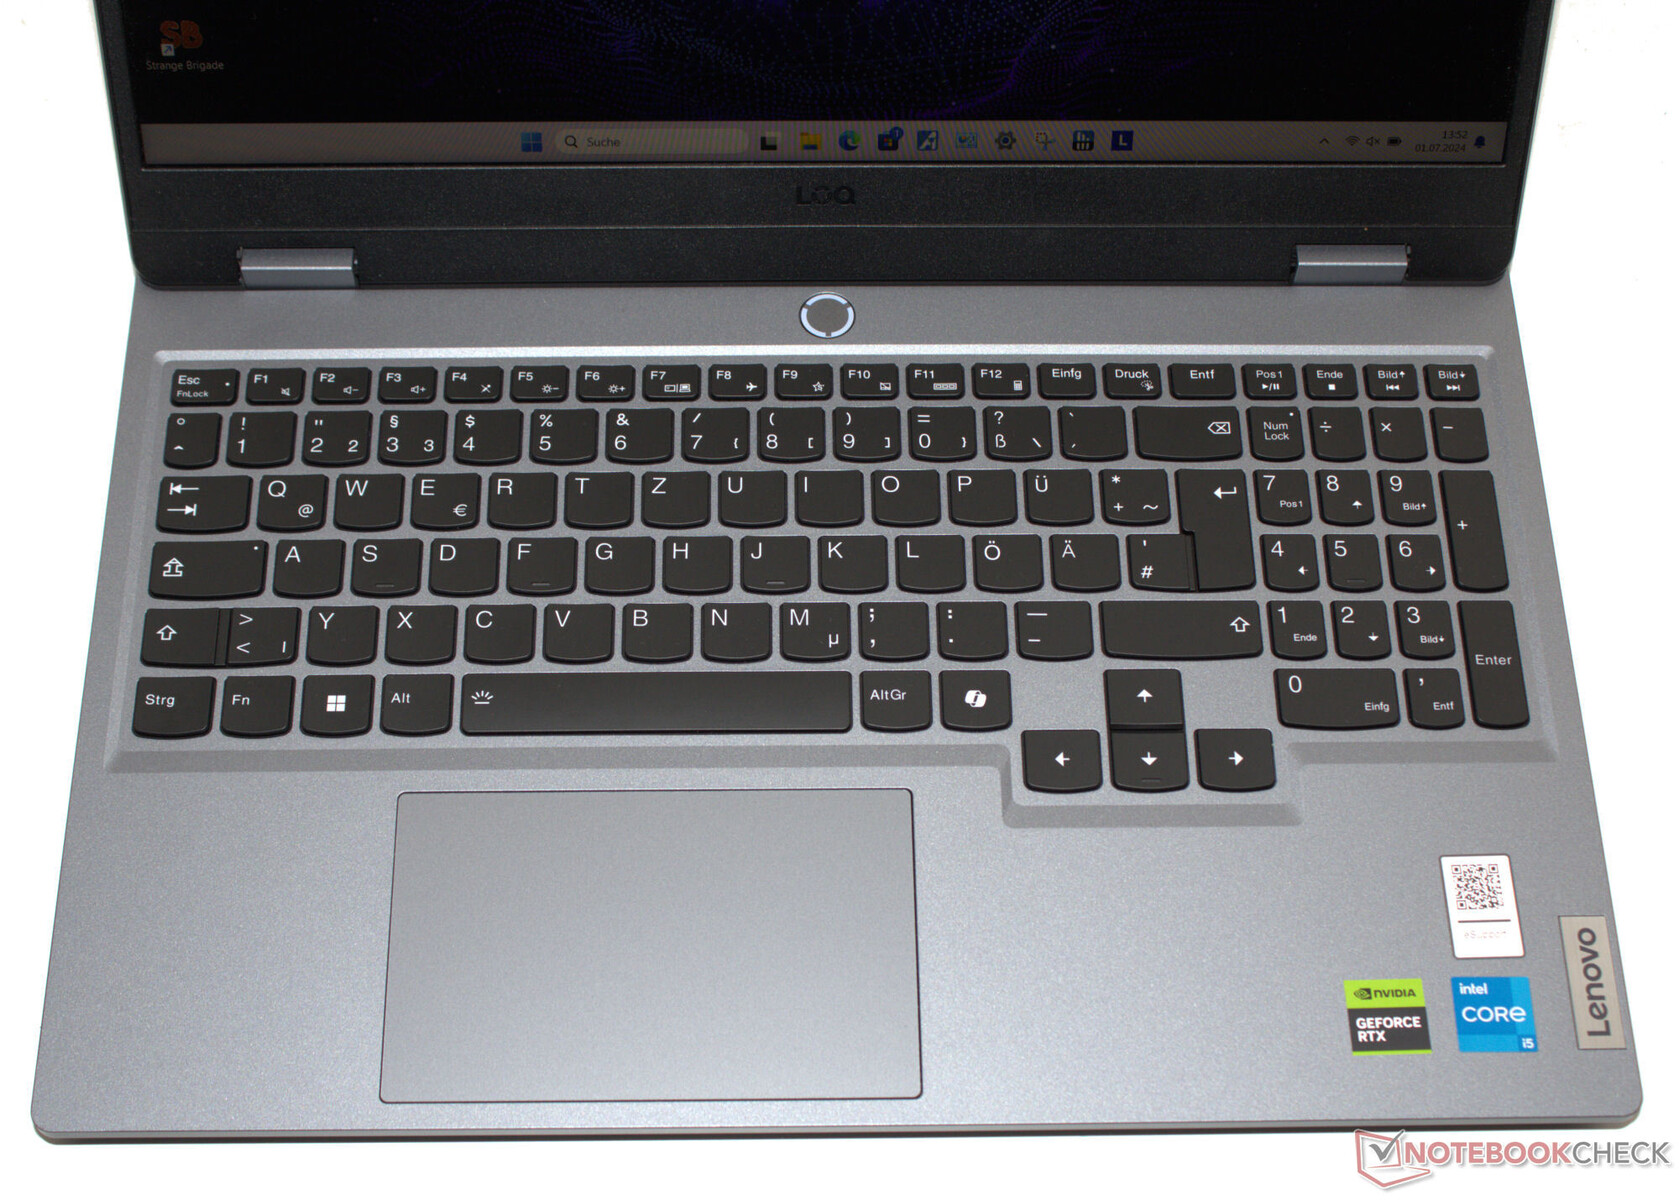
La tastiera chiclet con retroilluminazione bianca si estende per tutta la larghezza del portatile e in più è dotata di un tastierino numerico. La forma e la disposizione dei tasti corrispondono al familiare layout Lenovo. I tasti concavi offrono una buona resistenza e un chiaro punto di pressione. La tastiera cede leggermente durante la digitazione, ma non è un problema. Un aspetto positivo: I tasti freccia sfalsati e a grandezza naturale sono comodi da usare. Un clickpad multi-touch (circa 12 x 7,5 cm) con un breve sollevamento e un chiaro punto di pressione funge da sostituto del mouse.
Display - IPS a bordo
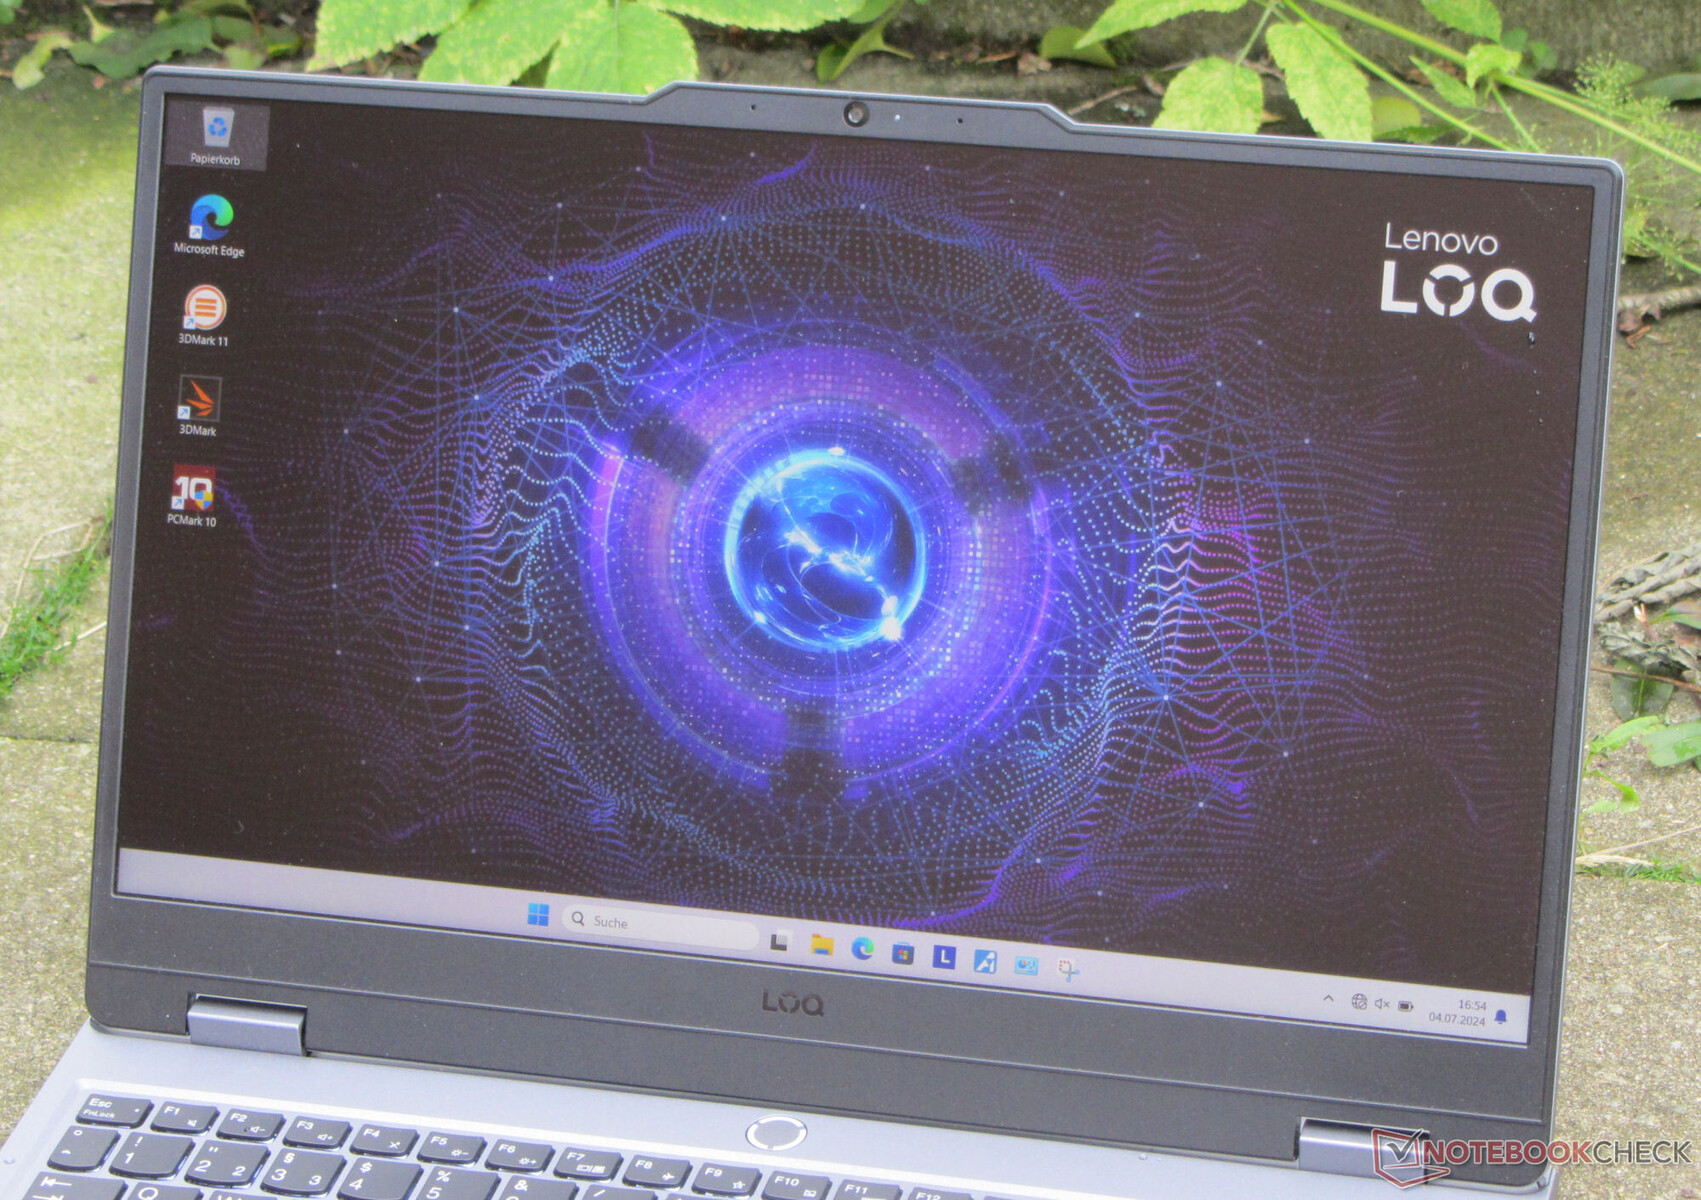
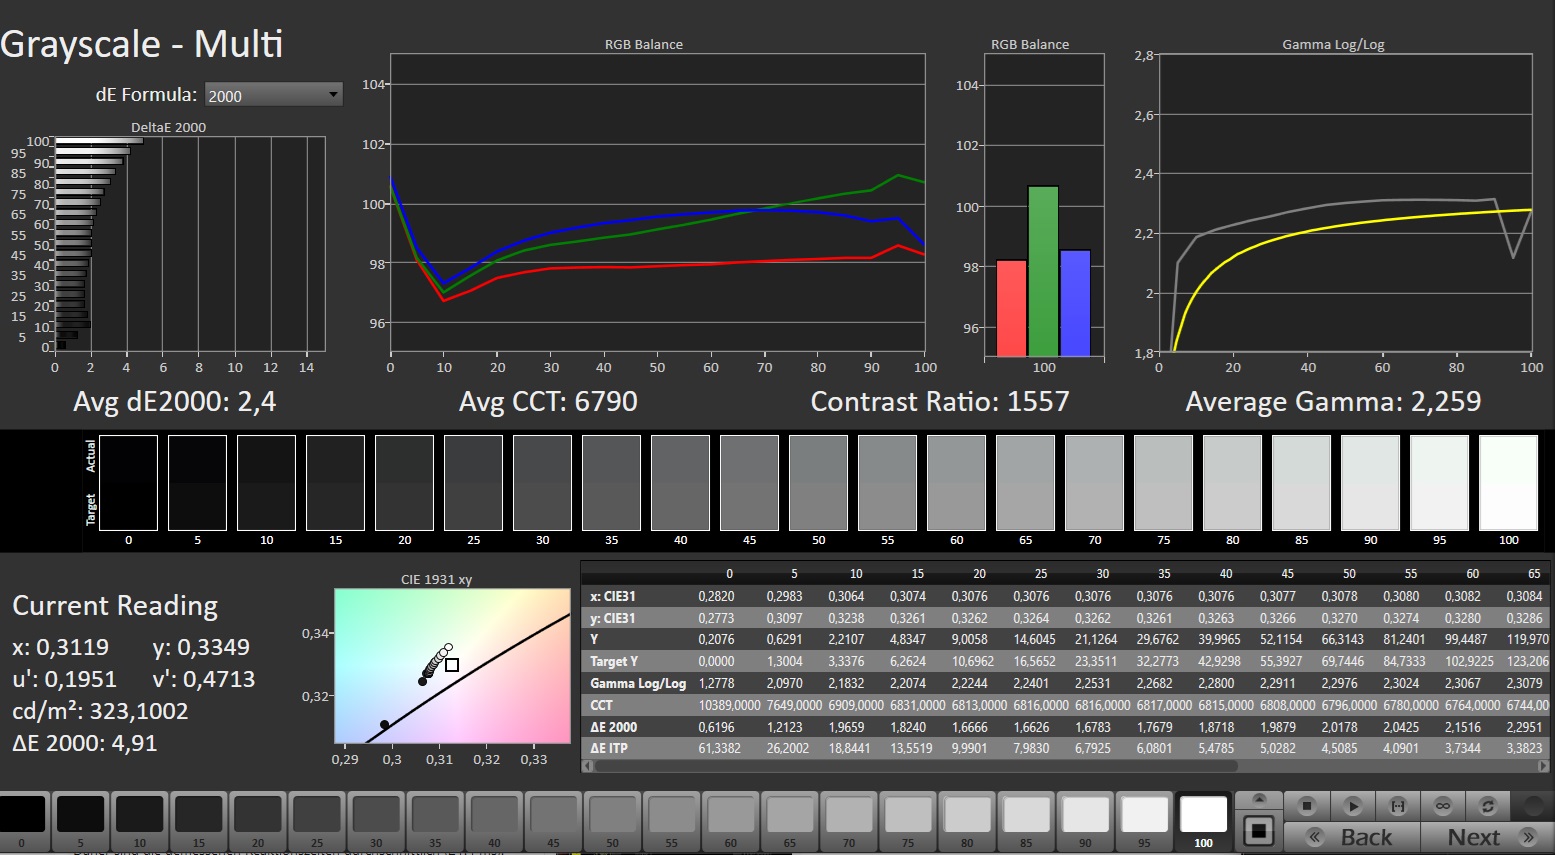
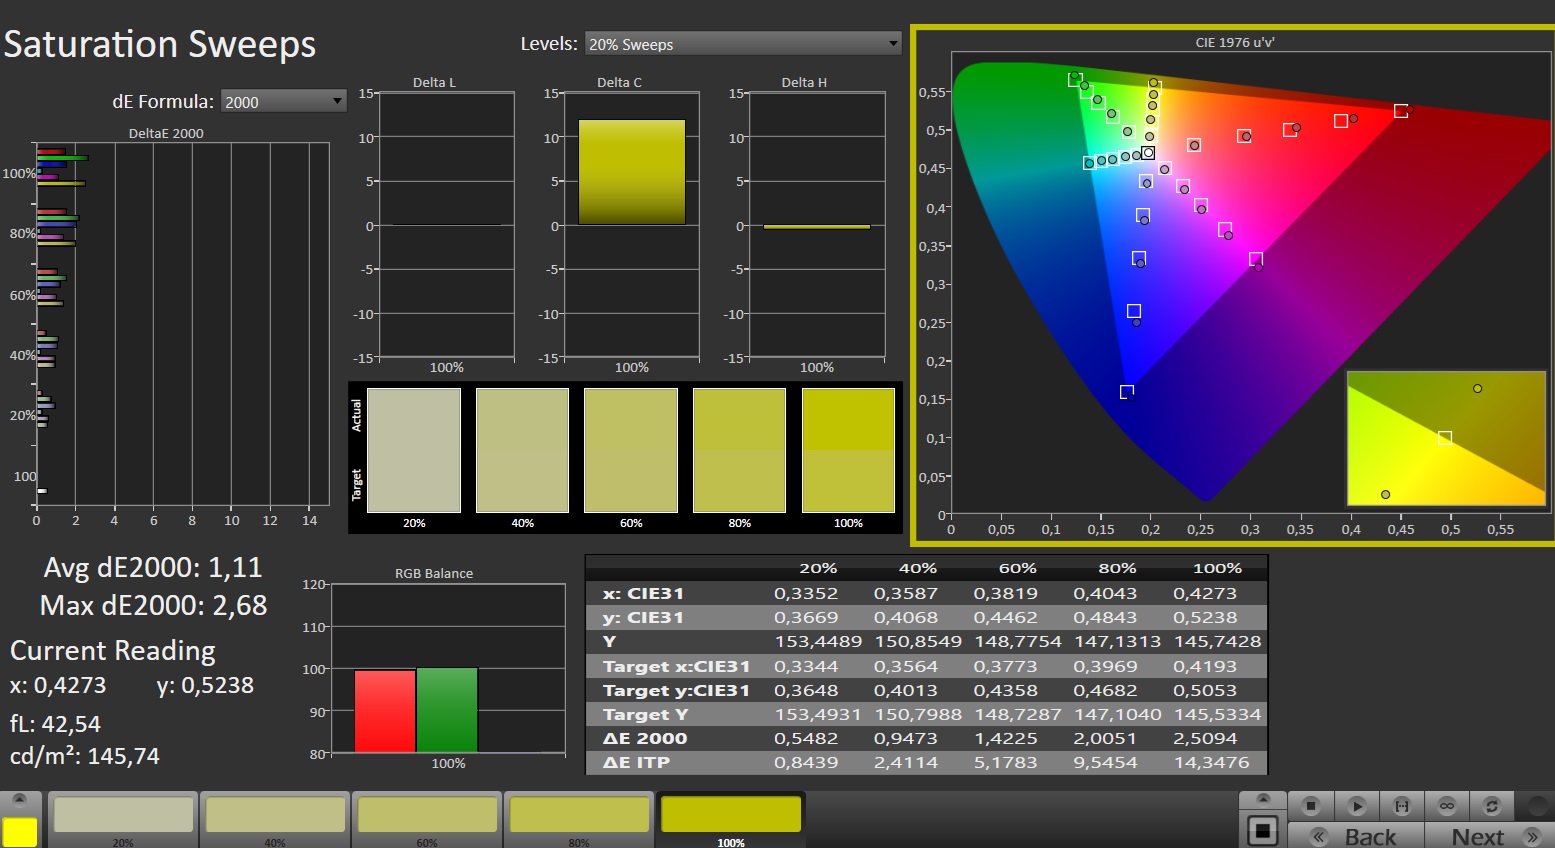
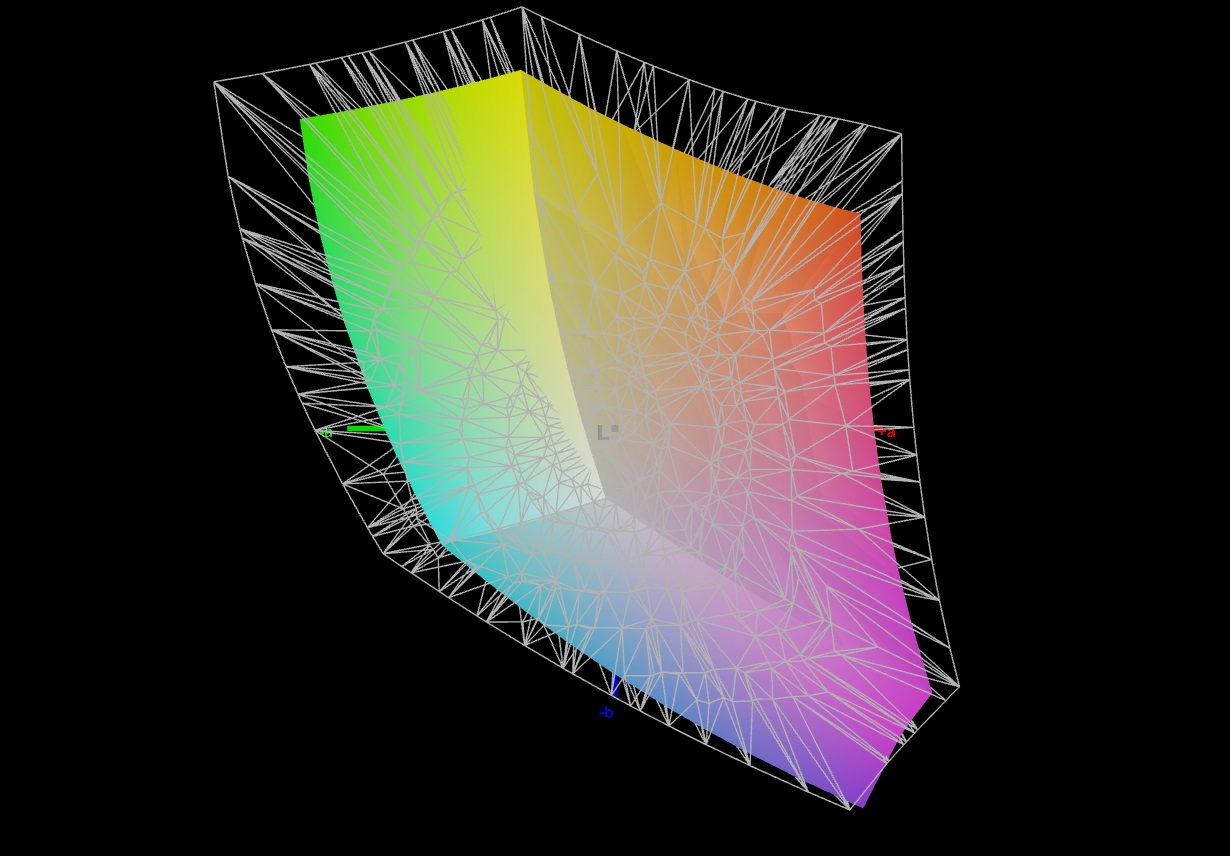
Lenovo ha dotato il LOQ di un pannello (FHD, IPS) da 144 Hz, stabile sull'angolo di visione, con un rapporto d'aspetto di 16:9 e supporto G-Sync. I buoni contrasti sono compensati da una luminosità massima leggermente troppo bassa. In generale, il display è progettato per l'uso in interni, ma potrebbe essere letto anche all'aperto in condizioni atmosferiche adeguate. Nel nostro test non è stato rilevato lo sfarfallio PWM.

| |||||||||||||||||||||||||
Distribuzione della luminosità: 88 %
Al centro con la batteria: 306 cd/m²
Contrasto: 1457:1 (Nero: 0.21 cd/m²)
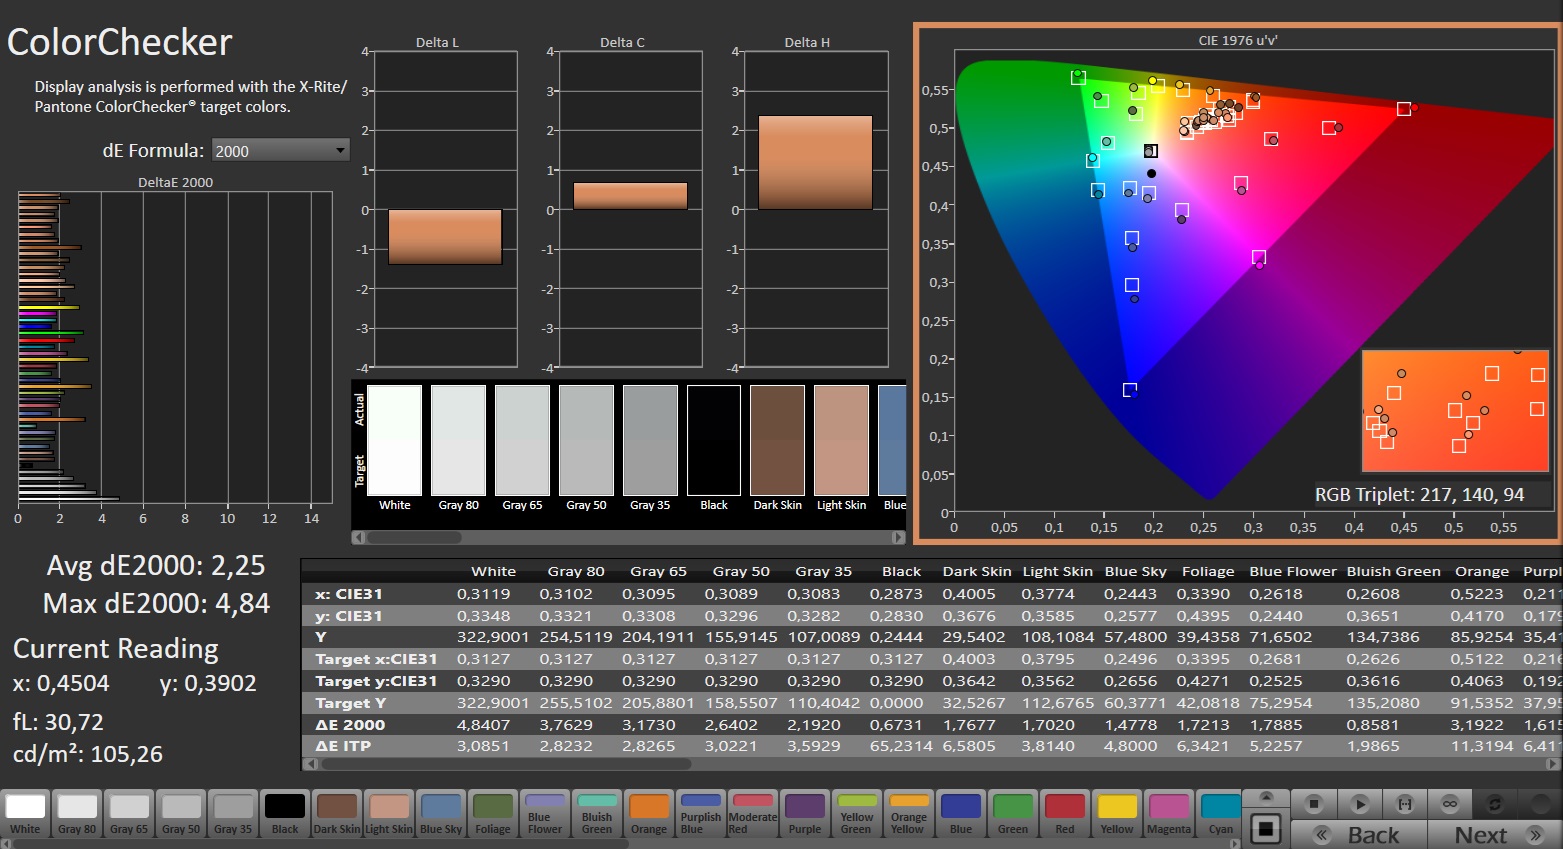
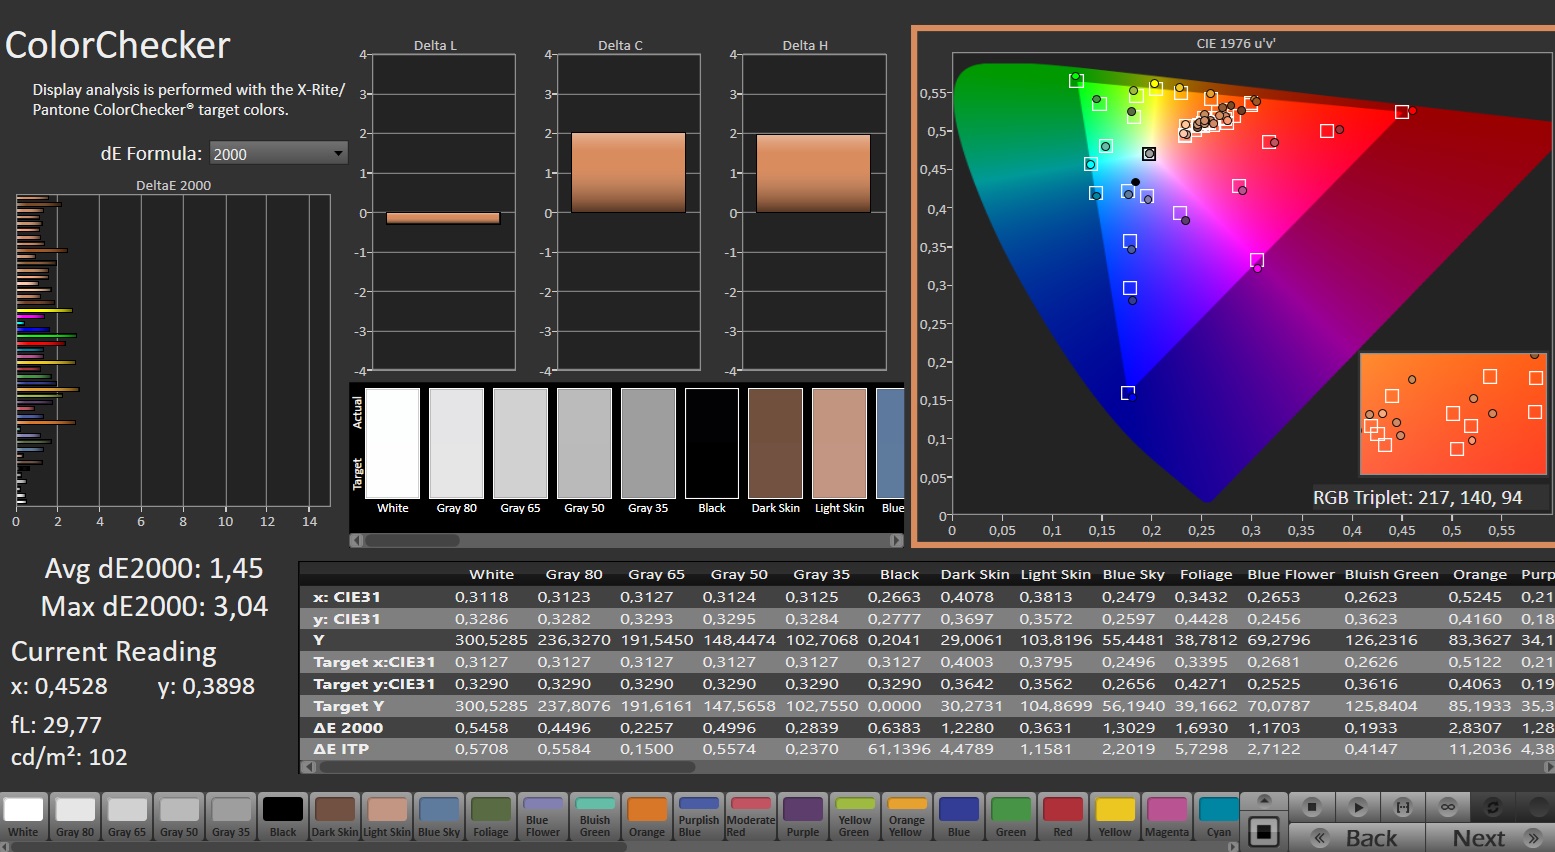
ΔE Color 2.25 | 0.5-29.43 Ø4.87, calibrated: 1.45
ΔE Greyscale 2.4 | 0.5-98 Ø5.1
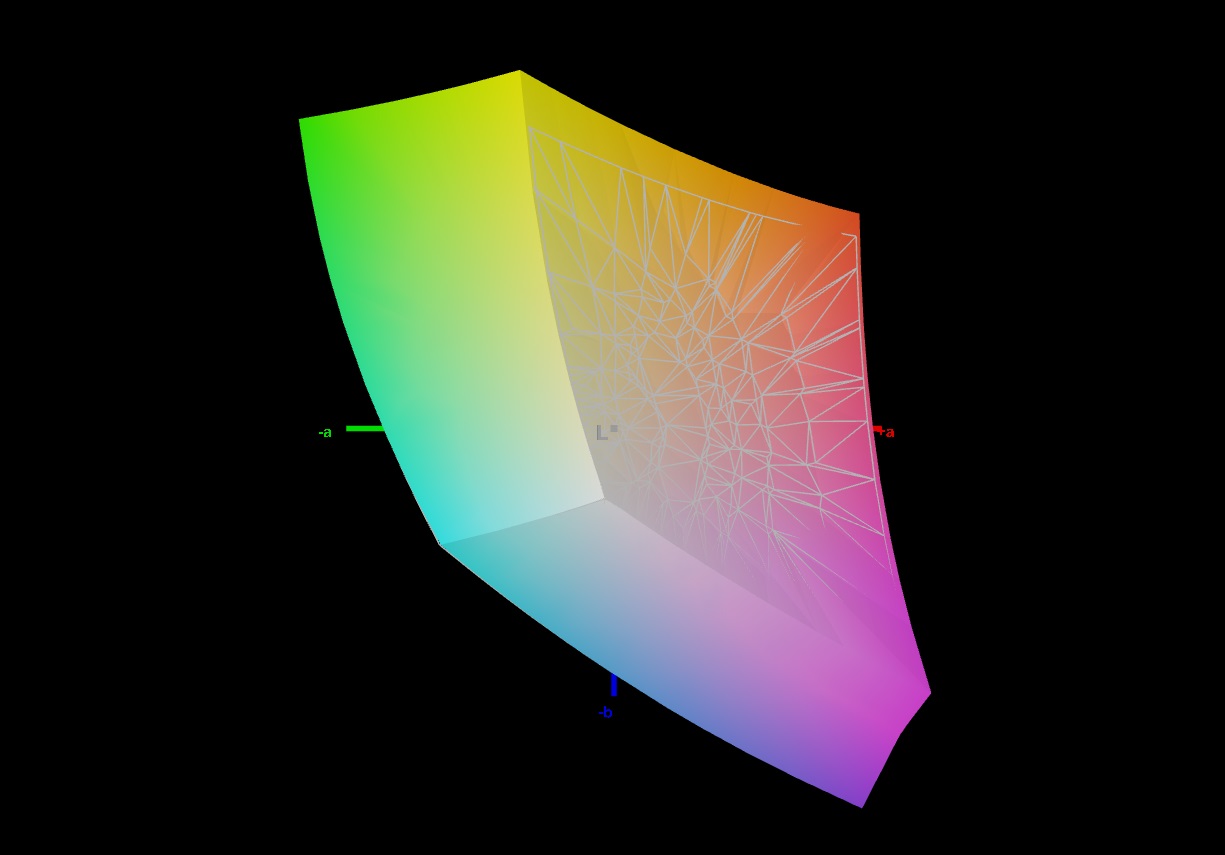
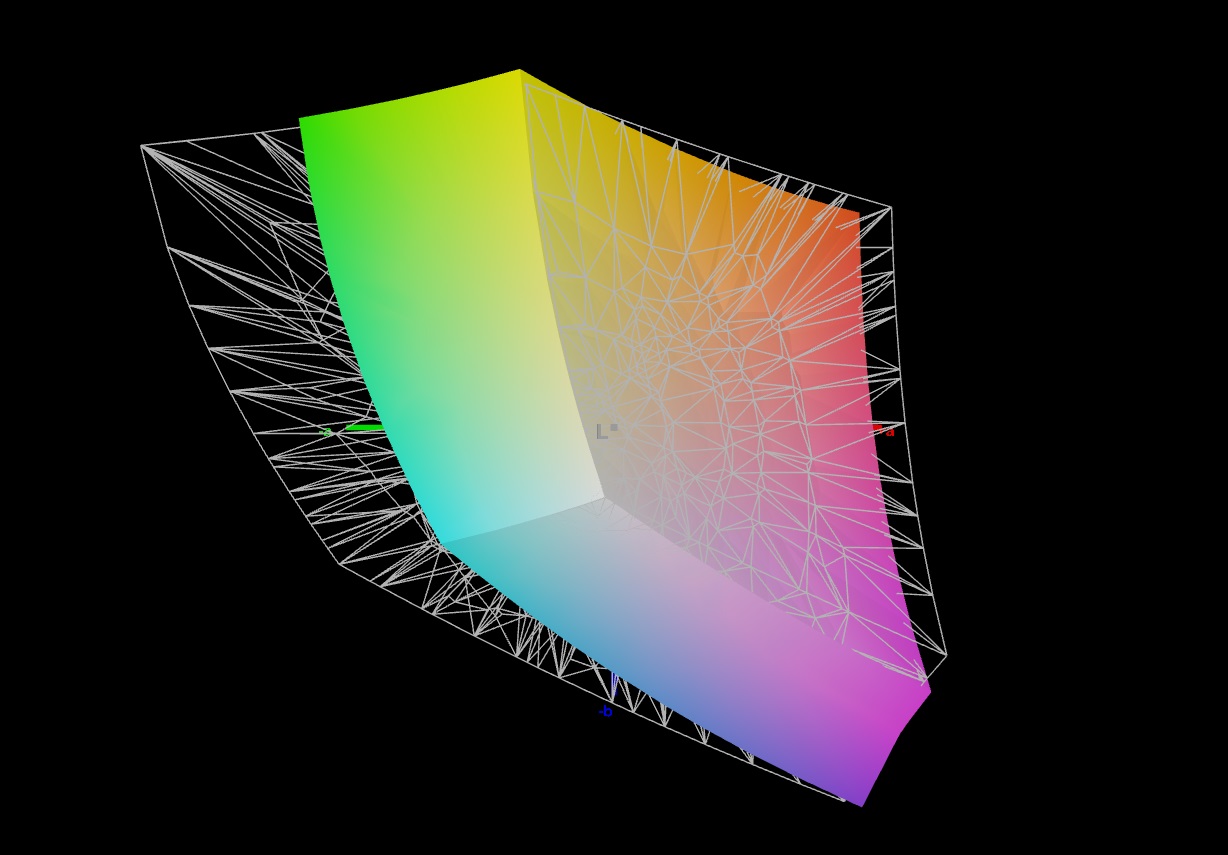
72.6% AdobeRGB 1998 (Argyll 2.2.0 3D)
99.1% sRGB (Argyll 2.2.0 3D)
73.7% Display P3 (Argyll 2.2.0 3D)
Gamma: 2.259
| Lenovo LOQ 15IRX9 BOE NJ NE156FHM-NX9, IPS, 1920x1080, 15.6" | SCHENKER XMG Core 15 (M24) BOE NJ NE153QDM-NZ1 (BOE0C8E), IPS, 2560x1600, 15.3" | Gigabyte G6X 9KG (2024) BOE NE160WUM-NX6, IPS, 1920x1200, 16" | HP Victus 16 (2024) Chi Mei CMN163E, IPS, 1920x1080, 16.1" | Dell G16, i7-13650HX, RTX 4060 Chi Mei CMN161D (160GME), IPS, 2560x1600, 16" | |
|---|---|---|---|---|---|
| Display | 1% | -40% | -41% | -5% | |
| Display P3 Coverage | 73.7 | 73.2 -1% | 41.8 -43% | 41.3 -44% | 67.5 -8% |
| sRGB Coverage | 99.1 | 100 1% | 62.4 -37% | 61.7 -38% | 98.5 -1% |
| AdobeRGB 1998 Coverage | 72.6 | 74.6 3% | 43.3 -40% | 42.7 -41% | 69.3 -5% |
| Response Times | 68% | 4% | 25% | 68% | |
| Response Time Grey 50% / Grey 80% * | 42.2 ? | 9.6 ? 77% | 40.5 ? 4% | 28.6 ? 32% | 7.6 ? 82% |
| Response Time Black / White * | 22.6 ? | 9.2 ? 59% | 21.6 ? 4% | 18.7 ? 17% | 10.4 ? 54% |
| PWM Frequency | |||||
| Screen | 6% | -68% | -78% | -15% | |
| Brightness middle | 306 | 635 108% | 353 15% | 287 -6% | 369 21% |
| Brightness | 287 | 604 110% | 318 11% | 288 0% | 344 20% |
| Brightness Distribution | 88 | 91 3% | 81 -8% | 86 -2% | 89 1% |
| Black Level * | 0.21 | 0.64 -205% | 0.21 -0% | 0.19 10% | 0.26 -24% |
| Contrast | 1457 | 992 -32% | 1681 15% | 1511 4% | 1419 -3% |
| Colorchecker dE 2000 * | 2.25 | 1.89 16% | 5.21 -132% | 5.46 -143% | 3.04 -35% |
| Colorchecker dE 2000 max. * | 4.84 | 3.14 35% | 19.95 -312% | 20.36 -321% | 5.56 -15% |
| Colorchecker dE 2000 calibrated * | 1.45 | 1.14 21% | 3.61 -149% | 3.52 -143% | 2.35 -62% |
| Greyscale dE 2000 * | 2.4 | 2.53 -5% | 3.6 -50% | 4.8 -100% | 3.38 -41% |
| Gamma | 2.259 97% | 2.36 93% | 2.367 93% | 2.108 104% | 2.47 89% |
| CCT | 6790 96% | 6434 101% | 7138 91% | 6442 101% | 6040 108% |
| Media totale (Programma / Settaggio) | 25% /
14% | -35% /
-52% | -31% /
-55% | 16% /
-1% |
* ... Meglio usare valori piccoli
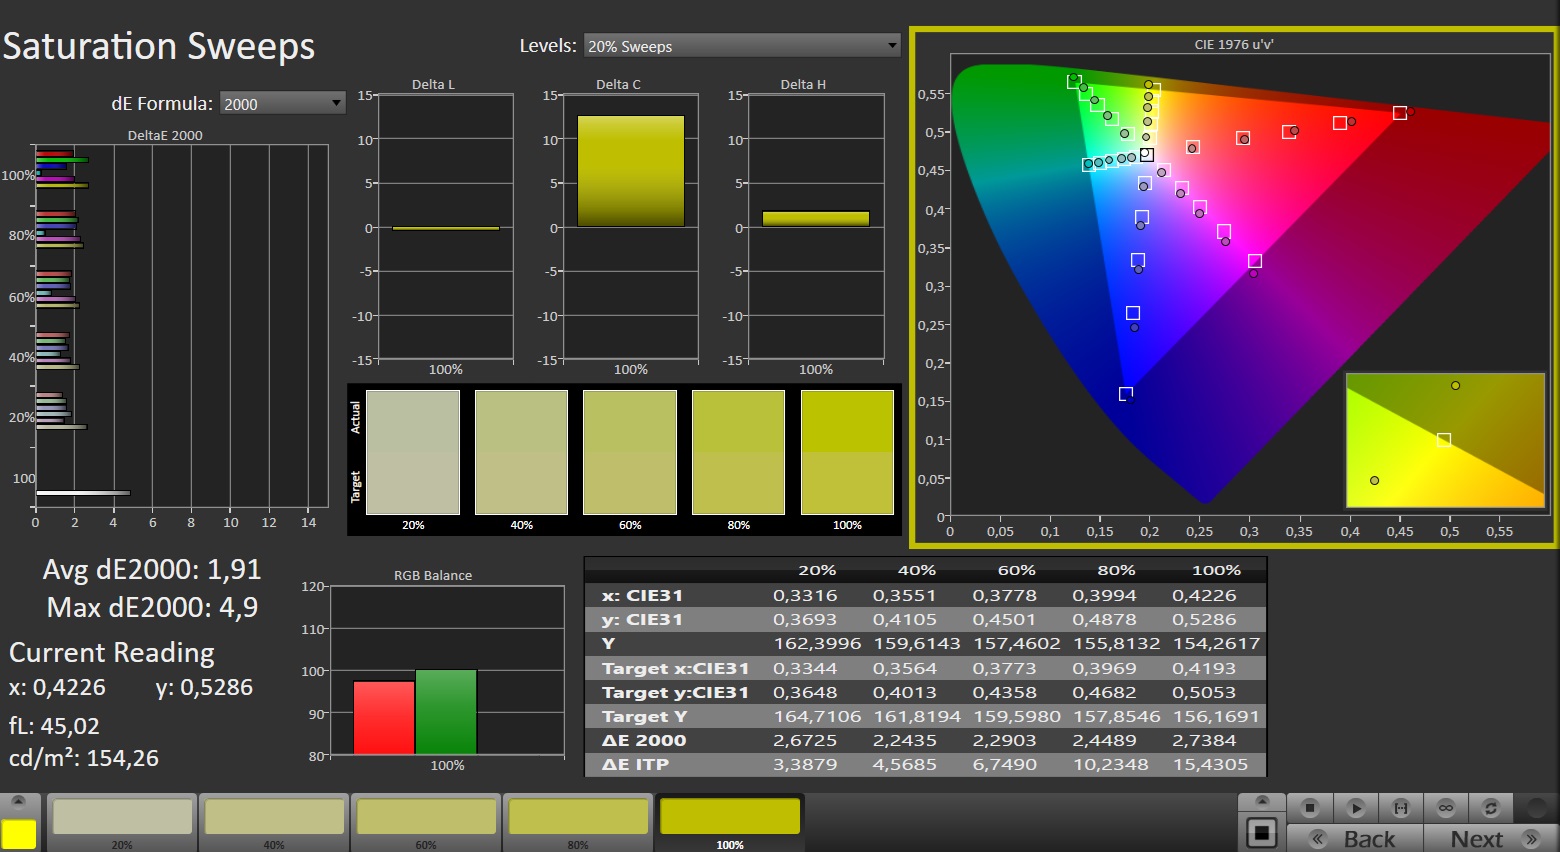
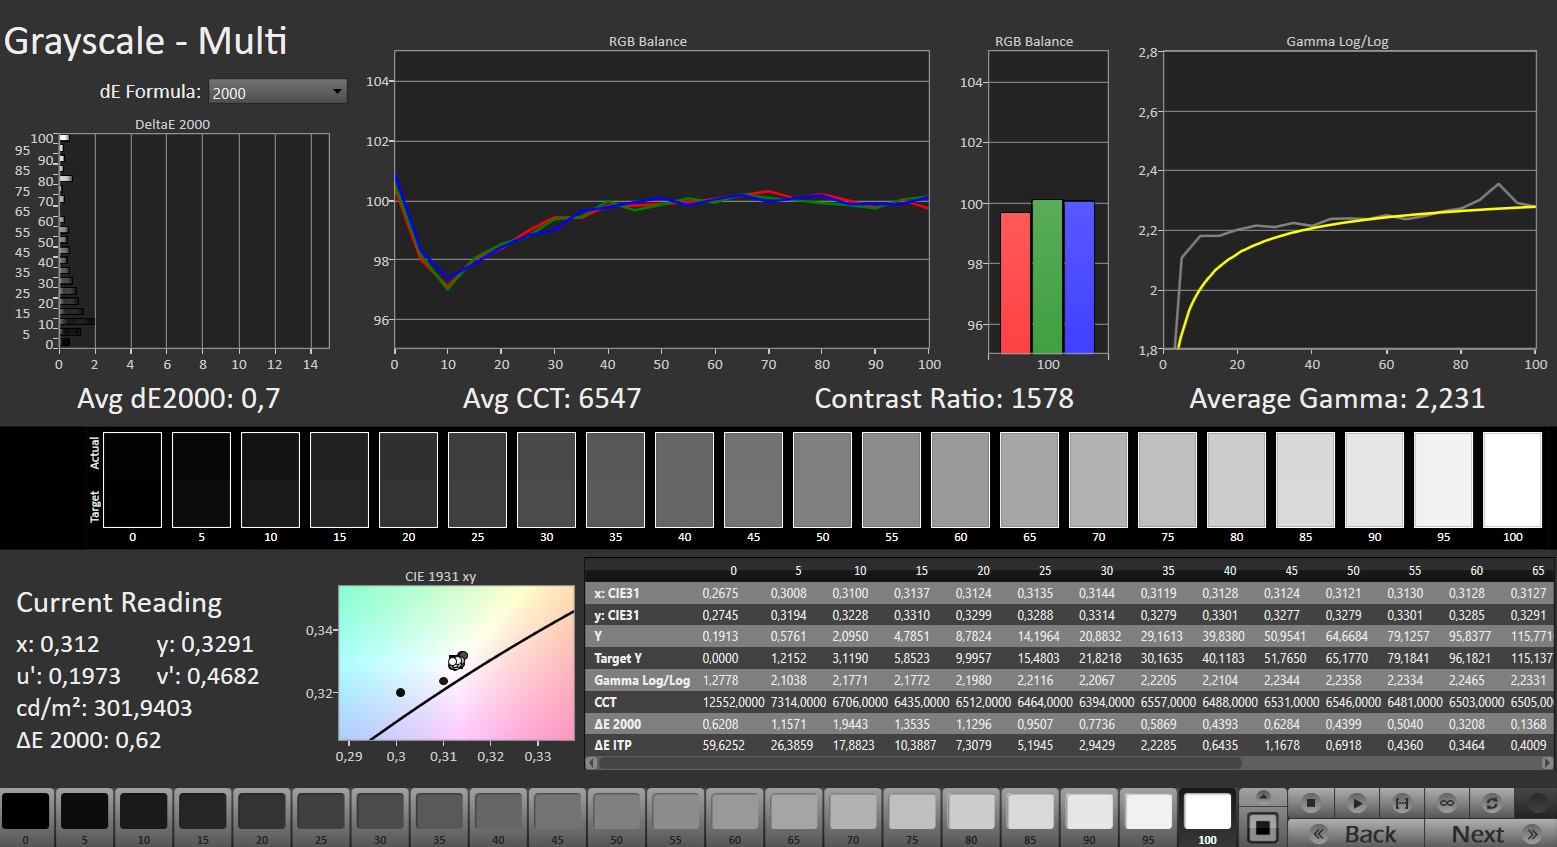
Direttamente dalla scatola, il display è ben calibrato: Con una deviazione di circa 2,25, il valore target (DeltaE < 3) è stato raggiunto. La calibrazione dello schermo riduce le deviazioni a 1,45 e garantisce toni di grigio più equilibrati. Il pannello può rappresentare lo spazio sRGB quasi nella sua interezza, ma non gli spazi AdobeRGB e DCI P3.
Tempi di risposta del Display
| ↔ Tempi di risposta dal Nero al Bianco | ||
|---|---|---|
| 22.6 ms ... aumenta ↗ e diminuisce ↘ combinato | ↗ 11.2 ms Incremento | 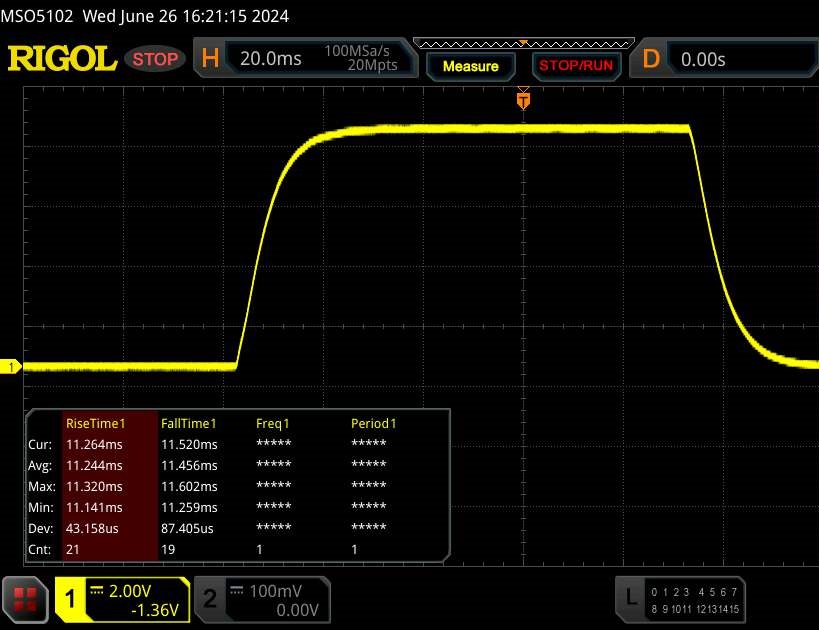 |
| ↘ 11.4 ms Calo | ||
| Lo schermo mostra buoni tempi di risposta durante i nostri tests, ma potrebbe essere troppo lento per i gamers competitivi. In confronto, tutti i dispositivi di test variano da 0.1 (minimo) a 240 (massimo) ms. » 48 % di tutti i dispositivi è migliore. Questo significa che i tempi di risposta rilevati sono simili alla media di tutti i dispositivi testati (20.8 ms). | ||
| ↔ Tempo di risposta dal 50% Grigio all'80% Grigio | ||
| 42.2 ms ... aumenta ↗ e diminuisce ↘ combinato | ↗ 19.1 ms Incremento | 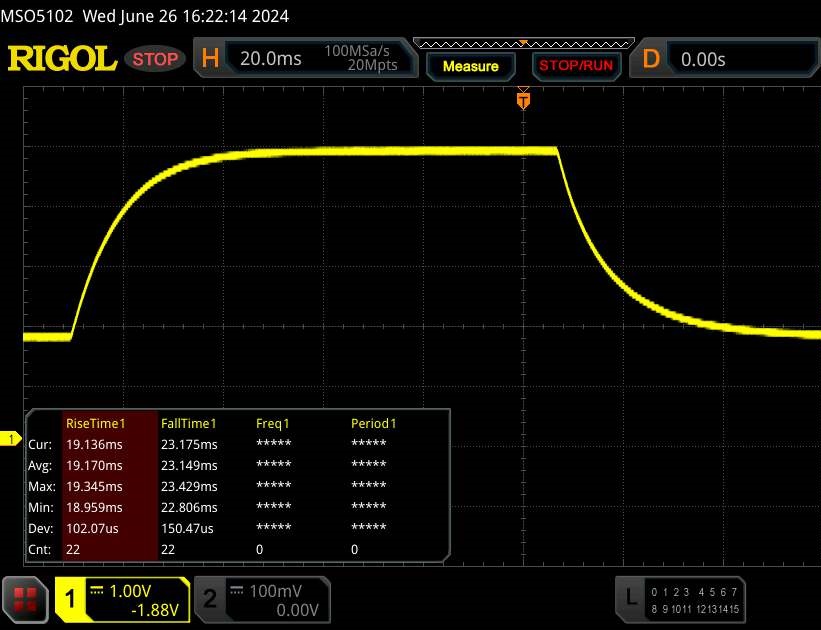 |
| ↘ 23.1 ms Calo | ||
| Lo schermo mostra tempi di risposta lenti nei nostri tests e sarà insoddisfacente per i gamers. In confronto, tutti i dispositivi di test variano da 0.165 (minimo) a 636 (massimo) ms. » 67 % di tutti i dispositivi è migliore. Questo significa che i tempi di risposta rilevati sono peggiori rispetto alla media di tutti i dispositivi testati (32.5 ms). | ||
Sfarfallio dello schermo / PWM (Pulse-Width Modulation)
| flickering dello schermo / PWM non rilevato | 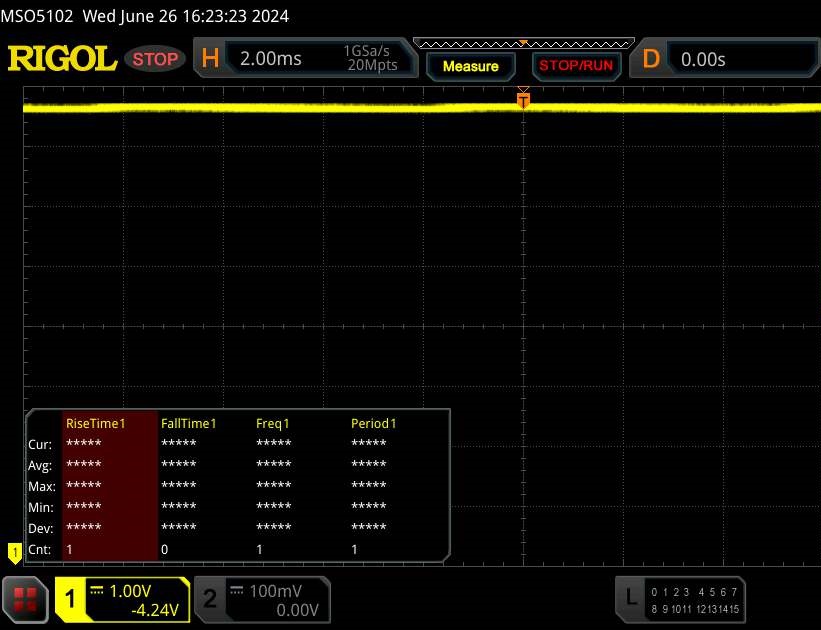 | ||
In confronto: 53 % di tutti i dispositivi testati non utilizza PWM per ridurre la luminosita' del display. Se è rilevato PWM, una media di 8516 (minimo: 5 - massimo: 343500) Hz è stata rilevata. | |||
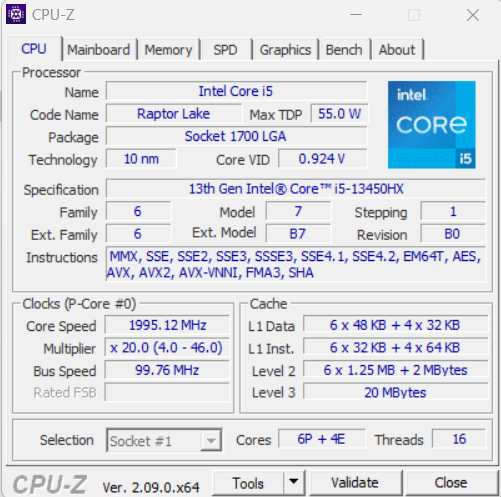
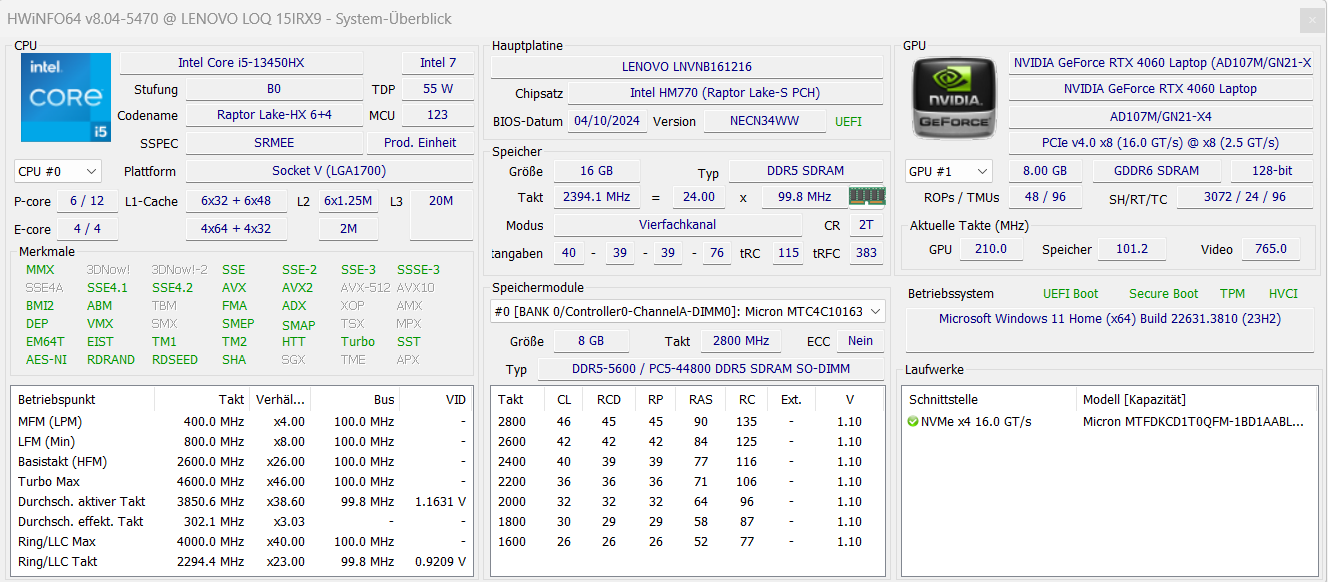
Prestazioni - Raptor Lake e Ada Lovelace alimentano il computer portatile
I modelli LOQ sono portatili da gioco entry-level. Lenovo offre una varietà di configurazioni diverse, con APU AMD e CPU Intel. Raptor Lake e Ada Lovelace sotto forma di Core i5-13450HX e GeForce RTX 4060 alimentano il presente dispositivo di prova. Può essere acquistato per circa 1.300 dollari (con Windows 11) o poco più di 1.000 dollari (senza Windows).
Condizioni di test
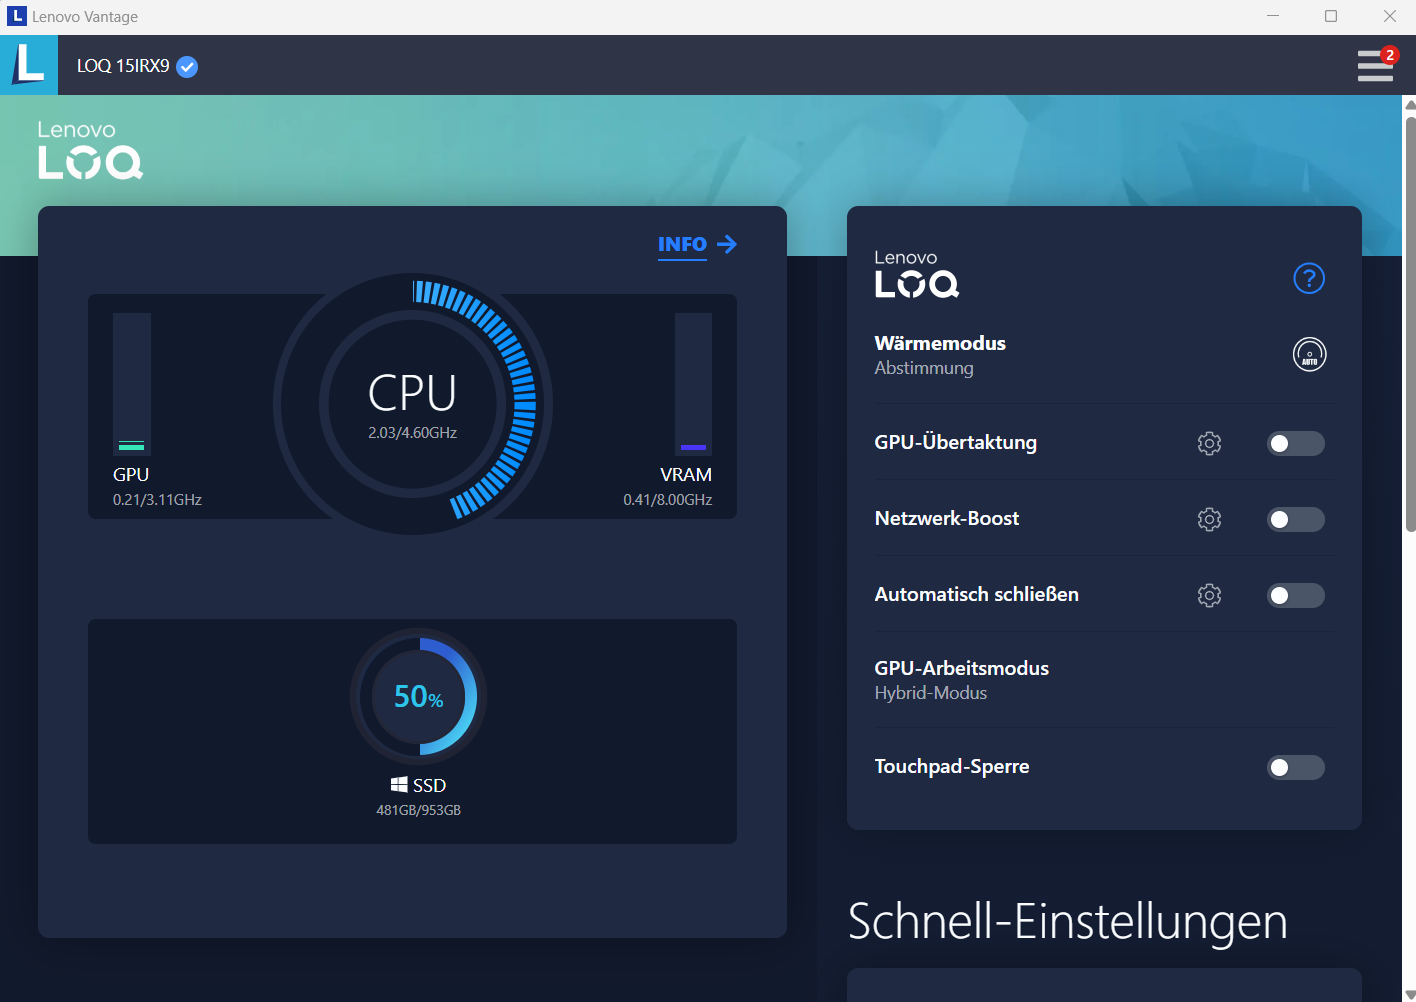
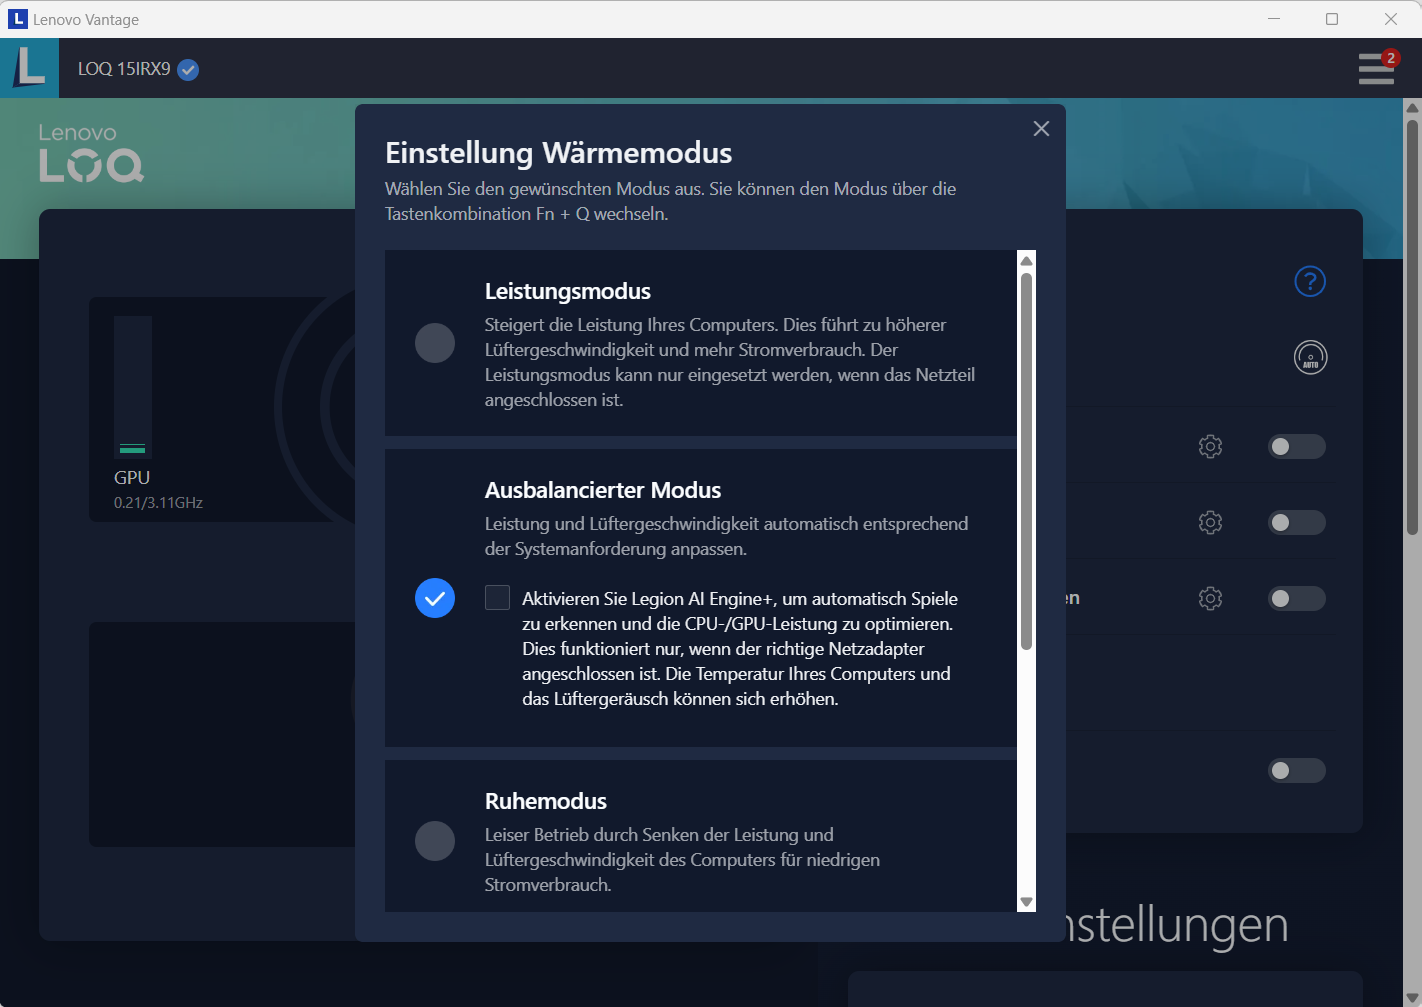
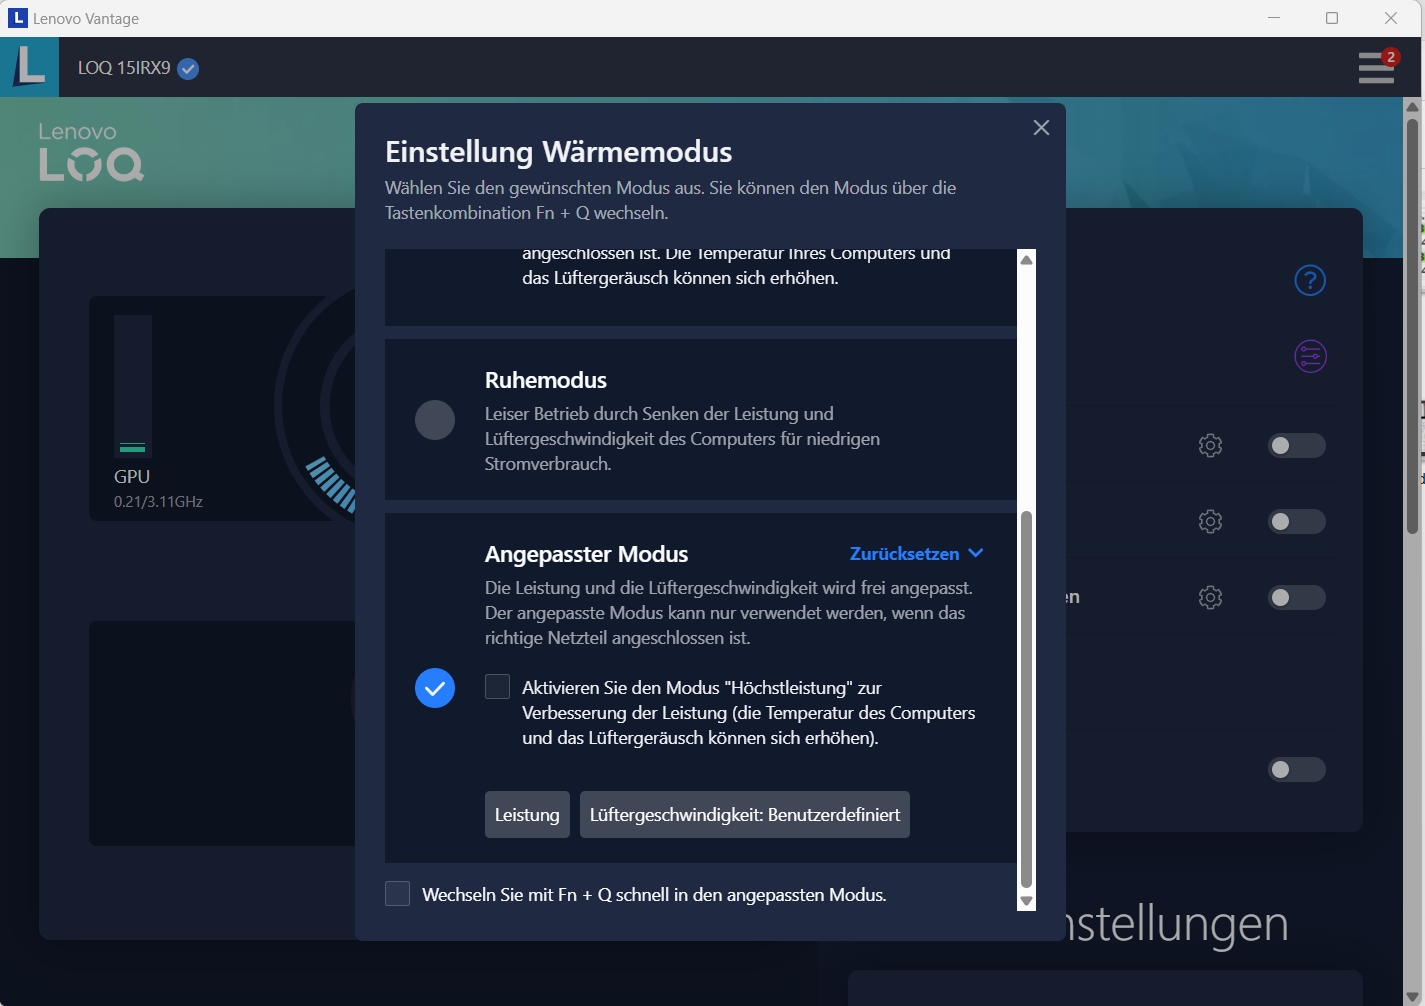
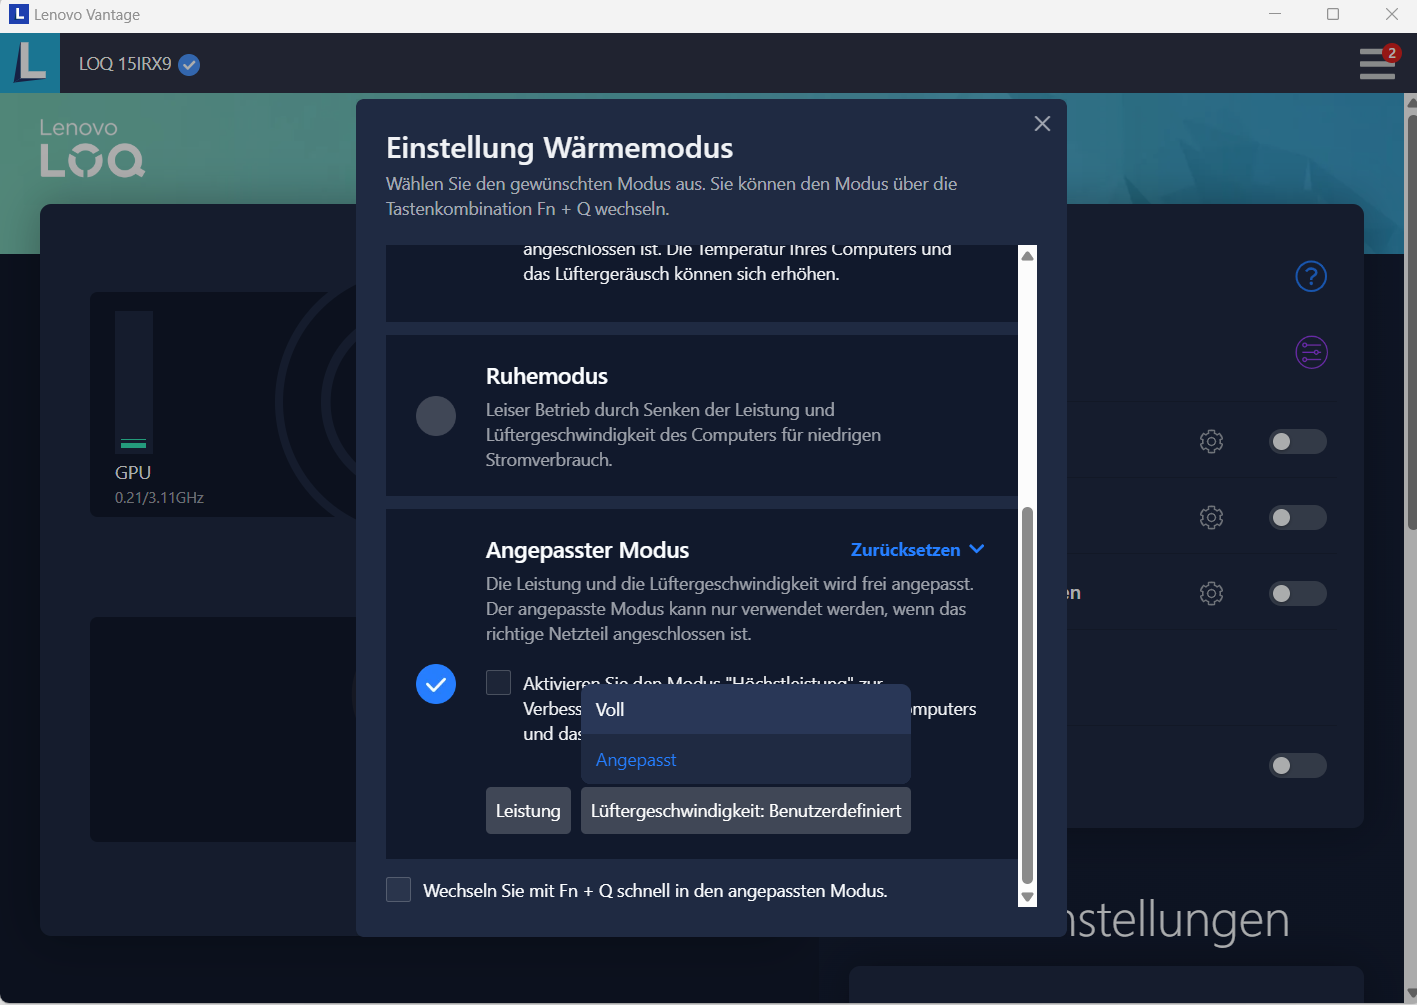
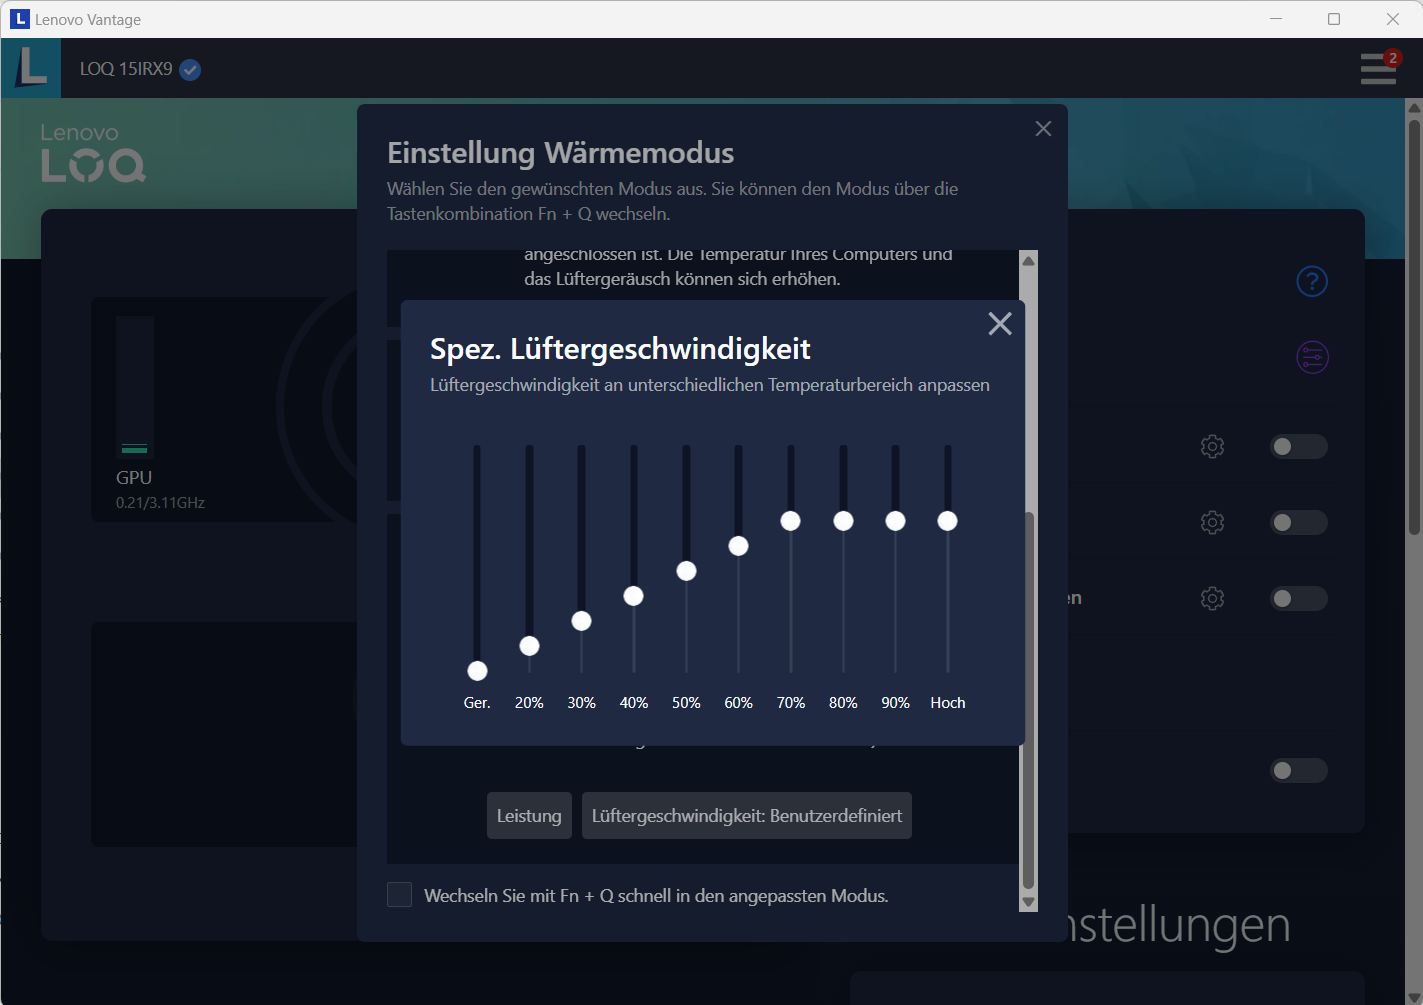
Il portatile offre tre modalità di prestazioni specifiche del produttore (vedere tabella), che possono essere alternate utilizzando la combinazione di tasti "Fn" + "Q". Abbiamo utilizzato le modalità equilibrata (benchmark) e silenziosa (test della batteria).
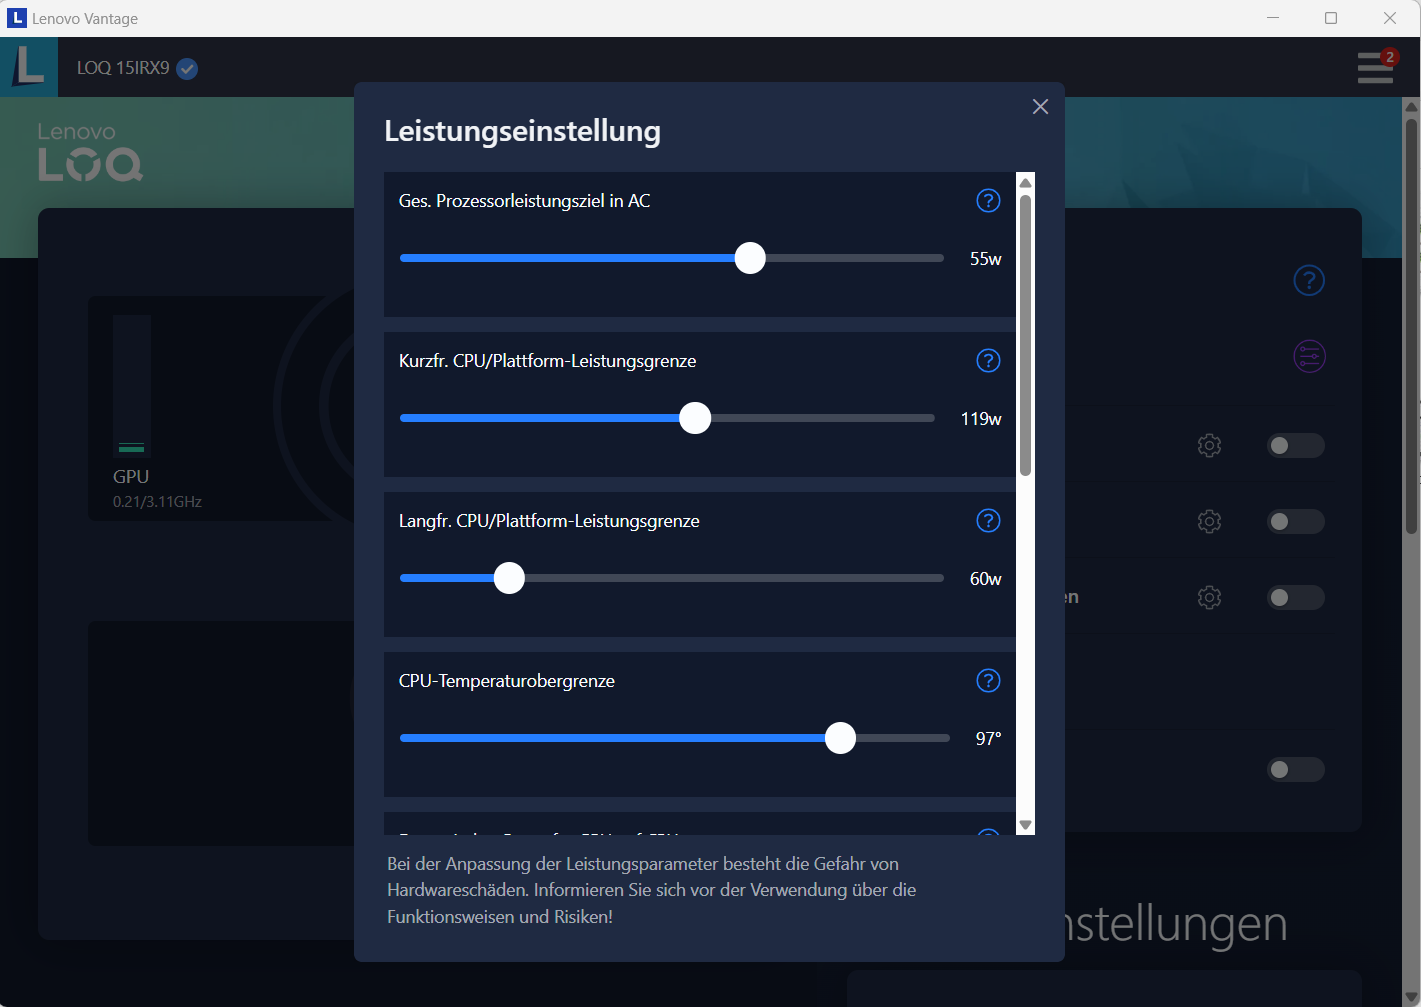
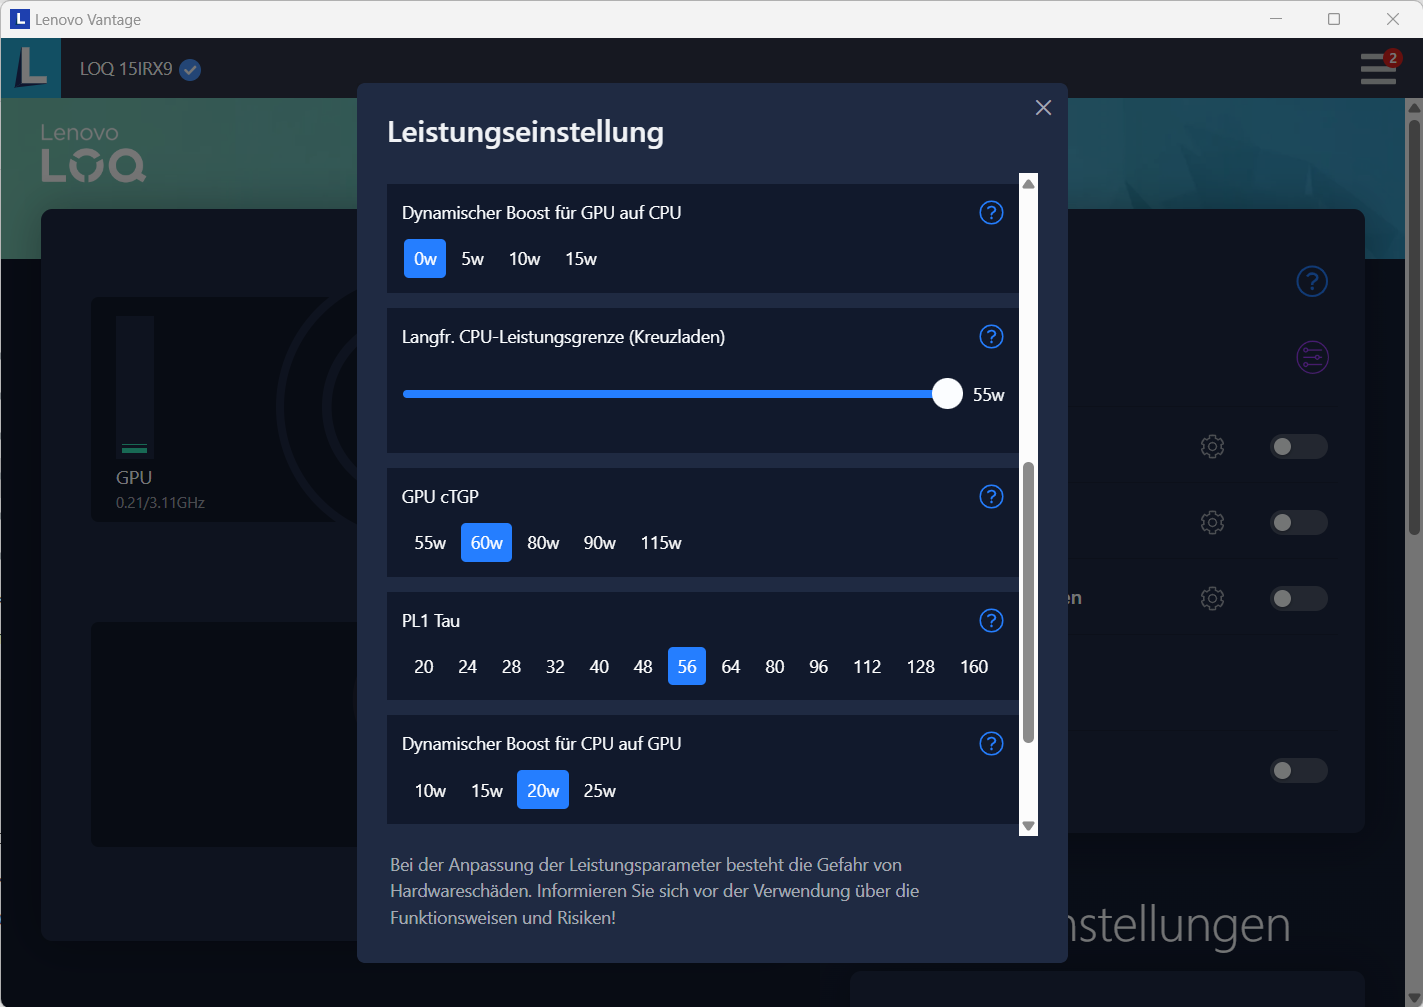
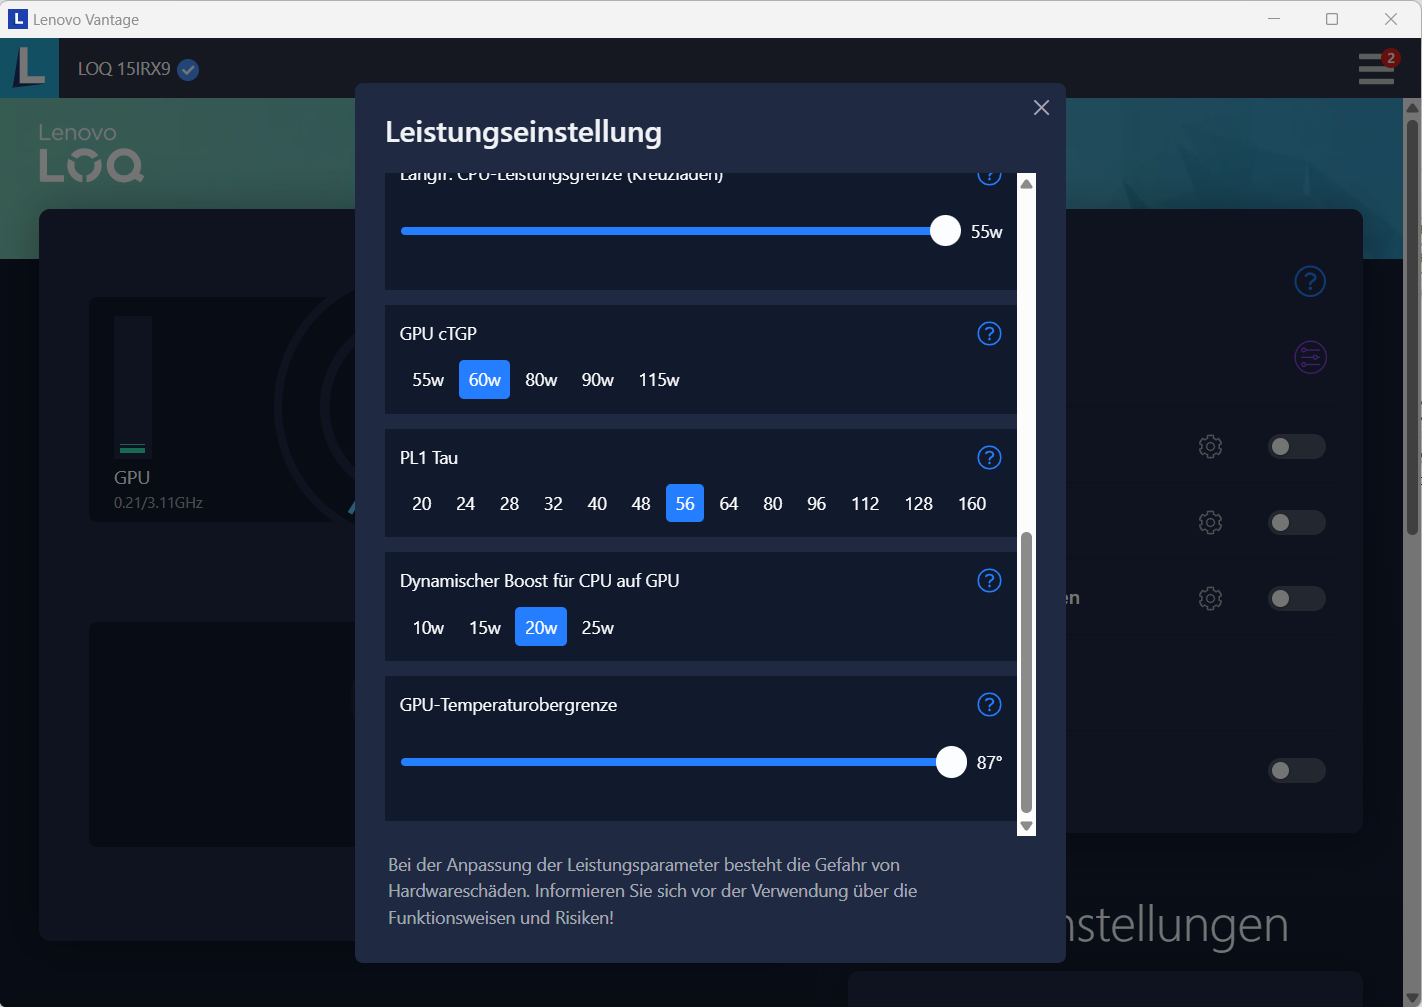
Una quarta modalità(personalizzata) può essere selezionata tramite Lenovo Vantage (centro di controllo del portatile). Ciò consente di impostare individualmente le impostazioni delle prestazioni del processore (limite di potenza) o della GPU (TGP, Dynamic Boost, limite di temperatura) e la velocità della ventola. È anche possibile overcloccare la GPU e la memoria grafica indipendentemente dal profilo.
| Modalità Performance | Modalità Bilanciata | Modalità Silenziosa | |
|---|---|---|---|
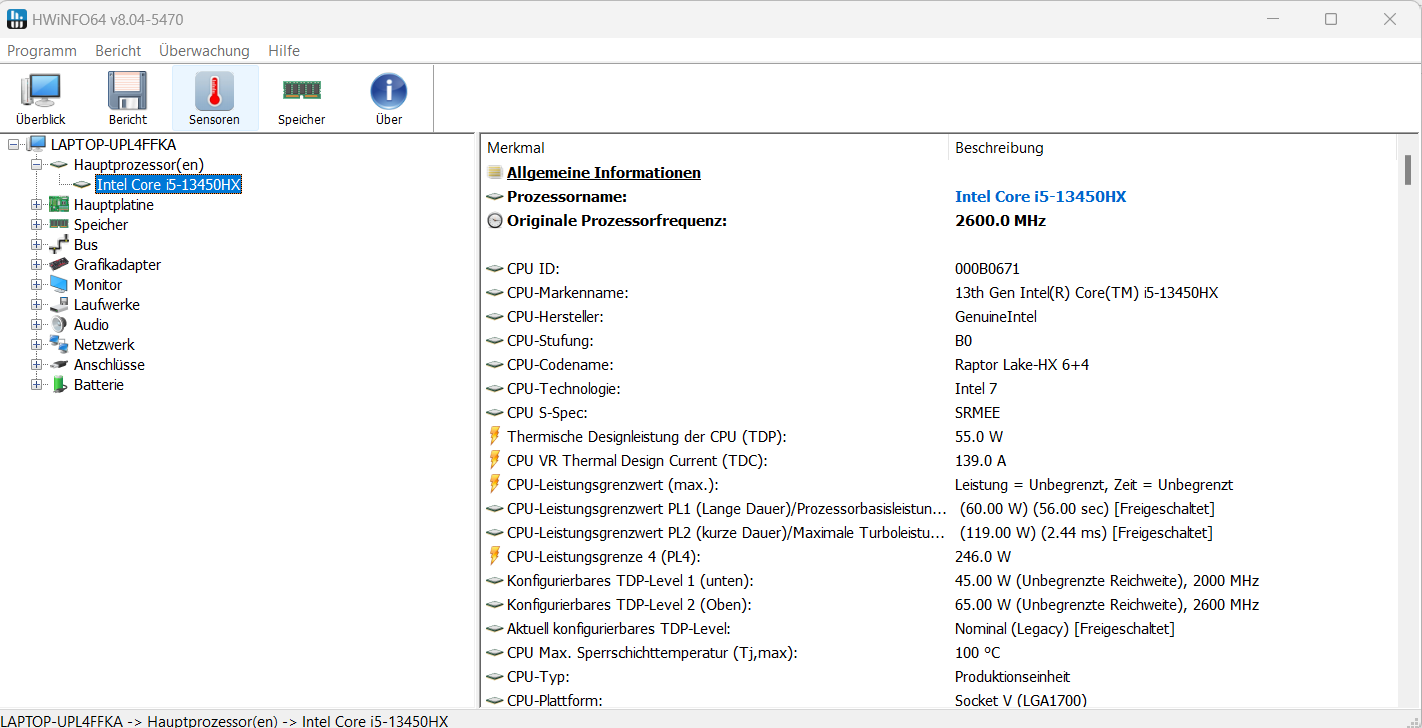
| Limite di potenza 1 (HWInfo) | 90 watt | 60 watt | 55 watt |
| Limite di potenza 2 (HWInfo) | 162 watt | 119 watt | 65 watt |
| Rumore (CP 2077 Phantom Liberty) | 54 dB(A) | 48 dB(A) | 39 dB(A) |
| Prestazioni (CP 2077 Phantom Liberty) | 70 fps | 66 fps | 52 fps |
Processore
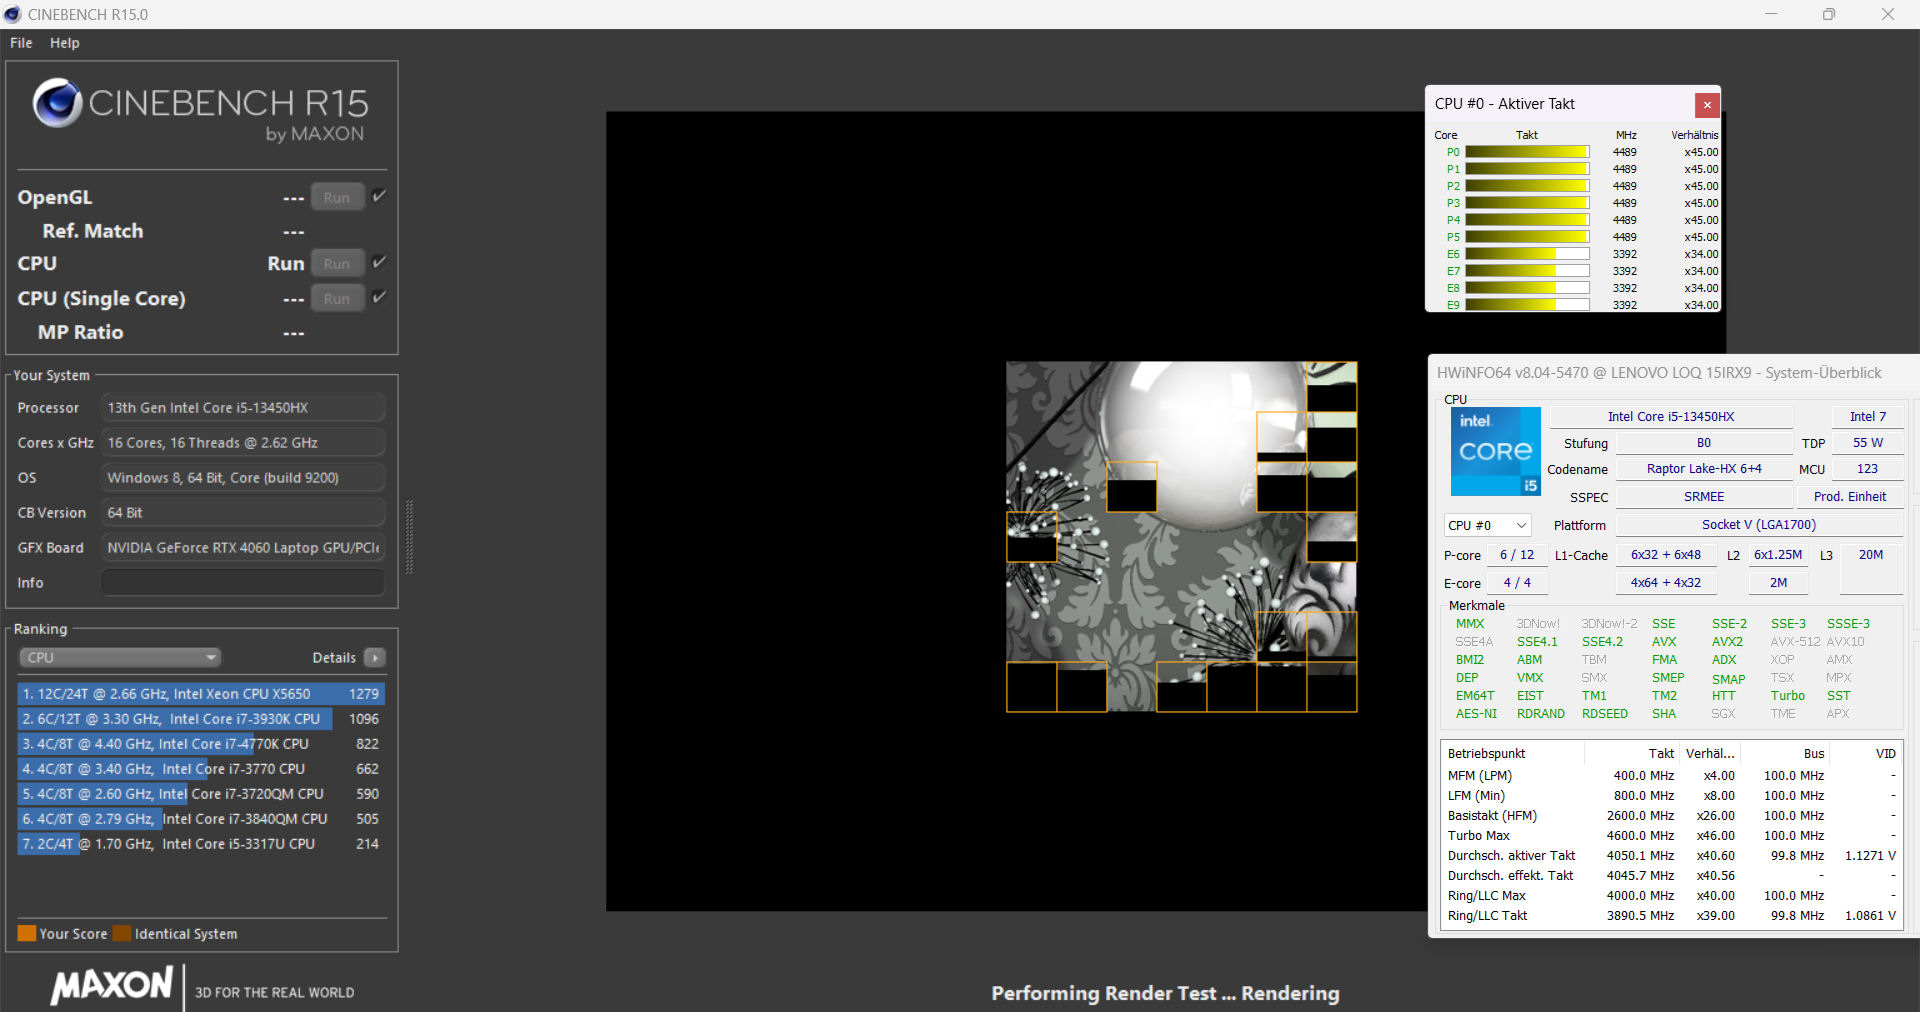
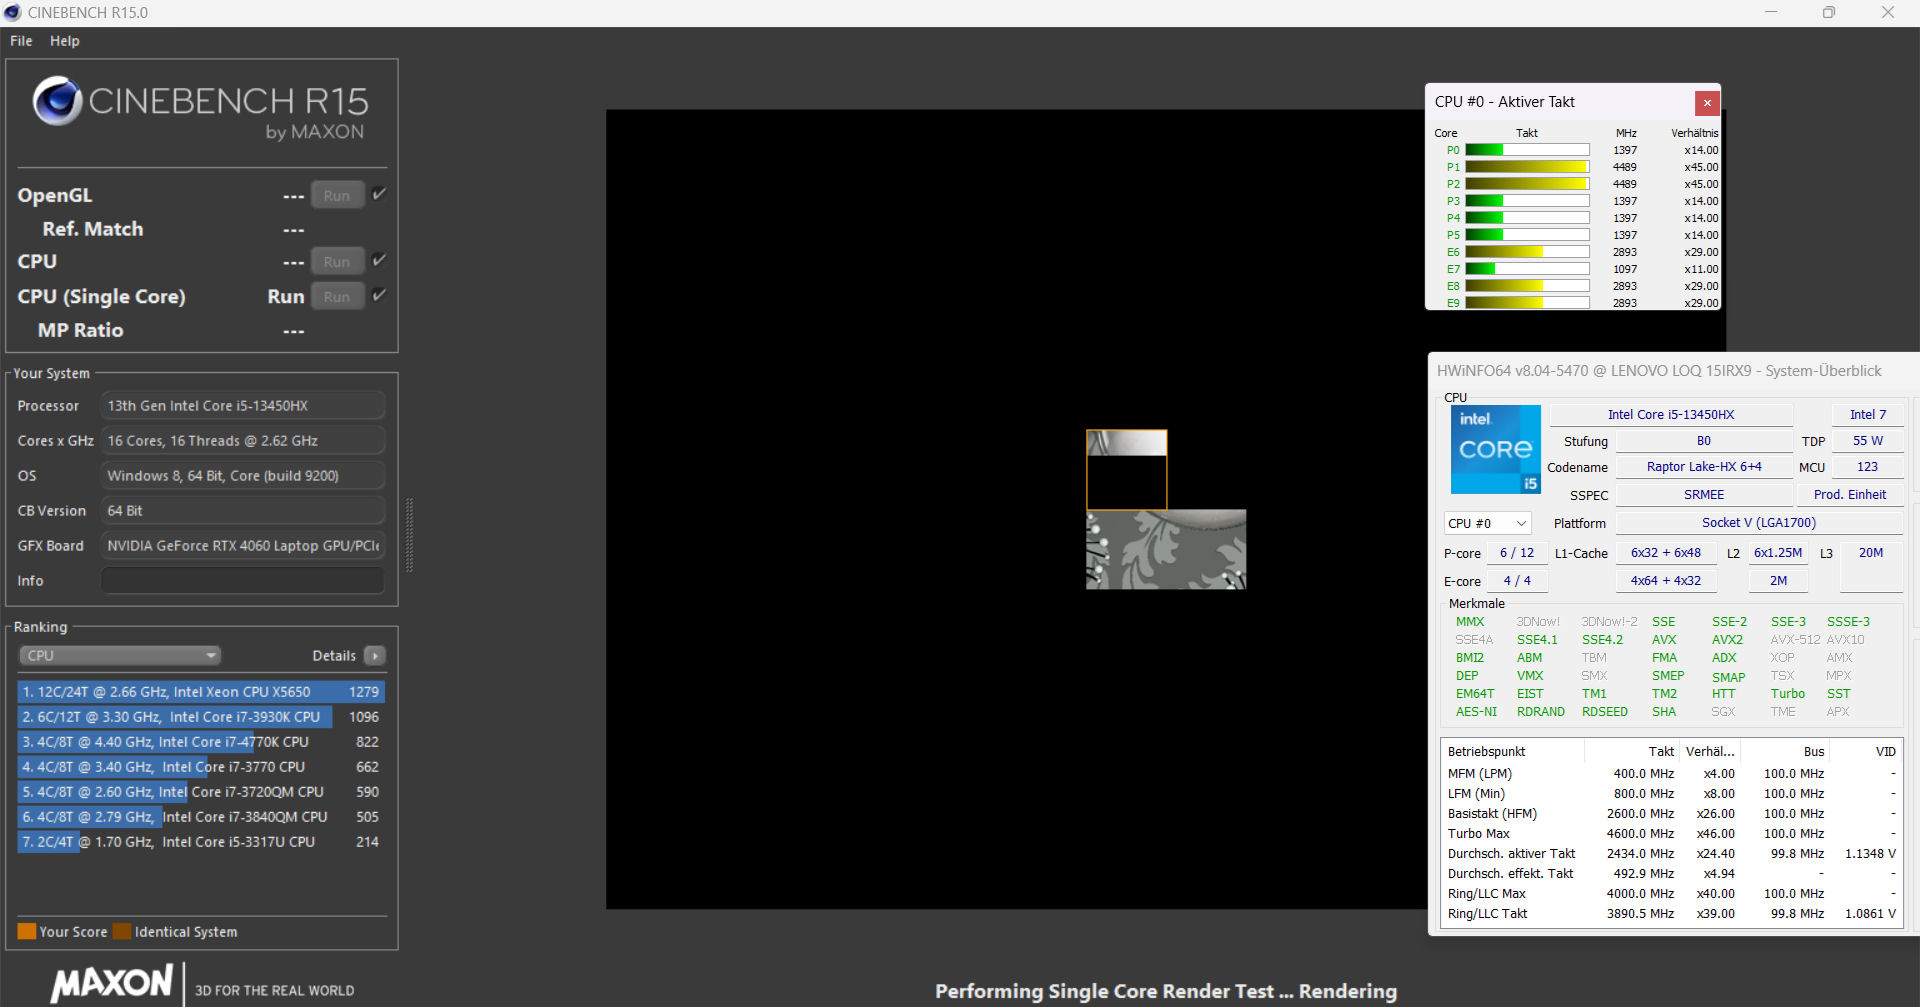
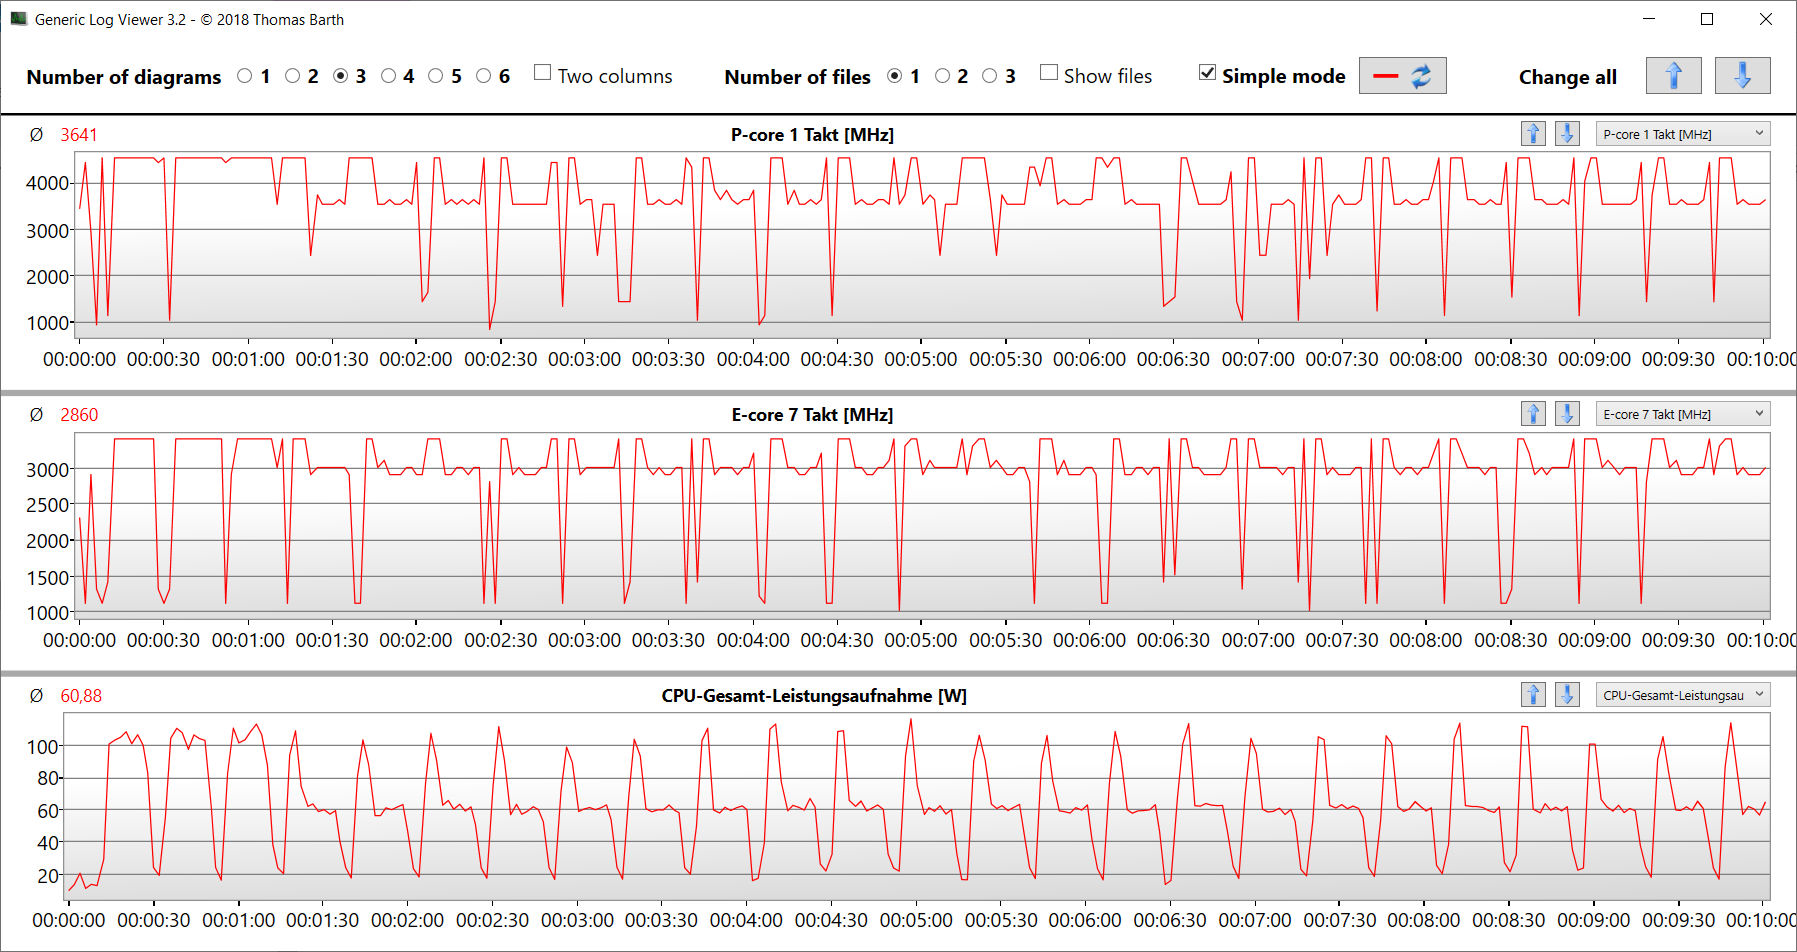
Il Core i5-13450HX(Raptor Lake) 10 core della CPU (6P + 4E = 16 thread) raggiungono velocità di clock massime di 4,6 GHz (P) e 3,4 GHz (E). Il carico continuo multi-thread (CB15 Loop) ha comportato un abbassamento della velocità di clock dalla prima alla quarta esecuzione( modalitàbilanciata ). In seguito, è rimasta stabile. La modalità Performance mantiene la velocità di clock a un livello costantemente alto.
I risultati del benchmark erano proprio come ci aspettavamo (modalitàbilanciata ), e la modalità prestazioni ha portato a un vantaggio (molto piccolo). Nell'ambito del confronto, il Core i5 ha ottenuto il risultato peggiore, in quanto ha il minor numero di core di calcolo. La CPU è una scelta adeguata per un giocatore economico.
Cinebench R15 Multi continuous test
| CPU Performance Rating - Percent | |
| Media della classe Gaming | |
| HP Victus 16 (2024) | |
| SCHENKER XMG Core 15 (M24) | |
| Dell G16, i7-13650HX, RTX 4060 | |
| Gigabyte G6X 9KG (2024) | |
| Lenovo LOQ 15IRX9 | |
| Media Intel Core i5-13450HX | |
| Lenovo LOQ 15IRX9 | |
| Cinebench R23 | |
| Multi Core | |
| HP Victus 16 (2024) | |
| Media della classe Gaming (5668 - 39652, n=151, ultimi 2 anni) | |
| Dell G16, i7-13650HX, RTX 4060 | |
| Gigabyte G6X 9KG (2024) | |
| SCHENKER XMG Core 15 (M24) | |
| Lenovo LOQ 15IRX9 (Leistungsmodus) | |
| Media Intel Core i5-13450HX (16575 - 17234, n=3) | |
| Lenovo LOQ 15IRX9 | |
| Single Core | |
| Dell G16, i7-13650HX, RTX 4060 | |
| Media della classe Gaming (1136 - 2252, n=151, ultimi 2 anni) | |
| Gigabyte G6X 9KG (2024) | |
| SCHENKER XMG Core 15 (M24) | |
| Lenovo LOQ 15IRX9 (Leistungsmodus) | |
| Media Intel Core i5-13450HX (1710 - 1766, n=3) | |
| Lenovo LOQ 15IRX9 | |
| HP Victus 16 (2024) | |
| Cinebench R20 | |
| CPU (Multi Core) | |
| HP Victus 16 (2024) | |
| Media della classe Gaming (2179 - 15517, n=151, ultimi 2 anni) | |
| Dell G16, i7-13650HX, RTX 4060 | |
| Gigabyte G6X 9KG (2024) | |
| SCHENKER XMG Core 15 (M24) | |
| Lenovo LOQ 15IRX9 (Leistungsmodus) | |
| Media Intel Core i5-13450HX (6489 - 6595, n=3) | |
| Lenovo LOQ 15IRX9 | |
| CPU (Single Core) | |
| Media della classe Gaming (439 - 866, n=151, ultimi 2 anni) | |
| Dell G16, i7-13650HX, RTX 4060 | |
| Gigabyte G6X 9KG (2024) | |
| SCHENKER XMG Core 15 (M24) | |
| Lenovo LOQ 15IRX9 (Leistungsmodus) | |
| Media Intel Core i5-13450HX (652 - 680, n=3) | |
| Lenovo LOQ 15IRX9 | |
| HP Victus 16 (2024) | |
| Cinebench R15 | |
| CPU Multi 64Bit | |
| HP Victus 16 (2024) | |
| Media della classe Gaming (905 - 6074, n=154, ultimi 2 anni) | |
| Dell G16, i7-13650HX, RTX 4060 | |
| SCHENKER XMG Core 15 (M24) | |
| Gigabyte G6X 9KG (2024) | |
| Lenovo LOQ 15IRX9 (Leistungsmodus) | |
| Lenovo LOQ 15IRX9 | |
| Media Intel Core i5-13450HX (2427 - 2505, n=3) | |
| CPU Single 64Bit | |
| SCHENKER XMG Core 15 (M24) | |
| Media della classe Gaming (191.9 - 343, n=151, ultimi 2 anni) | |
| Dell G16, i7-13650HX, RTX 4060 | |
| Gigabyte G6X 9KG (2024) | |
| Lenovo LOQ 15IRX9 (Leistungsmodus) | |
| Media Intel Core i5-13450HX (239 - 251, n=3) | |
| Lenovo LOQ 15IRX9 | |
| HP Victus 16 (2024) | |
| Blender - v2.79 BMW27 CPU | |
| Lenovo LOQ 15IRX9 | |
| Gigabyte G6X 9KG (2024) | |
| Media Intel Core i5-13450HX (196 - 229, n=3) | |
| Lenovo LOQ 15IRX9 (Leistungsmodus) | |
| SCHENKER XMG Core 15 (M24) | |
| Media della classe Gaming (81 - 555, n=144, ultimi 2 anni) | |
| HP Victus 16 (2024) | |
| Dell G16, i7-13650HX, RTX 4060 | |
| 7-Zip 18.03 | |
| 7z b 4 | |
| HP Victus 16 (2024) | |
| Media della classe Gaming (23795 - 144064, n=149, ultimi 2 anni) | |
| Dell G16, i7-13650HX, RTX 4060 | |
| SCHENKER XMG Core 15 (M24) | |
| Gigabyte G6X 9KG (2024) | |
| Lenovo LOQ 15IRX9 (Leistungsmodus) | |
| Media Intel Core i5-13450HX (59026 - 62204, n=3) | |
| Lenovo LOQ 15IRX9 | |
| 7z b 4 -mmt1 | |
| SCHENKER XMG Core 15 (M24) | |
| Media della classe Gaming (4199 - 7573, n=149, ultimi 2 anni) | |
| Dell G16, i7-13650HX, RTX 4060 | |
| Gigabyte G6X 9KG (2024) | |
| HP Victus 16 (2024) | |
| Lenovo LOQ 15IRX9 (Leistungsmodus) | |
| Media Intel Core i5-13450HX (5370 - 5576, n=3) | |
| Lenovo LOQ 15IRX9 | |
| Geekbench 6.4 | |
| Multi-Core | |
| HP Victus 16 (2024) (6.2.1) | |
| Media della classe Gaming (5340 - 21668, n=119, ultimi 2 anni) | |
| SCHENKER XMG Core 15 (M24) (6.2.1) | |
| Dell G16, i7-13650HX, RTX 4060 (6.2.1) | |
| Gigabyte G6X 9KG (2024) (6.2.1) | |
| Lenovo LOQ 15IRX9 (6.2.1, Leistungsmodus) | |
| Media Intel Core i5-13450HX (12619 - 12799, n=3) | |
| Lenovo LOQ 15IRX9 (6.2.1) | |
| Single-Core | |
| SCHENKER XMG Core 15 (M24) (6.2.1) | |
| Media della classe Gaming (1490 - 3219, n=119, ultimi 2 anni) | |
| Dell G16, i7-13650HX, RTX 4060 (6.2.1) | |
| Gigabyte G6X 9KG (2024) (6.2.1) | |
| Lenovo LOQ 15IRX9 (6.2.1, Leistungsmodus) | |
| Media Intel Core i5-13450HX (2381 - 2448, n=3) | |
| Lenovo LOQ 15IRX9 (6.2.1) | |
| HP Victus 16 (2024) (6.2.1) | |
| Geekbench 5.5 | |
| Multi-Core | |
| HP Victus 16 (2024) | |
| Media della classe Gaming (4557 - 25855, n=148, ultimi 2 anni) | |
| Gigabyte G6X 9KG (2024) | |
| SCHENKER XMG Core 15 (M24) | |
| Dell G16, i7-13650HX, RTX 4060 | |
| Lenovo LOQ 15IRX9 | |
| Media Intel Core i5-13450HX (11973 - 12022, n=3) | |
| Lenovo LOQ 15IRX9 (Leistungsmodus) | |
| Single-Core | |
| SCHENKER XMG Core 15 (M24) | |
| Media della classe Gaming (986 - 2423, n=148, ultimi 2 anni) | |
| Dell G16, i7-13650HX, RTX 4060 | |
| Gigabyte G6X 9KG (2024) | |
| Lenovo LOQ 15IRX9 (Leistungsmodus) | |
| Media Intel Core i5-13450HX (1696 - 1763, n=3) | |
| HP Victus 16 (2024) | |
| Lenovo LOQ 15IRX9 | |
| HWBOT x265 Benchmark v2.2 - 4k Preset | |
| Media della classe Gaming (6.72 - 42.9, n=148, ultimi 2 anni) | |
| SCHENKER XMG Core 15 (M24) | |
| HP Victus 16 (2024) | |
| Lenovo LOQ 15IRX9 (Leistungsmodus) | |
| Dell G16, i7-13650HX, RTX 4060 | |
| Gigabyte G6X 9KG (2024) | |
| Media Intel Core i5-13450HX (16.9 - 20.5, n=3) | |
| Lenovo LOQ 15IRX9 | |
| LibreOffice - 20 Documents To PDF | |
| Media Intel Core i5-13450HX (49.5 - 96.6, n=3) | |
| Lenovo LOQ 15IRX9 (6.3.4.2) | |
| HP Victus 16 (2024) (6.3.4.2) | |
| Dell G16, i7-13650HX, RTX 4060 (6.3.4.2) | |
| Lenovo LOQ 15IRX9 (6.3.4.2, Leistungsmodus) | |
| SCHENKER XMG Core 15 (M24) (6.3.4.2) | |
| Media della classe Gaming (19 - 96.6, n=147, ultimi 2 anni) | |
| Gigabyte G6X 9KG (2024) (6.3.4.2) | |
| R Benchmark 2.5 - Overall mean | |
| HP Victus 16 (2024) | |
| Lenovo LOQ 15IRX9 | |
| Media Intel Core i5-13450HX (0.4582 - 0.4838, n=3) | |
| Lenovo LOQ 15IRX9 (Leistungsmodus) | |
| Media della classe Gaming (0.3609 - 0.759, n=150, ultimi 2 anni) | |
| Gigabyte G6X 9KG (2024) | |
| SCHENKER XMG Core 15 (M24) | |
| Dell G16, i7-13650HX, RTX 4060 | |
| Dell G16, i7-13650HX, RTX 4060 | |
* ... Meglio usare valori piccoli
AIDA64: FP32 Ray-Trace | FPU Julia | CPU SHA3 | CPU Queen | FPU SinJulia | FPU Mandel | CPU AES | CPU ZLib | FP64 Ray-Trace | CPU PhotoWorxx
| Performance Rating | |
| SCHENKER XMG Core 15 (M24) | |
| Media della classe Gaming | |
| Dell G16, i7-13650HX, RTX 4060 | |
| HP Victus 16 (2024) | |
| Lenovo LOQ 15IRX9 | |
| Media Intel Core i5-13450HX | |
| Gigabyte G6X 9KG (2024) | |
| Lenovo LOQ 15IRX9 | |
| AIDA64 / FP32 Ray-Trace | |
| SCHENKER XMG Core 15 (M24) (v6.92.6600) | |
| Media della classe Gaming (4986 - 81639, n=147, ultimi 2 anni) | |
| Dell G16, i7-13650HX, RTX 4060 (v6.92.6600) | |
| Lenovo LOQ 15IRX9 (v6.92.6600, Leistungsmodus) | |
| HP Victus 16 (2024) (v6.92.6600) | |
| Media Intel Core i5-13450HX (13747 - 17767, n=3) | |
| Lenovo LOQ 15IRX9 (v6.92.6600) | |
| Gigabyte G6X 9KG (2024) (v6.92.6600) | |
| AIDA64 / FPU Julia | |
| SCHENKER XMG Core 15 (M24) (v6.92.6600) | |
| Media della classe Gaming (25360 - 252486, n=147, ultimi 2 anni) | |
| Dell G16, i7-13650HX, RTX 4060 (v6.92.6600) | |
| HP Victus 16 (2024) (v6.92.6600) | |
| Lenovo LOQ 15IRX9 (v6.92.6600, Leistungsmodus) | |
| Media Intel Core i5-13450HX (71834 - 83862, n=3) | |
| Lenovo LOQ 15IRX9 (v6.92.6600) | |
| Gigabyte G6X 9KG (2024) (v6.92.6600) | |
| AIDA64 / CPU SHA3 | |
| SCHENKER XMG Core 15 (M24) (v6.92.6600) | |
| Media della classe Gaming (1339 - 10389, n=147, ultimi 2 anni) | |
| Dell G16, i7-13650HX, RTX 4060 (v6.92.6600) | |
| HP Victus 16 (2024) (v6.92.6600) | |
| Lenovo LOQ 15IRX9 (v6.92.6600) | |
| Lenovo LOQ 15IRX9 (v6.92.6600, Leistungsmodus) | |
| Media Intel Core i5-13450HX (3519 - 3530, n=3) | |
| Gigabyte G6X 9KG (2024) (v6.92.6600) | |
| AIDA64 / CPU Queen | |
| HP Victus 16 (2024) (v6.92.6600) | |
| SCHENKER XMG Core 15 (M24) (v6.92.6600) | |
| Media della classe Gaming (50699 - 200651, n=147, ultimi 2 anni) | |
| Gigabyte G6X 9KG (2024) (v6.92.6600) | |
| Dell G16, i7-13650HX, RTX 4060 (v6.92.6600) | |
| Lenovo LOQ 15IRX9 (v6.92.6600) | |
| Media Intel Core i5-13450HX (85888 - 86148, n=3) | |
| Lenovo LOQ 15IRX9 (v6.92.6600, Leistungsmodus) | |
| AIDA64 / FPU SinJulia | |
| SCHENKER XMG Core 15 (M24) (v6.92.6600) | |
| Media della classe Gaming (4800 - 32988, n=147, ultimi 2 anni) | |
| HP Victus 16 (2024) (v6.92.6600) | |
| Dell G16, i7-13650HX, RTX 4060 (v6.92.6600) | |
| Lenovo LOQ 15IRX9 (v6.92.6600, Leistungsmodus) | |
| Lenovo LOQ 15IRX9 (v6.92.6600) | |
| Media Intel Core i5-13450HX (9325 - 9354, n=3) | |
| Gigabyte G6X 9KG (2024) (v6.92.6600) | |
| AIDA64 / FPU Mandel | |
| SCHENKER XMG Core 15 (M24) (v6.92.6600) | |
| Media della classe Gaming (12321 - 134044, n=147, ultimi 2 anni) | |
| Dell G16, i7-13650HX, RTX 4060 (v6.92.6600) | |
| Lenovo LOQ 15IRX9 (v6.92.6600, Leistungsmodus) | |
| HP Victus 16 (2024) (v6.92.6600) | |
| Media Intel Core i5-13450HX (34956 - 42825, n=3) | |
| Lenovo LOQ 15IRX9 (v6.92.6600) | |
| Gigabyte G6X 9KG (2024) (v6.92.6600) | |
| AIDA64 / CPU AES | |
| Media della classe Gaming (19065 - 328679, n=147, ultimi 2 anni) | |
| SCHENKER XMG Core 15 (M24) (v6.92.6600) | |
| Dell G16, i7-13650HX, RTX 4060 (v6.92.6600) | |
| HP Victus 16 (2024) (v6.92.6600) | |
| Media Intel Core i5-13450HX (70296 - 70680, n=3) | |
| Lenovo LOQ 15IRX9 (v6.92.6600) | |
| Lenovo LOQ 15IRX9 (v6.92.6600, Leistungsmodus) | |
| Gigabyte G6X 9KG (2024) (v6.92.6600) | |
| AIDA64 / CPU ZLib | |
| Media della classe Gaming (373 - 2531, n=147, ultimi 2 anni) | |
| Dell G16, i7-13650HX, RTX 4060 (v6.92.6600) | |
| HP Victus 16 (2024) (v6.92.6600) | |
| Gigabyte G6X 9KG (2024) (v6.92.6600) | |
| Lenovo LOQ 15IRX9 (v6.92.6600) | |
| Media Intel Core i5-13450HX (977 - 1002, n=3) | |
| Lenovo LOQ 15IRX9 (v6.92.6600, Leistungsmodus) | |
| SCHENKER XMG Core 15 (M24) (v6.92.6600) | |
| AIDA64 / FP64 Ray-Trace | |
| SCHENKER XMG Core 15 (M24) (v6.92.6600) | |
| Media della classe Gaming (2540 - 43430, n=147, ultimi 2 anni) | |
| Dell G16, i7-13650HX, RTX 4060 (v6.92.6600) | |
| Lenovo LOQ 15IRX9 (v6.92.6600, Leistungsmodus) | |
| HP Victus 16 (2024) (v6.92.6600) | |
| Media Intel Core i5-13450HX (7428 - 9561, n=3) | |
| Lenovo LOQ 15IRX9 (v6.92.6600) | |
| Gigabyte G6X 9KG (2024) (v6.92.6600) | |
| AIDA64 / CPU PhotoWorxx | |
| SCHENKER XMG Core 15 (M24) (v6.92.6600) | |
| Media della classe Gaming (10805 - 60161, n=147, ultimi 2 anni) | |
| HP Victus 16 (2024) (v6.92.6600) | |
| Gigabyte G6X 9KG (2024) (v6.92.6600) | |
| Lenovo LOQ 15IRX9 (v6.92.6600) | |
| Lenovo LOQ 15IRX9 (v6.92.6600, Leistungsmodus) | |
| Media Intel Core i5-13450HX (36014 - 36764, n=3) | |
| Dell G16, i7-13650HX, RTX 4060 (v6.92.6600) | |
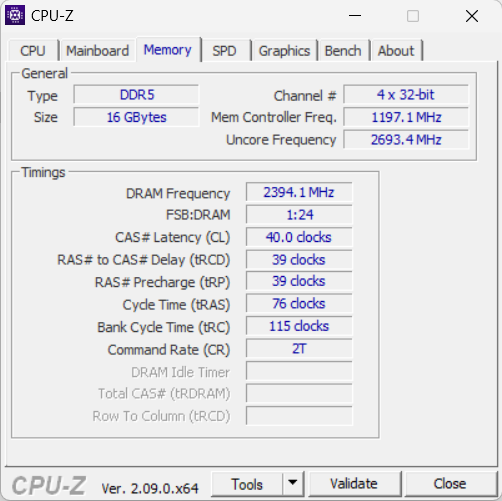
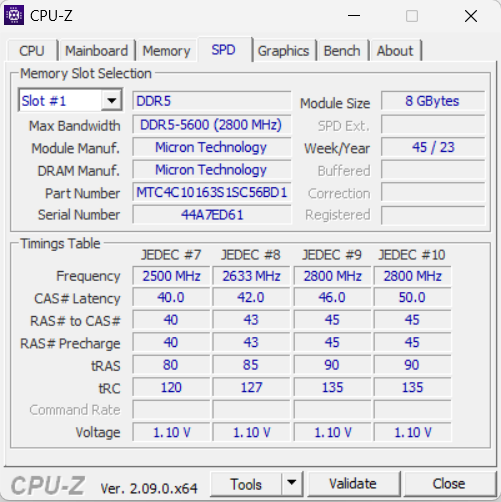
Prestazioni del sistema
Il sistema fluido non manca di prestazioni: il computer gestisce i giochi, il rendering e lo streaming senza problemi. Le velocità di trasferimento della RAM sono quelle attese per una RAM DDR5-5600.

CrossMark: Overall | Productivity | Creativity | Responsiveness
WebXPRT 3: Overall
WebXPRT 4: Overall
Mozilla Kraken 1.1: Total
| PCMark 10 / Score | |
| SCHENKER XMG Core 15 (M24) | |
| Media della classe Gaming (5776 - 9852, n=133, ultimi 2 anni) | |
| Gigabyte G6X 9KG (2024) | |
| HP Victus 16 (2024) | |
| Dell G16, i7-13650HX, RTX 4060 | |
| Lenovo LOQ 15IRX9 | |
| Media Intel Core i5-13450HX, NVIDIA GeForce RTX 4060 Laptop GPU (n=1) | |
| PCMark 10 / Essentials | |
| HP Victus 16 (2024) | |
| Media della classe Gaming (9057 - 12600, n=133, ultimi 2 anni) | |
| Gigabyte G6X 9KG (2024) | |
| SCHENKER XMG Core 15 (M24) | |
| Dell G16, i7-13650HX, RTX 4060 | |
| Lenovo LOQ 15IRX9 | |
| Media Intel Core i5-13450HX, NVIDIA GeForce RTX 4060 Laptop GPU (n=1) | |
| PCMark 10 / Productivity | |
| SCHENKER XMG Core 15 (M24) | |
| Gigabyte G6X 9KG (2024) | |
| Dell G16, i7-13650HX, RTX 4060 | |
| HP Victus 16 (2024) | |
| Media della classe Gaming (6662 - 14612, n=133, ultimi 2 anni) | |
| Lenovo LOQ 15IRX9 | |
| Media Intel Core i5-13450HX, NVIDIA GeForce RTX 4060 Laptop GPU (n=1) | |
| PCMark 10 / Digital Content Creation | |
| SCHENKER XMG Core 15 (M24) | |
| Media della classe Gaming (6807 - 18475, n=133, ultimi 2 anni) | |
| Dell G16, i7-13650HX, RTX 4060 | |
| Gigabyte G6X 9KG (2024) | |
| Lenovo LOQ 15IRX9 | |
| Media Intel Core i5-13450HX, NVIDIA GeForce RTX 4060 Laptop GPU (n=1) | |
| HP Victus 16 (2024) | |
| CrossMark / Overall | |
| Gigabyte G6X 9KG (2024) | |
| HP Victus 16 (2024) | |
| Media della classe Gaming (1247 - 2344, n=114, ultimi 2 anni) | |
| SCHENKER XMG Core 15 (M24) | |
| Dell G16, i7-13650HX, RTX 4060 | |
| Lenovo LOQ 15IRX9 | |
| Media Intel Core i5-13450HX, NVIDIA GeForce RTX 4060 Laptop GPU (n=1) | |
| CrossMark / Productivity | |
| Gigabyte G6X 9KG (2024) | |
| Media della classe Gaming (1299 - 2204, n=114, ultimi 2 anni) | |
| SCHENKER XMG Core 15 (M24) | |
| HP Victus 16 (2024) | |
| Dell G16, i7-13650HX, RTX 4060 | |
| Lenovo LOQ 15IRX9 | |
| Media Intel Core i5-13450HX, NVIDIA GeForce RTX 4060 Laptop GPU (n=1) | |
| CrossMark / Creativity | |
| HP Victus 16 (2024) | |
| SCHENKER XMG Core 15 (M24) | |
| Media della classe Gaming (1275 - 2660, n=114, ultimi 2 anni) | |
| Gigabyte G6X 9KG (2024) | |
| Dell G16, i7-13650HX, RTX 4060 | |
| Lenovo LOQ 15IRX9 | |
| Media Intel Core i5-13450HX, NVIDIA GeForce RTX 4060 Laptop GPU (n=1) | |
| CrossMark / Responsiveness | |
| Gigabyte G6X 9KG (2024) | |
| HP Victus 16 (2024) | |
| Lenovo LOQ 15IRX9 | |
| Media Intel Core i5-13450HX, NVIDIA GeForce RTX 4060 Laptop GPU (n=1) | |
| Media della classe Gaming (1030 - 2330, n=114, ultimi 2 anni) | |
| Dell G16, i7-13650HX, RTX 4060 | |
| SCHENKER XMG Core 15 (M24) | |
| WebXPRT 3 / Overall | |
| SCHENKER XMG Core 15 (M24) (Chrome 82) | |
| Gigabyte G6X 9KG (2024) (Chrome 82) | |
| Media della classe Gaming (215 - 480, n=127, ultimi 2 anni) | |
| HP Victus 16 (2024) (Chrome 82) | |
| Dell G16, i7-13650HX, RTX 4060 (Chrome 82) | |
| Lenovo LOQ 15IRX9 (Chrome 82) | |
| Media Intel Core i5-13450HX, NVIDIA GeForce RTX 4060 Laptop GPU (n=1) | |
| WebXPRT 4 / Overall | |
| Media della classe Gaming (176.4 - 335, n=115, ultimi 2 anni) | |
| SCHENKER XMG Core 15 (M24) (Chrome 105.0.0.0) | |
| Gigabyte G6X 9KG (2024) (Chrome 105.0.0.0) | |
| HP Victus 16 (2024) (Chrome 105.0.0.0) | |
| Lenovo LOQ 15IRX9 (Chrome 105.0.0.0) | |
| Media Intel Core i5-13450HX, NVIDIA GeForce RTX 4060 Laptop GPU (n=1) | |
| Mozilla Kraken 1.1 / Total | |
| Lenovo LOQ 15IRX9 (Chrome 82) | |
| Media Intel Core i5-13450HX, NVIDIA GeForce RTX 4060 Laptop GPU (n=1) | |
| HP Victus 16 (2024) (Chrome 82) | |
| Gigabyte G6X 9KG (2024) (Chrome 82) | |
| Dell G16, i7-13650HX, RTX 4060 (Chrome 82) | |
| Media della classe Gaming (409 - 674, n=139, ultimi 2 anni) | |
| SCHENKER XMG Core 15 (M24) (Chrome 82) | |
* ... Meglio usare valori piccoli
| PCMark 10 Score | 6929 punti | |
Aiuto | ||
| AIDA64 / Memory Copy | |
| SCHENKER XMG Core 15 (M24) (v6.92.6600) | |
| HP Victus 16 (2024) (v6.92.6600) | |
| Media della classe Gaming (21750 - 97515, n=147, ultimi 2 anni) | |
| Gigabyte G6X 9KG (2024) (v6.92.6600) | |
| Dell G16, i7-13650HX, RTX 4060 (v6.92.6600) | |
| Media Intel Core i5-13450HX (58673 - 58861, n=3) | |
| Lenovo LOQ 15IRX9 (v6.92.6600) | |
| AIDA64 / Memory Read | |
| HP Victus 16 (2024) (v6.92.6600) | |
| Media della classe Gaming (22956 - 102937, n=147, ultimi 2 anni) | |
| Gigabyte G6X 9KG (2024) (v6.92.6600) | |
| Lenovo LOQ 15IRX9 (v6.92.6600) | |
| Media Intel Core i5-13450HX (66626 - 69024, n=3) | |
| Dell G16, i7-13650HX, RTX 4060 (v6.92.6600) | |
| SCHENKER XMG Core 15 (M24) (v6.92.6600) | |
| AIDA64 / Memory Write | |
| SCHENKER XMG Core 15 (M24) (v6.92.6600) | |
| Media della classe Gaming (22297 - 108954, n=147, ultimi 2 anni) | |
| HP Victus 16 (2024) (v6.92.6600) | |
| Gigabyte G6X 9KG (2024) (v6.92.6600) | |
| Lenovo LOQ 15IRX9 (v6.92.6600) | |
| Media Intel Core i5-13450HX (58540 - 60196, n=3) | |
| Dell G16, i7-13650HX, RTX 4060 (v6.92.6600) | |
| AIDA64 / Memory Latency | |
| HP Victus 16 (2024) (v6.92.6600) | |
| Media della classe Gaming (59.5 - 259, n=147, ultimi 2 anni) | |
| Lenovo LOQ 15IRX9 (v6.92.6600) | |
| Media Intel Core i5-13450HX (90 - 94.2, n=3) | |
| Dell G16, i7-13650HX, RTX 4060 (v6.92.6600) | |
| Gigabyte G6X 9KG (2024) (v6.92.6600) | |
| SCHENKER XMG Core 15 (M24) (v6.92.6600) | |
* ... Meglio usare valori piccoli
Latenze DPC
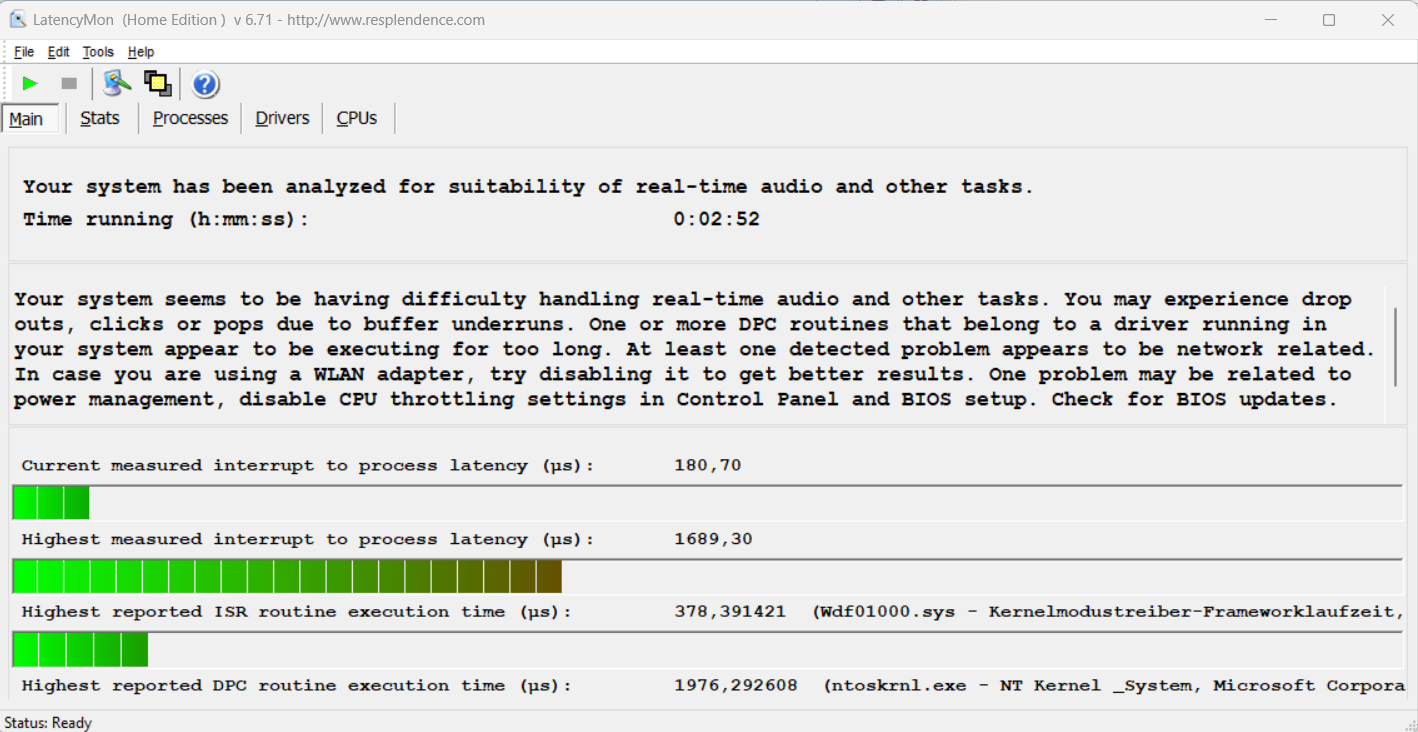
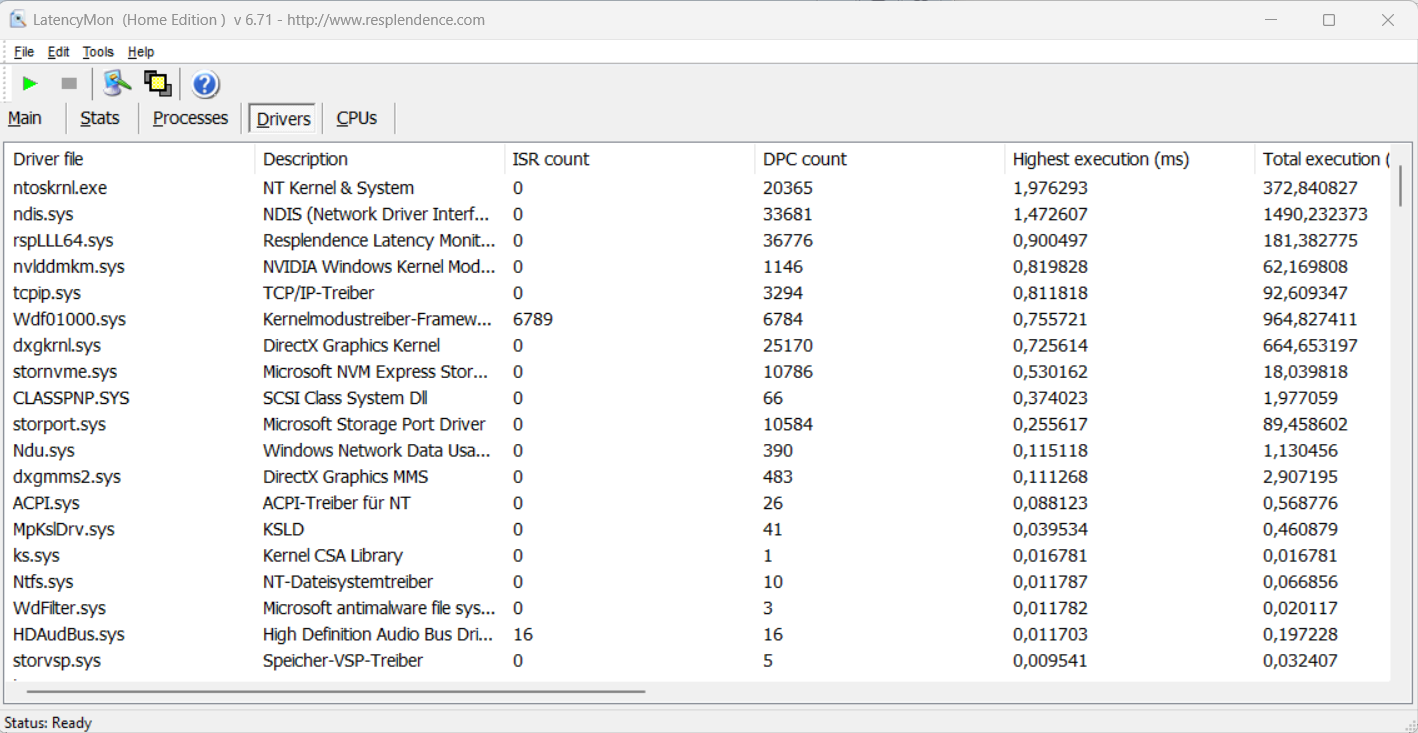
Il test di latenza standardizzato (navigazione web, riproduzione di video 4k, Prime95 ad alto carico) ha rivelato alcune anomalie. Il sistema non sembra essere adatto all'editing video e audio in tempo reale. I futuri aggiornamenti del software potrebbero portare a miglioramenti o addirittura a peggioramenti.
| DPC Latencies / LatencyMon - interrupt to process latency (max), Web, Youtube, Prime95 | |
| Gigabyte G6X 9KG (2024) | |
| Lenovo LOQ 15IRX9 | |
| SCHENKER XMG Core 15 (M24) | |
| Dell G16, i7-13650HX, RTX 4060 | |
| HP Victus 16 (2024) | |
* ... Meglio usare valori piccoli
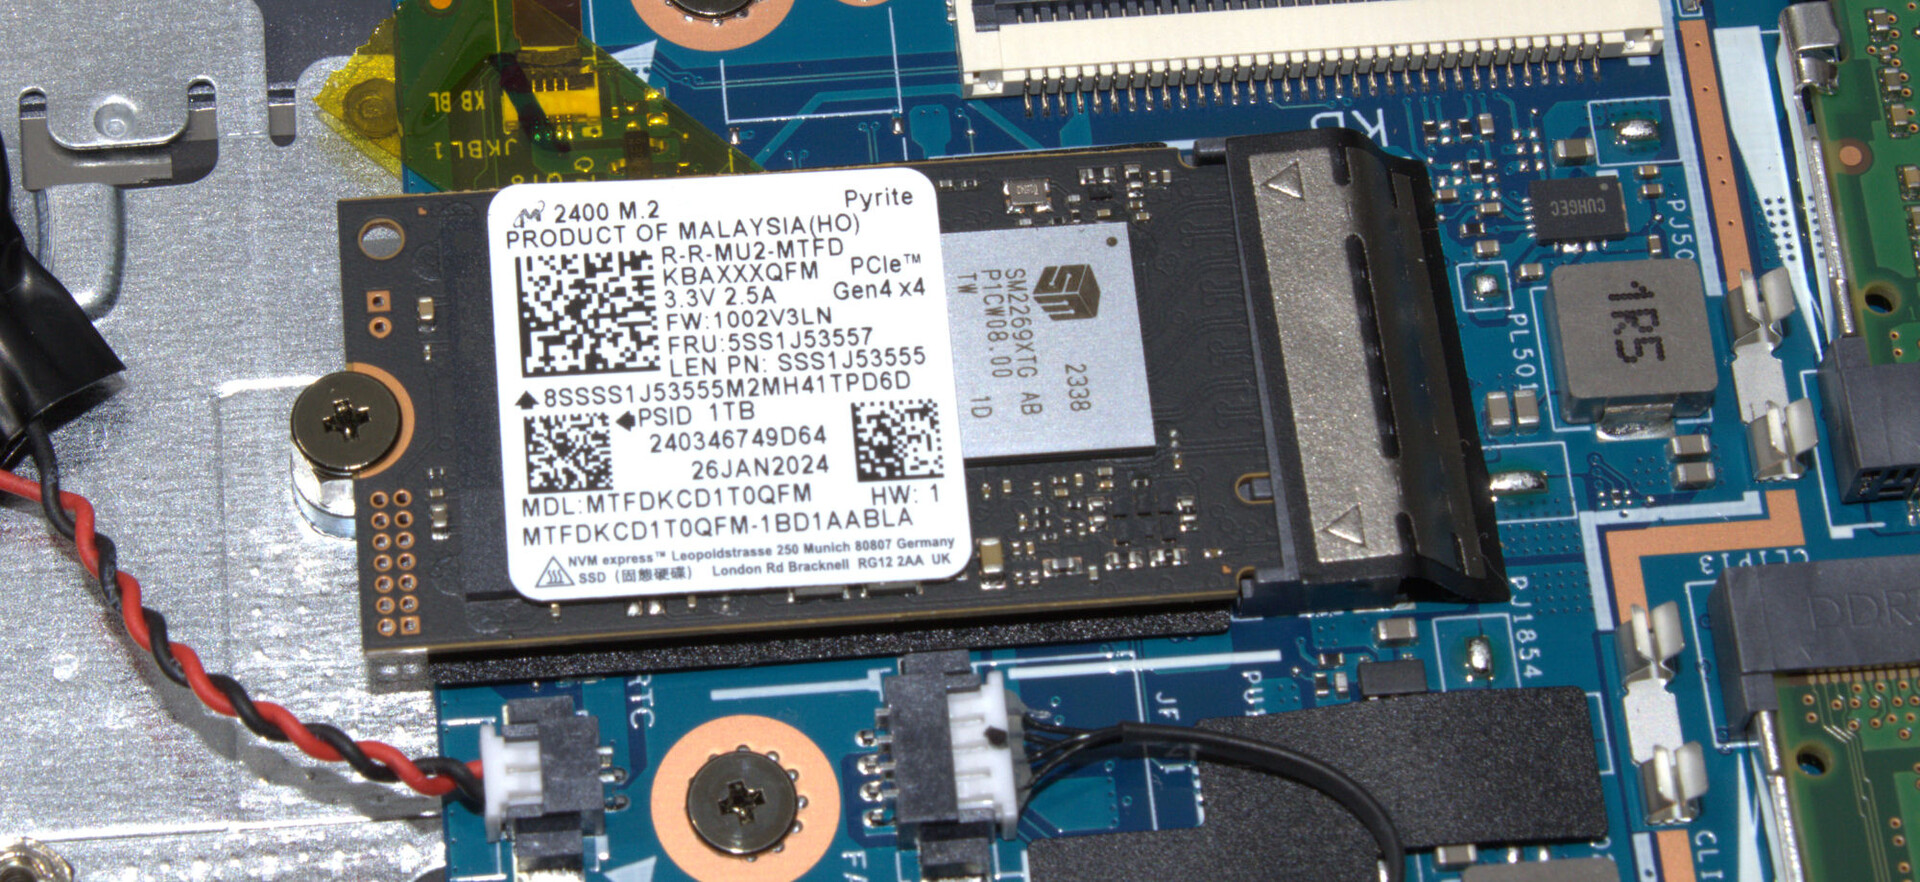
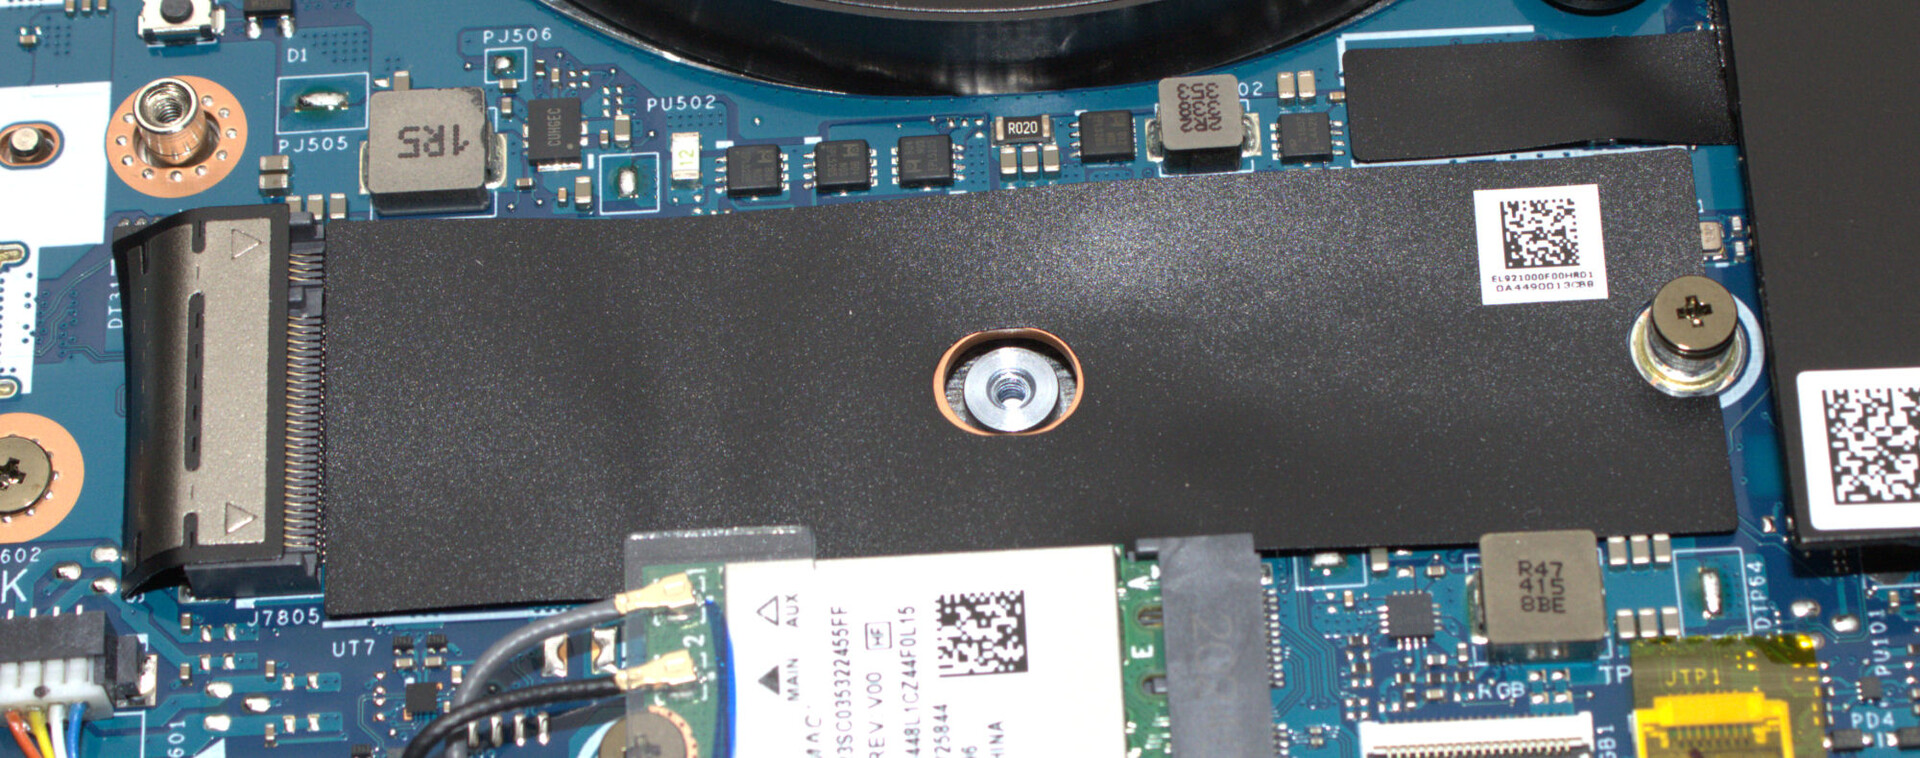
Dispositivi di archiviazione
Il LOQ ha spazio per un totale di due SSD PCIe 4 (M.2 2280 o M.2 2242). L'SSD Micron (1 TB, M.2 2242) all'interno del nostro dispositivo di prova offre buone velocità di trasferimento dati, ma non può essere classificato come uno dei modelli SSD top di gamma. Nel corso del ciclo DiskSpd, abbiamo notato un po' di throttling indotto dalla temperatura.

* ... Meglio usare valori piccoli
Reading continuous performance: DiskSpd Read Loop, Queue Depth 8
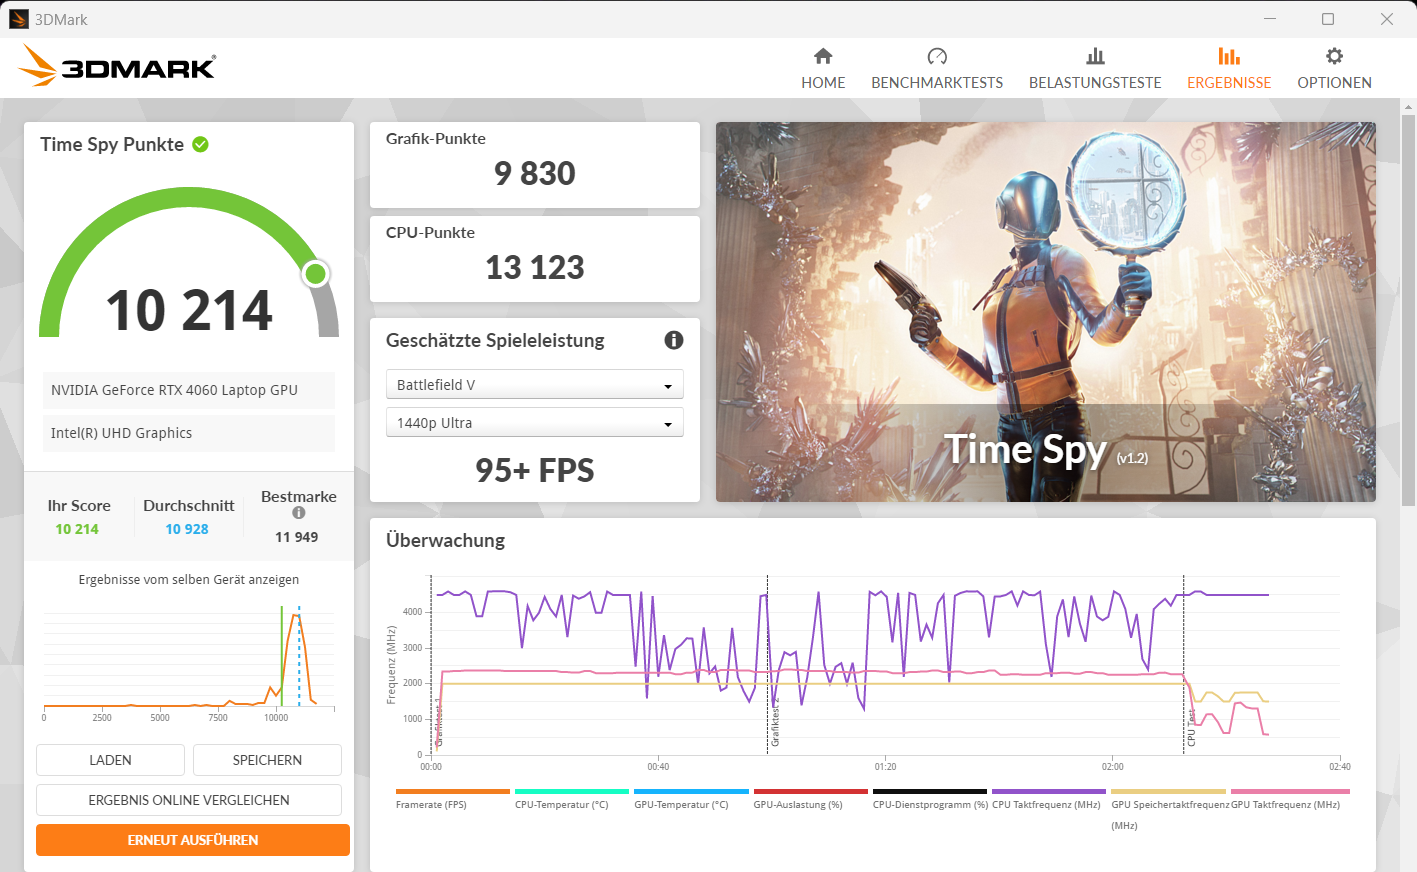
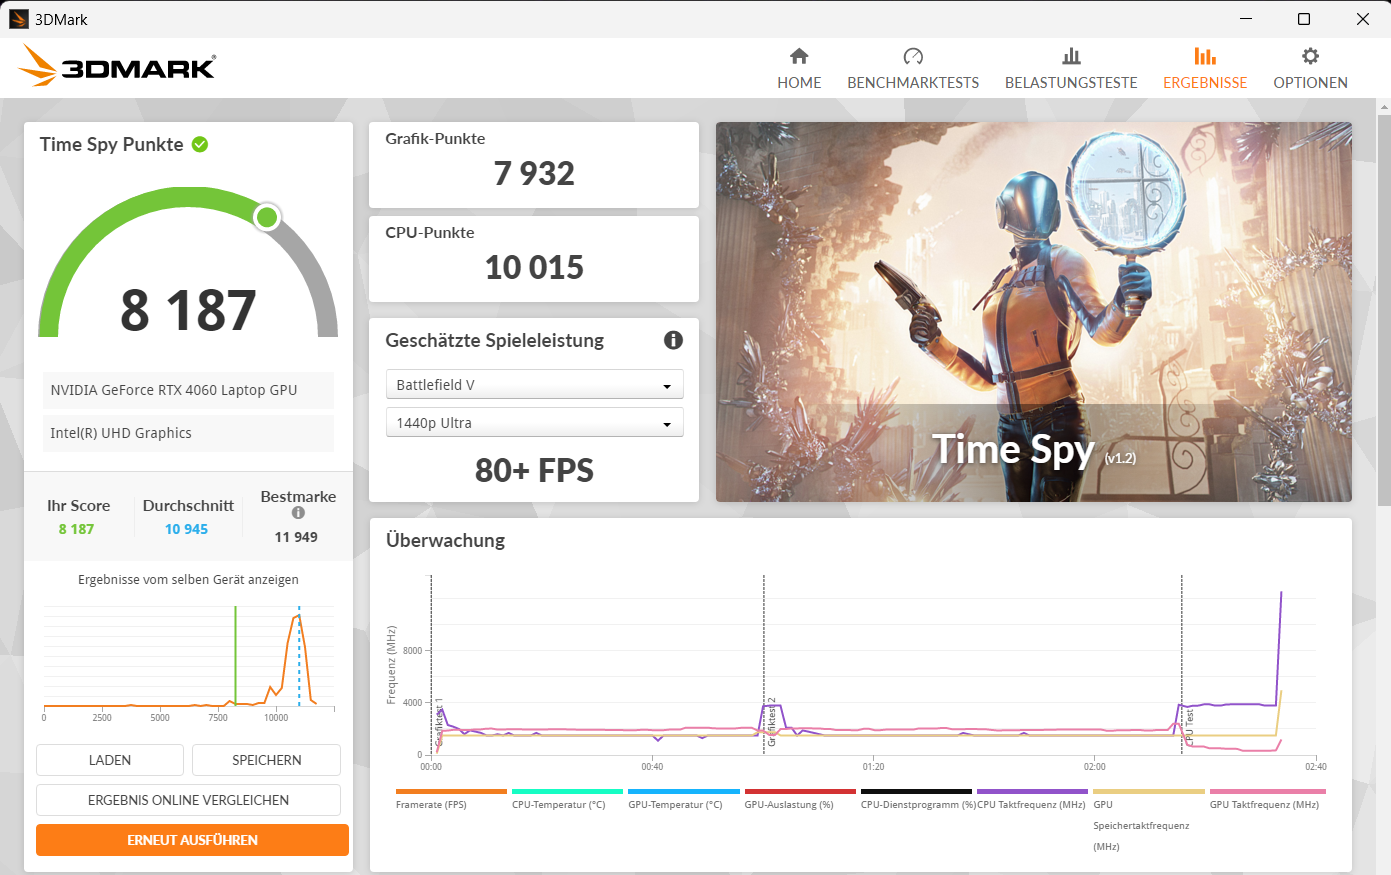
Scheda grafica
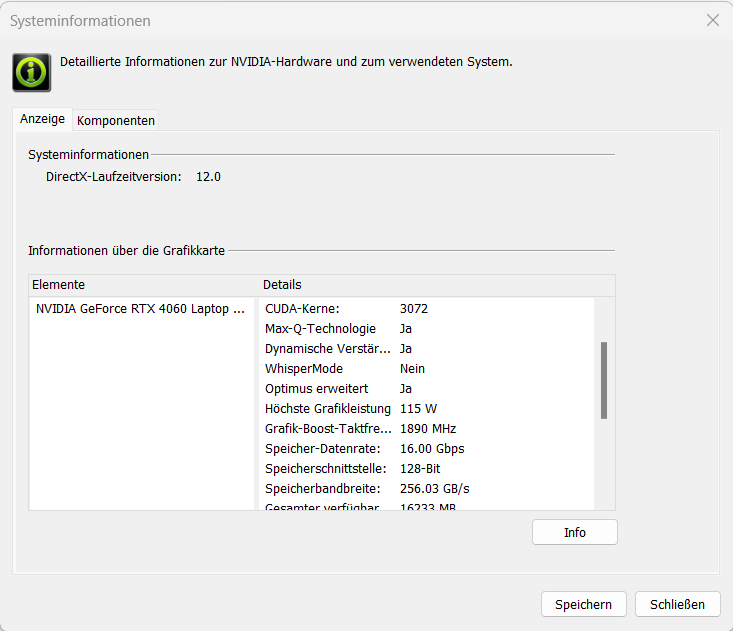
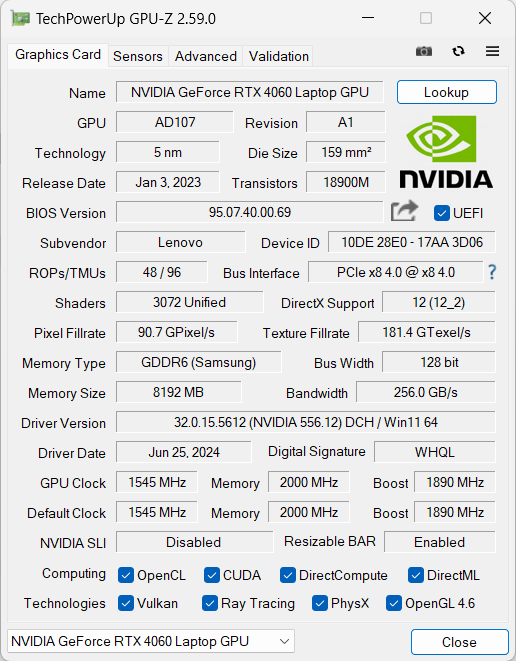
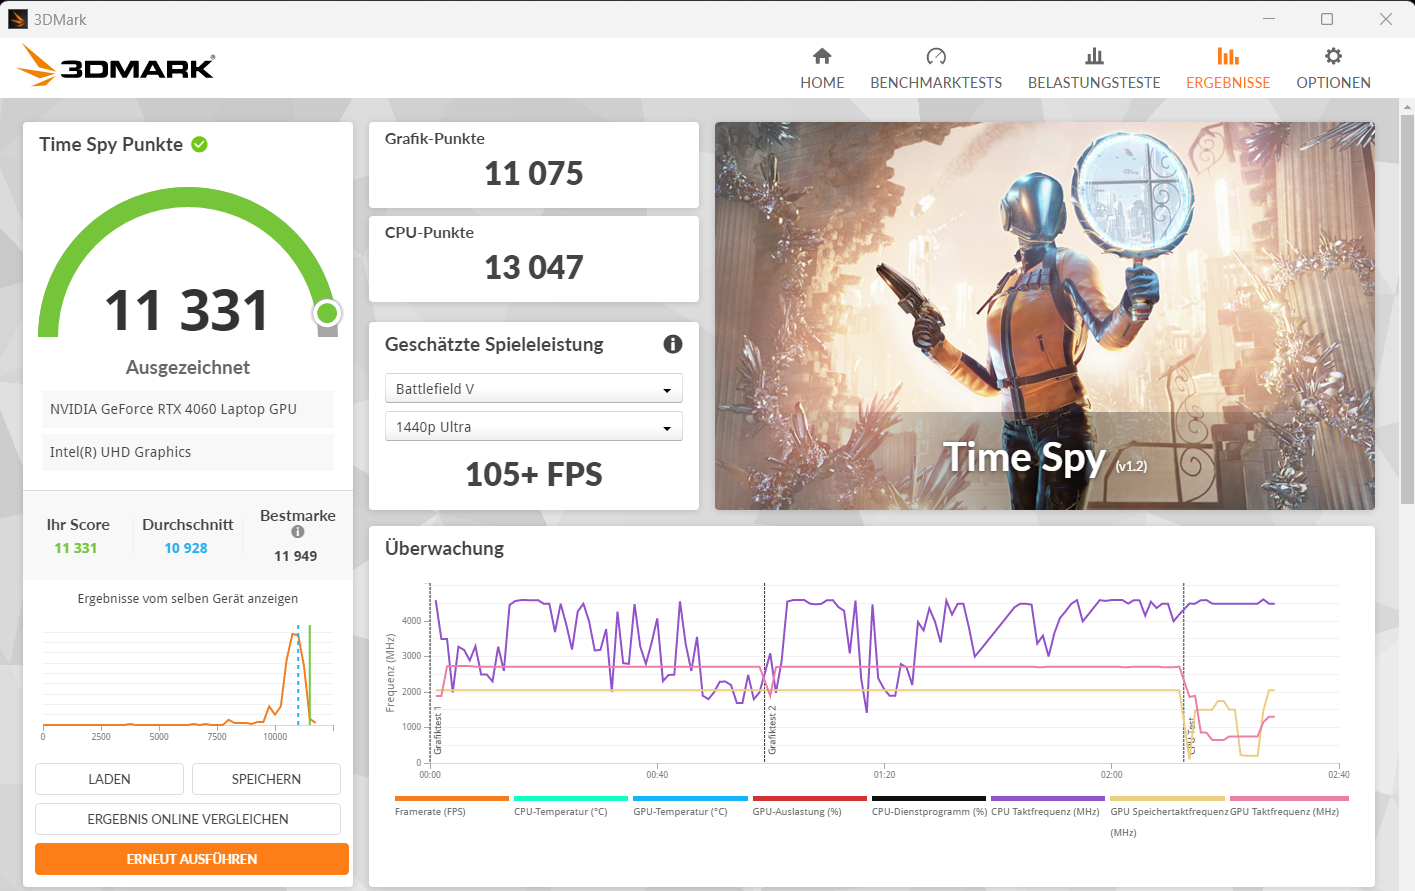
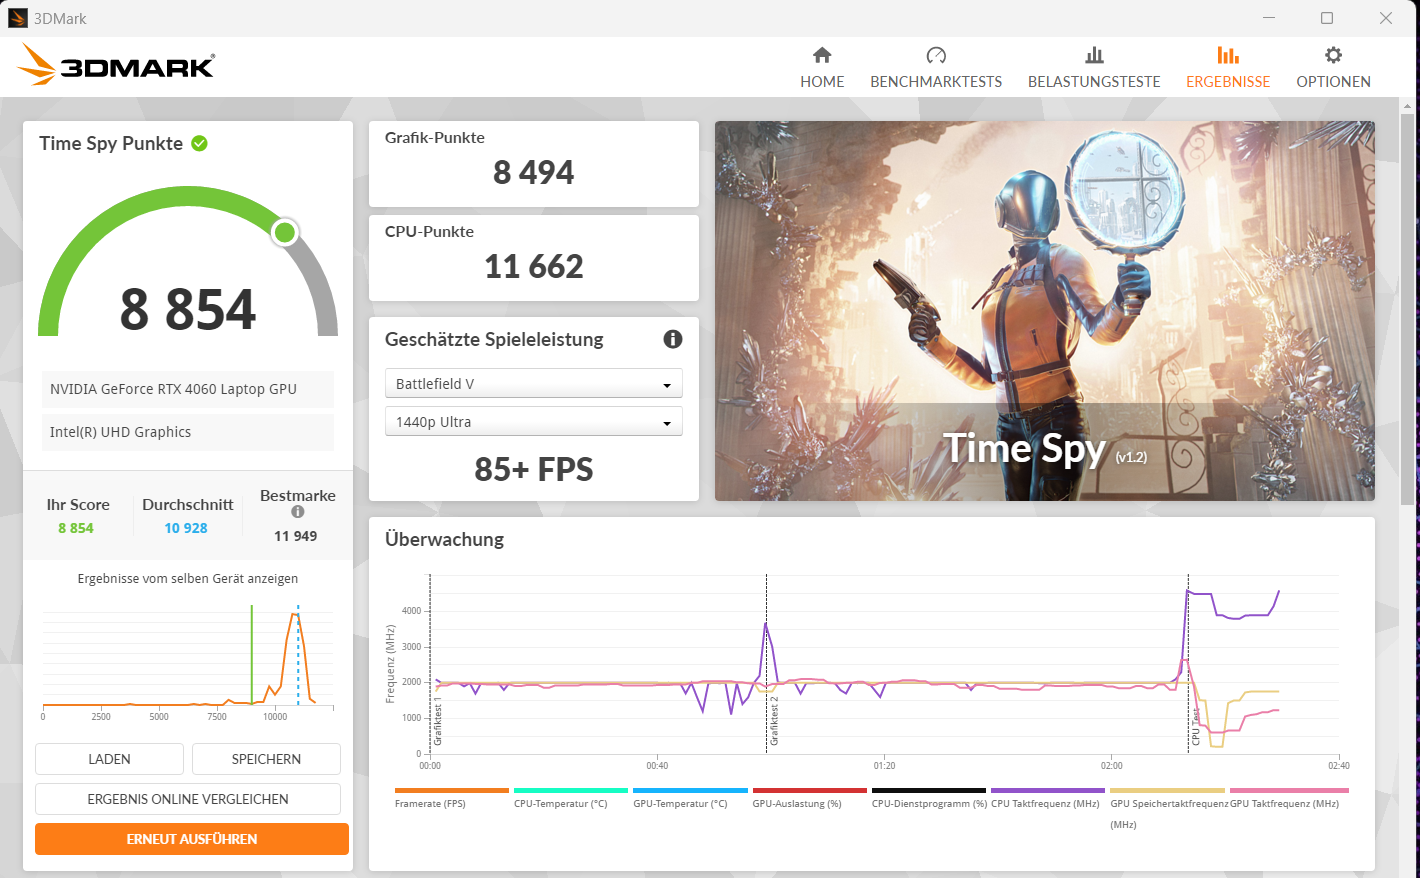
La GeForce RTX 4060 (3.072 shader, bus a 128 bit, 8 GB GDDR6, 115 watt) rappresenta la fascia media dell'attuale lineup di GPU mobili di Nvidia. Consente di giocare in FHD con impostazioni da alte a massime. I risultati dei benchmark e i frame rate sono all'incirca in linea con la media della RTX-4060( modalitàbilanciata ). La modalità Performance ha portato a valori migliori. Il passaggio da dGPU a Optimus non richiede un riavvio: Optimus avanzato è supportato.
| 3DMark Performance Rating - Percent | |
| Media della classe Gaming | |
| SCHENKER XMG Core 15 (M24) | |
| Lenovo LOQ 15IRX9 | |
| Dell G16, i7-13650HX, RTX 4060 | |
| Lenovo LOQ 15IRX9 | |
| Gigabyte G6X 9KG (2024) | |
| HP Victus 16 (2024) | |
| Media NVIDIA GeForce RTX 4060 Laptop GPU | |
| 3DMark 11 - 1280x720 Performance GPU | |
| Media della classe Gaming (10741 - 72178, n=143, ultimi 2 anni) | |
| SCHENKER XMG Core 15 (M24) | |
| Lenovo LOQ 15IRX9 (Leistungsmodus) | |
| Dell G16, i7-13650HX, RTX 4060 | |
| Lenovo LOQ 15IRX9 | |
| Gigabyte G6X 9KG (2024) | |
| HP Victus 16 (2024) | |
| Media NVIDIA GeForce RTX 4060 Laptop GPU (28136 - 38912, n=57) | |
| 3DMark | |
| 1920x1080 Fire Strike Graphics | |
| Media della classe Gaming (2913 - 56116, n=155, ultimi 2 anni) | |
| SCHENKER XMG Core 15 (M24) | |
| Lenovo LOQ 15IRX9 (Leistungsmodus) | |
| Lenovo LOQ 15IRX9 | |
| Gigabyte G6X 9KG (2024) | |
| Dell G16, i7-13650HX, RTX 4060 | |
| HP Victus 16 (2024) | |
| Media NVIDIA GeForce RTX 4060 Laptop GPU (20533 - 29656, n=54) | |
| 2560x1440 Time Spy Graphics | |
| Media della classe Gaming (2295 - 24599, n=151, ultimi 2 anni) | |
| SCHENKER XMG Core 15 (M24) | |
| Lenovo LOQ 15IRX9 (Leistungsmodus) | |
| Dell G16, i7-13650HX, RTX 4060 | |
| Media NVIDIA GeForce RTX 4060 Laptop GPU (7484 - 11451, n=56) | |
| HP Victus 16 (2024) | |
| Gigabyte G6X 9KG (2024) | |
| Lenovo LOQ 15IRX9 | |
| 3DMark 11 Performance | 30755 punti | |
| 3DMark Fire Strike Score | 22788 punti | |
| 3DMark Time Spy Score | 10214 punti | |
| 3DMark Steel Nomad Score | 2143 punti | |
Aiuto | ||
| Geekbench 5.5 | |
| OpenCL Score | |
| Media della classe Gaming (5039 - 270235, n=150, ultimi 2 anni) | |
| SCHENKER XMG Core 15 (M24) | |
| Lenovo LOQ 15IRX9 (Leistungsmodus) | |
| Lenovo LOQ 15IRX9 | |
| Gigabyte G6X 9KG (2024) | |
| Dell G16, i7-13650HX, RTX 4060 | |
| HP Victus 16 (2024) | |
| Media NVIDIA GeForce RTX 4060 Laptop GPU (5039 - 112238, n=53) | |
| Vulkan Score 5.5 | |
| SCHENKER XMG Core 15 (M24) | |
| Lenovo LOQ 15IRX9 (Leistungsmodus) | |
| Lenovo LOQ 15IRX9 | |
| Media della classe Gaming (9296 - 176078, n=103, ultimi 2 anni) | |
| Media NVIDIA GeForce RTX 4060 Laptop GPU (28838 - 87612, n=31) | |
| HP Victus 16 (2024) | |
| Gigabyte G6X 9KG (2024) | |
| Geekbench 6.4 | |
| GPU OpenCL | |
| Media della classe Gaming (4321 - 234213, n=118, ultimi 2 anni) | |
| Gigabyte G6X 9KG (2024) (6.2.1) | |
| SCHENKER XMG Core 15 (M24) (6.2.1) | |
| HP Victus 16 (2024) (6.2.1) | |
| Dell G16, i7-13650HX, RTX 4060 (6.2.1) | |
| Lenovo LOQ 15IRX9 (6.2.1, Leistungsmodus) | |
| Lenovo LOQ 15IRX9 (6.2.1) | |
| Media NVIDIA GeForce RTX 4060 Laptop GPU (4321 - 100831, n=40) | |
| GPU Vulkan | |
| SCHENKER XMG Core 15 (M24) (6.2.1) | |
| Lenovo LOQ 15IRX9 (6.2.1, Leistungsmodus) | |
| Gigabyte G6X 9KG (2024) (6.2.1) | |
| Lenovo LOQ 15IRX9 (6.2.1) | |
| HP Victus 16 (2024) (6.2.1) | |
| Media della classe Gaming (4286 - 231659, n=110, ultimi 2 anni) | |
| Media NVIDIA GeForce RTX 4060 Laptop GPU (4286 - 101001, n=36) | |
| Dell G16, i7-13650HX, RTX 4060 (6.2.1) | |
| V-Ray 5 Benchmark | |
| GPU RTX | |
| Media della classe Gaming (556 - 4011, n=88, ultimi 2 anni) | |
| Gigabyte G6X 9KG (2024) (5.0.1) | |
| HP Victus 16 (2024) (5.0.1) | |
| Lenovo LOQ 15IRX9 (5.0.1, Leistungsmodus) | |
| Dell G16, i7-13650HX, RTX 4060 (5.0.1) | |
| Media NVIDIA GeForce RTX 4060 Laptop GPU (1387 - 1817, n=28) | |
| Lenovo LOQ 15IRX9 (5.0.1) | |
| GPU CUDA | |
| Media della classe Gaming (300 - 3229, n=90, ultimi 2 anni) | |
| Lenovo LOQ 15IRX9 (5.0.1, Leistungsmodus) | |
| Gigabyte G6X 9KG (2024) (5.0.1) | |
| Lenovo LOQ 15IRX9 (5.0.1) | |
| HP Victus 16 (2024) (5.0.1) | |
| Media NVIDIA GeForce RTX 4060 Laptop GPU (957 - 1294, n=29) | |
| Dell G16, i7-13650HX, RTX 4060 (5.0.1) | |
| CPU | |
| Media della classe Gaming (3562 - 30302, n=92, ultimi 2 anni) | |
| HP Victus 16 (2024) (5.0.1) | |
| Media NVIDIA GeForce RTX 4060 Laptop GPU (8364 - 21065, n=28) | |
| Gigabyte G6X 9KG (2024) (5.0.1) | |
| Lenovo LOQ 15IRX9 (5.0.1, Leistungsmodus) | |
| Dell G16, i7-13650HX, RTX 4060 (5.0.1) | |
| Lenovo LOQ 15IRX9 (5.0.1) | |
| V-Ray Benchmark Next 4.10 | |
| GPU | |
| SCHENKER XMG Core 15 (M24) (v4.10.07 ) | |
| Media della classe Gaming (54 - 1317, n=122, ultimi 2 anni) | |
| Gigabyte G6X 9KG (2024) (v4.10.07 ) | |
| Lenovo LOQ 15IRX9 (v4.10.07, Leistungsmodus) | |
| Media NVIDIA GeForce RTX 4060 Laptop GPU (483 - 715, n=46) | |
| HP Victus 16 (2024) (v4.10.07 ) | |
| Lenovo LOQ 15IRX9 (v4.10.07 ) | |
| CPU | |
| HP Victus 16 (2024) (v4.10.07 ) | |
| Media della classe Gaming (5413 - 44129, n=122, ultimi 2 anni) | |
| Media NVIDIA GeForce RTX 4060 Laptop GPU (12680 - 32360, n=46) | |
| SCHENKER XMG Core 15 (M24) (v4.10.07 ) | |
| Gigabyte G6X 9KG (2024) (v4.10.07 ) | |
| Lenovo LOQ 15IRX9 (v4.10.07, Leistungsmodus) | |
| Lenovo LOQ 15IRX9 (v4.10.07 ) | |
* ... Meglio usare valori piccoli
| Performance Rating - Percent | |
| Media della classe Gaming | |
| SCHENKER XMG Core 15 (M24) | |
| Dell G16, i7-13650HX, RTX 4060 | |
| Lenovo LOQ 15IRX9 | |
| Gigabyte G6X 9KG (2024) | |
| Media NVIDIA GeForce RTX 4060 Laptop GPU | |
| HP Victus 16 (2024) | |
| Lenovo LOQ 15IRX9 | |
| Cyberpunk 2077 2.2 Phantom Liberty - 1920x1080 Ultra Preset (FSR off) | |
| SCHENKER XMG Core 15 (M24) (2.12) | |
| Media della classe Gaming (6.76 - 158, n=90, ultimi 2 anni) | |
| Lenovo LOQ 15IRX9 (2.02, Leistungsmodus) | |
| Media NVIDIA GeForce RTX 4060 Laptop GPU (56.4 - 93.1, n=31) | |
| Lenovo LOQ 15IRX9 (2.02) | |
| Dell G16, i7-13650HX, RTX 4060 (2.11) | |
| Gigabyte G6X 9KG (2024) (2.02) | |
| HP Victus 16 (2024) (2.02) | |
| GTA V - 1920x1080 Highest Settings possible AA:4xMSAA + FX AF:16x | |
| Dell G16, i7-13650HX, RTX 4060 | |
| SCHENKER XMG Core 15 (M24) | |
| Lenovo LOQ 15IRX9 (Leistungsmodus) | |
| Gigabyte G6X 9KG (2024) | |
| Lenovo LOQ 15IRX9 | |
| Media della classe Gaming (12.1 - 168.2, n=132, ultimi 2 anni) | |
| HP Victus 16 (2024) | |
| Media NVIDIA GeForce RTX 4060 Laptop GPU (76.9 - 126.3, n=48) | |
| Final Fantasy XV Benchmark - 1920x1080 High Quality | |
| Media della classe Gaming (19.2 - 201, n=144, ultimi 2 anni) | |
| Lenovo LOQ 15IRX9 (1.3, Leistungsmodus) | |
| SCHENKER XMG Core 15 (M24) (1.3) | |
| Dell G16, i7-13650HX, RTX 4060 (1.3) | |
| Gigabyte G6X 9KG (2024) (1.3) | |
| Lenovo LOQ 15IRX9 (1.3) | |
| HP Victus 16 (2024) (1.3) | |
| Media NVIDIA GeForce RTX 4060 Laptop GPU (75.1 - 109.8, n=51) | |
| Strange Brigade - 1920x1080 ultra AA:ultra AF:16 | |
| Media della classe Gaming (38.9 - 420, n=140, ultimi 2 anni) | |
| SCHENKER XMG Core 15 (M24) (1.47.22.14 D3D12) | |
| Dell G16, i7-13650HX, RTX 4060 (1.47.22.14 D3D12) | |
| Lenovo LOQ 15IRX9 (1.47.22.14 D3D12, Leistungsmodus) | |
| Lenovo LOQ 15IRX9 (1.47.22.14 D3D12) | |
| Gigabyte G6X 9KG (2024) (1.47.22.14 D3D12) | |
| Media NVIDIA GeForce RTX 4060 Laptop GPU (135.3 - 210, n=50) | |
| HP Victus 16 (2024) (1.47.22.14 D3D12) | |
| Dota 2 Reborn - 1920x1080 ultra (3/3) best looking | |
| HP Victus 16 (2024) | |
| Dell G16, i7-13650HX, RTX 4060 | |
| Media della classe Gaming (65.1 - 220, n=148, ultimi 2 anni) | |
| Media NVIDIA GeForce RTX 4060 Laptop GPU (115 - 183.8, n=53) | |
| Lenovo LOQ 15IRX9 (Leistungsmodus) | |
| Gigabyte G6X 9KG (2024) | |
| Lenovo LOQ 15IRX9 | |
| SCHENKER XMG Core 15 (M24) | |
| X-Plane 11.11 - 1920x1080 high (fps_test=3) | |
| Dell G16, i7-13650HX, RTX 4060 | |
| Gigabyte G6X 9KG (2024) | |
| Media della classe Gaming (32.8 - 166.2, n=151, ultimi 2 anni) | |
| Media NVIDIA GeForce RTX 4060 Laptop GPU (60.7 - 141.1, n=54) | |
| Lenovo LOQ 15IRX9 (Leistungsmodus) | |
| HP Victus 16 (2024) | |
| SCHENKER XMG Core 15 (M24) | |
| Lenovo LOQ 15IRX9 | |
| Dragon's Dogma 2 - 1920x1080 High Preset | |
| Media della classe Gaming (49.5 - 80, n=8, ultimi 2 anni) | |
| HP Victus 16 (2024) | |
| Lenovo LOQ 15IRX9 | |
| Media NVIDIA GeForce RTX 4060 Laptop GPU (57.2 - 67.7, n=5) | |
| Razer Blade 14 Mid 23 | |
| F1 24 - 1920x1080 Ultra High Preset AA:T AF:16x | |
| Media della classe Gaming (54.1 - 148, n=19, ultimi 2 anni) | |
| Media NVIDIA GeForce RTX 4060 Laptop GPU (47.5 - 61.6, n=10) | |
| Razer Blade 14 Mid 23 | |
| Lenovo LOQ 15IRX9 (1122588) | |
| Counter-Strike 2 - 1920x1080 Very High Preset | |
| Razer Blade 14 Mid 23 | |
| Media NVIDIA GeForce RTX 4060 Laptop GPU (123.9 - 139.1, n=2) | |
| Lenovo LOQ 15IRX9 | |
| Media della classe Gaming (11.5 - 189.7, n=10, ultimi 2 anni) | |
| Senua's Saga Hellblade 2 - 1920x1080 High Preset | |
| Media della classe Gaming (38.4 - 78.8, n=6, ultimi 2 anni) | |
| Media NVIDIA GeForce RTX 4060 Laptop GPU (37.6 - 39.5, n=3) | |
| Lenovo LOQ 15IRX9 | |
| Razer Blade 14 Mid 23 | |
| Ghost of Tsushima - 1920x1080 Very High Preset AA:T | |
| Lenovo LOQ 15IRX9 | |
| Media NVIDIA GeForce RTX 4060 Laptop GPU (55.6 - 63.4, n=5) | |
| Media della classe Gaming (28.5 - 73.7, n=7, ultimi 2 anni) | |
| Razer Blade 14 Mid 23 | |
Cyberpunk 2077 ultra FPS diagram
| basso | medio | alto | ultra | |
|---|---|---|---|---|
| GTA V (2015) | 184.4 | 181.5 | 175.5 | 112.6 |
| Dota 2 Reborn (2015) | 171.2 | 156.8 | 149.4 | 141 |
| Final Fantasy XV Benchmark (2018) | 198.9 | 138.5 | 99.9 | |
| X-Plane 11.11 (2018) | 139.6 | 118.4 | 92.2 | |
| Strange Brigade (2018) | 425 | 260 | 209 | 182.7 |
| Cyberpunk 2077 2.2 Phantom Liberty (2023) | 118.9 | 94.3 | 80.1 | 71.4 |
| Counter-Strike 2 (2023) | 195.3 | 195 | 157 | 123.9 |
| Dragon's Dogma 2 (2024) | 70.6 | 63.3 | ||
| Ghost of Tsushima (2024) | 91 | 81.7 | 74.5 | 60.6 |
| Senua's Saga Hellblade 2 (2024) | 64.1 | 53.2 | 38.4 | |
| F1 24 (2024) | 216 | 201 | 162.5 | 54.1 |
Emissioni e potenza - Il Lenovo LOQ con una durata della batteria inferiore alla media
Emissioni di rumore
Per quanto riguarda le emissioni di rumore, il portatile si comporta come ci si aspetta per la sua classe: Sotto carico, produce molto rumore. Giocando a Cyberpunk 2077 si ottengono emissioni acustiche di 48 dB(A)( modalitàbilanciata ) e 54 dB(A)( modalitàprestazioni ). La modalità silenziosa riduce i livelli di rumore a valori più moderati, a costo delle prestazioni del portatile. Il gioco dovrebbe essere ancora possibile, con impostazioni ridotte.
Il controllo della ventola deve essere regolato: Quando è al minimo, le ventole si avviano ripetutamente e brevemente, un comportamento molto fastidioso a lungo termine. A volte funzionano anche in modo permanente a un livello chiaramente udibile.
Rumorosità
| Idle |
| 26 / 34 / 36 dB(A) |
| Sotto carico |
| 48 / 50 dB(A) |
 | ||
30 dB silenzioso 40 dB(A) udibile 50 dB(A) rumoroso |
||
min: | ||
| Lenovo LOQ 15IRX9 NVIDIA GeForce RTX 4060 Laptop GPU, i5-13450HX, Micron 2400 MTFDKCD1T0QFM | SCHENKER XMG Core 15 (M24) NVIDIA GeForce RTX 4060 Laptop GPU, R7 8845HS, Samsung 990 Pro 1 TB | Gigabyte G6X 9KG (2024) NVIDIA GeForce RTX 4060 Laptop GPU, i7-13650HX, Gigabyte AG450E1024-SI | HP Victus 16 (2024) NVIDIA GeForce RTX 4060 Laptop GPU, i7-14700HX, Kioxia XG8 KXG80ZNV512G | Dell G16, i7-13650HX, RTX 4060 NVIDIA GeForce RTX 4060 Laptop GPU, i7-13650HX, WD PC SN740 SDDPNQD-1T00 | |
|---|---|---|---|---|---|
| Noise | 14% | -4% | 4% | 20% | |
| off /ambiente * | 25 | 23 8% | 26 -4% | 25 -0% | 23 8% |
| Idle Minimum * | 26 | 23 12% | 30 -15% | 28 -8% | 23 12% |
| Idle Average * | 34 | 23 32% | 32 6% | 29 15% | 23 32% |
| Idle Maximum * | 36 | 23 36% | 35 3% | 33 8% | 27.96 22% |
| Load Average * | 48 | 38.92 19% | 51 -6% | 45 6% | 27.96 42% |
| Cyberpunk 2077 ultra * | 48 | 52.06 -8% | |||
| Load Maximum * | 50 | 52.09 -4% | 54 -8% | 48 4% | 47.89 4% |
| Witcher 3 ultra * | 50.96 | 51 | 43 | 47.89 |
* ... Meglio usare valori piccoli
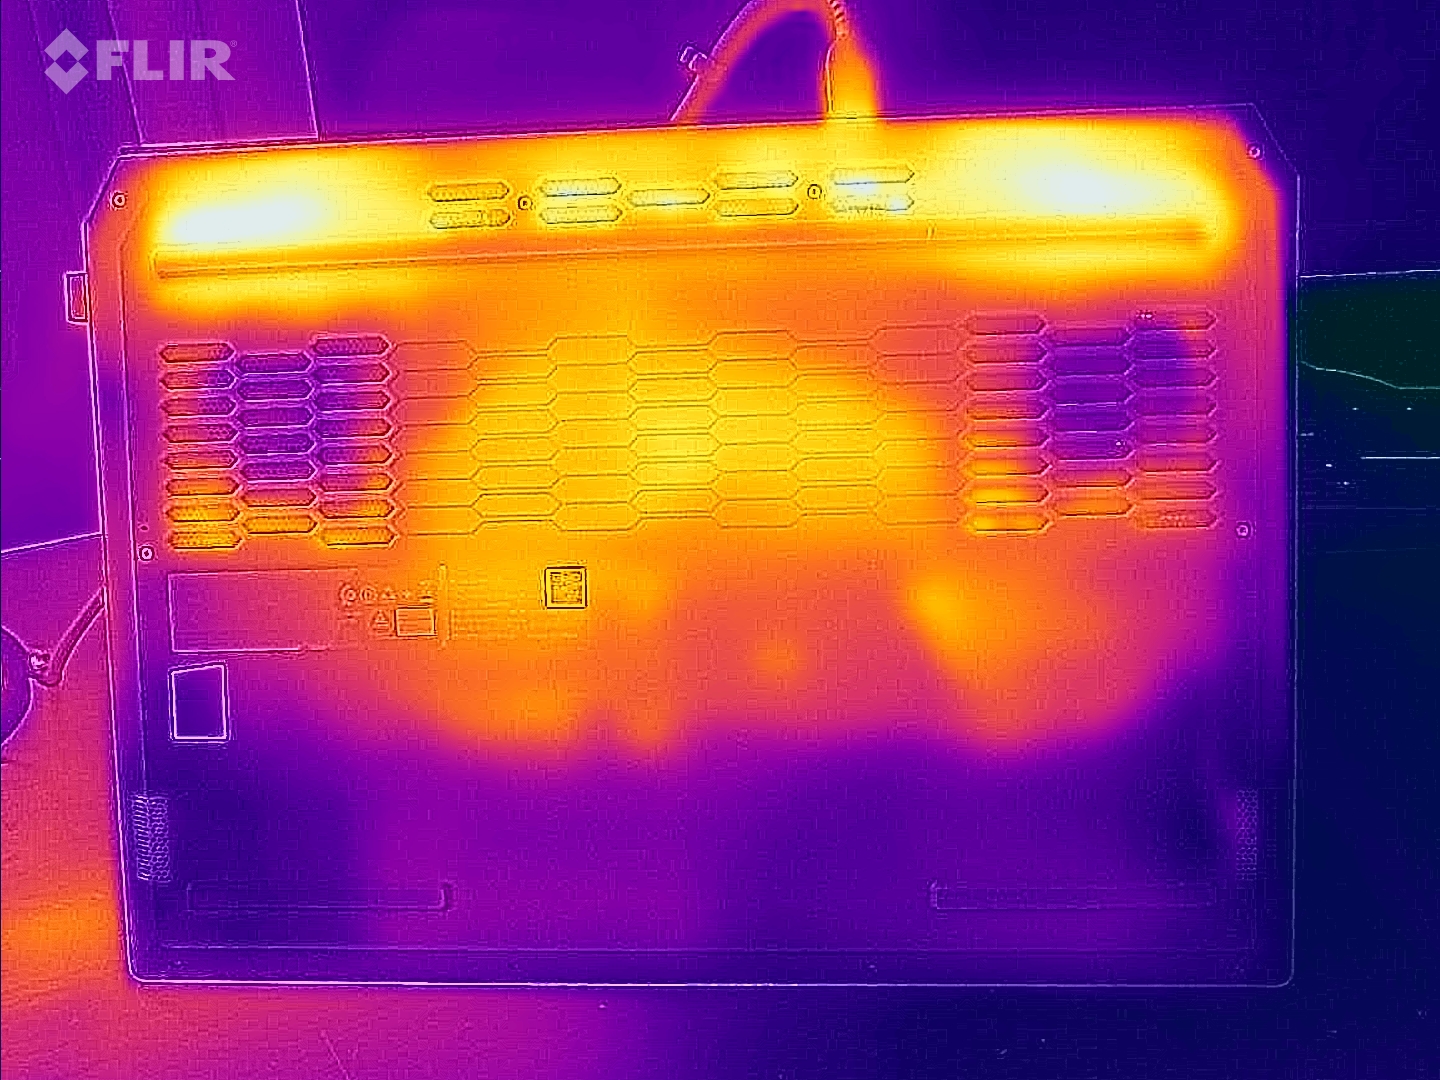
Temperatura
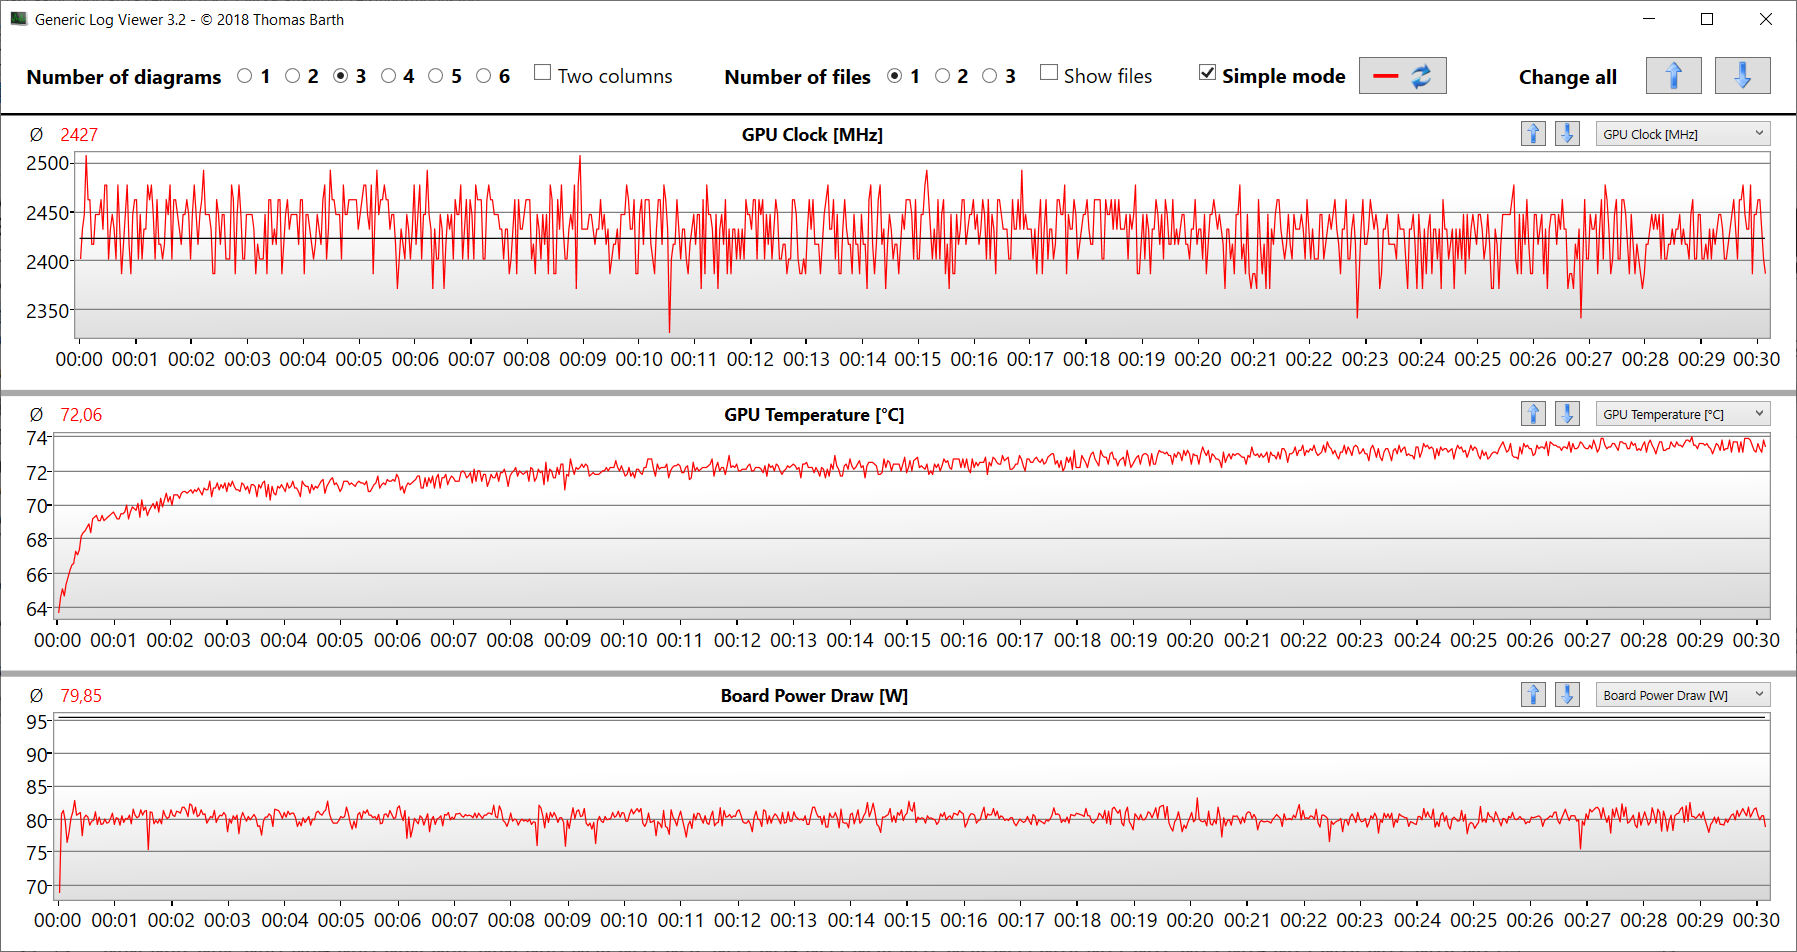
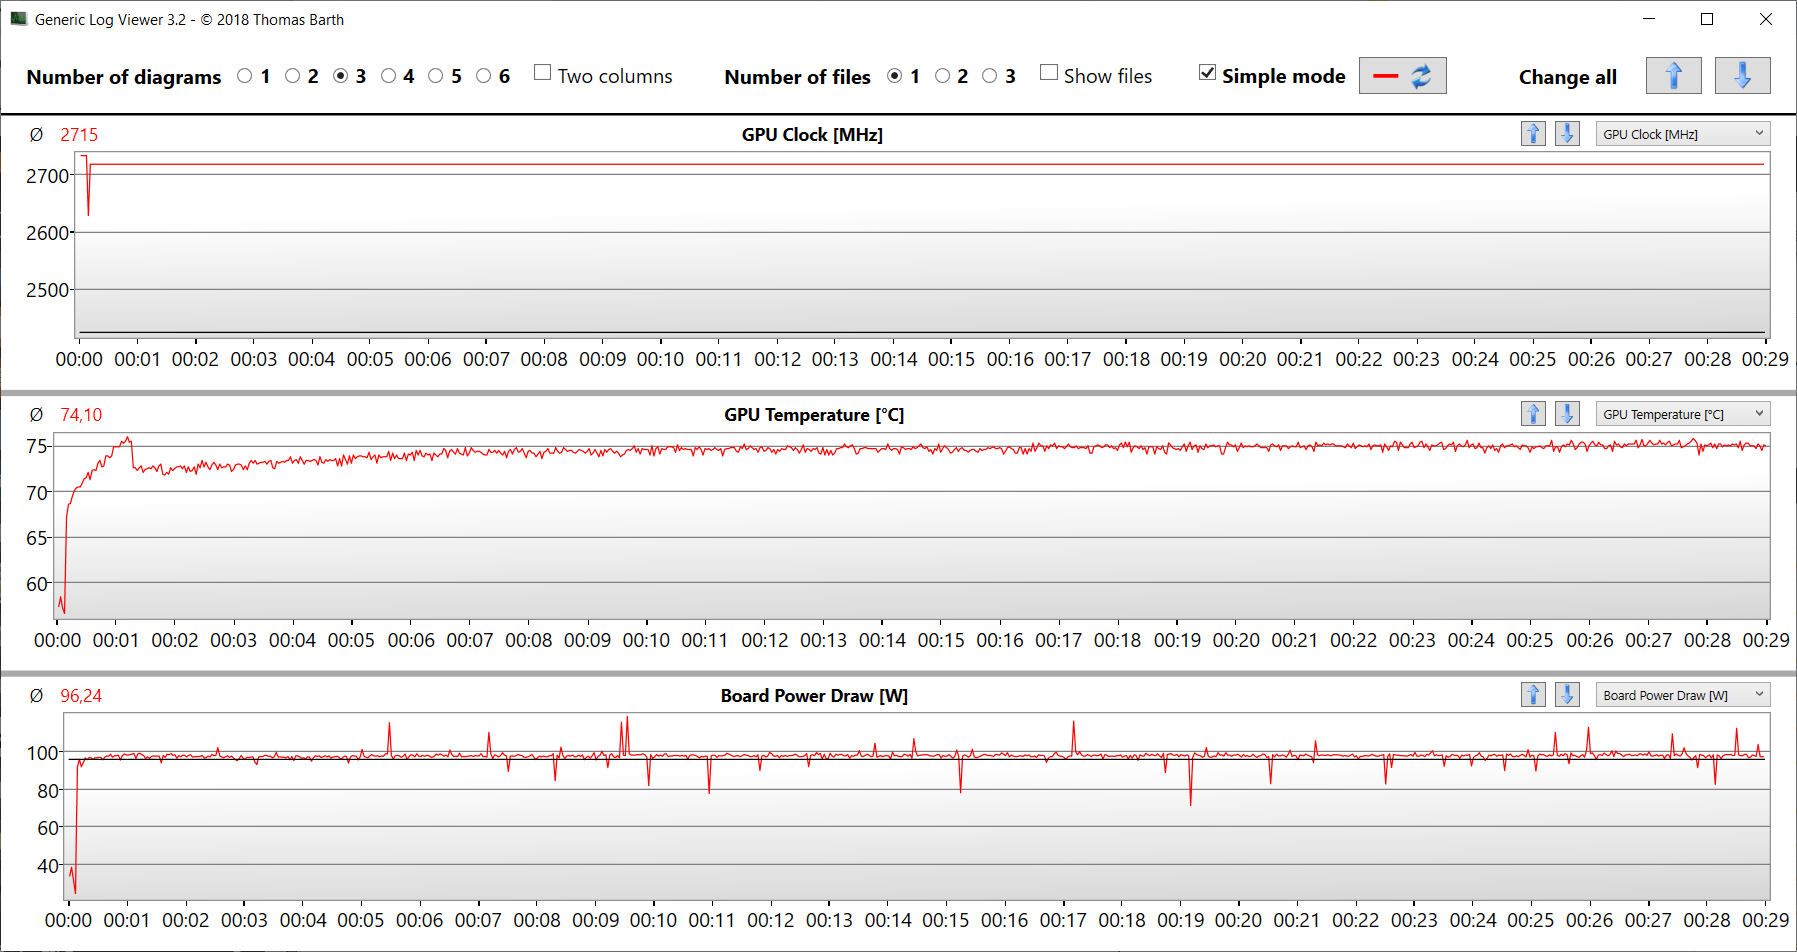
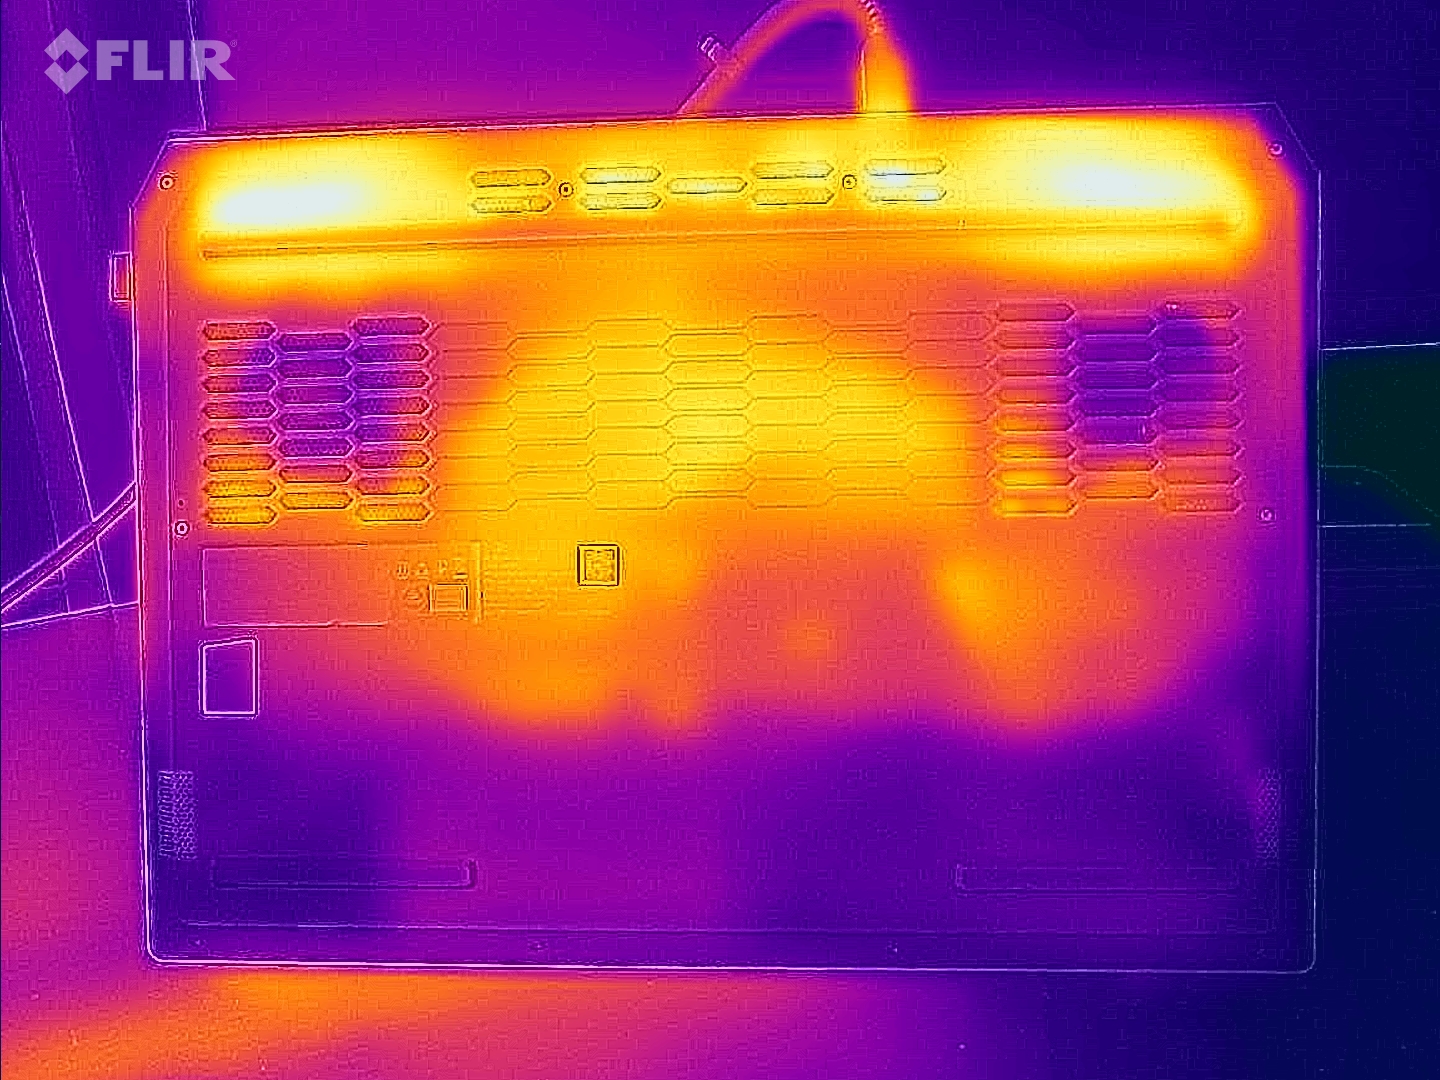
Sotto carico (stress test, Cyberpunk), il portatile si scalda notevolmente: A volte, supera i 50 gradi Celsius. Inoltre, raggiunge valori più elevati durante l'uso quotidiano (ufficio, internet) rispetto a molti dispositivi di confronto. Le temperature del palm rest rimangono semi-ragionevoli.
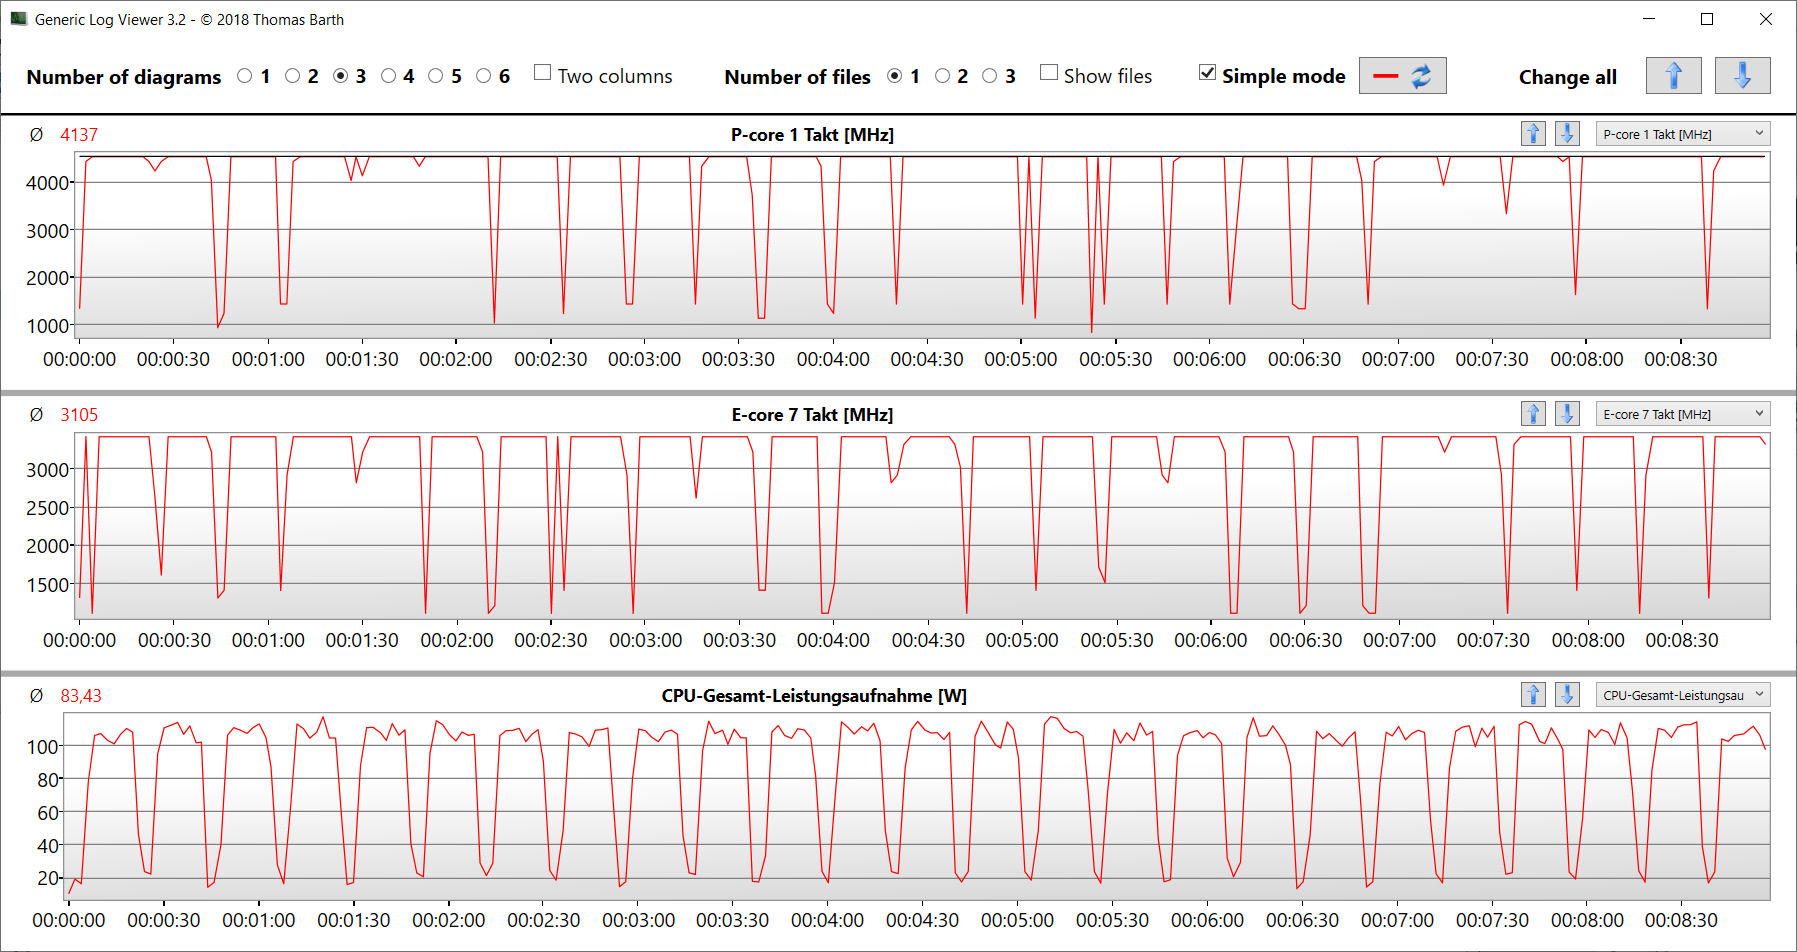
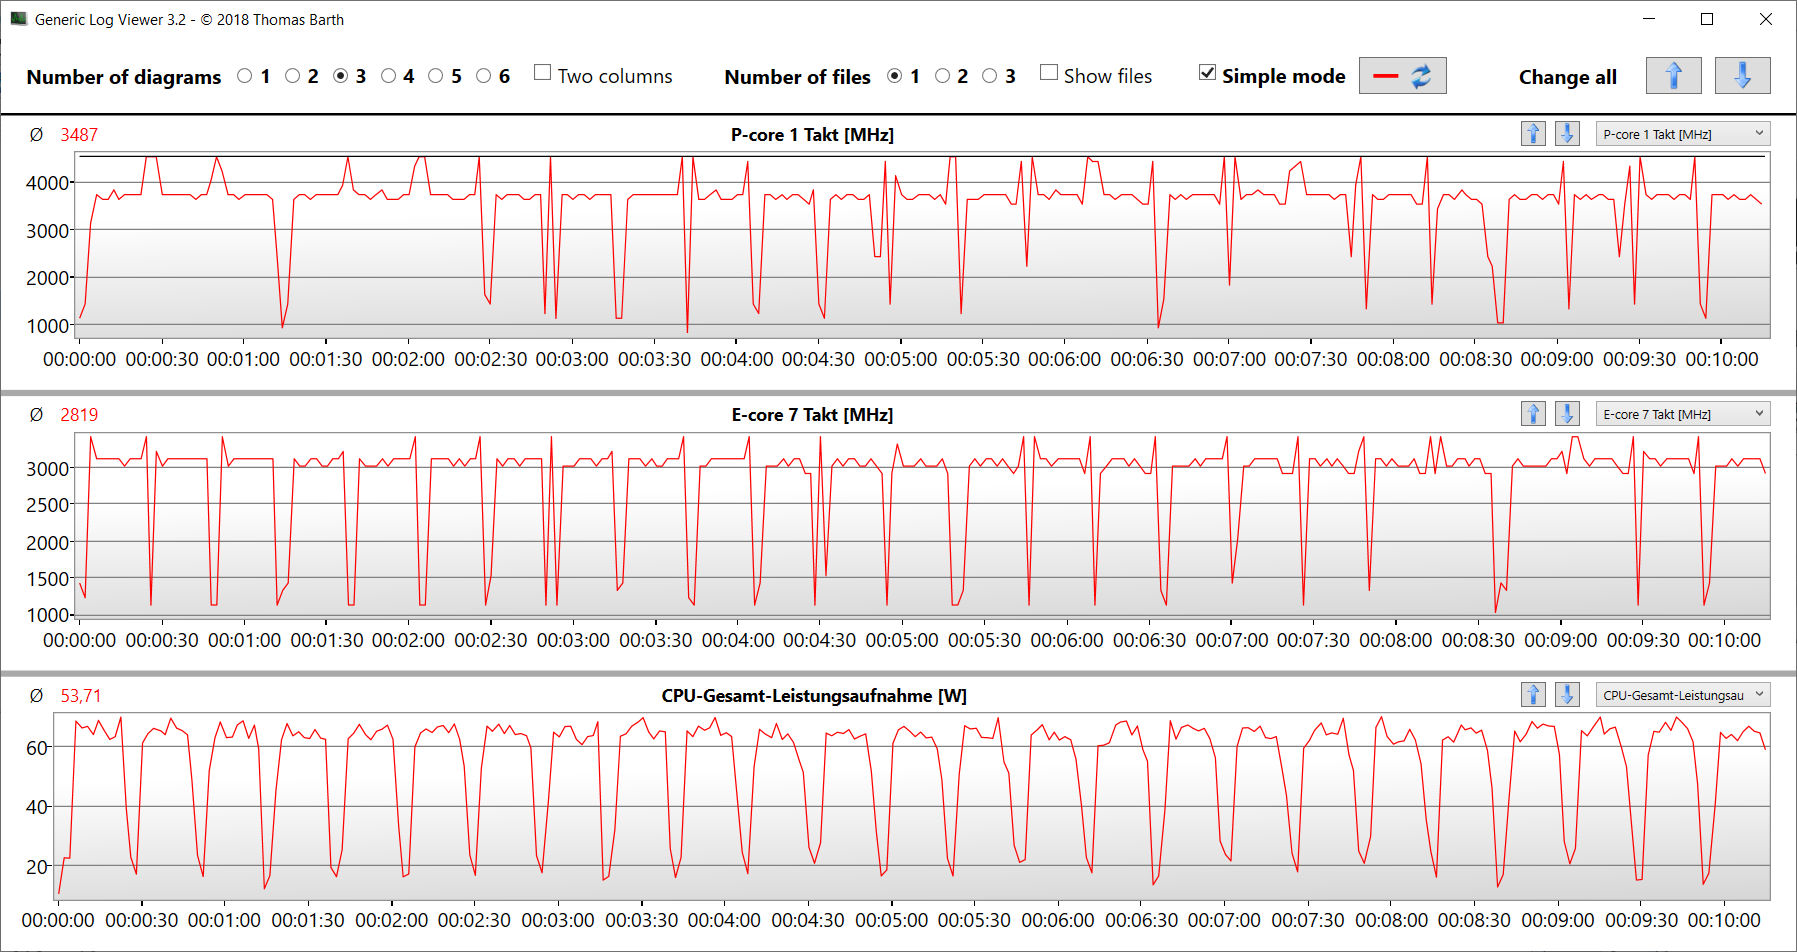
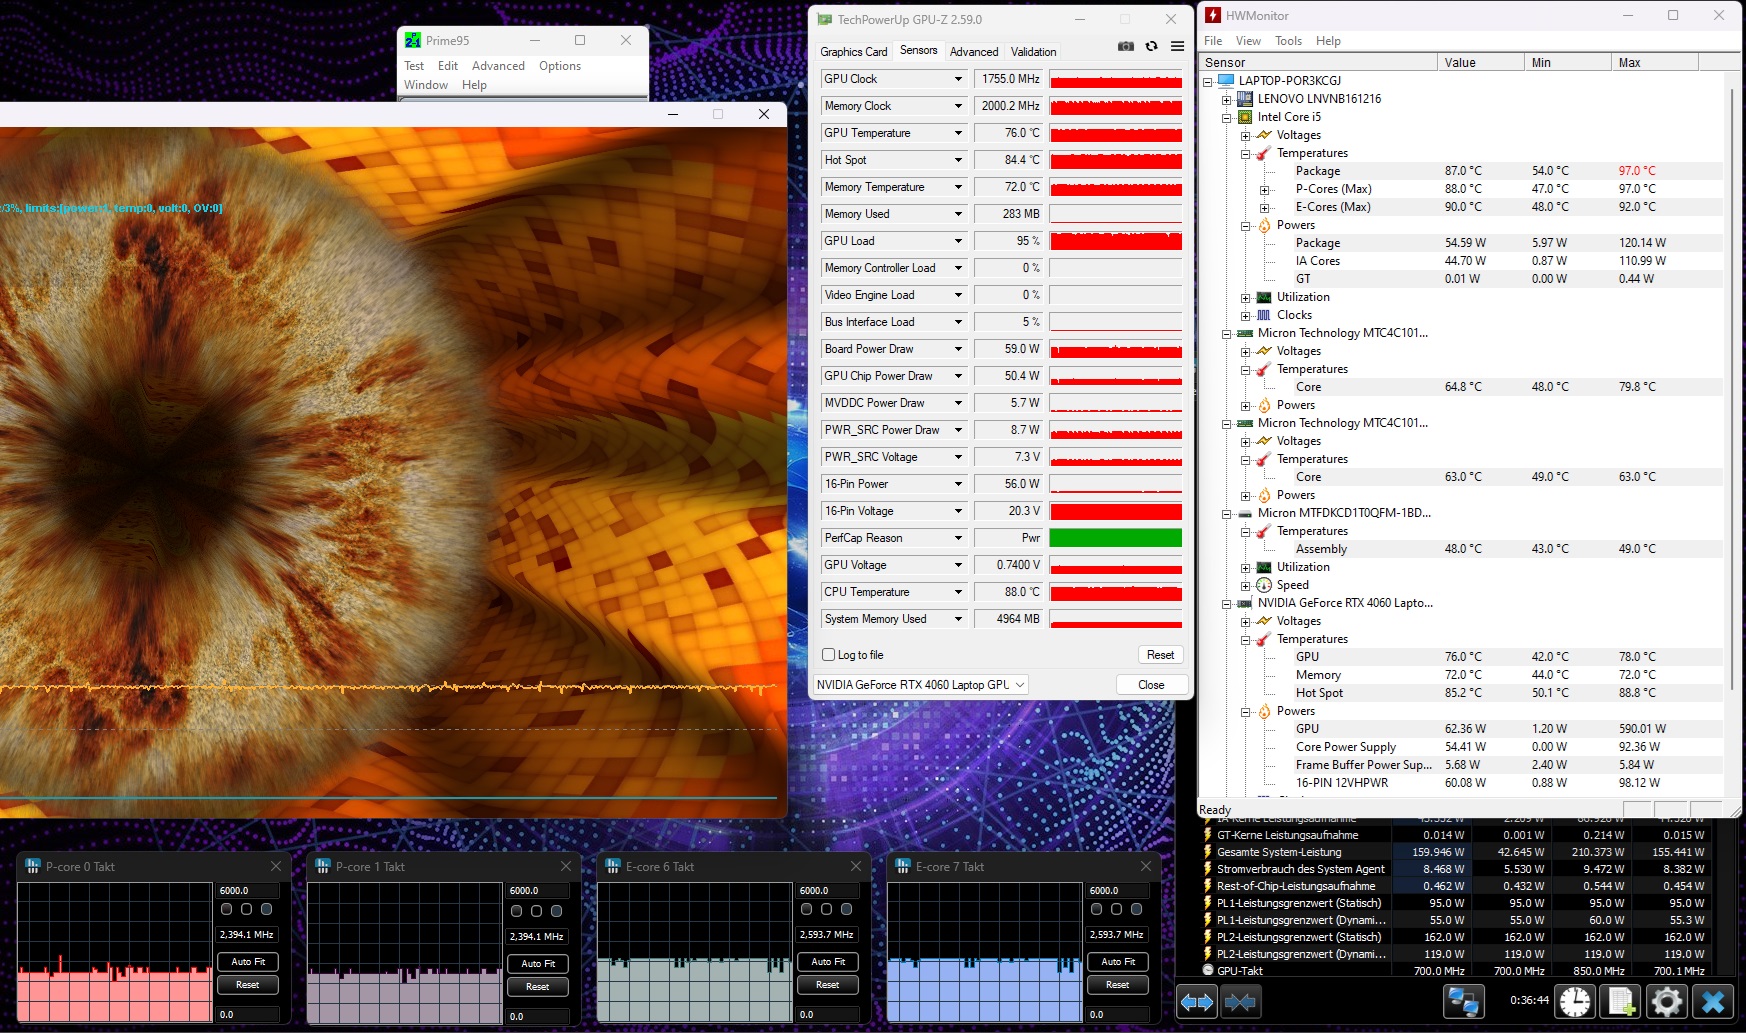
Lo scenario estremo (stress test con Prime95 e Furmark in funzionamento continuo) verifica la stabilità del sistema a pieno carico. La CPU ha un clock di circa 2,4 GHz (P) e 2,6 GHz (E), mentre il core grafico ha raggiunto valori intorno a 1.800 MHz.
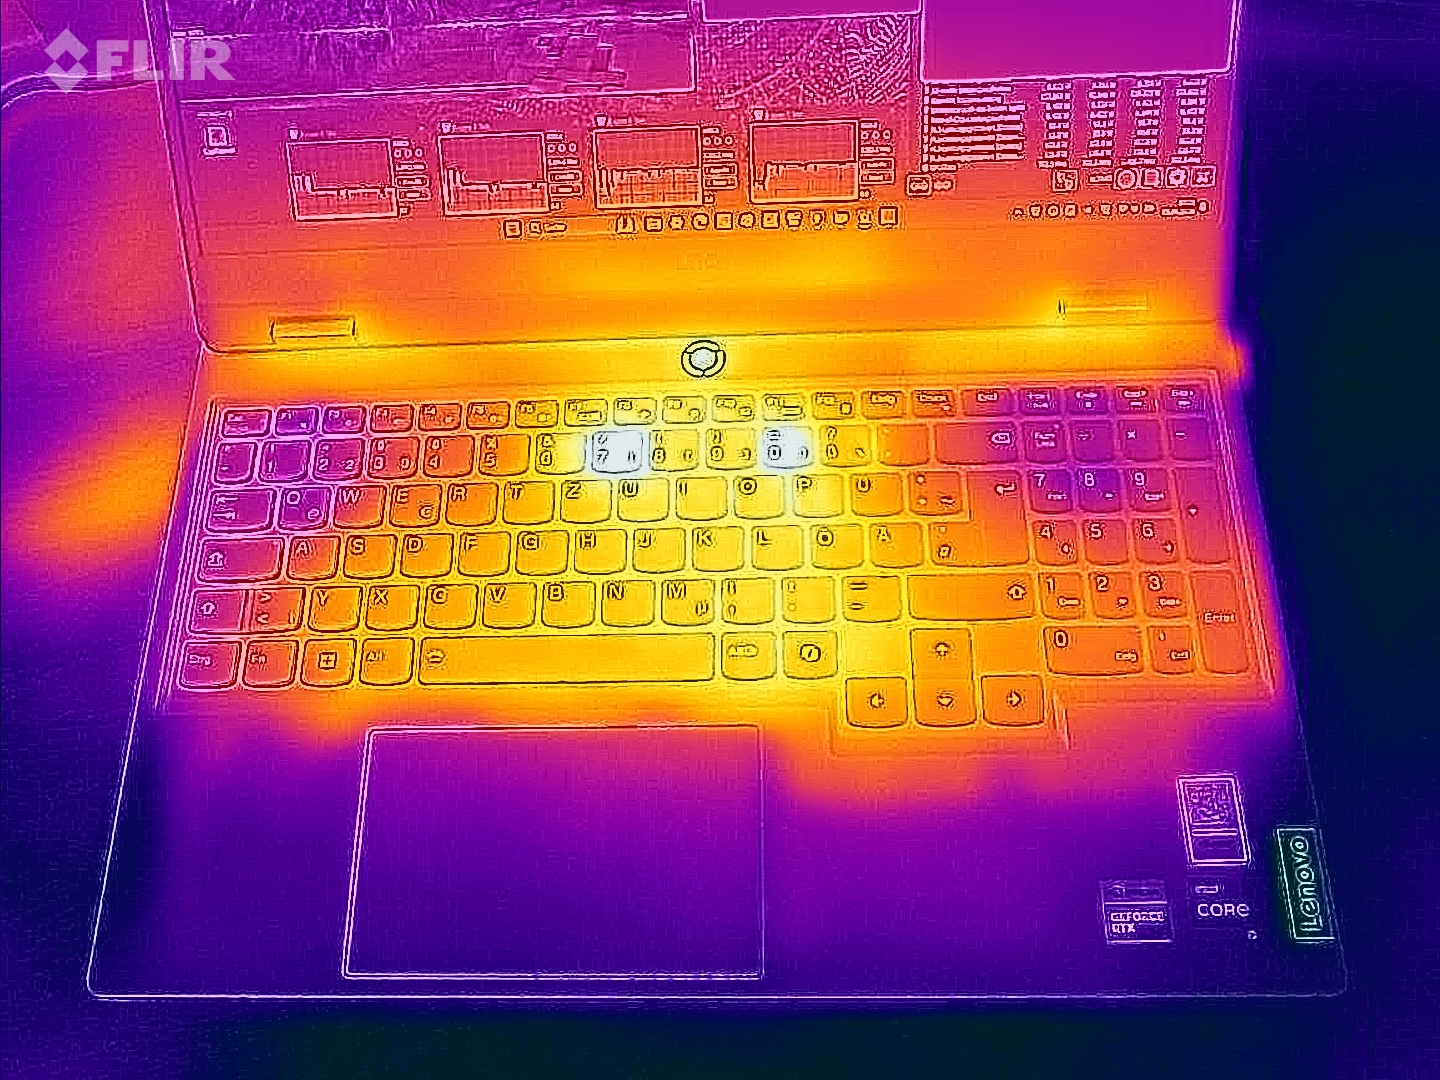
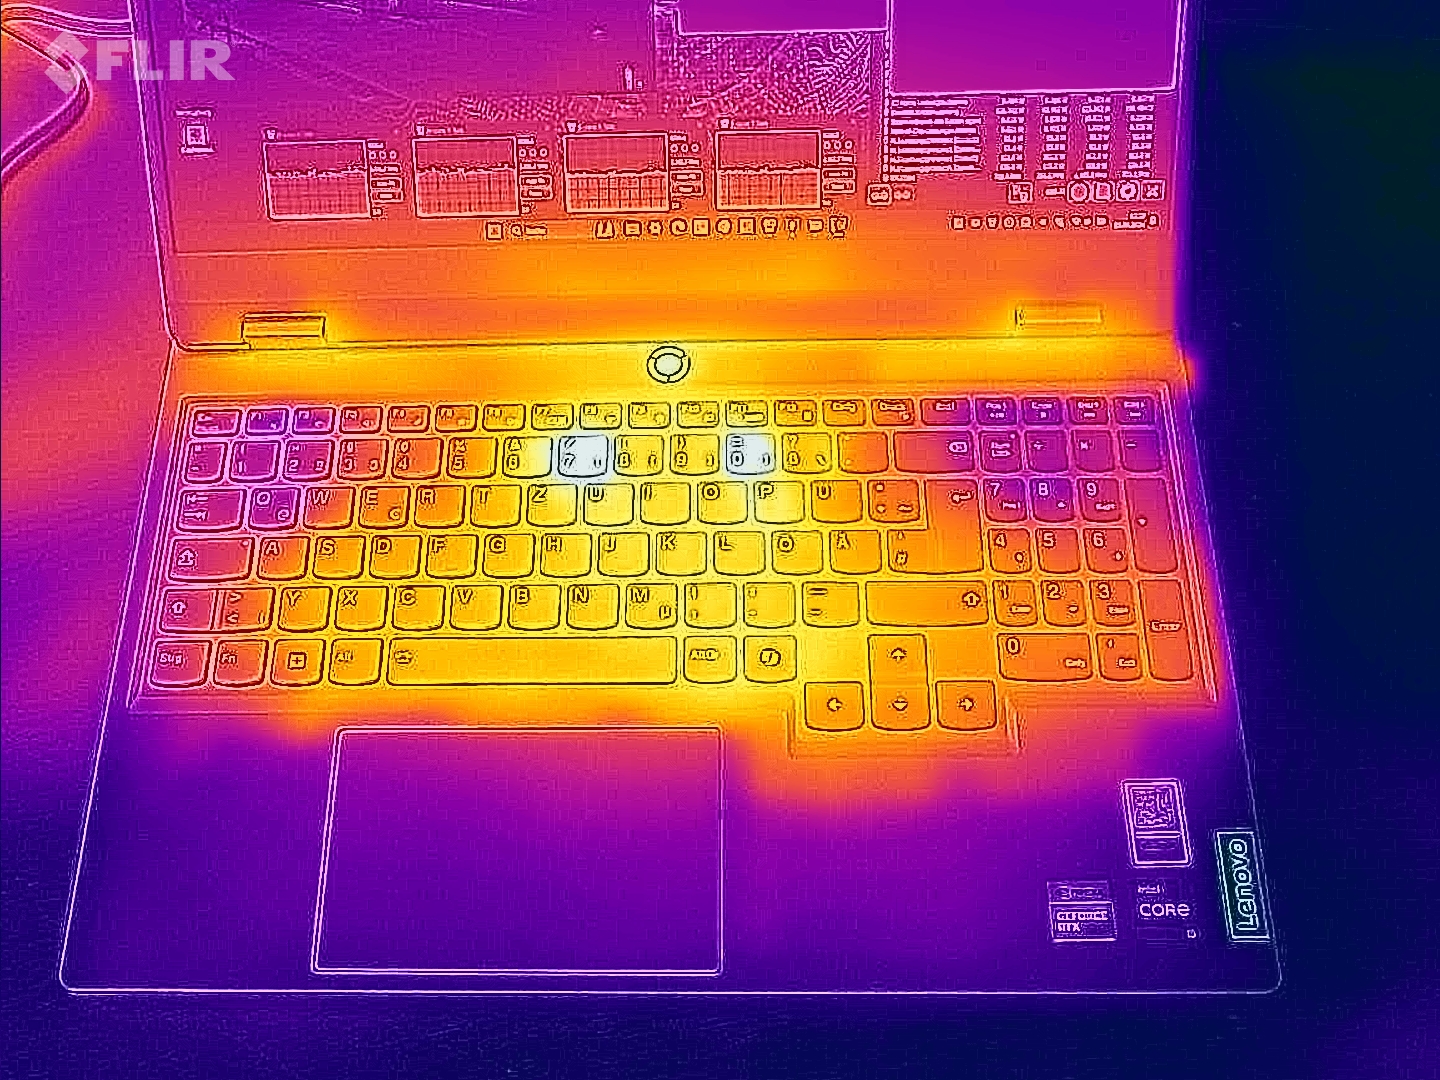
(-) La temperatura massima sul lato superiore è di 47 °C / 117 F, rispetto alla media di 40.4 °C / 105 F, che varia da 21.2 a 68.8 °C per questa classe Gaming.
(-) Il lato inferiore si riscalda fino ad un massimo di 58 °C / 136 F, rispetto alla media di 43.2 °C / 110 F
(+) In idle, la temperatura media del lato superiore è di 30.2 °C / 86 F, rispetto alla media deld ispositivo di 33.9 °C / 93 F.
(-) 3: The average temperature for the upper side is 41.7 °C / 107 F, compared to the average of 33.9 °C / 93 F for the class Gaming.
(±) I poggiapolsi e il touchpad possono diventare molto caldi al tatto con un massimo di 38 °C / 100.4 F.
(-) La temperatura media della zona del palmo della mano di dispositivi simili e'stata di 28.9 °C / 84 F (-9.1 °C / -16.4 F).
| Lenovo LOQ 15IRX9 Intel Core i5-13450HX, NVIDIA GeForce RTX 4060 Laptop GPU | SCHENKER XMG Core 15 (M24) AMD Ryzen 7 8845HS, NVIDIA GeForce RTX 4060 Laptop GPU | Gigabyte G6X 9KG (2024) Intel Core i7-13650HX, NVIDIA GeForce RTX 4060 Laptop GPU | HP Victus 16 (2024) Intel Core i7-14700HX, NVIDIA GeForce RTX 4060 Laptop GPU | Dell G16, i7-13650HX, RTX 4060 Intel Core i7-13650HX, NVIDIA GeForce RTX 4060 Laptop GPU | |
|---|---|---|---|---|---|
| Heat | -8% | 9% | 15% | -3% | |
| Maximum Upper Side * | 47 | 52 -11% | 41 13% | 50 -6% | 49 -4% |
| Maximum Bottom * | 58 | 61 -5% | 43 26% | 50 14% | 58 -0% |
| Idle Upper Side * | 32 | 35 -9% | 32 -0% | 25 22% | 35 -9% |
| Idle Bottom * | 36 | 39 -8% | 37 -3% | 26 28% | 35 3% |
* ... Meglio usare valori piccoli
Altoparlanti
Gli altoparlanti stereo producono un paesaggio sonoro complessivamente accettabile. Tuttavia, un po' più di bassi non guasterebbero.
Lenovo LOQ 15IRX9 analisi audio
(±) | potenza degli altiparlanti media ma buona (81 dB)
Bassi 100 - 315 Hz
(±) | bassi ridotti - in media 14.6% inferiori alla media
(±) | la linearità dei bassi è media (9.6% delta rispetto alla precedente frequenza)
Medi 400 - 2000 Hz
(+) | medi bilanciati - solo only 2.1% rispetto alla media
(+) | medi lineari (3.6% delta rispetto alla precedente frequenza)
Alti 2 - 16 kHz
(±) | alti elevati - circa 5.9% superiori alla media
(±) | la linearità degli alti è media (8.2% delta rispetto alla precedente frequenza)
Nel complesso 100 - 16.000 Hz
(+) | suono nel complesso lineare (14.7% differenza dalla media)
Rispetto alla stessa classe
» 27% di tutti i dispositivi testati in questa classe è stato migliore, 7% simile, 66% peggiore
» Il migliore ha avuto un delta di 6%, medio di 18%, peggiore di 132%
Rispetto a tutti i dispositivi testati
» 17% di tutti i dispositivi testati in questa classe è stato migliore, 4% similare, 79% peggiore
» Il migliore ha avuto un delta di 4%, medio di 24%, peggiore di 134%
SCHENKER XMG Core 15 (M24) analisi audio
(±) | potenza degli altiparlanti media ma buona (79.12 dB)
Bassi 100 - 315 Hz
(-) | quasi nessun basso - in media 16.7% inferiori alla media
(-) | bassi non lineari (15.7% delta rispetto alla precedente frequenza)
Medi 400 - 2000 Hz
(+) | medi bilanciati - solo only 4.5% rispetto alla media
(+) | medi lineari (4.4% delta rispetto alla precedente frequenza)
Alti 2 - 16 kHz
(+) | Alti bilanciati - appena 1% dalla media
(+) | alti lineari (2.7% delta rispetto alla precedente frequenza)
Nel complesso 100 - 16.000 Hz
(+) | suono nel complesso lineare (13.7% differenza dalla media)
Rispetto alla stessa classe
» 20% di tutti i dispositivi testati in questa classe è stato migliore, 6% simile, 74% peggiore
» Il migliore ha avuto un delta di 6%, medio di 18%, peggiore di 132%
Rispetto a tutti i dispositivi testati
» 13% di tutti i dispositivi testati in questa classe è stato migliore, 4% similare, 83% peggiore
» Il migliore ha avuto un delta di 4%, medio di 24%, peggiore di 134%
Consumo di energia
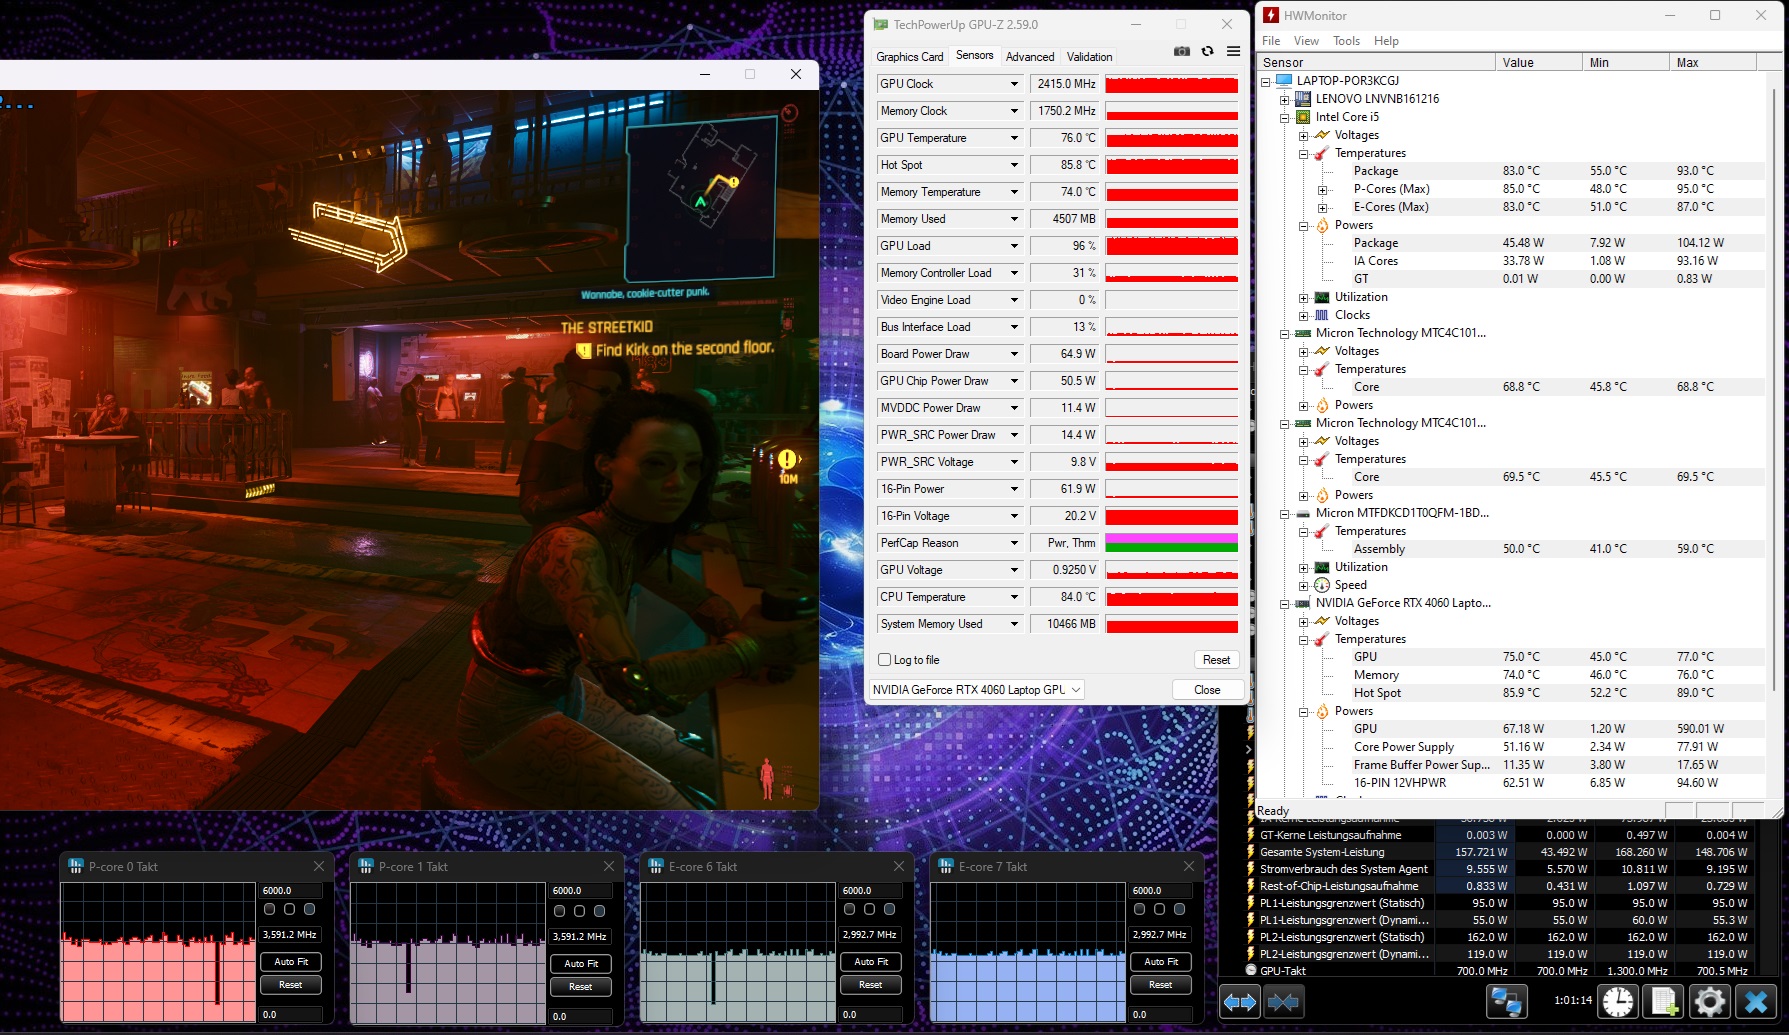
Il suo consumo energetico è piuttosto normale per l'hardware installato. Cyberpunk e gli stress test sono stati eseguiti con un consumo energetico relativamente costante. L'alimentatore è sufficientemente potente, con 230 watt.
| Off / Standby | |
| Idle | |
| Sotto carico |
|
Leggenda:
min: | |
| Lenovo LOQ 15IRX9 Intel Core i5-13450HX, NVIDIA GeForce RTX 4060 Laptop GPU | SCHENKER XMG Core 15 (M24) AMD Ryzen 7 8845HS, NVIDIA GeForce RTX 4060 Laptop GPU | Gigabyte G6X 9KG (2024) Intel Core i7-13650HX, NVIDIA GeForce RTX 4060 Laptop GPU | HP Victus 16 (2024) Intel Core i7-14700HX, NVIDIA GeForce RTX 4060 Laptop GPU | Dell G16, i7-13650HX, RTX 4060 Intel Core i7-13650HX, NVIDIA GeForce RTX 4060 Laptop GPU | |
|---|---|---|---|---|---|
| Power Consumption | 20% | 2% | 1% | 6% | |
| Idle Minimum * | 13 | 9.3 28% | 12 8% | 9 31% | 11 15% |
| Idle Average * | 18 | 12.9 28% | 13 28% | 15 17% | 14.8 18% |
| Idle Maximum * | 24 | 12.8 47% | 27 -13% | 23 4% | 16.8 30% |
| Load Average * | 85 | 105 -24% | 123 -45% | 103.7 -22% | |
| Cyberpunk 2077 ultra * | 155.7 | ||||
| Cyberpunk 2077 ultra external monitor * | 150.9 | ||||
| Load Maximum * | 232 | 286 -23% | 210 9% | 241 -4% | 255 -10% |
| Witcher 3 ultra * | 167 | 167.8 | 143.7 | 185 |
* ... Meglio usare valori piccoli
Power consumption Cyberpunk 2077 / stress test
Power consumption with external monitor
Tempi di esecuzione
Il dispositivo da 15,6 pollici ha gestito un'autonomia di 5:20 ore nel nostro test pratico WLAN (mappando il carico quando si accede ai siti web utilizzando uno script) - non un valore eccezionale. La capacità della batteria relativamente bassa (60 Wh) diventa evidente in questo caso.
Pro
Contro
Verdetto - Un solido giocatore economico

Il LOQ consente di giocare in FHD con impostazioni elevate o massime Core i5-13450HX e GeForce RTX 4060 lo rendono possibile. In questo modo, la CPU e la GPU funzionano con tassi di clock costantemente elevati. Un SSD PCIe 4 (1 TB) garantisce tempi di caricamento ridotti.
Il LOQ 15IRX9 di Lenovo è un portatile da gioco FHD conveniente che soffre di uno o due difetti minori.
Le emissioni elevate possono essere ridotte a livelli moderati utilizzando la modalità silenziosa, a scapito delle prestazioni del portatile. Il controllo delle ventole potrebbe essere migliorato: In modalità idle, le ventole funzionano in modo permanente o pulsante, il che è del tutto inutile.
Cercherà invano uno schermo 16:10, in quanto Lenovo ha scelto un rapporto di aspetto 16:9. Il pannello da 15,6 pollici installato (FHD, 144 Hz, G-Sync, sRGB) funziona bene, ma potrebbe essere leggermente più luminoso. Il portatile non offre Thunderbolt 4 o USB 4. Tuttavia: la sua porta USB-C (USB 3.2 Gen 2) supporta Power Delivery e la modalità Display ALT. La durata della batteria del dispositivo non batterà alcun record mondiale.
Un'alternativa potrebbe essere il Gigabyte G6X 9KG. Ha una CPU leggermente più potente, uno schermo da 16 pollici 16:10 e tempi di esecuzione migliori. In termini di copertura dello spazio colore, si colloca dietro al LOQ.
Prezzo e disponibilità
Al momento in cui scriviamo, la nostra configurazione di Lenovo LOQ 15IRX9 può essere acquistata su Amazon a 1.279 dollari.
Nota bene: abbiamo recentemente aggiornato il nostro sistema di valutazione e i risultati della versione 8 non sono confrontabili con quelli della versione 7. Ulteriori informazioni sono disponibili qui .
Lenovo LOQ 15IRX9
- 07/08/2024 v8
Sascha Mölck
 Total Sustainability Score:
 Transparency
La selezione dei dispositivi da recensire viene effettuata dalla nostra redazione. Il campione di prova è stato fornito all'autore come prestito dal produttore o dal rivenditore ai fini di questa recensione. L'istituto di credito non ha avuto alcuna influenza su questa recensione, né il produttore ne ha ricevuto una copia prima della pubblicazione. Non vi era alcun obbligo di pubblicare questa recensione. Non accettiamo mai compensi o pagamenti in cambio delle nostre recensioni. In quanto società mediatica indipendente, Notebookcheck non è soggetta all'autorità di produttori, rivenditori o editori.
Ecco come Notebookcheck esegue i test
Ogni anno, Notebookcheck esamina in modo indipendente centinaia di laptop e smartphone utilizzando procedure standardizzate per garantire che tutti i risultati siano comparabili. Da circa 20 anni sviluppiamo continuamente i nostri metodi di prova e nel frattempo stabiliamo gli standard di settore. Nei nostri laboratori di prova, tecnici ed editori esperti utilizzano apparecchiature di misurazione di alta qualità. Questi test comportano un processo di validazione in più fasi. Il nostro complesso sistema di valutazione si basa su centinaia di misurazioni e parametri di riferimento ben fondati, che mantengono l'obiettività.Price comparison

