

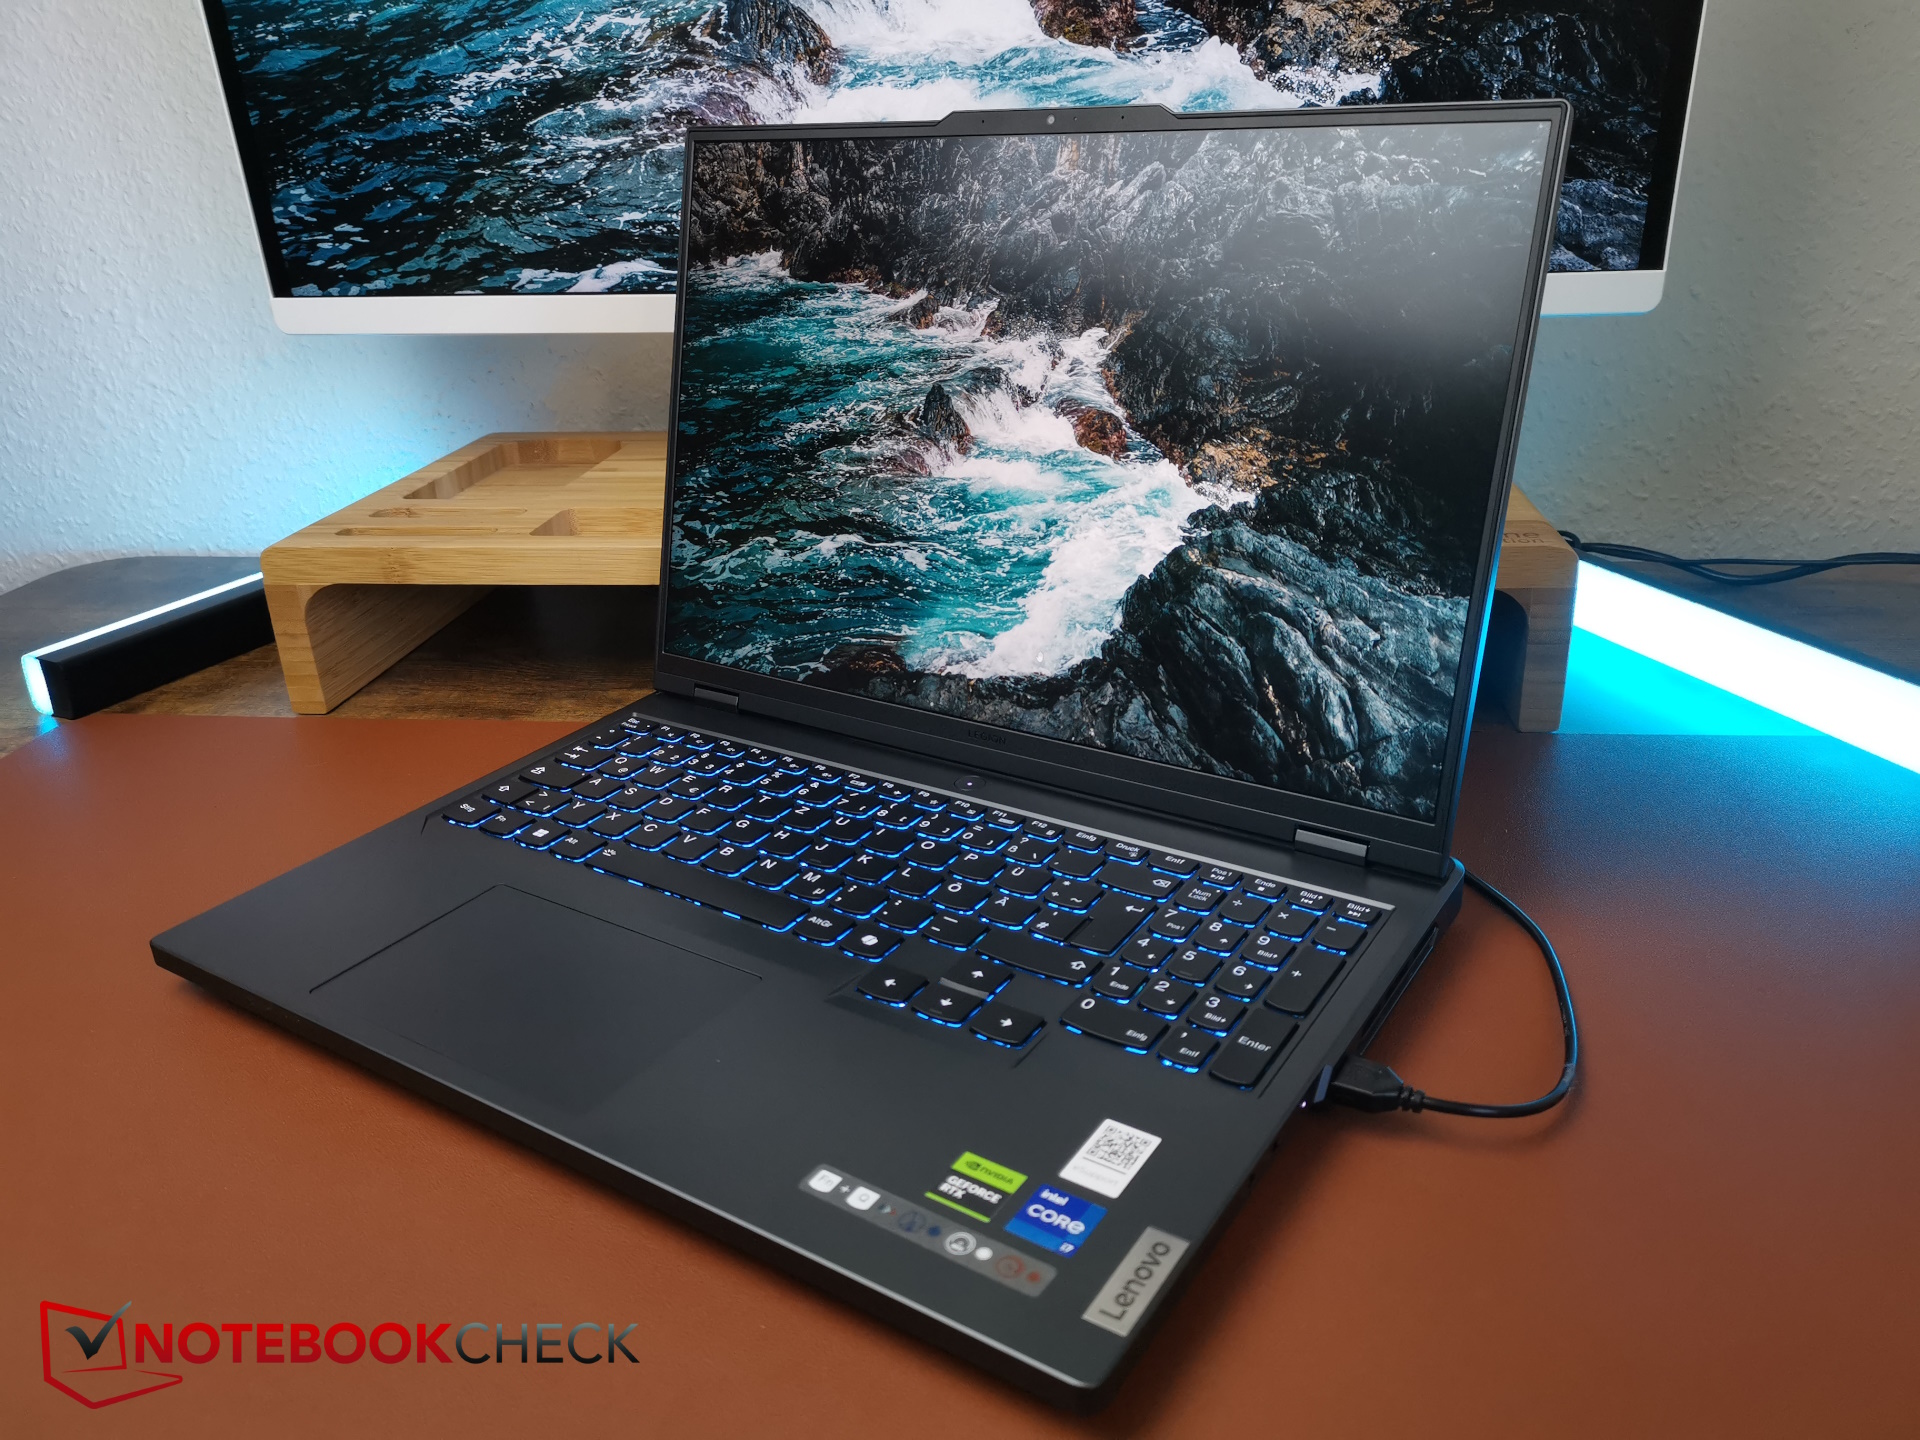
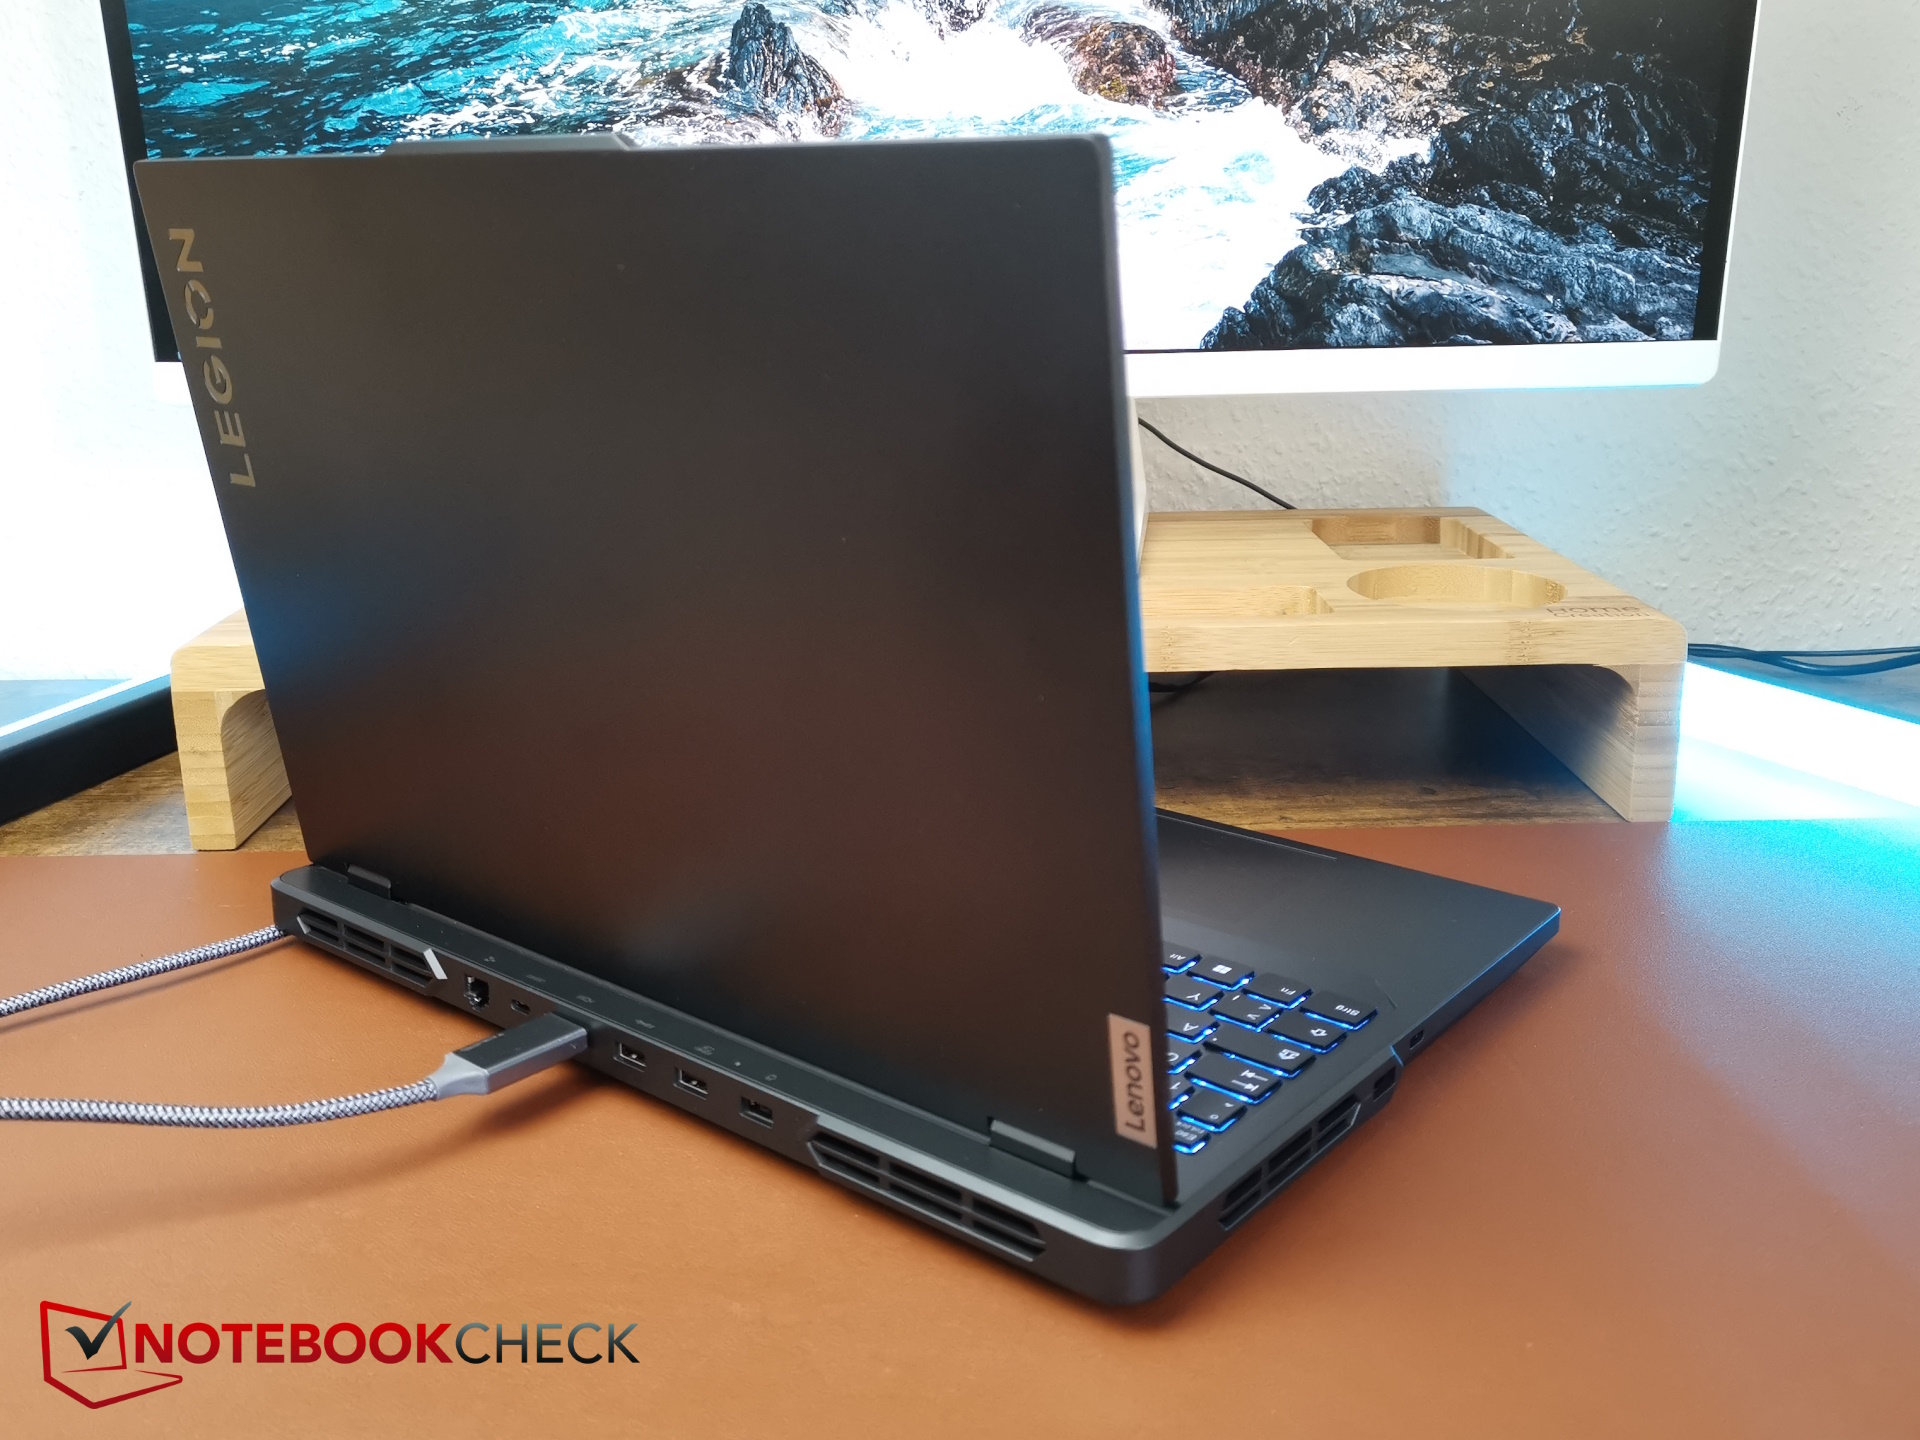
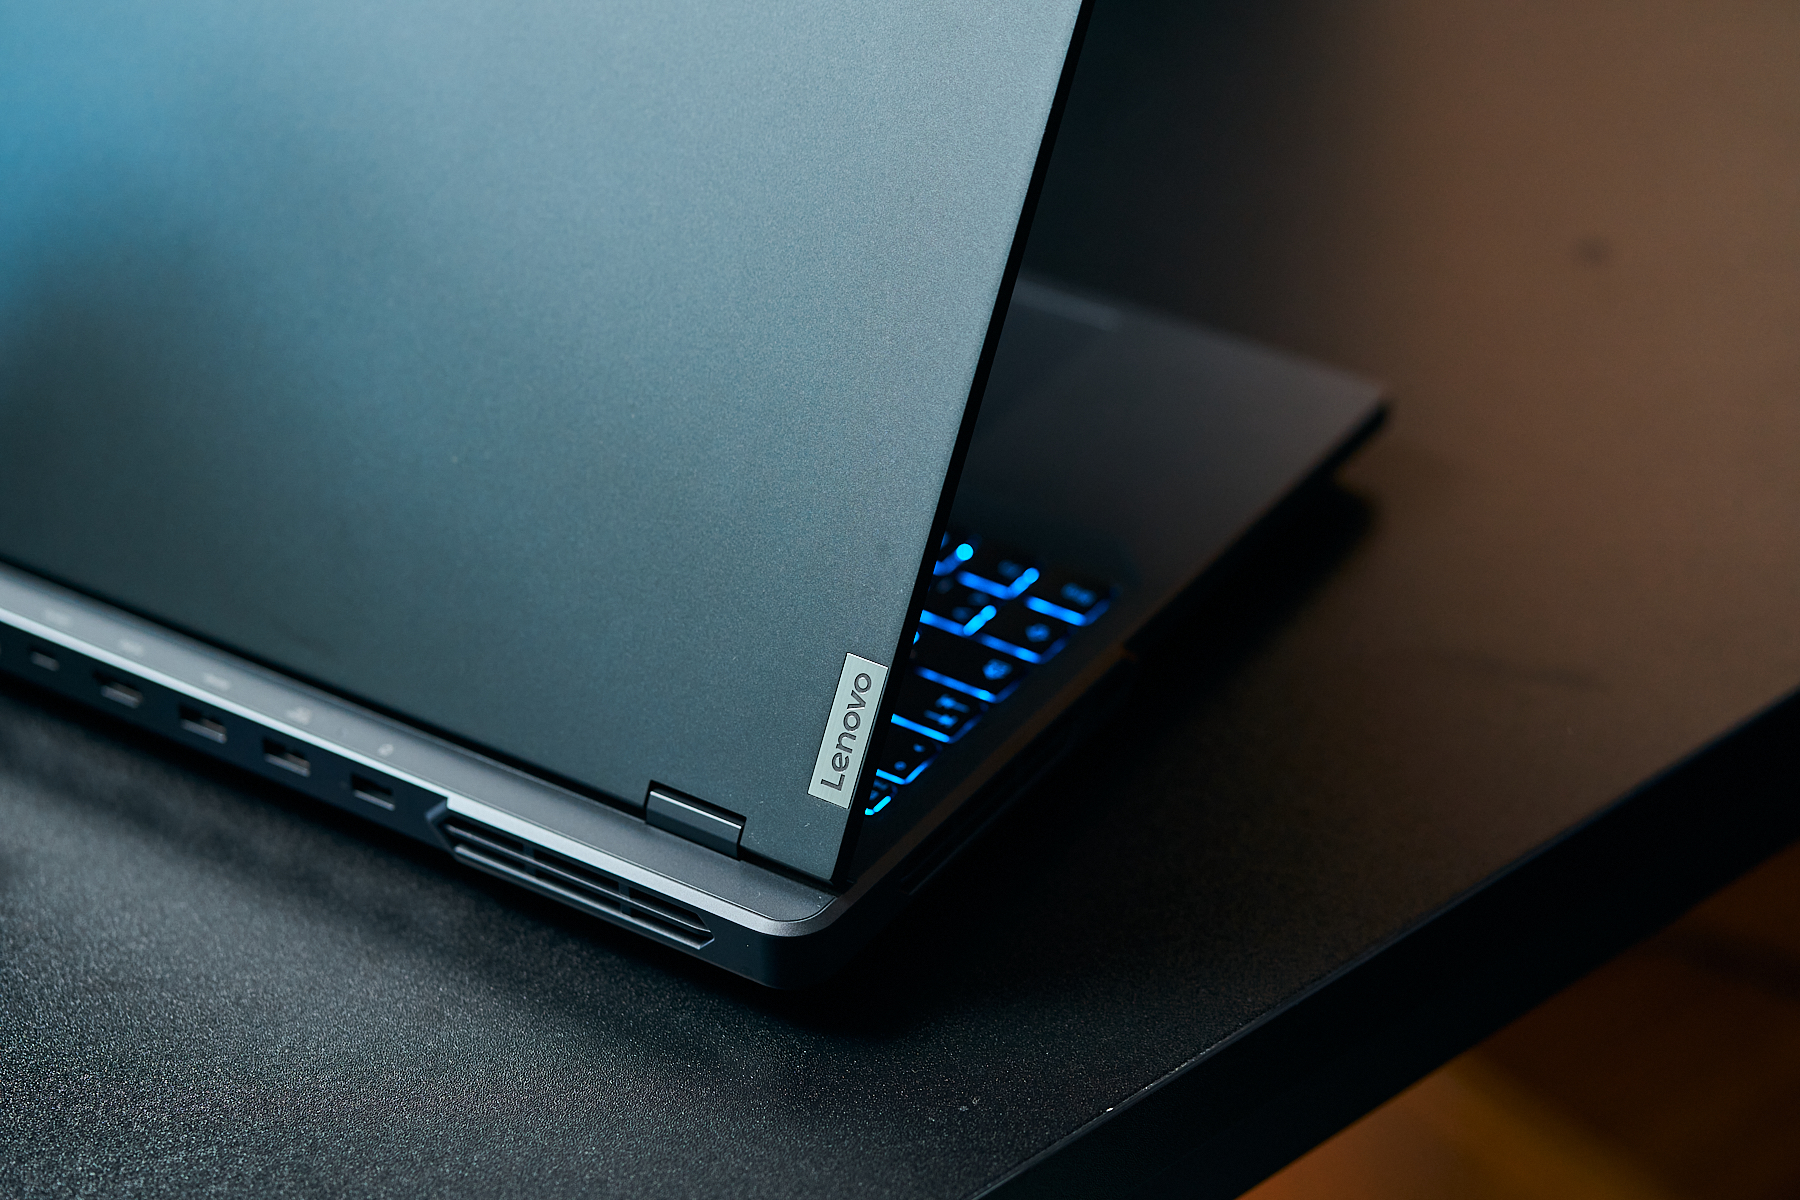
Recensione del computer portatile Lenovo Legion Pro 5i: Prestazioni super potenti con i7-14700HX e RTX 4060
Abbiamo già testato una delle migliori configurazioni con una CPU CPU Core i9 14900HX e una GeForce RTX 4070 da 140 watt. Tuttavia, molti giocatori probabilmente sceglieranno la configurazione più economica con un i7 14700HX e una RTX 4060 a cui diamo un'occhiata oggi. Questo modello può anche mettere in prospettiva alcuni dei punti deboli del modello "grande", come le elevate temperature superficiali e il sistema di raffreddamento rumoroso.
A parte il suo fratello maggiore e il non-pro Legion 5Legion Pro 5 con altri gamer RTX 4060, come il modello G16 di Dell'Aquila Dell G16, HP Victus 16 e il XMG Core 15.
Potenziali concorrenti a confrontos
Versione | Punteggio | Data | Modello | Peso | Altezza | Dimensione | Risoluzione | Prezzo |
|---|---|---|---|---|---|---|---|---|
| v8 | 82.3 % | 07/2024 | Lenovo Legion Pro 5 16IRX9 G9 i7-14700HX, NVIDIA GeForce RTX 4060 Laptop GPU | 2.5 kg | 26.55 mm | 16.00" | 2560x1600 | |
| v7 (old) | 84.3 % v7 (old) | 05/2024 | HP Victus 16 (2024) i7-14700HX, NVIDIA GeForce RTX 4060 Laptop GPU | 2.4 kg | 23.9 mm | 16.10" | 1920x1080 | |
| v7 (old) | 85.5 % v7 (old) | 02/2024 | Dell G16, i7-13650HX, RTX 4060 i7-13650HX, NVIDIA GeForce RTX 4060 Laptop GPU | 2.8 kg | 25.65 mm | 16.00" | 2560x1600 | |
| v8 | 83.7 % | 06/2024 | SCHENKER XMG Core 15 (M24) R7 8845HS, NVIDIA GeForce RTX 4060 Laptop GPU | 2.1 kg | 21.9 mm | 15.30" | 2560x1600 | |
| v7 (old) | 89.3 % v7 (old) | 04/2024 | Lenovo Legion Pro 5 16IRX9 i9-14900HX, NVIDIA GeForce RTX 4070 Laptop GPU | 2.5 kg | 26.95 mm | 16.00" | 2560x1600 | |
| v7 (old) | 89.1 % v7 (old) | 02/2024 | Lenovo Legion 5 16IRX G9 i7-14650HX, NVIDIA GeForce RTX 4060 Laptop GPU | 2.4 kg | 25.2 mm | 16.00" | 2560x1600 |
Attenzione: abbiamo aggiornato il nostro sistema di valutazione e i risultati della versione 8 non sono paragonabili a quelli della versione 7. Ulteriori informazioni sono disponibili qui.
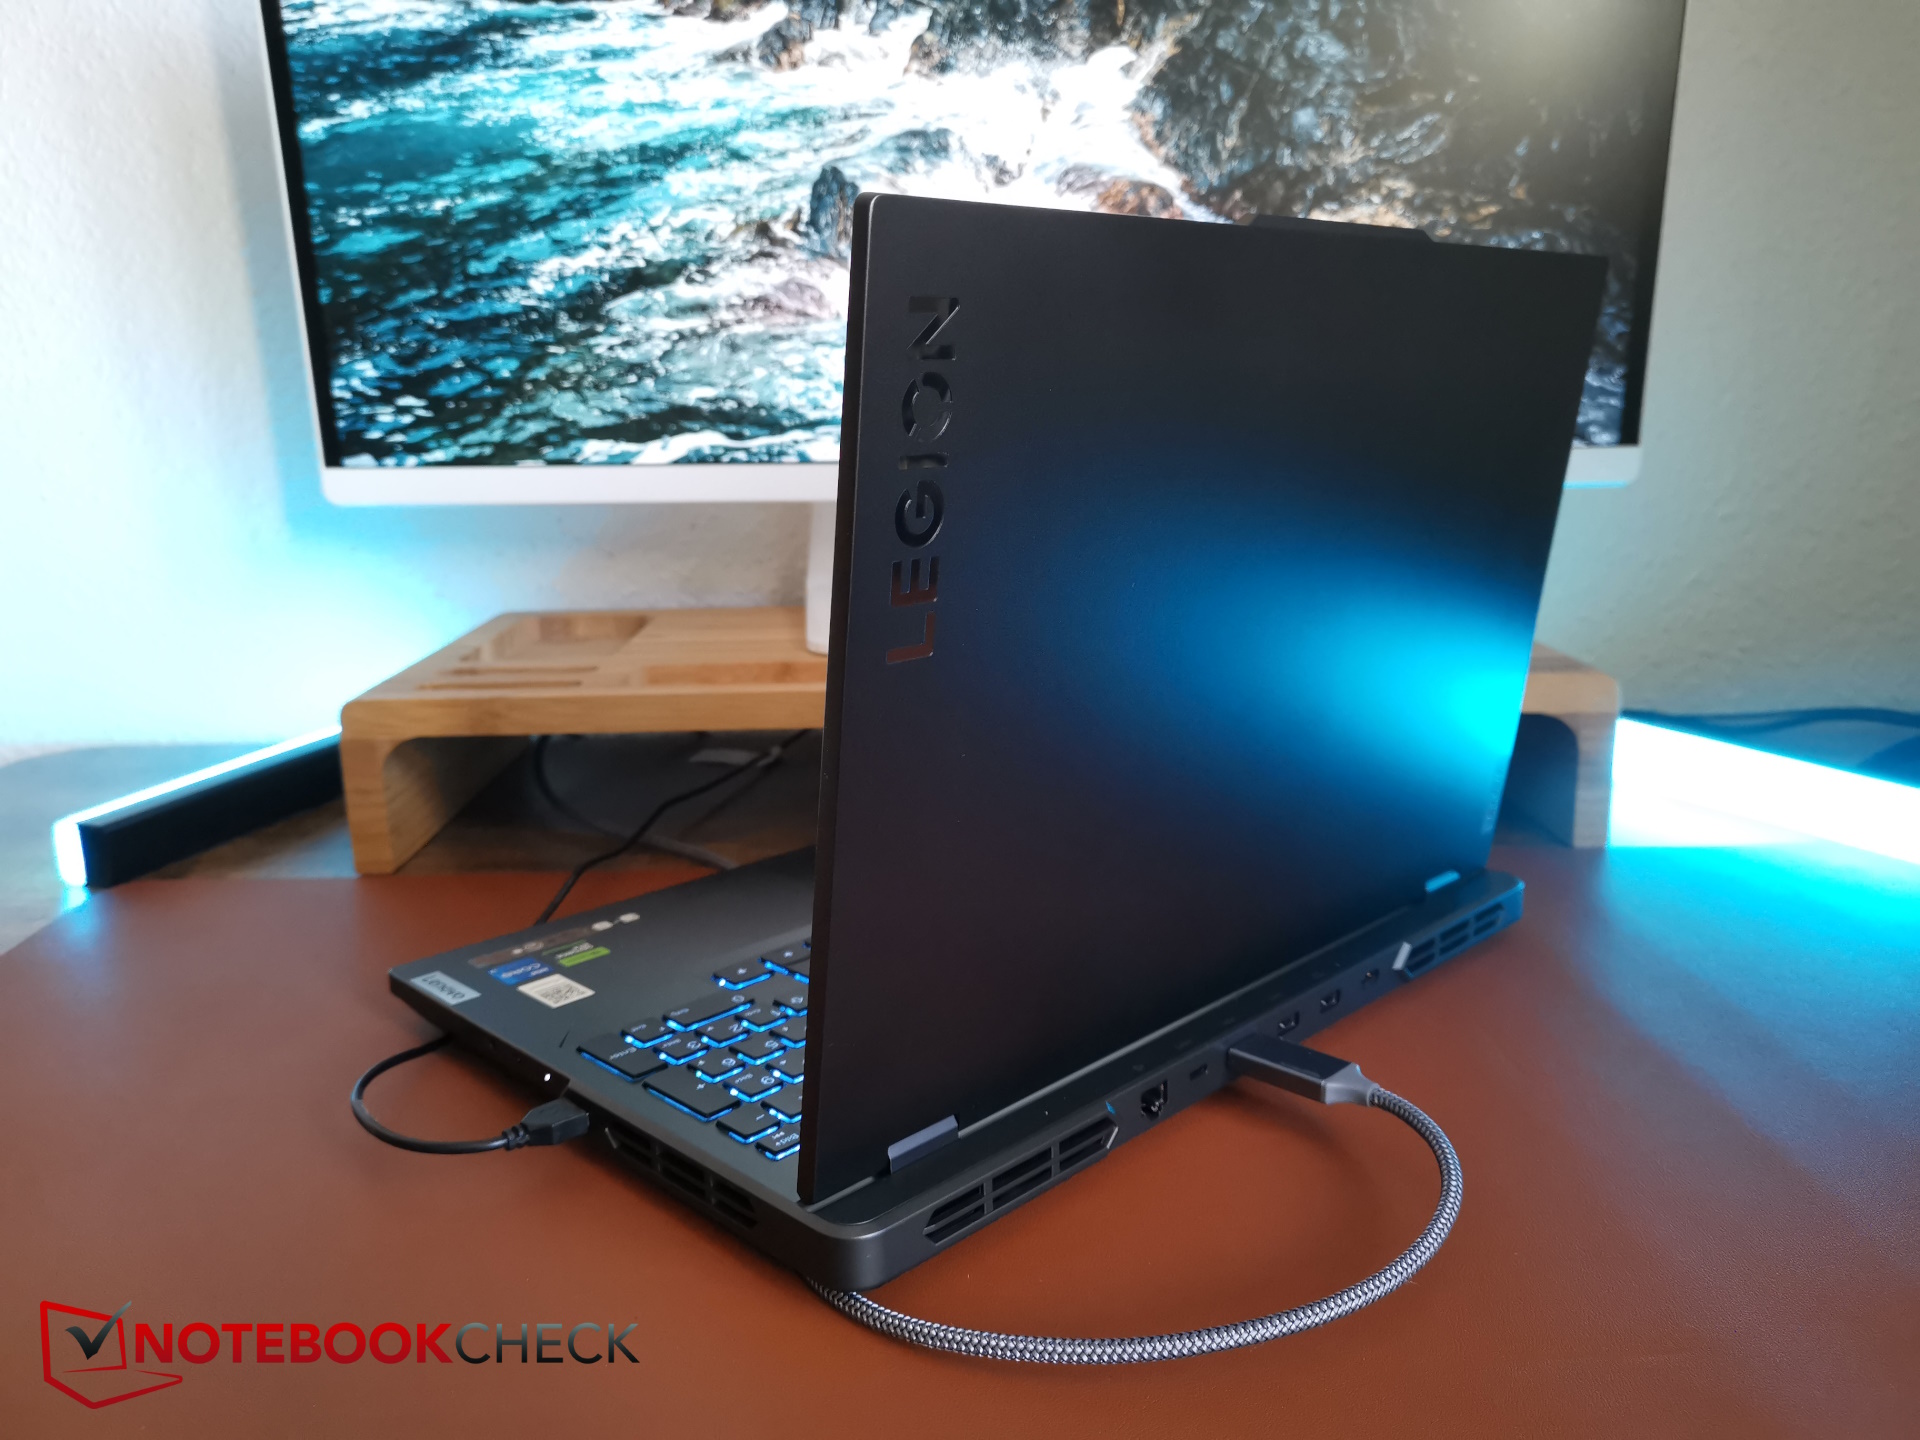
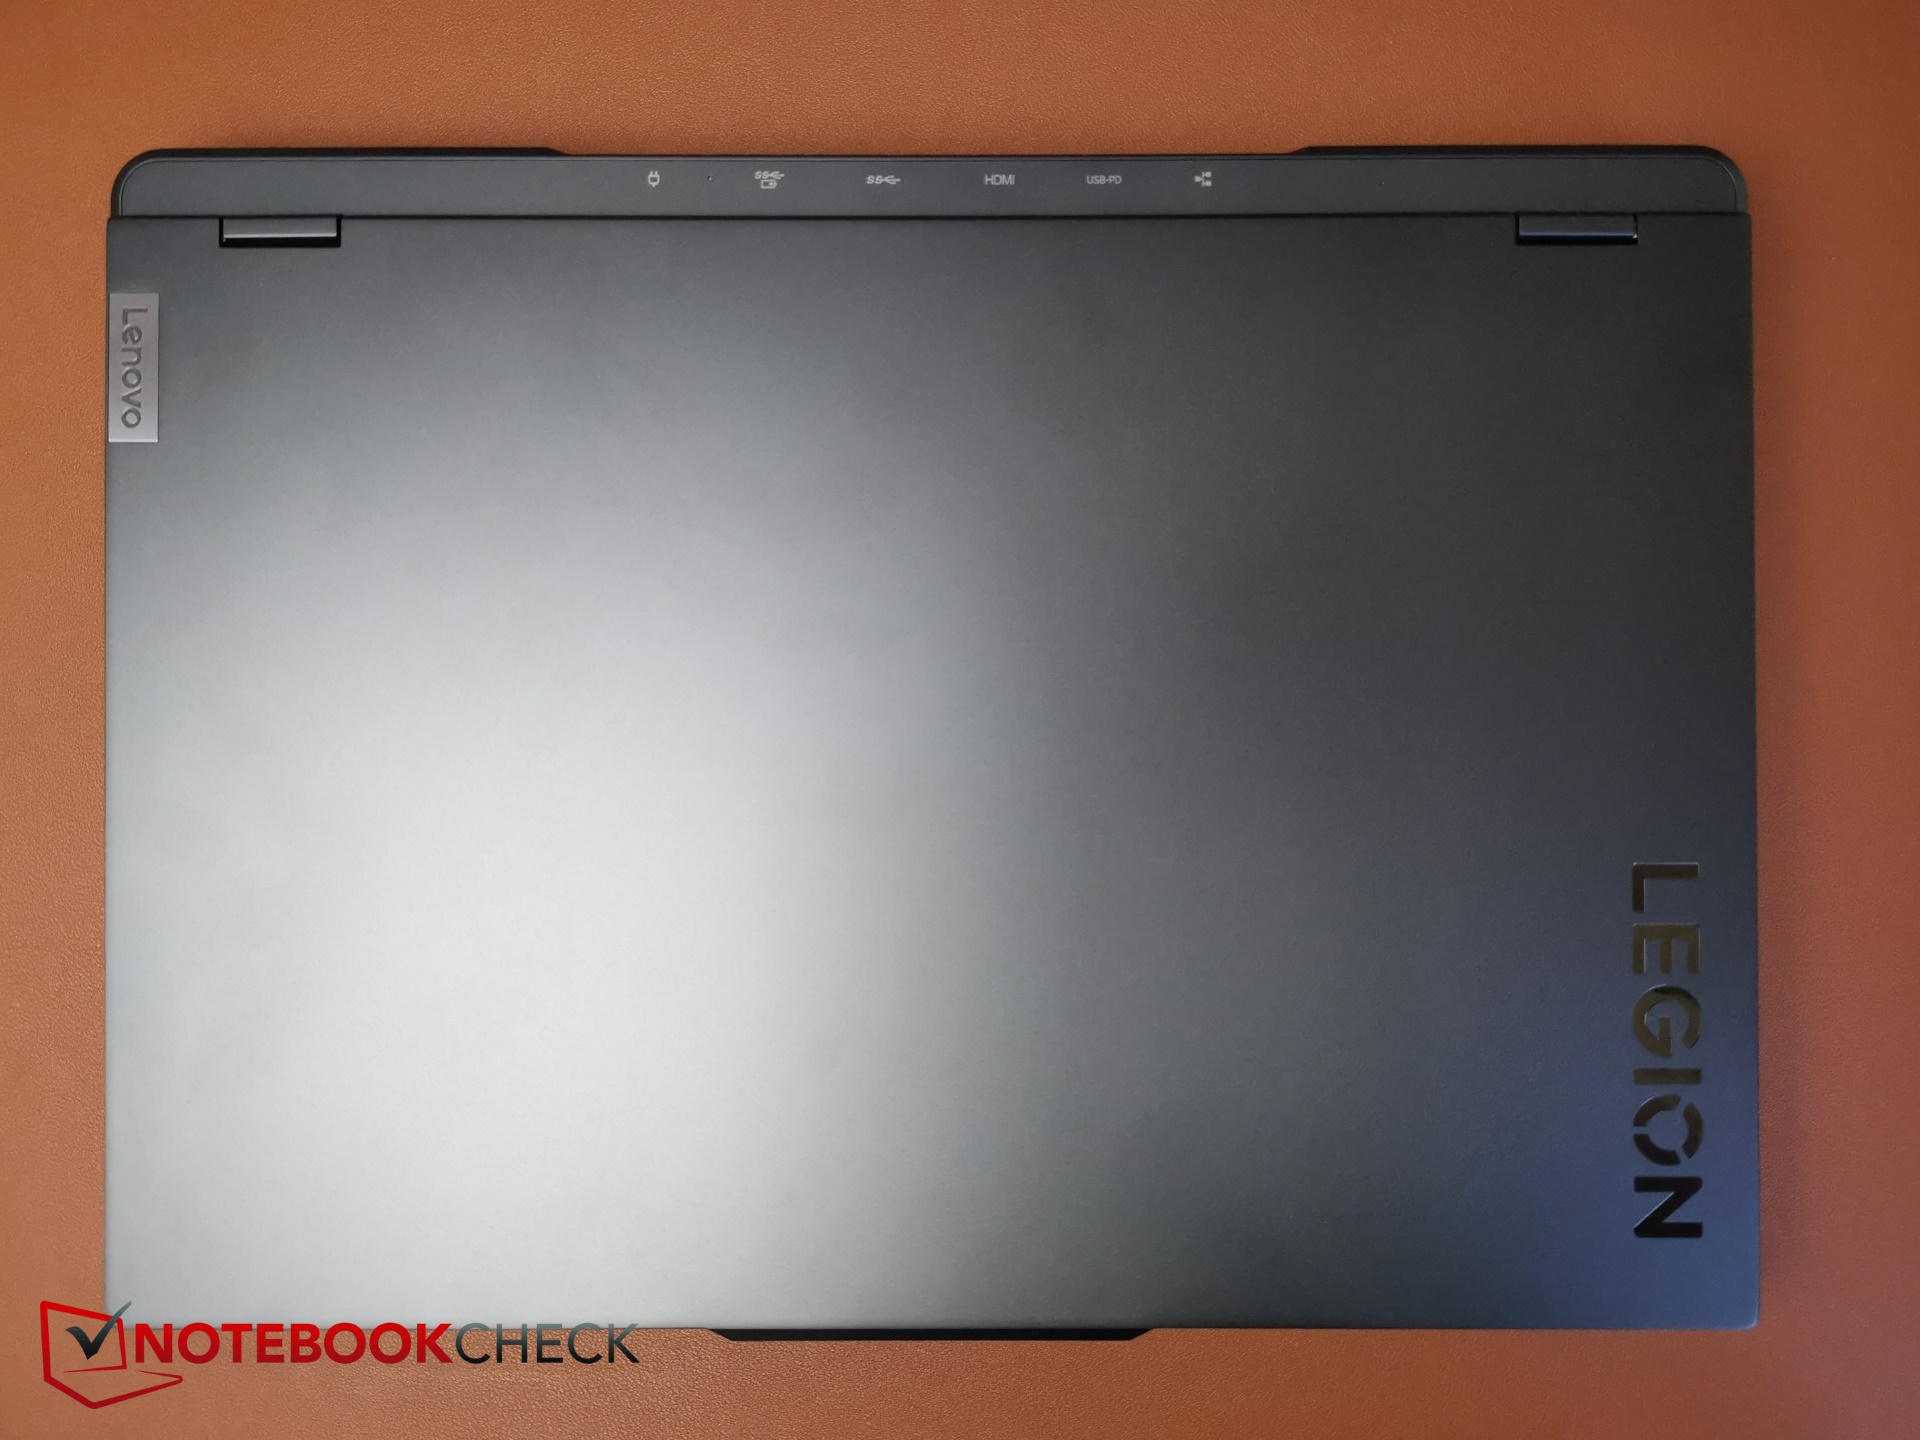
Custodia e connettività: Il Legion Pro senza lettore di schede SD
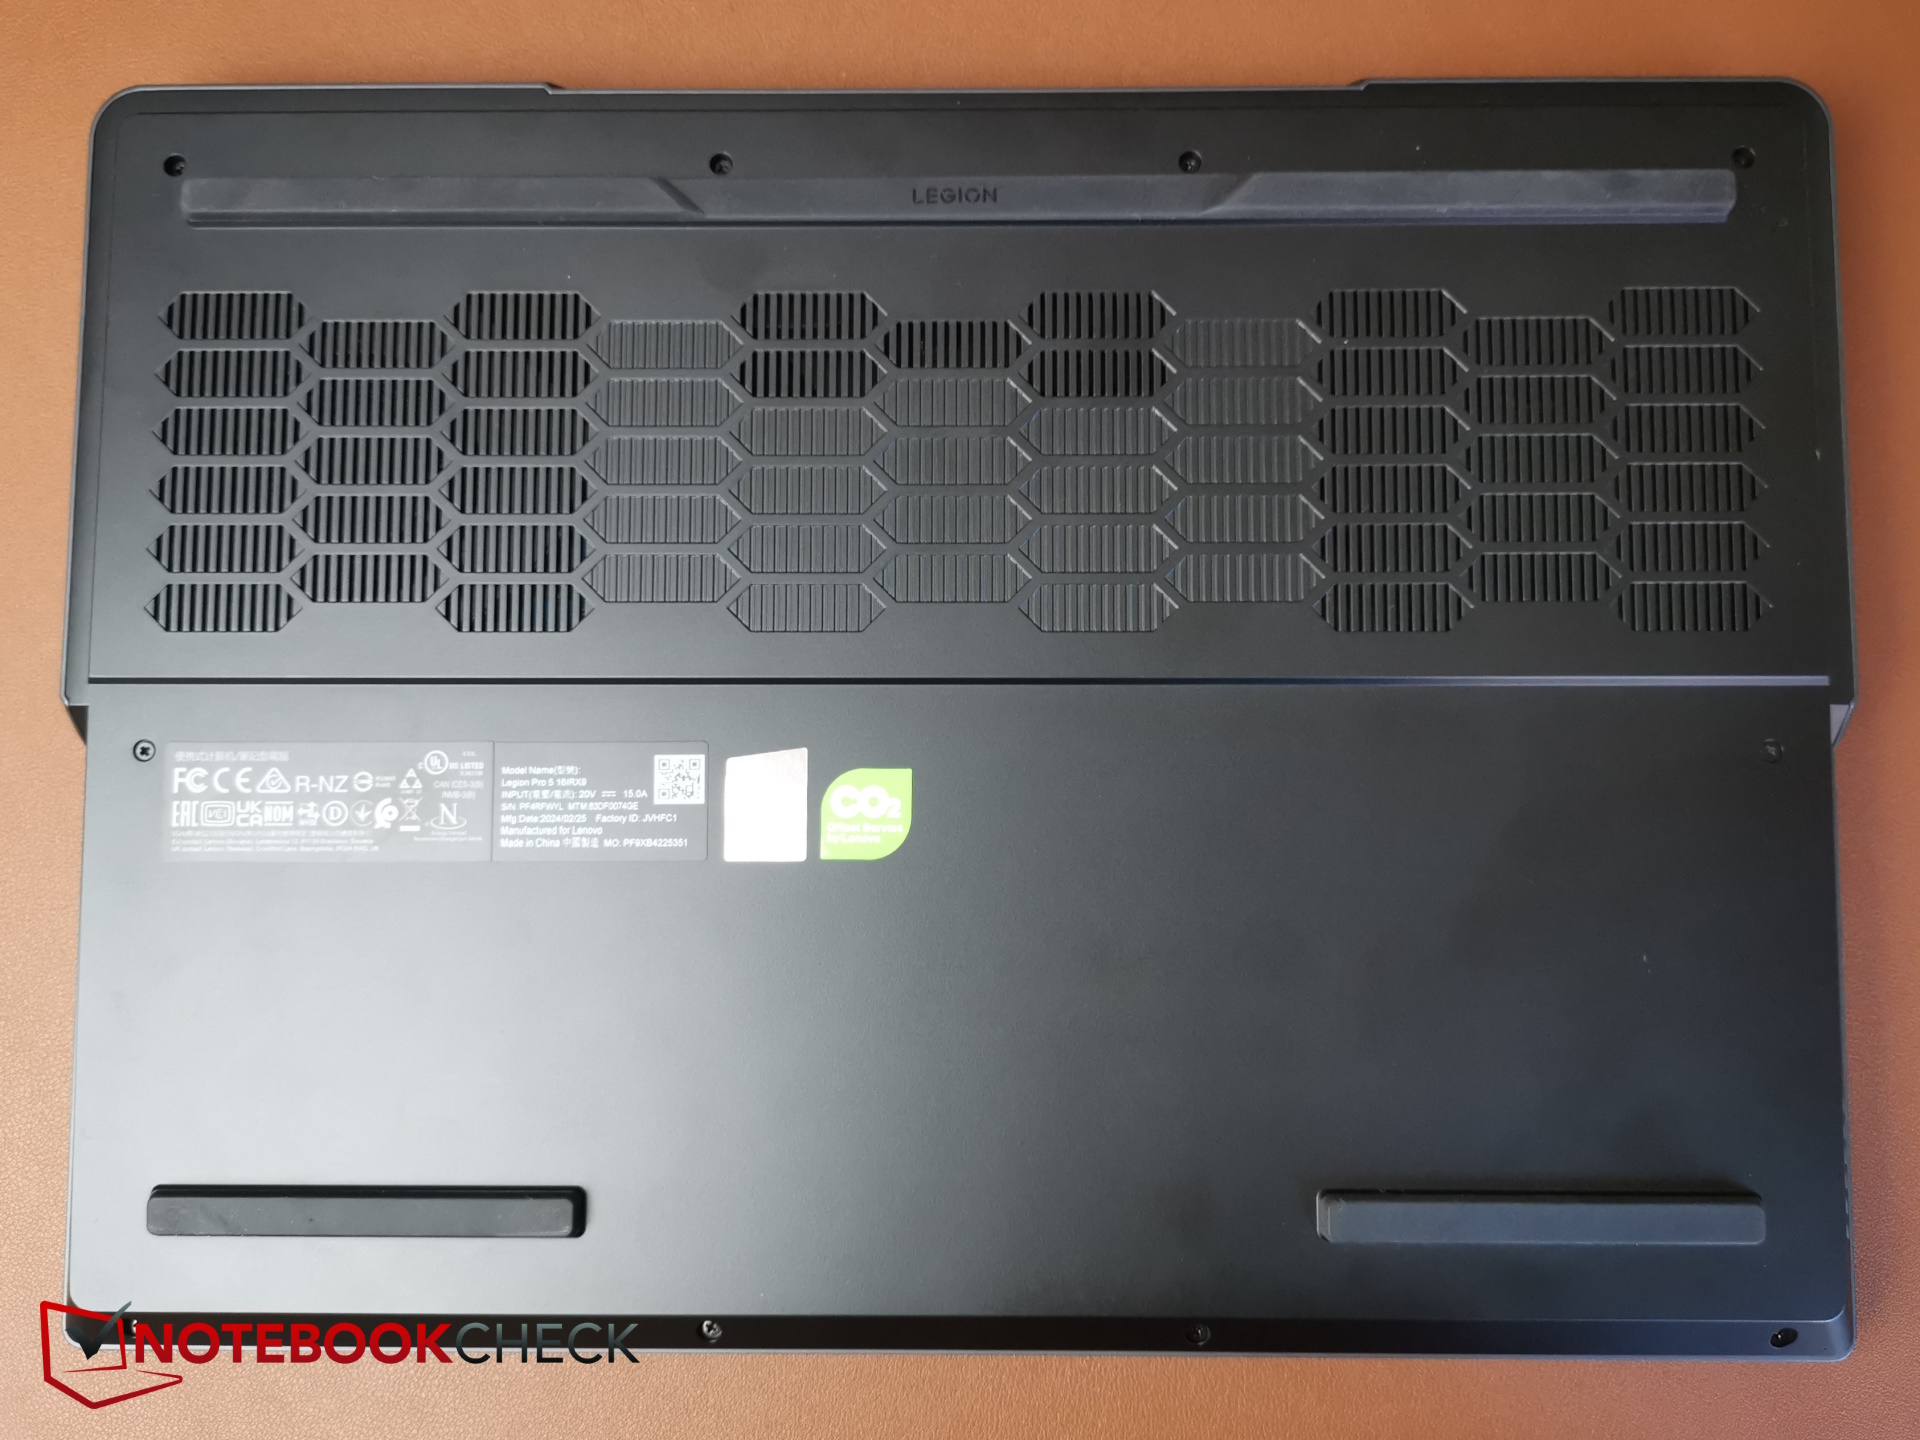
Poiché le sue caratteristiche fisiche sono rimaste invariate, le consigliamo di leggere la nostra recensione originale del Lenovo Legion Pro 5 16IRX9 per informazioni sul suo case, sulle opzioni di manutenzione e sui dispositivi di input.
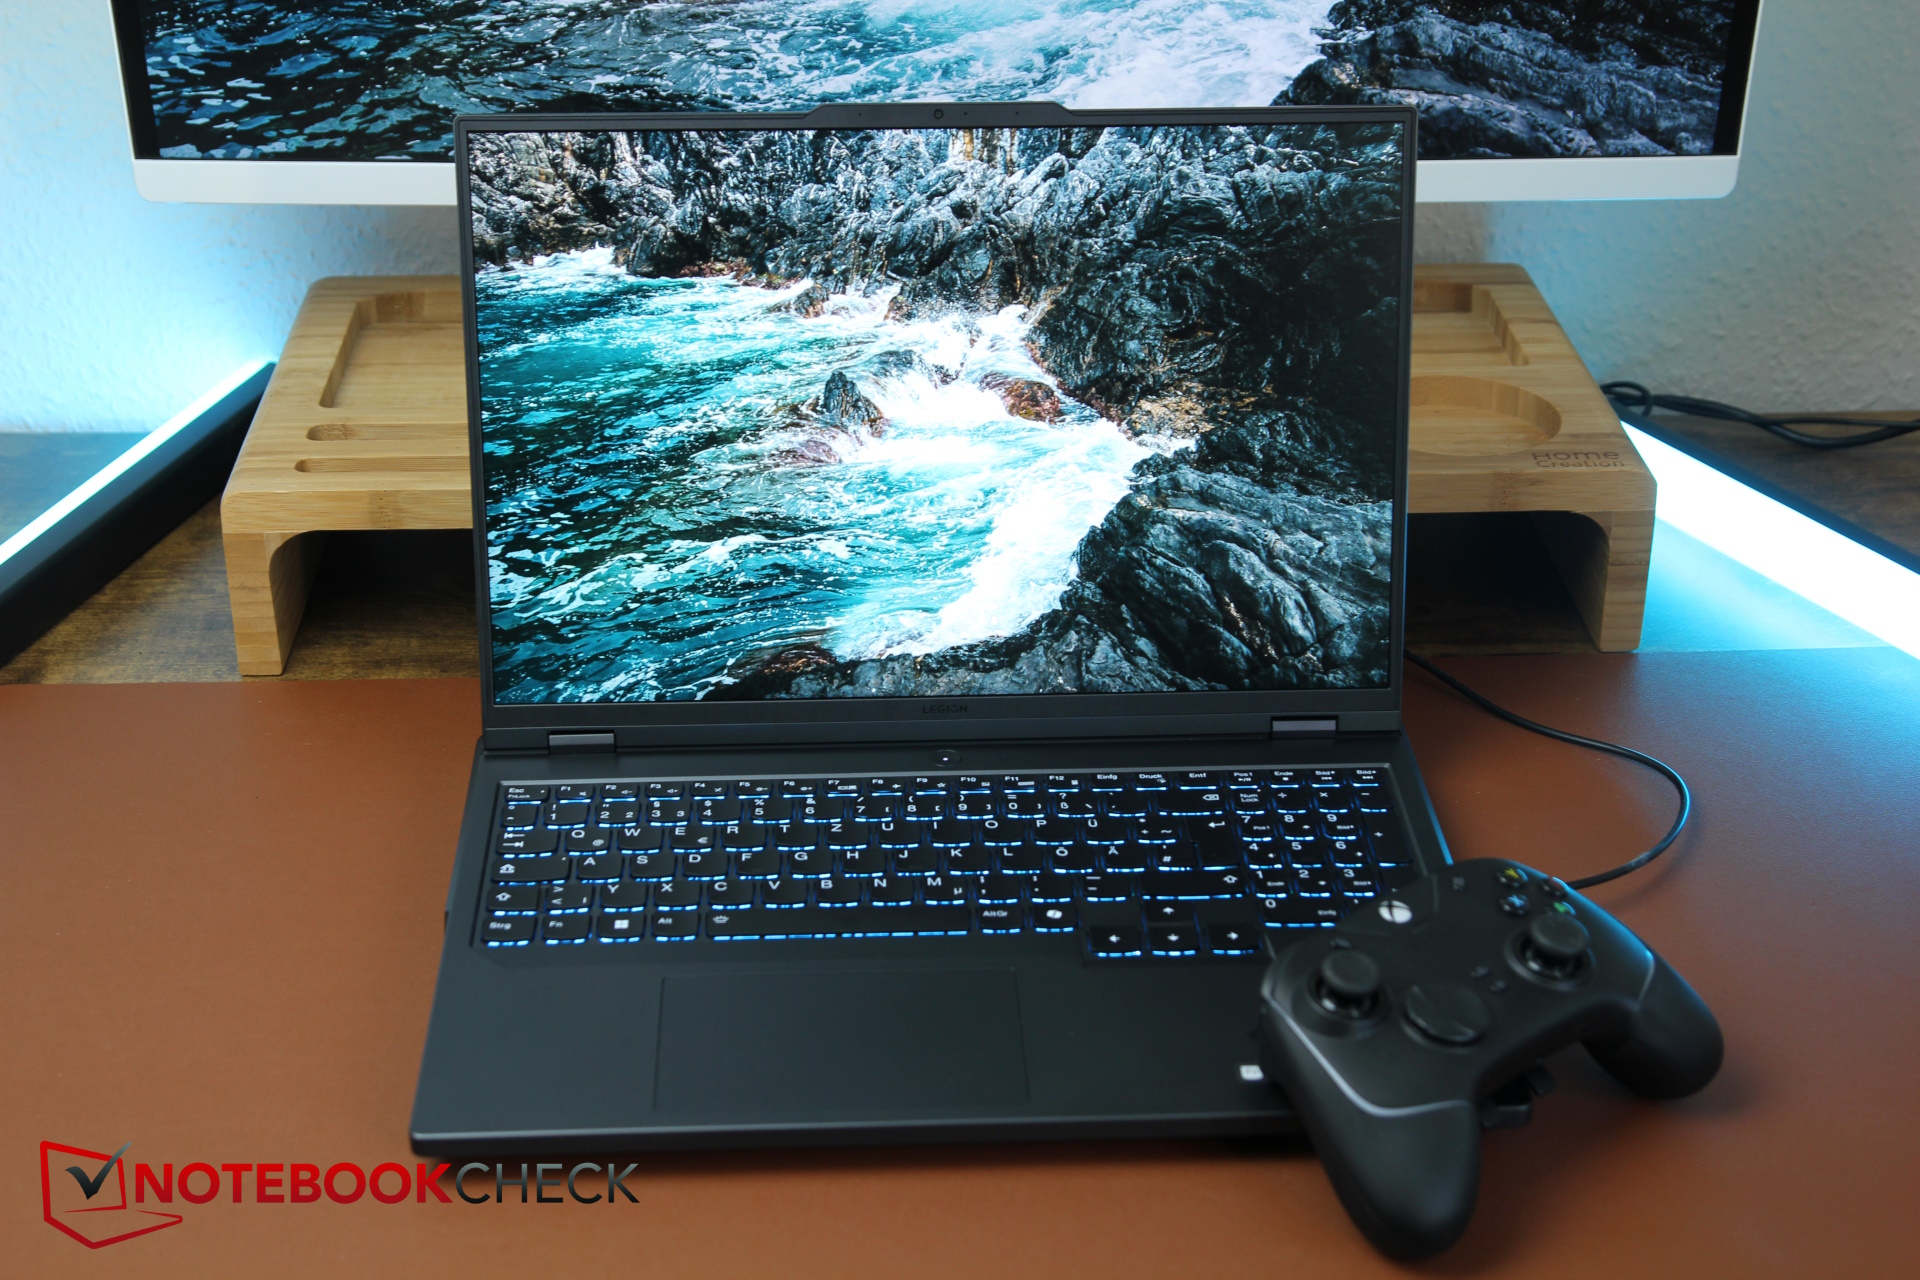


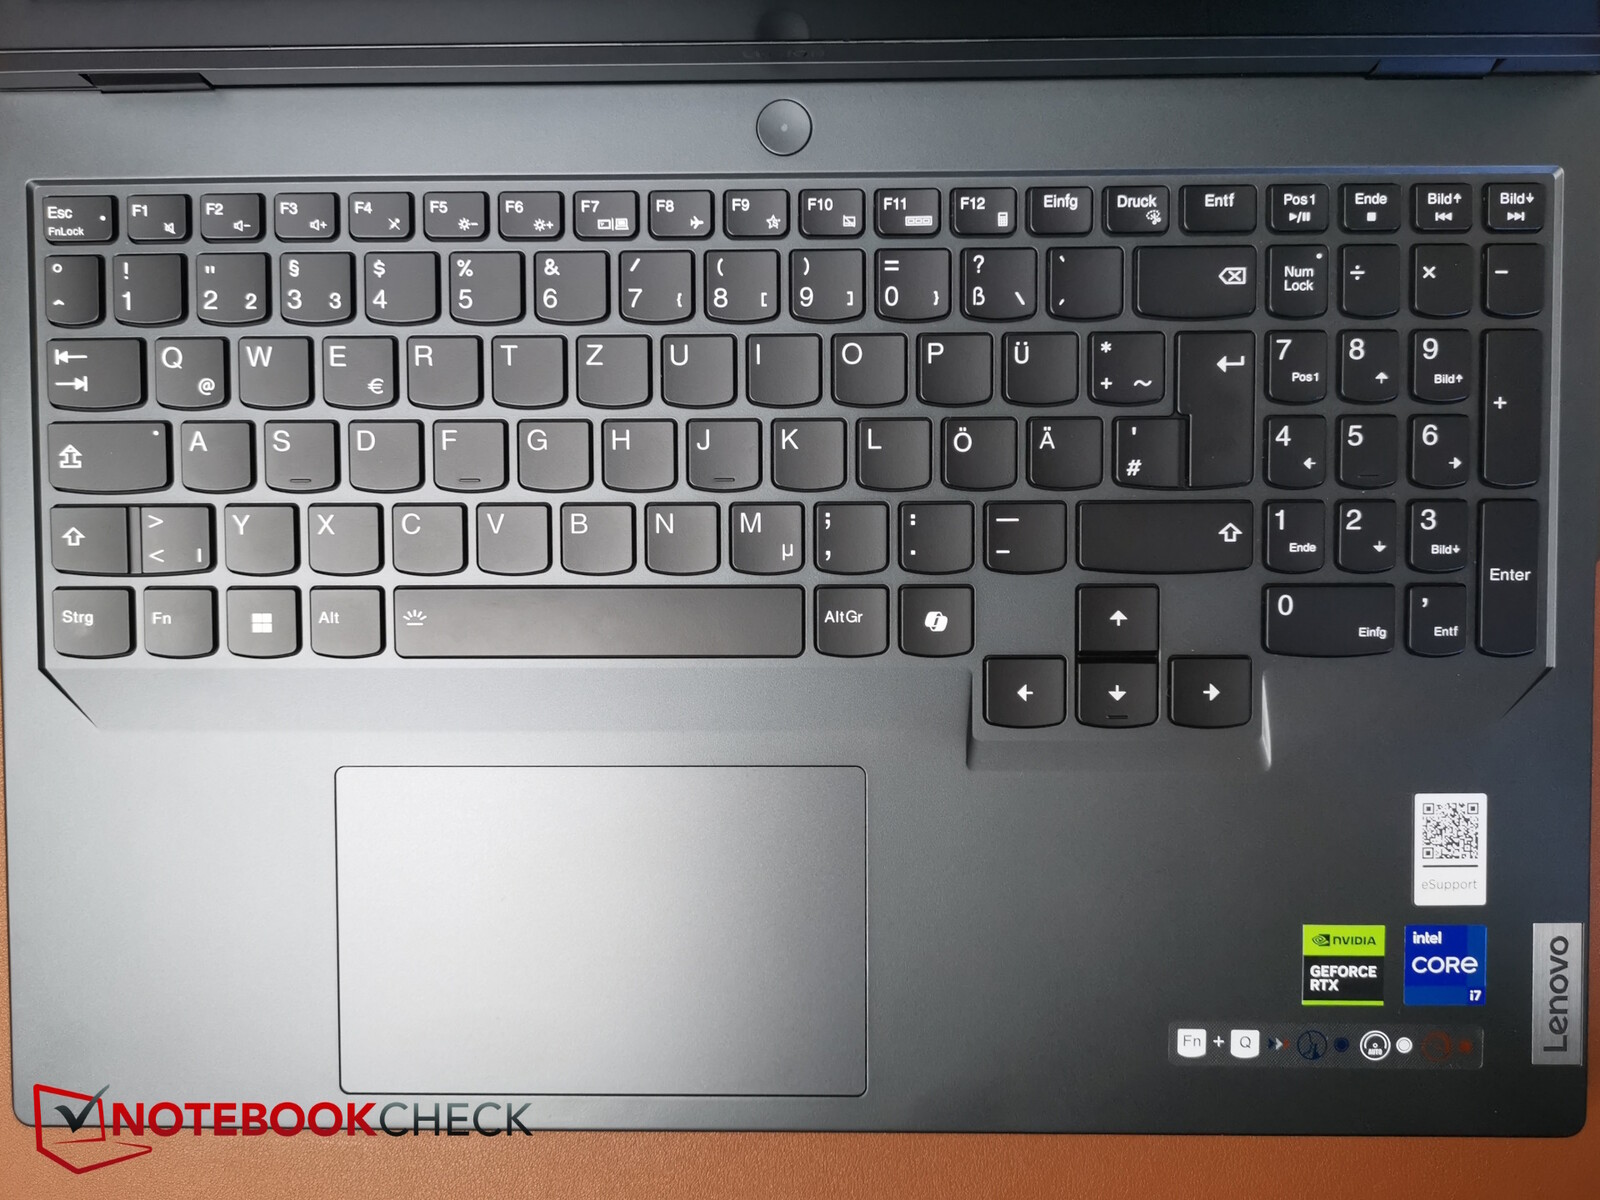
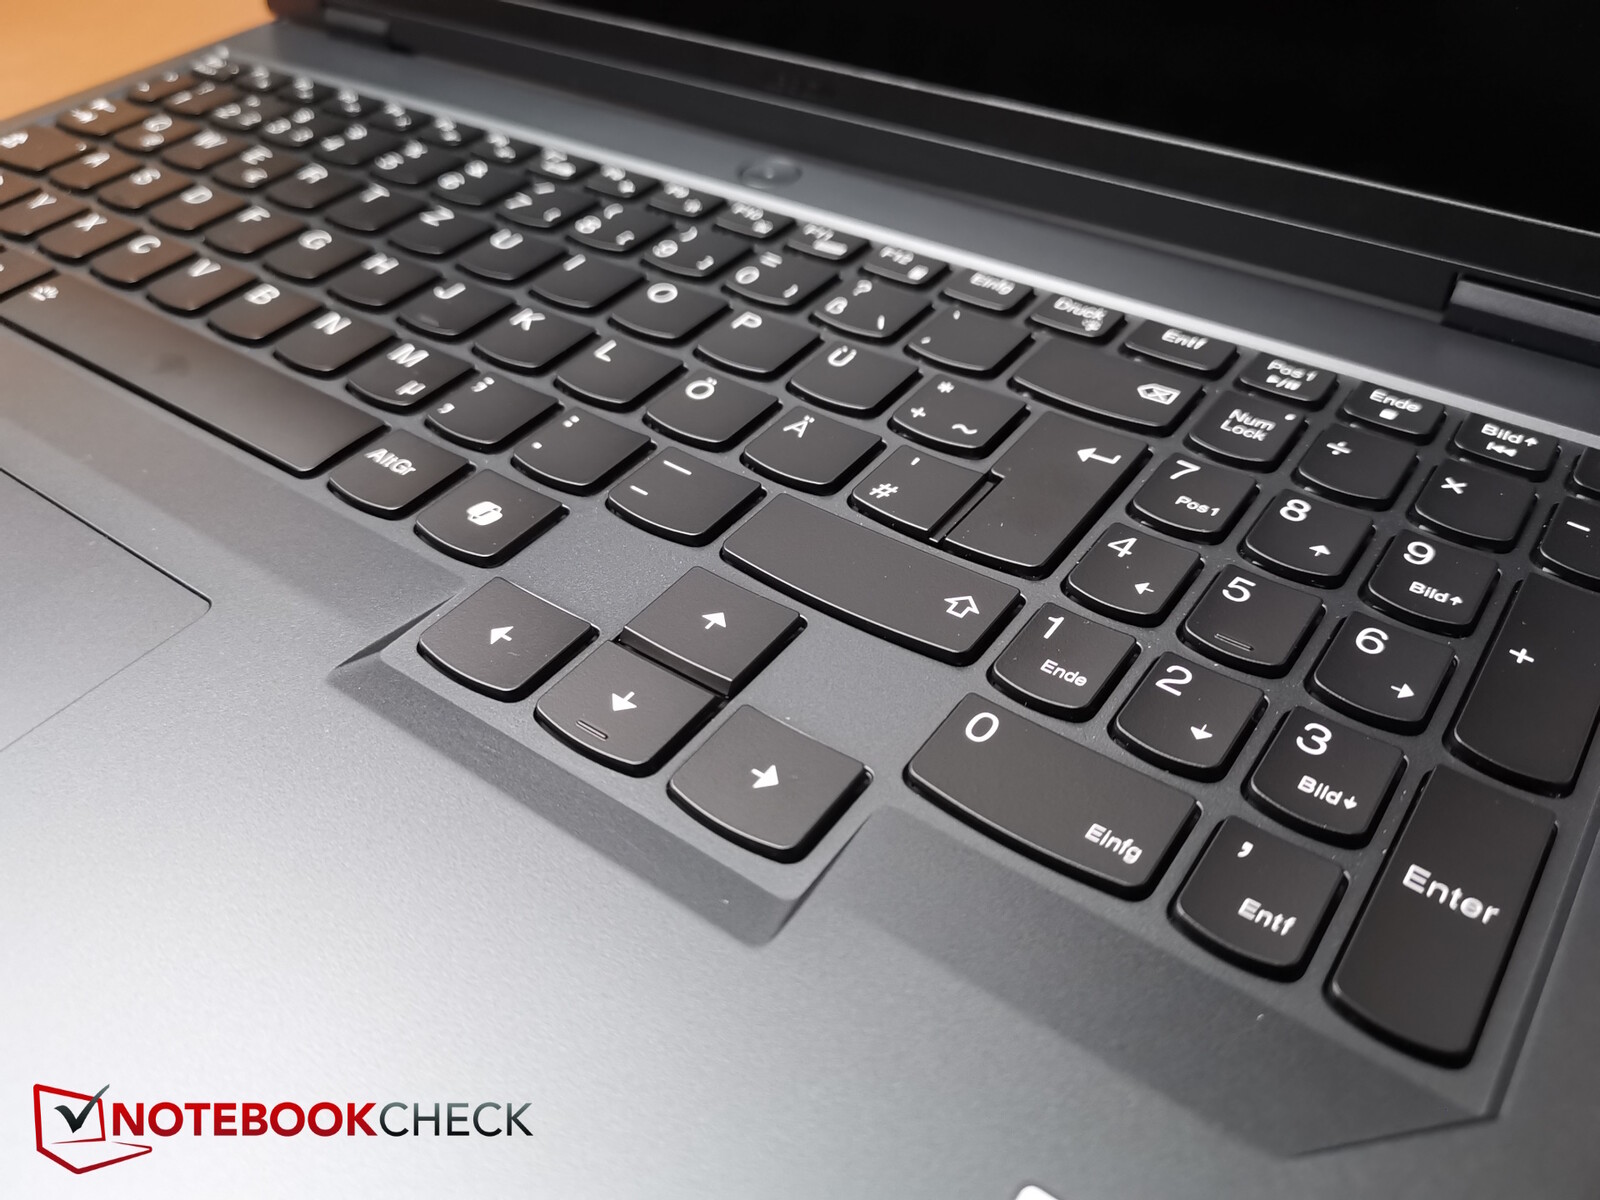
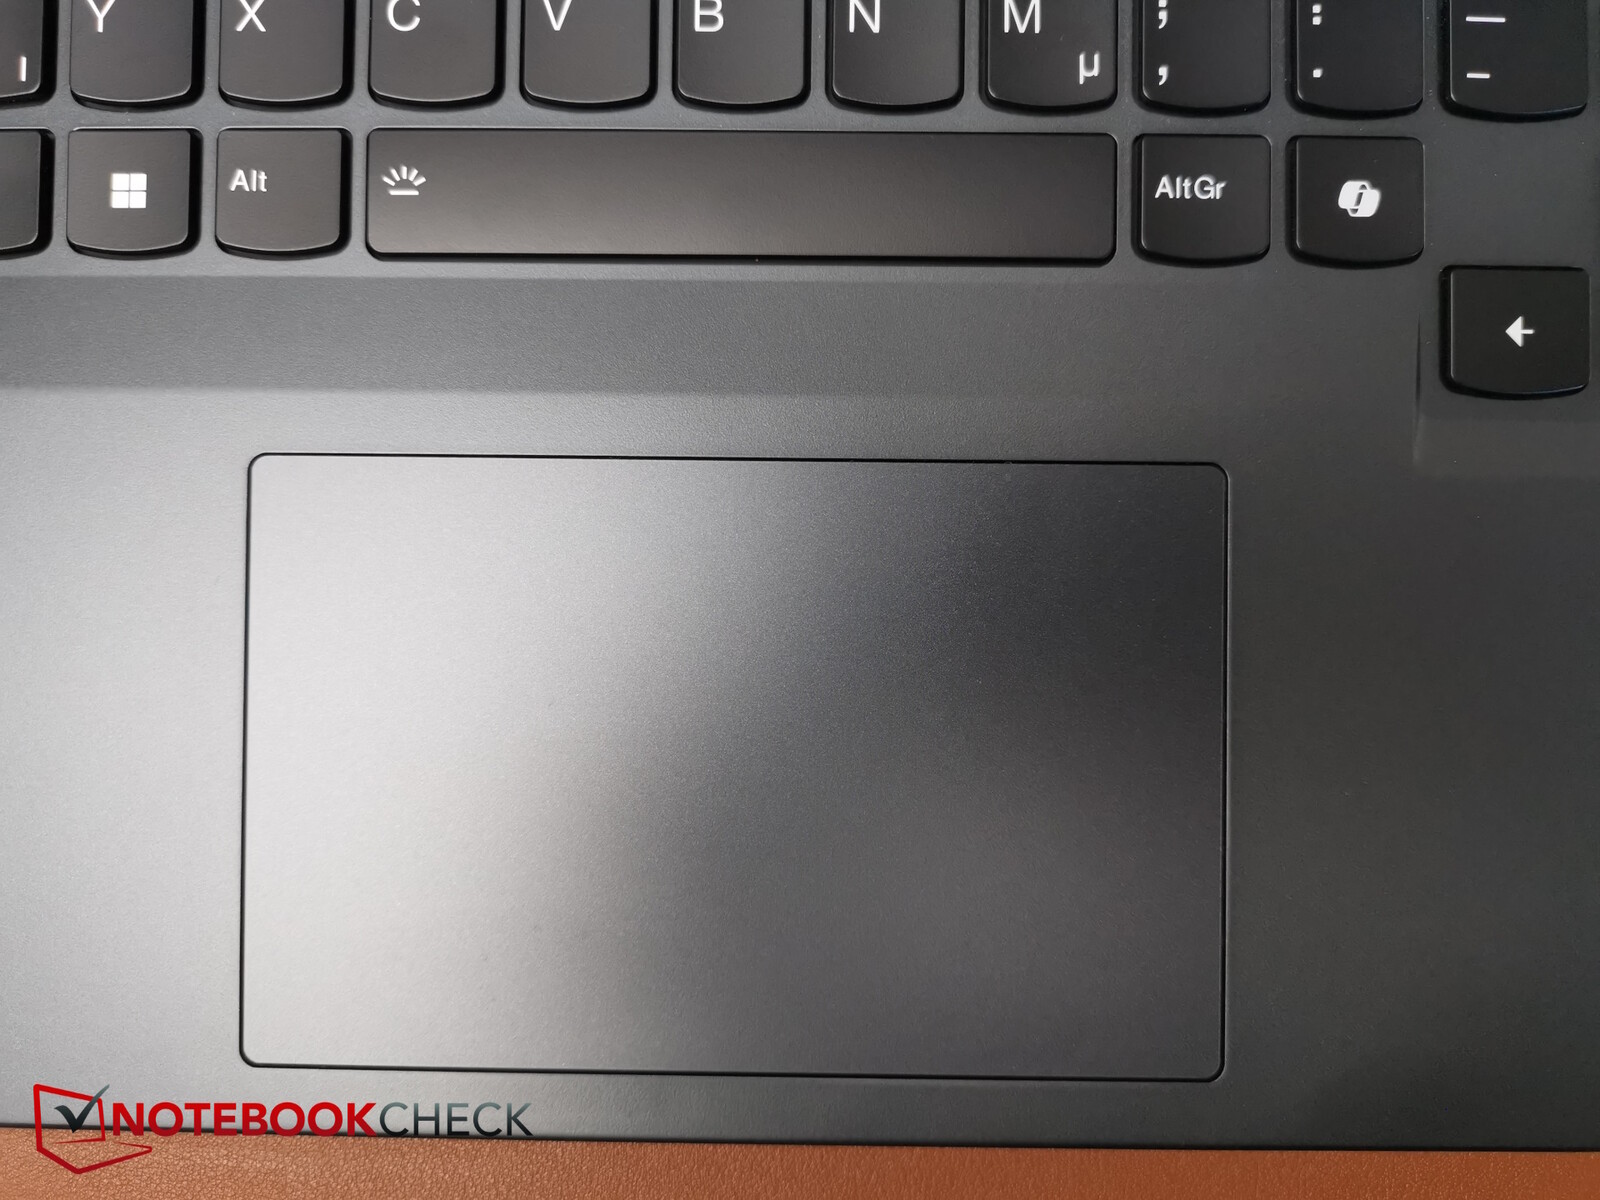
Dispositivi di input - Qualità rinomata di Legion
Non è stato menzionato nel nostro primo il test di Legion Pro 5i: La sua frequenza di aggiornamento può essere modificata in tre fasi (240, 165 e 60 Hz) utilizzando la combinazione di tasti Fn + R.

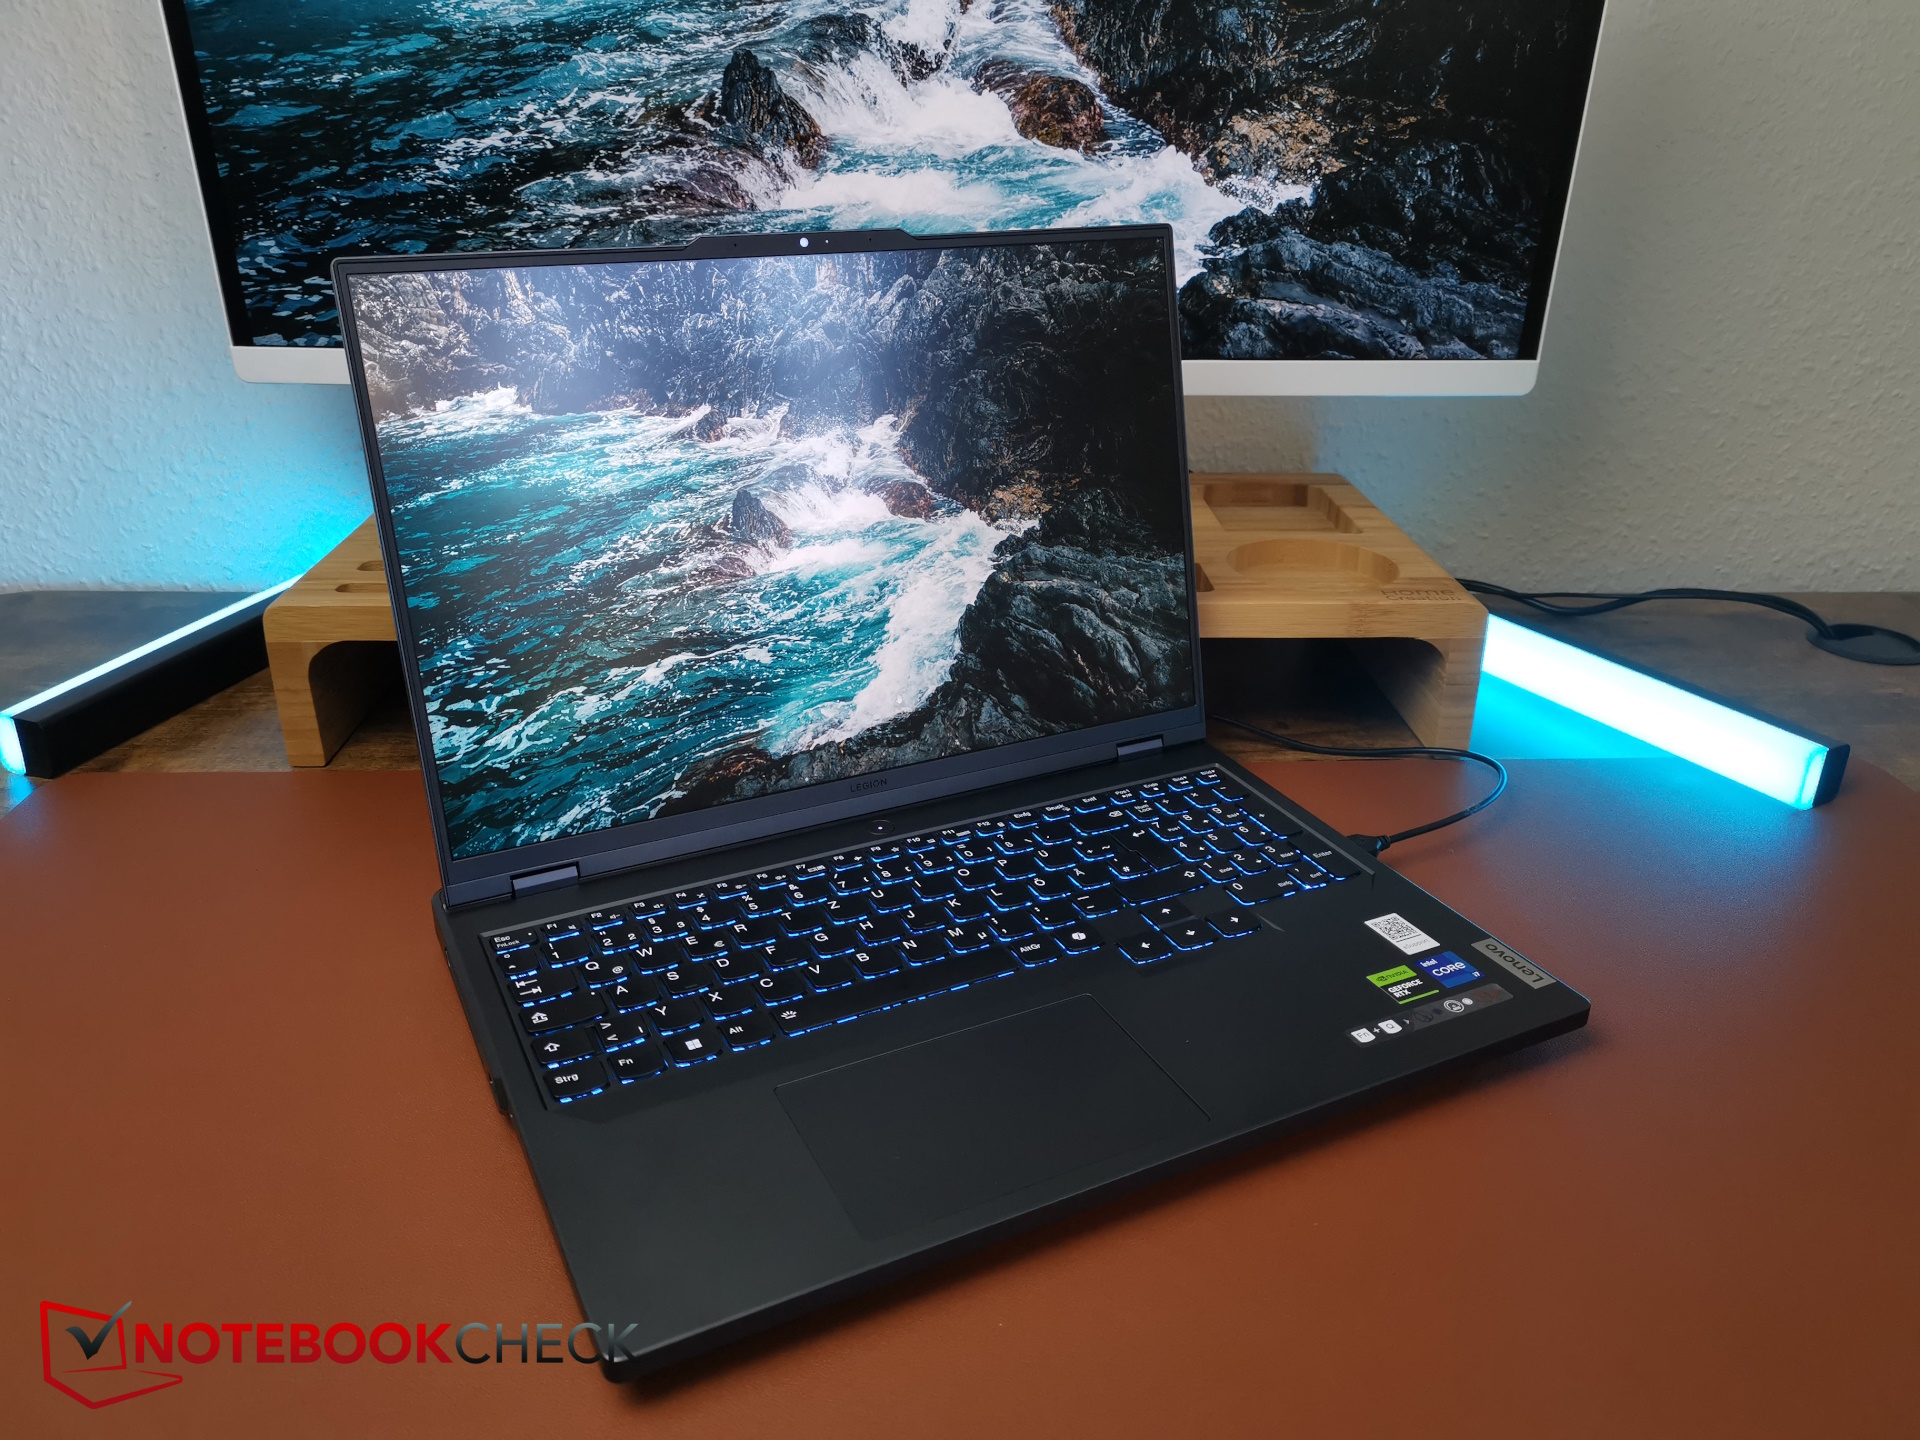
Display - Un Legion Pro anche per i creatori di contenuti


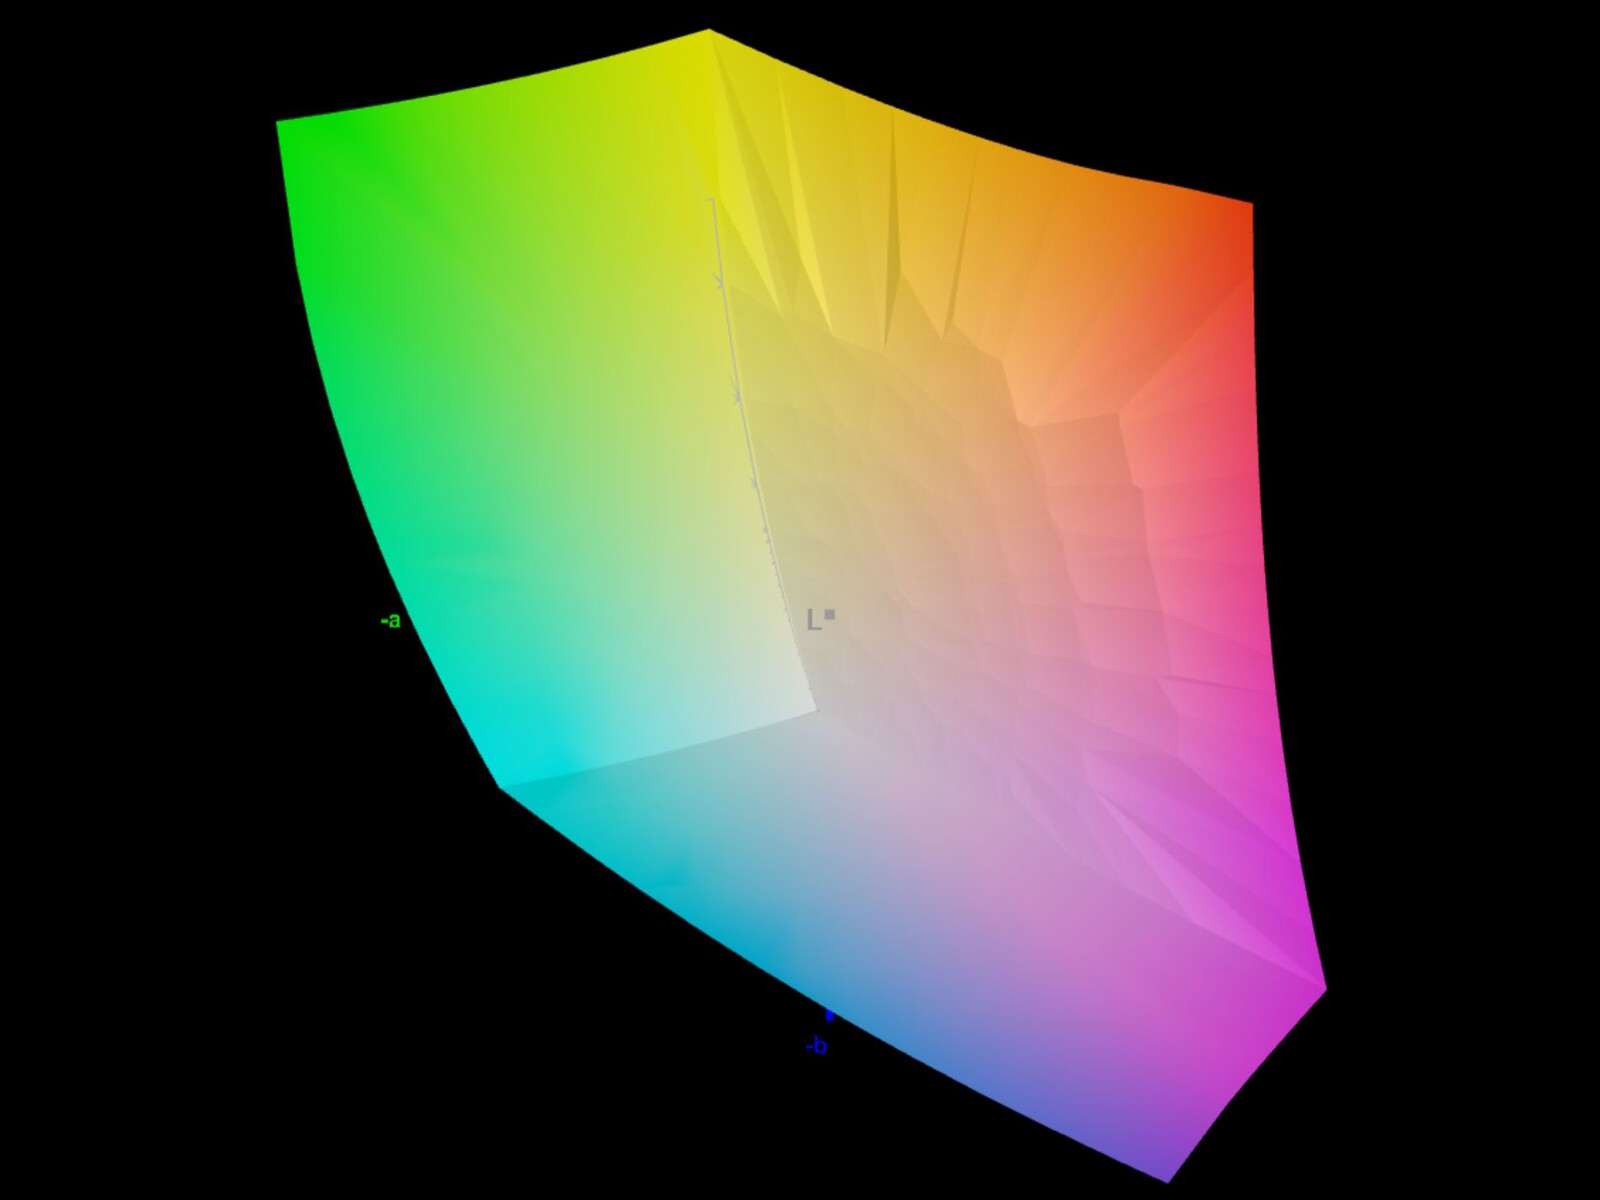
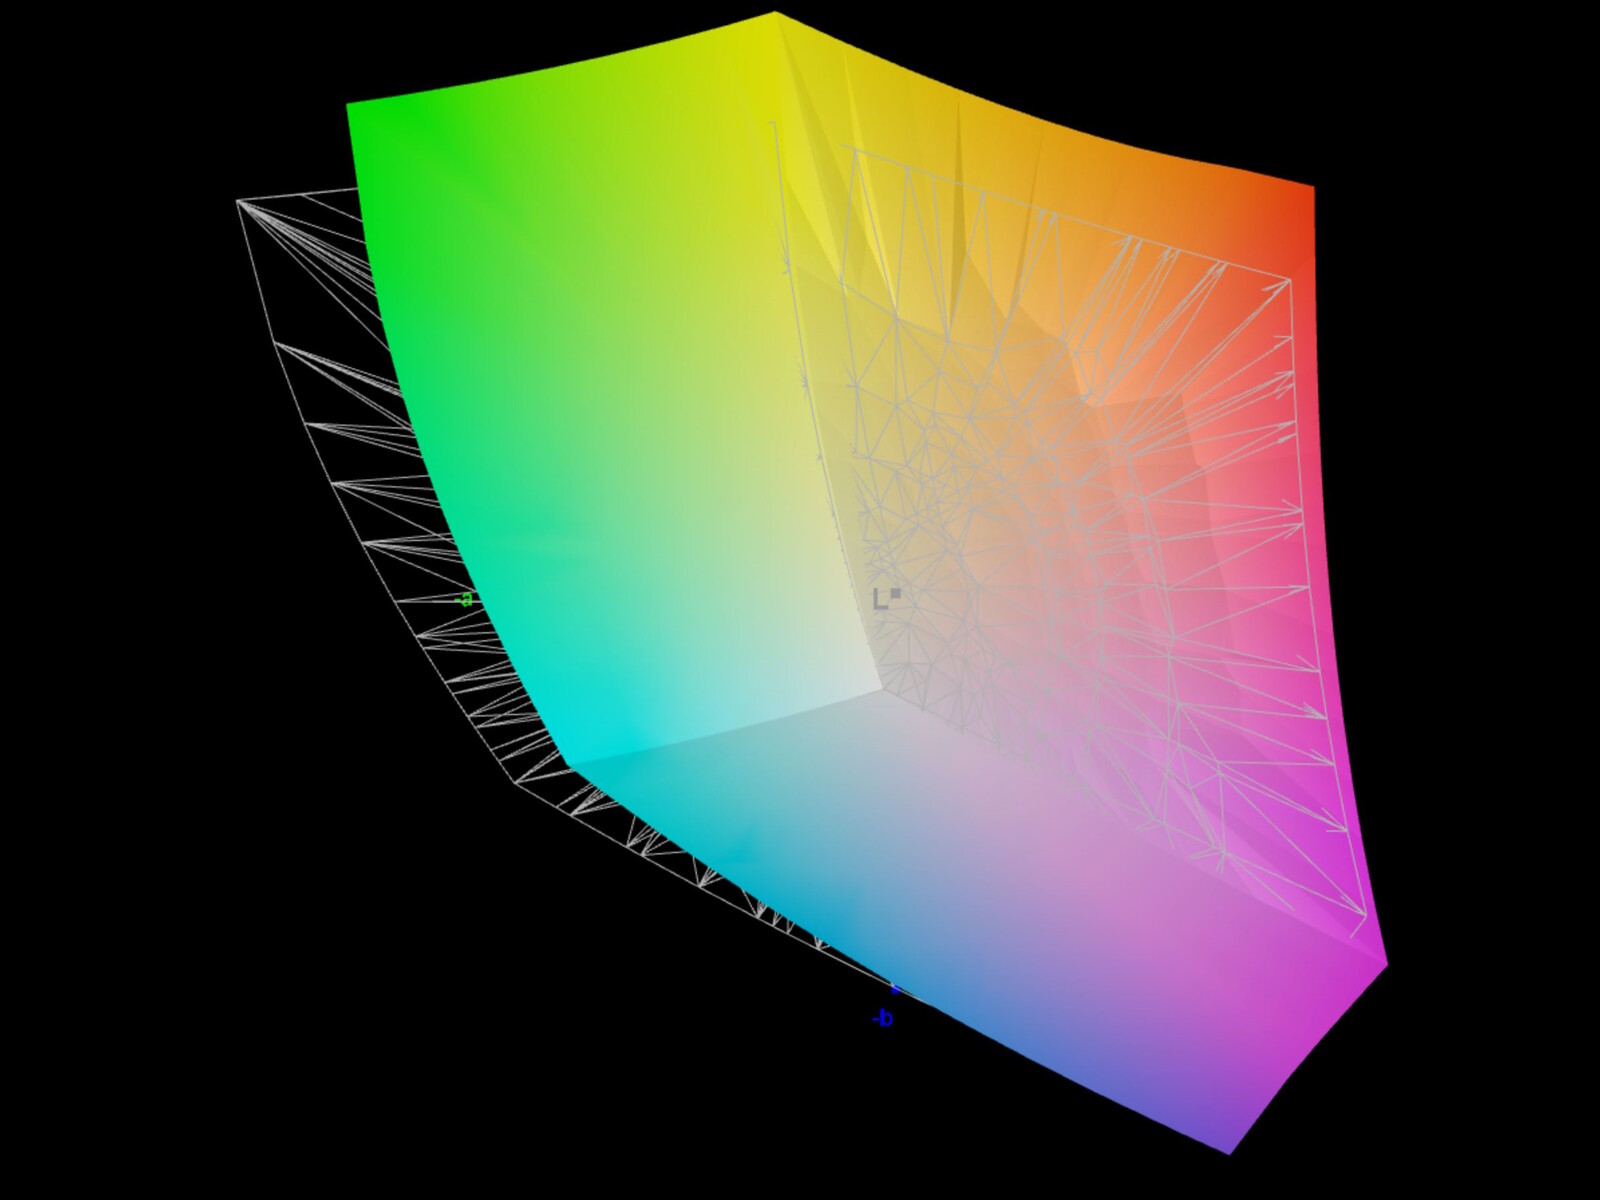
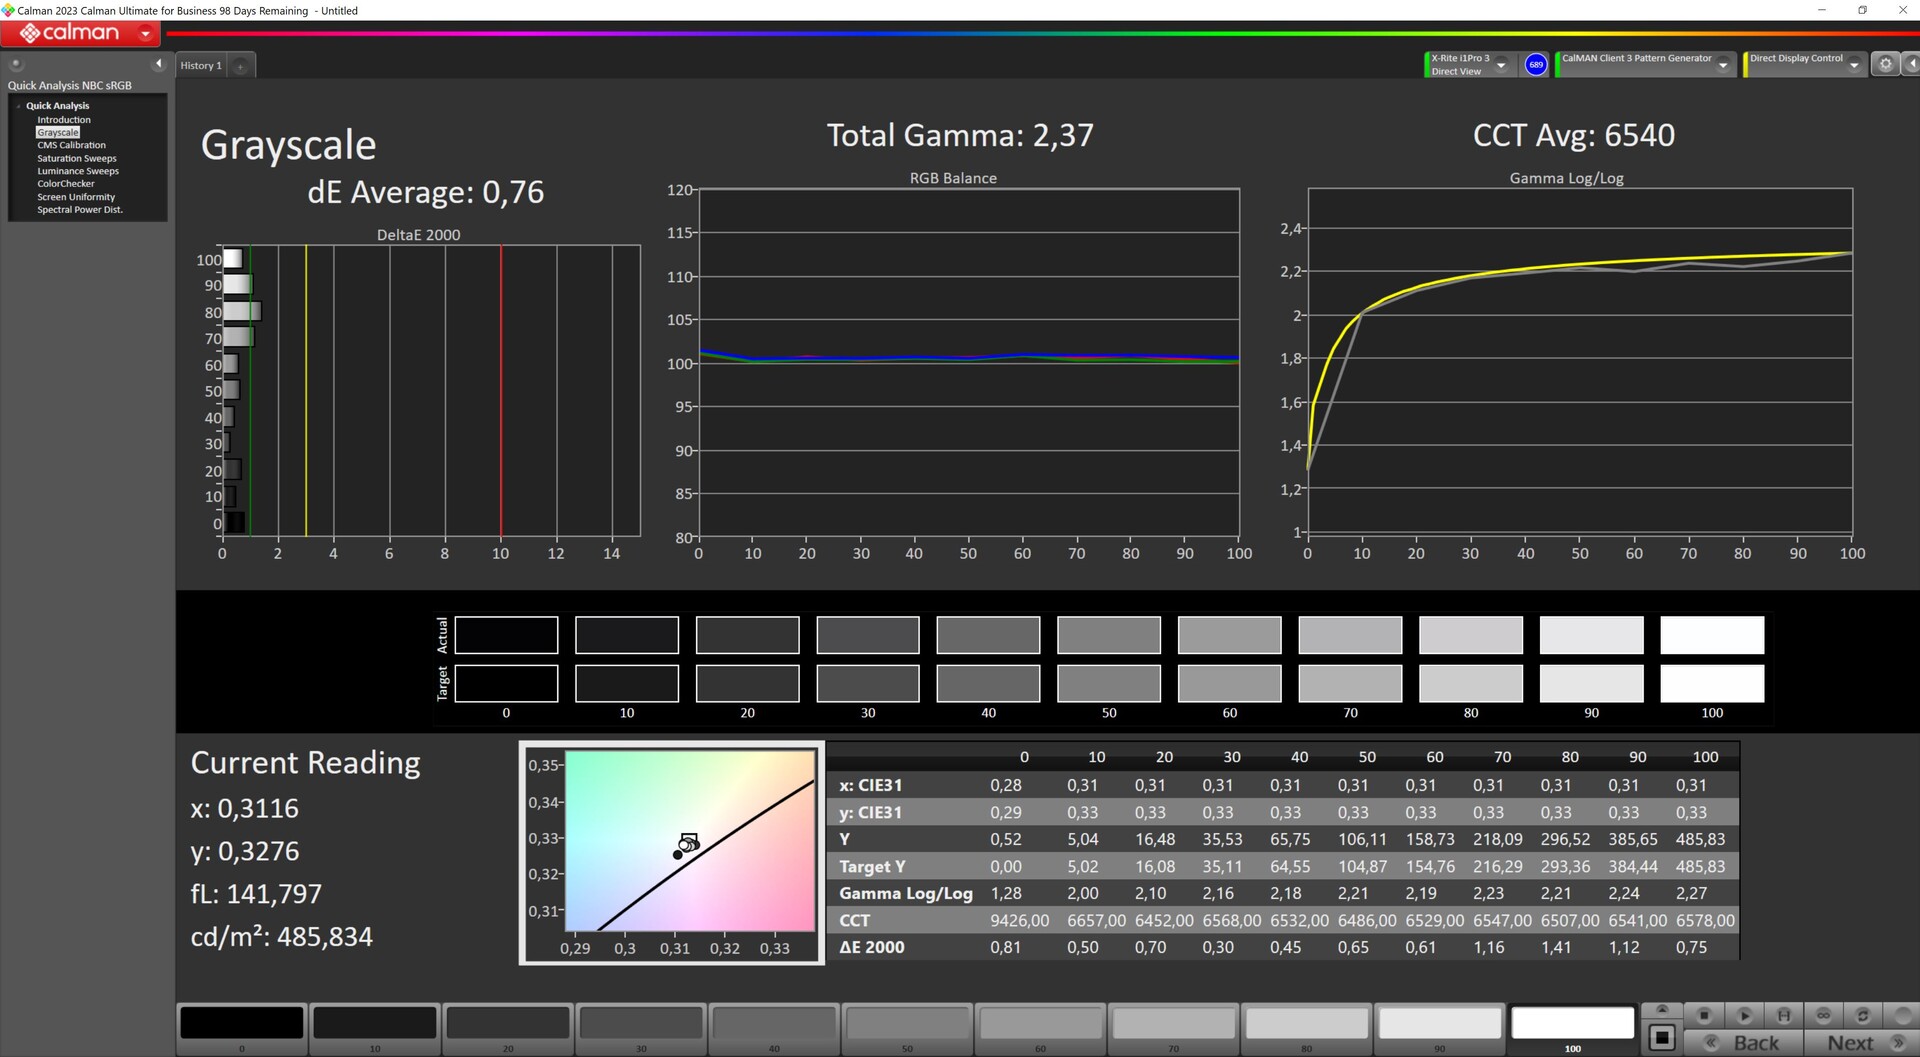
Lenovo ha installato un display IPS opaco con 2.560 x 1.600 pixel in questo portatile. Tuttavia, sono disponibili tre varianti di display, tutte con la stessa risoluzione. Il modello base dovrebbe coprire sRGB, ha una frequenza di aggiornamento di 165 Hz e una luminosità di 300 nits. Gli altri due modelli hanno una luminosità di 500 nits e una frequenza di aggiornamento di 240 Hz, uno dei quali supporta anche DCI-P3. Il nostro modello di prova ha uno dei display da 500 nits con una frequenza di aggiornamento di 240 Hz.
Abbiamo misurato una luminosità media di 491 nits e la sua illuminazione del 90% è buona. Tuttavia, il livello del nero potrebbe essere leggermente migliore, ma il contrasto è buono.
Abbiamo rilevato 150 nits con una luminosità di circa il 58 percento. Non utilizza il PWM, quindi il bleeding dello schermo non è un problema e i suoi tempi di risposta sono abbastanza veloci per un pannello IPS.
| |||||||||||||||||||||||||
Distribuzione della luminosità: 90 %
Al centro con la batteria: 518 cd/m²
Contrasto: 1439:1 (Nero: 0.36 cd/m²)
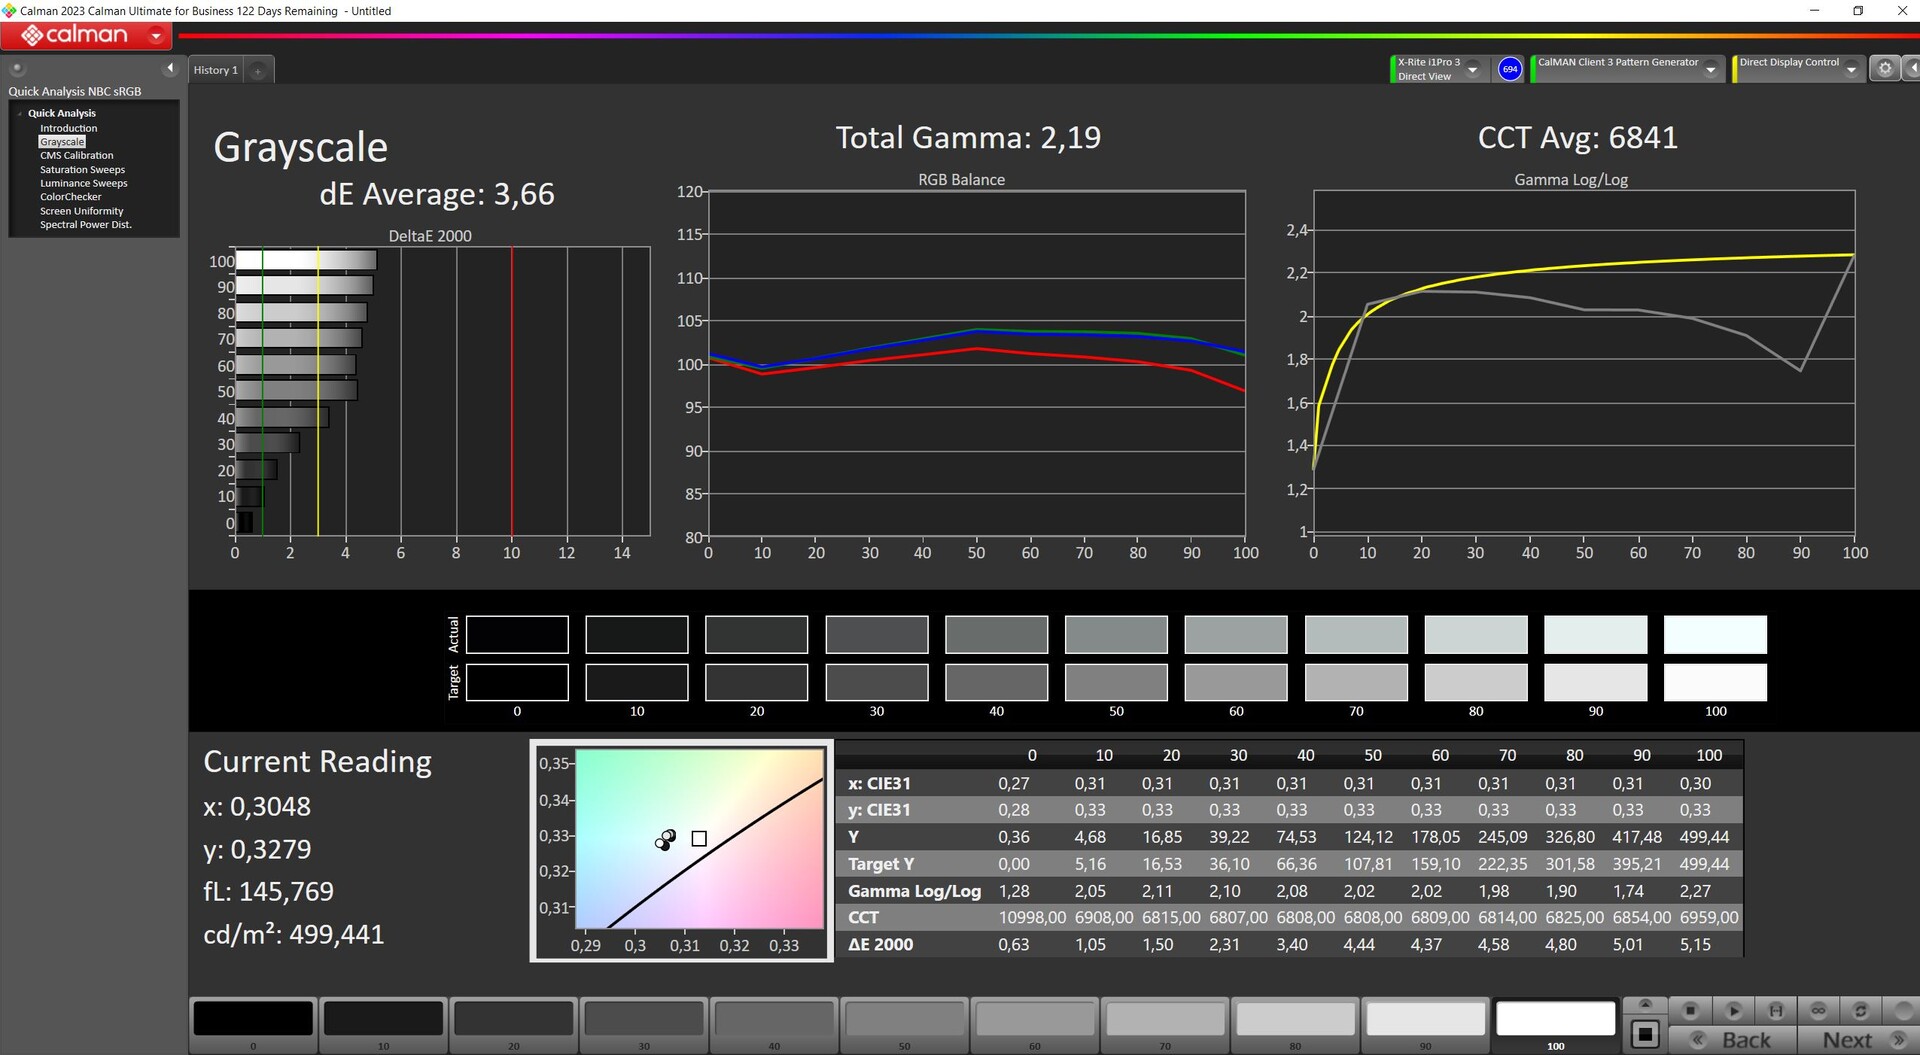
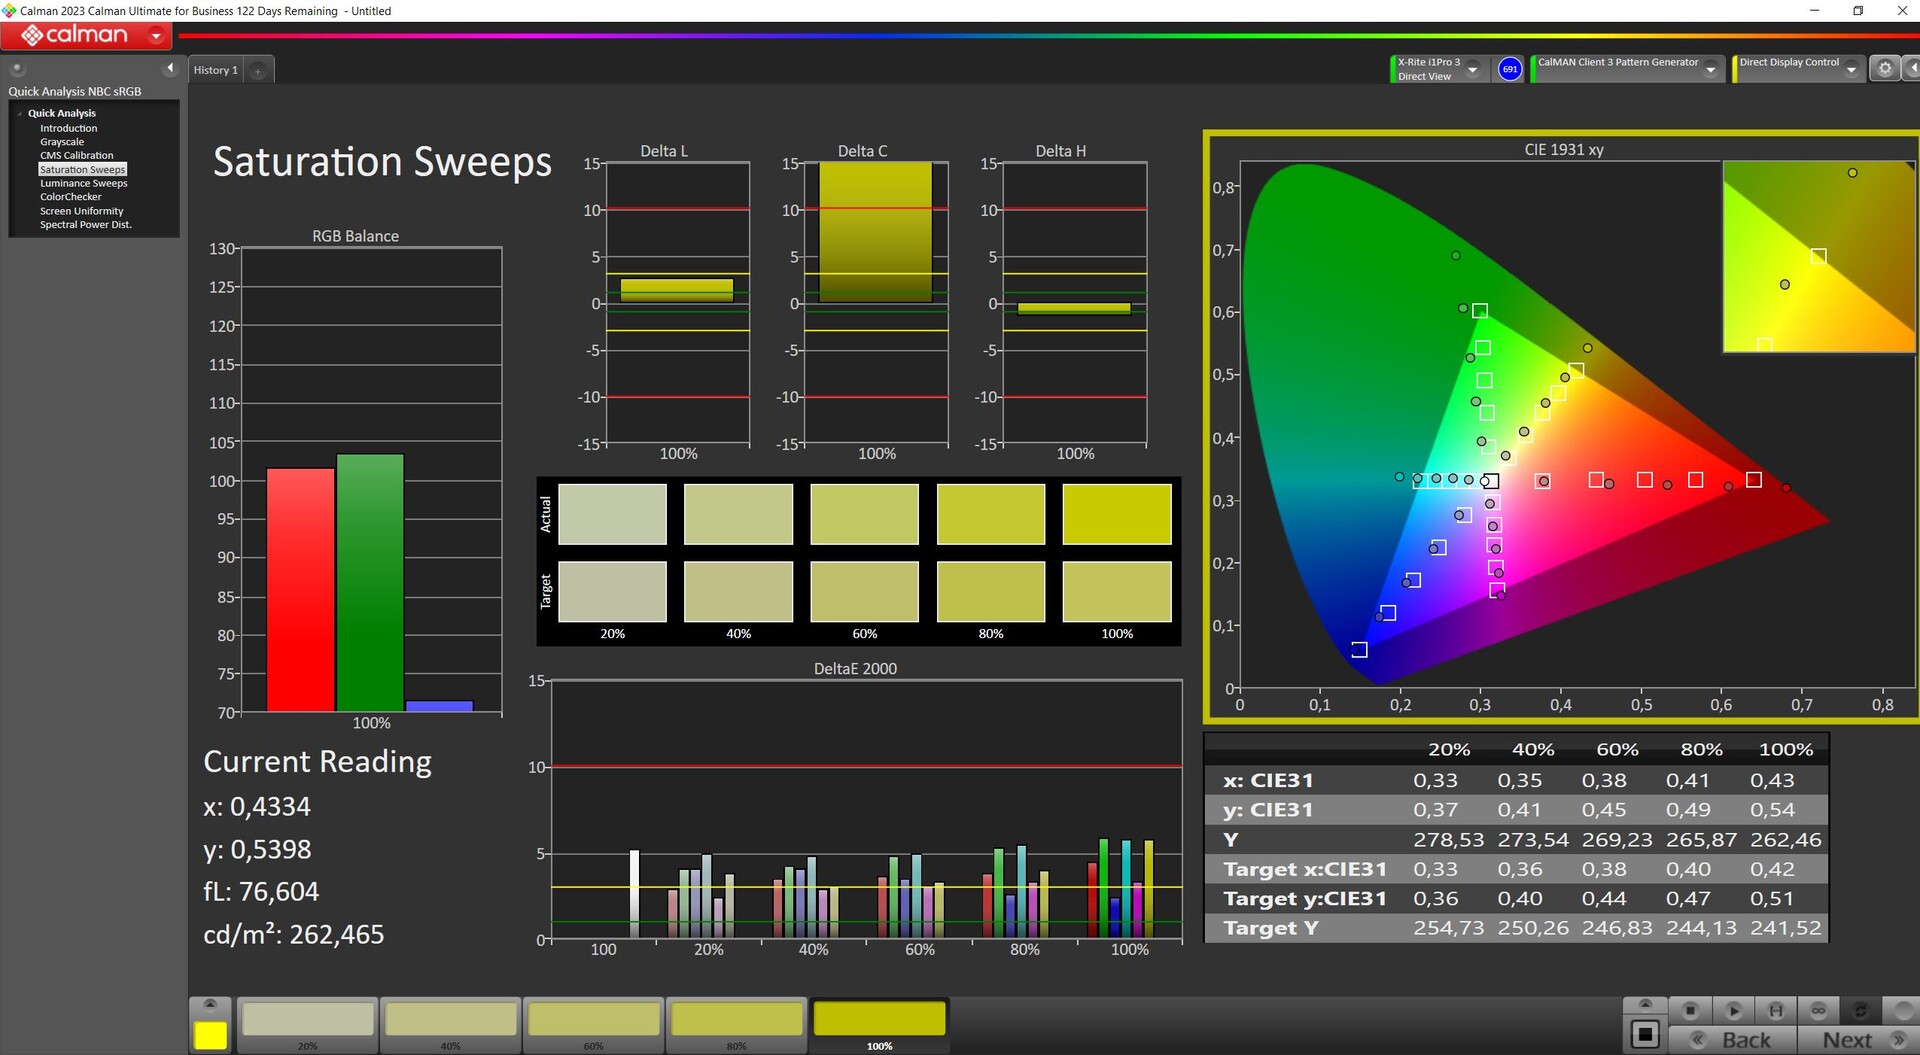
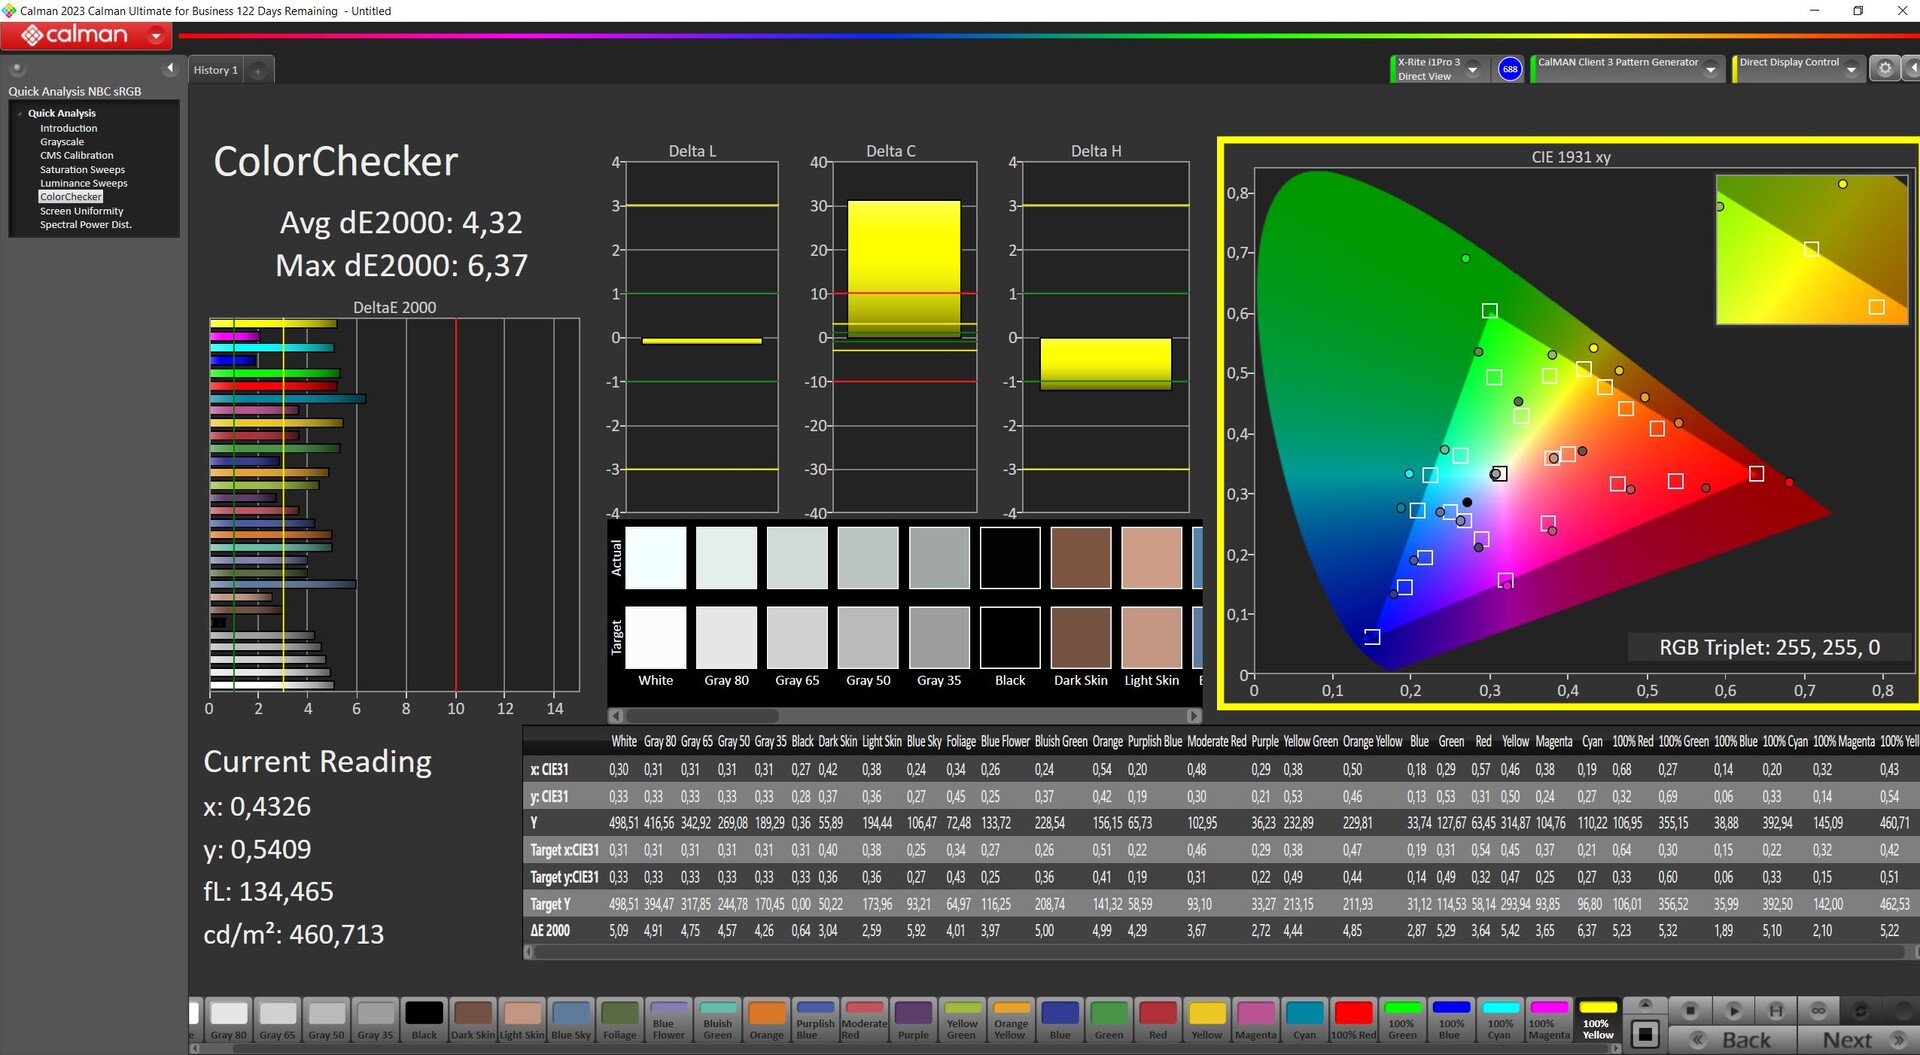
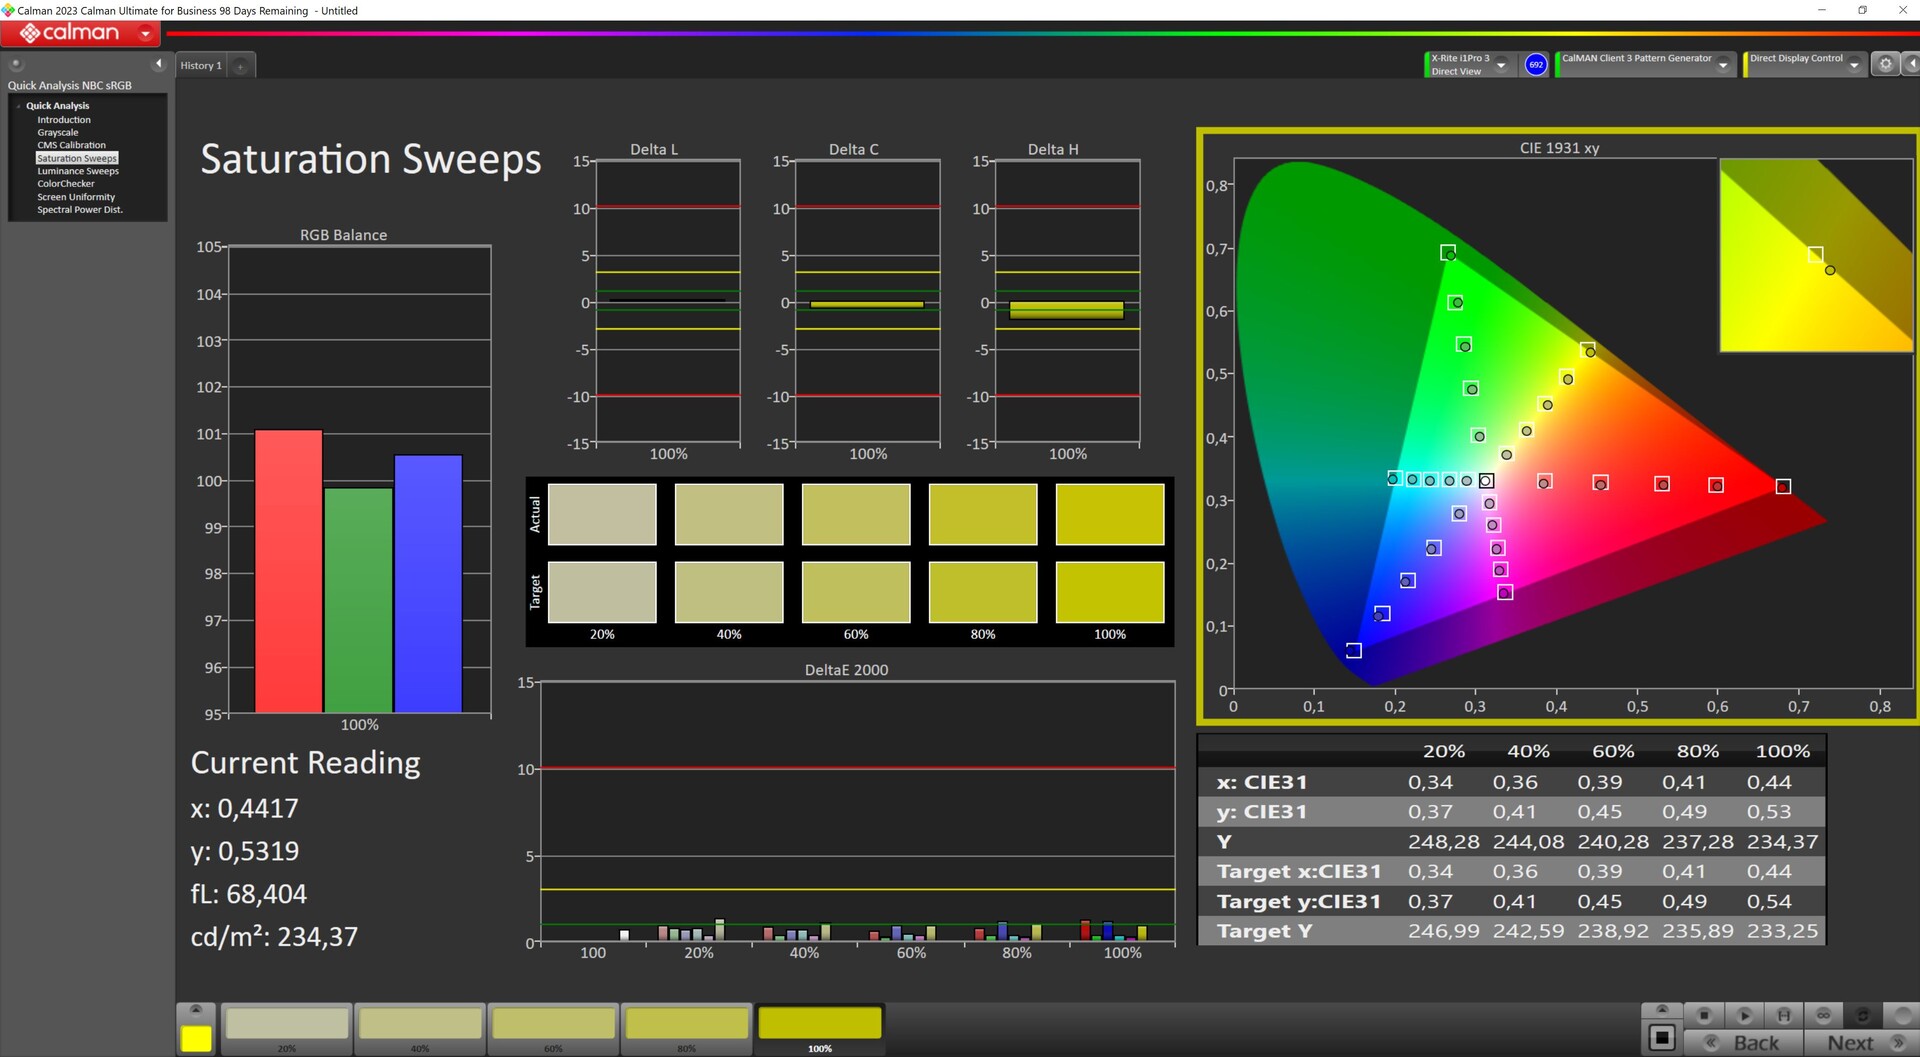
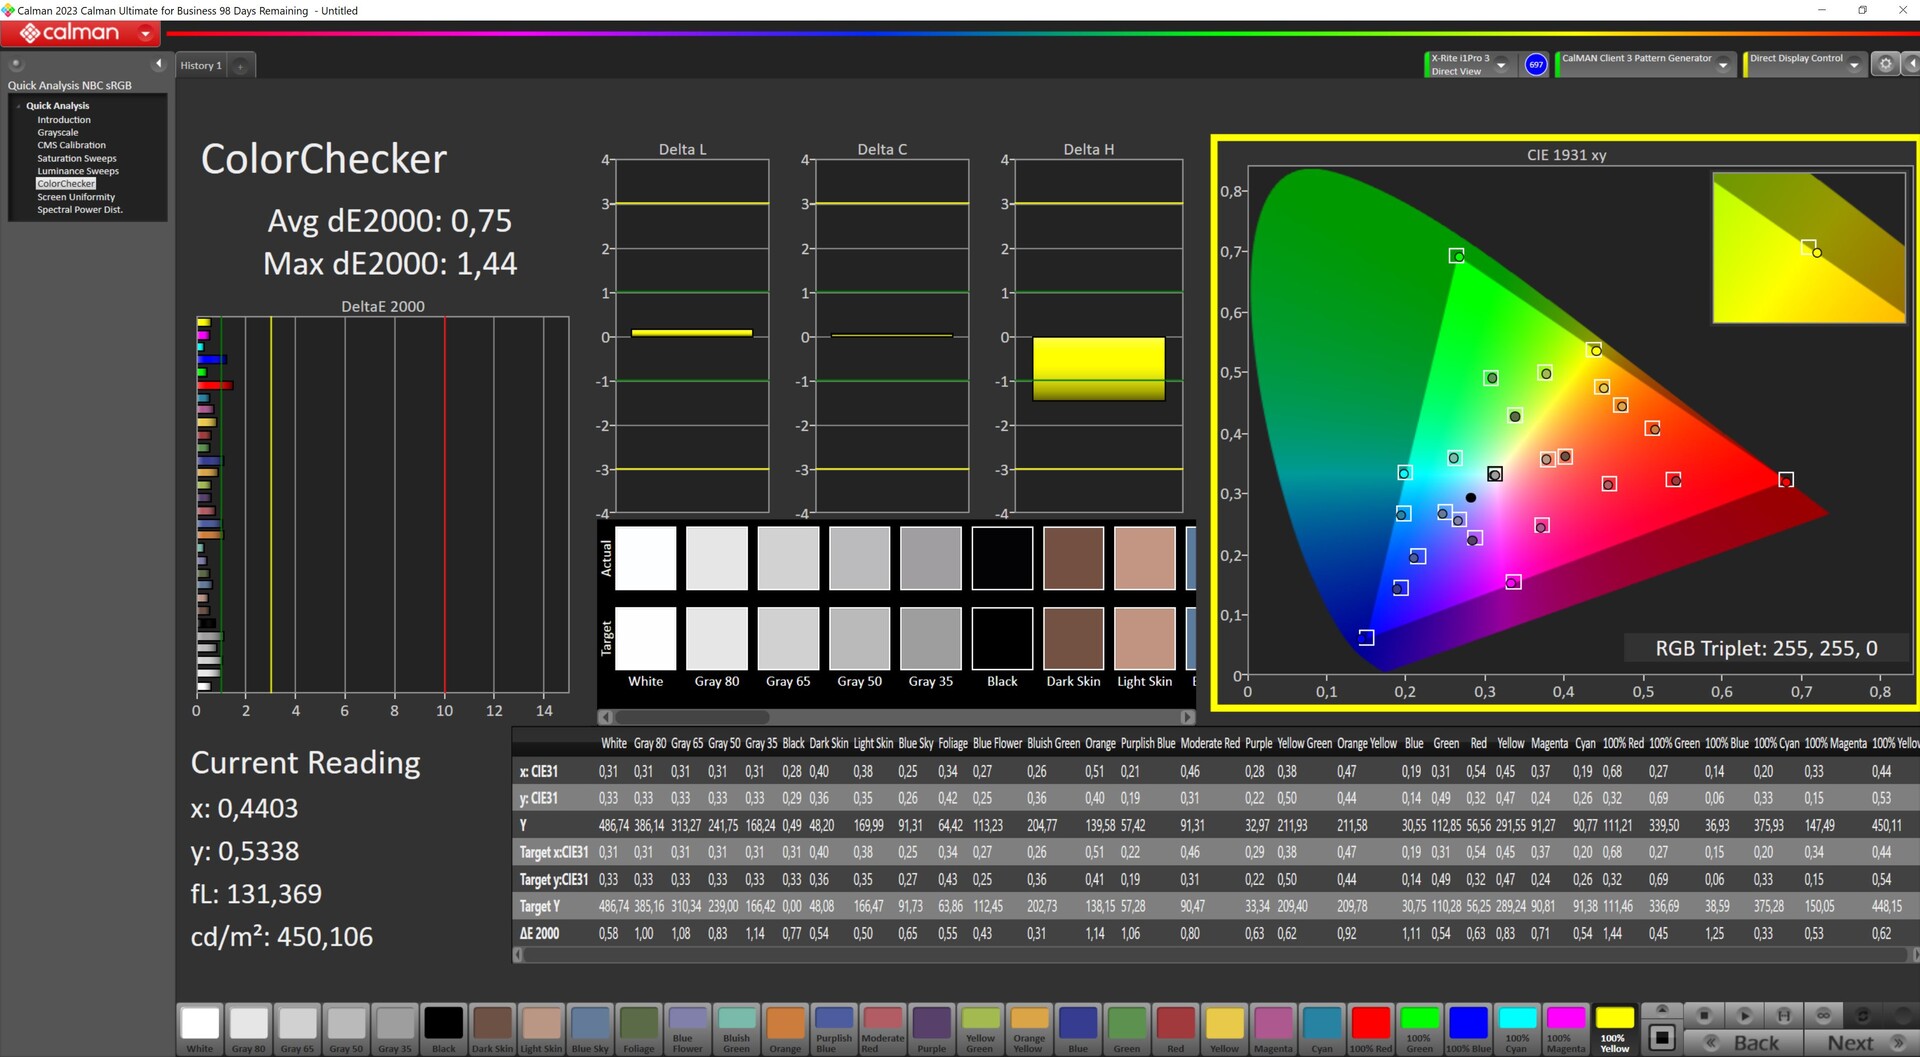
ΔE Color 4.32 | 0.5-29.43 Ø4.87, calibrated: 0.75
ΔE Greyscale 3.66 | 0.5-98 Ø5.1
87.81% AdobeRGB 1998 (Argyll 2.2.0 3D)
99.93% sRGB (Argyll 2.2.0 3D)
99.22% Display P3 (Argyll 2.2.0 3D)
Gamma: 2.19
| Lenovo Legion Pro 5 16IRX9 G9 BOE NE160QDM-NZB, IPS, 2560x1600, 16" | HP Victus 16 (2024) Chi Mei CMN163E, IPS, 1920x1080, 16.1" | Dell G16, i7-13650HX, RTX 4060 Chi Mei CMN161D (160GME), IPS, 2560x1600, 16" | SCHENKER XMG Core 15 (M24) BOE NJ NE153QDM-NZ1 (BOE0C8E), IPS, 2560x1600, 15.3" | Lenovo Legion Pro 5 16IRX9 BOE NE160QDM-NYC, IPS, 2560x1600, 16" | Lenovo Legion 5 16IRX G9 NE160QDM-NZ3, IPS, 2560x1600, 16" | |
|---|---|---|---|---|---|---|
| Display | -49% | -18% | -14% | -17% | -14% | |
| Display P3 Coverage | 99.22 | 41.3 -58% | 67.5 -32% | 73.2 -26% | 69.3 -30% | 72.4 -27% |
| sRGB Coverage | 99.93 | 61.7 -38% | 98.5 -1% | 100 0% | 99.4 -1% | 100 0% |
| AdobeRGB 1998 Coverage | 87.81 | 42.7 -51% | 69.3 -21% | 74.6 -15% | 70.1 -20% | 74.1 -16% |
| Response Times | -300% | -36% | -50% | -73% | -78% | |
| Response Time Grey 50% / Grey 80% * | 4.8 ? | 28.6 ? -496% | 7.6 ? -58% | 9.6 ? -100% | 11.9 ? -148% | 12.5 ? -160% |
| Response Time Black / White * | 9.2 ? | 18.7 ? -103% | 10.4 ? -13% | 9.2 ? -0% | 8.9 ? 3% | 8.7 ? 5% |
| PWM Frequency | ||||||
| Screen | -76% | -22% | 3% | 12% | 21% | |
| Brightness middle | 518 | 287 -45% | 369 -29% | 635 23% | 384 -26% | 526 2% |
| Brightness | 491 | 288 -41% | 344 -30% | 604 23% | 366 -25% | 500 2% |
| Brightness Distribution | 90 | 86 -4% | 89 -1% | 91 1% | 91 1% | 87 -3% |
| Black Level * | 0.36 | 0.19 47% | 0.26 28% | 0.64 -78% | 0.35 3% | 0.33 8% |
| Contrast | 1439 | 1511 5% | 1419 -1% | 992 -31% | 1097 -24% | 1594 11% |
| Colorchecker dE 2000 * | 4.32 | 5.46 -26% | 3.04 30% | 1.89 56% | 0.97 78% | 1.2 72% |
| Colorchecker dE 2000 max. * | 6.37 | 20.36 -220% | 5.56 13% | 3.14 51% | 3.57 44% | 2.1 67% |
| Colorchecker dE 2000 calibrated * | 0.75 | 3.52 -369% | 2.35 -213% | 1.14 -52% | 0.77 -3% | 1 -33% |
| Greyscale dE 2000 * | 3.66 | 4.8 -31% | 3.38 8% | 2.53 31% | 1.5 59% | 1.3 64% |
| Gamma | 2.19 100% | 2.108 104% | 2.47 89% | 2.36 93% | 2.24 98% | 2.23 99% |
| CCT | 6841 95% | 6442 101% | 6040 108% | 6434 101% | 6709 97% | 6391 102% |
| Media totale (Programma / Settaggio) | -142% /
-102% | -25% /
-23% | -20% /
-8% | -26% /
-6% | -24% /
-1% |
* ... Meglio usare valori piccoli
Sia sRGB che Display P3 sono coperti quasi completamente, mentre AdobeRGB è coperto per quasi l'88 percento.

Appena uscito dalla scatola, lo schermo non è calibrato in modo del tutto ottimale. La nostra calibrazione personale con il dispositivo di misurazione del colore X-Rite i1Pro e il software Calman ha spinto i valori DeltaE della scala di grigi e del colore sotto 1.
Tempi di risposta del Display
| ↔ Tempi di risposta dal Nero al Bianco | ||
|---|---|---|
| 9.2 ms ... aumenta ↗ e diminuisce ↘ combinato | ↗ 4.6 ms Incremento | 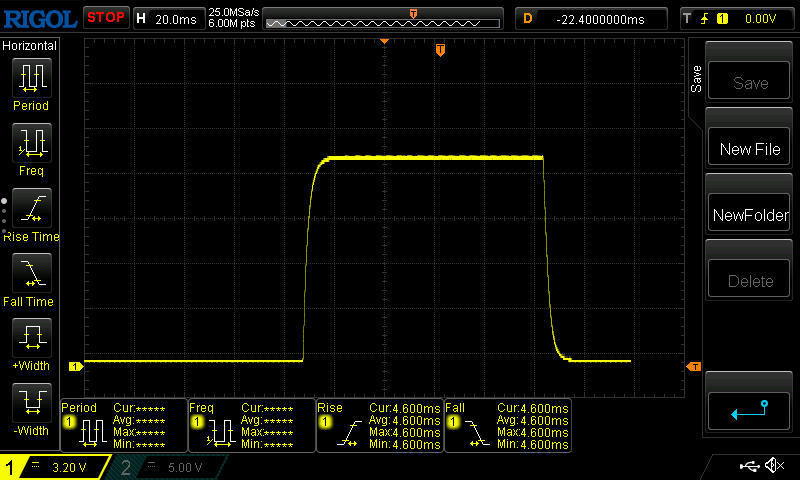 |
| ↘ 4.6 ms Calo | ||
| Lo schermo mostra veloci tempi di risposta durante i nostri tests e dovrebbe esere adatto al gaming In confronto, tutti i dispositivi di test variano da 0.1 (minimo) a 240 (massimo) ms. » 23 % di tutti i dispositivi è migliore. Questo significa che i tempi di risposta rilevati sono migliori rispettto alla media di tutti i dispositivi testati (20.8 ms). | ||
| ↔ Tempo di risposta dal 50% Grigio all'80% Grigio | ||
| 4.8 ms ... aumenta ↗ e diminuisce ↘ combinato | ↗ 2.2 ms Incremento | 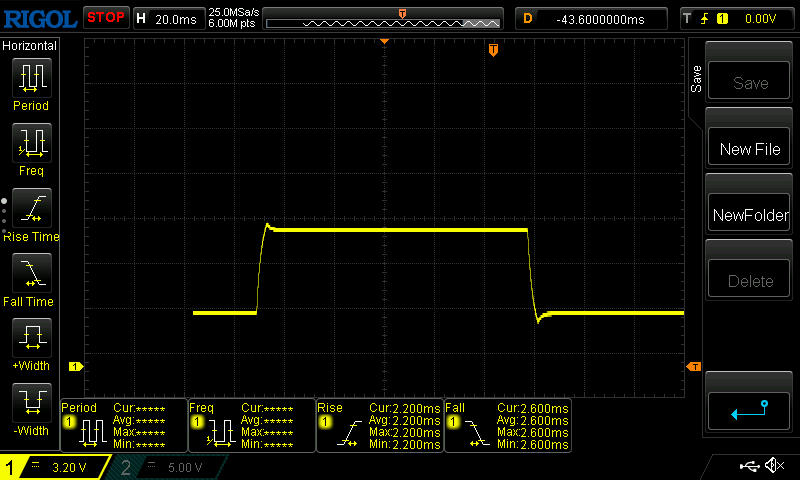 |
| ↘ 2.6 ms Calo | ||
| Lo schermo ha mostrato valori di risposta molto veloci nei nostri tests ed è molto adatto per i gaming veloce. In confronto, tutti i dispositivi di test variano da 0.165 (minimo) a 636 (massimo) ms. » 14 % di tutti i dispositivi è migliore. Questo significa che i tempi di risposta rilevati sono migliori rispettto alla media di tutti i dispositivi testati (32.5 ms). | ||
Sfarfallio dello schermo / PWM (Pulse-Width Modulation)
| flickering dello schermo / PWM non rilevato | 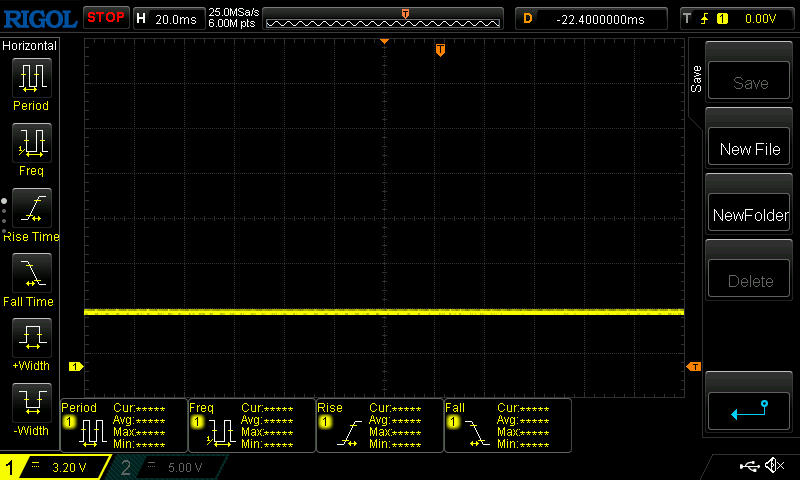 | ||
In confronto: 53 % di tutti i dispositivi testati non utilizza PWM per ridurre la luminosita' del display. Se è rilevato PWM, una media di 8516 (minimo: 5 - massimo: 343500) Hz è stata rilevata. | |||

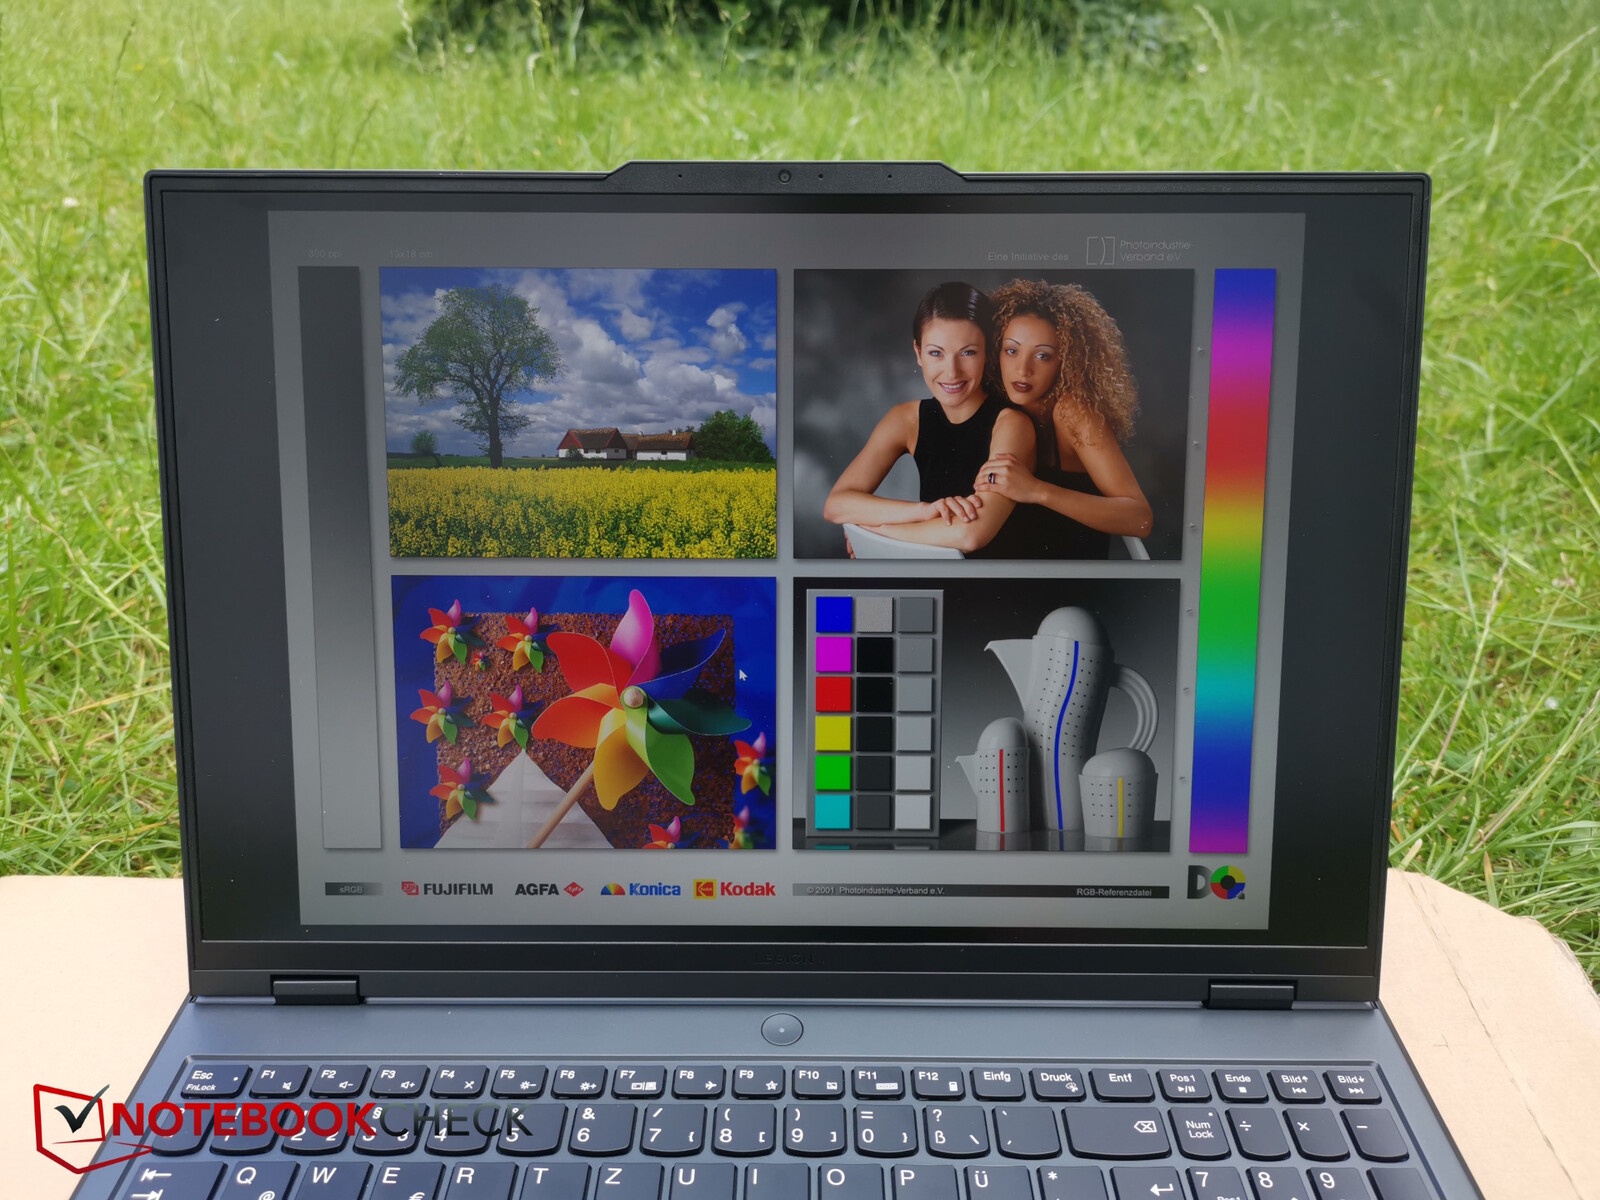
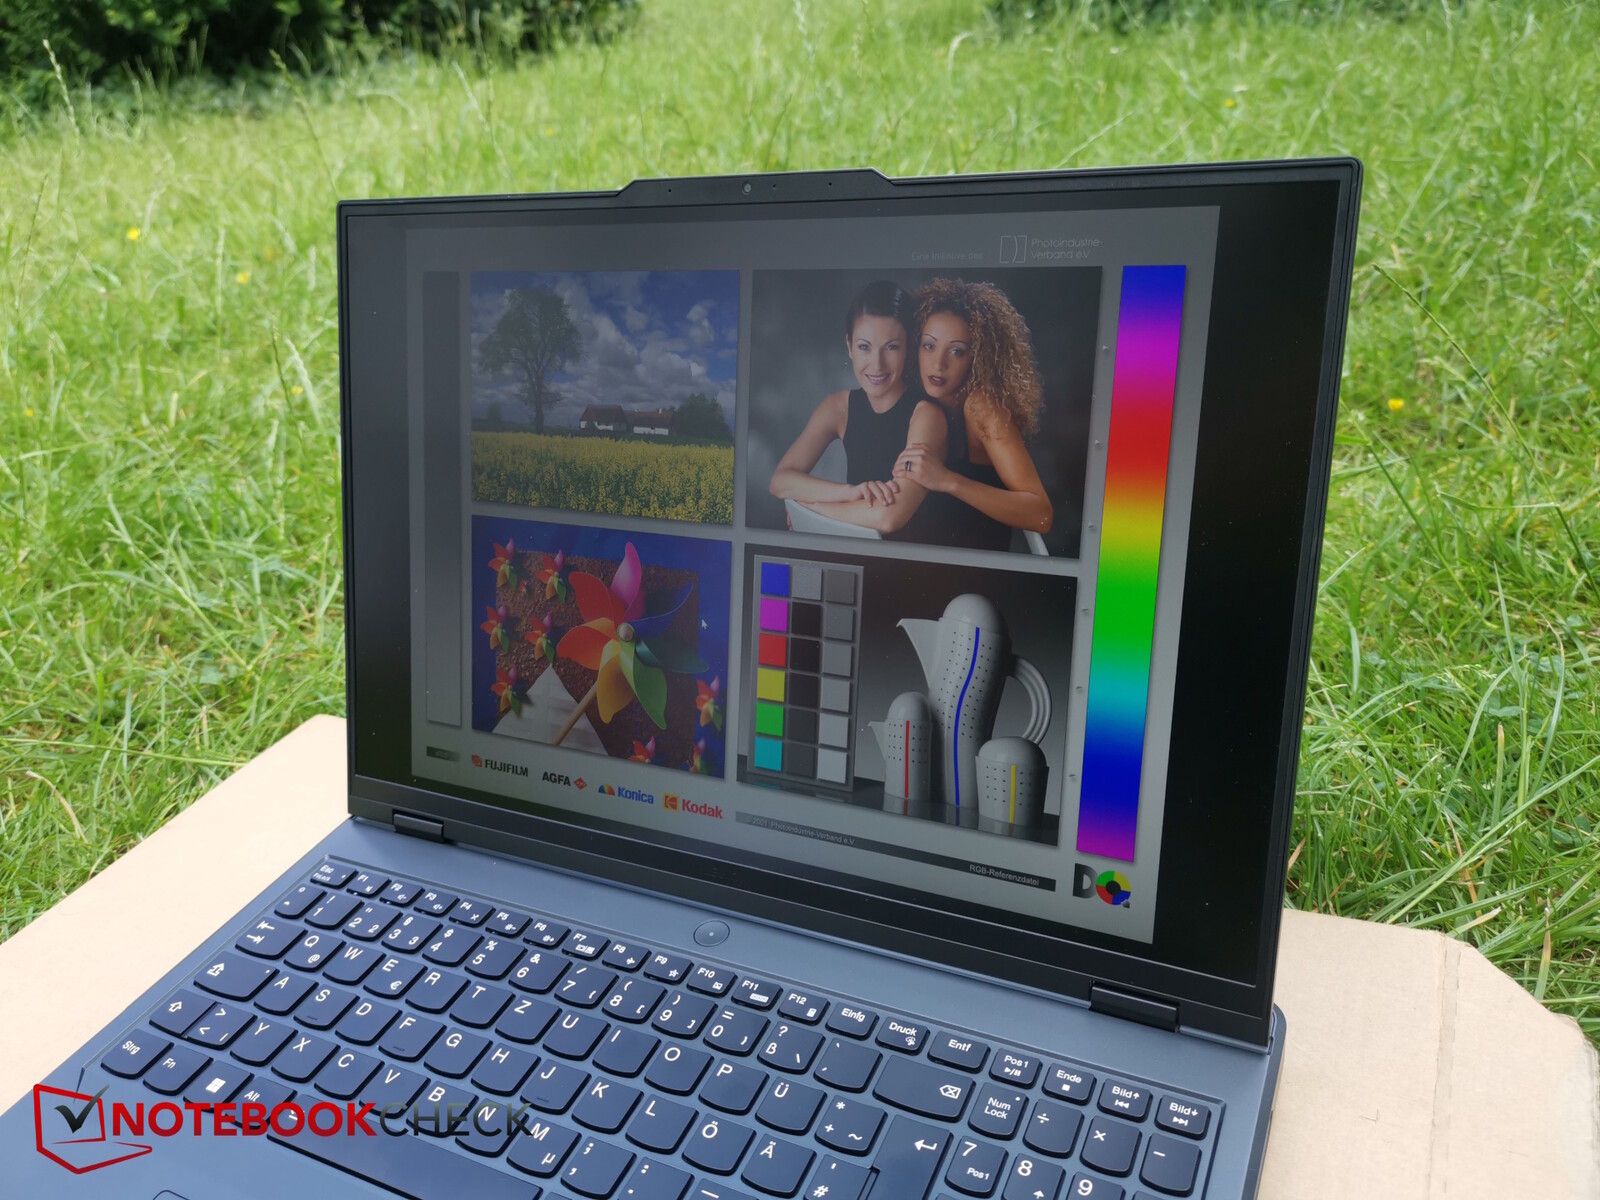
Poiché lo schermo è abbastanza luminoso, con quasi 500 nit, e presenta anche una superficie opaca, la maggior parte dei riflessi viene attenuata e si può usare bene il portatile anche all'esterno, a patto di guardarlo direttamente ed evitare la luce diretta del sole.
Prestazioni - Le ottime prestazioni della CPU e dei giochi del Pro 5i
In contrasto con Legion Pro 5i con i componenti di fascia alta i9 14900HX e RTX 4070 che abbiamo già testato, l'attuale dispositivo di prova è dotato di un i7 14700HX e una RTX 4060. Ciò significa che il portatile è classificato come un gamer di fascia media.
Grazie al suo display luminoso e relativamente preciso nei colori, Legion sarà probabilmente interessante anche per molti creatori, anche se il suo design potrebbe essere un po' più sottile.
Condizioni di test
Il software Lenovo Vantage funge da centro di controllo all'interno di Legion Pro 5i. Oltre ai profili di prestazioni, qui si possono trovare varie altre impostazioni, dall'illuminazione della tastiera all'alimentazione, dall'interruttore MUX agli aggiornamenti del sistema.
Ci sono tre profili di prestazioni preimpostati tra cui scegliere(prestazioni, equilibrato, silenzioso) - è possibile aggiungere un motore AI nella modalità equilibrata e c'è un'altra modalità personalizzata in cui è possibile impostare manualmente vari parametri.
Per i nostri benchmark abbiamo utilizzato la modalità performance senza overclock della GPU. La modalità silenziosa è stata utilizzata per i nostri test della batteria. Occasionalmente, abbiamo fornito anche i valori misurati per le altre modalità di prestazioni.


Processore
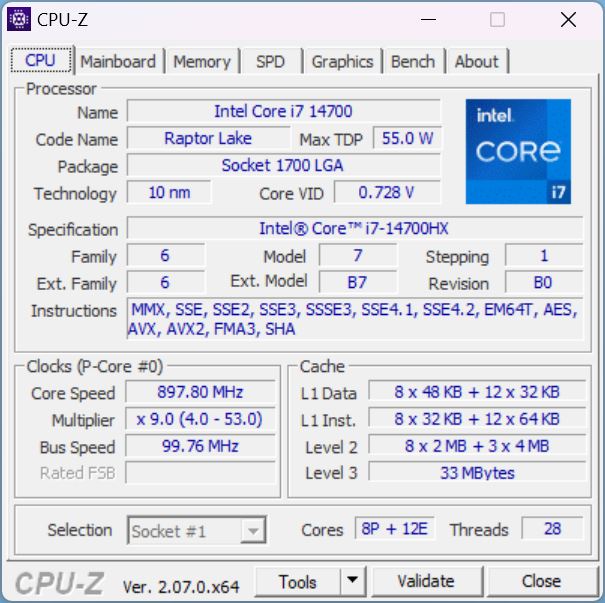
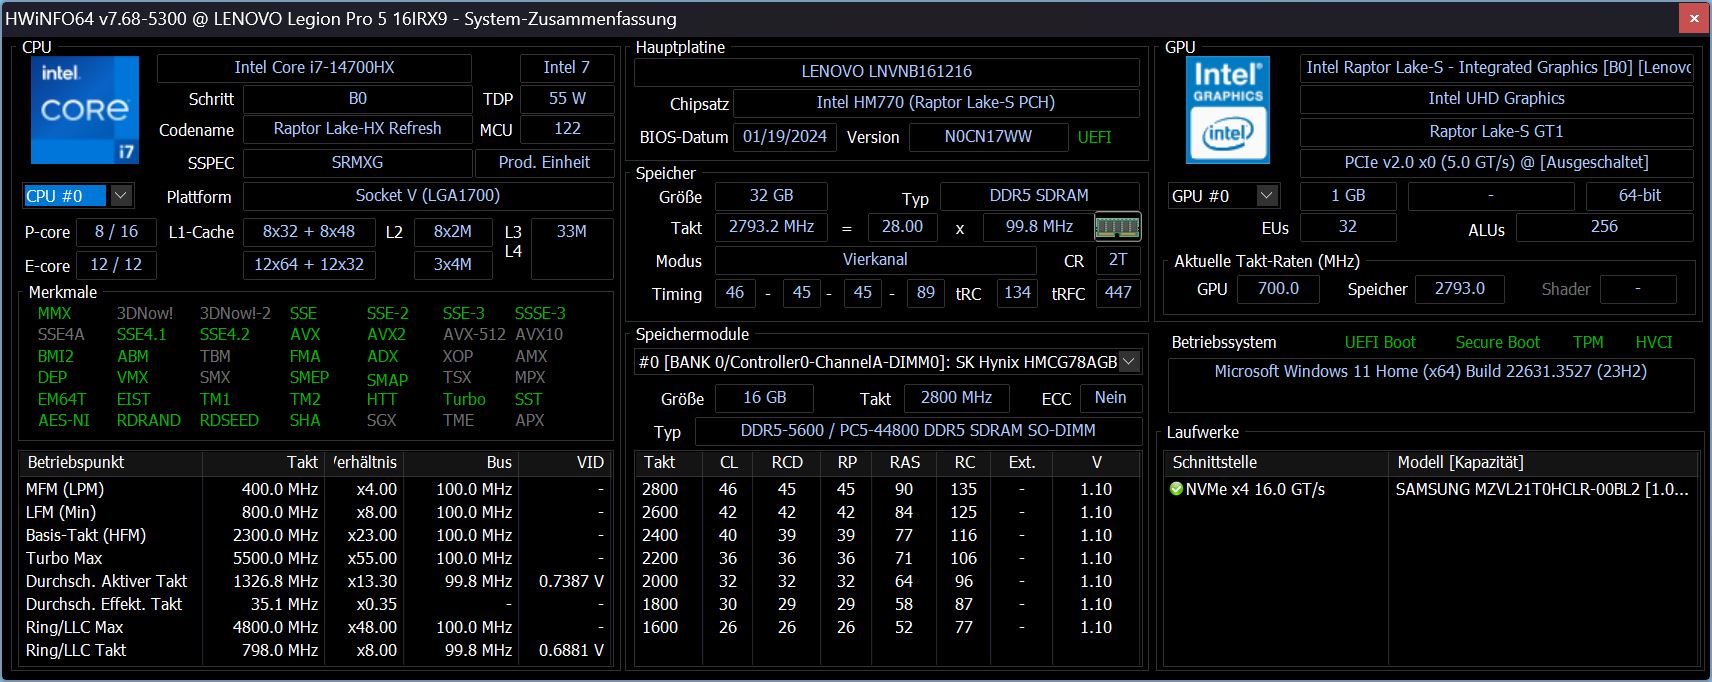
Il Intel Core i7-14700HX è una CPU di fascia alta basata sulla nuova serie Raptor Lake HX Refresh. La CPU contiene 8 core P e 12 core E e può elaborare un totale di 28 thread contemporaneamente grazie all'hyperthreading.
Nel nostro test di loop, la CPU si è comportata in modo molto costante e con una perdita di prestazioni minima nel corso dei 30 minuti. Ha superato la maggior parte dei concorrenti: solo Legion Pro 5i con il processore i9-14900HX ha fatto leggermente meglio.
In tutti i benchmark, tuttavia, è emerso chiaramente che il processore del nostro Legion Pro 5i ha prestazioni impressionanti. È risultato superiore del 9 percento rispetto all'i7-14700HX medio del nostro database e solo del 5 percento rispetto all'i9-14900HX.
Scollegato dalla rete elettrica, circa il 44 percento delle prestazioni della CPU è stato perso durante l'esecuzione di Cinebench R15 Multi. La tabella seguente mostra i punteggi e i TDP di Cinebench R15 Multi a seconda del profilo di prestazioni, con le curve TDP corrispondenti nella rispettiva modalità sulla destra.
| Modalità di prestazione/valore di misurazione | Punteggio Cinebench R 15 Multi | TDP |
|---|---|---|
| Prestazioni | 4137 | 190 - 130 |
| Bilanciato con AI | 3650 | 125 - 70 |
| Bilanciato senza AI | 3367 | 125 - 65 |
| Silenziosità | 2640 | 70 - 65 |
| Batteria | 2302 | 56 - 45 |
Cinebench R15 Multi continuous test
Cinebench R23: Multi Core | Single Core
Cinebench R20: CPU (Multi Core) | CPU (Single Core)
Cinebench R15: CPU Multi 64Bit | CPU Single 64Bit
Blender: v2.79 BMW27 CPU
7-Zip 18.03: 7z b 4 | 7z b 4 -mmt1
Geekbench 6.4: Multi-Core | Single-Core
Geekbench 5.5: Multi-Core | Single-Core
HWBOT x265 Benchmark v2.2: 4k Preset
LibreOffice : 20 Documents To PDF
R Benchmark 2.5: Overall mean
| CPU Performance Rating | |
| Lenovo Legion Pro 5 16IRX9 | |
| Lenovo Legion Pro 5 16IRX9 G9 | |
| Lenovo Legion 5 16IRX G9 | |
| Media Intel Core i7-14700HX | |
| Media della classe Gaming | |
| HP Victus 16 (2024) | |
| SCHENKER XMG Core 15 (M24) | |
| Dell G16, i7-13650HX, RTX 4060 | |
| Cinebench R23 / Multi Core | |
| Lenovo Legion Pro 5 16IRX9 | |
| Lenovo Legion Pro 5 16IRX9 G9 | |
| Media Intel Core i7-14700HX (22313 - 28122, n=7) | |
| Lenovo Legion 5 16IRX G9 | |
| HP Victus 16 (2024) | |
| Media della classe Gaming (5668 - 39652, n=151, ultimi 2 anni) | |
| Dell G16, i7-13650HX, RTX 4060 | |
| SCHENKER XMG Core 15 (M24) | |
| Cinebench R23 / Single Core | |
| Lenovo Legion Pro 5 16IRX9 G9 | |
| Lenovo Legion Pro 5 16IRX9 | |
| Media Intel Core i7-14700HX (1702 - 2144, n=7) | |
| Lenovo Legion 5 16IRX G9 | |
| Dell G16, i7-13650HX, RTX 4060 | |
| Media della classe Gaming (1136 - 2252, n=151, ultimi 2 anni) | |
| SCHENKER XMG Core 15 (M24) | |
| HP Victus 16 (2024) | |
| Cinebench R20 / CPU (Multi Core) | |
| Lenovo Legion Pro 5 16IRX9 | |
| Lenovo Legion Pro 5 16IRX9 G9 | |
| Lenovo Legion 5 16IRX G9 | |
| HP Victus 16 (2024) | |
| Media Intel Core i7-14700HX (8361 - 10498, n=7) | |
| Media della classe Gaming (2179 - 15517, n=151, ultimi 2 anni) | |
| Dell G16, i7-13650HX, RTX 4060 | |
| SCHENKER XMG Core 15 (M24) | |
| Cinebench R20 / CPU (Single Core) | |
| Lenovo Legion Pro 5 16IRX9 G9 | |
| Lenovo Legion Pro 5 16IRX9 | |
| Media Intel Core i7-14700HX (651 - 821, n=7) | |
| Lenovo Legion 5 16IRX G9 | |
| Media della classe Gaming (439 - 866, n=151, ultimi 2 anni) | |
| Dell G16, i7-13650HX, RTX 4060 | |
| SCHENKER XMG Core 15 (M24) | |
| HP Victus 16 (2024) | |
| Cinebench R15 / CPU Multi 64Bit | |
| Lenovo Legion Pro 5 16IRX9 | |
| Lenovo Legion Pro 5 16IRX9 G9 | |
| HP Victus 16 (2024) | |
| Lenovo Legion 5 16IRX G9 | |
| Media Intel Core i7-14700HX (3328 - 4137, n=7) | |
| Media della classe Gaming (905 - 6074, n=154, ultimi 2 anni) | |
| Dell G16, i7-13650HX, RTX 4060 | |
| SCHENKER XMG Core 15 (M24) | |
| Cinebench R15 / CPU Single 64Bit | |
| Lenovo Legion Pro 5 16IRX9 G9 | |
| Lenovo Legion Pro 5 16IRX9 | |
| Lenovo Legion 5 16IRX G9 | |
| Media Intel Core i7-14700HX (238 - 304, n=7) | |
| SCHENKER XMG Core 15 (M24) | |
| Media della classe Gaming (191.9 - 343, n=151, ultimi 2 anni) | |
| Dell G16, i7-13650HX, RTX 4060 | |
| HP Victus 16 (2024) | |
| Blender / v2.79 BMW27 CPU | |
| SCHENKER XMG Core 15 (M24) | |
| Media della classe Gaming (81 - 555, n=144, ultimi 2 anni) | |
| HP Victus 16 (2024) | |
| Dell G16, i7-13650HX, RTX 4060 | |
| Media Intel Core i7-14700HX (126 - 184, n=7) | |
| Lenovo Legion 5 16IRX G9 | |
| Lenovo Legion Pro 5 16IRX9 G9 | |
| Lenovo Legion Pro 5 16IRX9 | |
| 7-Zip 18.03 / 7z b 4 | |
| Lenovo Legion Pro 5 16IRX9 | |
| Lenovo Legion Pro 5 16IRX9 G9 | |
| Media Intel Core i7-14700HX (84799 - 104730, n=7) | |
| Lenovo Legion 5 16IRX G9 | |
| HP Victus 16 (2024) | |
| Media della classe Gaming (23795 - 144064, n=149, ultimi 2 anni) | |
| Dell G16, i7-13650HX, RTX 4060 | |
| SCHENKER XMG Core 15 (M24) | |
| 7-Zip 18.03 / 7z b 4 -mmt1 | |
| Lenovo Legion Pro 5 16IRX9 G9 | |
| Lenovo Legion Pro 5 16IRX9 | |
| Lenovo Legion 5 16IRX G9 | |
| Media Intel Core i7-14700HX (5641 - 7041, n=7) | |
| SCHENKER XMG Core 15 (M24) | |
| Media della classe Gaming (4199 - 7573, n=149, ultimi 2 anni) | |
| Dell G16, i7-13650HX, RTX 4060 | |
| HP Victus 16 (2024) | |
| Geekbench 6.4 / Multi-Core | |
| Lenovo Legion Pro 5 16IRX9 | |
| Lenovo Legion Pro 5 16IRX9 G9 | |
| Media Intel Core i7-14700HX (14807 - 17562, n=7) | |
| Lenovo Legion 5 16IRX G9 | |
| HP Victus 16 (2024) | |
| Media della classe Gaming (5340 - 21668, n=119, ultimi 2 anni) | |
| SCHENKER XMG Core 15 (M24) | |
| Dell G16, i7-13650HX, RTX 4060 | |
| Geekbench 6.4 / Single-Core | |
| Lenovo Legion Pro 5 16IRX9 | |
| Lenovo Legion Pro 5 16IRX9 G9 | |
| Media Intel Core i7-14700HX (2378 - 2975, n=7) | |
| Lenovo Legion 5 16IRX G9 | |
| SCHENKER XMG Core 15 (M24) | |
| Media della classe Gaming (1490 - 3219, n=119, ultimi 2 anni) | |
| Dell G16, i7-13650HX, RTX 4060 | |
| HP Victus 16 (2024) | |
| Geekbench 5.5 / Multi-Core | |
| Lenovo Legion Pro 5 16IRX9 | |
| Lenovo Legion Pro 5 16IRX9 G9 | |
| Media Intel Core i7-14700HX (15705 - 19597, n=7) | |
| Lenovo Legion 5 16IRX G9 | |
| HP Victus 16 (2024) | |
| Media della classe Gaming (4557 - 25855, n=148, ultimi 2 anni) | |
| SCHENKER XMG Core 15 (M24) | |
| Dell G16, i7-13650HX, RTX 4060 | |
| Geekbench 5.5 / Single-Core | |
| Lenovo Legion Pro 5 16IRX9 G9 | |
| Lenovo Legion Pro 5 16IRX9 | |
| Media Intel Core i7-14700HX (1700 - 2133, n=7) | |
| SCHENKER XMG Core 15 (M24) | |
| Lenovo Legion 5 16IRX G9 | |
| Media della classe Gaming (986 - 2423, n=148, ultimi 2 anni) | |
| Dell G16, i7-13650HX, RTX 4060 | |
| HP Victus 16 (2024) | |
| HWBOT x265 Benchmark v2.2 / 4k Preset | |
| Lenovo Legion Pro 5 16IRX9 | |
| Lenovo Legion Pro 5 16IRX9 G9 | |
| Lenovo Legion 5 16IRX G9 | |
| Media Intel Core i7-14700HX (22 - 27.4, n=7) | |
| Media della classe Gaming (6.72 - 42.9, n=148, ultimi 2 anni) | |
| SCHENKER XMG Core 15 (M24) | |
| HP Victus 16 (2024) | |
| Dell G16, i7-13650HX, RTX 4060 | |
| LibreOffice / 20 Documents To PDF | |
| HP Victus 16 (2024) | |
| Dell G16, i7-13650HX, RTX 4060 | |
| Lenovo Legion Pro 5 16IRX9 G9 | |
| SCHENKER XMG Core 15 (M24) | |
| Media della classe Gaming (19 - 96.6, n=147, ultimi 2 anni) | |
| Media Intel Core i7-14700HX (41.9 - 55.3, n=7) | |
| Lenovo Legion 5 16IRX G9 | |
| Lenovo Legion Pro 5 16IRX9 | |
| R Benchmark 2.5 / Overall mean | |
| HP Victus 16 (2024) | |
| Media della classe Gaming (0.3609 - 0.759, n=150, ultimi 2 anni) | |
| SCHENKER XMG Core 15 (M24) | |
| Dell G16, i7-13650HX, RTX 4060 | |
| Dell G16, i7-13650HX, RTX 4060 | |
| Lenovo Legion 5 16IRX G9 | |
| Media Intel Core i7-14700HX (0.3821 - 0.4896, n=7) | |
| Lenovo Legion Pro 5 16IRX9 G9 | |
| Lenovo Legion Pro 5 16IRX9 | |
* ... Meglio usare valori piccoli
AIDA64: FP32 Ray-Trace | FPU Julia | CPU SHA3 | CPU Queen | FPU SinJulia | FPU Mandel | CPU AES | CPU ZLib | FP64 Ray-Trace | CPU PhotoWorxx
| Performance Rating | |
| Lenovo Legion Pro 5 16IRX9 | |
| Lenovo Legion Pro 5 16IRX9 G9 | |
| SCHENKER XMG Core 15 (M24) | |
| Media Intel Core i7-14700HX | |
| Media della classe Gaming | |
| Lenovo Legion 5 16IRX G9 | |
| Dell G16, i7-13650HX, RTX 4060 | |
| HP Victus 16 (2024) | |
| AIDA64 / FP32 Ray-Trace | |
| SCHENKER XMG Core 15 (M24) | |
| Lenovo Legion Pro 5 16IRX9 | |
| Lenovo Legion Pro 5 16IRX9 G9 | |
| Media della classe Gaming (4986 - 81639, n=147, ultimi 2 anni) | |
| Media Intel Core i7-14700HX (16932 - 23676, n=7) | |
| Lenovo Legion 5 16IRX G9 | |
| Dell G16, i7-13650HX, RTX 4060 | |
| HP Victus 16 (2024) | |
| AIDA64 / FPU Julia | |
| Lenovo Legion Pro 5 16IRX9 | |
| SCHENKER XMG Core 15 (M24) | |
| Lenovo Legion Pro 5 16IRX9 G9 | |
| Media Intel Core i7-14700HX (86338 - 116556, n=7) | |
| Media della classe Gaming (25360 - 252486, n=147, ultimi 2 anni) | |
| Lenovo Legion 5 16IRX G9 | |
| Dell G16, i7-13650HX, RTX 4060 | |
| HP Victus 16 (2024) | |
| AIDA64 / CPU SHA3 | |
| Lenovo Legion Pro 5 16IRX9 | |
| Lenovo Legion Pro 5 16IRX9 G9 | |
| SCHENKER XMG Core 15 (M24) | |
| Media Intel Core i7-14700HX (4008 - 5567, n=7) | |
| Media della classe Gaming (1339 - 10389, n=147, ultimi 2 anni) | |
| Dell G16, i7-13650HX, RTX 4060 | |
| Lenovo Legion 5 16IRX G9 | |
| HP Victus 16 (2024) | |
| AIDA64 / CPU Queen | |
| Lenovo Legion Pro 5 16IRX9 G9 | |
| Lenovo Legion Pro 5 16IRX9 | |
| Media Intel Core i7-14700HX (129836 - 152200, n=7) | |
| HP Victus 16 (2024) | |
| SCHENKER XMG Core 15 (M24) | |
| Media della classe Gaming (50699 - 200651, n=147, ultimi 2 anni) | |
| Dell G16, i7-13650HX, RTX 4060 | |
| Lenovo Legion 5 16IRX G9 | |
| AIDA64 / FPU SinJulia | |
| SCHENKER XMG Core 15 (M24) | |
| Lenovo Legion Pro 5 16IRX9 | |
| Lenovo Legion Pro 5 16IRX9 G9 | |
| Media Intel Core i7-14700HX (11704 - 14434, n=7) | |
| Media della classe Gaming (4800 - 32988, n=147, ultimi 2 anni) | |
| Lenovo Legion 5 16IRX G9 | |
| HP Victus 16 (2024) | |
| Dell G16, i7-13650HX, RTX 4060 | |
| AIDA64 / FPU Mandel | |
| SCHENKER XMG Core 15 (M24) | |
| Lenovo Legion Pro 5 16IRX9 | |
| Lenovo Legion Pro 5 16IRX9 G9 | |
| Media della classe Gaming (12321 - 134044, n=147, ultimi 2 anni) | |
| Media Intel Core i7-14700HX (42125 - 58380, n=7) | |
| Lenovo Legion 5 16IRX G9 | |
| Dell G16, i7-13650HX, RTX 4060 | |
| HP Victus 16 (2024) | |
| AIDA64 / CPU AES | |
| Lenovo Legion Pro 5 16IRX9 | |
| Lenovo Legion Pro 5 16IRX9 G9 | |
| Media della classe Gaming (19065 - 328679, n=147, ultimi 2 anni) | |
| Media Intel Core i7-14700HX (82161 - 113157, n=7) | |
| SCHENKER XMG Core 15 (M24) | |
| Lenovo Legion 5 16IRX G9 | |
| Dell G16, i7-13650HX, RTX 4060 | |
| HP Victus 16 (2024) | |
| AIDA64 / CPU ZLib | |
| Lenovo Legion Pro 5 16IRX9 | |
| Lenovo Legion Pro 5 16IRX9 G9 | |
| Media Intel Core i7-14700HX (1177 - 1682, n=7) | |
| Media della classe Gaming (373 - 2531, n=147, ultimi 2 anni) | |
| Lenovo Legion 5 16IRX G9 | |
| Dell G16, i7-13650HX, RTX 4060 | |
| HP Victus 16 (2024) | |
| SCHENKER XMG Core 15 (M24) | |
| AIDA64 / FP64 Ray-Trace | |
| SCHENKER XMG Core 15 (M24) | |
| Lenovo Legion Pro 5 16IRX9 | |
| Lenovo Legion Pro 5 16IRX9 G9 | |
| Media della classe Gaming (2540 - 43430, n=147, ultimi 2 anni) | |
| Media Intel Core i7-14700HX (9029 - 12928, n=7) | |
| Dell G16, i7-13650HX, RTX 4060 | |
| Lenovo Legion 5 16IRX G9 | |
| HP Victus 16 (2024) | |
| AIDA64 / CPU PhotoWorxx | |
| Lenovo Legion Pro 5 16IRX9 | |
| Lenovo Legion Pro 5 16IRX9 G9 | |
| Media Intel Core i7-14700HX (39151 - 49671, n=7) | |
| SCHENKER XMG Core 15 (M24) | |
| Media della classe Gaming (10805 - 60161, n=147, ultimi 2 anni) | |
| HP Victus 16 (2024) | |
| Dell G16, i7-13650HX, RTX 4060 | |
| Lenovo Legion 5 16IRX G9 | |
Prestazioni del sistema
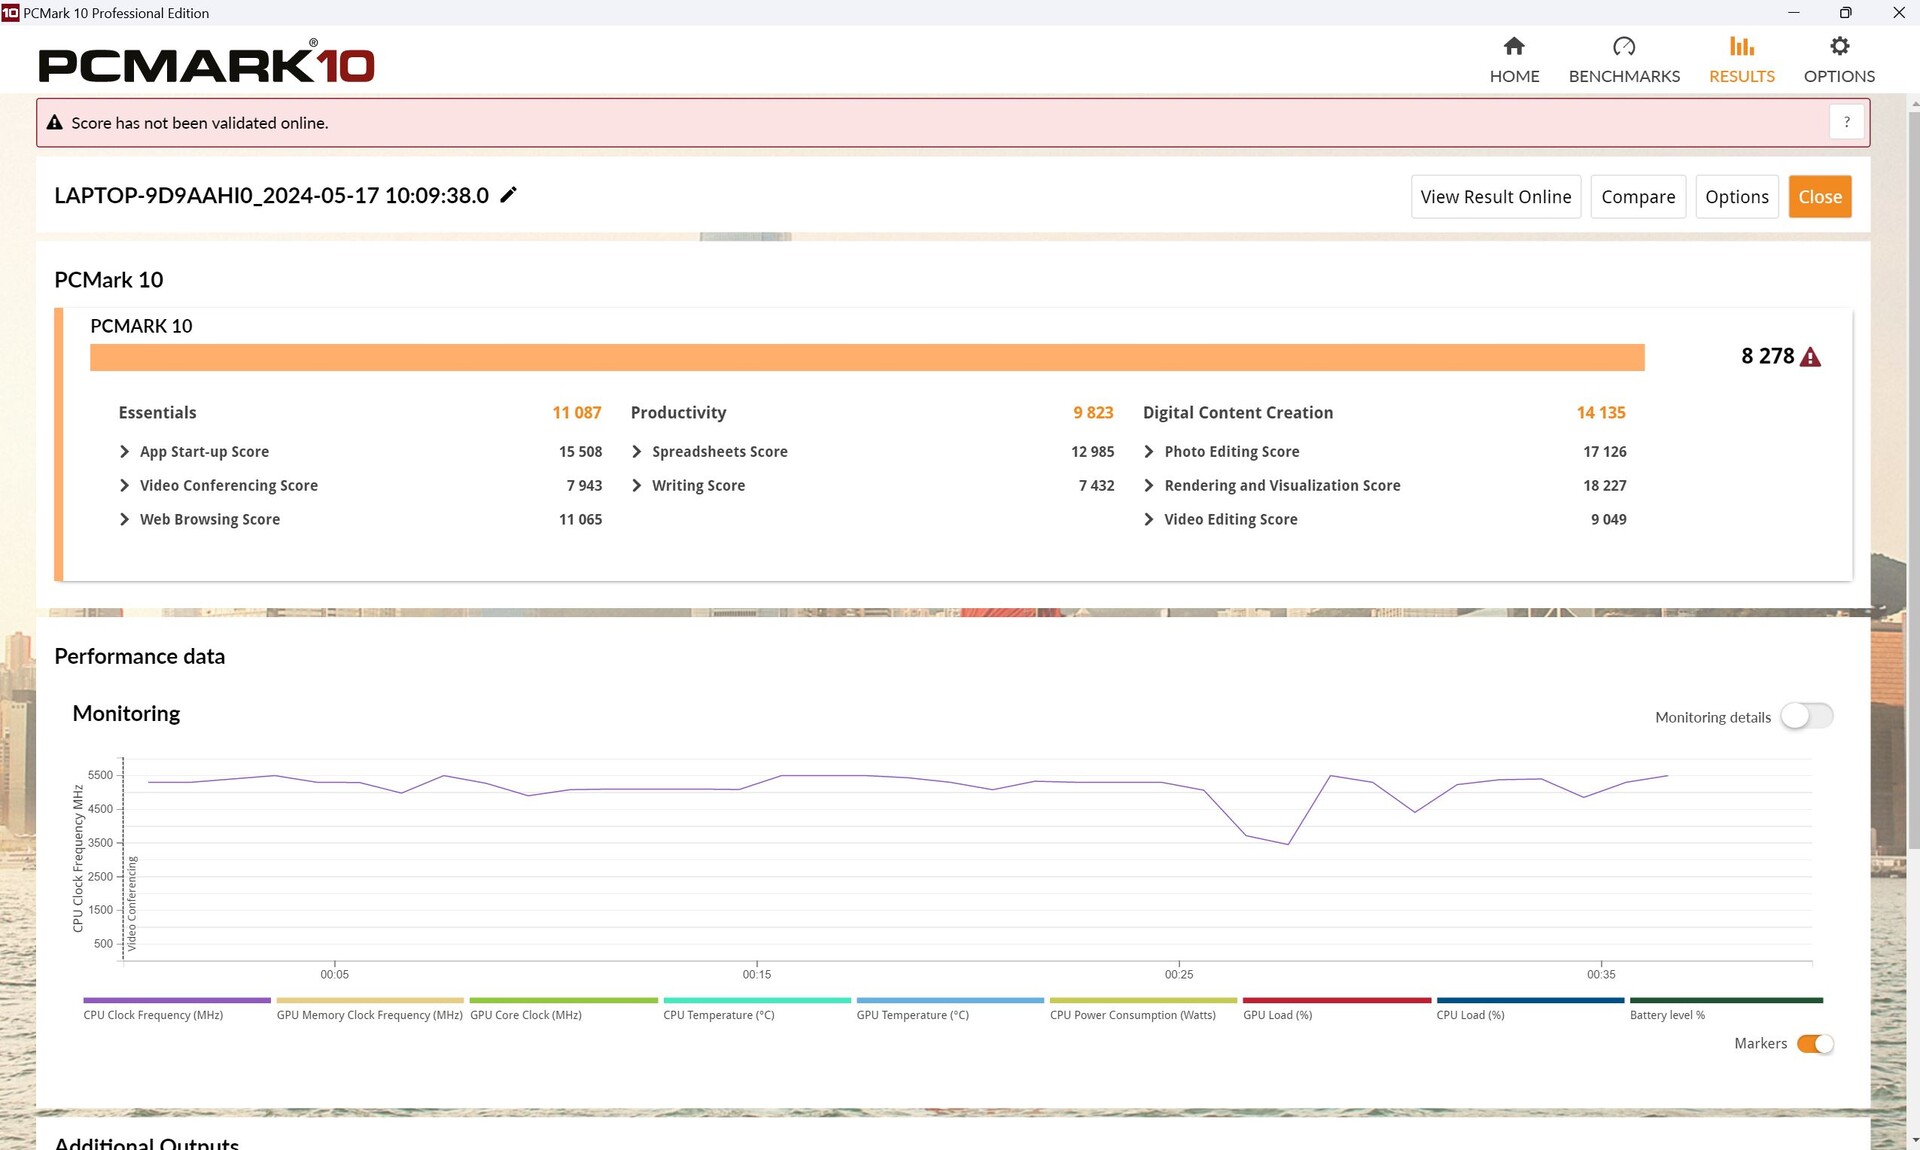
In PCMark 10, il nostro Legion Pro era solo leggermente più debole quando si trattava di produttività, ma per il resto si è sempre piazzato al secondo posto, direttamente dietro al Legion Pro meglio equipaggiato.
In CrossMark, i suoi risultati sono stati ancora una volta particolarmente buoni e il nostro modello di prova è riuscito persino a battere la versione "migliore" di se stesso.
CrossMark: Overall | Productivity | Creativity | Responsiveness
WebXPRT 3: Overall
WebXPRT 4: Overall
Mozilla Kraken 1.1: Total
| PCMark 10 / Score | |
| SCHENKER XMG Core 15 (M24) | |
| Lenovo Legion Pro 5 16IRX9 | |
| Lenovo Legion Pro 5 16IRX9 G9 | |
| Media Intel Core i7-14700HX, NVIDIA GeForce RTX 4060 Laptop GPU (7528 - 8278, n=2) | |
| Media della classe Gaming (5776 - 9852, n=133, ultimi 2 anni) | |
| Lenovo Legion 5 16IRX G9 | |
| HP Victus 16 (2024) | |
| Dell G16, i7-13650HX, RTX 4060 | |
| PCMark 10 / Essentials | |
| Lenovo Legion Pro 5 16IRX9 | |
| Lenovo Legion Pro 5 16IRX9 G9 | |
| Media Intel Core i7-14700HX, NVIDIA GeForce RTX 4060 Laptop GPU (10778 - 11087, n=2) | |
| Lenovo Legion 5 16IRX G9 | |
| HP Victus 16 (2024) | |
| Media della classe Gaming (9057 - 12600, n=133, ultimi 2 anni) | |
| SCHENKER XMG Core 15 (M24) | |
| Dell G16, i7-13650HX, RTX 4060 | |
| PCMark 10 / Productivity | |
| SCHENKER XMG Core 15 (M24) | |
| Lenovo Legion Pro 5 16IRX9 | |
| Dell G16, i7-13650HX, RTX 4060 | |
| HP Victus 16 (2024) | |
| Media della classe Gaming (6662 - 14612, n=133, ultimi 2 anni) | |
| Media Intel Core i7-14700HX, NVIDIA GeForce RTX 4060 Laptop GPU (9823 - 9910, n=2) | |
| Lenovo Legion Pro 5 16IRX9 G9 | |
| Lenovo Legion 5 16IRX G9 | |
| PCMark 10 / Digital Content Creation | |
| Lenovo Legion Pro 5 16IRX9 | |
| Lenovo Legion Pro 5 16IRX9 G9 | |
| SCHENKER XMG Core 15 (M24) | |
| Media Intel Core i7-14700HX, NVIDIA GeForce RTX 4060 Laptop GPU (10841 - 14135, n=2) | |
| Media della classe Gaming (6807 - 18475, n=133, ultimi 2 anni) | |
| Lenovo Legion 5 16IRX G9 | |
| Dell G16, i7-13650HX, RTX 4060 | |
| HP Victus 16 (2024) | |
| CrossMark / Overall | |
| Lenovo Legion Pro 5 16IRX9 G9 | |
| Lenovo Legion 5 16IRX G9 | |
| Media Intel Core i7-14700HX, NVIDIA GeForce RTX 4060 Laptop GPU (1923 - 2132, n=2) | |
| Lenovo Legion Pro 5 16IRX9 | |
| HP Victus 16 (2024) | |
| Media della classe Gaming (1247 - 2344, n=114, ultimi 2 anni) | |
| SCHENKER XMG Core 15 (M24) | |
| Dell G16, i7-13650HX, RTX 4060 | |
| CrossMark / Productivity | |
| Lenovo Legion Pro 5 16IRX9 G9 | |
| Lenovo Legion 5 16IRX G9 | |
| Media Intel Core i7-14700HX, NVIDIA GeForce RTX 4060 Laptop GPU (1782 - 1973, n=2) | |
| Lenovo Legion Pro 5 16IRX9 | |
| Media della classe Gaming (1299 - 2204, n=114, ultimi 2 anni) | |
| SCHENKER XMG Core 15 (M24) | |
| HP Victus 16 (2024) | |
| Dell G16, i7-13650HX, RTX 4060 | |
| CrossMark / Creativity | |
| Lenovo Legion Pro 5 16IRX9 G9 | |
| Lenovo Legion 5 16IRX G9 | |
| Lenovo Legion Pro 5 16IRX9 | |
| Media Intel Core i7-14700HX, NVIDIA GeForce RTX 4060 Laptop GPU (2107 - 2399, n=2) | |
| HP Victus 16 (2024) | |
| SCHENKER XMG Core 15 (M24) | |
| Media della classe Gaming (1275 - 2660, n=114, ultimi 2 anni) | |
| Dell G16, i7-13650HX, RTX 4060 | |
| CrossMark / Responsiveness | |
| Lenovo Legion 5 16IRX G9 | |
| Lenovo Legion Pro 5 16IRX9 G9 | |
| Media Intel Core i7-14700HX, NVIDIA GeForce RTX 4060 Laptop GPU (1835 - 1885, n=2) | |
| HP Victus 16 (2024) | |
| Lenovo Legion Pro 5 16IRX9 | |
| Media della classe Gaming (1030 - 2330, n=114, ultimi 2 anni) | |
| Dell G16, i7-13650HX, RTX 4060 | |
| SCHENKER XMG Core 15 (M24) | |
| WebXPRT 3 / Overall | |
| Lenovo Legion Pro 5 16IRX9 | |
| Lenovo Legion 5 16IRX G9 | |
| SCHENKER XMG Core 15 (M24) | |
| Lenovo Legion Pro 5 16IRX9 G9 | |
| Media della classe Gaming (215 - 480, n=127, ultimi 2 anni) | |
| Media Intel Core i7-14700HX, NVIDIA GeForce RTX 4060 Laptop GPU (276 - 301, n=2) | |
| HP Victus 16 (2024) | |
| Dell G16, i7-13650HX, RTX 4060 | |
| WebXPRT 4 / Overall | |
| Lenovo Legion Pro 5 16IRX9 | |
| Lenovo Legion 5 16IRX G9 | |
| Lenovo Legion Pro 5 16IRX9 G9 | |
| Media della classe Gaming (176.4 - 335, n=115, ultimi 2 anni) | |
| SCHENKER XMG Core 15 (M24) | |
| Media Intel Core i7-14700HX, NVIDIA GeForce RTX 4060 Laptop GPU (251 - 273, n=2) | |
| HP Victus 16 (2024) | |
| Mozilla Kraken 1.1 / Total | |
| HP Victus 16 (2024) | |
| Dell G16, i7-13650HX, RTX 4060 | |
| Media Intel Core i7-14700HX, NVIDIA GeForce RTX 4060 Laptop GPU (467 - 542, n=2) | |
| Media della classe Gaming (409 - 674, n=139, ultimi 2 anni) | |
| SCHENKER XMG Core 15 (M24) | |
| Lenovo Legion 5 16IRX G9 | |
| Lenovo Legion Pro 5 16IRX9 G9 | |
| Lenovo Legion Pro 5 16IRX9 | |
* ... Meglio usare valori piccoli
| PCMark 10 Score | 8278 punti | |
Aiuto | ||
| AIDA64 / Memory Copy | |
| Lenovo Legion Pro 5 16IRX9 | |
| Lenovo Legion Pro 5 16IRX9 G9 | |
| Media Intel Core i7-14700HX (63949 - 78742, n=7) | |
| SCHENKER XMG Core 15 (M24) | |
| HP Victus 16 (2024) | |
| Media della classe Gaming (21750 - 97515, n=147, ultimi 2 anni) | |
| Lenovo Legion 5 16IRX G9 | |
| Dell G16, i7-13650HX, RTX 4060 | |
| AIDA64 / Memory Read | |
| Lenovo Legion Pro 5 16IRX9 | |
| Lenovo Legion Pro 5 16IRX9 G9 | |
| Media Intel Core i7-14700HX (68593 - 86175, n=7) | |
| HP Victus 16 (2024) | |
| Lenovo Legion 5 16IRX G9 | |
| Media della classe Gaming (22956 - 102937, n=147, ultimi 2 anni) | |
| Dell G16, i7-13650HX, RTX 4060 | |
| SCHENKER XMG Core 15 (M24) | |
| AIDA64 / Memory Write | |
| SCHENKER XMG Core 15 (M24) | |
| Lenovo Legion Pro 5 16IRX9 | |
| Lenovo Legion Pro 5 16IRX9 G9 | |
| Media Intel Core i7-14700HX (64033 - 76689, n=7) | |
| Media della classe Gaming (22297 - 108954, n=147, ultimi 2 anni) | |
| HP Victus 16 (2024) | |
| Dell G16, i7-13650HX, RTX 4060 | |
| Lenovo Legion 5 16IRX G9 | |
| AIDA64 / Memory Latency | |
| HP Victus 16 (2024) | |
| Media della classe Gaming (59.5 - 259, n=147, ultimi 2 anni) | |
| Dell G16, i7-13650HX, RTX 4060 | |
| Lenovo Legion 5 16IRX G9 | |
| Media Intel Core i7-14700HX (82.7 - 96.4, n=7) | |
| SCHENKER XMG Core 15 (M24) | |
| Lenovo Legion Pro 5 16IRX9 | |
| Lenovo Legion Pro 5 16IRX9 G9 | |
* ... Meglio usare valori piccoli
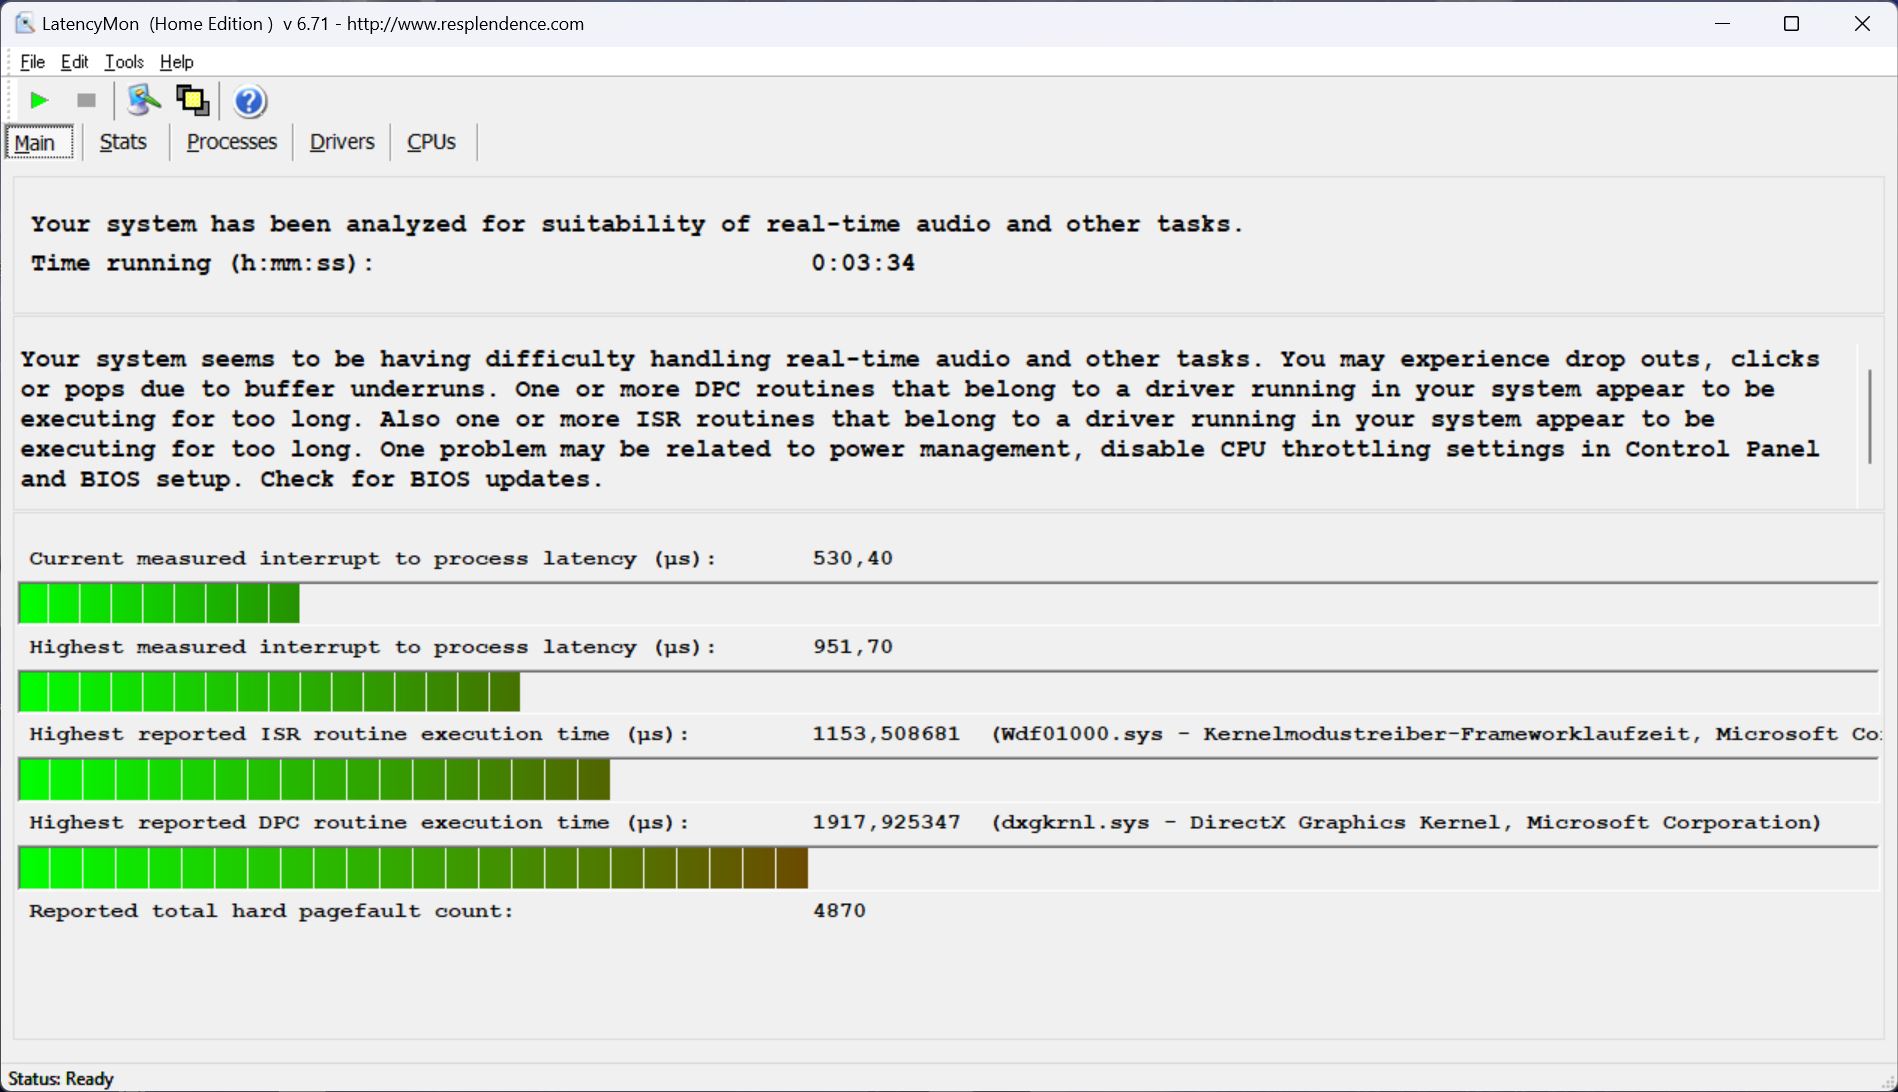
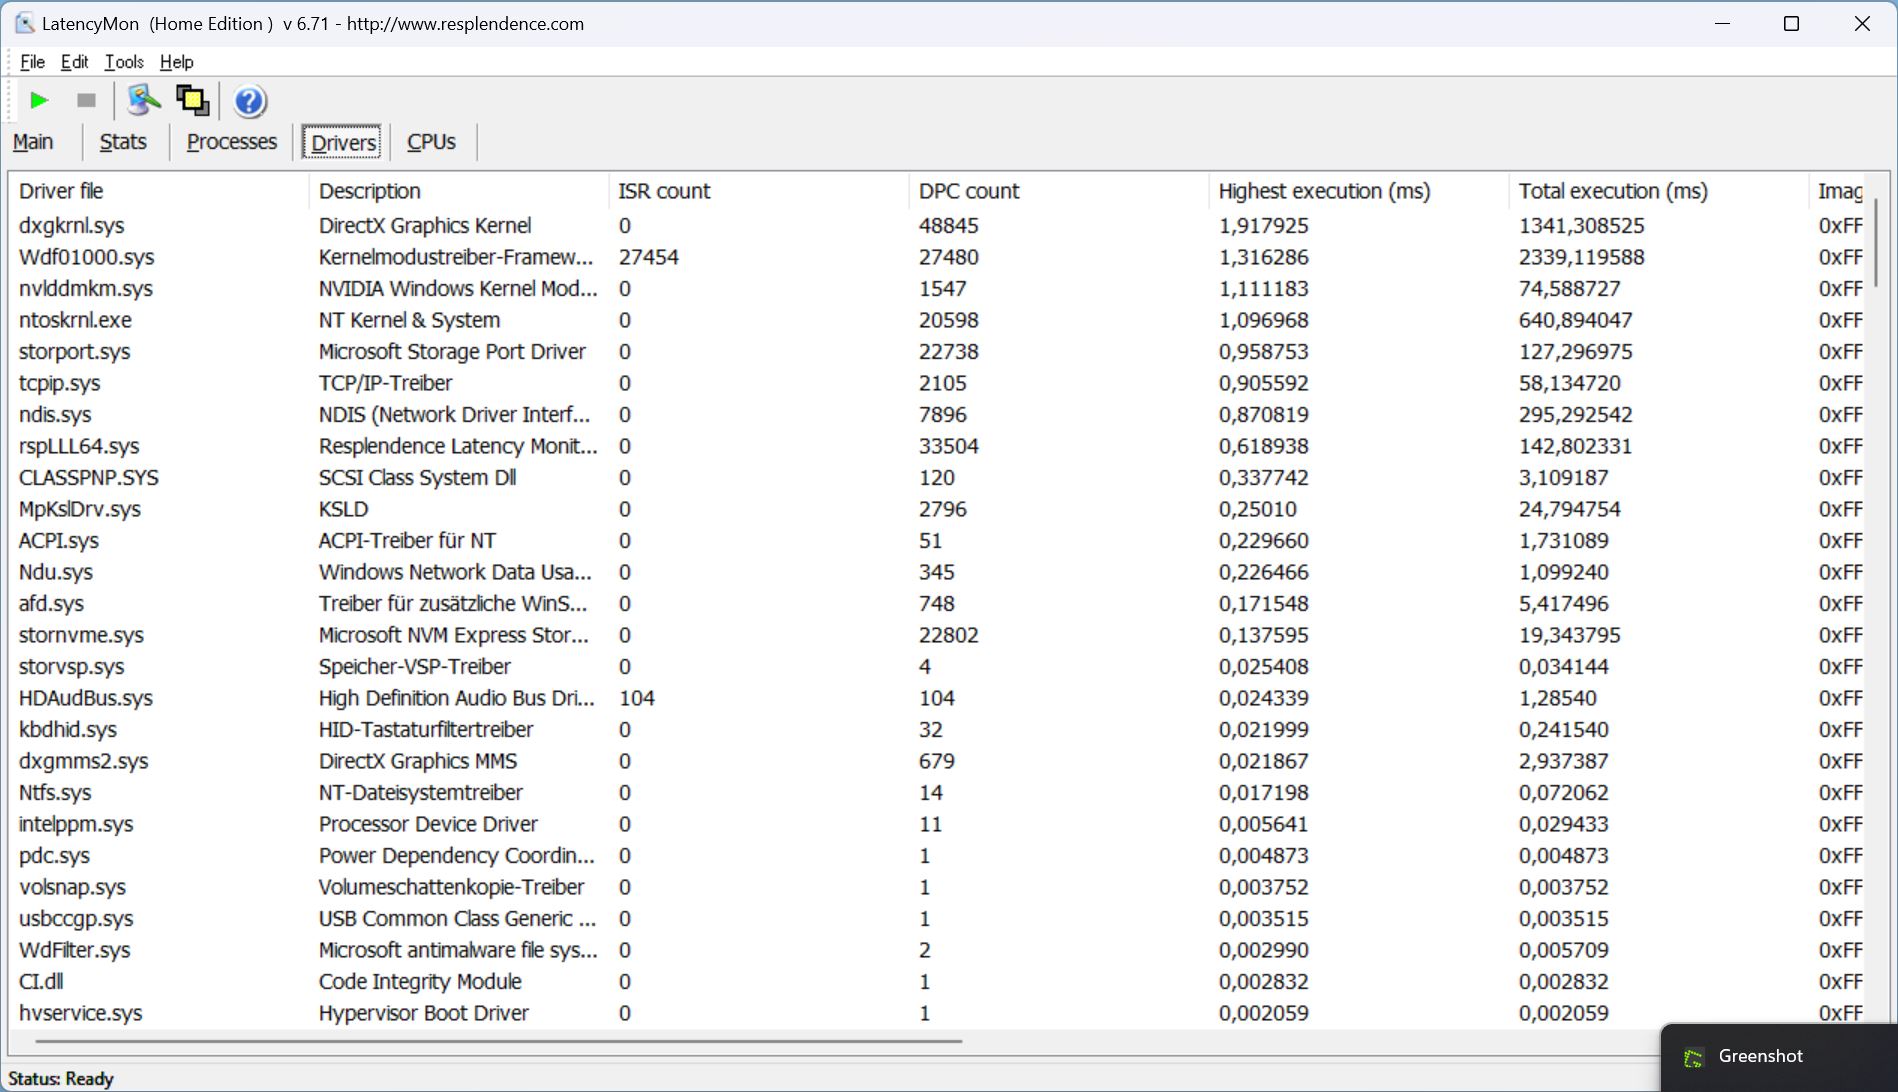
Latenze DPC
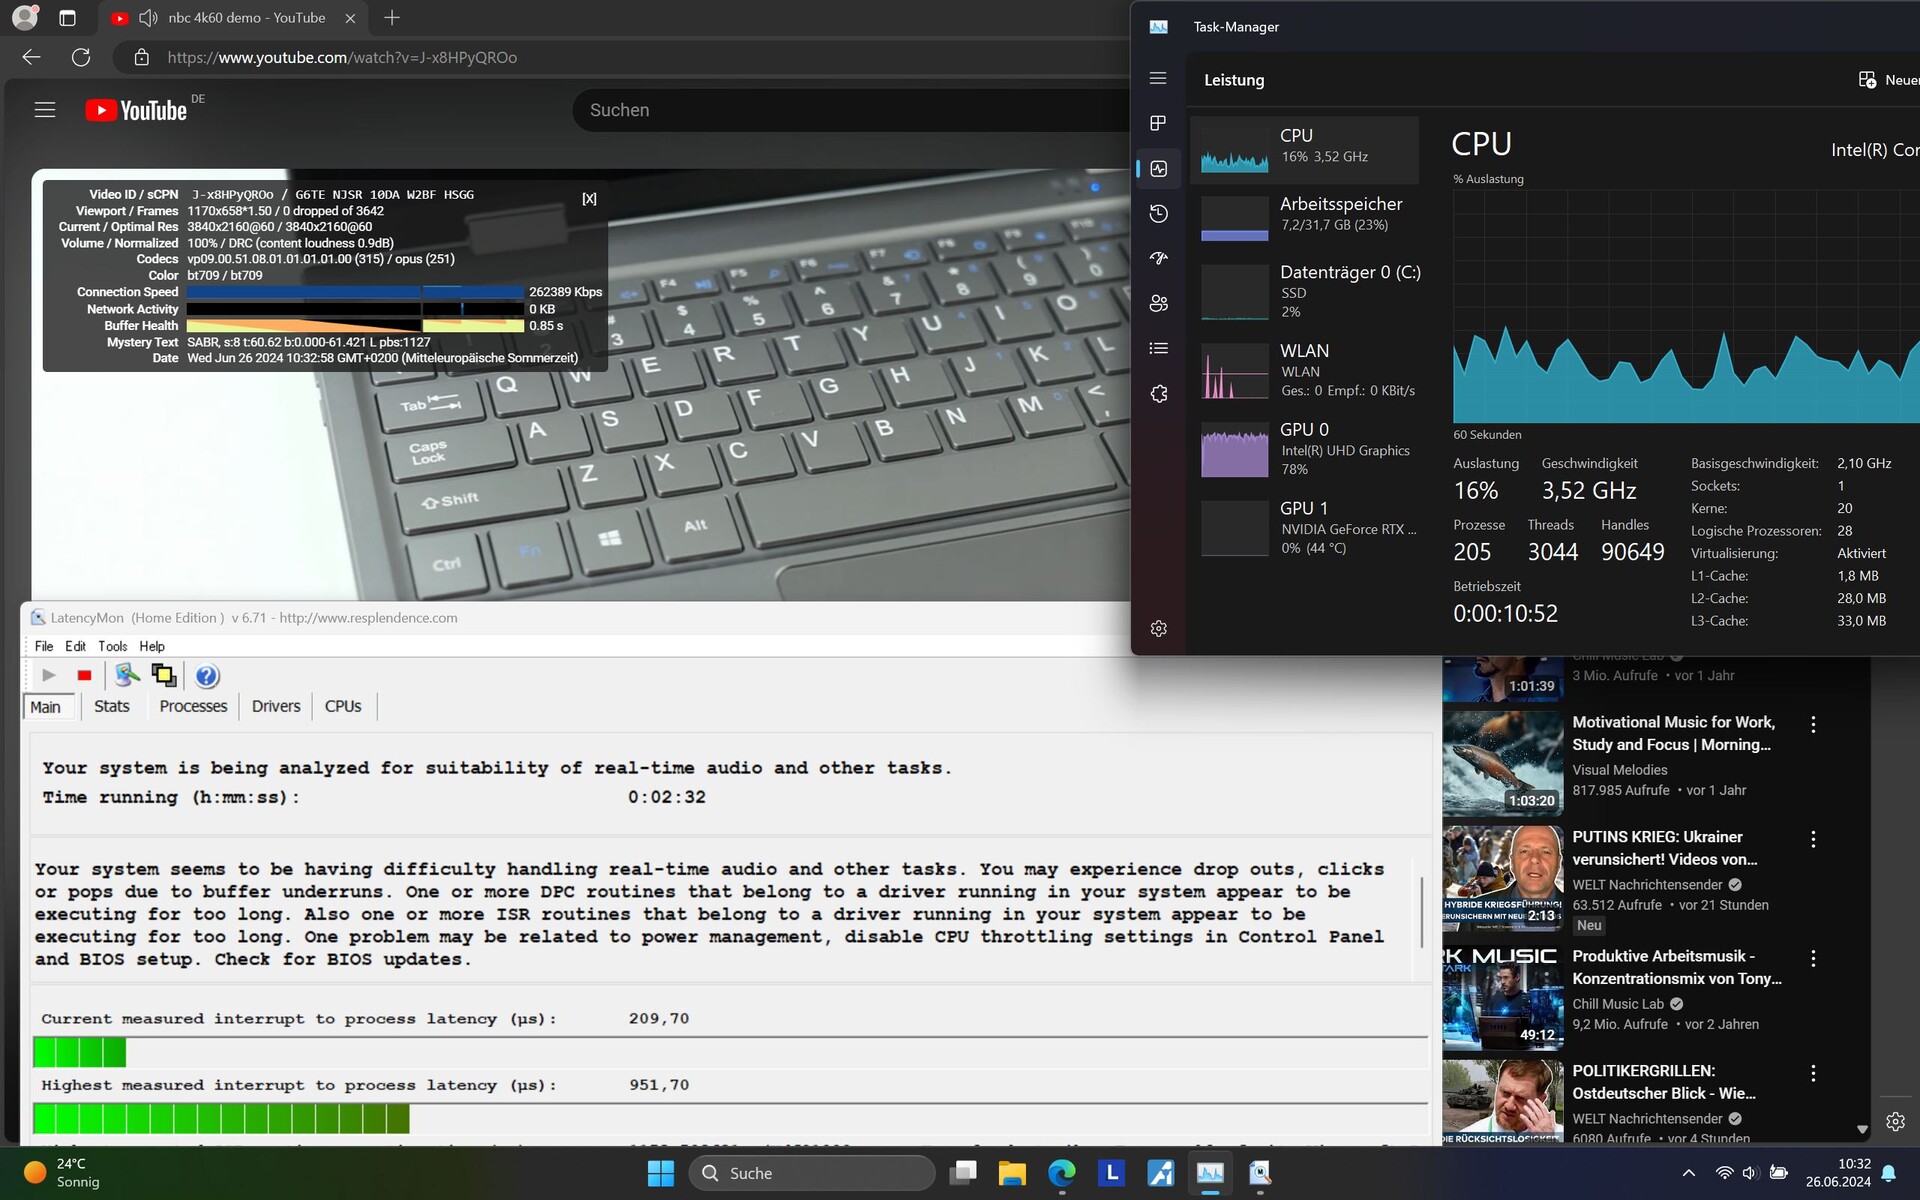
Le prime latenze, più piccole, si sono verificate già all'apertura del browser. Il valore del ritardo è aumentato ancora leggermente quando si sono aperte diverse schede del nostro sito web. Tuttavia, il nostro video YouTube a 4K/60fps è stato riprodotto senza alcun problema o perdita di fotogrammi. Il carico interno della GPU era molto alto, pari al 78%.
| DPC Latencies / LatencyMon - interrupt to process latency (max), Web, Youtube, Prime95 | |
| Lenovo Legion 5 16IRX G9 | |
| SCHENKER XMG Core 15 (M24) | |
| Dell G16, i7-13650HX, RTX 4060 | |
| Lenovo Legion Pro 5 16IRX9 | |
| Lenovo Legion Pro 5 16IRX9 G9 | |
| HP Victus 16 (2024) | |
* ... Meglio usare valori piccoli
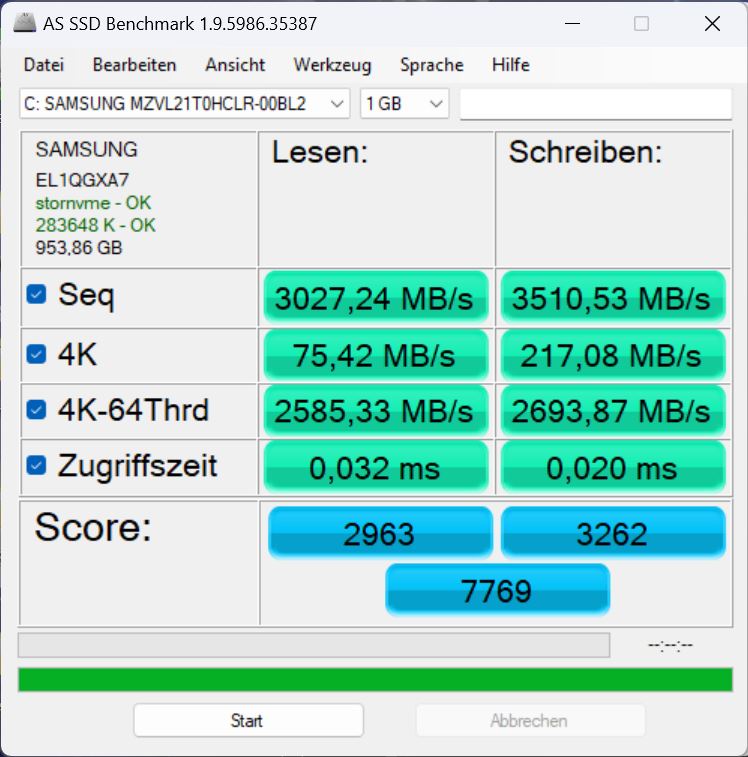
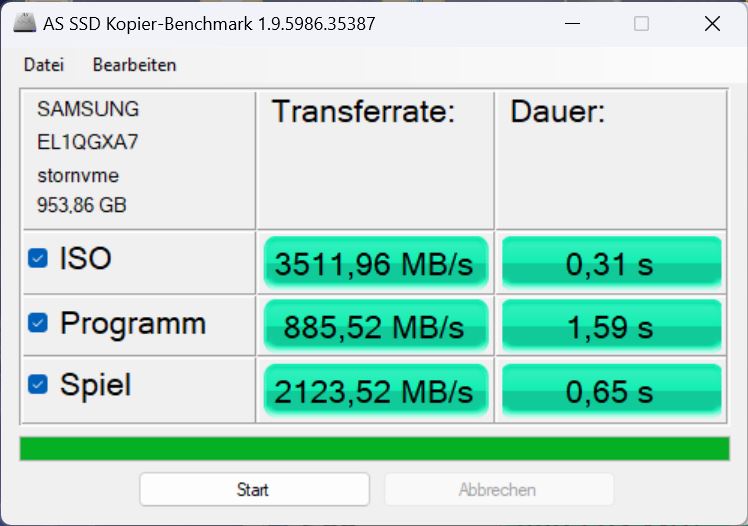
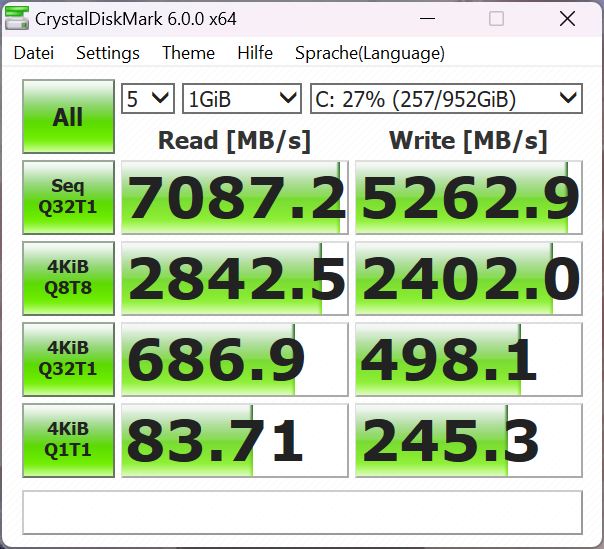
Dispositivo di archiviazione
Lenovo ha installato un veloce SSD PCIe 4 NVMe di Samsung con 1 TB di spazio di archiviazione nel nostro modello, più precisamente una versione OEM del noto 980 Pro. Il modello si posiziona al 14° posto nella nostra Elenco dei migliori SSD e quindi è uno dei dispositivi di archiviazione più veloci nel campo di confronto.
Durante i nostri benchmark, ha ottenuto valori complessivamente buoni, ma proprio come gli SSD degli altri modelli Legion (Pro) 5, non è stato in grado di mantenere le sue prestazioni per un periodo di tempo più lungo ed è stato strozzato termicamente. È un peccato che Lenovo non abbia dotato il portatile di un sistema di raffreddamento migliore e che l'intera serie sia affetta da questo problema.

* ... Meglio usare valori piccoli
Reading continuous performance: DiskSpd Read Loop, Queue Depth 8
Scheda grafica
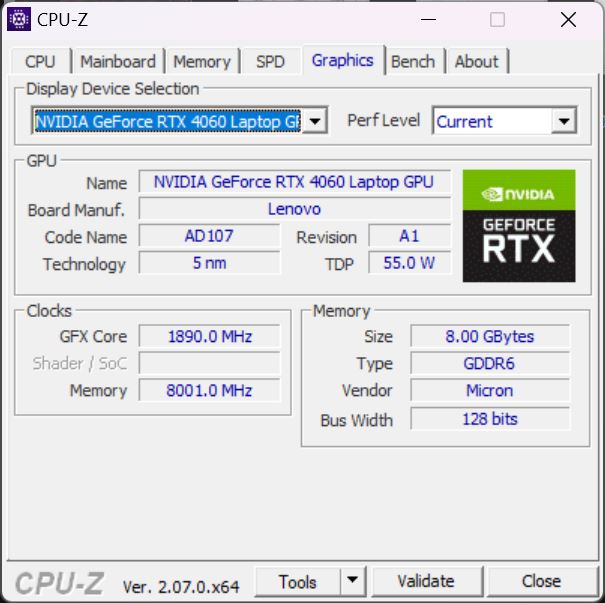
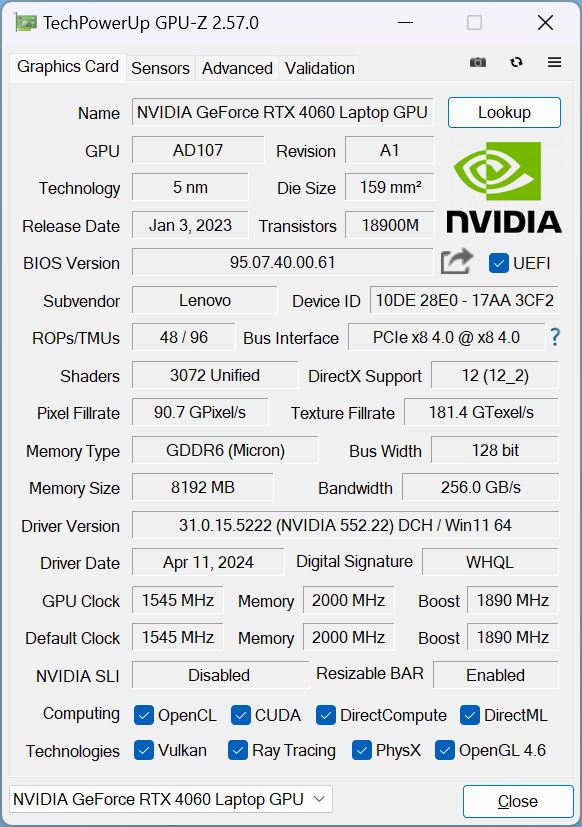
La nostra configurazione è dotata di una Nvidia Geforce RTX 4060 a 140 watt.
Durante i test sintetici di 3DMark, la GPU si è comportata leggermente sopra la media, ma la stessa RTX 4060 è stata leggermente più veloce nei test di Legion 5 senza il suffisso Pro. Il modello Legion Pro 5 con la RTX 4070 e i9-14900HX è stato circa il 20% più veloce in questi test.
In modalità batteria, le sue prestazioni 3D sono diminuite del 23 percento quando ha eseguito ancora una volta Fire Strike.

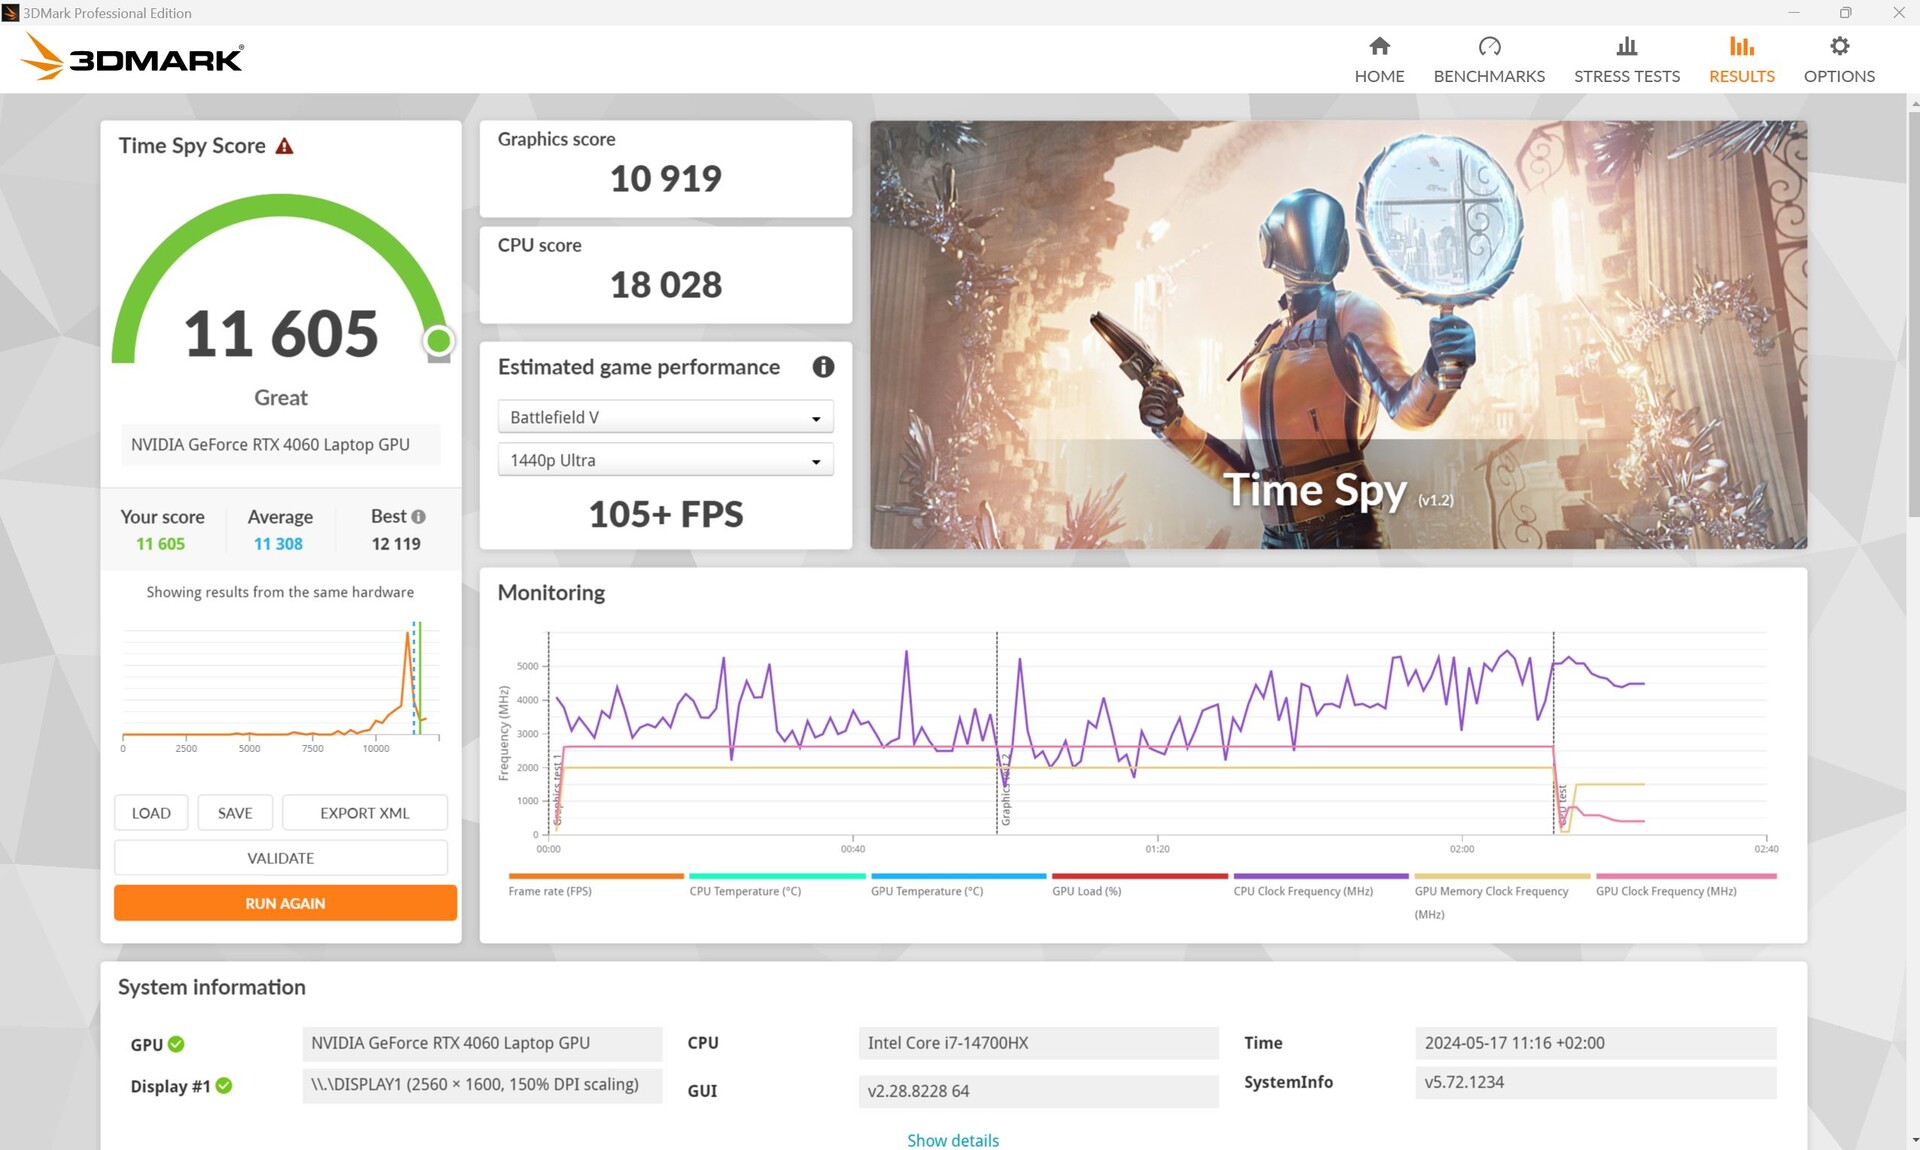
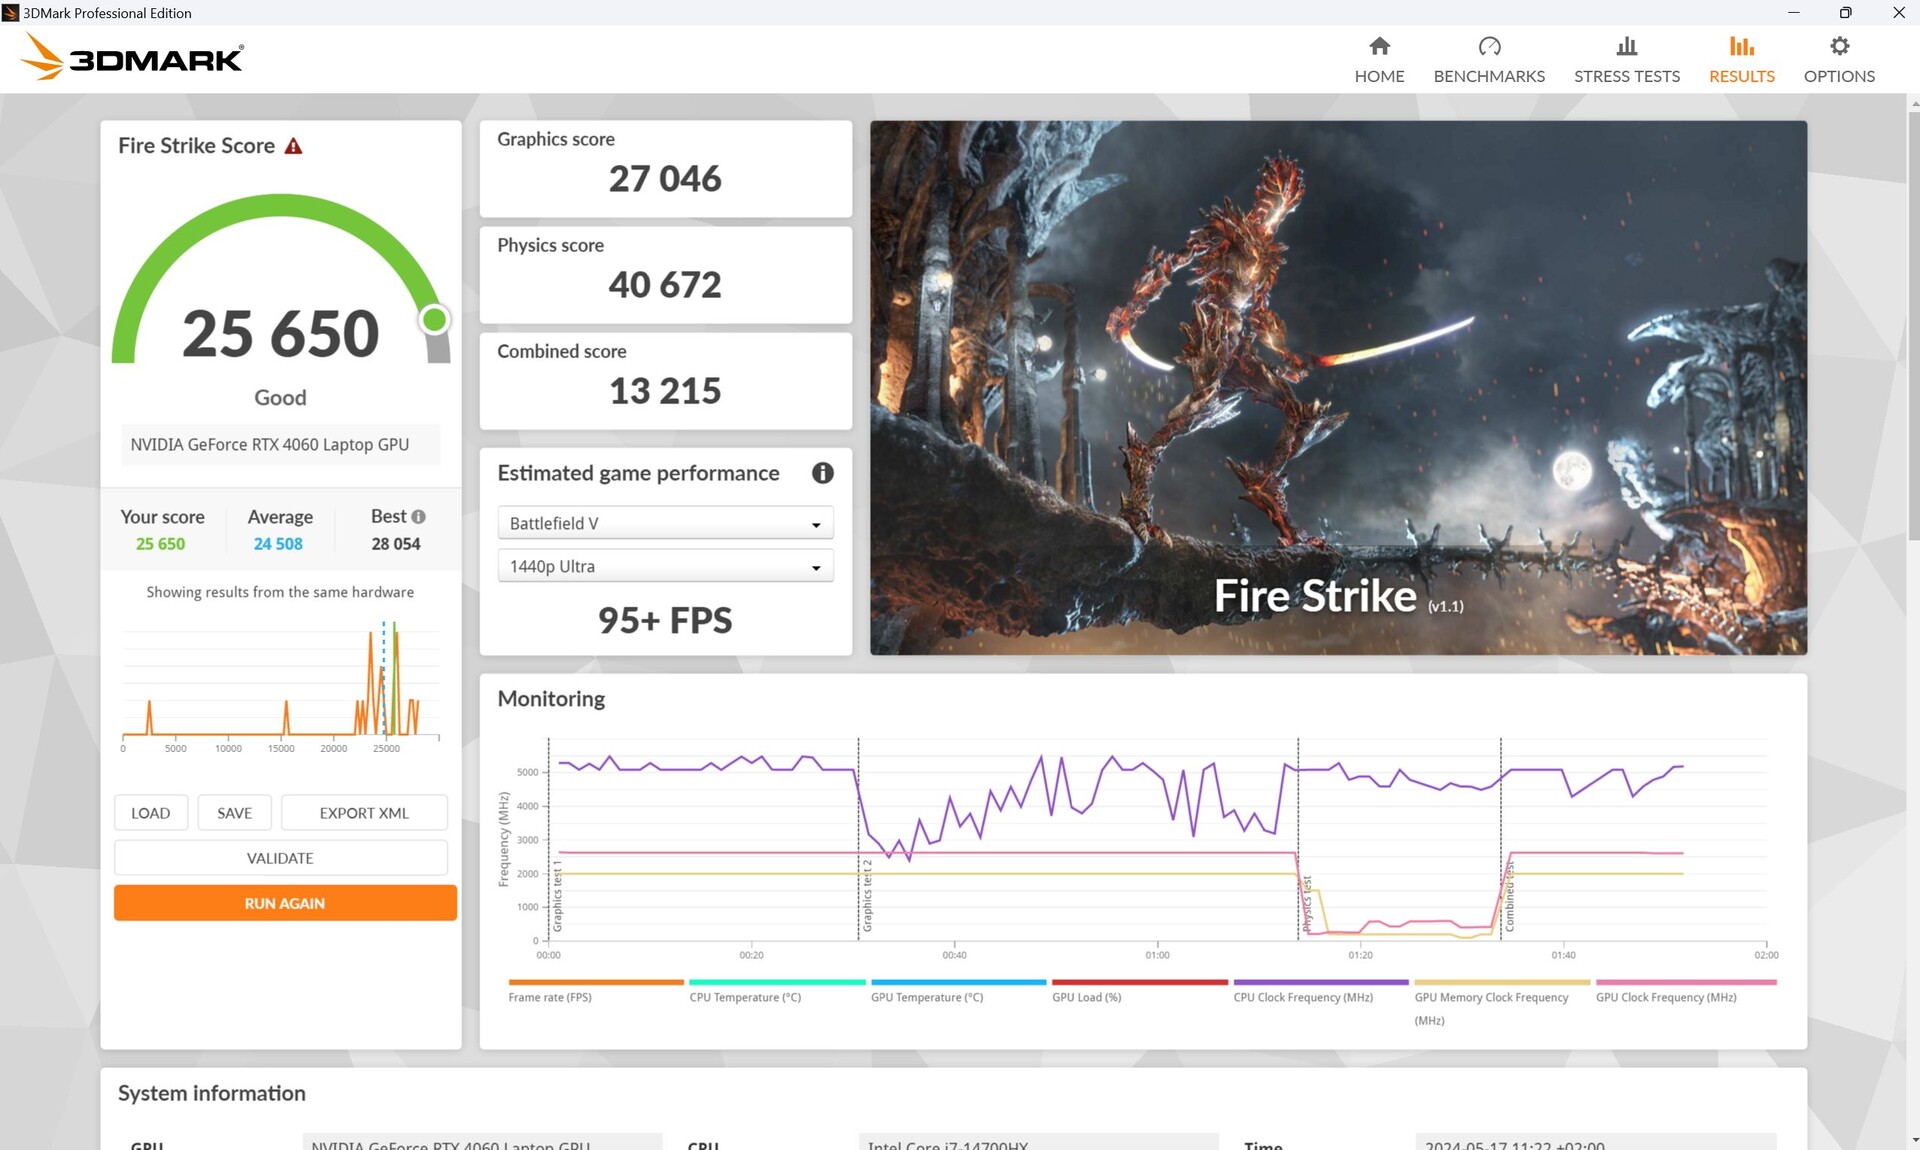
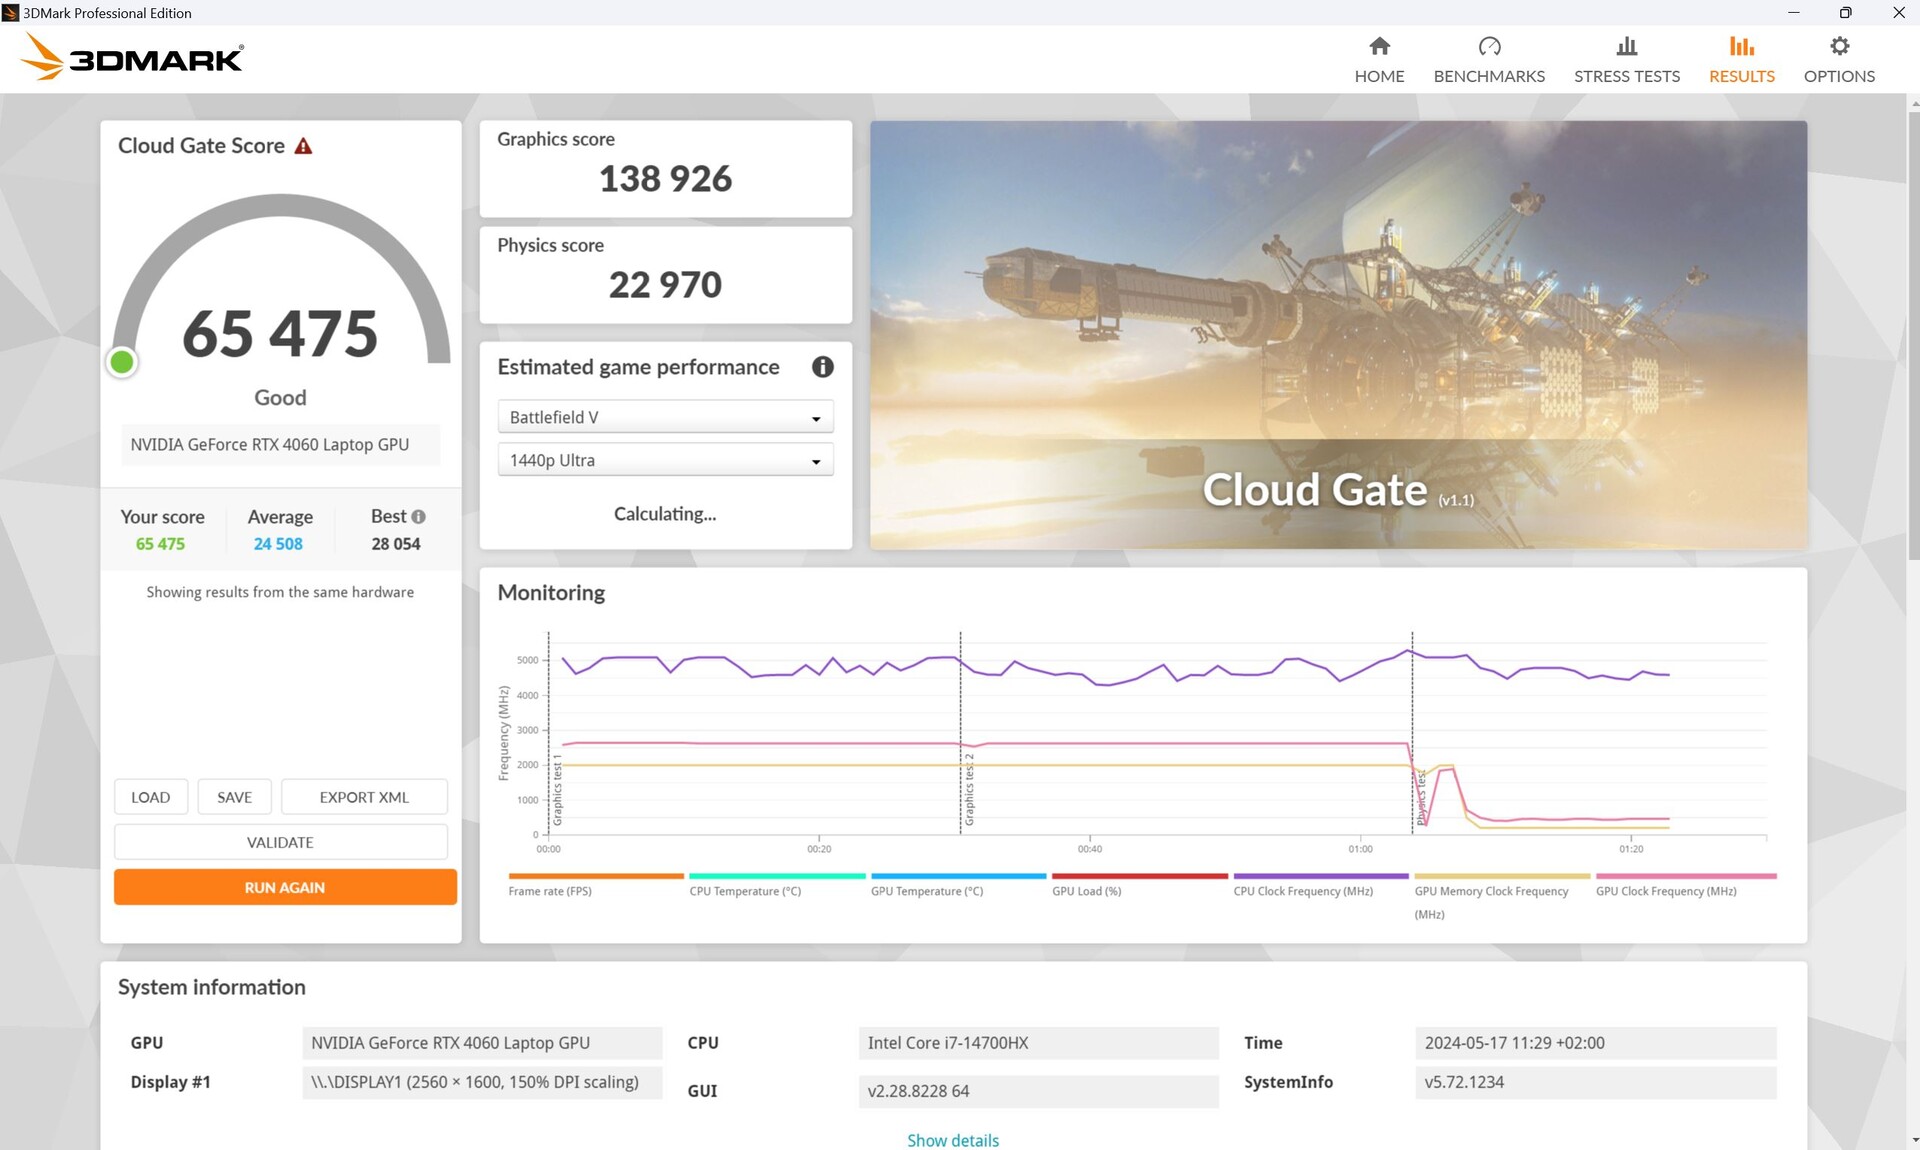
| 3DMark 11 Performance | 33600 punti | |
| 3DMark Cloud Gate Standard Score | 65475 punti | |
| 3DMark Fire Strike Score | 25650 punti | |
| 3DMark Time Spy Score | 11605 punti | |
Aiuto | ||
* ... Meglio usare valori piccoli
Per quanto riguarda i giochi, Legion Pro 5 supera l'intera concorrenza con una RTX 4060 - in particolare Victus con la stessa CPU e GPU che si è piazzato all'ultimo posto, con un punteggio inferiore di 15 punti. La RTX-4070 Legion Pro ha ottenuto solo 10 punti di vantaggio.
In definitiva, tutti i giochi che abbiamo testato possono essere giocati in Full HD con il massimo dei dettagli; in QHD, la frequenza dei fotogrammi può talvolta scivolare al di sotto dei 60 fps quando si eseguono giochi impegnativi, ma anche in questo caso, vengono eseguiti senza problemi.
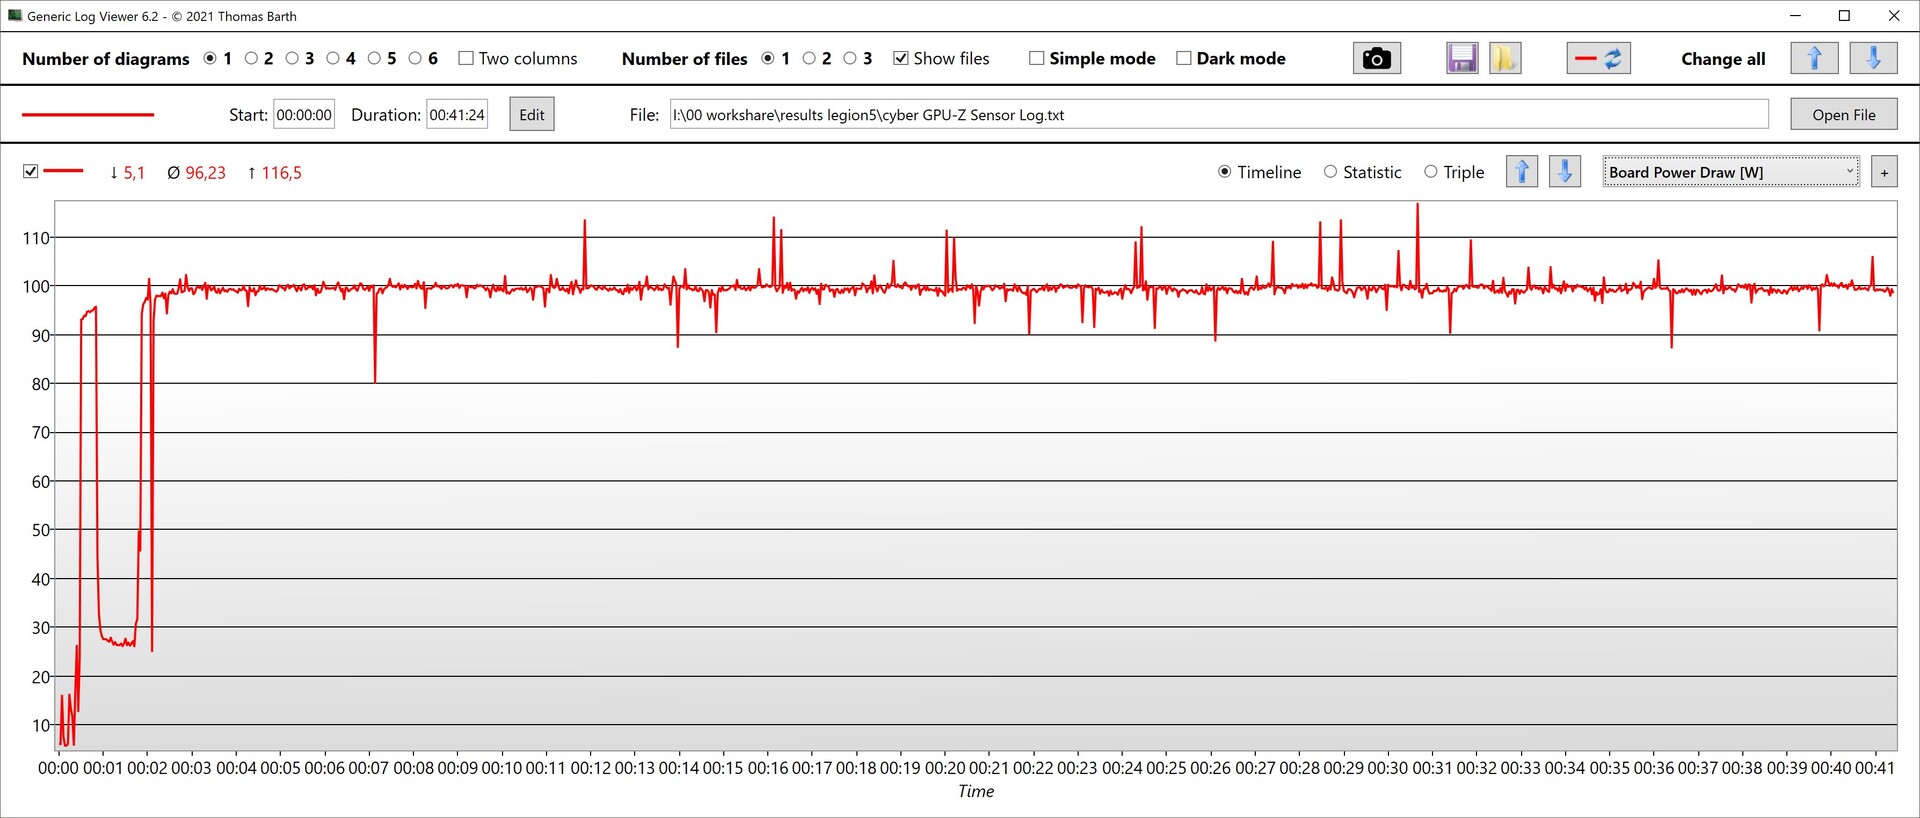
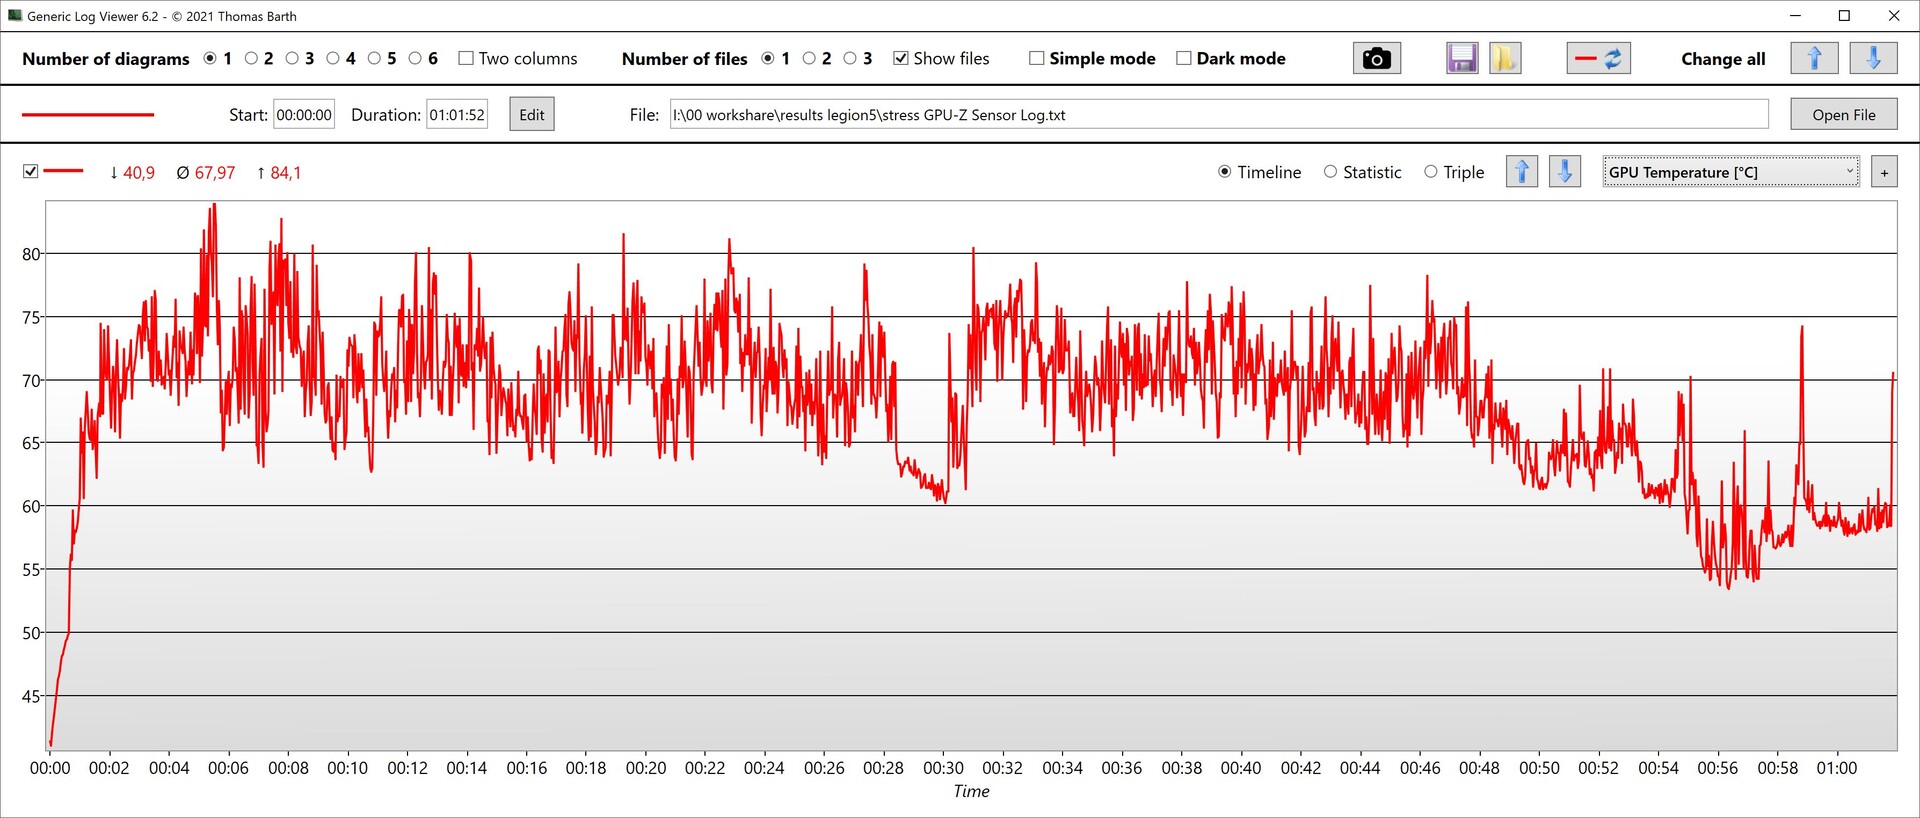
Il nostro test continuo di Cyberpunk 2077 ha rivelato una frequenza di fotogrammi molto costante, senza cali importanti. La GPU ha registrato un clock costante a 2.610 MHz e si è riscaldata fino a 75-79 °C. Il consumo energetico è stato di circa 100 watt.


| The Witcher 3 - 1920x1080 Ultra Graphics & Postprocessing (HBAO+) | |
| Lenovo Legion Pro 5 16IRX9 | |
| Media della classe Gaming (18.4 - 214, n=119, ultimi 2 anni) | |
| Lenovo Legion Pro 5 16IRX9 G9 | |
| SCHENKER XMG Core 15 (M24) | |
| Dell G16, i7-13650HX, RTX 4060 | |
| HP Victus 16 (2024) | |
| Lenovo Legion 5 16IRX G9 | |
| GTA V - 1920x1080 Highest Settings possible AA:4xMSAA + FX AF:16x | |
| Lenovo Legion Pro 5 16IRX9 | |
| Lenovo Legion Pro 5 16IRX9 G9 | |
| Lenovo Legion 5 16IRX G9 | |
| Dell G16, i7-13650HX, RTX 4060 | |
| SCHENKER XMG Core 15 (M24) | |
| Media della classe Gaming (12.1 - 168.2, n=132, ultimi 2 anni) | |
| HP Victus 16 (2024) | |
| Final Fantasy XV Benchmark - 1920x1080 High Quality | |
| Lenovo Legion Pro 5 16IRX9 | |
| Media della classe Gaming (19.2 - 201, n=144, ultimi 2 anni) | |
| SCHENKER XMG Core 15 (M24) | |
| Lenovo Legion 5 16IRX G9 | |
| Lenovo Legion Pro 5 16IRX9 G9 | |
| Dell G16, i7-13650HX, RTX 4060 | |
| HP Victus 16 (2024) | |
| Dota 2 Reborn - 1920x1080 ultra (3/3) best looking | |
| Lenovo Legion Pro 5 16IRX9 | |
| Lenovo Legion Pro 5 16IRX9 G9 | |
| Lenovo Legion 5 16IRX G9 | |
| HP Victus 16 (2024) | |
| Dell G16, i7-13650HX, RTX 4060 | |
| Media della classe Gaming (65.1 - 220, n=148, ultimi 2 anni) | |
| SCHENKER XMG Core 15 (M24) | |
| The Witcher 3 | |
| 1920x1080 High Graphics & Postprocessing (Nvidia HairWorks Off) | |
| Lenovo Legion Pro 5 16IRX9 | |
| Media della classe Gaming (40.1 - 424, n=86, ultimi 2 anni) | |
| Lenovo Legion 5 16IRX G9 | |
| Lenovo Legion Pro 5 16IRX9 G9 | |
| SCHENKER XMG Core 15 (M24) | |
| Media NVIDIA GeForce RTX 4060 Laptop GPU (110 - 229, n=36) | |
| HP Victus 16 (2024) | |
| Dell G16, i7-13650HX, RTX 4060 | |
| 1920x1080 Ultra Graphics & Postprocessing (HBAO+) | |
| Lenovo Legion Pro 5 16IRX9 | |
| Media della classe Gaming (18.4 - 214, n=119, ultimi 2 anni) | |
| Lenovo Legion Pro 5 16IRX9 G9 | |
| SCHENKER XMG Core 15 (M24) | |
| Dell G16, i7-13650HX, RTX 4060 | |
| Media NVIDIA GeForce RTX 4060 Laptop GPU (77 - 159.7, n=42) | |
| HP Victus 16 (2024) | |
| Lenovo Legion 5 16IRX G9 | |
| Skull & Bones | |
| 1920x1080 Ultra High Preset AA:T | |
| Media della classe Gaming (31 - 118, n=12, ultimi 2 anni) | |
| SCHENKER XMG Core 15 (M24) | |
| Media NVIDIA GeForce RTX 4060 Laptop GPU (65 - 73, n=5) | |
| Lenovo Legion Pro 5 16IRX9 G9 | |
| 2560x1440 Ultra High Preset AA:T | |
| Media della classe Gaming (37 - 98, n=8, ultimi 2 anni) | |
| SCHENKER XMG Core 15 (M24) | |
| Media NVIDIA GeForce RTX 4060 Laptop GPU (51 - 57, n=3) | |
| Lenovo Legion Pro 5 16IRX9 G9 | |
| F1 24 - 1920x1080 Ultra High Preset AA:T AF:16x | |
| Media della classe Gaming (54.1 - 148, n=19, ultimi 2 anni) | |
| Lenovo Legion Pro 5 16IRX9 G9 | |
| Media NVIDIA GeForce RTX 4060 Laptop GPU (47.5 - 61.6, n=10) | |
Cyberpunk 2077 FPS diagram
| basso | medio | alto | ultra | QHD | 4K | |
|---|---|---|---|---|---|---|
| GTA V (2015) | 187.2 | 185.9 | 185.2 | 124.9 | 87.3 | |
| The Witcher 3 (2015) | 531 | 364 | 217 | 112 | 83 | |
| Dota 2 Reborn (2015) | 228 | 203 | 191.7 | 183.8 | 129.4 | |
| Final Fantasy XV Benchmark (2018) | 226 | 155.5 | 106.1 | 78.1 | ||
| X-Plane 11.11 (2018) | 201 | 172.9 | 135.1 | 124.7 | ||
| Far Cry 5 (2018) | 192 | 165 | 158 | 148 | 106 | |
| Strange Brigade (2018) | 526 | 295 | 231 | 199.9 | ||
| Baldur's Gate 3 (2023) | 138.6 | 85.7 | 71.1 | 66.5 | 49.1 | |
| Cyberpunk 2077 2.2 Phantom Liberty (2023) | 135.3 | 100.8 | 88.7 | 79.5 | 47.5 | |
| Skull & Bones (2024) | 137 | 124 | 98 | 69 | 53 | |
| F1 24 (2024) | 286 | 247 | 185.3 | 60.6 |
Emissioni e potenza: Il lato gaming sinistro di Lenovo si scalda di più di quello destro
Emissioni di rumore
In modalità prestazioni, le ventole sono per lo più attive e spesso lo sono anche in modalità idle: girano a un livello silenzioso di 25-26 dB. Nel nostro scenario di medio carico tramite 3DMark06, hanno già raggiunto i 45 dB, ma la concorrenza è altrettanto rumorosa.
Sotto carichi più elevati, le emissioni acustiche della ventola fluttuano e non rimangono costanti. I dati riportati nella tabella mostrano i suoi valori massimi. Ad esempio, le sue emissioni fluttuavano tra 47,5 dB e 52,69 dB durante la riproduzione di Cyberpunk.
Rumorosità
| Idle |
| 23 / 23 / 25 dB(A) |
| Sotto carico |
| 45.18 / 53.13 dB(A) |
 | ||
30 dB silenzioso 40 dB(A) udibile 50 dB(A) rumoroso |
||
min: | ||
| Lenovo Legion Pro 5 16IRX9 G9 NVIDIA GeForce RTX 4060 Laptop GPU, i7-14700HX, Samsung PM9A1 MZVL21T0HCLR | HP Victus 16 (2024) NVIDIA GeForce RTX 4060 Laptop GPU, i7-14700HX, Kioxia XG8 KXG80ZNV512G | Dell G16, i7-13650HX, RTX 4060 NVIDIA GeForce RTX 4060 Laptop GPU, i7-13650HX, WD PC SN740 SDDPNQD-1T00 | SCHENKER XMG Core 15 (M24) NVIDIA GeForce RTX 4060 Laptop GPU, R7 8845HS, Samsung 990 Pro 1 TB | Lenovo Legion Pro 5 16IRX9 NVIDIA GeForce RTX 4070 Laptop GPU, i9-14900HX, Samsung PM9A1 MZVL21T0HCLR | Lenovo Legion 5 16IRX G9 NVIDIA GeForce RTX 4060 Laptop GPU, i7-14650HX, Samsung PM9A1 MZVL21T0HCLR | |
|---|---|---|---|---|---|---|
| Noise | -13% | 6% | 4% | -7% | -11% | |
| off /ambiente * | 23 | 25 -9% | 23 -0% | 23 -0% | 23.9 -4% | 24 -4% |
| Idle Minimum * | 23 | 28 -22% | 23 -0% | 23 -0% | 24.3 -6% | 24 -4% |
| Idle Average * | 23 | 29 -26% | 23 -0% | 23 -0% | 24.3 -6% | 28.8 -25% |
| Idle Maximum * | 25 | 33 -32% | 27.96 -12% | 23 8% | 28.9 -16% | 32 -28% |
| Load Average * | 45.18 | 45 -0% | 27.96 38% | 38.92 14% | 45.8 -1% | 45.5 -1% |
| Cyberpunk 2077 ultra * | 52.69 | 52.06 1% | ||||
| Load Maximum * | 53.13 | 48 10% | 47.89 10% | 52.09 2% | 56.6 -7% | 55.7 -5% |
| Witcher 3 ultra * | 43 | 47.89 | 50.96 | 51 | 53.1 |
* ... Meglio usare valori piccoli
Temperatura
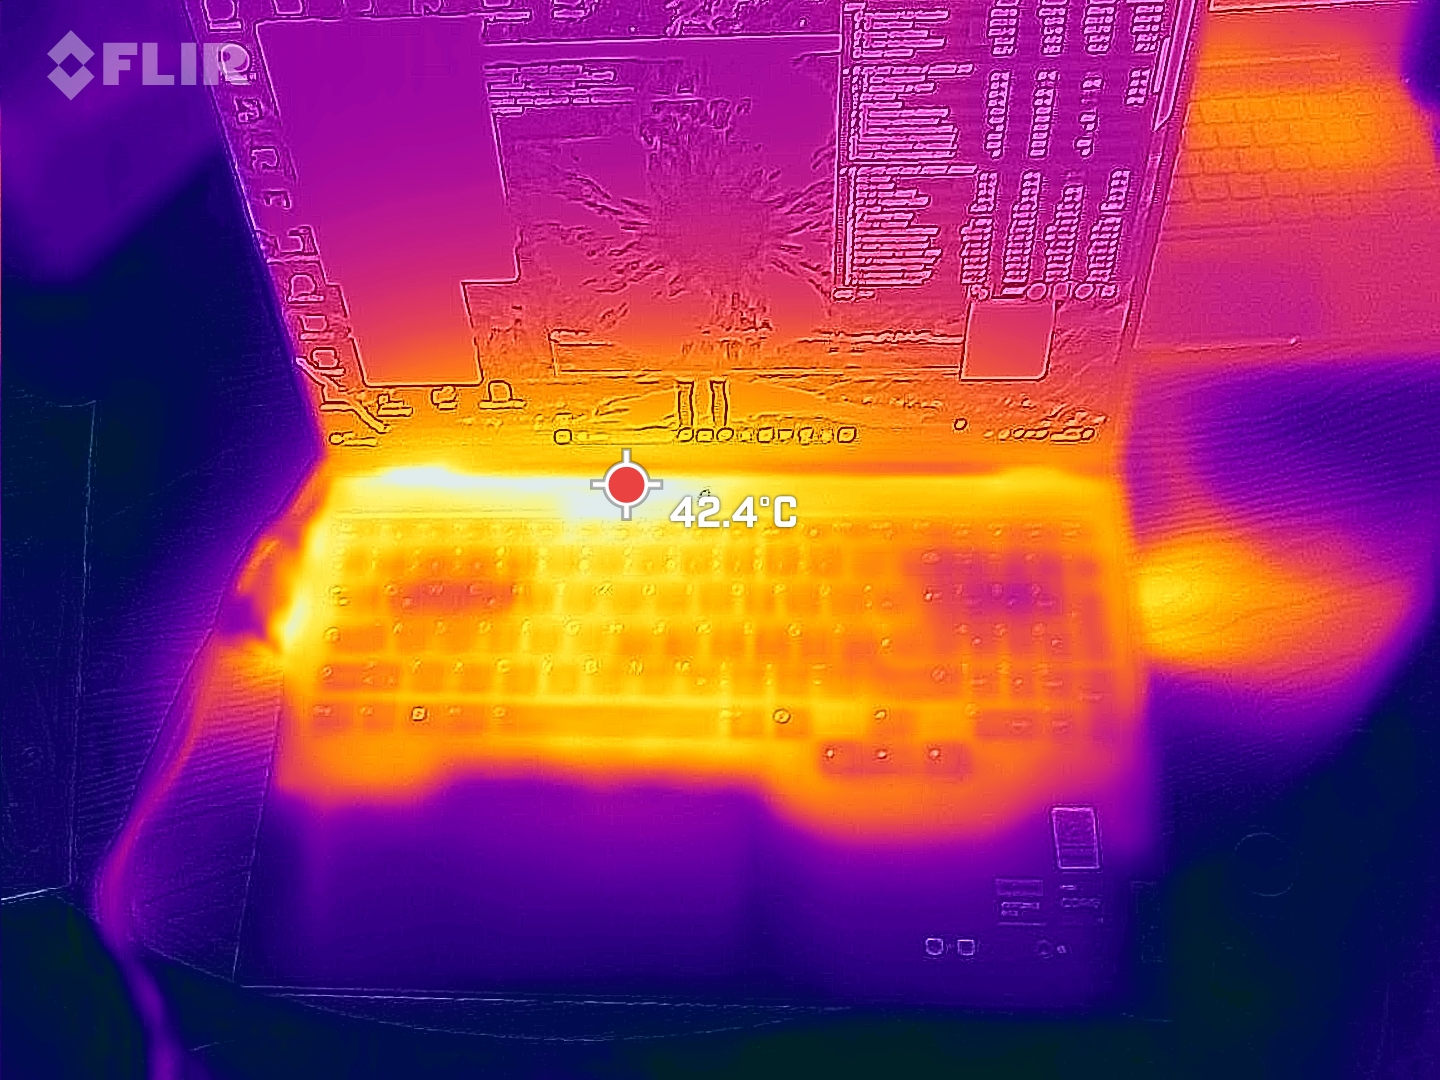
Il Legion si scalda abbastanza quando è inattivo: abbiamo misurato fino a 39 °C sulla parte inferiore del dispositivo. In generale, il lato sinistro con i tasti WASD (che sono importanti per i giocatori) sembra riscaldarsi di più rispetto al lato destro.
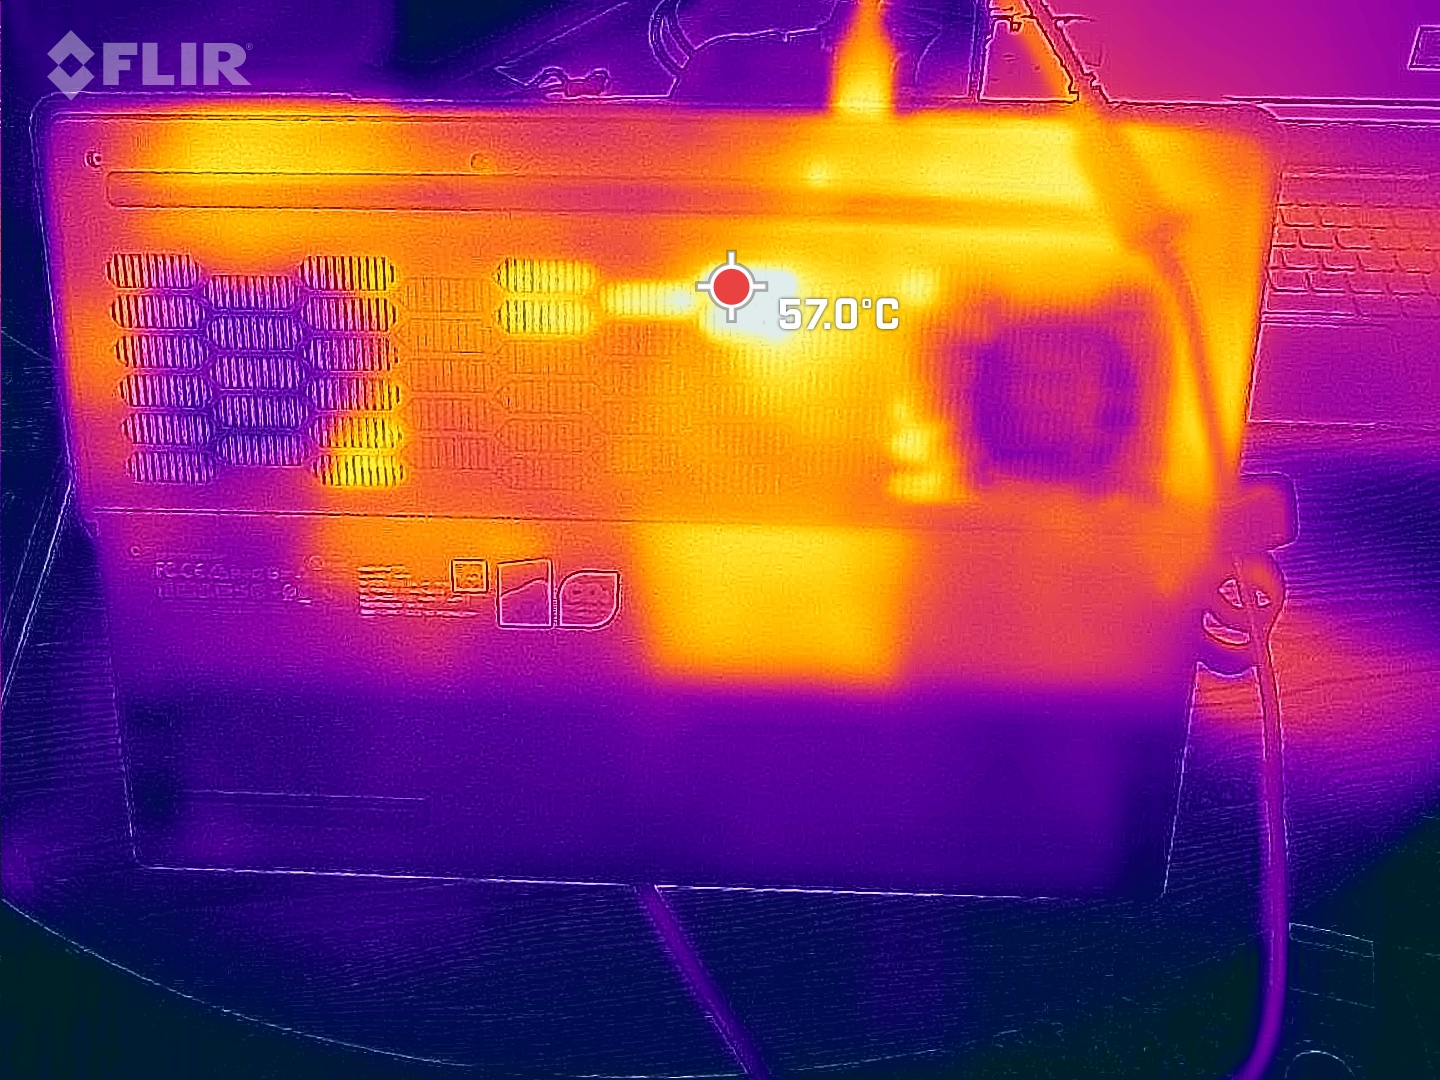
Sotto carico pesante, abbiamo misurato un punto caldo di 57 °C sul fondo. Il Dell G16 e il Core 15 si scaldano in modo simile, mentre gli altri concorrenti tendono a rimanere più freddi.
(-) La temperatura massima sul lato superiore è di 50 °C / 122 F, rispetto alla media di 40.4 °C / 105 F, che varia da 21.2 a 68.8 °C per questa classe Gaming.
(-) Il lato inferiore si riscalda fino ad un massimo di 57 °C / 135 F, rispetto alla media di 43.2 °C / 110 F
(±) In idle, la temperatura media del lato superiore è di 32.9 °C / 91 F, rispetto alla media deld ispositivo di 33.9 °C / 93 F.
(-) 3: The average temperature for the upper side is 38.4 °C / 101 F, compared to the average of 33.9 °C / 93 F for the class Gaming.
(±) I poggiapolsi e il touchpad possono diventare molto caldi al tatto con un massimo di 36 °C / 96.8 F.
(-) La temperatura media della zona del palmo della mano di dispositivi simili e'stata di 28.9 °C / 84 F (-7.1 °C / -12.8 F).
| Lenovo Legion Pro 5 16IRX9 G9 Intel Core i7-14700HX, NVIDIA GeForce RTX 4060 Laptop GPU | HP Victus 16 (2024) Intel Core i7-14700HX, NVIDIA GeForce RTX 4060 Laptop GPU | Dell G16, i7-13650HX, RTX 4060 Intel Core i7-13650HX, NVIDIA GeForce RTX 4060 Laptop GPU | SCHENKER XMG Core 15 (M24) AMD Ryzen 7 8845HS, NVIDIA GeForce RTX 4060 Laptop GPU | Lenovo Legion Pro 5 16IRX9 Intel Core i9-14900HX, NVIDIA GeForce RTX 4070 Laptop GPU | Lenovo Legion 5 16IRX G9 Intel Core i7-14650HX, NVIDIA GeForce RTX 4060 Laptop GPU | |
|---|---|---|---|---|---|---|
| Heat | 19% | 3% | -2% | 8% | 17% | |
| Maximum Upper Side * | 50 | 50 -0% | 49 2% | 52 -4% | 43.8 12% | 40.4 19% |
| Maximum Bottom * | 57 | 50 12% | 58 -2% | 61 -7% | 55.4 3% | 43.8 23% |
| Idle Upper Side * | 36 | 25 31% | 35 3% | 35 3% | 32.8 9% | 30.3 16% |
| Idle Bottom * | 39 | 26 33% | 35 10% | 39 -0% | 36 8% | 35.3 9% |
* ... Meglio usare valori piccoli
Altoparlanti
Gli altoparlanti non si distinguono positivamente dalla concorrenza: sono solo moderatamente rumorosi e non abbiamo notato quasi nessun basso. È disponibile un jack per cuffie standard per collegare dispositivi analogici.
Lenovo Legion Pro 5 16IRX9 G9 analisi audio
(±) | potenza degli altiparlanti media ma buona (77.13 dB)
Bassi 100 - 315 Hz
(-) | quasi nessun basso - in media 18.3% inferiori alla media
(±) | la linearità dei bassi è media (12% delta rispetto alla precedente frequenza)
Medi 400 - 2000 Hz
(±) | medi elevati - circa 6.9% superiore alla media
(+) | medi lineari (4.9% delta rispetto alla precedente frequenza)
Alti 2 - 16 kHz
(+) | Alti bilanciati - appena 4.5% dalla media
(±) | la linearità degli alti è media (9.5% delta rispetto alla precedente frequenza)
Nel complesso 100 - 16.000 Hz
(±) | la linearità complessiva del suono è media (21.6% di differenza rispetto alla media
Rispetto alla stessa classe
» 76% di tutti i dispositivi testati in questa classe è stato migliore, 5% simile, 19% peggiore
» Il migliore ha avuto un delta di 6%, medio di 18%, peggiore di 132%
Rispetto a tutti i dispositivi testati
» 58% di tutti i dispositivi testati in questa classe è stato migliore, 7% similare, 34% peggiore
» Il migliore ha avuto un delta di 4%, medio di 24%, peggiore di 134%
Dell G16, i7-13650HX, RTX 4060 analisi audio
(±) | potenza degli altiparlanti media ma buona (80.55 dB)
Bassi 100 - 315 Hz
(-) | quasi nessun basso - in media 25.1% inferiori alla media
(-) | bassi non lineari (18.9% delta rispetto alla precedente frequenza)
Medi 400 - 2000 Hz
(±) | medi elevati - circa 8% superiore alla media
(+) | medi lineari (5.9% delta rispetto alla precedente frequenza)
Alti 2 - 16 kHz
(+) | Alti bilanciati - appena 3.5% dalla media
(±) | la linearità degli alti è media (8.6% delta rispetto alla precedente frequenza)
Nel complesso 100 - 16.000 Hz
(±) | la linearità complessiva del suono è media (23.4% di differenza rispetto alla media
Rispetto alla stessa classe
» 83% di tutti i dispositivi testati in questa classe è stato migliore, 5% simile, 12% peggiore
» Il migliore ha avuto un delta di 6%, medio di 18%, peggiore di 132%
Rispetto a tutti i dispositivi testati
» 68% di tutti i dispositivi testati in questa classe è stato migliore, 6% similare, 26% peggiore
» Il migliore ha avuto un delta di 4%, medio di 24%, peggiore di 134%
Consumo di energia
Non è molto facile misurare il consumo reale in idle di Legion Pro 5, perché il portatile assorbe circa 50 watt dalla presa di corrente quasi continuamente, anche quando è inattivo! Se si attende molto a lungo, il consumo in idle si stabilizza finalmente su valori relativamente normali (15-20 watt), ma non appena si cambia la luminosità del portatile con il tasto F, il consumo torna a 50 watt e vi rimane per un tempo insolitamente lungo. I valori di idle indicati nella tabella sono quindi piuttosto ottimisticamente bassi.
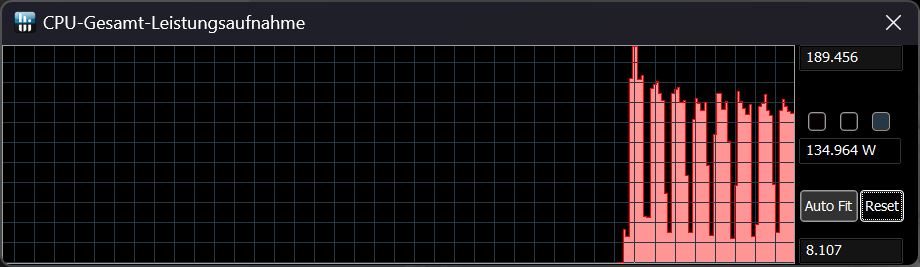
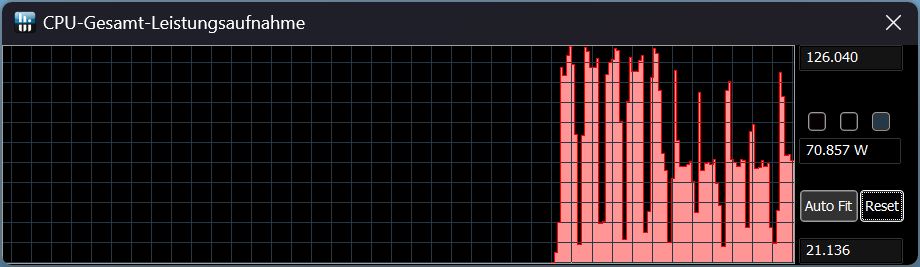
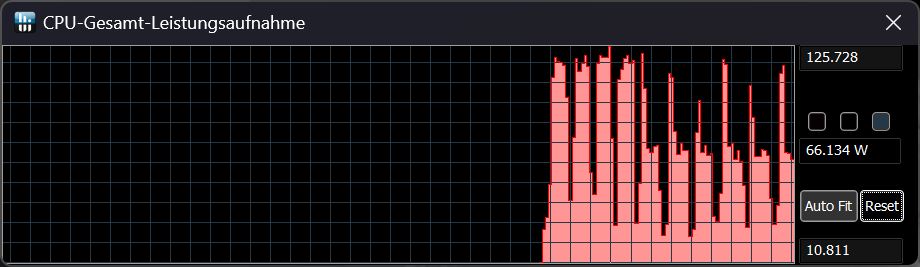
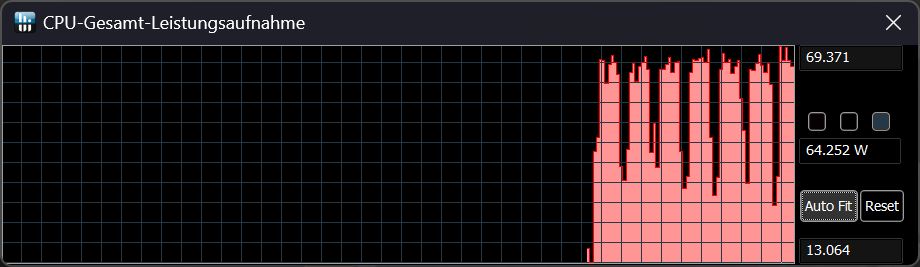
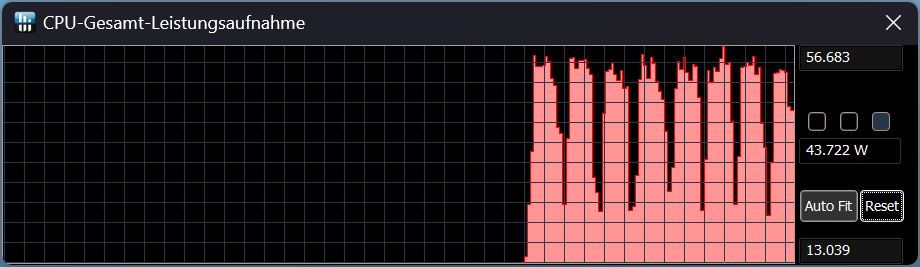
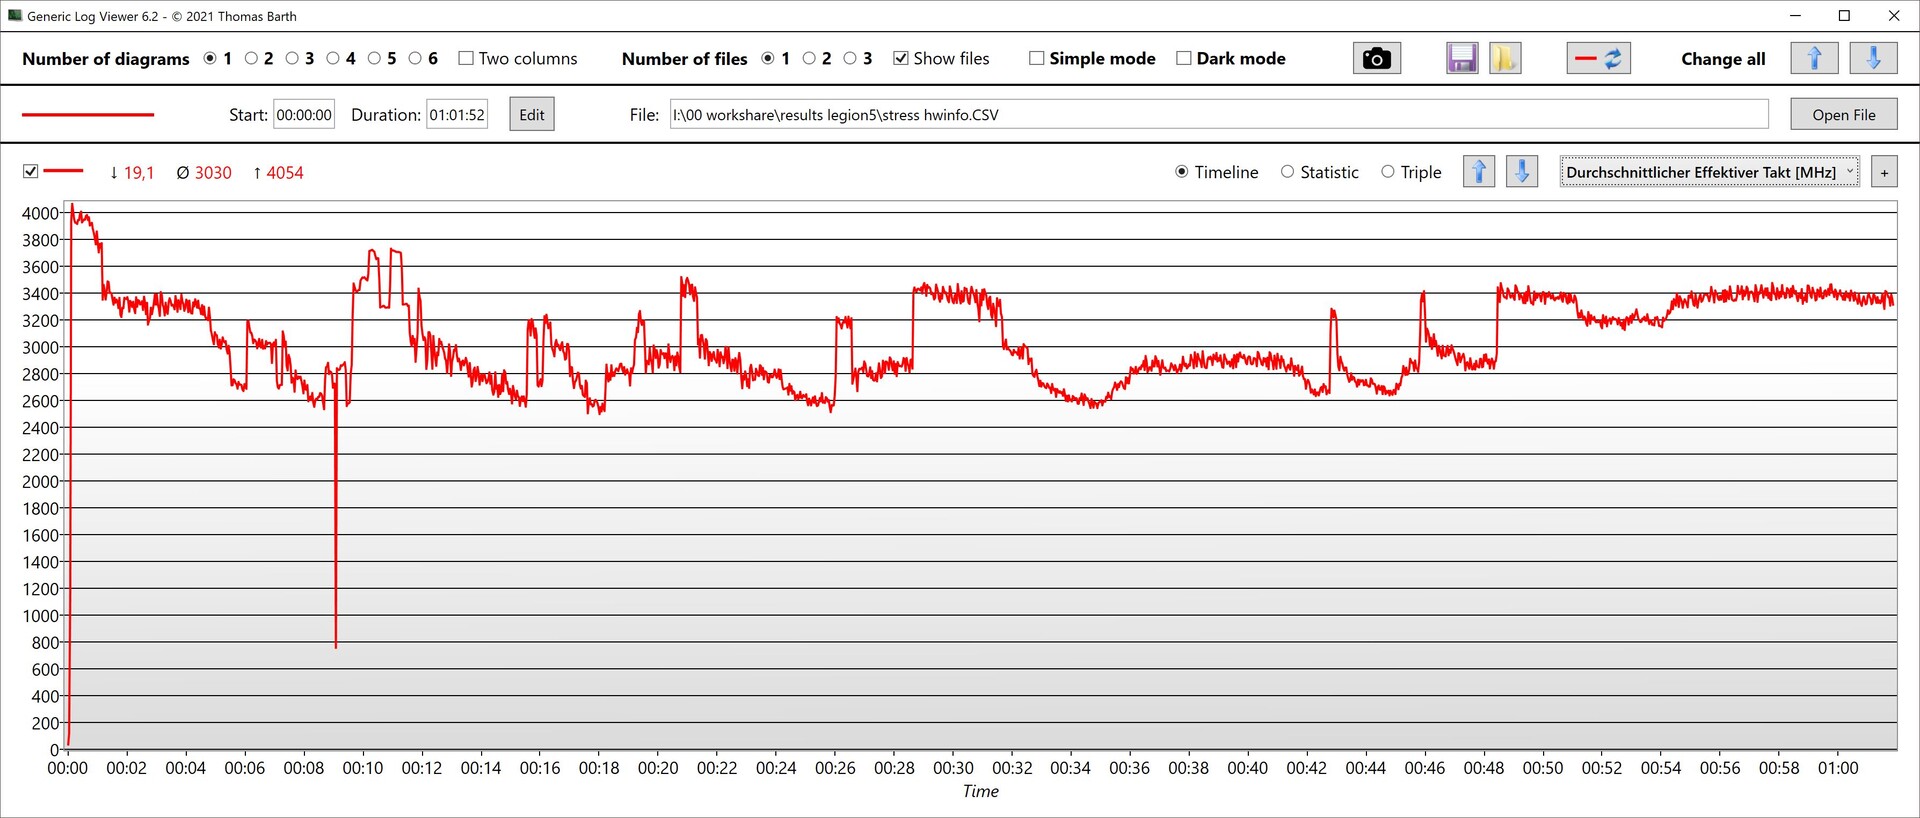
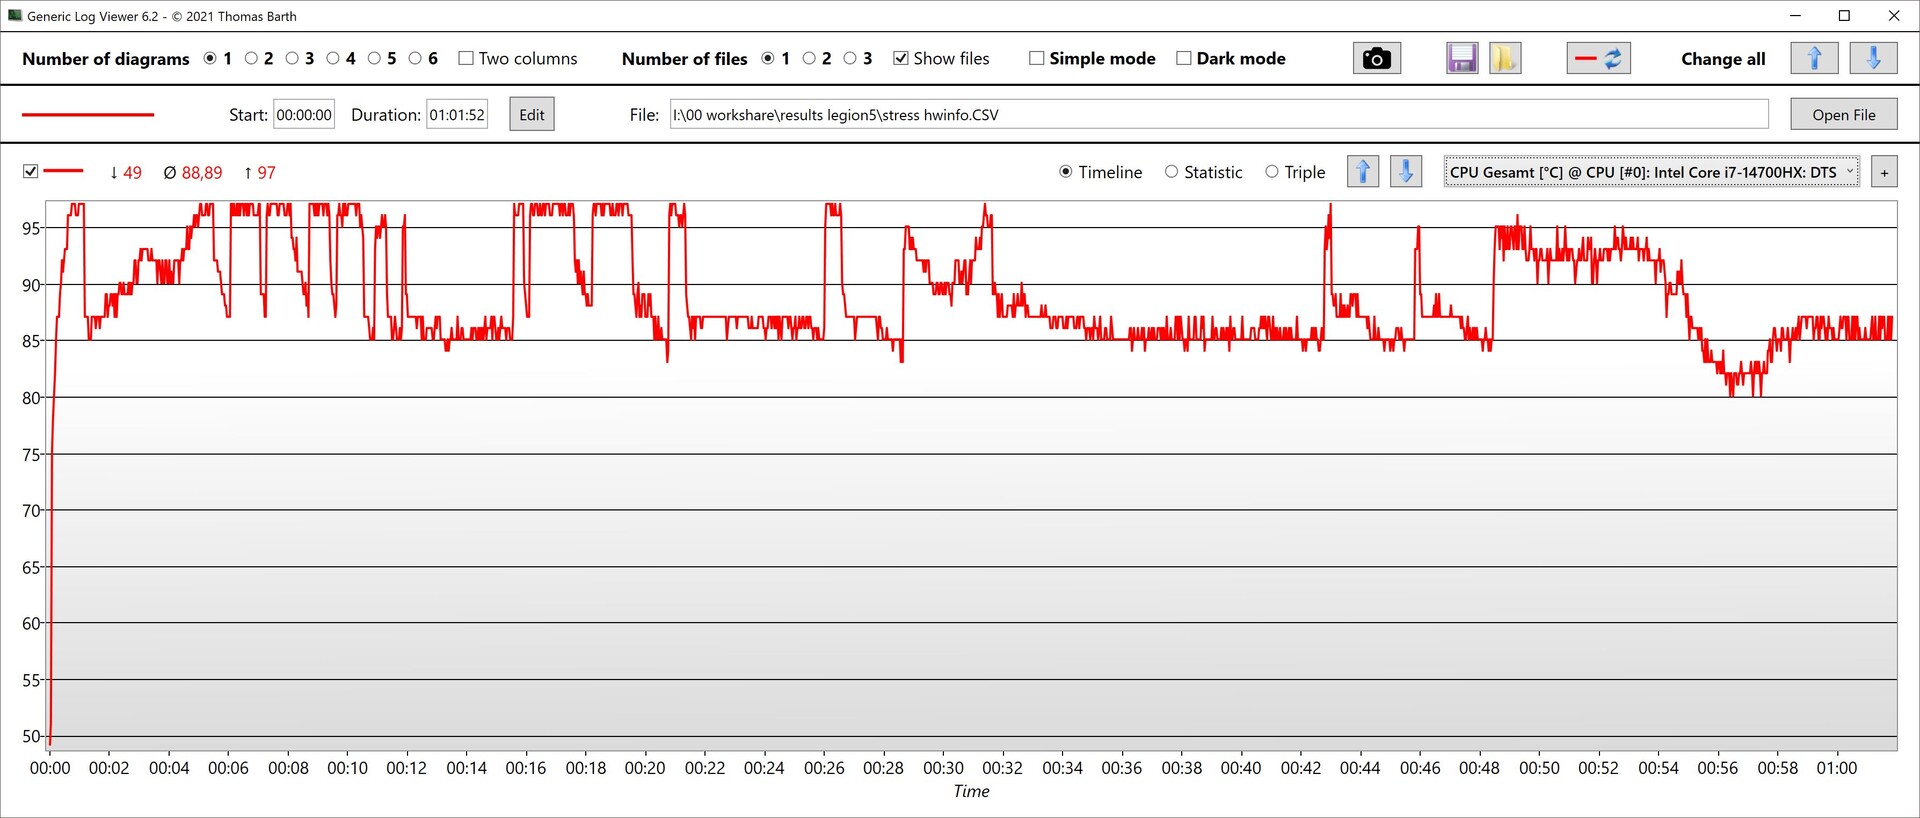
Sotto carico pesante, il suo consumo e le prestazioni della GPU fluttuano in modo piuttosto forte, come si può vedere dai nostri grafici di consumo - soprattutto quando la CPU e la GPU sono ugualmente sollecitate, come nel nostro stress test.

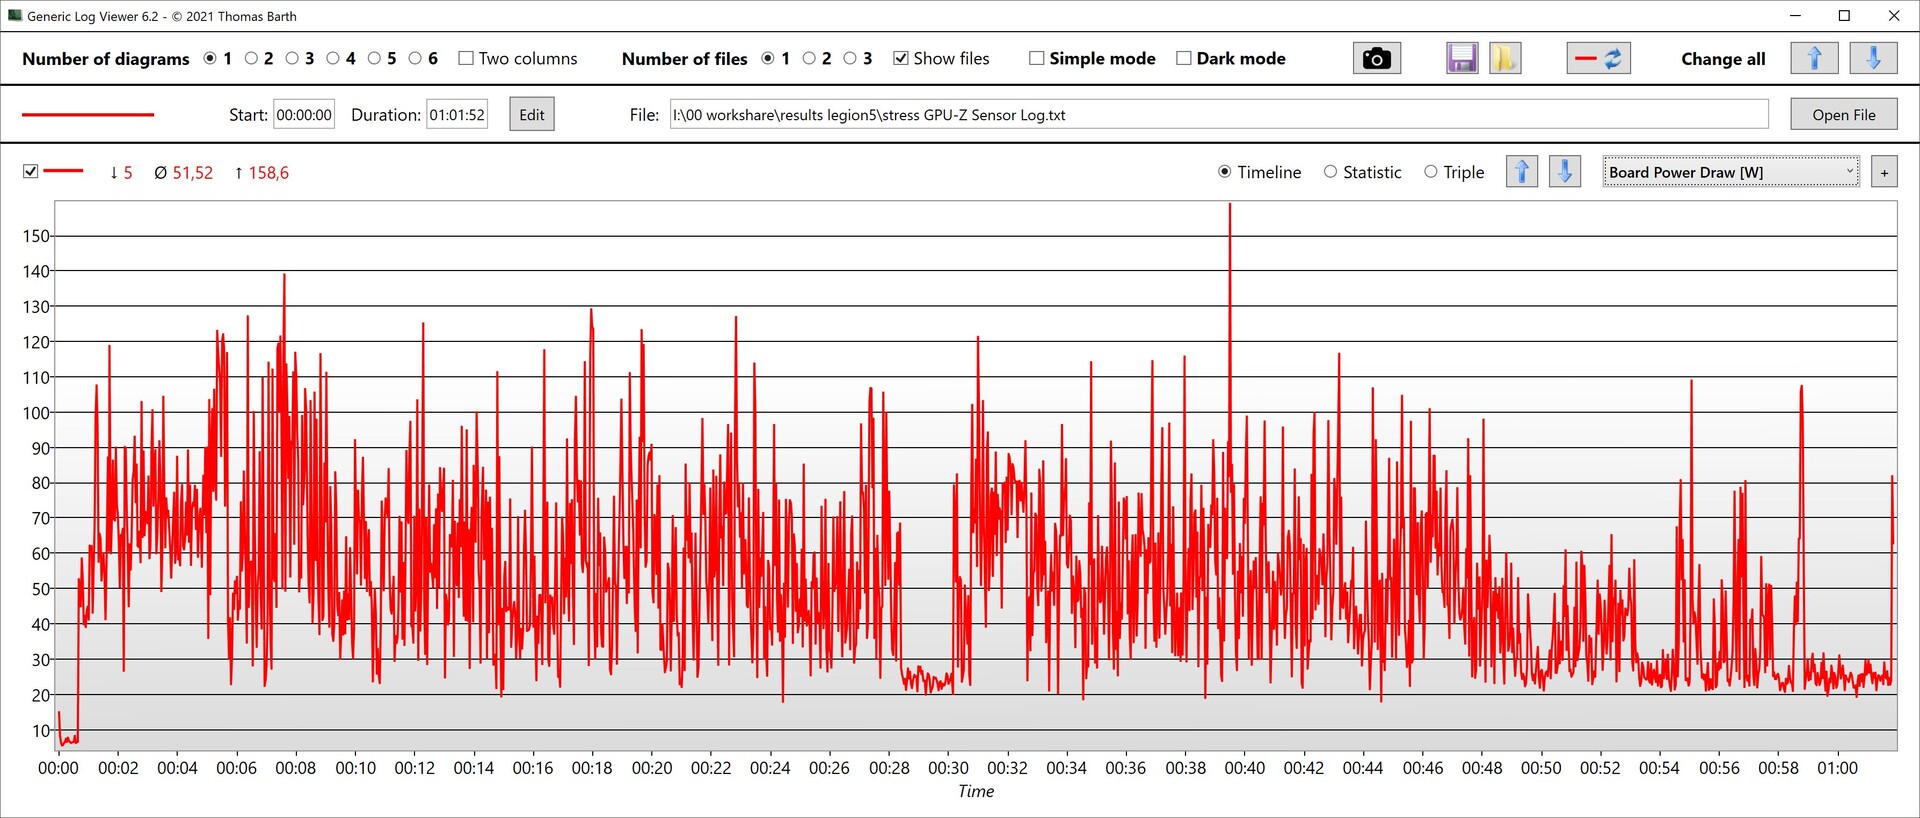
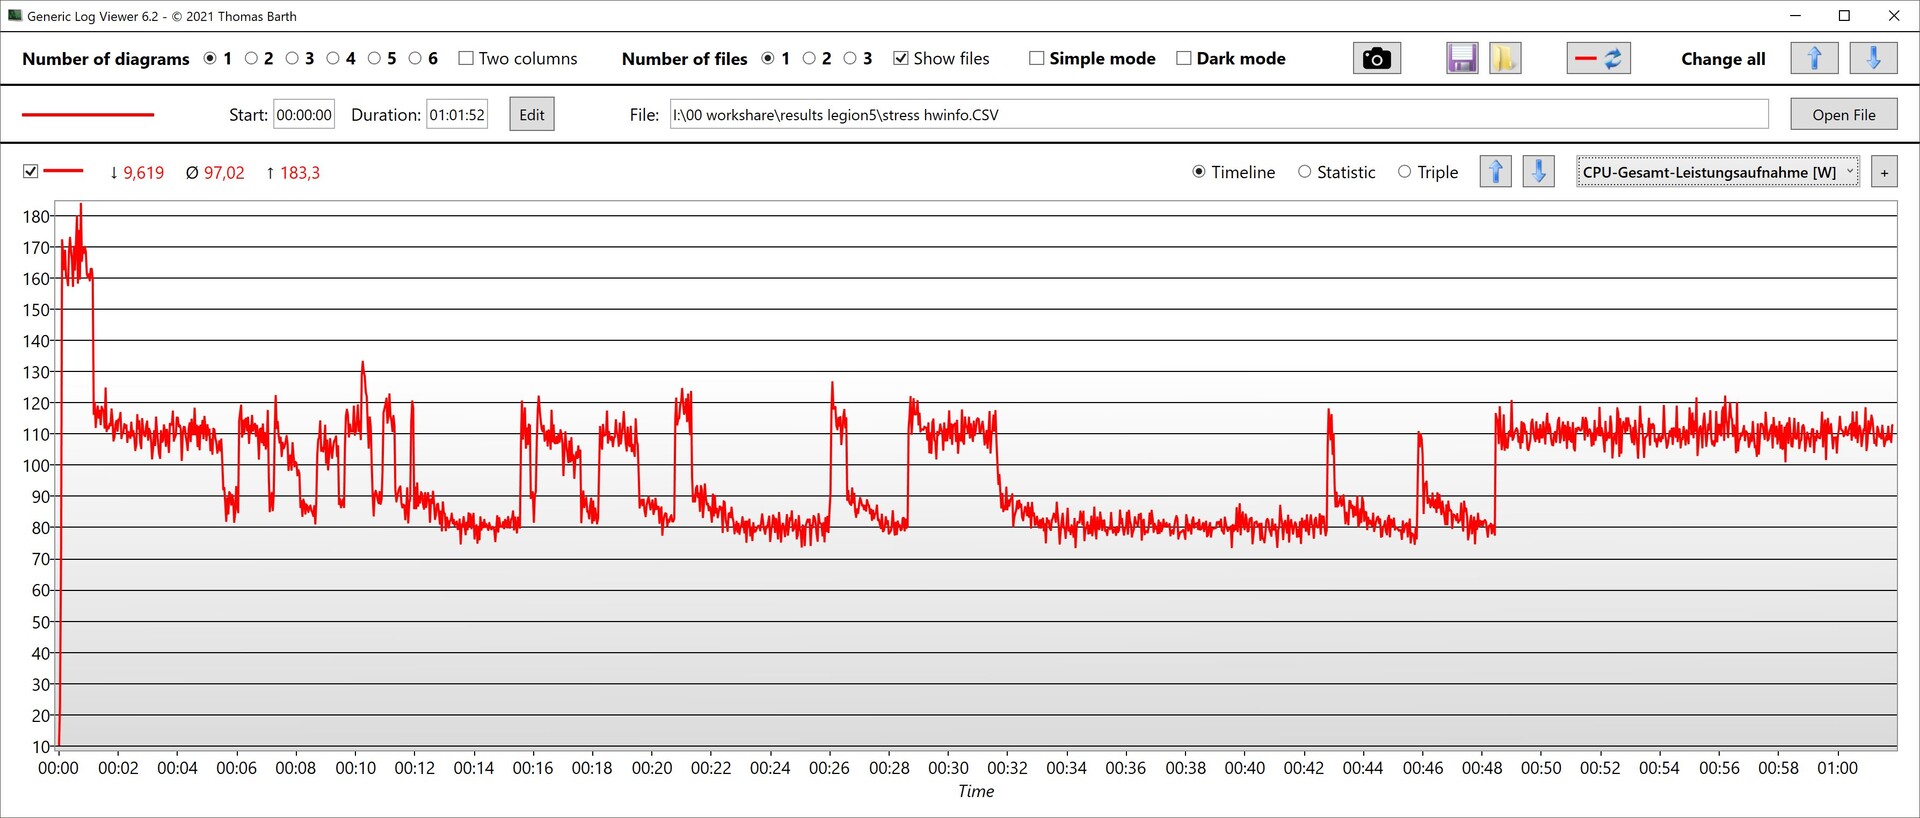
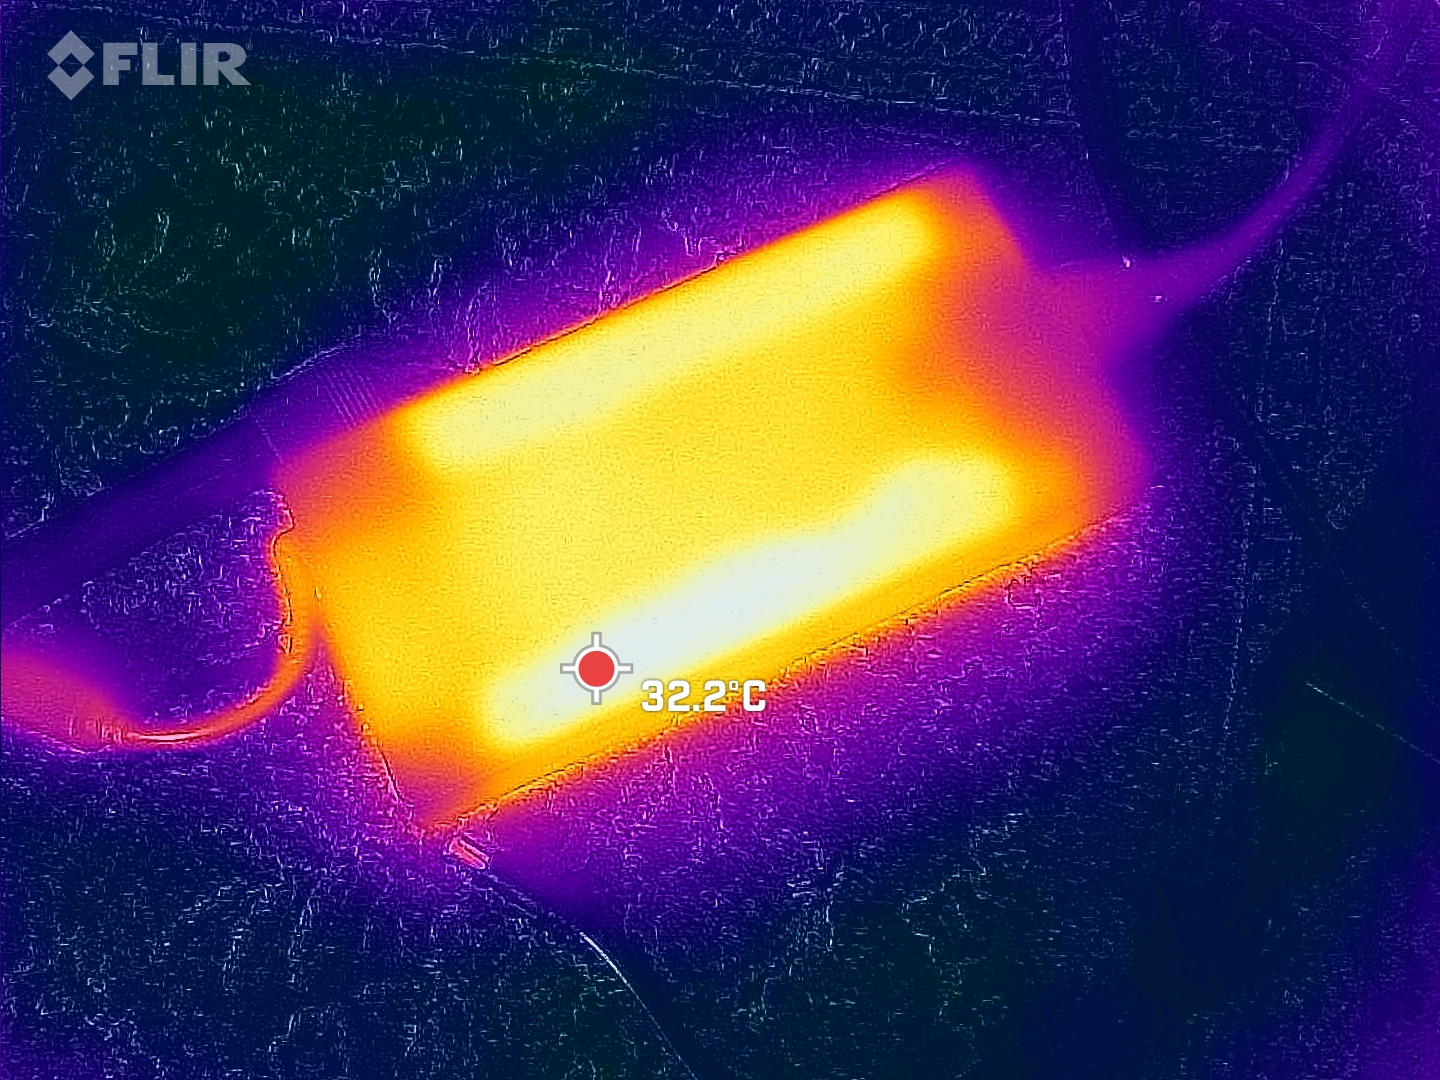
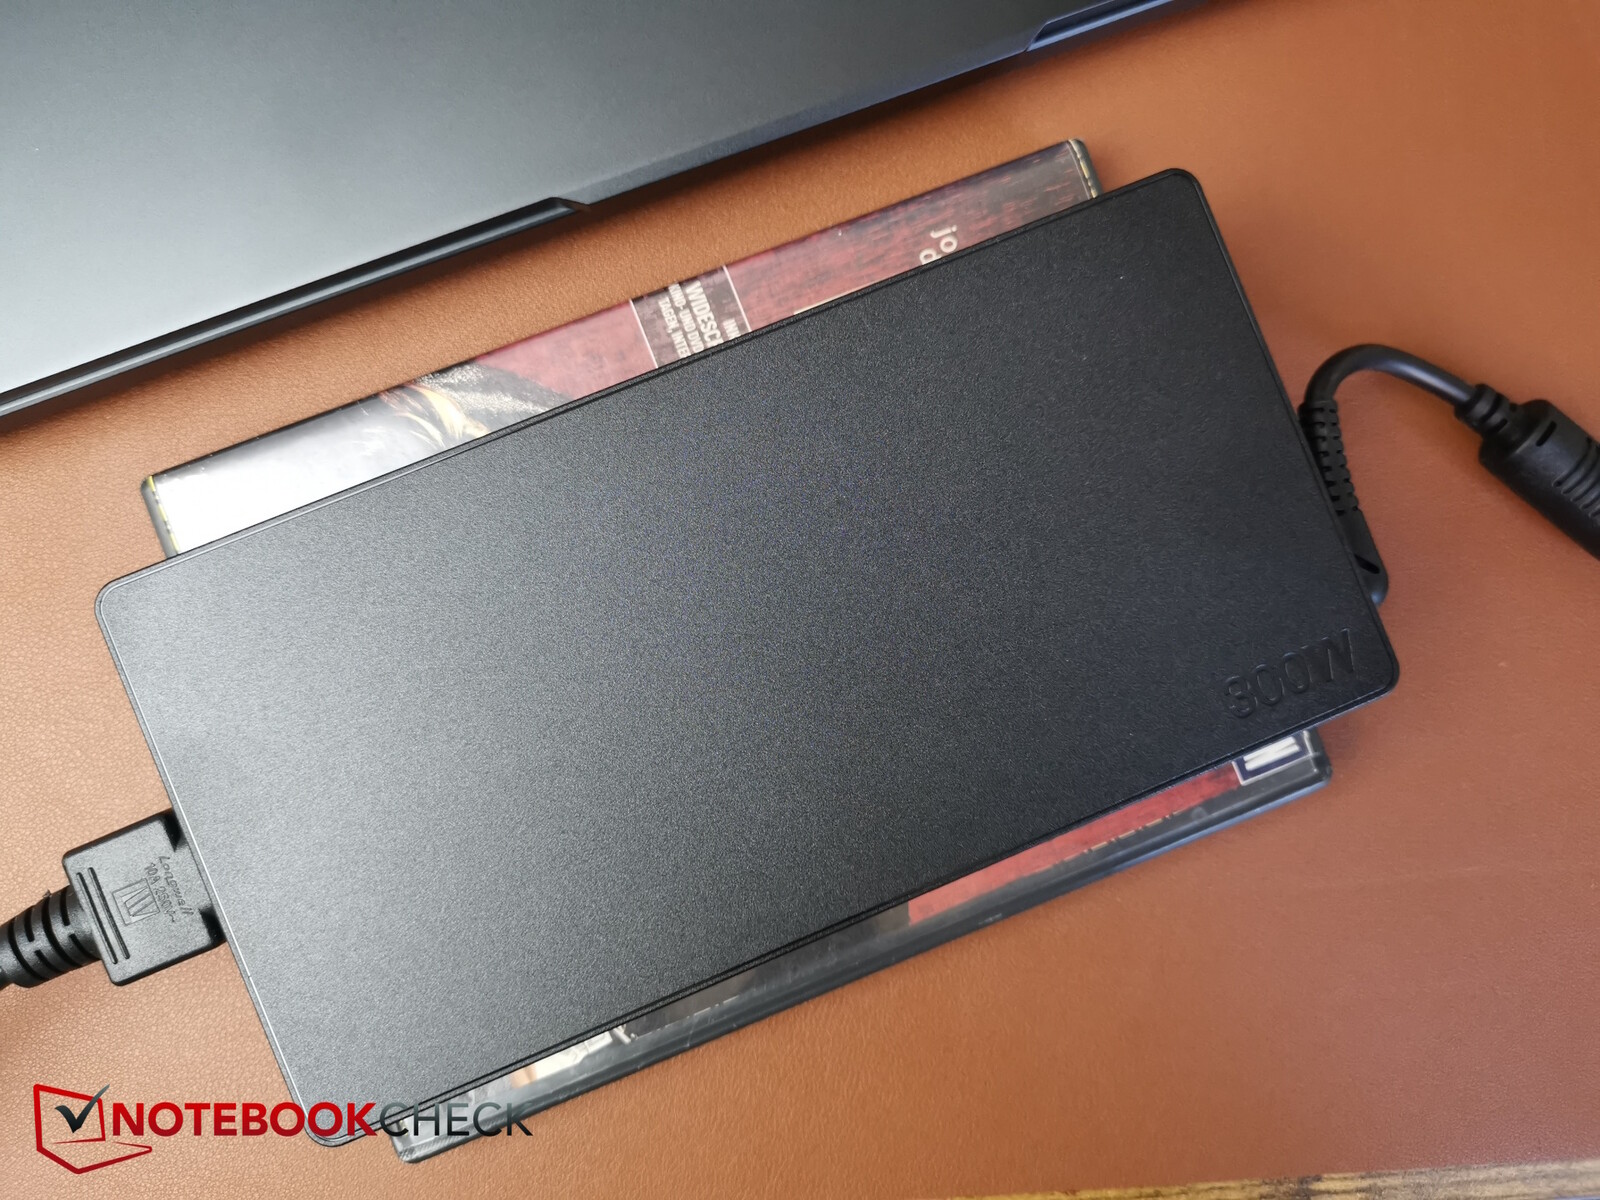
Abbiamo misurato un consumo medio di 229 watt durante l'esecuzione di Cyberpunk 2077. Nello stress test, il nostro dispositivo di misurazione ha registrato un consumo massimo e solo a breve termine di 297 watt, che l'alimentatore piatto ma piuttosto grande da 300 watt dovrebbe essere in grado di gestire.
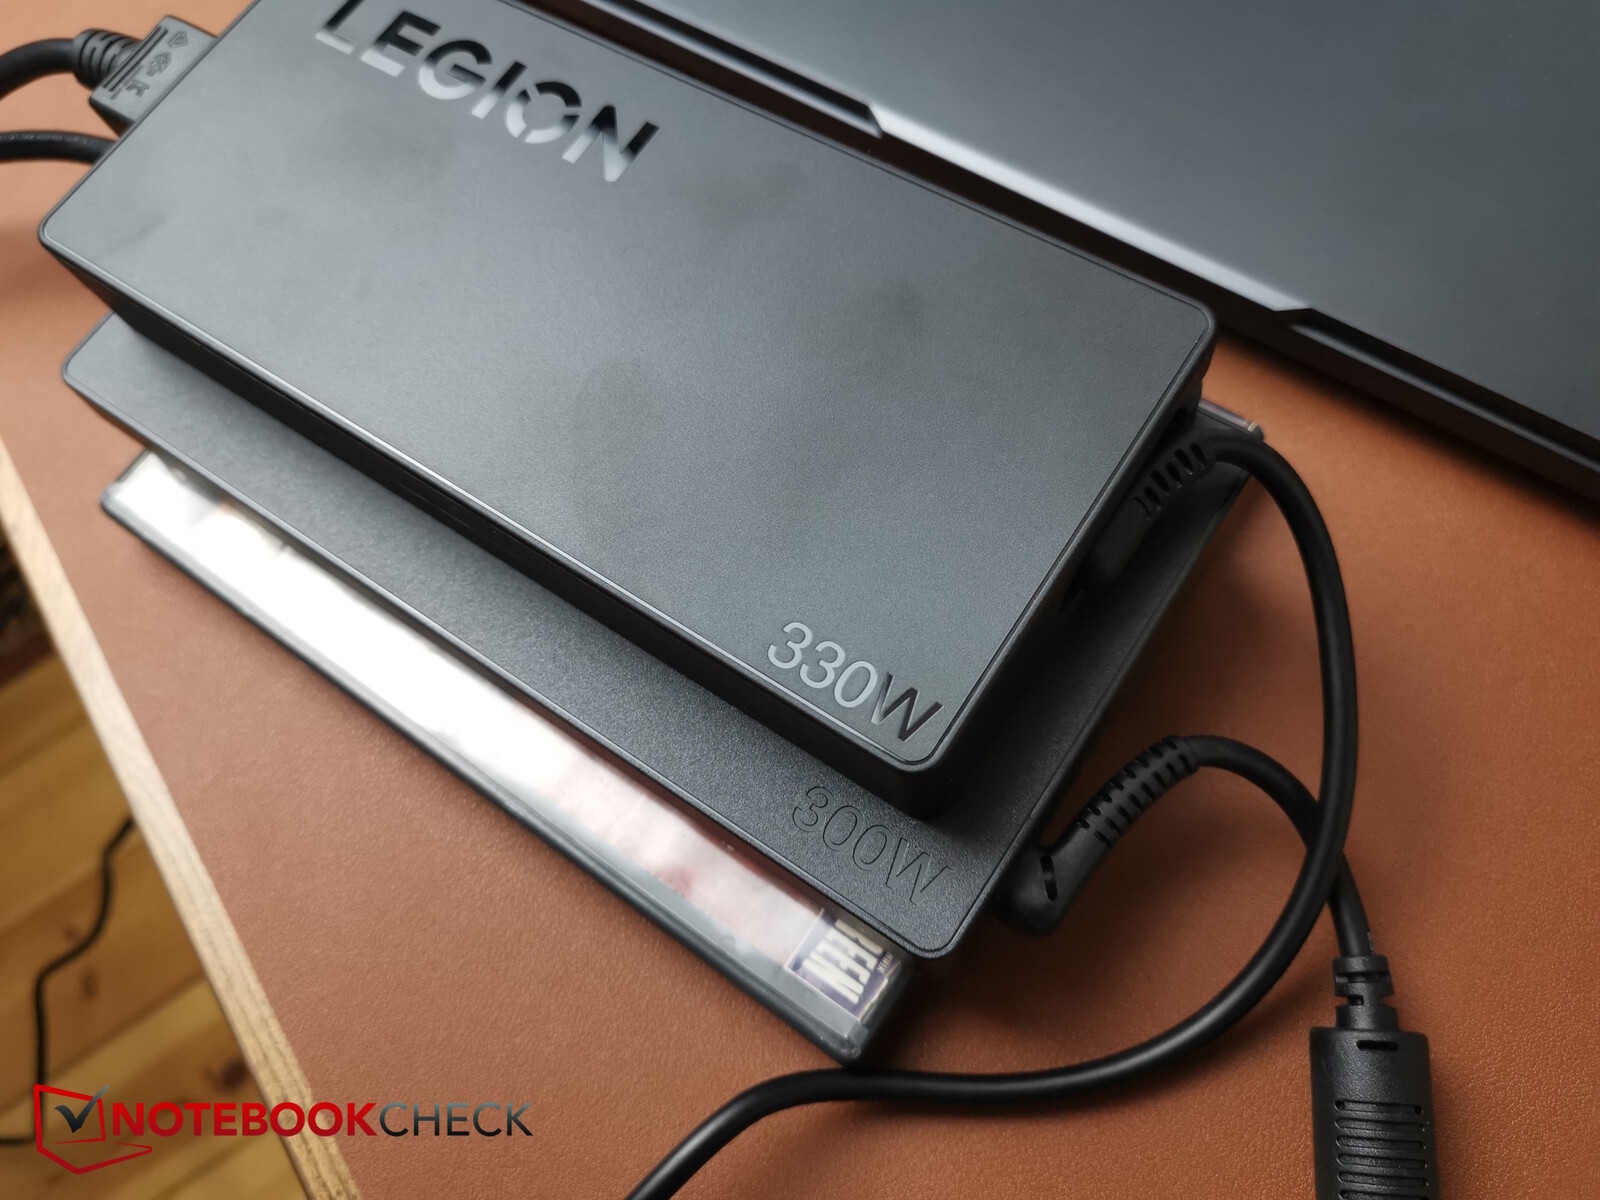
A proposito di alimentatori: L'alimentatore da 300 watt fornito con il nostro Legion Pro 5i è notevolmente più grande dell'alimentatore da 330 watt del più costoso Legion 9i.
| Off / Standby | |
| Idle | |
| Sotto carico |
|
Leggenda:
min: | |
| Lenovo Legion Pro 5 16IRX9 G9 NVIDIA GeForce RTX 4060 Laptop GPU, i7-14700HX, Samsung PM9A1 MZVL21T0HCLR | HP Victus 16 (2024) NVIDIA GeForce RTX 4060 Laptop GPU, i7-14700HX, Kioxia XG8 KXG80ZNV512G | Dell G16, i7-13650HX, RTX 4060 NVIDIA GeForce RTX 4060 Laptop GPU, i7-13650HX, WD PC SN740 SDDPNQD-1T00 | SCHENKER XMG Core 15 (M24) NVIDIA GeForce RTX 4060 Laptop GPU, R7 8845HS, Samsung 990 Pro 1 TB | Lenovo Legion Pro 5 16IRX9 NVIDIA GeForce RTX 4070 Laptop GPU, i9-14900HX, Samsung PM9A1 MZVL21T0HCLR | Lenovo Legion 5 16IRX G9 NVIDIA GeForce RTX 4060 Laptop GPU, i7-14650HX, Samsung PM9A1 MZVL21T0HCLR | |
|---|---|---|---|---|---|---|
| Power Consumption | 11% | 14% | 23% | -22% | -8% | |
| Idle 150cd/m2 * | 16.4 | 15.4 6% | 14 15% | 11.8 28% | 21 -28% | 17.6 -7% |
| 3DMark06 Return To Proxycon * | 124 | 104 16% | 77.5 37% | |||
| Cyberpunk 2077 FHD ultra no FSR 150cd * | 229 | |||||
| 1280x720 Prime95 28.10 and Furmark 1.25 * | 211 | 176.9 16% | 190 10% | 200.6 5% | 245 -16% | 227 -8% |
* ... Meglio usare valori piccoli
Power consumption Witcher 3 / stress test
Power consumption with external monitor
Tempi di esecuzione
Lenovo ha installato una batteria da 80 Wh nel portatile; a parte il Core 15 con una batteria più grande, la concorrenza utilizza modelli con una capacità simile.
Il nostro dispositivo di prova è durato poco più di 5 ore nei test Wi-Fi e video con la luminosità ridotta a 150 nits, un valore medio o leggermente inferiore alla media, spesso superato dalla concorrenza.
| Lenovo Legion Pro 5 16IRX9 G9 i7-14700HX, NVIDIA GeForce RTX 4060 Laptop GPU, 80 Wh | HP Victus 16 (2024) i7-14700HX, NVIDIA GeForce RTX 4060 Laptop GPU, 83 Wh | Dell G16, i7-13650HX, RTX 4060 i7-13650HX, NVIDIA GeForce RTX 4060 Laptop GPU, 86 Wh | SCHENKER XMG Core 15 (M24) R7 8845HS, NVIDIA GeForce RTX 4060 Laptop GPU, 99.8 Wh | Lenovo Legion Pro 5 16IRX9 i9-14900HX, NVIDIA GeForce RTX 4070 Laptop GPU, 80 Wh | Lenovo Legion 5 16IRX G9 i7-14650HX, NVIDIA GeForce RTX 4060 Laptop GPU, 80 Wh | Media della classe Gaming | |
|---|---|---|---|---|---|---|---|
| Autonomia della batteria | 66% | 6% | 109% | -22% | 24% | 16% | |
| H.264 | 312 | 381 22% | 608 95% | 576 85% | 447 ? 43% | ||
| WiFi v1.3 | 308 | 511 66% | 378 23% | 889 189% | 290 -6% | 444 44% | 387 ? 26% |
| Load | 105 | 76 -28% | 151 44% | 65 -38% | 46 -56% | 84.5 ? -20% | |
| Reader / Idle | 403 | 585 ? |
Pro
Contro
Verdetto - Piena attenzione alle prestazioni


Legion Pro 5 si concentra esclusivamente sulle prestazioni. Il suo già potente i7-14700HX e la sua RTX 4060 lavorano più velocemente della media e, in termini puramente prestazionali, si avvicinano persino alla configurazione con i9-14900HX e RTX 4070. Grazie al display potenzialmente estremamente preciso nei colori, Legion Pro potrebbe essere interessante anche per i creatori di contenuti.
A sua volta, è un peccato che lo schermo non sia calibrato in modo terribilmente accurato fin dall'inizio. Considerando la sua attenzione alle prestazioni di gioco, il produttore avrebbe dovuto notare che il sistema di raffreddamento funziona un po' meglio sul lato destro rispetto al lato WASD, il che è importante per i giocatori. Altri punti negativi sono il throttling termico dell'SSD e le prestazioni in idle parzialmente elevate del dispositivo, che richiedono un po' di tempo per calmarsi di nuovo. Tuttavia, gli aspetti positivi superano quelli negativi in totale.
Se è alla ricerca di un portatile da gioco super potente, non cerchi oltre il Lenovo Legion Pro 5i. Anche i creatori di contenuti possono essere soddisfatti, tuttavia alcuni dettagli minori lasciano più spazio a potenziali ottimizzazioni.
Prezzo e disponibilità
Può ordinare il Lenovo Legion Pro 5i direttamente dal produttore. L'MRSP per il nostro dispositivo di prova è di 1.395 dollari.
Attenzione: abbiamo aggiornato il nostro sistema di valutazione e i risultati della versione 8 non sono paragonabili a quelli della versione 7. Ulteriori informazioni sono disponibili qui.
Lenovo Legion Pro 5 16IRX9 G9
- 07/03/2024 v8
Christian Hintze
 Total Sustainability Score:
 Transparency
La selezione dei dispositivi da recensire viene effettuata dalla nostra redazione. Il campione di prova è stato fornito all'autore come prestito dal produttore o dal rivenditore ai fini di questa recensione. L'istituto di credito non ha avuto alcuna influenza su questa recensione, né il produttore ne ha ricevuto una copia prima della pubblicazione. Non vi era alcun obbligo di pubblicare questa recensione. Non accettiamo mai compensi o pagamenti in cambio delle nostre recensioni. In quanto società mediatica indipendente, Notebookcheck non è soggetta all'autorità di produttori, rivenditori o editori.
Ecco come Notebookcheck esegue i test
Ogni anno, Notebookcheck esamina in modo indipendente centinaia di laptop e smartphone utilizzando procedure standardizzate per garantire che tutti i risultati siano comparabili. Da circa 20 anni sviluppiamo continuamente i nostri metodi di prova e nel frattempo stabiliamo gli standard di settore. Nei nostri laboratori di prova, tecnici ed editori esperti utilizzano apparecchiature di misurazione di alta qualità. Questi test comportano un processo di validazione in più fasi. Il nostro complesso sistema di valutazione si basa su centinaia di misurazioni e parametri di riferimento ben fondati, che mantengono l'obiettività.Price comparison

