 Deutsch
 English
 Español
 Français
 Italiano
 Nederlands
 Polski
 Português
 Русский
 Türkçe
 Svenska
 Chinese
 Magyar
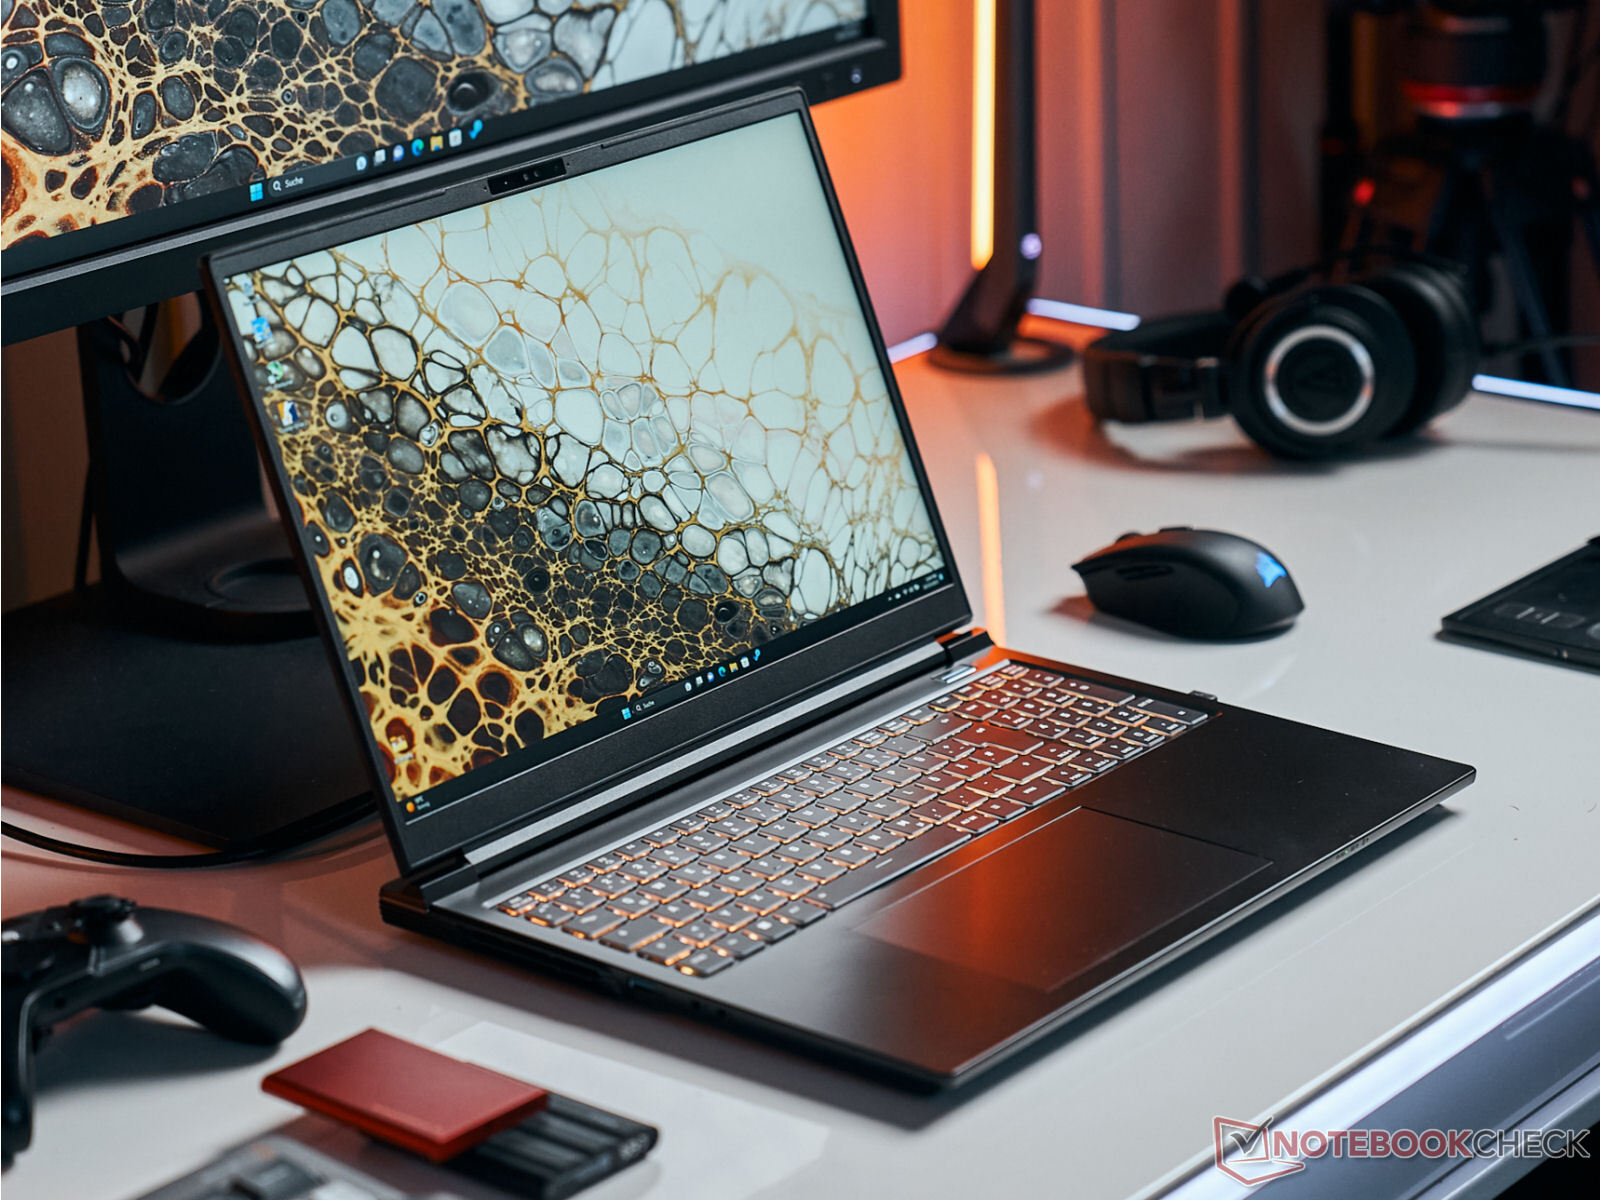
Recensione dell'XMG Pro 16 Studio (Mid 24): Core i9 e RTX 4070 per gamers e creators
Sascha Mölck, 👁 Florian Glaser (traduzione a cura di DeepL / Ninh Duy) Published 🇺🇸 🇩🇪 ...
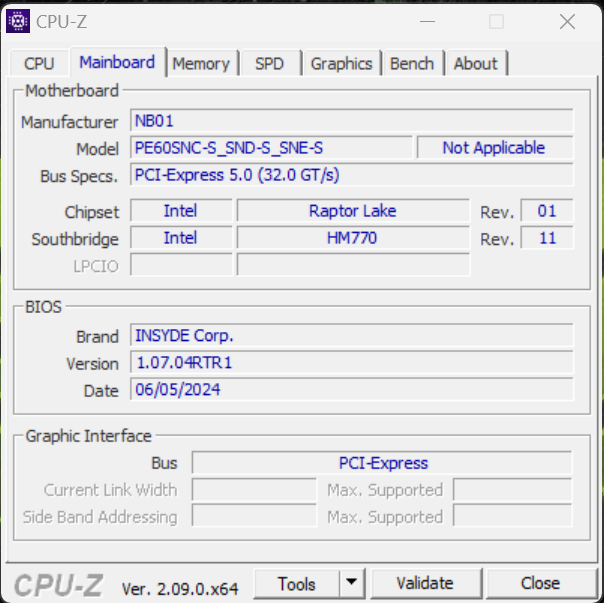
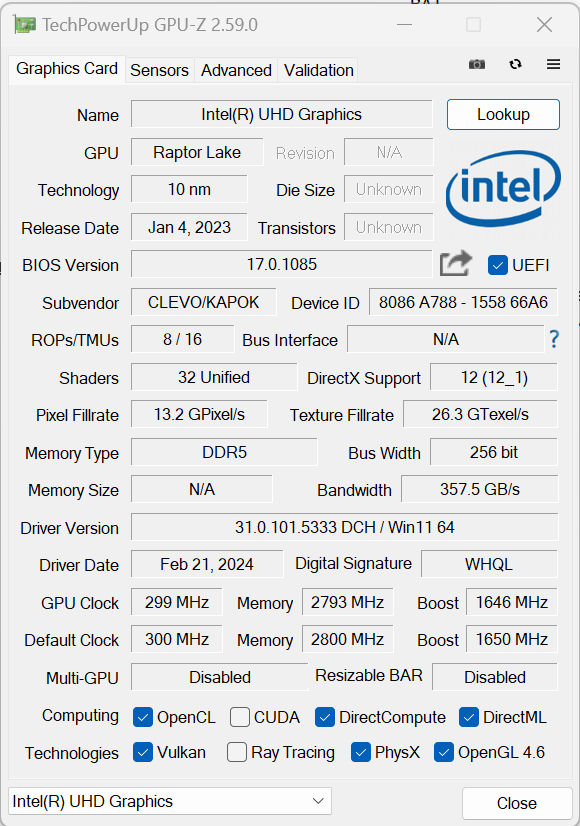
XMG Pro 16 Studio (Mid 24) si rivolge ai giocatori e ai creatori. L'hardware corrispondente è a bordo: Un Core i9-14900HX, GeForce RTX 4070 e un display calibrato (X-Rite) da 16 pollici con un rapporto d'aspetto di 16:10. Un barebone (PE60SNE-S) del produttore Clevo funge da base per questo. Questo è il successore del XMG Pro 16 (Mid 23) che, visivamente, ha lo stesso aspetto. I concorrenti includono il Lenovo Legion Pro 5 16IRX9, Acer Predator Helios Neo 16 (2024), Lenovo Legion 7 16 G9 e il Aorus 16X (2024).
Potenziali concorrenti a confrontos
Punteggio | Version | Data | Modello | Peso | Altezza | Dimensione | Risoluzione | Miglior Prezzo |
|---|---|---|---|---|---|---|---|---|
| 81.2 % | v8 | 07/2024 | SCHENKER XMG Pro 16 Studio (Mid 24) i9-14900HX, NVIDIA GeForce RTX 4070 Laptop GPU | 2.3 kg | 19.9 mm | 16.00" | 2560x1600 | |
| 86.8 % | v7 (old) | 05/2024 | Acer Predator Helios Neo 16 (2024) i7-14700HX, NVIDIA GeForce RTX 4070 Laptop GPU | 2.6 kg | 25.95 mm | 16.00" | 2560x1600 | |
| 89.3 % | v7 (old) | 04/2024 | Lenovo Legion Pro 5 16IRX9 i9-14900HX, NVIDIA GeForce RTX 4070 Laptop GPU | 2.5 kg | 26.95 mm | 16.00" | 2560x1600 | |
| 87.4 % | v7 (old) | 04/2024 | Aorus 16X 2024 i9-14900HX, NVIDIA GeForce RTX 4070 Laptop GPU | 2.3 kg | 20 mm | 16.00" | 2560x1600 | |
| 90.8 % | v7 (old) | 04/2024 | Lenovo Legion 7 16 IRX G9 i9-14900HX, NVIDIA GeForce RTX 4070 Laptop GPU | 2.3 kg | 19.8 mm | 16.00" | 3200x2000 |
Nota bene: abbiamo recentemente aggiornato il nostro sistema di valutazione e i risultati della versione 8 non sono confrontabili con quelli della versione 7. Ulteriori informazioni sono disponibili qui.
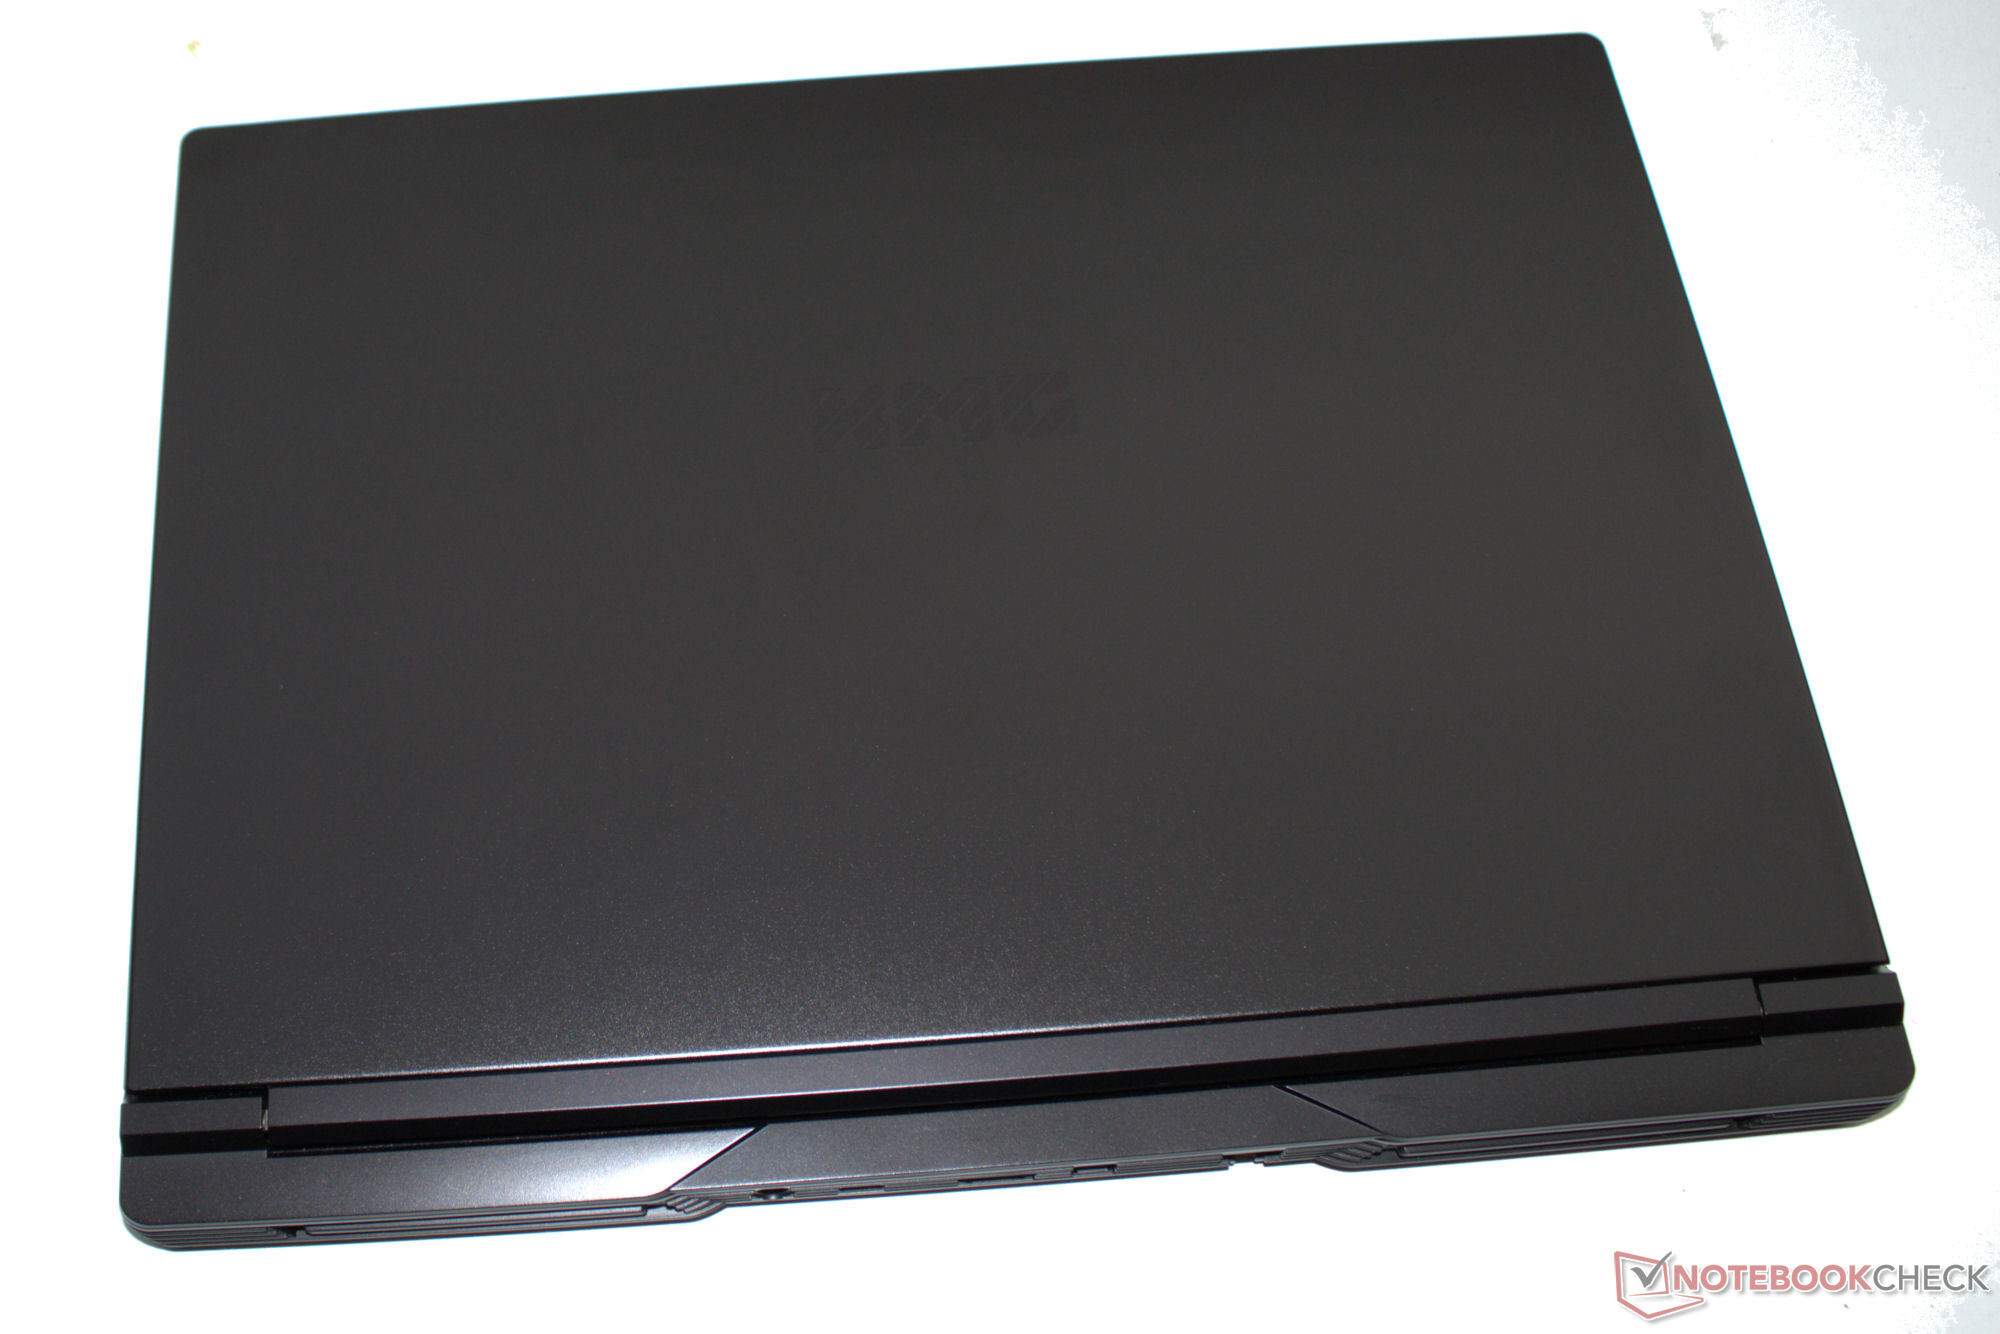
Custodia e connettività - Schenker utilizza un barebone di Clevo
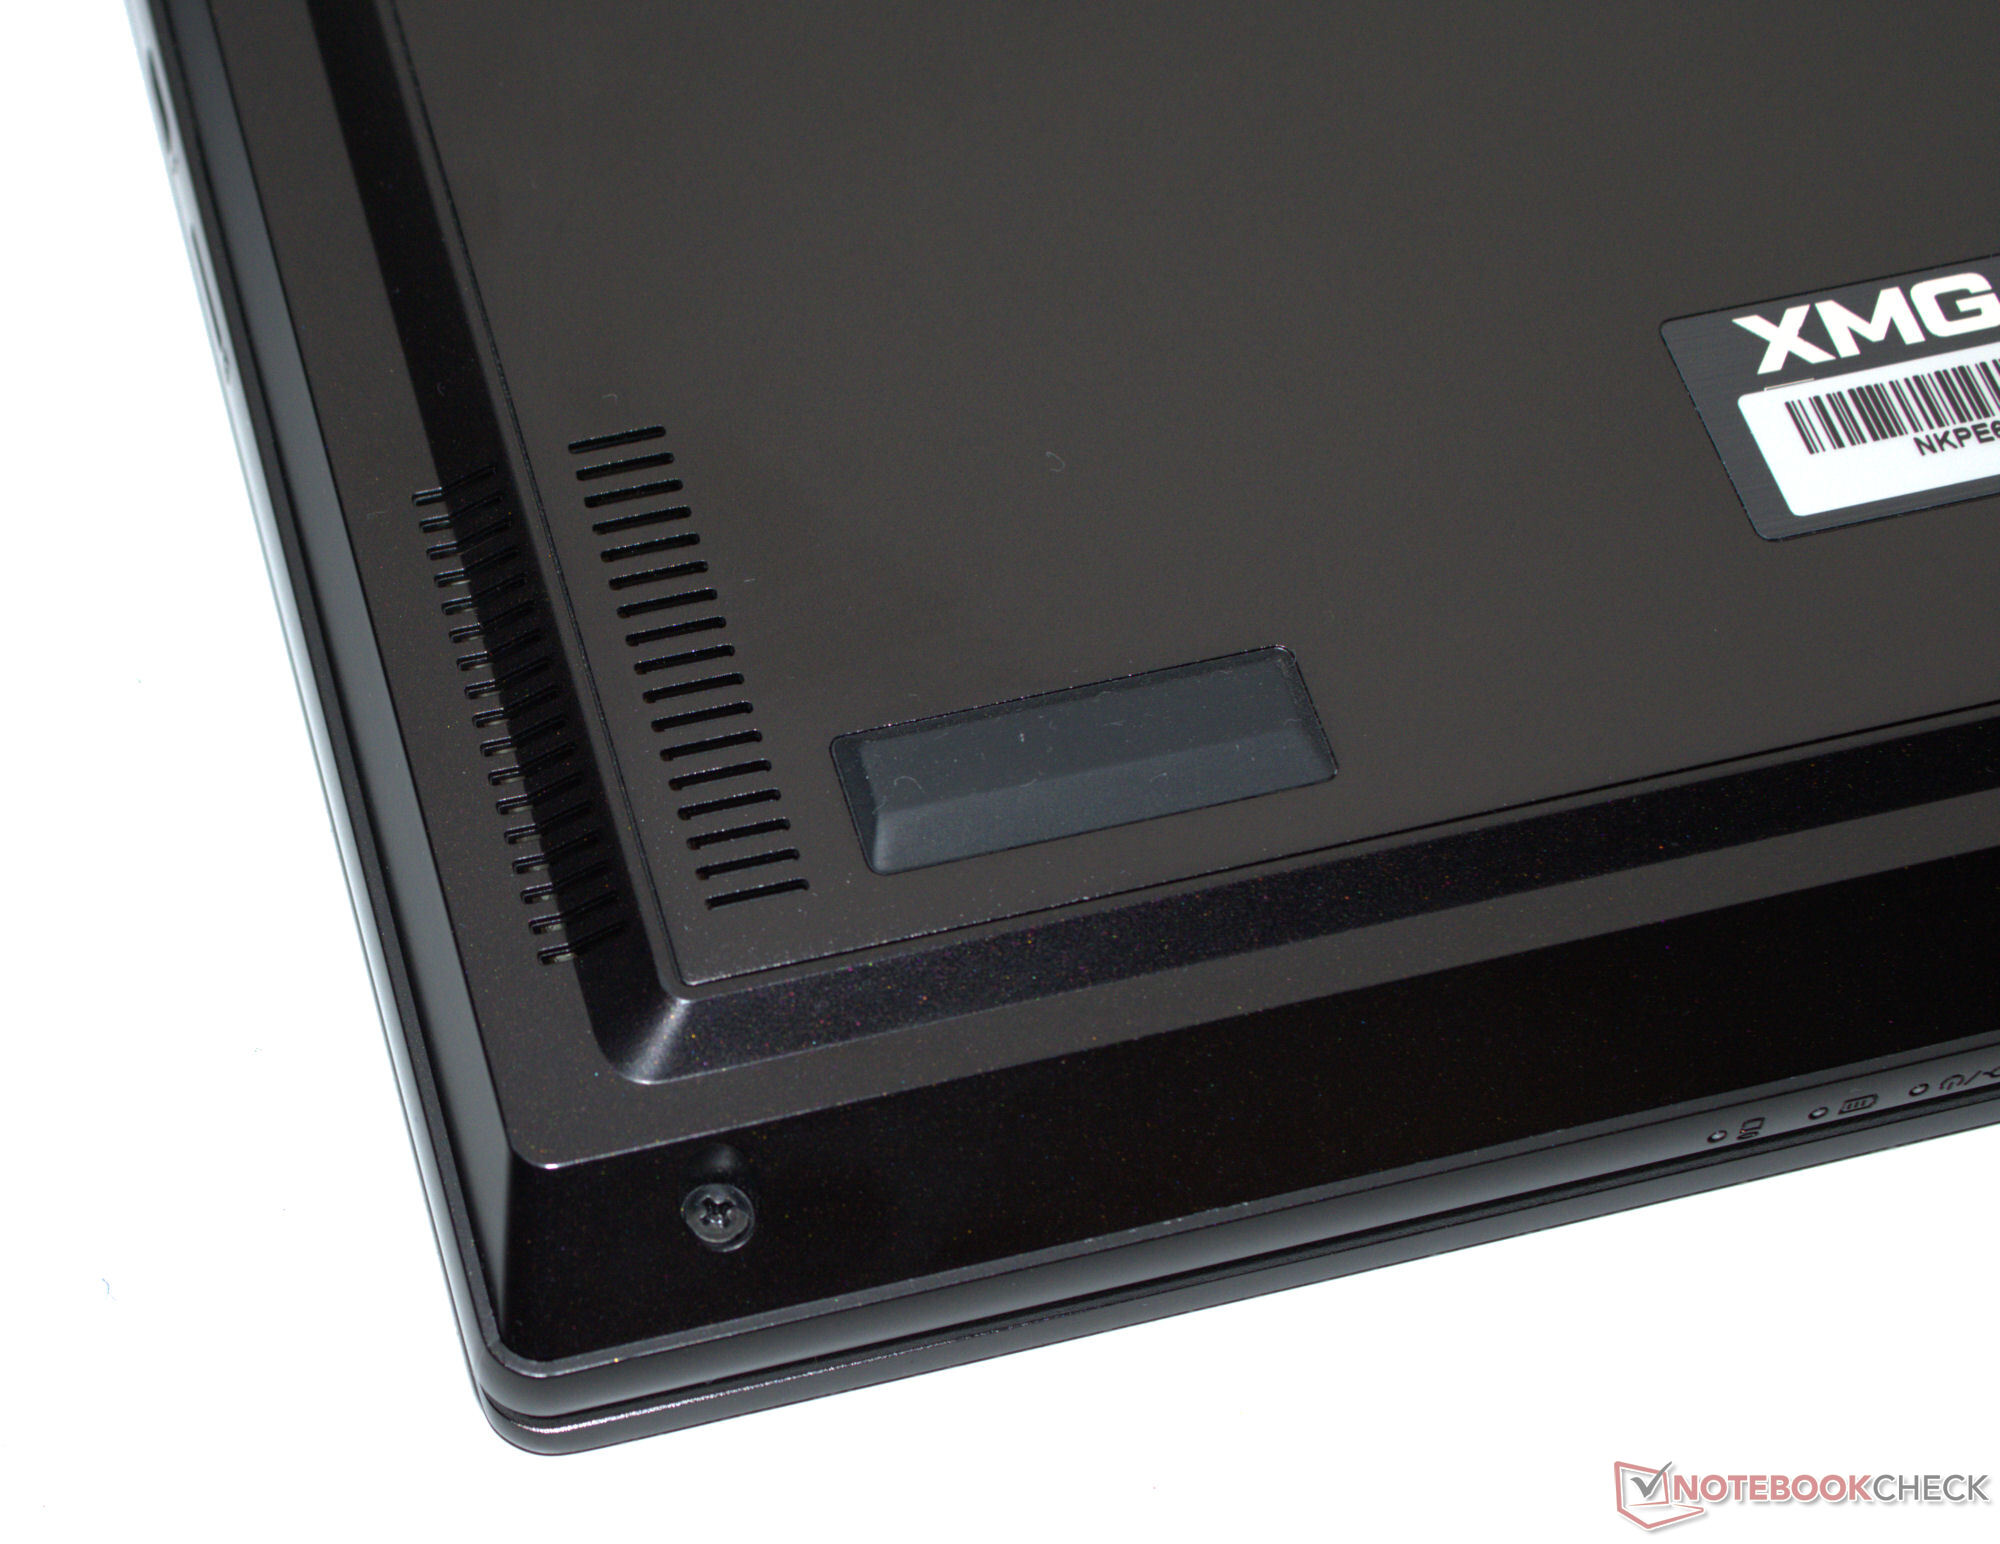
Dall'esterno, non è cambiato nulla: l'ultimo Pro 16 utilizza la stessa custodia in alluminio nero opaco del modello dello scorso anno modello dello scorso anno -se si considera solo il suo involucro esterno. L'unità di base e il coperchio possono essere leggermente ruotati, ma la loro qualità costruttiva è buona. Cercherà invano delle strisce LED su un case dall'aspetto così serio. L'angolo di apertura massimo del coperchio è di 130 gradi.
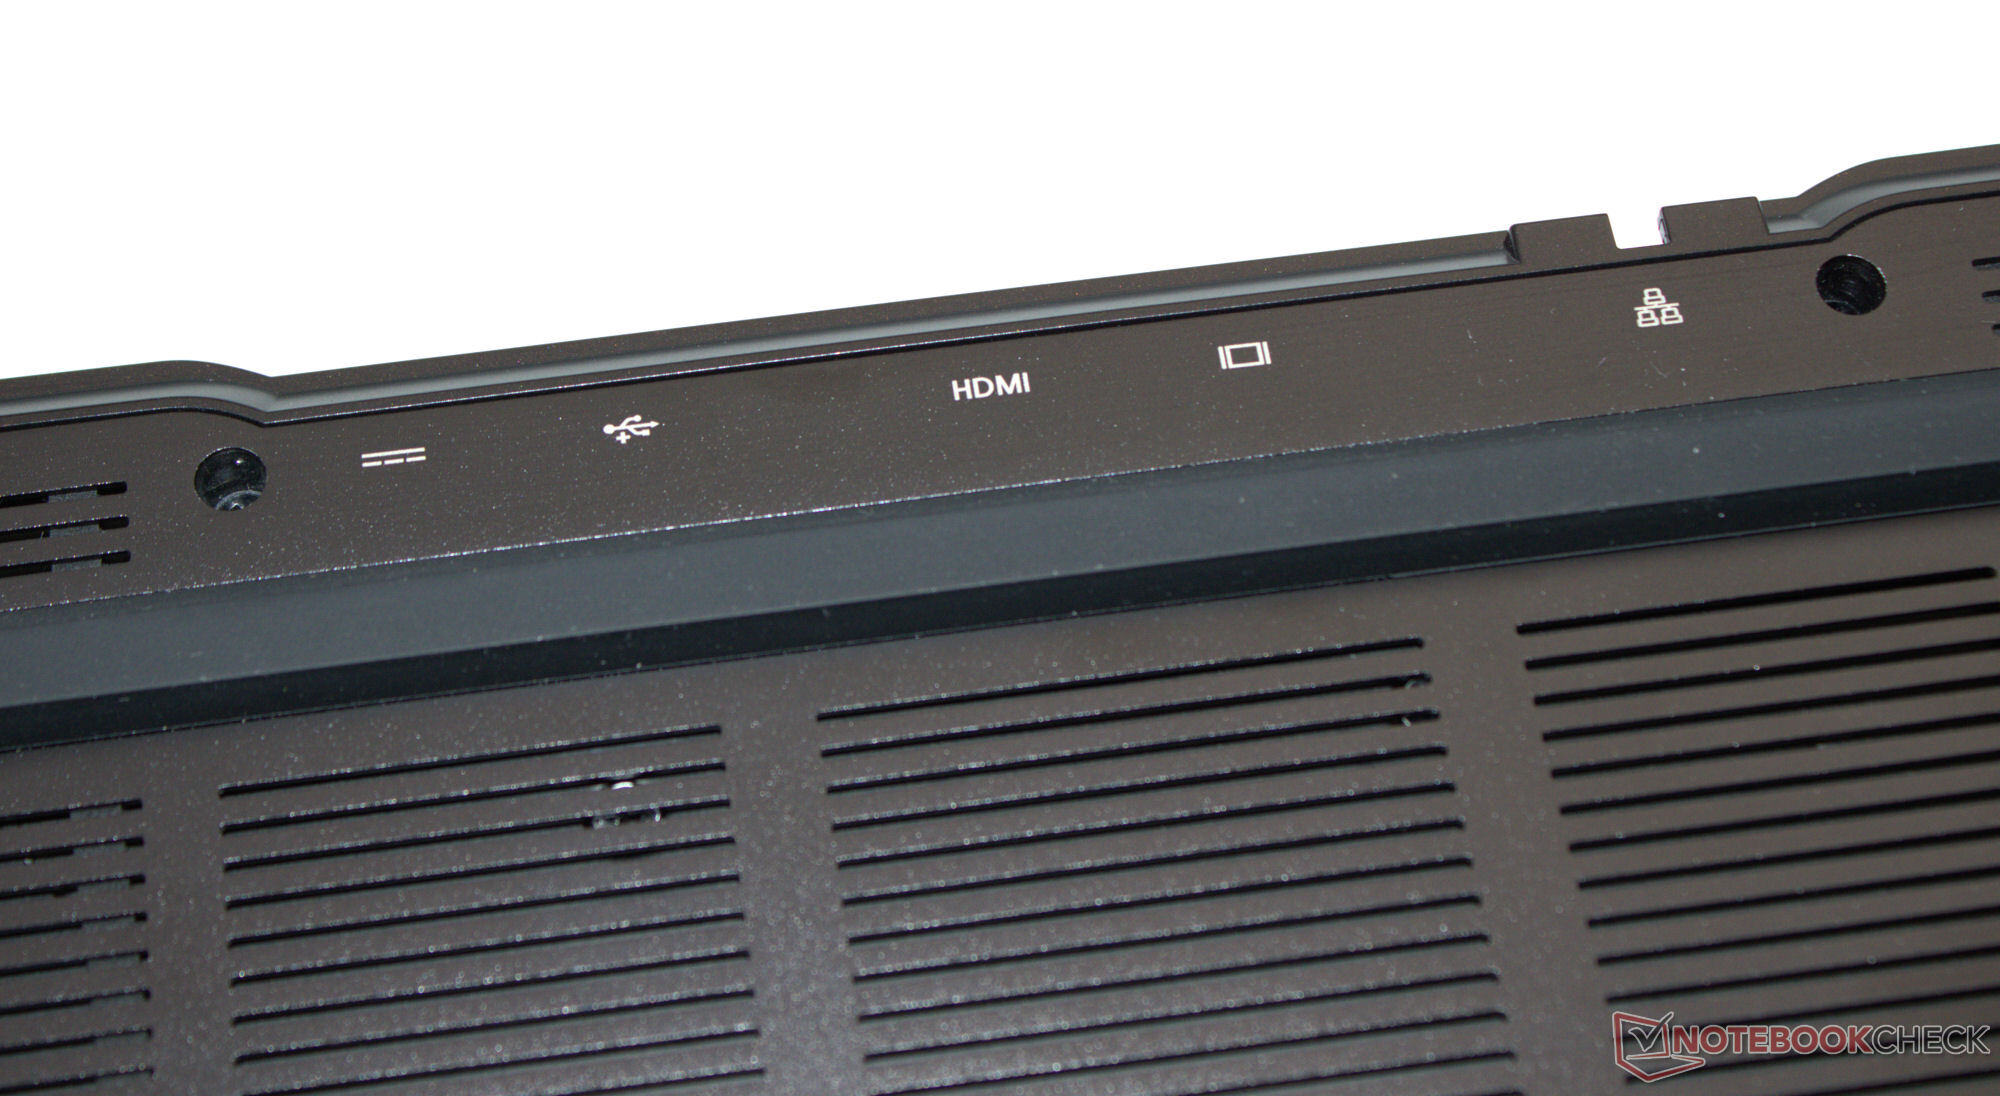
Due porte USB-A (USB 3.2 Gen 1), due porte USB-C (1x USB 3.2 Gen 2, 1x TB 4/USB 4) e tre uscite video dovrebbero essere sufficienti per la maggior parte degli utenti; nel peggiore dei casi, potrebbe dover ricorrere a una docking station. Power Delivery è supportato grazie alla porta TB4. La porta Gigabit Ethernet consente velocità di trasmissione dati fino a 2,5 Gbit/s.
In condizioni ottimali (nessun dispositivo WiFi nelle vicinanze, breve distanza tra il portatile e il PC server), il chip WiFi-6E di Intel (AX211) produce velocità di trasmissione dati da buone a molto buone. La webcam FHD (2,1 MP, senza copertura) non fa scatti sorprendenti. Il lettore di schede MicroSD (scheda di riferimento: AV PRO microSD 128 GB V60) ha una velocità media.


| SD Card Reader | |
| average JPG Copy Test (av. of 3 runs) | |
| Aorus 16X 2024 (AV PRO microSD 128 GB V60) | |
| Media della classe Gaming (19 - 202, n=95, ultimi 2 anni) | |
| XMG Pro 16 Studio (Mid 23) (AV PRO microSD 128 GB V60) | |
| SCHENKER XMG Pro 16 Studio (Mid 24) (AV PRO microSD 128 GB V60) | |
| Lenovo Legion 7 16 IRX G9 (Angelbird AV Pro V60) | |
| Acer Predator Helios Neo 16 (2024) (AV PRO microSD 128 GB V60) | |
| maximum AS SSD Seq Read Test (1GB) | |
| Aorus 16X 2024 (AV PRO microSD 128 GB V60) | |
| Media della classe Gaming (25.8 - 269, n=95, ultimi 2 anni) | |
| XMG Pro 16 Studio (Mid 23) (AV PRO microSD 128 GB V60) | |
| Lenovo Legion 7 16 IRX G9 (Angelbird AV Pro V60) | |
| SCHENKER XMG Pro 16 Studio (Mid 24) (AV PRO microSD 128 GB V60) | |
| Acer Predator Helios Neo 16 (2024) (AV PRO microSD 128 GB V60) | |
 NVIDIA GeForce RTX 4070 Laptop GPU, i9-14900HX, Samsung 990 Pro 1 TB")
 NVIDIA GeForce RTX 4070 Laptop GPU, i9-14900HX, Samsung 990 Pro 1 TB")
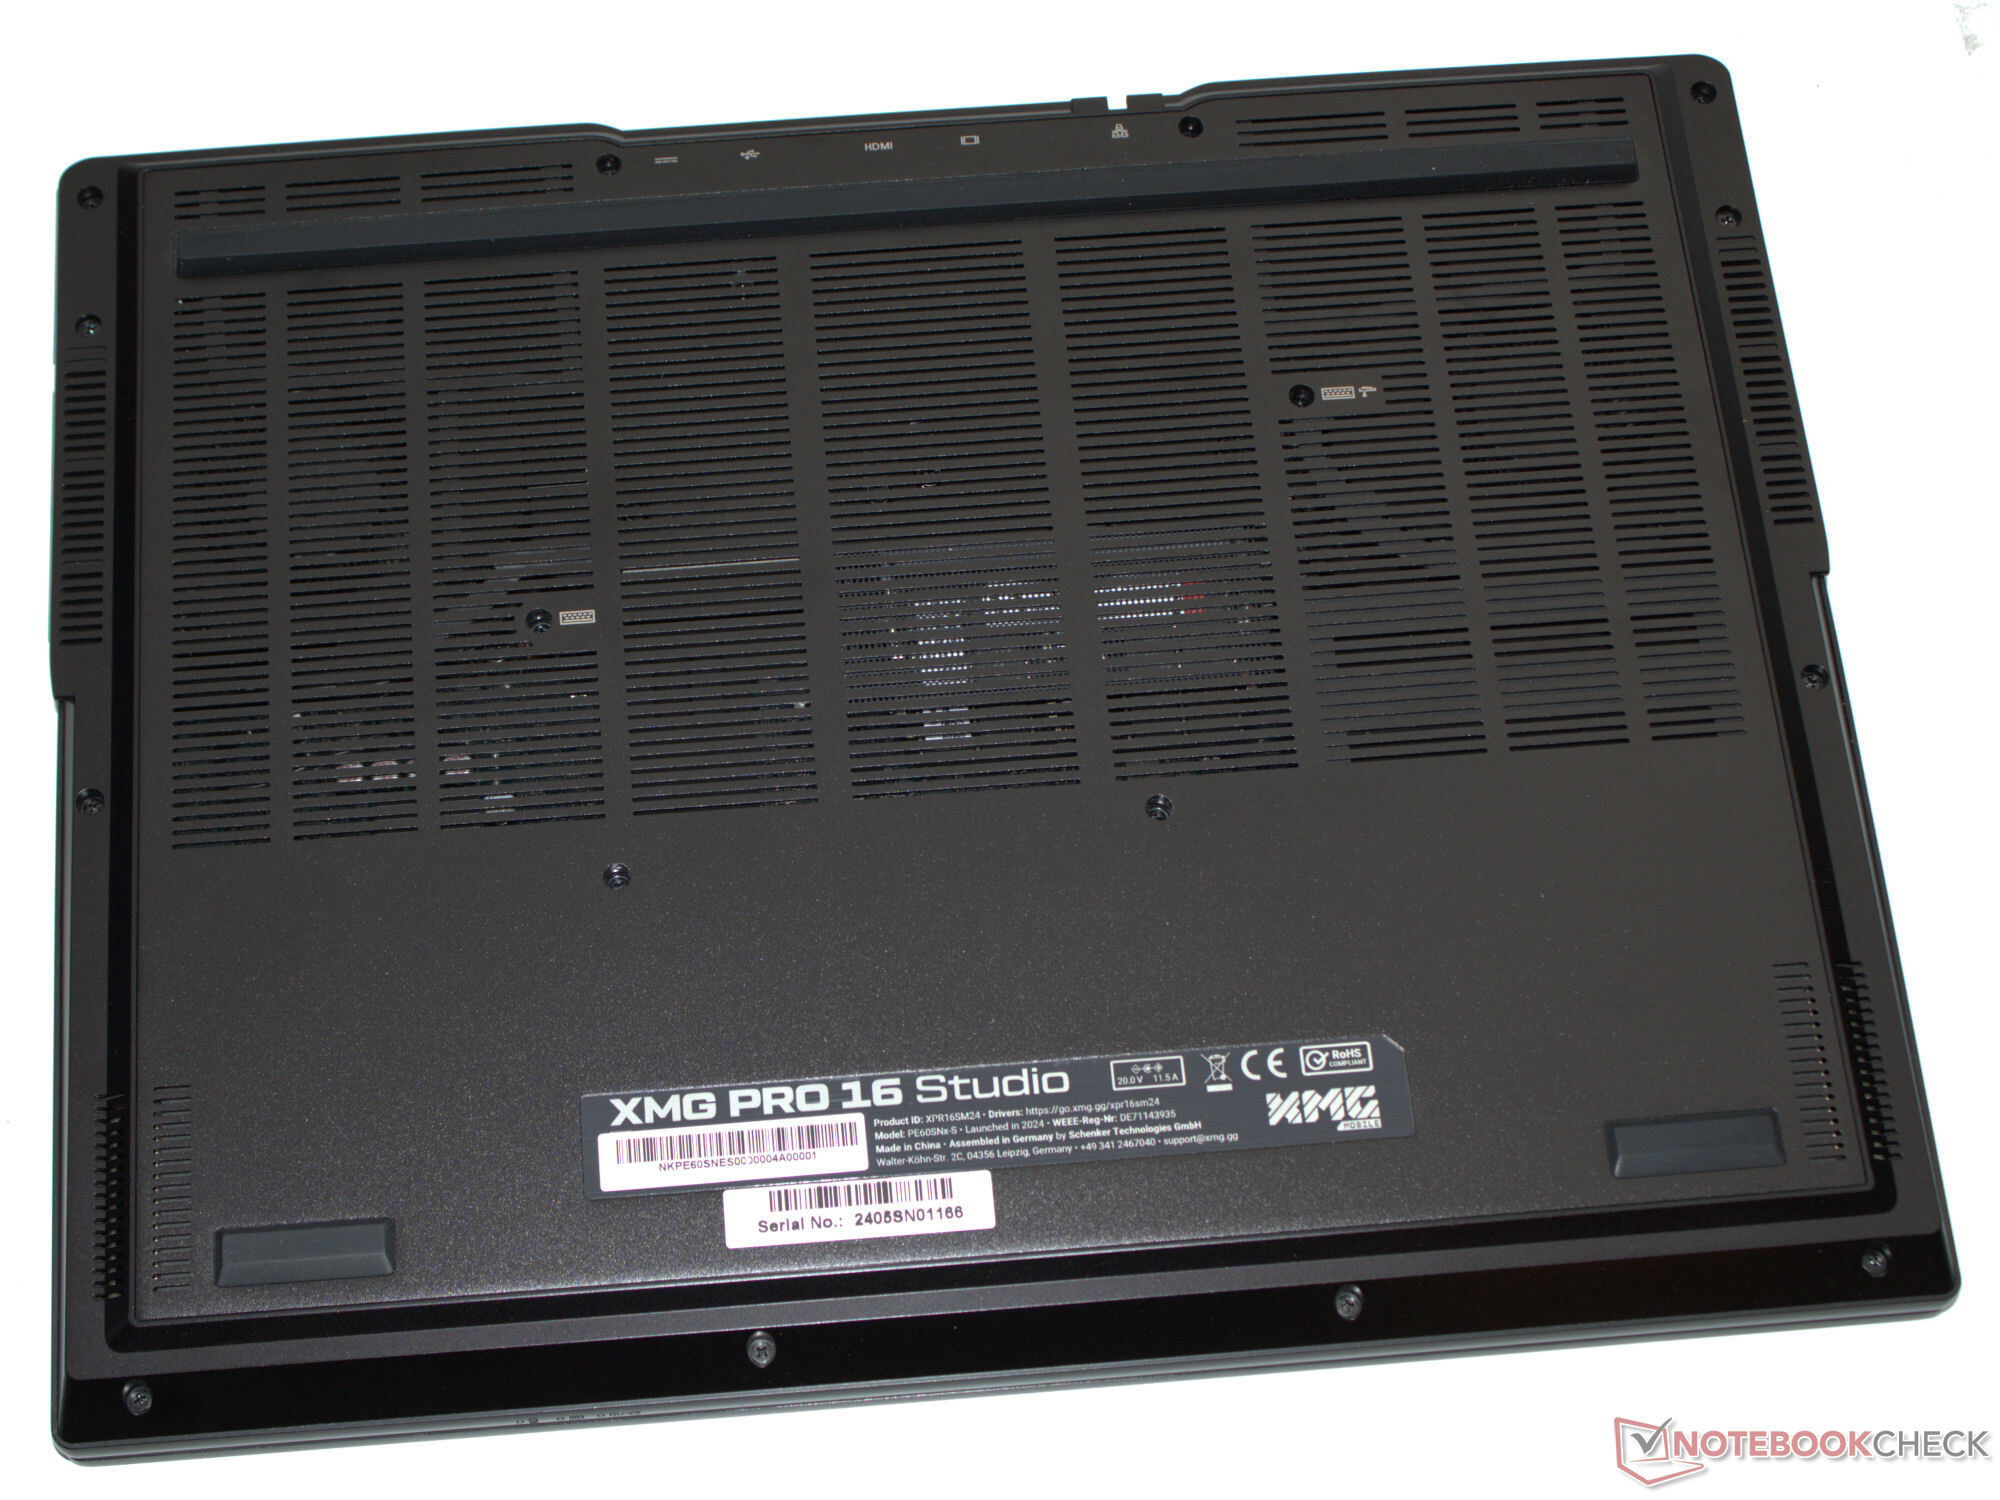
Sostenibilità
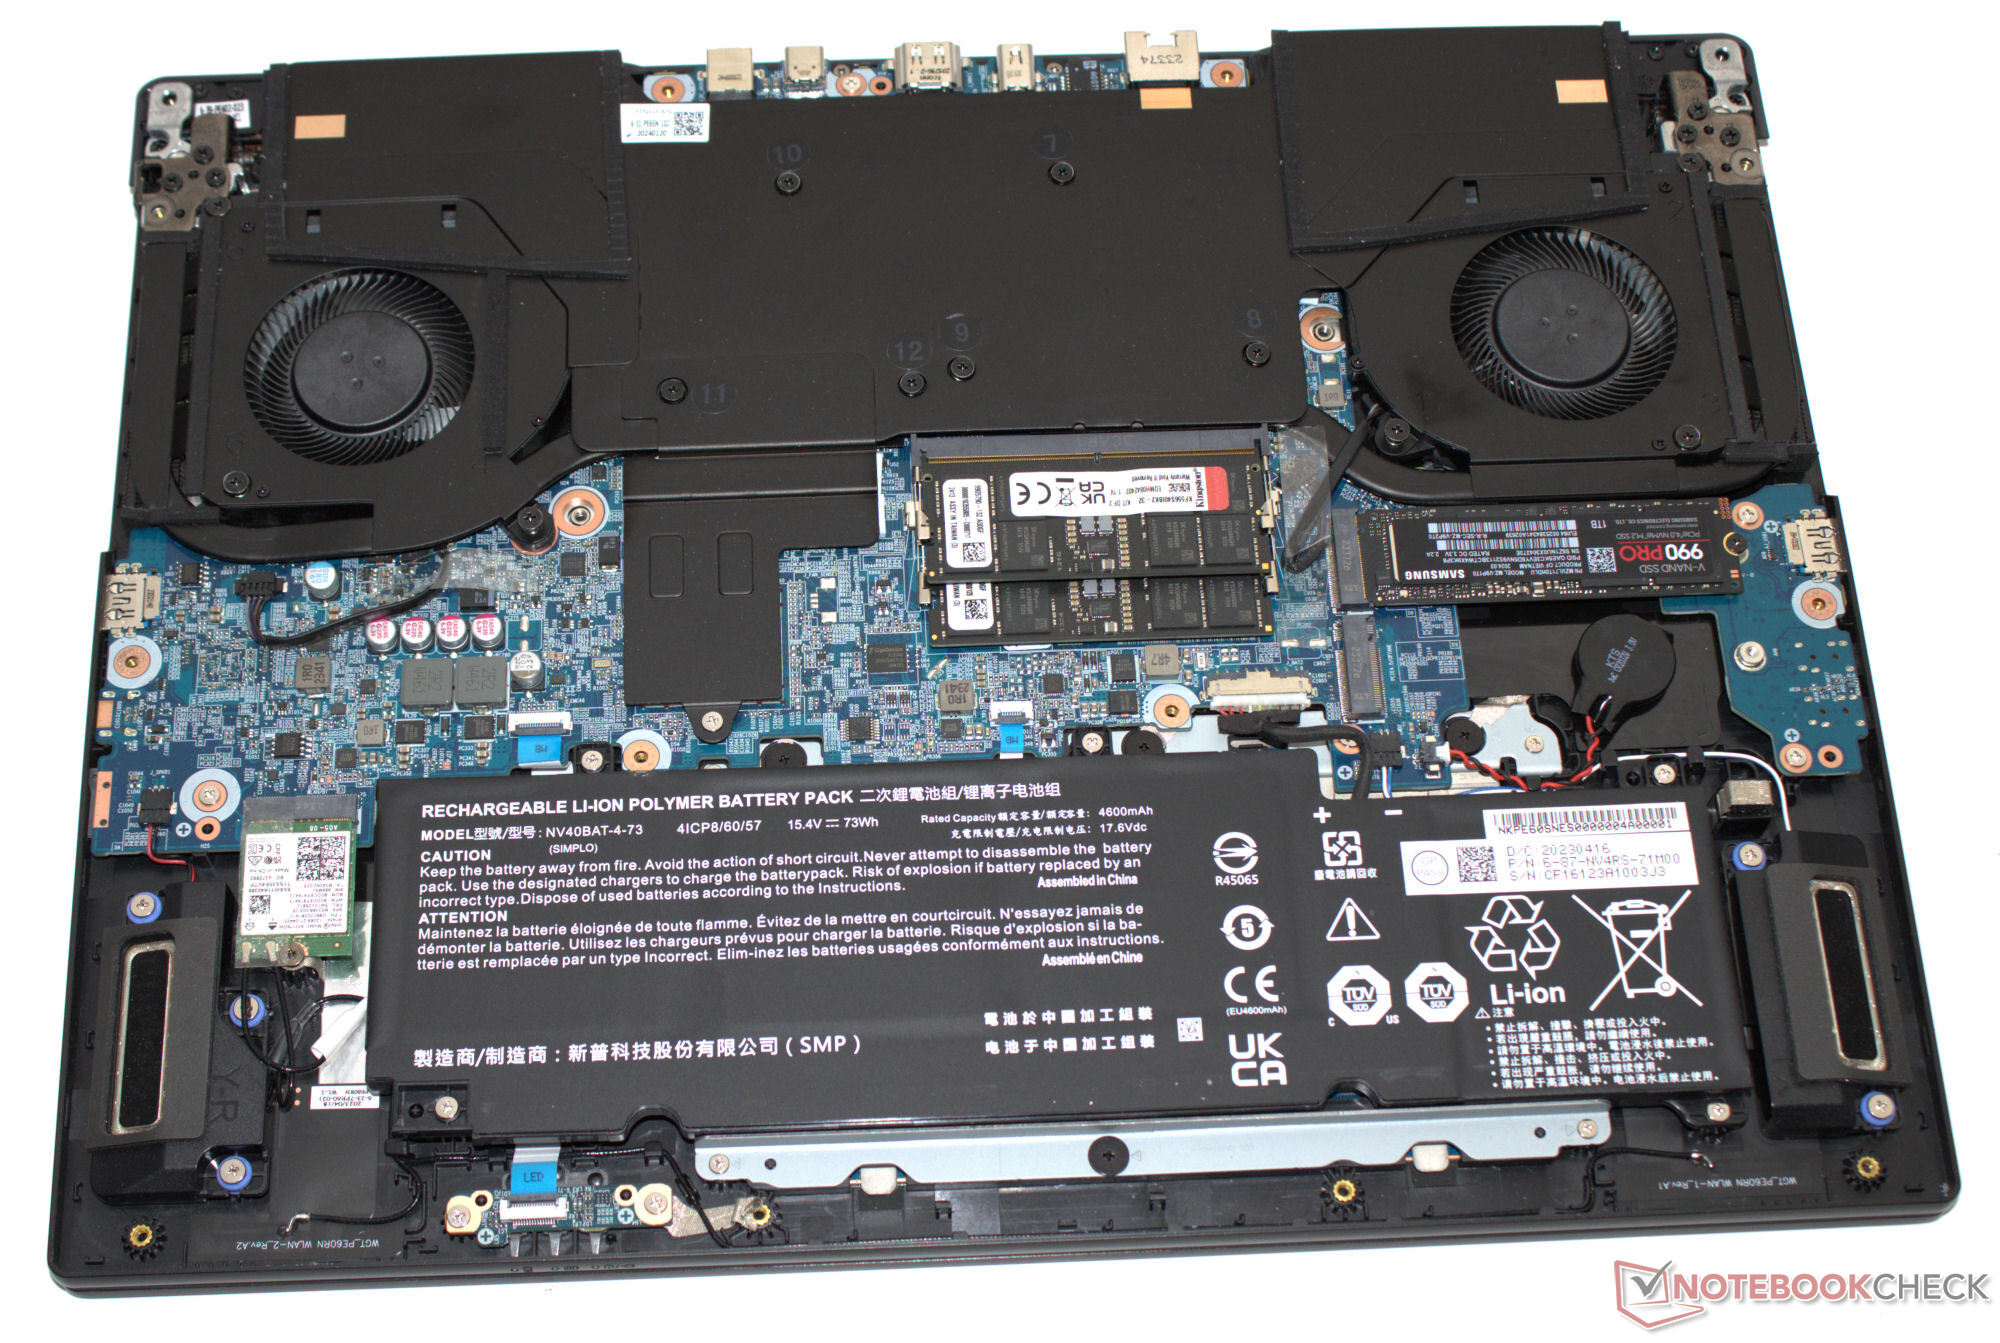
Il computer portatile e gli accessori sono protetti da ogni tipo di custodia in plastica (supporto in schiuma, pellicola, borsa). I nomi delle plastiche utilizzate sono stampati su di esse. Eccezione: La copertura in pellicola trasparente sul coperchio è priva delle informazioni corrispondenti. L'hardware del dispositivo è accessibile dopo aver rimosso la piastra di base, in modo da poter eseguire lavori di manutenzione e riparazione. Gli aggiornamenti del software dovrebbero essere garantiti per i prossimi anni.
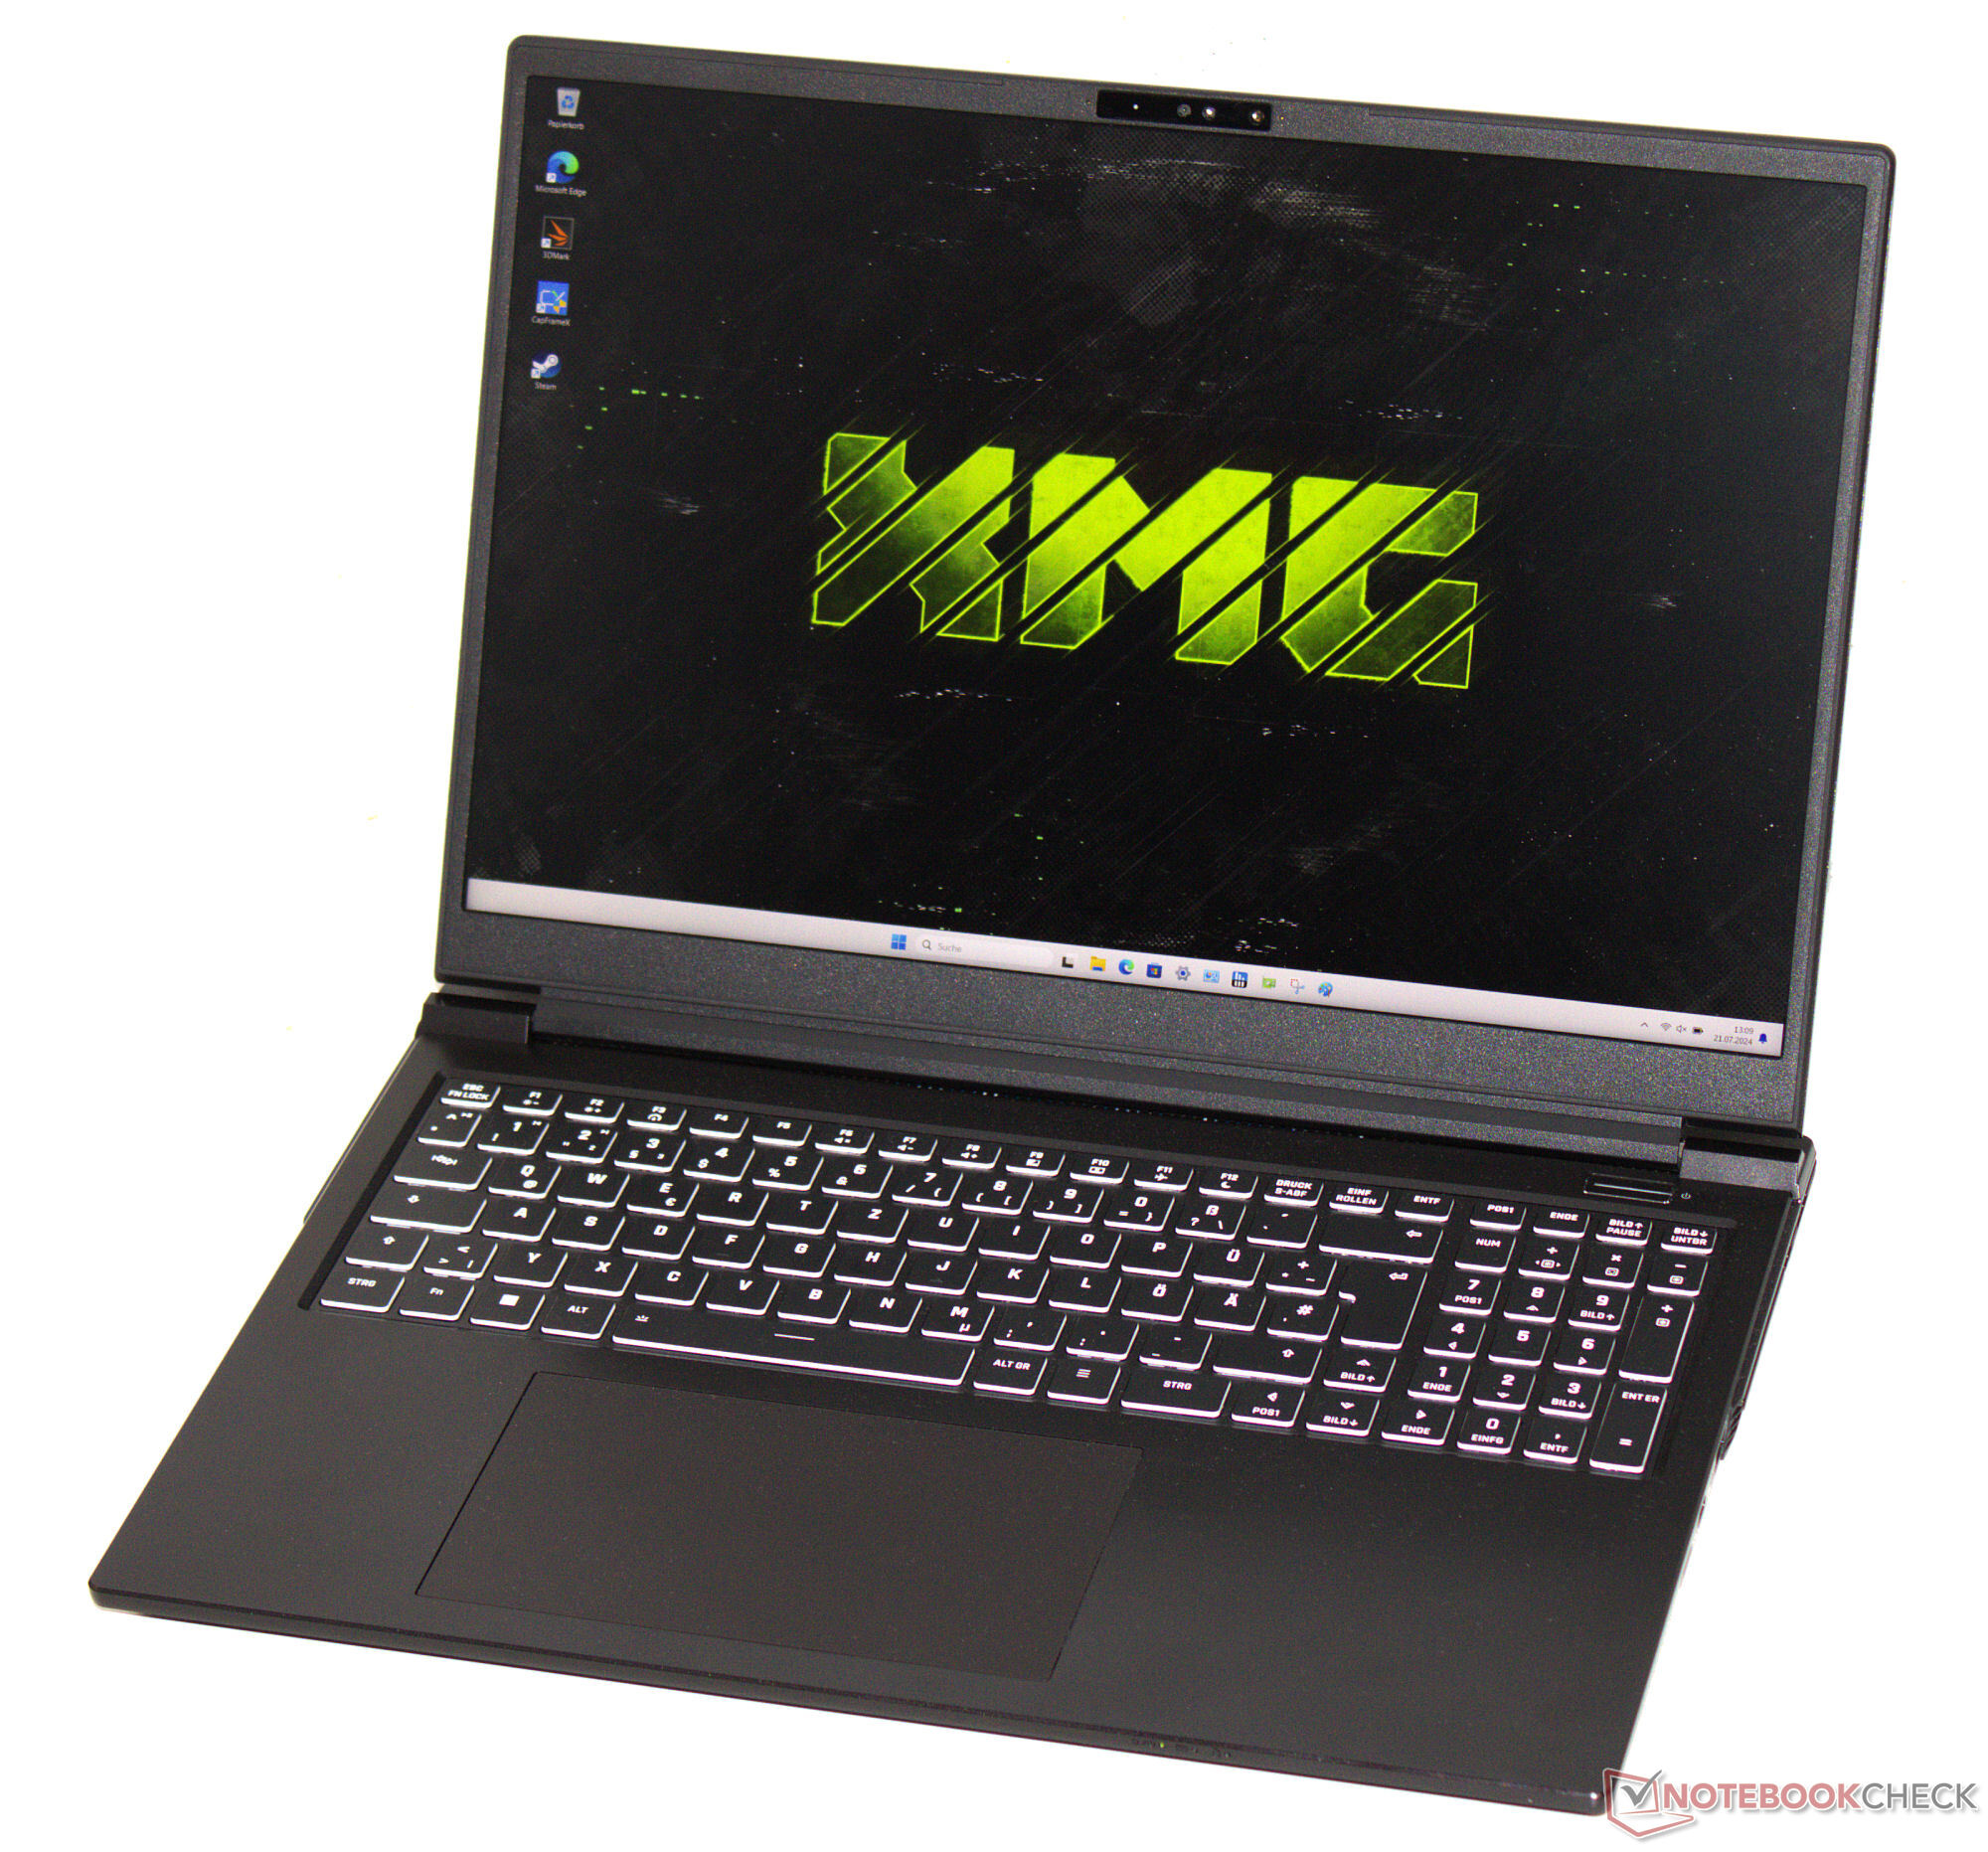
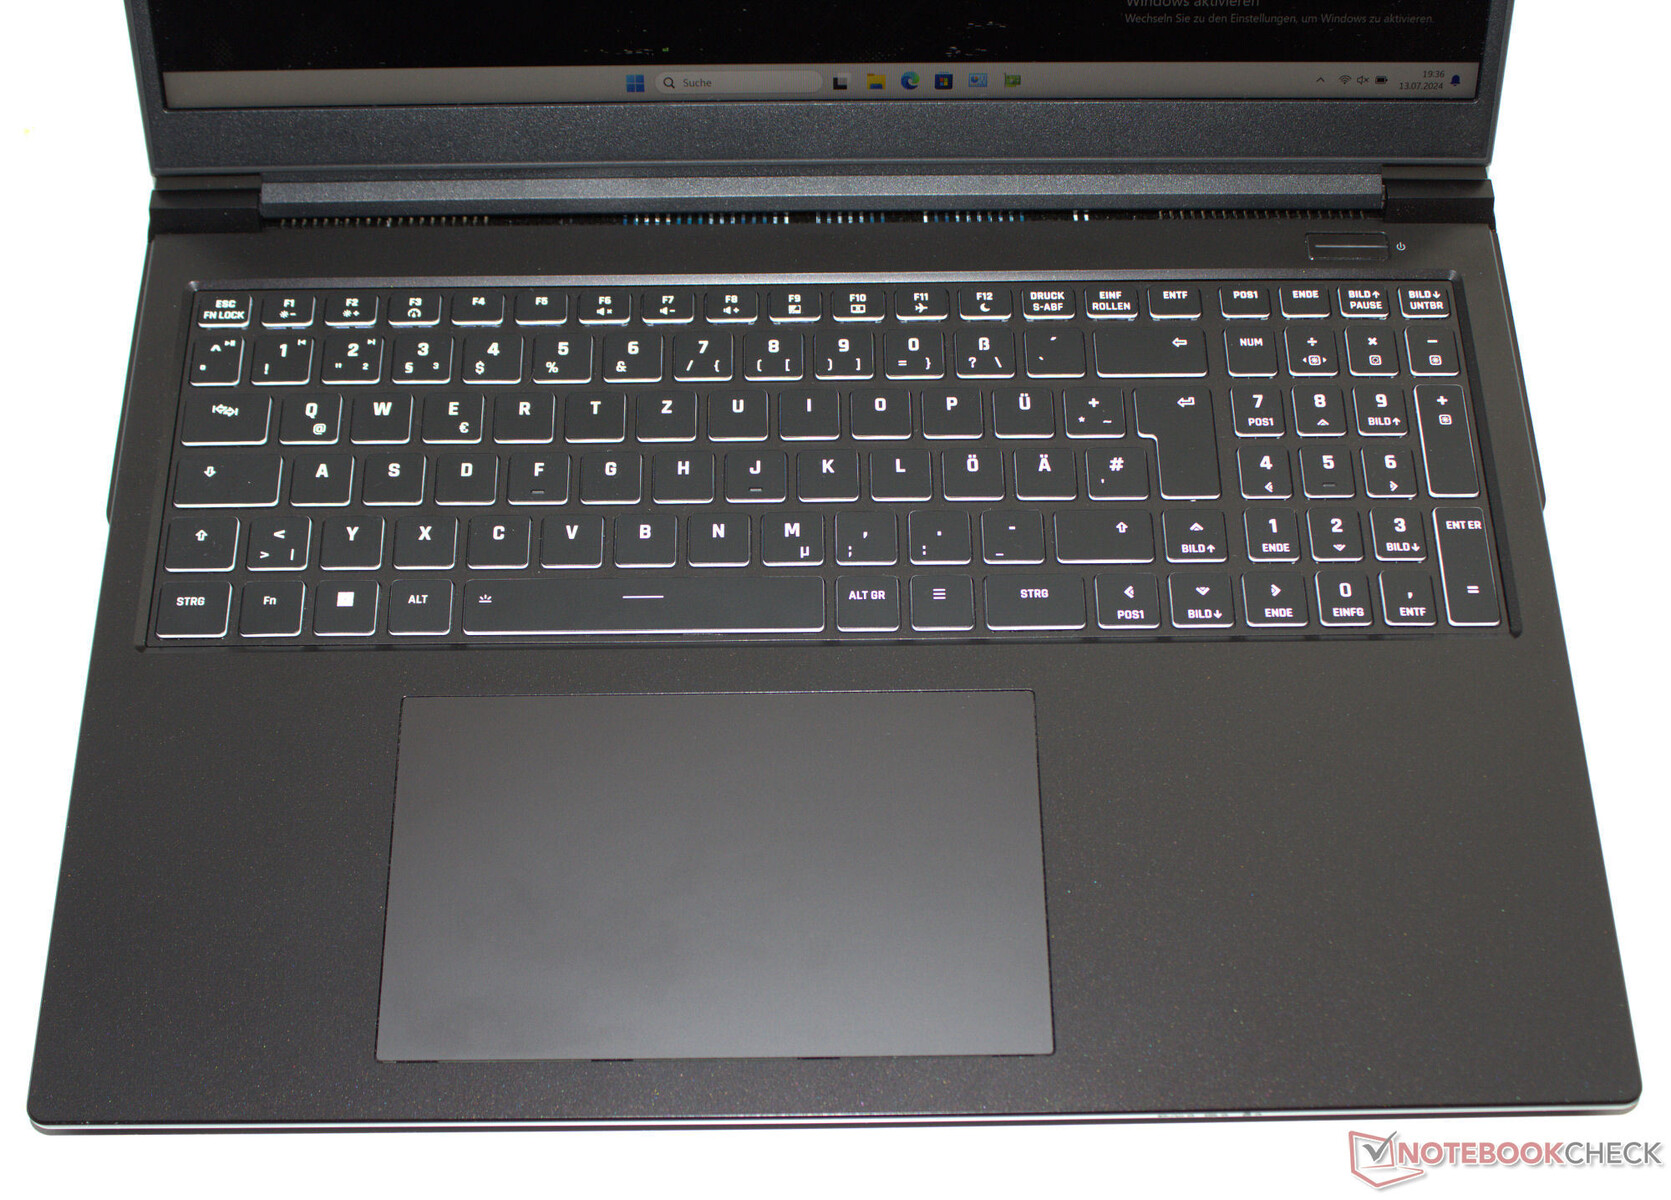
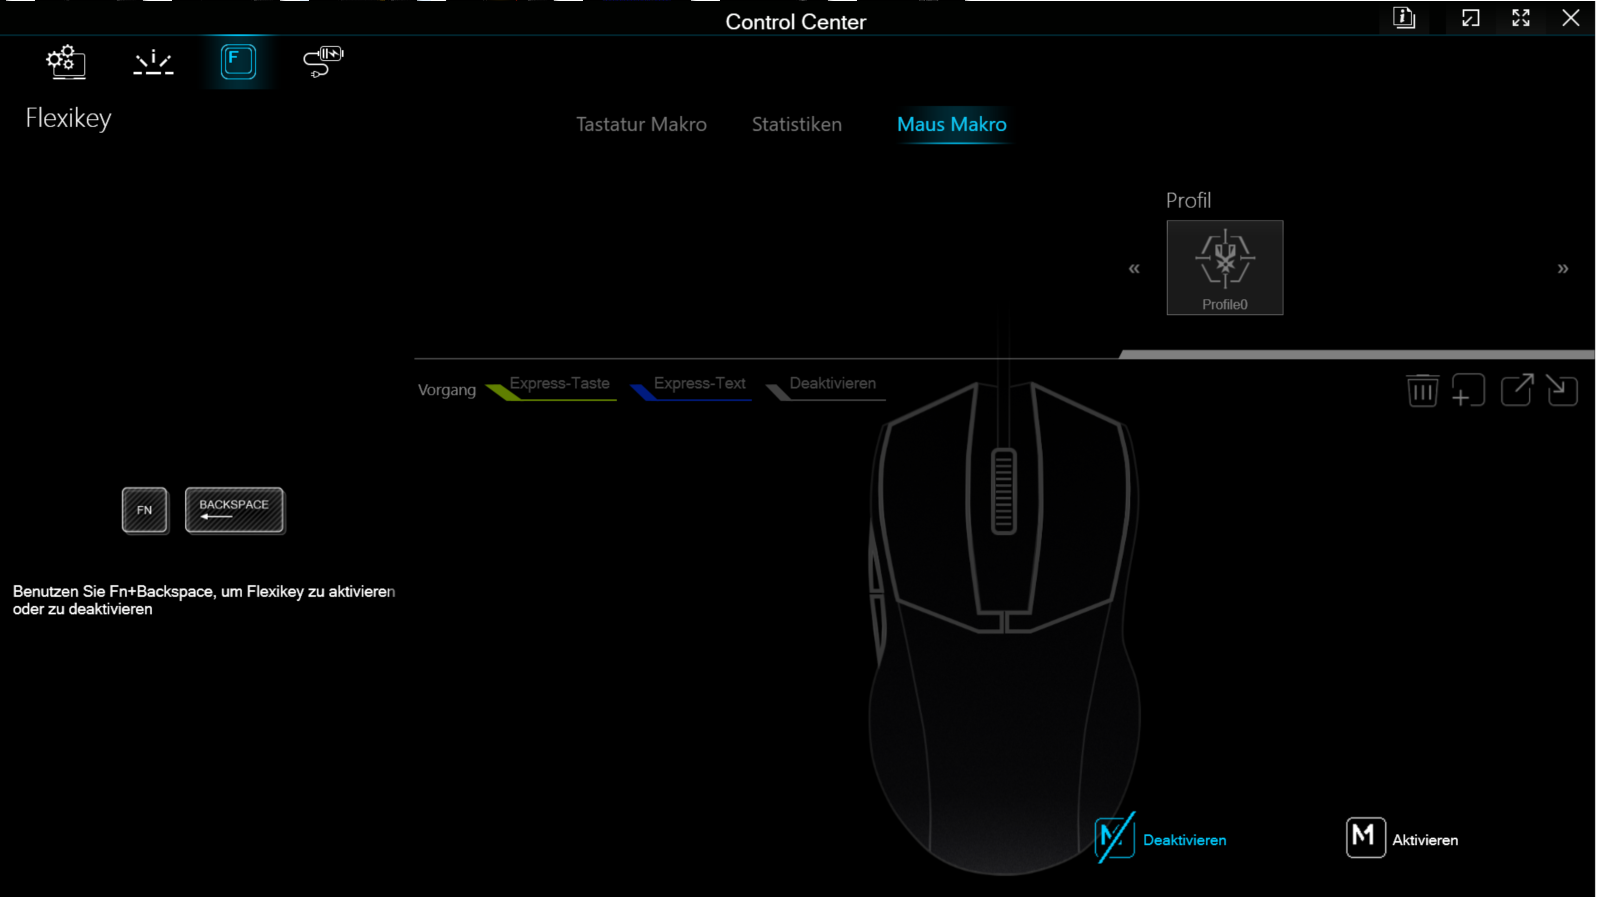
Dispositivi di input - Il portatile XMG con una tastiera intercambiabile
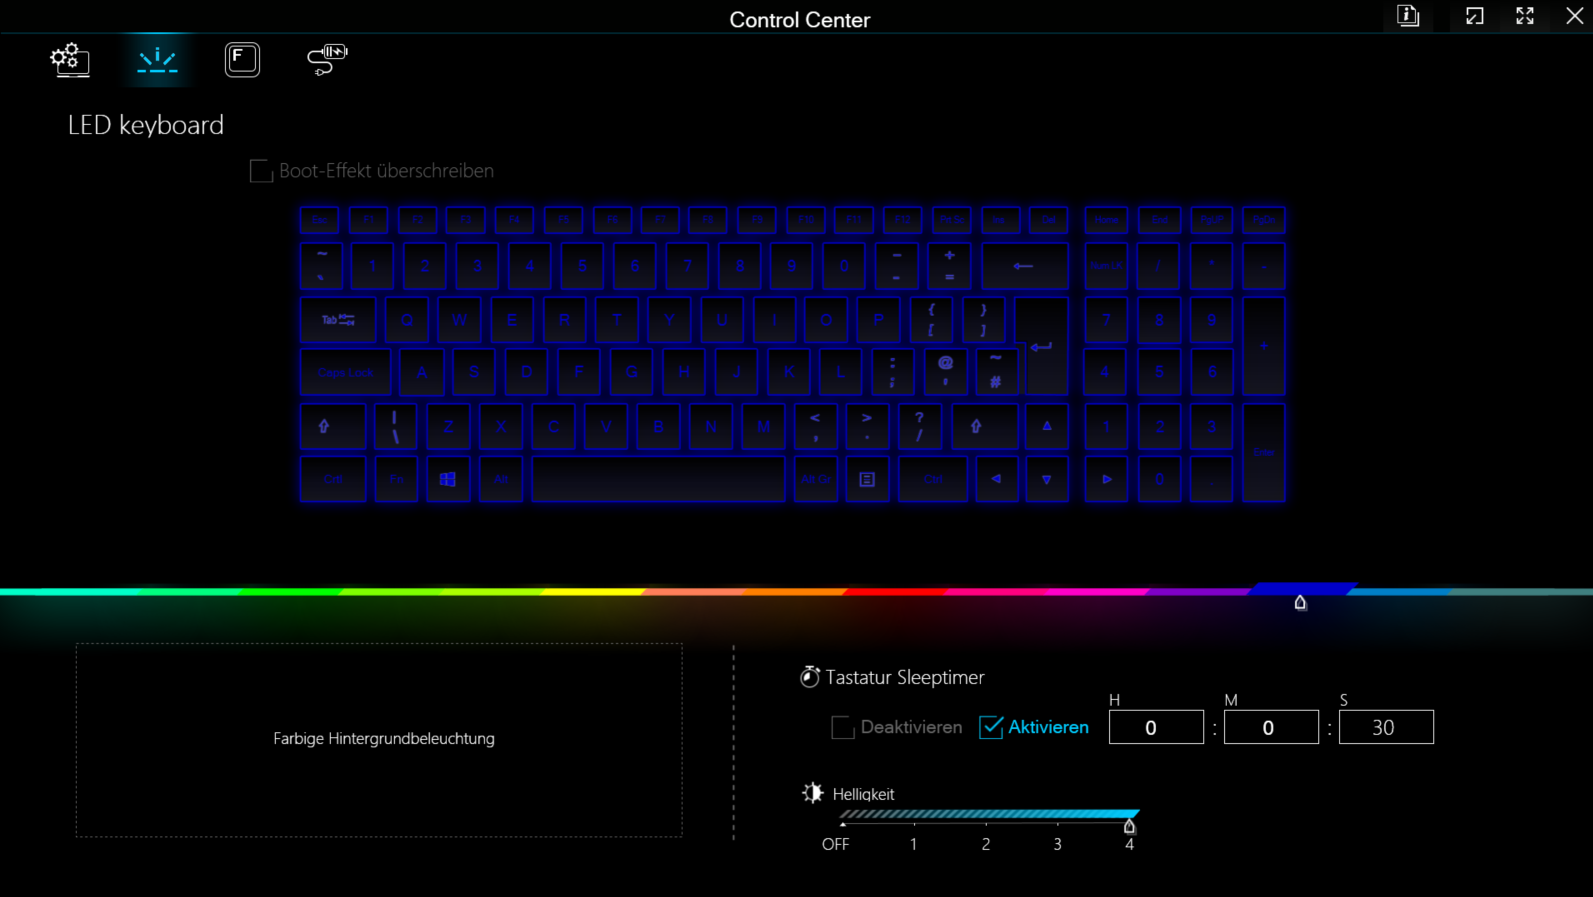
Spesso è la regola con Schenker, e un'eccezione quando si tratta di altri produttori: La tastiera chiclet retroilluminata (RGB, a quattro livelli) potrebbe essere facilmente sostituita, in quanto è tenuta in posizione solo da due viti (e alcune clip). I suoi tasti piatti e lisci hanno una corsa media e un punto di pressione chiaro. La loro resistenza potrebbe essere più nitida, ma è una questione di gusti. Un leggero cedimento della tastiera non dovrebbe ostacolarla durante l'uso quotidiano. Positivo: I quattro tasti freccia sono di dimensioni reali. Un clickpad multi-touch di dimensioni generose (15,1 x 9,1 cm) viene utilizzato per controllare il puntatore del mouse.
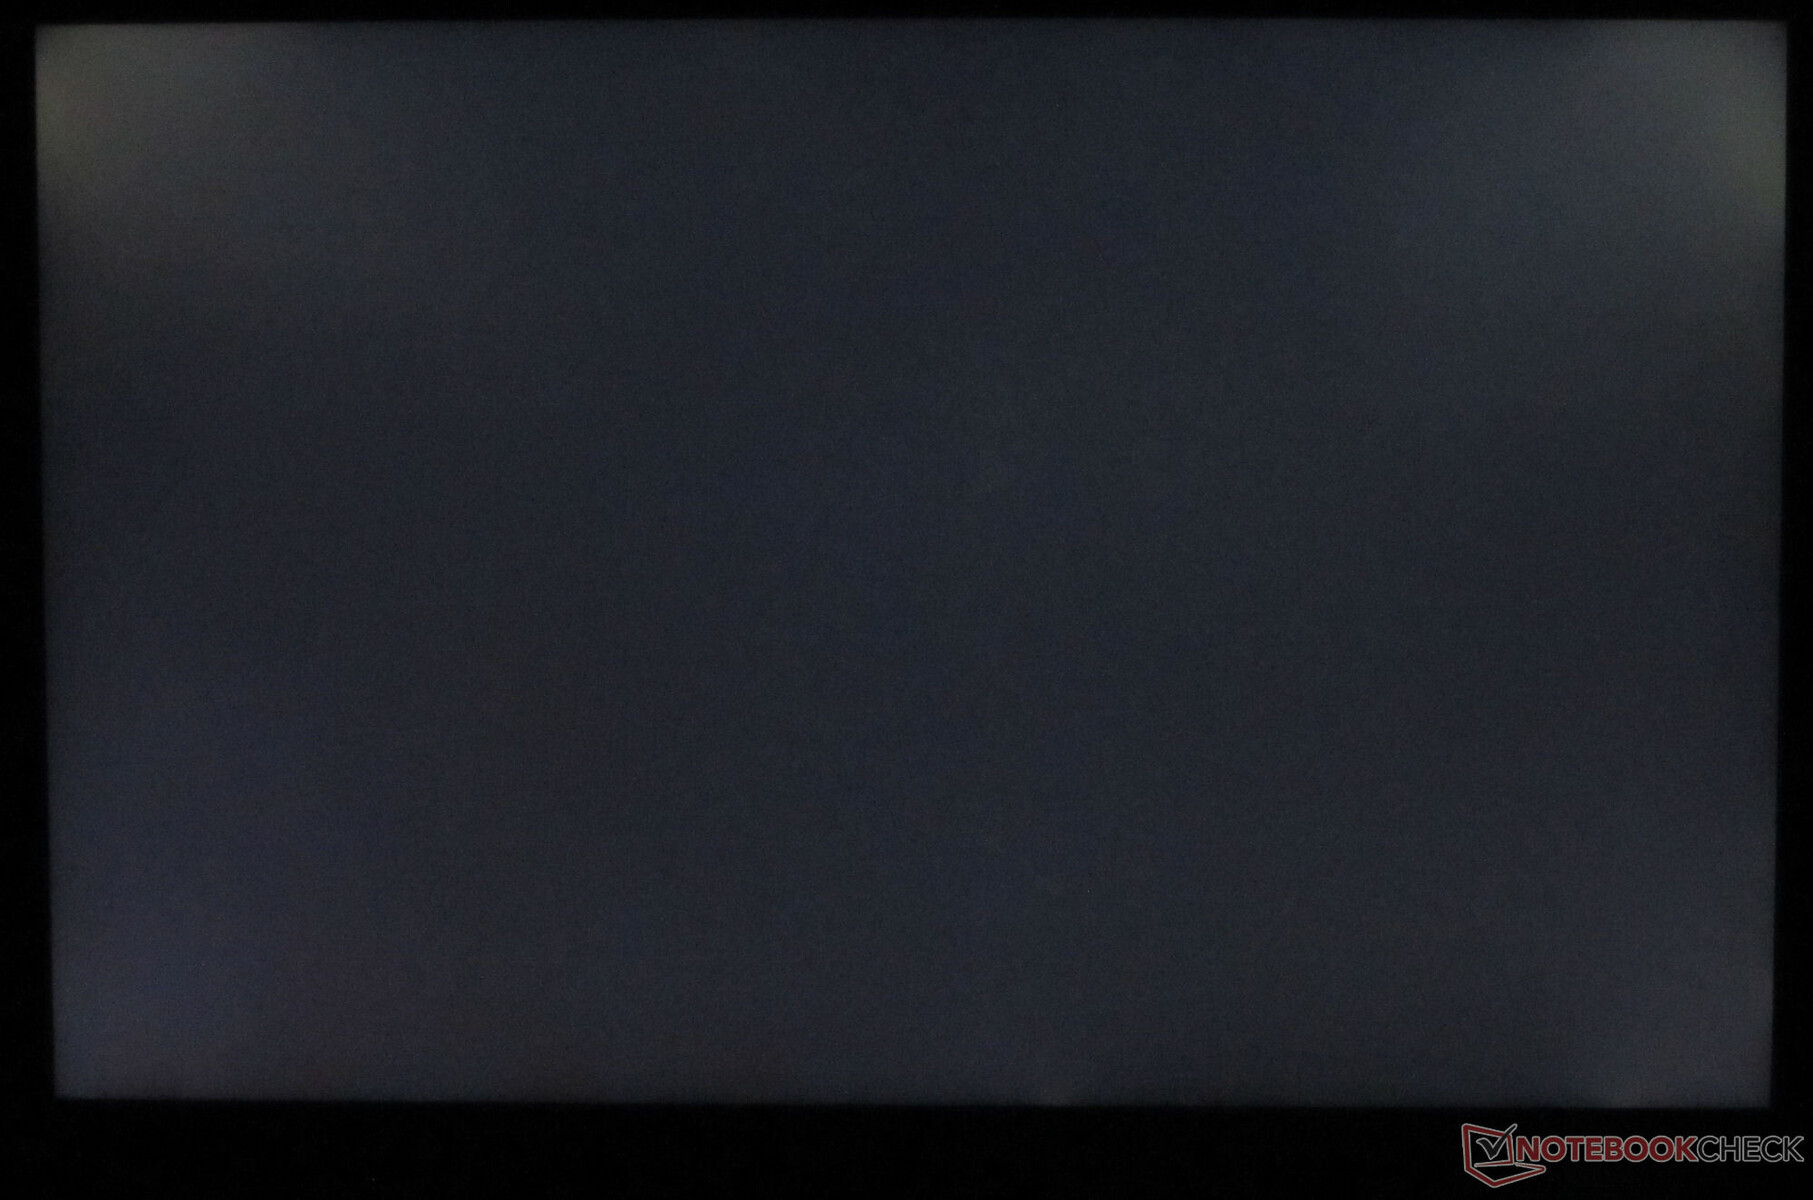
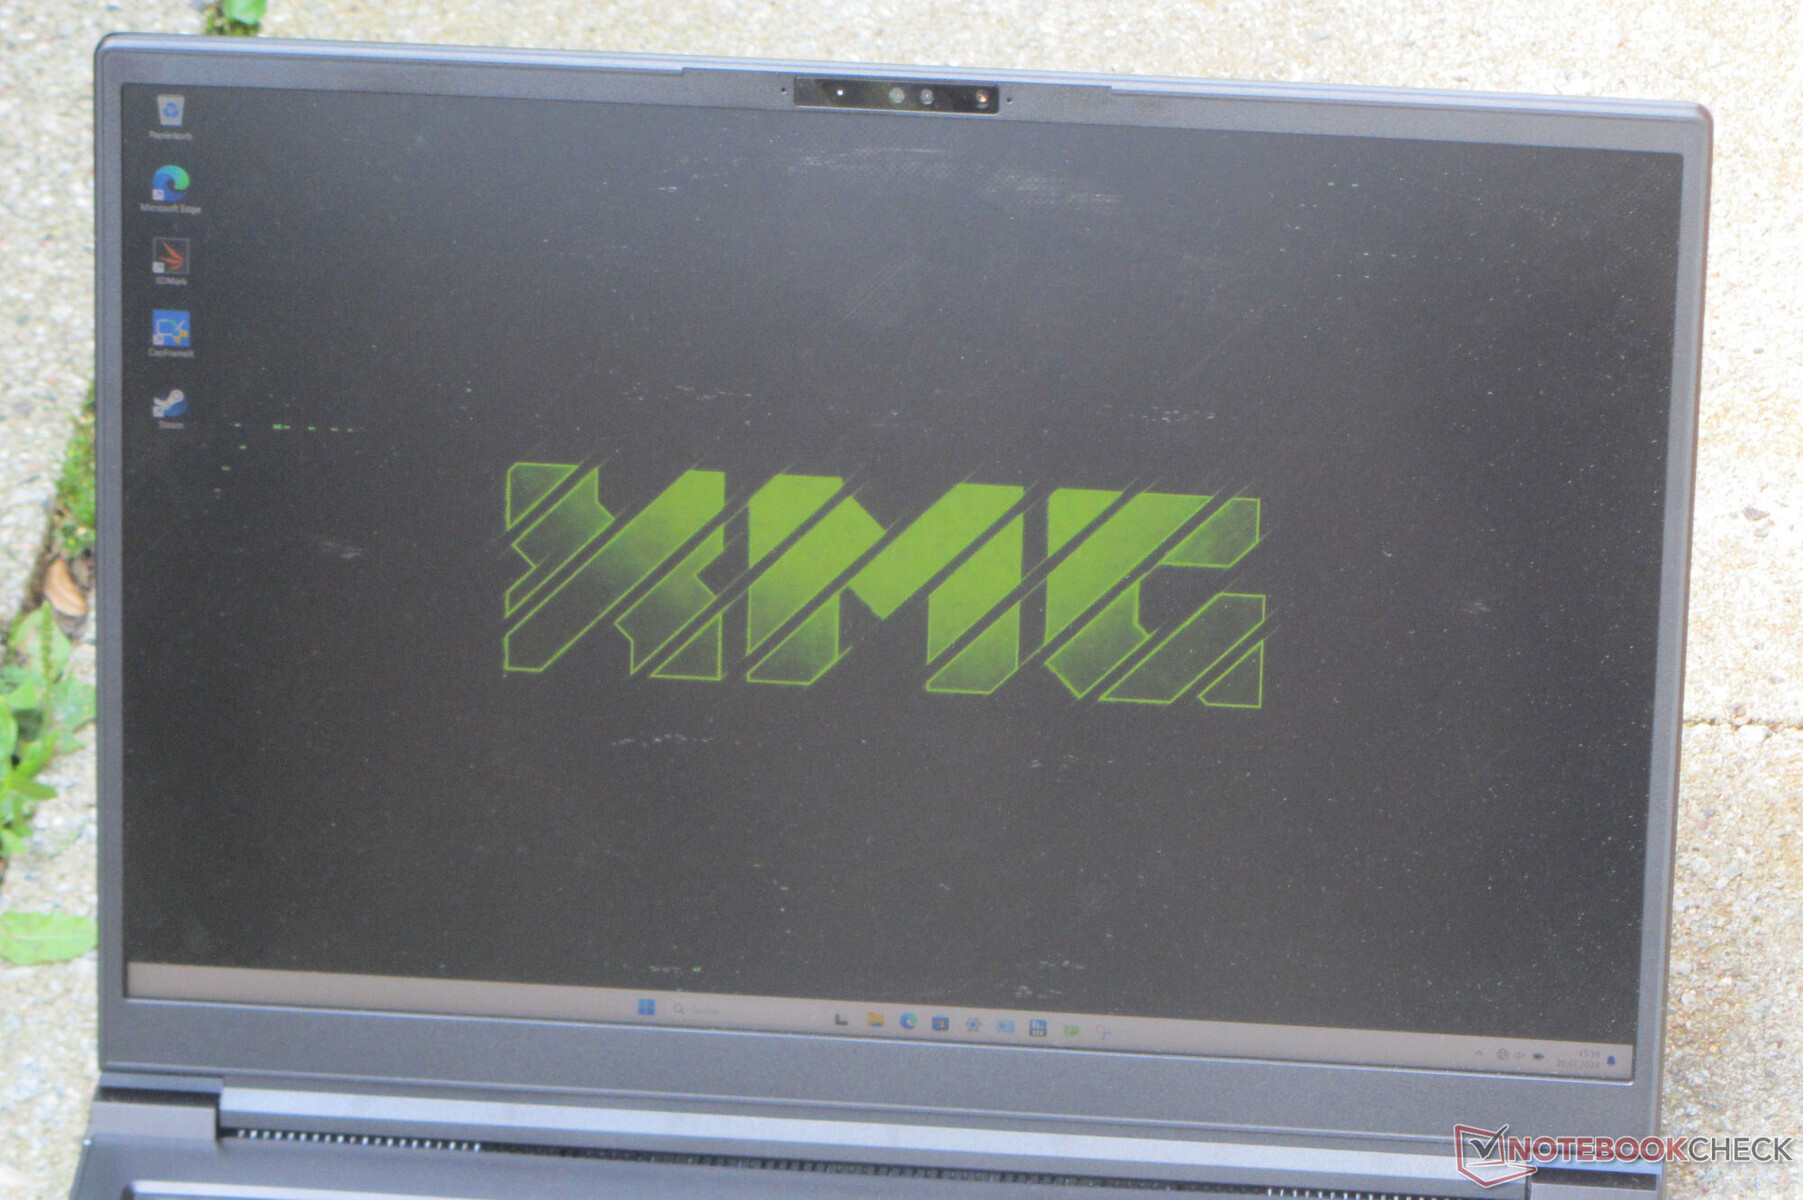
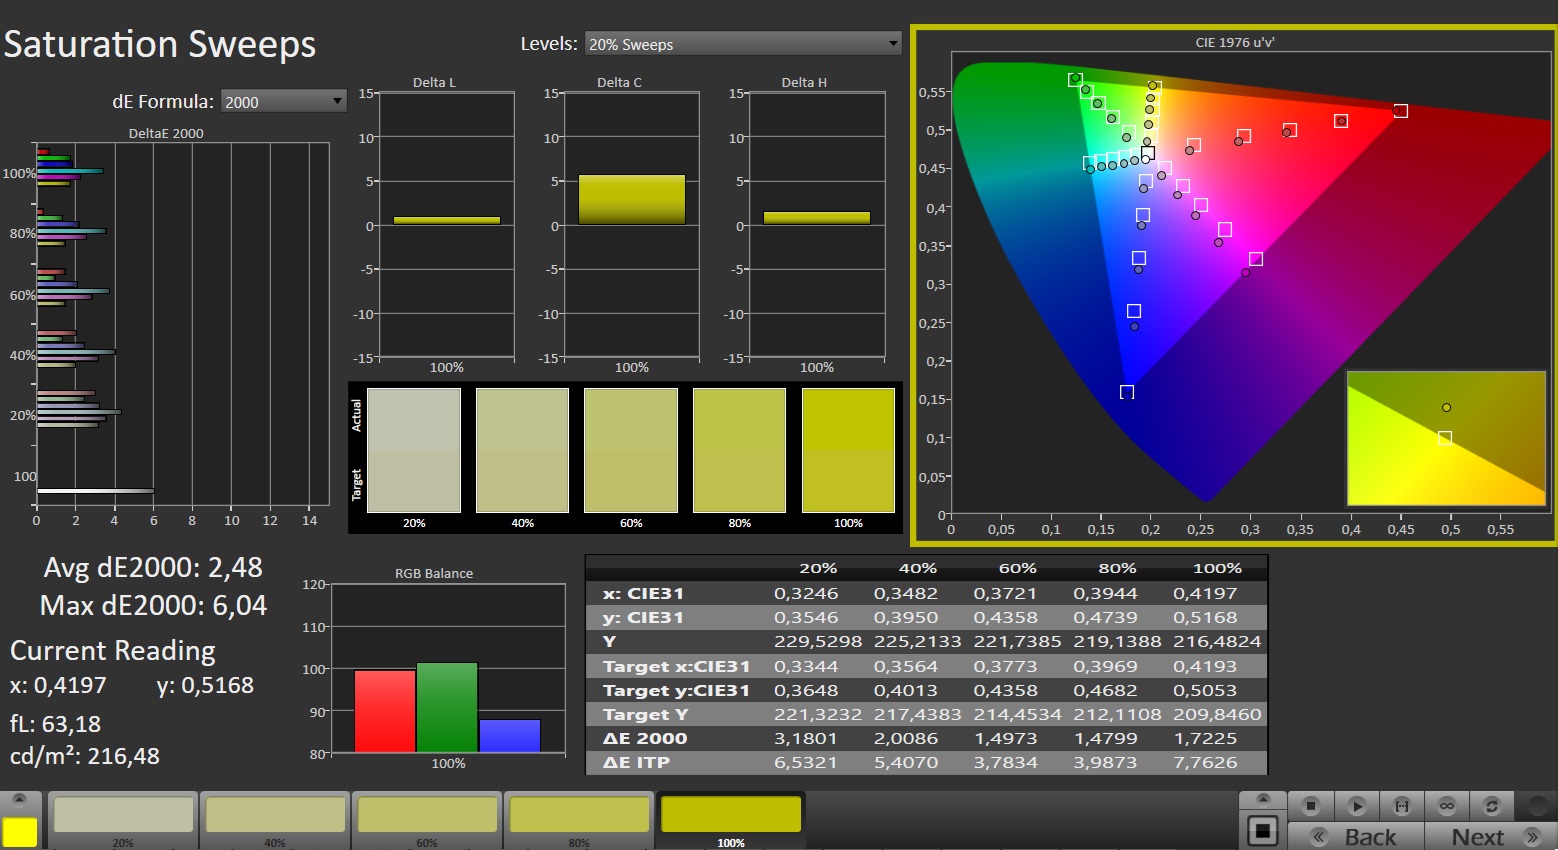
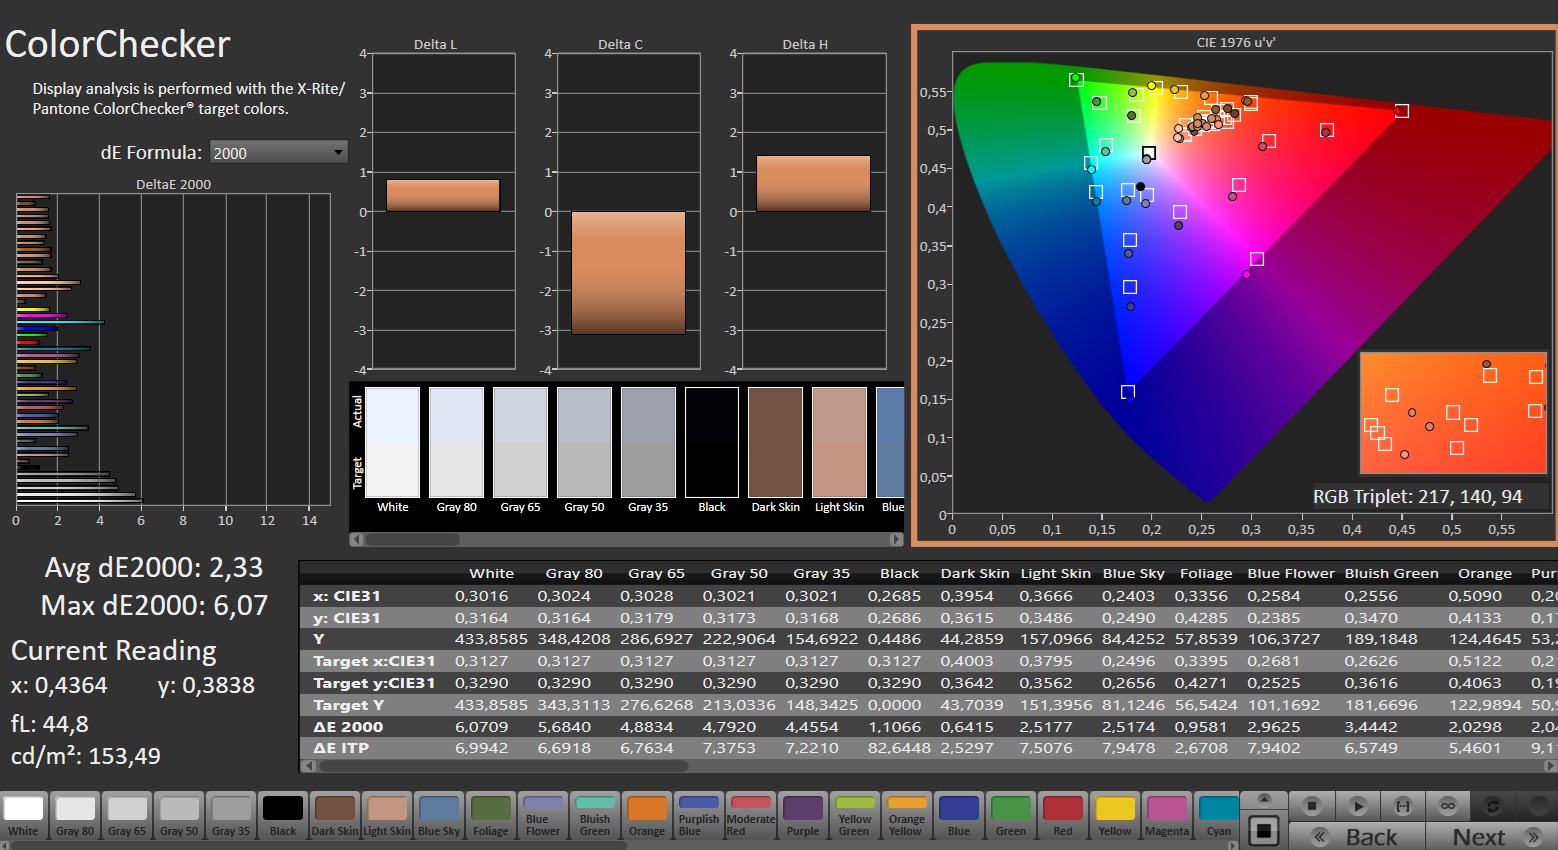
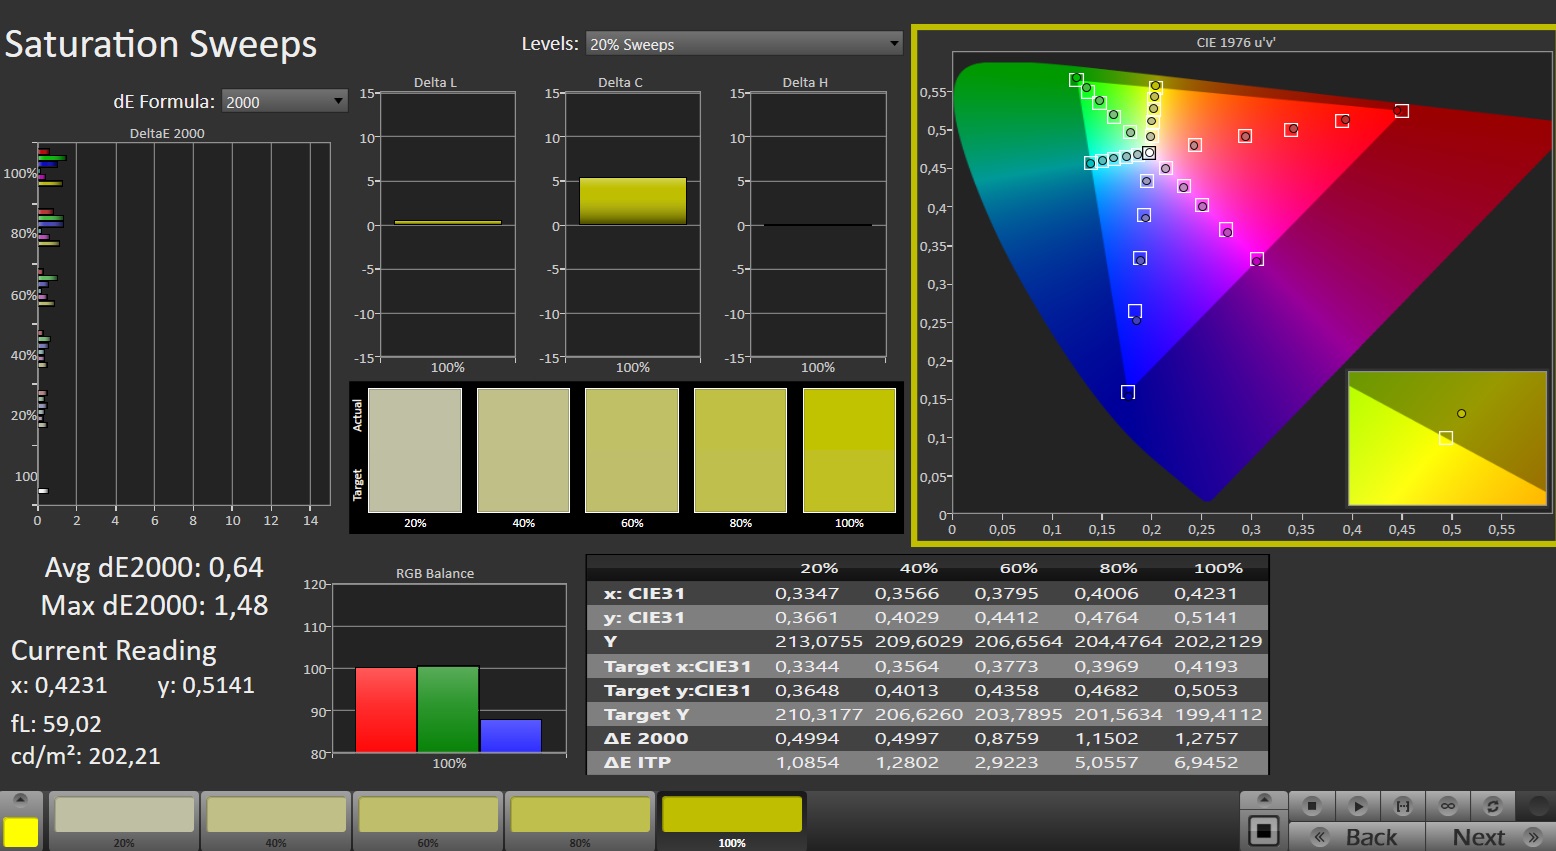
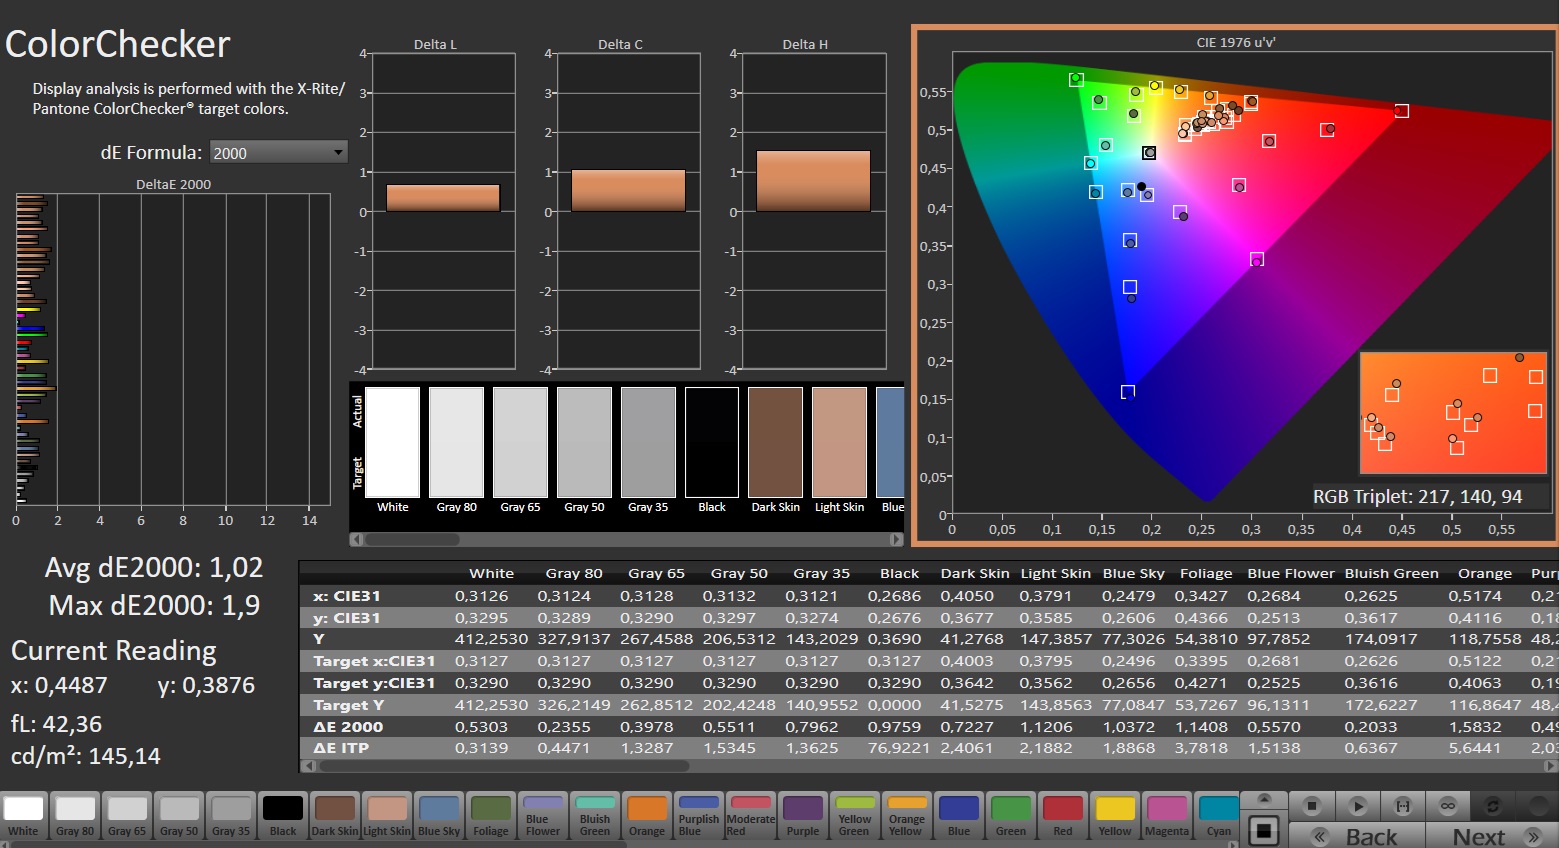
Display - 16:10, IPS, sRGB
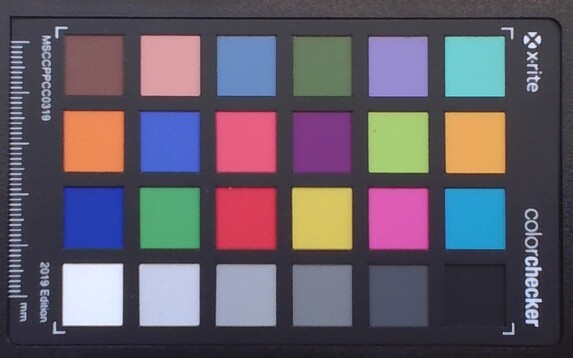
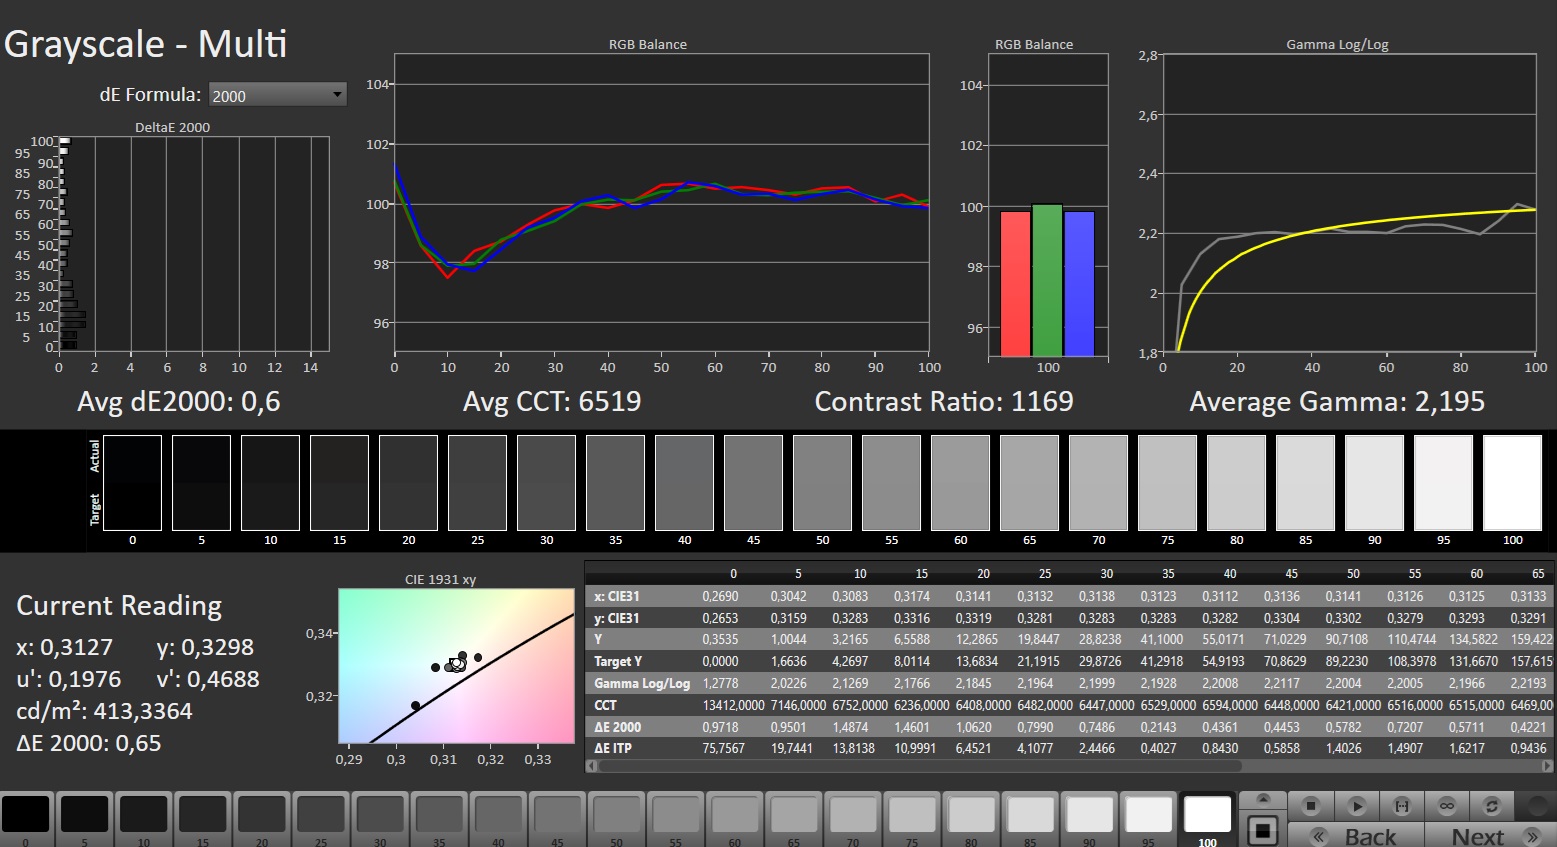
Il display da 16 pollici (2.560 x 1.600 pixel) con un rapporto di aspetto 16:10 è familiare: Il portatile si avvale dello stesso pannello IPS di BOE che era già stato utilizzato nella versione versione 2023 del Pro 16. Tuttavia, beneficia di una luminosità massima leggermente superiore. Nel complesso, i valori dello schermo che abbiamo misurato sono sufficienti per un uso interno. La lettura all'aperto dovrebbe essere possibile, a condizione che il sole non sia troppo luminoso. Positivo: Il pannello reattivo a 240 Hz non presenta sfarfallii PWM. Non sono disponibili opzioni di visualizzazione alternative.
| |||||||||||||||||||||||||
Distribuzione della luminosità: 86 %
Al centro con la batteria: 416 cd/m²
Contrasto: 1095:1 (Nero: 0.38 cd/m²)
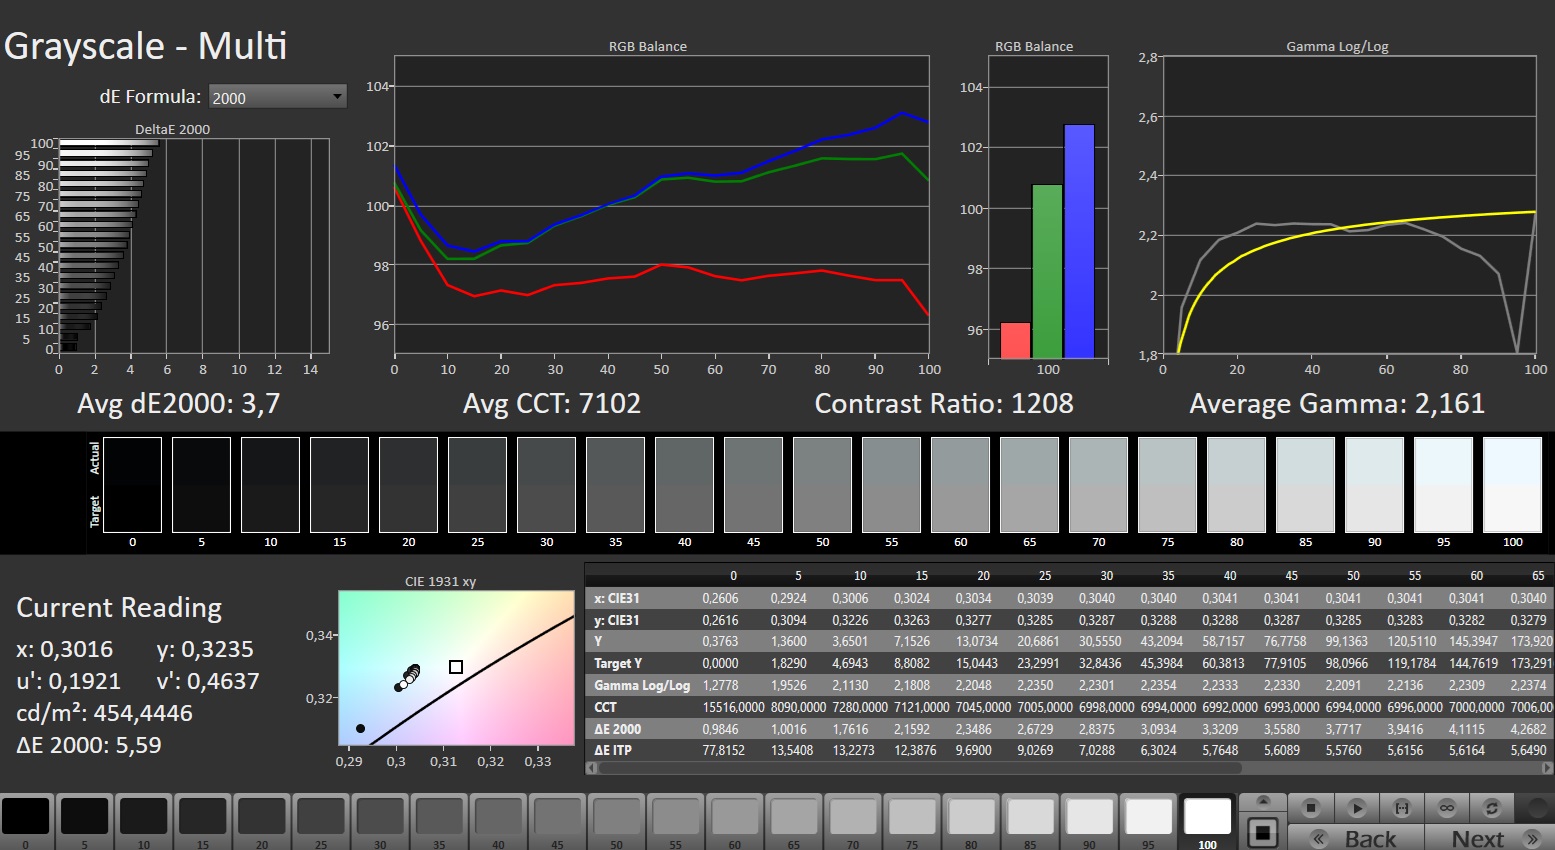
ΔE Color 2.33 | 0.5-29.43 Ø4.95, calibrated: 1.02
ΔE Greyscale 3.7 | 0.5-98 Ø5.2
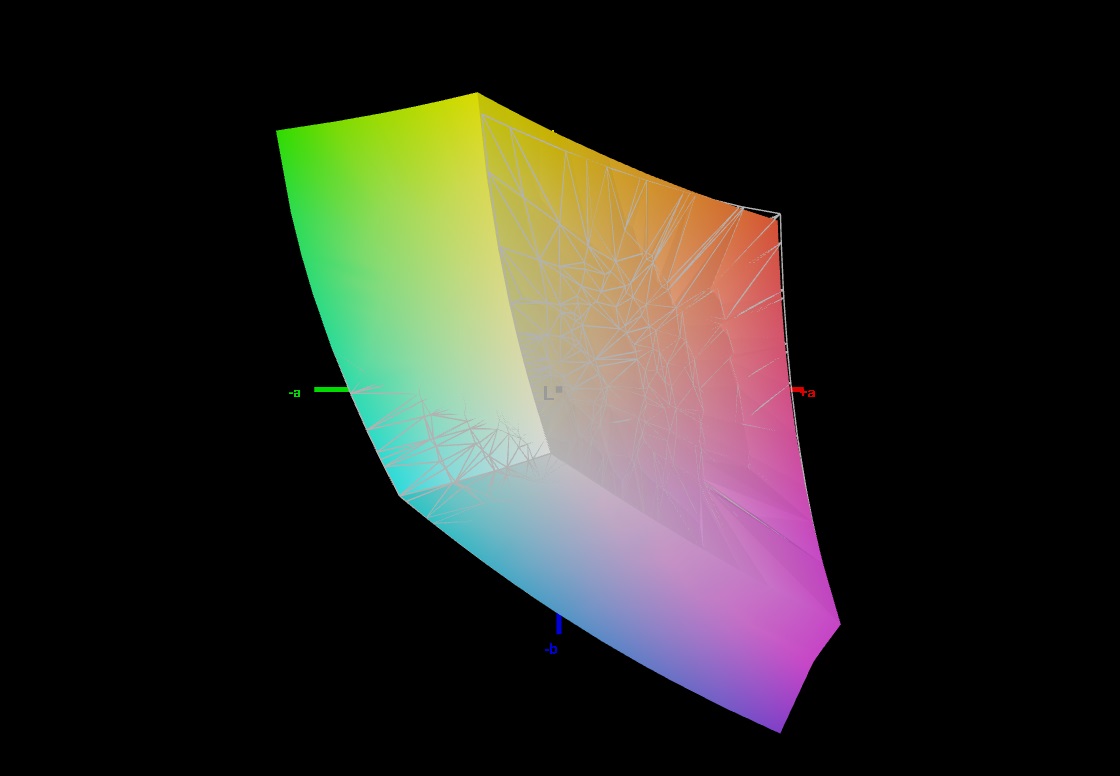
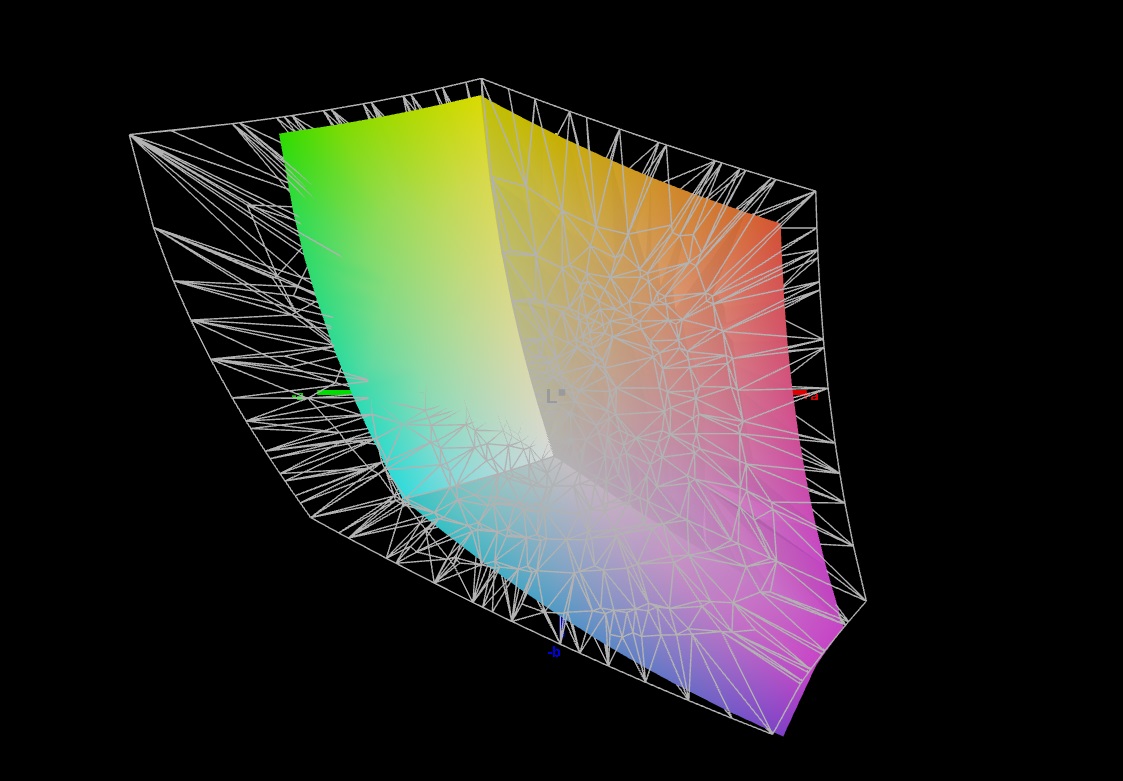
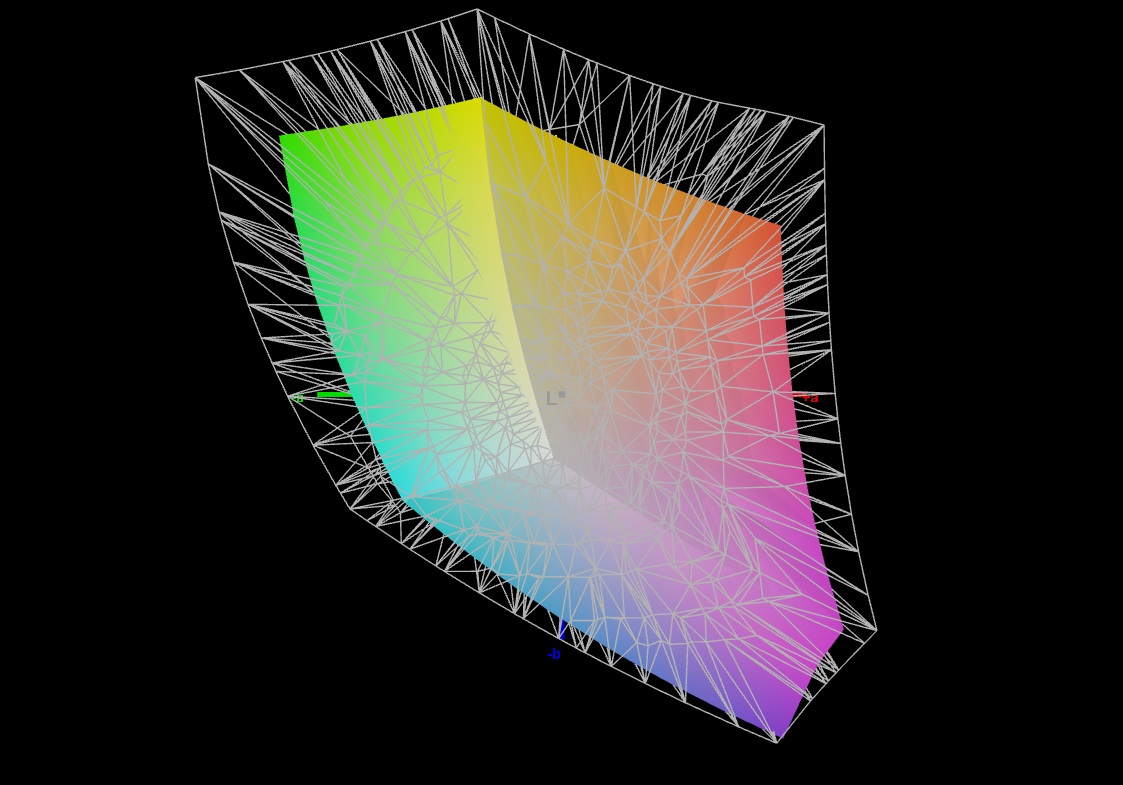
70.8% AdobeRGB 1998 (Argyll 2.2.0 3D)
99.5% sRGB (Argyll 2.2.0 3D)
68.8% Display P3 (Argyll 2.2.0 3D)
Gamma: 2.161
| SCHENKER XMG Pro 16 Studio (Mid 24) BOE CQ NE160QDM-NZ1, IPS, 2560x1600, 16" | Acer Predator Helios Neo 16 (2024) Chi Mei N160GME-GTB, LED, 2560x1600, 16" | Lenovo Legion Pro 5 16IRX9 BOE NE160QDM-NYC, IPS, 2560x1600, 16" | Aorus 16X 2024 BOE CQ NE160QDM-NY1, IPS, 2560x1600, 16" | XMG Pro 16 Studio (Mid 23) BOE CQ NE160QDM-NZ1, IPS, 2560x1600, 16" | Lenovo Legion 7 16 IRX G9 MNG007ZA1-2, IPS, 3200x2000, 16" | |
|---|---|---|---|---|---|---|
| Display | 20% | 0% | -2% | -0% | 21% | |
| Display P3 Coverage | 68.8 | 95.9 39% | 69.3 1% | 67.2 -2% | 69.4 1% | 95 38% |
| sRGB Coverage | 99.5 | 99.8 0% | 99.4 0% | 96.7 -3% | 98.2 -1% | 100 1% |
| AdobeRGB 1998 Coverage | 70.8 | 86.4 22% | 70.1 -1% | 69.3 -2% | 70.1 -1% | 87.2 23% |
| Response Times | 11% | -18% | 28% | -9% | -14% | |
| Response Time Grey 50% / Grey 80% * | 12.7 ? | 5 ? 61% | 11.9 ? 6% | 7.5 ? 41% | 12.2 ? 4% | 14.4 ? -13% |
| Response Time Black / White * | 6.3 ? | 8.8 ? -40% | 8.9 ? -41% | 5.4 ? 14% | 7.7 ? -22% | 7.2 ? -14% |
| PWM Frequency | ||||||
| Screen | 19% | 20% | 4% | -5% | 23% | |
| Brightness middle | 416 | 521 25% | 384 -8% | 542 30% | 349 -16% | 412 -1% |
| Brightness | 392 | 506 29% | 366 -7% | 504 29% | 348 -11% | 396 1% |
| Brightness Distribution | 86 | 85 -1% | 91 6% | 86 0% | 93 8% | 89 3% |
| Black Level * | 0.38 | 0.44 -16% | 0.35 8% | 0.45 -18% | 0.32 16% | 0.43 -13% |
| Contrast | 1095 | 1184 8% | 1097 0% | 1204 10% | 1091 0% | 958 -13% |
| Colorchecker dE 2000 * | 2.33 | 1.74 25% | 0.97 58% | 2.73 -17% | 1.98 15% | 0.9 61% |
| Colorchecker dE 2000 max. * | 6.07 | 3.88 36% | 3.57 41% | 5.29 13% | 7.56 -25% | 2 67% |
| Colorchecker dE 2000 calibrated * | 1.02 | 0.52 49% | 0.77 25% | 1.32 -29% | 1.45 -42% | 0.6 41% |
| Greyscale dE 2000 * | 3.7 | 3 19% | 1.5 59% | 2.9 22% | 3.3 11% | 1.4 62% |
| Gamma | 2.161 102% | 2.164 102% | 2.24 98% | 2.192 100% | 2.137 103% | 2.23 99% |
| CCT | 7102 92% | 6816 95% | 6709 97% | 6173 105% | 6672 97% | 6731 97% |
| Media totale (Programma / Settaggio) | 17% /
18% | 1% /
11% | 10% /
6% | -5% /
-5% | 10% /
17% |
* ... Meglio usare valori piccoli
La copertura dello spazio colore del pannello installato è deludente. È possibile riprodurre solo lo spazio sRGB, non gli spazi AdobeRGB e DCI-P3. Tuttavia, questo non è diverso dai display della maggior parte dei concorrenti. Tuttavia, lo schermo di un computer portatile commercializzato come "workstation professionale per la creazione di contenuti" dovrebbe davvero offrire l'intera gamma. La riproduzione dei colori è migliore: Una leggera deviazione di 2,26 (obiettivo: DeltaE < 3) potrebbe essere ridotta a 1,03 eseguendo una calibrazione.
Tempi di risposta del Display
| ↔ Tempi di risposta dal Nero al Bianco | ||
|---|---|---|
| 6.3 ms ... aumenta ↗ e diminuisce ↘ combinato | ↗ 2.5 ms Incremento | 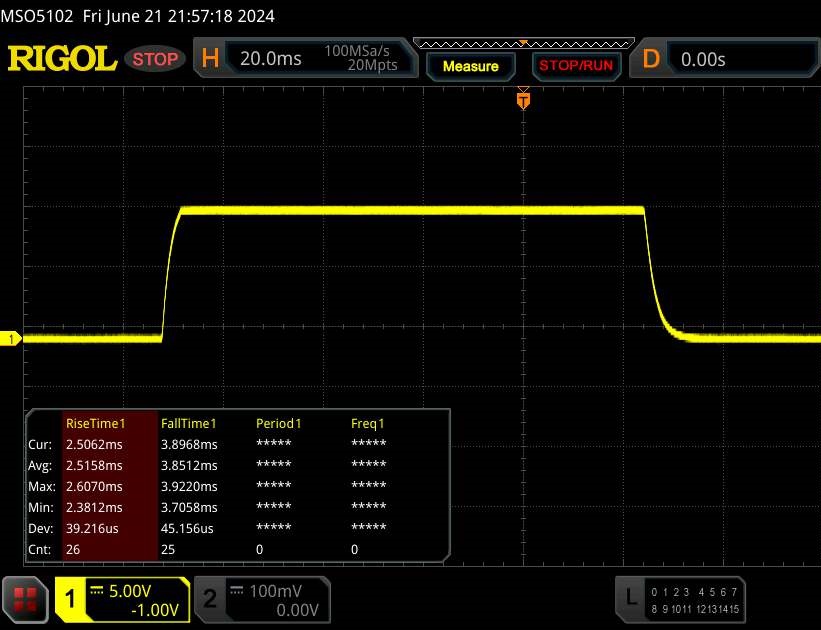 |
| ↘ 3.8 ms Calo | ||
| Lo schermo ha mostrato valori di risposta molto veloci nei nostri tests ed è molto adatto per i gaming veloce. In confronto, tutti i dispositivi di test variano da 0.1 (minimo) a 240 (massimo) ms. » 16 % di tutti i dispositivi è migliore. Questo significa che i tempi di risposta rilevati sono migliori rispettto alla media di tutti i dispositivi testati (21.2 ms). | ||
| ↔ Tempo di risposta dal 50% Grigio all'80% Grigio | ||
| 12.7 ms ... aumenta ↗ e diminuisce ↘ combinato | ↗ 6 ms Incremento | 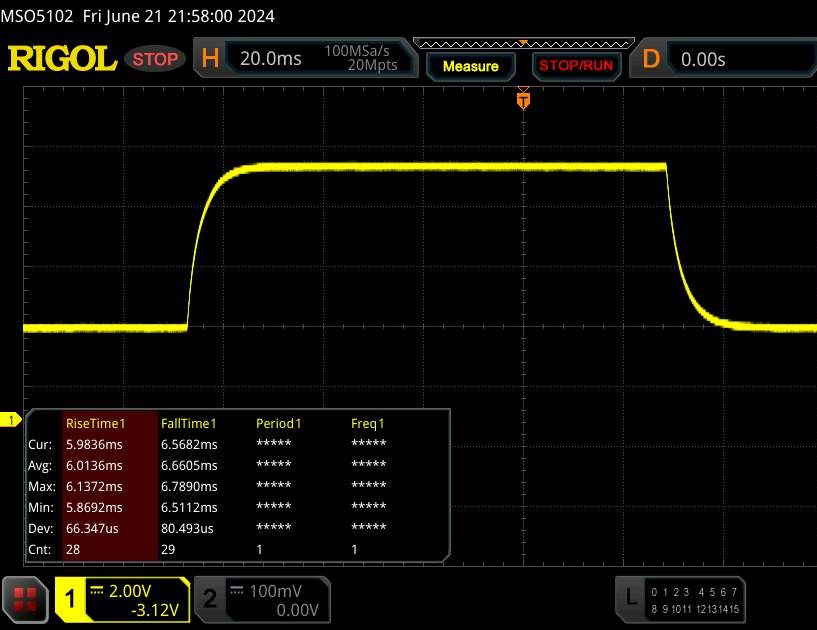 |
| ↘ 6.7 ms Calo | ||
| Lo schermo mostra buoni tempi di risposta durante i nostri tests, ma potrebbe essere troppo lento per i gamers competitivi. In confronto, tutti i dispositivi di test variano da 0.165 (minimo) a 636 (massimo) ms. » 22 % di tutti i dispositivi è migliore. Questo significa che i tempi di risposta rilevati sono migliori rispettto alla media di tutti i dispositivi testati (33.2 ms). | ||
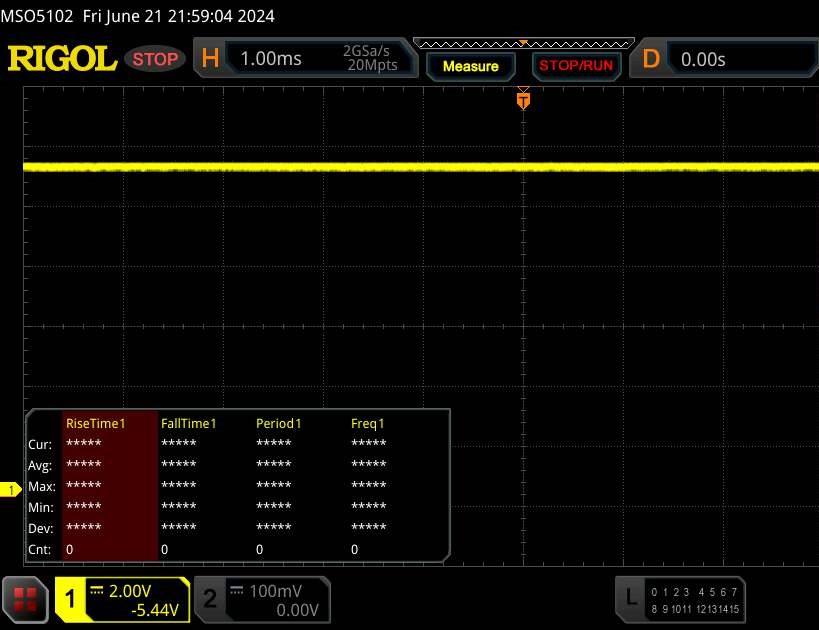
Sfarfallio dello schermo / PWM (Pulse-Width Modulation)
| flickering dello schermo / PWM non rilevato | 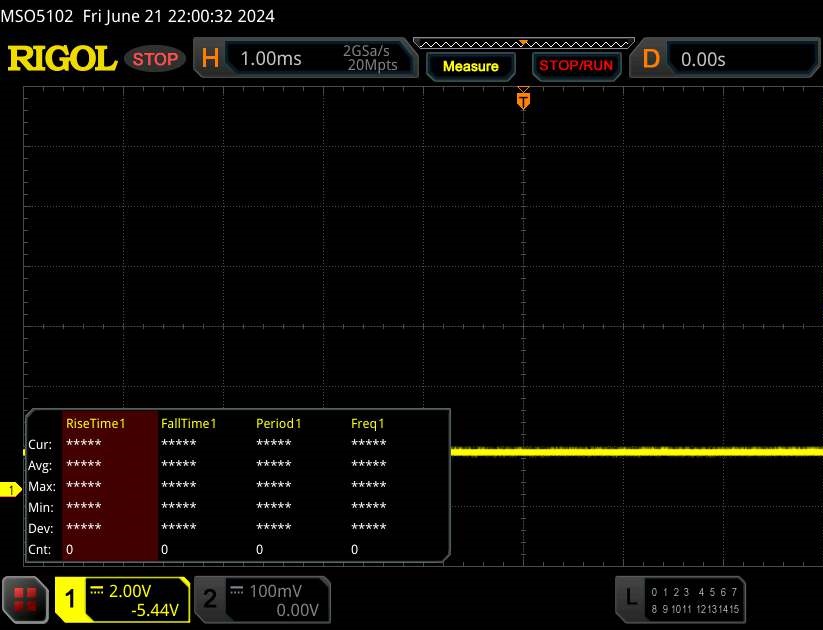 | ||
In confronto: 53 % di tutti i dispositivi testati non utilizza PWM per ridurre la luminosita' del display. Se è rilevato PWM, una media di 17373 (minimo: 5 - massimo: 3846000) Hz è stata rilevata. | |||
Prestazioni - Raptor Lake Refresh sostituisce Raptor Lake
XMG Pro 16 Studio (Mid 24), descritto da Schenker come un "laptop per la creazione di contenuti", si rivolge a giocatori e creatori. Tutti i modelli sono dotati di un Core i9-14900HX e la selezione di GPU disponibili include una RTX 4060 e una RTX 4070 - il nostro dispositivo di prova è dotato di una RTX 4070. Questa variante è disponibile a circa 2.500 dollari. I prezzi partono da circa 1.800 dollari.
Condizioni di test
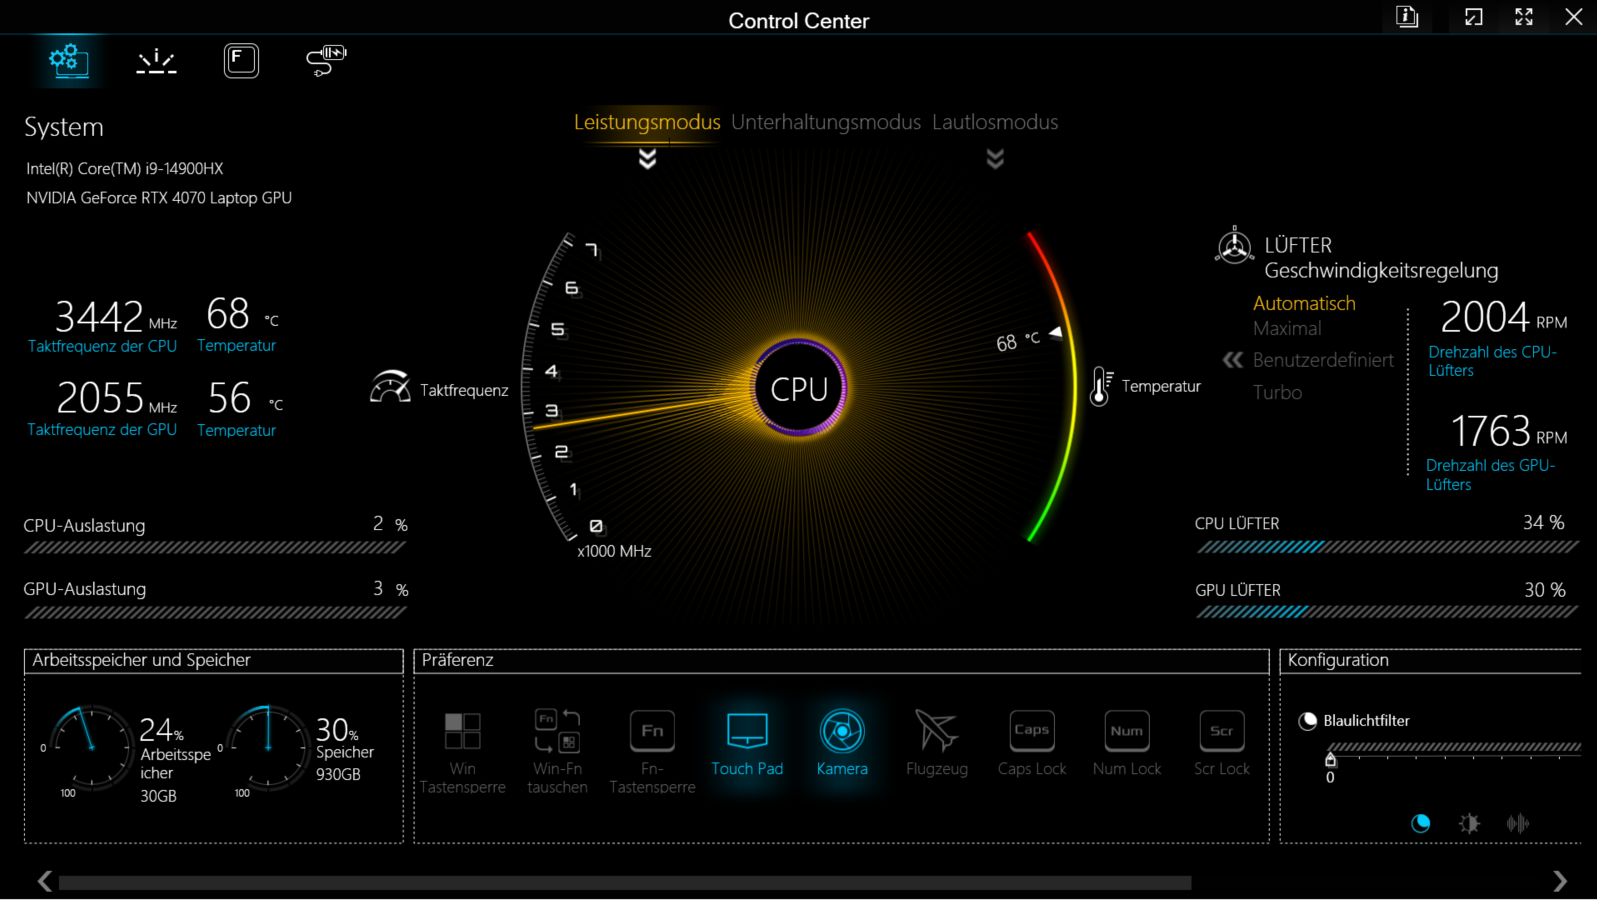
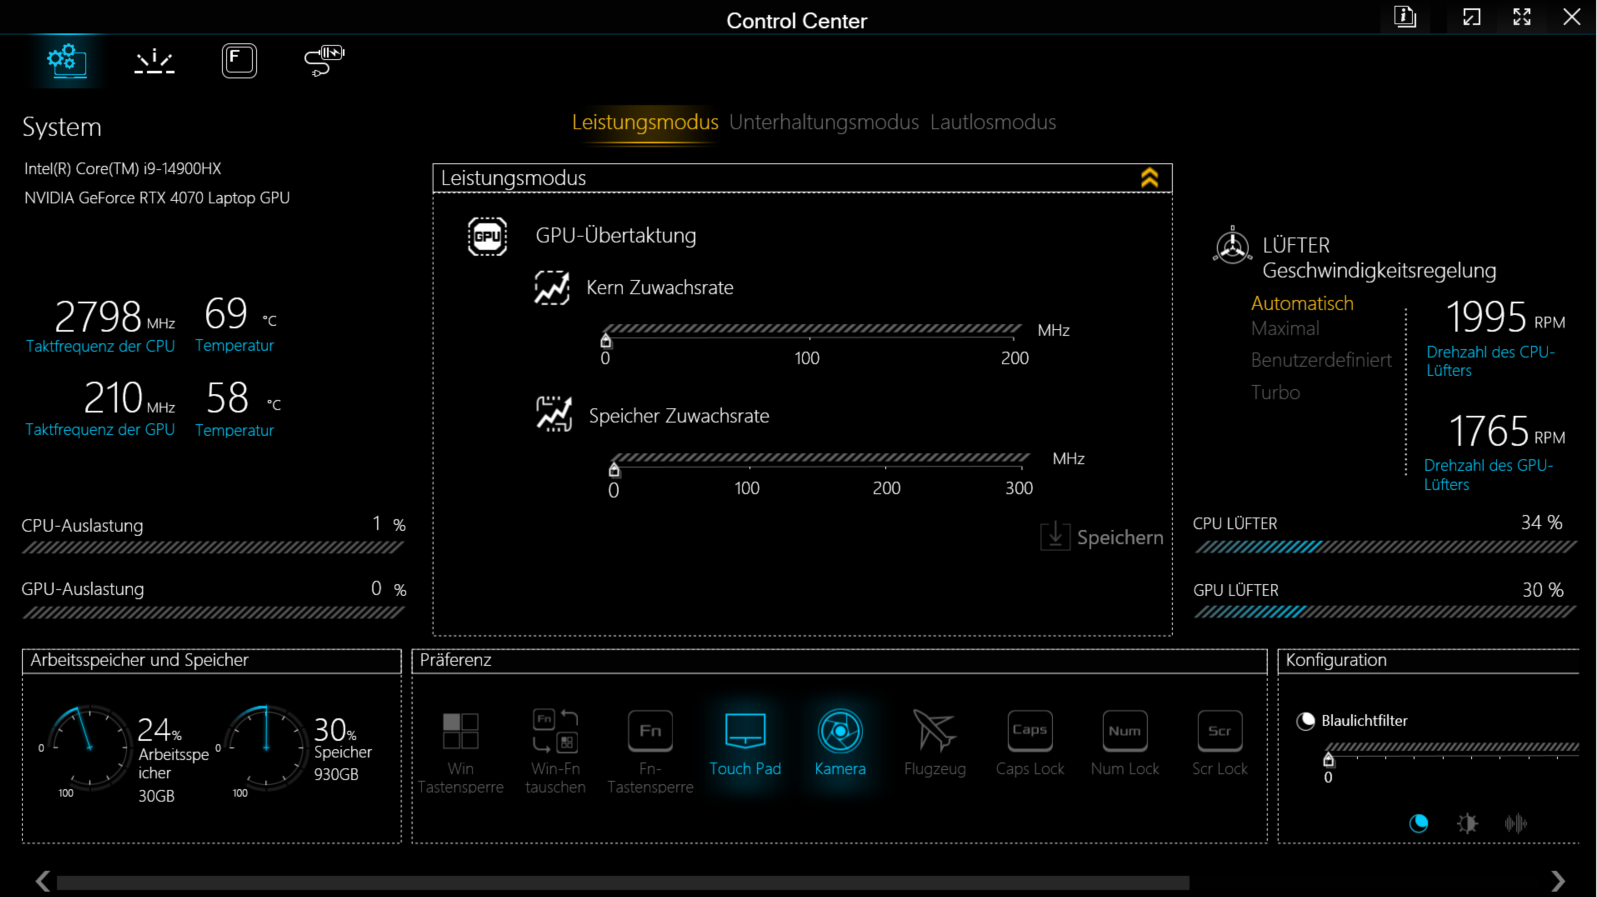
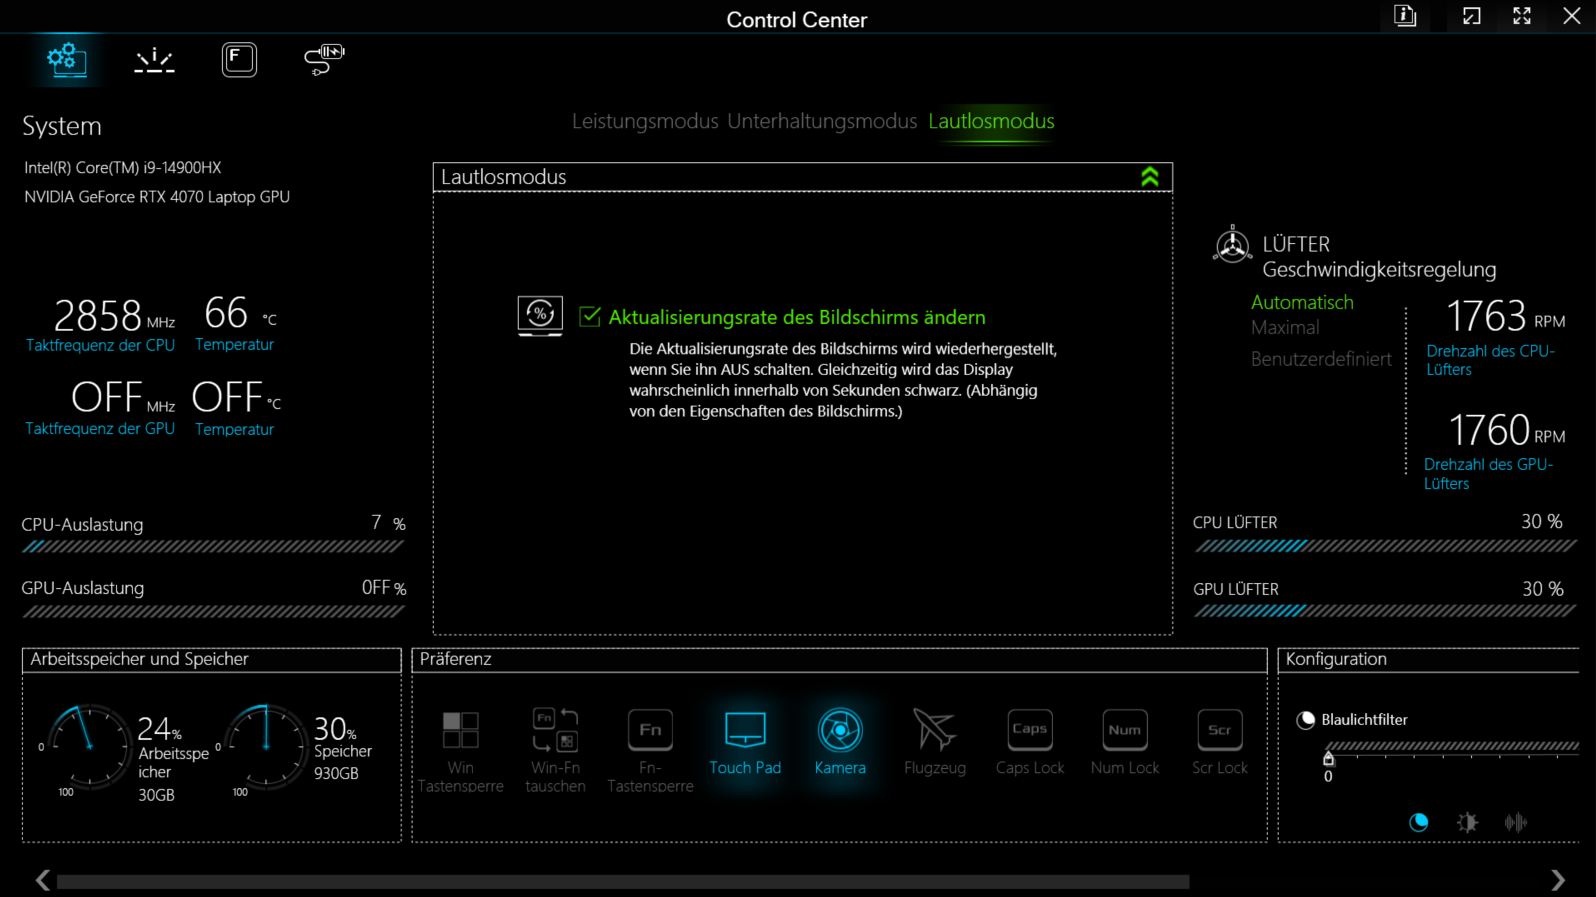
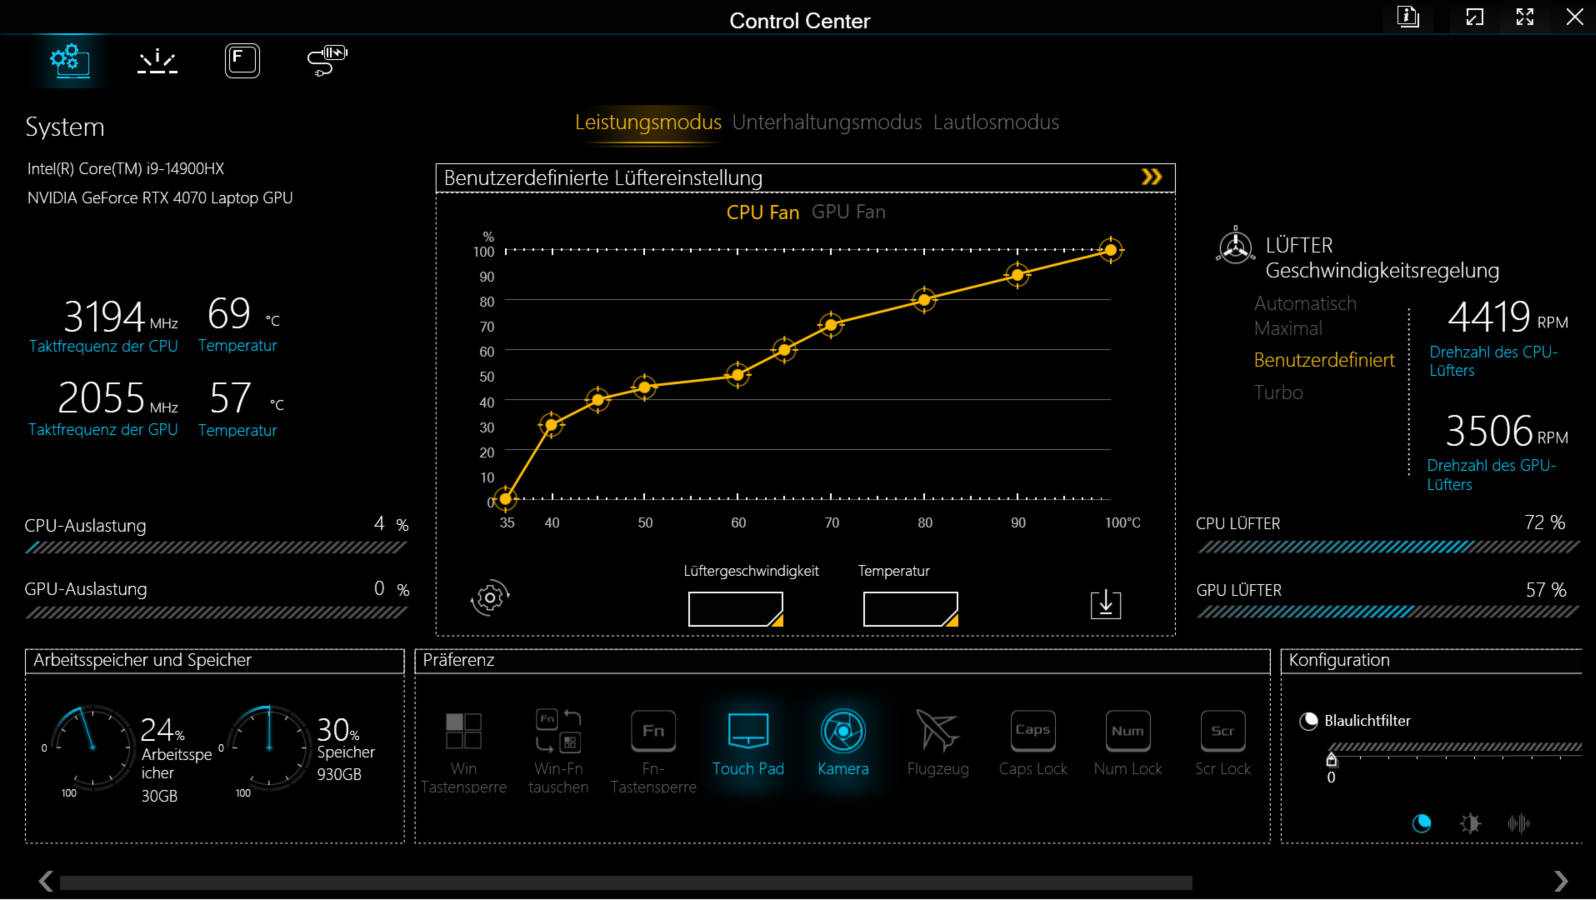
È possibile scegliere tra tre modalità di prestazioni specifiche del produttore (vedere tabella), che possono essere alternate utilizzando il software Control Center (il centro di controllo del portatile). Abbiamo utilizzato le modalità prestazioni (benchmark) e silenziosa (test della batteria). Optimus era attivo.
| Modalità prestazioni | Modalità intrattenimento | Modalità silenziosa (dGPU disattivata) | |
|---|---|---|---|
| Limite di potenza 1 (HWInfo) | 135 watt | 55 watt | 25 watt |
| Limite di potenza 2 (HWInfo) | 150 watt | 135 watt | 35 watt |
| Rumore (CP 2077 Phantom) | 53 dB (A) | 49 dB (A) | - |
| Prestazioni (CP 2077 Phantom) | 78 fps | 73 fps | - |
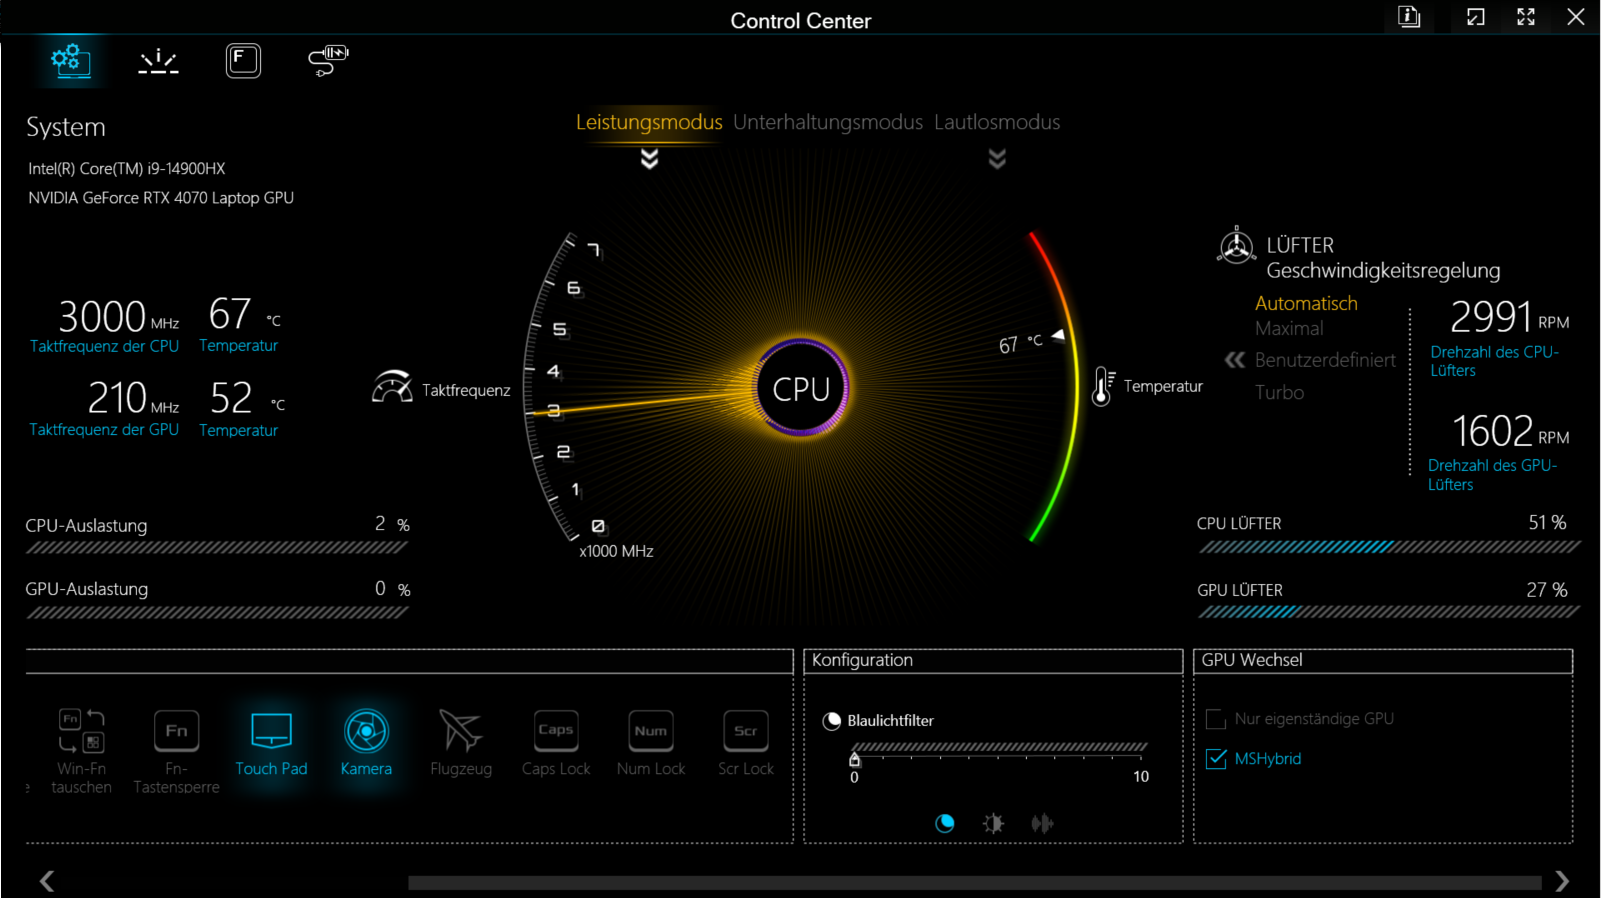
Problemi con la modalità di intrattenimento
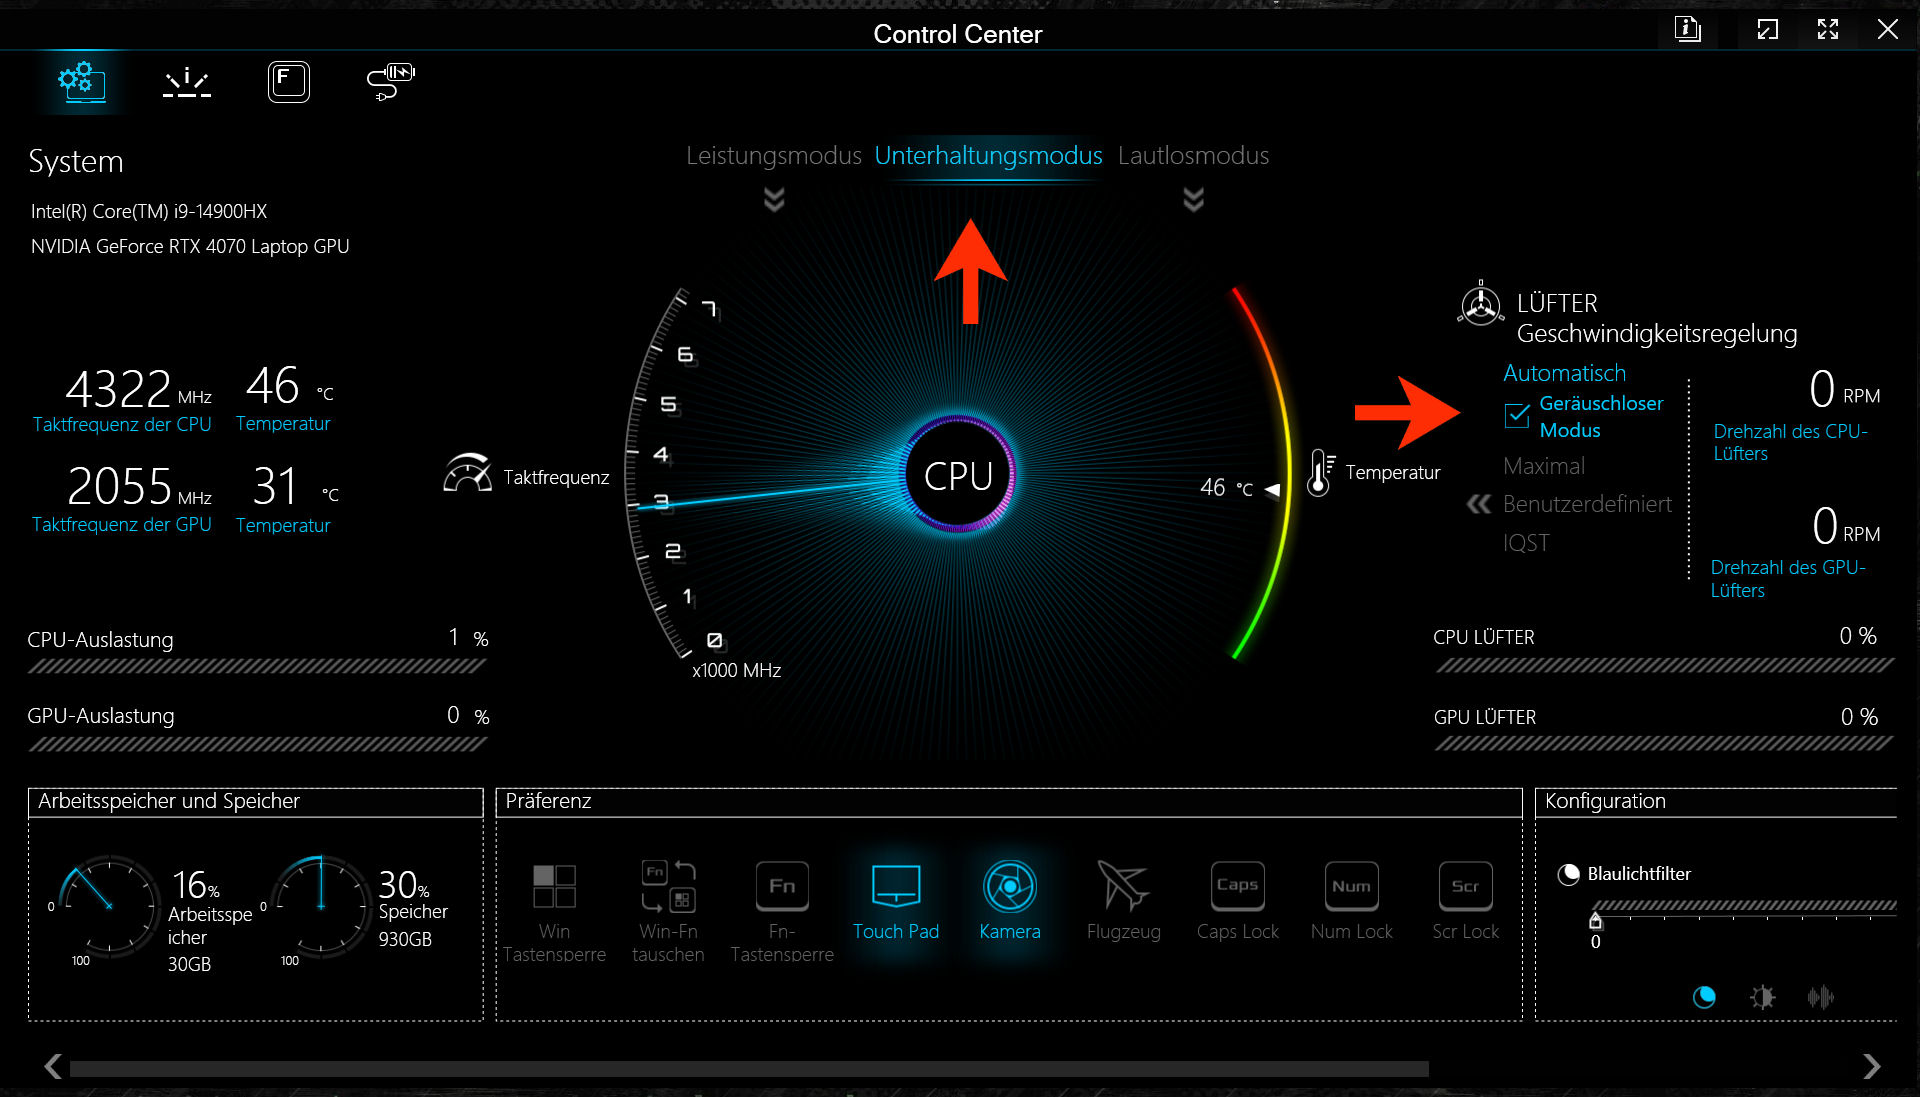
Il profilo "intrattenimento" ha causato fluttuazioni significative nelle prestazioni durante il nostro test. Di conseguenza, ci siamo astenuti dall'utilizzarlo. Nel corso del test, Schenker è stato in grado di indicare un modo per aggirare il problema: l'attivazione dell'opzione "modalità silenziosa" della ventola all'interno del Control Center. Un futuro aggiornamento del BIOS dovrebbe risolvere l'errore.
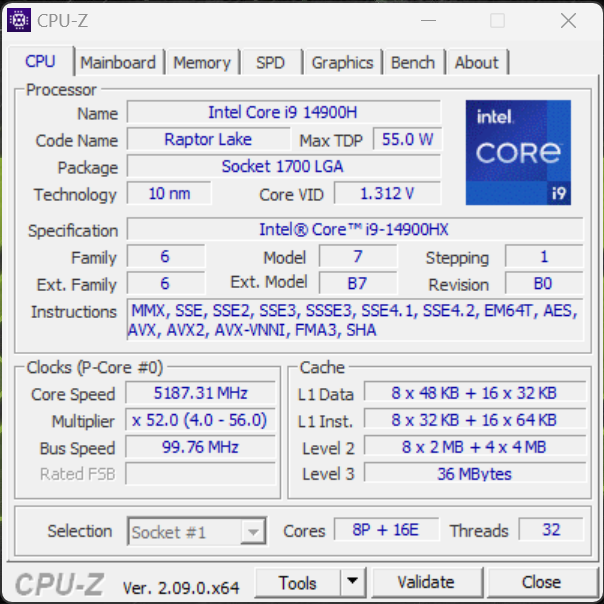
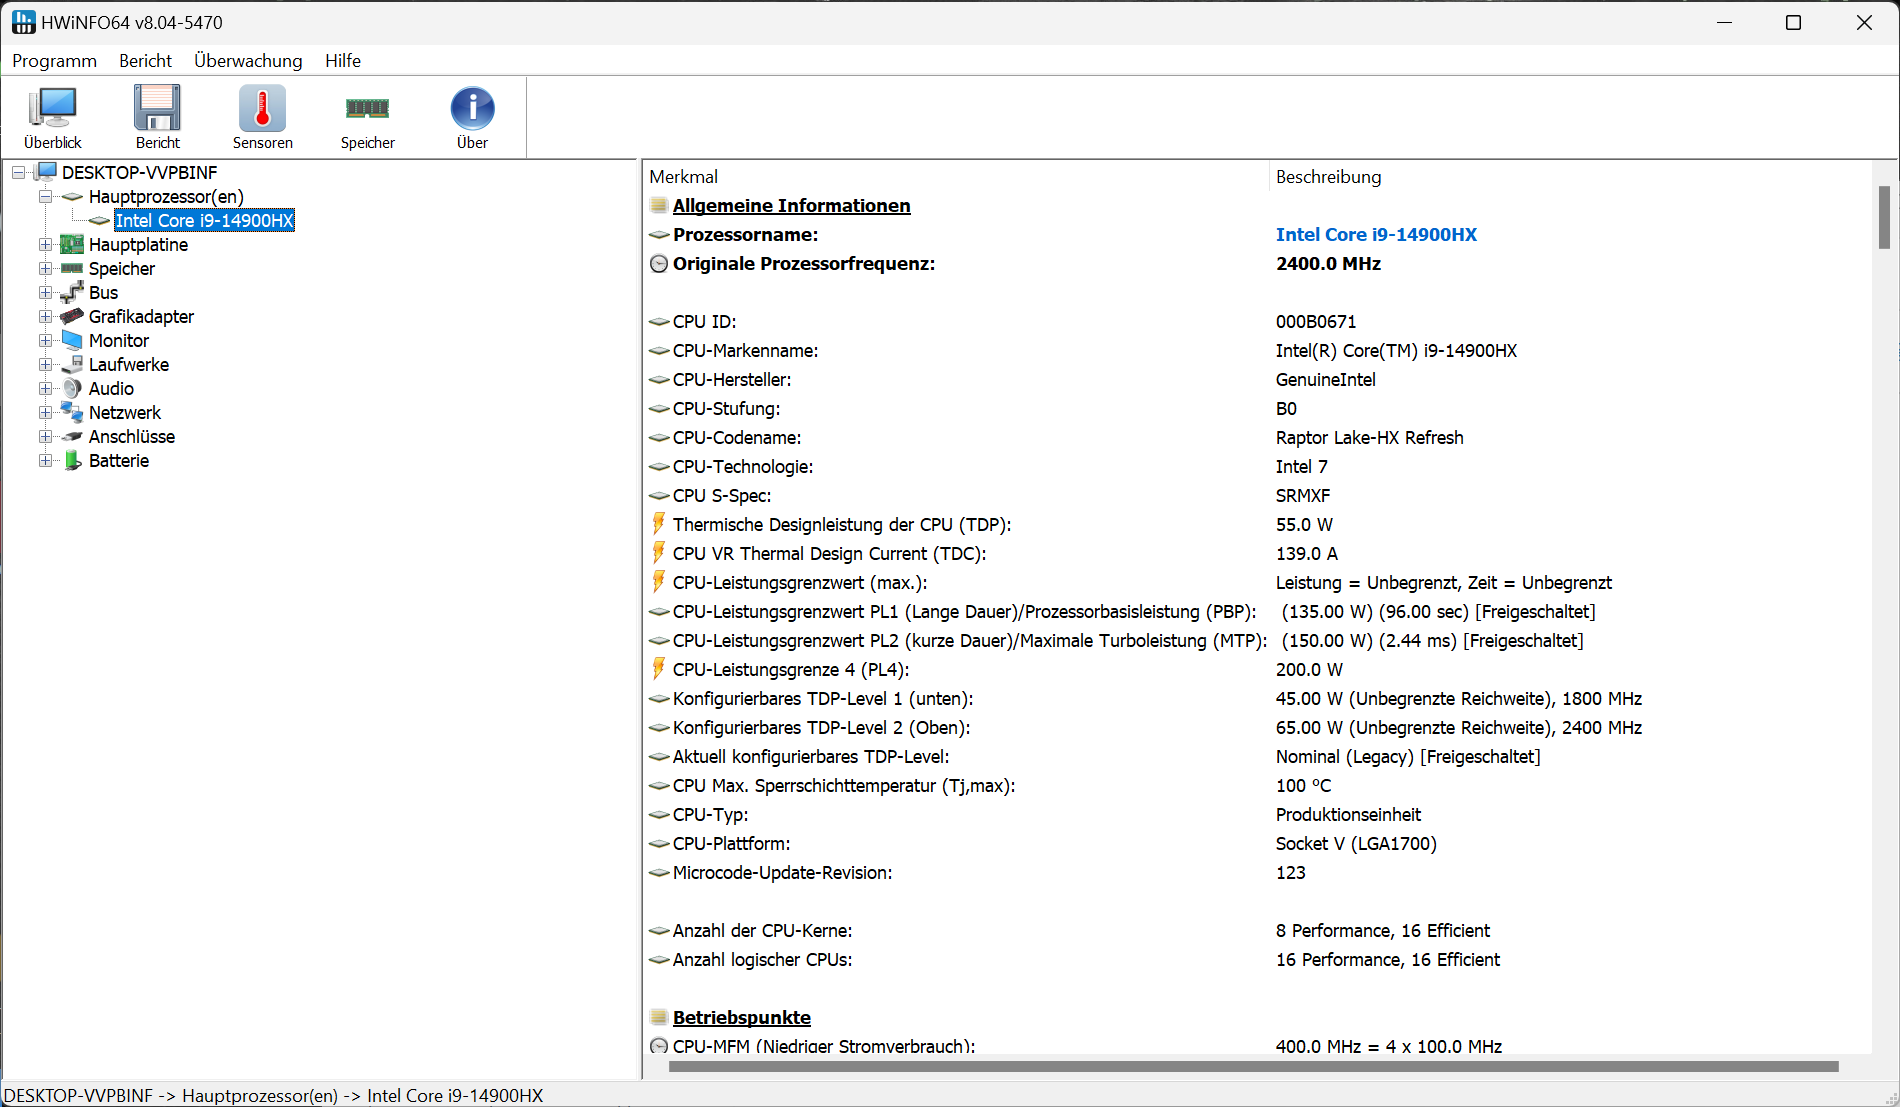
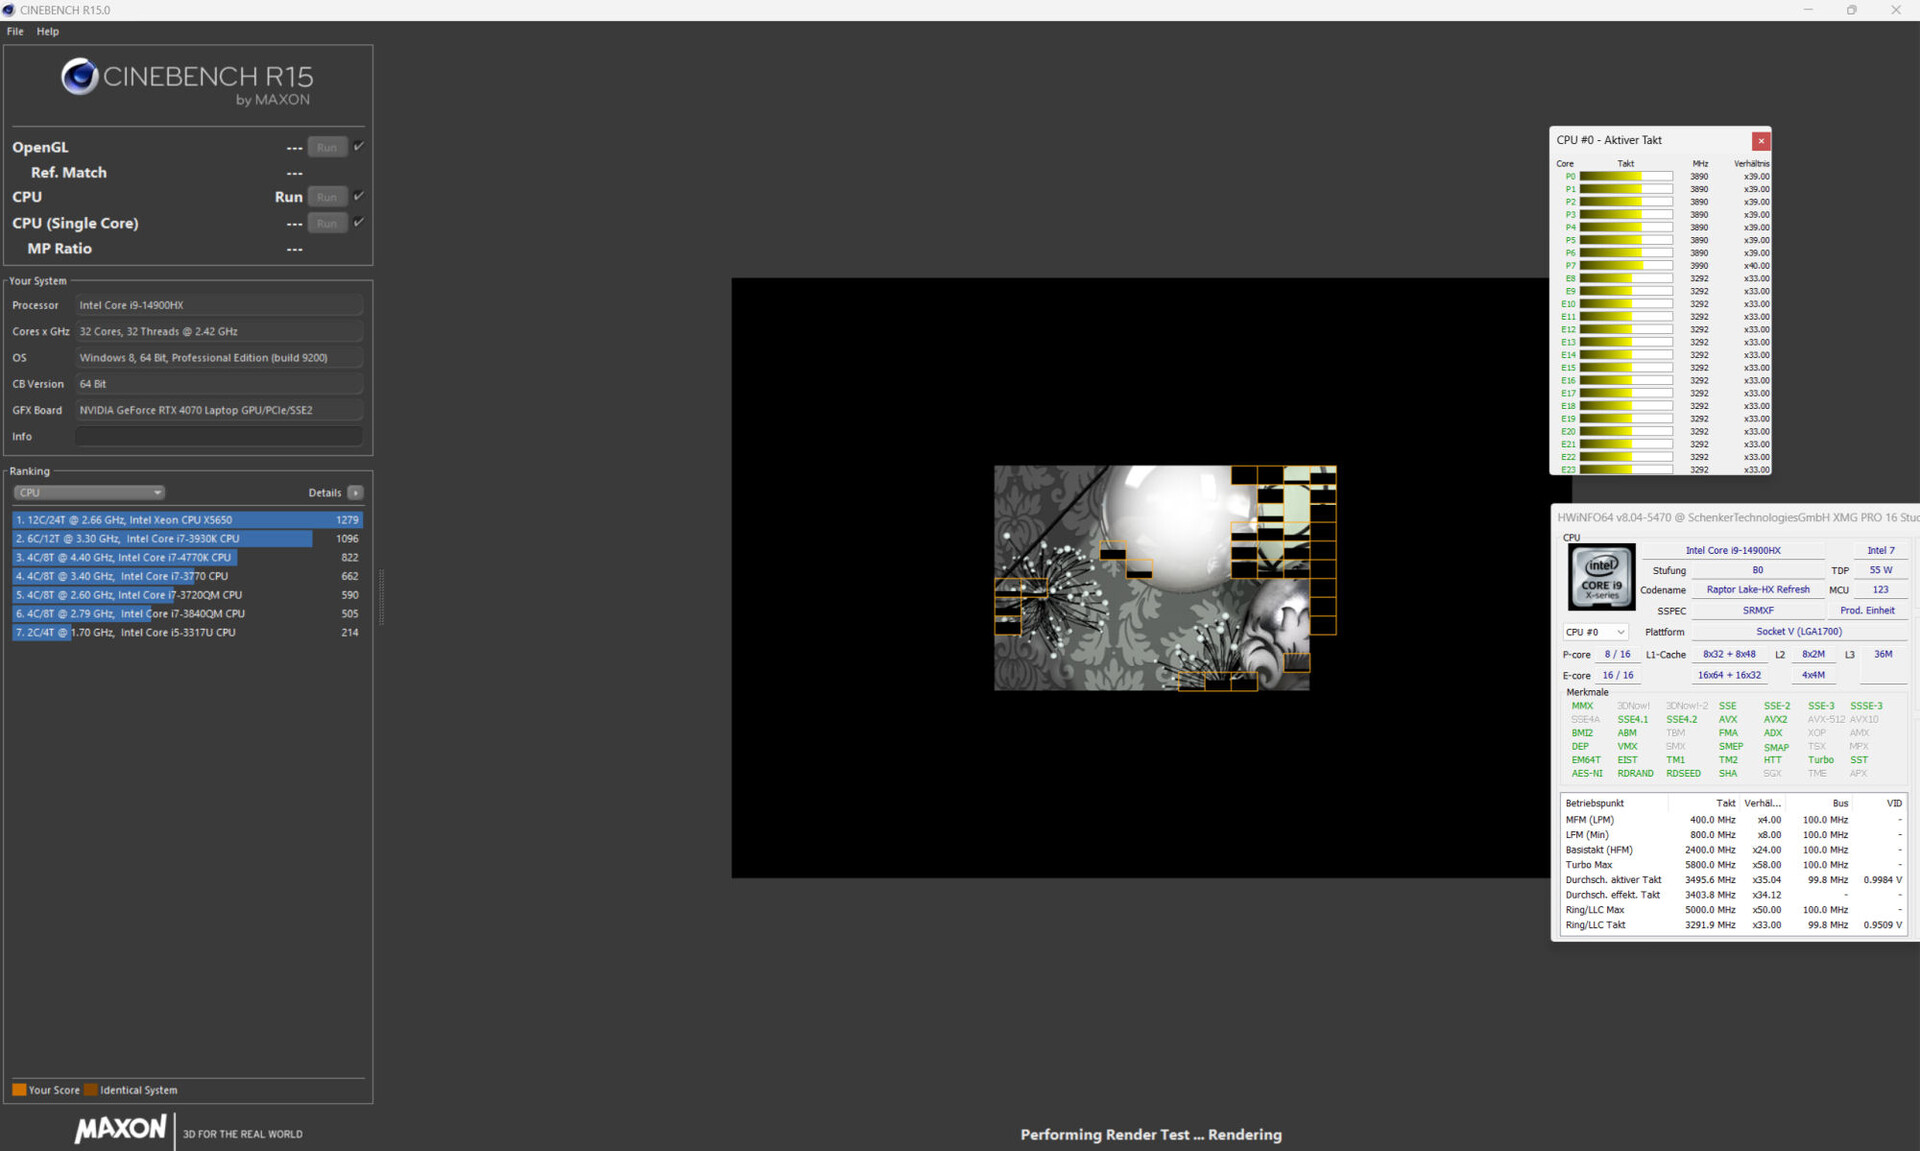
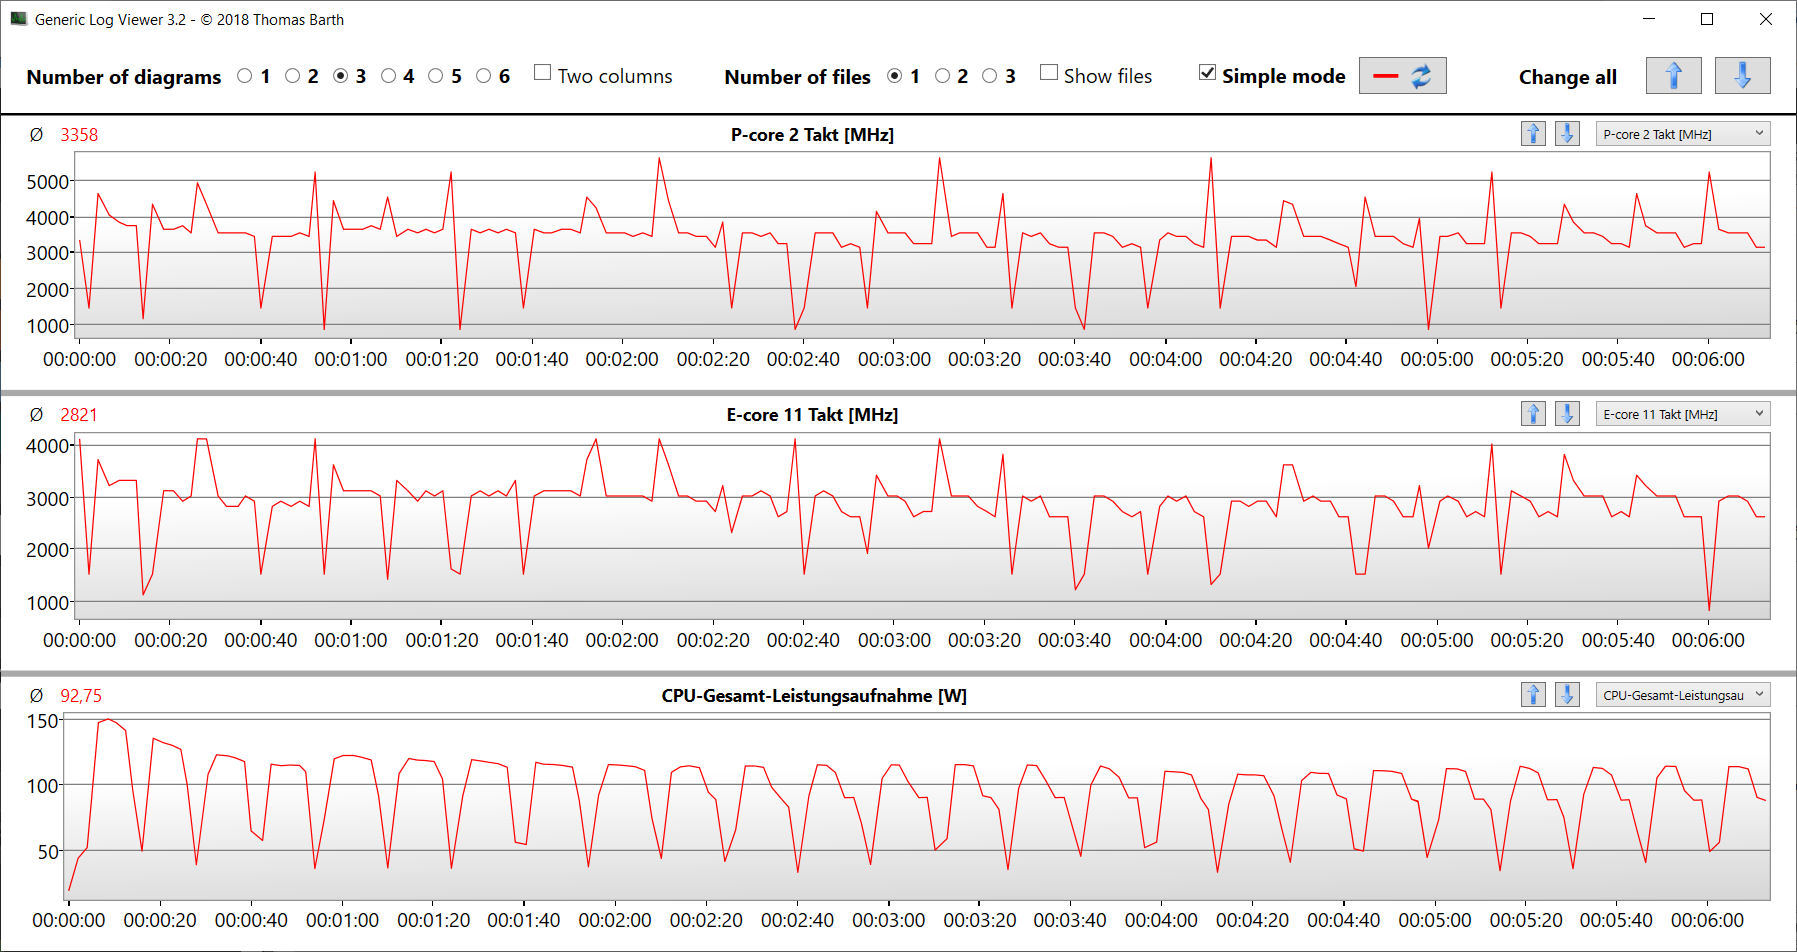
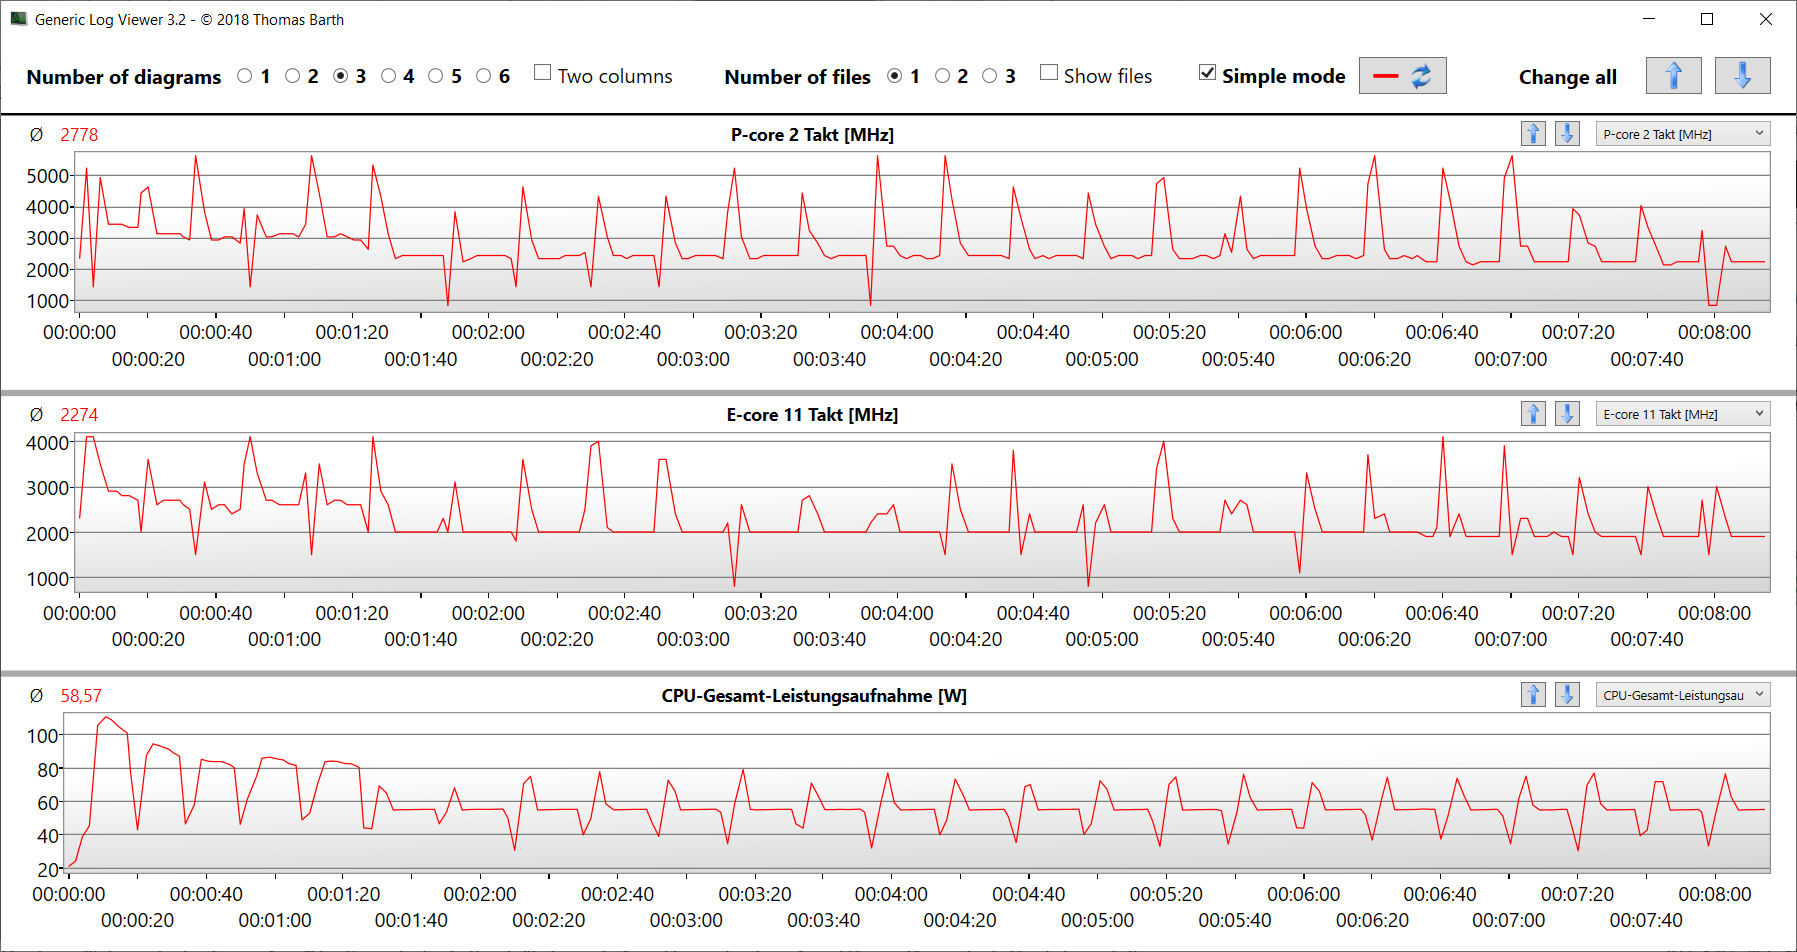
Processore
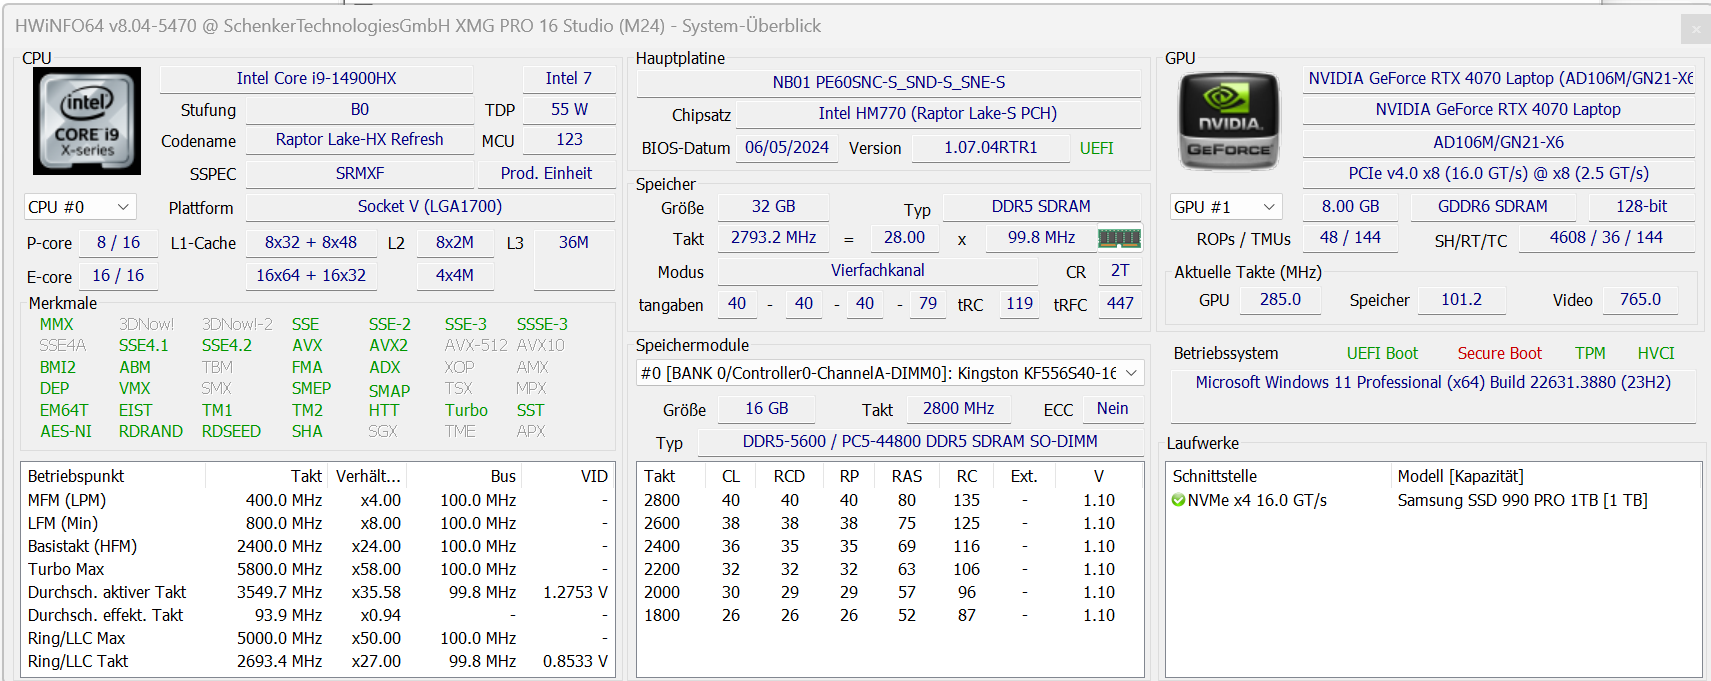
Il Core i9-14900HX (Raptor Lake) viene utilizzato per tutte le varianti di configurazione Pro 16. I suoi 24 core (8P + 16E) possono elaborare un totale di 32 thread. Una sorpresa: Anche quando la modalità prestazioni è attiva, il processore non può lavorare sempre alla massima potenza. Il carico continuo multi-thread (CB15 Loop) ha fatto sì che il clock della CPU scendesse in modo significativo dalla prima alla quinta esecuzione. In seguito, la curva si è appiattita. I risultati dei benchmark sono inferiori alla media della CPU precedente.
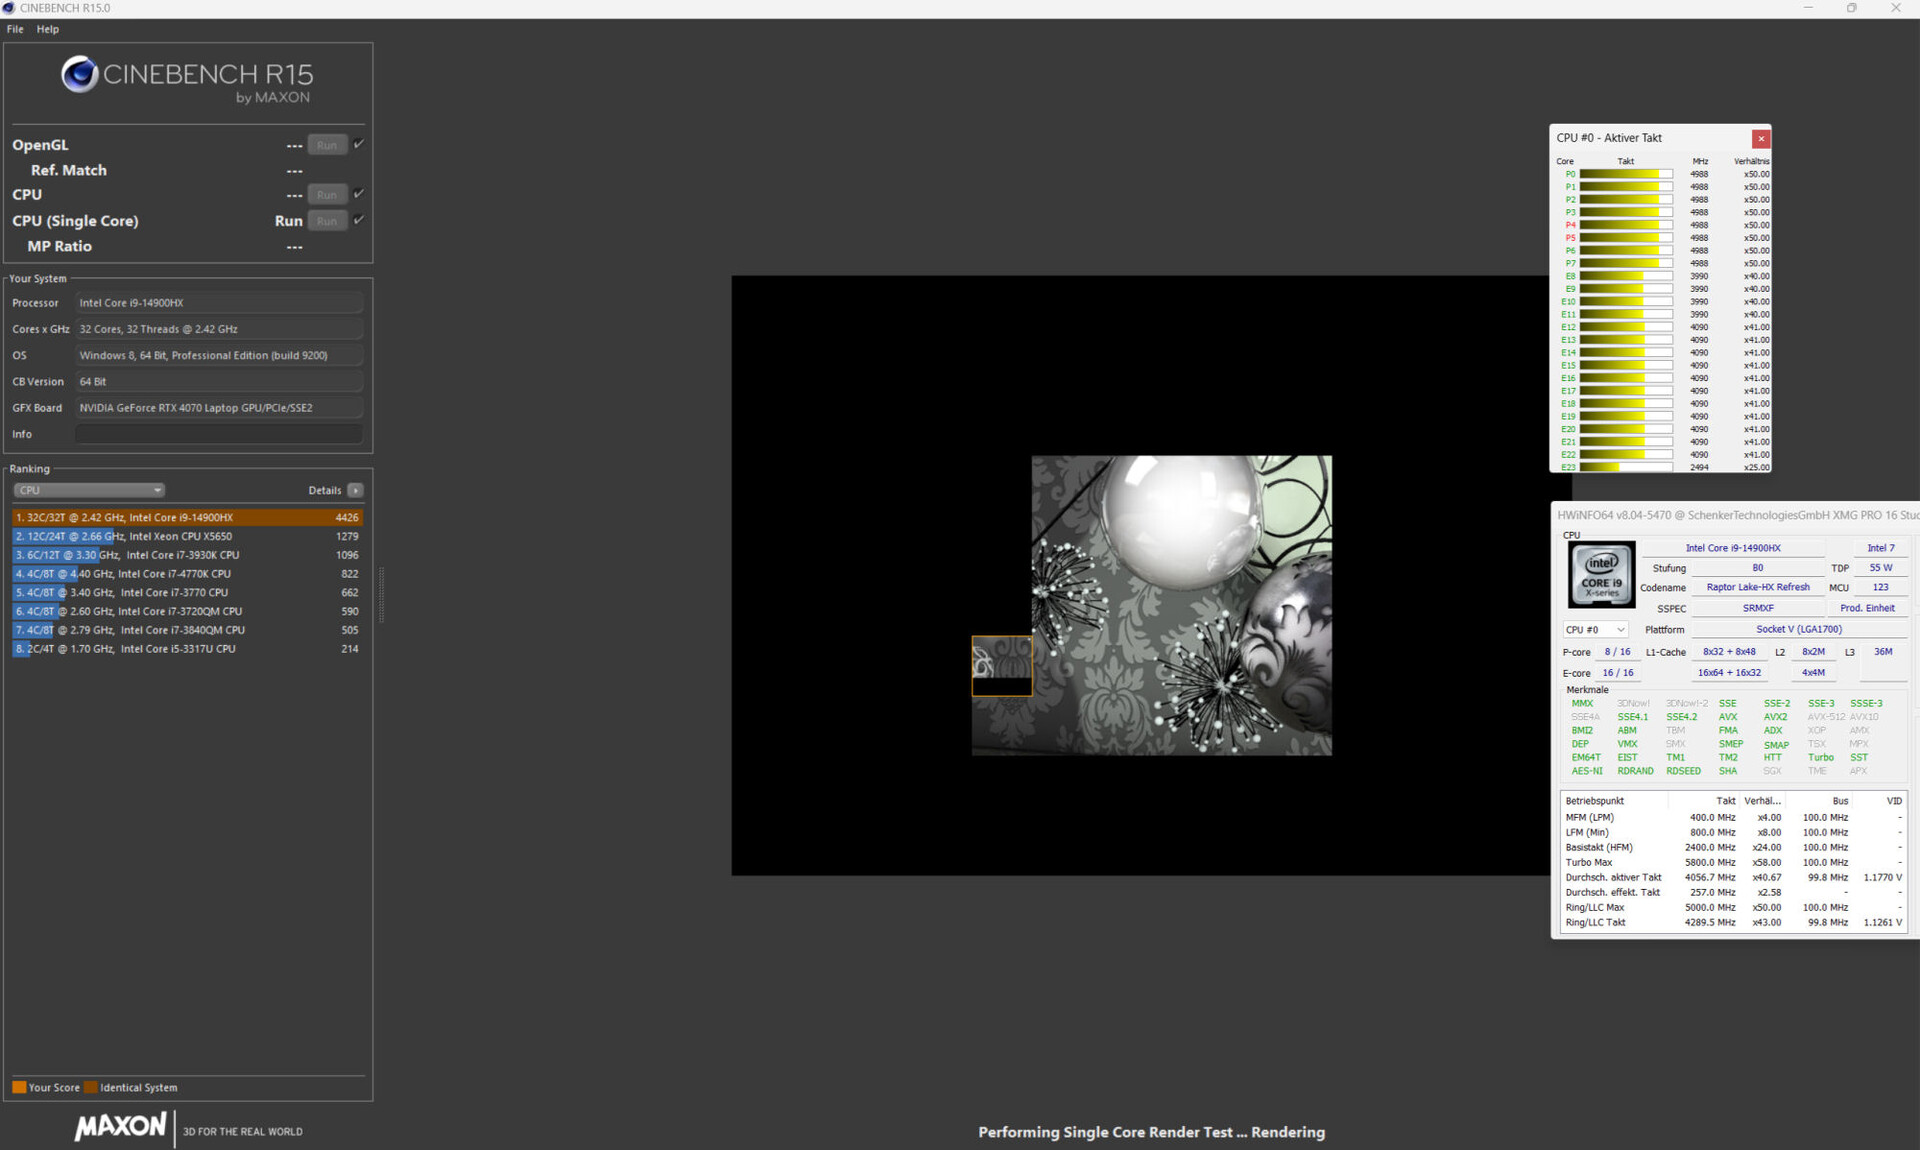
Cinebench R15 Multi continuous test
* ... Meglio usare valori piccoli
AIDA64: FP32 Ray-Trace | FPU Julia | CPU SHA3 | CPU Queen | FPU SinJulia | FPU Mandel | CPU AES | CPU ZLib | FP64 Ray-Trace | CPU PhotoWorxx
| Performance Rating | |
| Lenovo Legion Pro 5 16IRX9 | |
| Media Intel Core i9-14900HX | |
| Aorus 16X 2024 | |
| Lenovo Legion 7 16 IRX G9 | |
| SCHENKER XMG Pro 16 Studio (Mid 24) | |
| Acer Predator Helios Neo 16 (2024) | |
| Media della classe Gaming | |
| XMG Pro 16 Studio (Mid 23) | |
| AIDA64 / FP32 Ray-Trace | |
| Lenovo Legion 7 16 IRX G9 | |
| Lenovo Legion Pro 5 16IRX9 | |
| Media Intel Core i9-14900HX (13098 - 33474, n=30) | |
| Aorus 16X 2024 | |
| Acer Predator Helios Neo 16 (2024) | |
| SCHENKER XMG Pro 16 Studio (Mid 24) | |
| Media della classe Gaming (4986 - 60169, n=201, ultimi 2 anni) | |
| XMG Pro 16 Studio (Mid 23) | |
| AIDA64 / FPU Julia | |
| Lenovo Legion Pro 5 16IRX9 | |
| Media Intel Core i9-14900HX (67573 - 166040, n=30) | |
| Lenovo Legion 7 16 IRX G9 | |
| Aorus 16X 2024 | |
| SCHENKER XMG Pro 16 Studio (Mid 24) | |
| Acer Predator Helios Neo 16 (2024) | |
| Media della classe Gaming (25360 - 252486, n=201, ultimi 2 anni) | |
| XMG Pro 16 Studio (Mid 23) | |
| AIDA64 / CPU SHA3 | |
| Lenovo Legion Pro 5 16IRX9 | |
| Media Intel Core i9-14900HX (3589 - 7979, n=30) | |
| Aorus 16X 2024 | |
| Lenovo Legion 7 16 IRX G9 | |
| SCHENKER XMG Pro 16 Studio (Mid 24) | |
| Acer Predator Helios Neo 16 (2024) | |
| Media della classe Gaming (1339 - 10389, n=201, ultimi 2 anni) | |
| XMG Pro 16 Studio (Mid 23) | |
| AIDA64 / CPU Queen | |
| Acer Predator Helios Neo 16 (2024) | |
| Lenovo Legion Pro 5 16IRX9 | |
| Lenovo Legion 7 16 IRX G9 | |
| Aorus 16X 2024 | |
| Media Intel Core i9-14900HX (118405 - 148966, n=30) | |
| SCHENKER XMG Pro 16 Studio (Mid 24) | |
| Media della classe Gaming (41257 - 200651, n=201, ultimi 2 anni) | |
| XMG Pro 16 Studio (Mid 23) | |
| AIDA64 / FPU SinJulia | |
| Lenovo Legion Pro 5 16IRX9 | |
| Media Intel Core i9-14900HX (10475 - 18517, n=30) | |
| Aorus 16X 2024 | |
| Lenovo Legion 7 16 IRX G9 | |
| SCHENKER XMG Pro 16 Studio (Mid 24) | |
| Acer Predator Helios Neo 16 (2024) | |
| Media della classe Gaming (3925 - 32988, n=201, ultimi 2 anni) | |
| XMG Pro 16 Studio (Mid 23) | |
| AIDA64 / FPU Mandel | |
| Lenovo Legion Pro 5 16IRX9 | |
| Media Intel Core i9-14900HX (32543 - 83662, n=30) | |
| Aorus 16X 2024 | |
| Acer Predator Helios Neo 16 (2024) | |
| Media della classe Gaming (12321 - 134044, n=201, ultimi 2 anni) | |
| SCHENKER XMG Pro 16 Studio (Mid 24) | |
| Lenovo Legion 7 16 IRX G9 | |
| XMG Pro 16 Studio (Mid 23) | |
| AIDA64 / CPU AES | |
| XMG Pro 16 Studio (Mid 23) | |
| Media Intel Core i9-14900HX (86964 - 241777, n=30) | |
| Lenovo Legion Pro 5 16IRX9 | |
| Aorus 16X 2024 | |
| Lenovo Legion 7 16 IRX G9 | |
| Media della classe Gaming (19065 - 328679, n=201, ultimi 2 anni) | |
| SCHENKER XMG Pro 16 Studio (Mid 24) | |
| Acer Predator Helios Neo 16 (2024) | |
| AIDA64 / CPU ZLib | |
| Lenovo Legion Pro 5 16IRX9 | |
| Media Intel Core i9-14900HX (1054 - 2292, n=30) | |
| Aorus 16X 2024 | |
| SCHENKER XMG Pro 16 Studio (Mid 24) | |
| Lenovo Legion 7 16 IRX G9 | |
| Acer Predator Helios Neo 16 (2024) | |
| Media della classe Gaming (269 - 2409, n=201, ultimi 2 anni) | |
| XMG Pro 16 Studio (Mid 23) | |
| AIDA64 / FP64 Ray-Trace | |
| Lenovo Legion Pro 5 16IRX9 | |
| Media Intel Core i9-14900HX (6809 - 18349, n=30) | |
| Lenovo Legion 7 16 IRX G9 | |
| Aorus 16X 2024 | |
| SCHENKER XMG Pro 16 Studio (Mid 24) | |
| Acer Predator Helios Neo 16 (2024) | |
| Media della classe Gaming (2540 - 31796, n=201, ultimi 2 anni) | |
| XMG Pro 16 Studio (Mid 23) | |
| AIDA64 / CPU PhotoWorxx | |
| Lenovo Legion Pro 5 16IRX9 | |
| Aorus 16X 2024 | |
| SCHENKER XMG Pro 16 Studio (Mid 24) | |
| Lenovo Legion 7 16 IRX G9 | |
| XMG Pro 16 Studio (Mid 23) | |
| Acer Predator Helios Neo 16 (2024) | |
| Media Intel Core i9-14900HX (23903 - 54702, n=30) | |
| Media della classe Gaming (10805 - 60161, n=202, ultimi 2 anni) | |
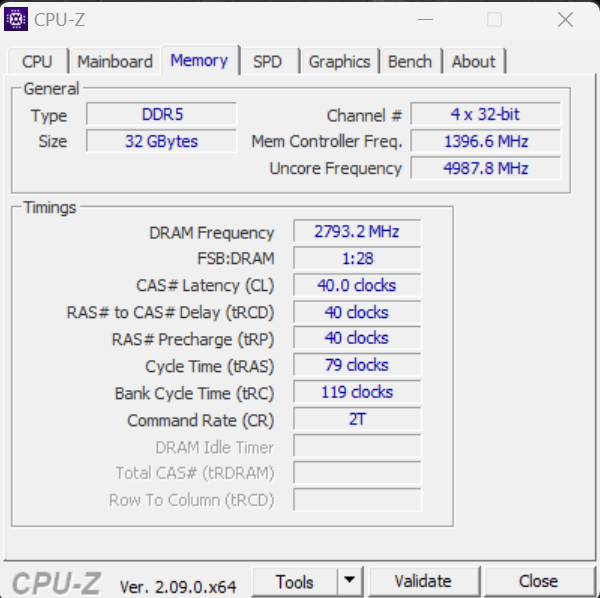
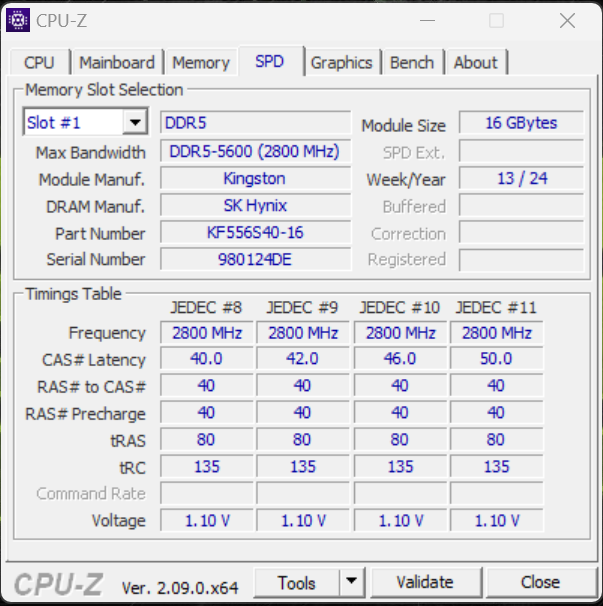
Prestazioni del sistema
Il sistema fluido fornisce prestazioni sufficienti per il gioco, il rendering e lo streaming, ma l'hardware installato non è in grado di stabilire nuovi record. Le velocità di trasferimento della RAM sono nella norma per una RAM DDR5-5600.

CrossMark: Overall | Productivity | Creativity | Responsiveness
WebXPRT 3: Overall
WebXPRT 4: Overall
Mozilla Kraken 1.1: Total
| PCMark 10 / Score | |
| Lenovo Legion Pro 5 16IRX9 | |
| Aorus 16X 2024 | |
| Acer Predator Helios Neo 16 (2024) | |
| Media Intel Core i9-14900HX, NVIDIA GeForce RTX 4070 Laptop GPU (7866 - 8550, n=6) | |
| SCHENKER XMG Pro 16 Studio (Mid 24) | |
| Lenovo Legion 7 16 IRX G9 | |
| XMG Pro 16 Studio (Mid 23) | |
| Media della classe Gaming (5442 - 9852, n=180, ultimi 2 anni) | |
| PCMark 10 / Essentials | |
| XMG Pro 16 Studio (Mid 23) | |
| Acer Predator Helios Neo 16 (2024) | |
| Lenovo Legion Pro 5 16IRX9 | |
| Media Intel Core i9-14900HX, NVIDIA GeForce RTX 4070 Laptop GPU (10621 - 11815, n=6) | |
| Aorus 16X 2024 | |
| Lenovo Legion 7 16 IRX G9 | |
| Media della classe Gaming (8829 - 12334, n=179, ultimi 2 anni) | |
| SCHENKER XMG Pro 16 Studio (Mid 24) | |
| PCMark 10 / Productivity | |
| Aorus 16X 2024 | |
| SCHENKER XMG Pro 16 Studio (Mid 24) | |
| Media Intel Core i9-14900HX, NVIDIA GeForce RTX 4070 Laptop GPU (9701 - 11103, n=6) | |
| XMG Pro 16 Studio (Mid 23) | |
| Acer Predator Helios Neo 16 (2024) | |
| Lenovo Legion Pro 5 16IRX9 | |
| Media della classe Gaming (6662 - 14612, n=179, ultimi 2 anni) | |
| Lenovo Legion 7 16 IRX G9 | |
| PCMark 10 / Digital Content Creation | |
| Lenovo Legion Pro 5 16IRX9 | |
| Lenovo Legion 7 16 IRX G9 | |
| Media Intel Core i9-14900HX, NVIDIA GeForce RTX 4070 Laptop GPU (12114 - 14827, n=6) | |
| Aorus 16X 2024 | |
| Acer Predator Helios Neo 16 (2024) | |
| SCHENKER XMG Pro 16 Studio (Mid 24) | |
| Media della classe Gaming (6462 - 18475, n=179, ultimi 2 anni) | |
| XMG Pro 16 Studio (Mid 23) | |
| CrossMark / Overall | |
| Aorus 16X 2024 | |
| Lenovo Legion 7 16 IRX G9 | |
| Acer Predator Helios Neo 16 (2024) | |
| Media Intel Core i9-14900HX, NVIDIA GeForce RTX 4070 Laptop GPU (2002 - 2312, n=5) | |
| SCHENKER XMG Pro 16 Studio (Mid 24) | |
| Lenovo Legion Pro 5 16IRX9 | |
| XMG Pro 16 Studio (Mid 23) | |
| Media della classe Gaming (1247 - 2344, n=162, ultimi 2 anni) | |
| CrossMark / Productivity | |
| Aorus 16X 2024 | |
| Lenovo Legion 7 16 IRX G9 | |
| Acer Predator Helios Neo 16 (2024) | |
| Media Intel Core i9-14900HX, NVIDIA GeForce RTX 4070 Laptop GPU (1827 - 2191, n=5) | |
| SCHENKER XMG Pro 16 Studio (Mid 24) | |
| XMG Pro 16 Studio (Mid 23) | |
| Lenovo Legion Pro 5 16IRX9 | |
| Media della classe Gaming (1299 - 2204, n=162, ultimi 2 anni) | |
| CrossMark / Creativity | |
| Aorus 16X 2024 | |
| Acer Predator Helios Neo 16 (2024) | |
| Lenovo Legion 7 16 IRX G9 | |
| Media Intel Core i9-14900HX, NVIDIA GeForce RTX 4070 Laptop GPU (2287 - 2458, n=5) | |
| SCHENKER XMG Pro 16 Studio (Mid 24) | |
| Lenovo Legion Pro 5 16IRX9 | |
| Media della classe Gaming (1275 - 2660, n=162, ultimi 2 anni) | |
| XMG Pro 16 Studio (Mid 23) | |
| CrossMark / Responsiveness | |
| Lenovo Legion 7 16 IRX G9 | |
| Aorus 16X 2024 | |
| Acer Predator Helios Neo 16 (2024) | |
| Media Intel Core i9-14900HX, NVIDIA GeForce RTX 4070 Laptop GPU (1734 - 2330, n=5) | |
| XMG Pro 16 Studio (Mid 23) | |
| Lenovo Legion Pro 5 16IRX9 | |
| SCHENKER XMG Pro 16 Studio (Mid 24) | |
| Media della classe Gaming (1030 - 2330, n=162, ultimi 2 anni) | |
| WebXPRT 3 / Overall | |
| Lenovo Legion 7 16 IRX G9 | |
| Media Intel Core i9-14900HX, NVIDIA GeForce RTX 4070 Laptop GPU (319 - 342, n=6) | |
| Aorus 16X 2024 | |
| Acer Predator Helios Neo 16 (2024) | |
| Lenovo Legion Pro 5 16IRX9 | |
| XMG Pro 16 Studio (Mid 23) | |
| SCHENKER XMG Pro 16 Studio (Mid 24) | |
| Media della classe Gaming (215 - 480, n=181, ultimi 2 anni) | |
| WebXPRT 4 / Overall | |
| Acer Predator Helios Neo 16 (2024) | |
| SCHENKER XMG Pro 16 Studio (Mid 24) | |
| Media Intel Core i9-14900HX, NVIDIA GeForce RTX 4070 Laptop GPU (291 - 301, n=4) | |
| Lenovo Legion 7 16 IRX G9 | |
| Lenovo Legion Pro 5 16IRX9 | |
| Media della classe Gaming (157.9 - 328, n=167, ultimi 2 anni) | |
| Mozilla Kraken 1.1 / Total | |
| Media della classe Gaming (421 - 737, n=193, ultimi 2 anni) | |
| XMG Pro 16 Studio (Mid 23) | |
| SCHENKER XMG Pro 16 Studio (Mid 24) | |
| Lenovo Legion Pro 5 16IRX9 | |
| Acer Predator Helios Neo 16 (2024) | |
| Lenovo Legion 7 16 IRX G9 | |
| Media Intel Core i9-14900HX, NVIDIA GeForce RTX 4070 Laptop GPU (431 - 461, n=6) | |
| Aorus 16X 2024 | |
* ... Meglio usare valori piccoli
| PCMark 10 Score | 8166 punti | |
Aiuto | ||
| AIDA64 / Memory Copy | |
| Lenovo Legion Pro 5 16IRX9 | |
| Lenovo Legion 7 16 IRX G9 | |
| Aorus 16X 2024 | |
| SCHENKER XMG Pro 16 Studio (Mid 24) | |
| Acer Predator Helios Neo 16 (2024) | |
| Media Intel Core i9-14900HX (38028 - 83392, n=30) | |
| XMG Pro 16 Studio (Mid 23) | |
| Media della classe Gaming (21842 - 94222, n=201, ultimi 2 anni) | |
| AIDA64 / Memory Read | |
| Aorus 16X 2024 | |
| Lenovo Legion Pro 5 16IRX9 | |
| Lenovo Legion 7 16 IRX G9 | |
| SCHENKER XMG Pro 16 Studio (Mid 24) | |
| Acer Predator Helios Neo 16 (2024) | |
| Media Intel Core i9-14900HX (43306 - 87507, n=30) | |
| XMG Pro 16 Studio (Mid 23) | |
| Media della classe Gaming (23681 - 99713, n=201, ultimi 2 anni) | |
| AIDA64 / Memory Write | |
| Aorus 16X 2024 | |
| Lenovo Legion Pro 5 16IRX9 | |
| Lenovo Legion 7 16 IRX G9 | |
| SCHENKER XMG Pro 16 Studio (Mid 24) | |
| XMG Pro 16 Studio (Mid 23) | |
| Media Intel Core i9-14900HX (37146 - 80589, n=30) | |
| Acer Predator Helios Neo 16 (2024) | |
| Media della classe Gaming (22986 - 108954, n=201, ultimi 2 anni) | |
| AIDA64 / Memory Latency | |
| Media della classe Gaming (59.5 - 259, n=201, ultimi 2 anni) | |
| Acer Predator Helios Neo 16 (2024) | |
| XMG Pro 16 Studio (Mid 23) | |
| Media Intel Core i9-14900HX (76.1 - 105, n=30) | |
| SCHENKER XMG Pro 16 Studio (Mid 24) | |
| Lenovo Legion 7 16 IRX G9 | |
| Lenovo Legion Pro 5 16IRX9 | |
| Aorus 16X 2024 | |
* ... Meglio usare valori piccoli
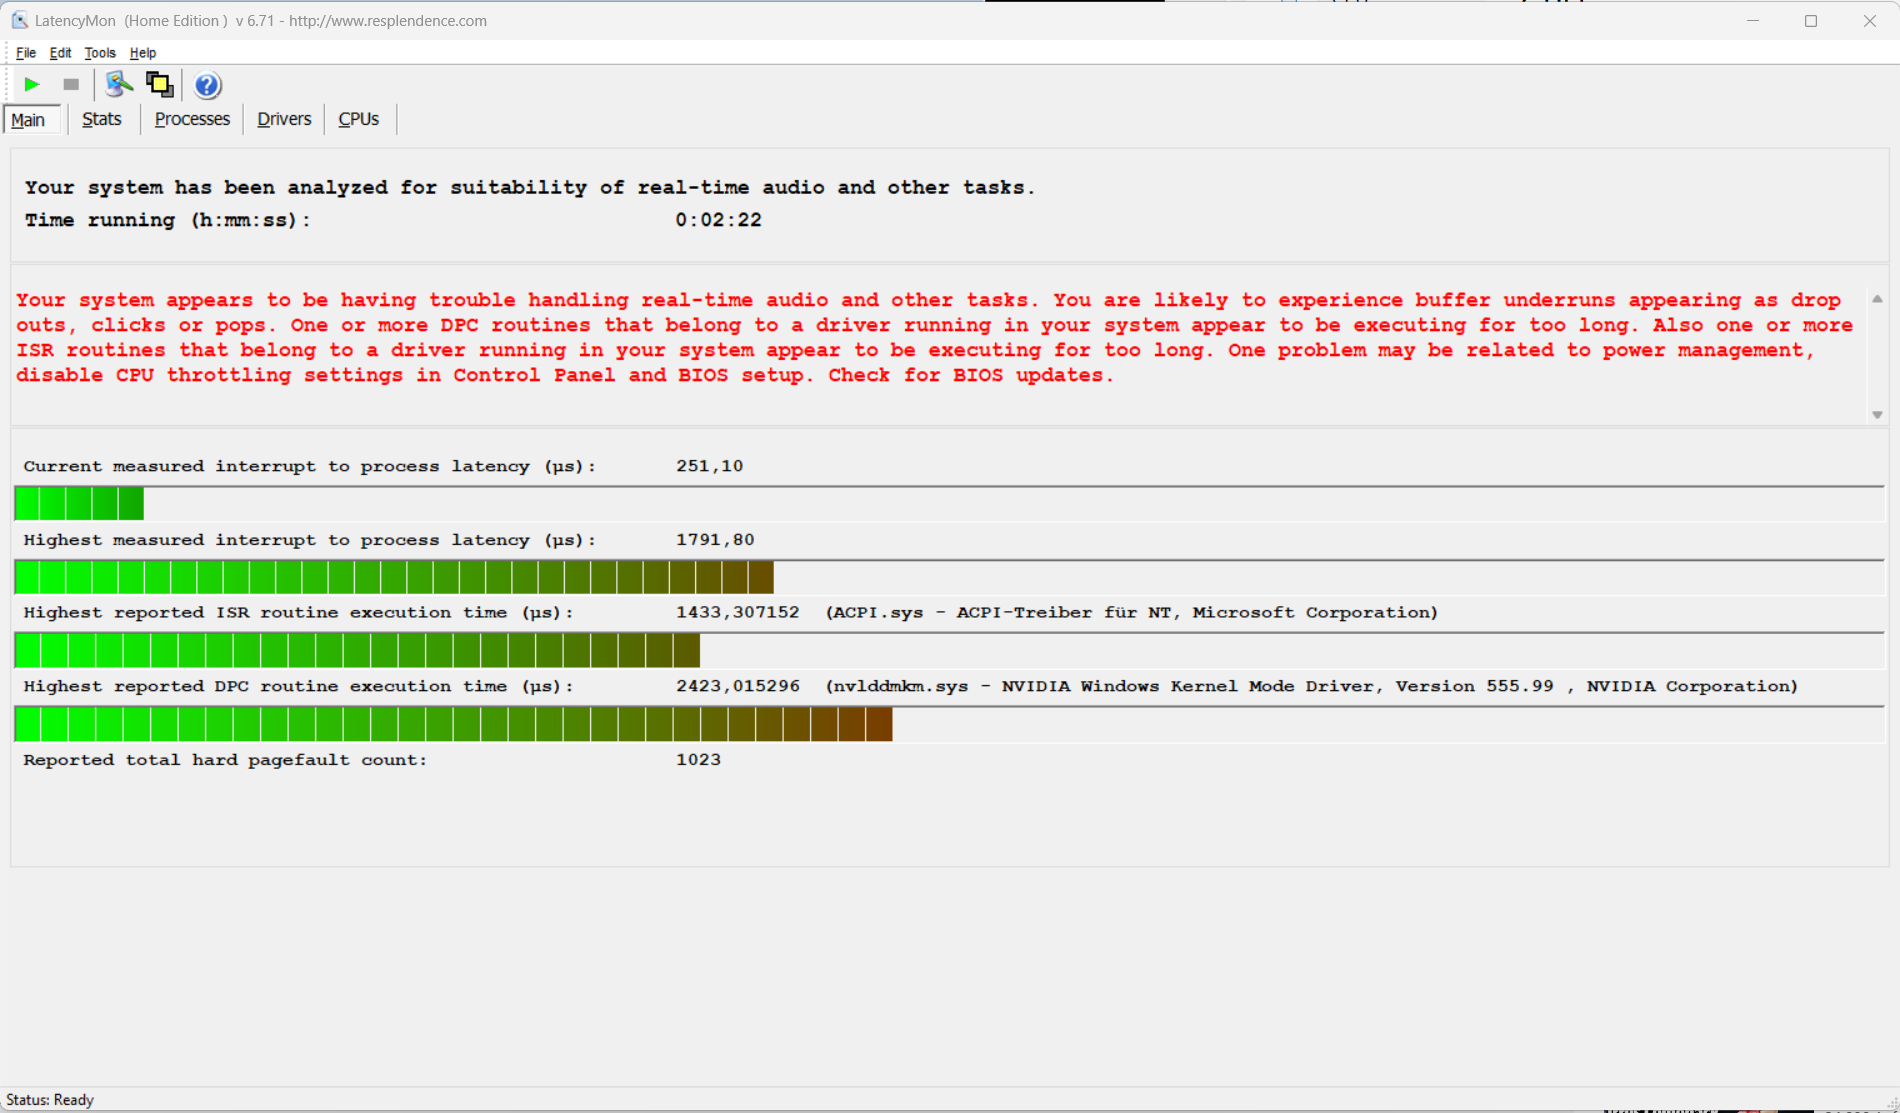
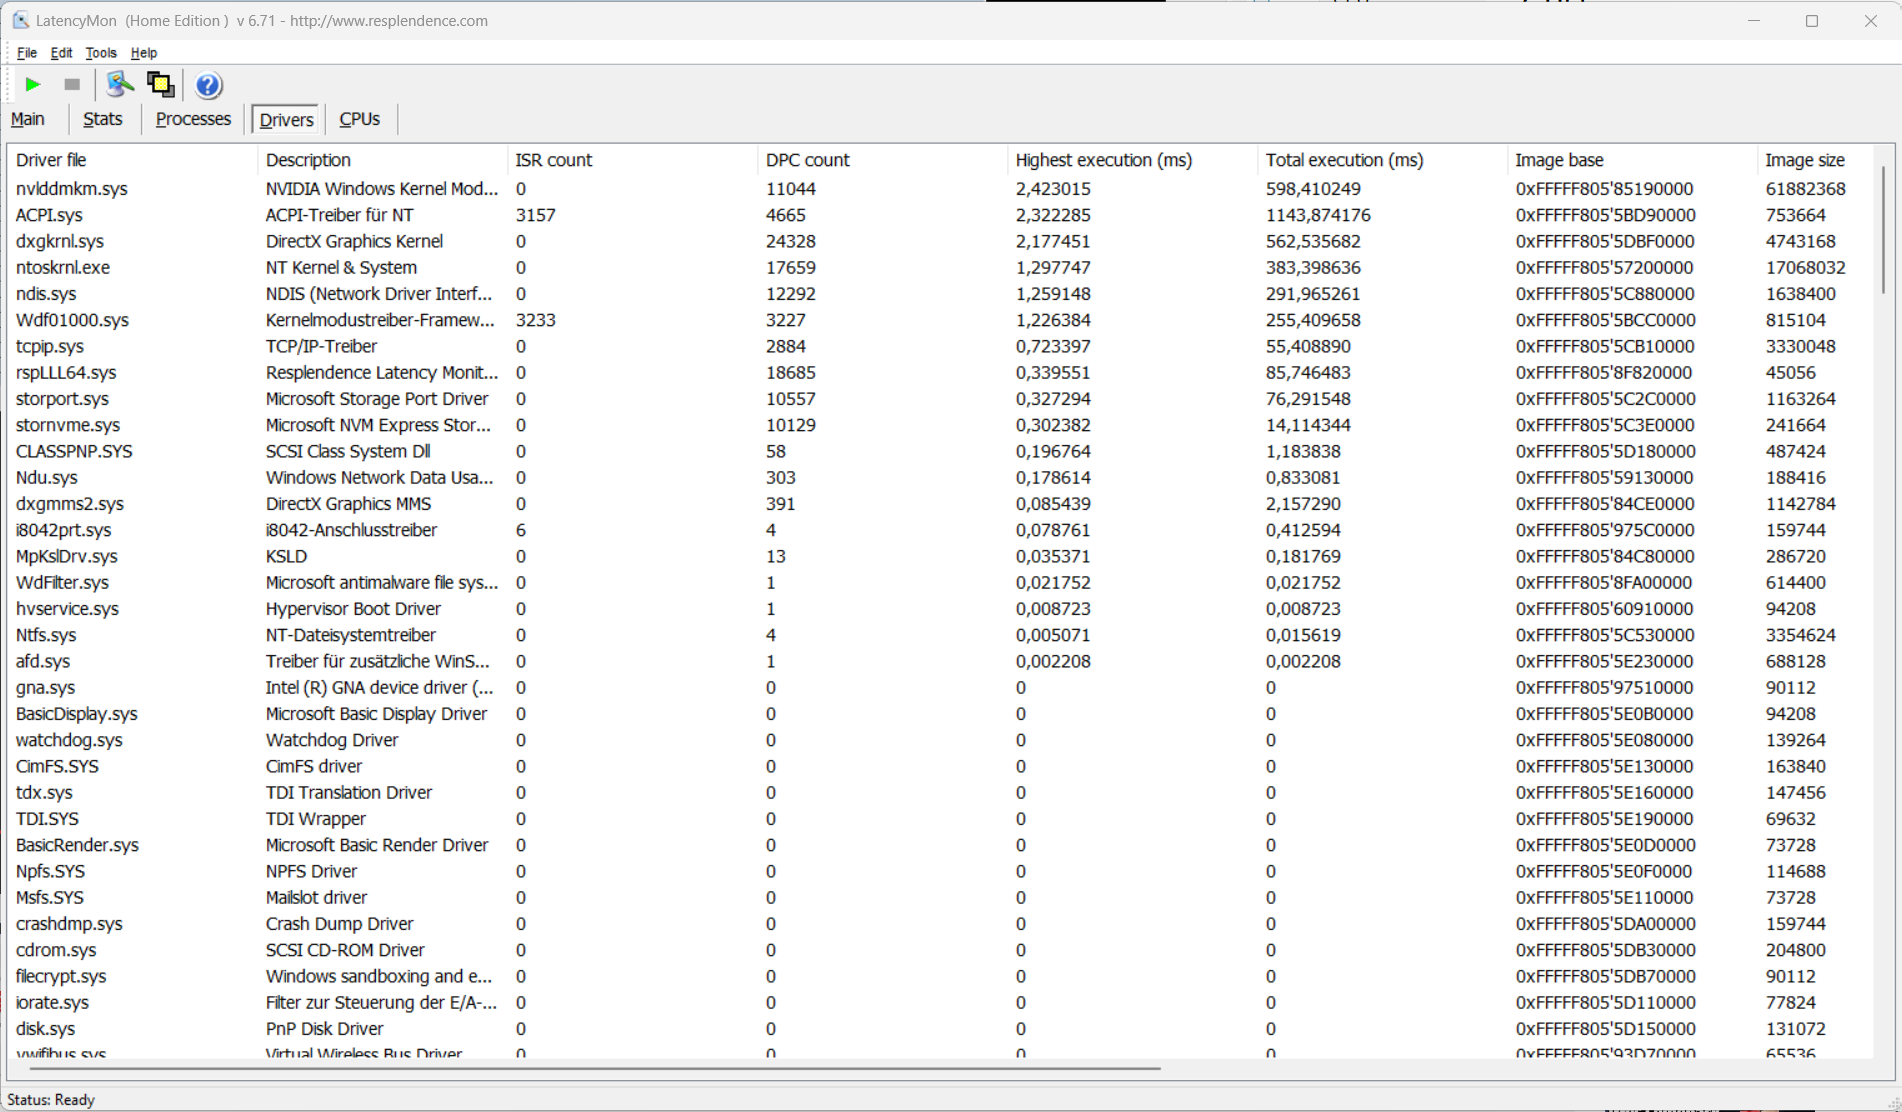
Latenze DPC
A causa delle latenze relativamente elevate del portatile, l'editing video e audio in tempo reale non è previsto. Tuttavia, i futuri aggiornamenti del software potrebbero portare a cambiamenti in questo senso.
| DPC Latencies / LatencyMon - interrupt to process latency (max), Web, Youtube, Prime95 | |
| XMG Pro 16 Studio (Mid 23) | |
| SCHENKER XMG Pro 16 Studio (Mid 24) | |
| Lenovo Legion 7 16 IRX G9 | |
| Acer Predator Helios Neo 16 (2024) | |
| Aorus 16X 2024 | |
| Lenovo Legion Pro 5 16IRX9 | |
* ... Meglio usare valori piccoli
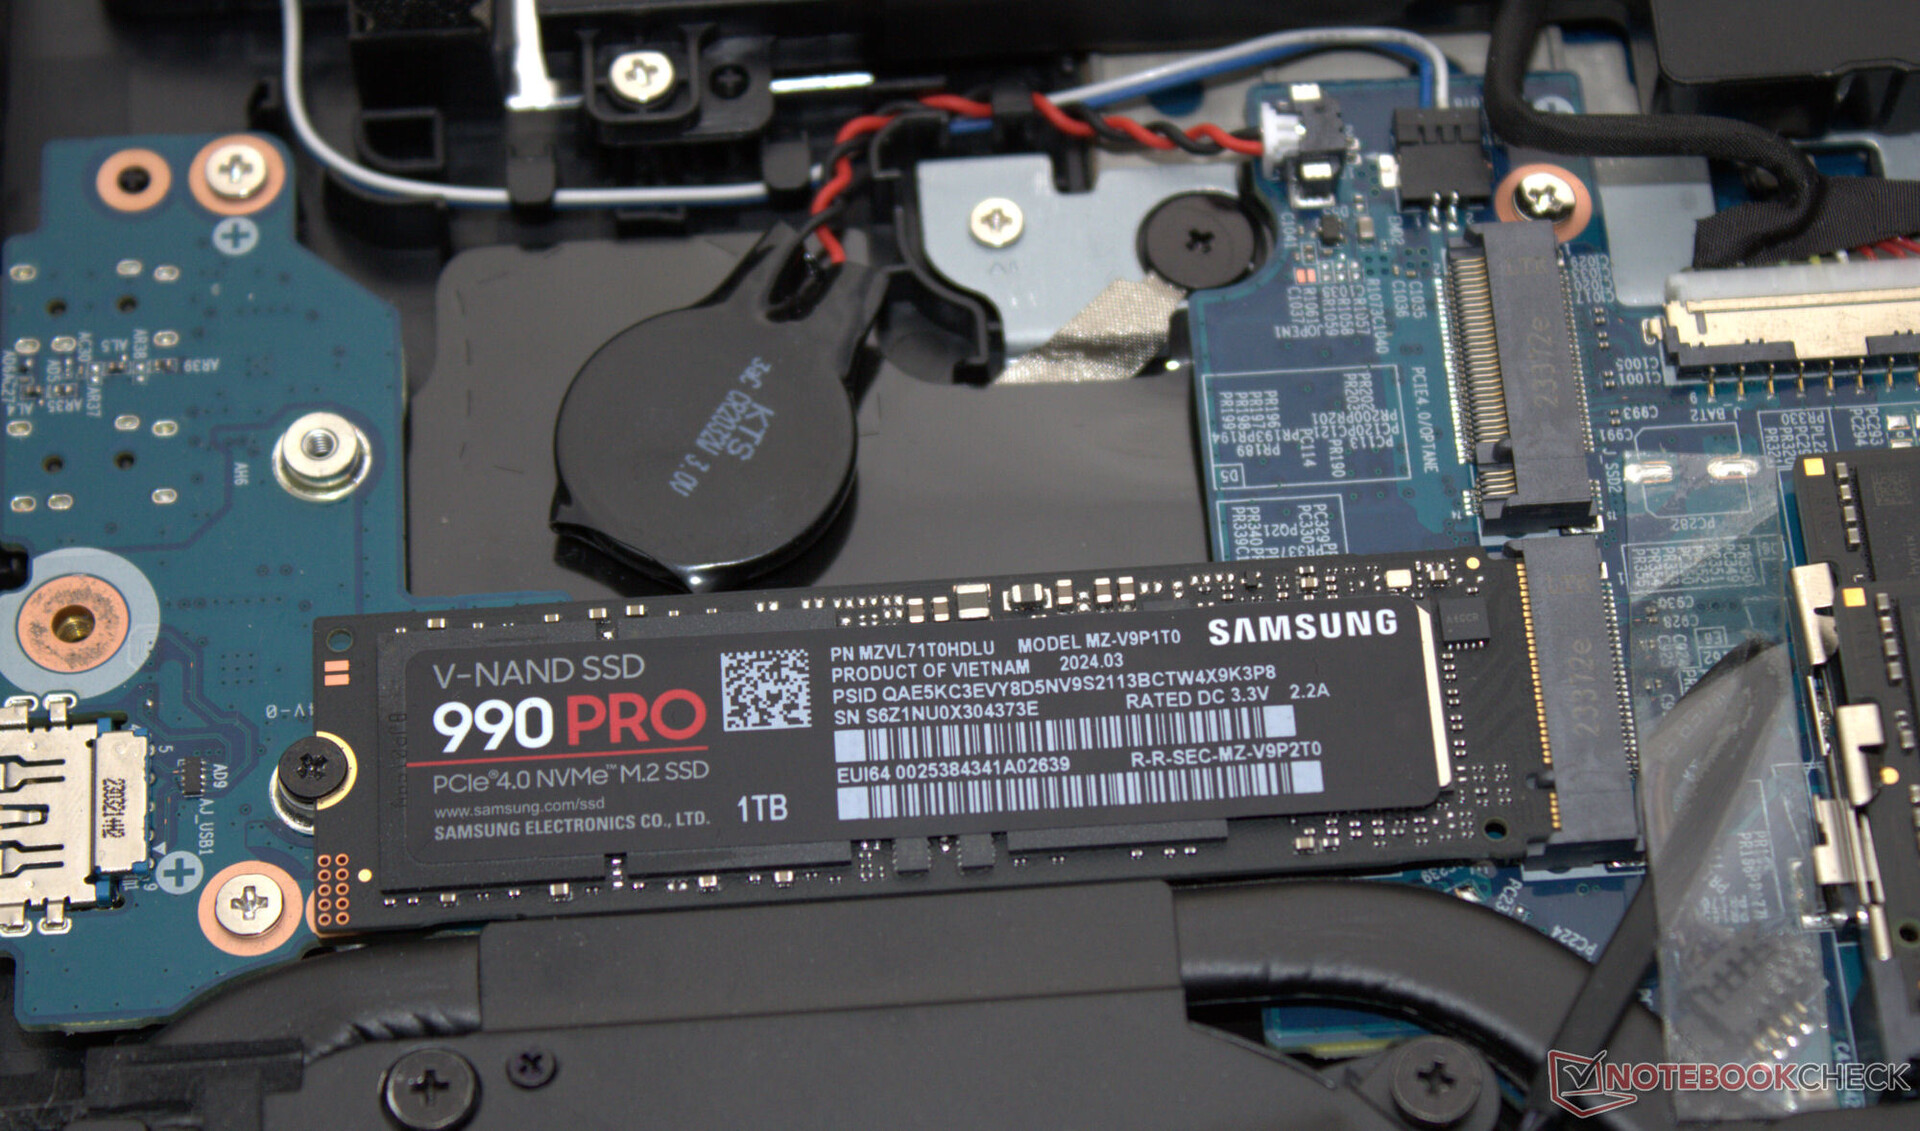
Dispositivi di archiviazione
Il negozio online di Schenker offre una varietà di SSD tra cui scegliere; il nostro dispositivo di prova è dotato di un modello fulmineo (1 TB, PCIe 4, M.2-2280) di Samsung. Positivo: Non si è verificato il throttling indotto dal calore. Il portatile può ospitare fino a due SSD PCIe 4 (M.2-2280). È supportato il RAID-0/1.

* ... Meglio usare valori piccoli
Reading continuous performance: DiskSpd Read Loop, Queue Depth 8
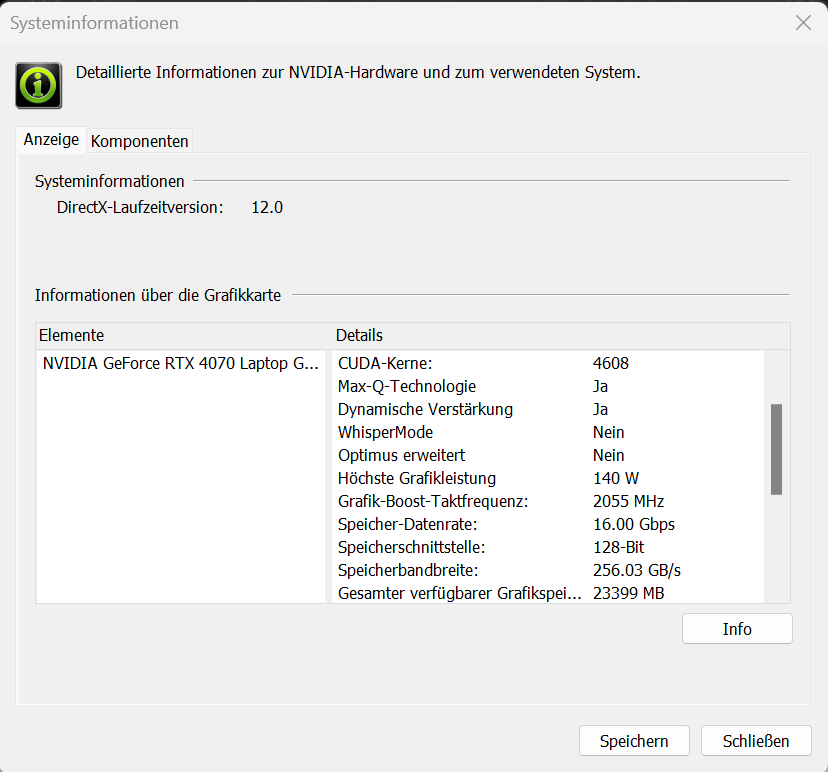
Scheda grafica
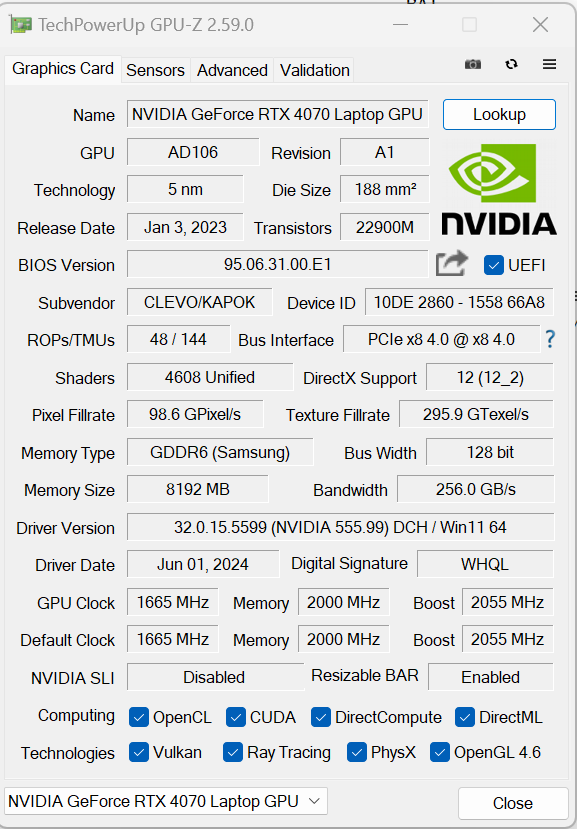
Il gioco in QHD con impostazioni elevate o massime non è un problema per la GeForce RTX 4070 (TGP: 140 watt): Offre frame rate (e risultati di benchmark) leggermente superiori alla media della GPU. Un po' stretto per i requisiti di oggi: La GPU ha a disposizione solo 8 GB di VRAM (GDDR6). La commutazione tra dGPU e Optimus richiede un riavvio.

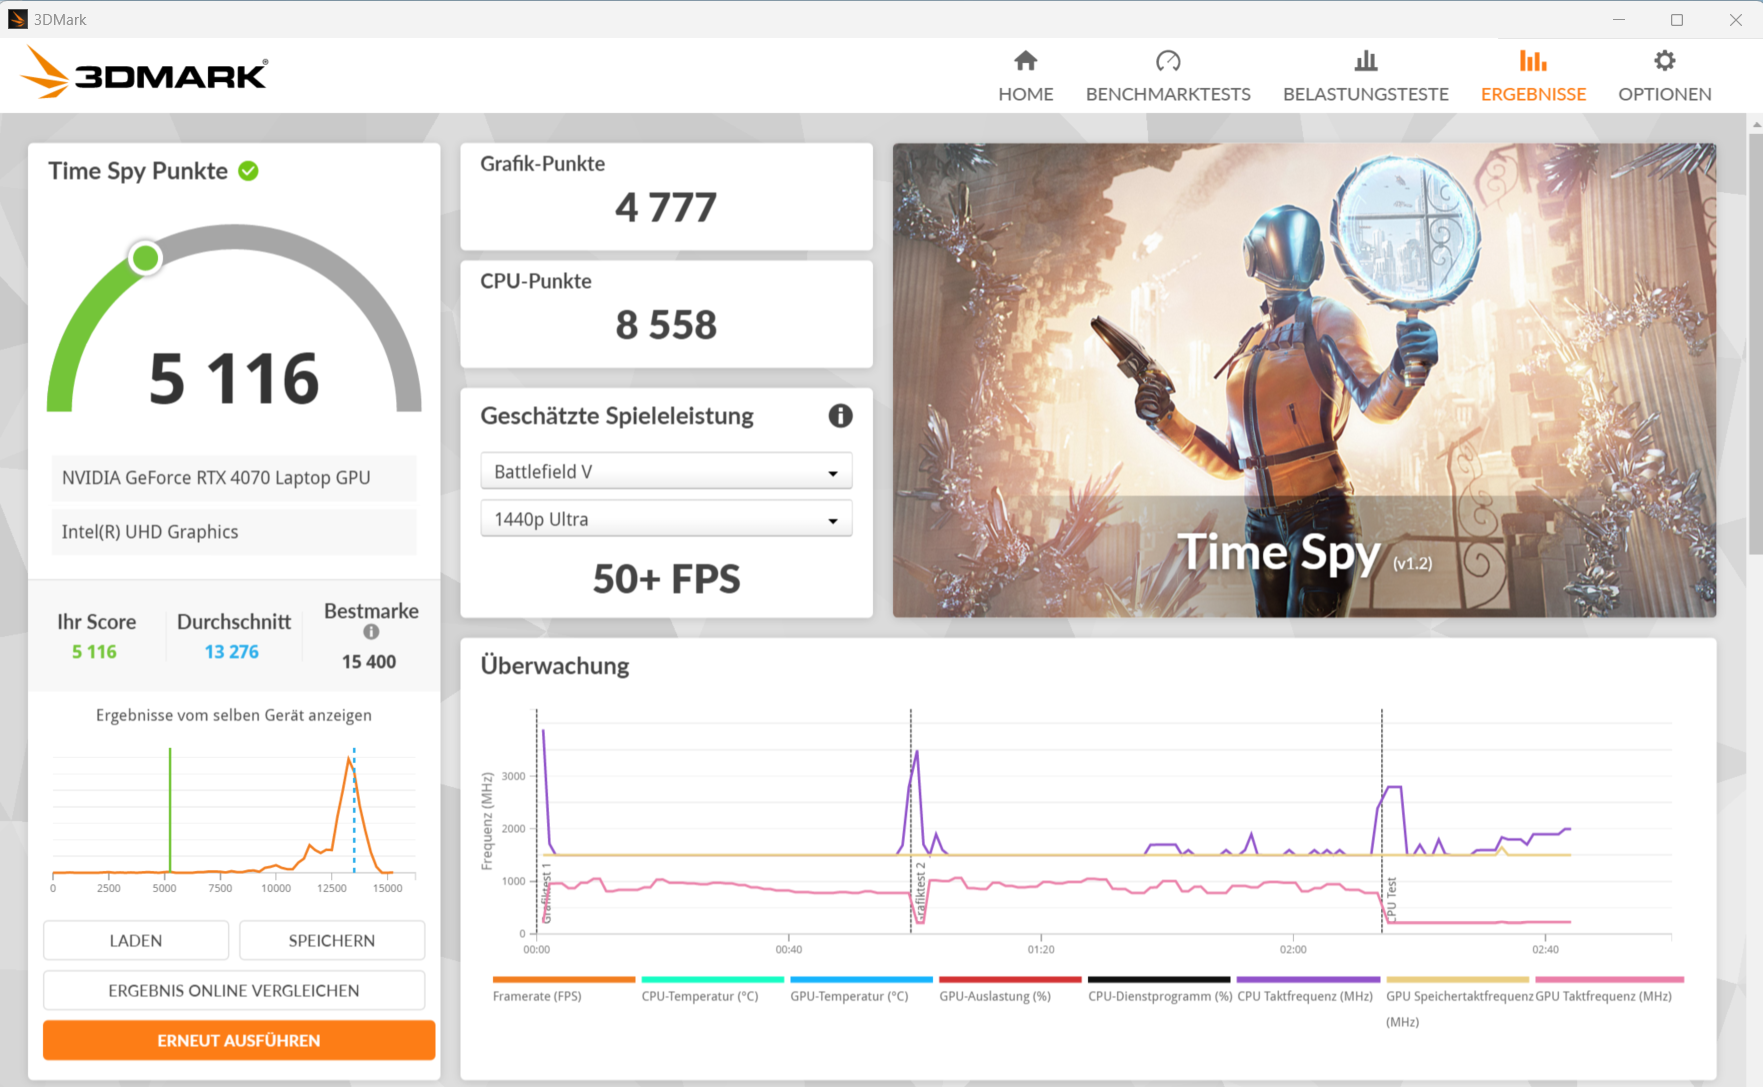
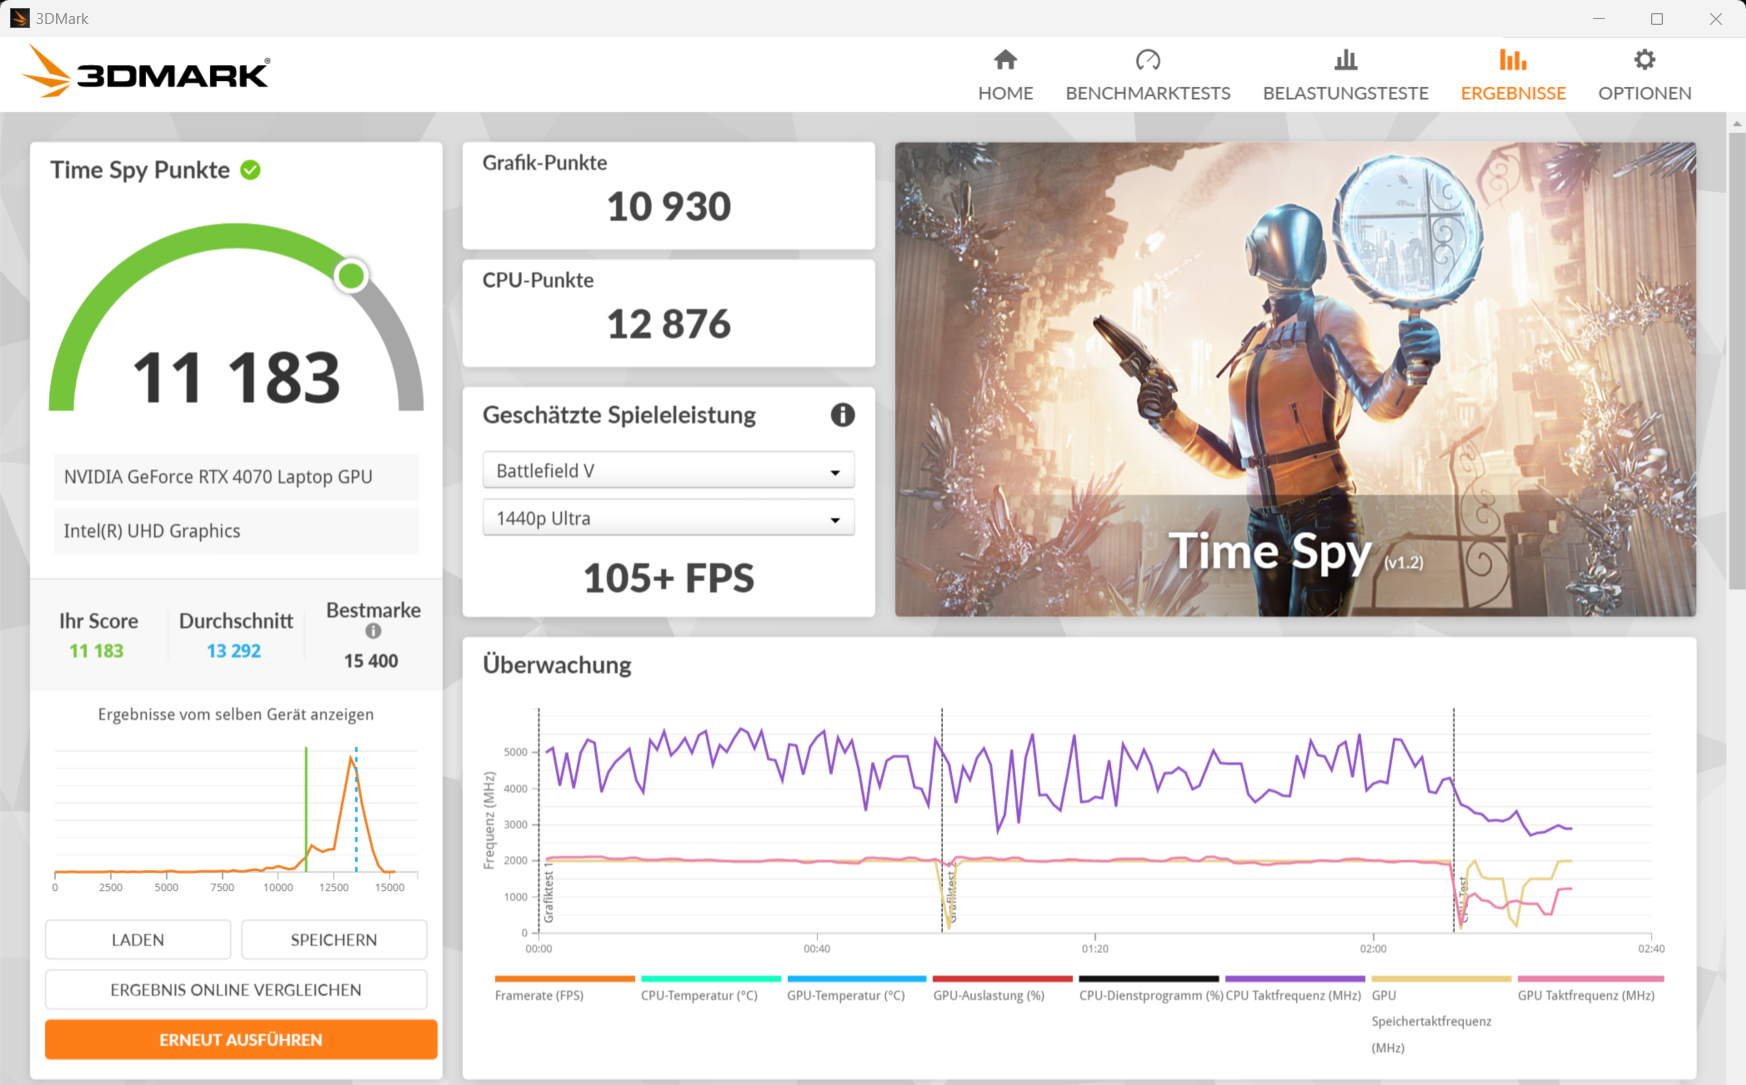
| 3DMark 11 Performance | 34173 punti | |
| 3DMark Fire Strike Score | 23584 punti | |
| 3DMark Time Spy Score | 12286 punti | |
| 3DMark Steel Nomad Score | 2598 punti | |
Aiuto | ||
* ... Meglio usare valori piccoli
| Cyberpunk 2077 2.1 Phantom Liberty - 1920x1080 Ultra Preset (FSR off) | |
| XMG Pro 16 Studio (Mid 23) | |
| Lenovo Legion Pro 5 16IRX9 | |
| Media della classe Gaming (6.76 - 144.7, n=73, ultimi 2 anni) | |
| Lenovo Legion 7 16 IRX G9 | |
| Acer Predator Helios Neo 16 (2024) | |
| SCHENKER XMG Pro 16 Studio (Mid 24) | |
| Media NVIDIA GeForce RTX 4070 Laptop GPU (30.7 - 90.7, n=27) | |
| Aorus 16X 2024 | |
| GTA V - 1920x1080 Highest Settings possible AA:4xMSAA + FX AF:16x | |
| Acer Predator Helios Neo 16 (2024) | |
| Lenovo Legion Pro 5 16IRX9 | |
| SCHENKER XMG Pro 16 Studio (Mid 24) | |
| XMG Pro 16 Studio (Mid 23) | |
| Lenovo Legion 7 16 IRX G9 | |
| Media della classe Gaming (12.1 - 167.7, n=185, ultimi 2 anni) | |
| Media NVIDIA GeForce RTX 4070 Laptop GPU (48.3 - 140.5, n=53) | |
| Aorus 16X 2024 | |
| Senua's Saga Hellblade 2 | |
| 1920x1080 High Preset | |
| Media della classe Gaming (38.4 - 78.8, n=4, ultimi 2 anni) | |
| SCHENKER XMG Pro 16 Studio (Mid 24) | |
| Media NVIDIA GeForce RTX 4070 Laptop GPU (46.2 - 51.2, n=2) | |
| 2560x1440 High Preset | |
| Media della classe Gaming (33.3 - 57.3, n=2, ultimi 2 anni) | |
| SCHENKER XMG Pro 16 Studio (Mid 24) | |
| Media NVIDIA GeForce RTX 4070 Laptop GPU (32 - 33.3, n=2) | |
| 2560x1440 High Preset + Quality DLSS | |
| Media della classe Gaming (47.8 - 83.1, n=2, ultimi 2 anni) | |
| SCHENKER XMG Pro 16 Studio (Mid 24) | |
| Media NVIDIA GeForce RTX 4070 Laptop GPU () | |
| Ghost of Tsushima | |
| 1920x1080 Very High Preset AA:T | |
| SCHENKER XMG Pro 16 Studio (Mid 24) | |
| Media NVIDIA GeForce RTX 4070 Laptop GPU (68.1 - 73.7, n=3) | |
| Media della classe Gaming (28.5 - 73.7, n=7, ultimi 2 anni) | |
| 2560x1440 Very High Preset AA:T | |
| SCHENKER XMG Pro 16 Studio (Mid 24) | |
| Media NVIDIA GeForce RTX 4070 Laptop GPU (50.5 - 56.1, n=3) | |
| Media della classe Gaming (22.7 - 56.1, n=5, ultimi 2 anni) | |
| 2560x1440 Very High Preset + Quality DLSS | |
| SCHENKER XMG Pro 16 Studio (Mid 24) | |
| Media NVIDIA GeForce RTX 4070 Laptop GPU (69.6 - 74.2, n=2) | |
| Media della classe Gaming (63.6 - 74.2, n=3, ultimi 2 anni) | |
| The First Descendant | |
| 1920x1080 Ultra Preset | |
| SCHENKER XMG Pro 16 Studio (Mid 24) | |
| Media NVIDIA GeForce RTX 4070 Laptop GPU (73.7 - 80, n=4) | |
| Media della classe Gaming (15.4 - 80, n=5, ultimi 2 anni) | |
| 2560x1440 Ultra Preset | |
| SCHENKER XMG Pro 16 Studio (Mid 24) | |
| Media NVIDIA GeForce RTX 4070 Laptop GPU (48.2 - 51.2, n=4) | |
| Media della classe Gaming (43.7 - 51.2, n=3, ultimi 2 anni) | |
| 2560x1440 Ultra Preset + Ultra Ray Tracing + DLSS Quality | |
| SCHENKER XMG Pro 16 Studio (Mid 24) | |
| Media NVIDIA GeForce RTX 4070 Laptop GPU (48.6 - 51.8, n=2) | |
| Media della classe Gaming (43.3 - 51.8, n=2, ultimi 2 anni) | |
| F1 24 | |
| 1920x1080 Ultra High Preset AA:T AF:16x | |
| Media della classe Gaming (54.1 - 127, n=12, ultimi 2 anni) | |
| SCHENKER XMG Pro 16 Studio (Mid 24) | |
| Media NVIDIA GeForce RTX 4070 Laptop GPU (64.7 - 74.1, n=5) | |
| 2560x1440 Ultra High Preset AA:T AF:16x | |
| Media della classe Gaming (36.7 - 84.7, n=9, ultimi 2 anni) | |
| Media NVIDIA GeForce RTX 4070 Laptop GPU (41.1 - 48.4, n=5) | |
| SCHENKER XMG Pro 16 Studio (Mid 24) | |
| 2560x1440 Ultra High Preset + Quality DLSS AF:16x | |
| Media della classe Gaming (59.2 - 129.5, n=8, ultimi 2 anni) | |
| SCHENKER XMG Pro 16 Studio (Mid 24) | |
| Media NVIDIA GeForce RTX 4070 Laptop GPU (65.2 - 73.9, n=4) | |
Cyberpunk 2077 ultra FPS diagram
| basso | medio | alto | ultra | QHD | |
| GTA V (2015) | 186.7 | 184.9 | 180.9 | 126 | 95.9 |
| Dota 2 Reborn (2015) | 231 | 196.2 | 181.6 | 160.8 | |
| Final Fantasy XV Benchmark (2018) | 214 | 163.6 | 119.7 | 86.8 | |
| X-Plane 11.11 (2018) | 178 | 147.3 | 119.5 | ||
| Strange Brigade (2018) | 457 | 297 | 236 | 206 | 135.9 |
| Baldur's Gate 3 (2023) | 171.8 | 132 | 115.3 | 111.8 | 77.2 |
| Cyberpunk 2077 2.1 Phantom Liberty (2023) | 126.3 | 112.1 | 95.5 | 82.5 | 48.6 |
| Dragon's Dogma 2 (2024) | 81 | 70.4 | 58.5 | ||
| Ghost of Tsushima (2024) | 114.9 | 102.8 | 93 | 73.7 | 56.1 |
| Senua's Saga Hellblade 2 (2024) | 78.3 | 64.9 | 51.2 | 33.3 | |
| F1 24 (2024) | 239 | 238 | 203 | 70.4 | 45.1 |
| The First Descendant (2024) | 171 | 110.9 | 91.3 | 80 | 51.2 |
Emissioni e potenza - L'XMG Pro con un elevato consumo di potenza
Emissioni di rumore
Cyberpunk 2077 aumenta le emissioni acustiche del portatile fino a 53 dB(A)( modalitàprestazioni ), mentre il profilo intrattenimento produce valori leggermente più moderati. La modalità silenziosa non è adatta al gioco, in quanto la dGPU è disattivata. Il livello di rumore del dispositivo è più basso quando è al minimo e durante l'uso quotidiano (ufficio, internet): Le ventole non aumentano eccessivamente e a volte rimangono ferme. A volte, si sente un crepitio elettronico dall'interno del portatile.
Rumorosità
| Idle |
| 28 / 31 / 35 dB(A) |
| Sotto carico |
| 52 / 52 dB(A) |
 | ||
30 dB silenzioso 40 dB(A) udibile 50 dB(A) rumoroso |
||
min: | ||
| SCHENKER XMG Pro 16 Studio (Mid 24) NVIDIA GeForce RTX 4070 Laptop GPU, i9-14900HX, Samsung 990 Pro 1 TB | Acer Predator Helios Neo 16 (2024) NVIDIA GeForce RTX 4070 Laptop GPU, i7-14700HX, Samsung PM9A1a MZVL21T0HDLU | Lenovo Legion Pro 5 16IRX9 NVIDIA GeForce RTX 4070 Laptop GPU, i9-14900HX, Samsung PM9A1 MZVL21T0HCLR | Aorus 16X 2024 NVIDIA GeForce RTX 4070 Laptop GPU, i9-14900HX, Gigabyte AG450E1024-SI | XMG Pro 16 Studio (Mid 23) NVIDIA GeForce RTX 4070 Laptop GPU, i9-13900H, Samsung 990 Pro 1 TB | Lenovo Legion 7 16 IRX G9 NVIDIA GeForce RTX 4070 Laptop GPU, i9-14900HX, SK Hynix HFS001TEJ9X115N | |
|---|---|---|---|---|---|---|
| Noise | 3% | 10% | -3% | 7% | 16% | |
| off /ambiente * | 25 | 25.2 -1% | 23.9 4% | 26 -4% | 25 -0% | 24.5 2% |
| Idle Minimum * | 28 | 27.8 1% | 24.3 13% | 26 7% | 26 7% | 24.5 12% |
| Idle Average * | 31 | 32 -3% | 24.3 22% | 32 -3% | 29 6% | 24.5 21% |
| Idle Maximum * | 35 | 29.6 15% | 28.9 17% | 38 -9% | 34 3% | 24.5 30% |
| Load Average * | 52 | 45.2 13% | 45.8 12% | 54 -4% | 43 17% | 34.8 33% |
| Cyberpunk 2077 ultra * | 53 | |||||
| Load Maximum * | 52 | 55.8 -7% | 56.6 -9% | 55 -6% | 48 8% | 54.1 -4% |
| Witcher 3 ultra * | 51 | 50 | 48 | 54.1 |
* ... Meglio usare valori piccoli
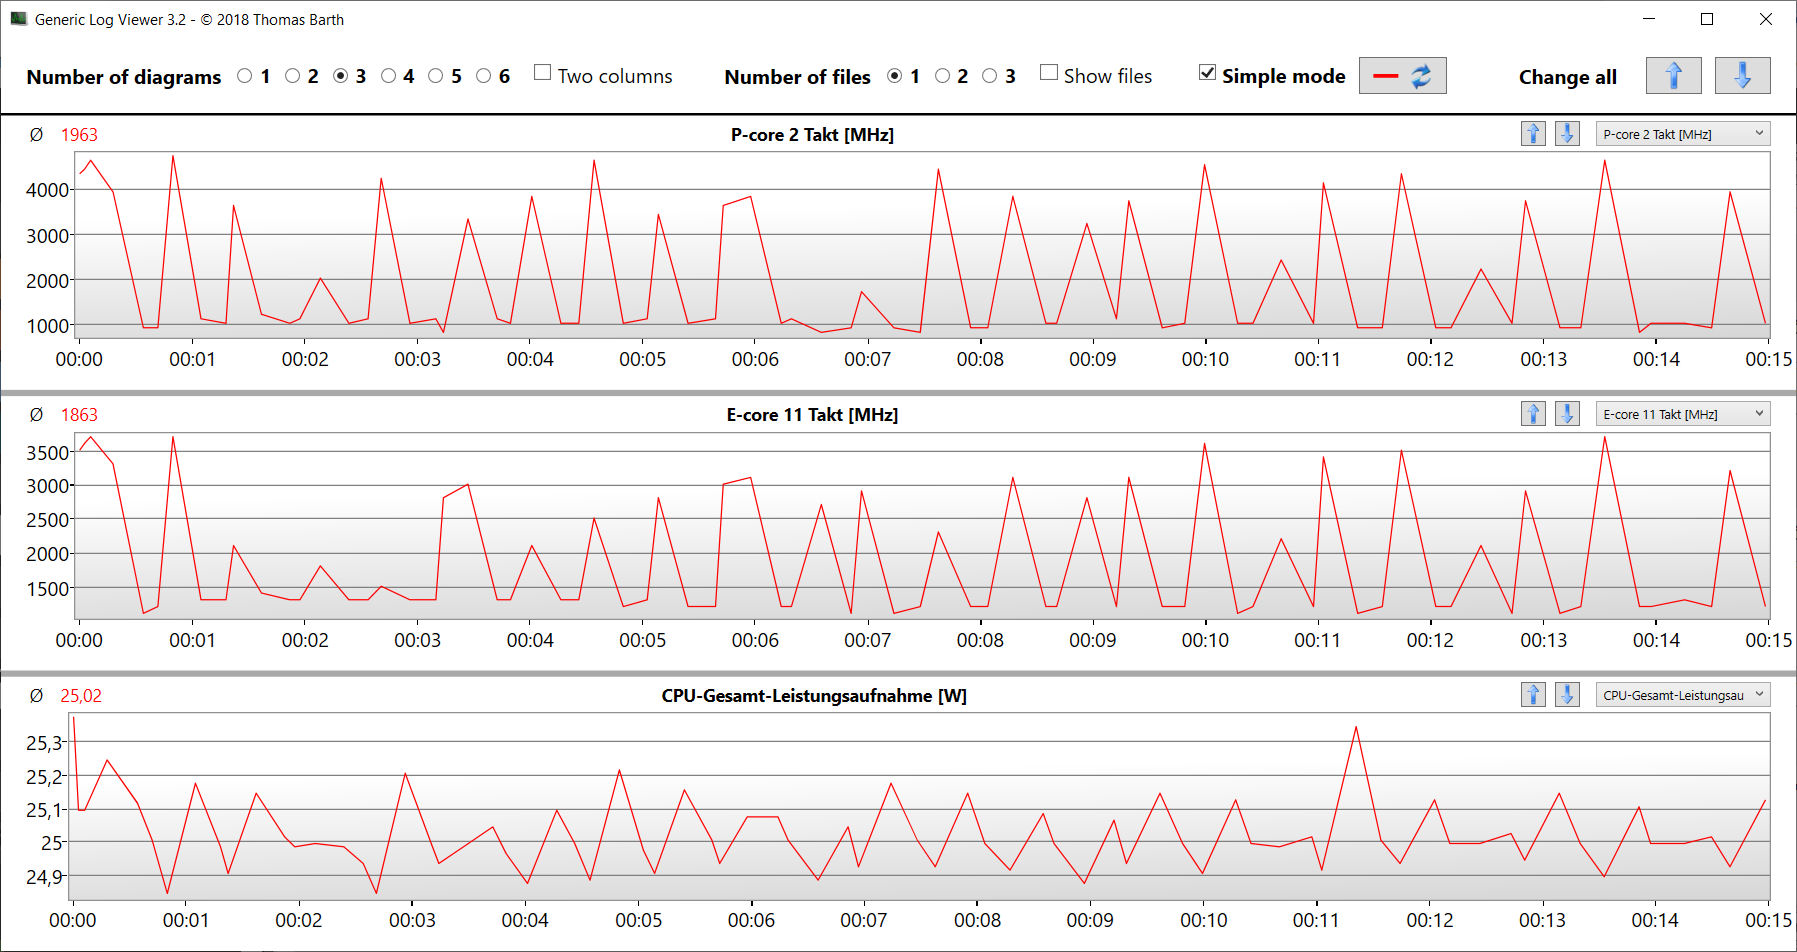
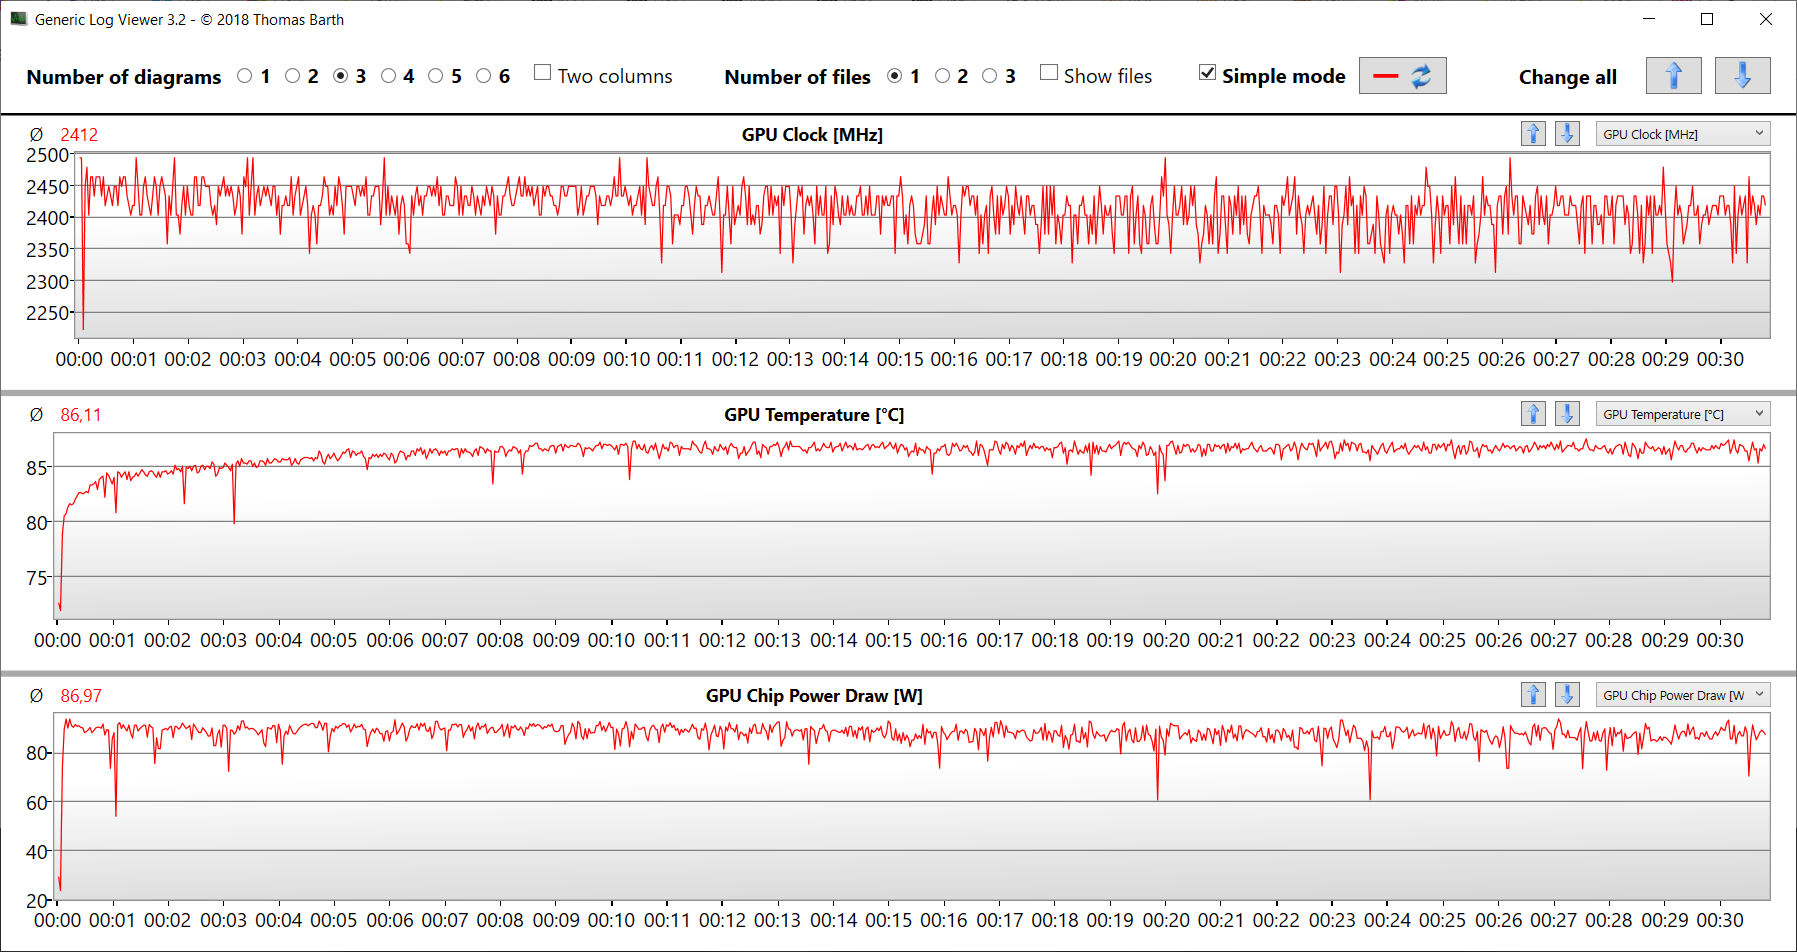
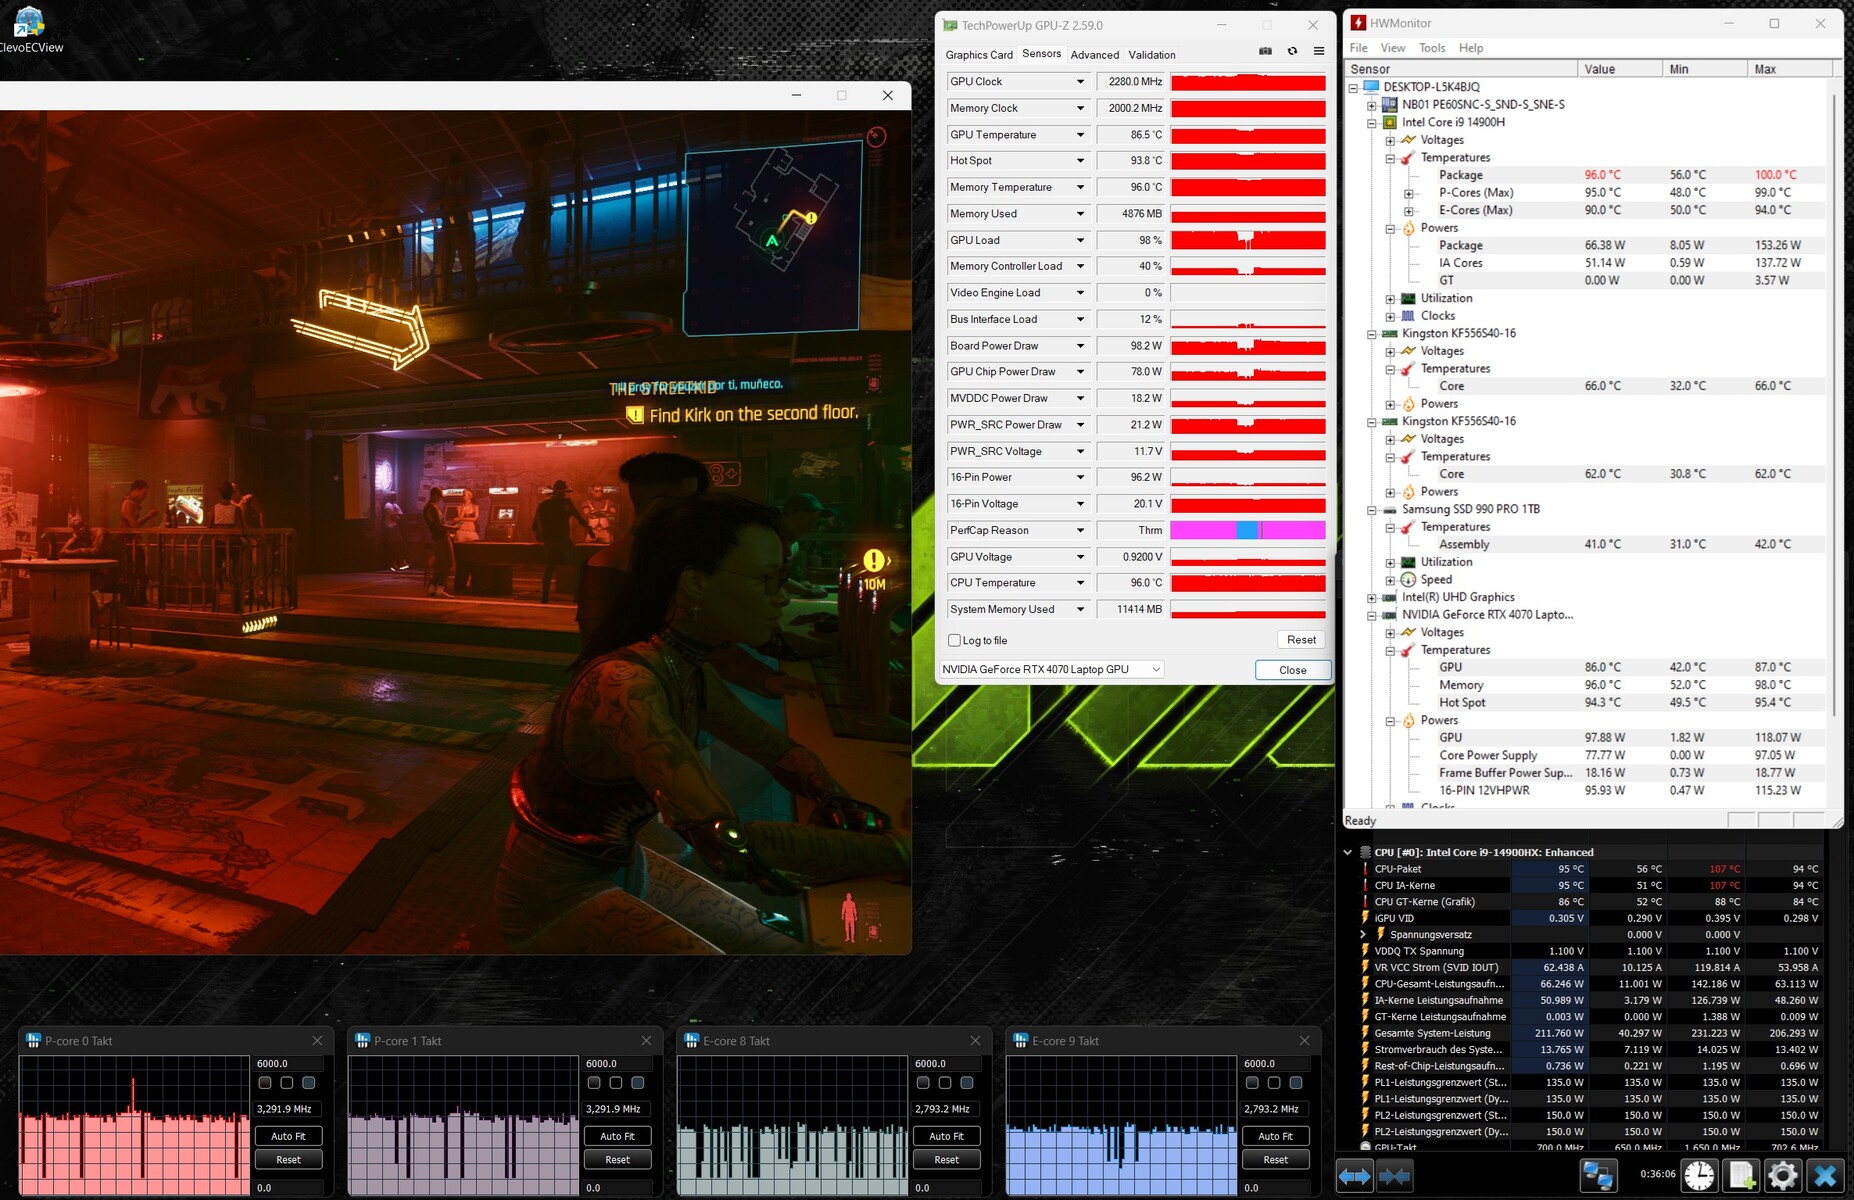
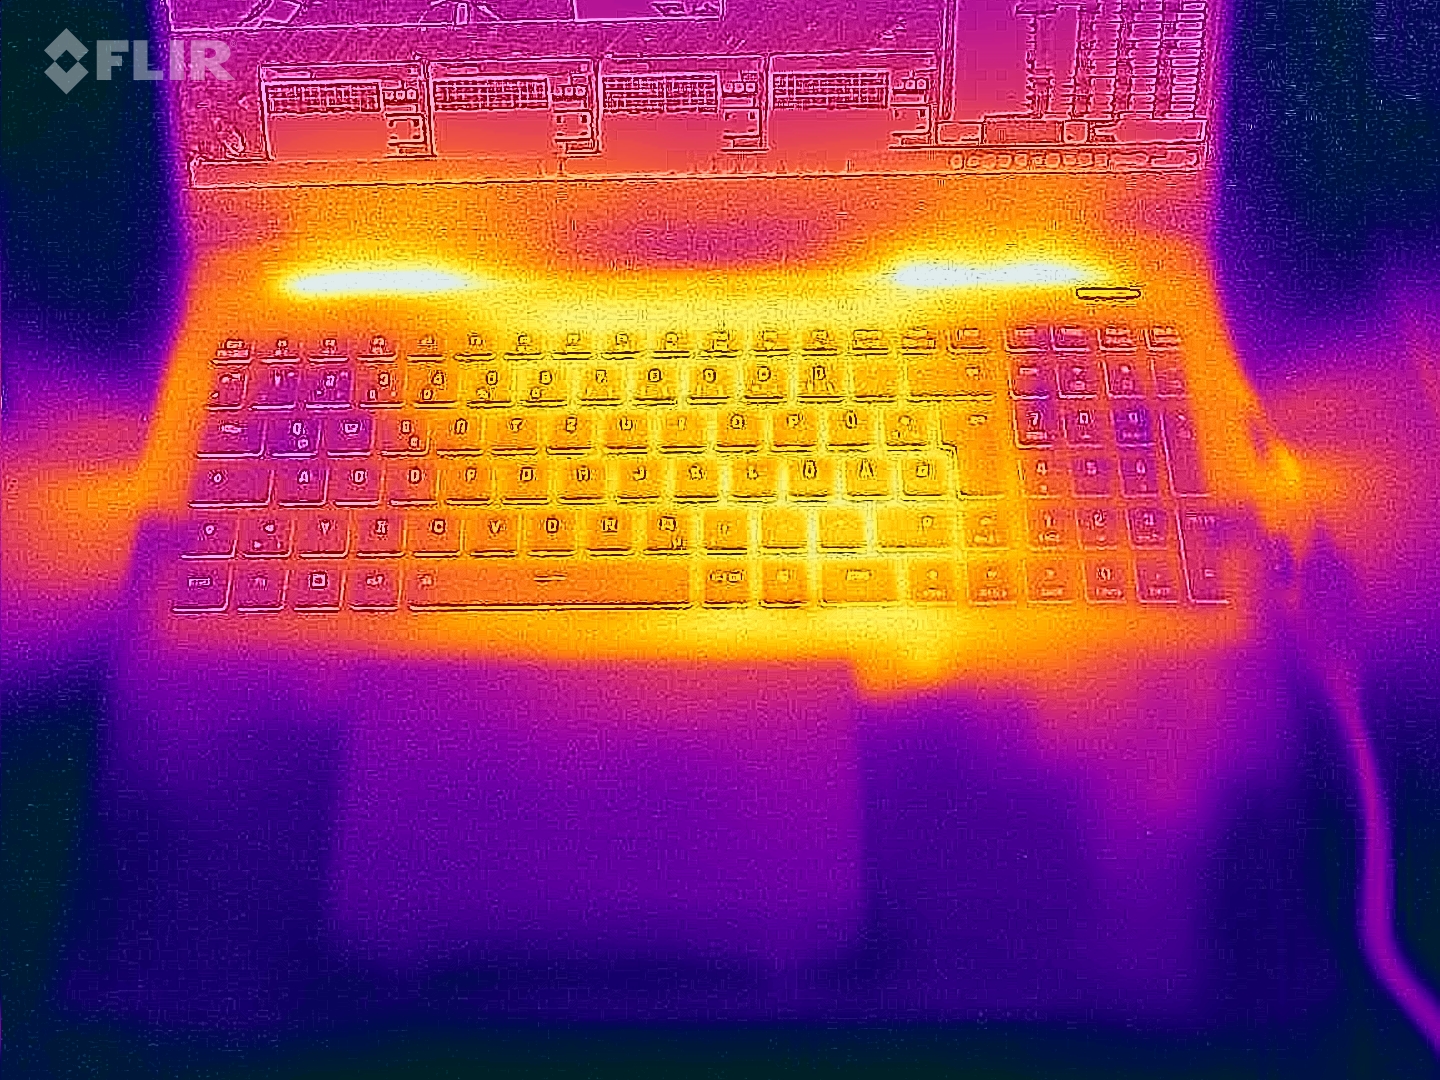
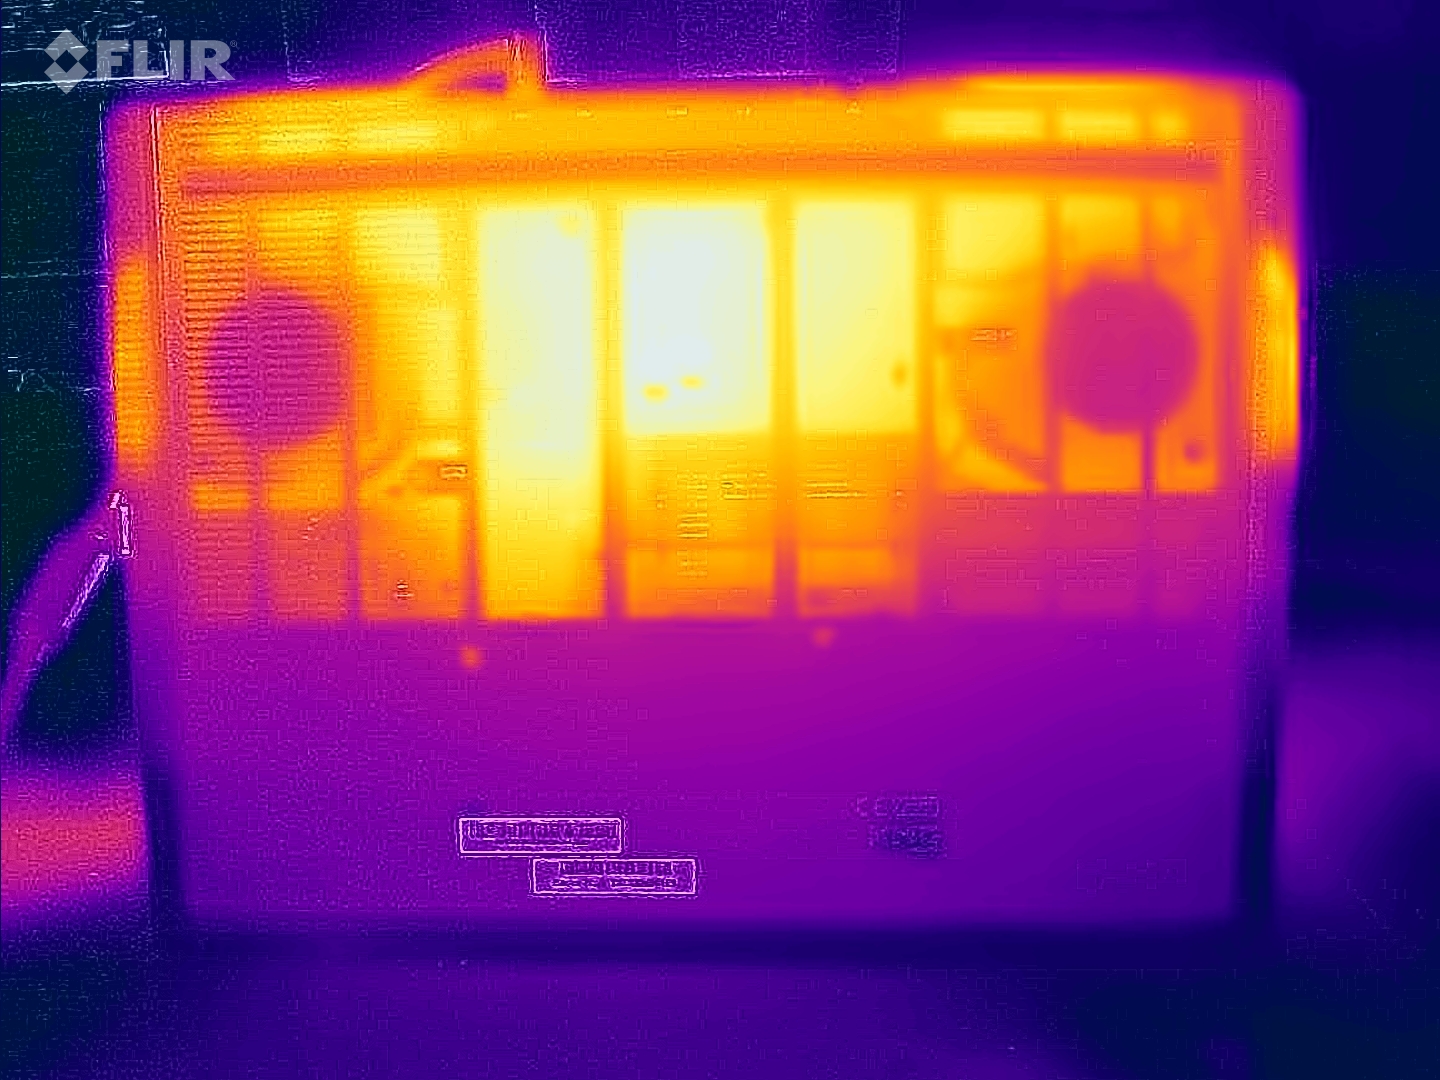
Temperatura
Il portatile si riscalda notevolmente: Cyberpunk e gli stress test hanno portato a temperature superiori a 60 gradi Celsius in alcuni punti. Valori superiori alla media possono essere raggiunti anche durante l'uso quotidiano (ufficio, internet). Le temperature del palm rest non sono così negative.
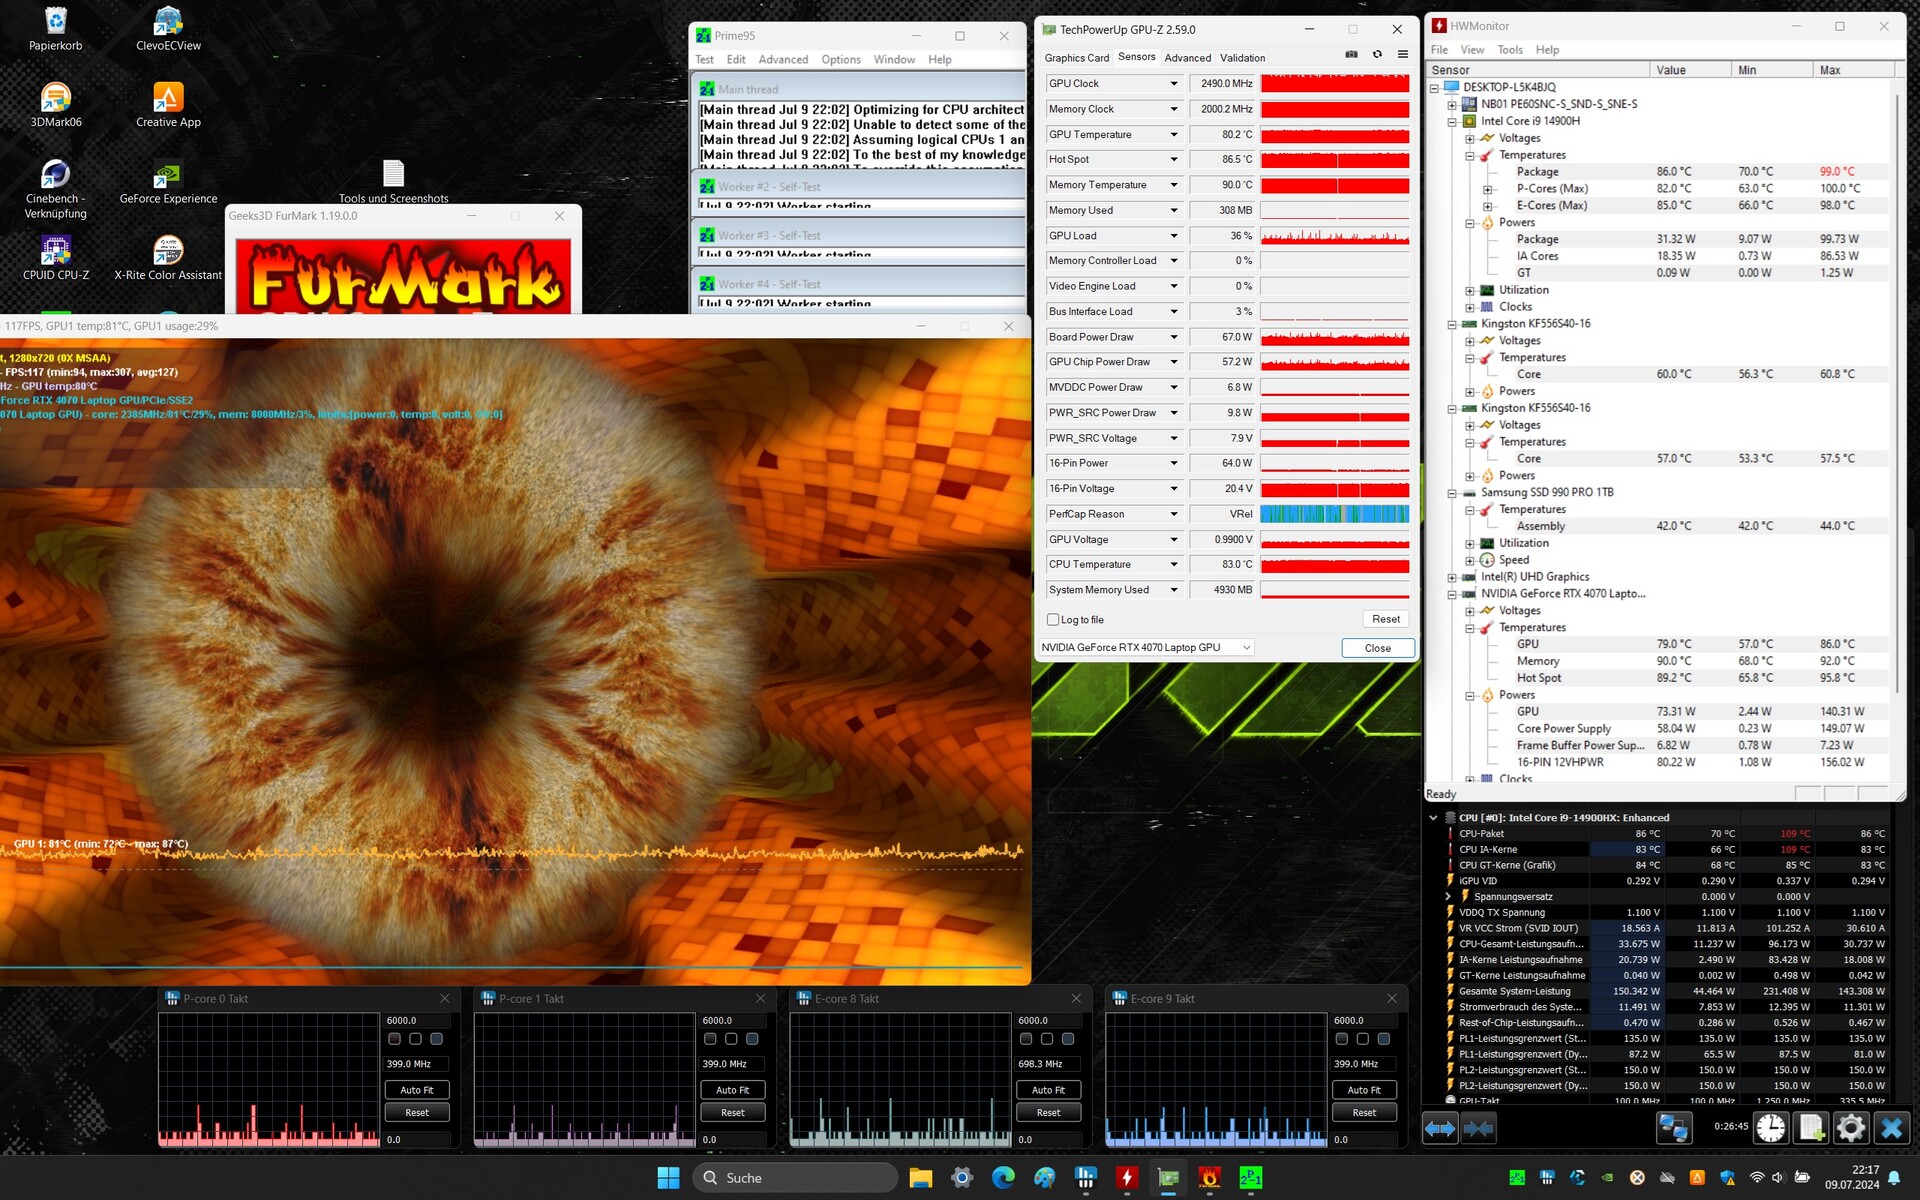
Lo scenario di stress test estremo (Prime95 e Furmark in funzionamento continuo) verifica la stabilità del sistema a pieno carico. Le priorità del dispositivo sono chiaramente distribuite: Mentre la GPU lavorava alla massima potenza, il clock della CPU (da 400 MHz a 2 GHz) era inferiore al clock di base.
(-) La temperatura massima sul lato superiore è di 51 °C / 124 F, rispetto alla media di 40.4 °C / 105 F, che varia da 21.2 a 68.8 °C per questa classe Gaming.
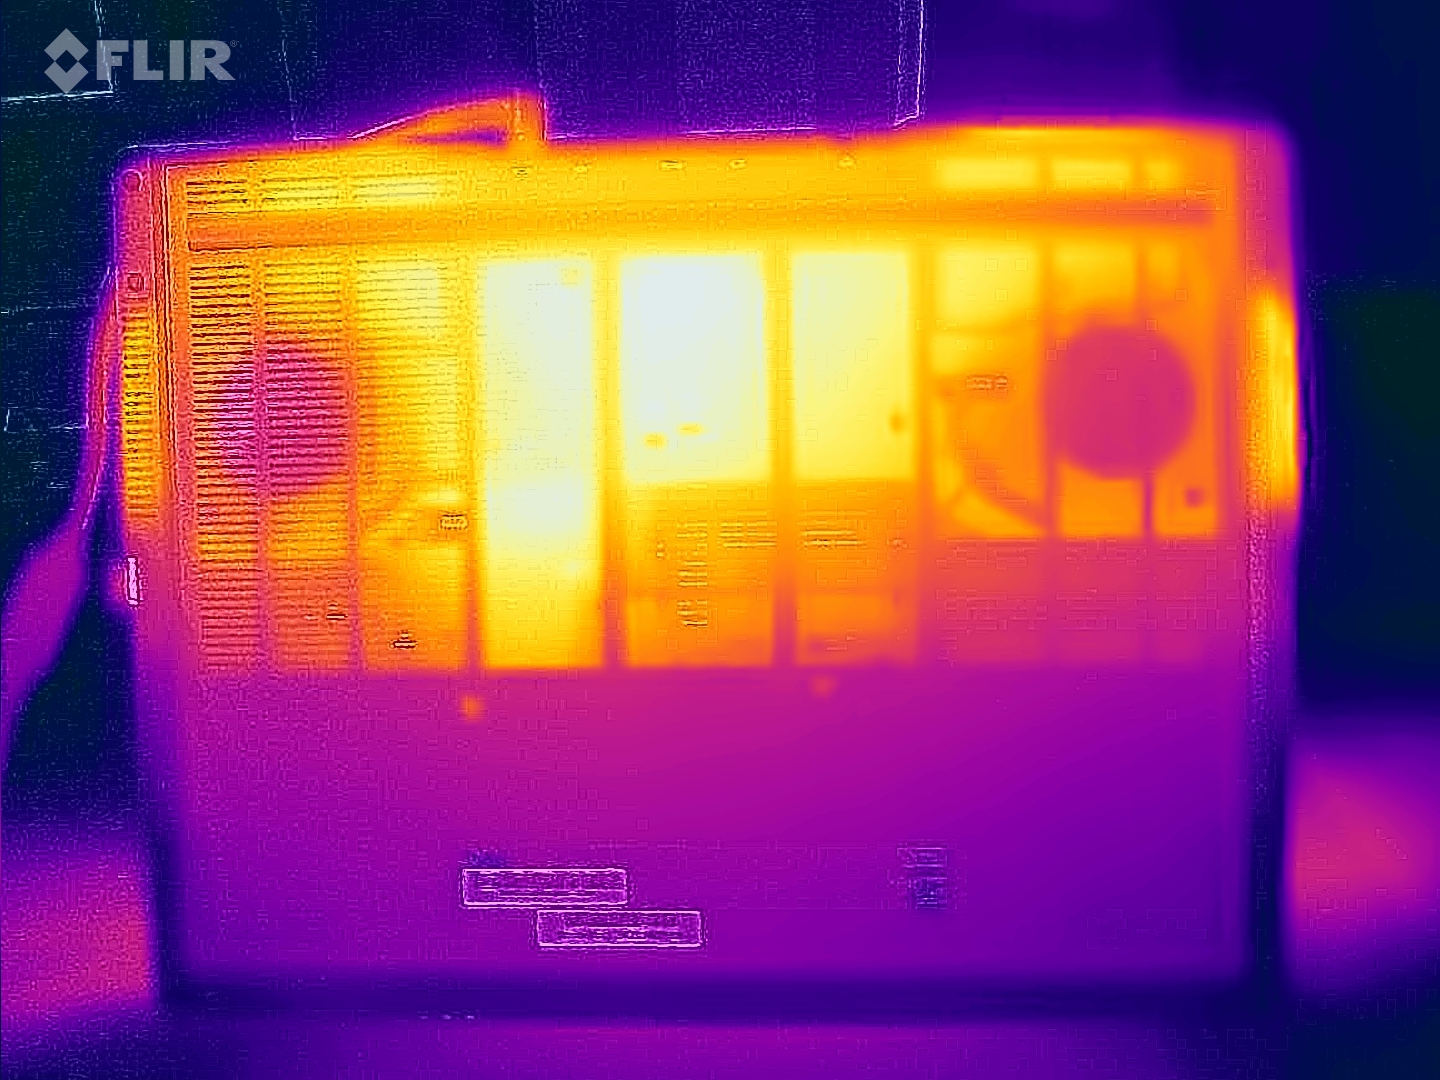
(-) Il lato inferiore si riscalda fino ad un massimo di 66 °C / 151 F, rispetto alla media di 43.2 °C / 110 F
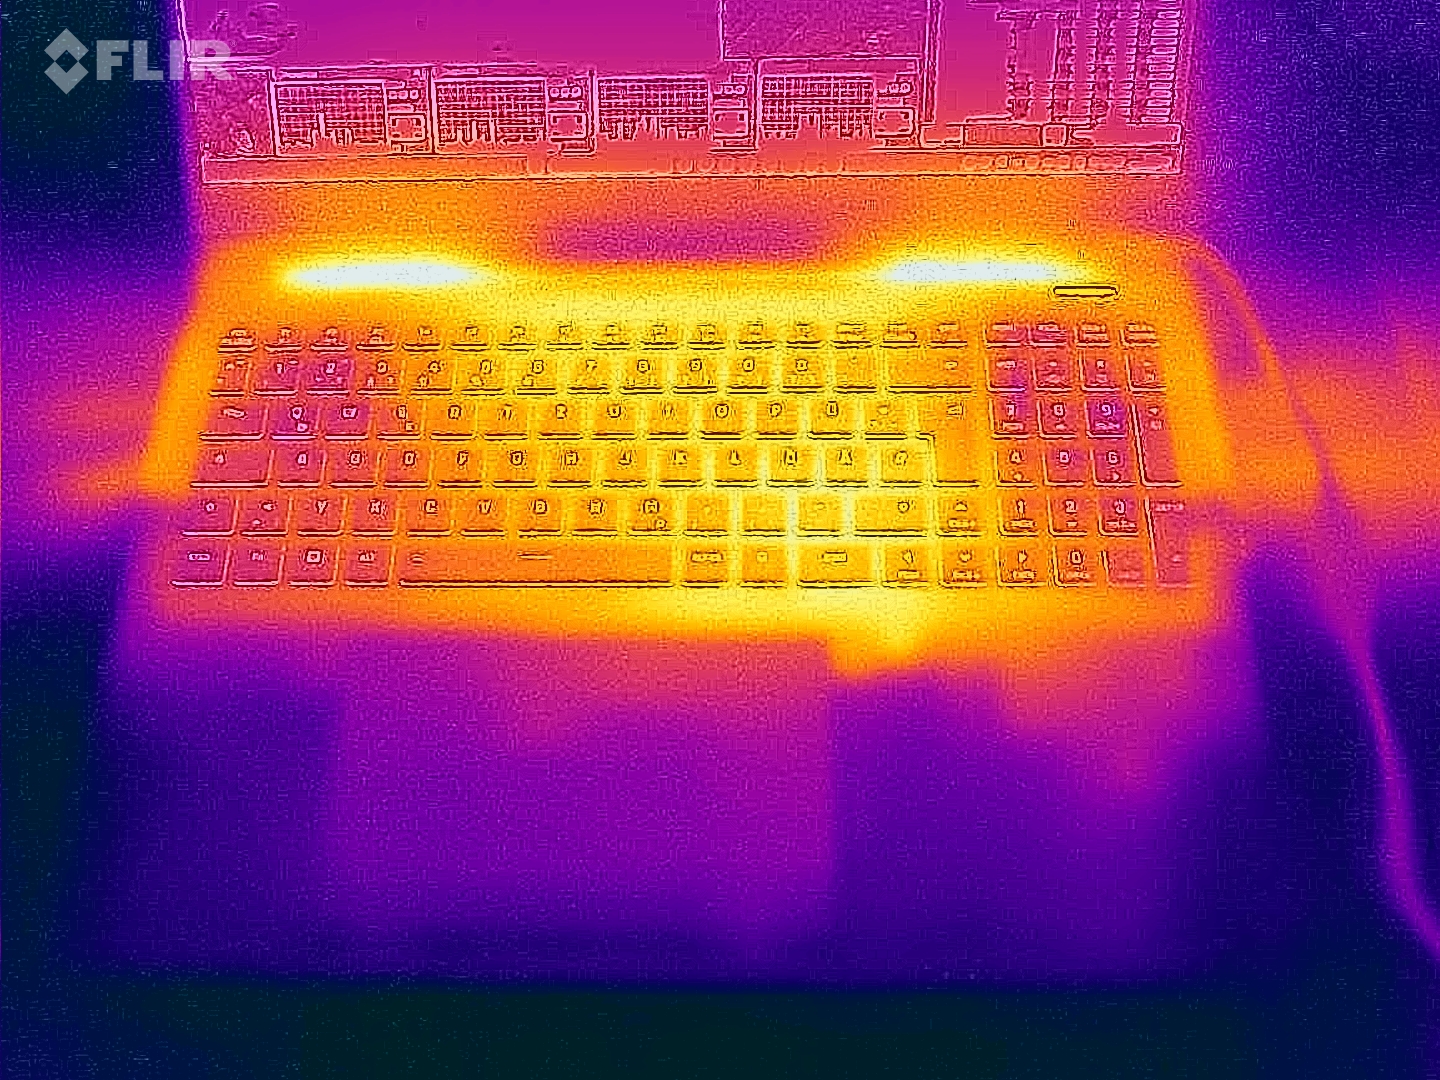
(±) In idle, la temperatura media del lato superiore è di 32.3 °C / 90 F, rispetto alla media deld ispositivo di 33.9 °C / 93 F.
(-) 3: The average temperature for the upper side is 42.2 °C / 108 F, compared to the average of 33.9 °C / 93 F for the class Gaming.
(+) I poggiapolsi e il touchpad sono piu' freddi della temperatura della pelle con un massimo di 31 °C / 87.8 F e sono quindi freddi al tatto.
(-) La temperatura media della zona del palmo della mano di dispositivi simili e'stata di 28.9 °C / 84 F (-2.1 °C / -3.8 F).
| SCHENKER XMG Pro 16 Studio (Mid 24) Intel Core i9-14900HX, NVIDIA GeForce RTX 4070 Laptop GPU | Acer Predator Helios Neo 16 (2024) Intel Core i7-14700HX, NVIDIA GeForce RTX 4070 Laptop GPU | Lenovo Legion Pro 5 16IRX9 Intel Core i9-14900HX, NVIDIA GeForce RTX 4070 Laptop GPU | Aorus 16X 2024 Intel Core i9-14900HX, NVIDIA GeForce RTX 4070 Laptop GPU | XMG Pro 16 Studio (Mid 23) Intel Core i9-13900H, NVIDIA GeForce RTX 4070 Laptop GPU | Lenovo Legion 7 16 IRX G9 Intel Core i9-14900HX, NVIDIA GeForce RTX 4070 Laptop GPU | |
|---|---|---|---|---|---|---|
| Heat | 9% | 11% | 14% | 2% | 22% | |
| Maximum Upper Side * | 51 | 58 -14% | 43.8 14% | 41 20% | 55 -8% | 43.7 14% |
| Maximum Bottom * | 66 | 45.2 32% | 55.4 16% | 41 38% | 66 -0% | 42.9 35% |
| Idle Upper Side * | 35 | 31.1 11% | 32.8 6% | 37 -6% | 33 6% | 29.1 17% |
| Idle Bottom * | 39 | 37.2 5% | 36 8% | 38 3% | 35 10% | 30.6 22% |
* ... Meglio usare valori piccoli
Altoparlanti
C'è una chiara mancanza di bassi. Per il resto, i diffusori stereo producono un suono accettabile. Il loro livello massimo potrebbe essere leggermente più alto.
SCHENKER XMG Pro 16 Studio (Mid 24) analisi audio
(±) | potenza degli altiparlanti media ma buona (79 dB)
Bassi 100 - 315 Hz
(-) | quasi nessun basso - in media 15.1% inferiori alla media
(±) | la linearità dei bassi è media (13.6% delta rispetto alla precedente frequenza)
Medi 400 - 2000 Hz
(±) | medi elevati - circa 5.3% superiore alla media
(+) | medi lineari (4.4% delta rispetto alla precedente frequenza)
Alti 2 - 16 kHz
(+) | Alti bilanciati - appena 4.4% dalla media
(+) | alti lineari (4.9% delta rispetto alla precedente frequenza)
Nel complesso 100 - 16.000 Hz
(±) | la linearità complessiva del suono è media (17.7% di differenza rispetto alla media
Rispetto alla stessa classe
» 50% di tutti i dispositivi testati in questa classe è stato migliore, 10% simile, 40% peggiore
» Il migliore ha avuto un delta di 6%, medio di 18%, peggiore di 132%
Rispetto a tutti i dispositivi testati
» 31% di tutti i dispositivi testati in questa classe è stato migliore, 8% similare, 61% peggiore
» Il migliore ha avuto un delta di 4%, medio di 25%, peggiore di 134%
Lenovo Legion Pro 5 16IRX9 analisi audio
(±) | potenza degli altiparlanti media ma buona (80.7 dB)
Bassi 100 - 315 Hz
(-) | quasi nessun basso - in media 19% inferiori alla media
(±) | la linearità dei bassi è media (10.1% delta rispetto alla precedente frequenza)
Medi 400 - 2000 Hz
(+) | medi bilanciati - solo only 4.7% rispetto alla media
(+) | medi lineari (5.7% delta rispetto alla precedente frequenza)
Alti 2 - 16 kHz
(+) | Alti bilanciati - appena 3.3% dalla media
(+) | alti lineari (5.6% delta rispetto alla precedente frequenza)
Nel complesso 100 - 16.000 Hz
(±) | la linearità complessiva del suono è media (17.2% di differenza rispetto alla media
Rispetto alla stessa classe
» 45% di tutti i dispositivi testati in questa classe è stato migliore, 11% simile, 44% peggiore
» Il migliore ha avuto un delta di 6%, medio di 18%, peggiore di 132%
Rispetto a tutti i dispositivi testati
» 28% di tutti i dispositivi testati in questa classe è stato migliore, 8% similare, 65% peggiore
» Il migliore ha avuto un delta di 4%, medio di 25%, peggiore di 134%
Consumo di energia
In modalità idle, il consumo di energia del portatile è decisamente troppo elevato, significativamente più alto rispetto al modello precedente con equipaggiamento simile. Cyberpunk e gli stress test sono stati eseguiti con un consumo energetico leggermente in calo e costantemente fluttuante. L'alimentatore da 230 watt è ancora sufficientemente dimensionato. I picchi di carico a breve termine, come all'inizio dello stress test, non rappresentano un problema.
| Off / Standby | |
| Idle | |
| Sotto carico |
|
Leggenda:
min: Attualmente utilizziamo il Metrahit Energy, un multimetro digitale professionale per la misurazione della qualità della potenza e dell'energia monofase, per le nostre misurazioni. | |
| SCHENKER XMG Pro 16 Studio (Mid 24) NVIDIA GeForce RTX 4070 Laptop GPU, i9-14900HX, Samsung 990 Pro 1 TB | Acer Predator Helios Neo 16 (2024) NVIDIA GeForce RTX 4070 Laptop GPU, i7-14700HX, Samsung PM9A1a MZVL21T0HDLU | Lenovo Legion Pro 5 16IRX9 NVIDIA GeForce RTX 4070 Laptop GPU, i9-14900HX, Samsung PM9A1 MZVL21T0HCLR | Aorus 16X 2024 NVIDIA GeForce RTX 4070 Laptop GPU, i9-14900HX, Gigabyte AG450E1024-SI | XMG Pro 16 Studio (Mid 23) NVIDIA GeForce RTX 4070 Laptop GPU, i9-13900H, Samsung 990 Pro 1 TB | |
|---|---|---|---|---|---|
| Power Consumption | 11% | 23% | 22% | 43% | |
| Idle Minimum * | 31 | 26.7 14% | 12.5 60% | 13 58% | 8 74% |
| Idle Average * | 33 | 24.4 26% | 24.6 25% | 18 45% | 12 64% |
| Idle Maximum * | 41 | 32.7 20% | 24.8 40% | 35 15% | 23 44% |
| Load Average * | 114 | 122.1 -7% | 109.6 4% | 138 -21% | 94 18% |
| Cyberpunk 2077 ultra * | 218 | ||||
| Cyberpunk 2077 ultra external monitor * | 196.8 | ||||
| Load Maximum * | 250 | 241 4% | 284.9 -14% | 222 11% | 215 14% |
| Witcher 3 ultra * | 190.6 | 218 | 172.6 | 181.5 |
* ... Meglio usare valori piccoli
Power consumption Cyberpunk / stress test
Power consumption with external monitor
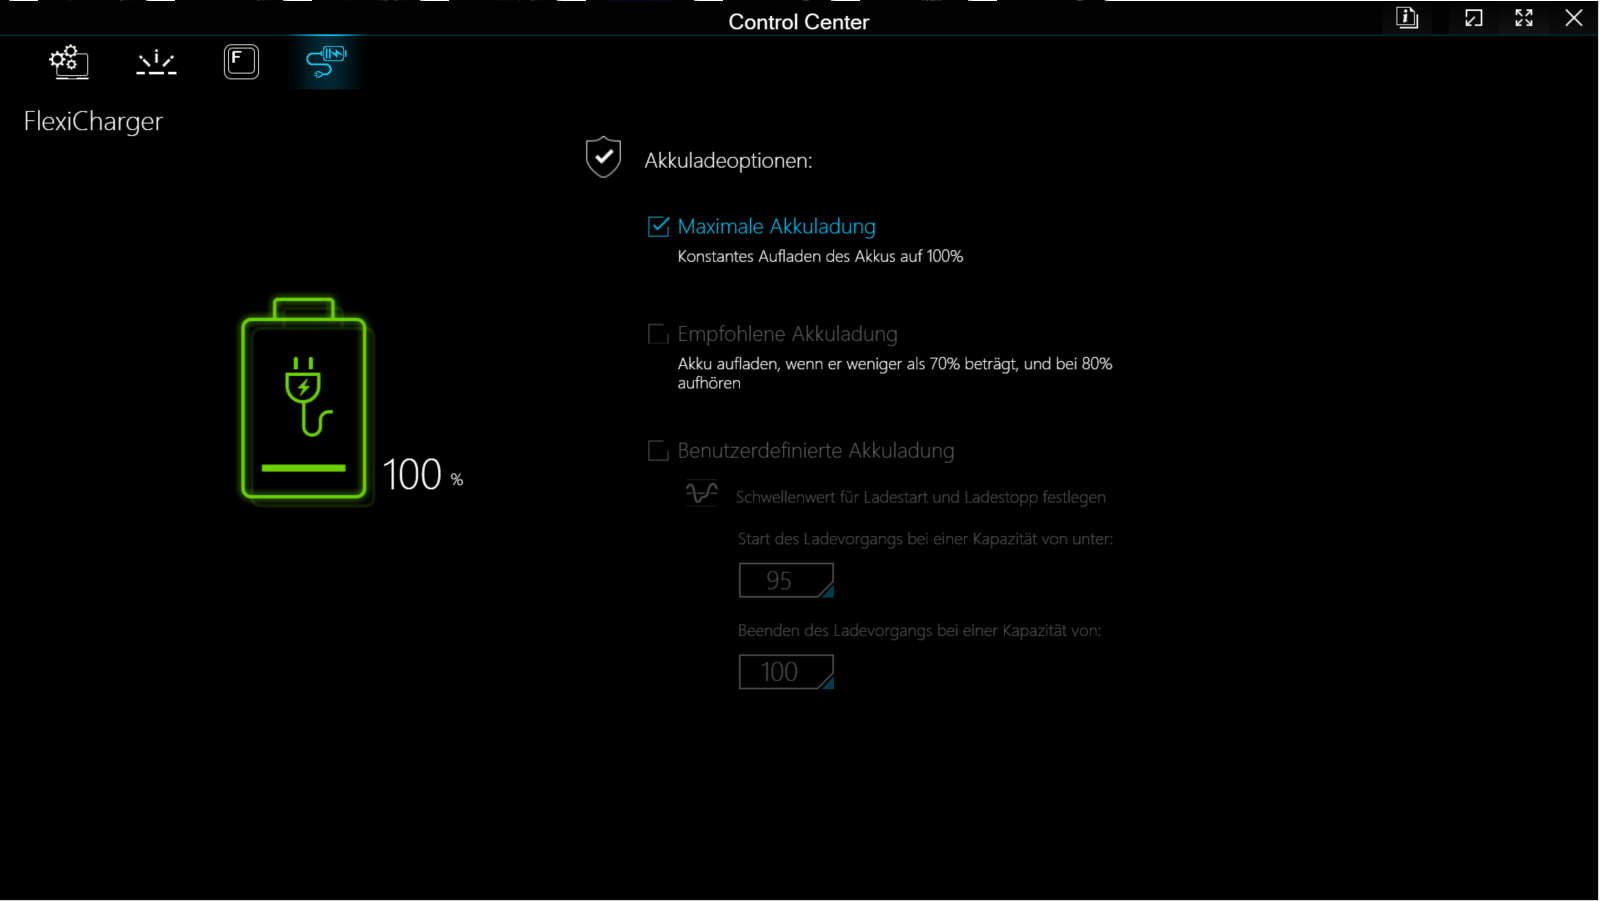
Tempi di esecuzione
Il Pro 16 richiede anche più energia rispetto al suo predecessore in condizioni di basso carico in modalità batteria. Di conseguenza, ha raggiunto un'autonomia di 5:37 ore durante il test WiFi (mappando il carico quando si accede ai siti web utilizzando uno script). Questo lo lascia indietro di un'ora rispetto al suo predecessore-che aveva la stessa capacità della batteria di 73 Wh.
Pro
Contro
Verdetto - Una centrale elettrica con problemi
Il Pro 16 si concentra su una potenza della GPU permanentemente elevata, con valori di prestazioni leggermente superiori alla media della GPU. La CPU deve già prendersela comoda dopo poco tempo - il Loop CB15 lo ha rivelato.
XMG Pro 16 Studio (Mid 24) può essere assegnato al reparto di manutenzione dei modelli. A parte il passaggio da Raptor Lake a Raptor Lake Refresh, il laptop non vanta nuove caratteristiche significative.
La rumorosità e lo sviluppo di calore del dispositivo, nonché il consumo energetico in modalità idle, sono tutti (troppo) elevati. Per quanto riguarda il consumo energetico del laptop, non possiamo escludere che il nostro campione di prova abbia un difetto. I tempi di esecuzione sono discreti.
Il pannello 16:10 installato (16 pollici, 2.560 x 1.600 pixel, sRGB, IPS, 240 Hz) va bene, ma manca lo spazio colore DCI-P3, che è un requisito fondamentale per un laptop creatore. Il dispositivo può comunque ospitare due SSD PCIe 4 e il RAID 0/1 è supportato. Una porta TB-4 offre opzioni di espansione (GPU esterna, docking) e supporta Power Delivery.
Un'alternativa potrebbe essere il dispositivo Aorus 16X (2024). Può ottenere un po' più di potenza di calcolo dalla stessa CPU, dispone di uno schermo molto più luminoso (incluso Dolby Vision) - inoltre, vanta tempi di esecuzione migliori.
Prezzo e disponibilità
Il nuovo XMG Pro 16 Studio (Mid 24) può essere configurato e ordinato tramite il sito bestware.comil dispositivo di prova attuale costa circa 2.500 dollari.
Nota bene: abbiamo recentemente aggiornato il nostro sistema di valutazione e i risultati della versione 8 non sono confrontabili con quelli della versione 7. Ulteriori informazioni sono disponibili qui.
SCHENKER XMG Pro 16 Studio (Mid 24)
-
07/23/2024 v8
Sascha Mölck
 Total Sustainability Score:
 Transparency
The present review sample was made available to the author as a loan by the manufacturer or a shop for the purposes of review. The lender had no influence on this review, nor did the manufacturer receive a copy of this review before publication. There was no obligation to publish this review.
Price comparison

