Notebookcheck Logo
Intel Core Ultra 9 285K Arrow Lake-S review

Recensione di Intel Core Ultra 9 285K Arrow Lake-S: la CPU da 589 dollari sacrifica la corona di gioco per eguagliare AMD Zen 5 Ryzen 9000 nell'efficienza energetica

Efficiente dal punto di vista energetico, ma carente dal punto di vista dei giochi. Il nuovo Arrow Lake-S Core Ultra 9 285 di Intel introduce un nuovo layout di tile di calcolo che sacrifica l'hyperthreading e mira a conquistare gli appassionati con miglioramenti significativi dell'efficienza. Sebbene il Core Ultra 9 285K sia effettivamente all'altezza delle prestazioni e dell'efficienza della CPU grezza, perde nettamente rispetto alle offerte di Intel Raptor Lake-S Refresh e AMD Zen 5 Ryzen 9000 nei giochi.
Vaidyanathan Subramaniam (traduzione a cura di DeepL / Ninh Duy) Published 🇺🇸 🇩🇪 ...
Intel Arrow Lake Desktop Gaming

Verdetto: il gioco di efficienza di Intel si scontra con un problema di gioco

I chip desktop di Intel non sono esattamente noti per la loro efficienza, ma l'azienda spera di riscrivere la narrativa con il lancio di Arrow Lake-S di oggi.

La nuova linea Arrow Lake-S di Intel, guidata dal Core Ultra 9 285K, segna un cambiamento significativo con l'eliminazione dell'hyperthreading in tutti i modelli - una prima volta dall'era del Pentium 4. Nei benchmark cumulativi delle CPU, il Core Ultra 9 285K eguaglia il Core i9-14900K e raggiunge quasi i livelli di prestazioni di Ryzen 9 9950X.

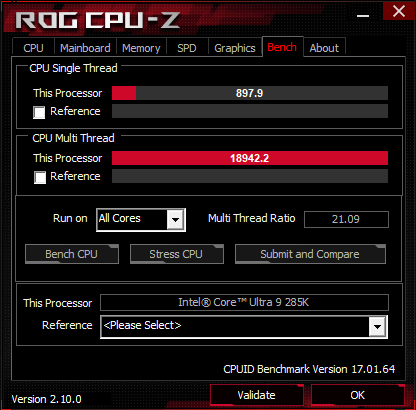
Detto questo, vediamo che il Core Ultra 9 285K supera entrambe queste CPU nei singoli benchmark single e multi-core.

Ciò che ci è piaciuto in particolare è la capacità di Arrow Lake-S di ottenere prestazioni pari o addirittura leggermente superiori a Raptor Lake-S Refresh, raggiungendo al contempo un'efficienza energetica paragonabile ai processori Zen 5 di AMD.

Tuttavia, nonostante questi progressi, il Core Ultra 9 285K fatica nelle prestazioni di gioco, rimanendo indietro rispetto al Core i9-14900K e alle CPU Zen 5 in tutte le risoluzioni testate.

Il Core Ultra 9 285K si limita a competere solo con il Core i7-14700K nei giochi. Questo è sorprendente, viste le ottimizzazioni APO integrate di Arrow Lake-S e la mancanza dell'hyperthreading, che in teoria avrebbe dovuto aiutare la CPU a ottenere punteggi di gioco migliori.

La nuova piattaforma richiede anche investimenti aggiuntivi in nuove schede madri della Serie 800 e nella memoria DDR5, e questo è un aspetto da tenere in considerazione prima dell'aggiornamento.

Pro

+ Imballaggio 3D Foveros e processo efficiente TSMC N3B
+ Guadagni in single e multi-core rispetto a Core i9-14900K e Ryzen 9 9950X
+ Consumo energetico significativamente ridotto
+ Efficienza energetica alla pari con le CPU AMD Ryzen 9000 Zen 5

Contro

- Stesso MSRP del Core i9-14900K
- Richiede investimenti aggiuntivi per le schede della Serie 800 e la RAM DDR5
- La longevità del socket LGA 1851 non è garantita
- Prestazioni 3D e di gioco deludenti

Prezzo e disponibilità

L'Intel Core Ultra 9 285K sarà disponibile da oggi presso i rivenditori di tutto il mondo al prezzo di 589 dollari. Il Core i9-14900K, ora scontato Core i9-14900K rimane ancora valido se si privilegia l'elaborazione e il gioco, nonostante le lievi penalizzazioni delle prestazioni dovute ai BIOS più recenti.

Il AMD Ryzen 9 9950X(attualmente 709 dollari su Amazon) e Ryzen 9 9900X(429 dollari su Amazon) continuano ad essere alternative eccellenti, senza gli intoppi di gioco del Core Ultra 9 285K.

$442.60
Intel® CoreTM i9-14900K New Gaming Desktop Processor 24 (8 P-cores + 16 E-cores) with Integrated Graphics - Unlocked

Price comparison

I processori desktop di punta di Intel di 13a e 14a generazione hanno fatto notizia per tutti i motivi sbagliati ragioni sbagliate non molto tempo fa, ma oggi si spera che tutto questo cambi in meglio. Dopo aver iniziato bene con Lunar Lake per i computer portatili, Intel si sta ora concentrando su Arrow Lake-S per i desktop.

Arrow Lake-S, o la serie Core Ultra 200S come vuole il marketing per qualche motivo, segna un cambiamento paradigmatico nella strategia delle CPU desktop di Intel.

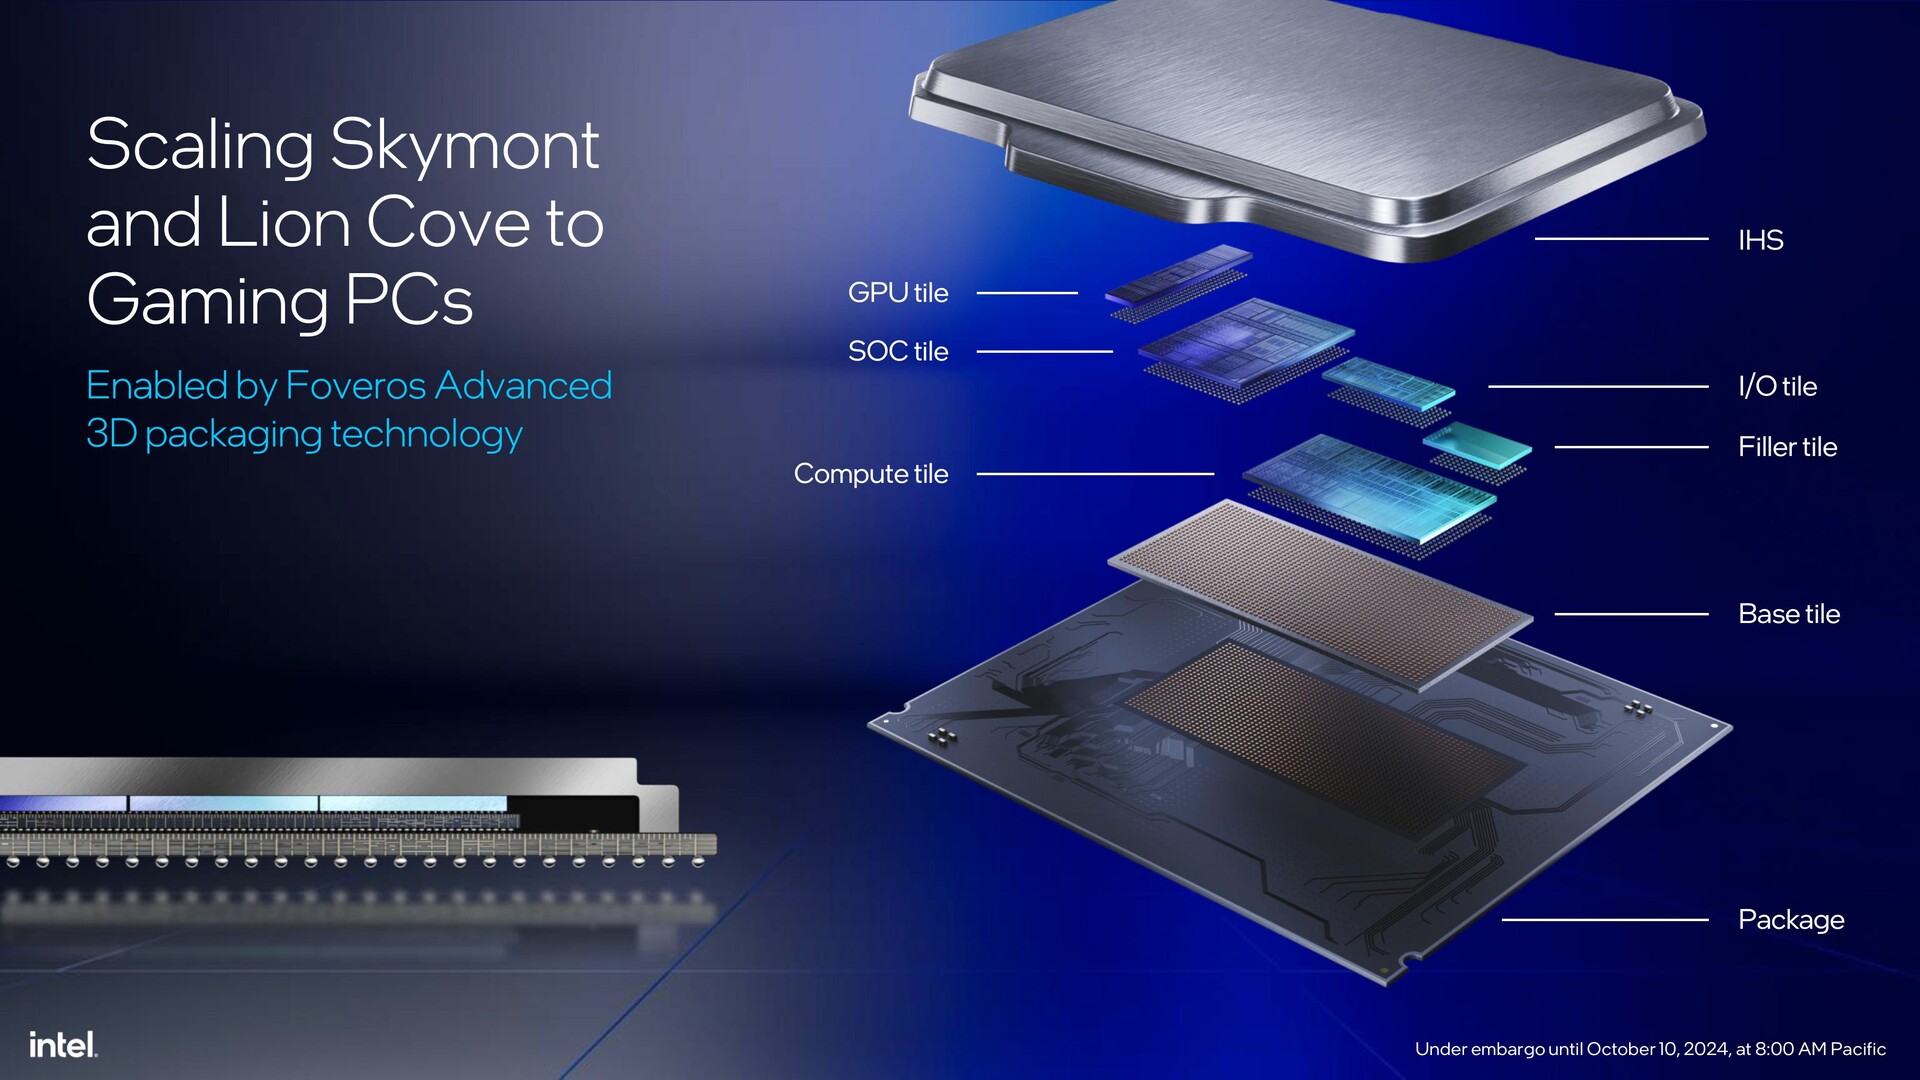
Questa generazione vede l'arrivo del packaging 3D

Foveros di Intel per la prima volta sui desktop, l'utilizzo delle linee di produzione a 3 nm di TSMC invece di quelle di Intel, un nuovo Compute tile con core P Lion Cove riorganizzati e core E Skymont senza hyperthreading, una cache L2 più grande sui core P e l'arrivo dell'iGPU e della NPU Alchemist Xe, entrambi riutilizzati da Meteor Lake. <br />

La confezione Foveros di Arrow Lake-S comprende un totale di sei piastrelle, quattro delle quali sono basate sui nodi TSMC. Questi includono Compute (N3B), Xe-LPG Alchemist iGPU (N5P), SoC (N6), I/O (N6), un tile di riempimento per la stabilità e il tile Base (Intel 1227.1 22 nm FinFET).

La presenza di tutti questi componenti nella confezione richiede inevitabilmente nuovi requisiti di alimentazione e quindi un nuovo socket. I processori Arrow Lake-S richiedono nuove schede madri della Serie 800 con il nuovo socket LGA 1851. Purtroppo, Intel non ha ancora deciso se le prossime generazioni di CPU utilizzeranno questo nuovo layout dei pin.

A questo si aggiunge anche la necessità di passare completamente alla memoria DDR5, in quanto queste CPU non dispongono del controller di memoria ibrido presente in Raptor Lake-S e Alder Lake-S.

In questa recensione, diamo un'occhiata al nuovo Intel Core Ultra 9 285K e vediamo se le decisioni di Intel in ambito desktop possono rappresentare una sfida sufficiente per le ultime offerte Ryzen 9000 di AMD e i chip di 14esima generazione di Intel.

Una panoramica sui processori desktop Intel Core Ultra 200S Serie Arrow Lake-S

SKU Core / Threads P-Core Clock / Turbo E-Core Clock / Turbo Turbo Boost Max 3.0 Cache L2 totale Cache L3 Grafica integrata NPU Peak TOPS PBP (PL1) MTP (PL2) MSRP
Intel Core Ultra 9 285K 24 (8P + 16E) /24 3,7 GHz / 5,5 GHz 3,2 GHz / 4,6 GHz 5,6 GHz 40 MB 36 MB 4Core Xe, 2,0 GHz 13 TOPS 125 W 250 W $589
Intel Core Ultra 7 265K 20 (8P + 12E) /20 3,9 GHz / 5,4 GHz 3,3 GHz / 4,6 GHz 5,6 GHz 36 MB 30 MB 4 Core Xe, 2,0 GHz 13 TOPS 125 W 250 W $394
Intel Core Ultra 7 265KF 20 (8P + 12E) /20 3,9 GHz / 5,4 GHz 3,3 GHz / 4,6 GHz 5,6 GHz 36 MB 30 MB - 13 TOPS 125 W 250 W $379
Intel Core Ultra 5 245K 14 (6P + 8E) /14 3,9 GHz / 5,4 GHz 4,2 GHz / 5,2 GHz 5,2 GHz 26 MB 24 MB 4 Core Xe, 1,9 GHz 13 TOPS 125 W 159 W $309
Intel Core Ultra 5 245KF 14 (6P + 8E) /14 3,9 GHz / 5,4 GHz 4,2 GHz / 5,2 GHz 5,2 GHz 26 MB 24 MB - 13 TOPS 125 W 159 W $294

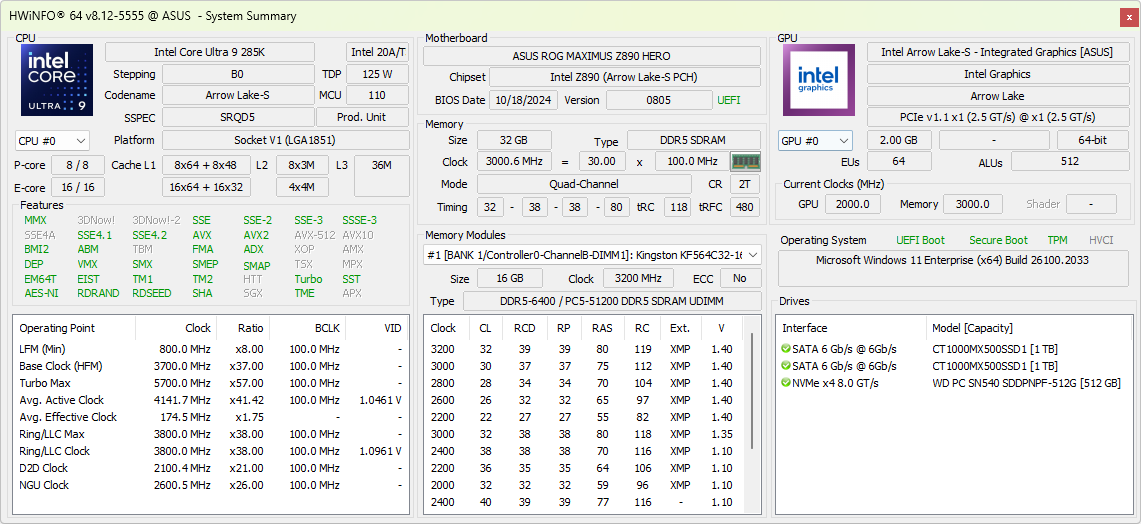
Il banco di prova: GeForce RTX 4090 è un ottimo abbinamento con il Core Ultra 9 285K

Abbiamo utilizzato i seguenti componenti per testare il Core Ultra 9 285K:

  • Banco di prova aperto Cooler Master MasterFrame 700
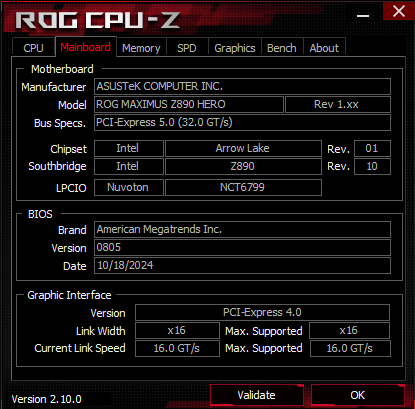
  • Scheda madre Asus ROG Maximus Z890 Hero con versione BIOS 0805
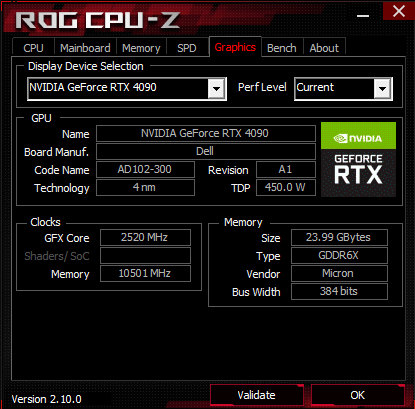
  • Nvidia GeForce RTX 4090 Founders Edition GPU
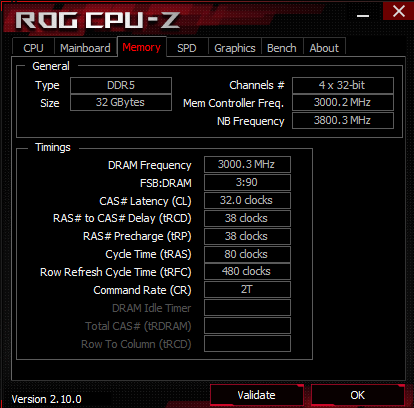
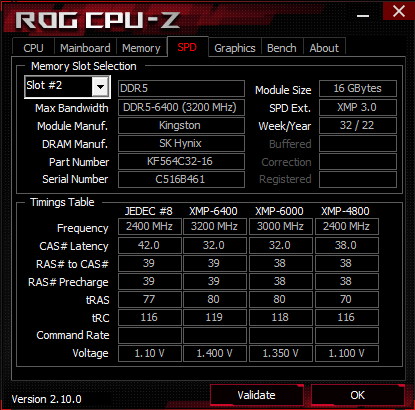
  • 2x 16 GB di RAM Kingston Fury Beast DDR5-6400 in esecuzione a DDR5-6000 con temporizzazioni 32-38-38-80 a 1,35 V
  • Western Digital PC SN540 512 GB NVMe SSD e 2x Crucial MX500 1 TB SATA SSD per OS, benchmark e giochi
  • Monitor Alienware AW3225QF 4K 240 Hz QD-OLED
  • Thermaltake TH420 V2 Ultra EX ARGB Raffreddatore AiO
  • Alimentatore Cooler Master MVE Gold V2 1250 ATX 3.0 completamente modulare

Desideriamo ringraziare Intel per aver fornito il campione di prova Core Ultra 9 285K, Nvidia per la GPU RTX 4090 Founders Edition, Asus per la scheda madre ROG Maximus Z890 Hero, Dell per il monitor AW3225QF, Kingston per il kit di memoria DDR5, Thermaltake per il TH420 V2 Ultra EX AIO e infine Cooler Master per il banco di prova e l'alimentatore.

Tutti i test sono stati eseguiti su un'installazione fresca di Windows 11 24H2 (Build 26100.2033) insieme agli ultimi driver della piattaforma e al driver Nvidia Game Ready Driver 566.03.

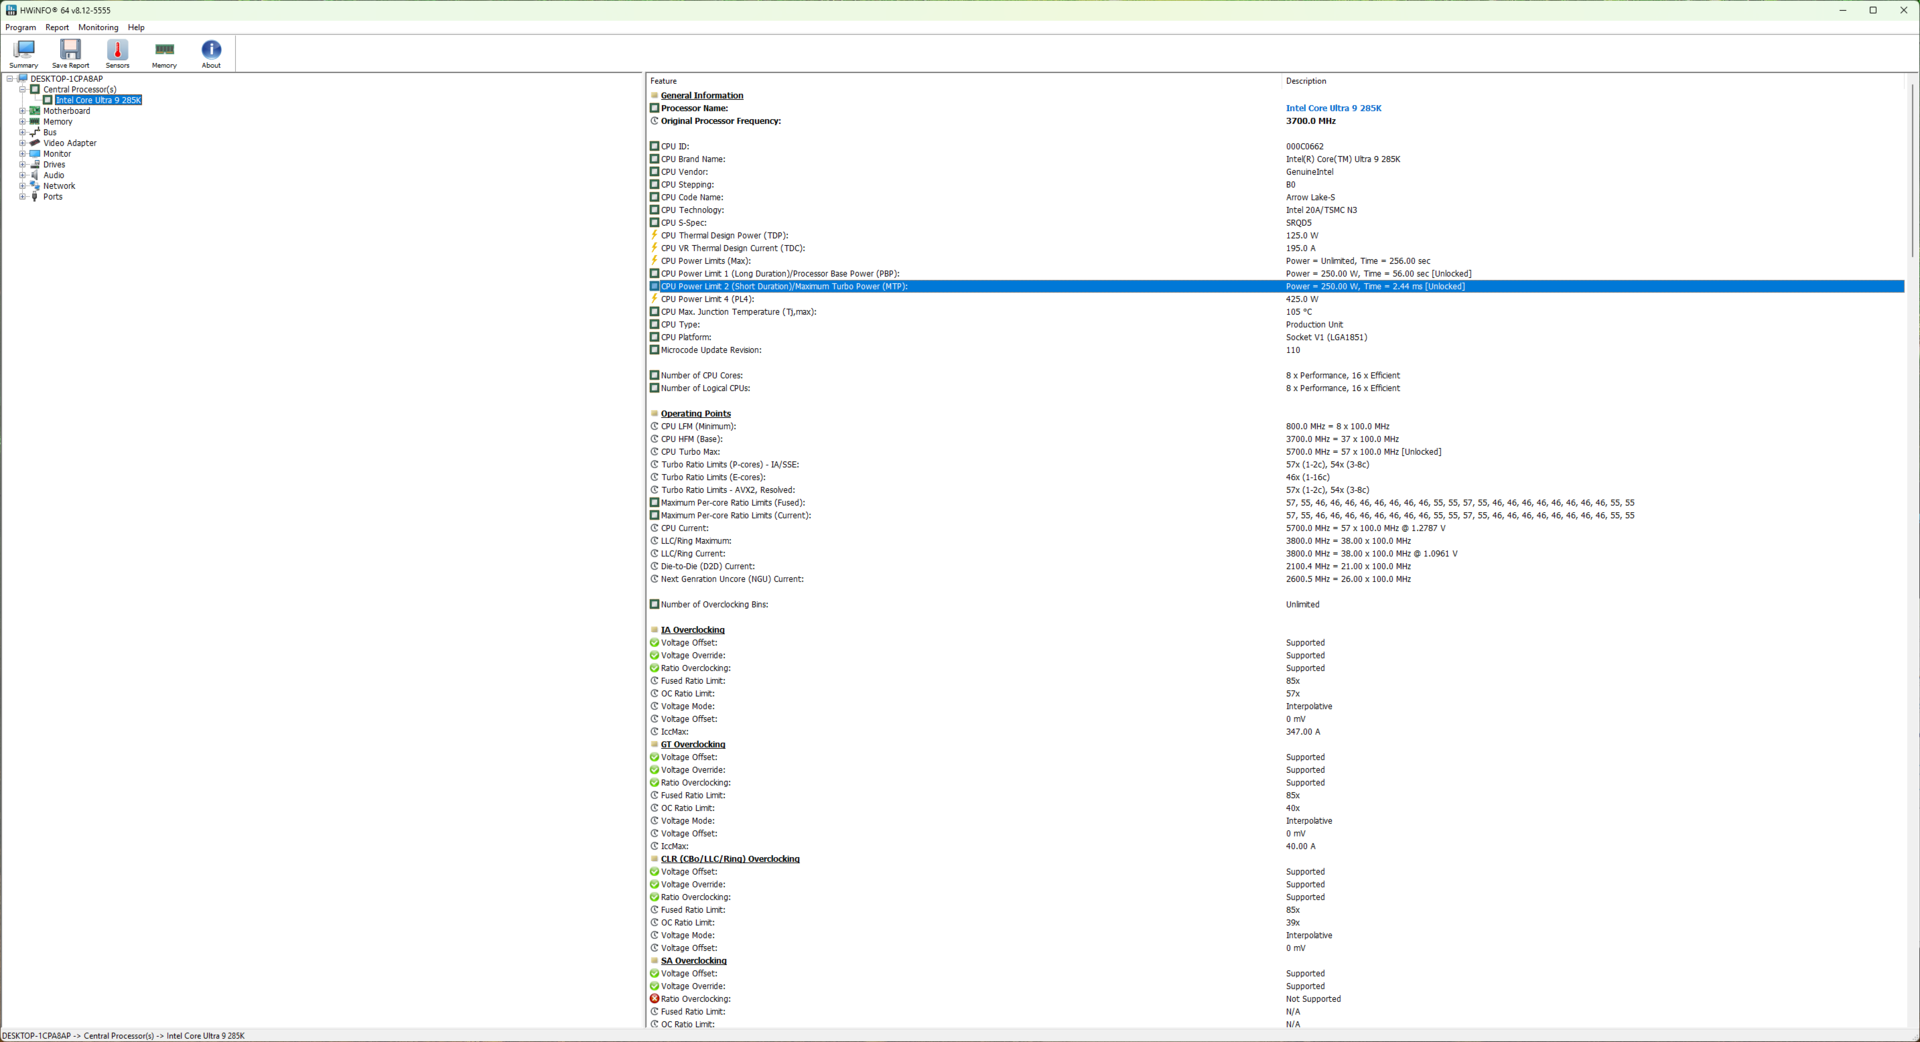
Abbiamo utilizzato le impostazioni predefinite di Intel per le prestazioni nel BIOS e abbiamo impostato il piano di alimentazione di Windows su Prestazioni Ultimate, che imposta PL1=PL2=250 W.

Prestazioni della CPU: In linea con il Core i9-14900K, con piccoli guadagni rispetto a Ryzen 9 9950X

I test cumulativi della CPU vedono il Core Ultra 9 285K alla pari con il Core i9-14900K e solo leggermente in ritardo rispetto al AMD Ryzen 9 9950X. Ciò è dovuto in gran parte al fatto che il Core Ultra 9 285K è rimasto indietro rispetto al Ryzen 9 9950X in test specifici come Blender 2.79 BMW27 CPU, i test V-Ray, wPrime 2.1 e il benchmark R, anche se le differenze non sono così significative.

Nei test Cinebench single-core, l'Ultra 9 285K riesce a superare leggermente il Core i9-14900K, mentre il

Ryzen 9 9900X e il Ryzen 9 9950X gli rosicchiano i talloni. La situazione è diversa in Geekbench, tuttavia, con i chip Zen 5 che riescono a ottenere guadagni minuscoli rispetto ad Arrow Lake-S.

I guadagni multi-core sono più evidenti, con il Core Ultra 9 285K da 24C/24T che mostra guadagni del 4-6% rispetto al Ryzen 9 9950X da 16C/32T nei test multi-core di Cinebench, nonostante la mancanza di hyperthreading. Il Core Ultra 9 285K, il Core i9-14900K e il Ryzen 9 9950X hanno tutti prestazioni comparabili in Geekbench 6.3 multi-core.

CPU Performance Rating - Percent
AMD Ryzen 9 9950X
Ryzen 9 9950X, 4300 MHz
82 pt
Intel Core i9-14900K -1!
i9-14900K, 3200 MHz
79.2 pt
Intel Core Ultra 9 285K
Core Ultra 9 285K, 3200 MHz
79 pt
AMD Ryzen 9 7950X -2!
R9 7950X, 4500 MHz
78.2 pt
Intel Core i9-13900K -2!
i9-13900K, 3000 MHz
77.9 pt
AMD Ryzen 9 7950X3D -2!
R9 7950X3D, 4200 MHz
77.2 pt
AMD Ryzen 9 9900X -9!
Ryzen 9 9900X, 4400 MHz
77.1 pt
Intel Core i7-14700K
i7-14700K, 2500 MHz
74.4 pt
AMD Ryzen 9 7900X -2!
R9 7900X, 4700 MHz
70.5 pt
AMD Ryzen 7 9700X
Ryzen 7 9700X, 3800 MHz
68.9 pt
Intel Core i5-14600K
i5-14600K, 3500 MHz
67.4 pt
Intel Core Ultra 5 245K
Core Ultra 5 245K, 3600 MHz
67.2 pt
Intel Core i9-12900K -3!
i9-12900K, 3200 MHz
66.4 pt
Intel Core i5-13600K -2!
i5-13600K, 3500 MHz
65.5 pt
AMD Ryzen 5 9600X -2!
Ryzen 5 9600X, 3900 MHz
65.4 pt
AMD Ryzen 7 7800X3D -3!
R7 7800X3D, 4200 MHz
64.7 pt
Intel Core i5-12600K -3!
i5-12600K, 2800 MHz
59.2 pt
Cinebench R15
CPU Single 64Bit
Intel Core Ultra 9 285K
Core Ultra 9 285K, 3200 MHz
356 Points
AMD Ryzen 9 9900X
Ryzen 9 9900X, 4400 MHz
353 Points -1%
AMD Ryzen 7 9700X
Ryzen 7 9700X, 3800 MHz
346 Points -3%
AMD Ryzen 9 9950X
Ryzen 9 9950X, 4300 MHz
344 Points -3%
AMD Ryzen 5 9600X
Ryzen 5 9600X, 3900 MHz
341 Points -4%
Intel Core i9-14900K
i9-14900K, 3200 MHz
332 Points -7%
AMD Ryzen 9 7950X
R9 7950X, 4500 MHz
328 Points -8%
Intel Core i9-13900K
i9-13900K, 3000 MHz
327 Points -8%
AMD Ryzen 9 7950X3D
R9 7950X3D, 4200 MHz
326 Points -8%
AMD Ryzen 9 7900X
R9 7900X, 4700 MHz
324 Points -9%
Intel Core Ultra 5 245K
Core Ultra 5 245K, 3600 MHz
322 Points -10%
Intel Core i7-14700K
i7-14700K, 2500 MHz
314 Points -12%
Intel Core i5-14600K
i5-14600K, 3500 MHz
297 Points -17%
AMD Ryzen 7 7800X3D
R7 7800X3D, 4200 MHz
291 Points -18%
Intel Core i5-13600K
i5-13600K, 3500 MHz
289 Points -19%
Intel Core i9-12900K
i9-12900K, 3200 MHz
286 Points -20%
Intel Core i5-12600K
i5-12600K, 2800 MHz
275 Points -23%
CPU Multi 64Bit
Intel Core Ultra 9 285K
Core Ultra 9 285K, 3200 MHz
6588 (6491.4min - 6587.62max) Points
AMD Ryzen 9 9950X
Ryzen 9 9950X, 4300 MHz
6335 (6262.72min - 6335.13max) Points -4%
Intel Core i9-14900K
i9-14900K, 3200 MHz
6282 Points -5%
AMD Ryzen 9 7950X
R9 7950X, 4500 MHz
6209 Points -6%
Intel Core i9-13900K
i9-13900K, 3000 MHz
6191 Points -6%
AMD Ryzen 9 7950X3D
R9 7950X3D, 4200 MHz
5974 Points -9%
Intel Core i7-14700K
i7-14700K, 2500 MHz
5459 (5323.4min - 5459.26max) Points -17%
AMD Ryzen 9 9900X
Ryzen 9 9900X, 4400 MHz
5008 (4929.75min - 5007.51max) Points -24%
AMD Ryzen 9 7900X
R9 7900X, 4700 MHz
4856 Points -26%
Intel Core i9-12900K
i9-12900K, 3200 MHz
4057 Points -38%
Intel Core Ultra 5 245K
Core Ultra 5 245K, 3600 MHz
3850 Points -42%
Intel Core i5-13600K
i5-13600K, 3500 MHz
3643 Points -45%
Intel Core i5-14600K
i5-14600K, 3500 MHz
3640 Points -45%
AMD Ryzen 7 9700X
Ryzen 7 9700X, 3800 MHz
3178 (3067.25min - 3120.37max) Points -52%
AMD Ryzen 7 7800X3D
R7 7800X3D, 4200 MHz
2974 Points -55%
AMD Ryzen 5 9600X
Ryzen 5 9600X, 3900 MHz
2630 Points -60%
Intel Core i5-12600K
i5-12600K, 2800 MHz
2555 Points -61%
Cinebench R20
CPU (Single Core)
Intel Core Ultra 9 285K
Core Ultra 9 285K, 3200 MHz
902 Points
Intel Core i9-14900K
i9-14900K, 3200 MHz
900 Points 0%
AMD Ryzen 9 9900X
Ryzen 9 9900X, 4400 MHz
885 Points -2%
AMD Ryzen 9 9950X
Ryzen 9 9950X, 4300 MHz
871 Points -3%
AMD Ryzen 7 9700X
Ryzen 7 9700X, 3800 MHz
870 Points -4%
AMD Ryzen 5 9600X
Ryzen 5 9600X, 3900 MHz
858 Points -5%
Intel Core i7-14700K
i7-14700K, 2500 MHz
832 Points -8%
Intel Core i9-13900K
i9-13900K, 3000 MHz
828 Points -8%
Intel Core Ultra 5 245K
Core Ultra 5 245K, 3600 MHz
820 Points -9%
AMD Ryzen 9 7950X
R9 7950X, 4500 MHz
795 Points -12%
AMD Ryzen 9 7950X3D
R9 7950X3D, 4200 MHz
795 Points -12%
Intel Core i5-14600K
i5-14600K, 3500 MHz
790 Points -12%
AMD Ryzen 9 7900X
R9 7900X, 4700 MHz
786 Points -13%
Intel Core i5-13600K
i5-13600K, 3500 MHz
775 Points -14%
Intel Core i9-12900K
i9-12900K, 3200 MHz
766 Points -15%
Intel Core i5-12600K
i5-12600K, 2800 MHz
734 Points -19%
AMD Ryzen 7 7800X3D
R7 7800X3D, 4200 MHz
709 Points -21%
CPU (Multi Core)
Intel Core Ultra 9 285K
Core Ultra 9 285K, 3200 MHz
16722 Points
AMD Ryzen 9 9950X
Ryzen 9 9950X, 4300 MHz
15788 Points -6%
Intel Core i9-14900K
i9-14900K, 3200 MHz
15466 Points -8%
Intel Core i9-13900K
i9-13900K, 3000 MHz
15181 Points -9%
AMD Ryzen 9 7950X
R9 7950X, 4500 MHz
14786 Points -12%
AMD Ryzen 9 7950X3D
R9 7950X3D, 4200 MHz
14188 Points -15%
Intel Core i7-14700K
i7-14700K, 2500 MHz
13672 Points -18%
AMD Ryzen 9 9900X
Ryzen 9 9900X, 4400 MHz
12551 Points -25%
AMD Ryzen 9 7900X
R9 7900X, 4700 MHz
11563 Points -31%
Intel Core i9-12900K
i9-12900K, 3200 MHz
10240 Points -39%
Intel Core Ultra 5 245K
Core Ultra 5 245K, 3600 MHz
9752 Points -42%
Intel Core i5-14600K
i5-14600K, 3500 MHz
9371 Points -44%
Intel Core i5-13600K
i5-13600K, 3500 MHz
9265 Points -45%
AMD Ryzen 7 9700X
Ryzen 7 9700X, 3800 MHz
7956 Points -52%
AMD Ryzen 7 7800X3D
R7 7800X3D, 4200 MHz
7121 Points -57%
AMD Ryzen 5 9600X
Ryzen 5 9600X, 3900 MHz
6719 Points -60%
Intel Core i5-12600K
i5-12600K, 2800 MHz
6692 Points -60%
Cinebench R23
Single Core
Intel Core Ultra 9 285K
Core Ultra 9 285K, 3200 MHz
2353 Points
Intel Core i9-14900K
i9-14900K, 3200 MHz
2351 Points 0%
Intel Core i9-13900K
i9-13900K, 3000 MHz
2267 Points -4%
AMD Ryzen 9 9900X
Ryzen 9 9900X, 4400 MHz
2253 Points -4%
AMD Ryzen 7 9700X
Ryzen 7 9700X, 3800 MHz
2211 Points -6%
AMD Ryzen 9 9950X
Ryzen 9 9950X, 4300 MHz
2202 Points -6%
AMD Ryzen 5 9600X
Ryzen 5 9600X, 3900 MHz
2180 Points -7%
Intel Core i7-14700K
i7-14700K, 2500 MHz
2153 Points -8%
Intel Core Ultra 5 245K
Core Ultra 5 245K, 3600 MHz
2132 Points -9%
Intel Core i5-14600K
i5-14600K, 3500 MHz
2064 Points -12%
AMD Ryzen 9 7950X3D
R9 7950X3D, 4200 MHz
2053 Points -13%
AMD Ryzen 9 7950X
R9 7950X, 4500 MHz
2045 Points -13%
AMD Ryzen 9 7900X
R9 7900X, 4700 MHz
2039 Points -13%
Intel Core i5-13600K
i5-13600K, 3500 MHz
2010 Points -15%
Intel Core i9-12900K
i9-12900K, 3200 MHz
1998 Points -15%
Intel Core i5-12600K
i5-12600K, 2800 MHz
1907 Points -19%
AMD Ryzen 7 7800X3D
R7 7800X3D, 4200 MHz
1820 Points -23%
Multi Core
Intel Core Ultra 9 285K
Core Ultra 9 285K, 3200 MHz
42705 Points
Intel Core i9-14900K
i9-14900K, 3200 MHz
41193 Points -4%
AMD Ryzen 9 9950X
Ryzen 9 9950X, 4300 MHz
40924 Points -4%
Intel Core i9-13900K
i9-13900K, 3000 MHz
40103 Points -6%
AMD Ryzen 9 7950X
R9 7950X, 4500 MHz
37792 Points -12%
AMD Ryzen 9 7950X3D
R9 7950X3D, 4200 MHz
36291 Points -15%
Intel Core i7-14700K
i7-14700K, 2500 MHz
35892 Points -16%
AMD Ryzen 9 9900X
Ryzen 9 9900X, 4400 MHz
32172 Points -25%
AMD Ryzen 9 7900X
R9 7900X, 4700 MHz
29480 Points -31%
Intel Core i9-12900K
i9-12900K, 3200 MHz
27005 Points -37%
Intel Core Ultra 5 245K
Core Ultra 5 245K, 3600 MHz
25066 Points -41%
Intel Core i5-14600K
i5-14600K, 3500 MHz
24491 Points -43%
Intel Core i5-13600K
i5-13600K, 3500 MHz
24268 Points -43%
AMD Ryzen 7 9700X
Ryzen 7 9700X, 3800 MHz
20485 Points -52%
AMD Ryzen 7 7800X3D
R7 7800X3D, 4200 MHz
18086 Points -58%
Intel Core i5-12600K
i5-12600K, 2800 MHz
17491 Points -59%
AMD Ryzen 5 9600X
Ryzen 5 9600X, 3900 MHz
17176 Points -60%
Blender - v2.79 BMW27 CPU
Intel Core i5-12600K
i5-12600K, 2800 MHz
189.5 Seconds * -140%
AMD Ryzen 5 9600X
Ryzen 5 9600X, 3900 MHz
184 Seconds * -133%
AMD Ryzen 7 7800X3D
R7 7800X3D, 4200 MHz
169 Seconds * -114%
AMD Ryzen 7 9700X
Ryzen 7 9700X, 3800 MHz
154 Seconds * -95%
Intel Core Ultra 5 245K
Core Ultra 5 245K, 3600 MHz
136 Seconds * -72%
Intel Core i5-13600K
i5-13600K, 3500 MHz
135 Seconds * -71%
Intel Core i5-14600K
i5-14600K, 3500 MHz
134 Seconds * -70%
Intel Core i9-12900K
i9-12900K, 3200 MHz
121.1 Seconds * -53%
AMD Ryzen 9 7900X
R9 7900X, 4700 MHz
106 Seconds * -34%
AMD Ryzen 9 9900X
Ryzen 9 9900X, 4400 MHz
97 Seconds * -23%
Intel Core i7-14700K
i7-14700K, 2500 MHz
91 Seconds * -15%
AMD Ryzen 9 7950X3D
R9 7950X3D, 4200 MHz
86 Seconds * -9%
AMD Ryzen 9 7950X
R9 7950X, 4500 MHz
85 Seconds * -8%
Intel Core i9-13900K
i9-13900K, 3000 MHz
80 Seconds * -1%
Intel Core i9-14900K
i9-14900K, 3200 MHz
80 Seconds * -1%
Intel Core Ultra 9 285K
Core Ultra 9 285K, 3200 MHz
79 Seconds *
AMD Ryzen 9 9950X
Ryzen 9 9950X, 4300 MHz
77 Seconds * +3%
HWBOT x265 Benchmark v2.2 - 4k Preset
Intel Core Ultra 9 285K
Core Ultra 9 285K, 3200 MHz
45.7 fps
AMD Ryzen 9 9950X
Ryzen 9 9950X, 4300 MHz
45.1 fps -1%
AMD Ryzen 9 7950X
R9 7950X, 4500 MHz
44.4 fps -3%
Intel Core i9-14900K
i9-14900K, 3200 MHz
42.8 fps -6%
Intel Core i9-13900K
i9-13900K, 3000 MHz
42.6 fps -7%
AMD Ryzen 9 7950X3D
R9 7950X3D, 4200 MHz
42.4 fps -7%
AMD Ryzen 9 9900X
Ryzen 9 9900X, 4400 MHz
38.7 fps -15%
Intel Core i7-14700K
i7-14700K, 2500 MHz
36.8 fps -19%
AMD Ryzen 9 7900X
R9 7900X, 4700 MHz
36.2 fps -21%
Intel Core i5-12600K
i5-12600K, 2800 MHz
30.1 fps -34%
Intel Core i9-12900K
i9-12900K, 3200 MHz
30 fps -34%
Intel Core Ultra 5 245K
Core Ultra 5 245K, 3600 MHz
29.6 fps -35%
Intel Core i5-14600K
i5-14600K, 3500 MHz
28.6 fps -37%
Intel Core i5-13600K
i5-13600K, 3500 MHz
27.6 fps -40%
AMD Ryzen 7 9700X
Ryzen 7 9700X, 3800 MHz
26.4 fps -42%
AMD Ryzen 7 7800X3D
R7 7800X3D, 4200 MHz
24.4 fps -47%
AMD Ryzen 5 9600X
Ryzen 5 9600X, 3900 MHz
23.2 fps -49%
WinRAR - Result
AMD Ryzen 9 7900X
R9 7900X, 4700 MHz
17225 KB/s +33%
AMD Ryzen 7 7800X3D
R7 7800X3D, 4200 MHz
16585 KB/s +28%
AMD Ryzen 9 7950X
R9 7950X, 4500 MHz
16351 KB/s +26%
Intel Core i9-14900K
i9-14900K, 3200 MHz
16108 KB/s +24%
AMD Ryzen 9 7950X3D
R9 7950X3D, 4200 MHz
15779 KB/s +22%
Intel Core i9-13900K
i9-13900K, 3000 MHz
14836 KB/s +15%
AMD Ryzen 5 9600X
Ryzen 5 9600X, 3900 MHz
14819 KB/s +14%
AMD Ryzen 9 9950X
Ryzen 9 9950X, 4300 MHz
13778 KB/s +6%
AMD Ryzen 7 9700X
Ryzen 7 9700X, 3800 MHz
13549 KB/s +5%
Intel Core Ultra 9 285K
Core Ultra 9 285K, 3200 MHz
12944 KB/s
Intel Core i7-14700K
i7-14700K, 2500 MHz
12800 KB/s -1%
Intel Core i5-14600K
i5-14600K, 3500 MHz
11491 KB/s -11%
Intel Core i5-13600K
i5-13600K, 3500 MHz
10937 KB/s -16%
Intel Core i9-12900K
i9-12900K, 3200 MHz
10792 KB/s -17%
Intel Core Ultra 5 245K
Core Ultra 5 245K, 3600 MHz
10521 KB/s -19%
Intel Core i5-12600K
i5-12600K, 2800 MHz
6239 KB/s -52%
TrueCrypt
AES Mean 100MB
AMD Ryzen 9 9950X
Ryzen 9 9950X, 4300 MHz
32.4 GB/s +87%
AMD Ryzen 9 7950X
R9 7950X, 4500 MHz
30.7 GB/s +77%
Intel Core i9-13900K
i9-13900K, 3000 MHz
27 GB/s +56%
AMD Ryzen 9 7950X3D
R9 7950X3D, 4200 MHz
26.9 GB/s +55%
Intel Core i9-14900K
i9-14900K, 3200 MHz
26.7 GB/s +54%
Intel Core i7-14700K
i7-14700K, 2500 MHz
25.6 GB/s +48%
Intel Core i5-14600K
i5-14600K, 3500 MHz
19.5 GB/s +13%
Intel Core i5-13600K
i5-13600K, 3500 MHz
18.8 GB/s +9%
Intel Core i9-12900K
i9-12900K, 3200 MHz
18.5 GB/s +7%
Intel Core Ultra 9 285K
Core Ultra 9 285K, 3200 MHz
17.3 GB/s
Intel Core Ultra 5 245K
Core Ultra 5 245K, 3600 MHz
16.4 GB/s -5%
AMD Ryzen 7 9700X
Ryzen 7 9700X, 3800 MHz
16.1 GB/s -7%
AMD Ryzen 7 7800X3D
R7 7800X3D, 4200 MHz
15.3 GB/s -12%
AMD Ryzen 9 7900X
R9 7900X, 4700 MHz
14.8 GB/s -14%
AMD Ryzen 5 9600X
Ryzen 5 9600X, 3900 MHz
13.4 GB/s -23%
Intel Core i5-12600K
i5-12600K, 2800 MHz
12.8 GB/s -26%
Twofish Mean 100MB
Intel Core i9-14900K
i9-14900K, 3200 MHz
5.8 GB/s +16%
AMD Ryzen 9 9950X
Ryzen 9 9950X, 4300 MHz
5.6 GB/s +12%
Intel Core i9-13900K
i9-13900K, 3000 MHz
5.4 GB/s +8%
Intel Core Ultra 9 285K
Core Ultra 9 285K, 3200 MHz
5 GB/s
Intel Core i7-14700K
i7-14700K, 2500 MHz
4.6 GB/s -8%
AMD Ryzen 9 7950X
R9 7950X, 4500 MHz
4.5 GB/s -10%
AMD Ryzen 9 7950X3D
R9 7950X3D, 4200 MHz
4.2 GB/s -16%
Intel Core i9-12900K
i9-12900K, 3200 MHz
3.7 GB/s -26%
Intel Core i5-14600K
i5-14600K, 3500 MHz
3.4 GB/s -32%
Intel Core i5-13600K
i5-13600K, 3500 MHz
3.1 GB/s -38%
Intel Core Ultra 5 245K
Core Ultra 5 245K, 3600 MHz
3 GB/s -40%
AMD Ryzen 9 7900X
R9 7900X, 4700 MHz
2.8 GB/s -44%
AMD Ryzen 7 9700X
Ryzen 7 9700X, 3800 MHz
2.8 GB/s -44%
Intel Core i5-12600K
i5-12600K, 2800 MHz
2.2 GB/s -56%
AMD Ryzen 5 9600X
Ryzen 5 9600X, 3900 MHz
2.2 GB/s -56%
AMD Ryzen 7 7800X3D
R7 7800X3D, 4200 MHz
2.1 GB/s -58%
Serpent Mean 100MB
AMD Ryzen 9 9950X
Ryzen 9 9950X, 4300 MHz
3.4 GB/s +36%
Intel Core i9-13900K
i9-13900K, 3000 MHz
3 GB/s +20%
AMD Ryzen 9 7950X
R9 7950X, 4500 MHz
2.8 GB/s +12%
AMD Ryzen 9 7950X3D
R9 7950X3D, 4200 MHz
2.8 GB/s +12%
Intel Core i9-14900K
i9-14900K, 3200 MHz
2.8 GB/s +12%
Intel Core i7-14700K
i7-14700K, 2500 MHz
2.6 GB/s +4%
Intel Core Ultra 9 285K
Core Ultra 9 285K, 3200 MHz
2.5 GB/s
Intel Core i9-12900K
i9-12900K, 3200 MHz
1.9 GB/s -24%
Intel Core i5-14600K
i5-14600K, 3500 MHz
1.8 GB/s -28%
Intel Core i5-13600K
i5-13600K, 3500 MHz
1.7 GB/s -32%
AMD Ryzen 7 9700X
Ryzen 7 9700X, 3800 MHz
1.7 GB/s -32%
AMD Ryzen 9 7900X
R9 7900X, 4700 MHz
1.5 GB/s -40%
Intel Core Ultra 5 245K
Core Ultra 5 245K, 3600 MHz
1.5 GB/s -40%
AMD Ryzen 5 9600X
Ryzen 5 9600X, 3900 MHz
1.4 GB/s -44%
Intel Core i5-12600K
i5-12600K, 2800 MHz
1.3 GB/s -48%
AMD Ryzen 7 7800X3D
R7 7800X3D, 4200 MHz
1.3 GB/s -48%
Geekbench 5.5
Single-Core
AMD Ryzen 9 9950X
Ryzen 9 9950X, 4300 MHz
2559 Points +6%
AMD Ryzen 9 9950X
Ryzen 9 9950X, 4300 MHz
2536 Points +5%
AMD Ryzen 9 9900X
Ryzen 9 9900X, 4400 MHz
2544 Points +6%
AMD Ryzen 5 9600X
Ryzen 5 9600X, 3900 MHz
2523 Points +5%
AMD Ryzen 7 9700X
Ryzen 7 9700X, 3800 MHz
2507 Points +4%
Intel Core Ultra 9 285K
Core Ultra 9 285K, 3200 MHz
2409 Points
AMD Ryzen 9 7950X
R9 7950X, 4500 MHz
2311 Points -4%
AMD Ryzen 9 7950X3D
R9 7950X3D, 4200 MHz
2311 Points -4%
Intel Core i9-13900K
i9-13900K, 3000 MHz
2290 Points -5%
AMD Ryzen 9 7900X
R9 7900X, 4700 MHz
2274 Points -6%
Intel Core i9-14900K
i9-14900K, 3200 MHz
2243 Points -7%
Intel Core Ultra 5 245K
Core Ultra 5 245K, 3600 MHz
2224 Points -8%
Intel Core i7-14700K
i7-14700K, 2500 MHz
2121 Points -12%
Intel Core i9-12900K
i9-12900K, 3200 MHz
2042 Points -15%
AMD Ryzen 7 7800X3D
R7 7800X3D, 4200 MHz
2027 Points -16%
Intel Core i5-14600K
i5-14600K, 3500 MHz
2017 Points -16%
Intel Core i5-13600K
i5-13600K, 3500 MHz
1967 Points -18%
Intel Core i5-12600K
i5-12600K, 2800 MHz
1904 Points -21%
Multi-Core
Intel Core Ultra 9 285K
Core Ultra 9 285K, 3200 MHz
26186 Points
Intel Core i9-14900K
i9-14900K, 3200 MHz
25867 Points -1%
AMD Ryzen 9 7950X
R9 7950X, 4500 MHz
24625 Points -6%
AMD Ryzen 9 7950X3D
R9 7950X3D, 4200 MHz
24343 Points -7%
Intel Core i9-13900K
i9-13900K, 3000 MHz
24157 Points -8%
AMD Ryzen 9 9950X
Ryzen 9 9950X, 4300 MHz
23982 Points -8%
AMD Ryzen 9 9950X
Ryzen 9 9950X, 4300 MHz
23154 Points -12%
Intel Core i7-14700K
i7-14700K, 2500 MHz
23159 Points -12%
AMD Ryzen 9 9900X
Ryzen 9 9900X, 4400 MHz
21384 Points -18%
AMD Ryzen 9 7900X
R9 7900X, 4700 MHz
19987 Points -24%
Intel Core i9-12900K
i9-12900K, 3200 MHz
17854 Points -32%
Intel Core Ultra 5 245K
Core Ultra 5 245K, 3600 MHz
17760 Points -32%
Intel Core i5-14600K
i5-14600K, 3500 MHz
17516 Points -33%
Intel Core i5-13600K
i5-13600K, 3500 MHz
16651 Points -36%
AMD Ryzen 7 9700X
Ryzen 7 9700X, 3800 MHz
14613 Points -44%
AMD Ryzen 7 7800X3D
R7 7800X3D, 4200 MHz
14252 Points -46%
Intel Core i5-12600K
i5-12600K, 2800 MHz
12797 Points -51%
AMD Ryzen 5 9600X
Ryzen 5 9600X, 3900 MHz
12751 Points -51%
Geekbench 6.3
Single-Core
AMD Ryzen 9 9900X
Ryzen 9 9900X, 4400 MHz
3429 Points +4%
AMD Ryzen 9 9950X
Ryzen 9 9950X, 4300 MHz
3408 Points +3%
AMD Ryzen 7 9700X
Ryzen 7 9700X, 3800 MHz
3373 Points +2%
Intel Core Ultra 9 285K
Core Ultra 9 285K, 3200 MHz
3306 Points
Intel Core i9-14900K
i9-14900K, 3200 MHz
3243 Points -2%
Intel Core Ultra 5 245K
Core Ultra 5 245K, 3600 MHz
3040 Points -8%
Intel Core i7-14700K
i7-14700K, 2500 MHz
2902 Points -12%
Intel Core i5-14600K
i5-14600K, 3500 MHz
2879 Points -13%
Multi-Core
Intel Core Ultra 9 285K
Core Ultra 9 285K, 3200 MHz
21688 Points
Intel Core i9-14900K
i9-14900K, 3200 MHz
21678 Points 0%
AMD Ryzen 9 9950X
Ryzen 9 9950X, 4300 MHz
21383 Points -1%
AMD Ryzen 9 9900X
Ryzen 9 9900X, 4400 MHz
20380 Points -6%
Intel Core i7-14700K
i7-14700K, 2500 MHz
19790 Points -9%
Intel Core Ultra 5 245K
Core Ultra 5 245K, 3600 MHz
17575 Points -19%
Intel Core i5-14600K
i5-14600K, 3500 MHz
17409 Points -20%
AMD Ryzen 7 9700X
Ryzen 7 9700X, 3800 MHz
16817 Points -22%
7-Zip 18.03
7z b 4
AMD Ryzen 9 7950X
R9 7950X, 4500 MHz
161724 MIPS +25%
AMD Ryzen 9 9950X
Ryzen 9 9950X, 4300 MHz
160423 MIPS +24%
AMD Ryzen 9 7950X3D
R9 7950X3D, 4200 MHz
159341 MIPS +23%
Intel Core i9-14900K
i9-14900K, 3200 MHz
149570 MIPS +15%
Intel Core i9-13900K
i9-13900K, 3000 MHz
147068 MIPS +13%
Intel Core i7-14700K
i7-14700K, 2500 MHz
135648 MIPS +4%
Intel Core Ultra 9 285K
Core Ultra 9 285K, 3200 MHz
129871 MIPS
AMD Ryzen 9 7900X
R9 7900X, 4700 MHz
124975 MIPS -4%
AMD Ryzen 9 9900X
Ryzen 9 9900X, 4400 MHz
122724 MIPS -6%
Intel Core i9-12900K
i9-12900K, 3200 MHz
97671 MIPS -25%
Intel Core i5-14600K
i5-14600K, 3500 MHz
93235 MIPS -28%
Intel Core i5-13600K
i5-13600K, 3500 MHz
89647 MIPS -31%
AMD Ryzen 7 7800X3D
R7 7800X3D, 4200 MHz
85067 MIPS -34%
AMD Ryzen 7 9700X
Ryzen 7 9700X, 3800 MHz
82553 MIPS -36%
Intel Core Ultra 5 245K
Core Ultra 5 245K, 3600 MHz
77921 MIPS -40%
AMD Ryzen 5 9600X
Ryzen 5 9600X, 3900 MHz
68220 MIPS -47%
Intel Core i5-12600K
i5-12600K, 2800 MHz
64260 MIPS -51%
7z b 4 -mmt1
AMD Ryzen 9 7950X
R9 7950X, 4500 MHz
8365 MIPS +12%
AMD Ryzen 9 7950X3D
R9 7950X3D, 4200 MHz
8321 MIPS +12%
AMD Ryzen 9 7900X
R9 7900X, 4700 MHz
8282 MIPS +11%
AMD Ryzen 7 7800X3D
R7 7800X3D, 4200 MHz
8235 MIPS +11%
AMD Ryzen 9 9900X
Ryzen 9 9900X, 4400 MHz
8020 MIPS +8%
AMD Ryzen 7 9700X
Ryzen 7 9700X, 3800 MHz
7894 MIPS +6%
AMD Ryzen 9 9950X
Ryzen 9 9950X, 4300 MHz
7852 MIPS +5%
AMD Ryzen 5 9600X
Ryzen 5 9600X, 3900 MHz
7796 MIPS +5%
Intel Core i9-14900K
i9-14900K, 3200 MHz
7772 MIPS +4%
Intel Core Ultra 9 285K
Core Ultra 9 285K, 3200 MHz
7444 MIPS
Intel Core i7-14700K
i7-14700K, 2500 MHz
7351 MIPS -1%
Intel Core i9-13900K
i9-13900K, 3000 MHz
7272 MIPS -2%
Intel Core i5-14600K
i5-14600K, 3500 MHz
6910 MIPS -7%
Intel Core i9-12900K
i9-12900K, 3200 MHz
6571 MIPS -12%
Intel Core i5-13600K
i5-13600K, 3500 MHz
6502 MIPS -13%
Intel Core Ultra 5 245K
Core Ultra 5 245K, 3600 MHz
6477 MIPS -13%
Intel Core i5-12600K
i5-12600K, 2800 MHz
5944 MIPS -20%
R Benchmark 2.5 - Overall mean
Intel Core i5-12600K
i5-12600K, 2800 MHz
0.4456 sec * -17%
Intel Core i9-12900K
i9-12900K, 3200 MHz
0.4216 sec * -11%
AMD Ryzen 7 7800X3D
R7 7800X3D, 4200 MHz
0.4152 sec * -9%
Intel Core Ultra 5 245K
Core Ultra 5 245K, 3600 MHz
0.4086 sec * -8%
Intel Core Ultra 5 245K
Core Ultra 5 245K, 3600 MHz
0.4058 sec * -7%
Intel Core i5-13600K
i5-13600K, 3500 MHz
0.405 sec * -7%
Intel Core i5-14600K
i5-14600K, 3500 MHz
0.3937 sec * -4%
Intel Core i7-14700K
i7-14700K, 2500 MHz
0.3826 sec * -1%
Intel Core Ultra 9 285K
Core Ultra 9 285K, 3200 MHz
0.3796 sec *
AMD Ryzen 9 7900X
R9 7900X, 4700 MHz
0.3736 sec * +2%
AMD Ryzen 9 7950X3D
R9 7950X3D, 4200 MHz
0.372 sec * +2%
AMD Ryzen 9 7950X
R9 7950X, 4500 MHz
0.3682 sec * +3%
Intel Core i9-13900K
i9-13900K, 3000 MHz
0.3539 sec * +7%
Intel Core i9-14900K
i9-14900K, 3200 MHz
0.345 sec * +9%
AMD Ryzen 7 9700X
Ryzen 7 9700X, 3800 MHz
0.3414 sec * +10%
AMD Ryzen 5 9600X
Ryzen 5 9600X, 3900 MHz
0.3389 sec * +11%
AMD Ryzen 9 9900X
Ryzen 9 9900X, 4400 MHz
0.336 sec * +11%
AMD Ryzen 9 9950X
Ryzen 9 9950X, 4300 MHz
0.3307 sec * +13%
LibreOffice - 20 Documents To PDF
Intel Core i5-12600K
i5-12600K, 2800 MHz
71.8 s * -90%
AMD Ryzen 5 9600X
Ryzen 5 9600X, 3900 MHz
46.4 s * -23%
AMD Ryzen 9 9950X
Ryzen 9 9950X, 4300 MHz
45.1 s * -20%
AMD Ryzen 9 9900X
Ryzen 9 9900X, 4400 MHz
44.2 s * -17%
AMD Ryzen 7 9700X
Ryzen 7 9700X, 3800 MHz
43.8 s * -16%
Intel Core Ultra 5 245K
Core Ultra 5 245K, 3600 MHz
43.1 s * -14%
Intel Core Ultra 5 245K
Core Ultra 5 245K, 3600 MHz
39.3 s * -4%
AMD Ryzen 7 7800X3D
R7 7800X3D, 4200 MHz
40.7 s * -8%
Intel Core i9-12900K
i9-12900K, 3200 MHz
40.6 s * -8%
Intel Core i7-14700K
i7-14700K, 2500 MHz
39.8 s * -6%
AMD Ryzen 9 7950X3D
R9 7950X3D, 4200 MHz
38.6 s * -2%
Intel Core Ultra 9 285K
Core Ultra 9 285K, 3200 MHz
37.7 s *
Intel Core i9-13900K
i9-13900K, 3000 MHz
36.6 s * +3%
AMD Ryzen 9 7950X
R9 7950X, 4500 MHz
35.5 s * +6%
Intel Core i5-13600K
i5-13600K, 3500 MHz
35 s * +7%
AMD Ryzen 9 7900X
R9 7900X, 4700 MHz
34.9 s * +7%
Intel Core i9-14900K
i9-14900K, 3200 MHz
32.5 s * +14%
Intel Core i5-14600K
i5-14600K, 3500 MHz
31.9 s * +15%
WebXPRT 3 - Overall
AMD Ryzen 9 9950X
Ryzen 9 9950X, 4300 MHz
409 Points +3%
AMD Ryzen 7 9700X
Ryzen 7 9700X, 3800 MHz
398 Points 0%
AMD Ryzen 9 9900X
Ryzen 9 9900X, 4400 MHz
398 Points 0%
Intel Core Ultra 9 285K
Core Ultra 9 285K, 3200 MHz
397 Points
AMD Ryzen 9 7950X3D
R9 7950X3D, 4200 MHz
383 Points -4%
Intel Core i9-14900K
i9-14900K, 3200 MHz
382 Points -4%
AMD Ryzen 9 7900X
R9 7900X, 4700 MHz
371 Points -7%
AMD Ryzen 9 7950X
R9 7950X, 4500 MHz
366 Points -8%
AMD Ryzen 5 9600X
Ryzen 5 9600X, 3900 MHz
364 Points -8%
Intel Core i9-13900K
i9-13900K, 3000 MHz
361 Points -9%
Intel Core i5-14600K
i5-14600K, 3500 MHz
354 Points -11%
AMD Ryzen 7 7800X3D
R7 7800X3D, 4200 MHz
353 Points -11%
Intel Core Ultra 5 245K
Core Ultra 5 245K, 3600 MHz
346 Points -13%
Intel Core i7-14700K
i7-14700K, 2500 MHz
339 Points -15%
Intel Core i5-13600K
i5-13600K, 3500 MHz
333 Points -16%
Intel Core i9-12900K
i9-12900K, 3200 MHz
320 Points -19%
Intel Core i5-12600K
i5-12600K, 2800 MHz
293 Points -26%
WebXPRT 4 - Overall
AMD Ryzen 9 9950X
Ryzen 9 9950X, 4300 MHz
357 Points +1%
Intel Core Ultra 9 285K
Core Ultra 9 285K, 3200 MHz
355 Points
AMD Ryzen 9 9900X
Ryzen 9 9900X, 4400 MHz
349 Points -2%
AMD Ryzen 7 9700X
Ryzen 7 9700X, 3800 MHz
346 Points -3%
AMD Ryzen 5 9600X
Ryzen 5 9600X, 3900 MHz
338 Points -5%
Intel Core Ultra 5 245K
Core Ultra 5 245K, 3600 MHz
318 Points -10%
Intel Core i9-13900K
i9-13900K, 3000 MHz
316 Points -11%
AMD Ryzen 9 7900X
R9 7900X, 4700 MHz
314 Points -12%
Intel Core i7-14700K
i7-14700K, 2500 MHz
314 Points -12%
AMD Ryzen 9 7950X3D
R9 7950X3D, 4200 MHz
313 Points -12%
AMD Ryzen 9 7950X
R9 7950X, 4500 MHz
304 Points -14%
Intel Core i5-14600K
i5-14600K, 3500 MHz
301 Points -15%
Intel Core i5-13600K
i5-13600K, 3500 MHz
288 Points -19%
AMD Ryzen 7 7800X3D
R7 7800X3D, 4200 MHz
282 Points -21%
Mozilla Kraken 1.1 - Total
Intel Core i5-12600K
i5-12600K, 2800 MHz
511 ms * -29%
AMD Ryzen 7 7800X3D
R7 7800X3D, 4200 MHz
487 ms * -23%
Intel Core i9-12900K
i9-12900K, 3200 MHz
481 ms * -21%
Intel Core i5-13600K
i5-13600K, 3500 MHz
469 ms * -18%
Intel Core i5-14600K
i5-14600K, 3500 MHz
450 ms * -13%
Intel Core i7-14700K
i7-14700K, 2500 MHz
439 ms * -11%
AMD Ryzen 9 7950X3D
R9 7950X3D, 4200 MHz
437 ms * -10%
AMD Ryzen 9 7950X
R9 7950X, 4500 MHz
433 ms * -9%
Intel Core i9-13900K
i9-13900K, 3000 MHz
432 ms * -9%
AMD Ryzen 9 7900X
R9 7900X, 4700 MHz
431 ms * -9%
Intel Core Ultra 5 245K
Core Ultra 5 245K, 3600 MHz
425 ms * -7%
Intel Core i9-14900K
i9-14900K, 3200 MHz
418 ms * -5%
Intel Core Ultra 9 285K
Core Ultra 9 285K, 3200 MHz
397 ms *
AMD Ryzen 5 9600X
Ryzen 5 9600X, 3900 MHz
389 ms * +2%
AMD Ryzen 7 9700X
Ryzen 7 9700X, 3800 MHz
383 ms * +4%
AMD Ryzen 9 9900X
Ryzen 9 9900X, 4400 MHz
383 ms * +4%
AMD Ryzen 9 9950X
Ryzen 9 9950X, 4300 MHz
377 ms * +5%
V-Ray Benchmark Next 4.10 - CPU
AMD Ryzen 9 9950X
Ryzen 9 9950X, 4300 MHz
45178 ksamples +2%
Intel Core Ultra 9 285K
Core Ultra 9 285K, 3200 MHz
44113 ksamples
AMD Ryzen 9 7950X
R9 7950X, 4500 MHz
43529 ksamples -1%
AMD Ryzen 9 7950X3D
R9 7950X3D, 4200 MHz
42381 ksamples -4%
Intel Core i9-14900K
i9-14900K, 3200 MHz
40942 ksamples -7%
Intel Core i9-13900K
i9-13900K, 3000 MHz
40076 ksamples -9%
AMD Ryzen 9 9900X
Ryzen 9 9900X, 4400 MHz
36389 ksamples -18%
Intel Core i7-14700K
i7-14700K, 2500 MHz
35640 ksamples -19%
AMD Ryzen 9 7900X
R9 7900X, 4700 MHz
32353 ksamples -27%
Intel Core i9-12900K
i9-12900K, 3200 MHz
27376 ksamples -38%
Intel Core Ultra 5 245K
Core Ultra 5 245K, 3600 MHz
25063 ksamples -43%
Intel Core i5-14600K
i5-14600K, 3500 MHz
24871 ksamples -44%
Intel Core i5-13600K
i5-13600K, 3500 MHz
24288 ksamples -45%
AMD Ryzen 7 9700X
Ryzen 7 9700X, 3800 MHz
23591 ksamples -47%
AMD Ryzen 5 9600X
Ryzen 5 9600X, 3900 MHz
19653 ksamples -55%
Intel Core i5-12600K
i5-12600K, 2800 MHz
17739 ksamples -60%
V-Ray 5 Benchmark - CPU
AMD Ryzen 9 9950X
Ryzen 9 9950X, 4300 MHz
31302 mpaths +2%
Intel Core Ultra 9 285K
Core Ultra 9 285K, 3200 MHz
30762 mpaths
AMD Ryzen 9 7950X
R9 7950X, 4500 MHz
29602 mpaths -4%
AMD Ryzen 9 7950X3D
R9 7950X3D, 4200 MHz
28258 mpaths -8%
Intel Core i9-13900K
i9-13900K, 3000 MHz
27447 mpaths -11%
Intel Core i9-14900K
i9-14900K, 3200 MHz
27341 mpaths -11%
Intel Core i7-14700K
i7-14700K, 2500 MHz
23557 mpaths -23%
AMD Ryzen 9 7900X
R9 7900X, 4700 MHz
22376 mpaths -27%
Intel Core i9-12900K
i9-12900K, 3200 MHz
18056 mpaths -41%
Intel Core Ultra 5 245K
Core Ultra 5 245K, 3600 MHz
17310 mpaths -44%
Intel Core i5-14600K
i5-14600K, 3500 MHz
16552 mpaths -46%
Intel Core i5-13600K
i5-13600K, 3500 MHz
16034 mpaths -48%
AMD Ryzen 7 9700X
Ryzen 7 9700X, 3800 MHz
15648 mpaths -49%
AMD Ryzen 7 7800X3D
R7 7800X3D, 4200 MHz
14397 mpaths -53%
AMD Ryzen 5 9600X
Ryzen 5 9600X, 3900 MHz
13355 mpaths -57%
Intel Core i5-12600K
i5-12600K, 2800 MHz
11579 mpaths -62%
wPrime 2.10
32m
Intel Core i9-12900K
i9-12900K, 3200 MHz
4.924 s * -132%
Intel Core i5-12600K
i5-12600K, 2800 MHz
4.725 s * -123%
Intel Core Ultra 5 245K
Core Ultra 5 245K, 3600 MHz
2.976 s * -40%
AMD Ryzen 5 9600X
Ryzen 5 9600X, 3900 MHz
2.617 s * -23%
Intel Core i5-13600K
i5-13600K, 3500 MHz
2.527 s * -19%
AMD Ryzen 7 7800X3D
R7 7800X3D, 4200 MHz
2.435 s * -15%
Intel Core i5-14600K
i5-14600K, 3500 MHz
2.39 s * -13%
AMD Ryzen 7 9700X
Ryzen 7 9700X, 3800 MHz
2.36 s * -11%
Intel Core i7-14700K
i7-14700K, 2500 MHz
2.147 s * -1%
Intel Core Ultra 9 285K
Core Ultra 9 285K, 3200 MHz
2.12 s *
AMD Ryzen 9 9950X
Ryzen 9 9950X, 4300 MHz
2.077 s * +2%
Intel Core i9-14900K
i9-14900K, 3200 MHz
2.07 s * +2%
AMD Ryzen 9 7950X3D
R9 7950X3D, 4200 MHz
2.007 s * +5%
Intel Core i9-13900K
i9-13900K, 3000 MHz
1.818 s * +14%
AMD Ryzen 9 7900X
R9 7900X, 4700 MHz
1.781 s * +16%
AMD Ryzen 9 7950X
R9 7950X, 4500 MHz
1.669 s * +21%
1024m
Intel Core i5-12600K
i5-12600K, 2800 MHz
202.7 s * -376%
Intel Core i9-12900K
i9-12900K, 3200 MHz
190.6 s * -348%
Intel Core i5-13600K
i5-13600K, 3500 MHz
177.592 s * -317%
Intel Core i5-14600K
i5-14600K, 3500 MHz
158.77 s * -273%
Intel Core i7-14700K
i7-14700K, 2500 MHz
109.801 s * -158%
Intel Core i9-13900K
i9-13900K, 3000 MHz
79.738 s * -87%
Intel Core Ultra 5 245K
Core Ultra 5 245K, 3600 MHz
77.721 s * -82%
Intel Core i9-14900K
i9-14900K, 3200 MHz
74.47 s * -75%
AMD Ryzen 5 9600X
Ryzen 5 9600X, 3900 MHz
72.546 s * -70%
AMD Ryzen 7 7800X3D
R7 7800X3D, 4200 MHz
62.733 s * -47%
AMD Ryzen 7 9700X
Ryzen 7 9700X, 3800 MHz
59.56 s * -40%
Intel Core Ultra 9 285K
Core Ultra 9 285K, 3200 MHz
42.591 s *
AMD Ryzen 9 7900X
R9 7900X, 4700 MHz
39.954 s * +6%
AMD Ryzen 9 7950X3D
R9 7950X3D, 4200 MHz
33.879 s * +20%
AMD Ryzen 9 7950X
R9 7950X, 4500 MHz
30.811 s * +28%
AMD Ryzen 9 9950X
Ryzen 9 9950X, 4300 MHz
29.318 s * +31%
Super Pi mod 1.5 XS 1M - 1M
AMD Ryzen 5 9600X
Ryzen 5 9600X, 3900 MHz
7.614 s * -11%
AMD Ryzen 7 9700X
Ryzen 7 9700X, 3800 MHz
7.54 s * -10%
Intel Core i5-12600K
i5-12600K, 2800 MHz
7.406 s * -8%
AMD Ryzen 9 9950X
Ryzen 9 9950X, 4300 MHz
7.31 s * -7%
Intel Core Ultra 5 245K
Core Ultra 5 245K, 3600 MHz
7.303 s * -7%
AMD Ryzen 7 7800X3D
R7 7800X3D, 4200 MHz
7.089 s * -3%
Intel Core i9-12900K
i9-12900K, 3200 MHz
7.063 s * -3%
Intel Core Ultra 9 285K
Core Ultra 9 285K, 3200 MHz
6.857 s *
Intel Core i5-13600K
i5-13600K, 3500 MHz
6.58 s * +4%
Intel Core i5-14600K
i5-14600K, 3500 MHz
6.234 s * +9%
AMD Ryzen 9 7900X
R9 7900X, 4700 MHz
6.141 s * +10%
AMD Ryzen 9 7950X3D
R9 7950X3D, 4200 MHz
6.109 s * +11%
AMD Ryzen 9 7950X
R9 7950X, 4500 MHz
6.088 s * +11%
Intel Core i7-14700K
i7-14700K, 2500 MHz
5.98 s * +13%
Intel Core i9-13900K
i9-13900K, 3000 MHz
5.655 s * +18%
Intel Core i9-14900K
i9-14900K, 3200 MHz
5.476 s * +20%
Super Pi mod 1.5 XS 2M - 2M
Intel Core i5-12600K
i5-12600K, 2800 MHz
16.42 s * -10%
AMD Ryzen 5 9600X
Ryzen 5 9600X, 3900 MHz
16.363 s * -10%
AMD Ryzen 7 9700X
Ryzen 7 9700X, 3800 MHz
16.1 s * -8%
Intel Core Ultra 5 245K
Core Ultra 5 245K, 3600 MHz
16.026 s * -7%
AMD Ryzen 9 9950X
Ryzen 9 9950X, 4300 MHz
15.61 s * -5%
Intel Core i9-12900K
i9-12900K, 3200 MHz
15.59 s * -4%
AMD Ryzen 7 7800X3D
R7 7800X3D, 4200 MHz
15.335 s * -3%
Intel Core Ultra 9 285K
Core Ultra 9 285K, 3200 MHz
14.936 s *
Intel Core i5-13600K
i5-13600K, 3500 MHz
14.876 s * -0%
Intel Core i5-14600K
i5-14600K, 3500 MHz
13.657 s * +9%
AMD Ryzen 9 7950X
R9 7950X, 4500 MHz
13.291 s * +11%
AMD Ryzen 9 7900X
R9 7900X, 4700 MHz
13.251 s * +11%
Intel Core i9-13900K
i9-13900K, 3000 MHz
13.193 s * +12%
AMD Ryzen 9 7950X3D
R9 7950X3D, 4200 MHz
13.189 s * +12%
Intel Core i7-14700K
i7-14700K, 2500 MHz
12.844 s * +14%
Intel Core i9-14900K
i9-14900K, 3200 MHz
11.996 s * +20%

* ... Meglio usare valori piccoli

Cinebench R15 Multi Loop

Come i suoi predecessori, il Core Ultra 9 285K non viene fornito con un raffreddatore per CPU nella confezione. Intel afferma che i raffreddatori progettati per LGA 1700 dovrebbero essere compatibili con LGA 1851. Non abbiamo avuto alcun problema nel montare il nostro radiatore Thermaltake TH420 V2 Ultra EX ARGB all-in-one, utilizzando le stesse staffe di montaggio previste per il socket LGA 1700.

Detto questo, ci aspettiamo di vedere nuovi raffreddatori specifici per LGA 1851 che tengano conto della presenza della piastrella Compute nella parte sud-ovest del pacchetto. I raffreddatori progettati per Arrow Lake-S potrebbero offrire prestazioni di raffreddamento leggermente migliori, ma la soluzione LGA 1700 esistente funzionerà benissimo.

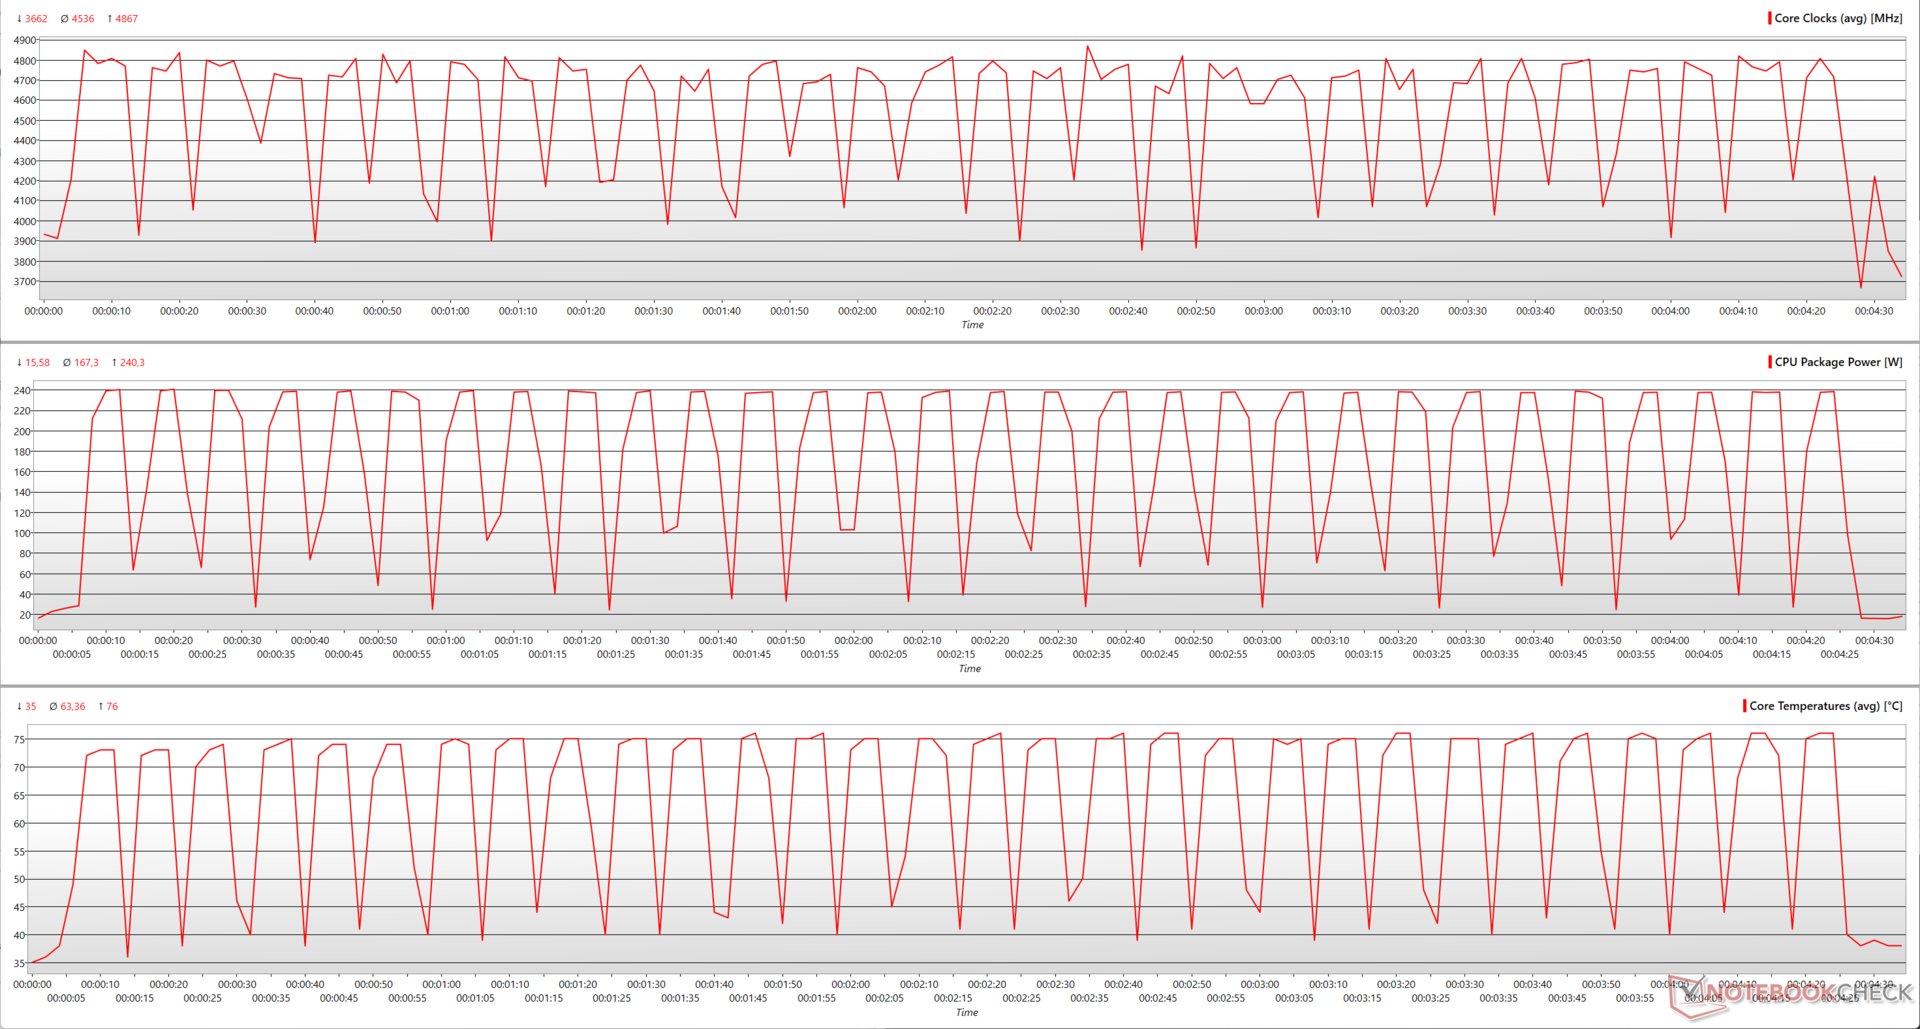
La capacità del TH420 V2 Ultra EX di raffreddare in modo efficiente il Core Ultra 9 285K è evidente dalle prestazioni costanti nel ciclo multi-core Cinebench R15 riportato di seguito.

03306609901320165019802310264029703300363039604290462049505280561059406270Tooltip
Intel Core Ultra 9 285K Core Ultra 9 285K: Ø6554 (6491.4-6587.62)
Intel Core i9-14900K i9-14900K: Ø6068 (5924.17-6110.6)
Intel Core i9-13900K i9-13900K: Ø6182 (6045.95-6213.11)
AMD Ryzen 9 9900X Ryzen 9 9900X: Ø4977 (4929.75-5007.51)
AMD Ryzen 9 9950X Ryzen 9 9950X: Ø6291 (6262.72-6335.13)
Intel Core Ultra 5 245K Core Ultra 5 245K: Ø3788 (3746.72-3821.53)

Vediamo che il Core Ultra 9 285K può aumentare fino a 4,86 GHz durante il loop multi-core di Cinebench R15, con un clock medio di 4,53 GHz.

Queste prestazioni sono ottenute con un consumo di energia del pacchetto di 240 W e una temperatura massima del nucleo di 76 °C, che sono significativamente inferiori ai valori di 349 W e 87 °C del Core i9-14900K. In effetti, anche il Core i7-14700K mostra cifre più alte, con una potenza del package di 313 W e una temperatura del core di 92 °C.

In media, il Core Ultra 9 285K mantiene una potenza del pacchetto di 167 W e una temperatura del nucleo di 63 °C, entrambi inferiori ai valori rispettivi del Core i7-14700K, pari a 195 W e 76 °C.

Intel Core Ultra 9 285K: parametri della CPU durante il ciclo multi-core di Cinebench R15
Cinebench R10 Rendering Multiple CPUs 32Bit
100637
Cinebench R10 Shading 32Bit
26426
Cinebench R10 Rendering Single 32Bit
12549
Cinebench R11.5 CPU Multi 64Bit
70.77 Points
Cinebench R11.5 OpenGL 64Bit
225.44 fps
Cinebench R11.5 CPU Single 64Bit
4.21 Points
Cinebench R15 CPU Single 64Bit
356 Points
Cinebench R15 Ref. Match 64Bit
99.6 %
Cinebench R15 OpenGL 64Bit
381 fps
Cinebench R15 CPU Multi 64Bit
6588 Points
Aiuto

Prestazioni del sistema: Alla stessa stregua del Core i9-14900K e dell'AMD Zen 5

Le prestazioni complessive del sistema del Core Ultra 9 285K sono paragonabili a quelle del Core i9-14900K e del Ryzen 9 9950X e non si discostano molto da quanto visto con il Ryzen 9 7950X Ryzen 9 7950X, Core i9-13900Ke Ryzen 9 9900X.

I singoli benchmark, tuttavia, mostrano guadagni leggermente migliori con il Core i9-14900K in 3DMark Time Spy CPU, 3DMark 11 Performance Physics e CrossMark. PCMark 10, nel complesso, mette il Core Ultra 9 285K un po' avanti rispetto al Core i9-14900K, ma soprattutto alla pari con AMD Zen 5.

Le CPU AMD hanno un vantaggio particolare nei test CPU AIDA64, ad eccezione di CPU PhotoWorxx, dove il Core Ultra 9 285K ottiene un vantaggio percepibile.

Tuttavia, le normali attività di produttività non hanno problemi nell'uso quotidiano.

System Performance Rating
AMD Ryzen 9 9950X
60.3 pt
Intel Core i9-14900K
58.8 pt
Intel Core Ultra 9 285K
57.7 pt
AMD Ryzen 9 7950X
57.3 pt
Intel Core i9-13900K
57 pt
AMD Ryzen 9 9900X
55.9 pt
AMD Ryzen 9 7950X3D -2!
53.9 pt
AMD Ryzen 9 7900X
53.3 pt
Intel Core i7-14700K
53.2 pt
Intel Core i5-14600K
49.8 pt
AMD Ryzen 7 9700X
49.8 pt
Intel Core i5-13600K
48.2 pt
AMD Ryzen 7 7800X3D
47.9 pt
AMD Ryzen 5 9600X
45.4 pt
Intel Core Ultra 5 245K
45.4 pt
Intel Core i9-12900K -4!
36.7 pt
Intel Core i5-12600K -4!
31.5 pt
3DMark 11 / Performance Physics
AMD Ryzen 9 9950X
38269 Points +24%
AMD Ryzen 9 7950X3D
36991 Points +20%
AMD Ryzen 7 7800X3D
35127 Points +14%
Intel Core i7-14700K
32336 Points +5%
Intel Core i9-13900K
32273 Points +5%
Intel Core i9-14900K
32188 Points +5%
Intel Core i5-14600K
31641 Points +3%
Intel Core Ultra 9 285K
30767 Points
AMD Ryzen 7 9700X
30757 Points 0%
Intel Core i5-13600K
30480 Points -1%
AMD Ryzen 9 9900X
29231 Points -5%
AMD Ryzen 9 7900X
28618 Points -7%
AMD Ryzen 9 7950X
28618 Points -7%
Intel Core i9-12900K
28211 Points -8%
Intel Core Ultra 5 245K
27022 Points -12%
AMD Ryzen 5 9600X
25717 Points -16%
Intel Core i5-12600K
25017 Points -19%
3DMark / Fire Strike Physics
Intel Core i9-14900K
56087 Points +5%
Intel Core i9-13900K
53853 Points +1%
Intel Core Ultra 9 285K
53541 Points
AMD Ryzen 9 9950X
49522 Points -8%
Intel Core i7-14700K
49142 Points -8%
AMD Ryzen 9 7950X3D
44787 Points -16%
AMD Ryzen 9 9900X
44322 Points -17%
AMD Ryzen 9 7900X
42682 Points -20%
AMD Ryzen 9 7950X
42682 Points -20%
Intel Core i5-14600K
40164 Points -25%
Intel Core i9-12900K
39112 Points -27%
Intel Core Ultra 5 245K
38202 Points -29%
AMD Ryzen 7 9700X
38088 Points -29%
Intel Core i5-13600K
35386 Points -34%
AMD Ryzen 5 9600X
33462 Points -38%
AMD Ryzen 7 7800X3D
33345 Points -38%
Intel Core i5-12600K
29671 Points -45%
3DMark / Time Spy CPU
Intel Core i9-14900K
23721 Points +29%
Intel Core i7-14700K
21541 Points +18%
Intel Core i9-13900K
19392 Points +6%
Intel Core i5-14600K
18768 Points +2%
Intel Core i9-12900K
18431 Points +1%
Intel Core Ultra 9 285K
18322 Points
AMD Ryzen 9 7950X3D
17206 Points -6%
Intel Core i5-13600K
17124 Points -7%
AMD Ryzen 9 7900X
16616 Points -9%
AMD Ryzen 9 7950X
16616 Points -9%
AMD Ryzen 9 9950X
16112 Points -12%
AMD Ryzen 9 9900X
15940 Points -13%
Intel Core Ultra 5 245K
15010 Points -18%
AMD Ryzen 7 9700X
14306 Points -22%
AMD Ryzen 7 7800X3D
14098 Points -23%
Intel Core i5-12600K
13869 Points -24%
AMD Ryzen 5 9600X
10821 Points -41%
CrossMark / Overall
Intel Core i9-14900K
2611 Points +3%
Intel Core i9-13900K
2589 Points +2%
Intel Core Ultra 9 285K
2529 Points
AMD Ryzen 9 7950X
2512 Points -1%
AMD Ryzen 9 9950X
2451 Points -3%
AMD Ryzen 9 7900X
2405 Points -5%
Intel Core i5-14600K
2310 Points -9%
AMD Ryzen 9 9900X
2289 Points -9%
Intel Core i7-14700K
2288 Points -10%
Intel Core i5-13600K
2271 Points -10%
Intel Core Ultra 5 245K
2245 Points -11%
AMD Ryzen 7 7800X3D
2216 Points -12%
AMD Ryzen 9 7950X3D
2193 Points -13%
AMD Ryzen 7 9700X
2174 Points -14%
AMD Ryzen 5 9600X
2103 Points -17%
CrossMark / Responsiveness
Intel Core i9-13900K
2653 Points +13%
Intel Core i9-14900K
2413 Points +3%
Intel Core Ultra 9 285K
2351 Points
Intel Core i5-13600K
2350 Points 0%
AMD Ryzen 9 7950X
2288 Points -3%
AMD Ryzen 9 7900X
2251 Points -4%
Intel Core Ultra 5 245K
2169 Points -8%
Intel Core i5-14600K
2090 Points -11%
AMD Ryzen 7 7800X3D
2039 Points -13%
Intel Core i7-14700K
2033 Points -14%
AMD Ryzen 9 9950X
2024 Points -14%
AMD Ryzen 9 7950X3D
1795 Points -24%
AMD Ryzen 9 9900X
1795 Points -24%
AMD Ryzen 7 9700X
1616 Points -31%
AMD Ryzen 5 9600X
1536 Points -35%
CrossMark / Creativity
AMD Ryzen 9 9950X
2929 Points +6%
Intel Core i9-14900K
2891 Points +5%
AMD Ryzen 9 7950X
2786 Points +1%
Intel Core i9-13900K
2784 Points +1%
Intel Core Ultra 9 285K
2766 Points
AMD Ryzen 9 9900X
2743 Points -1%
AMD Ryzen 9 7900X
2673 Points -3%
Intel Core i7-14700K
2601 Points -6%
AMD Ryzen 7 9700X
2590 Points -6%
Intel Core i5-14600K
2575 Points -7%
AMD Ryzen 9 7950X3D
2552 Points -8%
AMD Ryzen 5 9600X
2501 Points -10%
AMD Ryzen 7 7800X3D
2434 Points -12%
Intel Core i5-13600K
2412 Points -13%
Intel Core Ultra 5 245K
2364 Points -15%
CrossMark / Productivity
Intel Core i9-14900K
2421 Points +2%
Intel Core i9-13900K
2388 Points +1%
Intel Core Ultra 9 285K
2369 Points
AMD Ryzen 9 7950X
2336 Points -1%
AMD Ryzen 9 7900X
2211 Points -7%
AMD Ryzen 9 9950X
2187 Points -8%
Intel Core Ultra 5 245K
2156 Points -9%
Intel Core i5-14600K
2142 Points -10%
Intel Core i5-13600K
2115 Points -11%
Intel Core i7-14700K
2093 Points -12%
AMD Ryzen 7 7800X3D
2074 Points -12%
AMD Ryzen 9 9900X
2071 Points -13%
AMD Ryzen 7 9700X
2015 Points -15%
AMD Ryzen 9 7950X3D
2014 Points -15%
AMD Ryzen 5 9600X
1962 Points -17%
PCMark 10 / Score
AMD Ryzen 7 9700X
10699 Points +2%
AMD Ryzen 9 9950X
10699 Points +2%
AMD Ryzen 9 9900X
10677 Points +2%
Intel Core Ultra 9 285K
10514 Points
Intel Core i9-14900K
10101 Points -4%
AMD Ryzen 5 9600X
10060 Points -4%
AMD Ryzen 9 7900X
9911 Points -6%
AMD Ryzen 9 7950X
9911 Points -6%
Intel Core i9-13900K
9788 Points -7%
Intel Core i7-14700K
9741 Points -7%
Intel Core i5-14600K
9587 Points -9%
AMD Ryzen 7 7800X3D
9500 Points -10%
Intel Core Ultra 5 245K
9409 Points -11%
Intel Core i5-13600K
9362 Points -11%
Intel Core i9-12900K
8604 Points -18%
Intel Core i5-12600K
8259 Points -21%
PCMark 10 / Essentials
Intel Core i9-13900K
12868 Points +11%
AMD Ryzen 9 7900X
12651 Points +9%
AMD Ryzen 9 7950X
12651 Points +9%
AMD Ryzen 7 9700X
12591 Points +8%
Intel Core i9-14900K
12352 Points +6%
Intel Core i5-13600K
12306 Points +6%
AMD Ryzen 9 9900X
12192 Points +5%
AMD Ryzen 9 7950X3D
12130 Points +4%
AMD Ryzen 5 9600X
12047 Points +4%
AMD Ryzen 9 9950X
12044 Points +4%
Intel Core i7-14700K
11934 Points +3%
Intel Core Ultra 9 285K
11613 Points
Intel Core i5-14600K
11532 Points -1%
AMD Ryzen 7 7800X3D
11337 Points -2%
Intel Core Ultra 5 245K
11292 Points -3%
Intel Core i9-12900K
11086 Points -5%
Intel Core i5-12600K
10650 Points -8%
PCMark 10 / Productivity
AMD Ryzen 9 9900X
12944 Points +5%
AMD Ryzen 5 9600X
12915 Points +5%
AMD Ryzen 9 9950X
12883 Points +4%
AMD Ryzen 7 9700X
12873 Points +4%
AMD Ryzen 9 7950X3D
12576 Points +2%
Intel Core Ultra 9 285K
12340 Points
AMD Ryzen 7 7800X3D
12108 Points -2%
Intel Core i5-14600K
12075 Points -2%
Intel Core i7-14700K
11903 Points -4%
AMD Ryzen 9 7900X
11853 Points -4%
AMD Ryzen 9 7950X
11853 Points -4%
Intel Core i9-14900K
11784 Points -5%
Intel Core i5-13600K
11630 Points -6%
Intel Core i9-13900K
11370 Points -8%
Intel Core Ultra 5 245K
11131 Points -10%
Intel Core i5-12600K
11001 Points -11%
Intel Core i9-12900K
10699 Points -13%
PCMark 10 / Digital Content Creation
Intel Core Ultra 9 285K
22005 Points
AMD Ryzen 9 9950X
21420 Points -3%
AMD Ryzen 9 9900X
20931 Points -5%
AMD Ryzen 7 9700X
20506 Points -7%
Intel Core i9-14900K
19214 Points -13%
Intel Core Ultra 5 245K
17984 Points -18%
AMD Ryzen 5 9600X
17760 Points -19%
Intel Core i7-14700K
17659 Points -20%
AMD Ryzen 9 7900X
17617 Points -20%
AMD Ryzen 9 7950X
17617 Points -20%
Intel Core i9-13900K
17393 Points -21%
Intel Core i5-14600K
17170 Points -22%
AMD Ryzen 7 7800X3D
16950 Points -23%
Intel Core i5-13600K
15558 Points -29%
Intel Core i9-12900K
14573 Points -34%
Intel Core i5-12600K
13047 Points -41%
AIDA64 / FP32 Ray-Trace
AMD Ryzen 9 9950X
83214 KRay/s +94%
AMD Ryzen 9 9900X
66524 KRay/s +55%
AMD Ryzen 9 7950X
61180 KRay/s +43%
AMD Ryzen 9 7950X3D
58359 KRay/s +36%
Intel Core Ultra 9 285K
42871 KRay/s
AMD Ryzen 7 9700X
41146 KRay/s -4%
Intel Core i9-14900K
37224 KRay/s -13%
Intel Core i9-13900K
36939 KRay/s -14%
AMD Ryzen 5 9600X
36389 KRay/s -15%
AMD Ryzen 9 7900X
33676 KRay/s -21%
Intel Core i7-14700K
31200 KRay/s -27%
AMD Ryzen 7 7800X3D
29390 KRay/s -31%
Intel Core i5-14600K
24047 KRay/s -44%
Intel Core i5-13600K
23446 KRay/s -45%
Intel Core Ultra 5 245K
18517 KRay/s -57%
Intel Core i9-12900K
13266 KRay/s -69%
Intel Core i5-12600K
8243 KRay/s -81%
AIDA64 / FPU Julia
AMD Ryzen 9 7950X3D
245308 Points +11%
AMD Ryzen 9 9950X
242692 Points +10%
AMD Ryzen 9 7950X
234844 Points +6%
Intel Core Ultra 9 285K
220808 Points
AMD Ryzen 9 7900X
201995 Points -9%
AMD Ryzen 9 9900X
191485 Points -13%
Intel Core i9-14900K
184059 Points -17%
Intel Core i9-13900K
183390 Points -17%
Intel Core i7-14700K
157539 Points -29%
AMD Ryzen 7 7800X3D
121296 Points -45%
AMD Ryzen 7 9700X
116886 Points -47%
Intel Core i5-14600K
113603 Points -49%
Intel Core i5-13600K
111374 Points -50%
AMD Ryzen 5 9600X
100758 Points -54%
Intel Core Ultra 5 245K
95048 Points -57%
Intel Core i9-12900K
59419 Points -73%
Intel Core i5-12600K
37321 Points -83%
AIDA64 / CPU SHA3
AMD Ryzen 9 7950X3D
11001 MB/s +2%
Intel Core Ultra 9 285K
10804 MB/s
AMD Ryzen 9 9950X
10453 MB/s -3%
AMD Ryzen 9 7950X
10076 MB/s -7%
Intel Core i9-13900K
9180 MB/s -15%
Intel Core i9-14900K
9166 MB/s -15%
AMD Ryzen 9 9900X
8278 MB/s -23%
Intel Core i7-14700K
7372 MB/s -32%
AMD Ryzen 9 7900X
7018 MB/s -35%
Intel Core i5-14600K
5326 MB/s -51%
AMD Ryzen 7 9700X
5307 MB/s -51%
AMD Ryzen 7 7800X3D
5287 MB/s -51%
Intel Core i5-13600K
5253 MB/s -51%
Intel Core i9-12900K
4952 MB/s -54%
Intel Core Ultra 5 245K
4378 MB/s -59%
AMD Ryzen 5 9600X
4246 MB/s -61%
Intel Core i5-12600K
3250 MB/s -70%
AIDA64 / CPU Queen
AMD Ryzen 9 7950X
203324 Points +43%
AMD Ryzen 9 7950X3D
199943 Points +41%
AMD Ryzen 9 9950X
187912 Points +32%
AMD Ryzen 9 7900X
172637 Points +21%
Intel Core i7-14700K
167941 Points +18%
Intel Core i9-14900K
163637 Points +15%
Intel Core i9-13900K
159676 Points +12%
AMD Ryzen 9 9900X
158102 Points +11%
Intel Core Ultra 9 285K
142132 Points
Intel Core i5-14600K
123679 Points -13%
AMD Ryzen 7 7800X3D
121911 Points -14%
Intel Core i5-13600K
120485 Points -15%
AMD Ryzen 7 9700X
118203 Points -17%
Intel Core i9-12900K
112694 Points -21%
AMD Ryzen 5 9600X
97731 Points -31%
Intel Core i5-12600K
88337 Points -38%
Intel Core Ultra 5 245K
84390 Points -41%
AIDA64 / FPU SinJulia
AMD Ryzen 9 9950X
35251 Points +139%
AMD Ryzen 9 7950X
32823 Points +122%
AMD Ryzen 9 7950X3D
32423 Points +120%
AMD Ryzen 9 9900X
26220 Points +78%
AMD Ryzen 9 7900X
24881 Points +69%
Intel Core i9-14900K
20615 Points +40%
Intel Core i9-13900K
19920 Points +35%
Intel Core i7-14700K
18111 Points +23%
AMD Ryzen 7 9700X
17330 Points +17%
AMD Ryzen 7 7800X3D
15299 Points +4%
Intel Core Ultra 9 285K
14755 Points
Intel Core i9-12900K
14664 Points -1%
AMD Ryzen 5 9600X
13269 Points -10%
Intel Core i5-14600K
12663 Points -14%
Intel Core i5-13600K
12201 Points -17%
Intel Core i5-12600K
9510 Points -36%
Intel Core Ultra 5 245K
6443 Points -56%
AIDA64 / FPU Mandel
AMD Ryzen 9 7950X3D
131740 Points +16%
AMD Ryzen 9 9950X
127572 Points +12%
AMD Ryzen 9 7950X
118564 Points +4%
Intel Core Ultra 9 285K
114044 Points
AMD Ryzen 9 7900X
106620 Points -7%
AMD Ryzen 9 9900X
100990 Points -11%
Intel Core i9-14900K
92191 Points -19%
Intel Core i9-13900K
91721 Points -20%
Intel Core i7-14700K
76413 Points -33%
AMD Ryzen 7 7800X3D
65670 Points -42%
AMD Ryzen 7 9700X
62328 Points -45%
Intel Core i5-14600K
58795 Points -48%
Intel Core i5-13600K
57797 Points -49%
AMD Ryzen 5 9600X
54123 Points -53%
Intel Core Ultra 5 245K
50258 Points -56%
Intel Core i9-12900K
38042 Points -67%
Intel Core i5-12600K
24230 Points -79%
AIDA64 / CPU AES
AMD Ryzen 9 9900X
513073 MB/s +103%
AMD Ryzen 9 7950X
377952 MB/s +49%
AMD Ryzen 9 7950X3D
364030 MB/s +44%
AMD Ryzen 7 9700X
321370 MB/s +27%
Intel Core i9-14900K
305071 MB/s +20%
Intel Core i9-13900K
297727 MB/s +18%
AMD Ryzen 9 7900X
279956 MB/s +10%
AMD Ryzen 5 9600X
264125 MB/s +4%
Intel Core Ultra 9 285K
253364 MB/s
Intel Core i5-14600K
181167 MB/s -28%
AMD Ryzen 7 7800X3D
177487 MB/s -30%
Intel Core i5-13600K
175556 MB/s -31%
AMD Ryzen 9 9950X
174821 MB/s -31%
Intel Core i7-14700K
144308 MB/s -43%
Intel Core i9-12900K
94062 MB/s -63%
Intel Core Ultra 5 245K
60360 MB/s -76%
Intel Core i5-12600K
58635 MB/s -77%
AIDA64 / CPU ZLib
AMD Ryzen 9 9950X
2632 MB/s +11%
Intel Core i9-14900K
2562 MB/s +8%
Intel Core i9-13900K
2490 MB/s +5%
AMD Ryzen 9 7950X
2427 MB/s +2%
Intel Core Ultra 9 285K
2380 MB/s
AMD Ryzen 9 7950X3D
2315 MB/s -3%
Intel Core i7-14700K
2148 MB/s -10%
AMD Ryzen 9 9900X
2039 MB/s -14%
AMD Ryzen 9 7900X
1848 MB/s -22%
Intel Core i9-12900K
1560 MB/s -34%
Intel Core i5-14600K
1468 MB/s -38%
Intel Core i5-13600K
1426 MB/s -40%
AMD Ryzen 7 9700X
1272 MB/s -47%
AMD Ryzen 7 7800X3D
1156 MB/s -51%
AMD Ryzen 5 9600X
1050 MB/s -56%
Intel Core i5-12600K
988 MB/s -58%
Intel Core Ultra 5 245K
988 MB/s -58%
AIDA64 / FP64 Ray-Trace
AMD Ryzen 9 9950X
44013 KRay/s +87%
AMD Ryzen 9 9900X
35033 KRay/s +49%
AMD Ryzen 9 7950X
32883 KRay/s +40%
AMD Ryzen 9 7950X3D
31732 KRay/s +35%
Intel Core Ultra 9 285K
23501 KRay/s
AMD Ryzen 7 9700X
21984 KRay/s -6%
Intel Core i9-14900K
20599 KRay/s -12%
Intel Core i9-13900K
20298 KRay/s -14%
AMD Ryzen 5 9600X
19437 KRay/s -17%
AMD Ryzen 9 7900X
18490 KRay/s -21%
Intel Core i7-14700K
17130 KRay/s -27%
AMD Ryzen 7 7800X3D
15690 KRay/s -33%
Intel Core i5-14600K
13236 KRay/s -44%
Intel Core i5-13600K
12806 KRay/s -46%
Intel Core Ultra 5 245K
10486 KRay/s -55%
Intel Core i9-12900K
8078 KRay/s -66%
Intel Core i5-12600K
5149 KRay/s -78%
AIDA64 / CPU PhotoWorxx
Intel Core i9-14900K
55912 MPixel/s +2%
Intel Core i5-14600K
55888 MPixel/s +2%
Intel Core Ultra 9 285K
54680 MPixel/s
Intel Core i7-14700K
54037 MPixel/s -1%
AMD Ryzen 9 7950X3D
53949 MPixel/s -1%
Intel Core i9-13900K
48674 MPixel/s -11%
Intel Core i5-12600K
48577 MPixel/s -11%
Intel Core i5-13600K
48434 MPixel/s -11%
AMD Ryzen 9 9900X
48396 MPixel/s -11%
Intel Core i9-12900K
48307 MPixel/s -12%
AMD Ryzen 9 9950X
47615 MPixel/s -13%
AMD Ryzen 7 7800X3D
46968 MPixel/s -14%
AMD Ryzen 9 7950X
43947 MPixel/s -20%
AMD Ryzen 9 7900X
40893 MPixel/s -25%
AMD Ryzen 7 9700X
40890 MPixel/s -25%
AMD Ryzen 5 9600X
40853 MPixel/s -25%
Intel Core Ultra 5 245K
40535 MPixel/s -26%
PCMark 10 Score
10514 punti
Aiuto

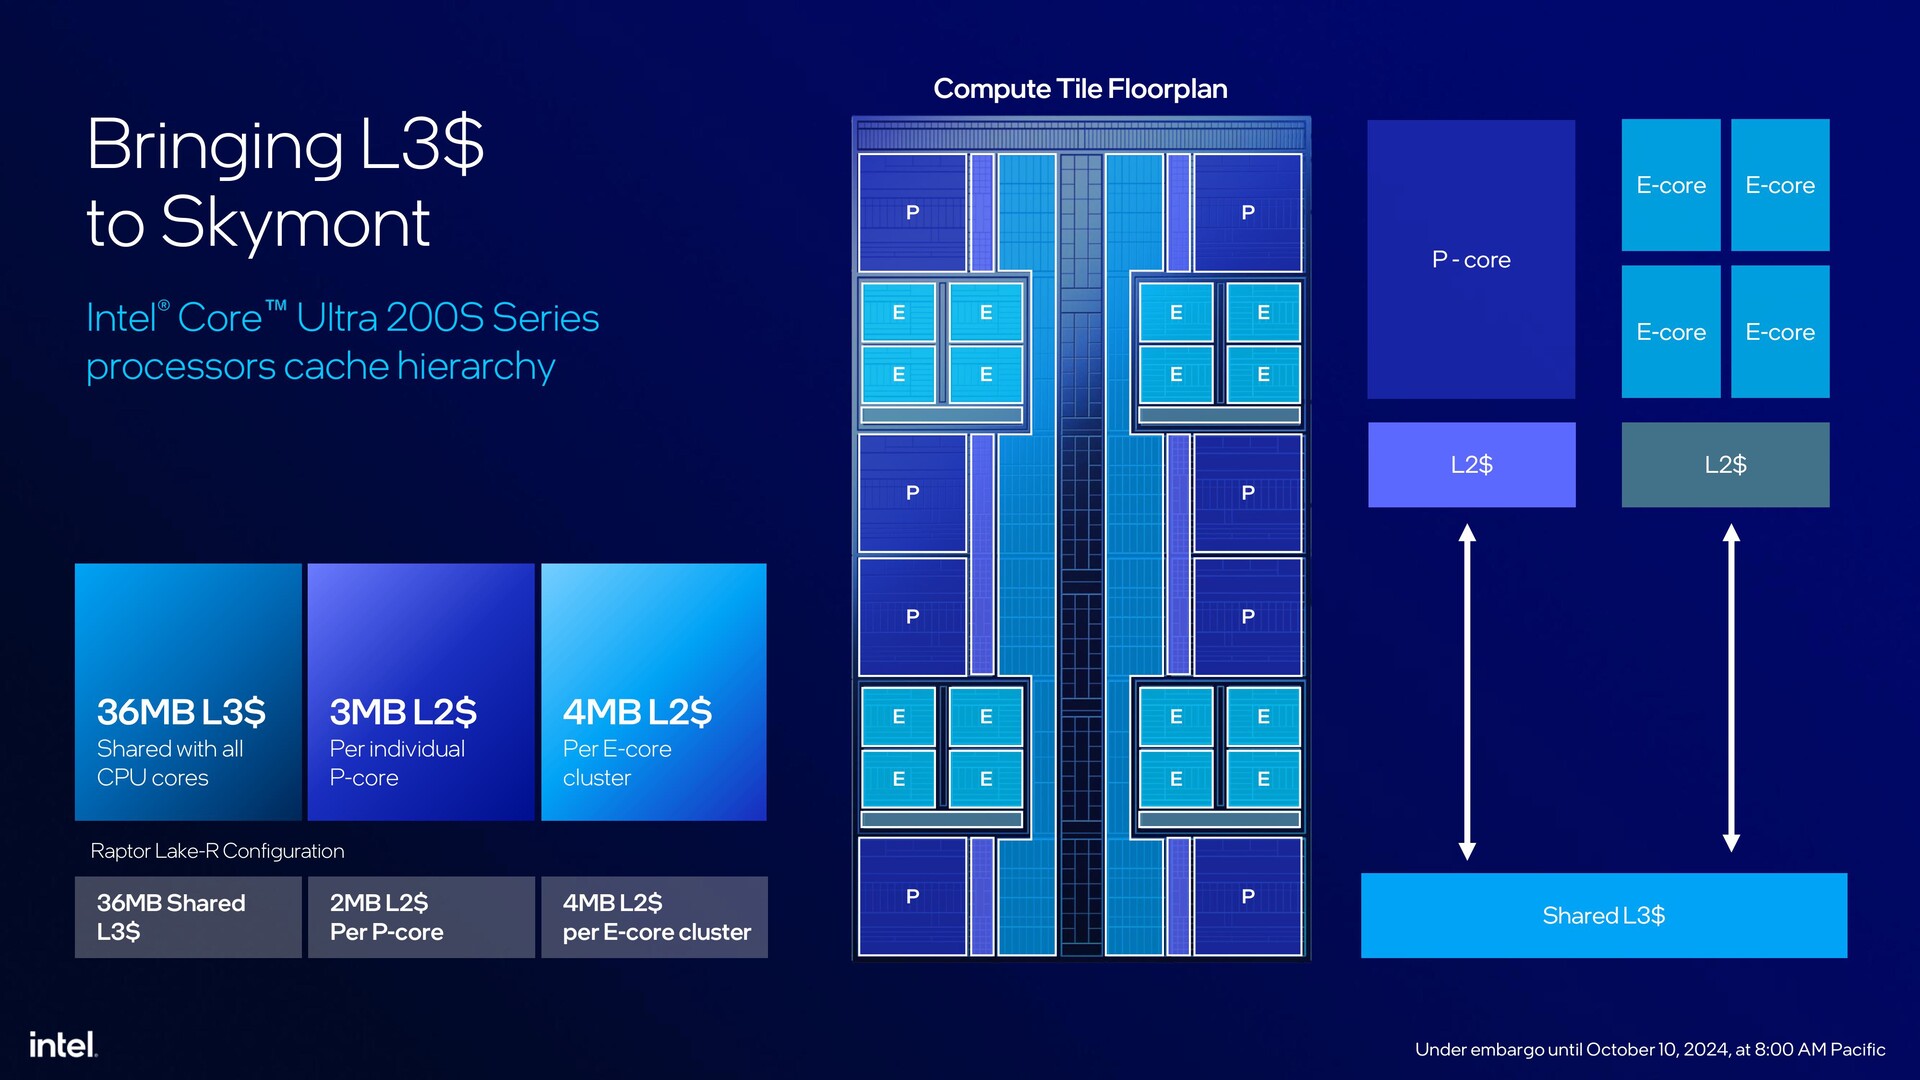
Con Arrow Lake-S, Intel ha optato per un design radicalmente nuovo dei tile di calcolo. I core P e i core E non si trovano più in blocchi contigui con le proprie cache. Invece, gli E-cores sono distribuiti in cluster di quattro tra i P-cores agli angoli del tile.

Tutti i core condividono ora una cache L3 unificata che attraversa il centro della piastrella e un bus ad anello unificato. Questo design dovrebbe teoricamente aiutare a spostare i dati più velocemente tra i core e anche a evitare che il calore si concentri intorno a uno o a un gruppo di core.

Intel Core Ultra 200S: Schema della mattonella di calcolo. (Fonte immagine: Intel)
Intel Core Ultra 9 285K: scatto del dado (Fonte: Tony Yu su Bilibili)
Intel Core Ultra 9 285K: latenza misurata da core a core

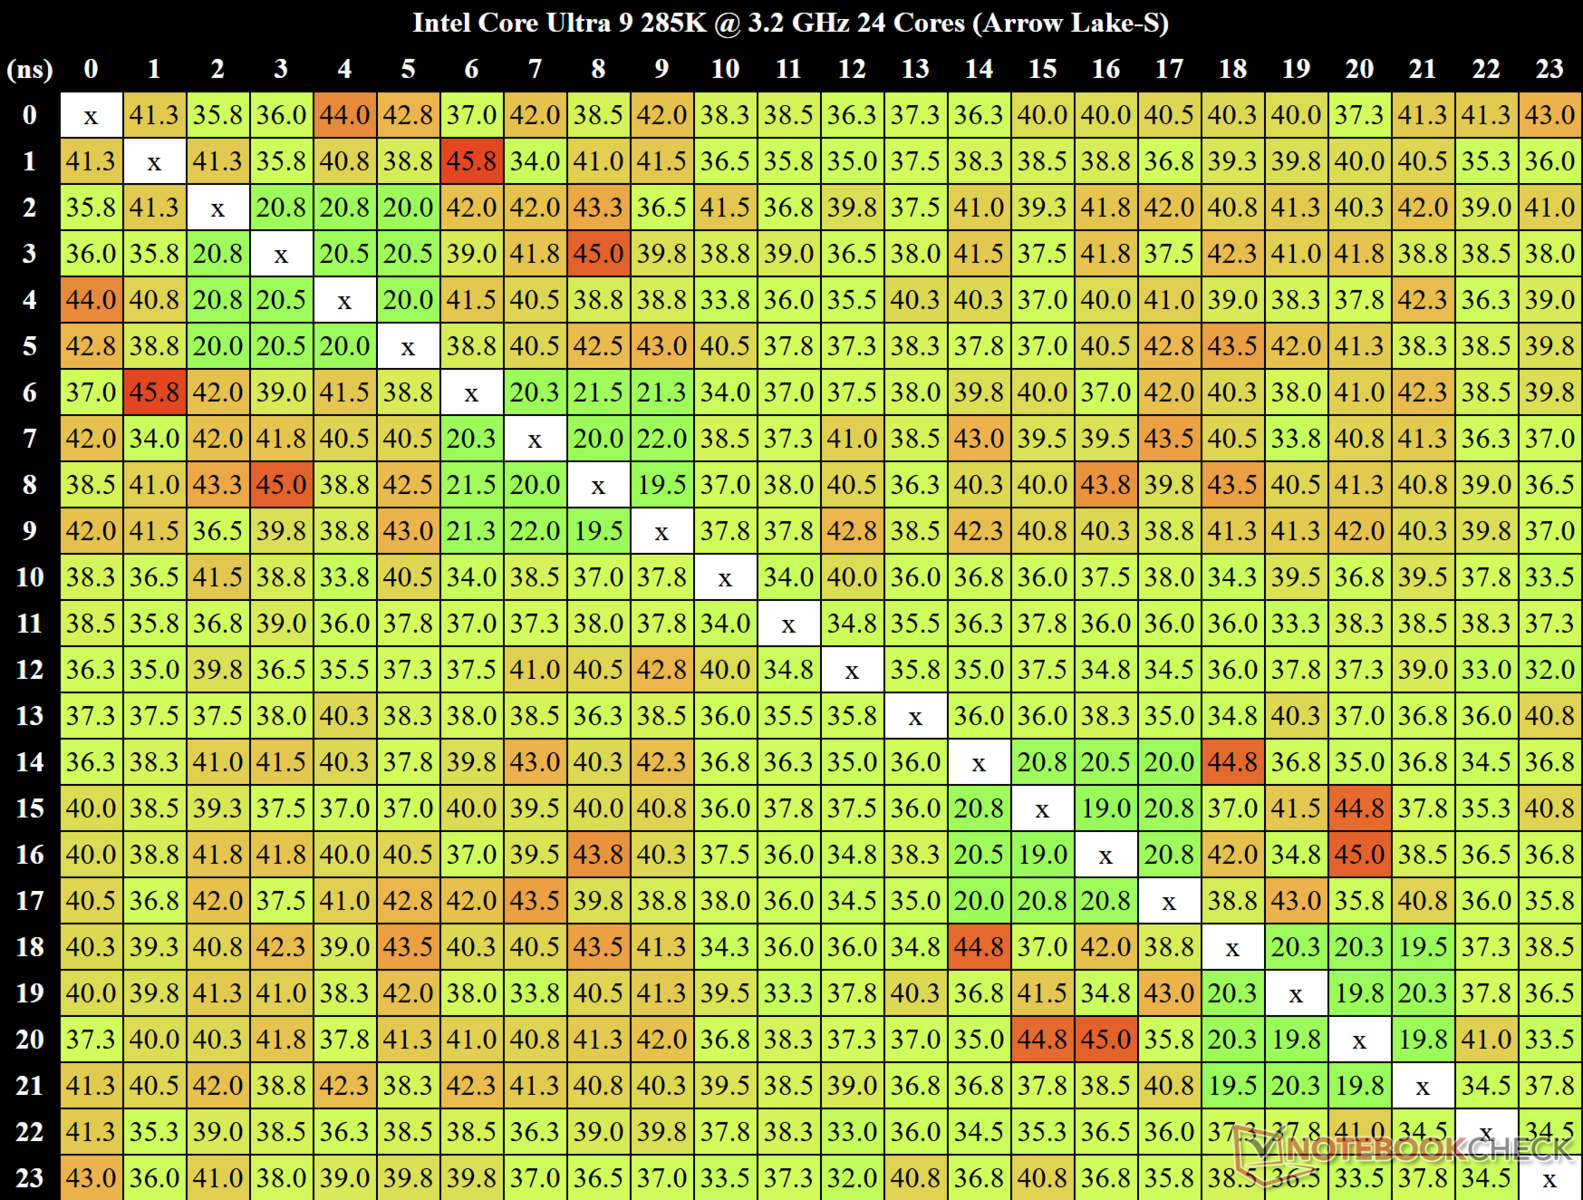
Abbiamo utilizzato MicrobenchX per calcolare la latenza inter-core. Le latenze da core a core arrivano a 45,8 ns tra il Core 2 e il Core 7, il che è indicativo di una possibile lunga latenza durante il trasferimento dei dati dal core E al core E. Tuttavia, i quattro cluster del core E sembrano mostrare una latenza minima, compresa tra 19 ns e 21,3 ns per il trasferimento dei dati all'interno di tali cluster.

Tuttavia, i quattro cluster E-core sembrano mostrare una latenza minima, compresa tra 19 ns e 21,3 ns per il trasferimento dei dati all'interno di questi cluster.

Abbiamo misurato una latenza mediana complessiva da core a core di 38,25 ns.

AIDA64 Memory Performance Rating - Percent
Intel Core i9-12900K -1!
84.1 pt
Intel Core i9-14900K
83.9 pt
Intel Core i7-14700K
83.2 pt
Intel Core i5-12600K -1!
81.7 pt
Intel Core i5-14600K
81.6 pt
Intel Core Ultra 9 285K
80.1 pt
AMD Ryzen 9 7950X3D
78.4 pt
AMD Ryzen 9 7950X
76.6 pt
AMD Ryzen 9 9950X
74.4 pt
Intel Core i9-13900K
73.9 pt
AMD Ryzen 9 9900X
73.9 pt
AMD Ryzen 9 7900X
73.5 pt
AMD Ryzen 7 7800X3D
70.5 pt
Intel Core i5-13600K
69.7 pt
AMD Ryzen 7 9700X
68.5 pt
AMD Ryzen 5 9600X
65.4 pt
Intel Core Ultra 5 245K
51.8 pt
AIDA64
Memory Copy
Intel Core Ultra 9 285K
88386 MB/s
Intel Core i9-14900K
85662 MB/s -3%
Intel Core i7-14700K
85092 MB/s -4%
Intel Core i5-14600K
82790 MB/s -6%
Intel Core i9-13900K
74937 MB/s -15%
AMD Ryzen 9 7950X3D
73868 MB/s -16%
Intel Core i9-12900K
73146 MB/s -17%
AMD Ryzen 9 7950X
73104 MB/s -17%
Intel Core i5-13600K
71725 MB/s -19%
Intel Core i5-12600K
70749 MB/s -20%
AMD Ryzen 9 9950X
70530 MB/s -20%
AMD Ryzen 9 9900X
69921 MB/s -21%
AMD Ryzen 9 7900X
69140 MB/s -22%
AMD Ryzen 7 7800X3D
63242 MB/s -28%
Intel Core Ultra 5 245K
61112 MB/s -31%
AMD Ryzen 7 9700X
59073 MB/s -33%
AMD Ryzen 5 9600X
55115 MB/s -38%
Memory Latency
Intel Core Ultra 5 245K
123.3 ns * -38%
Intel Core Ultra 9 285K
89.3 ns *
Intel Core i5-13600K
81.1 ns * +9%
Intel Core i9-13900K
76.5 ns * +14%
Intel Core i7-14700K
71.5 ns * +20%
Intel Core i9-14900K
70.3 ns * +21%
Intel Core i5-14600K
69.7 ns * +22%
AMD Ryzen 9 9900X
68.7 ns * +23%
AMD Ryzen 9 9950X
68.6 ns * +23%
AMD Ryzen 7 9700X
68.5 ns * +23%
AMD Ryzen 5 9600X
68.1 ns * +24%
AMD Ryzen 7 7800X3D
68 ns * +24%
AMD Ryzen 9 7950X3D
65.6 ns * +27%
AMD Ryzen 9 7900X
63.3 ns * +29%
AMD Ryzen 9 7950X
61.7 ns * +31%
Memory Read
Intel Core i9-14900K
95232 MB/s +3%
Intel Core i7-14700K
94830 MB/s +3%
Intel Core Ultra 9 285K
92063 MB/s
Intel Core i5-14600K
88793 MB/s -4%
Intel Core i9-13900K
83883 MB/s -9%
Intel Core i9-12900K
81059 MB/s -12%
AMD Ryzen 9 7950X3D
80946 MB/s -12%
AMD Ryzen 9 9900X
79594 MB/s -14%
AMD Ryzen 9 9950X
78986 MB/s -14%
AMD Ryzen 9 7950X
78282 MB/s -15%
Intel Core i5-12600K
76864 MB/s -17%
Intel Core i5-13600K
75757 MB/s -18%
AMD Ryzen 9 7900X
75338 MB/s -18%
Intel Core Ultra 5 245K
65415 MB/s -29%
AMD Ryzen 7 7800X3D
62528 MB/s -32%
AMD Ryzen 7 9700X
62369 MB/s -32%
AMD Ryzen 5 9600X
59008 MB/s -36%
Memory Write
AMD Ryzen 7 7800X3D
87412 MB/s +4%
AMD Ryzen 9 7950X3D
85951 MB/s +2%
AMD Ryzen 7 9700X
84869 MB/s +1%
Intel Core Ultra 9 285K
84216 MB/s
Intel Core i5-14600K
84101 MB/s 0%
Intel Core i9-14900K
83670 MB/s -1%
Intel Core i7-14700K
82856 MB/s -2%
AMD Ryzen 5 9600X
80805 MB/s -4%
AMD Ryzen 9 7950X
79843 MB/s -5%
AMD Ryzen 9 9950X
79040 MB/s -6%
AMD Ryzen 9 9900X
77408 MB/s -8%
AMD Ryzen 9 7900X
76967 MB/s -9%
Intel Core i9-13900K
74140 MB/s -12%
Intel Core i5-12600K
73824 MB/s -12%
Intel Core i9-12900K
73707 MB/s -12%
Intel Core i5-13600K
73484 MB/s -13%
Intel Core Ultra 5 245K
60635 MB/s -28%

* ... Meglio usare valori piccoli

3D e prestazioni di gioco: Arrow Lake-S delude alla grande

Ci si aspetterebbe che i vantaggi della mancanza di hyperthreading, dell'Intel APO e dell'aumento dell'IPC, soprattutto sui core Skymont, si traducano in buoni guadagni di gioco. Si prepari a rimanere deluso.

Mentre il Core Ultra 9 285K ha mostrato prestazioni lodevoli della CPU con un fabbisogno energetico relativamente inferiore, la situazione diventa sbilanciata quando si tratta di compiti 3D e di gioco.

Il Core Ultra 9 285K, in combinazione con la GPU Nvidia GeForce RTX 4090, riesce a raccogliere un vantaggio del 13% rispetto al Ryzen 9 9900X in 3DMark 11 Performance GPU e un guadagno del 6% rispetto al Ryzen 9 9950X in 3DMark Time Spy Graphics.

Tuttavia, il sistema perde significativamente rispetto alle altre offerte Raptor Lake-S Refresh e Zen 5 in 3DMark Fire Strike Graphics, il che lo pone in una posizione di svantaggio generale.

3DMark Performance Rating - Percent
Intel Core i5-14600K
NVIDIA GeForce RTX 4090
97.5 pt
AMD Ryzen 7 7800X3D
NVIDIA GeForce RTX 4090
93.7 pt
AMD Ryzen 5 9600X
NVIDIA GeForce RTX 4090
92.3 pt
Intel Core Ultra 5 245K
NVIDIA GeForce RTX 4090
91.9 pt
AMD Ryzen 7 9700X
NVIDIA GeForce RTX 4090
90.6 pt
Intel Core i9-14900K
NVIDIA GeForce RTX 4090
90.1 pt
AMD Ryzen 9 7950X3D
NVIDIA GeForce RTX 4090
90.1 pt
Intel Core i7-14700K
NVIDIA GeForce RTX 4090
89.3 pt
AMD Ryzen 9 9950X
NVIDIA GeForce RTX 4090
86.7 pt
AMD Ryzen 9 9900X
NVIDIA GeForce RTX 4090
84.5 pt
Intel Core Ultra 9 285K
NVIDIA GeForce RTX 4090
80.3 pt
3DMark 11 - 1280x720 Performance GPU
AMD Ryzen 7 7800X3D
NVIDIA GeForce RTX 4090
114641 Points +20%
Intel Core i5-14600K
NVIDIA GeForce RTX 4090
110994 Points +16%
AMD Ryzen 9 7950X3D
NVIDIA GeForce RTX 4090
105886 Points +10%
Intel Core i9-14900K
NVIDIA GeForce RTX 4090
104998 Points +10%
Intel Core Ultra 5 245K
NVIDIA GeForce RTX 4090
104781 Points +9%
AMD Ryzen 5 9600X
NVIDIA GeForce RTX 4090
104516 Points +9%
Intel Core i7-14700K
NVIDIA GeForce RTX 4090
103598 Points +8%
AMD Ryzen 9 9950X
NVIDIA GeForce RTX 4090
100037 Points +4%
AMD Ryzen 7 9700X
NVIDIA GeForce RTX 4090
99851 Points +4%
Intel Core Ultra 9 285K
NVIDIA GeForce RTX 4090
95851 Points
AMD Ryzen 9 9900X
NVIDIA GeForce RTX 4090
85108 Points -11%
3DMark
2560x1440 Time Spy Graphics
Intel Core i5-14600K
NVIDIA GeForce RTX 4090
37769 Points +7%
Intel Core i9-14900K
NVIDIA GeForce RTX 4090
37762 Points +7%
AMD Ryzen 7 7800X3D
NVIDIA GeForce RTX 4090
37664 Points +7%
Intel Core i7-14700K
NVIDIA GeForce RTX 4090
37589 Points +7%
AMD Ryzen 5 9600X
NVIDIA GeForce RTX 4090
37161 Points +6%
Intel Core Ultra 5 245K
NVIDIA GeForce RTX 4090
36813 Points +5%
AMD Ryzen 9 7950X3D
NVIDIA GeForce RTX 4090
36665 Points +4%
AMD Ryzen 7 9700X
NVIDIA GeForce RTX 4090
36564 Points +4%
AMD Ryzen 9 9900X
NVIDIA GeForce RTX 4090
36395 Points +3%
Intel Core Ultra 9 285K
NVIDIA GeForce RTX 4090
35166 Points
AMD Ryzen 9 9950X
NVIDIA GeForce RTX 4090
33198 Points -6%
1920x1080 Fire Strike Graphics
Intel Core i5-14600K
NVIDIA GeForce RTX 4090
86031 Points +48%
AMD Ryzen 7 9700X
NVIDIA GeForce RTX 4090
79185 Points +36%
AMD Ryzen 5 9600X
NVIDIA GeForce RTX 4090
78579 Points +35%
Intel Core Ultra 5 245K
NVIDIA GeForce RTX 4090
78079 Points +35%
AMD Ryzen 9 9950X
NVIDIA GeForce RTX 4090
76388 Points +32%
AMD Ryzen 9 9900X
NVIDIA GeForce RTX 4090
74552 Points +28%
AMD Ryzen 7 7800X3D
NVIDIA GeForce RTX 4090
73447 Points +27%
AMD Ryzen 9 7950X3D
NVIDIA GeForce RTX 4090
72901 Points +26%
Intel Core i9-14900K
NVIDIA GeForce RTX 4090
70971 Points +22%
Intel Core i7-14700K
NVIDIA GeForce RTX 4090
70246 Points +21%
Intel Core Ultra 9 285K
NVIDIA GeForce RTX 4090
58028 Points
3DMark 11 Performance
62846 punti
3DMark Fire Strike Score
44363 punti
3DMark Time Spy Score
30904 punti
Aiuto

Tendenze simili si riscontrano anche nei giochi. Contrariamente a quanto dichiarato da Intel al momento del lancio, il Core Ultra 9 285K abbinato alla RTX 4090 si posiziona in fondo alla nostra classifica di comparazione dei giochi, a pari merito solo con il Core i7-14700K e con un ritardo significativo rispetto alle offerte Zen 5 (fino al 12%) nei test di gioco cumulativi a 720p Low e 1080p Ultra.

Il Core Ultra 9 285K sembra mostrare dei piccoli guadagni rispetto al Core i7-14700K in Far Cry 5, Dota 2 Reborn e Metro Exodus (non Enhanced Edition), ma le differenze sono minime e le prestazioni complessive sono ancora molto inferiori a quelle dei Core i9-14700K e Core i9-14900K.

Anche il Core i5-14600K sembra essere una CPU da gioco migliore, con un guadagno complessivo del 7% rispetto al Core Ultra 9 285K

Gaming Performance Rating - Percent
AMD Ryzen 7 7800X3D
NVIDIA GeForce RTX 4090
99.3 pt
AMD Ryzen 9 7950X3D
NVIDIA GeForce RTX 4090
92.5 pt
Intel Core i9-14900K
NVIDIA GeForce RTX 4090
89.9 pt
AMD Ryzen 7 9700X
NVIDIA GeForce RTX 4090
87.4 pt
AMD Ryzen 9 9900X
NVIDIA GeForce RTX 4090
86.4 pt
AMD Ryzen 5 9600X
NVIDIA GeForce RTX 4090
85.7 pt
AMD Ryzen 9 9950X
NVIDIA GeForce RTX 4090
84.9 pt
Intel Core i5-14600K
NVIDIA GeForce RTX 4090
81.6 pt
Intel Core i7-14700K
NVIDIA GeForce RTX 4090
76.9 pt
Intel Core Ultra 9 285K
NVIDIA GeForce RTX 4090
76.2 pt
Intel Core Ultra 5 245K
NVIDIA GeForce RTX 4090
67.1 pt
F1 22
1280x720 Ultra Low Preset AA:T AF:16x
AMD Ryzen 7 7800X3D
NVIDIA GeForce RTX 4090
629 (477min, 404P1 - 691max) fps +49%
Intel Core i9-14900K
NVIDIA GeForce RTX 4090
576 (428min, 362P1 - 644max) fps +36%
AMD Ryzen 9 7950X3D
NVIDIA GeForce RTX 4090
564 (406min, 353P1 - 626max) fps +34%
AMD Ryzen 9 9950X
NVIDIA GeForce RTX 4090
532 (367min, 331P1 - 582max) fps +26%
AMD Ryzen 5 9600X
NVIDIA GeForce RTX 4090
507 (370min, 322P1 - 562max) fps +20%
AMD Ryzen 7 9700X
NVIDIA GeForce RTX 4090
497 (363min, 324P1 - 552max) fps +18%
AMD Ryzen 9 9900X
NVIDIA GeForce RTX 4090
494 (363min, 315P1 - 547max) fps +17%
Intel Core i5-14600K
NVIDIA GeForce RTX 4090
463 (344min, 290P1 - 519max) fps +10%
Intel Core i7-14700K
NVIDIA GeForce RTX 4090
435 (343min, 277P1 - 488max) fps +3%
Intel Core Ultra 9 285K
NVIDIA GeForce RTX 4090
422 (321min, 251P1 - 465max) fps
Intel Core Ultra 5 245K
NVIDIA GeForce RTX 4090
328 (258min, 191P1 - 376max) fps -22%
1920x1080 Low Preset AA:T AF:16x
AMD Ryzen 7 7800X3D
NVIDIA GeForce RTX 4090
533 (380min, 288P1 - 637max) fps +49%
AMD Ryzen 9 7950X3D
NVIDIA GeForce RTX 4090
475 (338min, 264P1 - 542max) fps +33%
Intel Core i9-14900K
NVIDIA GeForce RTX 4090
462 (309min, 256P1 - 558max) fps +29%
AMD Ryzen 5 9600X
NVIDIA GeForce RTX 4090
439 (256min, 238P1 - 510max) fps +23%
AMD Ryzen 9 9950X
NVIDIA GeForce RTX 4090
428 (277min, 226P1 - 544max) fps +20%
AMD Ryzen 7 9700X
NVIDIA GeForce RTX 4090
418 (280min, 246P1 - 506max) fps +17%
AMD Ryzen 9 9900X
NVIDIA GeForce RTX 4090
399 (257min, 232P1 - 471max) fps +12%
Intel Core i5-14600K
NVIDIA GeForce RTX 4090
379 (280min, 225P1 - 455max) fps +6%
Intel Core i7-14700K
NVIDIA GeForce RTX 4090
359 (275min, 204P1 - 431max) fps +1%
Intel Core Ultra 9 285K
NVIDIA GeForce RTX 4090
357 (276min, 212P1 - 434max) fps
Intel Core Ultra 5 245K
NVIDIA GeForce RTX 4090
311 (242min, 180P1 - 346max) fps -13%
1920x1080 Ultra High Preset AA:T AF:16x
AMD Ryzen 7 7800X3D
NVIDIA GeForce RTX 4090
221 (196min, 145P1 - 248max) fps +27%
Intel Core i9-14900K
NVIDIA GeForce RTX 4090
217 (156min, 142P1 - 244max) fps +24%
AMD Ryzen 7 9700X
NVIDIA GeForce RTX 4090
213 (130min, 131P1 - 242max) fps +22%
Intel Core i5-14600K
NVIDIA GeForce RTX 4090
210 (169min, 140P1 - 237max) fps +20%
AMD Ryzen 9 7950X3D
NVIDIA GeForce RTX 4090
204 (138min, 120P1 - 232max) fps +17%
AMD Ryzen 5 9600X
NVIDIA GeForce RTX 4090
202 (157min, 133P1 - 233max) fps +16%
AMD Ryzen 9 9900X
NVIDIA GeForce RTX 4090
194.5 (155min, 130P1 - 220max) fps +11%
AMD Ryzen 9 9950X
NVIDIA GeForce RTX 4090
193.3 (148min, 121P1 - 215max) fps +11%
Intel Core i7-14700K
NVIDIA GeForce RTX 4090
187 (149min, 119P1 - 207max) fps +7%
Intel Core Ultra 9 285K
NVIDIA GeForce RTX 4090
174.6 (142min, 115P1 - 193max) fps
Intel Core Ultra 5 245K
NVIDIA GeForce RTX 4090
161 (122min, 105P1 - 183max) fps -8%
Far Cry 5
1280x720 Low Preset AA:T
AMD Ryzen 7 7800X3D
NVIDIA GeForce RTX 4090
344 (220min - 464max) fps +53%
AMD Ryzen 9 7950X3D
NVIDIA GeForce RTX 4090
299 (201min - 390max) fps +33%
Intel Core i9-14900K
NVIDIA GeForce RTX 4090
280 (214min - 355max) fps +24%
AMD Ryzen 9 9900X
NVIDIA GeForce RTX 4090
277 (215min - 357max) fps +23%
AMD Ryzen 5 9600X
NVIDIA GeForce RTX 4090
263 (201min - 342max) fps +17%
AMD Ryzen 7 9700X
NVIDIA GeForce RTX 4090
263 (202min - 350max) fps +17%
Intel Core i5-14600K
NVIDIA GeForce RTX 4090
255 (199min - 343max) fps +13%
AMD Ryzen 9 9950X
NVIDIA GeForce RTX 4090
248 (185min - 322max) fps +10%
Intel Core Ultra 9 285K
NVIDIA GeForce RTX 4090
225 (180min - 283max) fps
Intel Core Ultra 5 245K
NVIDIA GeForce RTX 4090
204 (149min - 271max) fps -9%
Intel Core i7-14700K
NVIDIA GeForce RTX 4090
180 (138min - 249max) fps -20%
1920x1080 Ultra Preset AA:T
AMD Ryzen 7 7800X3D
NVIDIA GeForce RTX 4090
278 (200min - 402max) fps +63%
AMD Ryzen 9 7950X3D
NVIDIA GeForce RTX 4090
248 (186min - 370max) fps +45%
AMD Ryzen 9 9900X
NVIDIA GeForce RTX 4090
223 (160min - 308max) fps +30%
Intel Core i9-14900K
NVIDIA GeForce RTX 4090
217 (159min - 296max) fps +27%
AMD Ryzen 5 9600X
NVIDIA GeForce RTX 4090
203 (152min - 277max) fps +19%
AMD Ryzen 7 9700X
NVIDIA GeForce RTX 4090
202 (147min - 286max) fps +18%
Intel Core i5-14600K
NVIDIA GeForce RTX 4090
196 (146min - 270max) fps +15%
AMD Ryzen 9 9950X
NVIDIA GeForce RTX 4090
194 (144min - 265max) fps +13%
Intel Core Ultra 9 285K
NVIDIA GeForce RTX 4090
171 (126min - 236max) fps
Intel Core Ultra 5 245K
NVIDIA GeForce RTX 4090
156 (120min - 216max) fps -9%
Intel Core i7-14700K
NVIDIA GeForce RTX 4090
154 (115min - 213max) fps -10%
X-Plane 11.11
1280x720 low (fps_test=1)
AMD Ryzen 7 9700X
NVIDIA GeForce RTX 4090
256 fps +35%
AMD Ryzen 9 9900X
NVIDIA GeForce RTX 4090
254 fps +34%
AMD Ryzen 5 9600X
NVIDIA GeForce RTX 4090
245 fps +30%
Intel Core i9-14900K
NVIDIA GeForce RTX 4090
244 fps +29%
Intel Core i5-14600K
NVIDIA GeForce RTX 4090
228 fps +21%
Intel Core i7-14700K
NVIDIA GeForce RTX 4090
227 fps +20%
AMD Ryzen 9 7950X3D
NVIDIA GeForce RTX 4090
225 fps +19%
AMD Ryzen 7 7800X3D
NVIDIA GeForce RTX 4090
219 fps +16%
AMD Ryzen 9 9950X
NVIDIA GeForce RTX 4090
209 fps +11%
Intel Core Ultra 9 285K
NVIDIA GeForce RTX 4090
189.1 fps
Intel Core Ultra 5 245K
NVIDIA GeForce RTX 4090
129.1 fps -32%
1920x1080 high (fps_test=3)
AMD Ryzen 7 7800X3D
NVIDIA GeForce RTX 4090
188.1 fps +34%
AMD Ryzen 9 7950X3D
NVIDIA GeForce RTX 4090
187.1 fps +33%
AMD Ryzen 7 9700X
NVIDIA GeForce RTX 4090
171.8 fps +22%
AMD Ryzen 9 9900X
NVIDIA GeForce RTX 4090
170.9 fps +22%
AMD Ryzen 5 9600X
NVIDIA GeForce RTX 4090
166.1 fps +18%
Intel Core i9-14900K
NVIDIA GeForce RTX 4090
161 fps +15%
AMD Ryzen 9 9950X
NVIDIA GeForce RTX 4090
153.3 fps +9%
Intel Core i7-14700K
NVIDIA GeForce RTX 4090
151.7 fps +8%
Intel Core i5-14600K
NVIDIA GeForce RTX 4090
147.8 fps +5%
Intel Core Ultra 9 285K
NVIDIA GeForce RTX 4090
140.5 fps
Intel Core Ultra 5 245K
NVIDIA GeForce RTX 4090
98.2 fps -30%
Final Fantasy XV Benchmark
1280x720 Lite Quality
AMD Ryzen 5 9600X
NVIDIA GeForce RTX 4090
237 fps +1%
AMD Ryzen 7 7800X3D
NVIDIA GeForce RTX 4090
236 fps +1%
Intel Core i5-14600K
NVIDIA GeForce RTX 4090
236 fps +1%
AMD Ryzen 9 9950X
NVIDIA GeForce RTX 4090
236 fps +1%
Intel Core i9-14900K
NVIDIA GeForce RTX 4090
235 fps 0%
Intel Core i7-14700K
NVIDIA GeForce RTX 4090
235 fps 0%
AMD Ryzen 7 9700X
NVIDIA GeForce RTX 4090
235 fps 0%
Intel Core Ultra 5 245K
NVIDIA GeForce RTX 4090
235 fps 0%
AMD Ryzen 9 9900X
NVIDIA GeForce RTX 4090
235 fps 0%
AMD Ryzen 9 7950X3D
NVIDIA GeForce RTX 4090
234 fps 0%
Intel Core Ultra 9 285K
NVIDIA GeForce RTX 4090
234 fps
1920x1080 High Quality
Intel Core i9-14900K
NVIDIA GeForce RTX 4090
234 fps +3%
AMD Ryzen 7 7800X3D
NVIDIA GeForce RTX 4090
233 fps +2%
Intel Core i5-14600K
NVIDIA GeForce RTX 4090
233 fps +2%
AMD Ryzen 9 7950X3D
NVIDIA GeForce RTX 4090
232 fps +2%
AMD Ryzen 9 9900X
NVIDIA GeForce RTX 4090
230 fps +1%
AMD Ryzen 5 9600X
NVIDIA GeForce RTX 4090
229 fps 0%
Intel Core i7-14700K
NVIDIA GeForce RTX 4090
228 fps 0%
Intel Core Ultra 9 285K
NVIDIA GeForce RTX 4090
228 fps
AMD Ryzen 7 9700X
NVIDIA GeForce RTX 4090
226 fps -1%
AMD Ryzen 9 9950X
NVIDIA GeForce RTX 4090
226 fps -1%
Intel Core Ultra 5 245K
NVIDIA GeForce RTX 4090
219 fps -4%
Dota 2 Reborn
1280x720 min (0/3) fastest
AMD Ryzen 7 7800X3D
NVIDIA GeForce RTX 4090
322.9 (268min) fps +26%
AMD Ryzen 7 9700X
NVIDIA GeForce RTX 4090
319.7 (274min) fps +25%
AMD Ryzen 9 7950X3D
NVIDIA GeForce RTX 4090
314.1 (261.7min) fps +23%
AMD Ryzen 9 9900X
NVIDIA GeForce RTX 4090
312.8 (268.9min) fps +22%
AMD Ryzen 9 9950X
NVIDIA GeForce RTX 4090
305 (258.9min) fps +19%
Intel Core i9-14900K
NVIDIA GeForce RTX 4090
299.9 (248.4min) fps +17%
AMD Ryzen 5 9600X
NVIDIA GeForce RTX 4090
291 (244.2min) fps +14%
Intel Core i5-14600K
NVIDIA GeForce RTX 4090
261.5 (226.3min) fps +2%
Intel Core Ultra 9 285K
NVIDIA GeForce RTX 4090
256 (223.6min) fps
Intel Core i7-14700K
NVIDIA GeForce RTX 4090
239.4 (208min) fps -6%
Intel Core Ultra 5 245K
NVIDIA GeForce RTX 4090
213.7 (189.8min) fps -17%
1920x1080 ultra (3/3) best looking
AMD Ryzen 7 7800X3D
NVIDIA GeForce RTX 4090
267.5 (216.9min) fps +31%
AMD Ryzen 9 7950X3D
NVIDIA GeForce RTX 4090
252.7 (208.9min) fps +24%
AMD Ryzen 9 9900X
NVIDIA GeForce RTX 4090
241.4 (199.9min) fps +18%
AMD Ryzen 9 9950X
NVIDIA GeForce RTX 4090
241 (202.8min) fps +18%
AMD Ryzen 7 9700X
NVIDIA GeForce RTX 4090
239.4 (204.5min) fps +17%
AMD Ryzen 5 9600X
NVIDIA GeForce RTX 4090
233 (200min) fps +14%
Intel Core i9-14900K
NVIDIA GeForce RTX 4090
231.4 (197.9min) fps +13%
Intel Core i5-14600K
NVIDIA GeForce RTX 4090
217 (186.1min) fps +6%
Intel Core Ultra 9 285K
NVIDIA GeForce RTX 4090
204 (167.7min) fps
Intel Core i7-14700K
NVIDIA GeForce RTX 4090
200 (172.6min) fps -2%
Intel Core Ultra 5 245K
NVIDIA GeForce RTX 4090
172.9 (149.5min) fps -15%
The Witcher 3
1024x768 Low Graphics & Postprocessing
AMD Ryzen 9 7950X3D
NVIDIA GeForce RTX 4090
864.7 fps +38%
AMD Ryzen 7 7800X3D
NVIDIA GeForce RTX 4090
858.4 fps +37%
Intel Core i9-14900K
NVIDIA GeForce RTX 4090
829 (31.9min, 380P0.1, 595P1 - 1296max) fps +32%
AMD Ryzen 9 9950X
NVIDIA GeForce RTX 4090
797 (699min, 700.24P1 - 934max) fps +27%
AMD Ryzen 5 9600X
NVIDIA GeForce RTX 4090
762 (66min, 266P0.1, 520P1 - 1355max) fps +22%
AMD Ryzen 7 9700X
NVIDIA GeForce RTX 4090
751 (650min - 945max) fps +20%
AMD Ryzen 9 9900X
NVIDIA GeForce RTX 4090
711 (651min, 652.6P1 - 830max) fps +14%
Intel Core i7-14700K
NVIDIA GeForce RTX 4090
634 (573min, 574.2P1 - 727max) fps +1%
Intel Core i5-14600K
NVIDIA GeForce RTX 4090
632 (29.4min, 209P0.1, 471P1 - 1028max) fps +1%
Intel Core Ultra 9 285K
NVIDIA GeForce RTX 4090
626 (535min, 544.02P1 - 798max) fps
Intel Core Ultra 5 245K
NVIDIA GeForce RTX 4090
536 (23.7min, 212P0.1, 371P1 - 944max) fps -14%
1920x1080 Ultra Graphics & Postprocessing (HBAO+)
Intel Core i5-14600K
NVIDIA GeForce RTX 4090
316 (105.2min, 154.9P0.1, 222P1 - 551max) fps +7%
AMD Ryzen 7 7800X3D
NVIDIA GeForce RTX 4090
314.3 fps +7%
Intel Core i9-14900K
NVIDIA GeForce RTX 4090
314 (65.8min, 172.6P0.1, 242P1 - 579max) fps +7%
Intel Core Ultra 5 245K
NVIDIA GeForce RTX 4090
308 (29.8min, 149.7P0.1, 222P1 - 485max) fps +5%
AMD Ryzen 9 7950X3D
NVIDIA GeForce RTX 4090
305 fps +4%
Intel Core Ultra 9 285K
NVIDIA GeForce RTX 4090
294 (259min, 261.4P1 - 333max) fps
Intel Core i7-14700K
NVIDIA GeForce RTX 4090
287 (259min, 261.1P1 - 328max) fps -2%
AMD Ryzen 5 9600X
NVIDIA GeForce RTX 4090
286 (74.6min, 128.5P0.1, 200P1 - 609max) fps -3%
AMD Ryzen 9 9950X
NVIDIA GeForce RTX 4090
285 (259min, 259.96P1 - 323max) fps -3%
AMD Ryzen 7 9700X
NVIDIA GeForce RTX 4090
283 (259min, 259P1 - 322max) fps -4%
AMD Ryzen 9 9900X
NVIDIA GeForce RTX 4090
274 (248min, 248.6P1 - 312max) fps -7%
GTA V
1024x768 Lowest Settings possible
AMD Ryzen 7 7800X3D
NVIDIA GeForce RTX 4090
188.5 fps +1%
AMD Ryzen 5 9600X
NVIDIA GeForce RTX 4090
188.1 (3min, 200P1 - 713max) fps +1%
AMD Ryzen 9 7950X3D
NVIDIA GeForce RTX 4090
188 (3.25min, 200P1 - 705max) fps +1%
Intel Core i9-14900K
NVIDIA GeForce RTX 4090
187.9 (3.8min, 200P1 - 705max) fps +1%
AMD Ryzen 7 9700X
NVIDIA GeForce RTX 4090
187.9 (7.35min, 200P1 - 714max) fps +1%
AMD Ryzen 9 9900X
NVIDIA GeForce RTX 4090
187.8 (2.72min, 200P1 - 578max) fps 0%
Intel Core i5-14600K
NVIDIA GeForce RTX 4090
187.7 (4.67min, 200P1 - 640max) fps 0%
Intel Core Ultra 5 245K
NVIDIA GeForce RTX 4090
187.7 (4.11min, 200P1 - 547max) fps 0%
Intel Core i7-14700K
NVIDIA GeForce RTX 4090
187.6 (4.85min, 200P1 - 537max) fps 0%
AMD Ryzen 9 9950X
NVIDIA GeForce RTX 4090
187.3 (1.439min, 200P1 - 454max) fps 0%
Intel Core Ultra 9 285K
NVIDIA GeForce RTX 4090
186.9 (1.378min, 142.9P1 - 474max) fps
1920x1080 Highest Settings possible AA:4xMSAA + FX AF:16x
AMD Ryzen 7 7800X3D
NVIDIA GeForce RTX 4090
182 (2.73min, 142.9P1 - 445max) fps +13%
Intel Core i9-14900K
NVIDIA GeForce RTX 4090
170.9 (3.95min, 142.9P1 - 448max) fps +6%
AMD Ryzen 9 9900X
NVIDIA GeForce RTX 4090
170.7 (2.88min, 125P1 - 346max) fps +6%
AMD Ryzen 7 9700X
NVIDIA GeForce RTX 4090
170.4 (3.21min, 125P1 - 355max) fps +6%
AMD Ryzen 5 9600X
NVIDIA GeForce RTX 4090
166.3 (2.04min, 125P1 - 360max) fps +3%
AMD Ryzen 9 9950X
NVIDIA GeForce RTX 4090
164.1 (2.57min, 111.1P1 - 309max) fps +2%
Intel Core i5-14600K
NVIDIA GeForce RTX 4090
162.3 (14.2min, 125P1 - 354max) fps +1%
Intel Core Ultra 9 285K
NVIDIA GeForce RTX 4090
161.3 (2.63min, 111.1P1 - 310max) fps
AMD Ryzen 9 7950X3D
NVIDIA GeForce RTX 4090
160.2 (11.4min, 111.1P1 - 366max) fps -1%
Intel Core i7-14700K
NVIDIA GeForce RTX 4090
151.2 (3.55min, 83.3P1 - 351max) fps -6%
Intel Core Ultra 5 245K
NVIDIA GeForce RTX 4090
149.8 (3.65min, 111.1P1 - 305max) fps -7%
Borderlands 3
1280x720 Very Low Overall Quality (DX11)
AMD Ryzen 7 7800X3D
NVIDIA GeForce RTX 4090
310 fps +48%
AMD Ryzen 9 7950X3D
NVIDIA GeForce RTX 4090
308 fps +47%
Intel Core i9-14900K
NVIDIA GeForce RTX 4090
263 fps +26%
AMD Ryzen 7 9700X
NVIDIA GeForce RTX 4090
247 fps +18%
AMD Ryzen 9 9900X
NVIDIA GeForce RTX 4090
244 fps +17%
AMD Ryzen 9 9950X
NVIDIA GeForce RTX 4090
238 fps +14%
Intel Core i5-14600K
NVIDIA GeForce RTX 4090
237 fps +13%
AMD Ryzen 5 9600X
NVIDIA GeForce RTX 4090
228 fps +9%
Intel Core i7-14700K
NVIDIA GeForce RTX 4090
220 fps +5%
Intel Core Ultra 9 285K
NVIDIA GeForce RTX 4090
209 fps
Intel Core Ultra 5 245K
NVIDIA GeForce RTX 4090
172.1 fps -18%
1920x1080 Very Low Overall Quality (DX11)
AMD Ryzen 9 7950X3D
NVIDIA GeForce RTX 4090
306 fps +51%
AMD Ryzen 7 7800X3D
NVIDIA GeForce RTX 4090
305 fps +50%
Intel Core i9-14900K
NVIDIA GeForce RTX 4090
259 fps +28%
AMD Ryzen 9 9900X
NVIDIA GeForce RTX 4090
250 fps +23%
AMD Ryzen 7 9700X
NVIDIA GeForce RTX 4090
249 fps +23%
AMD Ryzen 9 9950X
NVIDIA GeForce RTX 4090
235 fps +16%
Intel Core i5-14600K
NVIDIA GeForce RTX 4090
233 fps +15%
AMD Ryzen 5 9600X
NVIDIA GeForce RTX 4090
227 fps +12%
Intel Core i7-14700K
NVIDIA GeForce RTX 4090
217 fps +7%
Intel Core Ultra 9 285K
NVIDIA GeForce RTX 4090
203 fps
Intel Core Ultra 5 245K
NVIDIA GeForce RTX 4090
177.6 fps -13%
1920x1080 Badass Overall Quality (DX11)
AMD Ryzen 9 7950X3D
NVIDIA GeForce RTX 4090
242 fps +52%
AMD Ryzen 7 7800X3D
NVIDIA GeForce RTX 4090
241 fps +51%
Intel Core i9-14900K
NVIDIA GeForce RTX 4090
204 fps +28%
AMD Ryzen 7 9700X
NVIDIA GeForce RTX 4090
192.8 fps +21%
AMD Ryzen 9 9900X
NVIDIA GeForce RTX 4090
191.2 fps +20%
Intel Core i5-14600K
NVIDIA GeForce RTX 4090
182 fps +14%
AMD Ryzen 9 9950X
NVIDIA GeForce RTX 4090
181.1 fps +14%
AMD Ryzen 5 9600X
NVIDIA GeForce RTX 4090
178.7 fps +12%
Intel Core i7-14700K
NVIDIA GeForce RTX 4090
170.4 fps +7%
Intel Core Ultra 9 285K
NVIDIA GeForce RTX 4090
159.1 fps
Intel Core Ultra 5 245K
NVIDIA GeForce RTX 4090
138.8 fps -13%
Shadow of the Tomb Raider
1280x720 Lowest Preset
AMD Ryzen 7 7800X3D
NVIDIA GeForce RTX 4090
407 fps +44%
AMD Ryzen 9 7950X3D
NVIDIA GeForce RTX 4090
383 fps +36%
AMD Ryzen 7 9700X
NVIDIA GeForce RTX 4090
335 fps +19%
AMD Ryzen 9 9950X
NVIDIA GeForce RTX 4090
335 fps +19%
Intel Core i9-14900K
NVIDIA GeForce RTX 4090
332 fps +18%
AMD Ryzen 9 9900X
NVIDIA GeForce RTX 4090
327 fps +16%
AMD Ryzen 5 9600X
NVIDIA GeForce RTX 4090
319 fps +13%
Intel Core Ultra 9 285K
NVIDIA GeForce RTX 4090
282 fps
Intel Core i5-14600K
NVIDIA GeForce RTX 4090
281 fps 0%
Intel Core i7-14700K
NVIDIA GeForce RTX 4090
278 fps -1%
Intel Core Ultra 5 245K
NVIDIA GeForce RTX 4090
246 fps -13%
1920x1080 Highest Preset AA:T
AMD Ryzen 7 7800X3D
NVIDIA GeForce RTX 4090
375 fps +39%
AMD Ryzen 9 7950X3D
NVIDIA GeForce RTX 4090
361 fps +34%
Intel Core i9-14900K
NVIDIA GeForce RTX 4090
313 fps +16%
AMD Ryzen 9 9900X
NVIDIA GeForce RTX 4090
306 fps +13%
AMD Ryzen 7 9700X
NVIDIA GeForce RTX 4090
303 fps +12%
AMD Ryzen 9 9950X
NVIDIA GeForce RTX 4090
294 fps +9%
AMD Ryzen 5 9600X
NVIDIA GeForce RTX 4090
283 fps +5%
Intel Core i5-14600K
NVIDIA GeForce RTX 4090
272 fps +1%
Intel Core Ultra 9 285K
NVIDIA GeForce RTX 4090
270 fps
Intel Core i7-14700K
NVIDIA GeForce RTX 4090
266 fps -1%
Intel Core Ultra 5 245K
NVIDIA GeForce RTX 4090
233 fps -14%
Metro Exodus
1280x720 Low Quality AF:4x
AMD Ryzen 7 7800X3D
NVIDIA GeForce RTX 4090
374 (214.41min - 571.76max) fps +25%
AMD Ryzen 7 9700X
NVIDIA GeForce RTX 4090
351 (190.8min - 547.05max) fps +17%
AMD Ryzen 5 9600X
NVIDIA GeForce RTX 4090
349 (182.25min - 551.57max) fps +17%
AMD Ryzen 9 9950X
NVIDIA GeForce RTX 4090
346 (188.11min - 534.47max) fps +16%
AMD Ryzen 9 9900X
NVIDIA GeForce RTX 4090
325 (183.15min - 495.29max) fps +9%
Intel Core i9-14900K
NVIDIA GeForce RTX 4090
319 (166.53min - 527.7max) fps +7%
Intel Core Ultra 9 285K
NVIDIA GeForce RTX 4090
299 (145.39min - 494.8max) fps
Intel Core i5-14600K
NVIDIA GeForce RTX 4090
296 (170.68min - 455.17max) fps -1%
AMD Ryzen 9 7950X3D
NVIDIA GeForce RTX 4090
293 (157.18min - 462.11max) fps -2%
Intel Core i7-14700K
NVIDIA GeForce RTX 4090
289 (165.56min - 442.67max) fps -3%
Intel Core Ultra 5 245K
NVIDIA GeForce RTX 4090
256 (135.37min - 427.35max) fps -14%
1920x1080 Ultra Quality AF:16x
AMD Ryzen 7 7800X3D
NVIDIA GeForce RTX 4090
219 (104.41min - 354.23max) fps +13%
AMD Ryzen 5 9600X
NVIDIA GeForce RTX 4090
218 (90.41min - 345.54max) fps +12%
Intel Core i9-14900K
NVIDIA GeForce RTX 4090
214 (96.03min - 351.12max) fps +10%
AMD Ryzen 7 9700X
NVIDIA GeForce RTX 4090
213 (90.34min - 345.18max) fps +10%
AMD Ryzen 9 9900X
NVIDIA GeForce RTX 4090
211 (94.84min - 333.44max) fps +9%
AMD Ryzen 9 9950X
NVIDIA GeForce RTX 4090
205 (89.97min - 340.37max) fps +6%
Intel Core i5-14600K
NVIDIA GeForce RTX 4090
202 (100.6min - 297.35max) fps +4%
Intel Core i7-14700K
NVIDIA GeForce RTX 4090
194.7 (90.04min - 299.94max) fps 0%
Intel Core Ultra 9 285K
NVIDIA GeForce RTX 4090
193.8 (101.45min - 321.75max) fps
AMD Ryzen 9 7950X3D
NVIDIA GeForce RTX 4090
193.5 (110.2min - 306.94max) fps 0%
Intel Core Ultra 5 245K
NVIDIA GeForce RTX 4090
175.4 (99.36min - 276.55max) fps -9%
F1 2021
1280x720 Ultra Low Preset
AMD Ryzen 7 7800X3D
NVIDIA GeForce RTX 4090
830 (632min, 515P1 - 919max) fps +57%
Intel Core i9-14900K
NVIDIA GeForce RTX 4090
733 (560min, 450P1 - 806max) fps +38%
AMD Ryzen 9 7950X3D
NVIDIA GeForce RTX 4090
682 (522min, 418P1 - 767max) fps +29%
AMD Ryzen 5 9600X
NVIDIA GeForce RTX 4090
669 (451min, 412P1 - 741max) fps +26%
AMD Ryzen 9 9950X
NVIDIA GeForce RTX 4090
662 (489min, 410P1 - 734max) fps +25%
AMD Ryzen 7 9700X
NVIDIA GeForce RTX 4090
642 (470min, 407P1 - 708max) fps +21%
AMD Ryzen 9 9900X
NVIDIA GeForce RTX 4090
631 (466min, 402P1 - 691max) fps +19%
Intel Core i5-14600K
NVIDIA GeForce RTX 4090
562 (468min, 364P1 - 618max) fps +6%
Intel Core i7-14700K
NVIDIA GeForce RTX 4090
547 (425min, 350P1 - 595max) fps +3%
Intel Core Ultra 9 285K
NVIDIA GeForce RTX 4090
530 (401min, 330P1 - 588max) fps
Intel Core Ultra 5 245K
NVIDIA GeForce RTX 4090
386 (318min, 250P1 - 422max) fps -27%
1920x1080 Ultra High Preset + Raytracing AA:T AF:16x
AMD Ryzen 7 7800X3D
NVIDIA GeForce RTX 4090
369 (301min, 276P1 - 395max) fps +59%
Intel Core i9-14900K
NVIDIA GeForce RTX 4090
307 (260min, 234P1 - 327max) fps +32%
AMD Ryzen 7 9700X
NVIDIA GeForce RTX 4090
287 (244min, 221P1 - 309max) fps +24%
AMD Ryzen 5 9600X
NVIDIA GeForce RTX 4090
280 (231min, 211P1 - 307max) fps +21%
Intel Core i5-14600K
NVIDIA GeForce RTX 4090
278 (237min, 198P1 - 299max) fps +20%
AMD Ryzen 9 7950X3D
NVIDIA GeForce RTX 4090
271 (216min, 208P1 - 293max) fps +17%
AMD Ryzen 9 9900X
NVIDIA GeForce RTX 4090
270 (227min, 211P1 - 289max) fps +16%
AMD Ryzen 9 9950X
NVIDIA GeForce RTX 4090
265 (211min, 195P1 - 288max) fps +14%
Intel Core i7-14700K
NVIDIA GeForce RTX 4090
260 (225min, 197P1 - 278max) fps +12%
Intel Core Ultra 9 285K
NVIDIA GeForce RTX 4090
232 (201min, 165P1 - 248max) fps
Intel Core Ultra 5 245K
NVIDIA GeForce RTX 4090
203 (168min, 142P1 - 218max) fps -12%

Anche le impostazioni legate alla GPU come QHD Ultra e UHD Ultra sembrano aver perso l'amore con il Core Ultra 9 285K. Tuttavia, il delta cumulativo delle prestazioni rispetto al Core i9-14900K è ora del 10% a queste impostazioni, rispetto al 15% a risoluzioni più legate alla CPU.

Anche se sarebbe un po' inverosimile affermare che il Core Ultra 9 285K sta imbottigliando la RTX 4090, ci sono opzioni migliori (e più economiche) se il gioco è il suo caso d'uso principale.

Gaming Performance Rating - Percent
AMD Ryzen 7 7800X3D
NVIDIA GeForce RTX 4090
99.4 pt
AMD Ryzen 9 7950X3D
NVIDIA GeForce RTX 4090
95.3 pt
Intel Core i9-14900K
NVIDIA GeForce RTX 4090
95.1 pt
AMD Ryzen 7 9700X
NVIDIA GeForce RTX 4090
91.8 pt
AMD Ryzen 9 9900X
NVIDIA GeForce RTX 4090
91.6 pt
Intel Core i5-14600K
NVIDIA GeForce RTX 4090
91.5 pt
AMD Ryzen 5 9600X
NVIDIA GeForce RTX 4090
91.4 pt
AMD Ryzen 9 9950X
NVIDIA GeForce RTX 4090
89.2 pt
Intel Core i7-14700K
NVIDIA GeForce RTX 4090
86.9 pt
Intel Core Ultra 9 285K
NVIDIA GeForce RTX 4090
85.8 pt
Intel Core Ultra 5 245K
NVIDIA GeForce RTX 4090
83.2 pt
F1 22
2560x1440 Ultra High Preset AA:T AF:16x
AMD Ryzen 7 7800X3D
NVIDIA GeForce RTX 4090
162.9 (140min, 114P1 - 191max) fps +9%
AMD Ryzen 5 9600X
NVIDIA GeForce RTX 4090
162.7 (141min, 119P1 - 186max) fps +9%
Intel Core i9-14900K
NVIDIA GeForce RTX 4090
161.1 (140min, 115P1 - 184max) fps +7%
AMD Ryzen 9 9900X
NVIDIA GeForce RTX 4090
160.8 (136min, 113P1 - 185max) fps +7%
Intel Core i5-14600K
NVIDIA GeForce RTX 4090
160.3 (139min, 112P1 - 182max) fps +7%
AMD Ryzen 7 9700X
NVIDIA GeForce RTX 4090
160 (114min, 112P1 - 185max) fps +7%
AMD Ryzen 9 7950X3D
NVIDIA GeForce RTX 4090
158.9 (138min, 107P1 - 178max) fps +6%
AMD Ryzen 9 9950X
NVIDIA GeForce RTX 4090
155.1 (128min, 107P1 - 178max) fps +3%
Intel Core Ultra 5 245K
NVIDIA GeForce RTX 4090
152.1 (120min, 103P1 - 169max) fps +1%
Intel Core i7-14700K
NVIDIA GeForce RTX 4090
151.1 (130min, 105P1 - 173max) fps +1%
Intel Core Ultra 9 285K
NVIDIA GeForce RTX 4090
149.9 (128min, 103P1 - 170max) fps
3840x2160 Ultra High Preset AA:T AF:16x
AMD Ryzen 9 9900X
NVIDIA GeForce RTX 4090
86.9 (74min, 73P1 - 103max) fps +5%
Intel Core Ultra 5 245K
NVIDIA GeForce RTX 4090
85.5 (74min, 69P1 - 98max) fps +3%
AMD Ryzen 5 9600X
NVIDIA GeForce RTX 4090
85 (73min, 72P1 - 99max) fps +2%
AMD Ryzen 7 9700X
NVIDIA GeForce RTX 4090
84.8 (73min, 72P1 - 98max) fps +2%
AMD Ryzen 7 7800X3D
NVIDIA GeForce RTX 4090
84.5 (72min, 71P1 - 97max) fps +2%
AMD Ryzen 9 9950X
NVIDIA GeForce RTX 4090
84.5 (72min, 71P1 - 98max) fps +2%
Intel Core i5-14600K
NVIDIA GeForce RTX 4090
83.5 (72min, 71P1 - 96max) fps +1%
Intel Core i9-14900K
NVIDIA GeForce RTX 4090
83.4 (72min, 71P1 - 96max) fps 0%
Intel Core Ultra 9 285K
NVIDIA GeForce RTX 4090
83 (70min, 69P1 - 96max) fps
AMD Ryzen 9 7950X3D
NVIDIA GeForce RTX 4090
82.3 (71min, 70P1 - 94max) fps -1%
Intel Core i7-14700K
NVIDIA GeForce RTX 4090
82.3 (71min, 70P1 - 95max) fps -1%
Far Cry 5
2560x1440 Ultra Preset AA:T
AMD Ryzen 7 7800X3D
NVIDIA GeForce RTX 4090
268 (202min - 364max) fps +56%
AMD Ryzen 9 7950X3D
NVIDIA GeForce RTX 4090
246 (178min - 355max) fps +43%
AMD Ryzen 9 9900X
NVIDIA GeForce RTX 4090
219 (158min - 305max) fps +27%
Intel Core i9-14900K
NVIDIA GeForce RTX 4090
216 (164min - 298max) fps +26%
AMD Ryzen 5 9600X
NVIDIA GeForce RTX 4090
203 (148min - 267max) fps +18%
AMD Ryzen 7 9700X
NVIDIA GeForce RTX 4090
203 (151min - 282max) fps +18%
Intel Core i5-14600K
NVIDIA GeForce RTX 4090
195 (148min - 267max) fps +13%
AMD Ryzen 9 9950X
NVIDIA GeForce RTX 4090
193 (146min - 266max) fps +12%
Intel Core Ultra 9 285K
NVIDIA GeForce RTX 4090
172 (124min - 234max) fps
Intel Core i7-14700K
NVIDIA GeForce RTX 4090
155 (118min - 229max) fps -10%
Intel Core Ultra 5 245K
NVIDIA GeForce RTX 4090
155 (120min - 219max) fps -10%
3840x2160 Ultra Preset AA:T
AMD Ryzen 7 7800X3D
NVIDIA GeForce RTX 4090
187 (166min - 215max) fps +15%
Intel Core i9-14900K
NVIDIA GeForce RTX 4090
187 (168min - 216max) fps +15%
AMD Ryzen 9 7950X3D
NVIDIA GeForce RTX 4090
182 (157min - 212max) fps +12%
Intel Core i5-14600K
NVIDIA GeForce RTX 4090
181 (151min - 215max) fps +12%
AMD Ryzen 5 9600X
NVIDIA GeForce RTX 4090
170 (136min - 198max) fps +5%
AMD Ryzen 9 9900X
NVIDIA GeForce RTX 4090
169 (143min - 197max) fps +4%
AMD Ryzen 9 9950X
NVIDIA GeForce RTX 4090
169 (142min - 196max) fps +4%
AMD Ryzen 7 9700X
NVIDIA GeForce RTX 4090
165 (135min - 198max) fps +2%
Intel Core Ultra 9 285K
NVIDIA GeForce RTX 4090
162 (127min - 201max) fps
Intel Core Ultra 5 245K
NVIDIA GeForce RTX 4090
153 (117min - 210max) fps -6%
Intel Core i7-14700K
NVIDIA GeForce RTX 4090
152 (118min - 207max) fps -6%
X-Plane 11.11 - 3840x2160 high (fps_test=3)
AMD Ryzen 7 7800X3D
NVIDIA GeForce RTX 4090
160.5 fps +37%
AMD Ryzen 9 7950X3D
NVIDIA GeForce RTX 4090
158.4 fps +35%
AMD Ryzen 7 9700X
NVIDIA GeForce RTX 4090
142 fps +21%
AMD Ryzen 5 9600X
NVIDIA GeForce RTX 4090
136.6 fps +16%
Intel Core i9-14900K
NVIDIA GeForce RTX 4090
136.3 fps +16%
AMD Ryzen 9 9900X
NVIDIA GeForce RTX 4090
133.5 fps +14%
Intel Core i7-14700K
NVIDIA GeForce RTX 4090
128.2 fps +9%
Intel Core i5-14600K
NVIDIA GeForce RTX 4090
124.6 fps +6%
AMD Ryzen 9 9950X
NVIDIA GeForce RTX 4090
123.1 fps +5%
Intel Core Ultra 9 285K
NVIDIA GeForce RTX 4090
117.3 fps
Intel Core Ultra 5 245K
NVIDIA GeForce RTX 4090
93.4 fps -20%
Final Fantasy XV Benchmark
2560x1440 High Quality
AMD Ryzen 7 7800X3D
NVIDIA GeForce RTX 4090
231 fps +5%
Intel Core i9-14900K
NVIDIA GeForce RTX 4090
229 fps +4%
Intel Core i5-14600K
NVIDIA GeForce RTX 4090
226 fps +2%
AMD Ryzen 9 7950X3D
NVIDIA GeForce RTX 4090
225 fps +2%
AMD Ryzen 9 9950X
NVIDIA GeForce RTX 4090
222 fps 0%
Intel Core Ultra 9 285K
NVIDIA GeForce RTX 4090
221 fps
Intel Core i7-14700K
NVIDIA GeForce RTX 4090
219 fps -1%
AMD Ryzen 5 9600X
NVIDIA GeForce RTX 4090
215 fps -3%
Intel Core Ultra 5 245K
NVIDIA GeForce RTX 4090
214 fps -3%
AMD Ryzen 7 9700X
NVIDIA GeForce RTX 4090
213 fps -4%
AMD Ryzen 9 9900X
NVIDIA GeForce RTX 4090
212 fps -4%
3840x2160 High Quality
Intel Core Ultra 5 245K
NVIDIA GeForce RTX 4090
162.3 fps +5%
Intel Core i9-14900K
NVIDIA GeForce RTX 4090
161.9 fps +5%
Intel Core i5-14600K
NVIDIA GeForce RTX 4090
161.5 fps +5%
Intel Core i7-14700K
NVIDIA GeForce RTX 4090
159.2 fps +3%
AMD Ryzen 7 7800X3D
NVIDIA GeForce RTX 4090
158.2 fps +3%
AMD Ryzen 9 7950X3D
NVIDIA GeForce RTX 4090
157.6 fps +2%
Intel Core Ultra 9 285K
NVIDIA GeForce RTX 4090
154.3 fps
AMD Ryzen 9 9950X
NVIDIA GeForce RTX 4090
152.9 fps -1%
AMD Ryzen 9 9900X
NVIDIA GeForce RTX 4090
151.3 fps -2%
AMD Ryzen 5 9600X
NVIDIA GeForce RTX 4090
150.9 fps -2%
AMD Ryzen 7 9700X
NVIDIA GeForce RTX 4090
148.3 fps -4%
Dota 2 Reborn - 3840x2160 ultra (3/3) best looking
AMD Ryzen 7 7800X3D
NVIDIA GeForce RTX 4090
258.2 (201.3min) fps +32%
AMD Ryzen 9 7950X3D
NVIDIA GeForce RTX 4090
245.4 (195.9min) fps +25%
AMD Ryzen 9 9950X
NVIDIA GeForce RTX 4090
238 (203.3min) fps +21%
AMD Ryzen 7 9700X
NVIDIA GeForce RTX 4090
237.2 (194.3min) fps +21%
AMD Ryzen 9 9900X
NVIDIA GeForce RTX 4090
233.2 (195.2min) fps +19%
Intel Core i9-14900K
NVIDIA GeForce RTX 4090
227.8 (188.3min) fps +16%
AMD Ryzen 5 9600X
NVIDIA GeForce RTX 4090
225 (189.1min) fps +15%
Intel Core i5-14600K
NVIDIA GeForce RTX 4090
211.5 (179.5min) fps +8%
Intel Core i7-14700K
NVIDIA GeForce RTX 4090
198.1 (161.6min) fps +1%
Intel Core Ultra 9 285K
NVIDIA GeForce RTX 4090
196.3 (160.9min) fps
Intel Core Ultra 5 245K
NVIDIA GeForce RTX 4090
168 (143.3min) fps -14%
The Witcher 3 - 3840x2160 Ultra Graphics & Postprocessing (HBAO+)
Intel Core i9-14900K
NVIDIA GeForce RTX 4090
180.1 (98.9min, 123.4P0.1, 150.3P1 - 473max) fps +10%
Intel Core Ultra 5 245K
NVIDIA GeForce RTX 4090
177.5 (113.8min, 145.4P0.1, 162P1 - 312max) fps +9%
AMD Ryzen 7 7800X3D
NVIDIA GeForce RTX 4090
174.8 fps +7%
Intel Core i5-14600K
NVIDIA GeForce RTX 4090
172.6 (94.4min, 106.5P0.1, 142.2P1 - 408max) fps +6%
AMD Ryzen 9 7950X3D
NVIDIA GeForce RTX 4090
171.8 fps +5%
AMD Ryzen 5 9600X
NVIDIA GeForce RTX 4090
168 (64min, 99P0.1, 134.4P1 - 449max) fps +3%
Intel Core i7-14700K
NVIDIA GeForce RTX 4090
164.7 (150min, 150.62P1 - 176max) fps +1%
Intel Core Ultra 9 285K
NVIDIA GeForce RTX 4090
163.2 (146min, 146P1 - 178max) fps
AMD Ryzen 7 9700X
NVIDIA GeForce RTX 4090
160.9 (144min, 145.45P1 - 176max) fps -1%
AMD Ryzen 9 9900X
NVIDIA GeForce RTX 4090
160.4 (148min, 148.3P1 - 173max) fps -2%
AMD Ryzen 9 9950X
NVIDIA GeForce RTX 4090
158 (143min, 143.31P1 - 169max) fps -3%
GTA V
2560x1440 Highest Settings possible AA:4xMSAA + FX AF:16x
AMD Ryzen 7 7800X3D
NVIDIA GeForce RTX 4090
181.1 (6.02min, 142.9P1 - 480max) fps +17%
Intel Core i9-14900K
NVIDIA GeForce RTX 4090
171.9 (4.45min, 142.9P1 - 406max) fps +11%
AMD Ryzen 9 9900X
NVIDIA GeForce RTX 4090
171.3 (4.56min, 125P1 - 356max) fps +11%
AMD Ryzen 7 9700X
NVIDIA GeForce RTX 4090
169.3 (2.93min, 125P1 - 341max) fps +10%
AMD Ryzen 5 9600X
NVIDIA GeForce RTX 4090
166.7 (6.04min, 125P1 - 387max) fps +8%
AMD Ryzen 9 9950X
NVIDIA GeForce RTX 4090
164.4 (2.77min, 125P1 - 304max) fps +7%
Intel Core i5-14600K
NVIDIA GeForce RTX 4090
163.5 (9.19min, 125P1 - 340max) fps +6%
AMD Ryzen 9 7950X3D
NVIDIA GeForce RTX 4090
160.9 (7.74min, 111.1P1 - 368max) fps +4%
Intel Core Ultra 9 285K
NVIDIA GeForce RTX 4090
154.2 (2.83min, 111.1P1 - 325max) fps
Intel Core Ultra 5 245K
NVIDIA GeForce RTX 4090
151.7 (3.63min, 111.1P1 - 294max) fps -2%
Intel Core i7-14700K
NVIDIA GeForce RTX 4090
151.2 (2.91min, 83.3P1 - 363max) fps -2%
3840x2160 Highest Settings possible AA:4xMSAA + FX AF:16x
AMD Ryzen 7 7800X3D
NVIDIA GeForce RTX 4090
146.2 (8.5min, 90.9P1 - 331max) fps +8%
Intel Core i9-14900K
NVIDIA GeForce RTX 4090
146.1 (4.68min, 100P1 - 354max) fps +7%
Intel Core i5-14600K
NVIDIA GeForce RTX 4090
141.9 (11.7min, 100P1 - 301max) fps +4%
AMD Ryzen 9 9900X
NVIDIA GeForce RTX 4090
141.8 (19.1min, 90.9P1 - 286max) fps +4%
AMD Ryzen 5 9600X
NVIDIA GeForce RTX 4090
140.8 (8.91min, 90.9P1 - 270max) fps +4%
AMD Ryzen 7 9700X
NVIDIA GeForce RTX 4090
140.7 (16min, 90.9P1 - 276max) fps +3%
AMD Ryzen 9 7950X3D
NVIDIA GeForce RTX 4090
136.9 (8.24min, 90.9P1 - 318max) fps +1%
Intel Core Ultra 9 285K
NVIDIA GeForce RTX 4090
136 (4.29min, 90.9P1 - 284max) fps
Intel Core Ultra 5 245K
NVIDIA GeForce RTX 4090
135.7 (8.52min, 90.9P1 - 241max) fps 0%
Intel Core i7-14700K
NVIDIA GeForce RTX 4090
133.8 (5.14min, 83.3P1 - 293max) fps -2%
AMD Ryzen 9 9950X
NVIDIA GeForce RTX 4090
125.7 (14.4min, 83.3P1 - 209max) fps -8%
Borderlands 3
2560x1440 Badass Overall Quality (DX11)
AMD Ryzen 7 7800X3D
NVIDIA GeForce RTX 4090
224 fps +42%
AMD Ryzen 9 7950X3D
NVIDIA GeForce RTX 4090
223 fps +41%
Intel Core i9-14900K
NVIDIA GeForce RTX 4090
198.4 fps +25%
AMD Ryzen 7 9700X
NVIDIA GeForce RTX 4090
188.3 fps +19%
AMD Ryzen 9 9900X
NVIDIA GeForce RTX 4090
186.9 fps +18%
Intel Core i5-14600K
NVIDIA GeForce RTX 4090
179.3 fps +13%
AMD Ryzen 9 9950X
NVIDIA GeForce RTX 4090
177.7 fps +12%
Intel Core i7-14700K
NVIDIA GeForce RTX 4090
171.6 fps +8%
AMD Ryzen 5 9600X
NVIDIA GeForce RTX 4090
171.6 fps +8%
Intel Core Ultra 9 285K
NVIDIA GeForce RTX 4090
158.2 fps
Intel Core Ultra 5 245K
NVIDIA GeForce RTX 4090
140.9 fps -11%
3840x2160 Badass Overall Quality (DX11)
Intel Core i9-14900K
NVIDIA GeForce RTX 4090
137.9 fps +8%
AMD Ryzen 7 7800X3D
NVIDIA GeForce RTX 4090
137.4 fps +8%
AMD Ryzen 9 7950X3D
NVIDIA GeForce RTX 4090
136.4 fps +7%
Intel Core i5-14600K
NVIDIA GeForce RTX 4090
136.1 fps +7%
Intel Core i7-14700K
NVIDIA GeForce RTX 4090
132.6 fps +4%
AMD Ryzen 9 9900X
NVIDIA GeForce RTX 4090
132 fps +4%
AMD Ryzen 5 9600X
NVIDIA GeForce RTX 4090
131.8 fps +4%
AMD Ryzen 7 9700X
NVIDIA GeForce RTX 4090
131.5 fps +3%
AMD Ryzen 9 9950X
NVIDIA GeForce RTX 4090
130.5 fps +3%
Intel Core Ultra 9 285K
NVIDIA GeForce RTX 4090
127.3 fps
Intel Core Ultra 5 245K
NVIDIA GeForce RTX 4090
124 fps -3%
Shadow of the Tomb Raider
2560x1440 Highest Preset AA:T
AMD Ryzen 7 7800X3D
NVIDIA GeForce RTX 4090
322 fps +26%
AMD Ryzen 9 7950X3D
NVIDIA GeForce RTX 4090
315 fps +24%
Intel Core i9-14900K
NVIDIA GeForce RTX 4090
293 fps +15%
AMD Ryzen 9 9900X
NVIDIA GeForce RTX 4090
278.1 fps +9%
AMD Ryzen 9 9950X
NVIDIA GeForce RTX 4090
275 fps +8%
AMD Ryzen 7 9700X
NVIDIA GeForce RTX 4090
273 fps +7%
AMD Ryzen 5 9600X
NVIDIA GeForce RTX 4090
267 fps +5%
Intel Core i5-14600K
NVIDIA GeForce RTX 4090
266 fps +4%
Intel Core i7-14700K
NVIDIA GeForce RTX 4090
258 fps +1%
Intel Core Ultra 9 285K
NVIDIA GeForce RTX 4090
255 fps
Intel Core Ultra 5 245K
NVIDIA GeForce RTX 4090
229 fps -10%
3840x2160 Highest Preset AA:T
Intel Core i9-14900K
NVIDIA GeForce RTX 4090
189.7 fps +6%
Intel Core i5-14600K
NVIDIA GeForce RTX 4090
188.8 fps +6%
AMD Ryzen 5 9600X
NVIDIA GeForce RTX 4090
188.1 fps +5%
AMD Ryzen 7 7800X3D
NVIDIA GeForce RTX 4090
187.7 fps +5%
AMD Ryzen 9 7950X3D
NVIDIA GeForce RTX 4090
187.6 fps +5%
Intel Core Ultra 5 245K
NVIDIA GeForce RTX 4090
186.6 fps +5%
AMD Ryzen 9 9900X
NVIDIA GeForce RTX 4090
185.1 fps +4%
AMD Ryzen 7 9700X
NVIDIA GeForce RTX 4090
185 fps +4%
Intel Core i7-14700K
NVIDIA GeForce RTX 4090
180.4 fps +1%
Intel Core Ultra 9 285K
NVIDIA GeForce RTX 4090
178.4 fps
AMD Ryzen 9 9950X
NVIDIA GeForce RTX 4090
177.2 fps -1%
Metro Exodus
2560x1440 Ultra Quality AF:16x
AMD Ryzen 7 7800X3D
NVIDIA GeForce RTX 4090
199.8 (101.33min - 324.25max) fps +12%
Intel Core i9-14900K
NVIDIA GeForce RTX 4090
194.6 (92.87min - 333.22max) fps +10%
AMD Ryzen 5 9600X
NVIDIA GeForce RTX 4090
194.4 (86.13min - 328.84max) fps +9%
AMD Ryzen 7 9700X
NVIDIA GeForce RTX 4090
190.5 (88.41min - 319.18max) fps +7%
Intel Core i5-14600K
NVIDIA GeForce RTX 4090
188.8 (91.88min - 291.97max) fps +6%
AMD Ryzen 9 9900X
NVIDIA GeForce RTX 4090
188.7 (90.82min - 309.5max) fps +6%
Intel Core i7-14700K
NVIDIA GeForce RTX 4090
181.3 (87.39min - 285.47max) fps +2%
AMD Ryzen 9 9950X
NVIDIA GeForce RTX 4090
180.3 (85.69min - 309.5max) fps +1%
AMD Ryzen 9 7950X3D
NVIDIA GeForce RTX 4090
178.9 (99.89min - 271.52max) fps +1%
Intel Core Ultra 9 285K
NVIDIA GeForce RTX 4090
177.7 (81.24min - 295.86max) fps
Intel Core Ultra 5 245K
NVIDIA GeForce RTX 4090
169 (98.55min - 262.95max) fps -5%
3840x2160 Ultra Quality AF:16x
Intel Core i9-14900K
NVIDIA GeForce RTX 4090
143.4 (84.04min - 227.17max) fps +9%
Intel Core i5-14600K
NVIDIA GeForce RTX 4090
142.1 (81.45min - 230.73max) fps +8%
AMD Ryzen 7 7800X3D
NVIDIA GeForce RTX 4090
141.6 (85.41min - 213.31max) fps +8%
AMD Ryzen 9 7950X3D
NVIDIA GeForce RTX 4090
139.4 (76.47min - 227.32max) fps +6%
AMD Ryzen 7 9700X
NVIDIA GeForce RTX 4090
138.6 (75.99min - 226.65max) fps +6%
Intel Core i7-14700K
NVIDIA GeForce RTX 4090
138.5 (76.17min - 231.7max) fps +5%
AMD Ryzen 9 9900X
NVIDIA GeForce RTX 4090
138.1 (77.88min - 220.02max) fps +5%
AMD Ryzen 5 9600X
NVIDIA GeForce RTX 4090
138 (71.03min - 235.4max) fps +5%
Intel Core Ultra 5 245K
NVIDIA GeForce RTX 4090
134.7 (69.85min - 225.07max) fps +3%
Intel Core Ultra 9 285K
NVIDIA GeForce RTX 4090
131.3 (68.99min - 225.89max) fps
AMD Ryzen 9 9950X
NVIDIA GeForce RTX 4090
129.6 (72.65min - 198.26max) fps -1%
F1 2021
2560x1440 Ultra High Preset + Raytracing AA:T AF:16x
AMD Ryzen 7 7800X3D
NVIDIA GeForce RTX 4090
324 (276min, 240P1 - 345max) fps +41%
AMD Ryzen 7 9700X
NVIDIA GeForce RTX 4090
292 (240min, 215P1 - 314max) fps +28%
Intel Core i9-14900K
NVIDIA GeForce RTX 4090
291 (246min, 214P1 - 308max) fps +27%
AMD Ryzen 5 9600X
NVIDIA GeForce RTX 4090
276 (222min, 198P1 - 303max) fps +21%
AMD Ryzen 9 7950X3D
NVIDIA GeForce RTX 4090
271 (223min, 202P1 - 294max) fps +18%
Intel Core i5-14600K
NVIDIA GeForce RTX 4090
268 (219min, 187P1 - 288max) fps +17%
AMD Ryzen 9 9950X
NVIDIA GeForce RTX 4090
268 (219min, 195P1 - 292max) fps +17%
Intel Core i7-14700K
NVIDIA GeForce RTX 4090
257 (218min, 192P1 - 275max) fps +12%
AMD Ryzen 9 9900X
NVIDIA GeForce RTX 4090
256 (189min, 174P1 - 279max) fps +12%
Intel Core Ultra 9 285K
NVIDIA GeForce RTX 4090
229 (196min, 162P1 - 248max) fps
Intel Core Ultra 5 245K
NVIDIA GeForce RTX 4090
201 (170min, 143P1 - 216max) fps -12%
3840x2160 Ultra High Preset + Raytracing AA:T AF:16x
AMD Ryzen 7 7800X3D
NVIDIA GeForce RTX 4090
207 (179min, 176P1 - 230max) fps +4%
AMD Ryzen 9 9950X
NVIDIA GeForce RTX 4090
207 (165min, 166P1 - 230max) fps +4%
AMD Ryzen 5 9600X
NVIDIA GeForce RTX 4090
205 (176min, 168P1 - 232max) fps +3%
AMD Ryzen 9 7950X3D
NVIDIA GeForce RTX 4090
203 (169min, 169P1 - 225max) fps +2%
Intel Core i9-14900K
NVIDIA GeForce RTX 4090
203 (173min, 165P1 - 226max) fps +2%
AMD Ryzen 7 9700X
NVIDIA GeForce RTX 4090
203 (174min, 169P1 - 227max) fps +2%
AMD Ryzen 9 9900X
NVIDIA GeForce RTX 4090
203 (170min, 163P1 - 225max) fps +2%
Intel Core i5-14600K
NVIDIA GeForce RTX 4090
201 (173min, 153P1 - 227max) fps +1%
Intel Core Ultra 9 285K
NVIDIA GeForce RTX 4090
198.2 (171min, 145P1 - 214max) fps
Intel Core Ultra 5 245K
NVIDIA GeForce RTX 4090
196.9 (171min, 139P1 - 211max) fps -1%
Intel Core i7-14700K
NVIDIA GeForce RTX 4090
194.9 (158min, 156P1 - 217max) fps -2%
bassomedioaltoultraQHD DLSSQHD4K DLSS4K FSR4K
GTA V (2015) 186.9 185.6 183.2 161.3 154.2 182.4
The Witcher 3 (2015) 626 584 545 294 251 276
Dota 2 Reborn (2015) 256 230 218 204 196.3
Final Fantasy XV Benchmark (2018) 234 237 228 221 154.3
X-Plane 11.11 (2018) 189.1 172.5 140.5 117.3
Far Cry 5 (2018) 225 194 186 171 172 162
Strange Brigade (2018) 705 557 552 547 501 276
Shadow of the Tomb Raider (2018) 282 273 275 270 255 178.4
Metro Exodus (2019) 299 271 230 193.8 177.7 131.3
Borderlands 3 (2019) 209 183 166.8 159.1 158.2 127.3
F1 2021 (2021) 530 510 486 232 229 198.2
F1 22 (2022) 357 388 373 174.6 149.9 83
F1 23 (2023) 376 394 393 182.9 145.7 127 78.5
Baldur's Gate 3 (2023) 304 293 271 269 225 193.2 131.7
Cyberpunk 2077 2.1 Phantom Liberty (2023) 212 214 195.1 180.3 145.2 73.2
Assassin's Creed Mirage (2023) 287 268 255 198 178 156 125
F1 24 (2024) 373 394 365 184.8 139.9 121 137.2 77
Black Myth: Wukong (2024) 214 162 128 81 89 65 68 42

Consumo di energia: Intel finalmente azzecca l'efficienza energetica

Intel sta presentando l'efficienza energetica come la principale USP di Arrow Lake-S, e abbiamo potuto constatare che il Core Ultra 9 285K è effettivamente all'altezza delle aspettative in questo senso.

Il Core Ultra 9 285K consuma il 37% in meno di energia dalla parete durante l'esecuzione di Cinebench R23 multi-core rispetto al Core i9-14900K, mentre il consumo energetico di Cinebench R23 single-core è inferiore di circa il 27%.

Anche il consumo di energia durante un'esecuzione Prime95 in-place di FFT di grandi dimensioni è inferiore del 29% rispetto a quanto avevamo osservato con il Core i9-14900K, con il Core Ultra 9 285K che si avvicina ai livelli del Core i5-14600K.

Questi guadagni si notano anche nei giochi, con il sistema Core Ultra 9 285K che assorbe il 18% di energia in meno rispetto al Core i9-14900K in The Witcher 3 a 1080p Ultra e il 22% in meno rispetto al Ryzen 9 9950X in Cyberpunk 2077: Phantom Liberty a 1080p Ultra.

Power Consumption: External monitor

0255075100125150175200225250275300325350375400425450Tooltip
Intel Core Ultra 9 285K; Cinebench R15 Multi (external Monitor): Ø356 (355-358)
Intel Core Ultra 9 285K; Cinebench R20 Single (external Monitor): Ø111.3 (108.3-162.9)
Intel Core Ultra 9 285K; Cinebench R20 Multi (external Monitor): Ø336 (331-343)
Intel Core Ultra 9 285K; Cinebench R23 Single (external Monitor): Ø111.2 (106-122.1)
Intel Core Ultra 9 285K; Cinebench R23 Multi (external Monitor): Ø335 (332-339)
Intel Core Ultra 9 285K; Cinebench 2024 Single Power (external Monitor): Ø109 (102.7-216)
Intel Core Ultra 9 285K; Cinebench 2024 Multi Power (external Monitor): Ø328 (311-337)
Intel Core Ultra 9 285K; Prime95 V2810 Stress (external Monitor): Ø379 (374-383)
Intel Core Ultra 9 285K; Idle 1min (external Monitor): Ø76.2 (75.4-79.4)
Intel Core Ultra 9 285K; Cyberpunk 2077 FHD ultra no FSR - external Monitor: Ø446 (440-456)
Power Consumption / Cinebench R15 Multi (external Monitor)
Intel Core i9-14900K, NVIDIA GeForce RTX 4090
548 (545min, 545P1 - 551max) Watt * -54%
Intel Core i9-13900K, NVIDIA GeForce RTX 3090
480 (263min, 277P1 - 553max) Watt * -35%
Intel Core i7-14700K, NVIDIA GeForce RTX 4090
428 (421min, 421P1 - 440max) Watt * -20%
Intel Core Ultra 9 285K, NVIDIA GeForce RTX 4090 (Idle: 76.2 W)
356 (355min, 355P1 - 358max) Watt *
Intel Core i5-14600K, NVIDIA GeForce RTX 4090
329 (323min, 324P1 - 331max) Watt * +8%
Intel Core i9-12900K, NVIDIA Titan RTX (Idle: 70.5 W)
324.4 Watt * +9%
AMD Ryzen 9 7950X, NVIDIA GeForce RTX 3090
320 (235min, 239P1 - 448max) Watt * +10%
AMD Ryzen 9 7900X, NVIDIA GeForce RTX 3090
313 (214min, 221P1 - 406max) Watt * +12%
AMD Ryzen 9 9950X, NVIDIA GeForce RTX 4090 (Idle: 100 W)
313 (309min, 309P1 - 315max) Watt * +12%
Intel Core i5-13600K, NVIDIA GeForce RTX 3090
286 (232min, 235P1 - 343max) Watt * +20%
AMD Ryzen 9 9900X, NVIDIA GeForce RTX 4090 (Idle: 85.1 W)
274 (272min, 272P1 - 277max) Watt * +23%
AMD Ryzen 9 7950X3D, NVIDIA GeForce RTX 4090
273 (264min, 264P1 - 304max) Watt * +23%
Intel Core Ultra 5 245K, NVIDIA GeForce RTX 4090
244 (242min, 242P1 - 246max) Watt * +31%
AMD Ryzen 5 9600X, NVIDIA GeForce RTX 4090
210 (209min, 209P1 - 210max) Watt * +41%
AMD Ryzen 7 7800X3D, NVIDIA GeForce RTX 4090
207 (203min, 203P1 - 216max) Watt * +42%
Intel Core i5-12600K, NVIDIA Titan RTX (Idle: 70.45 W)
205.9 (145min - 213max) Watt * +42%
AMD Ryzen 7 9700X, NVIDIA GeForce RTX 4090 (Idle: 83 W)
174.6 (173.6min, 173.6P1 - 175.1max) Watt * +51%
Power Consumption / Cinebench R23 Single (external Monitor)
AMD Ryzen 7 7800X3D, NVIDIA GeForce RTX 4090
190.8 (180min, 184.6P1 - 261max) Watt * -72%
Intel Core i7-14700K, NVIDIA GeForce RTX 4090
153.6 (149.9min, 150.4P1 - 202max) Watt * -38%
Intel Core i9-14900K, NVIDIA GeForce RTX 4090
151.5 (145.4min, 146.4P1 - 205max) Watt * -36%
Intel Core i5-14600K, NVIDIA GeForce RTX 4090
149.7 (143.8min, 144.7P1 - 227max) Watt * -35%
AMD Ryzen 5 9600X, NVIDIA GeForce RTX 4090
143.5 (139.1min, 139.7P1 - 160.8max) Watt * -29%
AMD Ryzen 9 9950X, NVIDIA GeForce RTX 4090 (100)
139.7 (129.3min, 130.4P1 - 183.3max) Watt * -26%
AMD Ryzen 9 9900X, NVIDIA GeForce RTX 4090 (85.1)
128.2 (124.1min, 125.4P1 - 184.4max) Watt * -15%
Intel Core Ultra 5 245K, NVIDIA GeForce RTX 4090
114.4 (109.6min, 110.8P1 - 170.5max) Watt * -3%
AMD Ryzen 7 9700X, NVIDIA GeForce RTX 4090 (83)
112.2 (110.2min, 110.5P1 - 131.2max) Watt * -1%
Intel Core Ultra 9 285K, NVIDIA GeForce RTX 4090 (76.2)
111.2 (106min, 106.3P1 - 122.1max) Watt *
Power Consumption / Cinebench R23 Multi (external Monitor)
Intel Core i9-14900K, NVIDIA GeForce RTX 4090
531 (470min, 479P1 - 573max) Watt * -59%
Intel Core i7-14700K, NVIDIA GeForce RTX 4090
414 (402min, 402P1 - 450max) Watt * -24%
Intel Core Ultra 9 285K, NVIDIA GeForce RTX 4090 (76.2)
335 (332min, 332P1 - 339max) Watt *
Intel Core i5-14600K, NVIDIA GeForce RTX 4090
332 (329min, 329P1 - 336max) Watt * +1%
AMD Ryzen 9 9950X, NVIDIA GeForce RTX 4090 (100)
316 (312min, 312P1 - 318max) Watt * +6%
AMD Ryzen 9 7950X3D, NVIDIA GeForce RTX 4090
289 (287min, 287P1 - 290max) Watt * +14%
AMD Ryzen 9 9900X, NVIDIA GeForce RTX 4090 (85.1)
275 (274min, 274P1 - 277max) Watt * +18%
Intel Core Ultra 5 245K, NVIDIA GeForce RTX 4090
228 (225min, 225P1 - 232max) Watt * +32%
AMD Ryzen 5 9600X, NVIDIA GeForce RTX 4090
209 (208min, 208P1 - 210max) Watt * +38%
AMD Ryzen 7 7800X3D, NVIDIA GeForce RTX 4090
203 (202min, 202P1 - 204max) Watt * +39%
AMD Ryzen 7 9700X, NVIDIA GeForce RTX 4090 (83)
175.3 (172.5min, 173.4P1 - 176.2max) Watt * +48%
Power Consumption / Prime95 V2810 Stress (external Monitor)
Intel Core i9-14900K, NVIDIA GeForce RTX 4090
537 (508min, 510P1 - 606max) Watt * -42%
Intel Core i9-13900K, NVIDIA GeForce RTX 3090
471 (414min, 427P1 - 561max) Watt * -24%
Intel Core i7-14700K, NVIDIA GeForce RTX 4090
400 (376min, 377P1 - 428max) Watt * -6%
Intel Core Ultra 9 285K, NVIDIA GeForce RTX 4090 (Idle: 76.2 W)
379 (374min, 376P1 - 383max) Watt *
Intel Core i5-14600K, NVIDIA GeForce RTX 4090
370 (349min, 349P1 - 422max) Watt * +2%
Intel Core i5-13600K, NVIDIA GeForce RTX 3090
348 (283min, 288P1 - 496max) Watt * +8%
AMD Ryzen 9 7950X, NVIDIA GeForce RTX 3090
321 (303min, 304P1 - 439max) Watt * +15%
AMD Ryzen 9 7900X, NVIDIA GeForce RTX 3090
319 (310min, 311P1 - 357max) Watt * +16%
AMD Ryzen 9 9950X, NVIDIA GeForce RTX 4090 (Idle: 100 W)
319 (318min, 318P1 - 325max) Watt * +16%
Intel Core i9-12900K, NVIDIA Titan RTX (Idle: 70.5 W)
279.6 (261min - 357max) Watt * +26%
AMD Ryzen 9 9900X, NVIDIA GeForce RTX 4090 (Idle: 85.1 W)
278 (277min, 277P1 - 280max) Watt * +27%
AMD Ryzen 9 7950X3D, NVIDIA GeForce RTX 4090
276 (267min, 267P1 - 329max) Watt * +27%
Intel Core Ultra 5 245K, NVIDIA GeForce RTX 4090
263 (256min, 256P1 - 271max) Watt * +31%
Intel Core i5-12600K, NVIDIA Titan RTX (Idle: 70.45 W)
256.5 (238min - 275max) Watt * +32%
AMD Ryzen 7 7800X3D, NVIDIA GeForce RTX 4090
218 (214min, 215P1 - 223max) Watt * +42%
AMD Ryzen 5 9600X, NVIDIA GeForce RTX 4090
213 (207min, 208P1 - 220max) Watt * +44%
AMD Ryzen 7 9700X, NVIDIA GeForce RTX 4090 (Idle: 83 W)
180.2 (178.9min, 178.9P1 - 181.7max) Watt * +52%
Power Consumption / The Witcher 3 ultra (external Monitor)
Intel Core i5-14600K, NVIDIA GeForce RTX 4090
564 (547min, 549P1 - 586max) Watt * -23%
Intel Core i9-14900K, NVIDIA GeForce RTX 4090
561 (551min, 552P1 - 597max) Watt * -22%
AMD Ryzen 9 7900X, NVIDIA GeForce RTX 3090
555 (547min, 549P1 - 607max) Watt * -21%
AMD Ryzen 9 7950X, NVIDIA GeForce RTX 3090
538 (532min, 532P1 - 570max) Watt * -17%
Intel Core i9-13900K, NVIDIA GeForce RTX 3090
533 (520min, 525P1 - 568max) Watt * -16%
Intel Core i7-14700K, NVIDIA GeForce RTX 4090
531 (516min, 519P1 - 557max) Watt * -16%
AMD Ryzen 9 7950X3D, NVIDIA GeForce RTX 4090
517 (508min, 510P1 - 539max) Watt * -13%
Intel Core i5-13600K, NVIDIA GeForce RTX 3090
500 (491min, 493P1 - 528max) Watt * -9%
AMD Ryzen 7 7800X3D, NVIDIA GeForce RTX 4090
497 (482min, 484P1 - 510max) Watt * -8%
Intel Core Ultra 5 245K, NVIDIA GeForce RTX 4090
492 (455min, 476P1 - 506max) Watt * -7%
AMD Ryzen 9 9950X, NVIDIA GeForce RTX 4090 (Idle: 100 W)
489 (480min, 483P1 - 501max) Watt * -7%
AMD Ryzen 9 9900X, NVIDIA GeForce RTX 4090 (Idle: 85.1 W)
470 (463min, 464P1 - 482max) Watt * -2%
Intel Core i9-12900K, NVIDIA Titan RTX (Idle: 70.5 W)
463 (439min - 490max) Watt * -1%
Intel Core Ultra 9 285K, NVIDIA GeForce RTX 4090 (Idle: 76.2 W)
459 (448min, 450P1 - 491max) Watt *
AMD Ryzen 7 9700X, NVIDIA GeForce RTX 4090 (Idle: 83 W)
441 (430min, 431P1 - 454max) Watt * +4%
Intel Core i5-12600K, NVIDIA Titan RTX (Idle: 70.45 W)
408.9 (401min - 460max) Watt * +11%
Power Consumption
Intel Core Ultra 9 285K, NVIDIA GeForce RTX 4090
446 Watt *
AMD Ryzen 5 9600X, NVIDIA GeForce RTX 4090
561 Watt *
AMD Ryzen 9 9900X, NVIDIA GeForce RTX 4090
507 Watt *
AMD Ryzen 9 9950X, NVIDIA GeForce RTX 4090
572 Watt *
AMD Ryzen 7 9700X, NVIDIA GeForce RTX 4090
475 Watt *
Intel Core Ultra 5 245K, NVIDIA GeForce RTX 4090
425 Watt *

* ... Meglio usare valori piccoli

Questi minori consumi si traducono naturalmente in guadagni di efficienza elevati. Cinebench R15 multi-core vede il Core Ultra 9 285K più efficiente di ben il 61% rispetto al Core i9-14900K, mentre è migliore del 64% in Cinebench R23 multi-core.

Cinebench R23 single-core vede il Core Ultra 9 285K più efficiente del 37% con 21,2 punti per W rispetto ai 15,51 punti per W del Core i9-14900K.

Anche rispetto al Ryzen 9 9950X, il Core Ultra 9 285K mantiene un buon vantaggio dal 32 al 34% nell'efficienza energetica single-core nei test single-core di Cinebench.

La CPU Arrow Lake-S mostra anche un buon guadagno di efficienza del 14% rispetto al Core i9-14900K durante la riproduzione di The Witcher 3 a 1080p Ultra ed è anche marginalmente migliore di un Ryzen 7 7800X3D sistema.

Power Consumption / Cinebench R15 Multi Efficiency (external Monitor)
AMD Ryzen 9 7950X3D, NVIDIA GeForce RTX 4090
21.9 Points per Watt +18%
AMD Ryzen 9 9950X, NVIDIA GeForce RTX 4090
20.2 Points per Watt +9%
Intel Core Ultra 9 285K, NVIDIA GeForce RTX 4090
18.5 Points per Watt
AMD Ryzen 9 9900X, NVIDIA GeForce RTX 4090
18.3 Points per Watt -1%
Intel Core Ultra 5 245K, NVIDIA GeForce RTX 4090
15.8 Points per Watt -15%
AMD Ryzen 7 7800X3D, NVIDIA GeForce RTX 4090
14.4 Points per Watt -22%
Intel Core i7-14700K, NVIDIA GeForce RTX 4090
12.8 Points per Watt -31%
AMD Ryzen 5 9600X, NVIDIA GeForce RTX 4090
12.5 Points per Watt -32%
Intel Core i9-14900K, NVIDIA GeForce RTX 4090
11.5 Points per Watt -38%
Intel Core i5-14600K, NVIDIA GeForce RTX 4090
11.1 Points per Watt -40%
Power Consumption / Cinebench R23 Single Power Efficiency - external Monitor
Intel Core Ultra 9 285K, NVIDIA GeForce RTX 4090
21.2 Points per Watt
Intel Core Ultra 5 245K, NVIDIA GeForce RTX 4090
18.6 Points per Watt -12%
AMD Ryzen 9 9900X, NVIDIA GeForce RTX 4090
17.6 Points per Watt -17%
AMD Ryzen 9 9950X, NVIDIA GeForce RTX 4090
15.8 Points per Watt -25%
Intel Core i9-14900K, NVIDIA GeForce RTX 4090
15.51 Points per Watt -27%
AMD Ryzen 5 9600X, NVIDIA GeForce RTX 4090
15.2 Points per Watt -28%
Intel Core i7-14700K, NVIDIA GeForce RTX 4090
14 Points per Watt -34%
Intel Core i5-14600K, NVIDIA GeForce RTX 4090
13.8 Points per Watt -35%
AMD Ryzen 7 7800X3D, NVIDIA GeForce RTX 4090
9.54 Points per Watt -55%
Power Consumption / Cinebench R23 Multi Power Efficiency - external Monitor
AMD Ryzen 9 9950X, NVIDIA GeForce RTX 4090
129.5 Points per Watt +2%
Intel Core Ultra 9 285K, NVIDIA GeForce RTX 4090
127.5 Points per Watt
AMD Ryzen 9 7950X3D, NVIDIA GeForce RTX 4090
125.6 Points per Watt -1%
AMD Ryzen 9 9900X, NVIDIA GeForce RTX 4090
117 Points per Watt -8%
Intel Core Ultra 5 245K, NVIDIA GeForce RTX 4090
109.9 Points per Watt -14%
AMD Ryzen 7 7800X3D, NVIDIA GeForce RTX 4090
89.1 Points per Watt -30%
Intel Core i7-14700K, NVIDIA GeForce RTX 4090
86.7 Points per Watt -32%
AMD Ryzen 5 9600X, NVIDIA GeForce RTX 4090
82.2 Points per Watt -36%
Intel Core i9-14900K, NVIDIA GeForce RTX 4090
77.57 Points per Watt -39%
Intel Core i5-14600K, NVIDIA GeForce RTX 4090
73.8 Points per Watt -42%
Power Consumption / Cinebench 2024 Single Power Efficiency - external Monitor
Intel Core Ultra 9 285K, NVIDIA GeForce RTX 4090
1.321 Points per Watt
AMD Ryzen 9 9900X, NVIDIA GeForce RTX 4090
1.095 Points per Watt -17%
AMD Ryzen 9 9950X, NVIDIA GeForce RTX 4090
0.997 Points per Watt -25%
Power Consumption / Cinebench 2024 Multi Power Efficiency - external Monitor
Intel Core Ultra 9 285K, NVIDIA GeForce RTX 4090
7.43 Points per Watt
AMD Ryzen 9 9950X, NVIDIA GeForce RTX 4090
7.18 Points per Watt -3%
AMD Ryzen 9 9900X, NVIDIA GeForce RTX 4090
6.61 Points per Watt -11%
Power Consumption / Witcher 3 ultra Efficiency (external Monitor)
Intel Core Ultra 9 285K, NVIDIA GeForce RTX 4090
0.641 fps per Watt
AMD Ryzen 7 7800X3D, NVIDIA GeForce RTX 4090
0.632 fps per Watt -1%
Intel Core i5-12400F, NVIDIA GeForce RTX 4090
0.627 fps per Watt -2%
Intel Core Ultra 5 245K, NVIDIA GeForce RTX 4090
0.626 fps per Watt -2%
AMD Ryzen 9 7950X3D, NVIDIA GeForce RTX 4090
0.59 fps per Watt -8%
AMD Ryzen 9 9900X, NVIDIA GeForce RTX 4090
0.583 fps per Watt -9%
AMD Ryzen 9 9950X, NVIDIA GeForce RTX 4090
0.583 fps per Watt -9%
AMD Ryzen 9 7950X, NVIDIA GeForce RTX 4090
0.56 fps per Watt -13%
Intel Core i9-14900K, NVIDIA GeForce RTX 4090
0.56 fps per Watt -13%
Intel Core i5-14600K, NVIDIA GeForce RTX 4090
0.56 fps per Watt -13%
Intel Core i5-13400, NVIDIA GeForce RTX 4090
0.557 fps per Watt -13%
Intel Core i7-14700K, NVIDIA GeForce RTX 4090
0.54 fps per Watt -16%
Intel Core i9-14900K, NVIDIA GeForce RTX 4090
0.518 fps per Watt -19%

L'impressione generale di Notebookcheck sul Core Ultra 9 285K

Intel Core Ultra 9 285K. Unità di recensione per gentile concessione di Intel India.

L'Intel Core Ultra 9 285K riesce a offrire i livelli Core i9-14900K di prestazioni CPU grezze a livelli di potenza inferiori.

Le prestazioni di gioco, tuttavia, non sono all'altezza, il che mette in discussione il suo prezzo di 589 dollari.

I giocatori più accaniti potrebbero voler aspettare il lancio dei chip Ryzen 9000X3D all'inizio di novembre prima di spendere i loro soldi.

Transparency

The selection of devices to be reviewed is made by our editorial team. The test sample was provided to the author as a loan by the manufacturer or retailer for the purpose of this review. The lender had no influence on this review, nor did the manufacturer receive a copy of this review before publication. There was no obligation to publish this review. We never accept compensation or payment in return for our reviews. As an independent media company, Notebookcheck is not subjected to the authority of manufacturers, retailers or publishers.

This is how Notebookcheck is testing

Every year, Notebookcheck independently reviews hundreds of laptops and smartphones using standardized procedures to ensure that all results are comparable. We have continuously developed our test methods for around 20 years and set industry standards in the process. In our test labs, high-quality measuring equipment is utilized by experienced technicians and editors. These tests involve a multi-stage validation process. Our complex rating system is based on hundreds of well-founded measurements and benchmarks, which maintains objectivity. Further information on our test methods can be found here.

Please share our article, every link counts!
> Recensioni e prove di notebook, tablets e smartphones > Recensioni e prove > Recensioni e prove > Recensione di Intel Core Ultra 9 285K Arrow Lake-S: la CPU da 589 dollari sacrifica la corona di gioco per eguagliare AMD Zen 5 Ryzen 9000 nell'efficienza energetica
Vaidyanathan Subramaniam, 2024-10-25 (Update: 2024-10-25)