Recensione dell'Intel Core Ultra 9 285K Arrow Lake-S: la CPU da 589 dollari sacrifica la corona del gaming per eguagliare l'AMD Zen 5 Ryzen 9000 nell'efficienza energetica
Efficiente dal punto di vista energetico, ma carente dal punto di vista dei giochi.
Il nuovo Arrow Lake-S Core Ultra 9 285 di Intel introduce un nuovo layout di tile di calcolo che sacrifica l'hyperthreading e mira a conquistare gli appassionati con miglioramenti significativi dell'efficienza. Sebbene il Core Ultra 9 285K sia effettivamente all'altezza delle prestazioni e dell'efficienza della CPU grezza, perde nettamente rispetto alle offerte di Intel Raptor Lake-S Refresh e AMD Zen 5 Ryzen 9000 nei giochi.Vaidyanathan Subramaniam (traduzione a cura di DeepL / Ninh Duy) Pubblicato 🇺🇸 🇩🇪 ...
Verdetto: il gioco di efficienza di Intel si scontra con un problema di gioco
I chip desktop di Intel non sono esattamente noti per la loro efficienza, ma l'azienda spera di riscrivere la narrativa con il lancio di Arrow Lake-S di oggi.
La nuova linea Arrow Lake-S di Intel, guidata dal Core Ultra 9 285K, segna un cambiamento significativo con l'eliminazione dell'hyperthreading in tutti i modelli - una prima volta dall'era del Pentium 4. Nei benchmark cumulativi delle CPU, il Core Ultra 9 285K eguaglia il Core i9-14900K e raggiunge quasi i livelli di prestazioni di Ryzen 9 9950X.
Detto questo, vediamo che il Core Ultra 9 285K supera entrambe queste CPU nei singoli benchmark single e multi-core.
Ciò che ci è piaciuto in particolare è la capacità di Arrow Lake-S di ottenere prestazioni pari o addirittura leggermente superiori a Raptor Lake-S Refresh, raggiungendo al contempo un'efficienza energetica paragonabile ai processori Zen 5 di AMD.
Tuttavia, nonostante questi progressi, il Core Ultra 9 285K fatica nelle prestazioni di gioco, rimanendo indietro rispetto al Core i9-14900K e alle CPU Zen 5 in tutte le risoluzioni testate.
Il Core Ultra 9 285K si limita a competere solo con il Core i7-14700K nei giochi. Questo è sorprendente, viste le ottimizzazioni APO integrate di Arrow Lake-S e la mancanza dell'hyperthreading, che in teoria avrebbe dovuto aiutare la CPU a ottenere punteggi di gioco migliori.
La nuova piattaforma richiede anche investimenti aggiuntivi in nuove schede madri della Serie 800 e nella memoria DDR5, e questo è un aspetto da tenere in considerazione prima dell'aggiornamento.
Pro
Contro
I nostri Top 10
» Top 10 Portatili Multimedia
» Top 10 Portatili Gaming
» Top 10 Portatili Gaming Leggeri
» Top 10 Portatili da Ufficio e Business economici
» Top 10 Portatili Premium da Ufficio/Business
» Top 10 Portatili sotto i 300 Euro
» Top 10 Portatili sotto i 500 Euro
» Top 10 dei Portatili Workstation
» Top 10 Subnotebooks
» Top 10 Ultrabooks
» Top 10 Convertibili
» Top 10 Tablets
» Top 10 Tablets Windows
» Top 10 Smartphones
Prezzo e disponibilità
L'Intel Core Ultra 9 285K sarà disponibile da oggi presso i rivenditori di tutto il mondo al prezzo di 589 dollari. Il Core i9-14900K, ora scontato Core i9-14900K rimane ancora valido se si privilegia l'elaborazione e il gioco, nonostante le lievi penalizzazioni delle prestazioni dovute ai BIOS più recenti.
Il AMD Ryzen 9 9950X(attualmente 709 dollari su Amazon) e Ryzen 9 9900X(429 dollari su Amazon) continuano ad essere alternative eccellenti, senza gli intoppi di gioco del Core Ultra 9 285K.
Price comparison
Sommario
- Verdetto: il gioco di efficienza di Intel si scontra con un problema di gioco
- Il banco di prova: GeForce RTX 4090 è un ottimo abbinamento con il Core Ultra 9 285K
- Prestazioni della CPU: In linea con il Core i9-14900K, con piccoli guadagni rispetto a Ryzen 9 9950X
- Prestazioni del sistema: Alla stessa stregua del Core i9-14900K e dell'AMD Zen 5
- 3D e prestazioni di gioco: Arrow Lake-S delude alla grande
- Consumo di energia: Intel finalmente azzecca l'efficienza energetica
- L'impressione generale di Notebookcheck sul Core Ultra 9 285K
I processori desktop di punta di Intel di 13a e 14a generazione hanno fatto notizia per tutti i motivi sbagliati ragioni sbagliate non molto tempo fa, ma oggi si spera che tutto questo cambi in meglio. Dopo aver iniziato bene con Lunar Lake per i computer portatili, Intel si sta ora concentrando su Arrow Lake-S per i desktop.
Arrow Lake-S, o la serie Core Ultra 200S come vuole il marketing per qualche motivo, segna un cambiamento paradigmatico nella strategia delle CPU desktop di Intel.
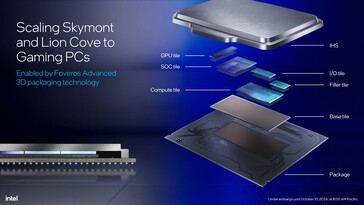
Questa generazione vede l'arrivo del packaging 3D
Foveros di Intel per la prima volta sui desktop, l'utilizzo delle linee di produzione a 3 nm di TSMC invece di quelle di Intel, un nuovo Compute tile con core P Lion Cove riorganizzati e core E Skymont senza hyperthreading, una cache L2 più grande sui core P e l'arrivo dell'iGPU e della NPU Alchemist Xe, entrambi riutilizzati da Meteor Lake. <br />La presenza di tutti questi componenti nella confezione richiede inevitabilmente nuovi requisiti di alimentazione e quindi un nuovo socket. I processori Arrow Lake-S richiedono nuove schede madri della Serie 800 con il nuovo socket LGA 1851. Purtroppo, Intel non ha ancora deciso se le prossime generazioni di CPU utilizzeranno questo nuovo layout dei pin.
A questo si aggiunge anche la necessità di passare completamente alla memoria DDR5, in quanto queste CPU non dispongono del controller di memoria ibrido presente in Raptor Lake-S e Alder Lake-S.
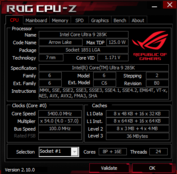
In questa recensione, diamo un'occhiata al nuovo Intel Core Ultra 9 285K e vediamo se le decisioni di Intel in ambito desktop possono rappresentare una sfida sufficiente per le ultime offerte Ryzen 9000 di AMD e i chip di 14esima generazione di Intel.
Una panoramica sui processori desktop Intel Core Ultra 200S Serie Arrow Lake-S
| SKU | Core / Threads | P-Core Clock / Turbo | E-Core Clock / Turbo | Turbo Boost Max 3.0 | Cache L2 totale | Cache L3 | Grafica integrata | NPU Peak TOPS | PBP (PL1) | MTP (PL2) | MSRP |
|---|---|---|---|---|---|---|---|---|---|---|---|
| Intel Core Ultra 9 285K | 24 (8P + 16E) /24 | 3,7 GHz / 5,5 GHz | 3,2 GHz / 4,6 GHz | 5,6 GHz | 40 MB | 36 MB | 4Core Xe, 2,0 GHz | 13 TOPS | 125 W | 250 W | $589 |
| Intel Core Ultra 7 265K | 20 (8P + 12E) /20 | 3,9 GHz / 5,4 GHz | 3,3 GHz / 4,6 GHz | 5,6 GHz | 36 MB | 30 MB | 4 Core Xe, 2,0 GHz | 13 TOPS | 125 W | 250 W | $394 |
| Intel Core Ultra 7 265KF | 20 (8P + 12E) /20 | 3,9 GHz / 5,4 GHz | 3,3 GHz / 4,6 GHz | 5,6 GHz | 36 MB | 30 MB | - | 13 TOPS | 125 W | 250 W | $379 |
| Intel Core Ultra 5 245K | 14 (6P + 8E) /14 | 3,9 GHz / 5,4 GHz | 4,2 GHz / 5,2 GHz | 5,2 GHz | 26 MB | 24 MB | 4 Core Xe, 1,9 GHz | 13 TOPS | 125 W | 159 W | $309 |
| Intel Core Ultra 5 245KF | 14 (6P + 8E) /14 | 3,9 GHz / 5,4 GHz | 4,2 GHz / 5,2 GHz | 5,2 GHz | 26 MB | 24 MB | - | 13 TOPS | 125 W | 159 W | $294 |
Il banco di prova: GeForce RTX 4090 è un ottimo abbinamento con il Core Ultra 9 285K
Abbiamo utilizzato i seguenti componenti per testare il Core Ultra 9 285K:
- Banco di prova aperto Cooler Master MasterFrame 700
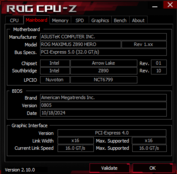
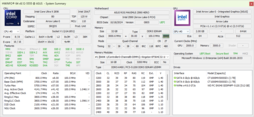
- Scheda madre Asus ROG Maximus Z890 Hero con versione BIOS 0805
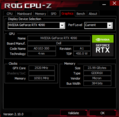
- Nvidia GeForce RTX 4090 Founders Edition GPU
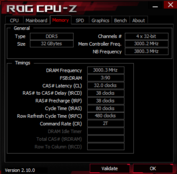
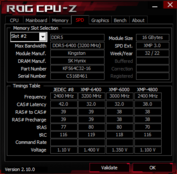
- 2x 16 GB di RAM Kingston Fury Beast DDR5-6400 in esecuzione a DDR5-6000 con temporizzazioni 32-38-38-80 a 1,35 V
- Western Digital PC SN540 512 GB NVMe SSD e 2x Crucial MX500 1 TB SATA SSD per OS, benchmark e giochi
- Monitor Alienware AW3225QF 4K 240 Hz QD-OLED
- Thermaltake TH420 V2 Ultra EX ARGB Raffreddatore AiO
- Alimentatore Cooler Master MVE Gold V2 1250 ATX 3.0 completamente modulare
Desideriamo ringraziare Intel per aver fornito il campione di prova Core Ultra 9 285K, Nvidia per la GPU RTX 4090 Founders Edition, Asus per la scheda madre ROG Maximus Z890 Hero, Dell per il monitor AW3225QF, Kingston per il kit di memoria DDR5, Thermaltake per il TH420 V2 Ultra EX AIO e infine Cooler Master per il banco di prova e l'alimentatore.
Tutti i test sono stati eseguiti su un'installazione fresca di Windows 11 24H2 (Build 26100.2033) insieme agli ultimi driver della piattaforma e al driver Nvidia Game Ready Driver 566.03.
Abbiamo utilizzato le impostazioni predefinite di Intel per le prestazioni nel BIOS e abbiamo impostato il piano di alimentazione di Windows su Prestazioni Ultimate, che imposta PL1=PL2=250 W.
Prestazioni della CPU: In linea con il Core i9-14900K, con piccoli guadagni rispetto a Ryzen 9 9950X
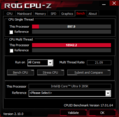
I test cumulativi della CPU vedono il Core Ultra 9 285K alla pari con il Core i9-14900K e solo leggermente in ritardo rispetto al AMD Ryzen 9 9950X. Ciò è dovuto in gran parte al fatto che il Core Ultra 9 285K è rimasto indietro rispetto al Ryzen 9 9950X in test specifici come Blender 2.79 BMW27 CPU, i test V-Ray, wPrime 2.1 e il benchmark R, anche se le differenze non sono così significative.
Nei test Cinebench single-core, l'Ultra 9 285K riesce a superare leggermente il Core i9-14900K, mentre il
Ryzen 9 9900X e il Ryzen 9 9950X gli rosicchiano i talloni. La situazione è diversa in Geekbench, tuttavia, con i chip Zen 5 che riescono a ottenere guadagni minuscoli rispetto ad Arrow Lake-S.I guadagni multi-core sono più evidenti, con il Core Ultra 9 285K da 24C/24T che mostra guadagni del 4-6% rispetto al Ryzen 9 9950X da 16C/32T nei test multi-core di Cinebench, nonostante la mancanza di hyperthreading. Il Core Ultra 9 285K, il Core i9-14900K e il Ryzen 9 9950X hanno tutti prestazioni comparabili in Geekbench 6.3 multi-core.
| CPU Performance Rating - Percent | |
| AMD Ryzen 9 9950X | |
| Intel Core i9-14900K -1! | |
| Intel Core Ultra 9 285K | |
| AMD Ryzen 9 7950X -2! | |
| Intel Core i9-13900K | |
| AMD Ryzen 9 7950X3D | |
| AMD Ryzen 9 9900X -9! | |
| Intel Core i7-14700K | |
| AMD Ryzen 9 7900X -2! | |
| AMD Ryzen 7 9700X | |
| Intel Core i5-14600K | |
| Intel Core Ultra 5 245K | |
| Intel Core i9-12900K -1! | |
| Intel Core i5-13600K -2! | |
| AMD Ryzen 5 9600X -2! | |
| AMD Ryzen 7 7800X3D -3! | |
| Intel Core i5-12600K -3! | |
* ... Meglio usare valori piccoli
Cinebench R15 Multi Loop
Come i suoi predecessori, il Core Ultra 9 285K non viene fornito con un raffreddatore per CPU nella confezione. Intel afferma che i raffreddatori progettati per LGA 1700 dovrebbero essere compatibili con LGA 1851. Non abbiamo avuto alcun problema nel montare il nostro radiatore Thermaltake TH420 V2 Ultra EX ARGB all-in-one, utilizzando le stesse staffe di montaggio previste per il socket LGA 1700.
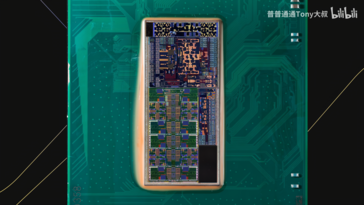
Detto questo, ci aspettiamo di vedere nuovi raffreddatori specifici per LGA 1851 che tengano conto della presenza della piastrella Compute nella parte sud-ovest del pacchetto. I raffreddatori progettati per Arrow Lake-S potrebbero offrire prestazioni di raffreddamento leggermente migliori, ma la soluzione LGA 1700 esistente funzionerà benissimo.
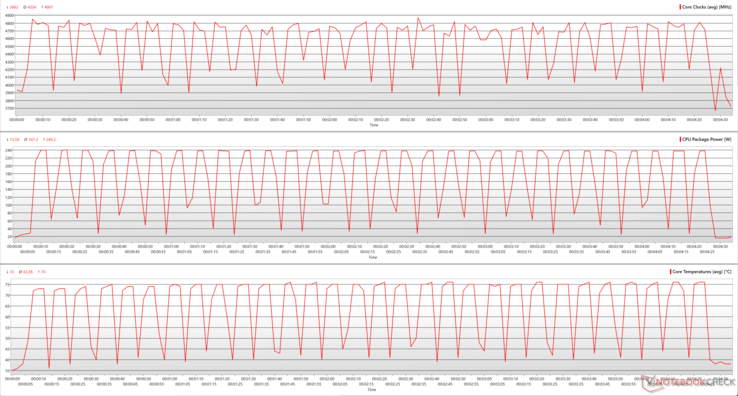
La capacità del TH420 V2 Ultra EX di raffreddare in modo efficiente il Core Ultra 9 285K è evidente dalle prestazioni costanti nel ciclo multi-core Cinebench R15 riportato di seguito.
Vediamo che il Core Ultra 9 285K può aumentare fino a 4,86 GHz durante il loop multi-core di Cinebench R15, con un clock medio di 4,53 GHz.
Queste prestazioni sono ottenute con un consumo di energia del pacchetto di 240 W e una temperatura massima del nucleo di 76 °C, che sono significativamente inferiori ai valori di 349 W e 87 °C del Core i9-14900K. In effetti, anche il Core i7-14700K mostra cifre più alte, con una potenza del package di 313 W e una temperatura del core di 92 °C.
In media, il Core Ultra 9 285K mantiene una potenza del pacchetto di 167 W e una temperatura del nucleo di 63 °C, entrambi inferiori ai valori rispettivi del Core i7-14700K, pari a 195 W e 76 °C.
Prestazioni del sistema: Alla stessa stregua del Core i9-14900K e dell'AMD Zen 5
Le prestazioni complessive del sistema del Core Ultra 9 285K sono paragonabili a quelle del Core i9-14900K e del Ryzen 9 9950X e non si discostano molto da quanto visto con il Ryzen 9 7950X Ryzen 9 7950X, Core i9-13900Ke Ryzen 9 9900X.
I singoli benchmark, tuttavia, mostrano guadagni leggermente migliori con il Core i9-14900K in 3DMark Time Spy CPU, 3DMark 11 Performance Physics e CrossMark. PCMark 10, nel complesso, mette il Core Ultra 9 285K un po' avanti rispetto al Core i9-14900K, ma soprattutto alla pari con AMD Zen 5.
Le CPU AMD hanno un vantaggio particolare nei test CPU AIDA64, ad eccezione di CPU PhotoWorxx, dove il Core Ultra 9 285K ottiene un vantaggio percepibile.
Tuttavia, le normali attività di produttività non hanno problemi nell'uso quotidiano.
3DMark 11: 1280x720 Performance Physics
3DMark: 1920x1080 Fire Strike Physics | 2560x1440 Time Spy CPU
CrossMark: Overall | Responsiveness | Creativity | Productivity
PCMark 10: Score | Essentials | Productivity | Digital Content Creation
AIDA64: FP32 Ray-Trace | FPU Julia | CPU SHA3 | CPU Queen | FPU SinJulia | FPU Mandel | CPU AES | CPU ZLib | FP64 Ray-Trace | CPU PhotoWorxx
| System Performance Rating | |
| AMD Ryzen 9 9950X | |
| Intel Core i9-14900K | |
| Intel Core Ultra 9 285K | |
| AMD Ryzen 9 7950X | |
| AMD Ryzen 9 9900X | |
| Intel Core i9-13900K | |
| AMD Ryzen 9 7950X3D -2! | |
| Intel Core i7-14700K | |
| AMD Ryzen 9 7900X | |
| AMD Ryzen 7 9700X | |
| Intel Core i5-14600K | |
| AMD Ryzen 7 7800X3D | |
| Intel Core i5-13600K | |
| AMD Ryzen 5 9600X | |
| Intel Core Ultra 5 245K | |
| Intel Core i9-12900K -4! | |
| Intel Core i5-12600K -4! | |
| PCMark 10 / Digital Content Creation | |
| Intel Core Ultra 9 285K | |
| AMD Ryzen 9 9950X | |
| AMD Ryzen 9 9900X | |
| AMD Ryzen 7 9700X | |
| Intel Core i9-14900K | |
| Intel Core Ultra 5 245K | |
| AMD Ryzen 5 9600X | |
| Intel Core i7-14700K | |
| AMD Ryzen 9 7900X | |
| AMD Ryzen 9 7950X | |
| Intel Core i9-13900K | |
| Intel Core i5-14600K | |
| AMD Ryzen 7 7800X3D | |
| Intel Core i5-13600K | |
| Intel Core i9-12900K | |
| Intel Core i5-12600K | |
3DMark 11: 1280x720 Performance Physics
3DMark: 1920x1080 Fire Strike Physics | 2560x1440 Time Spy CPU
CrossMark: Overall | Responsiveness | Creativity | Productivity
PCMark 10: Score | Essentials | Productivity | Digital Content Creation
AIDA64: FP32 Ray-Trace | FPU Julia | CPU SHA3 | CPU Queen | FPU SinJulia | FPU Mandel | CPU AES | CPU ZLib | FP64 Ray-Trace | CPU PhotoWorxx
| PCMark 10 Score | 10514 punti | |
Aiuto | ||
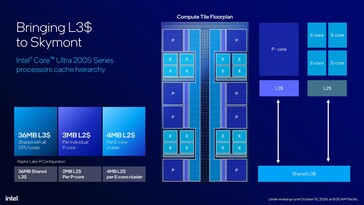
Con Arrow Lake-S, Intel ha optato per un design radicalmente nuovo dei tile di calcolo. I core P e i core E non si trovano più in blocchi contigui con le proprie cache. Invece, gli E-cores sono distribuiti in cluster di quattro tra i P-cores agli angoli del tile.
Tutti i core condividono ora una cache L3 unificata che attraversa il centro della piastrella e un bus ad anello unificato. Questo design dovrebbe teoricamente aiutare a spostare i dati più velocemente tra i core e anche a evitare che il calore si concentri intorno a uno o a un gruppo di core.
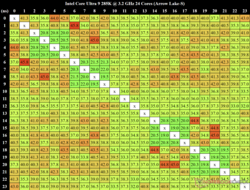
Abbiamo utilizzato MicrobenchX per calcolare la latenza inter-core. Le latenze da core a core arrivano a 45,8 ns tra il Core 2 e il Core 7, il che è indicativo di una possibile lunga latenza durante il trasferimento dei dati dal core E al core E. Tuttavia, i quattro cluster del core E sembrano mostrare una latenza minima, compresa tra 19 ns e 21,3 ns per il trasferimento dei dati all'interno di tali cluster.
Tuttavia, i quattro cluster E-core sembrano mostrare una latenza minima, compresa tra 19 ns e 21,3 ns per il trasferimento dei dati all'interno di questi cluster.
Abbiamo misurato una latenza mediana complessiva da core a core di 38,25 ns.
| AIDA64 Memory Performance Rating - Percent | |
| Intel Core i9-12900K -1! | |
| Intel Core i9-14900K | |
| Intel Core i7-14700K | |
| Intel Core i5-12600K -1! | |
| Intel Core i5-14600K | |
| Intel Core Ultra 9 285K | |
| AMD Ryzen 9 7950X3D | |
| AMD Ryzen 9 7950X | |
| AMD Ryzen 9 9950X | |
| Intel Core i9-13900K | |
| AMD Ryzen 9 9900X | |
| AMD Ryzen 9 7900X | |
| AMD Ryzen 7 7800X3D | |
| Intel Core i5-13600K | |
| AMD Ryzen 7 9700X | |
| AMD Ryzen 5 9600X | |
| Intel Core Ultra 5 245K | |
* ... Meglio usare valori piccoli
3D e prestazioni di gioco: Arrow Lake-S delude alla grande
Ci si aspetterebbe che i vantaggi della mancanza di hyperthreading, dell'Intel APO e dell'aumento dell'IPC, soprattutto sui core Skymont, si traducano in buoni guadagni di gioco. Si prepari a rimanere deluso.
Mentre il Core Ultra 9 285K ha mostrato prestazioni lodevoli della CPU con un fabbisogno energetico relativamente inferiore, la situazione diventa sbilanciata quando si tratta di compiti 3D e di gioco.
Il Core Ultra 9 285K, in combinazione con la GPU Nvidia GeForce RTX 4090, riesce a raccogliere un vantaggio del 13% rispetto al Ryzen 9 9900X in 3DMark 11 Performance GPU e un guadagno del 6% rispetto al Ryzen 9 9950X in 3DMark Time Spy Graphics.
Tuttavia, il sistema perde significativamente rispetto alle altre offerte Raptor Lake-S Refresh e Zen 5 in 3DMark Fire Strike Graphics, il che lo pone in una posizione di svantaggio generale.
| 3DMark Performance Rating - Percent | |
| Intel Core i5-14600K | |
| AMD Ryzen 7 7800X3D | |
| AMD Ryzen 5 9600X | |
| Intel Core Ultra 5 245K | |
| AMD Ryzen 7 9700X | |
| AMD Ryzen 9 7950X3D | |
| Intel Core i9-14900K | |
| Intel Core i7-14700K | |
| AMD Ryzen 9 9950X | |
| AMD Ryzen 9 9900X | |
| Intel Core Ultra 9 285K | |
| 3DMark 11 - 1280x720 Performance GPU | |
| AMD Ryzen 7 7800X3D | |
| Intel Core i5-14600K | |
| AMD Ryzen 9 7950X3D | |
| Intel Core i9-14900K | |
| Intel Core Ultra 5 245K | |
| AMD Ryzen 5 9600X | |
| Intel Core i7-14700K | |
| AMD Ryzen 9 9950X | |
| AMD Ryzen 7 9700X | |
| Intel Core Ultra 9 285K | |
| AMD Ryzen 9 9900X | |
| 3DMark | |
| 2560x1440 Time Spy Graphics | |
| Intel Core i5-14600K | |
| Intel Core i9-14900K | |
| AMD Ryzen 7 7800X3D | |
| Intel Core i7-14700K | |
| AMD Ryzen 5 9600X | |
| Intel Core Ultra 5 245K | |
| AMD Ryzen 9 7950X3D | |
| AMD Ryzen 7 9700X | |
| AMD Ryzen 9 9900X | |
| Intel Core Ultra 9 285K | |
| AMD Ryzen 9 9950X | |
| 1920x1080 Fire Strike Graphics | |
| Intel Core i5-14600K | |
| AMD Ryzen 7 9700X | |
| AMD Ryzen 5 9600X | |
| Intel Core Ultra 5 245K | |
| AMD Ryzen 9 9950X | |
| AMD Ryzen 9 9900X | |
| AMD Ryzen 7 7800X3D | |
| AMD Ryzen 9 7950X3D | |
| Intel Core i9-14900K | |
| Intel Core i7-14700K | |
| Intel Core Ultra 9 285K | |
| 3DMark 11 Performance | 62846 punti | |
| 3DMark Fire Strike Score | 44363 punti | |
| 3DMark Time Spy Score | 30904 punti | |
Aiuto | ||
Tendenze simili si riscontrano anche nei giochi. Contrariamente a quanto dichiarato da Intel al momento del lancio, il Core Ultra 9 285K abbinato alla RTX 4090 si posiziona in fondo alla nostra classifica di comparazione dei giochi, a pari merito solo con il Core i7-14700K e con un ritardo significativo rispetto alle offerte Zen 5 (fino al 12%) nei test di gioco cumulativi a 720p Low e 1080p Ultra.
Il Core Ultra 9 285K sembra mostrare dei piccoli guadagni rispetto al Core i7-14700K in Far Cry 5, Dota 2 Reborn e Metro Exodus (non Enhanced Edition), ma le differenze sono minime e le prestazioni complessive sono ancora molto inferiori a quelle dei Core i9-14700K e Core i9-14900K.
Anche il Core i5-14600K sembra essere una CPU da gioco migliore, con un guadagno complessivo del 7% rispetto al Core Ultra 9 285K
| Gaming Performance Rating - Percent | |
| AMD Ryzen 7 7800X3D | |
| AMD Ryzen 9 7950X3D | |
| Intel Core i9-14900K | |
| AMD Ryzen 7 9700X | |
| AMD Ryzen 9 9900X | |
| AMD Ryzen 5 9600X | |
| AMD Ryzen 9 9950X | |
| Intel Core i5-14600K | |
| Intel Core i7-14700K | |
| Intel Core Ultra 9 285K | |
| Intel Core Ultra 5 245K | |
| F1 22 | |
| 1280x720 Ultra Low Preset AA:T AF:16x | |
| AMD Ryzen 7 7800X3D | |
| Intel Core i9-14900K | |
| AMD Ryzen 9 7950X3D | |
| AMD Ryzen 9 9950X | |
| AMD Ryzen 5 9600X | |
| AMD Ryzen 7 9700X | |
| AMD Ryzen 9 9900X | |
| Intel Core i5-14600K | |
| Intel Core i7-14700K | |
| Intel Core Ultra 9 285K | |
| Intel Core Ultra 5 245K | |
| 1920x1080 Low Preset AA:T AF:16x | |
| AMD Ryzen 7 7800X3D | |
| AMD Ryzen 9 7950X3D | |
| Intel Core i9-14900K | |
| AMD Ryzen 5 9600X | |
| AMD Ryzen 9 9950X | |
| AMD Ryzen 7 9700X | |
| AMD Ryzen 9 9900X | |
| Intel Core i5-14600K | |
| Intel Core i7-14700K | |
| Intel Core Ultra 9 285K | |
| Intel Core Ultra 5 245K | |
| 1920x1080 Ultra High Preset AA:T AF:16x | |
| AMD Ryzen 7 7800X3D | |
| Intel Core i9-14900K | |
| AMD Ryzen 7 9700X | |
| Intel Core i5-14600K | |
| AMD Ryzen 9 7950X3D | |
| AMD Ryzen 5 9600X | |
| AMD Ryzen 9 9900X | |
| AMD Ryzen 9 9950X | |
| Intel Core i7-14700K | |
| Intel Core Ultra 9 285K | |
| Intel Core Ultra 5 245K | |
| X-Plane 11.11 | |
| 1280x720 low (fps_test=1) | |
| AMD Ryzen 7 9700X | |
| AMD Ryzen 9 9900X | |
| AMD Ryzen 5 9600X | |
| Intel Core i9-14900K | |
| Intel Core i5-14600K | |
| Intel Core i7-14700K | |
| AMD Ryzen 9 7950X3D | |
| AMD Ryzen 7 7800X3D | |
| AMD Ryzen 9 9950X | |
| Intel Core Ultra 9 285K | |
| Intel Core Ultra 5 245K | |
| 1920x1080 high (fps_test=3) | |
| AMD Ryzen 7 7800X3D | |
| AMD Ryzen 9 7950X3D | |
| AMD Ryzen 7 9700X | |
| AMD Ryzen 9 9900X | |
| AMD Ryzen 5 9600X | |
| Intel Core i9-14900K | |
| AMD Ryzen 9 9950X | |
| Intel Core i7-14700K | |
| Intel Core i5-14600K | |
| Intel Core Ultra 9 285K | |
| Intel Core Ultra 5 245K | |
| Final Fantasy XV Benchmark | |
| 1280x720 Lite Quality | |
| AMD Ryzen 5 9600X | |
| AMD Ryzen 7 7800X3D | |
| Intel Core i5-14600K | |
| AMD Ryzen 9 9950X | |
| Intel Core i9-14900K | |
| Intel Core i7-14700K | |
| AMD Ryzen 7 9700X | |
| Intel Core Ultra 5 245K | |
| AMD Ryzen 9 9900X | |
| AMD Ryzen 9 7950X3D | |
| Intel Core Ultra 9 285K | |
| 1920x1080 High Quality | |
| Intel Core i9-14900K | |
| AMD Ryzen 7 7800X3D | |
| Intel Core i5-14600K | |
| AMD Ryzen 9 7950X3D | |
| AMD Ryzen 9 9900X | |
| AMD Ryzen 5 9600X | |
| Intel Core i7-14700K | |
| Intel Core Ultra 9 285K | |
| AMD Ryzen 7 9700X | |
| AMD Ryzen 9 9950X | |
| Intel Core Ultra 5 245K | |
| Dota 2 Reborn | |
| 1280x720 min (0/3) fastest | |
| AMD Ryzen 7 7800X3D | |
| AMD Ryzen 7 9700X | |
| AMD Ryzen 9 7950X3D | |
| AMD Ryzen 9 9900X | |
| AMD Ryzen 9 9950X | |
| Intel Core i9-14900K | |
| AMD Ryzen 5 9600X | |
| Intel Core i5-14600K | |
| Intel Core Ultra 9 285K | |
| Intel Core i7-14700K | |
| Intel Core Ultra 5 245K | |
| 1920x1080 ultra (3/3) best looking | |
| AMD Ryzen 7 7800X3D | |
| AMD Ryzen 9 7950X3D | |
| AMD Ryzen 9 9900X | |
| AMD Ryzen 9 9950X | |
| AMD Ryzen 7 9700X | |
| AMD Ryzen 5 9600X | |
| Intel Core i9-14900K | |
| Intel Core i5-14600K | |
| Intel Core Ultra 9 285K | |
| Intel Core i7-14700K | |
| Intel Core Ultra 5 245K | |
| The Witcher 3 | |
| 1024x768 Low Graphics & Postprocessing | |
| AMD Ryzen 9 7950X3D | |
| AMD Ryzen 7 7800X3D | |
| Intel Core i9-14900K | |
| AMD Ryzen 9 9950X | |
| AMD Ryzen 5 9600X | |
| AMD Ryzen 7 9700X | |
| AMD Ryzen 9 9900X | |
| Intel Core i7-14700K | |
| Intel Core i5-14600K | |
| Intel Core Ultra 9 285K | |
| Intel Core Ultra 5 245K | |
| 1920x1080 Ultra Graphics & Postprocessing (HBAO+) | |
| Intel Core i5-14600K | |
| AMD Ryzen 7 7800X3D | |
| Intel Core i9-14900K | |
| Intel Core Ultra 5 245K | |
| AMD Ryzen 9 7950X3D | |
| Intel Core Ultra 9 285K | |
| Intel Core i7-14700K | |
| AMD Ryzen 5 9600X | |
| AMD Ryzen 9 9950X | |
| AMD Ryzen 7 9700X | |
| AMD Ryzen 9 9900X | |
| GTA V | |
| 1024x768 Lowest Settings possible | |
| AMD Ryzen 7 7800X3D | |
| AMD Ryzen 5 9600X | |
| AMD Ryzen 9 7950X3D | |
| Intel Core i9-14900K | |
| AMD Ryzen 7 9700X | |
| AMD Ryzen 9 9900X | |
| Intel Core i5-14600K | |
| Intel Core Ultra 5 245K | |
| Intel Core i7-14700K | |
| AMD Ryzen 9 9950X | |
| Intel Core Ultra 9 285K | |
| 1920x1080 Highest Settings possible AA:4xMSAA + FX AF:16x | |
| AMD Ryzen 7 7800X3D | |
| Intel Core i9-14900K | |
| AMD Ryzen 9 9900X | |
| AMD Ryzen 7 9700X | |
| AMD Ryzen 5 9600X | |
| AMD Ryzen 9 9950X | |
| Intel Core i5-14600K | |
| Intel Core Ultra 9 285K | |
| AMD Ryzen 9 7950X3D | |
| Intel Core i7-14700K | |
| Intel Core Ultra 5 245K | |
| Borderlands 3 | |
| 1280x720 Very Low Overall Quality (DX11) | |
| AMD Ryzen 7 7800X3D | |
| AMD Ryzen 9 7950X3D | |
| Intel Core i9-14900K | |
| AMD Ryzen 7 9700X | |
| AMD Ryzen 9 9900X | |
| AMD Ryzen 9 9950X | |
| Intel Core i5-14600K | |
| AMD Ryzen 5 9600X | |
| Intel Core i7-14700K | |
| Intel Core Ultra 9 285K | |
| Intel Core Ultra 5 245K | |
| 1920x1080 Very Low Overall Quality (DX11) | |
| AMD Ryzen 9 7950X3D | |
| AMD Ryzen 7 7800X3D | |
| Intel Core i9-14900K | |
| AMD Ryzen 9 9900X | |
| AMD Ryzen 7 9700X | |
| AMD Ryzen 9 9950X | |
| Intel Core i5-14600K | |
| AMD Ryzen 5 9600X | |
| Intel Core i7-14700K | |
| Intel Core Ultra 9 285K | |
| Intel Core Ultra 5 245K | |
| 1920x1080 Badass Overall Quality (DX11) | |
| AMD Ryzen 9 7950X3D | |
| AMD Ryzen 7 7800X3D | |
| Intel Core i9-14900K | |
| AMD Ryzen 7 9700X | |
| AMD Ryzen 9 9900X | |
| Intel Core i5-14600K | |
| AMD Ryzen 9 9950X | |
| AMD Ryzen 5 9600X | |
| Intel Core i7-14700K | |
| Intel Core Ultra 9 285K | |
| Intel Core Ultra 5 245K | |
| Shadow of the Tomb Raider | |
| 1280x720 Lowest Preset | |
| AMD Ryzen 7 7800X3D | |
| AMD Ryzen 9 7950X3D | |
| AMD Ryzen 7 9700X | |
| AMD Ryzen 9 9950X | |
| Intel Core i9-14900K | |
| AMD Ryzen 9 9900X | |
| AMD Ryzen 5 9600X | |
| Intel Core Ultra 9 285K | |
| Intel Core i5-14600K | |
| Intel Core i7-14700K | |
| Intel Core Ultra 5 245K | |
| 1920x1080 Highest Preset AA:T | |
| AMD Ryzen 7 7800X3D | |
| AMD Ryzen 9 7950X3D | |
| Intel Core i9-14900K | |
| AMD Ryzen 9 9900X | |
| AMD Ryzen 7 9700X | |
| AMD Ryzen 9 9950X | |
| AMD Ryzen 5 9600X | |
| Intel Core i5-14600K | |
| Intel Core Ultra 9 285K | |
| Intel Core i7-14700K | |
| Intel Core Ultra 5 245K | |
| Metro Exodus | |
| 1280x720 Low Quality AF:4x | |
| AMD Ryzen 7 7800X3D | |
| AMD Ryzen 7 9700X | |
| AMD Ryzen 5 9600X | |
| AMD Ryzen 9 9950X | |
| AMD Ryzen 9 9900X | |
| Intel Core i9-14900K | |
| Intel Core Ultra 9 285K | |
| Intel Core i5-14600K | |
| AMD Ryzen 9 7950X3D | |
| Intel Core i7-14700K | |
| Intel Core Ultra 5 245K | |
| 1920x1080 Ultra Quality AF:16x | |
| AMD Ryzen 7 7800X3D | |
| AMD Ryzen 5 9600X | |
| Intel Core i9-14900K | |
| AMD Ryzen 7 9700X | |
| AMD Ryzen 9 9900X | |
| AMD Ryzen 9 9950X | |
| Intel Core i5-14600K | |
| Intel Core i7-14700K | |
| Intel Core Ultra 9 285K | |
| AMD Ryzen 9 7950X3D | |
| Intel Core Ultra 5 245K | |
| F1 2021 | |
| 1280x720 Ultra Low Preset | |
| AMD Ryzen 7 7800X3D | |
| Intel Core i9-14900K | |
| AMD Ryzen 9 7950X3D | |
| AMD Ryzen 5 9600X | |
| AMD Ryzen 9 9950X | |
| AMD Ryzen 7 9700X | |
| AMD Ryzen 9 9900X | |
| Intel Core i5-14600K | |
| Intel Core i7-14700K | |
| Intel Core Ultra 9 285K | |
| Intel Core Ultra 5 245K | |
| 1920x1080 Ultra High Preset + Raytracing AA:T AF:16x | |
| AMD Ryzen 7 7800X3D | |
| Intel Core i9-14900K | |
| AMD Ryzen 7 9700X | |
| AMD Ryzen 5 9600X | |
| Intel Core i5-14600K | |
| AMD Ryzen 9 7950X3D | |
| AMD Ryzen 9 9900X | |
| AMD Ryzen 9 9950X | |
| Intel Core i7-14700K | |
| Intel Core Ultra 9 285K | |
| Intel Core Ultra 5 245K | |
Anche le impostazioni legate alla GPU come QHD Ultra e UHD Ultra sembrano aver perso l'amore con il Core Ultra 9 285K. Tuttavia, il delta cumulativo delle prestazioni rispetto al Core i9-14900K è ora del 10% a queste impostazioni, rispetto al 15% a risoluzioni più legate alla CPU.
Anche se sarebbe un po' inverosimile affermare che il Core Ultra 9 285K sta imbottigliando la RTX 4090, ci sono opzioni migliori (e più economiche) se il gioco è il suo caso d'uso principale.
| Gaming Performance Rating - Percent | |
| AMD Ryzen 7 7800X3D | |
| AMD Ryzen 9 7950X3D | |
| Intel Core i9-14900K | |
| AMD Ryzen 7 9700X | |
| AMD Ryzen 9 9900X | |
| Intel Core i5-14600K | |
| AMD Ryzen 5 9600X | |
| AMD Ryzen 9 9950X | |
| Intel Core i7-14700K | |
| Intel Core Ultra 9 285K | |
| Intel Core Ultra 5 245K | |
| F1 22 | |
| 2560x1440 Ultra High Preset AA:T AF:16x | |
| AMD Ryzen 7 7800X3D | |
| AMD Ryzen 5 9600X | |
| Intel Core i9-14900K | |
| AMD Ryzen 9 9900X | |
| Intel Core i5-14600K | |
| AMD Ryzen 7 9700X | |
| AMD Ryzen 9 7950X3D | |
| AMD Ryzen 9 9950X | |
| Intel Core Ultra 5 245K | |
| Intel Core i7-14700K | |
| Intel Core Ultra 9 285K | |
| 3840x2160 Ultra High Preset AA:T AF:16x | |
| AMD Ryzen 9 9900X | |
| Intel Core Ultra 5 245K | |
| AMD Ryzen 5 9600X | |
| AMD Ryzen 7 9700X | |
| AMD Ryzen 7 7800X3D | |
| AMD Ryzen 9 9950X | |
| Intel Core i5-14600K | |
| Intel Core i9-14900K | |
| Intel Core Ultra 9 285K | |
| AMD Ryzen 9 7950X3D | |
| Intel Core i7-14700K | |
| Far Cry 5 | |
| 2560x1440 Ultra Preset AA:T | |
| AMD Ryzen 7 7800X3D | |
| AMD Ryzen 9 7950X3D | |
| AMD Ryzen 9 9900X | |
| Intel Core i9-14900K | |
| AMD Ryzen 5 9600X | |
| AMD Ryzen 7 9700X | |
| Intel Core i5-14600K | |
| AMD Ryzen 9 9950X | |
| Intel Core Ultra 9 285K | |
| Intel Core i7-14700K | |
| Intel Core Ultra 5 245K | |
| 3840x2160 Ultra Preset AA:T | |
| AMD Ryzen 7 7800X3D | |
| Intel Core i9-14900K | |
| AMD Ryzen 9 7950X3D | |
| Intel Core i5-14600K | |
| AMD Ryzen 5 9600X | |
| AMD Ryzen 9 9900X | |
| AMD Ryzen 9 9950X | |
| AMD Ryzen 7 9700X | |
| Intel Core Ultra 9 285K | |
| Intel Core Ultra 5 245K | |
| Intel Core i7-14700K | |
| X-Plane 11.11 - 3840x2160 high (fps_test=3) | |
| AMD Ryzen 7 7800X3D | |
| AMD Ryzen 9 7950X3D | |
| AMD Ryzen 7 9700X | |
| AMD Ryzen 5 9600X | |
| Intel Core i9-14900K | |
| AMD Ryzen 9 9900X | |
| Intel Core i7-14700K | |
| Intel Core i5-14600K | |
| AMD Ryzen 9 9950X | |
| Intel Core Ultra 9 285K | |
| Intel Core Ultra 5 245K | |
| Final Fantasy XV Benchmark | |
| 2560x1440 High Quality | |
| AMD Ryzen 7 7800X3D | |
| Intel Core i9-14900K | |
| Intel Core i5-14600K | |
| AMD Ryzen 9 7950X3D | |
| AMD Ryzen 9 9950X | |
| Intel Core Ultra 9 285K | |
| Intel Core i7-14700K | |
| AMD Ryzen 5 9600X | |
| Intel Core Ultra 5 245K | |
| AMD Ryzen 7 9700X | |
| AMD Ryzen 9 9900X | |
| 3840x2160 High Quality | |
| Intel Core Ultra 5 245K | |
| Intel Core i9-14900K | |
| Intel Core i5-14600K | |
| Intel Core i7-14700K | |
| AMD Ryzen 7 7800X3D | |
| AMD Ryzen 9 7950X3D | |
| Intel Core Ultra 9 285K | |
| AMD Ryzen 9 9950X | |
| AMD Ryzen 9 9900X | |
| AMD Ryzen 5 9600X | |
| AMD Ryzen 7 9700X | |
| Dota 2 Reborn - 3840x2160 ultra (3/3) best looking | |
| AMD Ryzen 7 7800X3D | |
| AMD Ryzen 9 7950X3D | |
| AMD Ryzen 9 9950X | |
| AMD Ryzen 7 9700X | |
| AMD Ryzen 9 9900X | |
| Intel Core i9-14900K | |
| AMD Ryzen 5 9600X | |
| Intel Core i5-14600K | |
| Intel Core i7-14700K | |
| Intel Core Ultra 9 285K | |
| Intel Core Ultra 5 245K | |
| The Witcher 3 - 3840x2160 Ultra Graphics & Postprocessing (HBAO+) | |
| Intel Core i9-14900K | |
| Intel Core Ultra 5 245K | |
| AMD Ryzen 7 7800X3D | |
| Intel Core i5-14600K | |
| AMD Ryzen 9 7950X3D | |
| AMD Ryzen 5 9600X | |
| Intel Core i7-14700K | |
| Intel Core Ultra 9 285K | |
| AMD Ryzen 7 9700X | |
| AMD Ryzen 9 9900X | |
| AMD Ryzen 9 9950X | |
| GTA V | |
| 2560x1440 Highest Settings possible AA:4xMSAA + FX AF:16x | |
| AMD Ryzen 7 7800X3D | |
| Intel Core i9-14900K | |
| AMD Ryzen 9 9900X | |
| AMD Ryzen 7 9700X | |
| AMD Ryzen 5 9600X | |
| AMD Ryzen 9 9950X | |
| Intel Core i5-14600K | |
| AMD Ryzen 9 7950X3D | |
| Intel Core Ultra 9 285K | |
| Intel Core Ultra 5 245K | |
| Intel Core i7-14700K | |
| 3840x2160 Highest Settings possible AA:4xMSAA + FX AF:16x | |
| AMD Ryzen 7 7800X3D | |
| Intel Core i9-14900K | |
| Intel Core i5-14600K | |
| AMD Ryzen 9 9900X | |
| AMD Ryzen 5 9600X | |
| AMD Ryzen 7 9700X | |
| AMD Ryzen 9 7950X3D | |
| Intel Core Ultra 9 285K | |
| Intel Core Ultra 5 245K | |
| Intel Core i7-14700K | |
| AMD Ryzen 9 9950X | |
| Borderlands 3 | |
| 2560x1440 Badass Overall Quality (DX11) | |
| AMD Ryzen 7 7800X3D | |
| AMD Ryzen 9 7950X3D | |
| Intel Core i9-14900K | |
| AMD Ryzen 7 9700X | |
| AMD Ryzen 9 9900X | |
| Intel Core i5-14600K | |
| AMD Ryzen 9 9950X | |
| Intel Core i7-14700K | |
| AMD Ryzen 5 9600X | |
| Intel Core Ultra 9 285K | |
| Intel Core Ultra 5 245K | |
| 3840x2160 Badass Overall Quality (DX11) | |
| Intel Core i9-14900K | |
| AMD Ryzen 7 7800X3D | |
| AMD Ryzen 9 7950X3D | |
| Intel Core i5-14600K | |
| Intel Core i7-14700K | |
| AMD Ryzen 9 9900X | |
| AMD Ryzen 5 9600X | |
| AMD Ryzen 7 9700X | |
| AMD Ryzen 9 9950X | |
| Intel Core Ultra 9 285K | |
| Intel Core Ultra 5 245K | |
| Shadow of the Tomb Raider | |
| 2560x1440 Highest Preset AA:T | |
| AMD Ryzen 7 7800X3D | |
| AMD Ryzen 9 7950X3D | |
| Intel Core i9-14900K | |
| AMD Ryzen 9 9900X | |
| AMD Ryzen 9 9950X | |
| AMD Ryzen 7 9700X | |
| AMD Ryzen 5 9600X | |
| Intel Core i5-14600K | |
| Intel Core i7-14700K | |
| Intel Core Ultra 9 285K | |
| Intel Core Ultra 5 245K | |
| 3840x2160 Highest Preset AA:T | |
| Intel Core i9-14900K | |
| Intel Core i5-14600K | |
| AMD Ryzen 5 9600X | |
| AMD Ryzen 7 7800X3D | |
| AMD Ryzen 9 7950X3D | |
| Intel Core Ultra 5 245K | |
| AMD Ryzen 9 9900X | |
| AMD Ryzen 7 9700X | |
| Intel Core i7-14700K | |
| Intel Core Ultra 9 285K | |
| AMD Ryzen 9 9950X | |
| Metro Exodus | |
| 2560x1440 Ultra Quality AF:16x | |
| AMD Ryzen 7 7800X3D | |
| Intel Core i9-14900K | |
| AMD Ryzen 5 9600X | |
| AMD Ryzen 7 9700X | |
| Intel Core i5-14600K | |
| AMD Ryzen 9 9900X | |
| Intel Core i7-14700K | |
| AMD Ryzen 9 9950X | |
| AMD Ryzen 9 7950X3D | |
| Intel Core Ultra 9 285K | |
| Intel Core Ultra 5 245K | |
| 3840x2160 Ultra Quality AF:16x | |
| Intel Core i9-14900K | |
| Intel Core i5-14600K | |
| AMD Ryzen 7 7800X3D | |
| AMD Ryzen 9 7950X3D | |
| AMD Ryzen 7 9700X | |
| Intel Core i7-14700K | |
| AMD Ryzen 9 9900X | |
| AMD Ryzen 5 9600X | |
| Intel Core Ultra 5 245K | |
| Intel Core Ultra 9 285K | |
| AMD Ryzen 9 9950X | |
| F1 2021 | |
| 2560x1440 Ultra High Preset + Raytracing AA:T AF:16x | |
| AMD Ryzen 7 7800X3D | |
| AMD Ryzen 7 9700X | |
| Intel Core i9-14900K | |
| AMD Ryzen 5 9600X | |
| AMD Ryzen 9 7950X3D | |
| Intel Core i5-14600K | |
| AMD Ryzen 9 9950X | |
| Intel Core i7-14700K | |
| AMD Ryzen 9 9900X | |
| Intel Core Ultra 9 285K | |
| Intel Core Ultra 5 245K | |
| 3840x2160 Ultra High Preset + Raytracing AA:T AF:16x | |
| AMD Ryzen 7 7800X3D | |
| AMD Ryzen 9 9950X | |
| AMD Ryzen 5 9600X | |
| AMD Ryzen 9 7950X3D | |
| Intel Core i9-14900K | |
| AMD Ryzen 7 9700X | |
| AMD Ryzen 9 9900X | |
| Intel Core i5-14600K | |
| Intel Core Ultra 9 285K | |
| Intel Core Ultra 5 245K | |
| Intel Core i7-14700K | |
| basso | medio | alto | ultra | QHD DLSS | QHD | 4K DLSS | 4K FSR | 4K | |
|---|---|---|---|---|---|---|---|---|---|
| GTA V (2015) | 186.9 | 185.6 | 183.2 | 161.3 | 154.2 | 182.4 | |||
| The Witcher 3 (2015) | 626 | 584 | 545 | 294 | 251 | 276 | |||
| Dota 2 Reborn (2015) | 256 | 230 | 218 | 204 | 196.3 | ||||
| Final Fantasy XV Benchmark (2018) | 234 | 237 | 228 | 221 | 154.3 | ||||
| X-Plane 11.11 (2018) | 189.1 | 172.5 | 140.5 | 117.3 | |||||
| Far Cry 5 (2018) | 225 | 194 | 186 | 171 | 172 | 162 | |||
| Strange Brigade (2018) | 705 | 557 | 552 | 547 | 501 | 276 | |||
| Shadow of the Tomb Raider (2018) | 282 | 273 | 275 | 270 | 255 | 178.4 | |||
| Metro Exodus (2019) | 299 | 271 | 230 | 193.8 | 177.7 | 131.3 | |||
| Borderlands 3 (2019) | 209 | 183 | 166.8 | 159.1 | 158.2 | 127.3 | |||
| F1 2021 (2021) | 530 | 510 | 486 | 232 | 229 | 198.2 | |||
| F1 22 (2022) | 357 | 388 | 373 | 174.6 | 149.9 | 83 | |||
| F1 23 (2023) | 376 | 394 | 393 | 182.9 | 145.7 | 127 | 78.5 | ||
| Baldur's Gate 3 (2023) | 304 | 293 | 271 | 269 | 225 | 193.2 | 131.7 | ||
| Cyberpunk 2077 2.2 Phantom Liberty (2023) | 212 | 214 | 195.1 | 180.3 | 145.2 | 73.2 | |||
| Assassin's Creed Mirage (2023) | 287 | 268 | 255 | 198 | 178 | 156 | 125 | ||
| F1 24 (2024) | 373 | 394 | 365 | 184.8 | 139.9 | 121 | 137.2 | 77 | |
| Black Myth: Wukong (2024) | 214 | 162 | 128 | 81 | 89 | 65 | 68 | 42 |
Consumo di energia: Intel finalmente azzecca l'efficienza energetica
Intel sta presentando l'efficienza energetica come la principale USP di Arrow Lake-S, e abbiamo potuto constatare che il Core Ultra 9 285K è effettivamente all'altezza delle aspettative in questo senso.
Il Core Ultra 9 285K consuma il 37% in meno di energia dalla parete durante l'esecuzione di Cinebench R23 multi-core rispetto al Core i9-14900K, mentre il consumo energetico di Cinebench R23 single-core è inferiore di circa il 27%.
Anche il consumo di energia durante un'esecuzione Prime95 in-place di FFT di grandi dimensioni è inferiore del 29% rispetto a quanto avevamo osservato con il Core i9-14900K, con il Core Ultra 9 285K che si avvicina ai livelli del Core i5-14600K.
Questi guadagni si notano anche nei giochi, con il sistema Core Ultra 9 285K che assorbe il 18% di energia in meno rispetto al Core i9-14900K in The Witcher 3 a 1080p Ultra e il 22% in meno rispetto al Ryzen 9 9950X in Cyberpunk 2077: Phantom Liberty a 1080p Ultra.
Power Consumption: External monitor
: Cyberpunk 2077 ultra external monitor
| Power Consumption / Cinebench R15 Multi (external Monitor) | |
| Intel Core i9-14900K, NVIDIA GeForce RTX 4090 | |
| Intel Core i9-13900K, NVIDIA GeForce RTX 3090 | |
| Intel Core i7-14700K, NVIDIA GeForce RTX 4090 | |
| Intel Core Ultra 9 285K, NVIDIA GeForce RTX 4090 (Idle: 76.2 W) | |
| Intel Core i5-14600K, NVIDIA GeForce RTX 4090 | |
| Intel Core i9-12900K, NVIDIA Titan RTX (Idle: 70.5 W) | |
| AMD Ryzen 9 7950X, NVIDIA GeForce RTX 3090 | |
| AMD Ryzen 9 7900X, NVIDIA GeForce RTX 3090 | |
| AMD Ryzen 9 9950X, NVIDIA GeForce RTX 4090 (Idle: 100 W) | |
| Intel Core i5-13600K, NVIDIA GeForce RTX 3090 | |
| AMD Ryzen 9 9900X, NVIDIA GeForce RTX 4090 (Idle: 85.1 W) | |
| AMD Ryzen 9 7950X3D, NVIDIA GeForce RTX 4090 | |
| Intel Core Ultra 5 245K, NVIDIA GeForce RTX 4090 | |
| AMD Ryzen 5 9600X, NVIDIA GeForce RTX 4090 | |
| AMD Ryzen 7 7800X3D, NVIDIA GeForce RTX 4090 | |
| Intel Core i5-12600K, NVIDIA Titan RTX (Idle: 70.45 W) | |
| AMD Ryzen 7 9700X, NVIDIA GeForce RTX 4090 (Idle: 83 W) | |
| Power Consumption / Cinebench R23 Single (external Monitor) | |
| AMD Ryzen 7 7800X3D, NVIDIA GeForce RTX 4090 | |
| Intel Core i7-14700K, NVIDIA GeForce RTX 4090 | |
| Intel Core i9-14900K, NVIDIA GeForce RTX 4090 | |
| Intel Core i5-14600K, NVIDIA GeForce RTX 4090 | |
| AMD Ryzen 5 9600X, NVIDIA GeForce RTX 4090 | |
| AMD Ryzen 9 9950X, NVIDIA GeForce RTX 4090 (100) | |
| AMD Ryzen 9 9900X, NVIDIA GeForce RTX 4090 (85.1) | |
| Intel Core Ultra 5 245K, NVIDIA GeForce RTX 4090 | |
| AMD Ryzen 7 9700X, NVIDIA GeForce RTX 4090 (83) | |
| Intel Core Ultra 9 285K, NVIDIA GeForce RTX 4090 (76.2) | |
| Power Consumption / Cinebench R23 Multi (external Monitor) | |
| Intel Core i9-14900K, NVIDIA GeForce RTX 4090 | |
| Intel Core i7-14700K, NVIDIA GeForce RTX 4090 | |
| Intel Core Ultra 9 285K, NVIDIA GeForce RTX 4090 (76.2) | |
| Intel Core i5-14600K, NVIDIA GeForce RTX 4090 | |
| AMD Ryzen 9 9950X, NVIDIA GeForce RTX 4090 (100) | |
| AMD Ryzen 9 7950X3D, NVIDIA GeForce RTX 4090 | |
| AMD Ryzen 9 9900X, NVIDIA GeForce RTX 4090 (85.1) | |
| Intel Core Ultra 5 245K, NVIDIA GeForce RTX 4090 | |
| AMD Ryzen 5 9600X, NVIDIA GeForce RTX 4090 | |
| AMD Ryzen 7 7800X3D, NVIDIA GeForce RTX 4090 | |
| AMD Ryzen 7 9700X, NVIDIA GeForce RTX 4090 (83) | |
| Power Consumption / Prime95 V2810 Stress (external Monitor) | |
| Intel Core i9-14900K, NVIDIA GeForce RTX 4090 | |
| Intel Core i9-13900K, NVIDIA GeForce RTX 3090 | |
| Intel Core i7-14700K, NVIDIA GeForce RTX 4090 | |
| Intel Core Ultra 9 285K, NVIDIA GeForce RTX 4090 (Idle: 76.2 W) | |
| Intel Core i5-14600K, NVIDIA GeForce RTX 4090 | |
| Intel Core i5-13600K, NVIDIA GeForce RTX 3090 | |
| AMD Ryzen 9 7950X, NVIDIA GeForce RTX 3090 | |
| AMD Ryzen 9 7900X, NVIDIA GeForce RTX 3090 | |
| AMD Ryzen 9 9950X, NVIDIA GeForce RTX 4090 (Idle: 100 W) | |
| Intel Core i9-12900K, NVIDIA Titan RTX (Idle: 70.5 W) | |
| AMD Ryzen 9 9900X, NVIDIA GeForce RTX 4090 (Idle: 85.1 W) | |
| AMD Ryzen 9 7950X3D, NVIDIA GeForce RTX 4090 | |
| Intel Core Ultra 5 245K, NVIDIA GeForce RTX 4090 | |
| Intel Core i5-12600K, NVIDIA Titan RTX (Idle: 70.45 W) | |
| AMD Ryzen 7 7800X3D, NVIDIA GeForce RTX 4090 | |
| AMD Ryzen 5 9600X, NVIDIA GeForce RTX 4090 | |
| AMD Ryzen 7 9700X, NVIDIA GeForce RTX 4090 (Idle: 83 W) | |
| Power Consumption / The Witcher 3 ultra (external Monitor) | |
| Intel Core i5-14600K, NVIDIA GeForce RTX 4090 | |
| Intel Core i9-14900K, NVIDIA GeForce RTX 4090 | |
| AMD Ryzen 9 7900X, NVIDIA GeForce RTX 3090 | |
| AMD Ryzen 9 7950X, NVIDIA GeForce RTX 3090 | |
| Intel Core i9-13900K, NVIDIA GeForce RTX 3090 | |
| Intel Core i7-14700K, NVIDIA GeForce RTX 4090 | |
| AMD Ryzen 9 7950X3D, NVIDIA GeForce RTX 4090 | |
| Intel Core i5-13600K, NVIDIA GeForce RTX 3090 | |
| AMD Ryzen 7 7800X3D, NVIDIA GeForce RTX 4090 | |
| Intel Core Ultra 5 245K, NVIDIA GeForce RTX 4090 | |
| AMD Ryzen 9 9950X, NVIDIA GeForce RTX 4090 (Idle: 100 W) | |
| AMD Ryzen 9 9900X, NVIDIA GeForce RTX 4090 (Idle: 85.1 W) | |
| Intel Core i9-12900K, NVIDIA Titan RTX (Idle: 70.5 W) | |
| Intel Core Ultra 9 285K, NVIDIA GeForce RTX 4090 (Idle: 76.2 W) | |
| AMD Ryzen 7 9700X, NVIDIA GeForce RTX 4090 (Idle: 83 W) | |
| Intel Core i5-12600K, NVIDIA Titan RTX (Idle: 70.45 W) | |
| Power Consumption | |
| Intel Core Ultra 9 285K, NVIDIA GeForce RTX 4090 | |
| AMD Ryzen 5 9600X, NVIDIA GeForce RTX 4090 | |
| AMD Ryzen 9 9900X, NVIDIA GeForce RTX 4090 | |
| AMD Ryzen 9 9950X, NVIDIA GeForce RTX 4090 | |
| AMD Ryzen 7 9700X, NVIDIA GeForce RTX 4090 | |
| Intel Core Ultra 5 245K, NVIDIA GeForce RTX 4090 | |
: Cyberpunk 2077 ultra external monitor
* ... Meglio usare valori piccoli
Questi minori consumi si traducono naturalmente in guadagni di efficienza elevati. Cinebench R15 multi-core vede il Core Ultra 9 285K più efficiente di ben il 61% rispetto al Core i9-14900K, mentre è migliore del 64% in Cinebench R23 multi-core.
Cinebench R23 single-core vede il Core Ultra 9 285K più efficiente del 37% con 21,2 punti per W rispetto ai 15,51 punti per W del Core i9-14900K.
Anche rispetto al Ryzen 9 9950X, il Core Ultra 9 285K mantiene un buon vantaggio dal 32 al 34% nell'efficienza energetica single-core nei test single-core di Cinebench.
La CPU Arrow Lake-S mostra anche un buon guadagno di efficienza del 14% rispetto al Core i9-14900K durante la riproduzione di The Witcher 3 a 1080p Ultra ed è anche marginalmente migliore di un Ryzen 7 7800X3D sistema.
| Power Consumption / Cinebench R15 Multi Efficiency (external Monitor) | |
| AMD Ryzen 9 7950X3D, NVIDIA GeForce RTX 4090 | |
| AMD Ryzen 9 9950X, NVIDIA GeForce RTX 4090 | |
| Intel Core Ultra 9 285K, NVIDIA GeForce RTX 4090 | |
| AMD Ryzen 9 9900X, NVIDIA GeForce RTX 4090 | |
| Intel Core Ultra 5 245K, NVIDIA GeForce RTX 4090 | |
| AMD Ryzen 7 7800X3D, NVIDIA GeForce RTX 4090 | |
| Intel Core i7-14700K, NVIDIA GeForce RTX 4090 | |
| AMD Ryzen 5 9600X, NVIDIA GeForce RTX 4090 | |
| Intel Core i9-14900K, NVIDIA GeForce RTX 4090 | |
| Intel Core i5-14600K, NVIDIA GeForce RTX 4090 | |
| Power Consumption / Cinebench R23 Single Power Efficiency - external Monitor | |
| Intel Core Ultra 9 285K, NVIDIA GeForce RTX 4090 | |
| Intel Core Ultra 5 245K, NVIDIA GeForce RTX 4090 | |
| AMD Ryzen 9 9900X, NVIDIA GeForce RTX 4090 | |
| AMD Ryzen 9 9950X, NVIDIA GeForce RTX 4090 | |
| Intel Core i9-14900K, NVIDIA GeForce RTX 4090 | |
| AMD Ryzen 5 9600X, NVIDIA GeForce RTX 4090 | |
| Intel Core i7-14700K, NVIDIA GeForce RTX 4090 | |
| Intel Core i5-14600K, NVIDIA GeForce RTX 4090 | |
| AMD Ryzen 7 7800X3D, NVIDIA GeForce RTX 4090 | |
| Power Consumption / Cinebench R23 Multi Power Efficiency - external Monitor | |
| AMD Ryzen 9 9950X, NVIDIA GeForce RTX 4090 | |
| Intel Core Ultra 9 285K, NVIDIA GeForce RTX 4090 | |
| AMD Ryzen 9 7950X3D, NVIDIA GeForce RTX 4090 | |
| AMD Ryzen 9 9900X, NVIDIA GeForce RTX 4090 | |
| Intel Core Ultra 5 245K, NVIDIA GeForce RTX 4090 | |
| AMD Ryzen 7 7800X3D, NVIDIA GeForce RTX 4090 | |
| Intel Core i7-14700K, NVIDIA GeForce RTX 4090 | |
| AMD Ryzen 5 9600X, NVIDIA GeForce RTX 4090 | |
| Intel Core i9-14900K, NVIDIA GeForce RTX 4090 | |
| Intel Core i5-14600K, NVIDIA GeForce RTX 4090 | |
| Power Consumption / Cinebench 2024 Single Power Efficiency - external Monitor | |
| Intel Core Ultra 9 285K, NVIDIA GeForce RTX 4090 | |
| AMD Ryzen 9 9900X, NVIDIA GeForce RTX 4090 | |
| AMD Ryzen 9 9950X, NVIDIA GeForce RTX 4090 | |
| Power Consumption / Cinebench 2024 Multi Power Efficiency - external Monitor | |
| Intel Core Ultra 9 285K, NVIDIA GeForce RTX 4090 | |
| AMD Ryzen 9 9950X, NVIDIA GeForce RTX 4090 | |
| AMD Ryzen 9 9900X, NVIDIA GeForce RTX 4090 | |
| Power Consumption / Witcher 3 ultra Efficiency (external Monitor) | |
| Intel Core Ultra 9 285K, NVIDIA GeForce RTX 4090 | |
| AMD Ryzen 7 7800X3D, NVIDIA GeForce RTX 4090 | |
| Intel Core i5-12400F, NVIDIA GeForce RTX 4090 | |
| Intel Core Ultra 5 245K, NVIDIA GeForce RTX 4090 | |
| AMD Ryzen 9 7950X3D, NVIDIA GeForce RTX 4090 | |
| AMD Ryzen 9 9900X, NVIDIA GeForce RTX 4090 | |
| AMD Ryzen 9 9950X, NVIDIA GeForce RTX 4090 | |
| AMD Ryzen 9 7950X, NVIDIA GeForce RTX 4090 | |
| Intel Core i9-14900K, NVIDIA GeForce RTX 4090 | |
| Intel Core i5-14600K, NVIDIA GeForce RTX 4090 | |
| Intel Core i5-13400, NVIDIA GeForce RTX 4090 | |
| Intel Core i7-14700K, NVIDIA GeForce RTX 4090 | |
| Intel Core i9-14900K, NVIDIA GeForce RTX 4090 | |
L'impressione generale di Notebookcheck sul Core Ultra 9 285K
L'Intel Core Ultra 9 285K riesce a offrire i livelli Core i9-14900K di prestazioni CPU grezze a livelli di potenza inferiori.
Le prestazioni di gioco, tuttavia, non sono all'altezza, il che mette in discussione il suo prezzo di 589 dollari.
I giocatori più accaniti potrebbero voler aspettare il lancio dei chip Ryzen 9000X3D all'inizio di novembre prima di spendere i loro soldi.
Transparency
La selezione dei dispositivi da recensire viene effettuata dalla nostra redazione. Il campione di prova è stato fornito all'autore come prestito dal produttore o dal rivenditore ai fini di questa recensione. L'istituto di credito non ha avuto alcuna influenza su questa recensione, né il produttore ne ha ricevuto una copia prima della pubblicazione. Non vi era alcun obbligo di pubblicare questa recensione. Non accettiamo mai compensi o pagamenti in cambio delle nostre recensioni. In quanto società mediatica indipendente, Notebookcheck non è soggetta all'autorità di produttori, rivenditori o editori.
Ecco come Notebookcheck esegue i test
Ogni anno, Notebookcheck esamina in modo indipendente centinaia di laptop e smartphone utilizzando procedure standardizzate per garantire che tutti i risultati siano comparabili. Da circa 20 anni sviluppiamo continuamente i nostri metodi di prova e nel frattempo stabiliamo gli standard di settore. Nei nostri laboratori di prova, tecnici ed editori esperti utilizzano apparecchiature di misurazione di alta qualità. Questi test comportano un processo di validazione in più fasi. Il nostro complesso sistema di valutazione si basa su centinaia di misurazioni e parametri di riferimento ben fondati, che mantengono l'obiettività.


