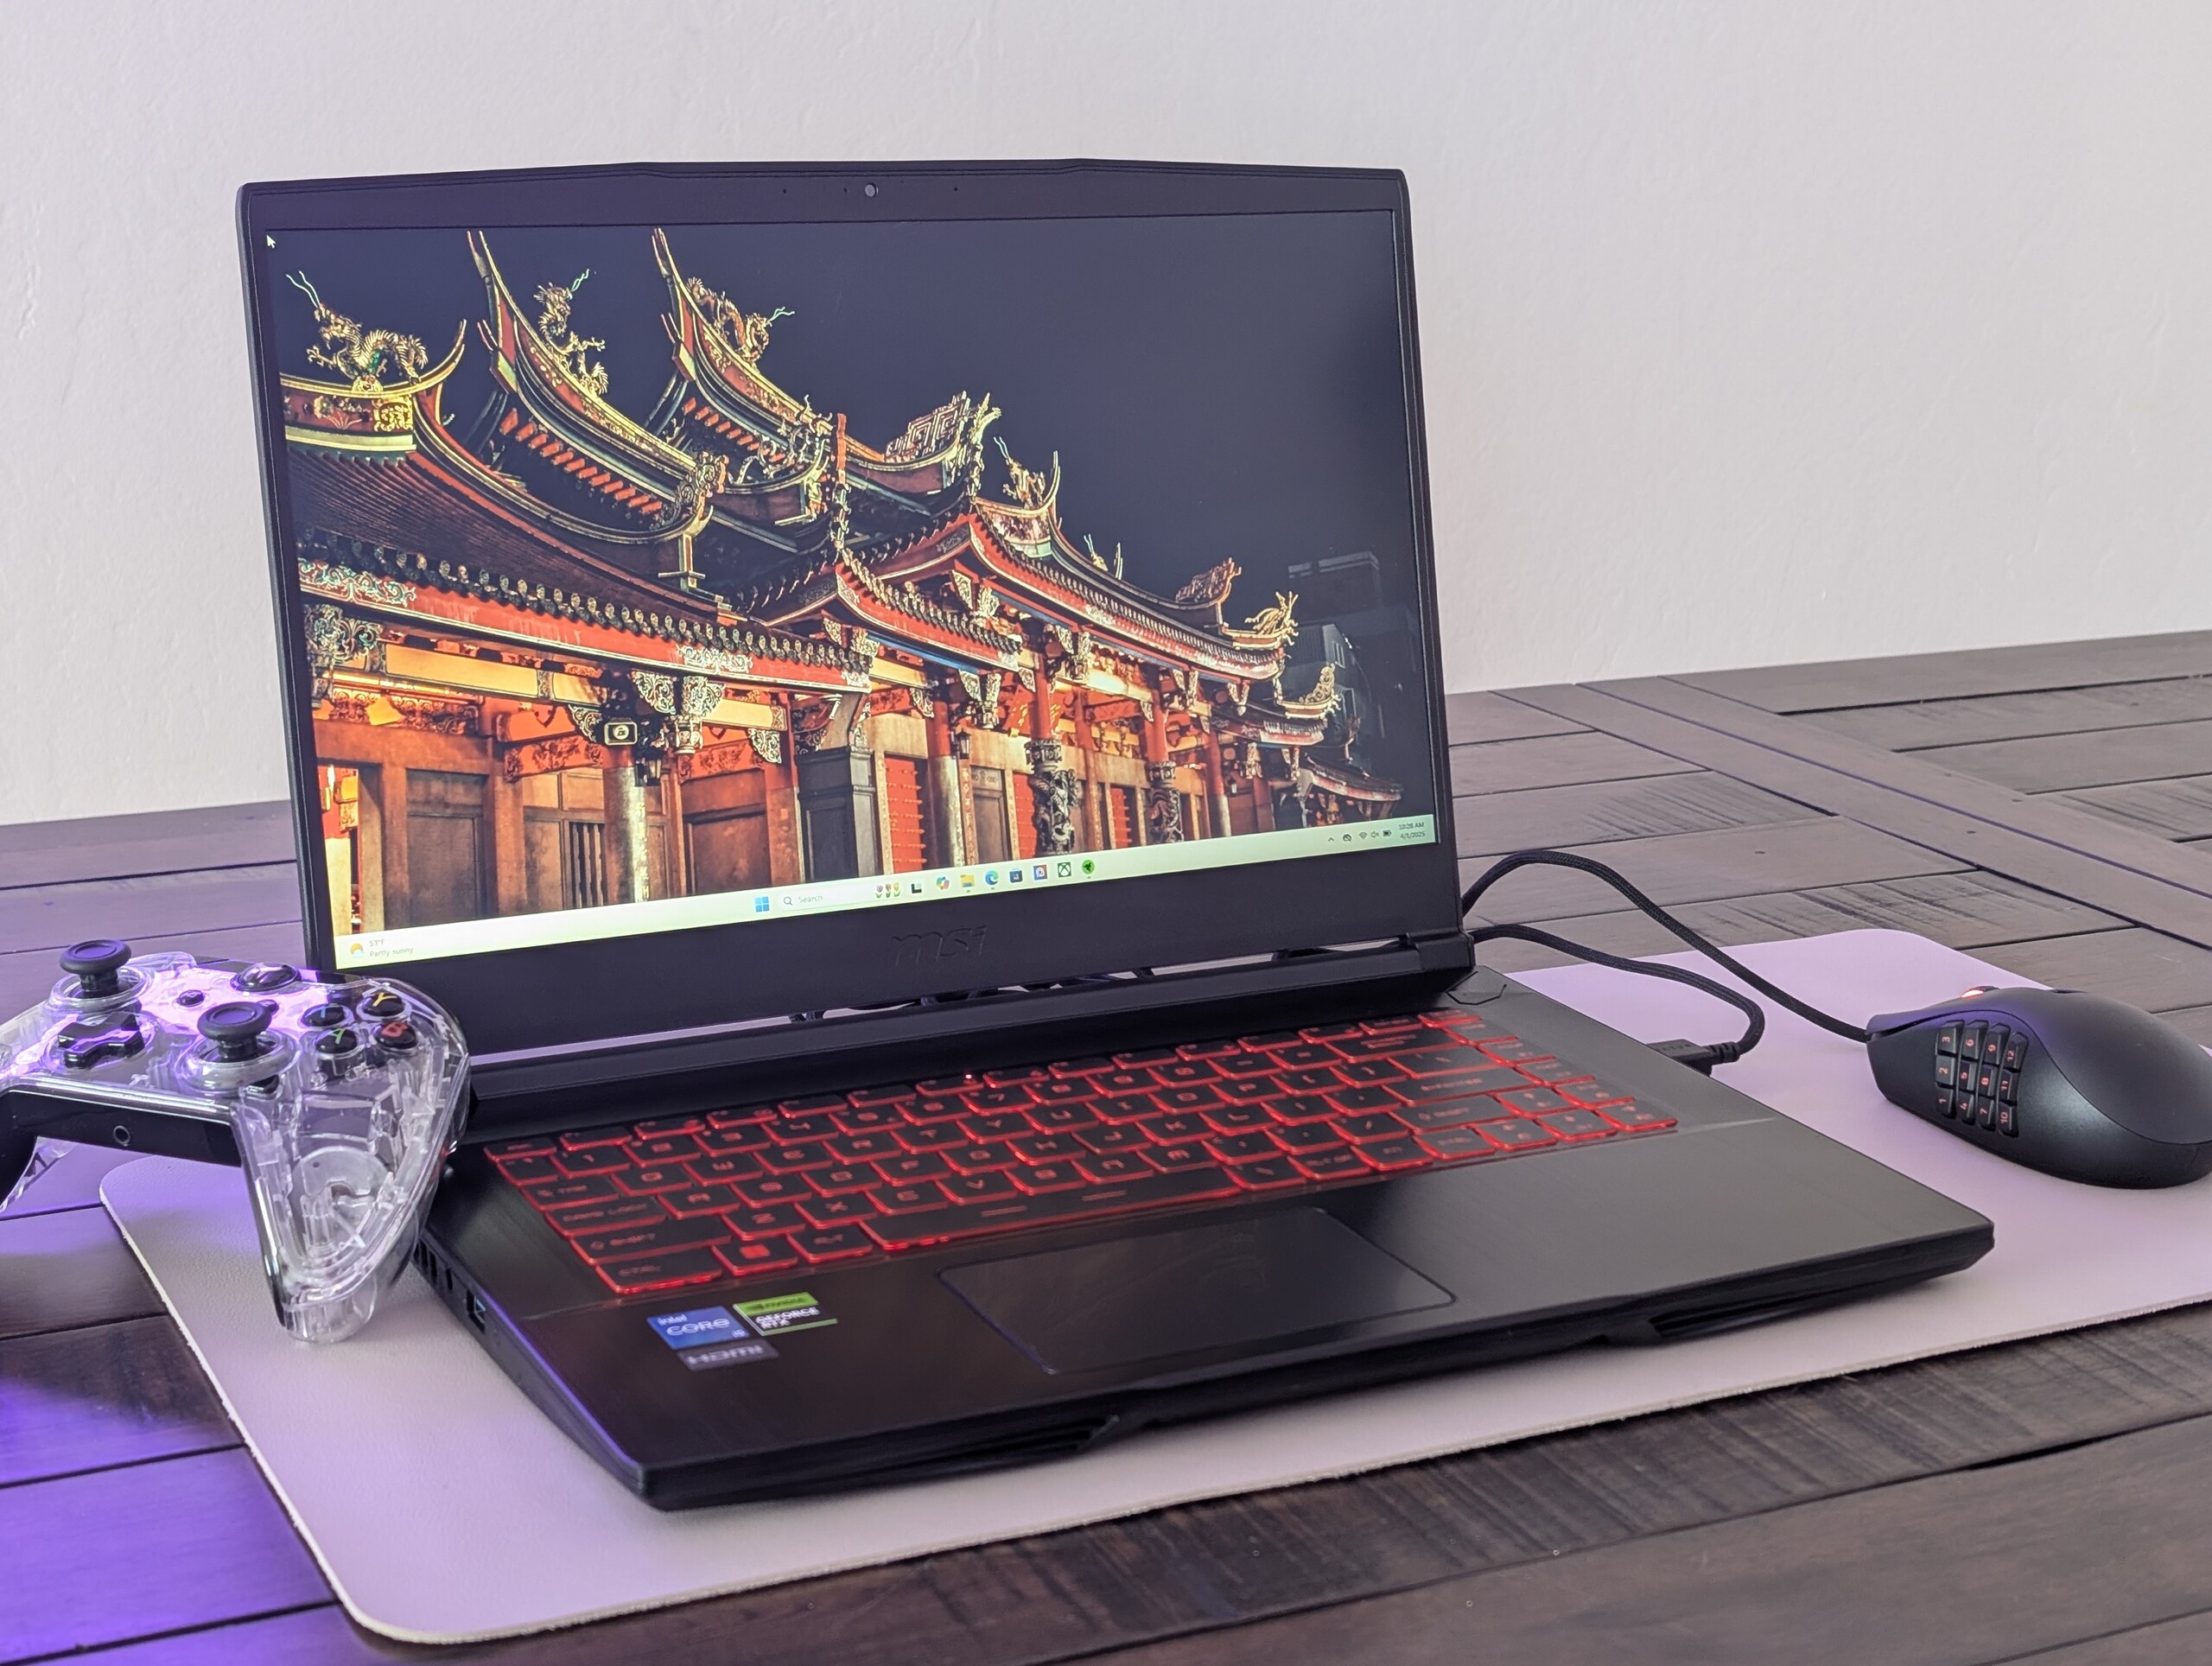
Recensione del portatile MSI Thin GF63 12VE: GeForce Gioco con RTX 4050 e 8 GB di RAM
Tagliare qualche angolo di troppo.
Il laptop da gioco da 15,6 pollici meno costoso di MSI presenta caratteristiche moderne come uno schermo IPS da 144 Hz, grafica GeForce RTX 4050 e un processore della serie Core-H. Tuttavia, è meglio evitare alcune SKU, soprattutto quelle con soli 8 GB di RAM.Allen Ngo, 👁 Allen Ngo (traduzione a cura di DeepL / Ninh Duy) Pubblicato 🇺🇸 🇫🇷 ...
Verdetto - Acquistare la configurazione da 16 GB
Il prezzo inferiore a 900 dollari è sufficiente per convincere qualsiasi giocatore economico a interessarsi a MSI GF63. Le sue specifiche spuntano molte caselle, tra cui la veloce frequenza di aggiornamento di 144 Hz, la GPU RTX 4050 di GeForce, la CPU relativamente nuova di 12° generazione Core i5 o i7 serie H e 512 GB di storage. Non si tratta di una macchina lenta nel suo nucleo e diventerà sempre più conveniente ora che i laptop GeForce RTX 50 stanno arrivando sul mercato. Il sistema MSI è anche più leggero di molte alternative, tra cui l' Acer Nitro V 15 o Lenovo LOQ 15.
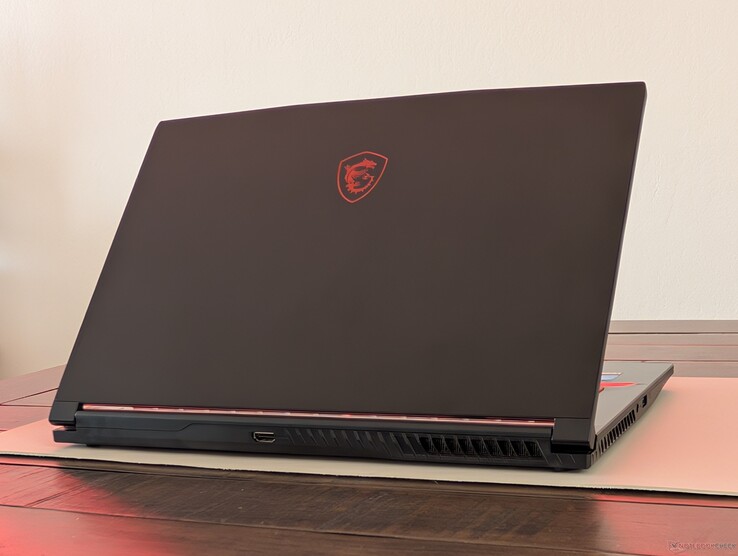
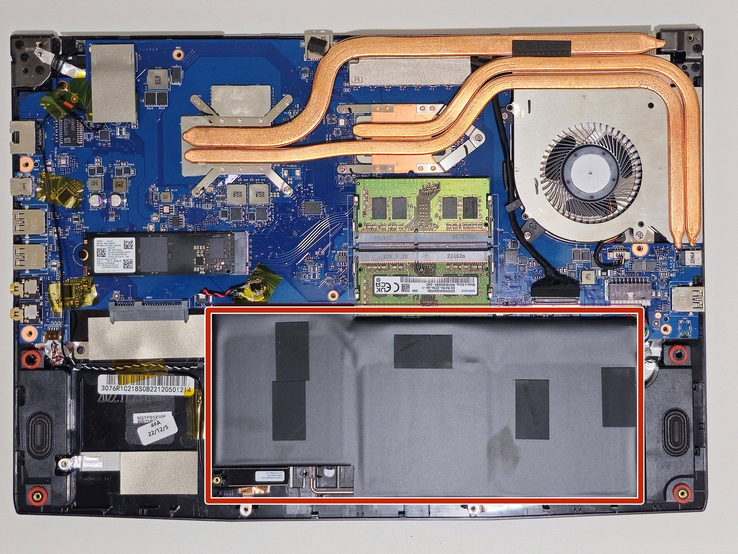
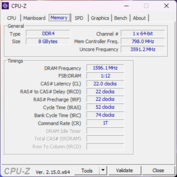
Sfortunatamente, l'esperienza utente rimane invariata rispetto al modello modello del 2020 il che significa che lo chassis sembra ancora economico e che qualsiasi intervento di manutenzione da parte dell'utente finale richiede la rottura dell'adesivo di fabbrica anti-manomissione. Le SKU con 8 GB di RAM dovrebbero quindi essere evitate, poiché la memoria limitata influisce sulle prestazioni complessive, mentre l'adesivo di fabbrica scoraggia qualsiasi tipo di aggiornamento.
Pro
Contro
Prezzo e disponibilità
La versione Core i7 di MSI Thin GF63 è ora disponibile su Amazon a 860 dollari.
GF63 è la linea di laptop da gioco meno costosa di MSI, pensata per i giocatori attenti al budget che desiderano la grafica RTX di GeForce senza tutti i fronzoli. Sono passati 5 anni da quando abbiamo recensito l'ultimo GF63 e quindi questo ultimo modello è dotato di opzioni di GPU Intel Alder Lake e Ada Lovelace molto più recenti.
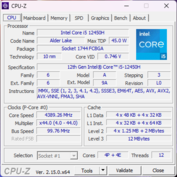
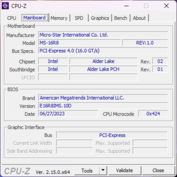
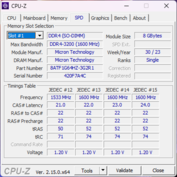
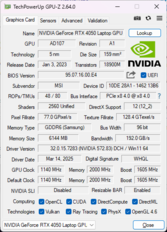
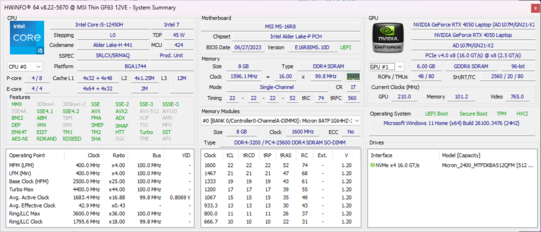
La nostra unità di prova è una configurazione di fascia bassa ampiamente disponibile presso rivenditori come Target e Amazon. Viene fornita con il Core i5-12450H, RTX 4050 da 6 GB, 8 GB di RAM e display IPS 1080p da 144 Hz per circa 850-900 dollari. Sono disponibili anche SKU con Core i7-12650H, RTX 4060 e il doppio della RAM.
I concorrenti includono altri portatili da gioco entry-level come Lenovo LOQ 15, Asus TUF A15 e Acer Nitro V 15.
Altre recensioni di MSI:
I nostri Top 10
» Top 10 Portatili Multimedia
» Top 10 Portatili Gaming
» Top 10 Portatili Gaming Leggeri
» Top 10 Portatili da Ufficio e Business economici
» Top 10 Portatili Premium da Ufficio/Business
» Top 10 Portatili sotto i 300 Euro
» Top 10 Portatili sotto i 500 Euro
» Top 10 dei Portatili Workstation
» Top 10 Subnotebooks
» Top 10 Ultrabooks
» Top 10 Convertibili
» Top 10 Tablets
» Top 10 Tablets Windows
» Top 10 Smartphones
Specifiche
Caso
Connettività
Comunicazione
| Networking | |
| iperf3 transmit AX12 | |
| MSI GF63 Thin 9SC | |
| iperf3 receive AX12 | |
| MSI GF63 Thin 9SC | |
| iperf3 transmit AXE11000 | |
| Asus TUF A15 FA507 | |
| MSI Thin GF63 12VE | |
| Lenovo LOQ 15IRX9 | |
| Acer Nitro V 15 ANV15-51-582S | |
| HP Victus 15-fa1057ng | |
| iperf3 receive AXE11000 | |
| Lenovo LOQ 15IRX9 | |
| Acer Nitro V 15 ANV15-51-582S | |
| Asus TUF A15 FA507 | |
| MSI Thin GF63 12VE | |
| HP Victus 15-fa1057ng | |
Webcam
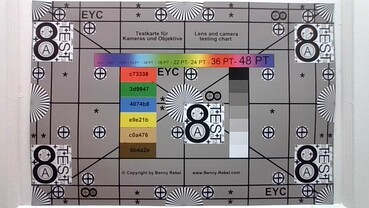
Non c'è un sensore IR o un cursore fisico della fotocamera. Invece, la fotocamera può spegnersi elettronicamente tramite un tasto di scelta rapida.
Manutenzione
Sostenibilità
MSI non pubblicizza alcuna misura di sostenibilità per la serie GF63. L'imballaggio, tuttavia, è costituito per lo più da carta e cartone.
Accessori e garanzia
Non ci sono extra nella confezione. Si applica la garanzia limitata standard di un anno del produttore.
Dispositivi di ingresso
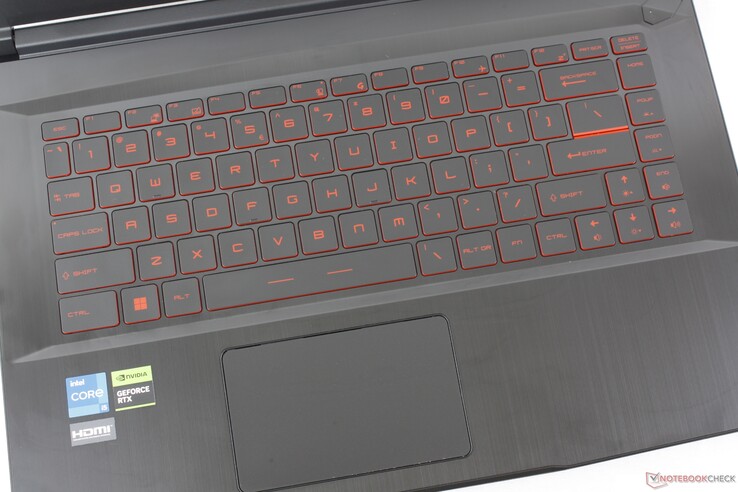
Tastiera e touchpad
Display
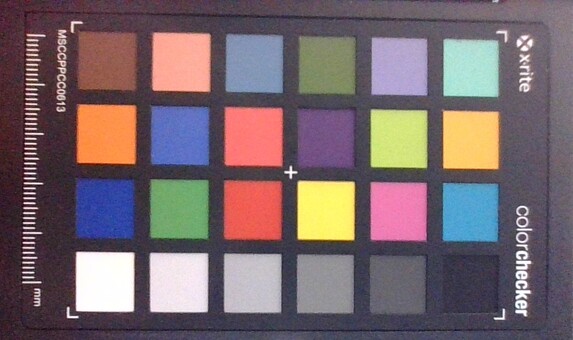
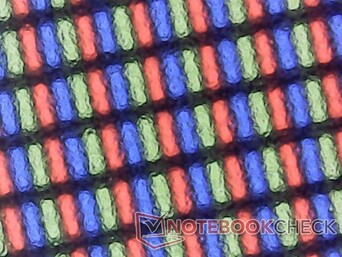
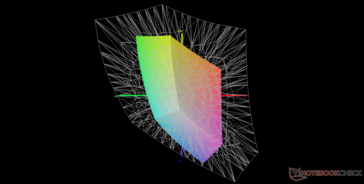
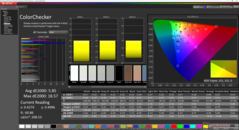
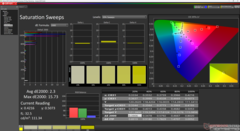
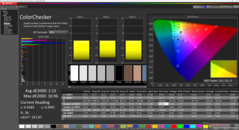
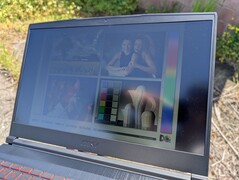
Il nostro pannello IPS AU Optronics B156HAN08.4 rappresenta un aggiornamento rispetto al pannello AU Optronics B156HAN02.1 del GF63 2020 in termini di frequenza di aggiornamento nativa e tempi di risposta. Tuttavia, la copertura sRGB e la luminosità rimangono deboli.
| |||||||||||||||||||||||||
Distribuzione della luminosità: 96 %
Al centro con la batteria: 248.6 cd/m²
Contrasto: 1381:1 (Nero: 0.18 cd/m²)
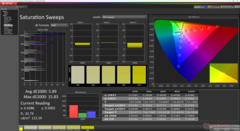
ΔE Color 5.85 | 0.5-29.43 Ø4.88, calibrated: 2.52
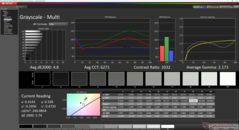
ΔE Greyscale 4.8 | 0.5-98 Ø5.1
40.5% AdobeRGB 1998 (Argyll 2.2.0 3D)
58.4% sRGB (Argyll 2.2.0 3D)
39.2% Display P3 (Argyll 2.2.0 3D)
Gamma: 2.17
| MSI Thin GF63 12VE AU Optronics B156HAN08.4, IPS, 1920x1080, 15.6", 144 Hz | MSI GF63 Thin 9SC AU Optronics B156HAN02.1 (AUO21ED), IPS, 1920x1080, 15.6", Hz | Lenovo LOQ 15IRX9 BOE NJ NE156FHM-NX9, IPS, 1920x1080, 15.6", 144 Hz | HP Victus 15-fa1057ng BOE094D, IPS, 1920x1080, 15.6", 144 Hz | Acer Nitro V 15 ANV15-51-582S LG LP156WFJ-SPB4 (LGD0742), IPS, 1920x1080, 15.6", 144 Hz | Asus TUF A15 FA507 N156HMA-GA1, IPS, 1920x1080, 15.6", 144 Hz | |
|---|---|---|---|---|---|---|
| Display | -4% | 79% | -0% | 2% | 65% | |
| Display P3 Coverage | 39.2 | 37.76 -4% | 73.7 88% | 39.2 0% | 40 2% | 64.9 66% |
| sRGB Coverage | 58.4 | 56.5 -3% | 99.1 70% | 57.9 -1% | 60 3% | 96.5 65% |
| AdobeRGB 1998 Coverage | 40.5 | 39.01 -4% | 72.6 79% | 40.5 0% | 41.4 2% | 66.6 64% |
| Response Times | -60% | -35% | 16% | -26% | -7% | |
| Response Time Grey 50% / Grey 80% * | 25.6 ? | 44.8 ? -75% | 42.2 ? -65% | 23.8 ? 7% | 34.2 ? -34% | 30.4 ? -19% |
| Response Time Black / White * | 21.8 ? | 31.6 ? -45% | 22.6 ? -4% | 16.3 ? 25% | 25.8 ? -18% | 20.8 ? 5% |
| PWM Frequency | ||||||
| Screen | 4% | 27% | -12% | -14% | 34% | |
| Brightness middle | 248.6 | 260 5% | 306 23% | 273 10% | 292 17% | 288 16% |
| Brightness | 257 | 249 -3% | 287 12% | 249 -3% | 263 2% | 271 5% |
| Brightness Distribution | 96 | 92 -4% | 88 -8% | 84 -12% | 80 -17% | 91 -5% |
| Black Level * | 0.18 | 0.23 -28% | 0.21 -17% | 0.28 -56% | 0.25 -39% | 0.17 6% |
| Contrast | 1381 | 1130 -18% | 1457 6% | 975 -29% | 1168 -15% | 1694 23% |
| Colorchecker dE 2000 * | 5.85 | 4.1 30% | 2.25 62% | 5.19 11% | 7.15 -22% | 1.9 68% |
| Colorchecker dE 2000 max. * | 18.57 | 7.93 57% | 4.84 74% | 21.16 -14% | 15.51 16% | 3.3 82% |
| Colorchecker dE 2000 calibrated * | 2.52 | 3.56 -41% | 1.45 42% | 4.54 -80% | 4.13 -64% | 0.9 64% |
| Greyscale dE 2000 * | 4.8 | 2.83 41% | 2.4 50% | 1.7 65% | 4.9 -2% | 2.7 44% |
| Gamma | 2.17 101% | 2.53 87% | 2.259 97% | 2.148 102% | 2.014 109% | 2.32 95% |
| CCT | 6271 104% | 6158 106% | 6790 96% | 6819 95% | 7178 91% | 6535 99% |
| Color Space (Percent of AdobeRGB 1998) | 36 | |||||
| Color Space (Percent of sRGB) | 56 | |||||
| Media totale (Programma / Settaggio) | -20% /
-7% | 24% /
29% | 1% /
-6% | -13% /
-12% | 31% /
35% |
* ... Meglio usare valori piccoli
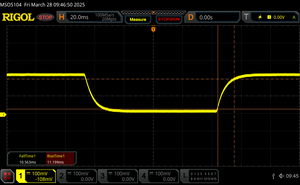
Tempi di risposta del Display
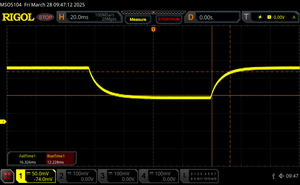
| ↔ Tempi di risposta dal Nero al Bianco | ||
|---|---|---|
| 21.8 ms ... aumenta ↗ e diminuisce ↘ combinato | ↗ 11.2 ms Incremento | |
| ↘ 10.6 ms Calo | ||
| Lo schermo mostra buoni tempi di risposta durante i nostri tests, ma potrebbe essere troppo lento per i gamers competitivi. In confronto, tutti i dispositivi di test variano da 0.1 (minimo) a 240 (massimo) ms. » 45 % di tutti i dispositivi è migliore. Questo significa che i tempi di risposta rilevati sono simili alla media di tutti i dispositivi testati (20.8 ms). | ||
| ↔ Tempo di risposta dal 50% Grigio all'80% Grigio | ||
| 25.6 ms ... aumenta ↗ e diminuisce ↘ combinato | ↗ 12.2 ms Incremento | |
| ↘ 13.4 ms Calo | ||
| Lo schermo mostra tempi di risposta relativamente lenti nei nostri tests e potrebbe essere troppo lento per i gamers. In confronto, tutti i dispositivi di test variano da 0.165 (minimo) a 636 (massimo) ms. » 33 % di tutti i dispositivi è migliore. Questo significa che i tempi di risposta rilevati sono migliori rispettto alla media di tutti i dispositivi testati (32.5 ms). | ||
Sfarfallio dello schermo / PWM (Pulse-Width Modulation)
| flickering dello schermo / PWM non rilevato | |||
In confronto: 53 % di tutti i dispositivi testati non utilizza PWM per ridurre la luminosita' del display. Se è rilevato PWM, una media di 8527 (minimo: 5 - massimo: 343500) Hz è stata rilevata. | |||
Prestazioni
Condizioni del test
Abbiamo impostato MSI Center in modalità Extreme Performance prima di eseguire i benchmark qui sotto.
Processore
Cinebench R15 Multi Loop
Cinebench R23: Multi Core | Single Core
Cinebench R20: CPU (Multi Core) | CPU (Single Core)
Cinebench R15: CPU Multi 64Bit | CPU Single 64Bit
Blender: v2.79 BMW27 CPU
7-Zip 18.03: 7z b 4 | 7z b 4 -mmt1
Geekbench 6.4: Multi-Core | Single-Core
Geekbench 5.5: Multi-Core | Single-Core
HWBOT x265 Benchmark v2.2: 4k Preset
LibreOffice : 20 Documents To PDF
R Benchmark 2.5: Overall mean
| CPU Performance Rating | |
| Asus TUF Gaming A15 FA507UV | |
| Gigabyte G5 KF5 2024 | |
| Lenovo LOQ 15IRH8 Core i7 | |
| Lenovo LOQ 15IRX9 | |
| HP Victus 15 fa0020nr -2! | |
| Gigabyte G5 KE -2! | |
| HP Victus 15-fa1057ng -4! | |
| Acer Nitro V 15 ANV15-51-582S | |
| Media Intel Core i5-12450H | |
| MSI Thin GF63 12VE | |
| Lenovo IdeaPad Gaming 3 15ARH7 -2! | |
| Cinebench R20 / CPU (Multi Core) | |
| Asus TUF Gaming A15 FA507UV | |
| Lenovo LOQ 15IRX9 | |
| HP Victus 15 fa0020nr | |
| Lenovo LOQ 15IRH8 Core i7 | |
| Gigabyte G5 KF5 2024 | |
| HP Victus 15-fa1057ng | |
| Gigabyte G5 KE | |
| Acer Nitro V 15 ANV15-51-582S | |
| MSI Thin GF63 12VE | |
| Lenovo IdeaPad Gaming 3 15ARH7 | |
| Media Intel Core i5-12450H (2952 - 4105, n=6) | |
| Cinebench R20 / CPU (Single Core) | |
| Lenovo LOQ 15IRH8 Core i7 | |
| Gigabyte G5 KF5 2024 | |
| HP Victus 15 fa0020nr | |
| Asus TUF Gaming A15 FA507UV | |
| HP Victus 15-fa1057ng | |
| Acer Nitro V 15 ANV15-51-582S | |
| Lenovo LOQ 15IRX9 | |
| Media Intel Core i5-12450H (622 - 646, n=6) | |
| Gigabyte G5 KE | |
| MSI Thin GF63 12VE | |
| Lenovo IdeaPad Gaming 3 15ARH7 | |
| Cinebench R15 / CPU Multi 64Bit | |
| Asus TUF Gaming A15 FA507UV | |
| HP Victus 15 fa0020nr | |
| Lenovo LOQ 15IRX9 | |
| Gigabyte G5 KF5 2024 | |
| Lenovo LOQ 15IRH8 Core i7 | |
| HP Victus 15-fa1057ng | |
| Gigabyte G5 KE | |
| Acer Nitro V 15 ANV15-51-582S | |
| Lenovo IdeaPad Gaming 3 15ARH7 | |
| MSI Thin GF63 12VE | |
| Media Intel Core i5-12450H (1150 - 1591, n=6) | |
| Cinebench R15 / CPU Single 64Bit | |
| Asus TUF Gaming A15 FA507UV | |
| Gigabyte G5 KF5 2024 | |
| Lenovo LOQ 15IRH8 Core i7 | |
| HP Victus 15 fa0020nr | |
| Gigabyte G5 KE | |
| HP Victus 15-fa1057ng | |
| Acer Nitro V 15 ANV15-51-582S | |
| Lenovo LOQ 15IRX9 | |
| Media Intel Core i5-12450H (225 - 239, n=6) | |
| Lenovo IdeaPad Gaming 3 15ARH7 | |
| MSI Thin GF63 12VE | |
| Geekbench 6.4 / Multi-Core | |
| Gigabyte G5 KF5 2024 | |
| Lenovo LOQ 15IRX9 | |
| Asus TUF Gaming A15 FA507UV | |
| Lenovo LOQ 15IRH8 Core i7 | |
| Acer Nitro V 15 ANV15-51-582S | |
| Media Intel Core i5-12450H (7081 - 9109, n=7) | |
| MSI Thin GF63 12VE | |
| Geekbench 6.4 / Single-Core | |
| Asus TUF Gaming A15 FA507UV | |
| Lenovo LOQ 15IRH8 Core i7 | |
| Gigabyte G5 KF5 2024 | |
| Lenovo LOQ 15IRX9 | |
| Acer Nitro V 15 ANV15-51-582S | |
| Media Intel Core i5-12450H (2155 - 2293, n=7) | |
| MSI Thin GF63 12VE | |
| Geekbench 5.5 / Multi-Core | |
| Lenovo LOQ 15IRX9 | |
| Asus TUF Gaming A15 FA507UV | |
| Gigabyte G5 KF5 2024 | |
| Lenovo LOQ 15IRH8 Core i7 | |
| HP Victus 15 fa0020nr | |
| Gigabyte G5 KE | |
| Acer Nitro V 15 ANV15-51-582S | |
| Media Intel Core i5-12450H (6777 - 8330, n=7) | |
| MSI Thin GF63 12VE | |
| Lenovo IdeaPad Gaming 3 15ARH7 | |
| Geekbench 5.5 / Single-Core | |
| Asus TUF Gaming A15 FA507UV | |
| Lenovo LOQ 15IRH8 Core i7 | |
| Gigabyte G5 KF5 2024 | |
| HP Victus 15 fa0020nr | |
| Lenovo LOQ 15IRX9 | |
| Acer Nitro V 15 ANV15-51-582S | |
| Gigabyte G5 KE | |
| Media Intel Core i5-12450H (1527 - 1665, n=7) | |
| MSI Thin GF63 12VE | |
| Lenovo IdeaPad Gaming 3 15ARH7 | |
| HWBOT x265 Benchmark v2.2 / 4k Preset | |
| Asus TUF Gaming A15 FA507UV | |
| Gigabyte G5 KF5 2024 | |
| Lenovo LOQ 15IRX9 | |
| Gigabyte G5 KE | |
| Lenovo LOQ 15IRH8 Core i7 | |
| HP Victus 15 fa0020nr | |
| HP Victus 15-fa1057ng | |
| Acer Nitro V 15 ANV15-51-582S | |
| Lenovo IdeaPad Gaming 3 15ARH7 | |
| MSI Thin GF63 12VE | |
| Media Intel Core i5-12450H (8.78 - 12.3, n=6) | |
| LibreOffice / 20 Documents To PDF | |
| HP Victus 15-fa1057ng | |
| MSI Thin GF63 12VE | |
| Acer Nitro V 15 ANV15-51-582S | |
| Lenovo LOQ 15IRX9 | |
| Lenovo IdeaPad Gaming 3 15ARH7 | |
| Gigabyte G5 KE | |
| Gigabyte G5 KF5 2024 | |
| HP Victus 15 fa0020nr | |
| Media Intel Core i5-12450H (41.1 - 60.3, n=7) | |
| Asus TUF Gaming A15 FA507UV | |
| Lenovo LOQ 15IRH8 Core i7 | |
| R Benchmark 2.5 / Overall mean | |
| MSI Thin GF63 12VE | |
| Lenovo IdeaPad Gaming 3 15ARH7 | |
| Media Intel Core i5-12450H (0.4949 - 0.54, n=7) | |
| Acer Nitro V 15 ANV15-51-582S | |
| HP Victus 15-fa1057ng | |
| Gigabyte G5 KE | |
| Lenovo LOQ 15IRX9 | |
| HP Victus 15 fa0020nr | |
| Lenovo LOQ 15IRH8 Core i7 | |
| Gigabyte G5 KF5 2024 | |
| Asus TUF Gaming A15 FA507UV | |
* ... Meglio usare valori piccoli
AIDA64: FP32 Ray-Trace | FPU Julia | CPU SHA3 | CPU Queen | FPU SinJulia | FPU Mandel | CPU AES | CPU ZLib | FP64 Ray-Trace | CPU PhotoWorxx
| Performance Rating | |
| Asus TUF A15 FA507 | |
| Lenovo LOQ 15IRX9 | |
| HP Victus 15-fa1057ng | |
| Acer Nitro V 15 ANV15-51-582S | |
| MSI Thin GF63 12VE | |
| Media Intel Core i5-12450H | |
| AIDA64 / FP32 Ray-Trace | |
| Asus TUF A15 FA507 | |
| Lenovo LOQ 15IRX9 | |
| HP Victus 15-fa1057ng | |
| Acer Nitro V 15 ANV15-51-582S | |
| MSI Thin GF63 12VE | |
| Media Intel Core i5-12450H (7229 - 10474, n=6) | |
| AIDA64 / FPU Julia | |
| Asus TUF A15 FA507 | |
| Lenovo LOQ 15IRX9 | |
| Acer Nitro V 15 ANV15-51-582S | |
| HP Victus 15-fa1057ng | |
| MSI Thin GF63 12VE | |
| Media Intel Core i5-12450H (37583 - 51636, n=6) | |
| AIDA64 / CPU SHA3 | |
| Lenovo LOQ 15IRX9 | |
| Asus TUF A15 FA507 | |
| Acer Nitro V 15 ANV15-51-582S | |
| HP Victus 15-fa1057ng | |
| MSI Thin GF63 12VE | |
| Media Intel Core i5-12450H (1724 - 2359, n=6) | |
| AIDA64 / CPU Queen | |
| Asus TUF A15 FA507 | |
| Lenovo LOQ 15IRX9 | |
| HP Victus 15-fa1057ng | |
| Acer Nitro V 15 ANV15-51-582S | |
| MSI Thin GF63 12VE | |
| Media Intel Core i5-12450H (59539 - 68897, n=6) | |
| AIDA64 / FPU SinJulia | |
| Asus TUF A15 FA507 | |
| Lenovo LOQ 15IRX9 | |
| HP Victus 15-fa1057ng | |
| Acer Nitro V 15 ANV15-51-582S | |
| MSI Thin GF63 12VE | |
| Media Intel Core i5-12450H (5007 - 6147, n=6) | |
| AIDA64 / FPU Mandel | |
| Asus TUF A15 FA507 | |
| Lenovo LOQ 15IRX9 | |
| HP Victus 15-fa1057ng | |
| Acer Nitro V 15 ANV15-51-582S | |
| MSI Thin GF63 12VE | |
| Media Intel Core i5-12450H (18516 - 25115, n=6) | |
| AIDA64 / CPU AES | |
| Acer Nitro V 15 ANV15-51-582S | |
| Lenovo LOQ 15IRX9 | |
| Asus TUF A15 FA507 | |
| Media Intel Core i5-12450H (46835 - 78537, n=6) | |
| HP Victus 15-fa1057ng | |
| MSI Thin GF63 12VE | |
| AIDA64 / CPU ZLib | |
| Lenovo LOQ 15IRX9 | |
| HP Victus 15-fa1057ng | |
| Acer Nitro V 15 ANV15-51-582S | |
| MSI Thin GF63 12VE | |
| Asus TUF A15 FA507 | |
| Media Intel Core i5-12450H (490 - 708, n=6) | |
| AIDA64 / FP64 Ray-Trace | |
| Asus TUF A15 FA507 | |
| Lenovo LOQ 15IRX9 | |
| HP Victus 15-fa1057ng | |
| Acer Nitro V 15 ANV15-51-582S | |
| MSI Thin GF63 12VE | |
| Media Intel Core i5-12450H (4025 - 5614, n=6) | |
| AIDA64 / CPU PhotoWorxx | |
| Lenovo LOQ 15IRX9 | |
| Asus TUF A15 FA507 | |
| HP Victus 15-fa1057ng | |
| Media Intel Core i5-12450H (12271 - 28682, n=6) | |
| Acer Nitro V 15 ANV15-51-582S | |
| MSI Thin GF63 12VE | |
Prestazioni del sistema
CrossMark: Overall | Productivity | Creativity | Responsiveness
WebXPRT 3: Overall
WebXPRT 4: Overall
Mozilla Kraken 1.1: Total
| PCMark 10 / Score | |
| Asus TUF A15 FA507 | |
| Lenovo LOQ 15IRX9 | |
| HP Victus 15-fa1057ng | |
| Acer Nitro V 15 ANV15-51-582S | |
| MSI Thin GF63 12VE | |
| Media Intel Core i5-12450H, NVIDIA GeForce RTX 4050 Laptop GPU (n=1) | |
| MSI GF63 Thin 9SC | |
| PCMark 10 / Essentials | |
| Asus TUF A15 FA507 | |
| HP Victus 15-fa1057ng | |
| Acer Nitro V 15 ANV15-51-582S | |
| Lenovo LOQ 15IRX9 | |
| MSI Thin GF63 12VE | |
| Media Intel Core i5-12450H, NVIDIA GeForce RTX 4050 Laptop GPU (n=1) | |
| MSI GF63 Thin 9SC | |
| PCMark 10 / Productivity | |
| Asus TUF A15 FA507 | |
| HP Victus 15-fa1057ng | |
| Lenovo LOQ 15IRX9 | |
| Acer Nitro V 15 ANV15-51-582S | |
| MSI Thin GF63 12VE | |
| Media Intel Core i5-12450H, NVIDIA GeForce RTX 4050 Laptop GPU (n=1) | |
| MSI GF63 Thin 9SC | |
| PCMark 10 / Digital Content Creation | |
| Lenovo LOQ 15IRX9 | |
| Asus TUF A15 FA507 | |
| HP Victus 15-fa1057ng | |
| Acer Nitro V 15 ANV15-51-582S | |
| MSI Thin GF63 12VE | |
| Media Intel Core i5-12450H, NVIDIA GeForce RTX 4050 Laptop GPU (n=1) | |
| MSI GF63 Thin 9SC | |
| CrossMark / Overall | |
| Lenovo LOQ 15IRX9 | |
| Asus TUF A15 FA507 | |
| MSI Thin GF63 12VE | |
| Media Intel Core i5-12450H, NVIDIA GeForce RTX 4050 Laptop GPU (n=1) | |
| CrossMark / Productivity | |
| Lenovo LOQ 15IRX9 | |
| MSI Thin GF63 12VE | |
| Media Intel Core i5-12450H, NVIDIA GeForce RTX 4050 Laptop GPU (n=1) | |
| Asus TUF A15 FA507 | |
| CrossMark / Creativity | |
| Lenovo LOQ 15IRX9 | |
| Asus TUF A15 FA507 | |
| MSI Thin GF63 12VE | |
| Media Intel Core i5-12450H, NVIDIA GeForce RTX 4050 Laptop GPU (n=1) | |
| CrossMark / Responsiveness | |
| Lenovo LOQ 15IRX9 | |
| MSI Thin GF63 12VE | |
| Media Intel Core i5-12450H, NVIDIA GeForce RTX 4050 Laptop GPU (n=1) | |
| Asus TUF A15 FA507 | |
| WebXPRT 3 / Overall | |
| Asus TUF A15 FA507 | |
| HP Victus 15-fa1057ng | |
| Acer Nitro V 15 ANV15-51-582S | |
| Lenovo LOQ 15IRX9 | |
| MSI Thin GF63 12VE | |
| Media Intel Core i5-12450H, NVIDIA GeForce RTX 4050 Laptop GPU (n=1) | |
| WebXPRT 4 / Overall | |
| Lenovo LOQ 15IRX9 | |
| Acer Nitro V 15 ANV15-51-582S | |
| MSI Thin GF63 12VE | |
| Media Intel Core i5-12450H, NVIDIA GeForce RTX 4050 Laptop GPU (n=1) | |
| Asus TUF A15 FA507 | |
| Mozilla Kraken 1.1 / Total | |
| Asus TUF A15 FA507 | |
| MSI Thin GF63 12VE | |
| Media Intel Core i5-12450H, NVIDIA GeForce RTX 4050 Laptop GPU (n=1) | |
| Acer Nitro V 15 ANV15-51-582S | |
| Lenovo LOQ 15IRX9 | |
| HP Victus 15-fa1057ng | |
* ... Meglio usare valori piccoli
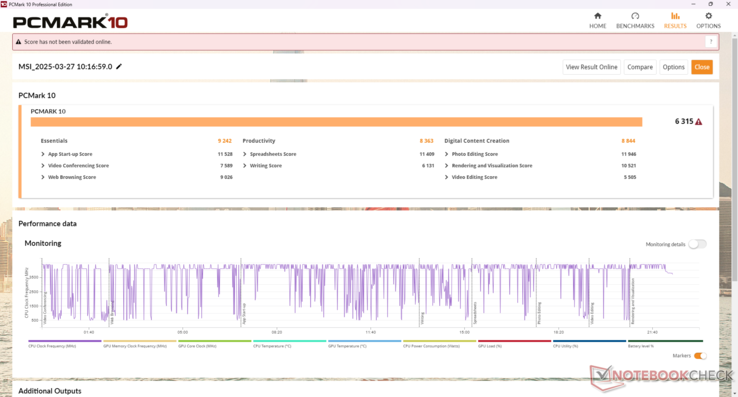
| PCMark 10 Score | 6315 punti | |
Aiuto | ||
| AIDA64 / Memory Copy | |
| Lenovo LOQ 15IRX9 | |
| Asus TUF A15 FA507 | |
| HP Victus 15-fa1057ng | |
| Media Intel Core i5-12450H (21750 - 43918, n=6) | |
| Acer Nitro V 15 ANV15-51-582S | |
| MSI Thin GF63 12VE | |
| AIDA64 / Memory Read | |
| Lenovo LOQ 15IRX9 | |
| Asus TUF A15 FA507 | |
| HP Victus 15-fa1057ng | |
| Media Intel Core i5-12450H (22956 - 47555, n=6) | |
| Acer Nitro V 15 ANV15-51-582S | |
| MSI Thin GF63 12VE | |
| AIDA64 / Memory Write | |
| Lenovo LOQ 15IRX9 | |
| Asus TUF A15 FA507 | |
| HP Victus 15-fa1057ng | |
| Media Intel Core i5-12450H (22297 - 46963, n=6) | |
| Acer Nitro V 15 ANV15-51-582S | |
| MSI Thin GF63 12VE | |
| AIDA64 / Memory Latency | |
| MSI Thin GF63 12VE | |
| Lenovo LOQ 15IRX9 | |
| Acer Nitro V 15 ANV15-51-582S | |
| HP Victus 15-fa1057ng | |
| Media Intel Core i5-12450H (76.5 - 100.9, n=6) | |
| Asus TUF A15 FA507 | |
* ... Meglio usare valori piccoli
| DPC Latencies / LatencyMon - interrupt to process latency (max), Web, Youtube, Prime95 | |
| MSI Thin GF63 12VE | |
| HP Victus 15-fa1057ng | |
| Lenovo LOQ 15IRX9 | |
| Acer Nitro V 15 ANV15-51-582S | |
* ... Meglio usare valori piccoli
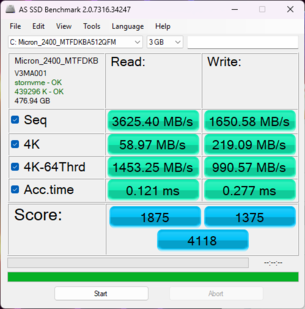
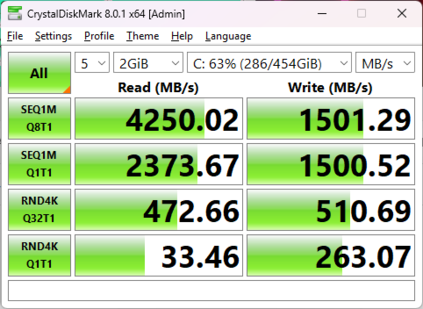
| Drive Performance Rating - Percent | |
| Acer Nitro V 15 ANV15-51-582S | |
| Lenovo LOQ 15IRX9 | |
| HP Victus 15-fa1057ng | |
| MSI Thin GF63 12VE | |
| Asus TUF A15 FA507 | |
| MSI GF63 Thin 9SC -8! | |
* ... Meglio usare valori piccoli
Disk Throttling: DiskSpd Read Loop, Queue Depth 8
Prestazioni della GPU
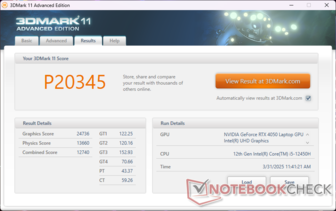
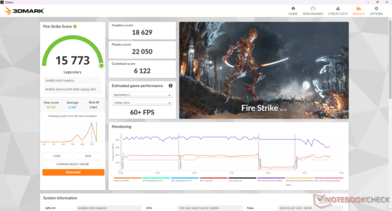
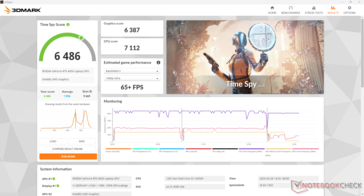
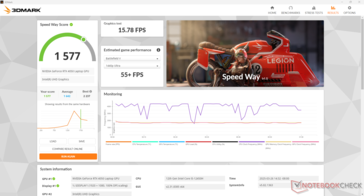
Le prestazioni grafiche sono inferiori alla media se paragonate a quelle di altri portatili con la stessa GPU RTX 4050 a causa soprattutto dei nostri limitati 8 GB di RAM di sistema.
| 3DMark Performance Rating - Percent | |
| Asus TUF Gaming A15 FA507UV -1! | |
| Lenovo LOQ 15IRX9 -1! | |
| Gigabyte G5 KF5 2024 -1! | |
| Gigabyte G5 KE | |
| Lenovo LOQ 15IRH8 Core i7 | |
| Media NVIDIA GeForce RTX 4050 Laptop GPU | |
| HP Victus 15-fa1057ng -1! | |
| Acer Nitro V 15 ANV15-51-582S -1! | |
| MSI Thin GF63 12VE | |
| Lenovo IdeaPad Gaming 3 15ARH7 -1! | |
| HP Victus 15 fa0020nr | |
| 3DMark 11 Performance | 20345 punti | |
| 3DMark Fire Strike Score | 15773 punti | |
| 3DMark Time Spy Score | 6486 punti | |
Aiuto | ||
* ... Meglio usare valori piccoli
| Tiny Tina's Wonderlands | |
| 1280x720 Lowest Preset (DX12) | |
| Media NVIDIA GeForce RTX 4050 Laptop GPU (109.3 - 250, n=4) | |
| MSI Thin GF63 12VE | |
| 1920x1080 Low Preset (DX12) | |
| Media NVIDIA GeForce RTX 4050 Laptop GPU (104.5 - 183.3, n=7) | |
| MSI Thin GF63 12VE | |
| 1920x1080 Medium Preset (DX12) | |
| Media NVIDIA GeForce RTX 4050 Laptop GPU (93.4 - 149.2, n=7) | |
| MSI Thin GF63 12VE | |
| 1920x1080 High Preset (DX12) | |
| Media NVIDIA GeForce RTX 4050 Laptop GPU (63.3 - 99.5, n=7) | |
| MSI Thin GF63 12VE | |
| 1920x1080 Badass Preset (DX12) | |
| Media NVIDIA GeForce RTX 4050 Laptop GPU (49.8 - 77.3, n=7) | |
| MSI Thin GF63 12VE | |
| F1 22 | |
| 1280x720 Ultra Low Preset AA:T AF:16x | |
| Lenovo LOQ 15IRH8 Core i7 | |
| Media NVIDIA GeForce RTX 4050 Laptop GPU (175.1 - 364, n=16) | |
| Gigabyte G5 KE | |
| MSI Thin GF63 12VE | |
| 1920x1080 Low Preset AA:T AF:16x | |
| Lenovo LOQ 15IRH8 Core i7 | |
| Gigabyte G5 KE | |
| Media NVIDIA GeForce RTX 4050 Laptop GPU (100.9 - 244, n=22) | |
| MSI Thin GF63 12VE | |
| 1920x1080 Medium Preset AA:T AF:16x | |
| Lenovo LOQ 15IRH8 Core i7 | |
| Gigabyte G5 KE | |
| Media NVIDIA GeForce RTX 4050 Laptop GPU (101.8 - 234, n=21) | |
| MSI Thin GF63 12VE | |
| 1920x1080 High Preset AA:T AF:16x | |
| Lenovo LOQ 15IRH8 Core i7 | |
| Gigabyte G5 KE | |
| Media NVIDIA GeForce RTX 4050 Laptop GPU (94.4 - 174.7, n=22) | |
| MSI Thin GF63 12VE | |
| 1920x1080 Ultra High Preset AA:T AF:16x | |
| Gigabyte G5 KE | |
| Lenovo LOQ 15IRH8 Core i7 | |
| Media NVIDIA GeForce RTX 4050 Laptop GPU (10.9 - 56.4, n=24) | |
| MSI Thin GF63 12VE | |
| Cyberpunk 2077 2.2 Phantom Liberty | |
| 1280x720 Low Preset (FSR off) | |
| Lenovo LOQ 15IRX9 | |
| Asus TUF Gaming A15 FA507UV | |
| Gigabyte G5 KF5 2024 | |
| Media NVIDIA GeForce RTX 4050 Laptop GPU (83.1 - 122, n=5) | |
| MSI Thin GF63 12VE | |
| 1920x1080 Low Preset (FSR off) | |
| Asus TUF Gaming A15 FA507UV | |
| Lenovo LOQ 15IRX9 | |
| Gigabyte G5 KF5 2024 | |
| Media NVIDIA GeForce RTX 4050 Laptop GPU (67.2 - 103.1, n=8) | |
| MSI Thin GF63 12VE | |
| 1920x1080 Medium Preset (FSR off) | |
| Asus TUF Gaming A15 FA507UV | |
| Lenovo LOQ 15IRX9 | |
| Gigabyte G5 KF5 2024 | |
| Media NVIDIA GeForce RTX 4050 Laptop GPU (50.1 - 88.6, n=9) | |
| MSI Thin GF63 12VE | |
| 1920x1080 High Preset (FSR off) | |
| Asus TUF Gaming A15 FA507UV | |
| Lenovo LOQ 15IRX9 | |
| Gigabyte G5 KF5 2024 | |
| Media NVIDIA GeForce RTX 4050 Laptop GPU (42.4 - 75, n=9) | |
| MSI Thin GF63 12VE | |
| 1920x1080 Ultra Preset (FSR off) | |
| Asus TUF Gaming A15 FA507UV | |
| Lenovo LOQ 15IRX9 | |
| Gigabyte G5 KF5 2024 | |
| Media NVIDIA GeForce RTX 4050 Laptop GPU (35.8 - 67.3, n=9) | |
| MSI Thin GF63 12VE | |
Cyberpunk 2077 ultra FPS Chart
| basso | medio | alto | ultra | |
|---|---|---|---|---|
| GTA V (2015) | 150.9 | 142.2 | 110.7 | 67.1 |
| Dota 2 Reborn (2015) | 122.7 | 108.6 | 95.9 | 90.5 |
| Final Fantasy XV Benchmark (2018) | 123.2 | 85.7 | 64.2 | |
| X-Plane 11.11 (2018) | 70.1 | 63.8 | 55.5 | |
| Far Cry 5 (2018) | 97 | 84 | 82 | 70 |
| Strange Brigade (2018) | 299 | 160.9 | 129.5 | 113.6 |
| Tiny Tina's Wonderlands (2022) | 113 | 95.6 | 72.1 | 55 |
| F1 22 (2022) | 129.2 | 126.3 | 99.3 | 40.1 |
| Baldur's Gate 3 (2023) | 82.1 | 71.3 | 64 | 63.8 |
| Cyberpunk 2077 2.2 Phantom Liberty (2023) | 76.4 | 65.1 | 55.7 | 47.3 |
Emissioni
Rumore del sistema
Si noti che il rumore della ventola quando gioca in modalità Bilanciata è uguale a quello del gioco in modalità Prestazioni (47,7 dB(A)). Si consiglia pertanto di giocare in modalità Prestazioni, in quanto non vi è un aumento significativo del rumore della ventola.
Rumorosità
| Idle |
| 24.3 / 24.3 / 24.3 dB(A) |
| Sotto carico |
| 36.2 / 59.3 dB(A) |
 | ||
30 dB silenzioso 40 dB(A) udibile 50 dB(A) rumoroso |
||
min: | ||
| MSI Thin GF63 12VE NVIDIA GeForce RTX 4050 Laptop GPU, i5-12450H, Micron 2400 MTFDKBA512QFM | MSI GF63 Thin 9SC GeForce GTX 1650 Max-Q, i5-9300H, Toshiba KBG30ZMV512G | Lenovo LOQ 15IRX9 NVIDIA GeForce RTX 4060 Laptop GPU, i5-13450HX, Micron 2400 MTFDKCD1T0QFM | HP Victus 15-fa1057ng NVIDIA GeForce RTX 4050 Laptop GPU, i5-13500H, Kioxia XG8 KXG80ZNV512G | Acer Nitro V 15 ANV15-51-582S NVIDIA GeForce RTX 4050 Laptop GPU, i5-13420H, SK hynix PC801 HFS512GEJ9X115N | Asus TUF A15 FA507 NVIDIA GeForce RTX 4050 Laptop GPU, R7 7735HS, Micron 2400 MTFDKBA512QFM | |
|---|---|---|---|---|---|---|
| Noise | -27% | -17% | -11% | -12% | 10% | |
| off /ambiente * | 24.3 | 30 -23% | 25 -3% | 25 -3% | 25 -3% | 23.3 4% |
| Idle Minimum * | 24.3 | 35 -44% | 26 -7% | 29 -19% | 25 -3% | 23.3 4% |
| Idle Average * | 24.3 | 36 -48% | 34 -40% | 30 -23% | 29 -19% | 23.3 4% |
| Idle Maximum * | 24.3 | 37 -52% | 36 -48% | 31 -28% | 30 -23% | 23.3 4% |
| Load Average * | 36.2 | 44 -22% | 48 -33% | 40 -10% | 49 -35% | 29.6 18% |
| Cyberpunk 2077 ultra * | 47.7 | 48 -1% | ||||
| Load Maximum * | 59.3 | 43 27% | 50 16% | 48 19% | 51 14% | 43 27% |
| Witcher 3 ultra * | 41 | 42 | 49 | 43 |
* ... Meglio usare valori piccoli
Temperatura
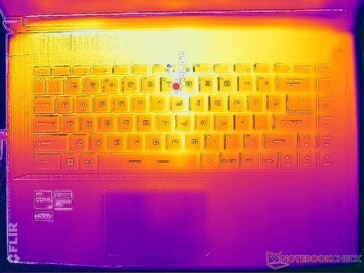
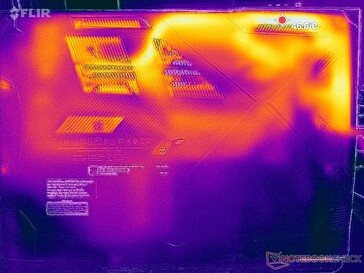
(+) La temperatura massima sul lato superiore è di 39.8 °C / 104 F, rispetto alla media di 40.4 °C / 105 F, che varia da 21.2 a 68.8 °C per questa classe Gaming.
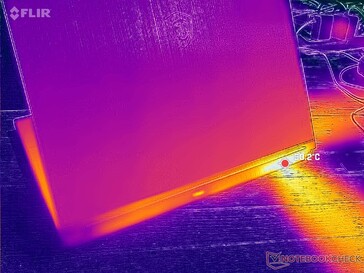
(+) Il lato inferiore si riscalda fino ad un massimo di 37.6 °C / 100 F, rispetto alla media di 43.2 °C / 110 F
(+) In idle, la temperatura media del lato superiore è di 28.5 °C / 83 F, rispetto alla media deld ispositivo di 33.9 °C / 93 F.
(+) I poggiapolsi e il touchpad sono piu' freddi della temperatura della pelle con un massimo di 24.6 °C / 76.3 F e sono quindi freddi al tatto.
(+) La temperatura media della zona del palmo della mano di dispositivi simili e'stata di 28.9 °C / 84 F (+4.3 °C / 7.7 F).
| MSI Thin GF63 12VE Intel Core i5-12450H, NVIDIA GeForce RTX 4050 Laptop GPU | MSI GF63 Thin 9SC Intel Core i5-9300H, NVIDIA GeForce GTX 1650 Max-Q | Lenovo LOQ 15IRX9 Intel Core i5-13450HX, NVIDIA GeForce RTX 4060 Laptop GPU | HP Victus 15-fa1057ng Intel Core i5-13500H, NVIDIA GeForce RTX 4050 Laptop GPU | Acer Nitro V 15 ANV15-51-582S Intel Core i5-13420H, NVIDIA GeForce RTX 4050 Laptop GPU | Asus TUF A15 FA507 AMD Ryzen 7 7735HS, NVIDIA GeForce RTX 4050 Laptop GPU | |
|---|---|---|---|---|---|---|
| Heat | 2% | -17% | 11% | 0% | 1% | |
| Maximum Upper Side * | 39.8 | 47 -18% | 47 -18% | 42 -6% | 46 -16% | 48.9 -23% |
| Maximum Bottom * | 37.6 | 47 -25% | 58 -54% | 42 -12% | 48 -28% | 44.6 -19% |
| Idle Upper Side * | 32.8 | 26 21% | 32 2% | 24 27% | 27 18% | 27.1 17% |
| Idle Bottom * | 37.6 | 26 31% | 36 4% | 24 36% | 28 26% | 27.5 27% |
* ... Meglio usare valori piccoli
Test da sforzo
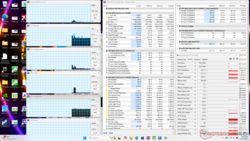
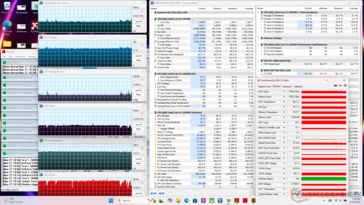
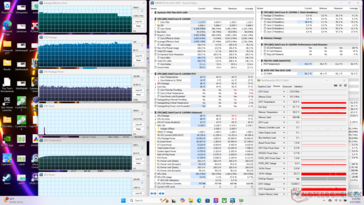
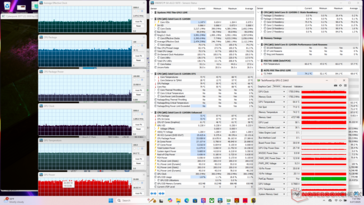
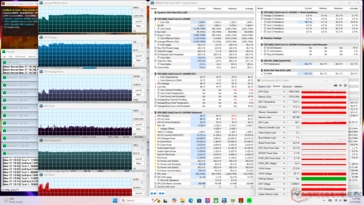
La CPU ha raggiunto 62 W, 88 C e 3,9 GHz all'avvio dello stress Prime95, prima di scendere a 2,8 GHz e 53 W pochi istanti dopo. Le temperature della CPU e della GPU durante il gioco sono decenti per un portatile da gioco, con una temperatura di <80 C anche quando si utilizza la modalità Bilanciata.
| Clock medio della CPU (GHz) | Clock della GPU (MHz) | Temperatura media della CPU (°C) | Temperatura media della GPU (°C) | |
| Sistema inattivo | -- | -- | 46 | 45 |
| Stress Prime95 | 2,9 | -- | 88 | 54 |
| Prime95 + FurMark Stress | 3,2 | 1440 | 86 | 70 |
| Cyberpunk 2077 Stress (modalità Bilanciata) | 2,4 | 1740 | 72 | 68 |
| Cyberpunk 2077 Stress (modalità Performance) | 2,4 | 1755 | 79 | 64 |
Altoparlanti
MSI Thin GF63 12VE analisi audio
(±) | potenza degli altiparlanti media ma buona (81.5 dB)
Bassi 100 - 315 Hz
(-) | quasi nessun basso - in media 18.4% inferiori alla media
(±) | la linearità dei bassi è media (14.2% delta rispetto alla precedente frequenza)
Medi 400 - 2000 Hz
(+) | medi bilanciati - solo only 2.9% rispetto alla media
(+) | medi lineari (4.3% delta rispetto alla precedente frequenza)
Alti 2 - 16 kHz
(+) | Alti bilanciati - appena 2.9% dalla media
(+) | alti lineari (4% delta rispetto alla precedente frequenza)
Nel complesso 100 - 16.000 Hz
(+) | suono nel complesso lineare (13.8% differenza dalla media)
Rispetto alla stessa classe
» 20% di tutti i dispositivi testati in questa classe è stato migliore, 6% simile, 73% peggiore
» Il migliore ha avuto un delta di 6%, medio di 18%, peggiore di 132%
Rispetto a tutti i dispositivi testati
» 14% di tutti i dispositivi testati in questa classe è stato migliore, 4% similare, 83% peggiore
» Il migliore ha avuto un delta di 4%, medio di 24%, peggiore di 134%
Apple MacBook Pro 16 2021 M1 Pro analisi audio
(+) | gli altoparlanti sono relativamente potenti (84.7 dB)
Bassi 100 - 315 Hz
(+) | bassi buoni - solo 3.8% dalla media
(+) | bassi in lineaa (5.2% delta rispetto alla precedente frequenza)
Medi 400 - 2000 Hz
(+) | medi bilanciati - solo only 1.3% rispetto alla media
(+) | medi lineari (2.1% delta rispetto alla precedente frequenza)
Alti 2 - 16 kHz
(+) | Alti bilanciati - appena 1.9% dalla media
(+) | alti lineari (2.7% delta rispetto alla precedente frequenza)
Nel complesso 100 - 16.000 Hz
(+) | suono nel complesso lineare (4.6% differenza dalla media)
Rispetto alla stessa classe
» 0% di tutti i dispositivi testati in questa classe è stato migliore, 0% simile, 100% peggiore
» Il migliore ha avuto un delta di 5%, medio di 18%, peggiore di 45%
Rispetto a tutti i dispositivi testati
» 0% di tutti i dispositivi testati in questa classe è stato migliore, 0% similare, 100% peggiore
» Il migliore ha avuto un delta di 4%, medio di 24%, peggiore di 134%
Gestione dell'energia
Consumo di energia
| Off / Standby | |
| Idle | |
| Sotto carico |
|
Leggenda:
min: | |
| MSI Thin GF63 12VE i5-12450H, NVIDIA GeForce RTX 4050 Laptop GPU, Micron 2400 MTFDKBA512QFM, IPS, 1920x1080, 15.6" | MSI GF63 Thin 9SC i5-9300H, GeForce GTX 1650 Max-Q, Toshiba KBG30ZMV512G, IPS, 1920x1080, 15.6" | Lenovo LOQ 15IRX9 i5-13450HX, NVIDIA GeForce RTX 4060 Laptop GPU, Micron 2400 MTFDKCD1T0QFM, IPS, 1920x1080, 15.6" | HP Victus 15-fa1057ng i5-13500H, NVIDIA GeForce RTX 4050 Laptop GPU, Kioxia XG8 KXG80ZNV512G, IPS, 1920x1080, 15.6" | Acer Nitro V 15 ANV15-51-582S i5-13420H, NVIDIA GeForce RTX 4050 Laptop GPU, SK hynix PC801 HFS512GEJ9X115N, IPS, 1920x1080, 15.6" | Asus TUF A15 FA507 R7 7735HS, NVIDIA GeForce RTX 4050 Laptop GPU, Micron 2400 MTFDKBA512QFM, IPS, 1920x1080, 15.6" | |
|---|---|---|---|---|---|---|
| Power Consumption | -18% | -83% | -20% | -8% | -32% | |
| Idle Minimum * | 4.3 | 7 -63% | 13 -202% | 5 -16% | 7 -63% | 8 -86% |
| Idle Average * | 9.2 | 9 2% | 18 -96% | 9 2% | 8 13% | 12.1 -32% |
| Idle Maximum * | 16.4 | 13 21% | 24 -46% | 22 -34% | 11 33% | 12.5 24% |
| Load Average * | 67 | 79 -18% | 85 -27% | 72 -7% | 76 -13% | 74.9 -12% |
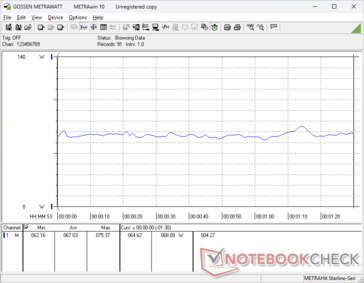
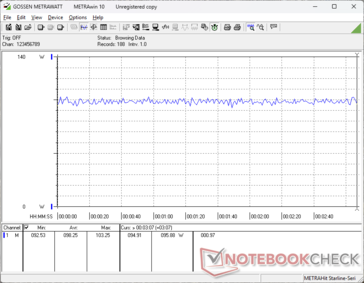
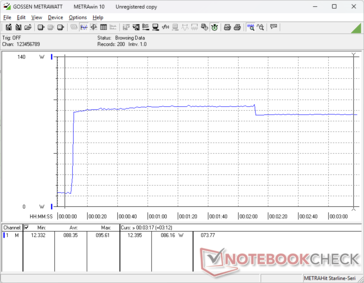
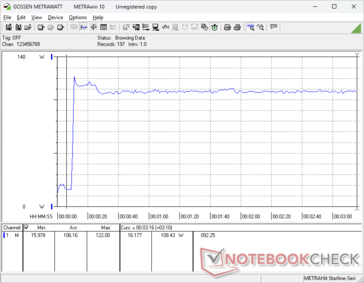
| Cyberpunk 2077 ultra external monitor * | 94.2 | 150.9 -60% | ||||
| Cyberpunk 2077 ultra * | 98.2 | 155.7 -59% | ||||
| Load Maximum * | 122 | 164 -34% | 232 -90% | 176 -44% | 136 -11% | 185 -52% |
| Witcher 3 ultra * | 73 | 113 | 98.2 | 136.6 |
* ... Meglio usare valori piccoli
Power Consumption Cyberpunk / Stress Test
Power Consumption external Monitor
Durata della batteria
| MSI Thin GF63 12VE i5-12450H, NVIDIA GeForce RTX 4050 Laptop GPU, 52.4 Wh | MSI GF63 Thin 9SC i5-9300H, GeForce GTX 1650 Max-Q, 51 Wh | Lenovo LOQ 15IRX9 i5-13450HX, NVIDIA GeForce RTX 4060 Laptop GPU, 60 Wh | HP Victus 15-fa1057ng i5-13500H, NVIDIA GeForce RTX 4050 Laptop GPU, 70 Wh | Acer Nitro V 15 ANV15-51-582S i5-13420H, NVIDIA GeForce RTX 4050 Laptop GPU, 57 Wh | Asus TUF A15 FA507 R7 7735HS, NVIDIA GeForce RTX 4050 Laptop GPU, 90 Wh | |
|---|---|---|---|---|---|---|
| Autonomia della batteria | 23% | 50% | 110% | 163% | 229% | |
| WiFi v1.3 | 213 | 262 23% | 320 50% | 448 110% | 561 163% | 701 229% |
| Reader / Idle | 507 | 1290 | ||||
| Load | 72 | 100 | 59 | |||
| H.264 | 747 |
Valutazione Notebookcheck
MSI Thin GF63 12VE
- 04/03/2025 v8
Allen Ngo
Potential Competitors in Comparison
Immagine | Modello | Prezzo | Peso | Altezza | Schermo |
|---|---|---|---|---|---|
| MSI Thin GF63 12VE Intel Core i5-12450H ⎘ NVIDIA GeForce RTX 4050 Laptop GPU ⎘ 8 GB Memoria, 512 GB SSD | Amazon: $863.00 Prezzo di listino: 900 USD | 1.8 kg | 21.7 mm | 15.60" 1920x1080 141 PPI IPS | |
| MSI GF63 Thin 9SC Intel Core i5-9300H ⎘ NVIDIA GeForce GTX 1650 Max-Q ⎘ 8 GB Memoria, 512 GB SSD | Amazon: 1. $585.00 MSI GF63 Thin 9SC-068 15.6" ... 2. $899.99 MSI GF63 Thin 9SC-066 15.6" ... 3. $28.49 TREE.NB BTY-M6K Laptop Batte... Prezzo di listino: 975 EUR | 1.8 kg | 22 mm | 15.60" 1920x1080 141 PPI IPS | |
| Lenovo LOQ 15IRX9 Intel Core i5-13450HX ⎘ NVIDIA GeForce RTX 4060 Laptop GPU ⎘ 16 GB Memoria, 1024 GB SSD | Amazon: $1,269.00 Prezzo di listino: 1149 Euro | 2.4 kg | 23.9 mm | 15.60" 1920x1080 141 PPI IPS | |
| HP Victus 15-fa1057ng Intel Core i5-13500H ⎘ NVIDIA GeForce RTX 4050 Laptop GPU ⎘ 16 GB Memoria, 512 GB SSD | Amazon: 1. $126.00 15.6" FHD 1920(RGB)*1080 LCD... 2. $125.99 15.6" FHD 1920(RGB)*1080 144... 3. $12.00 RAKSTORE Laptop CPU Cooling ... Prezzo di listino: 1000 EUR | 2.3 kg | 24 mm | 15.60" 1920x1080 141 PPI IPS | |
| Acer Nitro V 15 ANV15-51-582S Intel Core i5-13420H ⎘ NVIDIA GeForce RTX 4050 Laptop GPU ⎘ 16 GB Memoria, 512 GB SSD | Amazon: 1. $22.99 Deal4GO CPU & GPU Graphics C... Prezzo di listino: 900 EUR | 2.1 kg | 23.5 mm | 15.60" 1920x1080 141 PPI IPS | |
| Asus TUF A15 FA507 AMD Ryzen 7 7735HS ⎘ NVIDIA GeForce RTX 4050 Laptop GPU ⎘ 16 GB Memoria, 512 GB SSD | Amazon: 1. $36.98 90Wh C41N2013 C41N2013-1 Lap... 2. $36.99 Replacement Backlit Keyboard... 3. $729.00 ASUS TUF Gaming A15 Laptop |... Prezzo di listino: 1199€ | 2.2 kg | 24.9 mm | 15.60" 1920x1080 141 PPI IPS |
Transparency
La selezione dei dispositivi da recensire viene effettuata dalla nostra redazione. Il campione di prova è stato acquistato gratuitamente dall'autore a proprie spese. L'istituto di credito non ha avuto alcuna influenza su questa recensione, né il produttore ne ha ricevuto una copia prima della pubblicazione. Non vi era alcun obbligo di pubblicare questa recensione. Non accettiamo mai compensi o pagamenti in cambio delle nostre recensioni. In quanto società mediatica indipendente, Notebookcheck non è soggetta all'autorità di produttori, rivenditori o editori.
Ecco come Notebookcheck esegue i test
Ogni anno, Notebookcheck esamina in modo indipendente centinaia di laptop e smartphone utilizzando procedure standardizzate per garantire che tutti i risultati siano comparabili. Da circa 20 anni sviluppiamo continuamente i nostri metodi di prova e nel frattempo stabiliamo gli standard di settore. Nei nostri laboratori di prova, tecnici ed editori esperti utilizzano apparecchiature di misurazione di alta qualità. Questi test comportano un processo di validazione in più fasi. Il nostro complesso sistema di valutazione si basa su centinaia di misurazioni e parametri di riferimento ben fondati, che mantengono l'obiettività.
















 Total Sustainability Score:


