Recensione del computer portatile Tulpar T7 V20.6 (Tongfang GM7PG0R): Attualmente uno dei più economici gamer RTX 4060
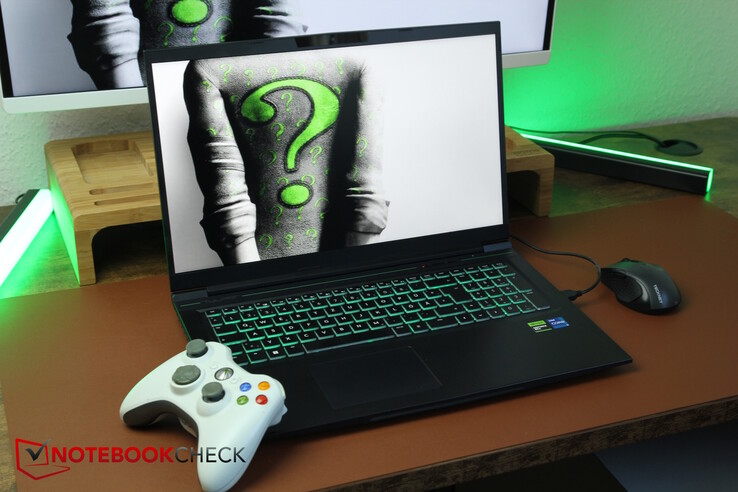
L'azienda originariamente turca - che tecnicamente opera con il nome di Monster Notebook - ha cambiato il suo marchio in Tulpar Notebook per il mercato europeo nel 2022. Tulpar ha la sua sede centrale DACH nel centro di Berlino, in Alexanderplatz, dove può provare vari prodotti e far riparare il suo dispositivo - di cui parleremo più avanti.
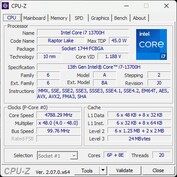
I computer portatili di Tulpar hanno riscosso un interesse crescente ultimamente, il che significa che finalmente abbiamo la possibilità di testare il nostro primo computer portatile Tulpar. "La serie A comprende modelli di base più accessibili per i giocatori occasionali. La serie T è rivolta ai giocatori abituali con esigenze elevate", si legge sul sito web del produttore. Stiamo testando il T7, un modello per i giocatori più assidui con esigenze elevate, ma sebbene le "serie di notebook A e T siano state progettate secondo i più recenti standard tecnologici", attualmente esistono solo due modelli del T6 con l'ultima CPU Gen14 di Intel. Il nostro T7 è ancora dotato di un i7-13700H dell'ultima generazione Intel. Inoltre, c'è una RTX 4060 all'interno del case Tonfang GM7PG0R.
L'attrattiva attuale di un laptop Tulpar è soprattutto il suo prezzo basso. Prezzo basso? Sul sito web, il modello con 1 TB di memoria costa circa 1.800 dollari! Ma allo stesso tempo, è possibile ottenere il portatile T7 anche da alcuni rivenditori online che chiedono molto meno per questo modello.
Quest'anno vengono rilasciati sempre meno gamer da 17 pollici, a causa dell'aumento dei modelli da 18 pollici. Di conseguenza, confronteremo il T7 con altri gamer di fascia media ed economica dello scorso anno, come il modello XMG Apex 17, Acer Nitro 17, Medion Erazer Defender P40 e il MSI Katana 17. Inoltre, lanceremo il 16 pollici Lenovo Legion 5i 16 G9 con una CPU attuale, per vedere quanto in avanti può arrivare la tecnologia più recente.
Potenziali concorrenti a confrontos
Punteggio | Data | Modello | Peso | Altezza | Dimensione | Risoluzione | Prezzo |
|---|---|---|---|---|---|---|---|
| 86.3 % v7 (old) | 05/2024 | Tulpar T7 V20.6 i7-13700H, NVIDIA GeForce RTX 4060 Laptop GPU | 2.6 kg | 30.05 mm | 17.30" | 1920x1080 | |
| 87.1 % v7 (old) | 10/2023 | SCHENKER XMG Apex 17 (Late 23) R7 7840HS, NVIDIA GeForce RTX 4060 Laptop GPU | 2.5 kg | 24.9 mm | 17.30" | 2560x1440 | |
| 87.2 % v7 (old) | 07/2023 | Acer Nitro 17 AN17-51-71ER i7-13700H, NVIDIA GeForce RTX 4060 Laptop GPU | 3 kg | 30.3 mm | 17.30" | 2560x1440 | |
| 84.6 % v7 (old) | 05/2023 | Medion Erazer Defender P40 i7-13700HX, NVIDIA GeForce RTX 4060 Laptop GPU | 2.9 kg | 33 mm | 17.30" | 2560x1440 | |
| 82.1 % v7 (old) | 02/2023 | MSI Katana 17 B13VFK i7-13620H, NVIDIA GeForce RTX 4060 Laptop GPU | 2.8 kg | 25.2 mm | 17.30" | 1920x1080 | |
| 89.1 % v7 (old) | 02/2024 | Lenovo Legion 5 16IRX G9 i7-14650HX, NVIDIA GeForce RTX 4060 Laptop GPU | 2.4 kg | 25.2 mm | 16.00" | 2560x1600 |
I nostri Top 10
» Top 10 Portatili Multimedia
» Top 10 Portatili Gaming
» Top 10 Portatili Gaming Leggeri
» Top 10 Portatili da Ufficio e Business economici
» Top 10 Portatili Premium da Ufficio/Business
» Top 10 Portatili sotto i 300 Euro
» Top 10 Portatili sotto i 500 Euro
» Top 10 dei Portatili Workstation
» Top 10 Subnotebooks
» Top 10 Ultrabooks
» Top 10 Convertibili
» Top 10 Tablets
» Top 10 Tablets Windows
» Top 10 Smartphones
Caso - Un Tongfang con un occhio verde da giocatore
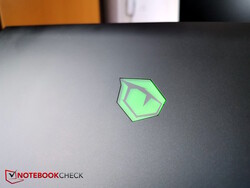
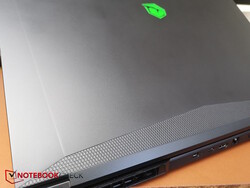
La custodia Tongfang è realizzata completamente in plastica nera. Il logo verde sulla parte anteriore, l'ampia striscia con un motivo a nido d'ape sotto e il marchio Tulpar con una striscia verde sulla base sopra la tastiera forniscono accenti al dispositivo. La superficie leggermente strutturata attira il grasso e le impronte digitali.
Nei nostri test di torsione, la base si è potuta piegare abbastanza facilmente e i bordi laterali, in particolare, hanno prodotto rumori di rottura più forti. A parte questo, la base è sufficientemente stabile e lo stesso si può dire per il display. Le cerniere tengono bene il display in posizione, ma non possono impedire una certa oscillazione quando si regola l'angolo di apertura. Quest'ultimo è di circa 145 gradi.
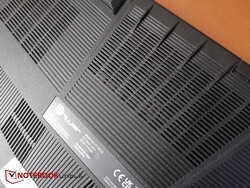
Abbiamo notato solo alcune piccole fessure lungo il bordo anteriore, dove la base incontra la piastra inferiore e quest'ultima è leggermente curva. La parte inferiore è realizzata con una plastica leggermente più morbida e la plastica può essere facilmente premuta contro gli elementi di raffreddamento interni - in particolare i tubi di calore - dall'esterno, in particolare in corrispondenza delle griglie dell'aria, che sono ancora più morbide grazie alle loro fessure. Tuttavia, questo non dovrebbe accadere grazie ai quattro piedini in gomma.
Nel complesso, la sua qualità costruttiva è buona, ma ci sono sicuramente dispositivi più stabili e di migliore qualità sul mercato.
Nel campo di confronto, il T7 ha dimensioni e peso nella media. Ha circa le stesse dimensioni del Medion o dell'XMG, mentre il Nitro e il Katana sono più grandi. Il suo peso di 2,6 kg è appena inferiore a quello di Schenker, mentre gli altri dispositivi di confronto sono più pesanti, soprattutto Nitro che pesa circa 3 kg.
Con uno spessore massimo di 30 mm, il T7 non sembra terribilmente sottile, ma l'Acer Nitro è altrettanto spesso e il Medion ha addirittura 3 mm in più sulle sue costole (di raffreddamento), soprattutto perché il T7 è più sottile del suo valore massimo specificato nella maggior parte dei punti. Il Katana e l'XMG sono più sottili.
Connettività - Niente Thunderbolt, ma USB 2.0
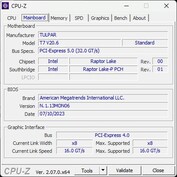
Il gamer Tulpar presenta tutte le opzioni di connettività più necessarie e un grande vantaggio è la porta MiniDP dedicata sul retro, che potrebbe essere particolarmente importante per le cuffie VR. A sua volta, la sua porta USB-C purtroppo non supporta Thunderbolt e una delle tre porte USB-A (a sinistra) è ancora di tipo 2.0. Tuttavia, almeno dispone di un lettore di schede SD di dimensioni standard e di due porte audio separate.
Il suo layout va bene, almeno le connessioni sono ben distribuite su entrambi i lati e sul retro. Soprattutto, i cavi potenzialmente rigidi e spessi - come LAN, HDMI, MiniDP e alimentazione - escono dal retro, quindi dovrà occuparsi dei dispositivi USB solo sui lati. Sul lato destro, le due porte USB-A potrebbero essere un po' più distanti, ma per il resto la distribuzione del portatile è buona.
Lettore di schede SD
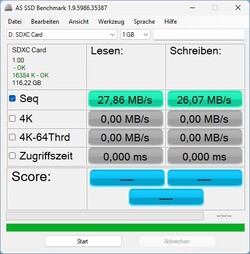
Ci piace che il portatile sia dotato di un lettore di schede SD di dimensioni standard. Meno impressionante è la lentezza del lettore di schede. Non c'è un meccanismo di aggancio e le schede fuoriescono per metà.
Abbiamo misurato velocità di lettura e scrittura sequenziali di soli 27 MB/s circa, che non sono affatto all'altezza della nostra scheda di riferimento AV PRO MicroSD 128 GB V60. La copia di 1 GB di immagini dalla scheda al desktop richiede ben 48 secondi! La concorrenza è molto più veloce, anche se Legion 5 e XMG non sono decisivi.
| SD Card Reader | |
| average JPG Copy Test (av. of 3 runs) | |
| Media della classe Gaming (19 - 197.3, n=68, ultimi 2 anni) | |
| Medion Erazer Defender P40 (AV PRO microSD 128 GB V60) | |
| Acer Nitro 17 AN17-51-71ER | |
| SCHENKER XMG Apex 17 (Late 23) (AV PRO microSD 128 GB V60) | |
| Lenovo Legion 5 16IRX G9 | |
| Tulpar T7 V20.6 | |
| maximum AS SSD Seq Read Test (1GB) | |
| Media della classe Gaming (25.8 - 263, n=67, ultimi 2 anni) | |
| Medion Erazer Defender P40 (AV PRO microSD 128 GB V60) | |
| Acer Nitro 17 AN17-51-71ER | |
| SCHENKER XMG Apex 17 (Late 23) (AV PRO microSD 128 GB V60) | |
| Lenovo Legion 5 16IRX G9 | |
| Tulpar T7 V20.6 | |
Comunicazione
Webcam
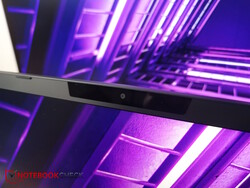
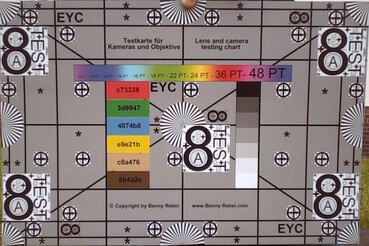
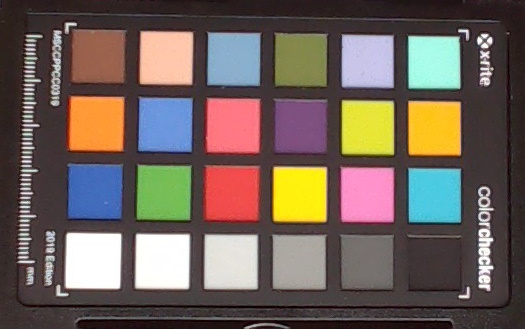
Mentre almeno l'XMG e il Legion 5 si affidano già a webcam Full HD, il Tulpar, come gli altri concorrenti, dispone ancora di una fotocamera a 720p.
Anche questa deve fare i conti con deviazioni di colore piuttosto elevate e scarsa nitidezza, con il risultato che non trasmette un'immagine molto bella dell'utente.
Sicurezza
È disponibile uno slot Kensington e il TPM è integrato nella CPU Intel. Non ci sono funzioni di sicurezza aggiuntive, come un sensore di impronte digitali o una copertura per la webcam, almeno.
Accessori e garanzia
Il conveniente computer portatile Tulpar non è corredato da alcun accessorio aggiuntivo. Tuttavia, c'è la promessa di una manutenzione gratuita annuale a vita, oltre alla garanzia legale di 12 mesi. Questa include la pulizia delle ventole, la sostituzione della pasta termica della CPU e della GPU e la rimozione della polvere dal case. Ma attenzione: Se il cliente fa qualcosa da solo (ad esempio, cambia la pasta termica), la manutenzione gratuita scade, quindi è meglio leggere i termini e le condizioni esatte sul sito web di Tulpar.
Manutenzione
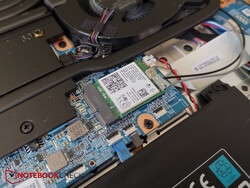
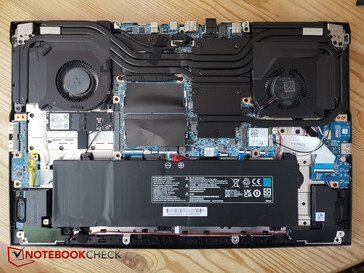
La parte inferiore del case è tenuta in posizione da 10 viti Phillips della stessa lunghezza e da molte clip di plastica. Di conseguenza, è necessario fare attenzione quando si fa leva, ma in generale è abbastanza facile da aprire. Non ci sono viti nascoste.
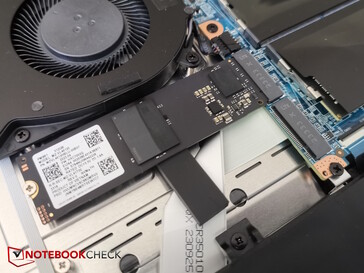
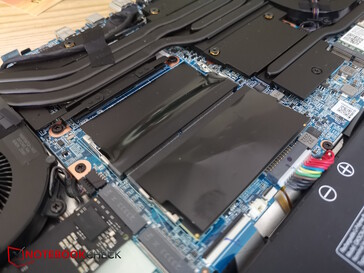
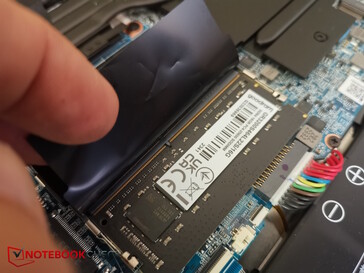
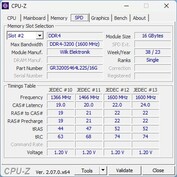
All'interno, avrà accesso al sistema di raffreddamento, ai due slot per la RAM (solo uno occupato), ai due slot per SSD M.2 (uno libero), al modulo Wi-Fi e alla batteria.
Dispositivi di input - La tastiera è migliore del previsto
Tastiera
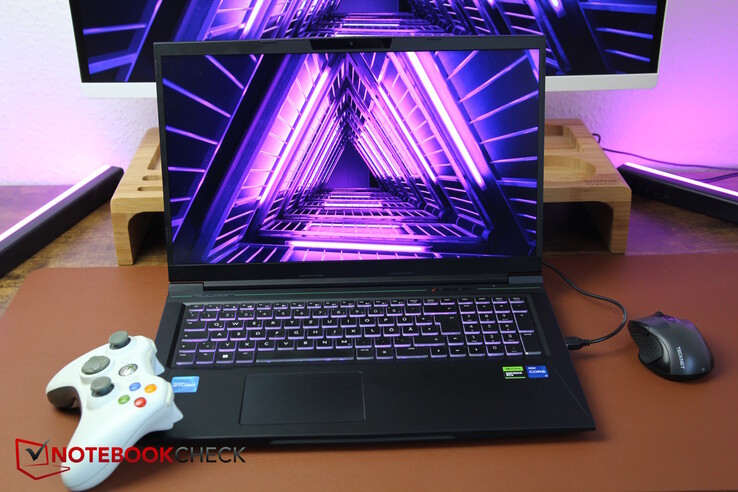
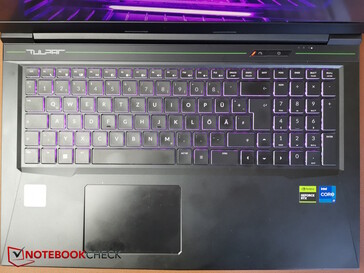
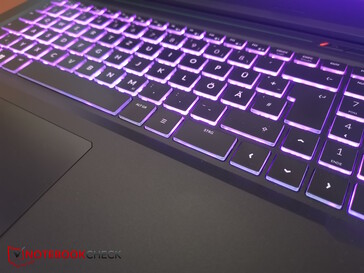
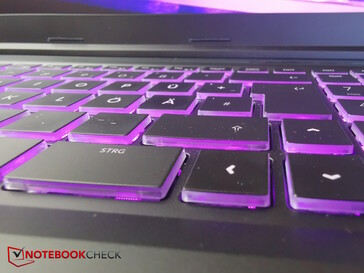
La tastiera ha un layout standard; tutto è distribuito su sei righe e nulla si discosta verso la parte superiore o inferiore del dispositivo. C'è un tastierino numerico sul lato destro. La base della tastiera retroilluminata a tre livelli (1 zona) è leggermente incassata e i tasti misurano 1,5 x 1,5 cm. Il loro percorso di pressione è leggermente più lungo e più morbido rispetto a quello di molti altri computer portatili, ma il feedback è sufficientemente nitido. Di conseguenza, la tastiera risulta meno piatta rispetto ad alcuni dei suoi concorrenti e la digitazione è abbastanza comoda e veloce. Il rumore di battitura è da moderato a mediamente forte e l'etichettatura dei tasti è facile da leggere.
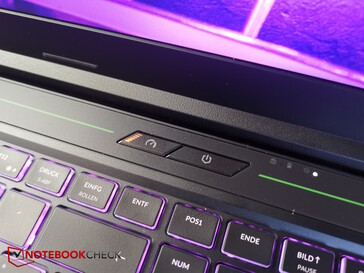
C'è un pulsante di accensione separato sopra il resto della tastiera e accanto ad esso si trova un altro pulsante per passare da un profilo di prestazioni all'altro. Purtroppo hanno nomi diversi rispetto a quelli elencati nel Control Center, ma controllano esattamente questi. Office è bilanciato, gaming è enthusiast e turbo è in realtà chiamato overboost. Un piccolo LED sul pulsante mostra quale modalità è in uso (off = ufficio, arancione = gaming, arancione più chiaro = turbo).
Touchpad
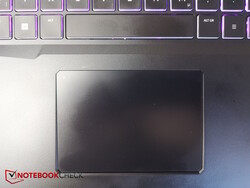
Il Tulpar è chiaramente commercializzato per i giocatori, e il suo touchpad relativamente piccolo (circa 10,6 x 7,35 cm) lo rende evidente, nonostante il portatile sia un modello da 17 pollici. Come risultato del tastierino numerico, non è completamente centrato, ma si trova leggermente spostato a sinistra, il che significa che si trova proprio sotto la barra spaziatrice.
La sua superficie è piacevole e liscia solo in condizioni ottimali; in altre parole, non appena le mani sono un po' umide, si impigliano sulla sua superficie. Può (de)attivare il touchpad toccando due volte la parte in alto a sinistra e un piccolo LED mostra il suo stato attuale.
I suoi rumori di clic sono un po' più forti e non danno al dispositivo una sensazione di alta qualità, ma vanno bene. Nel complesso, il touchpad risponde molto bene, offrendo una solida prestazione totale. I giocatori probabilmente prenderanno un mouse, in ogni caso.
Display - Full HD decente dal 2019
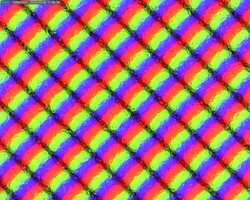
Il display opaco Full HD IPS di Chi Mei è una vecchia conoscenza, che si trova anche in diversi portatili più economici della serie G di MSI, tra cui l'MSI GP75 LeopardSD MSI GP75 Leopard 9SD (2019) che abbiamo testato in precedenza, così come il modello MSI GT76 9SG (2019) e il modello MSI GE75 9SG. Naturalmente, in questo caso l'età non è un segno di qualità. Ad eccezione del Katana, nessuno dei concorrenti si affida al Full HD a 17 pollici, ma piuttosto a schermi a risoluzione più elevata con 2.560 x 1.440 pixel.
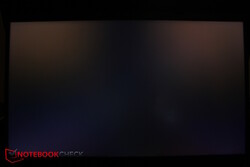
Tuttavia, il pannello non è necessariamente negativo. La sua luminosità media di circa 350 nit è buona, ma l'illuminazione potrebbe essere più uniforme. A sua volta, il contrasto è superiore a quello dei dispositivi di confronto, grazie al valore del nero che è buono per un dispositivo economico. Il bleeding della retroilluminazione è appena percettibile e non dovrebbe assolutamente ostacolarla.
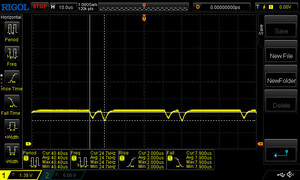
Lo schermo sfarfalla a livelli di luminosità inferiori al 25 percento, tuttavia, con una frequenza elevata compresa tra 25 kHz e 42 kHz, il che significa che anche gli utenti più sensibili non dovrebbero avere problemi. I suoi tempi di risposta sono di circa 11 (da nero a bianco) a 15 ms (da grigio a grigio).
| |||||||||||||||||||||||||
Distribuzione della luminosità: 83 %
Al centro con la batteria: 373 cd/m²
Contrasto: 1639:1 (Nero: 0.23 cd/m²)
ΔE Color 0.83 | 0.5-29.43 Ø4.87, calibrated: 0.83
ΔE Greyscale 0.9 | 0.5-98 Ø5.1
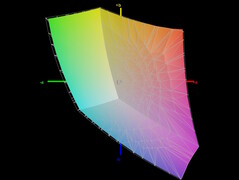
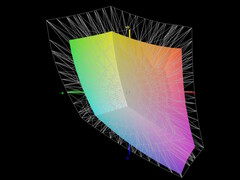
66.1% AdobeRGB 1998 (Argyll 2.2.0 3D)
96.2% sRGB (Argyll 2.2.0 3D)
64.2% Display P3 (Argyll 2.2.0 3D)
Gamma: 2.36
| Tulpar T7 V20.6 Chi Mei CMN175C (CMN N173HCE-G33), IPS, 1920x1080, 17.3" | SCHENKER XMG Apex 17 (Late 23) BOE CQ NE173QHM-NZ3, IPS, 2560x1440, 17.3" | Acer Nitro 17 AN17-51-71ER BOE0B7C NE173QHM-NY6, , 2560x1440, 17.3" | Medion Erazer Defender P40 BOE CQ NE173QHM-NZ3, IPS, 2560x1440, 17.3" | MSI Katana 17 B13VFK B173HAN04.9, IPS LED, 1920x1080, 17.3" | Lenovo Legion 5 16IRX G9 NE160QDM-NZ3, IPS, 2560x1600, 16" | |
|---|---|---|---|---|---|---|
| Display | 4% | 29% | 5% | -36% | 10% | |
| Display P3 Coverage | 64.2 | 68.1 6% | 98.3 53% | 68.3 6% | 40.8 -36% | 72.4 13% |
| sRGB Coverage | 96.2 | 97.7 2% | 100 4% | 98.1 2% | 61 -37% | 100 4% |
| AdobeRGB 1998 Coverage | 66.1 | 69.5 5% | 85.7 30% | 69.8 6% | 42.2 -36% | 74.1 12% |
| Response Times | 19% | 14% | 12% | -129% | 19% | |
| Response Time Grey 50% / Grey 80% * | 14.7 ? | 13.5 ? 8% | 14.8 ? -1% | 14.6 ? 1% | 33 ? -124% | 12.5 ? 15% |
| Response Time Black / White * | 11.1 ? | 7.9 ? 29% | 8 ? 28% | 8.7 ? 22% | 26 ? -134% | 8.7 ? 22% |
| PWM Frequency | 25000 | |||||
| Screen | -55% | -153% | -32% | -222% | -9% | |
| Brightness middle | 377 | 403 7% | 361 -4% | 364 -3% | 267 -29% | 526 40% |
| Brightness | 353 | 381 8% | 326 -8% | 343 -3% | 256 -27% | 500 42% |
| Brightness Distribution | 83 | 90 8% | 87 5% | 86 4% | 93 12% | 87 5% |
| Black Level * | 0.23 | 0.37 -61% | 0.6 -161% | 0.28 -22% | 0.21 9% | 0.33 -43% |
| Contrast | 1639 | 1089 -34% | 602 -63% | 1300 -21% | 1271 -22% | 1594 -3% |
| Colorchecker dE 2000 * | 0.83 | 2.22 -167% | 3.83 -361% | 1.67 -101% | 4.7 -466% | 1.2 -45% |
| Colorchecker dE 2000 max. * | 1.92 | 3.76 -96% | 5.71 -197% | 2.78 -45% | 20.4 -963% | 2.1 -9% |
| Colorchecker dE 2000 calibrated * | 0.83 | 1.22 -47% | 3.48 -319% | 1.14 -37% | 4.5 -442% | 1 -20% |
| Greyscale dE 2000 * | 0.9 | 1.9 -111% | 3.29 -266% | 1.4 -56% | 1.5 -67% | 1.3 -44% |
| Gamma | 2.36 93% | 2.046 108% | 2.29 96% | 2.091 105% | 2.12 104% | 2.23 99% |
| CCT | 6471 100% | 6656 98% | 6679 97% | 6568 99% | 6552 99% | 6391 102% |
| Media totale (Programma / Settaggio) | -11% /
-32% | -37% /
-90% | -5% /
-18% | -129% /
-169% | 7% /
-1% |
* ... Meglio usare valori piccoli
Il pannello è sorprendentemente ben calibrato subito dopo l'acquisto, soprattutto in questa classe di prezzo. I suoi valori medi di scala di grigi e ColorChecker DeltaE sono solo 0,9 e 0,83 (misurati rispetto a sRGB), quindi gli utenti non avranno bisogno di calibrare ulteriormente lo schermo.
Tempi di risposta del Display
| ↔ Tempi di risposta dal Nero al Bianco | ||
|---|---|---|
| 11.1 ms ... aumenta ↗ e diminuisce ↘ combinato | ↗ 5.7 ms Incremento | |
| ↘ 5.4 ms Calo | ||
| Lo schermo mostra buoni tempi di risposta durante i nostri tests, ma potrebbe essere troppo lento per i gamers competitivi. In confronto, tutti i dispositivi di test variano da 0.1 (minimo) a 240 (massimo) ms. » 27 % di tutti i dispositivi è migliore. Questo significa che i tempi di risposta rilevati sono migliori rispettto alla media di tutti i dispositivi testati (20.8 ms). | ||
| ↔ Tempo di risposta dal 50% Grigio all'80% Grigio | ||
| 14.7 ms ... aumenta ↗ e diminuisce ↘ combinato | ↗ 6.8 ms Incremento | |
| ↘ 7.9 ms Calo | ||
| Lo schermo mostra buoni tempi di risposta durante i nostri tests, ma potrebbe essere troppo lento per i gamers competitivi. In confronto, tutti i dispositivi di test variano da 0.165 (minimo) a 636 (massimo) ms. » 26 % di tutti i dispositivi è migliore. Questo significa che i tempi di risposta rilevati sono migliori rispettto alla media di tutti i dispositivi testati (32.5 ms). | ||
Sfarfallio dello schermo / PWM (Pulse-Width Modulation)
| flickering dello schermo / PWM rilevato | 25000 Hz Amplitude: 27 % | ||
Il display sfarfalla a 25000 Hz (Probabilmente a causa dell'uso di PWM) . La frequenza di 25000 Hz è abbastanza alta, quindi la maggioranza degli utenti sensibili al PWM non dovrebbero notare alcun flickering. In confronto: 53 % di tutti i dispositivi testati non utilizza PWM per ridurre la luminosita' del display. Se è rilevato PWM, una media di 8516 (minimo: 5 - massimo: 343500) Hz è stata rilevata. | |||
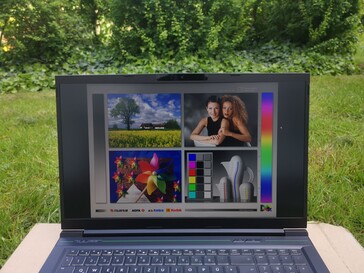
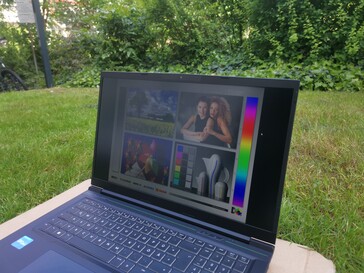
All'esterno, la superficie opaca del display impedisce la maggior parte dei riflessi. All'ombra, può lavorare bene guardando direttamente il T7: la sua luminosità di 350 nit è appena sufficiente per poterlo fare. Dovrebbe solo evitare la luce diretta del sole e gli angoli di visione inclinati.
Prestazioni - Intel Gen13 non è una novità
Sono disponibili diverse configurazioni del Tulpar T7, tutte caratterizzate dalla presenza della RTX 4060. Il nostro T7 20.6 è equipaggiato con la CPU Raptor Lake i7-13700Hmentre i modelli intorno al T7 20.7 utilizzano ancora una CPU Alder Lake di 12a generazione, nonostante il "numero" presumibilmente più alto nel nome. Poi ci sono anche diverse configurazioni di RAM e SSD, che di solito sono seguite da un numero, ad esempio il T7 20.6.1 (SSD da 1 TB) rispetto al T7 20.2 (SSD da 500 GB) - entrambi i modelli hanno 32 GB di RAM. La configurazione di memoria e archiviazione del nostro dispositivo di prova (16 GB di RAM e 500 GB di SSD) non si trova sul sito web di Tulpar o sui portali di confronto.
Il Tulpar T7 è chiaramente rivolto ai giocatori con un budget più limitato. La sua CPU Intel Gen13 e RTX 4060 promettono buone prestazioni di gioco a un prezzo contenuto. I creatori, invece, non sono direttamente indirizzati dal suo evidente design da gamer, dal case spesso, dal touchpad piccolo e dallo schermo decente che non è il più adatto per l'editing.
Condizioni di test
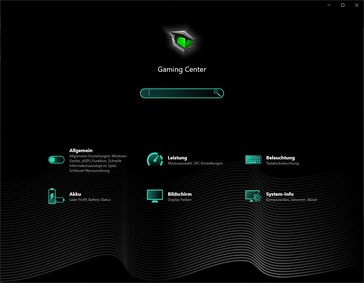
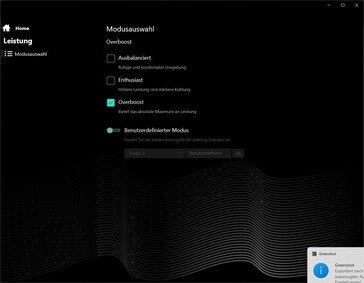
Tulpar si affida a un Centro di Controllo generico, leggermente adattato, il cui design è esattamente lo stesso utilizzato nei modelli XMG di Schenker e altri. È semplice ma chiaro e offre varie opzioni di impostazione.
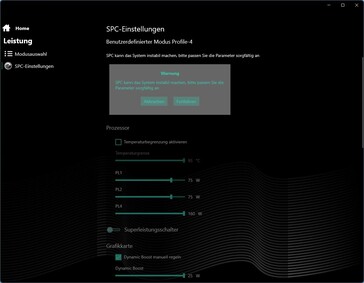
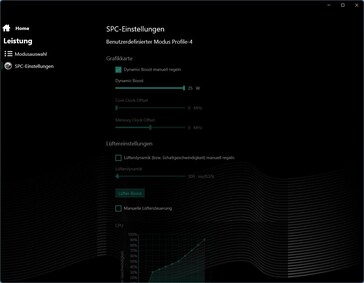
La scheda delle prestazioni offre tre profili predefiniti(equilibrato, entusiasta, overboost) e una modalità manuale con tutti i tipi di opzioni di personalizzazione. Abbiamo eseguito i nostri benchmark sulle prestazioni utilizzando la modalità overboost, a meno che non sia indicato diversamente.
Oltre ai profili di prestazioni, sono presenti anche un interruttore MUX, impostazioni generali, opzioni di visualizzazione, impostazioni di illuminazione della tastiera e impostazioni della batteria.
Una parola sulla modalità batteria: Sebbene le prestazioni del portatile siano ovviamente notevolmente ridotte, la modalità di alimentazione impostata non cambia visivamente, quindi se ha attivato in precedenza la modalità overboost e stacca la spina, questa rimane attiva nel Centro di controllo. Questo suggerisce che può scegliere tra varie modalità di alimentazione anche quando è lontano da una presa di corrente. Tuttavia, molto probabilmente non è questo il caso, in quanto i risultati della nostra modalità batteria erano sempre gli stessi (entro la tolleranza), indipendentemente dalla modalità di alimentazione selezionata.
Processore
L'Intel Gen13 Core i7-13700H Che si trovava in molti computer da gioco dei principali produttori l'anno scorso, è utilizzata in questo computer portatile da gioco. L'ultima Gen14 è attualmente disponibile solo nella serie T6 di Tulpar. Tuttavia, poiché la Gen14 non offre quasi nessun vantaggio in termini di velocità, il vantaggio dei laptop più recenti sarà probabilmente minimo.
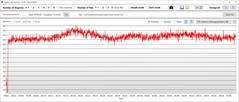
Il nostro Tulpar si è comportato bene durante il ciclo Cinebench R15, offrendo prestazioni elevate e soprattutto molto costanti, senza cali dopo le prime prove. In overboost, ha richiamato un TDP abbastanza costante di 95-96 watt, in modalità enthusiast era ancora di 82 watt e in modalità bilanciata abbiamo notato solo 48 watt. In modalità batteria, viene impostato automaticamente su bilanciato. In questo caso, le prestazioni della CPU diminuiscono di circa il 27%.
In generale e in tutti i benchmark, il T7 era praticamente allo stesso livello di prestazioni del laptop medio dotato della stessa CPU nel nostro database. In molti test è stato addirittura più veloce, ma i punteggi multi-thread di Geekbench, insolitamente bassi, rovinano leggermente il suo punteggio complessivo. Durante i test Cinebench, è stato circa l'11% più veloce dell'i7-13700H medio.
Questo lo colloca proprio nel mezzo dei dispositivi di confronto in termini di prestazioni: solo il Legion 5 era sensibilmente più veloce, e tutti gli altri concorrenti erano a pochi punti percentuali dal nostro dispositivo di prova.
I suoi punteggi multi-core insolitamente bassi nei test Geekbench sono piuttosto interessanti. I suoi punteggi sono rimasti molto bassi anche dopo varie ripetizioni(overboost, dGPU e modalità ibrida testate). Nei test Cinebench, invece, i suoi punteggi multi-thread erano da normali a buoni.
| Profilo prestazionale/valore di misurazione | CB15 multi score | TDP (in watt) |
|---|---|---|
| Turbo | 2.763 | 95 |
| Enthusiast | 2.538 | 82 |
| Bilanciato | 1.990 | 48 |
| Batteria | 1.760 | 35 |
Cinebench R15 Multi continuous test
Cinebench R23: Multi Core | Single Core
Cinebench R20: CPU (Multi Core) | CPU (Single Core)
Cinebench R15: CPU Multi 64Bit | CPU Single 64Bit
Blender: v2.79 BMW27 CPU
7-Zip 18.03: 7z b 4 | 7z b 4 -mmt1
Geekbench 6.4: Multi-Core | Single-Core
Geekbench 5.5: Multi-Core | Single-Core
HWBOT x265 Benchmark v2.2: 4k Preset
LibreOffice : 20 Documents To PDF
R Benchmark 2.5: Overall mean
| CPU Performance Rating | |
| Lenovo Legion 5 16IRX G9 | |
| Media della classe Gaming | |
| SCHENKER XMG Apex 17 (Late 23) | |
| Medion Erazer Defender P40 -2! | |
| Tulpar T7 V20.6 | |
| Media Intel Core i7-13700H | |
| Acer Nitro 17 AN17-51-71ER -2! | |
| MSI Katana 17 B13VFK -2! | |
| Cinebench R23 / Multi Core | |
| Lenovo Legion 5 16IRX G9 | |
| Media della classe Gaming (5668 - 39652, n=151, ultimi 2 anni) | |
| Medion Erazer Defender P40 | |
| Acer Nitro 17 AN17-51-71ER | |
| Tulpar T7 V20.6 | |
| SCHENKER XMG Apex 17 (Late 23) | |
| MSI Katana 17 B13VFK | |
| Media Intel Core i7-13700H (5890 - 20034, n=29) | |
| Cinebench R23 / Single Core | |
| Lenovo Legion 5 16IRX G9 | |
| Tulpar T7 V20.6 | |
| Media della classe Gaming (1136 - 2252, n=151, ultimi 2 anni) | |
| MSI Katana 17 B13VFK | |
| Media Intel Core i7-13700H (1323 - 1914, n=29) | |
| SCHENKER XMG Apex 17 (Late 23) | |
| Medion Erazer Defender P40 | |
| Acer Nitro 17 AN17-51-71ER | |
| Cinebench R20 / CPU (Multi Core) | |
| Lenovo Legion 5 16IRX G9 | |
| Media della classe Gaming (2179 - 15517, n=151, ultimi 2 anni) | |
| Medion Erazer Defender P40 | |
| Acer Nitro 17 AN17-51-71ER | |
| Tulpar T7 V20.6 | |
| SCHENKER XMG Apex 17 (Late 23) | |
| MSI Katana 17 B13VFK | |
| Media Intel Core i7-13700H (2322 - 7674, n=29) | |
| Cinebench R20 / CPU (Single Core) | |
| Lenovo Legion 5 16IRX G9 | |
| Tulpar T7 V20.6 | |
| Media della classe Gaming (439 - 866, n=151, ultimi 2 anni) | |
| Media Intel Core i7-13700H (508 - 741, n=29) | |
| MSI Katana 17 B13VFK | |
| SCHENKER XMG Apex 17 (Late 23) | |
| Medion Erazer Defender P40 | |
| Acer Nitro 17 AN17-51-71ER | |
| Cinebench R15 / CPU Multi 64Bit | |
| Lenovo Legion 5 16IRX G9 | |
| Media della classe Gaming (905 - 6074, n=154, ultimi 2 anni) | |
| Medion Erazer Defender P40 | |
| Acer Nitro 17 AN17-51-71ER | |
| Tulpar T7 V20.6 | |
| SCHENKER XMG Apex 17 (Late 23) | |
| Media Intel Core i7-13700H (905 - 2982, n=29) | |
| MSI Katana 17 B13VFK | |
| Cinebench R15 / CPU Single 64Bit | |
| Lenovo Legion 5 16IRX G9 | |
| Tulpar T7 V20.6 | |
| Media della classe Gaming (191.9 - 343, n=151, ultimi 2 anni) | |
| SCHENKER XMG Apex 17 (Late 23) | |
| Media Intel Core i7-13700H (213 - 278, n=29) | |
| MSI Katana 17 B13VFK | |
| Medion Erazer Defender P40 | |
| Acer Nitro 17 AN17-51-71ER | |
| Blender / v2.79 BMW27 CPU | |
| Media Intel Core i7-13700H (169 - 555, n=29) | |
| MSI Katana 17 B13VFK | |
| SCHENKER XMG Apex 17 (Late 23) | |
| Medion Erazer Defender P40 | |
| Acer Nitro 17 AN17-51-71ER | |
| Media della classe Gaming (81 - 555, n=144, ultimi 2 anni) | |
| Tulpar T7 V20.6 | |
| Lenovo Legion 5 16IRX G9 | |
| 7-Zip 18.03 / 7z b 4 | |
| Lenovo Legion 5 16IRX G9 | |
| Media della classe Gaming (23795 - 144064, n=149, ultimi 2 anni) | |
| Medion Erazer Defender P40 | |
| Acer Nitro 17 AN17-51-71ER | |
| SCHENKER XMG Apex 17 (Late 23) | |
| MSI Katana 17 B13VFK | |
| Media Intel Core i7-13700H (27322 - 76344, n=29) | |
| Tulpar T7 V20.6 | |
| 7-Zip 18.03 / 7z b 4 -mmt1 | |
| SCHENKER XMG Apex 17 (Late 23) | |
| Lenovo Legion 5 16IRX G9 | |
| Media della classe Gaming (4199 - 7573, n=149, ultimi 2 anni) | |
| Tulpar T7 V20.6 | |
| Media Intel Core i7-13700H (4825 - 6238, n=29) | |
| MSI Katana 17 B13VFK | |
| Medion Erazer Defender P40 | |
| Acer Nitro 17 AN17-51-71ER | |
| Geekbench 6.4 / Multi-Core | |
| Lenovo Legion 5 16IRX G9 | |
| Media della classe Gaming (5340 - 21668, n=119, ultimi 2 anni) | |
| SCHENKER XMG Apex 17 (Late 23) | |
| Media Intel Core i7-13700H (8415 - 13832, n=13) | |
| Tulpar T7 V20.6 | |
| Geekbench 6.4 / Single-Core | |
| Lenovo Legion 5 16IRX G9 | |
| SCHENKER XMG Apex 17 (Late 23) | |
| Media della classe Gaming (1490 - 3219, n=119, ultimi 2 anni) | |
| Tulpar T7 V20.6 | |
| Media Intel Core i7-13700H (2316 - 2639, n=13) | |
| Geekbench 5.5 / Multi-Core | |
| Lenovo Legion 5 16IRX G9 | |
| Media della classe Gaming (4557 - 25855, n=148, ultimi 2 anni) | |
| Medion Erazer Defender P40 | |
| Acer Nitro 17 AN17-51-71ER | |
| SCHENKER XMG Apex 17 (Late 23) | |
| Media Intel Core i7-13700H (6165 - 14215, n=29) | |
| MSI Katana 17 B13VFK | |
| Tulpar T7 V20.6 | |
| Geekbench 5.5 / Single-Core | |
| SCHENKER XMG Apex 17 (Late 23) | |
| Lenovo Legion 5 16IRX G9 | |
| Media della classe Gaming (986 - 2423, n=148, ultimi 2 anni) | |
| Media Intel Core i7-13700H (1362 - 1919, n=29) | |
| MSI Katana 17 B13VFK | |
| Tulpar T7 V20.6 | |
| Medion Erazer Defender P40 | |
| Acer Nitro 17 AN17-51-71ER | |
| HWBOT x265 Benchmark v2.2 / 4k Preset | |
| Lenovo Legion 5 16IRX G9 | |
| Media della classe Gaming (6.72 - 42.9, n=148, ultimi 2 anni) | |
| Medion Erazer Defender P40 | |
| SCHENKER XMG Apex 17 (Late 23) | |
| Acer Nitro 17 AN17-51-71ER | |
| Tulpar T7 V20.6 | |
| MSI Katana 17 B13VFK | |
| Media Intel Core i7-13700H (6.72 - 21.2, n=29) | |
| LibreOffice / 20 Documents To PDF | |
| MSI Katana 17 B13VFK | |
| Acer Nitro 17 AN17-51-71ER | |
| Tulpar T7 V20.6 | |
| Medion Erazer Defender P40 | |
| Media Intel Core i7-13700H (31.3 - 62.4, n=29) | |
| Media della classe Gaming (19 - 96.6, n=147, ultimi 2 anni) | |
| SCHENKER XMG Apex 17 (Late 23) | |
| Lenovo Legion 5 16IRX G9 | |
| R Benchmark 2.5 / Overall mean | |
| Acer Nitro 17 AN17-51-71ER | |
| Medion Erazer Defender P40 | |
| Media Intel Core i7-13700H (0.4308 - 0.607, n=29) | |
| Tulpar T7 V20.6 | |
| MSI Katana 17 B13VFK | |
| Media della classe Gaming (0.3609 - 0.759, n=150, ultimi 2 anni) | |
| SCHENKER XMG Apex 17 (Late 23) | |
| Lenovo Legion 5 16IRX G9 | |
* ... Meglio usare valori piccoli
AIDA64: FP32 Ray-Trace | FPU Julia | CPU SHA3 | CPU Queen | FPU SinJulia | FPU Mandel | CPU AES | CPU ZLib | FP64 Ray-Trace | CPU PhotoWorxx
| Performance Rating | |
| SCHENKER XMG Apex 17 (Late 23) | |
| Media della classe Gaming | |
| Acer Nitro 17 AN17-51-71ER | |
| Lenovo Legion 5 16IRX G9 | |
| Tulpar T7 V20.6 | |
| Medion Erazer Defender P40 | |
| Media Intel Core i7-13700H | |
| MSI Katana 17 B13VFK | |
| AIDA64 / FP32 Ray-Trace | |
| SCHENKER XMG Apex 17 (Late 23) | |
| Media della classe Gaming (4986 - 81639, n=147, ultimi 2 anni) | |
| Lenovo Legion 5 16IRX G9 | |
| Acer Nitro 17 AN17-51-71ER | |
| Tulpar T7 V20.6 | |
| Medion Erazer Defender P40 | |
| Media Intel Core i7-13700H (4986 - 18908, n=29) | |
| MSI Katana 17 B13VFK | |
| AIDA64 / FPU Julia | |
| SCHENKER XMG Apex 17 (Late 23) | |
| Media della classe Gaming (25360 - 252486, n=147, ultimi 2 anni) | |
| Lenovo Legion 5 16IRX G9 | |
| Tulpar T7 V20.6 | |
| Acer Nitro 17 AN17-51-71ER | |
| Medion Erazer Defender P40 | |
| Media Intel Core i7-13700H (25360 - 92359, n=29) | |
| MSI Katana 17 B13VFK | |
| AIDA64 / CPU SHA3 | |
| Media della classe Gaming (1339 - 10389, n=147, ultimi 2 anni) | |
| SCHENKER XMG Apex 17 (Late 23) | |
| Acer Nitro 17 AN17-51-71ER | |
| Lenovo Legion 5 16IRX G9 | |
| Tulpar T7 V20.6 | |
| Medion Erazer Defender P40 | |
| Media Intel Core i7-13700H (1339 - 4224, n=29) | |
| MSI Katana 17 B13VFK | |
| AIDA64 / CPU Queen | |
| SCHENKER XMG Apex 17 (Late 23) | |
| Media della classe Gaming (50699 - 200651, n=147, ultimi 2 anni) | |
| Medion Erazer Defender P40 | |
| Tulpar T7 V20.6 | |
| Lenovo Legion 5 16IRX G9 | |
| Acer Nitro 17 AN17-51-71ER | |
| Media Intel Core i7-13700H (59324 - 107159, n=29) | |
| MSI Katana 17 B13VFK | |
| AIDA64 / FPU SinJulia | |
| SCHENKER XMG Apex 17 (Late 23) | |
| Media della classe Gaming (4800 - 32988, n=147, ultimi 2 anni) | |
| Lenovo Legion 5 16IRX G9 | |
| Tulpar T7 V20.6 | |
| Acer Nitro 17 AN17-51-71ER | |
| Medion Erazer Defender P40 | |
| Media Intel Core i7-13700H (4800 - 11050, n=29) | |
| MSI Katana 17 B13VFK | |
| AIDA64 / FPU Mandel | |
| SCHENKER XMG Apex 17 (Late 23) | |
| Media della classe Gaming (12321 - 134044, n=147, ultimi 2 anni) | |
| Lenovo Legion 5 16IRX G9 | |
| Acer Nitro 17 AN17-51-71ER | |
| Tulpar T7 V20.6 | |
| Medion Erazer Defender P40 | |
| Media Intel Core i7-13700H (12321 - 45118, n=29) | |
| MSI Katana 17 B13VFK | |
| AIDA64 / CPU AES | |
| SCHENKER XMG Apex 17 (Late 23) | |
| Acer Nitro 17 AN17-51-71ER | |
| Media della classe Gaming (19065 - 328679, n=147, ultimi 2 anni) | |
| Lenovo Legion 5 16IRX G9 | |
| Tulpar T7 V20.6 | |
| Media Intel Core i7-13700H (28769 - 151254, n=29) | |
| Medion Erazer Defender P40 | |
| MSI Katana 17 B13VFK | |
| AIDA64 / CPU ZLib | |
| Media della classe Gaming (373 - 2531, n=147, ultimi 2 anni) | |
| Lenovo Legion 5 16IRX G9 | |
| Acer Nitro 17 AN17-51-71ER | |
| Tulpar T7 V20.6 | |
| SCHENKER XMG Apex 17 (Late 23) | |
| Medion Erazer Defender P40 | |
| Media Intel Core i7-13700H (389 - 1215, n=29) | |
| MSI Katana 17 B13VFK | |
| AIDA64 / FP64 Ray-Trace | |
| SCHENKER XMG Apex 17 (Late 23) | |
| Media della classe Gaming (2540 - 43430, n=147, ultimi 2 anni) | |
| Lenovo Legion 5 16IRX G9 | |
| Acer Nitro 17 AN17-51-71ER | |
| Tulpar T7 V20.6 | |
| Medion Erazer Defender P40 | |
| Media Intel Core i7-13700H (2540 - 10135, n=29) | |
| MSI Katana 17 B13VFK | |
| AIDA64 / CPU PhotoWorxx | |
| Media della classe Gaming (10805 - 60161, n=147, ultimi 2 anni) | |
| Media Intel Core i7-13700H (12872 - 52727, n=29) | |
| Acer Nitro 17 AN17-51-71ER | |
| SCHENKER XMG Apex 17 (Late 23) | |
| Medion Erazer Defender P40 | |
| MSI Katana 17 B13VFK | |
| Lenovo Legion 5 16IRX G9 | |
| Tulpar T7 V20.6 | |
Prestazioni del sistema
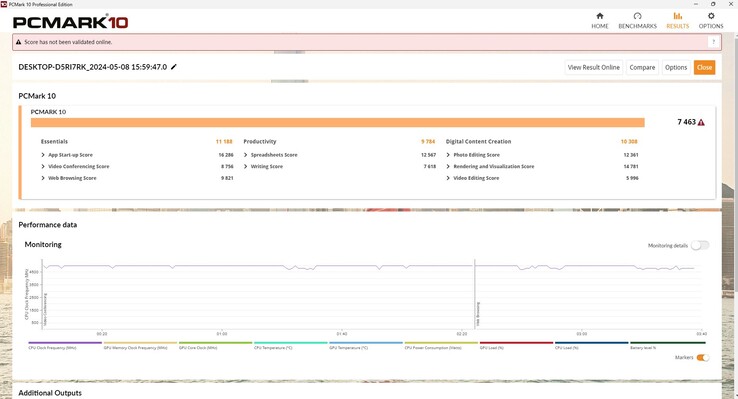
Per quanto riguarda le prestazioni del sistema, il T7 si colloca nella parte alta della classifica. In PCMark 10, ha raggiunto il livello medio esatto per questa combinazione hardware. I risultati di CrossMark sono un po' bassi.
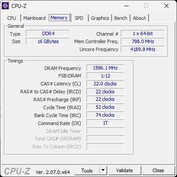
Il fatto che sia occupato un solo slot di RAM non è il massimo, almeno nella nostra configurazione del T7. Il test di memoria AIDA qui sotto mostra lo svantaggio della RAM a canale singolo. Per il canale doppio, dovrebbe inserire un'altra barra, poiché uno slot è ancora libero.
CrossMark: Overall | Productivity | Creativity | Responsiveness
WebXPRT 3: Overall
WebXPRT 4: Overall
Mozilla Kraken 1.1: Total
| PCMark 10 / Score | |
| SCHENKER XMG Apex 17 (Late 23) | |
| Media della classe Gaming (5776 - 9852, n=133, ultimi 2 anni) | |
| Lenovo Legion 5 16IRX G9 | |
| Tulpar T7 V20.6 | |
| Media Intel Core i7-13700H, NVIDIA GeForce RTX 4060 Laptop GPU (7157 - 7661, n=5) | |
| MSI Katana 17 B13VFK | |
| Acer Nitro 17 AN17-51-71ER | |
| Medion Erazer Defender P40 | |
| PCMark 10 / Essentials | |
| Tulpar T7 V20.6 | |
| MSI Katana 17 B13VFK | |
| Lenovo Legion 5 16IRX G9 | |
| Media Intel Core i7-13700H, NVIDIA GeForce RTX 4060 Laptop GPU (10179 - 11200, n=5) | |
| Media della classe Gaming (9057 - 12600, n=133, ultimi 2 anni) | |
| SCHENKER XMG Apex 17 (Late 23) | |
| Acer Nitro 17 AN17-51-71ER | |
| Medion Erazer Defender P40 | |
| PCMark 10 / Productivity | |
| SCHENKER XMG Apex 17 (Late 23) | |
| Media della classe Gaming (6662 - 14612, n=133, ultimi 2 anni) | |
| Tulpar T7 V20.6 | |
| Medion Erazer Defender P40 | |
| Media Intel Core i7-13700H, NVIDIA GeForce RTX 4060 Laptop GPU (8238 - 10249, n=5) | |
| MSI Katana 17 B13VFK | |
| Lenovo Legion 5 16IRX G9 | |
| Acer Nitro 17 AN17-51-71ER | |
| PCMark 10 / Digital Content Creation | |
| Media della classe Gaming (6807 - 18475, n=133, ultimi 2 anni) | |
| SCHENKER XMG Apex 17 (Late 23) | |
| Lenovo Legion 5 16IRX G9 | |
| Acer Nitro 17 AN17-51-71ER | |
| Media Intel Core i7-13700H, NVIDIA GeForce RTX 4060 Laptop GPU (10308 - 11862, n=5) | |
| Tulpar T7 V20.6 | |
| MSI Katana 17 B13VFK | |
| Medion Erazer Defender P40 | |
| CrossMark / Overall | |
| Lenovo Legion 5 16IRX G9 | |
| Media della classe Gaming (1247 - 2344, n=114, ultimi 2 anni) | |
| MSI Katana 17 B13VFK | |
| SCHENKER XMG Apex 17 (Late 23) | |
| Medion Erazer Defender P40 | |
| Tulpar T7 V20.6 | |
| Media Intel Core i7-13700H, NVIDIA GeForce RTX 4060 Laptop GPU (1629 - 1849, n=5) | |
| Acer Nitro 17 AN17-51-71ER | |
| CrossMark / Productivity | |
| Lenovo Legion 5 16IRX G9 | |
| Media della classe Gaming (1299 - 2204, n=114, ultimi 2 anni) | |
| MSI Katana 17 B13VFK | |
| SCHENKER XMG Apex 17 (Late 23) | |
| Tulpar T7 V20.6 | |
| Medion Erazer Defender P40 | |
| Media Intel Core i7-13700H, NVIDIA GeForce RTX 4060 Laptop GPU (1561 - 1743, n=5) | |
| Acer Nitro 17 AN17-51-71ER | |
| CrossMark / Creativity | |
| Lenovo Legion 5 16IRX G9 | |
| Media della classe Gaming (1275 - 2660, n=114, ultimi 2 anni) | |
| MSI Katana 17 B13VFK | |
| Medion Erazer Defender P40 | |
| SCHENKER XMG Apex 17 (Late 23) | |
| Media Intel Core i7-13700H, NVIDIA GeForce RTX 4060 Laptop GPU (1691 - 2064, n=5) | |
| Tulpar T7 V20.6 | |
| Acer Nitro 17 AN17-51-71ER | |
| CrossMark / Responsiveness | |
| Lenovo Legion 5 16IRX G9 | |
| MSI Katana 17 B13VFK | |
| Media della classe Gaming (1030 - 2330, n=114, ultimi 2 anni) | |
| SCHENKER XMG Apex 17 (Late 23) | |
| Acer Nitro 17 AN17-51-71ER | |
| Medion Erazer Defender P40 | |
| Media Intel Core i7-13700H, NVIDIA GeForce RTX 4060 Laptop GPU (1381 - 1656, n=5) | |
| Tulpar T7 V20.6 | |
| WebXPRT 3 / Overall | |
| Lenovo Legion 5 16IRX G9 | |
| SCHENKER XMG Apex 17 (Late 23) | |
| Media della classe Gaming (215 - 480, n=127, ultimi 2 anni) | |
| Tulpar T7 V20.6 | |
| MSI Katana 17 B13VFK | |
| Medion Erazer Defender P40 | |
| Media Intel Core i7-13700H, NVIDIA GeForce RTX 4060 Laptop GPU (215 - 314, n=4) | |
| Acer Nitro 17 AN17-51-71ER | |
| WebXPRT 4 / Overall | |
| Lenovo Legion 5 16IRX G9 | |
| Tulpar T7 V20.6 | |
| MSI Katana 17 B13VFK | |
| Media della classe Gaming (176.4 - 335, n=115, ultimi 2 anni) | |
| Media Intel Core i7-13700H, NVIDIA GeForce RTX 4060 Laptop GPU (228 - 274, n=4) | |
| Medion Erazer Defender P40 | |
| SCHENKER XMG Apex 17 (Late 23) | |
| Acer Nitro 17 AN17-51-71ER | |
| Mozilla Kraken 1.1 / Total | |
| Acer Nitro 17 AN17-51-71ER | |
| Medion Erazer Defender P40 | |
| MSI Katana 17 B13VFK | |
| SCHENKER XMG Apex 17 (Late 23) | |
| Media Intel Core i7-13700H, NVIDIA GeForce RTX 4060 Laptop GPU (495 - 570, n=4) | |
| Media della classe Gaming (409 - 674, n=139, ultimi 2 anni) | |
| Tulpar T7 V20.6 | |
| Lenovo Legion 5 16IRX G9 | |
* ... Meglio usare valori piccoli
| PCMark 10 Score | 7463 punti | |
Aiuto | ||
| AIDA64 / Memory Copy | |
| SCHENKER XMG Apex 17 (Late 23) | |
| Media della classe Gaming (21750 - 97515, n=147, ultimi 2 anni) | |
| Media Intel Core i7-13700H (24334 - 78081, n=29) | |
| Lenovo Legion 5 16IRX G9 | |
| Acer Nitro 17 AN17-51-71ER | |
| Medion Erazer Defender P40 | |
| MSI Katana 17 B13VFK | |
| Tulpar T7 V20.6 | |
| AIDA64 / Memory Read | |
| Lenovo Legion 5 16IRX G9 | |
| Media della classe Gaming (22956 - 102937, n=147, ultimi 2 anni) | |
| Medion Erazer Defender P40 | |
| Acer Nitro 17 AN17-51-71ER | |
| Media Intel Core i7-13700H (23681 - 79656, n=29) | |
| SCHENKER XMG Apex 17 (Late 23) | |
| MSI Katana 17 B13VFK | |
| Tulpar T7 V20.6 | |
| AIDA64 / Memory Write | |
| SCHENKER XMG Apex 17 (Late 23) | |
| Media della classe Gaming (22297 - 108954, n=147, ultimi 2 anni) | |
| Media Intel Core i7-13700H (22986 - 99898, n=29) | |
| Acer Nitro 17 AN17-51-71ER | |
| Medion Erazer Defender P40 | |
| Lenovo Legion 5 16IRX G9 | |
| MSI Katana 17 B13VFK | |
| Tulpar T7 V20.6 | |
| AIDA64 / Memory Latency | |
| Acer Nitro 17 AN17-51-71ER | |
| MSI Katana 17 B13VFK | |
| Media della classe Gaming (59.5 - 259, n=147, ultimi 2 anni) | |
| Media Intel Core i7-13700H (82.4 - 136.8, n=29) | |
| Medion Erazer Defender P40 | |
| Lenovo Legion 5 16IRX G9 | |
| Tulpar T7 V20.6 | |
| SCHENKER XMG Apex 17 (Late 23) | |
* ... Meglio usare valori piccoli
Latenze DPC
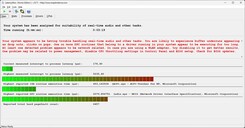
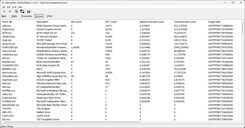
Purtroppo, avevamo già notato i primi problemi di latenza quando si spostava la finestra del software LatencyMon. L'apertura del browser ha aumentato ulteriormente il valore di latenza, mentre l'apertura successiva di diverse schede non lo ha fatto. Fino a questo punto, il valore di circa 500 μs che abbiamo misurato rientra ancora in un intervallo tollerabile.
Tuttavia, durante la riproduzione del nostro video YouTube a 4K/60fps, il valore del ritardo è salito a oltre 5.000 μs! Tuttavia, non si sono verificate cadute di fotogrammi. Tuttavia, il valore è ancora chiaramente troppo alto.
| DPC Latencies / LatencyMon - interrupt to process latency (max), Web, Youtube, Prime95 | |
| Tulpar T7 V20.6 | |
| Medion Erazer Defender P40 | |
| MSI Katana 17 B13VFK | |
| Lenovo Legion 5 16IRX G9 | |
| Acer Nitro 17 AN17-51-71ER | |
| SCHENKER XMG Apex 17 (Late 23) | |
* ... Meglio usare valori piccoli
Dispositivi di archiviazione
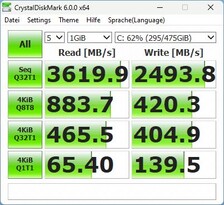
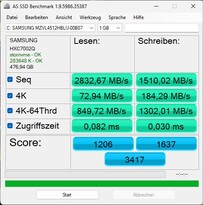
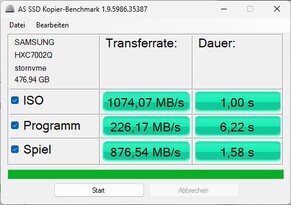
L'SSD NVMe Samsung installato con solo 500 GB di spazio di archiviazione è un po' più vecchio e, di conseguenza, non particolarmente veloce, anche perché ha prestazioni leggermente inferiori all'interno del T7. La concorrenza è chiaramente più veloce sotto questo aspetto. Dovrebbe sicuramente optare per una configurazione T7 con 1 TB di spazio di archiviazione. Tuttavia, non c'è da preoccuparsi, perché la sua velocità dovrebbe essere sufficiente per il lavoro di tutti i giorni e per i giochi, e ha anche ottenuto risultati leggermente migliori nel test Crystaldiskmark. Dopotutto, le sue prestazioni sono rimaste costanti per un periodo di tempo più lungo.
* ... Meglio usare valori piccoli
Reading continuous performance: DiskSpd Read Loop, Queue Depth 8
Scheda grafica
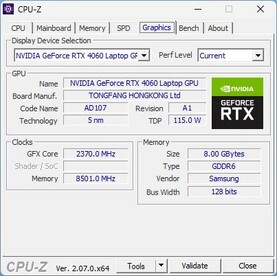
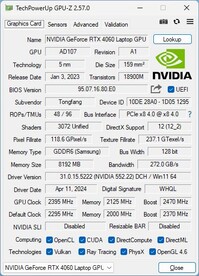
Tutti i modelli T7 sono dotati di una Nvidia Geforce RTX 4060. Tulpar non ha fornito informazioni sulle sue prestazioni, ma il pannello di controllo Nvidia dichiara 140 watt. La RTX 4060 dovrebbe essere in grado di eseguire quasi tutti i giochi attuali in Full HD con dettagli medio-alti, il che è compatibile con il display installato.
Nei test sintetici 3DMark, le sue prestazioni 3D sono state molto buone e circa il 10% migliori rispetto alla media dei laptop con la stessa GPU.
Un'esecuzione ripetuta di Fire Strike in modalità batteria ha comportato una perdita di prestazioni 3D di circa l'85 percento, un calo enorme! A quanto pare, in questo caso è in gioco solo la GPU integrata. Se Optimus viene disattivato (solo dGPU attiva), il suo punteggio aumenta in modo significativo e la perdita di prestazioni si riduce a circa il 56 percento.
| 3DMark 11 Performance | 28054 punti | |
| 3DMark Cloud Gate Standard Score | 60984 punti | |
| 3DMark Fire Strike Score | 24884 punti | |
| 3DMark Time Spy Score | 10324 punti | |
Aiuto | ||
* ... Meglio usare valori piccoli
Prestazioni di gioco
Sfortunatamente, il notebook Tulpar non è riuscito a mantenere gli ottimi risultati di 3DMark nel confronto dei giochi, poiché spesso perdeva rispetto alla concorrenza e finiva in fondo alla classifica. L'XMG era a un livello simile, ma molti dei suoi concorrenti erano più veloci del 10%.
Quando esegue il gioco attuale Skull & Bones, il T7 raggiunge ancora una media giocabile di 65 fps in Full HD e con dettagli ultra.
| The Witcher 3 - 1920x1080 Ultra Graphics & Postprocessing (HBAO+) | |
| Media della classe Gaming (18.4 - 214, n=119, ultimi 2 anni) | |
| Acer Nitro 17 AN17-51-71ER | |
| MSI Katana 17 B13VFK | |
| SCHENKER XMG Apex 17 (Late 23) | |
| Medion Erazer Defender P40 | |
| Tulpar T7 V20.6 | |
| Lenovo Legion 5 16IRX G9 | |
| GTA V - 1920x1080 Highest Settings possible AA:4xMSAA + FX AF:16x | |
| Lenovo Legion 5 16IRX G9 | |
| Acer Nitro 17 AN17-51-71ER | |
| Medion Erazer Defender P40 | |
| MSI Katana 17 B13VFK | |
| Media della classe Gaming (12.1 - 168.2, n=132, ultimi 2 anni) | |
| Tulpar T7 V20.6 | |
| Final Fantasy XV Benchmark - 1920x1080 High Quality | |
| Media della classe Gaming (19.2 - 201, n=144, ultimi 2 anni) | |
| Lenovo Legion 5 16IRX G9 | |
| SCHENKER XMG Apex 17 (Late 23) | |
| Acer Nitro 17 AN17-51-71ER | |
| Medion Erazer Defender P40 | |
| MSI Katana 17 B13VFK | |
| Tulpar T7 V20.6 | |
| Strange Brigade - 1920x1080 ultra AA:ultra AF:16 | |
| Media della classe Gaming (38.9 - 420, n=140, ultimi 2 anni) | |
| Lenovo Legion 5 16IRX G9 | |
| Tulpar T7 V20.6 | |
| Acer Nitro 17 AN17-51-71ER | |
| SCHENKER XMG Apex 17 (Late 23) | |
| Medion Erazer Defender P40 | |
| MSI Katana 17 B13VFK | |
| Dota 2 Reborn - 1920x1080 ultra (3/3) best looking | |
| Lenovo Legion 5 16IRX G9 | |
| MSI Katana 17 B13VFK | |
| Media della classe Gaming (65.1 - 220, n=148, ultimi 2 anni) | |
| Medion Erazer Defender P40 | |
| SCHENKER XMG Apex 17 (Late 23) | |
| Acer Nitro 17 AN17-51-71ER | |
| Tulpar T7 V20.6 | |
Il Witcher 3 il grafico segue la solita curva giorno/notte e per il resto, le sue prestazioni sono molto coerenti. Il T7 non è così veloce come alcuni dei suoi concorrenti, ma il divario non è troppo grande.
La frequenza di clock della GPU è costante a circa 2,6 GHz, mentre il clock della memoria è di 2,1 GHz. La GPU si riscalda fino a 72 °C e fino a un massimo di 75,5 °C. Il consumo della scheda grafica è di circa 97 watt, che è ancora lontano dai 140 watt possibili.
In modalità enthusiast, la sua velocità di clock scende da 100 a 150 MHz, ma l'andamento della temperatura è simile. Il consumo energetico è di circa 94 watt.
| Modalità di prestazione/valore della misurazione | Witcher 3 fps | clock della GPU (in GHz) | temperatura della GPU (in °C) | consumo energetico della GPU (in watt) |
|---|---|---|---|---|
| Overboost | 97 | 2,6 | 73 | 97 |
| Enthusiast | 90 | 2,45 | 72 | 94 |
| Bilanciato | 64 | 1,7 | 57 | 49 |
Witcher 3 FPS diagram
| basso | medio | alto | ultra | |
|---|---|---|---|---|
| GTA V (2015) | 178.3 | 172.1 | 163 | 97.8 |
| The Witcher 3 (2015) | 339 | 287 | 198 | 99.6 |
| Dota 2 Reborn (2015) | 148 | 130 | 124 | 115 |
| Final Fantasy XV Benchmark (2018) | 149.5 | 125.8 | 93.3 | |
| X-Plane 11.11 (2018) | 141.69 | 126.82 | 99.32 | |
| Far Cry 5 (2018) | 135 | 113 | 109 | 103 |
| Strange Brigade (2018) | 432 | 291 | 230 | 198.7 |
| Skull & Bones (2024) | 82 | 82 | 78 | 65 |
Emissioni - Valori moderati
Emissioni di rumore
Quando è al minimo sul desktop, le ventole del portatile sono solitamente spente. Questo vale anche per la modalità overdrive, ma utilizzando questa modalità, le ventole a volte aumentano brevemente fino a 40 dB. Quest'ultimo risultato può essere raggiunto anche quando si svolgono attività meno impegnative lontano dalla modalità idle.
Nel test 3DMark06, il rumore delle ventole è aumentato lentamente fino a 40 dB. Tuttavia, sono tornate ad essere più silenziose nel corso del test e alla fine le ventole hanno ronzato ad un livello abbastanza costante di 38 dB. I 40 dB che abbiamo misurato devono quindi essere intesi come il valore massimo delle ventole sotto carico medio.
Durante The Witcher 3, le ventole oscillavano costantemente tra circa 47,5 dB e poco meno di 50 dB. Si tratta di valori tipici per un giocatore, ma i concorrenti rappresentati in questo test sono ancora più rumorosi durante il gioco. Nel complesso, il T7 si comporta abbastanza bene in termini di rumore, ma non riesce a raggiungere le prestazioni degli altri dispositivi di confronto.
Rumorosità
| Idle |
| 23 / 23 / 30.84 dB(A) |
| Sotto carico |
| 40.14 / 50.69 dB(A) |
 | ||
30 dB silenzioso 40 dB(A) udibile 50 dB(A) rumoroso |
||
min: | ||
| Tulpar T7 V20.6 NVIDIA GeForce RTX 4060 Laptop GPU, i7-13700H, Samsung PM9B1 512GB MZVL4512HBLU | SCHENKER XMG Apex 17 (Late 23) NVIDIA GeForce RTX 4060 Laptop GPU, R7 7840HS, Samsung 990 Pro 1 TB | Acer Nitro 17 AN17-51-71ER NVIDIA GeForce RTX 4060 Laptop GPU, i7-13700H, Samsung PM9A1 MZVL21T0HCLR | Medion Erazer Defender P40 NVIDIA GeForce RTX 4060 Laptop GPU, i7-13700HX, Phison PS5021-E21 1TB | MSI Katana 17 B13VFK NVIDIA GeForce RTX 4060 Laptop GPU, i7-13620H, Micron 2400 MTFDKBA1T0QFM | Lenovo Legion 5 16IRX G9 NVIDIA GeForce RTX 4060 Laptop GPU, i7-14650HX, Samsung PM9A1 MZVL21T0HCLR | |
|---|---|---|---|---|---|---|
| Noise | -6% | -3% | -16% | -14% | -9% | |
| off /ambiente * | 23 | 24 -4% | 24 -4% | 25 -9% | 24.5 -7% | 24 -4% |
| Idle Minimum * | 23 | 25 -9% | 24 -4% | 26 -13% | 24.5 -7% | 24 -4% |
| Idle Average * | 23 | 29 -26% | 24 -4% | 27 -17% | 24.5 -7% | 28.8 -25% |
| Idle Maximum * | 30.84 | 33 -7% | 32.32 -5% | 32 -4% | 40 -30% | 32 -4% |
| Load Average * | 40.14 | 37 8% | 35.18 12% | 53 -32% | 48.3 -20% | 45.5 -13% |
| Witcher 3 ultra * | 50.69 | 50 1% | 54.78 -8% | 56 -10% | 56 -10% | 53.1 -5% |
| Load Maximum * | 50.69 | 54 -7% | 54.78 -8% | 64 -26% | 59.1 -17% | 55.7 -10% |
* ... Meglio usare valori piccoli
Temperatura
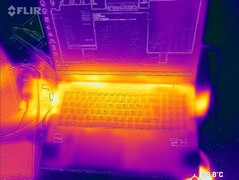
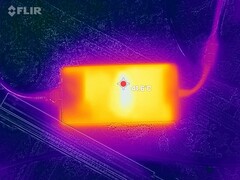
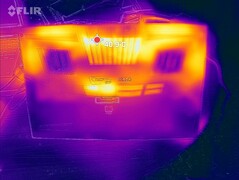
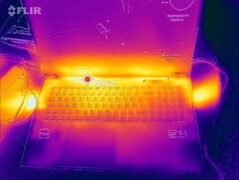
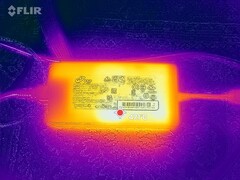
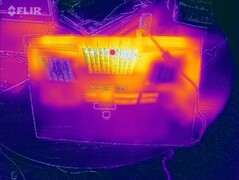
Anche le temperature superficiali del T7 sono rimaste moderate, con i punti caldi che si sono riscaldati solo fino a 44 °C durante lo stress test.
Quando abbiamo eseguito lo stesso stress test in modalità bilanciata, abbiamo misurato temperature superficiali medie di soli 32 °C nella parte superiore e 33 °C in quella inferiore.
(+) La temperatura massima sul lato superiore è di 38 °C / 100 F, rispetto alla media di 40.4 °C / 105 F, che varia da 21.2 a 68.8 °C per questa classe Gaming.
(±) Il lato inferiore si riscalda fino ad un massimo di 44 °C / 111 F, rispetto alla media di 43.2 °C / 110 F
(+) In idle, la temperatura media del lato superiore è di 30 °C / 86 F, rispetto alla media deld ispositivo di 33.9 °C / 93 F.
(±) Riproducendo The Witcher 3, la temperatura media per il lato superiore e' di 34.3 °C / 94 F, rispetto alla media del dispositivo di 33.9 °C / 93 F.
(+) I poggiapolsi e il touchpad raggiungono la temperatura massima della pelle (35 °C / 95 F) e quindi non sono caldi.
(-) La temperatura media della zona del palmo della mano di dispositivi simili e'stata di 28.9 °C / 84 F (-6.1 °C / -11 F).
| Tulpar T7 V20.6 Intel Core i7-13700H, NVIDIA GeForce RTX 4060 Laptop GPU | SCHENKER XMG Apex 17 (Late 23) AMD Ryzen 7 7840HS, NVIDIA GeForce RTX 4060 Laptop GPU | Acer Nitro 17 AN17-51-71ER Intel Core i7-13700H, NVIDIA GeForce RTX 4060 Laptop GPU | Medion Erazer Defender P40 Intel Core i7-13700HX, NVIDIA GeForce RTX 4060 Laptop GPU | MSI Katana 17 B13VFK Intel Core i7-13620H, NVIDIA GeForce RTX 4060 Laptop GPU | Lenovo Legion 5 16IRX G9 Intel Core i7-14650HX, NVIDIA GeForce RTX 4060 Laptop GPU | |
|---|---|---|---|---|---|---|
| Heat | -16% | -11% | 2% | -4% | -2% | |
| Maximum Upper Side * | 38 | 51 -34% | 46 -21% | 42 -11% | 41.6 -9% | 40.4 -6% |
| Maximum Bottom * | 44 | 54 -23% | 51 -16% | 45 -2% | 43.1 2% | 43.8 -0% |
| Idle Upper Side * | 32 | 33 -3% | 34 -6% | 28 12% | 32 -0% | 30.3 5% |
| Idle Bottom * | 33 | 34 -3% | 33 -0% | 30 9% | 35.8 -8% | 35.3 -7% |
* ... Meglio usare valori piccoli
Test da sforzo
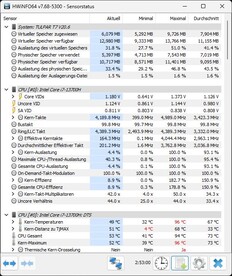
Nel test di stress, i core hanno raggiunto un clock di circa 3,5 - 3,7 GHz all'inizio e sono rimasti in questo intervallo fino alla fine del test di un'ora. Le temperature dei core sono state in media di 78 °C, e non hanno superato gli 85 °C. Il consumo energetico della CPU ha oscillato tra 60 e 80 watt, con una media di 67 watt.
| Clock della CPU (GHz) | Clock della GPU (MHz) | Temperatura media della CPU (°C) | Temperatura media della GPU (°C) | |
| Sistema al minimo | 4,2 | / | 41 | / |
| Prime95 + FurMark stress | 3,5 | 1.264 | 80 | 54 |
| Witcher 3 stress | 0,64 | 2.600 | 77 | 71 |
Altoparlanti
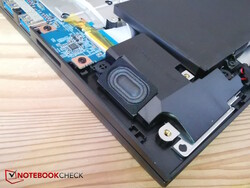
Gli altoparlanti stereo sono alloggiati negli angoli anteriori del portatile; sono piuttosto piccoli e irradiano verso il basso. Di conseguenza, potrebbero essere più forti e mancano di bassi. Almeno i medi e gli alti sono bilanciati.
Sono disponibili un ingresso per microfono e un'uscita per cuffie, entrambi da 3,5 mm, per collegare dispositivi audio analogici.
Tulpar T7 V20.6 analisi audio
(±) | potenza degli altiparlanti media ma buona (78.88 dB)
Bassi 100 - 315 Hz
(-) | quasi nessun basso - in media 20.7% inferiori alla media
(±) | la linearità dei bassi è media (12% delta rispetto alla precedente frequenza)
Medi 400 - 2000 Hz
(+) | medi bilanciati - solo only 4.8% rispetto alla media
(+) | medi lineari (6.5% delta rispetto alla precedente frequenza)
Alti 2 - 16 kHz
(+) | Alti bilanciati - appena 2.7% dalla media
(+) | alti lineari (5.7% delta rispetto alla precedente frequenza)
Nel complesso 100 - 16.000 Hz
(±) | la linearità complessiva del suono è media (17% di differenza rispetto alla media
Rispetto alla stessa classe
» 43% di tutti i dispositivi testati in questa classe è stato migliore, 12% simile, 45% peggiore
» Il migliore ha avuto un delta di 6%, medio di 18%, peggiore di 132%
Rispetto a tutti i dispositivi testati
» 28% di tutti i dispositivi testati in questa classe è stato migliore, 8% similare, 64% peggiore
» Il migliore ha avuto un delta di 4%, medio di 24%, peggiore di 134%
Lenovo Legion 5 16IRX G9 analisi audio
(+) | gli altoparlanti sono relativamente potenti (84.4 dB)
Bassi 100 - 315 Hz
(-) | quasi nessun basso - in media 25.7% inferiori alla media
(±) | la linearità dei bassi è media (8.3% delta rispetto alla precedente frequenza)
Medi 400 - 2000 Hz
(+) | medi bilanciati - solo only 4.3% rispetto alla media
(+) | medi lineari (5.2% delta rispetto alla precedente frequenza)
Alti 2 - 16 kHz
(+) | Alti bilanciati - appena 1.9% dalla media
(+) | alti lineari (2.1% delta rispetto alla precedente frequenza)
Nel complesso 100 - 16.000 Hz
(±) | la linearità complessiva del suono è media (16.1% di differenza rispetto alla media
Rispetto alla stessa classe
» 37% di tutti i dispositivi testati in questa classe è stato migliore, 7% simile, 56% peggiore
» Il migliore ha avuto un delta di 6%, medio di 18%, peggiore di 132%
Rispetto a tutti i dispositivi testati
» 23% di tutti i dispositivi testati in questa classe è stato migliore, 5% similare, 72% peggiore
» Il migliore ha avuto un delta di 4%, medio di 24%, peggiore di 134%
Gestione dell'alimentazione - L'efficienza dell'anno scorso
Consumo di energia
Il T7 non è particolarmente frugale. Ci sono già concorrenti più parsimoniosi quando il portatile è al minimo, anche se la differenza non è troppo grande. Quando è in funzione, il consumo di The Witcher 3 è troppo elevato, soprattutto se si considerano le sue prestazioni leggermente basse. Sebbene Medion e Lenovo consumino un po' di più, XMG e Acer sono un po' più parsimoniosi e offrono prestazioni leggermente migliori.
Se si collega un monitor esterno tramite HDMI, la dGPU del portatile è attiva, con conseguente aumento del consumo inattivo di circa 5 watt, ad esempio (vedere il grafico sottostante).
| Off / Standby | |
| Idle | |
| Sotto carico |
|
Leggenda:
min: | |
| Tulpar T7 V20.6 i7-13700H, NVIDIA GeForce RTX 4060 Laptop GPU, Samsung PM9B1 512GB MZVL4512HBLU, IPS, 1920x1080, 17.3" | SCHENKER XMG Apex 17 (Late 23) R7 7840HS, NVIDIA GeForce RTX 4060 Laptop GPU, Samsung 990 Pro 1 TB, IPS, 2560x1440, 17.3" | Acer Nitro 17 AN17-51-71ER i7-13700H, NVIDIA GeForce RTX 4060 Laptop GPU, Samsung PM9A1 MZVL21T0HCLR, , 2560x1440, 17.3" | Medion Erazer Defender P40 i7-13700HX, NVIDIA GeForce RTX 4060 Laptop GPU, Phison PS5021-E21 1TB, IPS, 2560x1440, 17.3" | MSI Katana 17 B13VFK i7-13620H, NVIDIA GeForce RTX 4060 Laptop GPU, Micron 2400 MTFDKBA1T0QFM, IPS LED, 1920x1080, 17.3" | Lenovo Legion 5 16IRX G9 i7-14650HX, NVIDIA GeForce RTX 4060 Laptop GPU, Samsung PM9A1 MZVL21T0HCLR, IPS, 2560x1600, 16" | Media NVIDIA GeForce RTX 4060 Laptop GPU | Media della classe Gaming | |
|---|---|---|---|---|---|---|---|---|
| Power Consumption | 16% | 9% | -2% | 3% | -21% | -5% | -24% | |
| Idle Minimum * | 12 | 9 25% | 8.3 31% | 8 33% | 12.2 -2% | 15.4 -28% | 11.5 ? 4% | 13.4 ? -12% |
| Idle Average * | 17 | 12 29% | 13.5 21% | 12 29% | 14.9 12% | 19.7 -16% | 16 ? 6% | 18.9 ? -11% |
| Idle Maximum * | 17.5 | 14 20% | 14.8 15% | 18 -3% | 15.8 10% | 20.7 -18% | 20.3 ? -16% | 26.3 ? -50% |
| Load Average * | 78.5 | 67 15% | 77 2% | 101 -29% | 85.22 -9% | 102.6 -31% | 92.9 ? -18% | 102.7 ? -31% |
| Witcher 3 ultra * | 169 | 147.6 13% | 154 9% | 180.8 -7% | 151.1 11% | 191.3 -13% | ||
| Load Maximum * | 209 | 223 -7% | 263 -26% | 284 -36% | 212.8 -2% | 246.6 -18% | 210 ? -0% | 244 ? -17% |
* ... Meglio usare valori piccoli
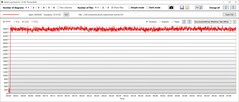
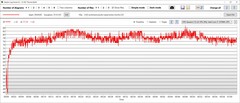
Power consumption Witcher 3 / stress test
Power consumption with external monitor
Tempi di esecuzione
Tulpar ha installato una batteria da 62 Wh nel case da 17 pollici. Per quanto riguarda le dimensioni del portatile, non è molto per un gamer e si può chiaramente notare che il produttore ha risparmiato un po' di soldi, anche se l'XMG Apex è dotato della stessa batteria e l'MSI Katana deve addirittura accontentarsi di soli 54 Wh. Gli altri tre concorrenti sono dotati di batterie più grandi, tra i 73 e i 90 Wh.
Di conseguenza, il T7 ha ottenuto tempi di funzionamento di circa 3,5 ore durante il test WLAN e il test video con una luminosità ridotta di 150 nits. Solo il Katana ha fatto peggio in questo caso, mentre gli altri dispositivi di confronto hanno resistito molto più a lungo, ad esempio l'Apex, nonostante sia dotato della stessa batteria. Ciò è forse dovuto al fatto che ha adottato misure di risparmio energetico migliori.
| Tulpar T7 V20.6 i7-13700H, NVIDIA GeForce RTX 4060 Laptop GPU, 62.32 Wh | SCHENKER XMG Apex 17 (Late 23) R7 7840HS, NVIDIA GeForce RTX 4060 Laptop GPU, 62.32 Wh | Acer Nitro 17 AN17-51-71ER i7-13700H, NVIDIA GeForce RTX 4060 Laptop GPU, 90 Wh | Medion Erazer Defender P40 i7-13700HX, NVIDIA GeForce RTX 4060 Laptop GPU, 73 Wh | MSI Katana 17 B13VFK i7-13620H, NVIDIA GeForce RTX 4060 Laptop GPU, 53.5 Wh | Lenovo Legion 5 16IRX G9 i7-14650HX, NVIDIA GeForce RTX 4060 Laptop GPU, 80 Wh | Media della classe Gaming | |
|---|---|---|---|---|---|---|---|
| Autonomia della batteria | 45% | 111% | 38% | -26% | 74% | 60% | |
| H.264 | 222 | 411 85% | 413 86% | 339 53% | 576 159% | 447 ? 101% | |
| WiFi v1.3 | 209 | 306 46% | 494 136% | 373 78% | 176 -16% | 444 112% | 387 ? 85% |
| Load | 90 | 93 3% | 76 -16% | 58 -36% | 46 -49% | 84.5 ? -6% | |
| Reader / Idle | 469 | 528 | 585 ? | ||||
| Witcher 3 ultra | 151 | 74.7 ? |
Pro
Contro
Verdetto - Conveniente, solido, ma la competenza di base!
A parte il prezzo attualmente interessante, del Tulpar T7 ci piacciono soprattutto la tastiera, la WLAN veloce e, naturalmente, l'assistenza a vita, annuale e gratuita. Inoltre, il T7 rimane abbastanza fresco sotto sforzo.
Tuttavia, quest'ultimo aspetto ha il suo prezzo, in quanto il gamer economico purtroppo non sfrutta appieno la sua potenza quando gioca. Naturalmente, si può perdonare un portatile da gioco economico per una webcam debole o per il mancato supporto di Thunderbolt. Ma, a sua volta, dovrebbe essere in grado di soddisfare la sua disciplina principale, ossia il gioco. E il portatile Tulpar semplicemente non lo fa. Il fatto che il produttore ci abbia inviato una configurazione con 16 GB di RAM a canale singolo, sebbene esistano varie SKU con 32 GB (si spera a doppio canale?), ha purtroppo avuto un effetto negativo sui risultati dei nostri benchmark. Di conseguenza, il T7 rimane indietro rispetto alla concorrenza quando si tratta di giocare, anche se non dovrebbe. Anche la durata della batteria potrebbe deludere alcuni utenti, anche se potrebbe non essere troppo importante per un giocatore da 17 pollici.
Tulpar T7 è un computer portatile da gioco conveniente con una generosa promessa di assistenza gratuita per tutta la vita, ogni anno. Deve solo assicurarsi di selezionare una configurazione con RAM a doppio canale, perché altrimenti le sue prestazioni non possono tenere il passo con la concorrenza.
Se si considera solo il suo MRSP, ci sono molte alternative. Tuttavia, il T7 con RTX 4060 è attualmente disponibile a un prezzo particolarmente basso, in alcuni casi inferiore a 1.000 dollari. Se è disposto a spendere di più, allora il modello Lenovo Legion 5 potrebbe essere un'alternativa migliore in molte aree.
Prezzo e disponibilità
Attualmente, il Tulpar T7 non è ancora disponibile negli Stati Uniti. A quanto pare, il produttore è pronto a lanciare i suoi prodotti negli Stati Uniti nel corso dell'anno.
Tulpar T7 V20.6
- 05/24/2024 v7 (old)
Christian Hintze
Transparency
La selezione dei dispositivi da recensire viene effettuata dalla nostra redazione. Il campione di prova è stato fornito all'autore come prestito dal produttore o dal rivenditore ai fini di questa recensione. L'istituto di credito non ha avuto alcuna influenza su questa recensione, né il produttore ne ha ricevuto una copia prima della pubblicazione. Non vi era alcun obbligo di pubblicare questa recensione. Non accettiamo mai compensi o pagamenti in cambio delle nostre recensioni. In quanto società mediatica indipendente, Notebookcheck non è soggetta all'autorità di produttori, rivenditori o editori.
Ecco come Notebookcheck esegue i test
Ogni anno, Notebookcheck esamina in modo indipendente centinaia di laptop e smartphone utilizzando procedure standardizzate per garantire che tutti i risultati siano comparabili. Da circa 20 anni sviluppiamo continuamente i nostri metodi di prova e nel frattempo stabiliamo gli standard di settore. Nei nostri laboratori di prova, tecnici ed editori esperti utilizzano apparecchiature di misurazione di alta qualità. Questi test comportano un processo di validazione in più fasi. Il nostro complesso sistema di valutazione si basa su centinaia di misurazioni e parametri di riferimento ben fondati, che mantengono l'obiettività.


