

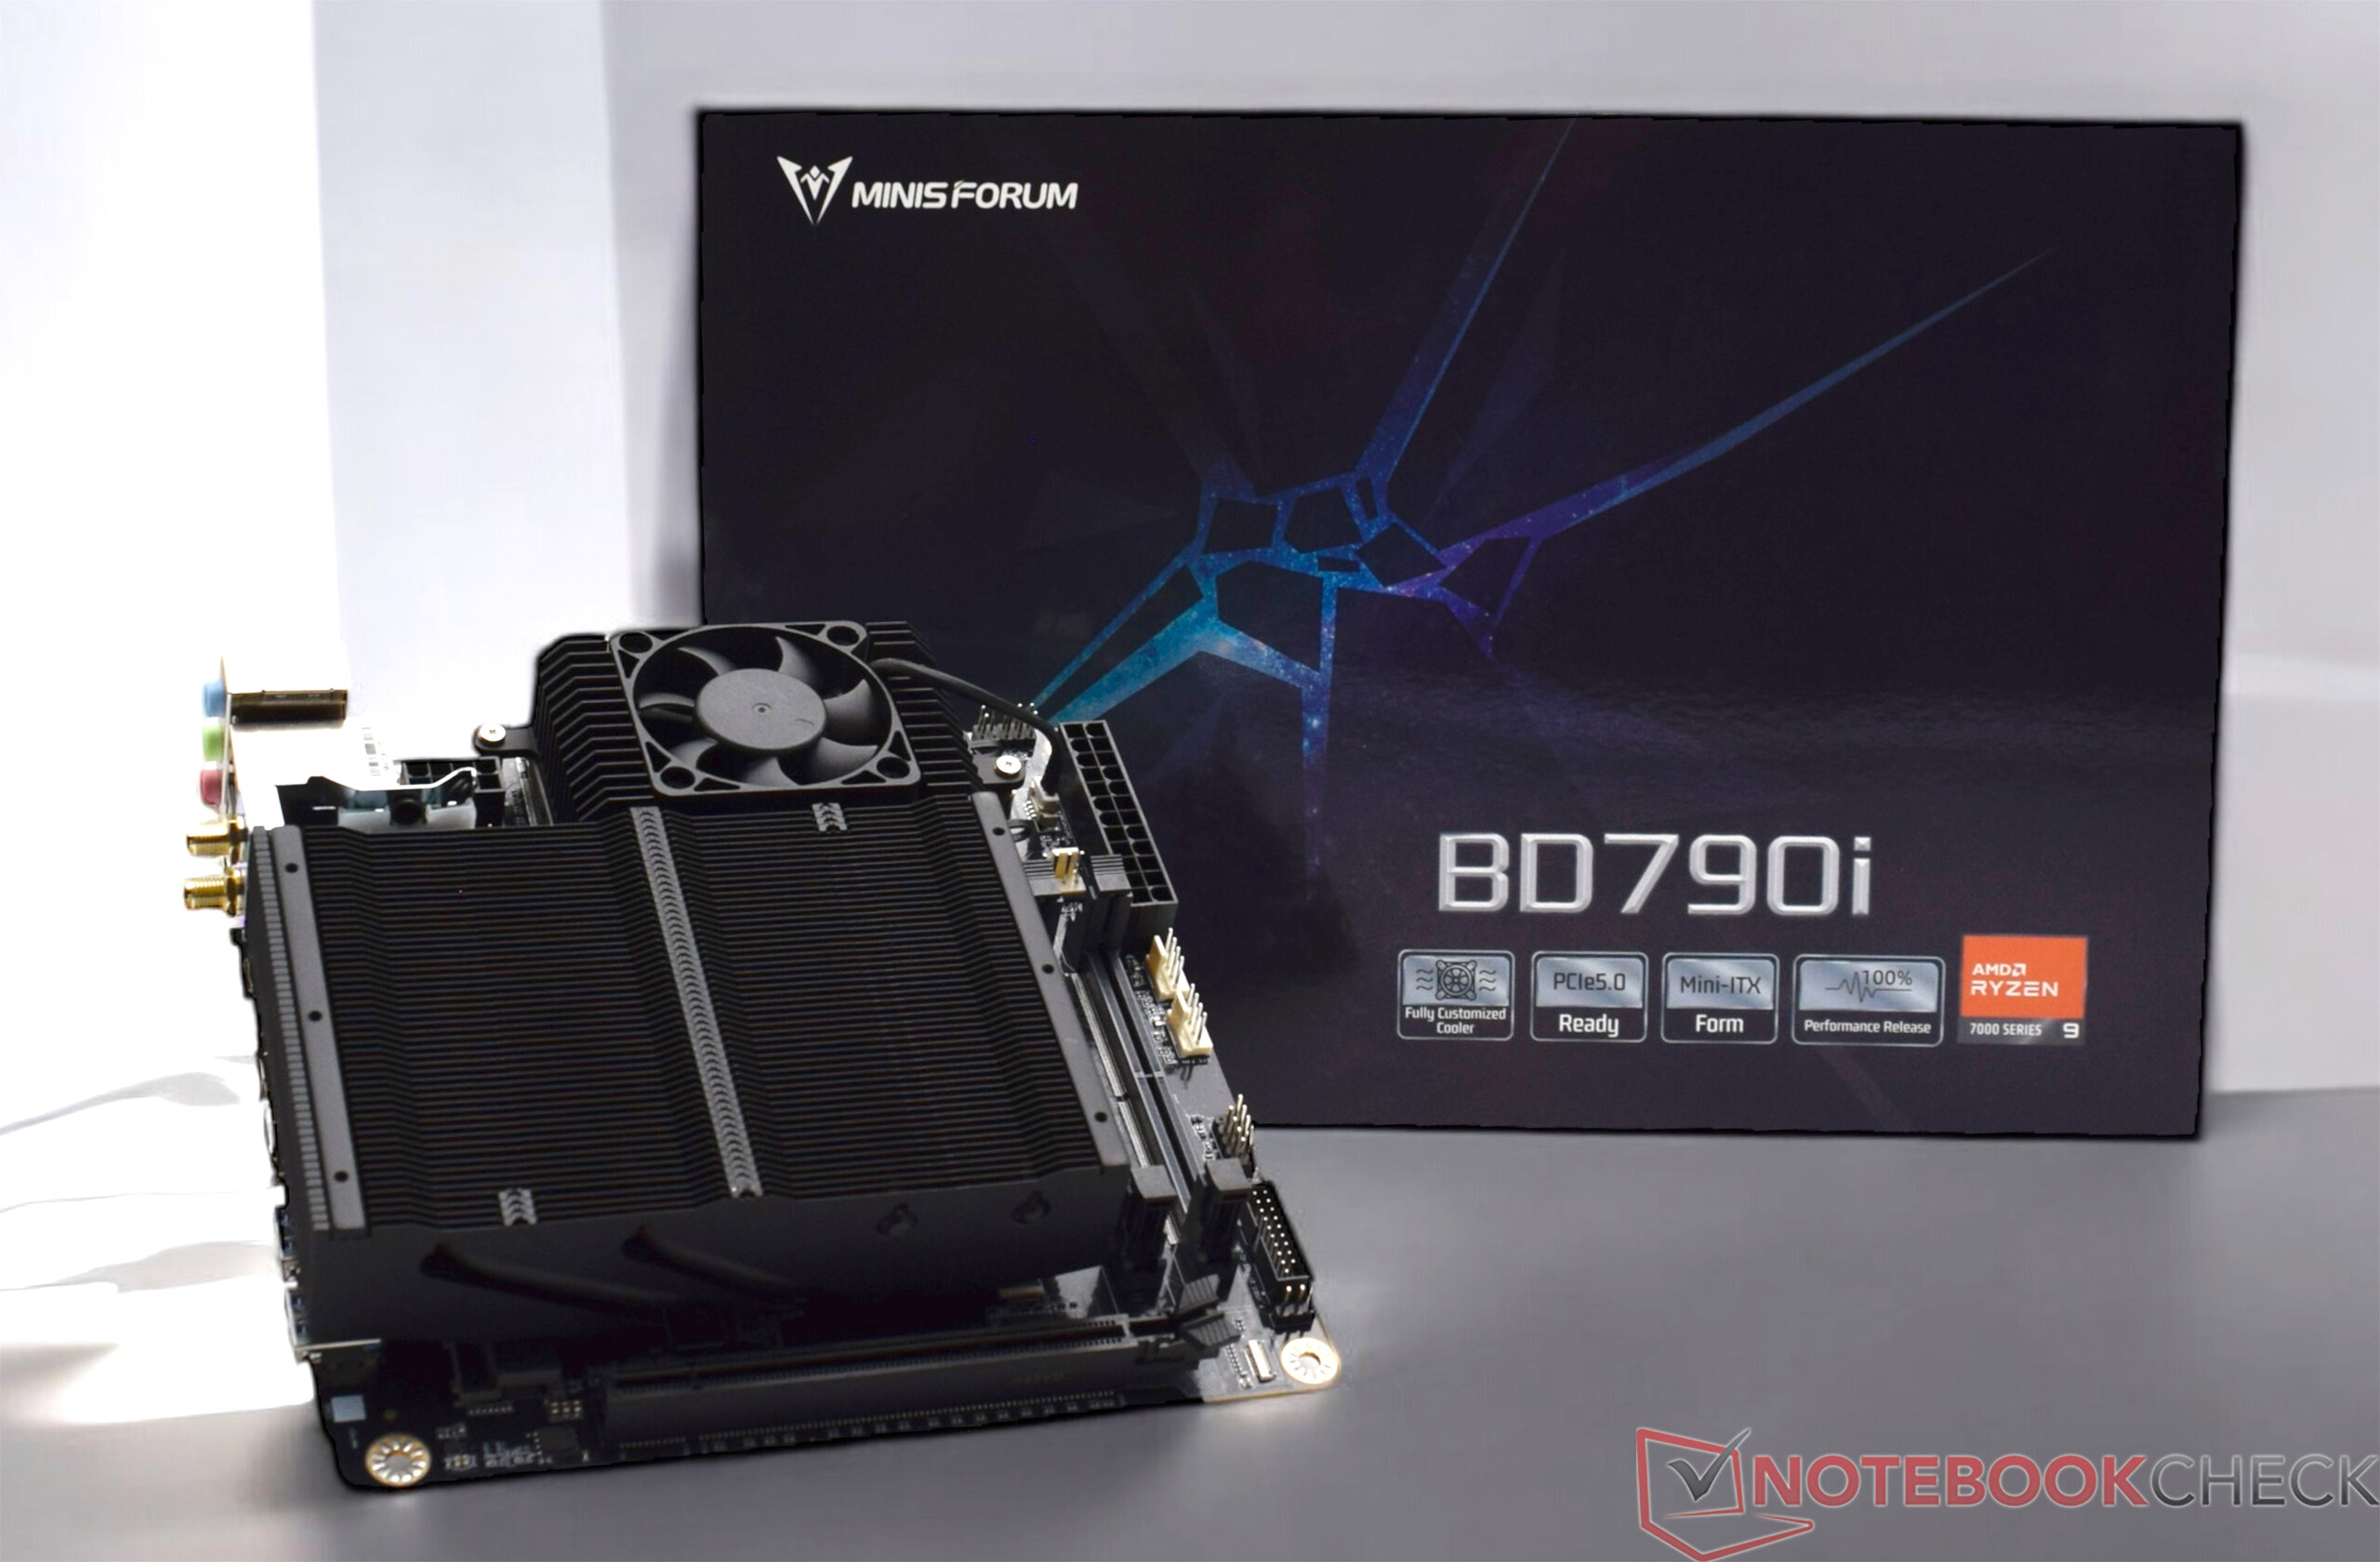
Minisforum è noto soprattutto per l'offerta di mini PC di tutte le classi di prestazioni. La maggior parte dei produttori di mini PC tende a rimanere lontana dal mercato dei desktop convenzionali, ma a quanto pare, Minisforum sta osando prendere piede anche in questo settore. Qualche tempo fa, abbiamo avuto modo di scoprire le buone prestazioni di Minisforum BD770i basato su AMD Ryzen 7 7745HX. Come modello top di gamma con APU AMD Ryzen, la scheda madre BD790i di Minisforum è un modello ancora più potente nel portafoglio del produttore, che esamineremo in dettaglio in questa recensione.
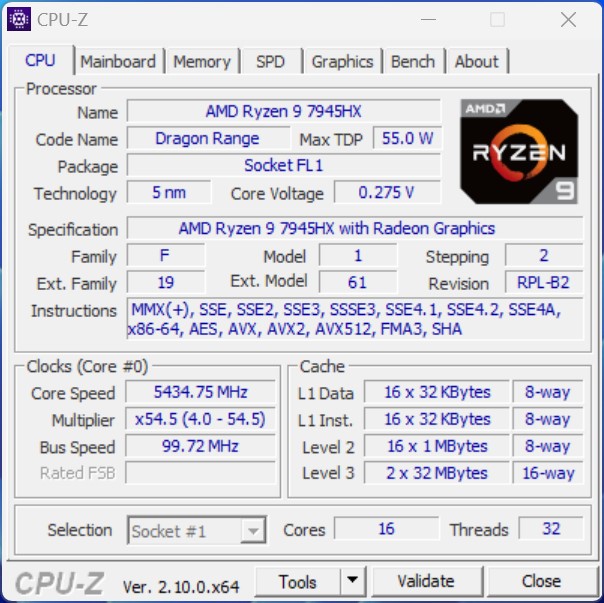
Minisforum ha installato un AMD Ryzen 9 7945HX nel BD790i, che è dotato di 16 core Zen4. Ciò significa che il SoC, che proviene dal settore mobile, è attualmente uno dei più veloci che AMD possa offrire. Per valutare le sue prestazioni di gioco, abbiamo dato un'occhiata in combinazione con una Nvidia GeForce RTX 4090. Grazie al suo slot PCIe x16 completo, la scheda grafica poteva essere collegata con tutte le sue prestazioni.
Schede madri Minisforum a confronto
| Nome | BD790i | BD790i SE | BD770i | AR900i |
| CPU | AMD Ryzen 9 7945HX | AMD Ryzen 9 7940HX | AMD Ryzen 7 7745HX | Processore Intel Core i9-13900HX |
| Core / thread | 16 / 32 | 8/16 | 8/16 | 24/32 |
| GPU | AMD Radeon 610M | AMD Radeon 610M | AMD Radeon 610M | Intel UHD Graphics |
| Tipi di memoria | DDR5-5200 SODIMM | DDR5-5200 SODIMM | DDR5-5200 SODIMM | DDR5-5600 SODIMM |
| Dimensione massima della memoria | 96 GB | 64 GB | 64 GB | 64 GB |
Il Minisforum BD790i e il sistema di prova in dettaglio


Caso e impostazione del test
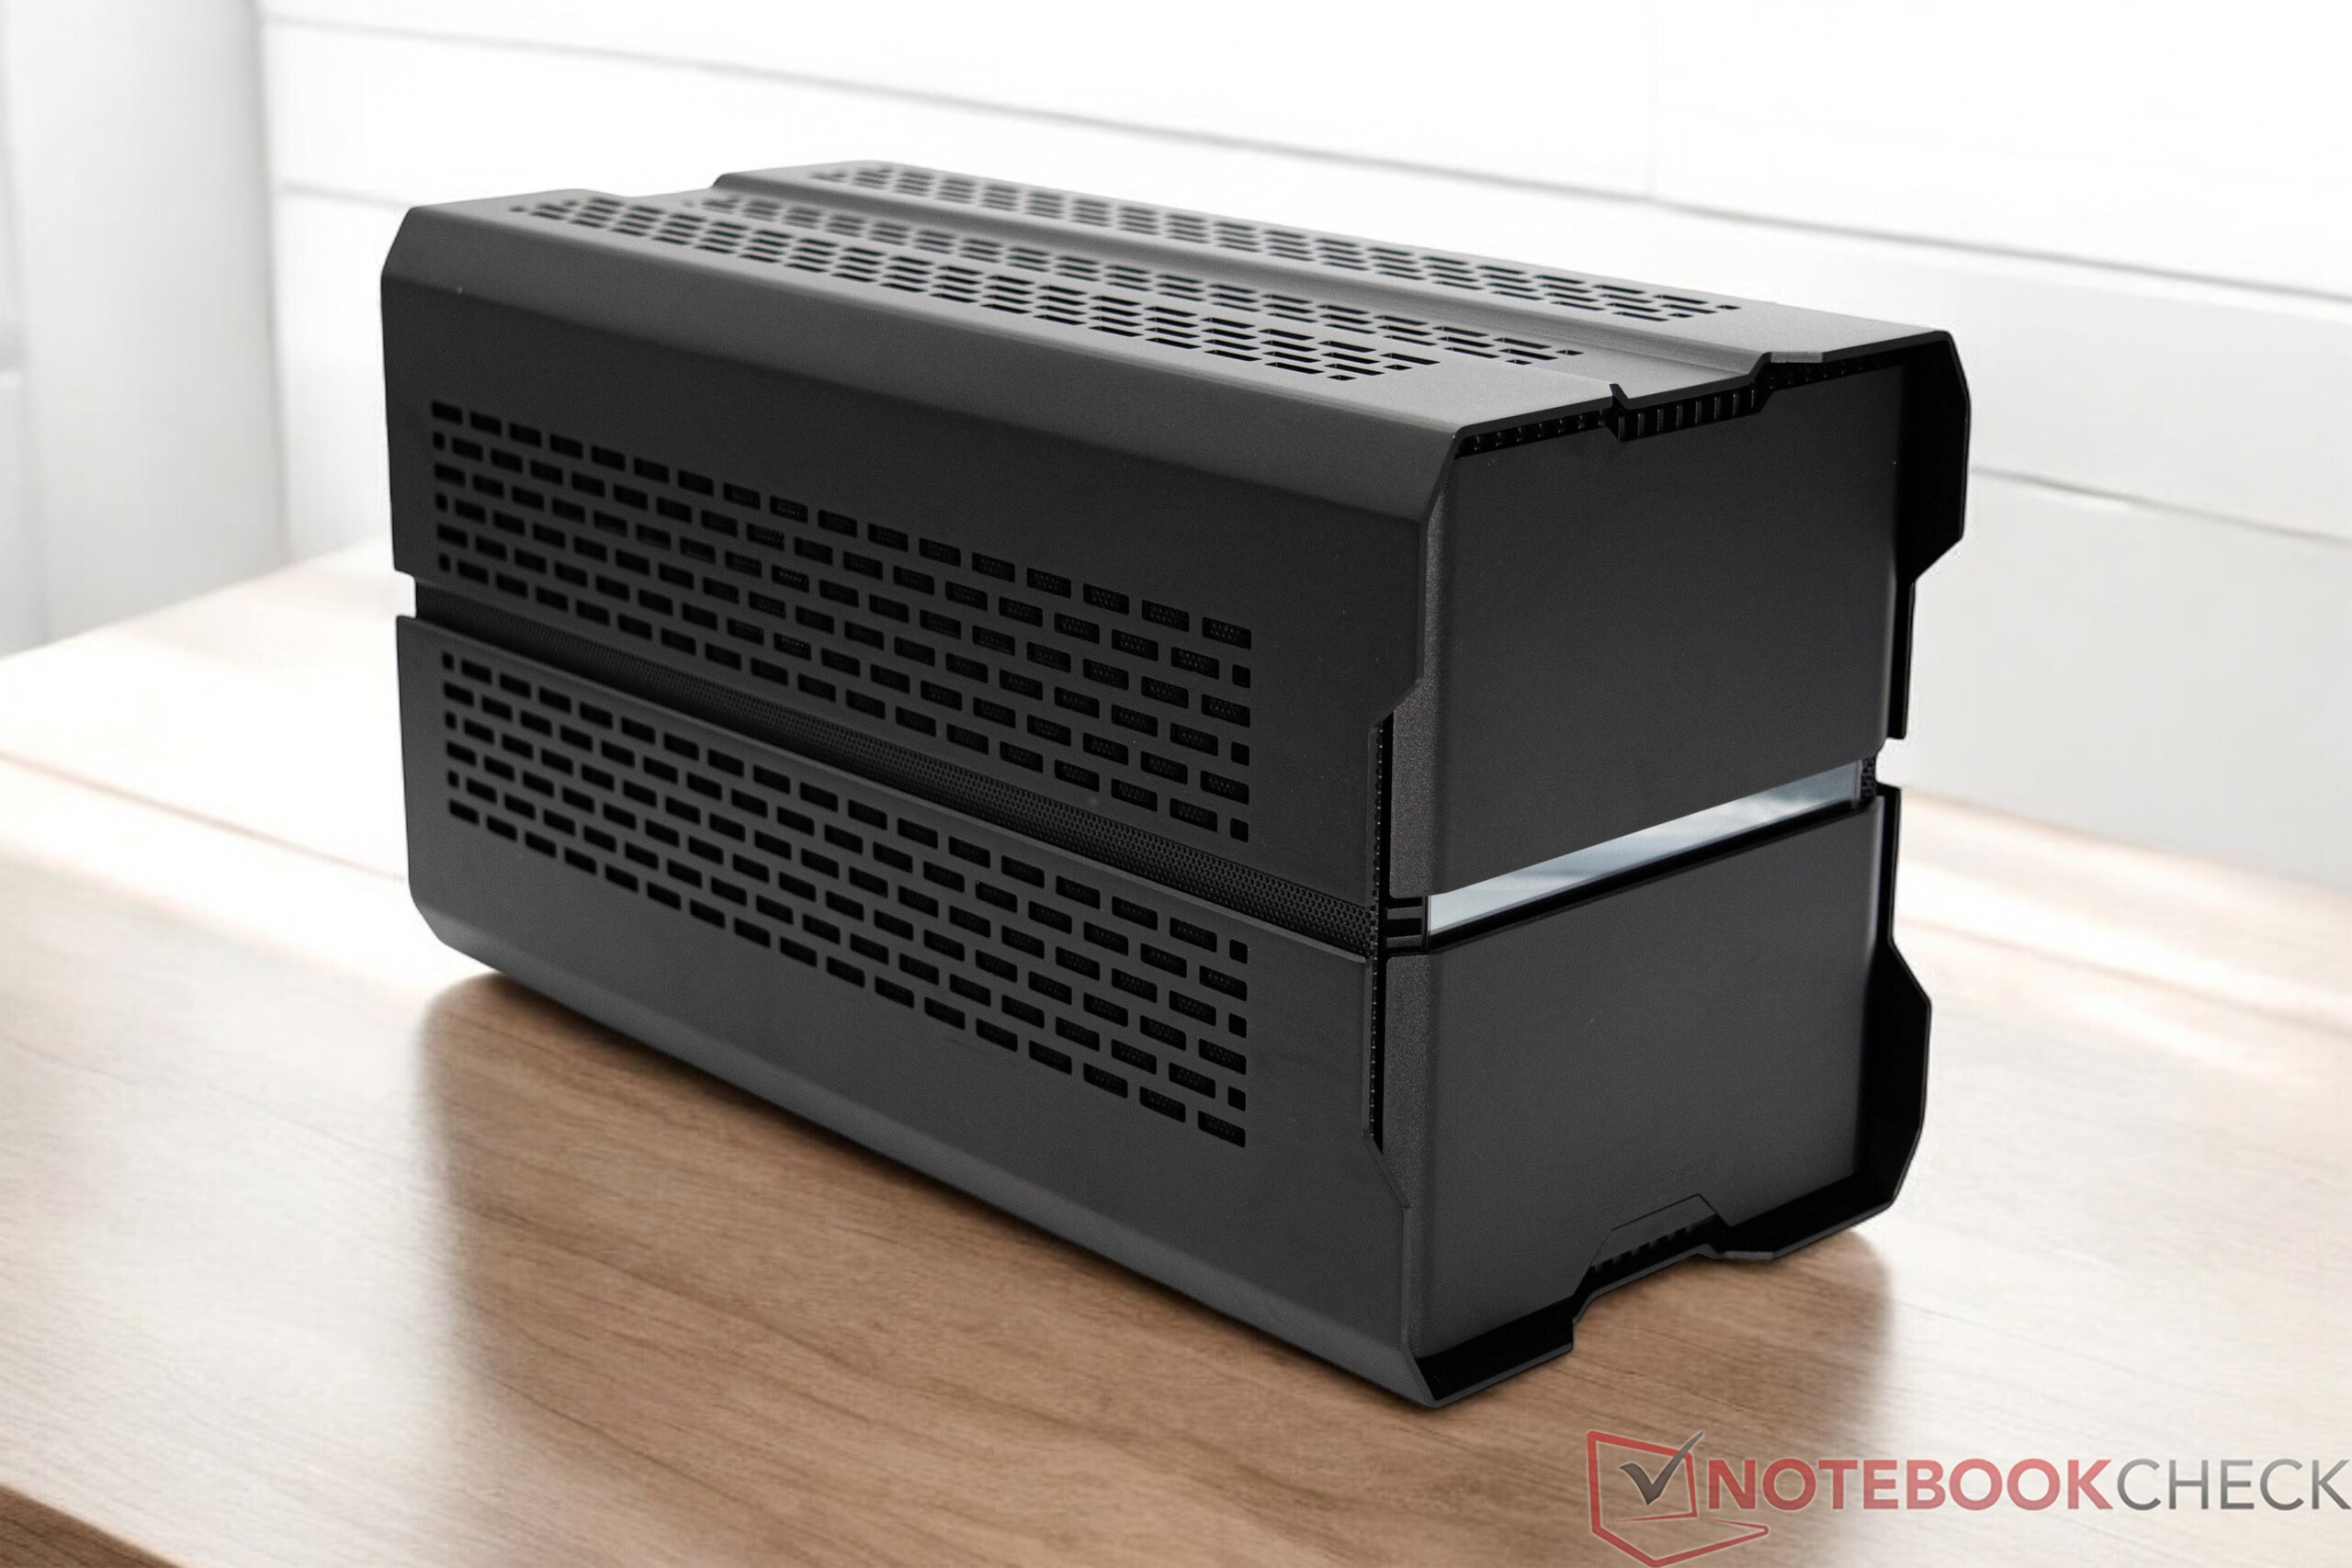
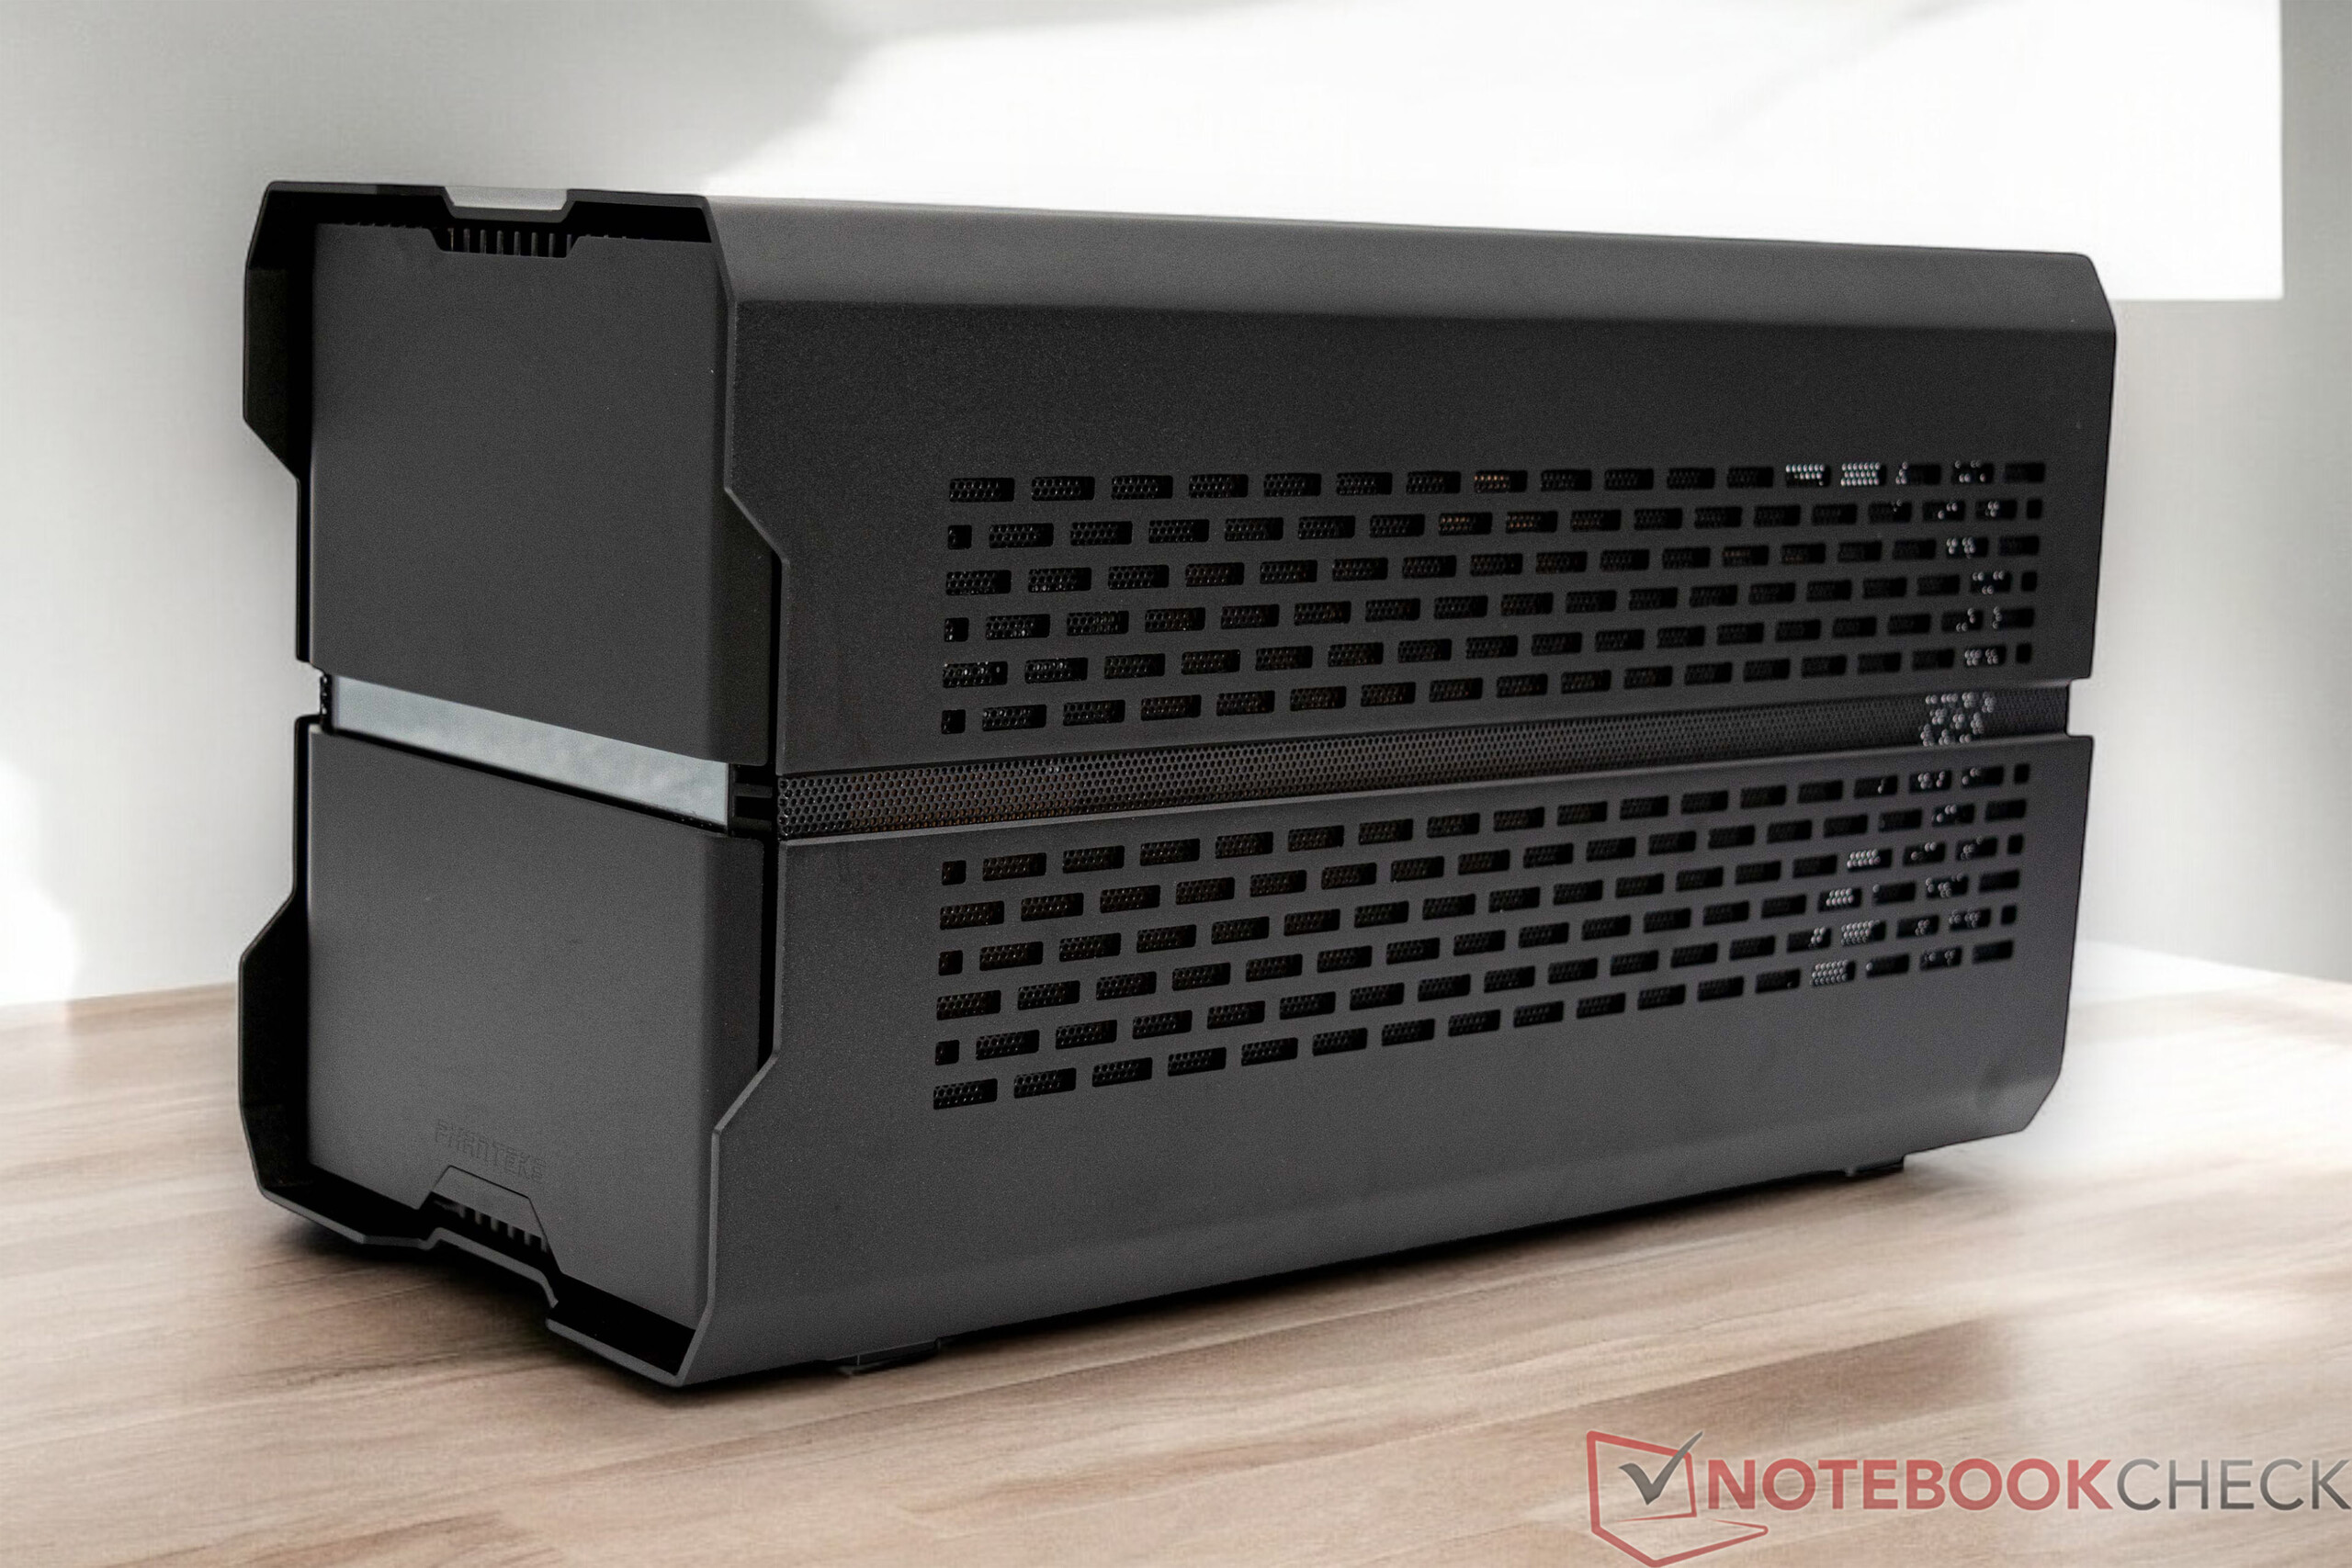
Per garantire la migliore comparabilità possibile con il Minisforum BD770i, che abbiamo già testato, ci siamo attenuti alle stesse identiche condizioni. Più precisamente, questo significa che abbiamo eseguito tutti i test della CPU nello stato installato. Abbiamo utilizzato il case Phanteks Enthoo Evolv Shift XT, che offre una buona base grazie alla sua compattezza.
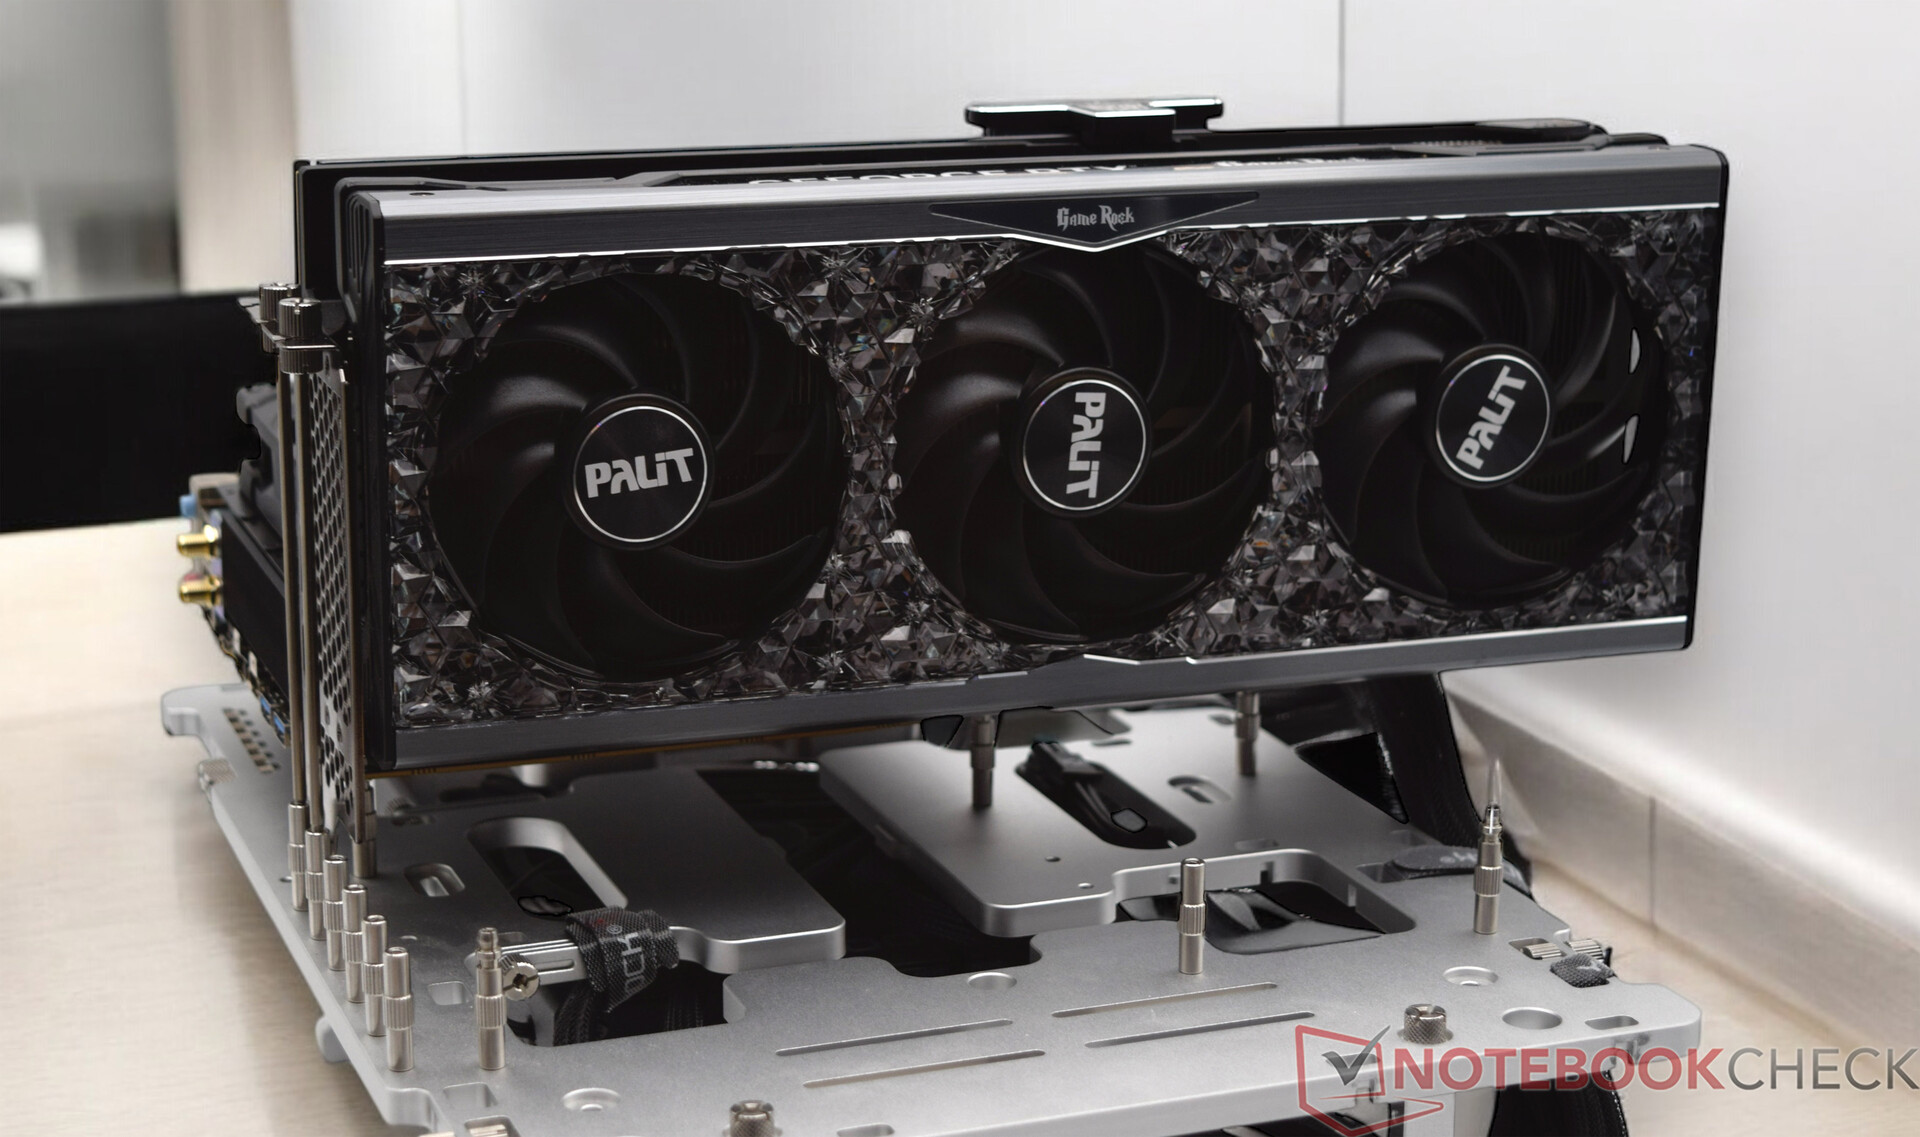
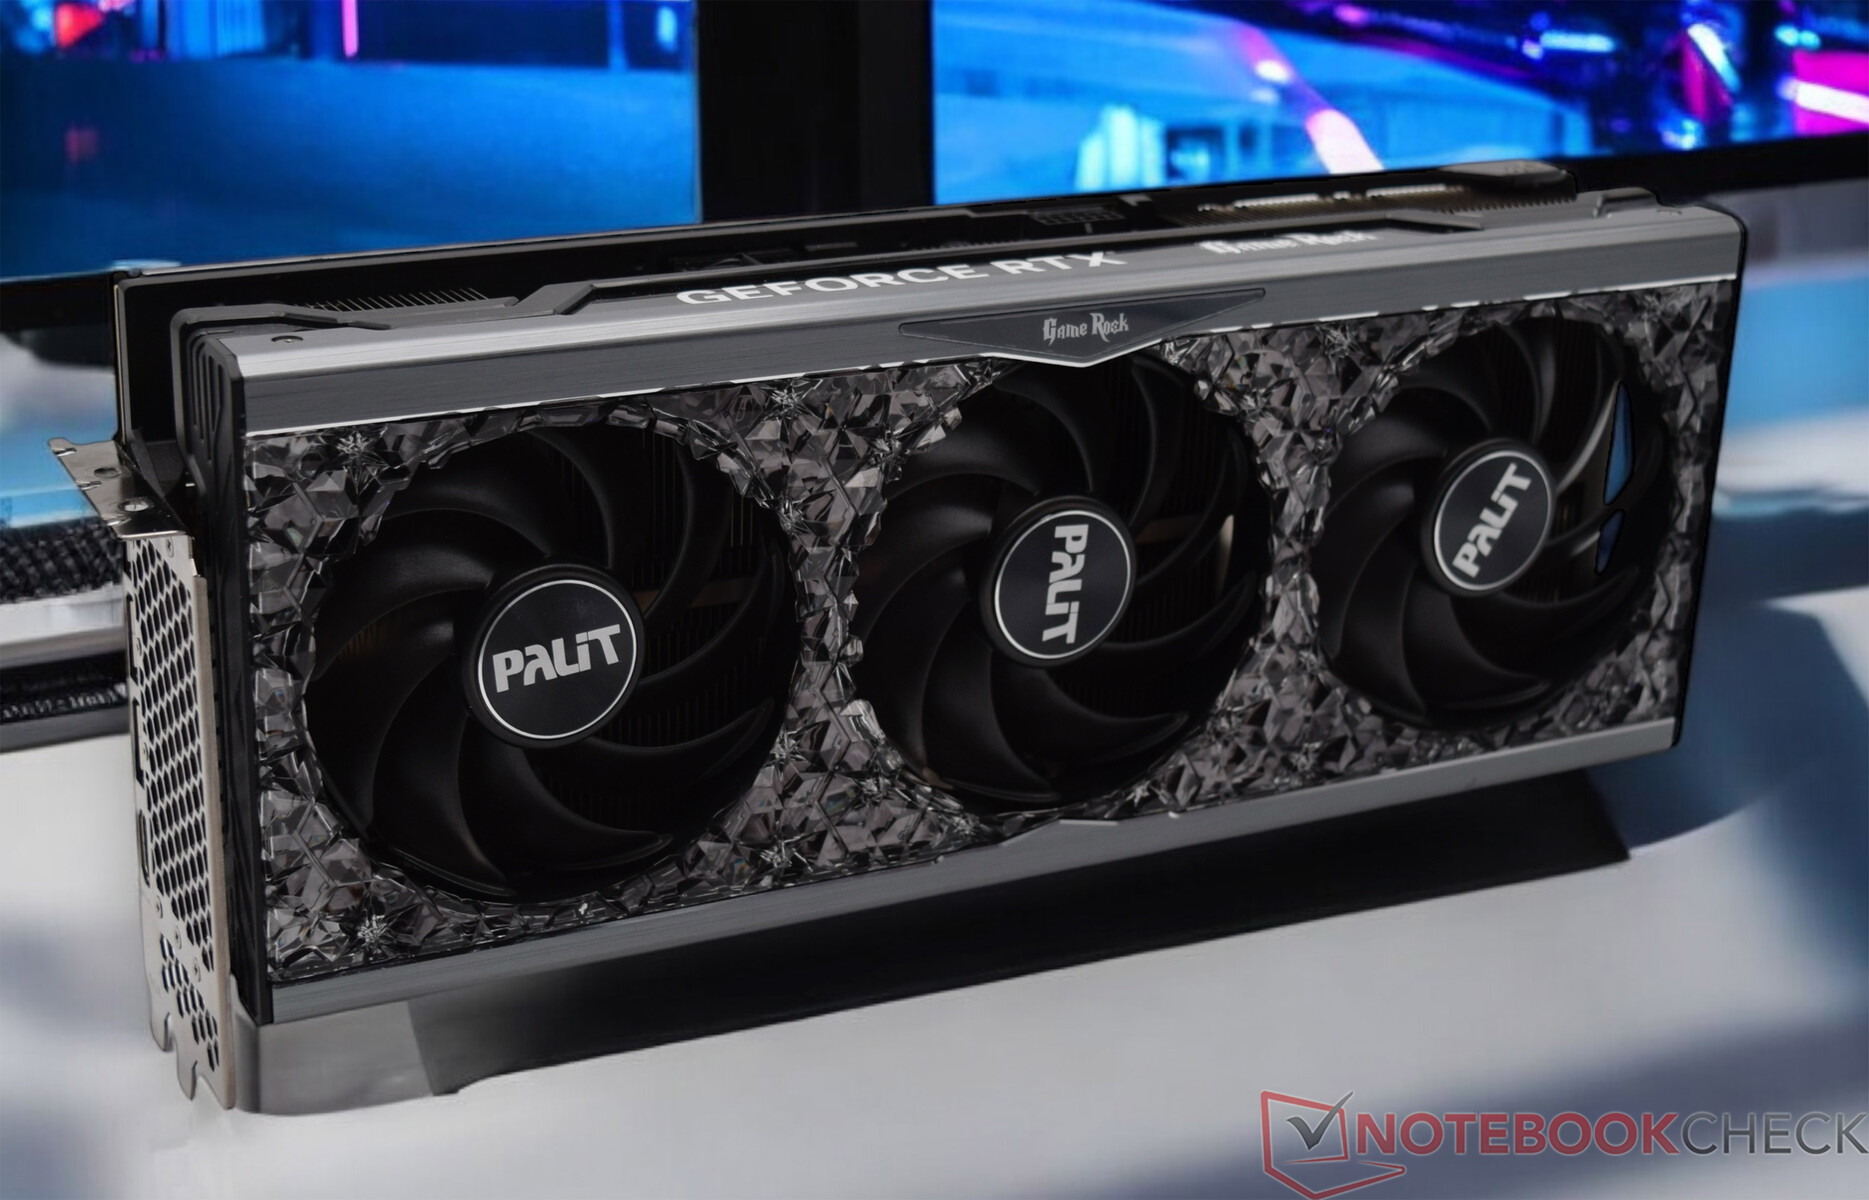
Per il nostro confronto delle prestazioni con una scheda grafica dedicata, abbiamo testato il Minisforum BD790i insieme alla scheda grafica Palit GeForce RTX 4090 GameRock OC in una configurazione aperta. A causa delle dimensioni della scheda grafica, non è stato possibile installarla nel Phanteks Enthoo Evolv Shift XT. Le schede grafiche che non superano i 32,4 centimetri di lunghezza sono adatte a Phanteks Enthoo Evolv Shift XT.
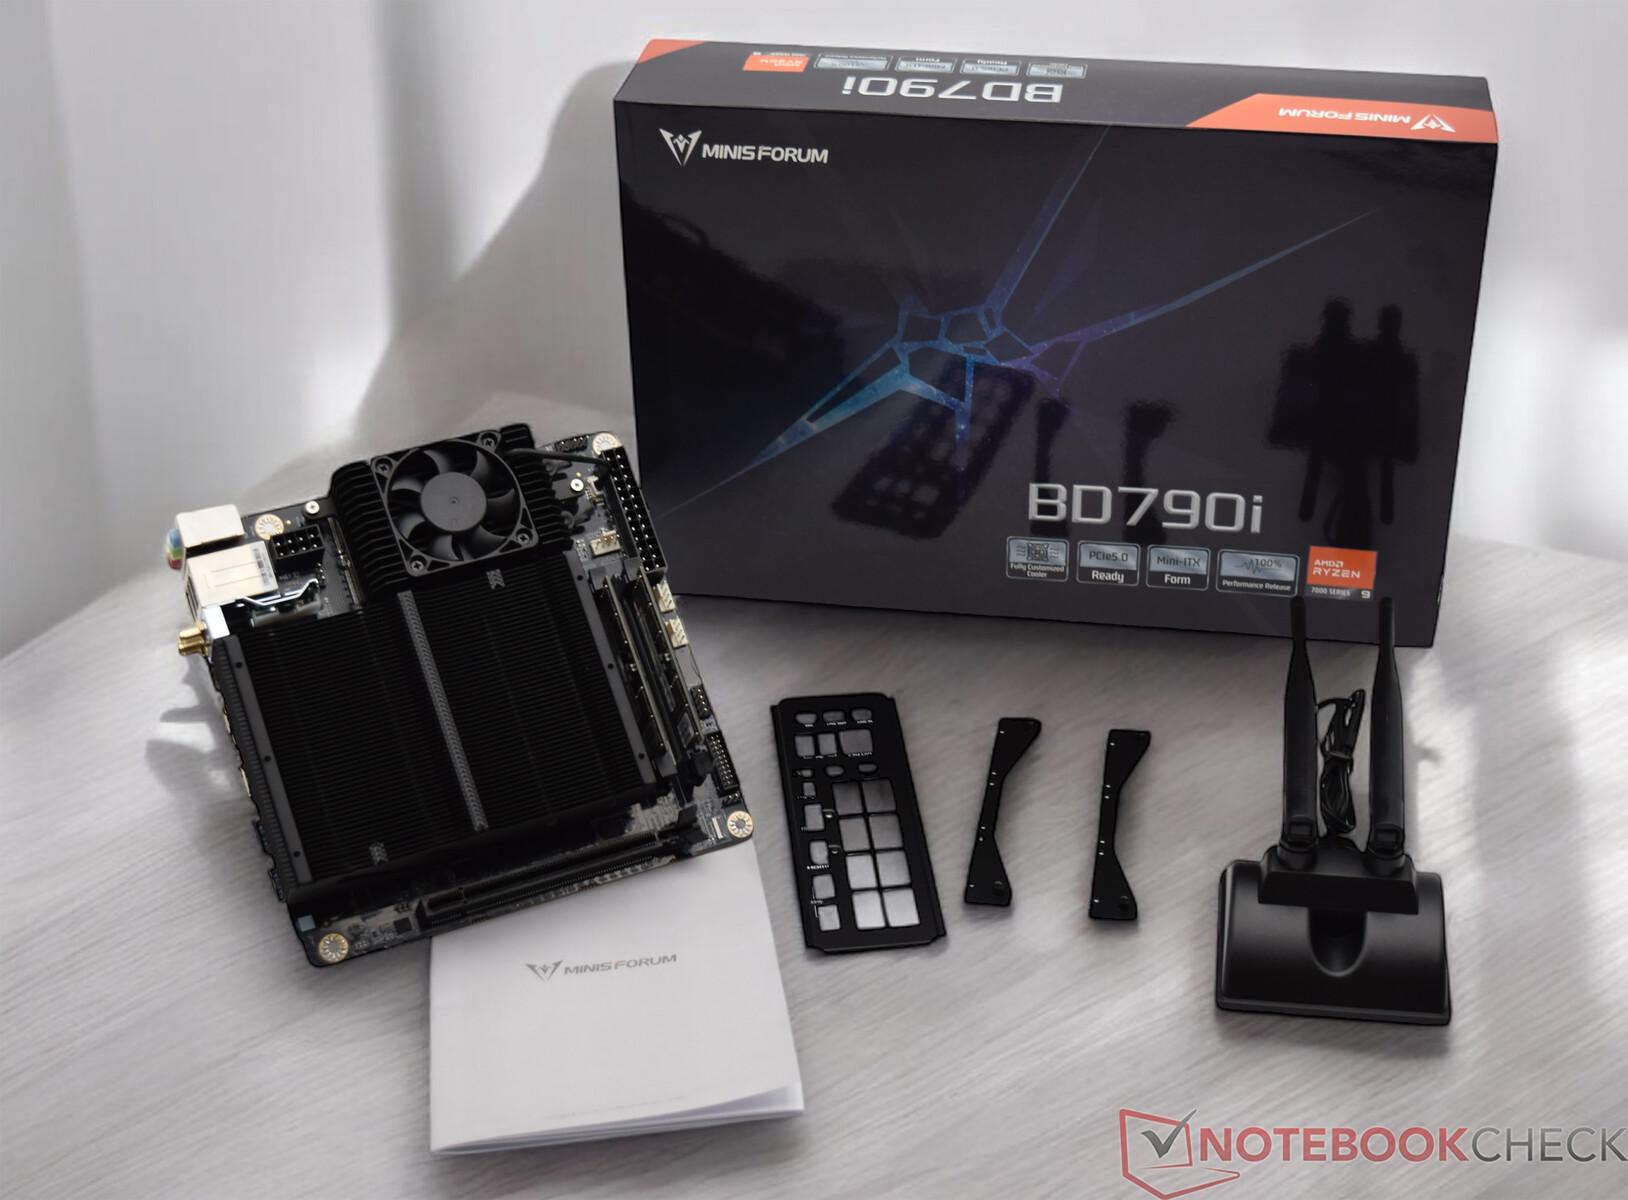
Ambito di consegna e connettività
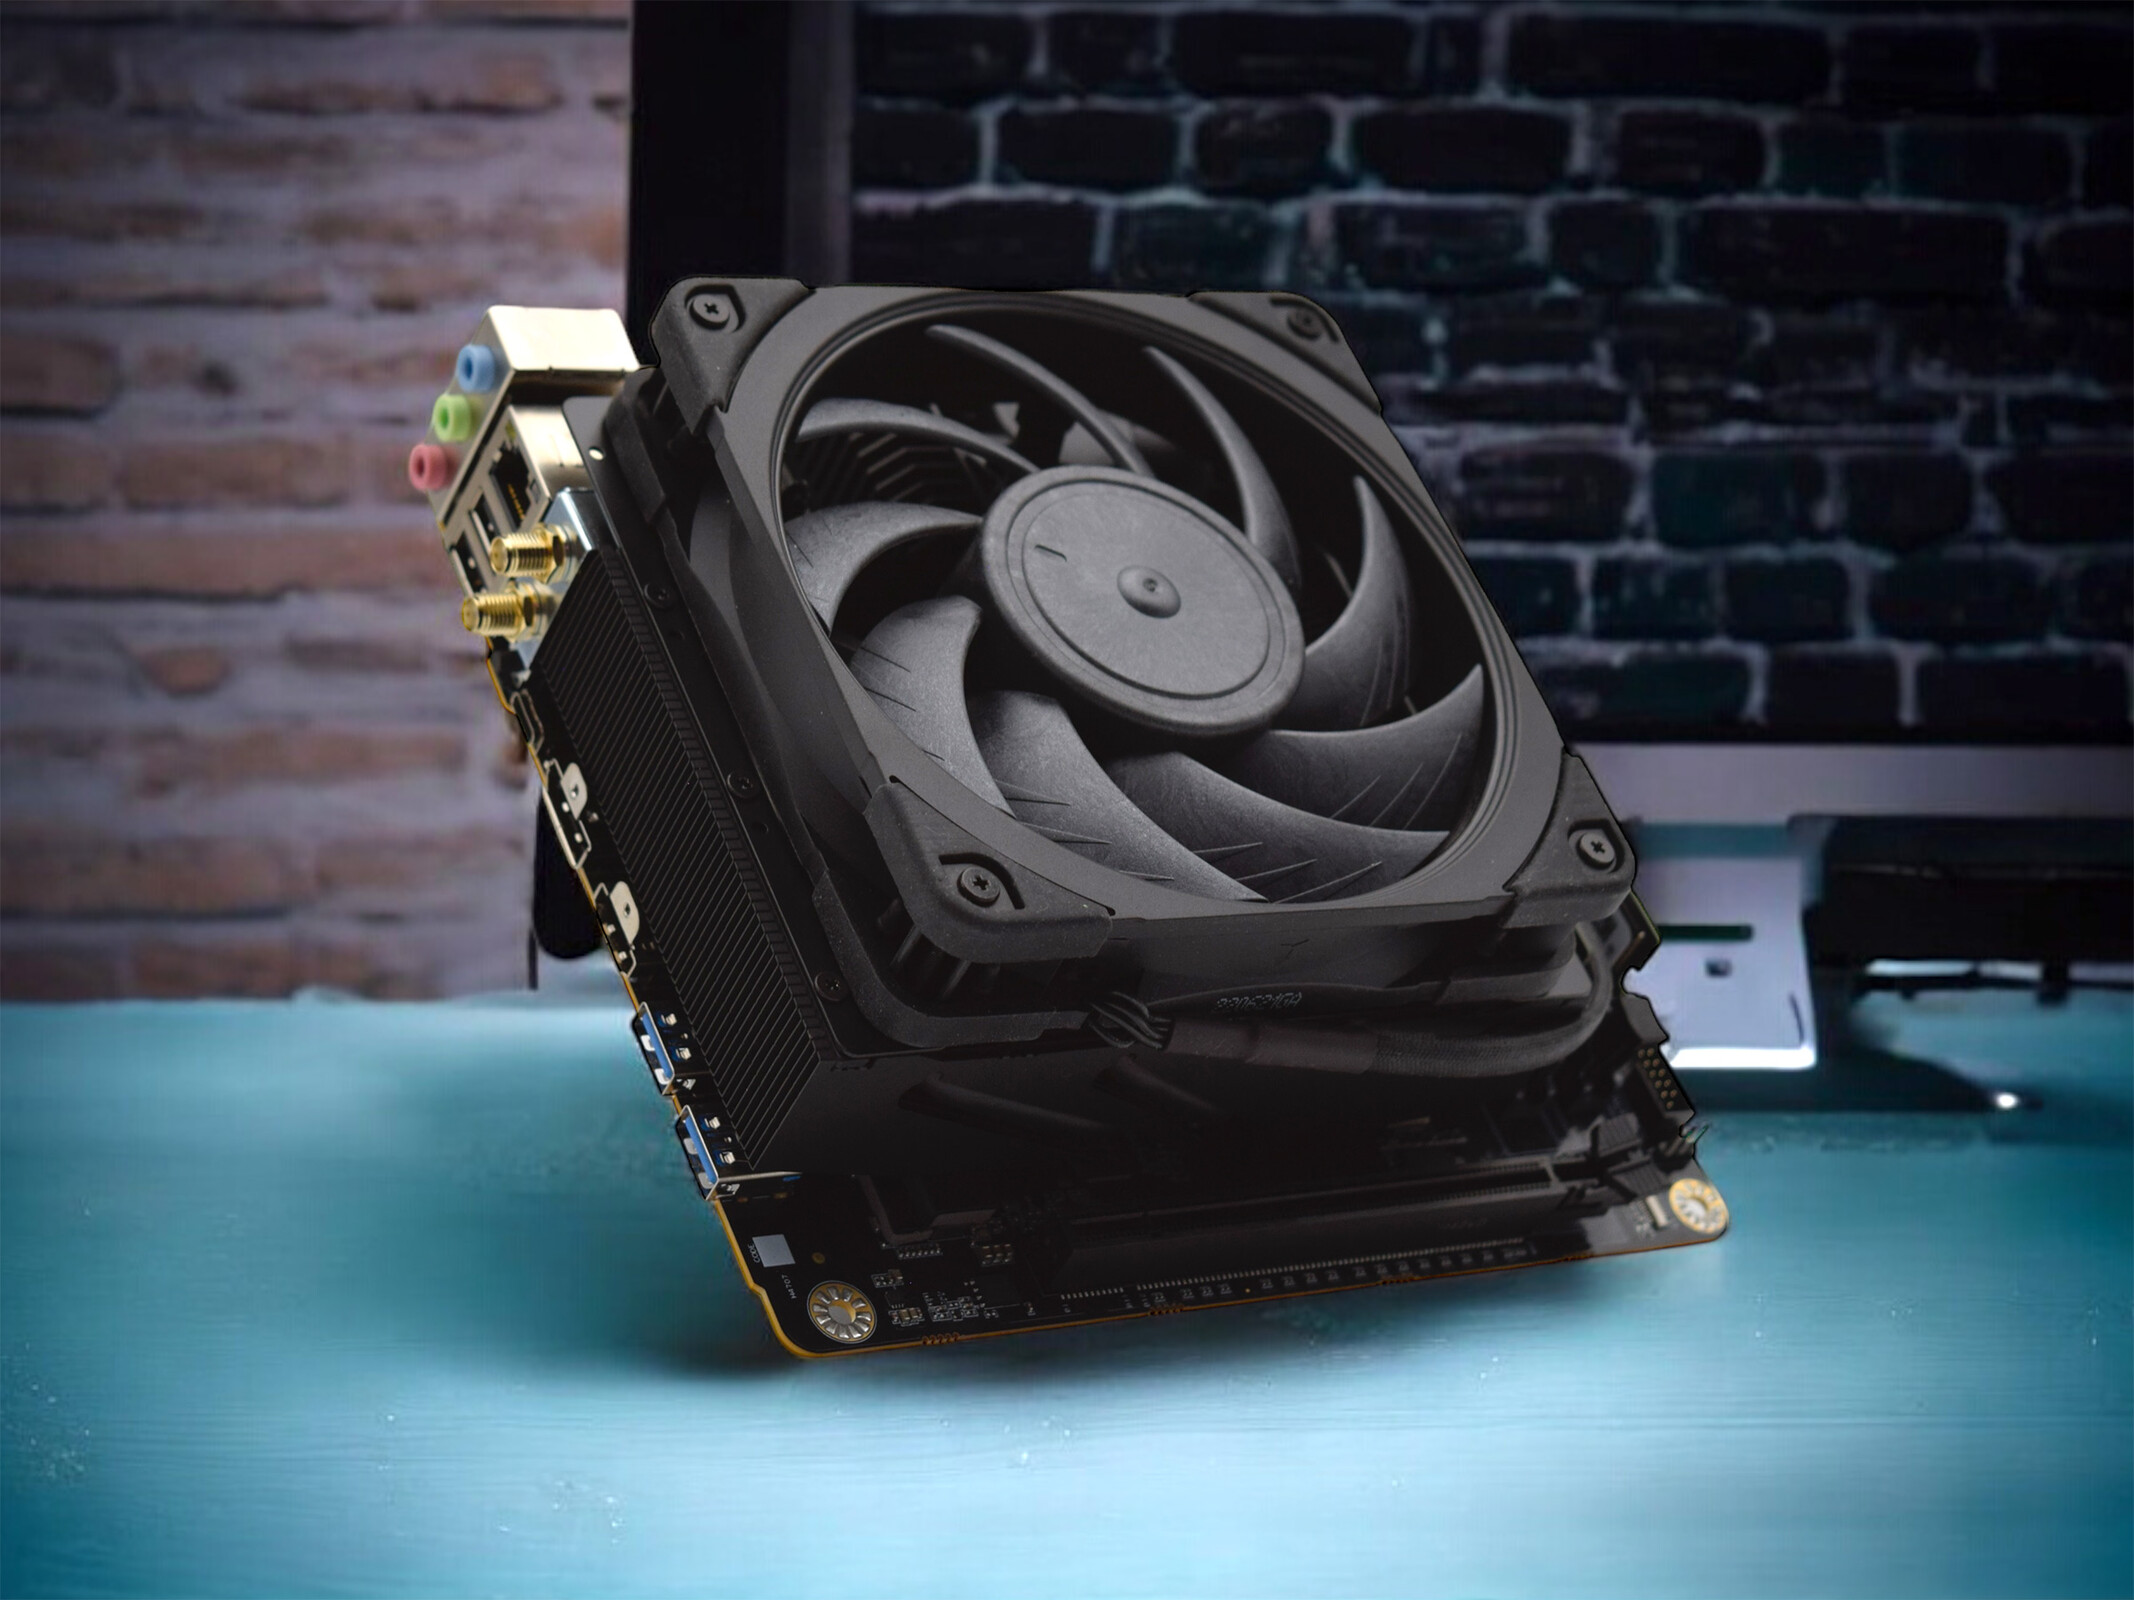
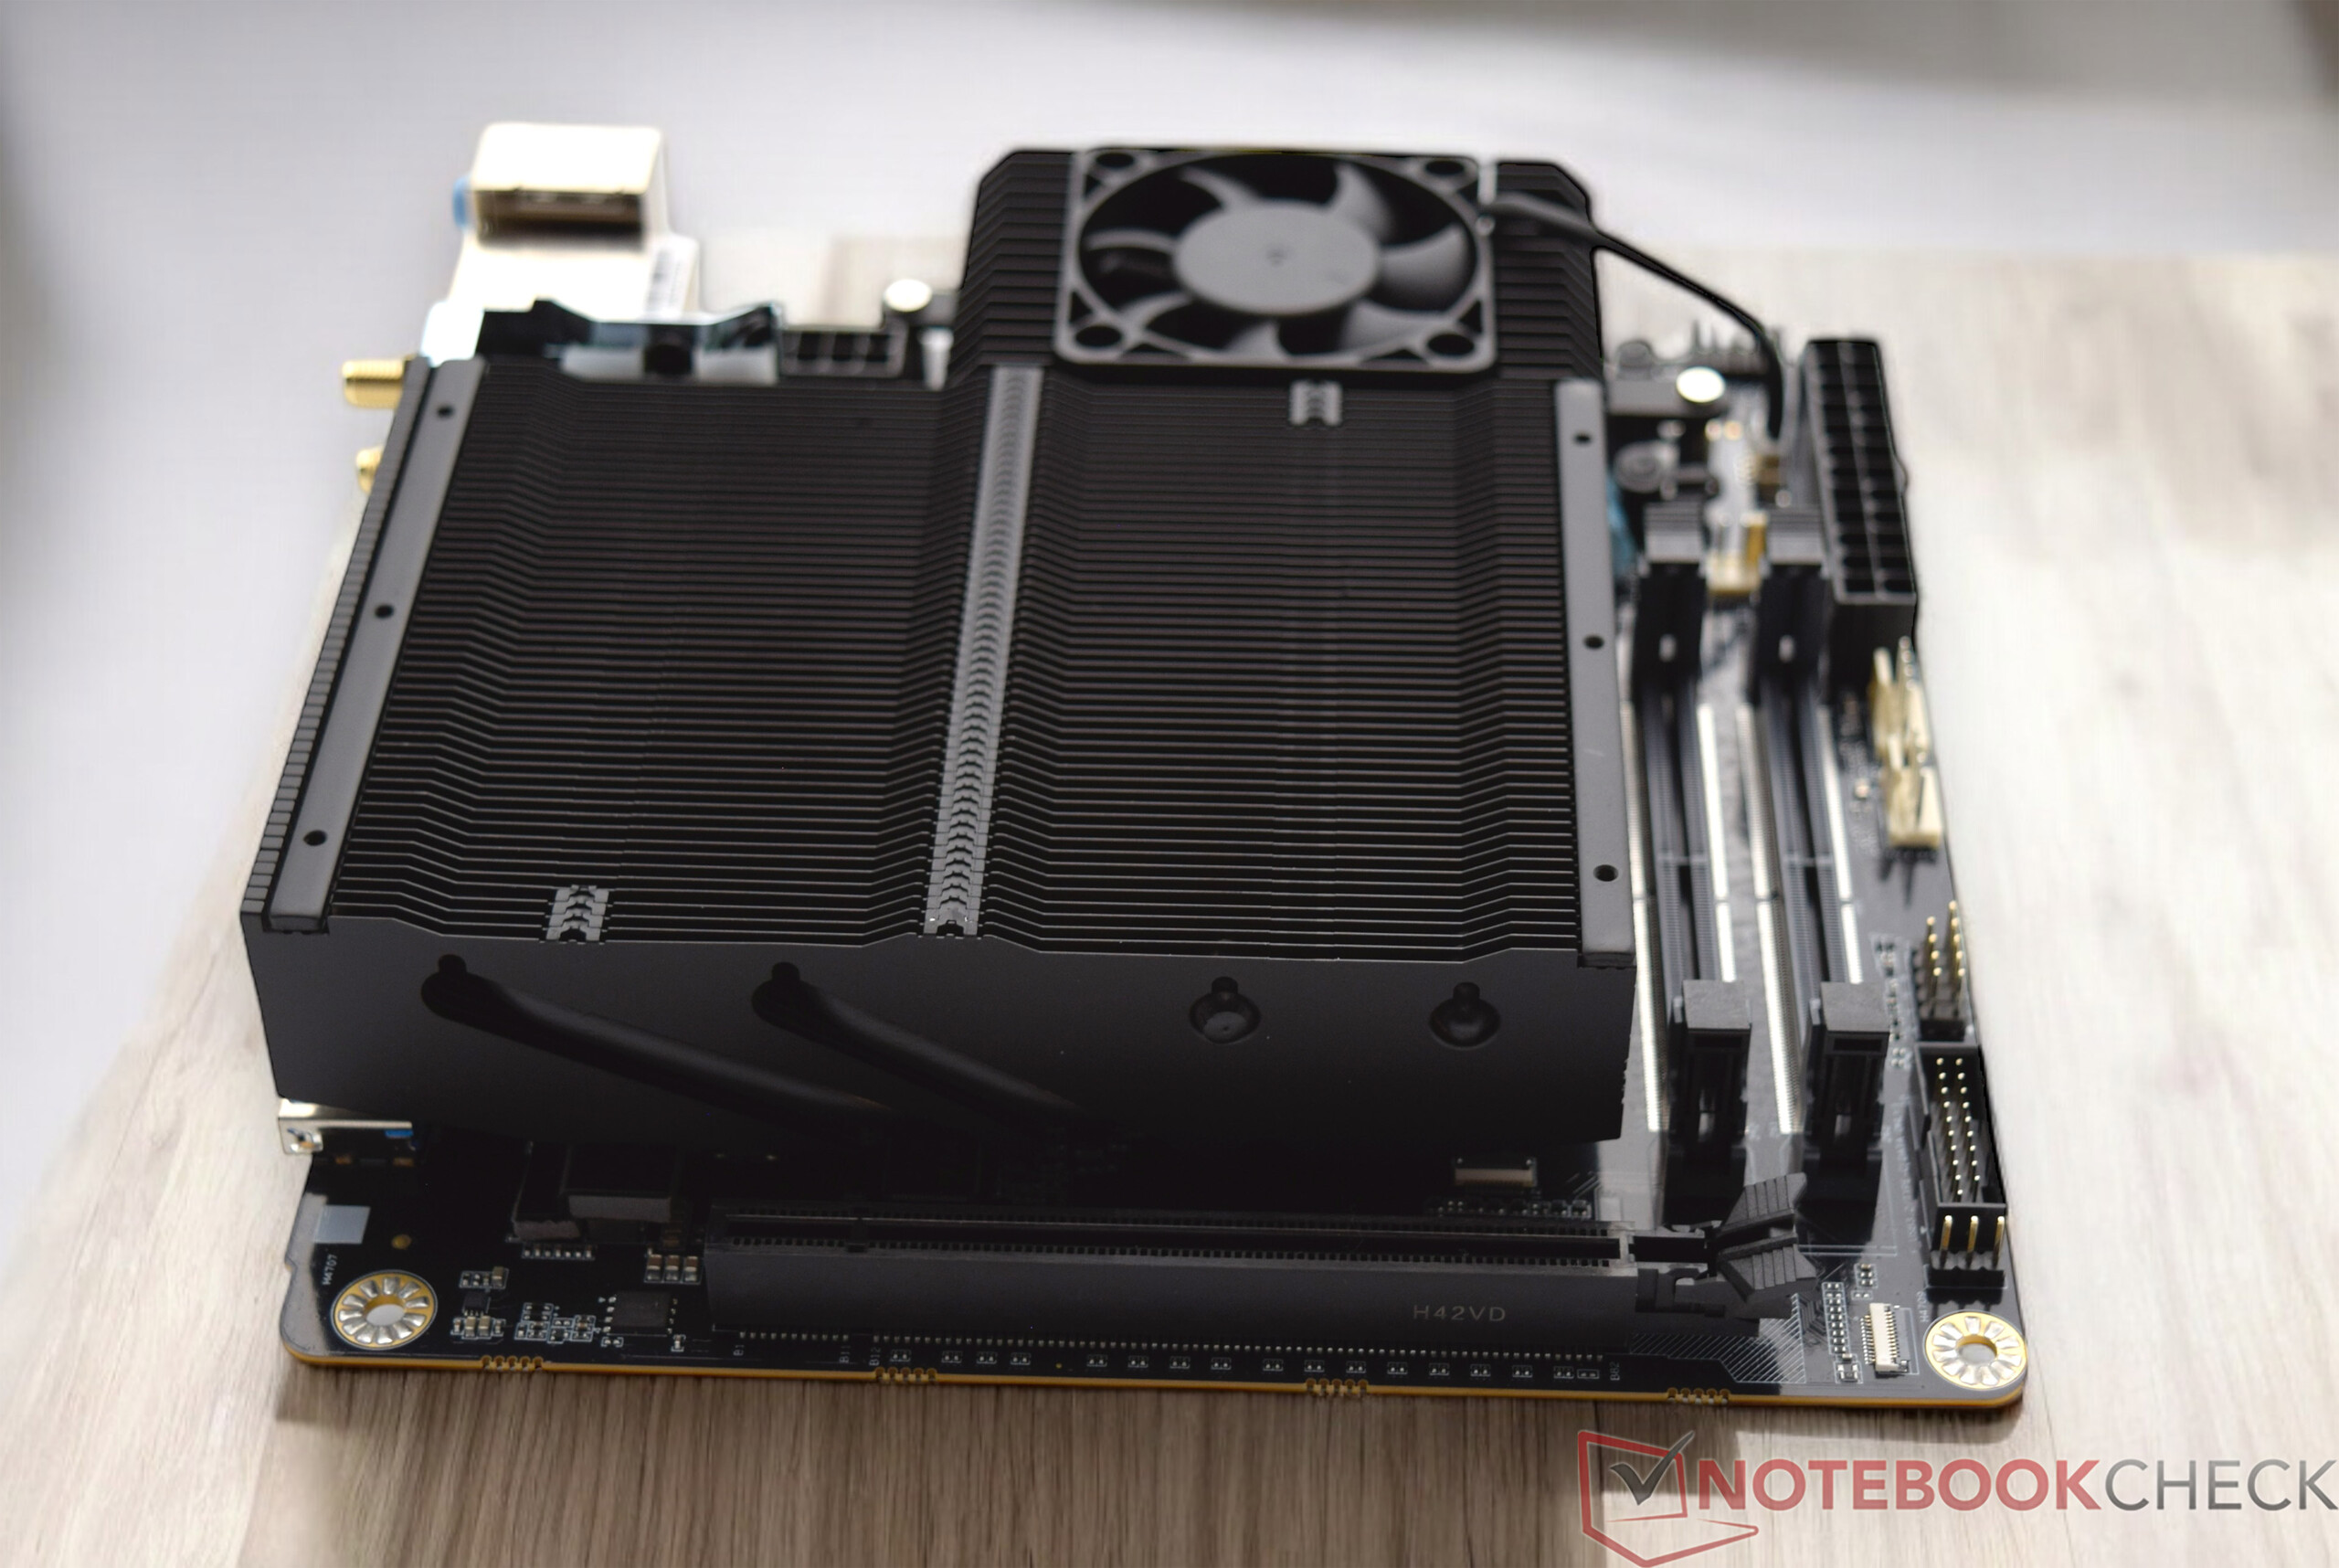
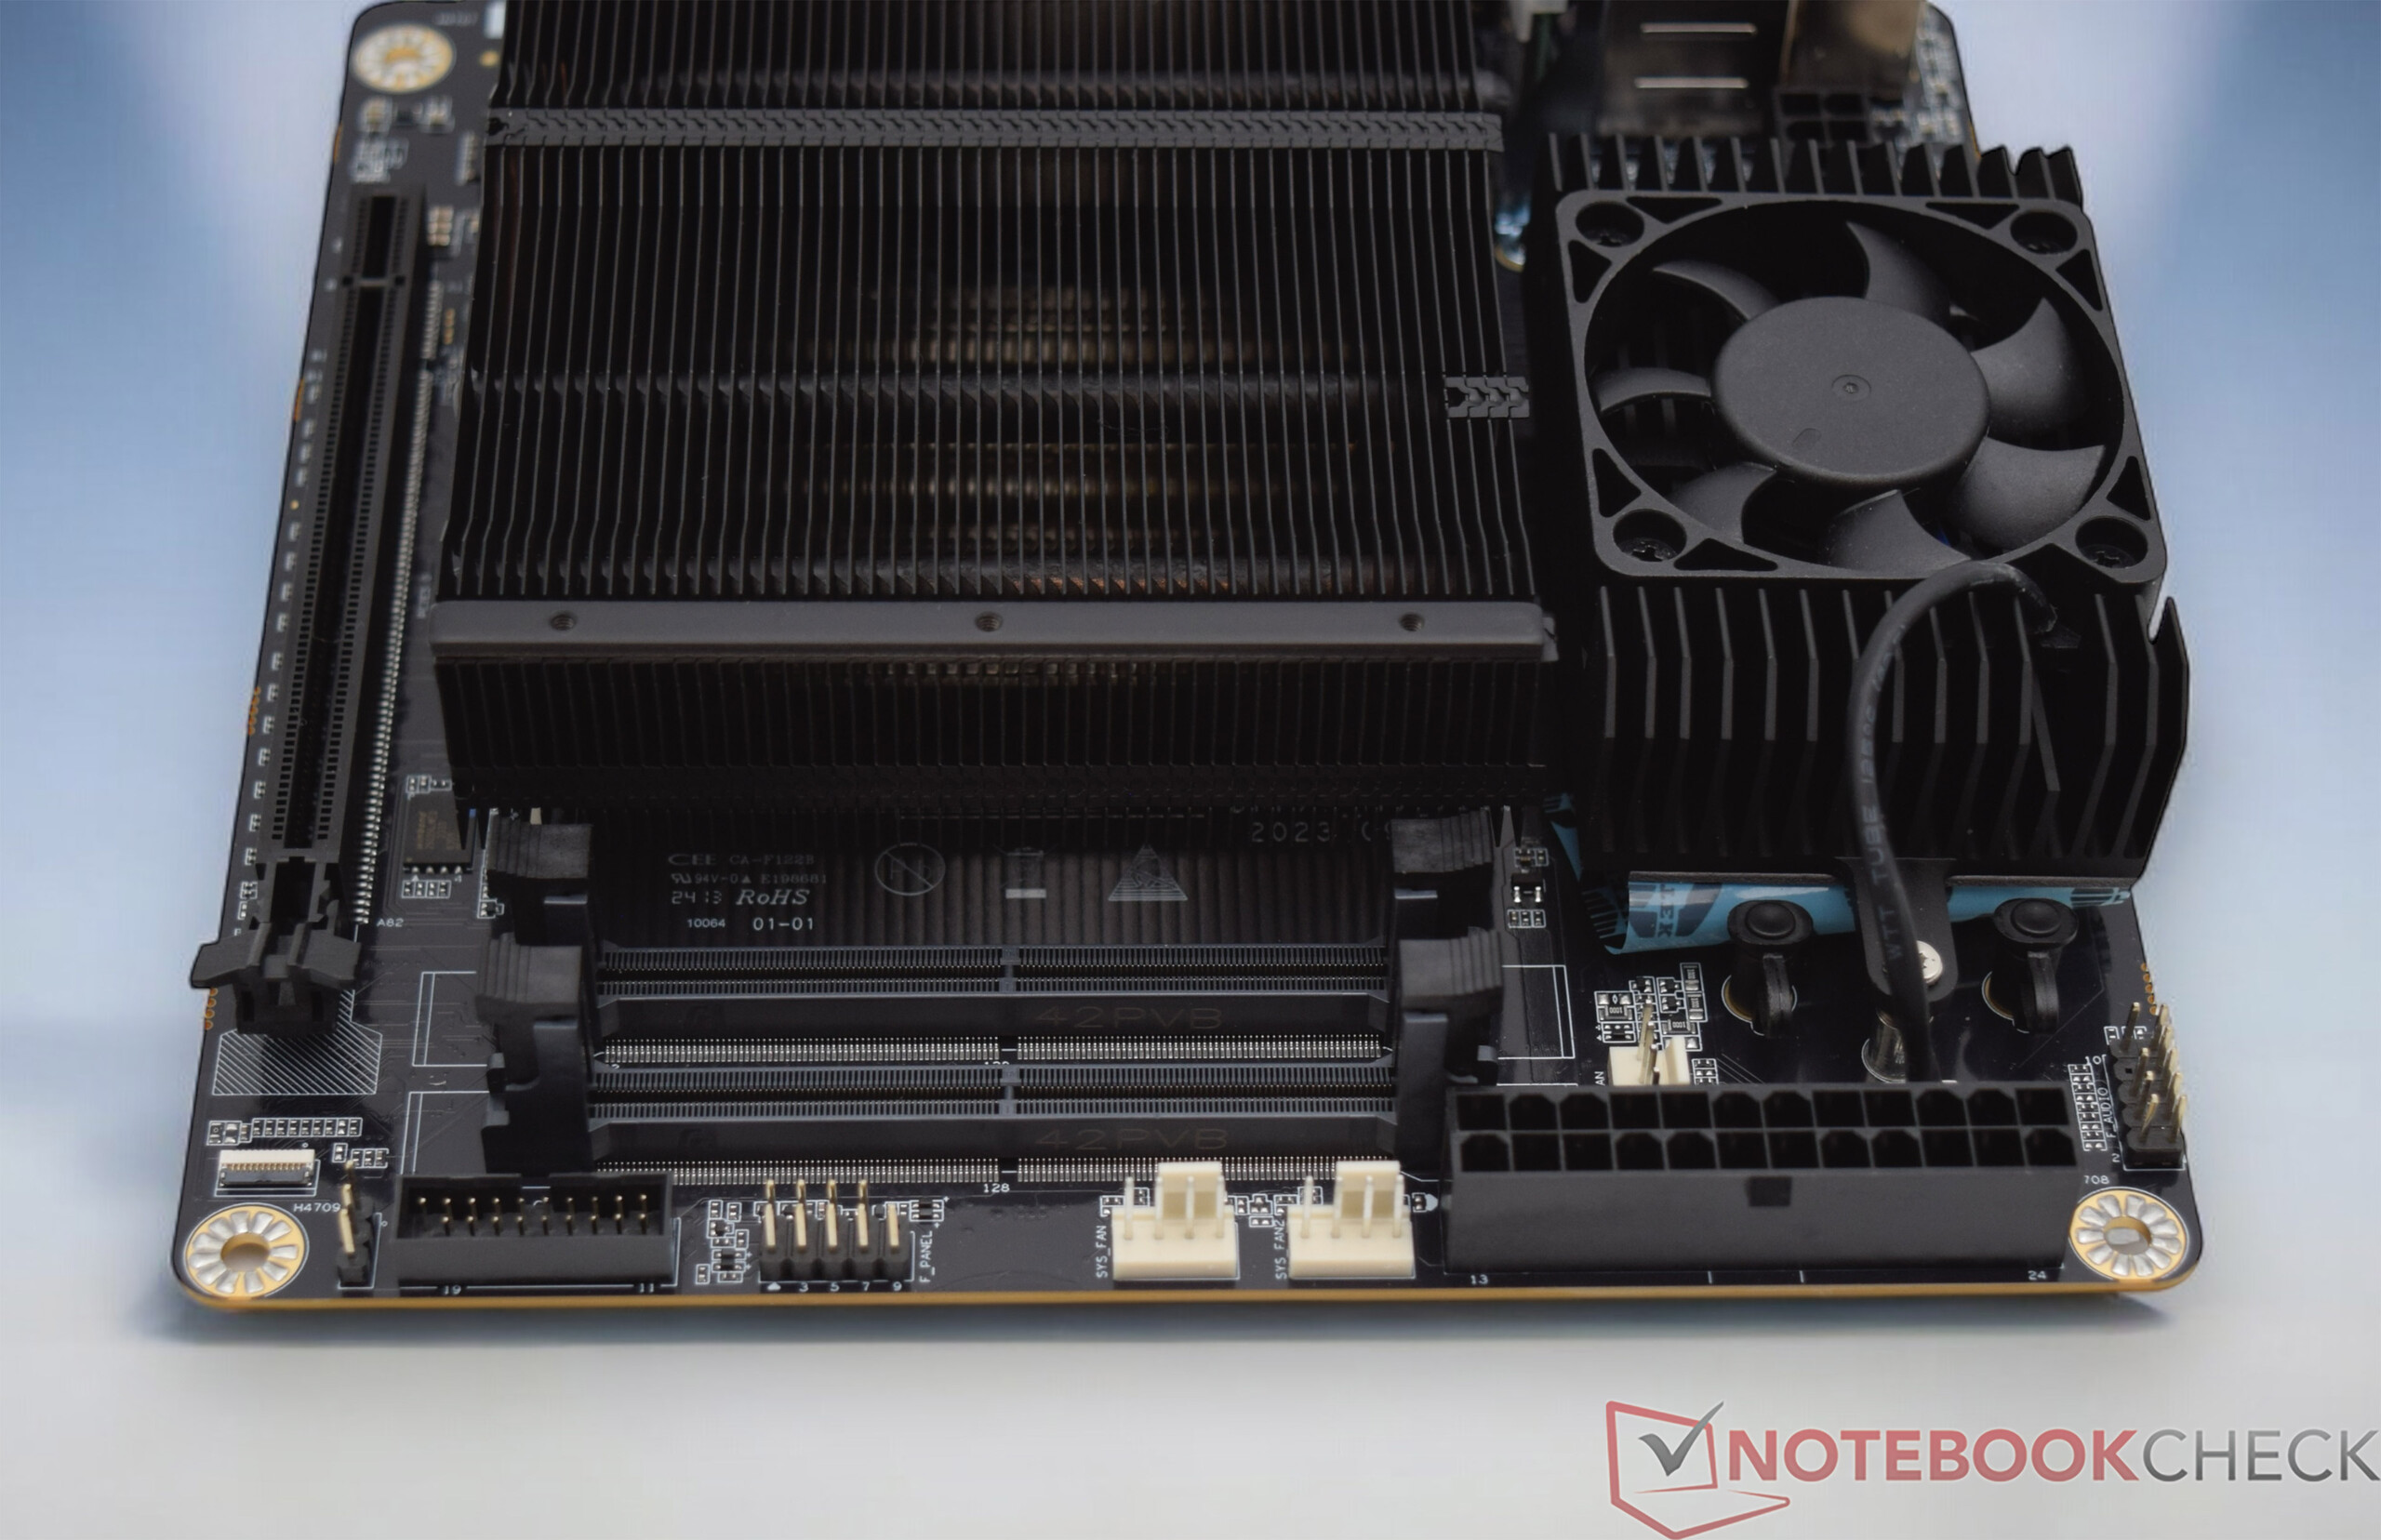
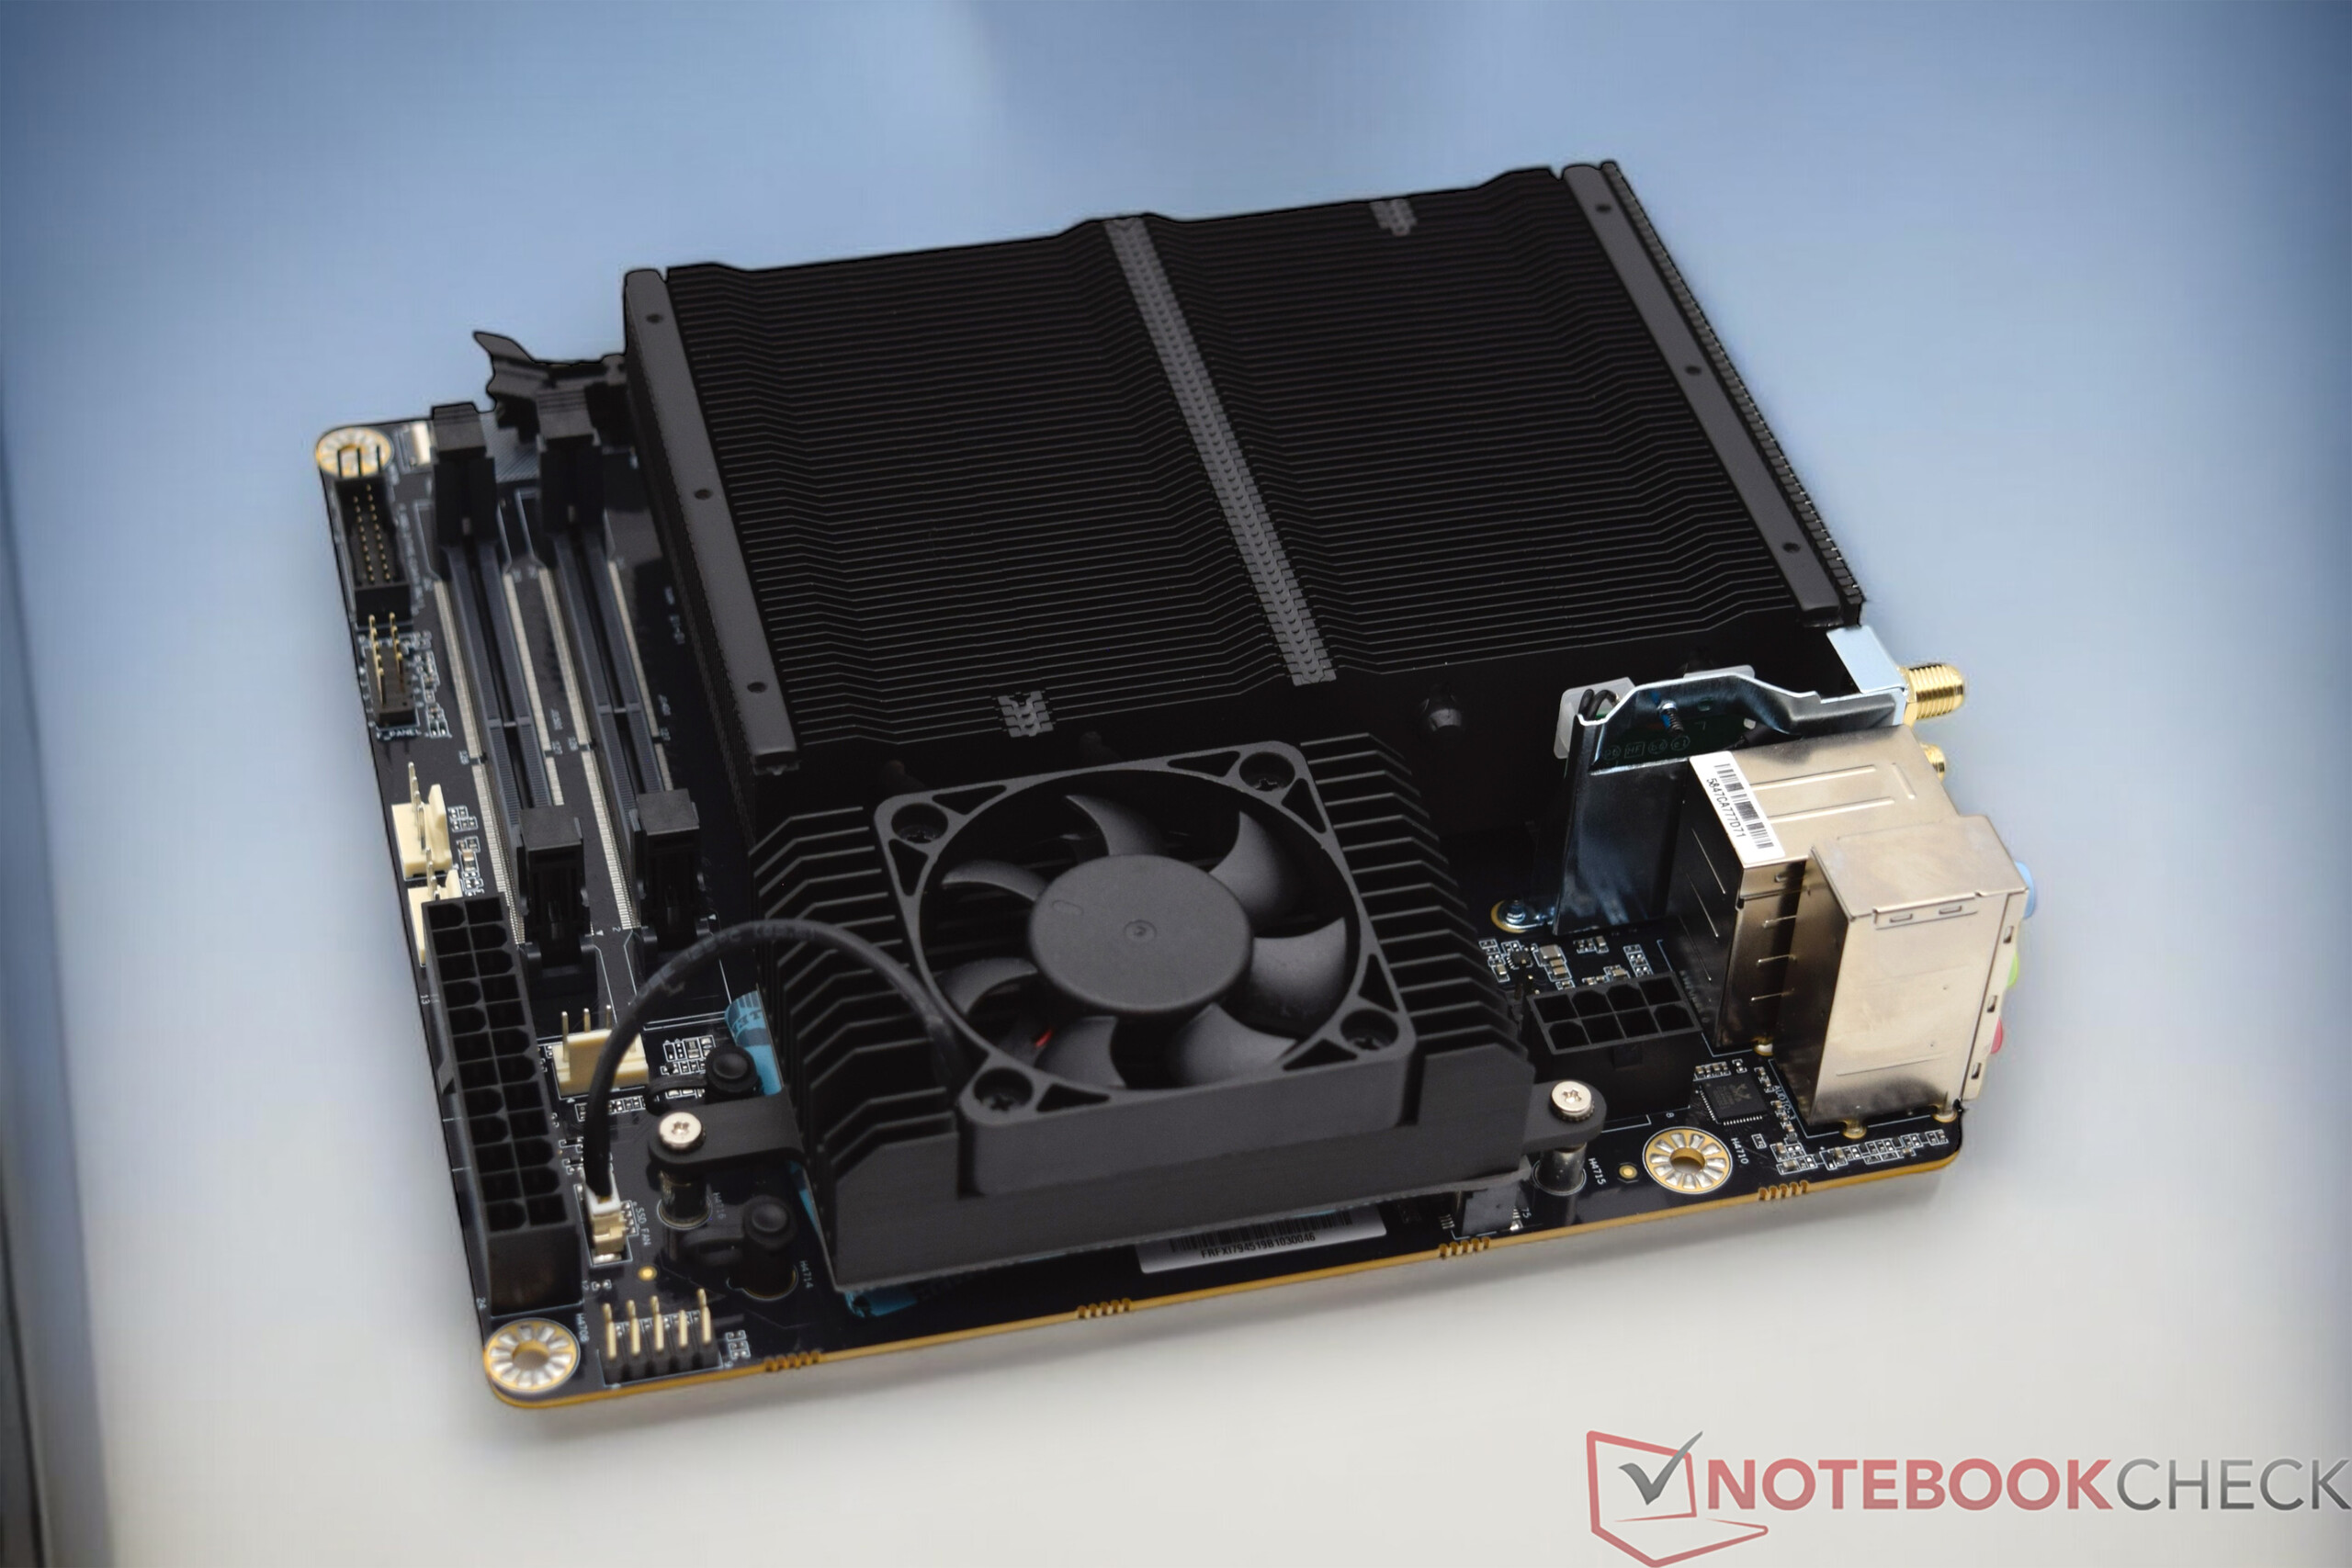
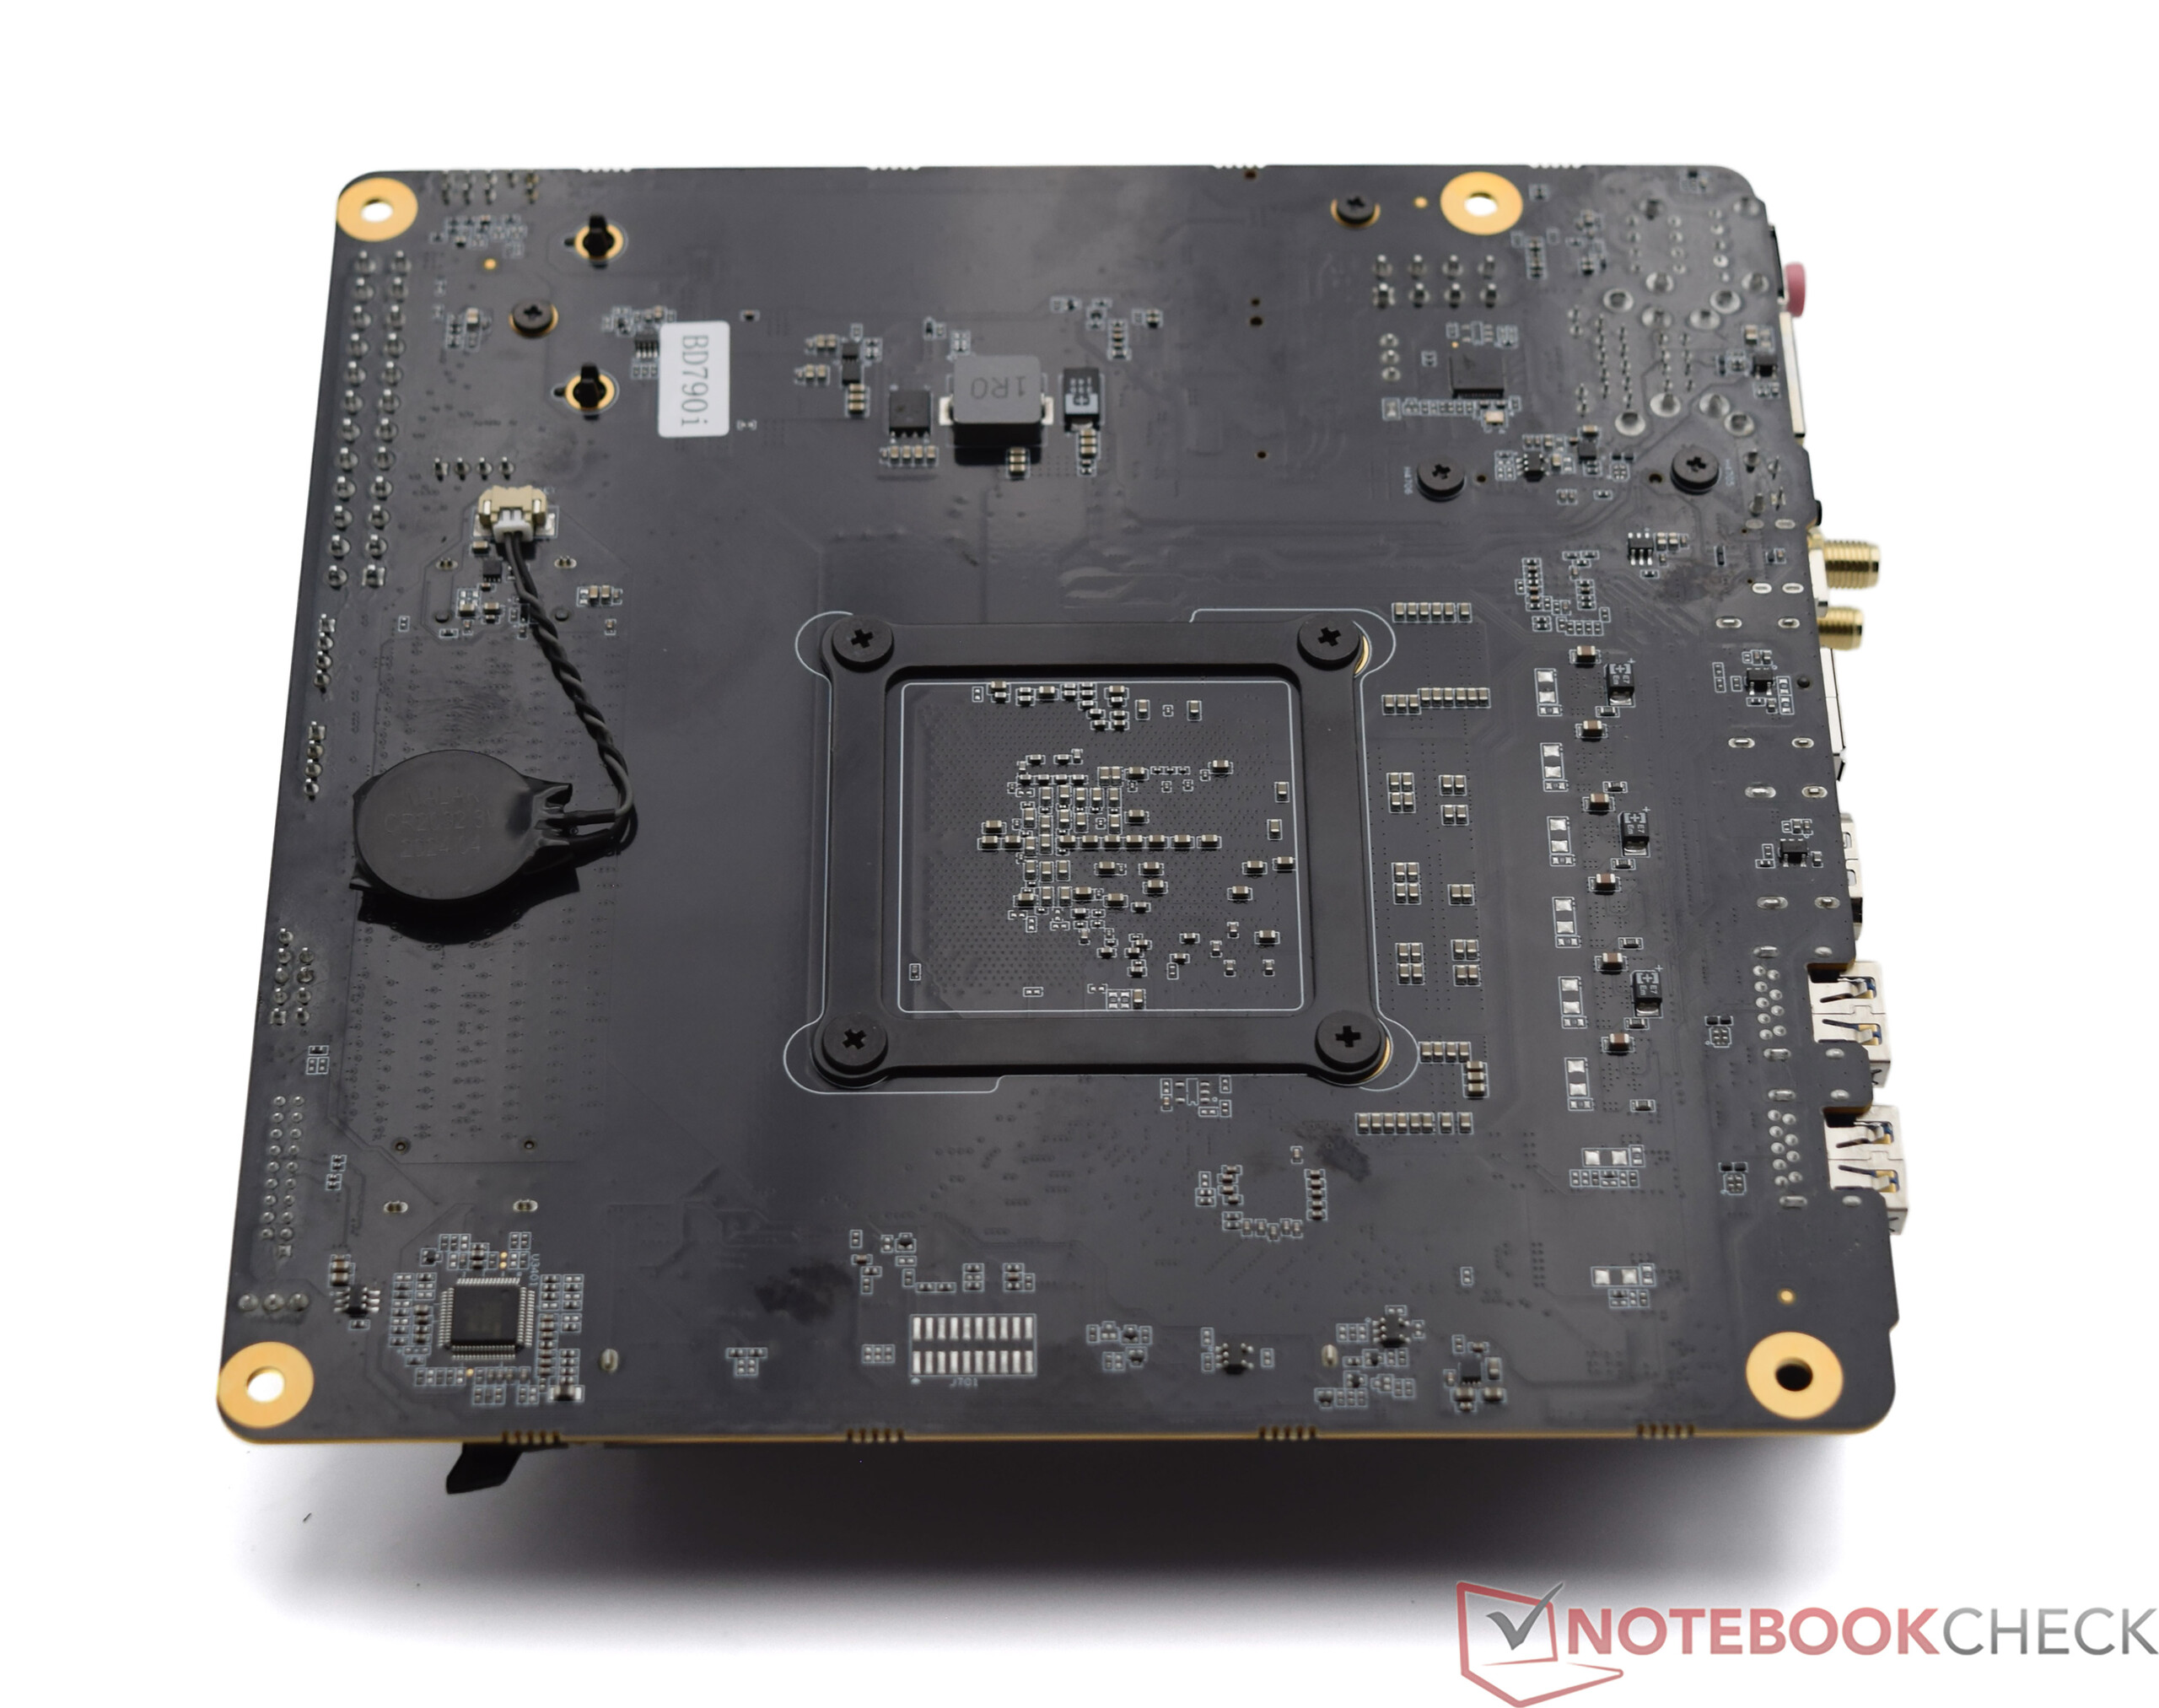
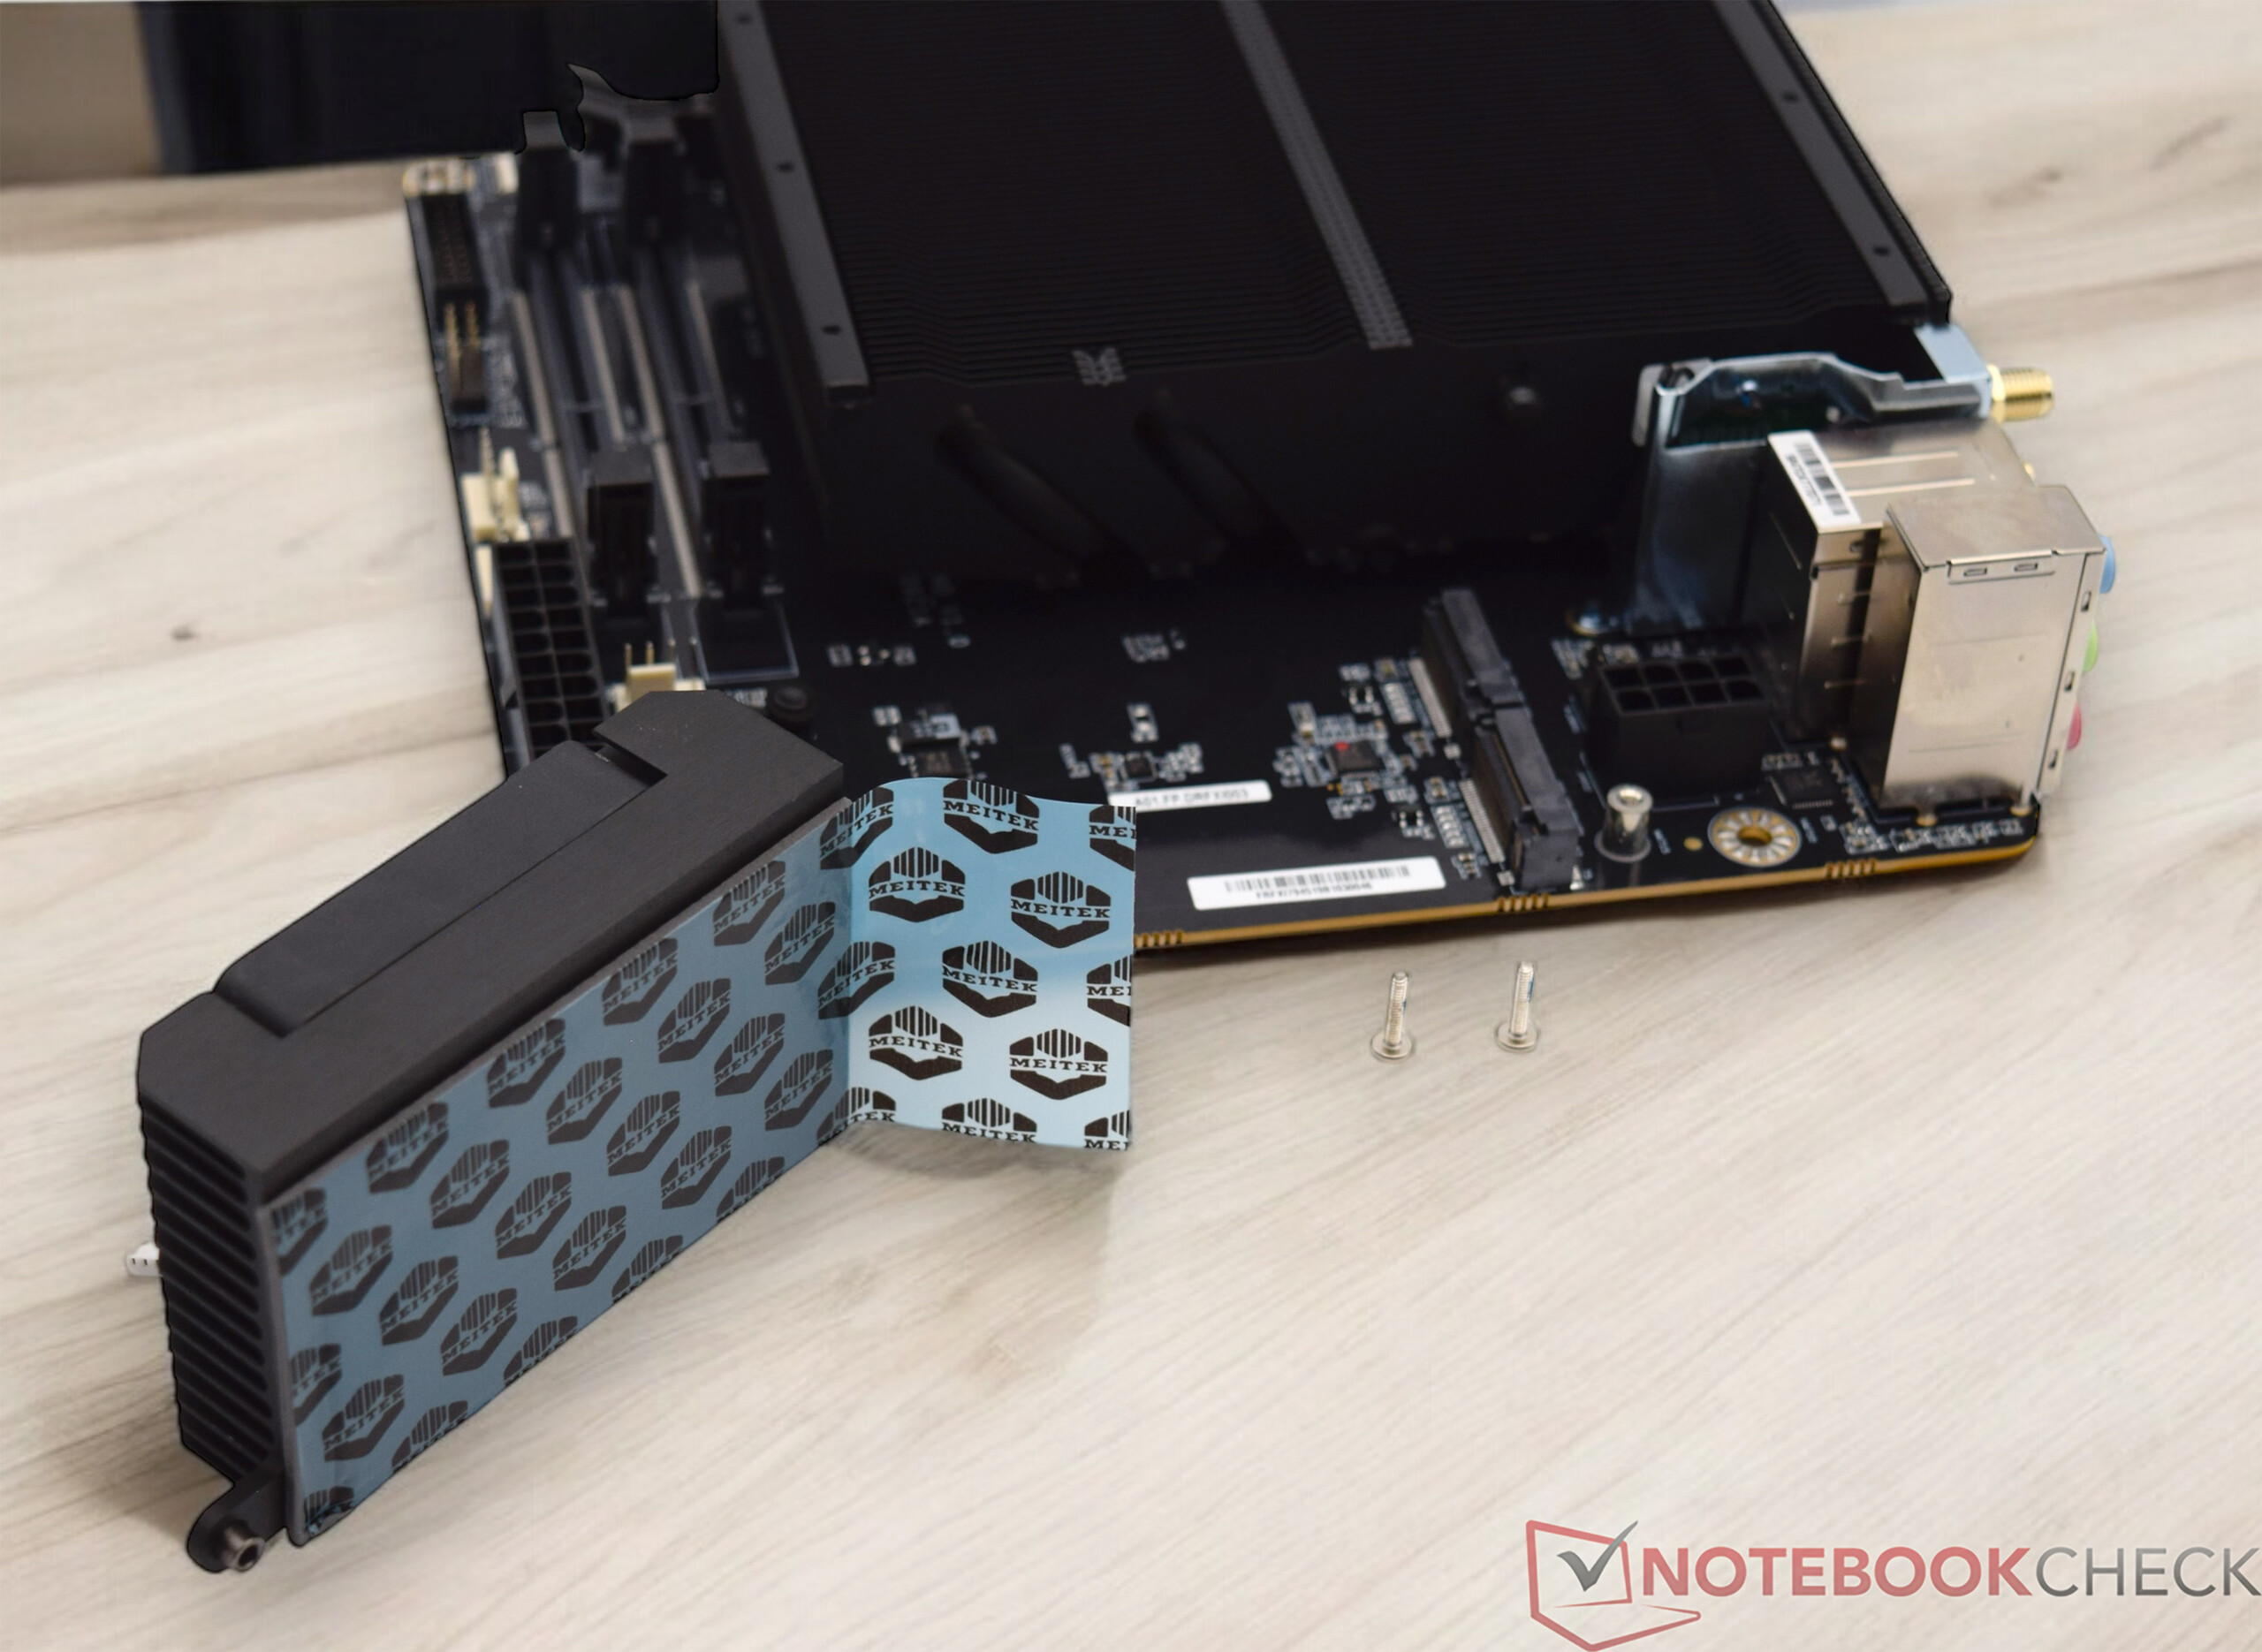
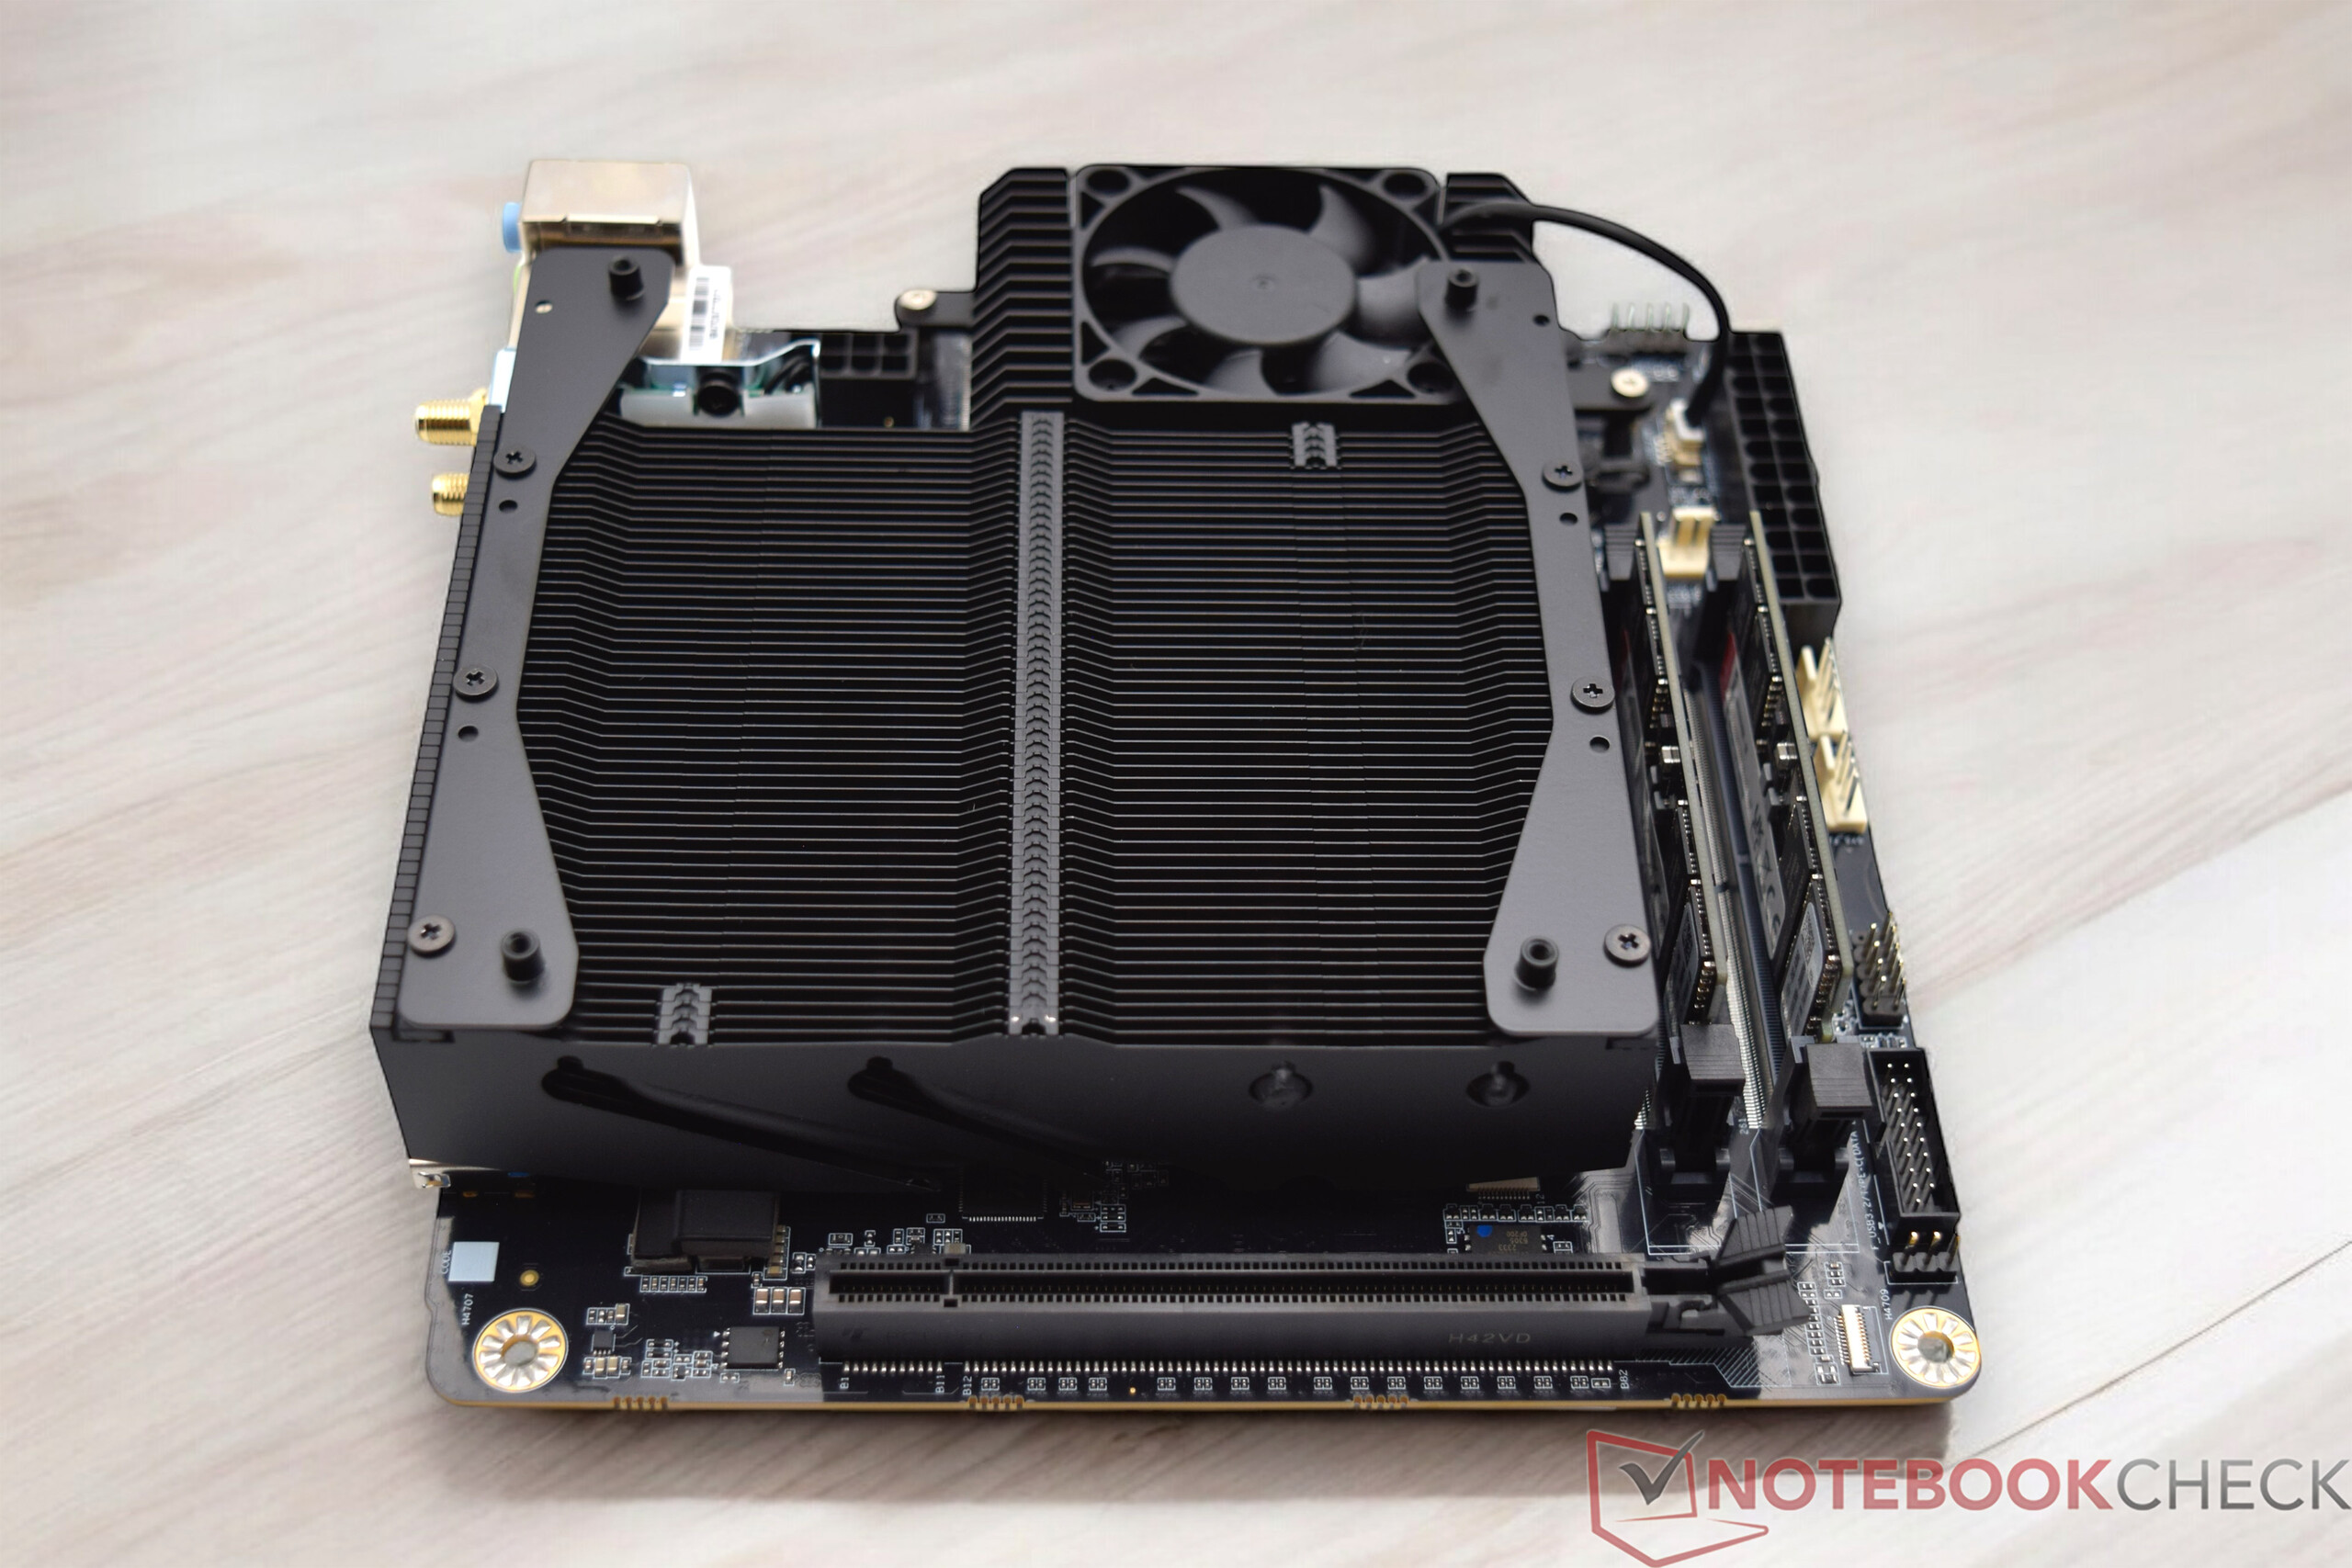
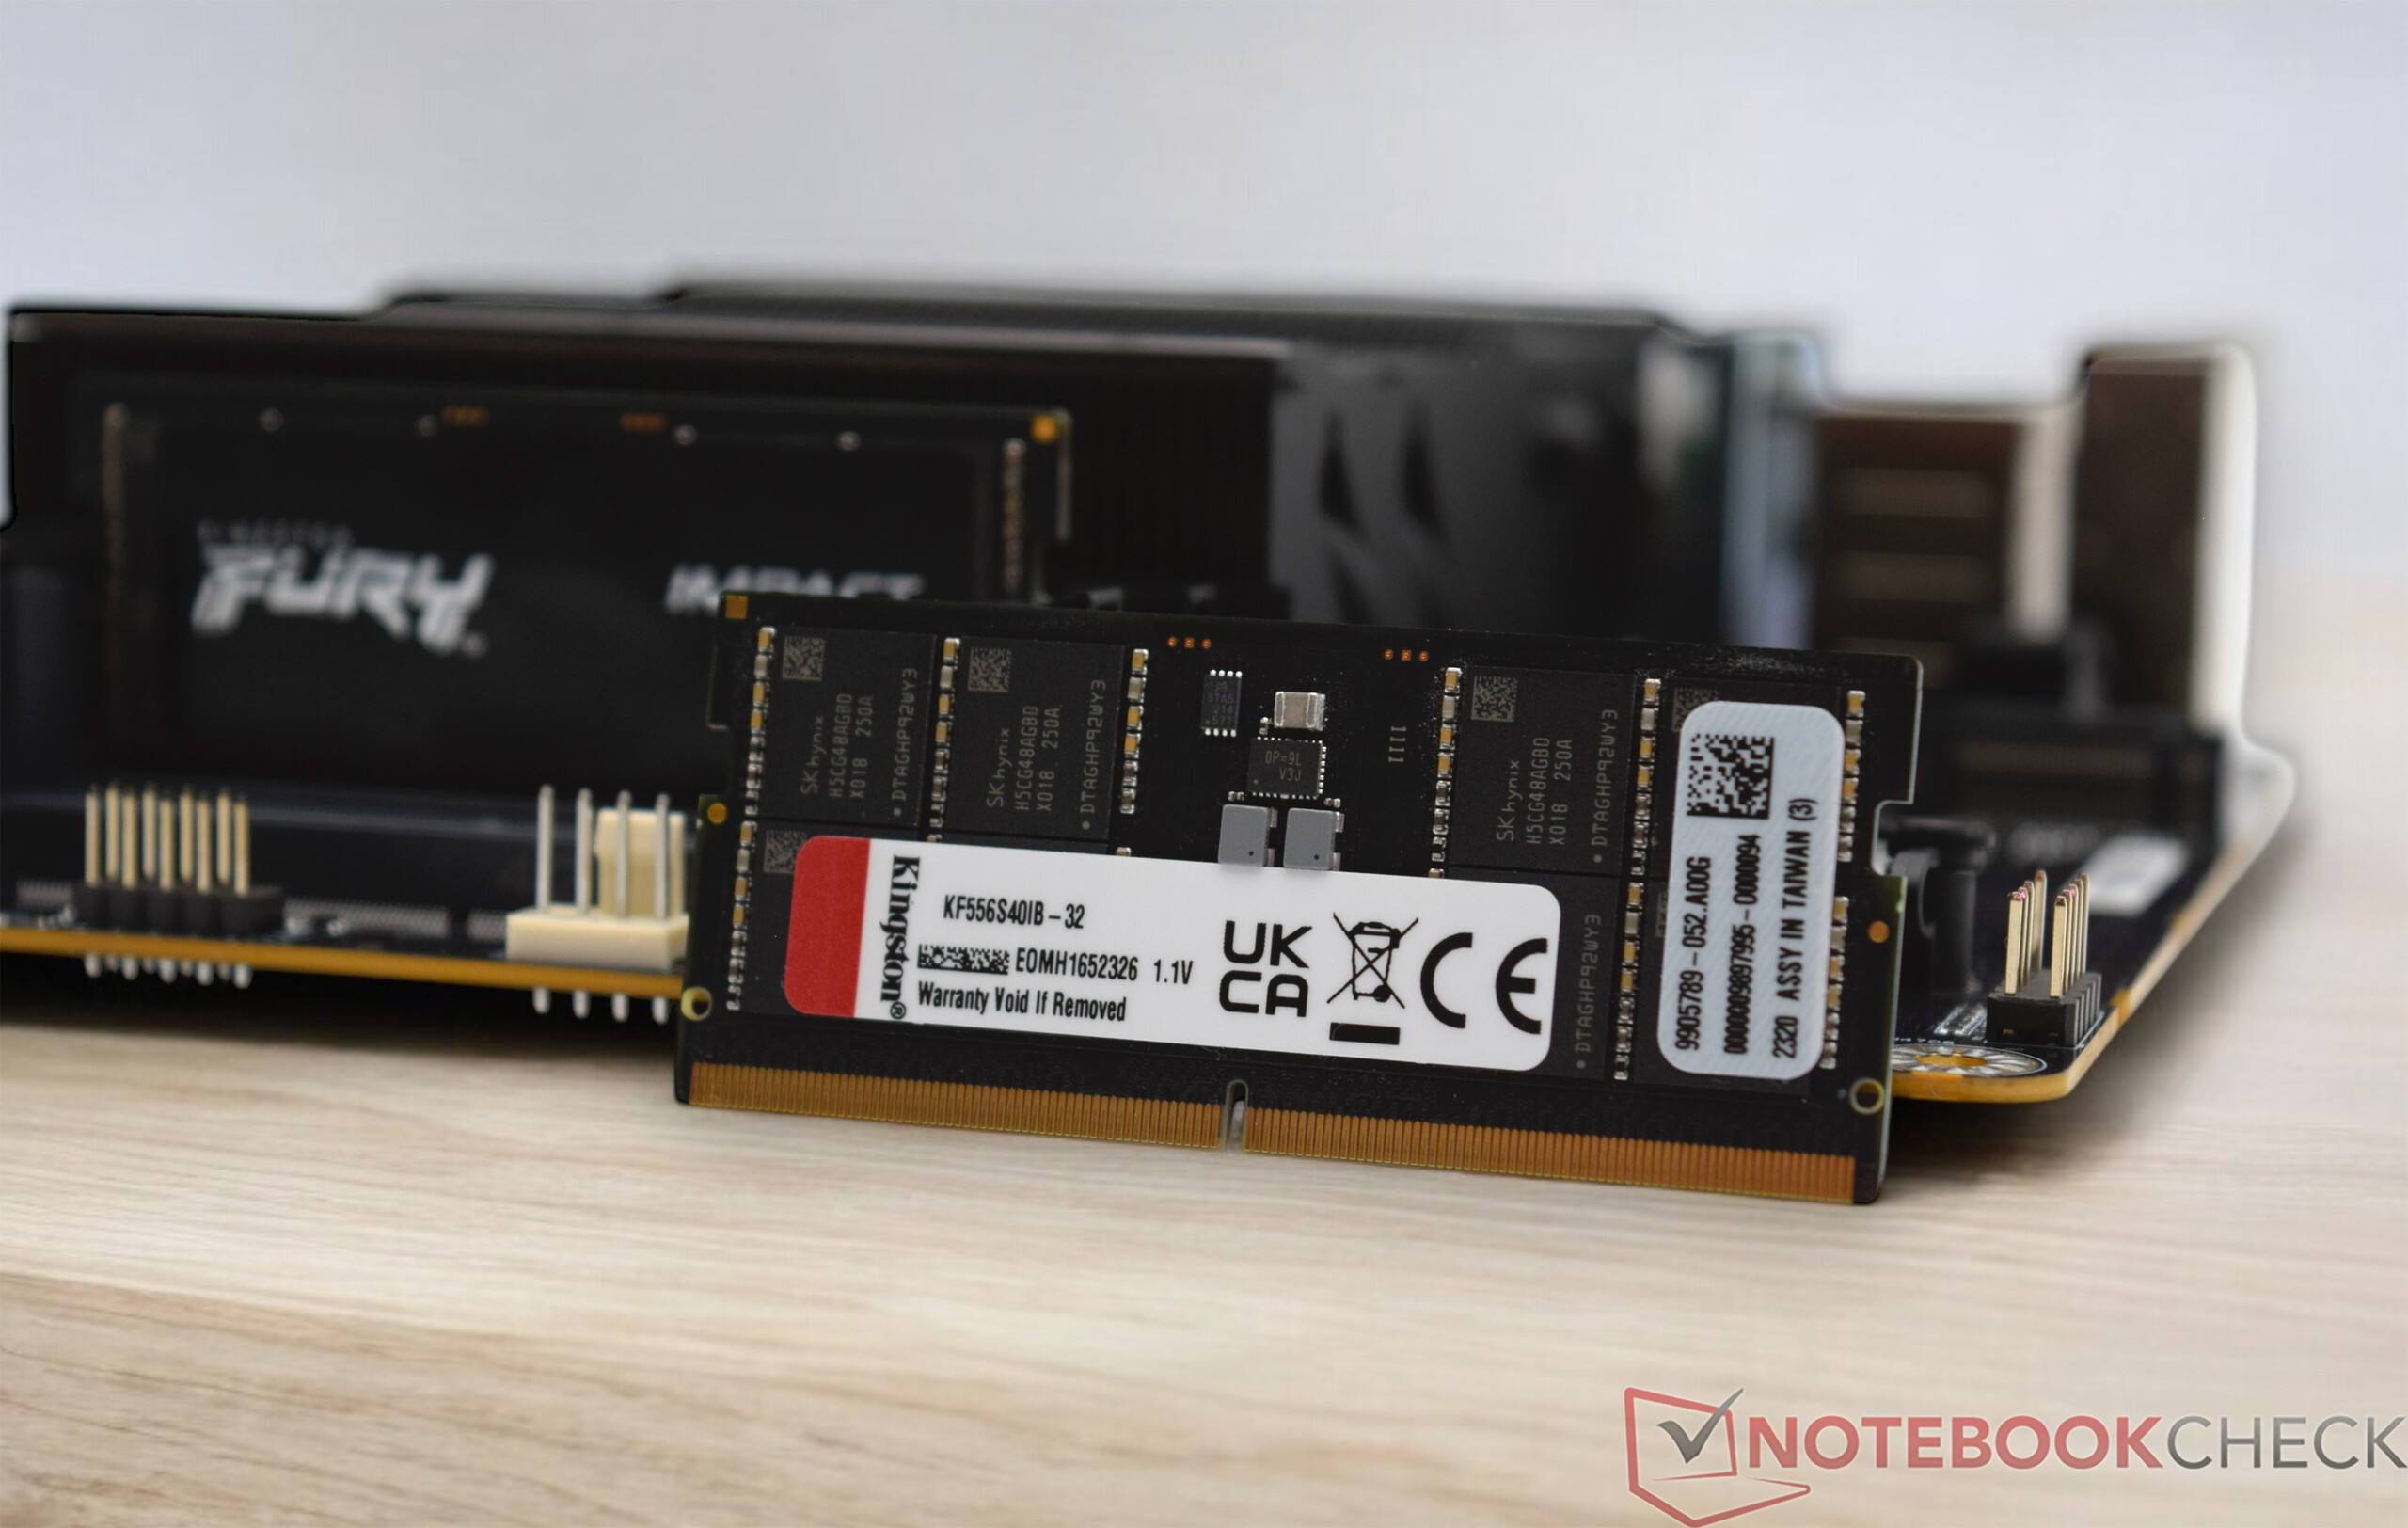
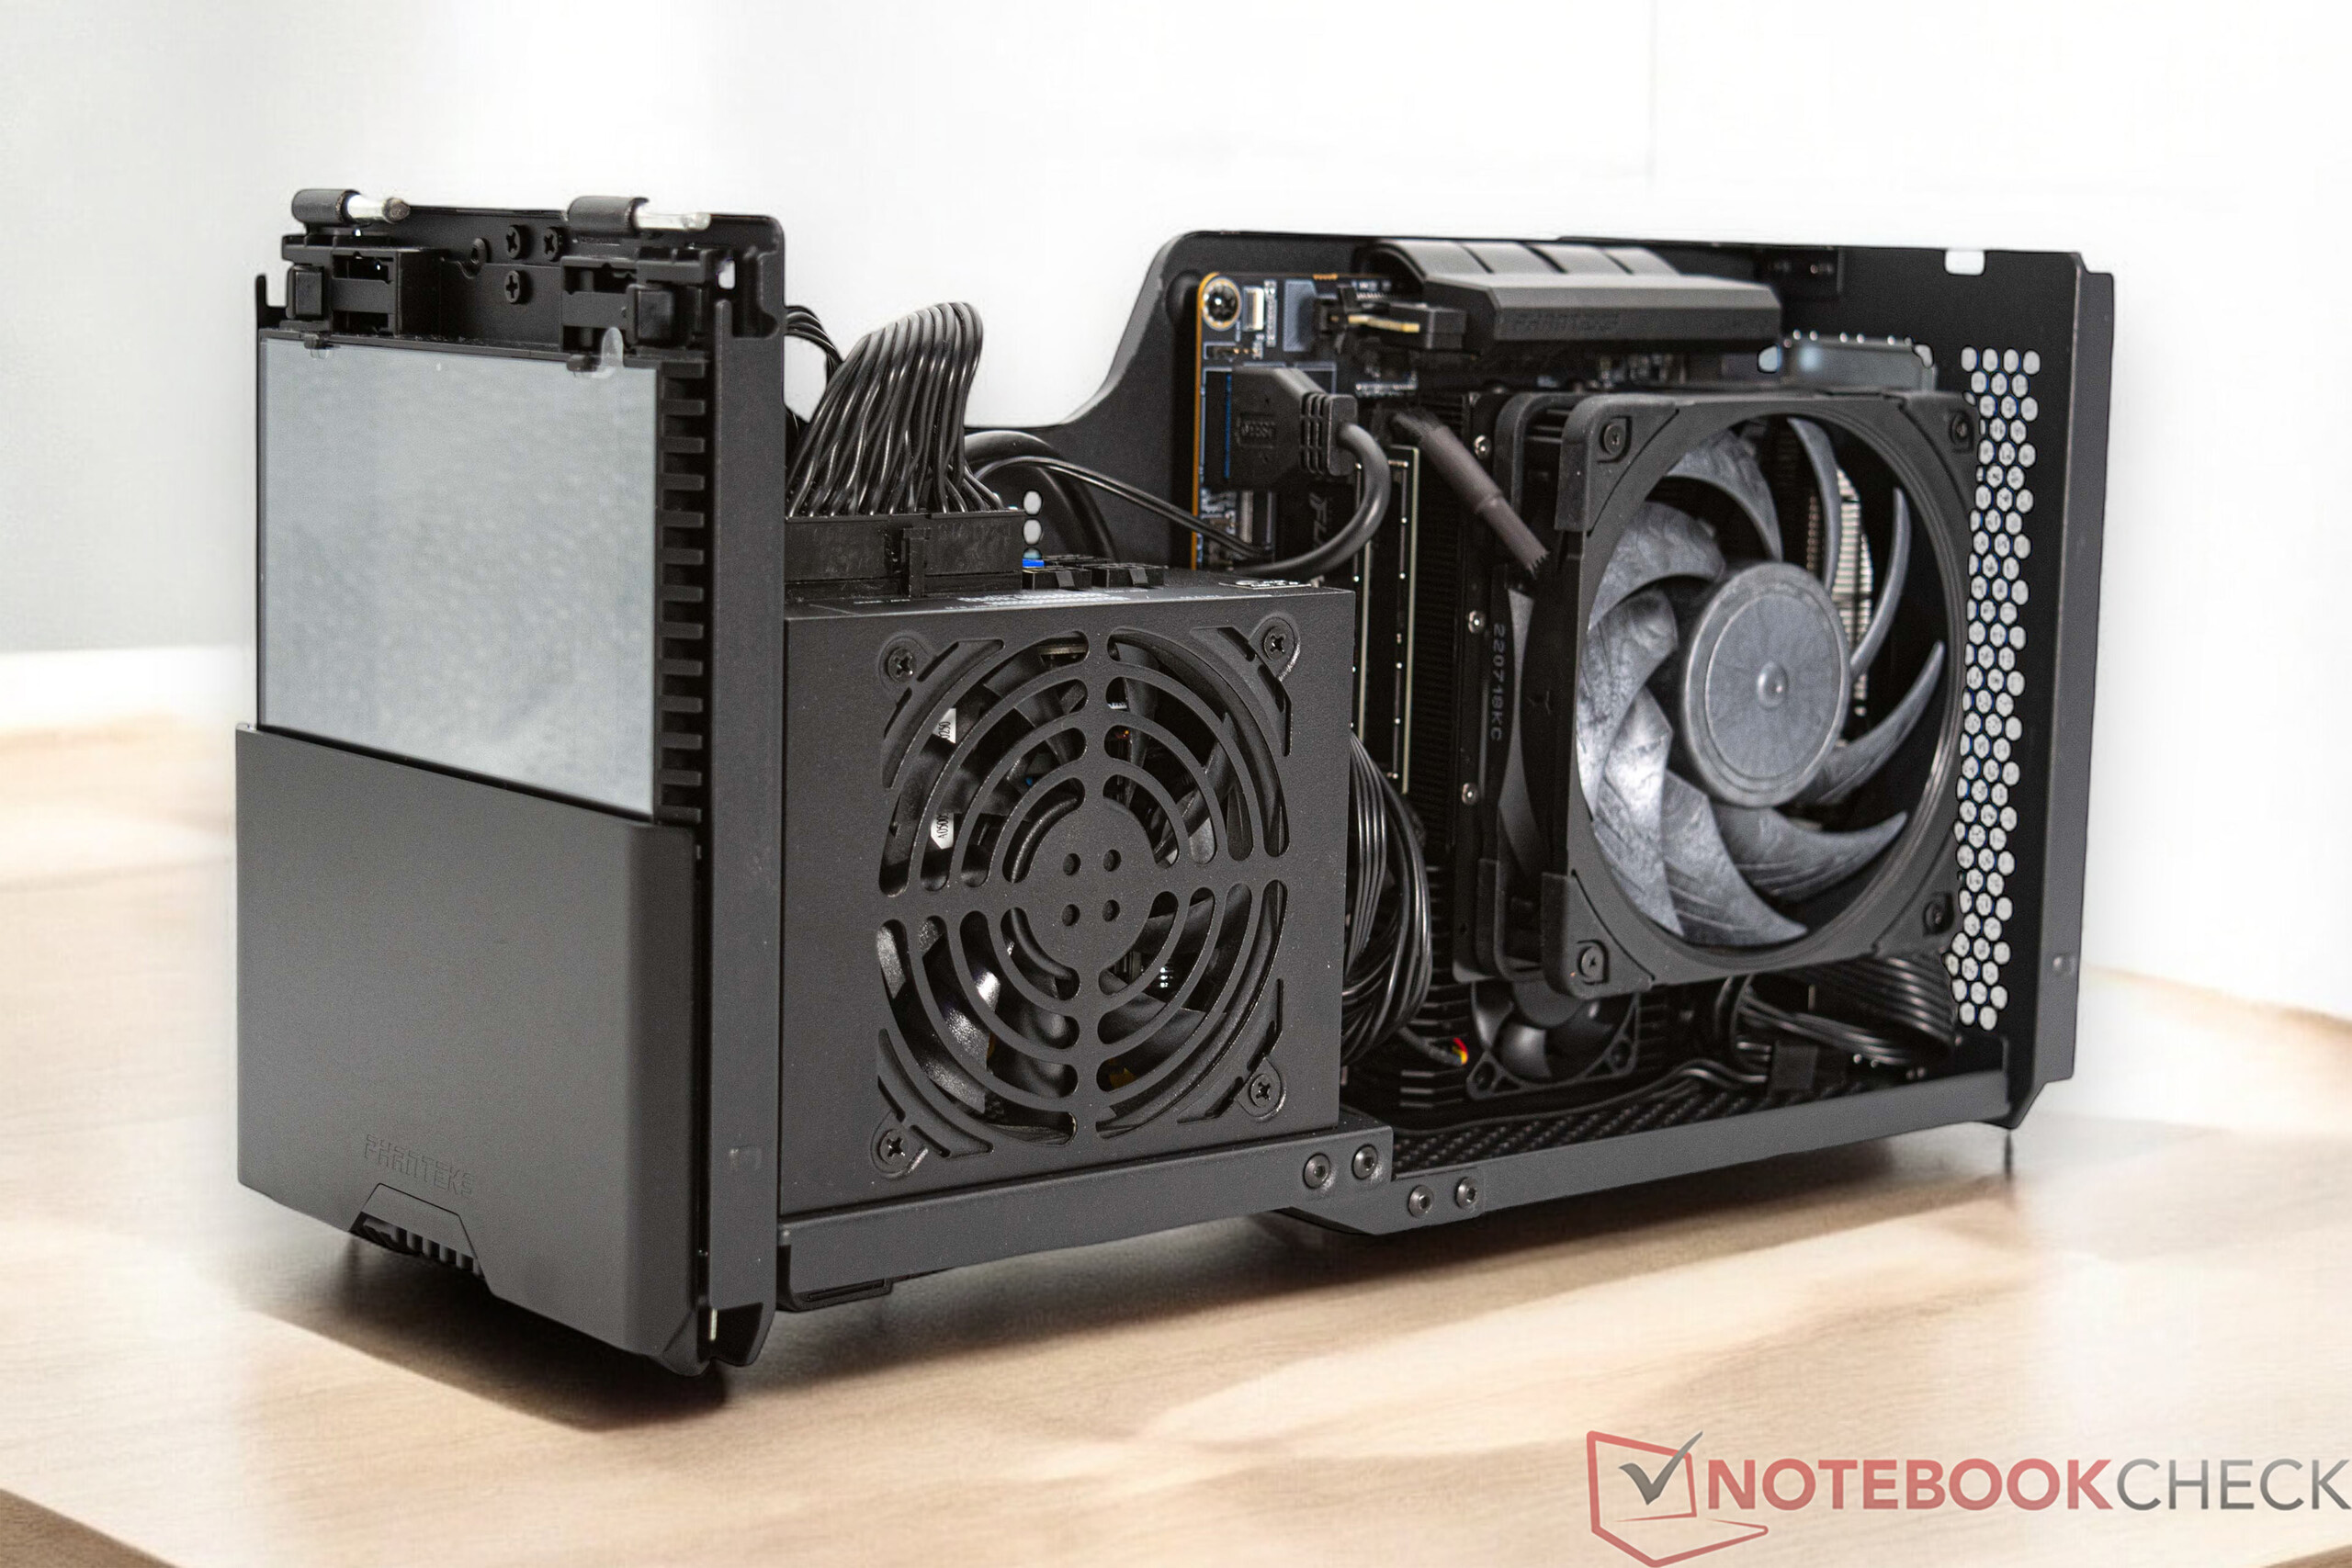
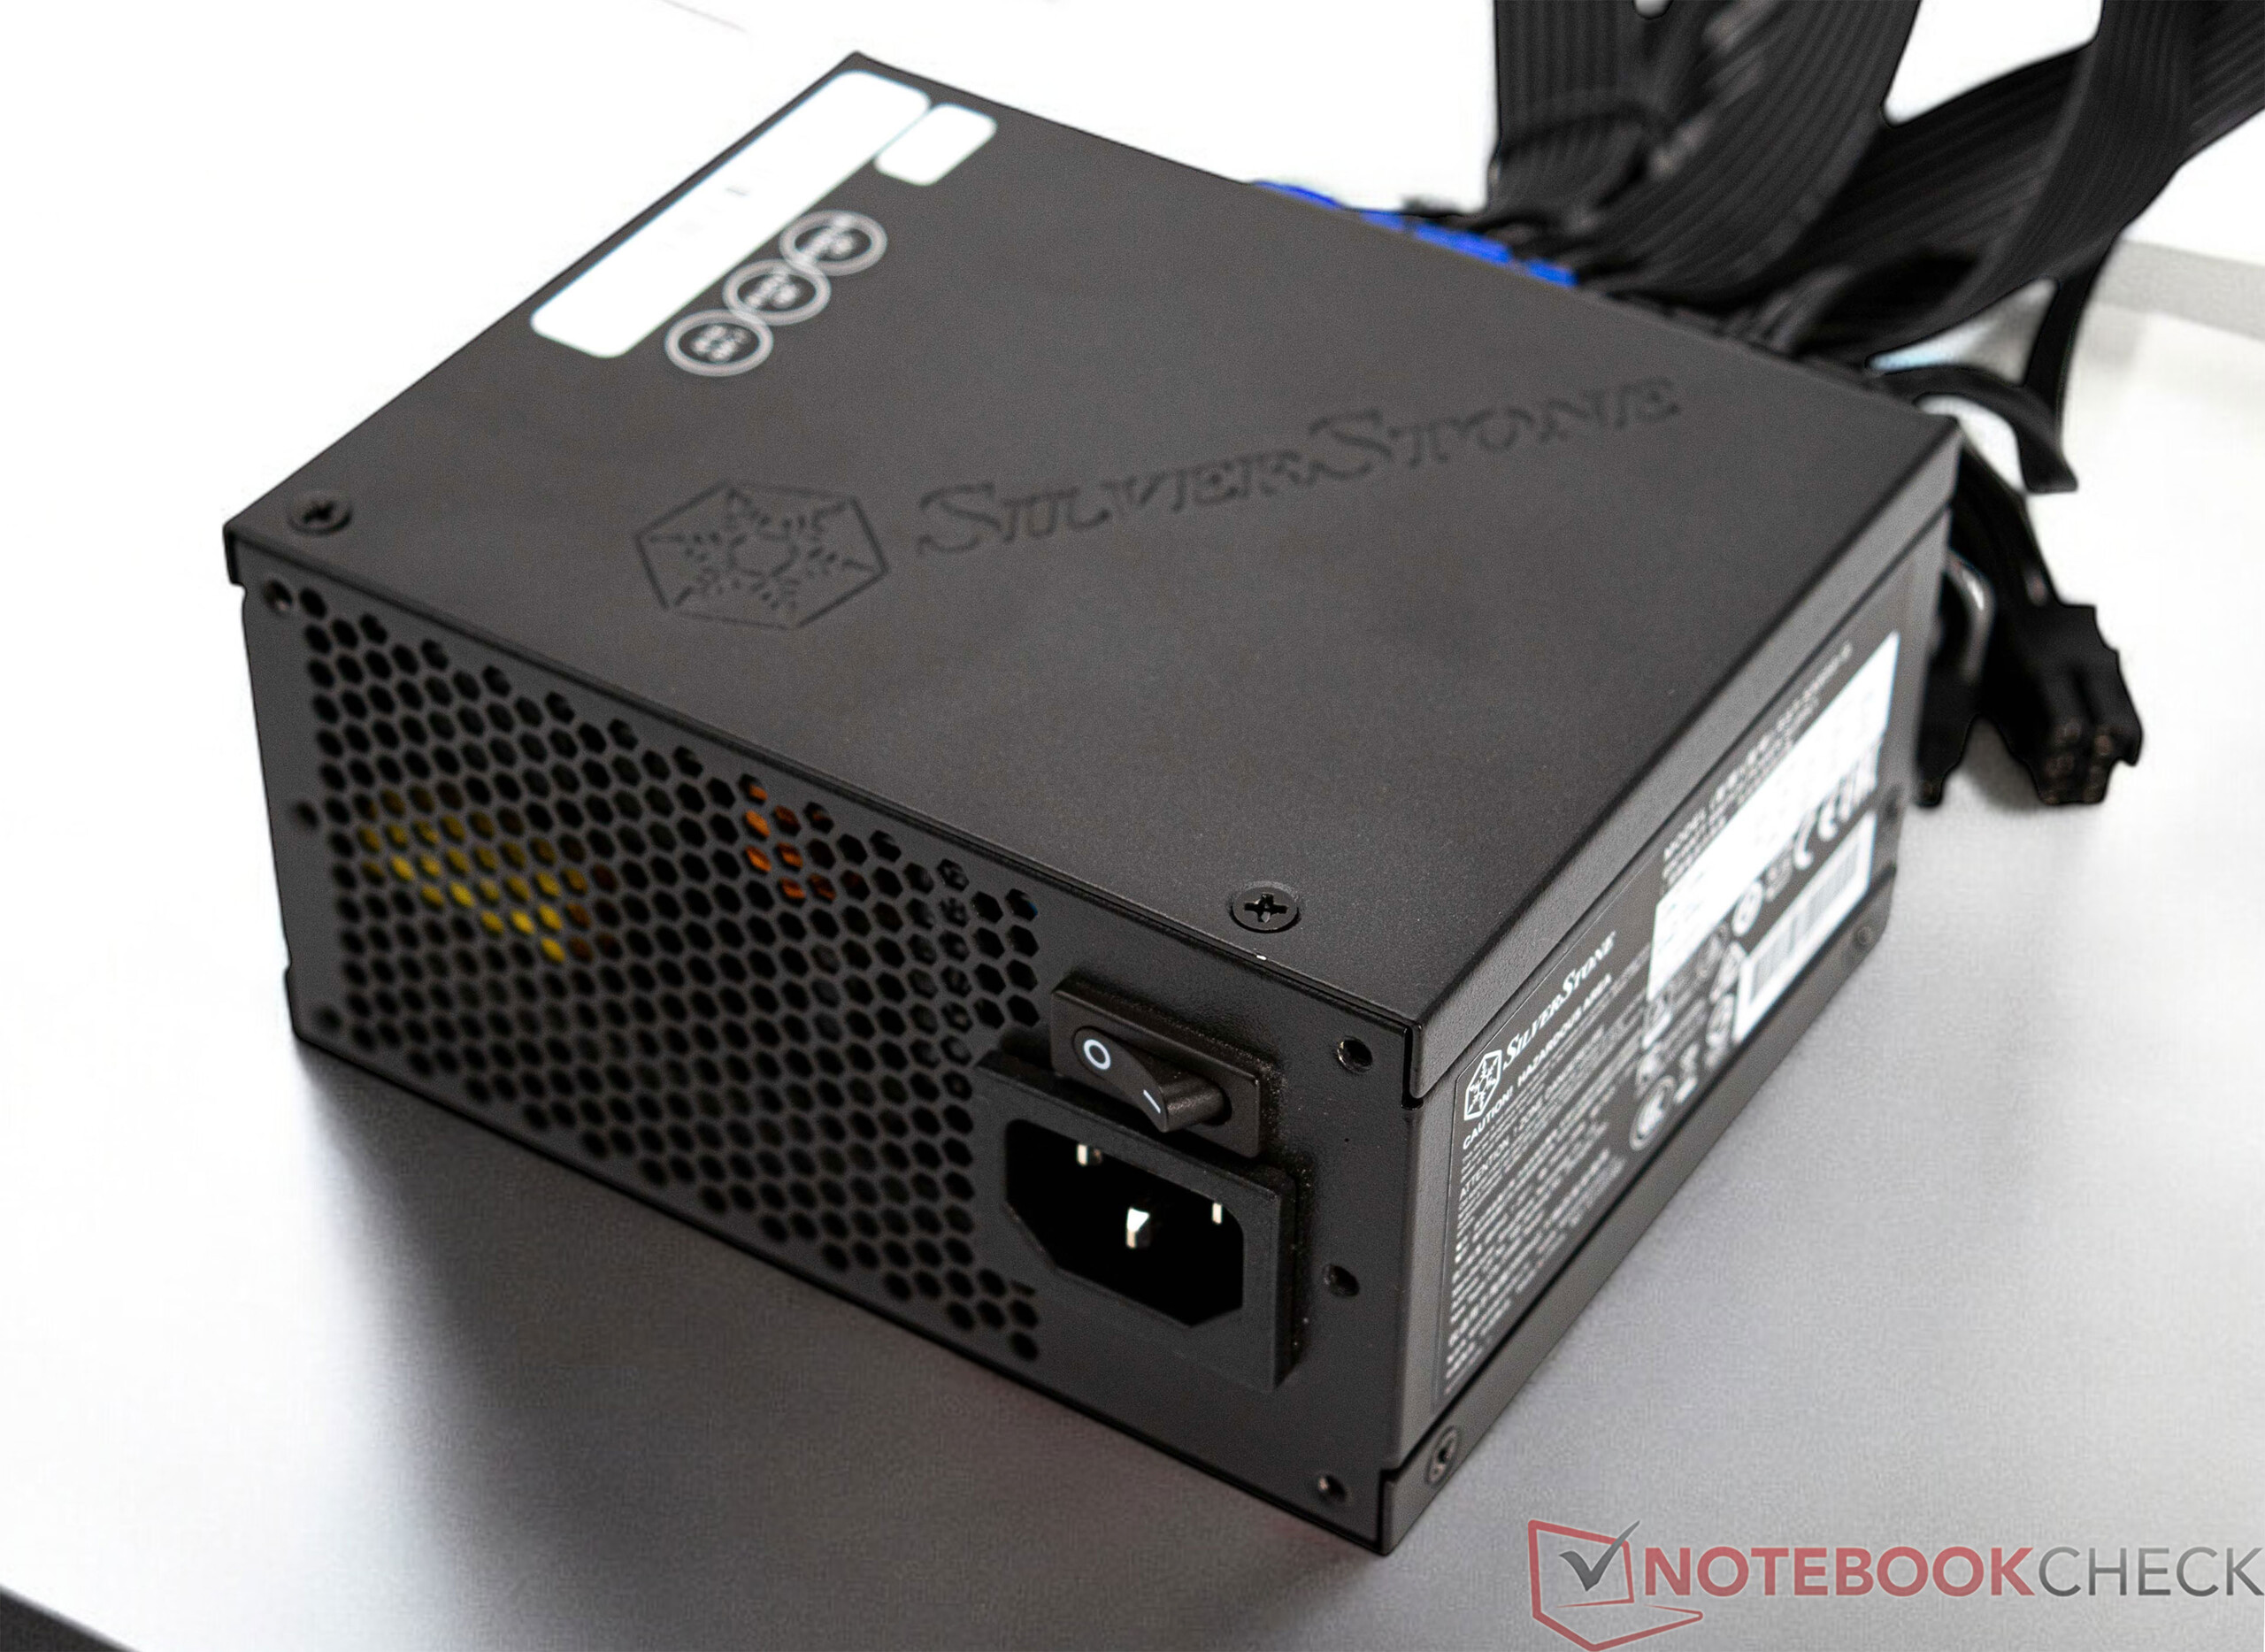
La fornitura della scheda madre Minisforum BD790i è simile a quella della Minisforum BD770i. Il produttore spedisce la scheda principale con un radiatore preinstallato che copre sia il processore che i convertitori di tensione. C'è uno schermo IO da abbinare alla scheda madre, che purtroppo non è preinstallato. Anche un'antenna WLAN relativamente grande è inclusa nella fornitura. Non ci sono opzioni completamente preconfigurate, ma questo non è un problema. È necessario acquistare una ventola da 120 millimetri come ventola della CPU, che si installa rapidamente utilizzando il materiale di montaggio. Per il funzionamento sono necessari un SSD e una RAM, nonché un alimentatore per PC. Il Minisforum BD790i è una buona base per un PC fai da te potente e compatto in formato miniaturizzato.
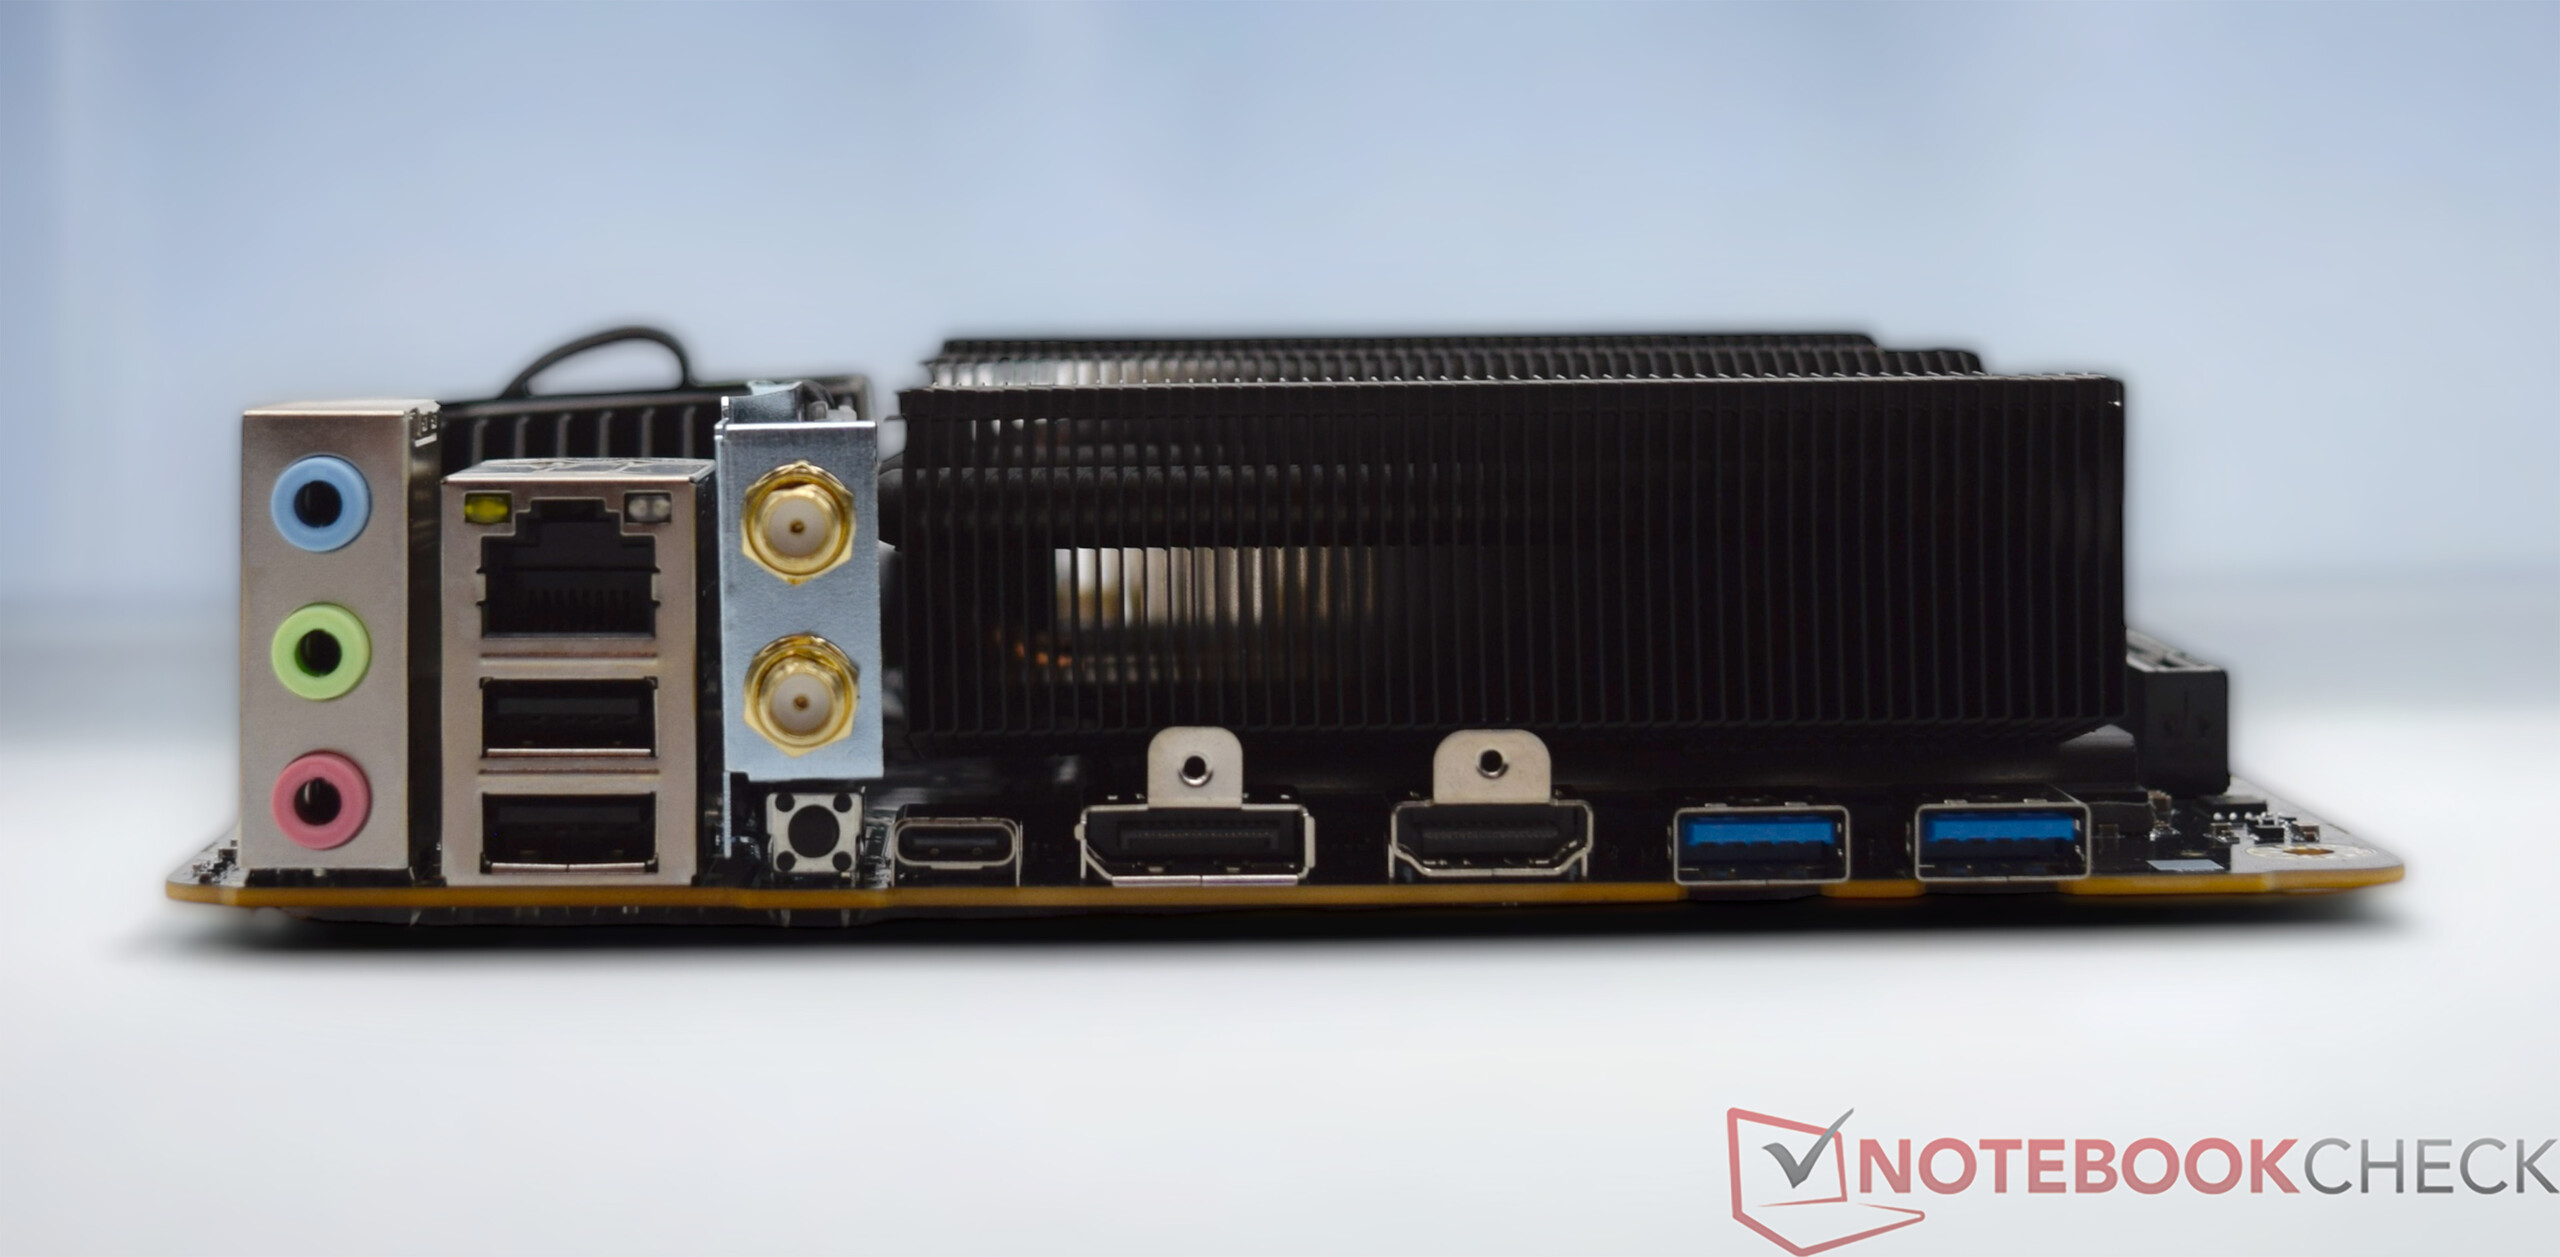
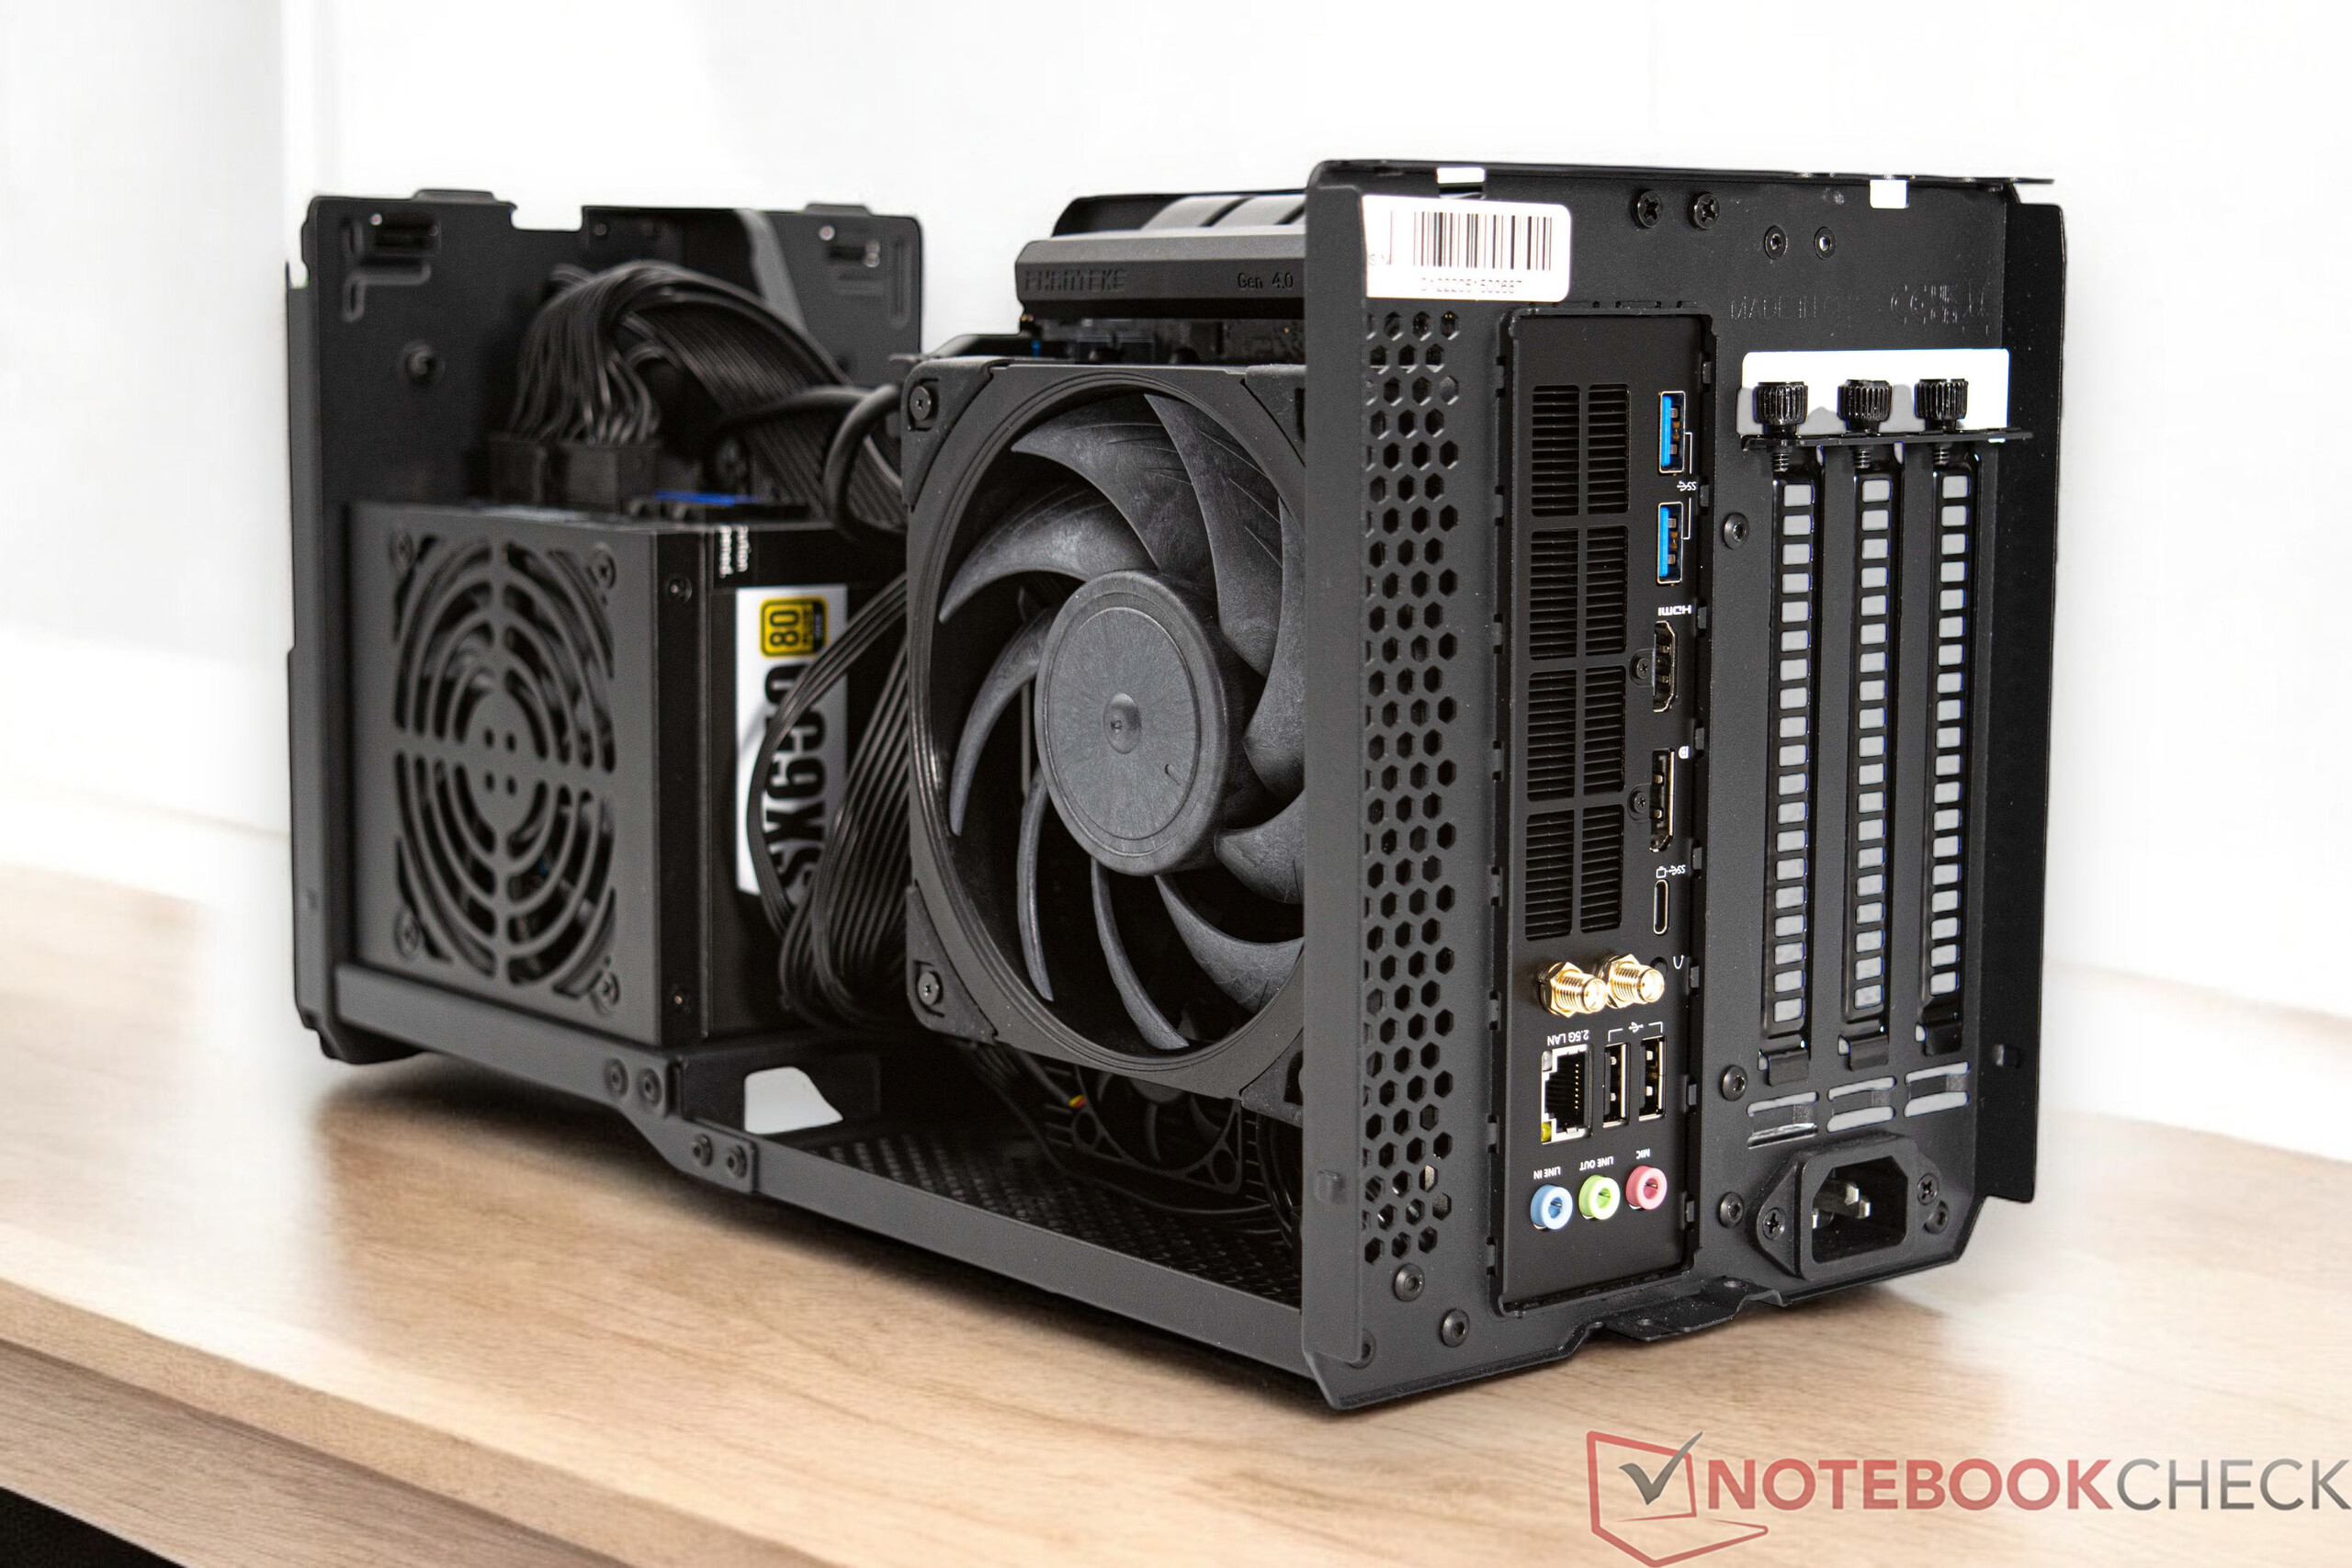
La connettività di Minisforum BD790i è piuttosto scarsa. Ci sono solo poche connessioni sul retro rispetto alle schede madri convenzionali, anche se le porte più importanti sono a bordo. C'è anche un connettore USB 3.2 sulla scheda stessa, il che significa che è possibile utilizzare un totale di 6 porte USB-A. Purtroppo, non ci sono altre connessioni, come un header ARGB o una porta USB-C aggiuntiva. Per quanto riguarda la scelta della ventola, si è limitati al dissipatore preinstallato. Non c'è un'opzione alternativa per installare un radiatore più potente. Sarebbe meglio raffreddare i convertitori di tensione separatamente, per dare all'utente la possibilità di installare la propria soluzione di raffreddamento.
Parametri di riferimento del processore
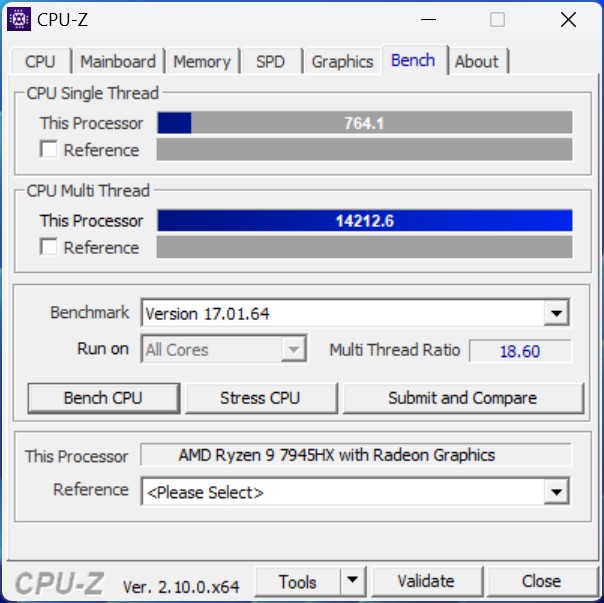
La scheda madre Minisforum BD790i è dotata di uno dei processori più potenti attualmente disponibili nel settore dei computer portatili. Il AMD Ryzen 9 7945HX dispone di 16 core Zen4, che possono elaborare un totale di 32 thread. In termini di prestazioni, questo sembra molto promettente, e ciò è stato dimostrato anche nei nostri test. Nel confronto delle prestazioni, l'AMD Ryzen 9 7945HX si è classificato tra l'AMD Ryzen 9 7900X e l'AMD Ryzen 9 7900X AMD Ryzen 9 7900X e un AMD Ryzen 9 7950X. Se guardiamo al confronto con i processori Intel, le prestazioni di AMD Ryzen 9 7945HX possono essere paragonate a quelle di un Intel Core i7-14700K. Rispetto ai processori desktop convenzionali, il consumo energetico è il principale vantaggio di AMD Ryzen 9 7945HX. Con soli 100 watt, il processore è significativamente più frugale e anche più facile da raffreddare.
Per ulteriori confronti e benchmark, dia un'occhiata alla nostra Tabella di confronto delle CPU.
| Performance Rating - Percent | |
| Intel Core i9-14900K | |
| Intel Core i9-13900K | |
| AMD Ryzen 9 7950X | |
| AMD Ryzen 9 7950X3D | |
| Intel Core i7-14700K | |
| AMD Ryzen 9 7945HX | |
| AMD Ryzen 9 7900X | |
| Intel Core i5-14600K | |
| Intel Core i9-12900K | |
| AMD Ryzen 9 5950X | |
| Intel Core i5-13600K | |
| AMD Ryzen 5 9600X | |
| AMD Ryzen 7 7800X3D | |
| AMD Ryzen 7 7745HX | |
| AMD Ryzen 5 7600X | |
| Intel Core i5-12600K | |
| AMD Ryzen 7 7840HS | |
| AMD Ryzen 9 7940HS | |
| Intel Core i5-13400 | |
| Intel Core i5-12400F | |
| Cinebench R20 | |
| CPU (Single Core) | |
| Intel Core i9-14900K | |
| AMD Ryzen 5 9600X | |
| Intel Core i7-14700K | |
| Intel Core i9-13900K | |
| AMD Ryzen 9 7950X | |
| AMD Ryzen 9 7950X3D | |
| Intel Core i5-14600K | |
| AMD Ryzen 9 7900X | |
| Intel Core i5-13600K | |
| Intel Core i9-12900K | |
| AMD Ryzen 5 7600X | |
| AMD Ryzen 9 7945HX | |
| Intel Core i5-12600K | |
| AMD Ryzen 7 7745HX | |
| AMD Ryzen 9 7940HS | |
| AMD Ryzen 7 7800X3D | |
| AMD Ryzen 7 7840HS | |
| Intel Core i5-13400 | |
| Intel Core i5-12400F | |
| AMD Ryzen 9 5950X | |
| CPU (Multi Core) | |
| Intel Core i9-14900K | |
| Intel Core i9-13900K | |
| AMD Ryzen 9 7950X | |
| AMD Ryzen 9 7950X3D | |
| Intel Core i7-14700K | |
| AMD Ryzen 9 7945HX | |
| AMD Ryzen 9 7900X | |
| AMD Ryzen 9 5950X | |
| Intel Core i9-12900K | |
| Intel Core i5-14600K | |
| Intel Core i5-13600K | |
| AMD Ryzen 7 7745HX | |
| AMD Ryzen 7 7800X3D | |
| AMD Ryzen 5 9600X | |
| Intel Core i5-12600K | |
| AMD Ryzen 9 7940HS | |
| AMD Ryzen 7 7840HS | |
| Intel Core i5-13400 | |
| AMD Ryzen 5 7600X | |
| Intel Core i5-12400F | |
| Cinebench R11.5 | |
| CPU Single 64Bit | |
| Intel Core i9-14900K | |
| AMD Ryzen 5 9600X | |
| Intel Core i9-13900K | |
| AMD Ryzen 9 7950X | |
| AMD Ryzen 9 7950X3D | |
| AMD Ryzen 9 7900X | |
| AMD Ryzen 5 7600X | |
| Intel Core i7-14700K | |
| AMD Ryzen 9 7945HX | |
| Intel Core i5-14600K | |
| AMD Ryzen 7 7745HX | |
| Intel Core i9-12900K | |
| Intel Core i5-13600K | |
| AMD Ryzen 9 7940HS | |
| AMD Ryzen 7 7800X3D | |
| AMD Ryzen 7 7840HS | |
| Intel Core i5-12600K | |
| AMD Ryzen 9 5950X | |
| Intel Core i5-13400 | |
| Intel Core i5-12400F | |
| CPU Multi 64Bit | |
| Intel Core i9-14900K | |
| Intel Core i9-13900K | |
| AMD Ryzen 9 7950X | |
| AMD Ryzen 9 7950X3D | |
| AMD Ryzen 9 7945HX | |
| Intel Core i7-14700K | |
| AMD Ryzen 9 7900X | |
| AMD Ryzen 9 5950X | |
| Intel Core i9-12900K | |
| Intel Core i5-13600K | |
| Intel Core i5-14600K | |
| AMD Ryzen 7 7745HX | |
| AMD Ryzen 7 7800X3D | |
| AMD Ryzen 9 7940HS | |
| AMD Ryzen 5 9600X | |
| AMD Ryzen 7 7840HS | |
| Intel Core i5-12600K | |
| AMD Ryzen 5 7600X | |
| Intel Core i5-13400 | |
| Intel Core i5-12400F | |
| Cinebench R10 | |
| Rendering Single CPUs 64Bit | |
| Intel Core i9-14900K | |
| Intel Core i9-13900K | |
| AMD Ryzen 5 9600X | |
| Intel Core i7-14700K | |
| Intel Core i5-14600K | |
| AMD Ryzen 9 7900X | |
| AMD Ryzen 9 7950X | |
| Intel Core i5-13600K | |
| Intel Core i9-12900K | |
| AMD Ryzen 5 7600X | |
| AMD Ryzen 9 7945HX | |
| Intel Core i5-12600K | |
| AMD Ryzen 7 7745HX | |
| AMD Ryzen 9 7940HS | |
| AMD Ryzen 7 7800X3D | |
| AMD Ryzen 7 7840HS | |
| Intel Core i5-13400 | |
| Intel Core i5-12400F | |
| AMD Ryzen 9 5950X | |
| AMD Ryzen 9 7950X3D | |
| Rendering Multiple CPUs 64Bit | |
| Intel Core i9-14900K | |
| Intel Core i7-14700K | |
| Intel Core i9-13900K | |
| AMD Ryzen 9 7945HX | |
| AMD Ryzen 9 7950X | |
| AMD Ryzen 9 7900X | |
| Intel Core i5-14600K | |
| Intel Core i9-12900K | |
| Intel Core i5-13600K | |
| AMD Ryzen 9 5950X | |
| AMD Ryzen 5 9600X | |
| AMD Ryzen 7 7745HX | |
| AMD Ryzen 7 7800X3D | |
| AMD Ryzen 5 7600X | |
| Intel Core i5-12600K | |
| AMD Ryzen 9 7940HS | |
| AMD Ryzen 7 7840HS | |
| Intel Core i5-13400 | |
| AMD Ryzen 9 7950X3D | |
| Intel Core i5-12400F | |
| Blender - v2.79 BMW27 CPU | |
| Intel Core i5-12400F | |
| Intel Core i5-13400 | |
| AMD Ryzen 5 7600X | |
| AMD Ryzen 7 7840HS | |
| Intel Core i5-12600K | |
| AMD Ryzen 9 7940HS | |
| AMD Ryzen 5 9600X | |
| AMD Ryzen 7 7800X3D | |
| AMD Ryzen 7 7745HX | |
| Intel Core i5-13600K | |
| Intel Core i5-14600K | |
| Intel Core i9-12900K | |
| AMD Ryzen 9 5950X | |
| AMD Ryzen 9 7900X | |
| AMD Ryzen 9 7945HX | |
| Intel Core i7-14700K | |
| AMD Ryzen 9 7950X3D | |
| AMD Ryzen 9 7950X | |
| Intel Core i9-13900K | |
| Intel Core i9-14900K | |
| Geekbench 4.4 | |
| 64 Bit Single-Core Score | |
| Intel Core i9-14900K | |
| AMD Ryzen 5 9600X | |
| Intel Core i9-13900K | |
| AMD Ryzen 9 7950X | |
| Intel Core i7-14700K | |
| AMD Ryzen 9 7950X3D | |
| AMD Ryzen 9 7900X | |
| AMD Ryzen 7 7800X3D | |
| AMD Ryzen 5 7600X | |
| Intel Core i5-14600K | |
| Intel Core i9-12900K | |
| Intel Core i5-13600K | |
| AMD Ryzen 9 7945HX | |
| AMD Ryzen 7 7745HX | |
| Intel Core i5-12600K | |
| AMD Ryzen 7 7840HS | |
| AMD Ryzen 9 7940HS | |
| Intel Core i5-13400 | |
| Intel Core i5-12400F | |
| AMD Ryzen 9 5950X | |
| 64 Bit Multi-Core Score | |
| AMD Ryzen 9 7950X | |
| Intel Core i9-14900K | |
| AMD Ryzen 9 7950X3D | |
| Intel Core i9-13900K | |
| Intel Core i7-14700K | |
| AMD Ryzen 9 7945HX | |
| AMD Ryzen 9 7900X | |
| Intel Core i5-14600K | |
| Intel Core i9-12900K | |
| AMD Ryzen 9 5950X | |
| Intel Core i5-13600K | |
| AMD Ryzen 7 7800X3D | |
| AMD Ryzen 7 7745HX | |
| AMD Ryzen 5 9600X | |
| AMD Ryzen 7 7840HS | |
| AMD Ryzen 5 7600X | |
| Intel Core i5-12600K | |
| AMD Ryzen 9 7940HS | |
| Intel Core i5-13400 | |
| Intel Core i5-12400F | |
| 3DMark 11 - 1280x720 Performance Physics | |
| AMD Ryzen 9 7950X3D | |
| AMD Ryzen 7 7800X3D | |
| Intel Core i7-14700K | |
| Intel Core i9-13900K | |
| Intel Core i9-14900K | |
| Intel Core i5-14600K | |
| Intel Core i5-13600K | |
| AMD Ryzen 9 7900X | |
| AMD Ryzen 9 7950X | |
| Intel Core i9-12900K | |
| AMD Ryzen 9 7945HX | |
| AMD Ryzen 7 7745HX | |
| AMD Ryzen 5 9600X | |
| AMD Ryzen 5 7600X | |
| AMD Ryzen 9 5950X | |
| Intel Core i5-12600K | |
| Intel Core i5-13400 | |
| AMD Ryzen 7 7840HS | |
| AMD Ryzen 9 7940HS | |
| Intel Core i5-12400F | |
| HWBOT x265 Benchmark v2.2 - 4k Preset | |
| AMD Ryzen 9 7950X | |
| Intel Core i9-14900K | |
| Intel Core i9-13900K | |
| AMD Ryzen 9 7950X3D | |
| AMD Ryzen 9 7945HX | |
| Intel Core i7-14700K | |
| AMD Ryzen 9 7900X | |
| AMD Ryzen 9 5950X | |
| Intel Core i5-12600K | |
| Intel Core i9-12900K | |
| Intel Core i5-14600K | |
| Intel Core i5-13600K | |
| AMD Ryzen 7 7800X3D | |
| AMD Ryzen 7 7745HX | |
| AMD Ryzen 5 9600X | |
| AMD Ryzen 5 7600X | |
| AMD Ryzen 7 7840HS | |
| AMD Ryzen 9 7940HS | |
| Intel Core i5-13400 | |
| Intel Core i5-12400F | |
| R Benchmark 2.5 - Overall mean | |
| Intel Core i5-12400F | |
| Intel Core i5-13400 | |
| AMD Ryzen 9 5950X | |
| Intel Core i5-12600K | |
| AMD Ryzen 7 7840HS | |
| Intel Core i9-12900K | |
| AMD Ryzen 9 7940HS | |
| AMD Ryzen 7 7800X3D | |
| AMD Ryzen 7 7745HX | |
| Intel Core i5-13600K | |
| Intel Core i5-14600K | |
| AMD Ryzen 9 7945HX | |
| Intel Core i7-14700K | |
| AMD Ryzen 5 7600X | |
| AMD Ryzen 9 7900X | |
| AMD Ryzen 9 7950X3D | |
| AMD Ryzen 9 7950X | |
| Intel Core i9-13900K | |
| Intel Core i9-14900K | |
| AMD Ryzen 5 9600X | |
| LibreOffice - 20 Documents To PDF | |
| Intel Core i5-12600K | |
| AMD Ryzen 7 7840HS | |
| Intel Core i5-12400F | |
| AMD Ryzen 5 9600X | |
| AMD Ryzen 9 7940HS | |
| AMD Ryzen 9 5950X | |
| AMD Ryzen 7 7745HX | |
| AMD Ryzen 7 7800X3D | |
| Intel Core i9-12900K | |
| Intel Core i7-14700K | |
| Intel Core i5-13400 | |
| AMD Ryzen 9 7950X3D | |
| AMD Ryzen 5 7600X | |
| Intel Core i9-13900K | |
| AMD Ryzen 9 7950X | |
| AMD Ryzen 9 7945HX | |
| Intel Core i5-13600K | |
| AMD Ryzen 9 7900X | |
| Intel Core i9-14900K | |
| Intel Core i5-14600K | |
| Mozilla Kraken 1.1 - Total | |
| Intel Core i5-12400F | |
| AMD Ryzen 9 5950X | |
| Intel Core i5-13400 | |
| AMD Ryzen 7 7840HS | |
| Intel Core i5-12600K | |
| AMD Ryzen 7 7800X3D | |
| AMD Ryzen 9 7940HS | |
| Intel Core i9-12900K | |
| AMD Ryzen 7 7745HX | |
| Intel Core i5-13600K | |
| Intel Core i5-14600K | |
| AMD Ryzen 9 7945HX | |
| AMD Ryzen 5 7600X | |
| Intel Core i7-14700K | |
| AMD Ryzen 9 7950X3D | |
| AMD Ryzen 9 7950X | |
| Intel Core i9-13900K | |
| AMD Ryzen 9 7900X | |
| Intel Core i9-14900K | |
| AMD Ryzen 5 9600X | |
| 3DMark | |
| 1920x1080 Fire Strike Physics | |
| Intel Core i9-14900K | |
| Intel Core i9-13900K | |
| Intel Core i7-14700K | |
| AMD Ryzen 9 7950X3D | |
| AMD Ryzen 9 7900X | |
| AMD Ryzen 9 7950X | |
| Intel Core i5-14600K | |
| AMD Ryzen 9 5950X | |
| Intel Core i9-12900K | |
| AMD Ryzen 9 7945HX | |
| Intel Core i5-13600K | |
| AMD Ryzen 5 9600X | |
| AMD Ryzen 7 7800X3D | |
| AMD Ryzen 5 7600X | |
| Intel Core i5-12600K | |
| AMD Ryzen 7 7840HS | |
| AMD Ryzen 9 7940HS | |
| Intel Core i5-13400 | |
| Intel Core i5-12400F | |
| AMD Ryzen 7 7745HX | |
| 2560x1440 Time Spy CPU | |
| Intel Core i9-14900K | |
| Intel Core i7-14700K | |
| Intel Core i9-13900K | |
| Intel Core i5-14600K | |
| Intel Core i9-12900K | |
| AMD Ryzen 9 7950X3D | |
| Intel Core i5-13600K | |
| AMD Ryzen 9 7900X | |
| AMD Ryzen 9 7950X | |
| AMD Ryzen 7 7800X3D | |
| Intel Core i5-12600K | |
| AMD Ryzen 9 5950X | |
| Intel Core i5-13400 | |
| AMD Ryzen 9 7945HX | |
| AMD Ryzen 7 7840HS | |
| AMD Ryzen 7 7745HX | |
| AMD Ryzen 5 9600X | |
| AMD Ryzen 9 7940HS | |
| AMD Ryzen 5 7600X | |
| Intel Core i5-12400F | |
* ... Meglio usare valori piccoli
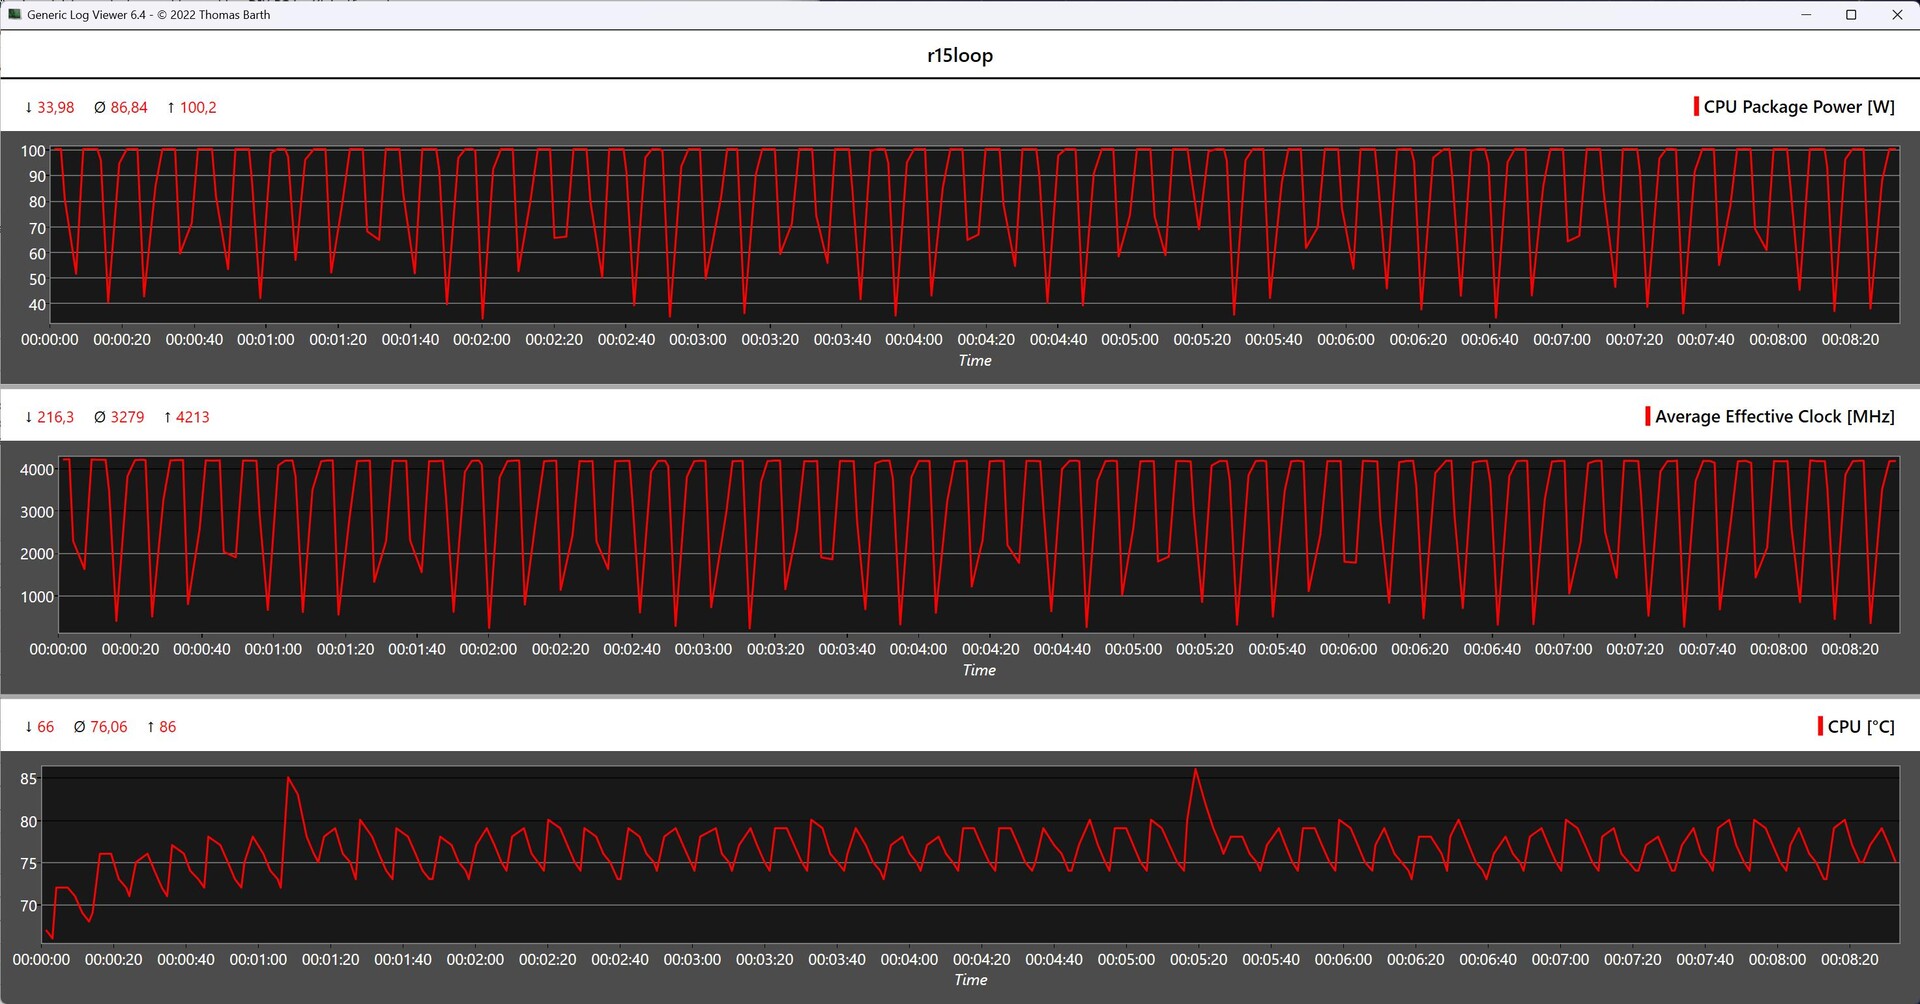
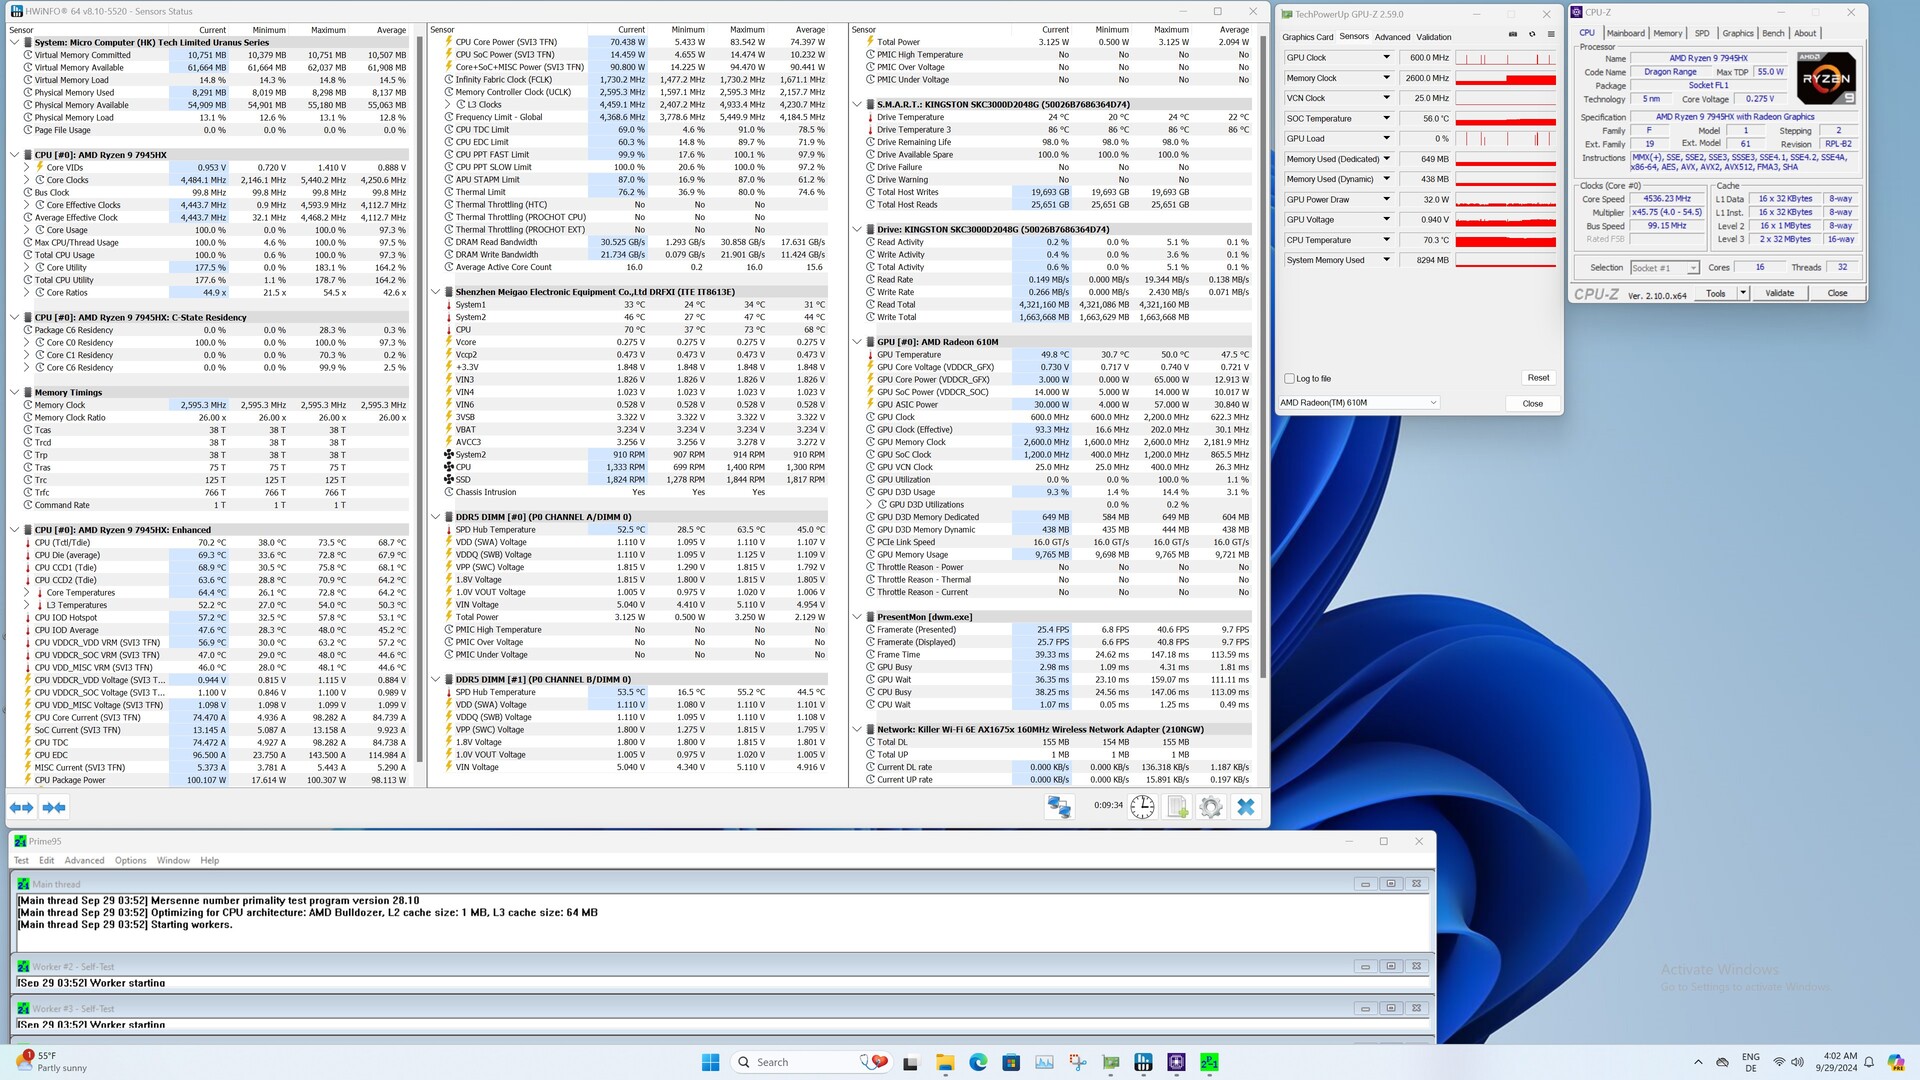
Risultati di Cinebench AMD Ryzen 9 7945HX
In combinazione con l'AMD Ryzen 9 7945HX, la scheda madre Minisforum BD790i ha padroneggiato il ciclo continuo di Cinebench R15 in modo eccellente. Le prestazioni dei 16 core sono rimaste stabili per tutti i 50 cicli, il che significa che non c'è da aspettarsi una perdita di prestazioni sotto carico continuo. Il raffreddatore installato in fabbrica si è comportato bene in questo test.
Prestazioni del sistema
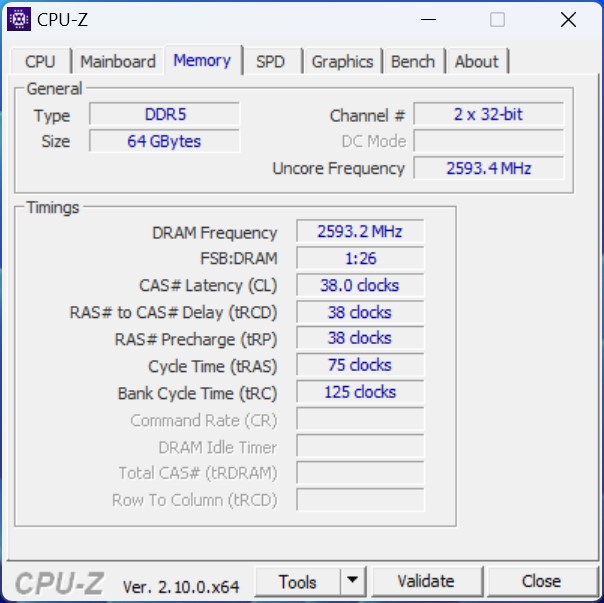
Il sistema di prova basato su Minisforum BD790i non è sempre riuscito a tenere il passo con i suoi concorrenti durante i benchmark delle prestazioni del sistema. Tuttavia, le prestazioni del sistema erano generalmente piuttosto elevate. Il potente e allo stesso tempo relativamente frugale AMD Ryzen 9 7945HX non mostra debolezze durante l'uso quotidiano. La combinazione del suo veloce SSD NVMe e della RAM DDR5 le consente di avere un margine di manovra sufficiente per gestire anche i compiti più impegnativi dal punto di vista energetico.
| Performance Rating - Percent | |
| AMD Ryzen 9 7950X3D, NVIDIA GeForce RTX 4090 -1! | |
| AMD Ryzen 9 7950X, NVIDIA GeForce RTX 3090 | |
| AMD Ryzen 9 7900X, NVIDIA GeForce RTX 3090 | |
| Intel Core i9-14900K, NVIDIA GeForce RTX 4090 | |
| AMD Ryzen 5 7600X, NVIDIA GeForce RTX 3090 | |
| Intel Core i9-13900K, NVIDIA GeForce RTX 3090 | |
| Intel Core i5-13600K, NVIDIA GeForce RTX 3090 | |
| Intel Core i5-14600K, NVIDIA GeForce RTX 4090 | |
| AMD Ryzen 7 7800X3D, NVIDIA GeForce RTX 4090 | |
| AMD Ryzen 9 5950X, NVIDIA Titan RTX | |
| Intel Core i9-12900K, NVIDIA Titan RTX | |
| Intel Core i5-13400, NVIDIA GeForce RTX 4090 | |
| AMD Ryzen 9 7945HX, AMD Radeon 610M | |
| Intel Core i5-12600K, NVIDIA Titan RTX | |
| AMD Ryzen 7 7745HX, AMD Radeon 610M | |
| AMD Ryzen 7 7840HS, AMD Radeon 780M | |
| AMD Ryzen 9 7940HS, AMD Radeon 780M | |
| Intel Core i5-12400F, NVIDIA GeForce RTX 4090 | |
| CrossMark / Overall | |
| Intel Core i9-14900K, NVIDIA GeForce RTX 4090 | |
| Intel Core i9-13900K, NVIDIA GeForce RTX 3090 | |
| AMD Ryzen 9 7950X, NVIDIA GeForce RTX 3090 | |
| AMD Ryzen 9 7900X, NVIDIA GeForce RTX 3090 | |
| Intel Core i5-14600K, NVIDIA GeForce RTX 4090 | |
| Intel Core i5-13600K, NVIDIA GeForce RTX 3090 | |
| AMD Ryzen 9 7945HX, AMD Radeon 610M | |
| AMD Ryzen 5 7600X, NVIDIA GeForce RTX 3090 | |
| AMD Ryzen 7 7800X3D, NVIDIA GeForce RTX 4090 | |
| AMD Ryzen 9 7950X3D, NVIDIA GeForce RTX 4090 | |
| AMD Ryzen 7 7745HX, AMD Radeon 610M | |
| Intel Core i5-13400, NVIDIA GeForce RTX 4090 | |
| Intel Core i5-12400F, NVIDIA GeForce RTX 4090 | |
| AMD Ryzen 7 7840HS, AMD Radeon 780M | |
| AMD Ryzen 9 7940HS, AMD Radeon 780M | |
| AMD Ryzen 9 5950X, NVIDIA Titan RTX | |
| CrossMark / Productivity | |
| Intel Core i9-14900K, NVIDIA GeForce RTX 4090 | |
| Intel Core i9-13900K, NVIDIA GeForce RTX 3090 | |
| AMD Ryzen 9 7950X, NVIDIA GeForce RTX 3090 | |
| AMD Ryzen 9 7900X, NVIDIA GeForce RTX 3090 | |
| Intel Core i5-14600K, NVIDIA GeForce RTX 4090 | |
| Intel Core i5-13600K, NVIDIA GeForce RTX 3090 | |
| AMD Ryzen 5 7600X, NVIDIA GeForce RTX 3090 | |
| AMD Ryzen 9 7945HX, AMD Radeon 610M | |
| AMD Ryzen 7 7800X3D, NVIDIA GeForce RTX 4090 | |
| AMD Ryzen 7 7745HX, AMD Radeon 610M | |
| AMD Ryzen 9 7950X3D, NVIDIA GeForce RTX 4090 | |
| Intel Core i5-13400, NVIDIA GeForce RTX 4090 | |
| AMD Ryzen 9 7940HS, AMD Radeon 780M | |
| Intel Core i5-12400F, NVIDIA GeForce RTX 4090 | |
| AMD Ryzen 7 7840HS, AMD Radeon 780M | |
| AMD Ryzen 9 5950X, NVIDIA Titan RTX | |
| CrossMark / Creativity | |
| Intel Core i9-14900K, NVIDIA GeForce RTX 4090 | |
| AMD Ryzen 9 7950X, NVIDIA GeForce RTX 3090 | |
| Intel Core i9-13900K, NVIDIA GeForce RTX 3090 | |
| AMD Ryzen 9 7900X, NVIDIA GeForce RTX 3090 | |
| Intel Core i5-14600K, NVIDIA GeForce RTX 4090 | |
| AMD Ryzen 9 7950X3D, NVIDIA GeForce RTX 4090 | |
| AMD Ryzen 9 7945HX, AMD Radeon 610M | |
| AMD Ryzen 7 7800X3D, NVIDIA GeForce RTX 4090 | |
| AMD Ryzen 5 7600X, NVIDIA GeForce RTX 3090 | |
| Intel Core i5-13600K, NVIDIA GeForce RTX 3090 | |
| AMD Ryzen 7 7745HX, AMD Radeon 610M | |
| AMD Ryzen 7 7840HS, AMD Radeon 780M | |
| Intel Core i5-13400, NVIDIA GeForce RTX 4090 | |
| AMD Ryzen 9 7940HS, AMD Radeon 780M | |
| Intel Core i5-12400F, NVIDIA GeForce RTX 4090 | |
| AMD Ryzen 9 5950X, NVIDIA Titan RTX | |
| CrossMark / Responsiveness | |
| Intel Core i9-13900K, NVIDIA GeForce RTX 3090 | |
| Intel Core i9-14900K, NVIDIA GeForce RTX 4090 | |
| Intel Core i5-13600K, NVIDIA GeForce RTX 3090 | |
| AMD Ryzen 9 7950X, NVIDIA GeForce RTX 3090 | |
| AMD Ryzen 9 7900X, NVIDIA GeForce RTX 3090 | |
| AMD Ryzen 5 7600X, NVIDIA GeForce RTX 3090 | |
| Intel Core i5-14600K, NVIDIA GeForce RTX 4090 | |
| AMD Ryzen 7 7800X3D, NVIDIA GeForce RTX 4090 | |
| AMD Ryzen 9 7945HX, AMD Radeon 610M | |
| AMD Ryzen 7 7745HX, AMD Radeon 610M | |
| Intel Core i5-13400, NVIDIA GeForce RTX 4090 | |
| Intel Core i5-12400F, NVIDIA GeForce RTX 4090 | |
| AMD Ryzen 9 7950X3D, NVIDIA GeForce RTX 4090 | |
| AMD Ryzen 9 7940HS, AMD Radeon 780M | |
| AMD Ryzen 7 7840HS, AMD Radeon 780M | |
| AMD Ryzen 9 5950X, NVIDIA Titan RTX | |
| AIDA64 / Memory Copy | |
| Intel Core i9-14900K, NVIDIA GeForce RTX 4090 | |
| Intel Core i5-14600K, NVIDIA GeForce RTX 4090 | |
| Intel Core i9-13900K, NVIDIA GeForce RTX 3090 | |
| AMD Ryzen 9 7950X3D, NVIDIA GeForce RTX 4090 | |
| Intel Core i9-12900K, NVIDIA Titan RTX | |
| AMD Ryzen 9 7950X, NVIDIA GeForce RTX 3090 | |
| Intel Core i5-13400, NVIDIA GeForce RTX 4090 | |
| Intel Core i5-13600K, NVIDIA GeForce RTX 3090 | |
| Intel Core i5-12400F, NVIDIA GeForce RTX 4090 | |
| Intel Core i5-12600K, NVIDIA Titan RTX | |
| AMD Ryzen 9 7900X, NVIDIA GeForce RTX 3090 | |
| AMD Ryzen 7 7840HS, AMD Radeon 780M | |
| Media della classe Desktop (43747 - 88386, n=12, ultimi 2 anni) | |
| AMD Ryzen 7 7800X3D, NVIDIA GeForce RTX 4090 | |
| AMD Ryzen 9 7940HS, AMD Radeon 780M | |
| AMD Ryzen 5 7600X, NVIDIA GeForce RTX 3090 | |
| AMD Ryzen 9 5950X, NVIDIA Titan RTX | |
| AMD Ryzen 9 7945HX, AMD Radeon 610M | |
| AMD Ryzen 7 7745HX, AMD Radeon 610M | |
| Media AMD Ryzen 9 7945HX (48948 - 57953, n=5) | |
| AIDA64 / Memory Read | |
| Intel Core i9-14900K, NVIDIA GeForce RTX 4090 | |
| Intel Core i5-14600K, NVIDIA GeForce RTX 4090 | |
| Intel Core i9-13900K, NVIDIA GeForce RTX 3090 | |
| Intel Core i9-12900K, NVIDIA Titan RTX | |
| AMD Ryzen 9 7950X3D, NVIDIA GeForce RTX 4090 | |
| AMD Ryzen 9 7950X, NVIDIA GeForce RTX 3090 | |
| Intel Core i5-13400, NVIDIA GeForce RTX 4090 | |
| Intel Core i5-12600K, NVIDIA Titan RTX | |
| Intel Core i5-13600K, NVIDIA GeForce RTX 3090 | |
| AMD Ryzen 9 7900X, NVIDIA GeForce RTX 3090 | |
| Intel Core i5-12400F, NVIDIA GeForce RTX 4090 | |
| Media della classe Desktop (47347 - 94830, n=12, ultimi 2 anni) | |
| AMD Ryzen 9 7945HX, AMD Radeon 610M | |
| AMD Ryzen 9 5950X, NVIDIA Titan RTX | |
| AMD Ryzen 7 7800X3D, NVIDIA GeForce RTX 4090 | |
| Media AMD Ryzen 9 7945HX (59620 - 67753, n=5) | |
| AMD Ryzen 7 7840HS, AMD Radeon 780M | |
| AMD Ryzen 9 7940HS, AMD Radeon 780M | |
| AMD Ryzen 5 7600X, NVIDIA GeForce RTX 3090 | |
| AMD Ryzen 7 7745HX, AMD Radeon 610M | |
| AIDA64 / Memory Write | |
| AMD Ryzen 7 7800X3D, NVIDIA GeForce RTX 4090 | |
| AMD Ryzen 7 7840HS, AMD Radeon 780M | |
| AMD Ryzen 9 7950X3D, NVIDIA GeForce RTX 4090 | |
| Intel Core i5-14600K, NVIDIA GeForce RTX 4090 | |
| Intel Core i9-14900K, NVIDIA GeForce RTX 4090 | |
| AMD Ryzen 5 7600X, NVIDIA GeForce RTX 3090 | |
| AMD Ryzen 9 7950X, NVIDIA GeForce RTX 3090 | |
| AMD Ryzen 9 7940HS, AMD Radeon 780M | |
| AMD Ryzen 9 7900X, NVIDIA GeForce RTX 3090 | |
| Media della classe Desktop (46768 - 84869, n=12, ultimi 2 anni) | |
| Intel Core i9-13900K, NVIDIA GeForce RTX 3090 | |
| Intel Core i5-13400, NVIDIA GeForce RTX 4090 | |
| Intel Core i5-12600K, NVIDIA Titan RTX | |
| Intel Core i5-12400F, NVIDIA GeForce RTX 4090 | |
| Intel Core i9-12900K, NVIDIA Titan RTX | |
| Intel Core i5-13600K, NVIDIA GeForce RTX 3090 | |
| AMD Ryzen 7 7745HX, AMD Radeon 610M | |
| AMD Ryzen 9 7945HX, AMD Radeon 610M | |
| Media AMD Ryzen 9 7945HX (58602 - 70063, n=5) | |
| AMD Ryzen 9 5950X, NVIDIA Titan RTX | |
| AIDA64 / Memory Latency | |
| AMD Ryzen 7 7840HS, AMD Radeon 780M | |
| AMD Ryzen 9 7940HS, AMD Radeon 780M | |
| Media AMD Ryzen 9 7945HX (77.1 - 91.3, n=5) | |
| Intel Core i5-13600K, NVIDIA GeForce RTX 3090 | |
| AMD Ryzen 7 7745HX, AMD Radeon 610M | |
| Intel Core i5-12400F, NVIDIA GeForce RTX 4090 | |
| Intel Core i5-13400, NVIDIA GeForce RTX 4090 | |
| AMD Ryzen 9 7945HX, AMD Radeon 610M | |
| Intel Core i9-13900K, NVIDIA GeForce RTX 3090 | |
| Media della classe Desktop (64.3 - 90.3, n=12, ultimi 2 anni) | |
| Intel Core i9-14900K, NVIDIA GeForce RTX 4090 | |
| Intel Core i5-14600K, NVIDIA GeForce RTX 4090 | |
| AMD Ryzen 7 7800X3D, NVIDIA GeForce RTX 4090 | |
| AMD Ryzen 9 5950X, NVIDIA Titan RTX | |
| AMD Ryzen 9 7950X3D, NVIDIA GeForce RTX 4090 | |
| AMD Ryzen 5 7600X, NVIDIA GeForce RTX 3090 | |
| AMD Ryzen 9 7900X, NVIDIA GeForce RTX 3090 | |
| AMD Ryzen 9 7950X, NVIDIA GeForce RTX 3090 | |
* ... Meglio usare valori piccoli
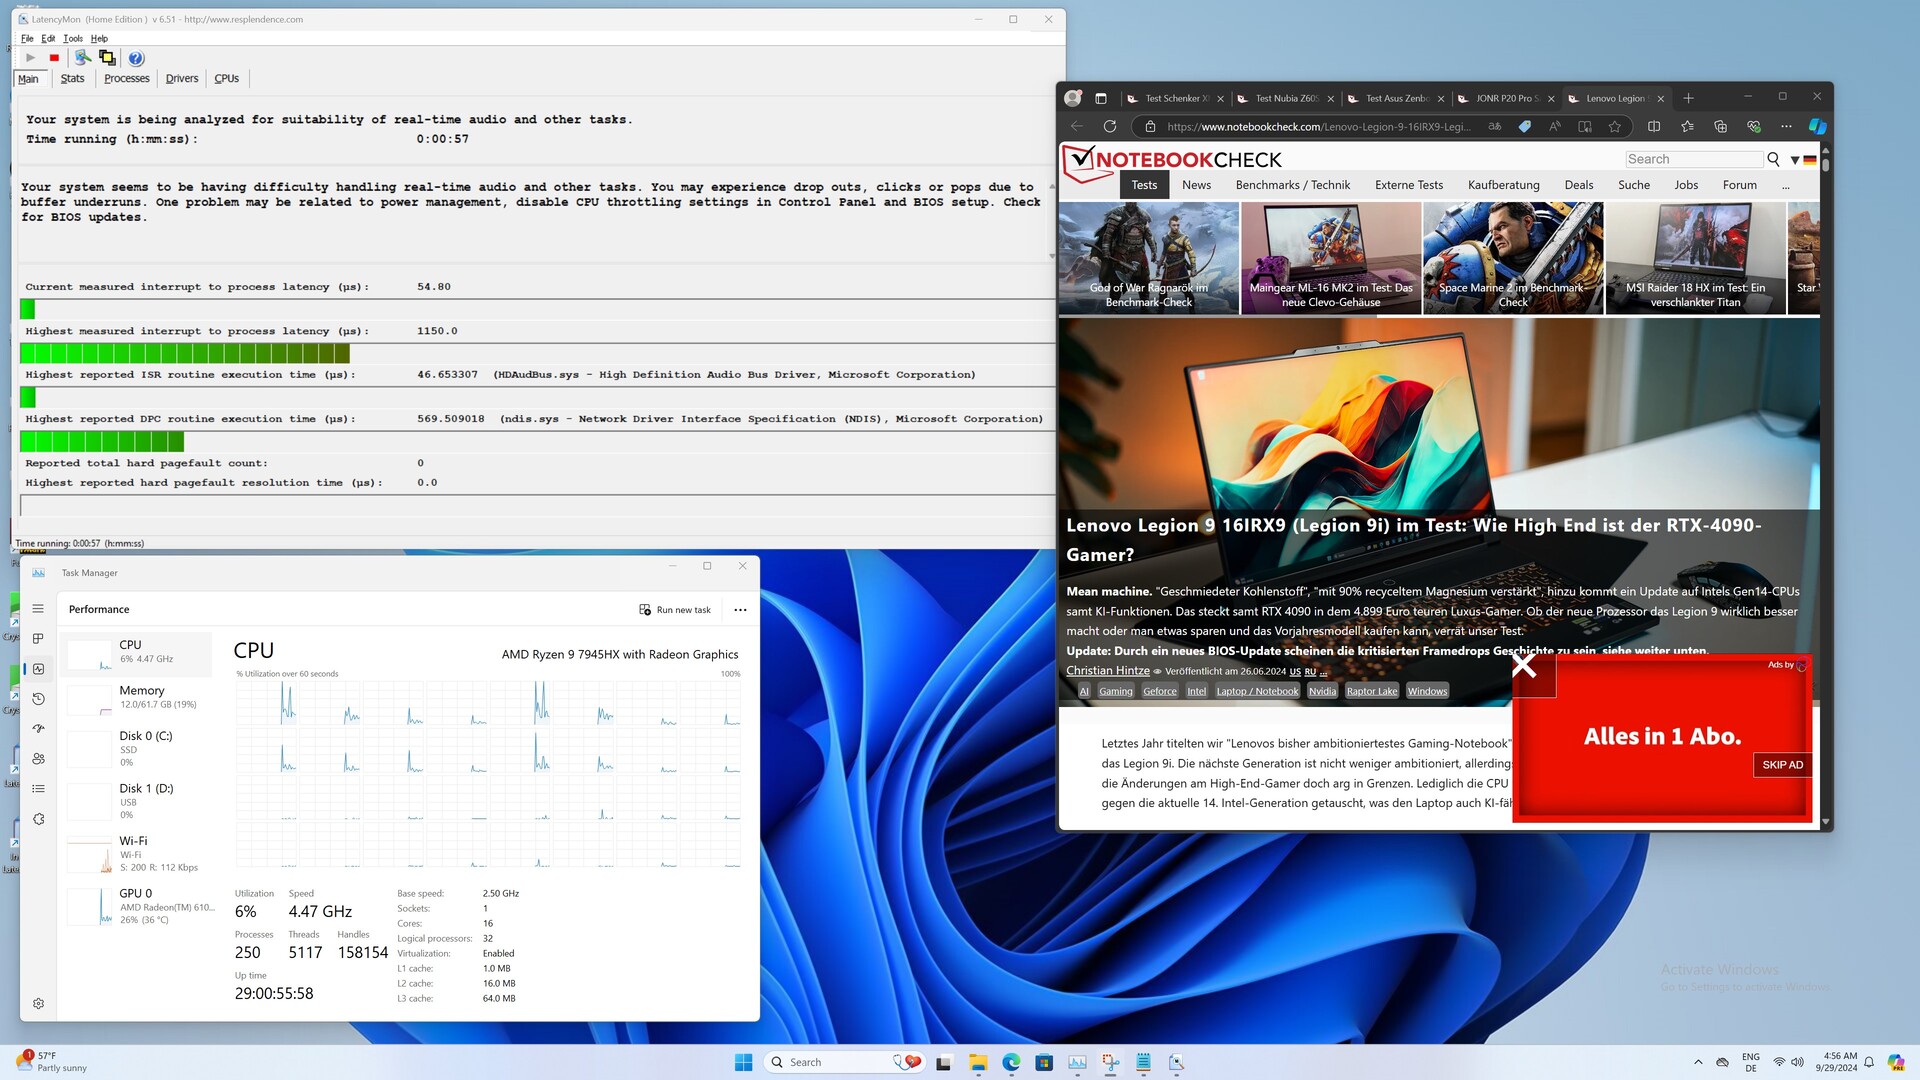
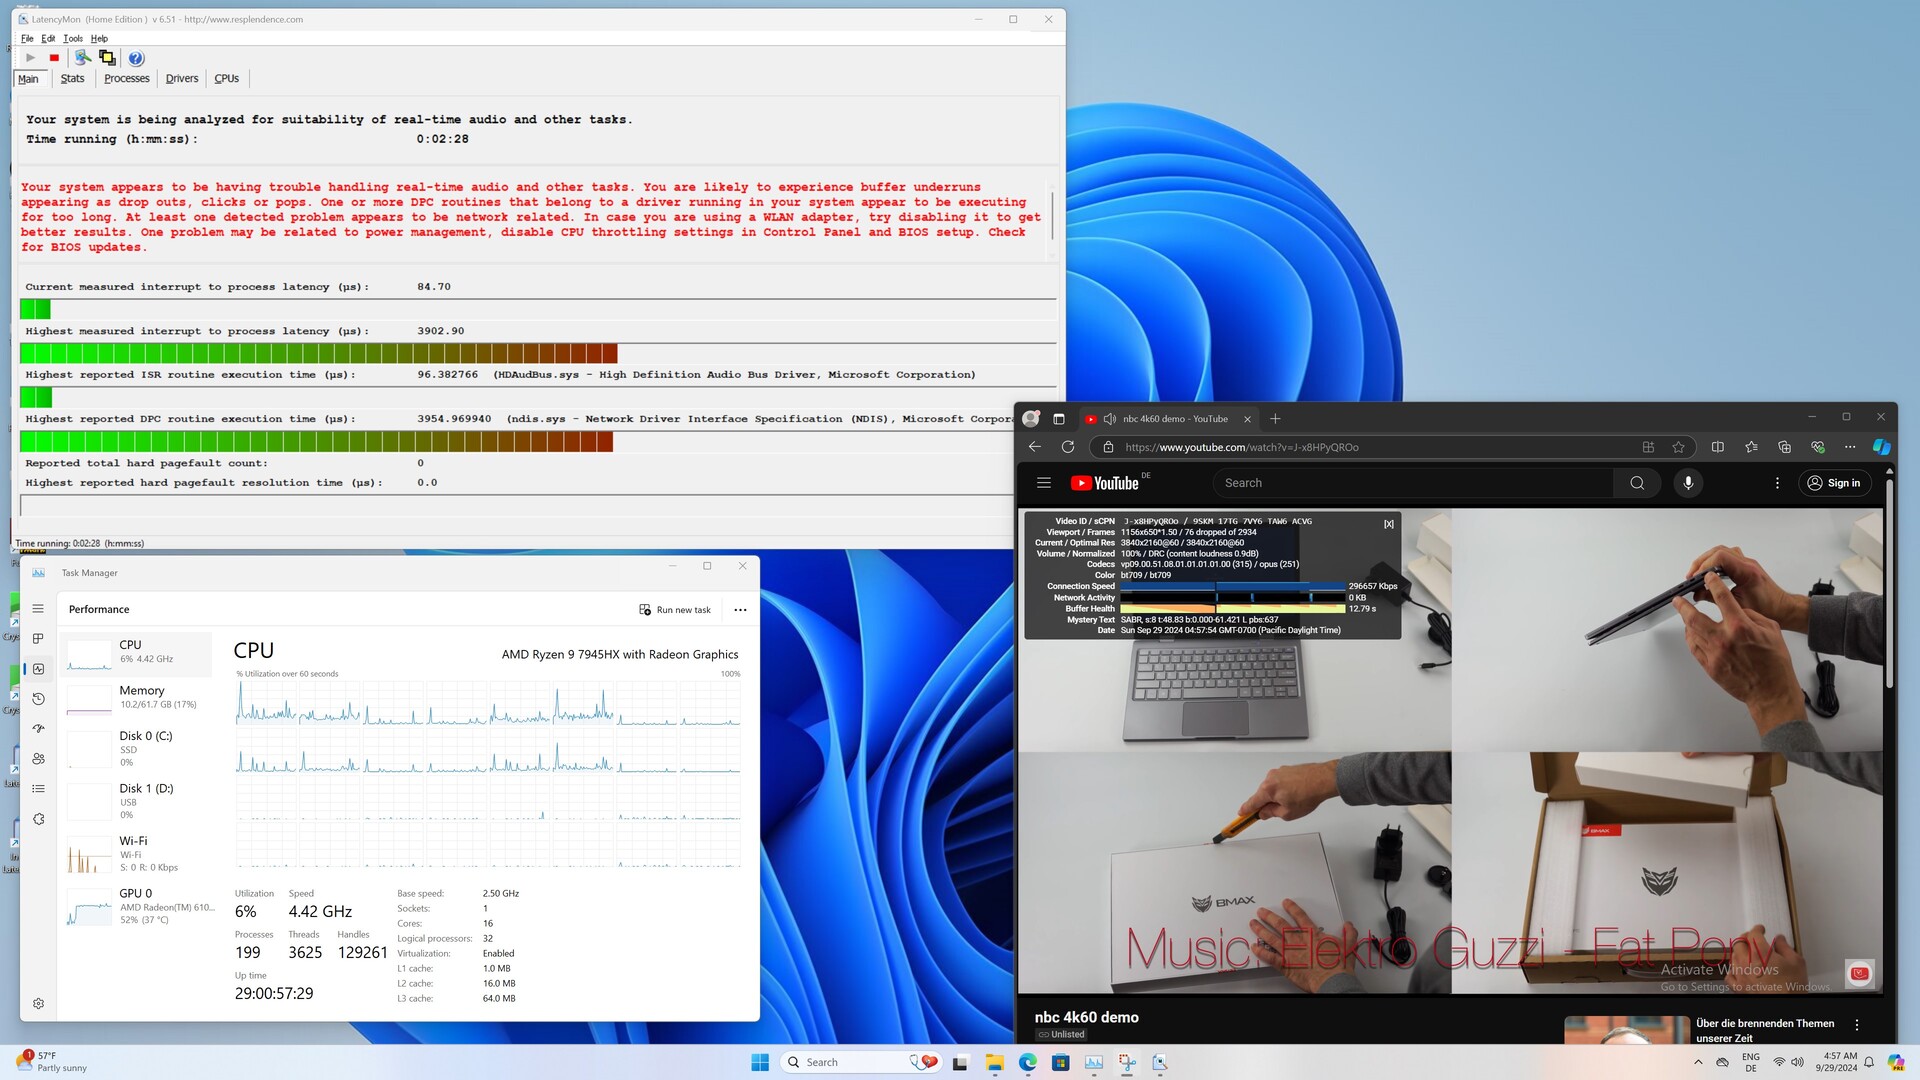
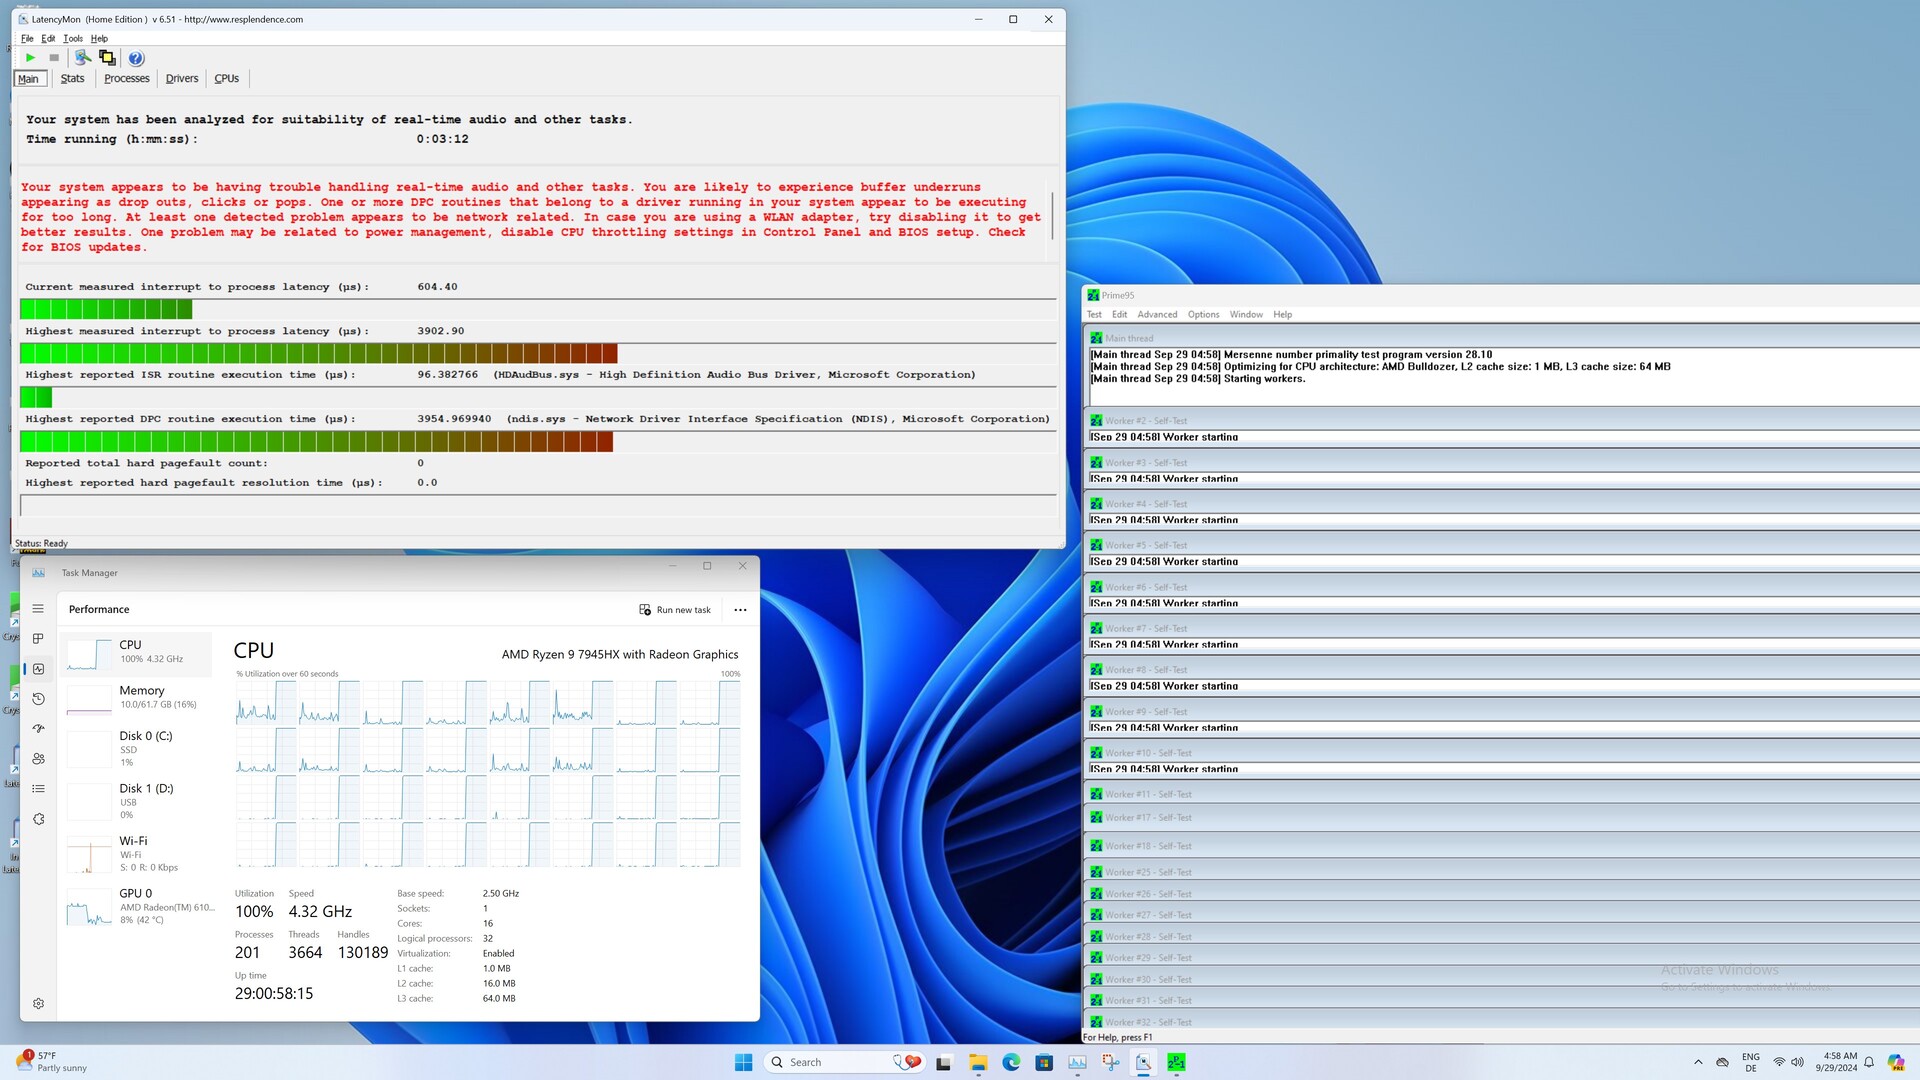
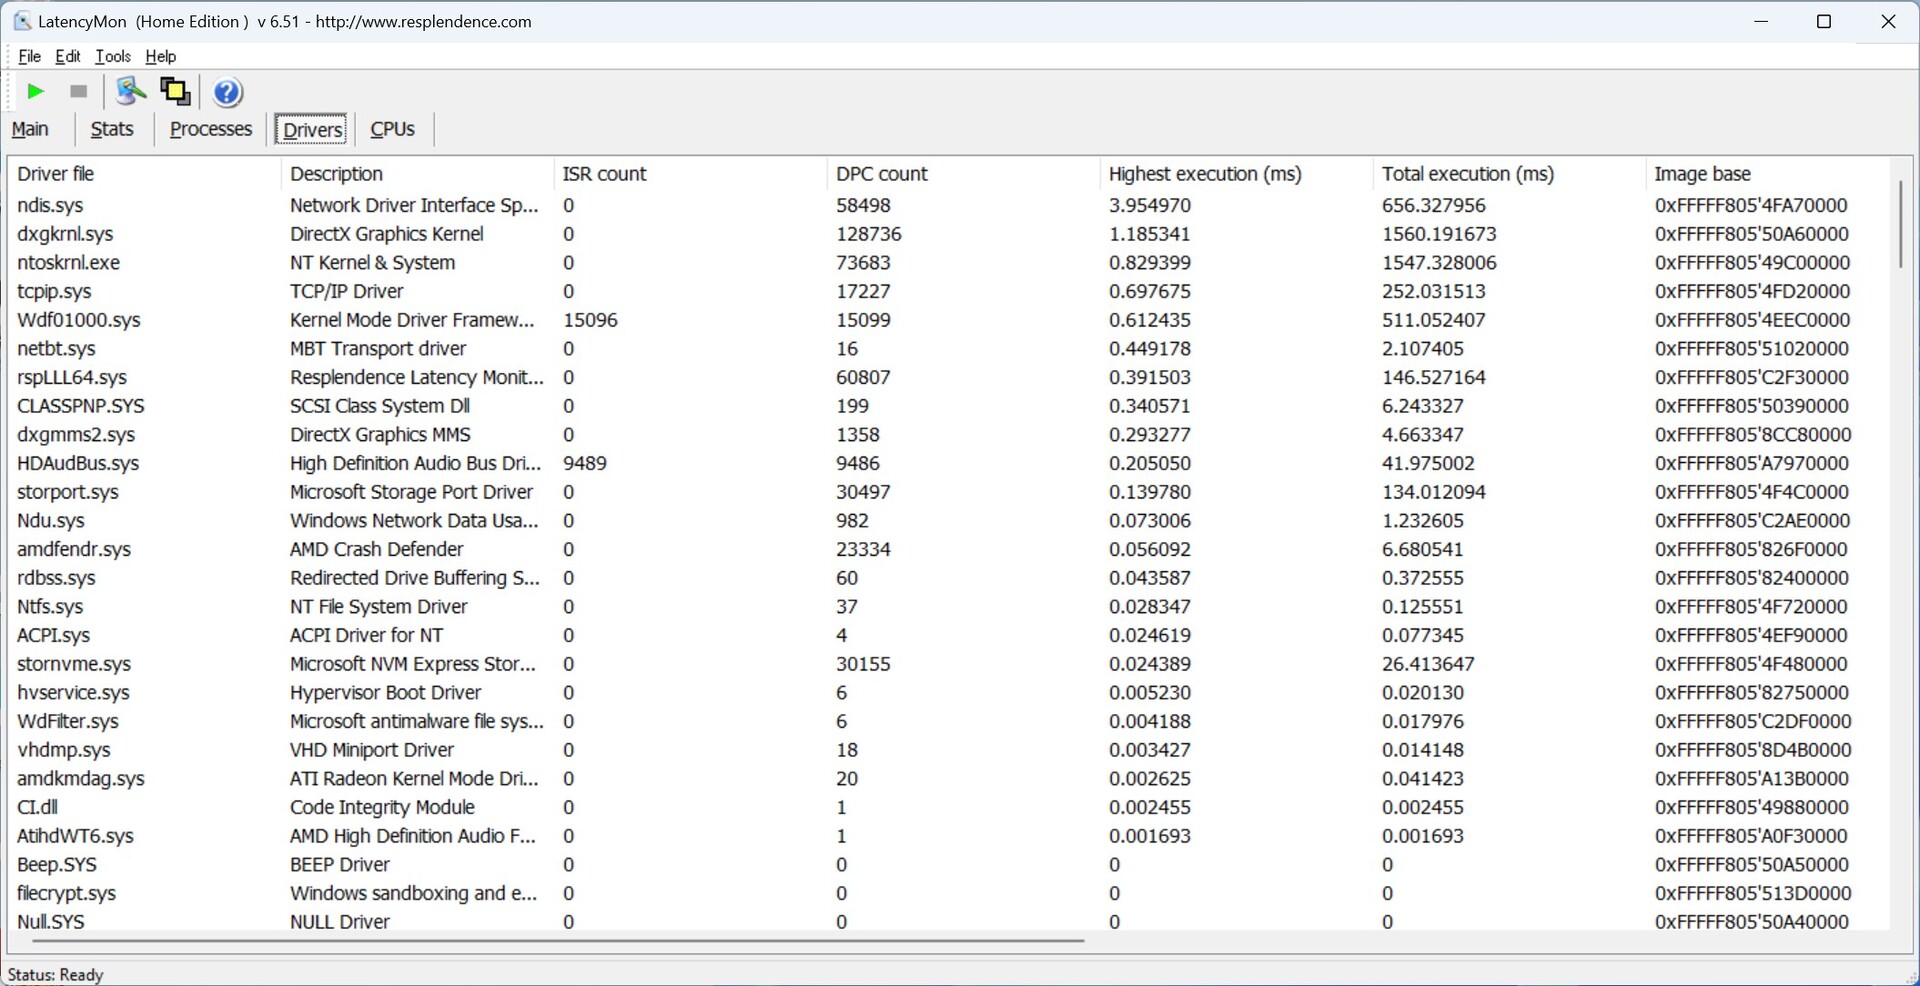
Latenze DPC
Abbiamo registrato latenze relativamente elevate nel nostro sistema di prova basato sul Minisforum BD790i. Abbiamo documentato un aumento dei valori anche durante la semplice navigazione sul web. Questi sono aumentati ulteriormente durante la riproduzione del video di prova 4K, il che significa che il sistema non sembra essere adatto all'elaborazione di materiale video e audio in tempo reale in questa configurazione.
| DPC Latencies / LatencyMon - interrupt to process latency (max), Web, Youtube, Prime95 | |
| Minisforum BD790i | |
| Minisforum EliteMini UM780 XTX | |
| Minisforum Venus Series UM790 Pro | |
| Minisforum BD770i | |
* ... Meglio usare valori piccoli
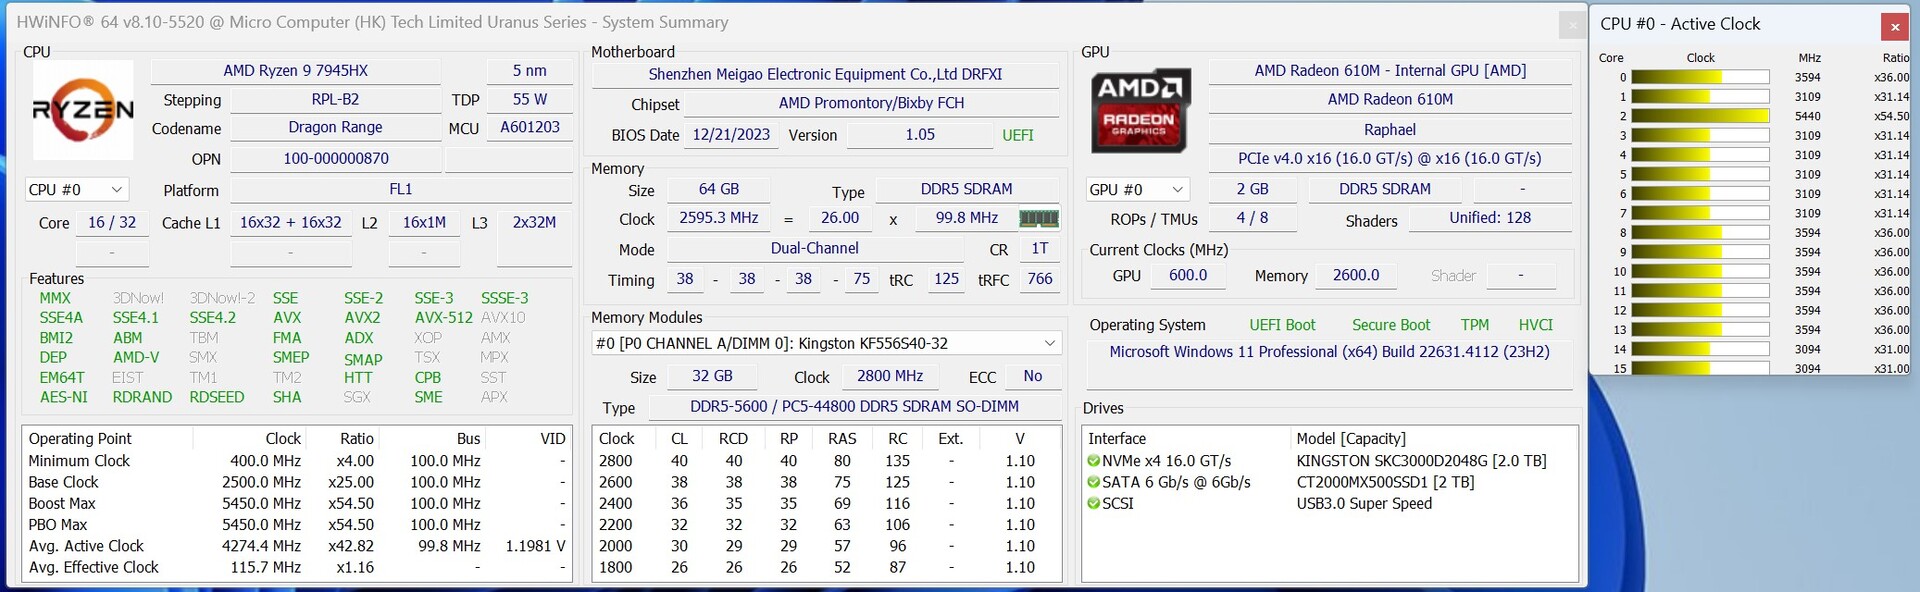
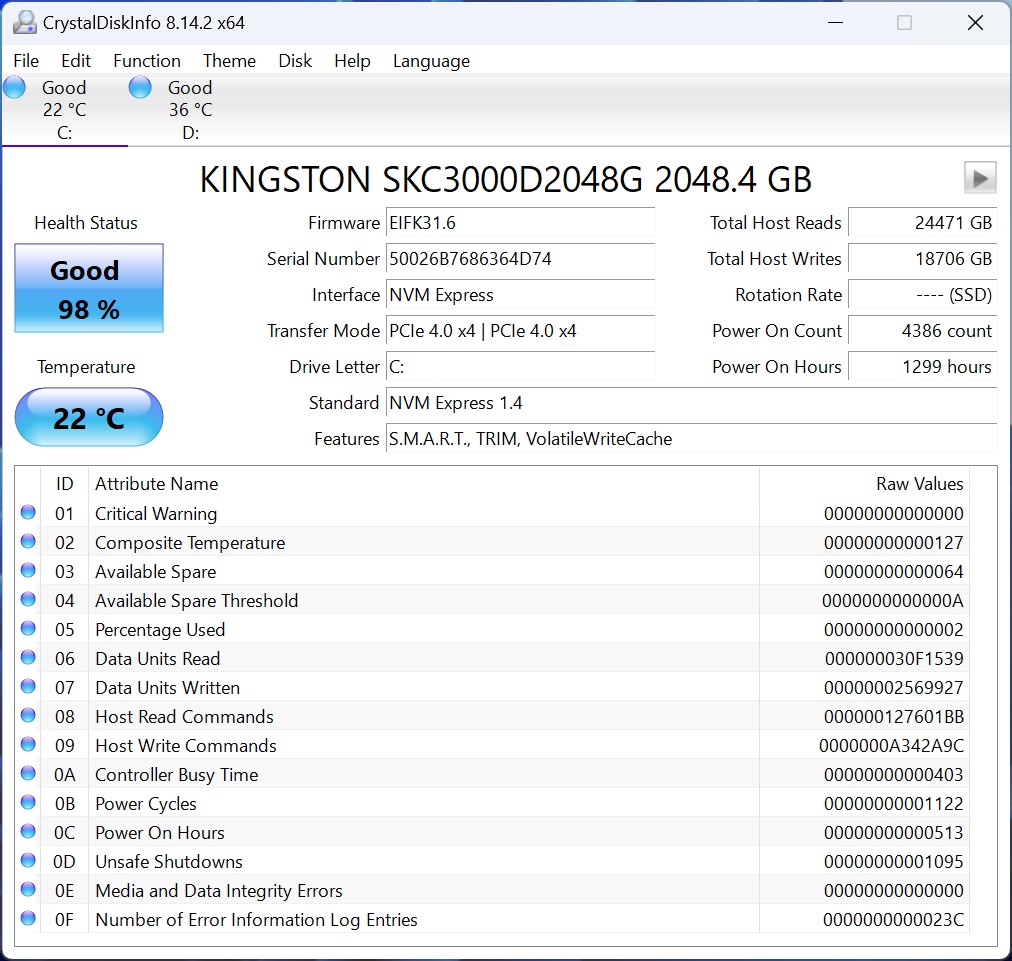
Dispositivi di archiviazione
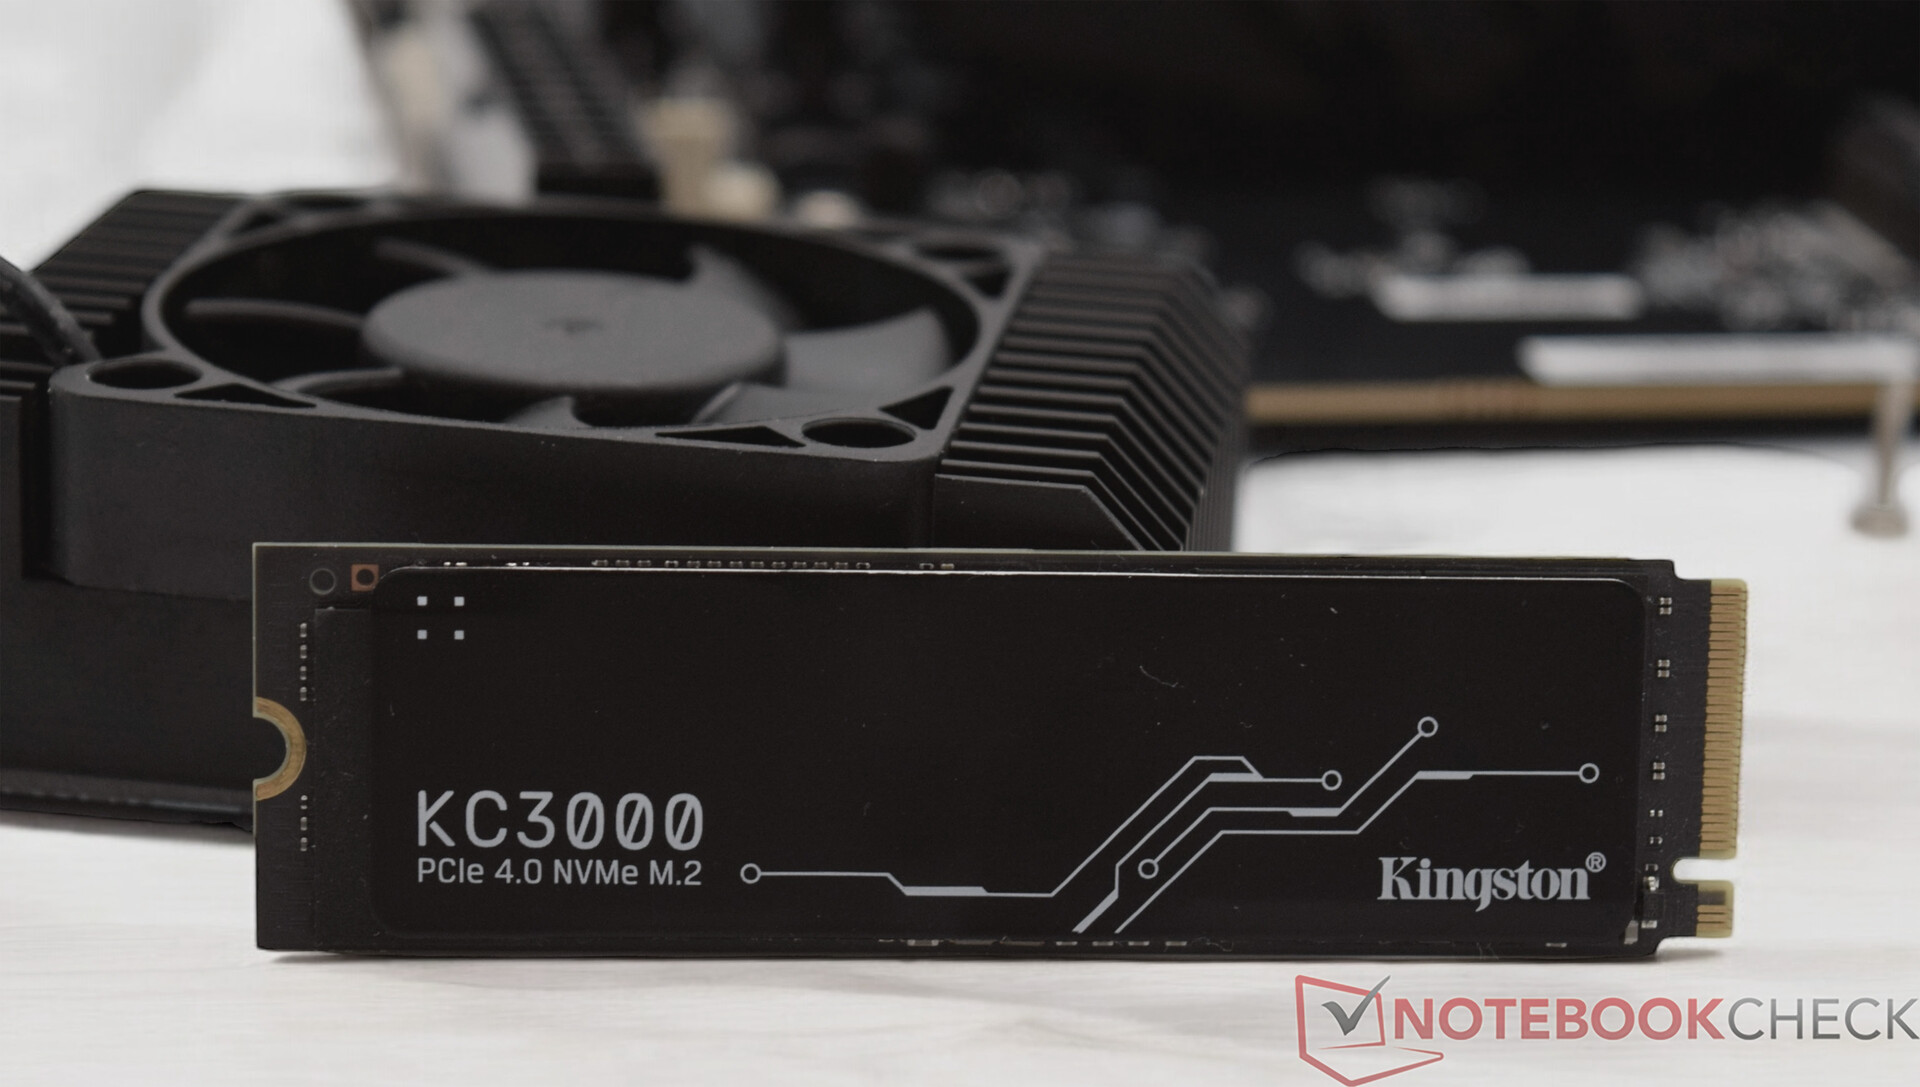
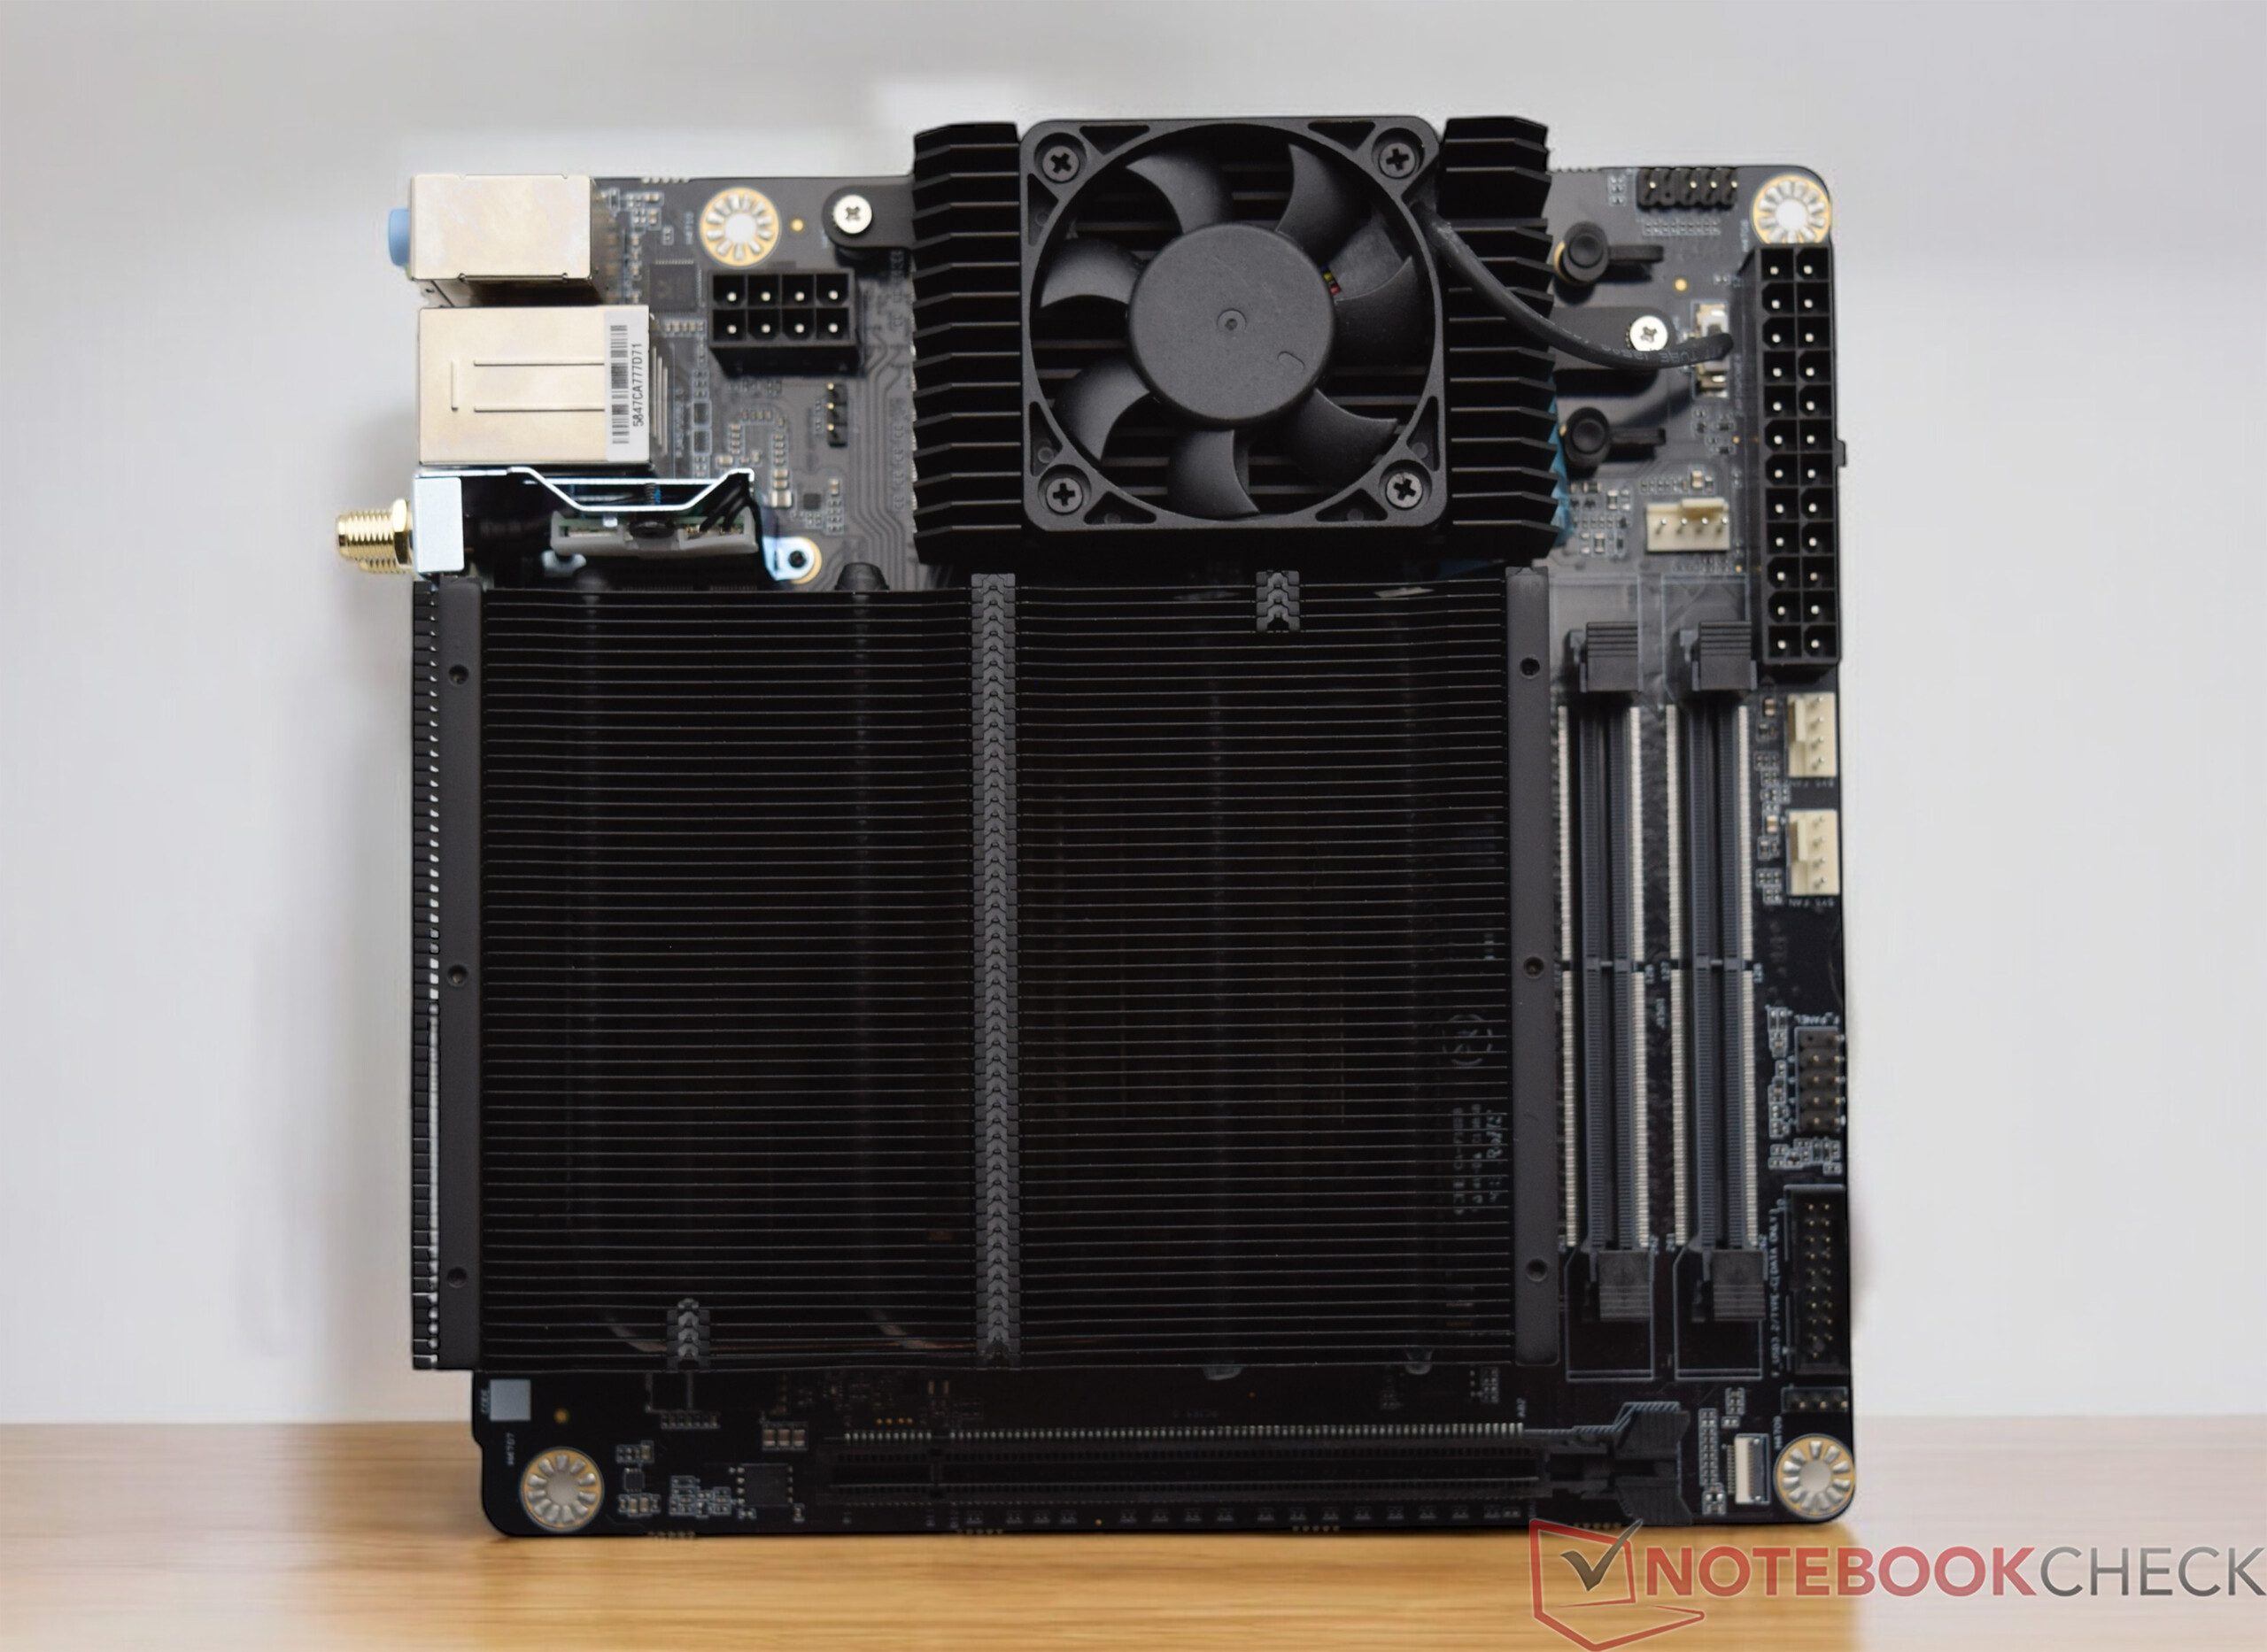
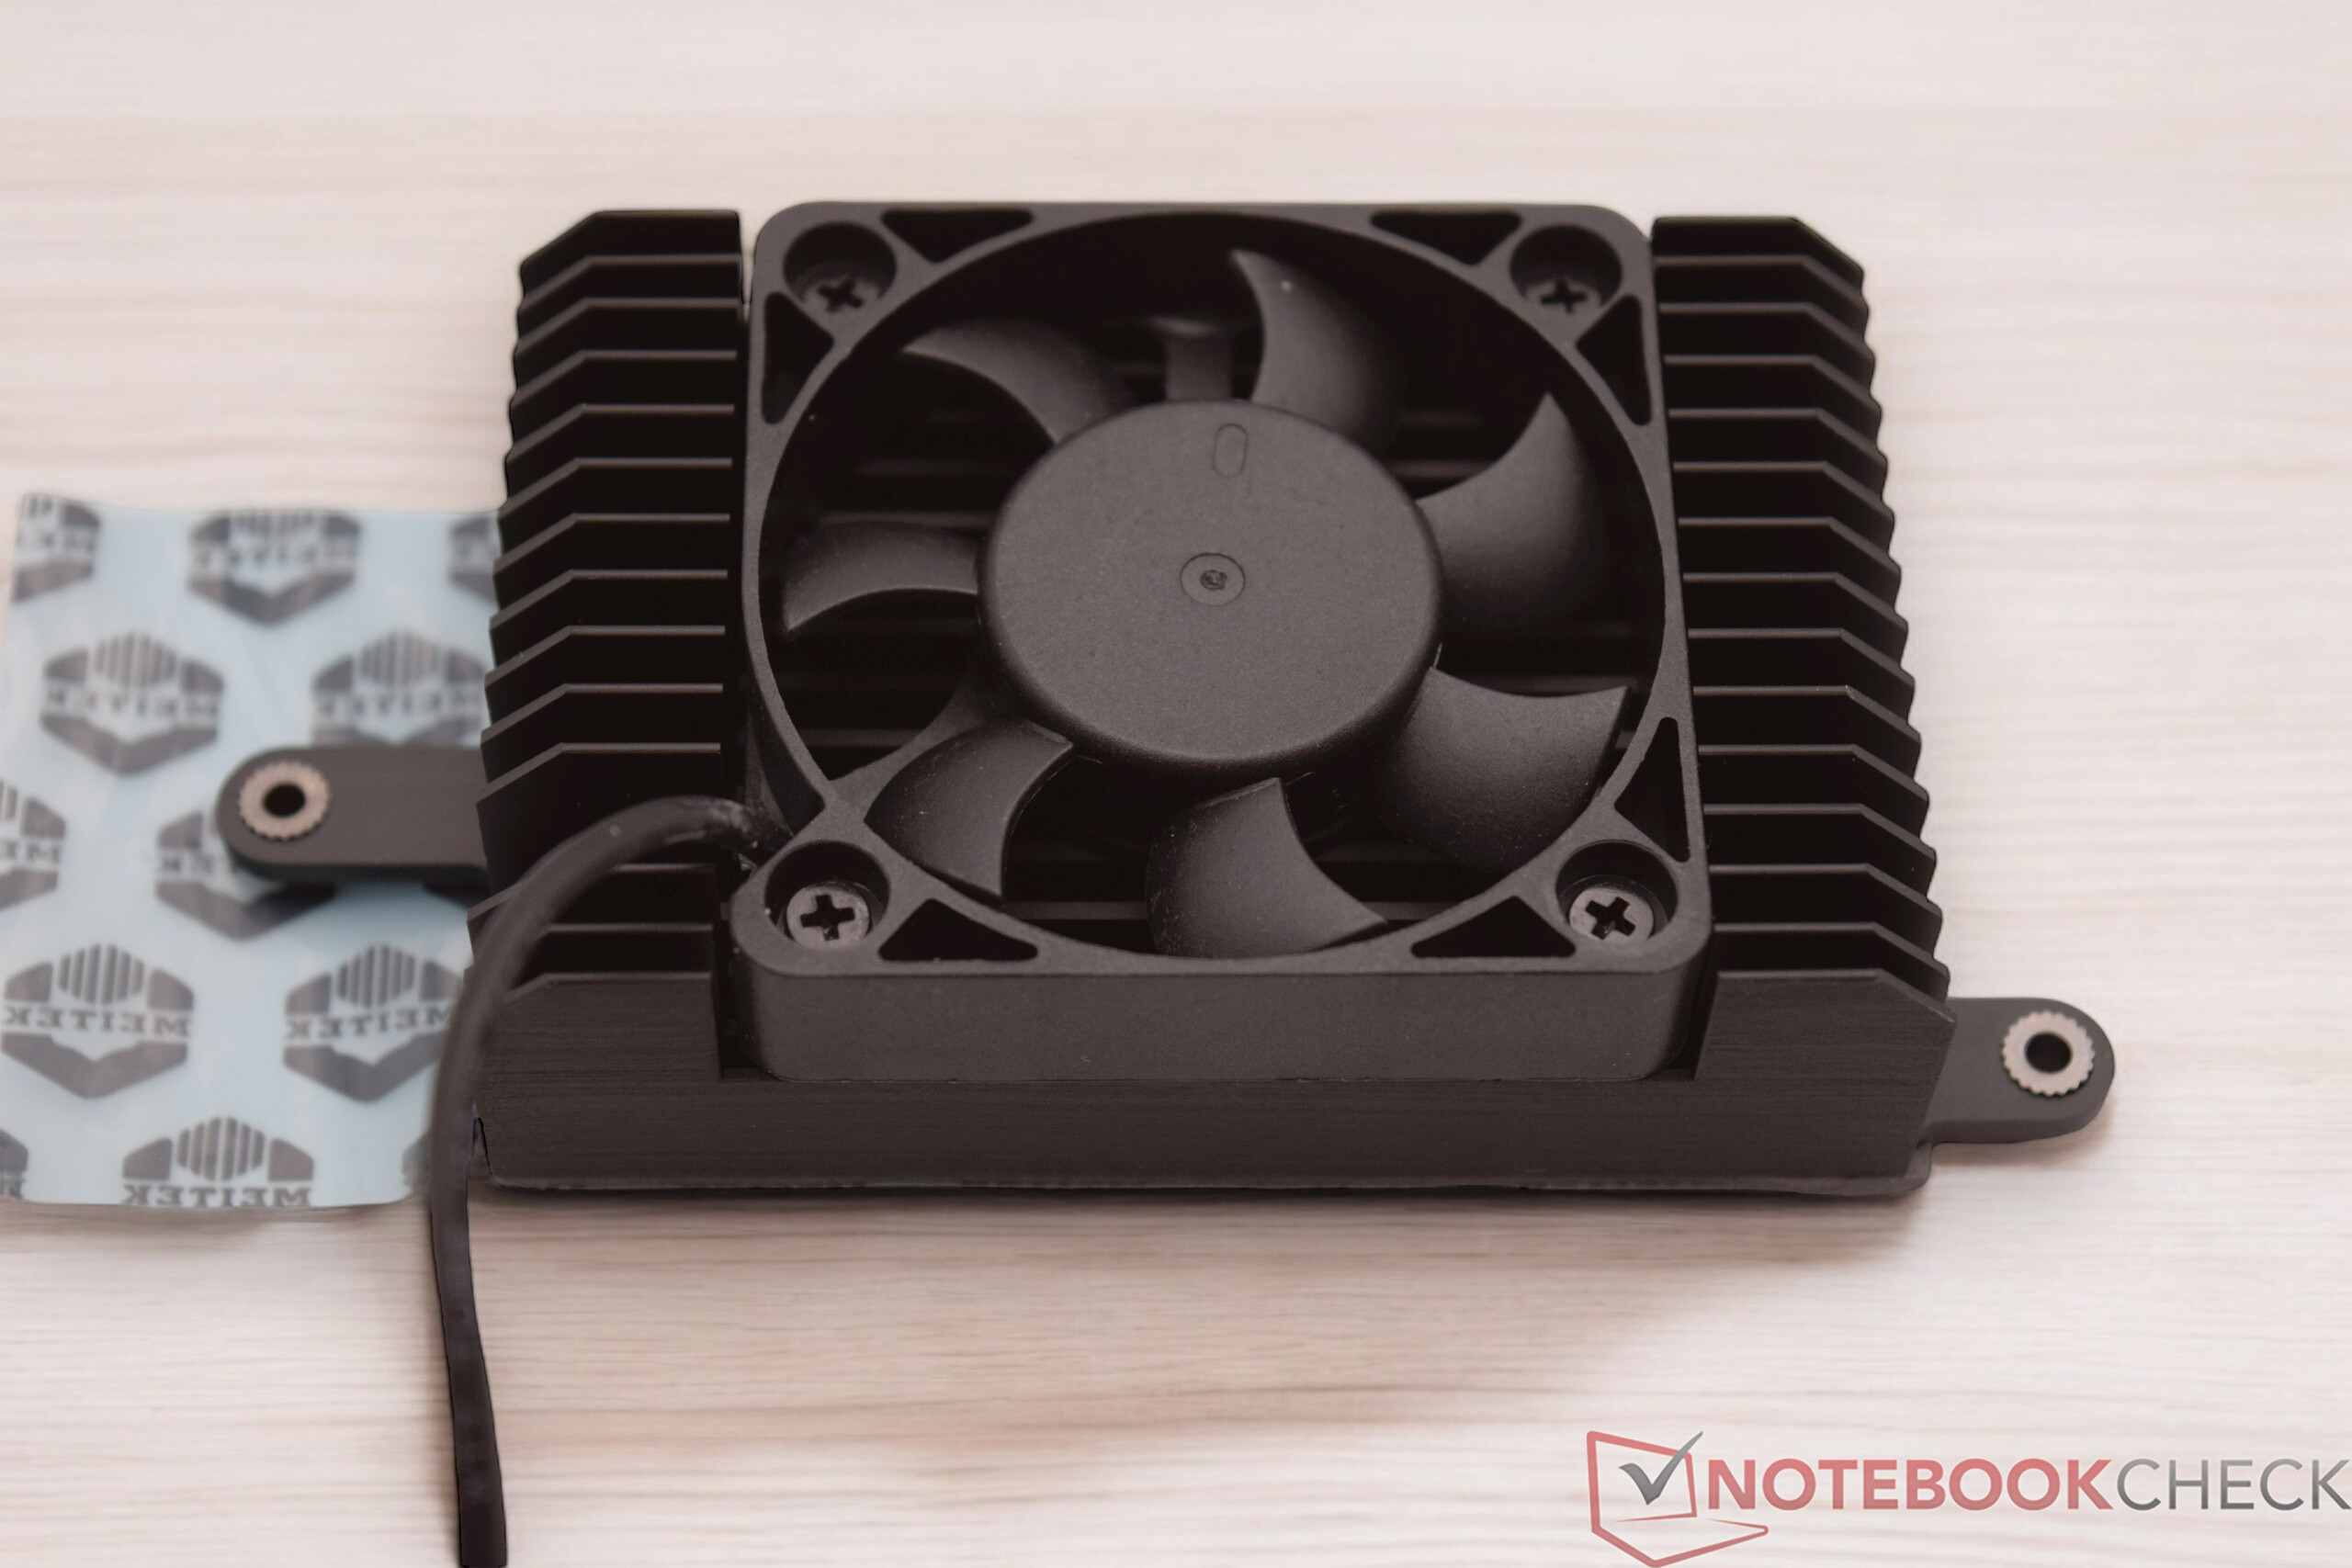
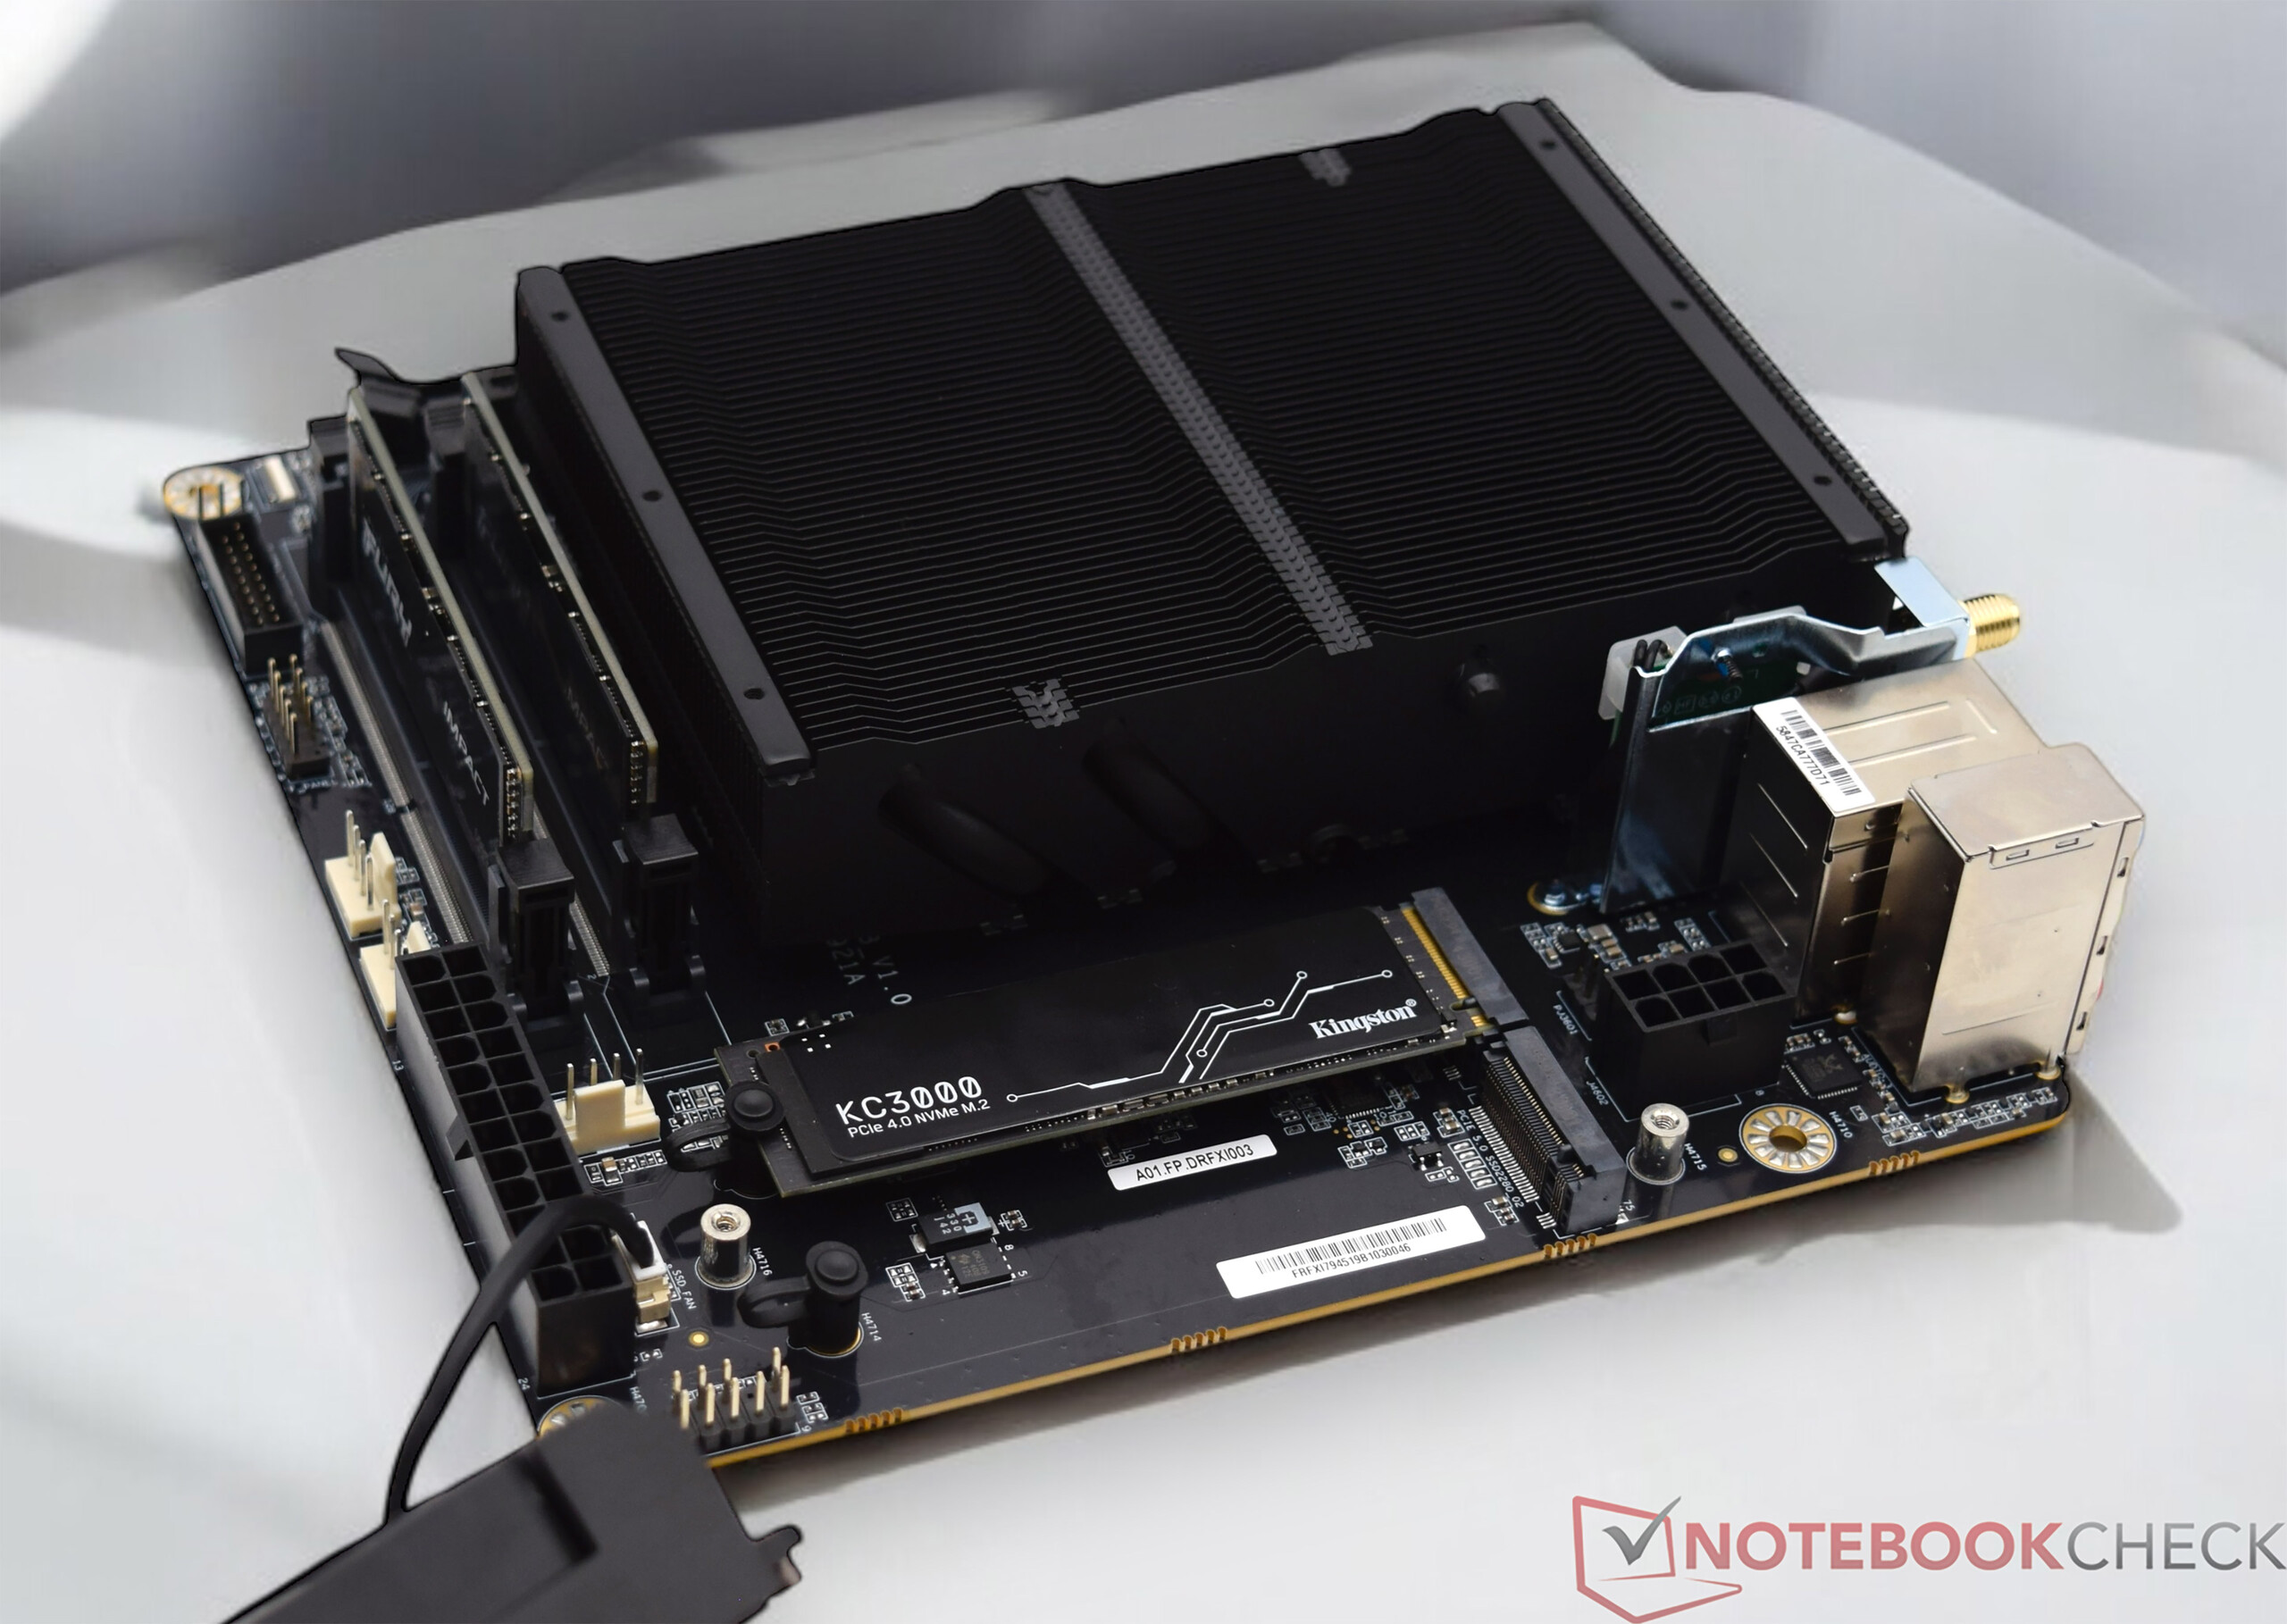
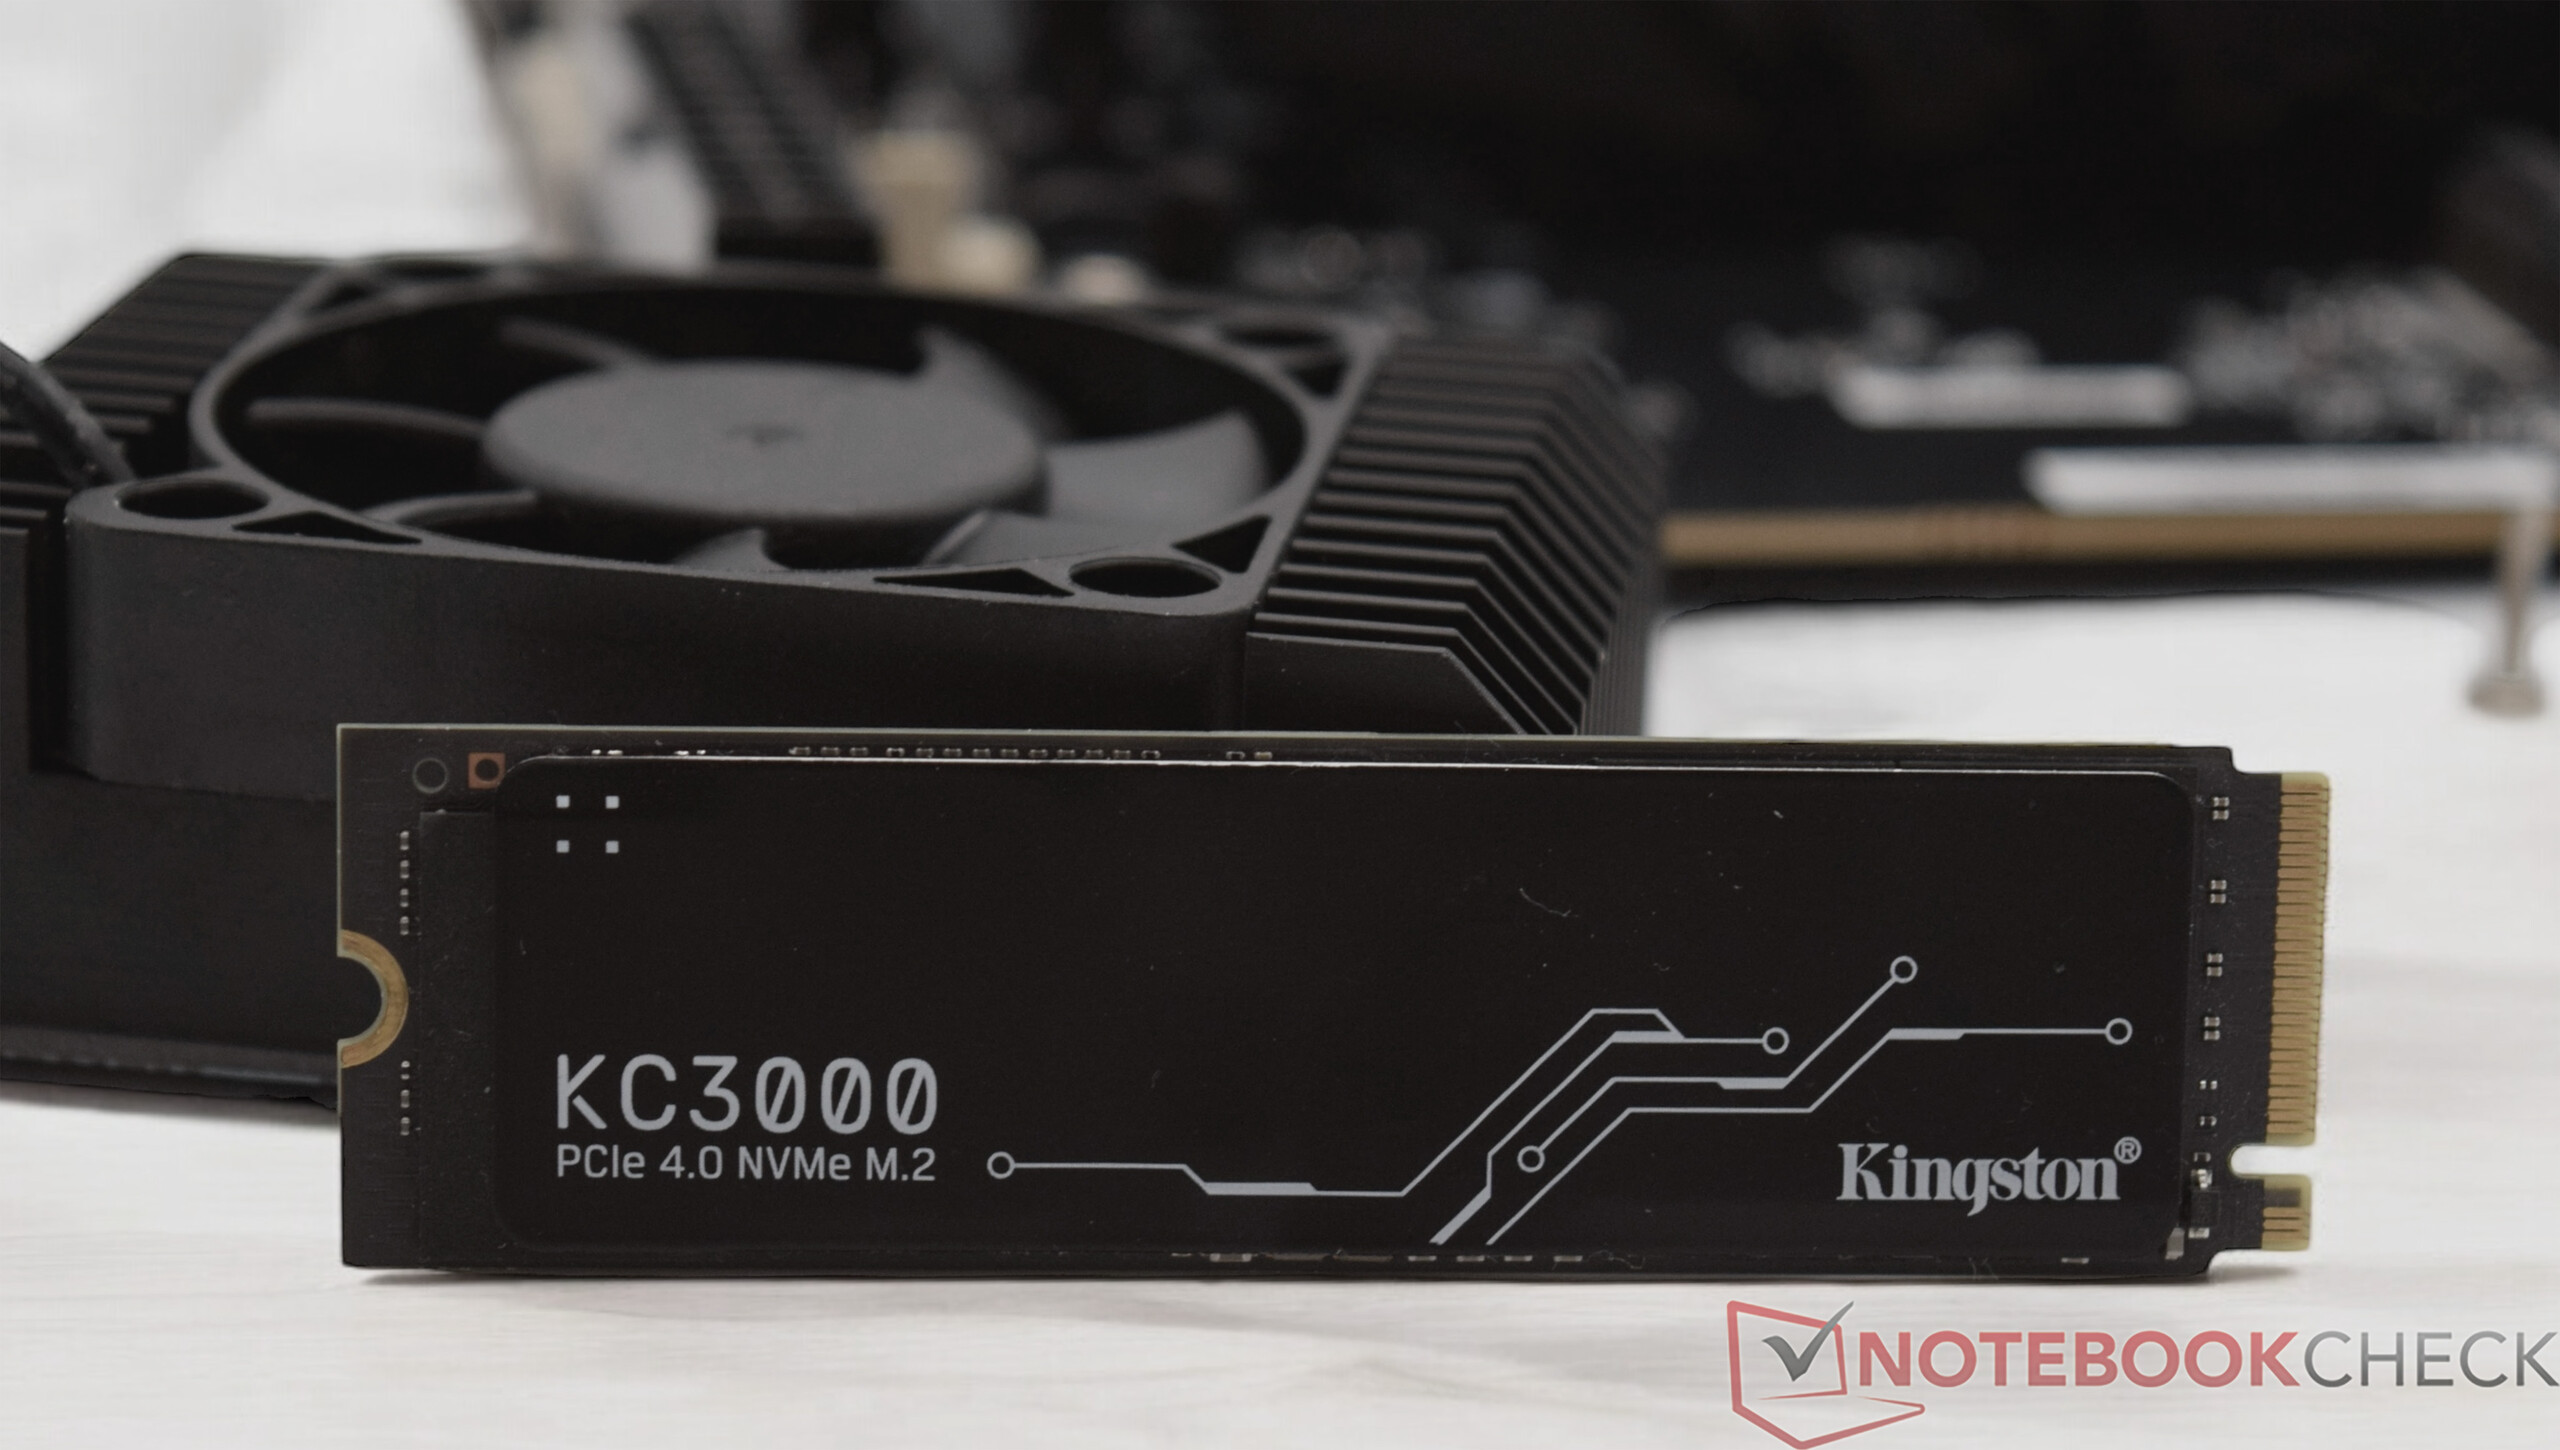
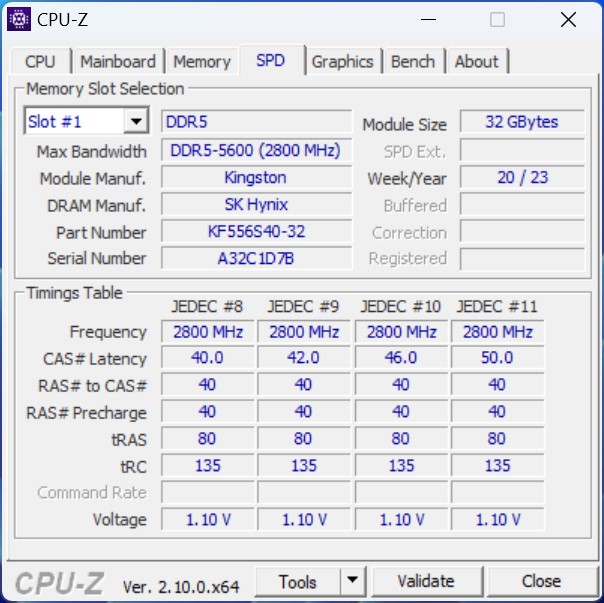
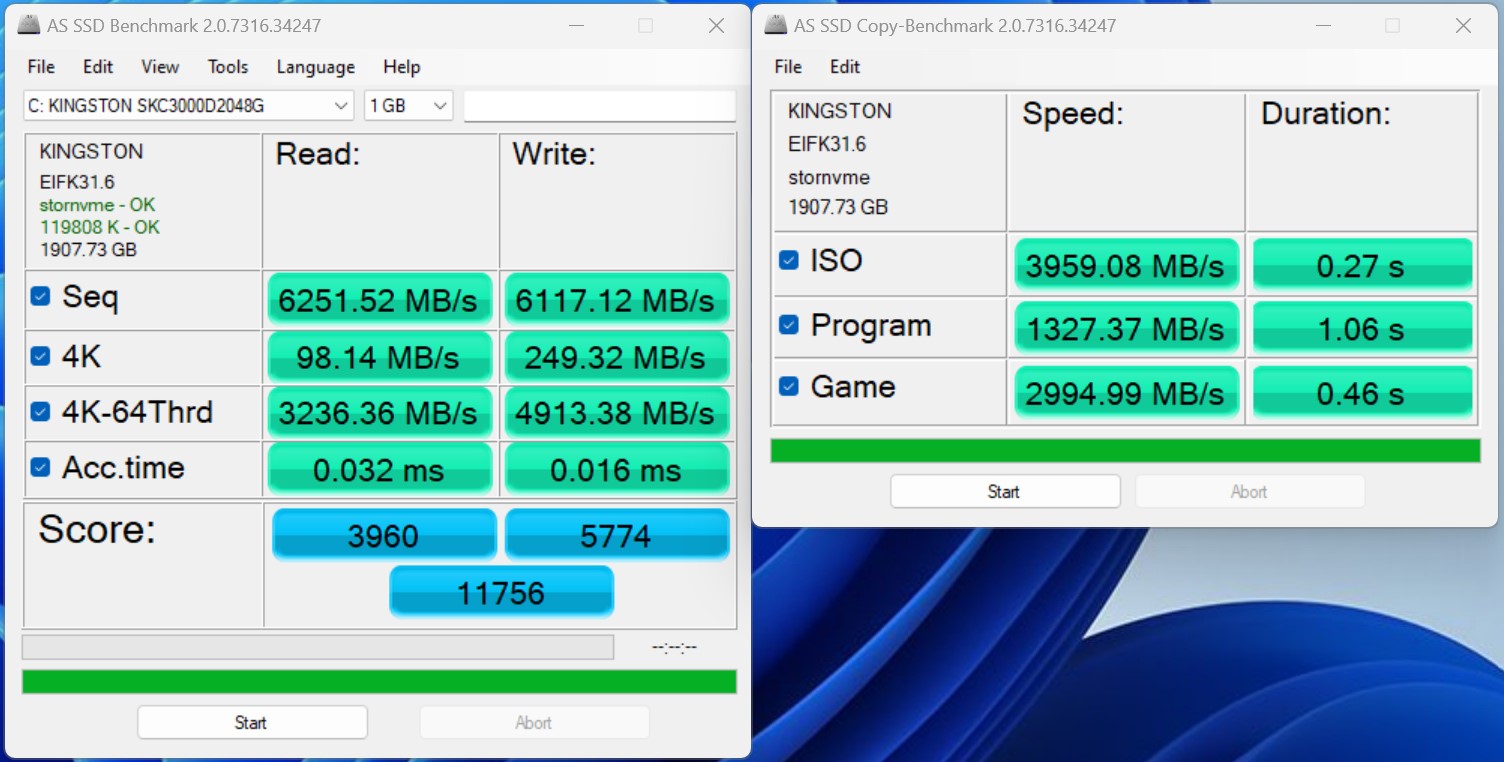
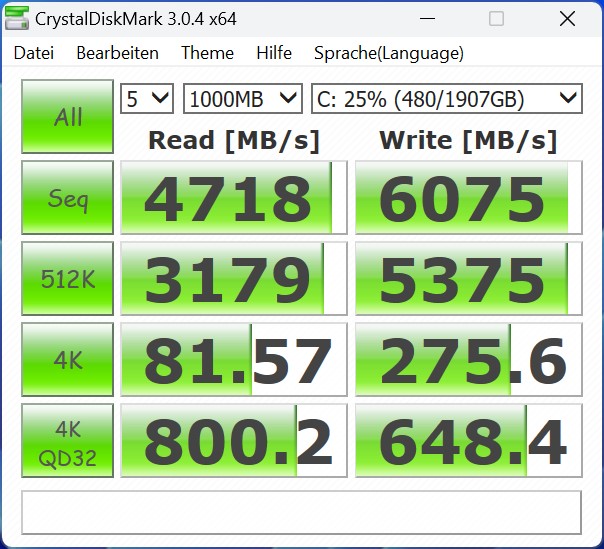
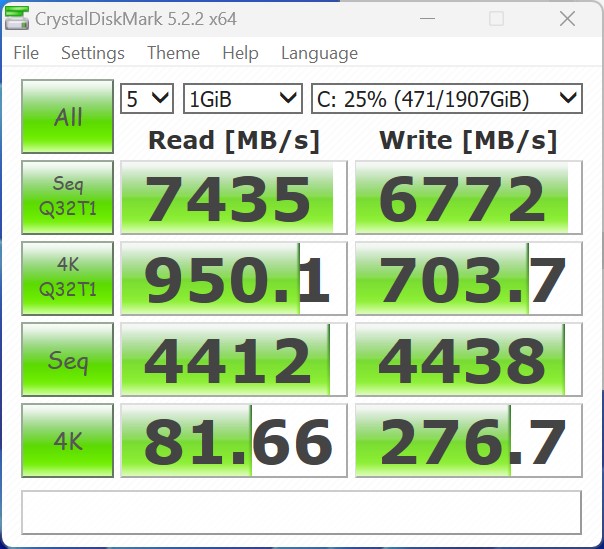
Come detto all'inizio di questa recensione, Minisforum fornisce solo la scheda madre BD790i. Per poter mettere in funzione un sistema completo, deve occuparsi personalmente dei componenti mancanti, come RAM, SSD, alimentatore e ventola della CPU. Per l'SSD, abbiamo optato per un Kingston KC3000 con 2 TB di spazio di archiviazione. Il modello è collegato tramite PCIe 4.0 x4 e non sfrutta appieno l'interfaccia, in quanto il Minisforum BD790i supporta tecnicamente due SSD PCIe 5.0. Entrambe le interfacce M.2 si trovano sulla parte superiore della scheda madre. Coperto da un piccolo dissipatore di calore, che è anche dotato di una piccola ventola, il nostro SSD non ha avuto problemi a fornire prestazioni stabili. Possiamo rassicurare tutti coloro che pensano che questa piccola ventola possa causare mal d'orecchi, perché la ventola è molto silenziosa e non si sente accanto alla ventola della CPU.
Per ulteriori confronti e benchmark, la invitiamo a consultare la nostra tabella di confronto.
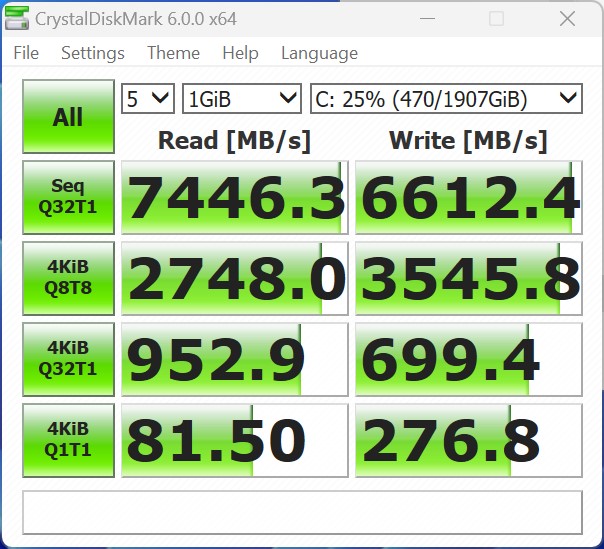

Reading continuous performance: DiskSpd Read Loop, Queue Depth 8
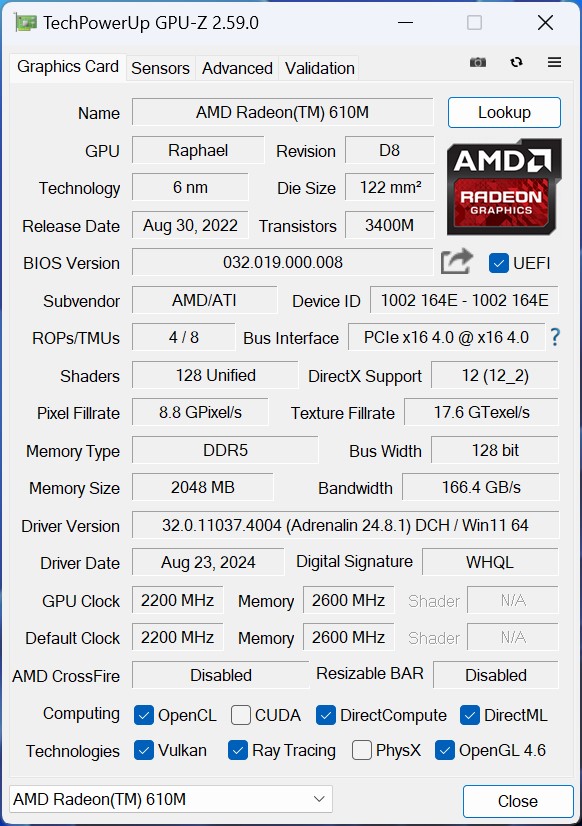
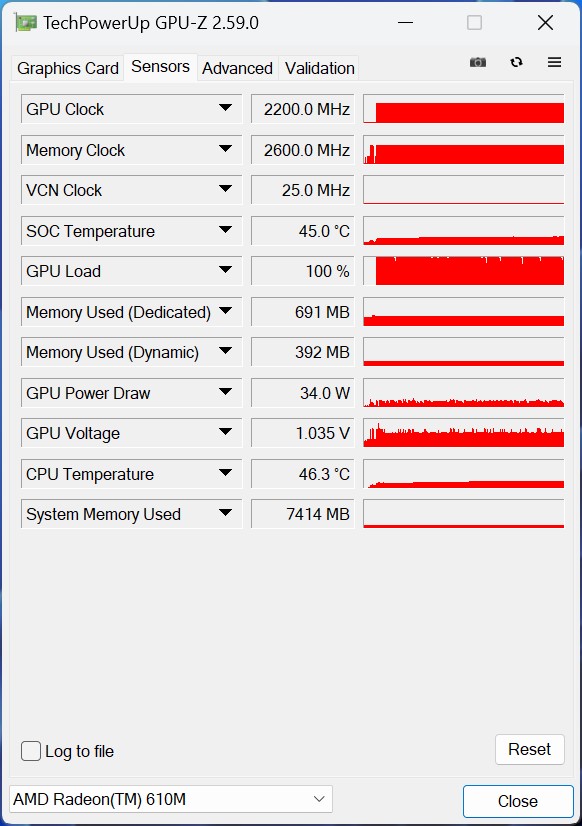
Scheda grafica - AMD Radeon 610M come iGPU
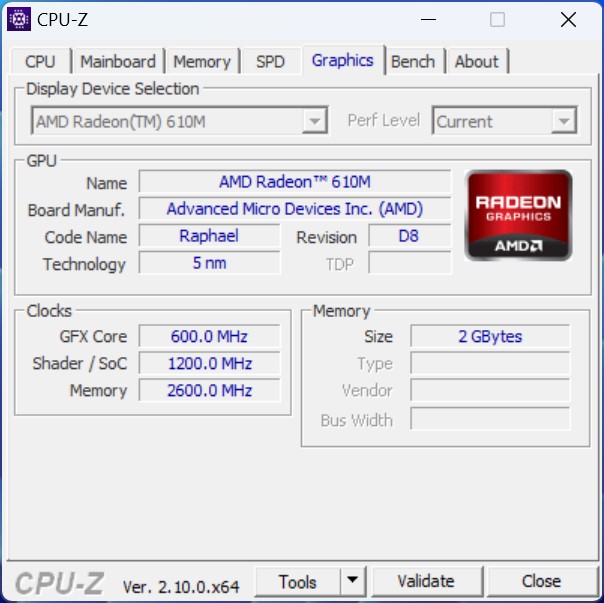
L'AMD Ryzen 9 7945HX AMD Ryzen 9 7945HX presenta solo una soluzione grafica semplice come iGPU, che si chiama AMD Radeon 610M. Questa è ancora basata sull'architettura RDNA2 e offre solo 2 CU, il che significa che ci sono solo 128 unità shader in totale disponibili per i calcoli 3D. Rispetto al AMD Ryzen 7 7745HXche è installato sul Minisforum BD770inon ci sono prestazioni 3D superiori. Alla luce di ciò, i loro risultati sono quasi identici. Rispetto a una AMD Radeon 780M, l'AMD Radeon 610M non ha alcuna possibilità. A nostro avviso, non ci si può aspettare che questa debole soluzione grafica faccia più di un semplice output di immagini.
Ulteriori confronti e benchmark sono disponibili nella nostra Tabella di confronto delle GPU.
| Performance Rating - Percent | |
| Minisforum EliteMini UM780 XTX | |
| Minisforum Venus Series UM790 Pro | |
| NiPoGi AD08 | |
| Minisforum Mars Series MC560 | |
| Minisforum BD790i | |
| Media AMD Radeon 610M | |
| Acemagic AD15 | |
| Minisforum BD770i | |
| Unigine Valley 1.0 | |
| 1920x1080 Extreme HD DirectX AA:x8 | |
| Minisforum EliteMini UM780 XTX | |
| Minisforum Venus Series UM790 Pro | |
| Minisforum Mars Series MC560 | |
| NiPoGi AD08 | |
| Minisforum BD770i | |
| Minisforum BD790i | |
| Media AMD Radeon 610M (10 - 10, n=2) | |
| Acemagic AD15 | |
| 1920x1080 Extreme HD Preset OpenGL AA:x8 | |
| Minisforum EliteMini UM780 XTX | |
| Minisforum Venus Series UM790 Pro | |
| NiPoGi AD08 | |
| Minisforum Mars Series MC560 | |
| Acemagic AD15 | |
| Minisforum BD770i | |
| Media AMD Radeon 610M (9.5 - 9.6, n=2) | |
| Minisforum BD790i | |
| Affinity Photo 2 - Combined (Single / Multi GPU) | |
| Minisforum BD790i | |
| NiPoGi AD08 | |
| Media AMD Radeon 610M (889 - 5750, n=2) | |
| Acemagic AD15 | |
| Minisforum EliteMini UM780 XTX | |
| Minisforum Mars Series MC560 | |
| Minisforum Venus Series UM790 Pro | |
| Minisforum BD770i | |
| 3DMark 06 Standard Score | 20555 punti | |
| 3DMark Vantage P Result | 12092 punti | |
| 3DMark 11 Performance | 3873 punti | |
| 3DMark Ice Storm Standard Score | 41556 punti | |
| 3DMark Cloud Gate Standard Score | 14629 punti | |
| 3DMark Fire Strike Score | 2156 punti | |
| 3DMark Fire Strike Extreme Score | 530 punti | |
| 3DMark Time Spy Score | 740 punti | |
Aiuto | ||
Prestazioni di gioco - AMD Radeon 610M
Per valutare meglio la AMD Radeon 610M3D, l'abbiamo sottoposta ad alcuni test di gioco. Purtroppo, l'iGPU a basse prestazioni non poteva vantare buoni frame rate. Anche quando si giocava con i giochi più vecchi, l'AMD Radeon 610M faticava a visualizzare sullo schermo frame rate adeguati. I modelli equipaggiati con una AMD Radeon 780M offrivano prestazioni nettamente migliori. Tuttavia, i limiti di una AMD Radeon 780M sono stati raggiunti rapidamente, lasciando solo l'opzione di utilizzare una scheda grafica dedicata se vuole godersi i giochi più recenti.
Per una panoramica delle prestazioni dell'iGPU rispetto ad altre schede grafiche, la invitiamo a dare un'occhiata al nostro Elenco di giochi con GPU.
| The Witcher 3 | |
| 1024x768 Low Graphics & Postprocessing | |
| Minisforum EliteMini UM780 XTX | |
| Minisforum Venus Series UM790 Pro | |
| NiPoGi AD08 | |
| Minisforum Mars Series MC560 | |
| Acemagic AD15 | |
| Minisforum BD790i | |
| Minisforum BD770i | |
| 1920x1080 High Graphics & Postprocessing (Nvidia HairWorks Off) | |
| Minisforum EliteMini UM780 XTX | |
| Minisforum Venus Series UM790 Pro | |
| NiPoGi AD08 | |
| Minisforum Mars Series MC560 | |
| Acemagic AD15 | |
| Minisforum BD790i | |
| Minisforum BD770i | |
| Borderlands 3 | |
| 1280x720 Very Low Overall Quality (DX11) | |
| Minisforum EliteMini UM780 XTX | |
| Minisforum Venus Series UM790 Pro | |
| Minisforum Mars Series MC560 | |
| NiPoGi AD08 | |
| Minisforum BD770i | |
| Minisforum BD790i | |
| Acemagic AD15 | |
| 1920x1080 High Overall Quality (DX11) | |
| Minisforum EliteMini UM780 XTX | |
| Minisforum Venus Series UM790 Pro | |
| Minisforum Mars Series MC560 | |
| NiPoGi AD08 | |
| Minisforum BD770i | |
| Minisforum BD790i | |
| Acemagic AD15 | |
| GTA V | |
| 1024x768 Lowest Settings possible | |
| Minisforum EliteMini UM780 XTX | |
| Minisforum Venus Series UM790 Pro | |
| Minisforum BD770i | |
| Minisforum BD790i | |
| Minisforum Mars Series MC560 | |
| NiPoGi AD08 | |
| Acemagic AD15 | |
| 1920x1080 High/On (Advanced Graphics Off) AA:2xMSAA + FX AF:8x | |
| Minisforum EliteMini UM780 XTX | |
| Minisforum Venus Series UM790 Pro | |
| Minisforum Mars Series MC560 | |
| Minisforum BD770i | |
| Minisforum BD790i | |
| NiPoGi AD08 | |
| Acemagic AD15 | |
| Tiny Tina's Wonderlands | |
| 1280x720 Lowest Preset (DX12) | |
| Minisforum EliteMini UM780 XTX | |
| Minisforum Venus Series UM790 Pro | |
| Minisforum Mars Series MC560 | |
| Minisforum BD770i | |
| Minisforum BD790i | |
| Acemagic AD15 | |
| 1920x1080 High Preset (DX12) | |
| Minisforum EliteMini UM780 XTX | |
| Minisforum Venus Series UM790 Pro | |
| Minisforum Mars Series MC560 | |
| Minisforum BD770i | |
| Minisforum BD790i | |
| Acemagic AD15 | |
| Metro Exodus | |
| 1280x720 Low Quality AF:4x | |
| Minisforum EliteMini UM780 XTX | |
| Minisforum Venus Series UM790 Pro | |
| NiPoGi AD08 | |
| Minisforum BD770i | |
| Minisforum BD790i | |
| 1920x1080 High Quality AF:16x | |
| Minisforum EliteMini UM780 XTX | |
| Minisforum Venus Series UM790 Pro | |
| NiPoGi AD08 | |
| Minisforum BD770i | |
| Minisforum BD790i | |
| Shadow of the Tomb Raider | |
| 1280x720 Lowest Preset | |
| Minisforum EliteMini UM780 XTX | |
| Minisforum Venus Series UM790 Pro | |
| NiPoGi AD08 | |
| Minisforum BD770i | |
| Minisforum BD790i | |
| Acemagic AD15 | |
| 1920x1080 High Preset AA:SM | |
| Minisforum EliteMini UM780 XTX | |
| Minisforum Venus Series UM790 Pro | |
| NiPoGi AD08 | |
| Minisforum BD770i | |
| Acemagic AD15 | |
| Minisforum BD790i | |
| basso | medio | alto | ultra | |
|---|---|---|---|---|
| GTA V (2015) | 131.2 | 99.5 | 21.6 | 9.61 |
| The Witcher 3 (2015) | 44.5 | 27 | 13.9 | 7.8 |
| Final Fantasy XV Benchmark (2018) | 25.9 | 11.4 | 7.97 | |
| X-Plane 11.11 (2018) | 39.8 | 23.5 | 20.8 | |
| Far Cry 5 (2018) | 25 | 13 | 12 | 11 |
| Strange Brigade (2018) | 20.9 | 18.8 | 14.3 | 12 |
| Shadow of the Tomb Raider (2018) | 35.7 | 12.5 | 11.5 | 9.4 |
| Far Cry New Dawn (2019) | 32 | 15 | 14 | 12 |
| Metro Exodus (2019) | 25.1 | 10.6 | 7.73 | 6.41 |
| Borderlands 3 (2019) | 38.1 | 14.3 | 8.43 | 6.4 |
| Tiny Tina's Wonderlands (2022) | 16.3 | 12.8 | 8.41 |
Il Minisforum BD790i con una Nvidia GeForce RTX 4090
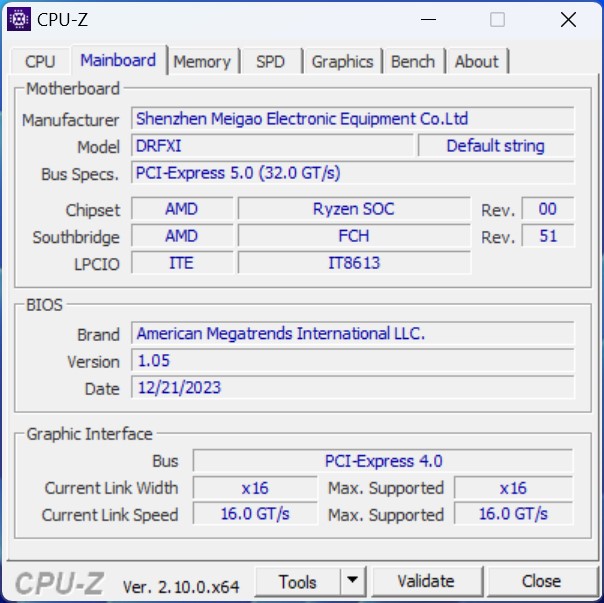
La scheda madre Minisforum BD790i è ideale come base per un sistema di gioco compatto. L'AMD Ryzen 9 7945HX offre molte prestazioni, e anche i giochi che richiedono una CPU non sovraccaricano in alcun modo il componente a 16 core. Uno sguardo ai benchmark sintetici rivela solo piccole differenze tra i vari sistemi. La scheda madre Minisforum BD790i è dotata di un'interfaccia PCIe x16 completa che supporta già lo standard 5.0. Questo significa che le future schede grafiche, che sono già in grado di supportare lo standard 5.0, possono essere utilizzate in futuro. Ciò significa che anche le future schede grafiche, che probabilmente verranno rilasciate nei prossimi mesi, potranno essere utilizzate con la loro piena larghezza di banda, il che sottolinea ulteriormente le qualità a prova di futuro di questo componente. Abbiamo utilizzato la nostra Palit GeForce RTX 4090 Gamerock OC per i test di gioco. A causa delle dimensioni della scheda grafica, abbiamo dovuto utilizzare il Minisforum BD790i in una configurazione aperta per questi test. La scheda grafica è semplicemente troppo grande per il case Phanteks Enthoo Evolv Shift XT.
Per analizzare i benchmark di gioco, diamo prima un'occhiata alle prestazioni al limite della CPU. È qui che si registrano le maggiori differenze tra i vari processori. Il nostro sistema di prova ha fornito all'incirca il livello di prestazioni che ci si può aspettare da un AMD Ryzen 5 9600X. Un Intel Core i9-14900K era a portata di mano e forniva prestazioni solo leggermente superiori. Quando abbiamo aumentato la risoluzione e il livello di dettaglio, le prestazioni del processore sono passate sempre più in secondo piano. Al limite della GPU, tutti i dispositivi di confronto erano molto più vicini, il che significa che una differenza reale era difficilmente percepibile. La combinazione di un AMD Ryzen 9 7945HX e Palit GeForce RTX 4090 Gamerock OC ha garantito prestazioni di gioco impressionanti, che non sono affatto inferiori a quelle dei PC desktop tradizionali.
Tutti i sistemi elencati in questo confronto sono stati testati con la stessa scheda grafica, una Palit GeForce RTX 4090 Gamerock OC.
| Performance Rating - Percent | |
| AMD Ryzen 5 9600X, NVIDIA GeForce RTX 4090 | |
| Intel Core i9-14900K, NVIDIA GeForce RTX 4090 | |
| Intel Core i5-14600K, NVIDIA GeForce RTX 4090 | |
| AMD Ryzen 7 7745HX, NVIDIA GeForce RTX 4090 | |
| AMD Ryzen 9 7950X, NVIDIA GeForce RTX 4090 | |
| AMD Ryzen 7 7800X3D, NVIDIA GeForce RTX 4090 | |
| Intel Core i7-13700, NVIDIA GeForce RTX 4090 | |
| AMD Ryzen 9 7945HX, NVIDIA GeForce RTX 4090 | |
| Intel Core i7-12700, NVIDIA GeForce RTX 4090 | |
| Intel Core i5-13400, NVIDIA GeForce RTX 4090 | |
| 3DMark 11 - 1280x720 Performance GPU | |
| AMD Ryzen 7 7745HX, NVIDIA GeForce RTX 4090 | |
| AMD Ryzen 7 7800X3D, NVIDIA GeForce RTX 4090 | |
| Intel Core i5-14600K, NVIDIA GeForce RTX 4090 | |
| AMD Ryzen 9 7950X, NVIDIA GeForce RTX 4090 | |
| Intel Core i7-13700, NVIDIA GeForce RTX 4090 | |
| Intel Core i7-12700, NVIDIA GeForce RTX 4090 | |
| Intel Core i5-13400, NVIDIA GeForce RTX 4090 | |
| AMD Ryzen 5 9600X, NVIDIA GeForce RTX 4090 | |
| Intel Core i9-14900K, NVIDIA GeForce RTX 4090 | |
| AMD Ryzen 9 7945HX, NVIDIA GeForce RTX 4090 | |
| 3DMark | |
| 2560x1440 Time Spy Graphics | |
| AMD Ryzen 7 7745HX, NVIDIA GeForce RTX 4090 | |
| Intel Core i5-14600K, NVIDIA GeForce RTX 4090 | |
| Intel Core i9-14900K, NVIDIA GeForce RTX 4090 | |
| AMD Ryzen 7 7800X3D, NVIDIA GeForce RTX 4090 | |
| AMD Ryzen 5 9600X, NVIDIA GeForce RTX 4090 | |
| Intel Core i7-13700, NVIDIA GeForce RTX 4090 | |
| AMD Ryzen 9 7950X, NVIDIA GeForce RTX 4090 | |
| Intel Core i7-12700, NVIDIA GeForce RTX 4090 | |
| Intel Core i5-13400, NVIDIA GeForce RTX 4090 | |
| AMD Ryzen 9 7945HX, NVIDIA GeForce RTX 4090 | |
| 1920x1080 Fire Strike Graphics | |
| AMD Ryzen 7 7745HX, NVIDIA GeForce RTX 4090 | |
| Intel Core i5-14600K, NVIDIA GeForce RTX 4090 | |
| Intel Core i7-12700, NVIDIA GeForce RTX 4090 | |
| Intel Core i7-13700, NVIDIA GeForce RTX 4090 | |
| AMD Ryzen 5 9600X, NVIDIA GeForce RTX 4090 | |
| Intel Core i5-13400, NVIDIA GeForce RTX 4090 | |
| AMD Ryzen 7 7800X3D, NVIDIA GeForce RTX 4090 | |
| AMD Ryzen 9 7950X, NVIDIA GeForce RTX 4090 | |
| AMD Ryzen 9 7945HX, NVIDIA GeForce RTX 4090 | |
| Intel Core i9-14900K, NVIDIA GeForce RTX 4090 | |
| 3840x2160 Fire Strike Ultra Graphics | |
| AMD Ryzen 7 7800X3D, NVIDIA GeForce RTX 4090 | |
| AMD Ryzen 7 7745HX, NVIDIA GeForce RTX 4090 | |
| Intel Core i5-14600K, NVIDIA GeForce RTX 4090 | |
| Intel Core i7-13700, NVIDIA GeForce RTX 4090 | |
| Intel Core i5-13400, NVIDIA GeForce RTX 4090 | |
| AMD Ryzen 9 7950X, NVIDIA GeForce RTX 4090 | |
| Intel Core i9-14900K, NVIDIA GeForce RTX 4090 | |
| AMD Ryzen 5 9600X, NVIDIA GeForce RTX 4090 | |
| AMD Ryzen 9 7945HX, NVIDIA GeForce RTX 4090 | |
| Intel Core i7-12700, NVIDIA GeForce RTX 4090 | |
| Unigine Superposition | |
| 1280x720 720p Low | |
| AMD Ryzen 5 9600X, NVIDIA GeForce RTX 4090 | |
| Intel Core i9-14900K, NVIDIA GeForce RTX 4090 | |
| AMD Ryzen 7 7800X3D, NVIDIA GeForce RTX 4090 | |
| AMD Ryzen 9 7950X, NVIDIA GeForce RTX 4090 | |
| AMD Ryzen 7 7745HX, NVIDIA GeForce RTX 4090 | |
| Intel Core i7-13700, NVIDIA GeForce RTX 4090 | |
| Intel Core i5-14600K, NVIDIA GeForce RTX 4090 | |
| AMD Ryzen 9 7945HX, NVIDIA GeForce RTX 4090 | |
| Intel Core i7-12700, NVIDIA GeForce RTX 4090 | |
| Intel Core i5-13400, NVIDIA GeForce RTX 4090 | |
| 1920x1080 1080p High | |
| Intel Core i9-14900K, NVIDIA GeForce RTX 4090 | |
| AMD Ryzen 5 9600X, NVIDIA GeForce RTX 4090 | |
| AMD Ryzen 7 7800X3D, NVIDIA GeForce RTX 4090 | |
| AMD Ryzen 9 7950X, NVIDIA GeForce RTX 4090 | |
| AMD Ryzen 7 7745HX, NVIDIA GeForce RTX 4090 | |
| Intel Core i7-13700, NVIDIA GeForce RTX 4090 | |
| Intel Core i5-14600K, NVIDIA GeForce RTX 4090 | |
| AMD Ryzen 9 7945HX, NVIDIA GeForce RTX 4090 | |
| Intel Core i7-12700, NVIDIA GeForce RTX 4090 | |
| Intel Core i5-13400, NVIDIA GeForce RTX 4090 | |
| 1920x1080 1080p Extreme | |
| AMD Ryzen 7 7800X3D, NVIDIA GeForce RTX 4090 | |
| AMD Ryzen 7 7745HX, NVIDIA GeForce RTX 4090 | |
| Intel Core i5-14600K, NVIDIA GeForce RTX 4090 | |
| Intel Core i9-14900K, NVIDIA GeForce RTX 4090 | |
| AMD Ryzen 9 7950X, NVIDIA GeForce RTX 4090 | |
| Intel Core i7-13700, NVIDIA GeForce RTX 4090 | |
| Intel Core i5-13400, NVIDIA GeForce RTX 4090 | |
| Intel Core i7-12700, NVIDIA GeForce RTX 4090 | |
| AMD Ryzen 9 7945HX, NVIDIA GeForce RTX 4090 | |
| AMD Ryzen 5 9600X, NVIDIA GeForce RTX 4090 | |
| 3840x2160 4k Optimized | |
| AMD Ryzen 9 7950X, NVIDIA GeForce RTX 4090 | |
| Intel Core i7-13700, NVIDIA GeForce RTX 4090 | |
| Intel Core i9-14900K, NVIDIA GeForce RTX 4090 | |
| Intel Core i5-14600K, NVIDIA GeForce RTX 4090 | |
| AMD Ryzen 7 7800X3D, NVIDIA GeForce RTX 4090 | |
| AMD Ryzen 7 7745HX, NVIDIA GeForce RTX 4090 | |
| AMD Ryzen 5 9600X, NVIDIA GeForce RTX 4090 | |
| AMD Ryzen 9 7945HX, NVIDIA GeForce RTX 4090 | |
| Intel Core i7-12700, NVIDIA GeForce RTX 4090 | |
| Intel Core i5-13400, NVIDIA GeForce RTX 4090 | |
| 7680x4320 8k Optimized | |
| AMD Ryzen 9 7950X, NVIDIA GeForce RTX 4090 | |
| Intel Core i7-13700, NVIDIA GeForce RTX 4090 | |
| Intel Core i7-12700, NVIDIA GeForce RTX 4090 | |
| Intel Core i5-13400, NVIDIA GeForce RTX 4090 | |
| Intel Core i9-14900K, NVIDIA GeForce RTX 4090 | |
| Intel Core i5-14600K, NVIDIA GeForce RTX 4090 | |
| AMD Ryzen 7 7800X3D, NVIDIA GeForce RTX 4090 | |
| AMD Ryzen 7 7745HX, NVIDIA GeForce RTX 4090 | |
| AMD Ryzen 9 7945HX, NVIDIA GeForce RTX 4090 | |
| AMD Ryzen 5 9600X, NVIDIA GeForce RTX 4090 | |
| Unigine Valley 1.0 | |
| 1920x1080 Extreme HD DirectX AA:x8 | |
| AMD Ryzen 5 9600X, NVIDIA GeForce RTX 4090 | |
| Intel Core i9-14900K, NVIDIA GeForce RTX 4090 | |
| Intel Core i5-14600K, NVIDIA GeForce RTX 4090 | |
| AMD Ryzen 9 7950X, NVIDIA GeForce RTX 4090 | |
| Intel Core i7-13700, NVIDIA GeForce RTX 4090 | |
| AMD Ryzen 9 7945HX, NVIDIA GeForce RTX 4090 | |
| AMD Ryzen 7 7745HX, NVIDIA GeForce RTX 4090 | |
| AMD Ryzen 7 7800X3D, NVIDIA GeForce RTX 4090 | |
| Intel Core i7-12700, NVIDIA GeForce RTX 4090 | |
| Intel Core i5-13400, NVIDIA GeForce RTX 4090 | |
| 1920x1080 Extreme HD Preset OpenGL AA:x8 | |
| AMD Ryzen 5 9600X, NVIDIA GeForce RTX 4090 | |
| Intel Core i9-14900K, NVIDIA GeForce RTX 4090 | |
| Intel Core i5-14600K, NVIDIA GeForce RTX 4090 | |
| Intel Core i7-13700, NVIDIA GeForce RTX 4090 | |
| AMD Ryzen 9 7950X, NVIDIA GeForce RTX 4090 | |
| AMD Ryzen 7 7745HX, NVIDIA GeForce RTX 4090 | |
| AMD Ryzen 7 7800X3D, NVIDIA GeForce RTX 4090 | |
| AMD Ryzen 9 7945HX, NVIDIA GeForce RTX 4090 | |
| Intel Core i7-12700, NVIDIA GeForce RTX 4090 | |
| Intel Core i5-13400, NVIDIA GeForce RTX 4090 | |
| Unigine Heaven 4.0 | |
| Extreme Preset OpenGL | |
| AMD Ryzen 5 9600X, NVIDIA GeForce RTX 4090 | |
| Intel Core i9-14900K, NVIDIA GeForce RTX 4090 | |
| AMD Ryzen 7 7745HX, NVIDIA GeForce RTX 4090 | |
| AMD Ryzen 9 7945HX, NVIDIA GeForce RTX 4090 | |
| Intel Core i5-14600K, NVIDIA GeForce RTX 4090 | |
| AMD Ryzen 9 7950X, NVIDIA GeForce RTX 4090 | |
| Intel Core i7-13700, NVIDIA GeForce RTX 4090 | |
| AMD Ryzen 7 7800X3D, NVIDIA GeForce RTX 4090 | |
| Intel Core i7-12700, NVIDIA GeForce RTX 4090 | |
| Intel Core i5-13400, NVIDIA GeForce RTX 4090 | |
| Extreme Preset DX11 | |
| AMD Ryzen 9 7950X, NVIDIA GeForce RTX 4090 | |
| Intel Core i9-14900K, NVIDIA GeForce RTX 4090 | |
| AMD Ryzen 9 7945HX, NVIDIA GeForce RTX 4090 | |
| AMD Ryzen 5 9600X, NVIDIA GeForce RTX 4090 | |
| AMD Ryzen 7 7745HX, NVIDIA GeForce RTX 4090 | |
| Intel Core i5-14600K, NVIDIA GeForce RTX 4090 | |
| AMD Ryzen 7 7800X3D, NVIDIA GeForce RTX 4090 | |
| Intel Core i7-13700, NVIDIA GeForce RTX 4090 | |
| Intel Core i7-12700, NVIDIA GeForce RTX 4090 | |
| Intel Core i5-13400, NVIDIA GeForce RTX 4090 | |
| ComputeMark v2.1 | |
| 1024x600 Normal, Score | |
| AMD Ryzen 7 7745HX, NVIDIA GeForce RTX 4090 | |
| Intel Core i5-14600K, NVIDIA GeForce RTX 4090 | |
| AMD Ryzen 9 7945HX, NVIDIA GeForce RTX 4090 | |
| AMD Ryzen 5 9600X, NVIDIA GeForce RTX 4090 | |
| AMD Ryzen 9 7950X, NVIDIA GeForce RTX 4090 | |
| Intel Core i9-14900K, NVIDIA GeForce RTX 4090 | |
| Intel Core i7-12700, NVIDIA GeForce RTX 4090 | |
| AMD Ryzen 7 7800X3D, NVIDIA GeForce RTX 4090 | |
| Intel Core i5-13400, NVIDIA GeForce RTX 4090 | |
| Intel Core i7-13700, NVIDIA GeForce RTX 4090 | |
| 1024x600 Normal, Fluid 3DTex | |
| AMD Ryzen 7 7800X3D, NVIDIA GeForce RTX 4090 | |
| Intel Core i5-14600K, NVIDIA GeForce RTX 4090 | |
| Intel Core i7-13700, NVIDIA GeForce RTX 4090 | |
| AMD Ryzen 9 7945HX, NVIDIA GeForce RTX 4090 | |
| Intel Core i5-13400, NVIDIA GeForce RTX 4090 | |
| AMD Ryzen 5 9600X, NVIDIA GeForce RTX 4090 | |
| Intel Core i7-12700, NVIDIA GeForce RTX 4090 | |
| AMD Ryzen 9 7950X, NVIDIA GeForce RTX 4090 | |
| AMD Ryzen 7 7745HX, NVIDIA GeForce RTX 4090 | |
| Intel Core i9-14900K, NVIDIA GeForce RTX 4090 | |
| 1024x600 Normal, Fluid 2DTexArr | |
| AMD Ryzen 9 7945HX, NVIDIA GeForce RTX 4090 | |
| AMD Ryzen 5 9600X, NVIDIA GeForce RTX 4090 | |
| AMD Ryzen 7 7745HX, NVIDIA GeForce RTX 4090 | |
| Intel Core i5-14600K, NVIDIA GeForce RTX 4090 | |
| Intel Core i9-14900K, NVIDIA GeForce RTX 4090 | |
| AMD Ryzen 9 7950X, NVIDIA GeForce RTX 4090 | |
| Intel Core i7-12700, NVIDIA GeForce RTX 4090 | |
| Intel Core i7-13700, NVIDIA GeForce RTX 4090 | |
| AMD Ryzen 7 7800X3D, NVIDIA GeForce RTX 4090 | |
| Intel Core i5-13400, NVIDIA GeForce RTX 4090 | |
| 1024x600 Normal, Mandel Vector | |
| AMD Ryzen 7 7745HX, NVIDIA GeForce RTX 4090 | |
| AMD Ryzen 9 7945HX, NVIDIA GeForce RTX 4090 | |
| Intel Core i5-14600K, NVIDIA GeForce RTX 4090 | |
| AMD Ryzen 9 7950X, NVIDIA GeForce RTX 4090 | |
| AMD Ryzen 5 9600X, NVIDIA GeForce RTX 4090 | |
| Intel Core i9-14900K, NVIDIA GeForce RTX 4090 | |
| Intel Core i7-13700, NVIDIA GeForce RTX 4090 | |
| Intel Core i7-12700, NVIDIA GeForce RTX 4090 | |
| AMD Ryzen 7 7800X3D, NVIDIA GeForce RTX 4090 | |
| Intel Core i5-13400, NVIDIA GeForce RTX 4090 | |
| 1024x600 Normal, Mandel Scalar | |
| AMD Ryzen 7 7745HX, NVIDIA GeForce RTX 4090 | |
| Intel Core i5-14600K, NVIDIA GeForce RTX 4090 | |
| Intel Core i9-14900K, NVIDIA GeForce RTX 4090 | |
| AMD Ryzen 9 7945HX, NVIDIA GeForce RTX 4090 | |
| AMD Ryzen 7 7800X3D, NVIDIA GeForce RTX 4090 | |
| AMD Ryzen 9 7950X, NVIDIA GeForce RTX 4090 | |
| AMD Ryzen 5 9600X, NVIDIA GeForce RTX 4090 | |
| Intel Core i7-12700, NVIDIA GeForce RTX 4090 | |
| Intel Core i7-13700, NVIDIA GeForce RTX 4090 | |
| Intel Core i5-13400, NVIDIA GeForce RTX 4090 | |
| 1024x600 Normal, QJuliaRayTrace | |
| AMD Ryzen 7 7745HX, NVIDIA GeForce RTX 4090 | |
| AMD Ryzen 5 9600X, NVIDIA GeForce RTX 4090 | |
| Intel Core i5-14600K, NVIDIA GeForce RTX 4090 | |
| AMD Ryzen 9 7950X, NVIDIA GeForce RTX 4090 | |
| AMD Ryzen 9 7945HX, NVIDIA GeForce RTX 4090 | |
| Intel Core i9-14900K, NVIDIA GeForce RTX 4090 | |
| Intel Core i5-13400, NVIDIA GeForce RTX 4090 | |
| Intel Core i7-12700, NVIDIA GeForce RTX 4090 | |
| Intel Core i7-13700, NVIDIA GeForce RTX 4090 | |
| AMD Ryzen 7 7800X3D, NVIDIA GeForce RTX 4090 | |
Performance comparison at CPU limit at 720p
| Performance Rating - Percent | |
| AMD Ryzen 7 7800X3D, NVIDIA GeForce RTX 4090 | |
| Intel Core i9-14900K, NVIDIA GeForce RTX 4090 | |
| AMD Ryzen 5 9600X, NVIDIA GeForce RTX 4090 | |
| AMD Ryzen 9 7950X, NVIDIA GeForce RTX 4090 | |
| Intel Core i5-14600K, NVIDIA GeForce RTX 4090 | |
| Intel Core i7-13700, NVIDIA GeForce RTX 4090 | |
| AMD Ryzen 7 7745HX, NVIDIA GeForce RTX 4090 | |
| AMD Ryzen 9 7945HX, NVIDIA GeForce RTX 4090 | |
| Intel Core i7-12700, NVIDIA GeForce RTX 4090 | |
| Intel Core i5-13400, NVIDIA GeForce RTX 4090 | |
| F1 22 - 1280x720 Ultra Low Preset AA:T AF:16x | |
| AMD Ryzen 7 7800X3D, NVIDIA GeForce RTX 4090 | |
| Intel Core i9-14900K, NVIDIA GeForce RTX 4090 | |
| AMD Ryzen 9 7950X, NVIDIA GeForce RTX 4090 | |
| AMD Ryzen 5 9600X, NVIDIA GeForce RTX 4090 | |
| Intel Core i5-14600K, NVIDIA GeForce RTX 4090 | |
| AMD Ryzen 7 7745HX, NVIDIA GeForce RTX 4090 | |
| Intel Core i7-13700, NVIDIA GeForce RTX 4090 | |
| AMD Ryzen 9 7945HX, NVIDIA GeForce RTX 4090 | |
| Intel Core i7-12700, NVIDIA GeForce RTX 4090 | |
| Intel Core i5-13400, NVIDIA GeForce RTX 4090 | |
| Far Cry 5 - 1280x720 Low Preset AA:T | |
| AMD Ryzen 7 7800X3D, NVIDIA GeForce RTX 4090 | |
| AMD Ryzen 5 9600X, NVIDIA GeForce RTX 4090 | |
| Intel Core i9-14900K, NVIDIA GeForce RTX 4090 | |
| Intel Core i5-14600K, NVIDIA GeForce RTX 4090 | |
| AMD Ryzen 9 7950X, NVIDIA GeForce RTX 4090 | |
| Intel Core i7-13700, NVIDIA GeForce RTX 4090 | |
| AMD Ryzen 7 7745HX, NVIDIA GeForce RTX 4090 | |
| Intel Core i7-12700, NVIDIA GeForce RTX 4090 | |
| AMD Ryzen 9 7945HX, NVIDIA GeForce RTX 4090 | |
| Intel Core i5-13400, NVIDIA GeForce RTX 4090 | |
| X-Plane 11.11 - 1280x720 low (fps_test=1) | |
| Intel Core i9-14900K, NVIDIA GeForce RTX 4090 | |
| AMD Ryzen 5 9600X, NVIDIA GeForce RTX 4090 | |
| Intel Core i5-14600K, NVIDIA GeForce RTX 4090 | |
| AMD Ryzen 9 7950X, NVIDIA GeForce RTX 4090 | |
| AMD Ryzen 7 7800X3D, NVIDIA GeForce RTX 4090 | |
| Intel Core i7-13700, NVIDIA GeForce RTX 4090 | |
| AMD Ryzen 9 7945HX, NVIDIA GeForce RTX 4090 | |
| AMD Ryzen 7 7745HX, NVIDIA GeForce RTX 4090 | |
| Intel Core i7-12700, NVIDIA GeForce RTX 4090 | |
| Intel Core i5-13400, NVIDIA GeForce RTX 4090 | |
| Final Fantasy XV Benchmark - 1280x720 Lite Quality | |
| AMD Ryzen 7 7745HX, NVIDIA GeForce RTX 4090 | |
| AMD Ryzen 5 9600X, NVIDIA GeForce RTX 4090 | |
| AMD Ryzen 9 7950X, NVIDIA GeForce RTX 4090 | |
| Intel Core i7-13700, NVIDIA GeForce RTX 4090 | |
| AMD Ryzen 7 7800X3D, NVIDIA GeForce RTX 4090 | |
| Intel Core i5-14600K, NVIDIA GeForce RTX 4090 | |
| Intel Core i9-14900K, NVIDIA GeForce RTX 4090 | |
| AMD Ryzen 9 7945HX, NVIDIA GeForce RTX 4090 | |
| Intel Core i7-12700, NVIDIA GeForce RTX 4090 | |
| Intel Core i5-13400, NVIDIA GeForce RTX 4090 | |
| Dota 2 Reborn - 1280x720 min (0/3) fastest | |
| AMD Ryzen 7 7800X3D, NVIDIA GeForce RTX 4090 | |
| AMD Ryzen 9 7950X, NVIDIA GeForce RTX 4090 | |
| Intel Core i9-14900K, NVIDIA GeForce RTX 4090 | |
| AMD Ryzen 5 9600X, NVIDIA GeForce RTX 4090 | |
| AMD Ryzen 9 7945HX, NVIDIA GeForce RTX 4090 | |
| Intel Core i5-14600K, NVIDIA GeForce RTX 4090 | |
| AMD Ryzen 7 7745HX, NVIDIA GeForce RTX 4090 | |
| Intel Core i7-13700, NVIDIA GeForce RTX 4090 | |
| Intel Core i7-12700, NVIDIA GeForce RTX 4090 | |
| Intel Core i5-13400, NVIDIA GeForce RTX 4090 | |
| The Witcher 3 - 1024x768 Low Graphics & Postprocessing | |
| AMD Ryzen 7 7800X3D, NVIDIA GeForce RTX 4090 | |
| AMD Ryzen 9 7950X, NVIDIA GeForce RTX 4090 | |
| Intel Core i9-14900K, NVIDIA GeForce RTX 4090 | |
| AMD Ryzen 5 9600X, NVIDIA GeForce RTX 4090 | |
| AMD Ryzen 9 7945HX, NVIDIA GeForce RTX 4090 | |
| AMD Ryzen 7 7745HX, NVIDIA GeForce RTX 4090 | |
| Intel Core i7-13700, NVIDIA GeForce RTX 4090 | |
| Intel Core i5-14600K, NVIDIA GeForce RTX 4090 | |
| Intel Core i7-12700, NVIDIA GeForce RTX 4090 | |
| Intel Core i5-13400, NVIDIA GeForce RTX 4090 | |
| GTA V - 1024x768 Lowest Settings possible | |
| AMD Ryzen 7 7800X3D, NVIDIA GeForce RTX 4090 | |
| AMD Ryzen 9 7950X, NVIDIA GeForce RTX 4090 | |
| AMD Ryzen 5 9600X, NVIDIA GeForce RTX 4090 | |
| Intel Core i9-14900K, NVIDIA GeForce RTX 4090 | |
| Intel Core i7-13700, NVIDIA GeForce RTX 4090 | |
| Intel Core i5-14600K, NVIDIA GeForce RTX 4090 | |
| AMD Ryzen 7 7745HX, NVIDIA GeForce RTX 4090 | |
| AMD Ryzen 9 7945HX, NVIDIA GeForce RTX 4090 | |
| Intel Core i7-12700, NVIDIA GeForce RTX 4090 | |
| Intel Core i5-13400, NVIDIA GeForce RTX 4090 | |
| Borderlands 3 - 1280x720 Very Low Overall Quality (DX11) | |
| AMD Ryzen 7 7800X3D, NVIDIA GeForce RTX 4090 | |
| Intel Core i9-14900K, NVIDIA GeForce RTX 4090 | |
| AMD Ryzen 9 7950X, NVIDIA GeForce RTX 4090 | |
| Intel Core i5-14600K, NVIDIA GeForce RTX 4090 | |
| AMD Ryzen 5 9600X, NVIDIA GeForce RTX 4090 | |
| Intel Core i7-13700, NVIDIA GeForce RTX 4090 | |
| AMD Ryzen 9 7945HX, NVIDIA GeForce RTX 4090 | |
| AMD Ryzen 7 7745HX, NVIDIA GeForce RTX 4090 | |
| Intel Core i7-12700, NVIDIA GeForce RTX 4090 | |
| Intel Core i5-13400, NVIDIA GeForce RTX 4090 | |
| Far Cry New Dawn - 1280x720 Low Preset | |
| AMD Ryzen 7 7800X3D, NVIDIA GeForce RTX 4090 | |
| Intel Core i9-14900K, NVIDIA GeForce RTX 4090 | |
| AMD Ryzen 5 9600X, NVIDIA GeForce RTX 4090 | |
| Intel Core i5-14600K, NVIDIA GeForce RTX 4090 | |
| Intel Core i7-13700, NVIDIA GeForce RTX 4090 | |
| AMD Ryzen 9 7950X, NVIDIA GeForce RTX 4090 | |
| Intel Core i7-12700, NVIDIA GeForce RTX 4090 | |
| AMD Ryzen 7 7745HX, NVIDIA GeForce RTX 4090 | |
| AMD Ryzen 9 7945HX, NVIDIA GeForce RTX 4090 | |
| Intel Core i5-13400, NVIDIA GeForce RTX 4090 | |
| Shadow of the Tomb Raider - 1280x720 Lowest Preset | |
| AMD Ryzen 7 7800X3D, NVIDIA GeForce RTX 4090 | |
| Intel Core i9-14900K, NVIDIA GeForce RTX 4090 | |
| AMD Ryzen 9 7950X, NVIDIA GeForce RTX 4090 | |
| AMD Ryzen 5 9600X, NVIDIA GeForce RTX 4090 | |
| Intel Core i5-14600K, NVIDIA GeForce RTX 4090 | |
| AMD Ryzen 7 7745HX, NVIDIA GeForce RTX 4090 | |
| AMD Ryzen 9 7945HX, NVIDIA GeForce RTX 4090 | |
| Intel Core i7-13700, NVIDIA GeForce RTX 4090 | |
| Intel Core i7-12700, NVIDIA GeForce RTX 4090 | |
| Intel Core i5-13400, NVIDIA GeForce RTX 4090 | |
| Tiny Tina's Wonderlands - 1280x720 Lowest Preset (DX12) | |
| AMD Ryzen 7 7800X3D, NVIDIA GeForce RTX 4090 | |
| Intel Core i9-14900K, NVIDIA GeForce RTX 4090 | |
| AMD Ryzen 9 7950X, NVIDIA GeForce RTX 4090 | |
| Intel Core i5-14600K, NVIDIA GeForce RTX 4090 | |
| AMD Ryzen 5 9600X, NVIDIA GeForce RTX 4090 | |
| AMD Ryzen 7 7745HX, NVIDIA GeForce RTX 4090 | |
| Intel Core i7-13700, NVIDIA GeForce RTX 4090 | |
| AMD Ryzen 9 7945HX, NVIDIA GeForce RTX 4090 | |
| Intel Core i7-12700, NVIDIA GeForce RTX 4090 | |
| Intel Core i5-13400, NVIDIA GeForce RTX 4090 | |
| Strange Brigade - 1280x720 lowest AF:1 | |
| Intel Core i9-14900K, NVIDIA GeForce RTX 4090 | |
| AMD Ryzen 7 7800X3D, NVIDIA GeForce RTX 4090 | |
| AMD Ryzen 5 9600X, NVIDIA GeForce RTX 4090 | |
| Intel Core i5-14600K, NVIDIA GeForce RTX 4090 | |
| AMD Ryzen 9 7950X, NVIDIA GeForce RTX 4090 | |
| AMD Ryzen 7 7745HX, NVIDIA GeForce RTX 4090 | |
| Intel Core i7-13700, NVIDIA GeForce RTX 4090 | |
| AMD Ryzen 9 7945HX, NVIDIA GeForce RTX 4090 | |
| Intel Core i7-12700, NVIDIA GeForce RTX 4090 | |
| Intel Core i5-13400, NVIDIA GeForce RTX 4090 | |
| Metro Exodus - 1280x720 Low Quality AF:4x | |
| AMD Ryzen 7 7800X3D, NVIDIA GeForce RTX 4090 | |
| AMD Ryzen 5 9600X, NVIDIA GeForce RTX 4090 | |
| Intel Core i9-14900K, NVIDIA GeForce RTX 4090 | |
| AMD Ryzen 9 7950X, NVIDIA GeForce RTX 4090 | |
| Intel Core i5-14600K, NVIDIA GeForce RTX 4090 | |
| AMD Ryzen 7 7745HX, NVIDIA GeForce RTX 4090 | |
| AMD Ryzen 9 7945HX, NVIDIA GeForce RTX 4090 | |
| Intel Core i7-13700, NVIDIA GeForce RTX 4090 | |
| Intel Core i7-12700, NVIDIA GeForce RTX 4090 | |
| Intel Core i5-13400, NVIDIA GeForce RTX 4090 | |
| F1 2020 - 1280x720 Ultra Low Preset | |
| AMD Ryzen 7 7800X3D, NVIDIA GeForce RTX 4090 | |
| AMD Ryzen 5 9600X, NVIDIA GeForce RTX 4090 | |
| Intel Core i9-14900K, NVIDIA GeForce RTX 4090 | |
| AMD Ryzen 9 7950X, NVIDIA GeForce RTX 4090 | |
| AMD Ryzen 7 7745HX, NVIDIA GeForce RTX 4090 | |
| AMD Ryzen 9 7945HX, NVIDIA GeForce RTX 4090 | |
| Intel Core i7-13700, NVIDIA GeForce RTX 4090 | |
| Intel Core i5-14600K, NVIDIA GeForce RTX 4090 | |
| Intel Core i7-12700, NVIDIA GeForce RTX 4090 | |
| Intel Core i5-13400, NVIDIA GeForce RTX 4090 | |
| F1 2021 - 1280x720 Ultra Low Preset | |
| AMD Ryzen 7 7800X3D, NVIDIA GeForce RTX 4090 | |
| Intel Core i9-14900K, NVIDIA GeForce RTX 4090 | |
| AMD Ryzen 9 7950X, NVIDIA GeForce RTX 4090 | |
| AMD Ryzen 5 9600X, NVIDIA GeForce RTX 4090 | |
| AMD Ryzen 7 7745HX, NVIDIA GeForce RTX 4090 | |
| Intel Core i7-13700, NVIDIA GeForce RTX 4090 | |
| Intel Core i5-14600K, NVIDIA GeForce RTX 4090 | |
| AMD Ryzen 9 7945HX, NVIDIA GeForce RTX 4090 | |
| Intel Core i7-12700, NVIDIA GeForce RTX 4090 | |
| Intel Core i5-13400, NVIDIA GeForce RTX 4090 | |
Performance comparison at GPU limit at 2,160p
| Performance Rating - Percent | |
| AMD Ryzen 7 7800X3D, NVIDIA GeForce RTX 4090 | |
| Intel Core i9-14900K, NVIDIA GeForce RTX 4090 -1! | |
| Intel Core i5-14600K, NVIDIA GeForce RTX 4090 | |
| AMD Ryzen 9 7950X, NVIDIA GeForce RTX 4090 | |
| AMD Ryzen 5 9600X, NVIDIA GeForce RTX 4090 | |
| Intel Core i7-13700, NVIDIA GeForce RTX 4090 | |
| AMD Ryzen 7 7745HX, NVIDIA GeForce RTX 4090 | |
| AMD Ryzen 9 7945HX, NVIDIA GeForce RTX 4090 | |
| Intel Core i7-12700, NVIDIA GeForce RTX 4090 | |
| Intel Core i5-13400, NVIDIA GeForce RTX 4090 | |
| F1 22 - 3840x2160 Ultra High Preset AA:T AF:16x | |
| AMD Ryzen 5 9600X, NVIDIA GeForce RTX 4090 | |
| AMD Ryzen 9 7945HX, NVIDIA GeForce RTX 4090 | |
| AMD Ryzen 7 7745HX, NVIDIA GeForce RTX 4090 | |
| AMD Ryzen 7 7800X3D, NVIDIA GeForce RTX 4090 | |
| Intel Core i9-14900K, NVIDIA GeForce RTX 4090 | |
| Intel Core i5-14600K, NVIDIA GeForce RTX 4090 | |
| AMD Ryzen 9 7950X, NVIDIA GeForce RTX 4090 | |
| Intel Core i7-13700, NVIDIA GeForce RTX 4090 | |
| Intel Core i7-12700, NVIDIA GeForce RTX 4090 | |
| Intel Core i5-13400, NVIDIA GeForce RTX 4090 | |
| Far Cry 5 - 3840x2160 Ultra Preset AA:T | |
| AMD Ryzen 7 7800X3D, NVIDIA GeForce RTX 4090 | |
| Intel Core i5-14600K, NVIDIA GeForce RTX 4090 | |
| Intel Core i9-14900K, NVIDIA GeForce RTX 4090 | |
| AMD Ryzen 9 7950X, NVIDIA GeForce RTX 4090 | |
| Intel Core i7-13700, NVIDIA GeForce RTX 4090 | |
| AMD Ryzen 5 9600X, NVIDIA GeForce RTX 4090 | |
| Intel Core i7-12700, NVIDIA GeForce RTX 4090 | |
| AMD Ryzen 7 7745HX, NVIDIA GeForce RTX 4090 | |
| AMD Ryzen 9 7945HX, NVIDIA GeForce RTX 4090 | |
| Intel Core i5-13400, NVIDIA GeForce RTX 4090 | |
| Final Fantasy XV Benchmark - 3840x2160 High Quality | |
| Intel Core i9-14900K, NVIDIA GeForce RTX 4090 | |
| Intel Core i5-14600K, NVIDIA GeForce RTX 4090 | |
| AMD Ryzen 9 7950X, NVIDIA GeForce RTX 4090 | |
| AMD Ryzen 7 7745HX, NVIDIA GeForce RTX 4090 | |
| AMD Ryzen 7 7800X3D, NVIDIA GeForce RTX 4090 | |
| Intel Core i7-13700, NVIDIA GeForce RTX 4090 | |
| Intel Core i7-12700, NVIDIA GeForce RTX 4090 | |
| AMD Ryzen 9 7945HX, NVIDIA GeForce RTX 4090 | |
| AMD Ryzen 5 9600X, NVIDIA GeForce RTX 4090 | |
| Intel Core i5-13400, NVIDIA GeForce RTX 4090 | |
| Dota 2 Reborn - 3840x2160 ultra (3/3) best looking | |
| AMD Ryzen 7 7800X3D, NVIDIA GeForce RTX 4090 | |
| AMD Ryzen 9 7950X, NVIDIA GeForce RTX 4090 | |
| Intel Core i9-14900K, NVIDIA GeForce RTX 4090 | |
| AMD Ryzen 5 9600X, NVIDIA GeForce RTX 4090 | |
| Intel Core i5-14600K, NVIDIA GeForce RTX 4090 | |
| Intel Core i7-13700, NVIDIA GeForce RTX 4090 | |
| AMD Ryzen 9 7945HX, NVIDIA GeForce RTX 4090 | |
| AMD Ryzen 7 7745HX, NVIDIA GeForce RTX 4090 | |
| Intel Core i7-12700, NVIDIA GeForce RTX 4090 | |
| Intel Core i5-13400, NVIDIA GeForce RTX 4090 | |
| The Witcher 3 - 3840x2160 High Graphics & Postprocessing (Nvidia HairWorks Off) | |
| AMD Ryzen 9 7945HX, NVIDIA GeForce RTX 4090 | |
| Intel Core i5-14600K, NVIDIA GeForce RTX 4090 | |
| AMD Ryzen 9 7950X, NVIDIA GeForce RTX 4090 | |
| Intel Core i5-13400, NVIDIA GeForce RTX 4090 | |
| Intel Core i7-13700, NVIDIA GeForce RTX 4090 | |
| Intel Core i7-12700, NVIDIA GeForce RTX 4090 | |
| AMD Ryzen 7 7800X3D, NVIDIA GeForce RTX 4090 | |
| AMD Ryzen 7 7745HX, NVIDIA GeForce RTX 4090 | |
| AMD Ryzen 5 9600X, NVIDIA GeForce RTX 4090 | |
| GTA V - 3840x2160 Highest Settings possible AA:4xMSAA + FX AF:16x | |
| AMD Ryzen 7 7800X3D, NVIDIA GeForce RTX 4090 | |
| Intel Core i9-14900K, NVIDIA GeForce RTX 4090 | |
| Intel Core i5-14600K, NVIDIA GeForce RTX 4090 | |
| AMD Ryzen 5 9600X, NVIDIA GeForce RTX 4090 | |
| AMD Ryzen 9 7950X, NVIDIA GeForce RTX 4090 | |
| Intel Core i7-13700, NVIDIA GeForce RTX 4090 | |
| AMD Ryzen 7 7745HX, NVIDIA GeForce RTX 4090 | |
| AMD Ryzen 9 7945HX, NVIDIA GeForce RTX 4090 | |
| Intel Core i7-12700, NVIDIA GeForce RTX 4090 | |
| Intel Core i5-13400, NVIDIA GeForce RTX 4090 | |
| Borderlands 3 - 3840x2160 Badass Overall Quality (DX11) | |
| Intel Core i9-14900K, NVIDIA GeForce RTX 4090 | |
| AMD Ryzen 7 7800X3D, NVIDIA GeForce RTX 4090 | |
| Intel Core i5-14600K, NVIDIA GeForce RTX 4090 | |
| AMD Ryzen 9 7950X, NVIDIA GeForce RTX 4090 | |
| AMD Ryzen 9 7945HX, NVIDIA GeForce RTX 4090 | |
| Intel Core i7-13700, NVIDIA GeForce RTX 4090 | |
| AMD Ryzen 5 9600X, NVIDIA GeForce RTX 4090 | |
| AMD Ryzen 7 7745HX, NVIDIA GeForce RTX 4090 | |
| Intel Core i7-12700, NVIDIA GeForce RTX 4090 | |
| Intel Core i5-13400, NVIDIA GeForce RTX 4090 | |
| Far Cry New Dawn - 3840x2160 Ultra Preset | |
| AMD Ryzen 7 7800X3D, NVIDIA GeForce RTX 4090 | |
| Intel Core i9-14900K, NVIDIA GeForce RTX 4090 | |
| Intel Core i5-14600K, NVIDIA GeForce RTX 4090 | |
| AMD Ryzen 5 9600X, NVIDIA GeForce RTX 4090 | |
| AMD Ryzen 9 7950X, NVIDIA GeForce RTX 4090 | |
| Intel Core i7-13700, NVIDIA GeForce RTX 4090 | |
| Intel Core i7-12700, NVIDIA GeForce RTX 4090 | |
| AMD Ryzen 7 7745HX, NVIDIA GeForce RTX 4090 | |
| AMD Ryzen 9 7945HX, NVIDIA GeForce RTX 4090 | |
| Intel Core i5-13400, NVIDIA GeForce RTX 4090 | |
| Shadow of the Tomb Raider - 3840x2160 Highest Preset AA:T | |
| Intel Core i5-14600K, NVIDIA GeForce RTX 4090 | |
| Intel Core i9-14900K, NVIDIA GeForce RTX 4090 | |
| AMD Ryzen 5 9600X, NVIDIA GeForce RTX 4090 | |
| AMD Ryzen 7 7800X3D, NVIDIA GeForce RTX 4090 | |
| Intel Core i7-13700, NVIDIA GeForce RTX 4090 | |
| AMD Ryzen 9 7945HX, NVIDIA GeForce RTX 4090 | |
| AMD Ryzen 7 7745HX, NVIDIA GeForce RTX 4090 | |
| AMD Ryzen 9 7950X, NVIDIA GeForce RTX 4090 | |
| Intel Core i7-12700, NVIDIA GeForce RTX 4090 | |
| Intel Core i5-13400, NVIDIA GeForce RTX 4090 | |
| Tiny Tina's Wonderlands - 3840x2160 Badass Preset (DX12) | |
| Intel Core i9-14900K, NVIDIA GeForce RTX 4090 | |
| AMD Ryzen 7 7745HX, NVIDIA GeForce RTX 4090 | |
| Intel Core i5-14600K, NVIDIA GeForce RTX 4090 | |
| AMD Ryzen 9 7950X, NVIDIA GeForce RTX 4090 | |
| Intel Core i7-13700, NVIDIA GeForce RTX 4090 | |
| AMD Ryzen 5 9600X, NVIDIA GeForce RTX 4090 | |
| AMD Ryzen 7 7800X3D, NVIDIA GeForce RTX 4090 | |
| AMD Ryzen 9 7945HX, NVIDIA GeForce RTX 4090 | |
| Intel Core i7-12700, NVIDIA GeForce RTX 4090 | |
| Intel Core i5-13400, NVIDIA GeForce RTX 4090 | |
| Strange Brigade - 3840x2160 ultra AA:ultra AF:16 | |
| Intel Core i9-14900K, NVIDIA GeForce RTX 4090 | |
| AMD Ryzen 7 7800X3D, NVIDIA GeForce RTX 4090 | |
| Intel Core i5-14600K, NVIDIA GeForce RTX 4090 | |
| AMD Ryzen 9 7945HX, NVIDIA GeForce RTX 4090 | |
| AMD Ryzen 7 7745HX, NVIDIA GeForce RTX 4090 | |
| AMD Ryzen 5 9600X, NVIDIA GeForce RTX 4090 | |
| Intel Core i7-12700, NVIDIA GeForce RTX 4090 | |
| Intel Core i7-13700, NVIDIA GeForce RTX 4090 | |
| AMD Ryzen 9 7950X, NVIDIA GeForce RTX 4090 | |
| Intel Core i5-13400, NVIDIA GeForce RTX 4090 | |
| Metro Exodus - 3840x2160 Ultra Quality AF:16x | |
| Intel Core i9-14900K, NVIDIA GeForce RTX 4090 | |
| Intel Core i5-14600K, NVIDIA GeForce RTX 4090 | |
| AMD Ryzen 7 7800X3D, NVIDIA GeForce RTX 4090 | |
| AMD Ryzen 9 7950X, NVIDIA GeForce RTX 4090 | |
| AMD Ryzen 5 9600X, NVIDIA GeForce RTX 4090 | |
| Intel Core i7-13700, NVIDIA GeForce RTX 4090 | |
| AMD Ryzen 7 7745HX, NVIDIA GeForce RTX 4090 | |
| AMD Ryzen 9 7945HX, NVIDIA GeForce RTX 4090 | |
| Intel Core i7-12700, NVIDIA GeForce RTX 4090 | |
| Intel Core i5-13400, NVIDIA GeForce RTX 4090 | |
| F1 2020 - 3840x2160 Ultra High Preset AA:T AF:16x | |
| AMD Ryzen 7 7800X3D, NVIDIA GeForce RTX 4090 | |
| Intel Core i5-14600K, NVIDIA GeForce RTX 4090 | |
| AMD Ryzen 7 7745HX, NVIDIA GeForce RTX 4090 | |
| AMD Ryzen 5 9600X, NVIDIA GeForce RTX 4090 | |
| AMD Ryzen 9 7950X, NVIDIA GeForce RTX 4090 | |
| Intel Core i9-14900K, NVIDIA GeForce RTX 4090 | |
| Intel Core i7-13700, NVIDIA GeForce RTX 4090 | |
| AMD Ryzen 9 7945HX, NVIDIA GeForce RTX 4090 | |
| Intel Core i7-12700, NVIDIA GeForce RTX 4090 | |
| Intel Core i5-13400, NVIDIA GeForce RTX 4090 | |
| F1 2021 - 3840x2160 Ultra High Preset + Raytracing AA:T AF:16x | |
| AMD Ryzen 7 7800X3D, NVIDIA GeForce RTX 4090 | |
| AMD Ryzen 7 7745HX, NVIDIA GeForce RTX 4090 | |
| AMD Ryzen 5 9600X, NVIDIA GeForce RTX 4090 | |
| AMD Ryzen 9 7945HX, NVIDIA GeForce RTX 4090 | |
| Intel Core i5-14600K, NVIDIA GeForce RTX 4090 | |
| Intel Core i9-14900K, NVIDIA GeForce RTX 4090 | |
| AMD Ryzen 9 7950X, NVIDIA GeForce RTX 4090 | |
| Intel Core i7-13700, NVIDIA GeForce RTX 4090 | |
| Intel Core i7-12700, NVIDIA GeForce RTX 4090 | |
| Intel Core i5-13400, NVIDIA GeForce RTX 4090 | |
| basso | medio | alto | ultra | QHD | 4K | |
|---|---|---|---|---|---|---|
| GTA V (2015) | 187.6 | 187.3 | 183 | 141 | 140.5 | 183.6 |
| The Witcher 3 (2015) | 709 | 618 | 563 | 310 | 272 | 292 |
| Dota 2 Reborn (2015) | 268.7 | 234.8 | 221.4 | 202.6 | 196.7 | |
| Final Fantasy XV Benchmark (2018) | 234 | 234 | 213 | 208 | 152 | |
| X-Plane 11.11 (2018) | 196.4 | 169.4 | 127.6 | 105.9 | ||
| Far Cry 5 (2018) | 191 | 168 | 163 | 151 | 151 | 146 |
| Strange Brigade (2018) | 592 | 470 | 465 | 463 | 461 | 289 |
| Shadow of the Tomb Raider (2018) | 273 | 266 | 264 | 263 | 252 | 186.8 |
| Far Cry New Dawn (2019) | 165 | 142 | 139 | 124 | 129 | 123 |
| Metro Exodus (2019) | 270 | 243 | 210 | 183.2 | 167.7 | 133.7 |
| Borderlands 3 (2019) | 213 | 189.6 | 175.5 | 165.6 | 163.2 | 134.1 |
| F1 2020 (2020) | 470 | 390 | 379 | 359 | 354 | 283 |
| F1 2021 (2021) | 562 | 533 | 455 | 220 | 222 | 203 |
| Tiny Tina's Wonderlands (2022) | 365 | 308 | 269 | 258 | 222 | 129.8 |
| F1 22 (2022) | 382 | 366 | 339 | 170 | 159.4 | 85 |
| F1 23 (2023) | 368 | 390 | 373 | 164.3 | 147.9 | 80.9 |
| Cyberpunk 2077 2.1 Phantom Liberty (2023) | 186 | 183.2 | 177.4 | 163.9 | 151.4 | 75.3 |
| Assassin's Creed Mirage (2023) | 250 | 244 | 236 | 167 | 163 | 128 |
| Avatar Frontiers of Pandora (2023) | 232 | 212 | 202 | 170 | 126 | 70 |
| F1 24 (2024) | 350 | 371 | 345 | 176.7 | 146.3 | 80 |
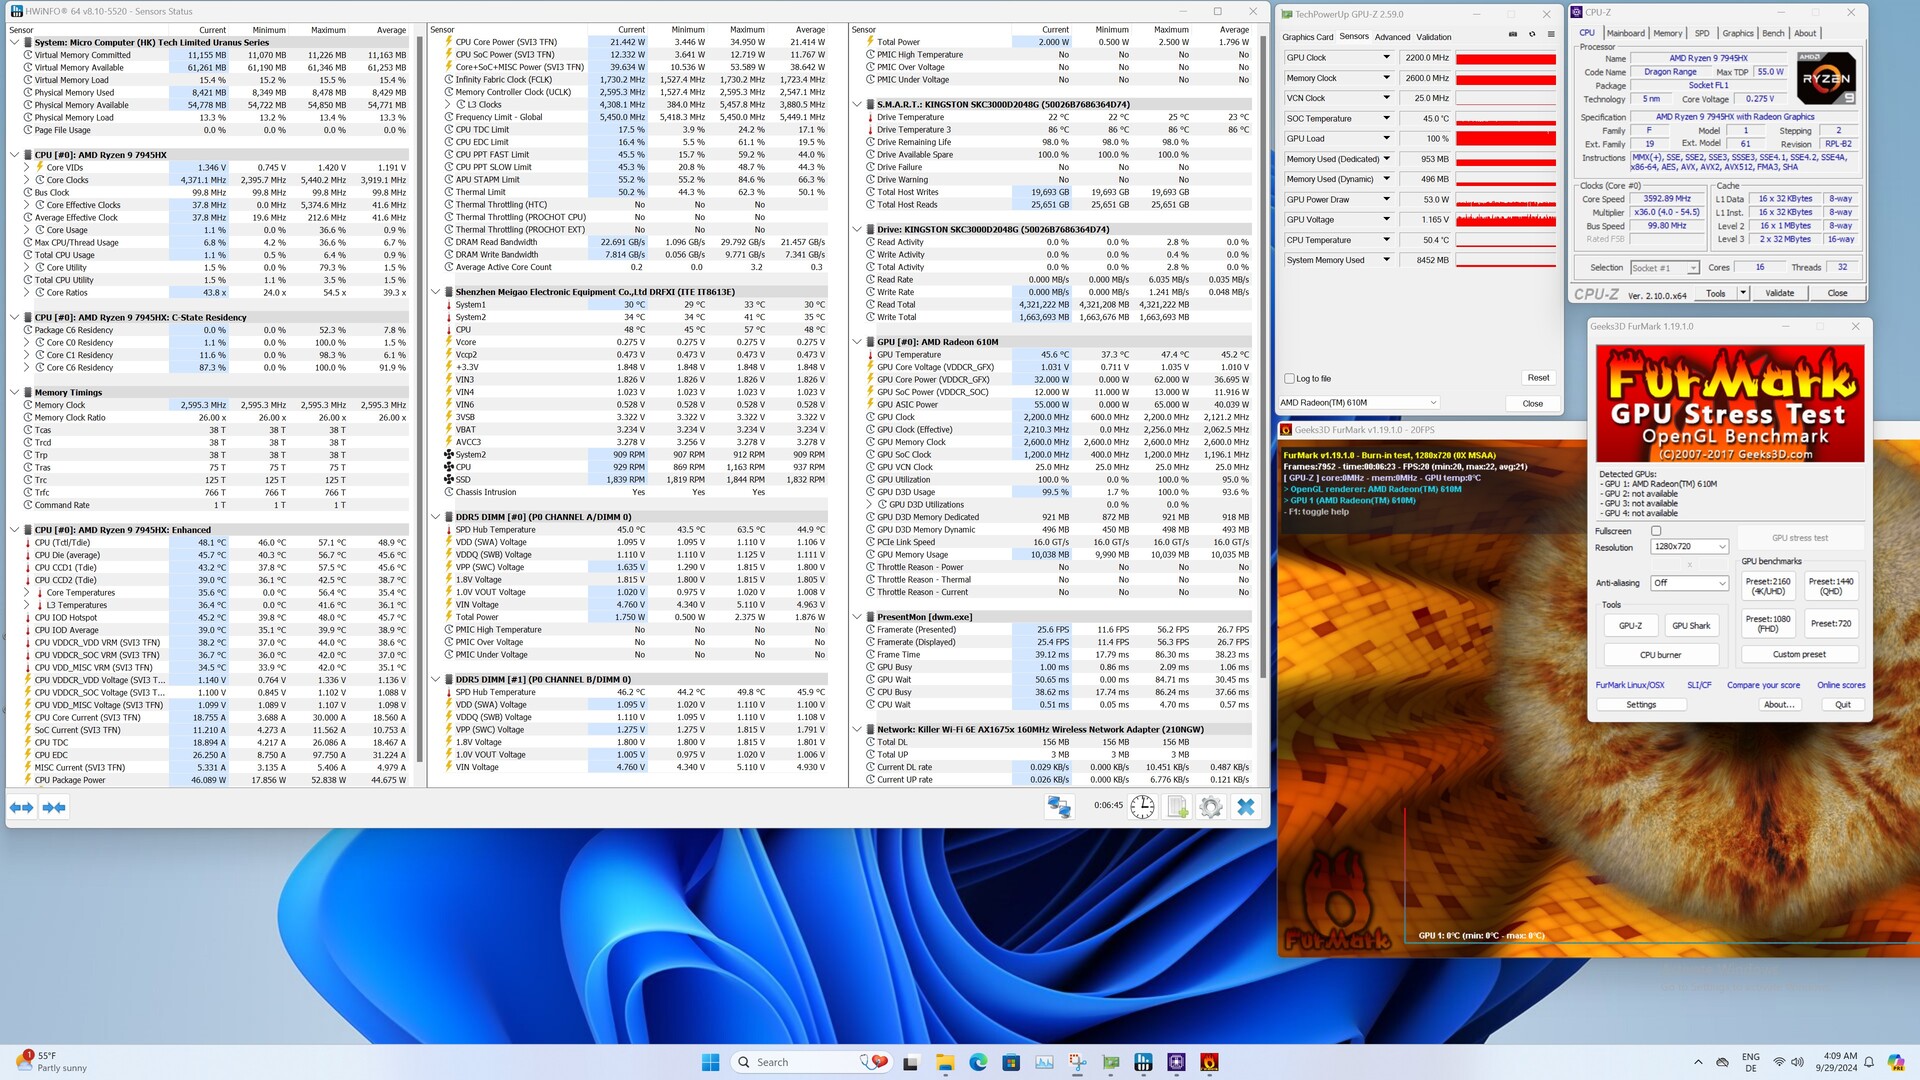
Consumo di energia e temperature
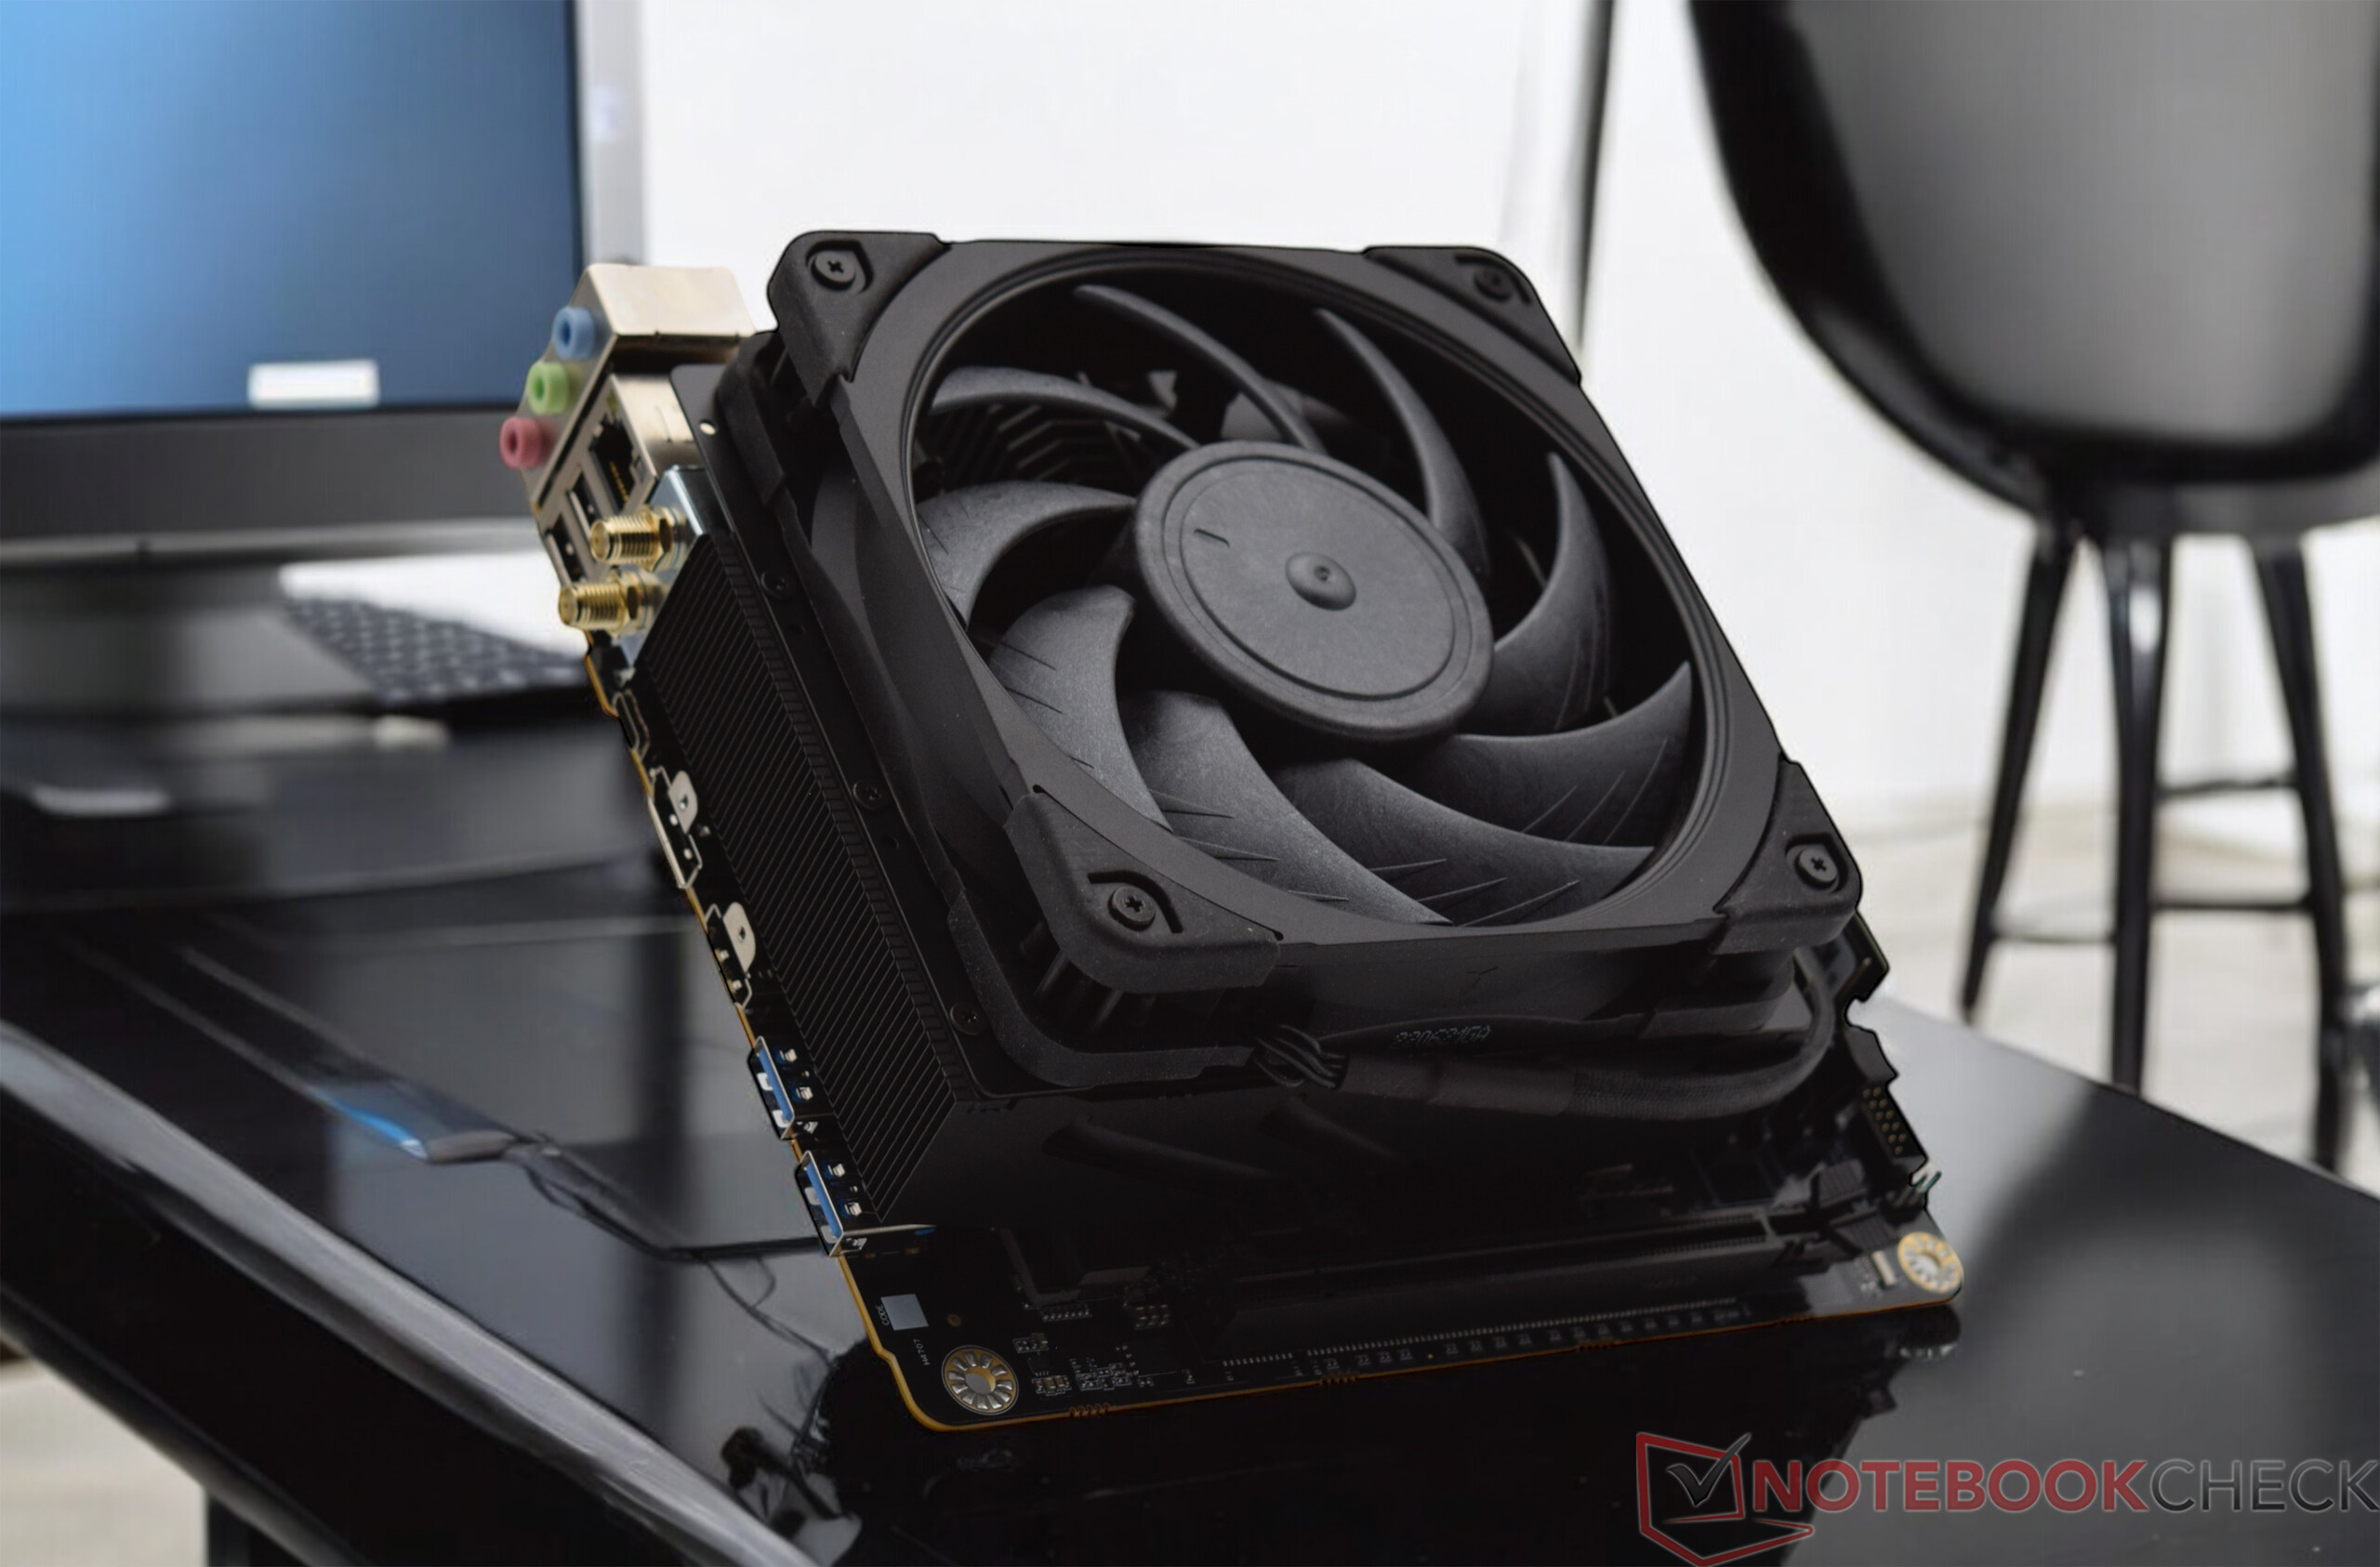
Minisforum fornisce la scheda madre BD790i con un'unità di raffreddamento heatpipe preinstallata, che raffredda il processore e i convertitori di tensione sulla scheda madre. La scelta della ventola spetta all'utente e deve essere installata da solo. Il materiale di montaggio corrispondente per installare una ventola da 120 millimetri è incluso. Noi abbiamo scelto una ventola Noctua NF-A12x25, già utilizzata nel nostro test del Minisforum BD770i. Il vantaggio principale del Minisforum BD790i rispetto ai PC desktop tradizionali è il suo basso consumo energetico. Abbiamo misurato solo circa 140 watt durante il multi-test Cinebench R15, che rappresenta una grande efficienza in relazione alle prestazioni che offre.
Per quanto riguarda il suo funzionamento complessivo e il livello di rumore durante il funzionamento, possiamo solo dire che l'alimentatore integrato è udibile nella nostra configurazione di test. Sia in modalità idle che sotto carico, non siamo riusciti a effettuare misurazioni che potessero essere influenzate dall'alimentatore installato. La ventola della CPU e la ventola preinstallata per il raffreddamento dell'SSD non si sentono dal case chiuso. Il raffreddamento funziona in modo molto efficace e non abbiamo documentato alcun valore critico sotto carico. Tuttavia, siamo dell'opinione che separare il raffreddatore della CPU e del VRM avrebbe senso per poter installare una soluzione di raffreddamento per il processore stesso. Il SoC potrebbe certamente essere raffreddato in modo ancora più efficace con una soluzione AiO.
Rispetto ai noti produttori di schede madri, le opzioni di impostazione nel BIOS della scheda madre Minisforum BD790i sono molto limitate. Il consumo energetico del processore può essere modificato, ma la curva della ventola non può essere regolata separatamente. Se Minisforum continuerà a coprire questo mercato, saremmo molto lieti di avere un'opzione più facile da usare.

Efficiency overview
| Performance Rating - Percent | |
| Minisforum BD790i | |
| Minisforum BD770i | |
| Power Consumption | |
| Cinebench R23 Multi Power Efficiency - external Monitor | |
| Minisforum BD790i | |
| Minisforum BD770i | |
| Cinebench R23 Single Power Efficiency - external Monitor | |
| Minisforum BD770i | |
| Minisforum BD790i | |
| Cinebench R15 Multi Efficiency (external Monitor) | |
| Minisforum BD790i | |
| Minisforum BD770i | |
| Power Consumption / Cinebench R15 Multi (external Monitor) | |
| Intel Core i9-14900K | |
| Intel Core i9-13900K | |
| AMD Ryzen 9 7950X (Idle: 95.2 W) | |
| Intel Core i7-13700K | |
| Intel Core i5-14600K | |
| Intel Core i5-13600K | |
| Intel Core i7-12700 | |
| AMD Ryzen 9 7950X3D | |
| AMD Ryzen 7 7800X3D | |
| Intel Core i5-13400 | |
| Intel Core i5-12400F | |
| AMD Ryzen 9 7945HX | |
| AMD Ryzen 7 7745HX | |
| Power Consumption / Prime95 V2810 Stress (external Monitor) | |
| Intel Core i9-14900K | |
| Intel Core i9-13900K | |
| Intel Core i5-14600K | |
| Intel Core i7-13700K | |
| Intel Core i5-13600K | |
| AMD Ryzen 9 7950X (Idle: 95.2 W) | |
| Intel Core i7-12700 | |
| AMD Ryzen 9 7950X3D | |
| Intel Core i5-12400F | |
| Intel Core i5-13400 | |
| AMD Ryzen 7 7800X3D | |
| AMD Ryzen 9 7945HX | |
| AMD Ryzen 7 7745HX | |
| Power Consumption / Cinebench R23 Multi (external Monitor) | |
| Intel Core i9-14900K | |
| AMD Ryzen 9 7950X (95.2) | |
| Intel Core i5-14600K | |
| AMD Ryzen 9 7950X3D | |
| AMD Ryzen 7 7800X3D | |
| AMD Ryzen 9 7945HX | |
| AMD Ryzen 7 7745HX | |
| Power Consumption / Cinebench R23 Single (external Monitor) | |
| AMD Ryzen 7 7800X3D | |
| AMD Ryzen 9 7950X (95.2) | |
| Intel Core i9-14900K | |
| Intel Core i5-14600K | |
| AMD Ryzen 9 7945HX | |
| AMD Ryzen 7 7745HX | |
| Power Consumption / Cinebench R15 Multi Efficiency (external Monitor) | |
| AMD Ryzen 9 7945HX | |
| AMD Ryzen 7 7745HX | |
| AMD Ryzen 9 7950X3D | |
| AMD Ryzen 9 7950X | |
| AMD Ryzen 7 7800X3D | |
| Intel Core i9-13900K | |
| Intel Core i5-13600K | |
| Intel Core i9-14900K | |
| Intel Core i5-14600K | |
* ... Meglio usare valori piccoli
Power consumption with and without dedicated graphics card
Power consumption with Nvidia GeForce RTX 4090
Pro
Contro
Verdetto - Potente AMD Ryzen 9 7945HX

Minisforum BD790i è una scheda madre molto potente che include un SoC e che, come scheda madre Mini-ITX, offre la base perfetta per la costruzione di piccoli sistemi. Trattandosi solo di una scheda madre, il produttore si rivolge a clienti disposti a costruire un sistema da soli. A differenza dei mini PC già pronti, bisogna comunque occuparsi dei componenti aggiuntivi. Va da sé che questo comporta dei costi aggiuntivi.
In combinazione con l'AMD Ryzen 9 7945HX, il Minisforum BD790i offre prestazioni impressionanti, grande efficienza e, grazie al supporto PCIe-5.0, buone qualità a prova di futuro per le schede grafiche e gli SSD.
Sulla base dei nostri test del Minisforum BD790i stesso, possiamo dire che AMD Ryzen 9 7945HX è un processore estremamente potente, che attualmente può gestire tutti i compiti con facilità. Rispetto a un Intel Core i9-14900K o a un AMD Ryzen 9 7950X, l'AMD Ryzen 9 7945HX deve ammettere la sconfitta, anche se la differenza di prestazioni è minima. In relazione al consumo energetico, i processori desktop tradizionali non riescono più a tenere il passo. La decisione di inserire la tecnologia dei computer portatili in una scheda madre convenzionale è sensata per quanto riguarda l'efficienza. Tuttavia, lo svantaggio maggiore è che il SoC non può essere semplicemente sostituito. Inoltre, si è limitati a un'unità di raffreddamento fissa, il che significa che non è possibile utilizzare unità di raffreddamento alternative.
A prima vista, il prezzo attuale di poco meno di 500 dollari sembra molto alto. Tuttavia, quando si confrontano i valori delle prestazioni, AMD Ryzen 9 7945HX non ha certo bisogno di nascondersi dietro i processori desktop più veloci. Pertanto, riteniamo che il suo prezzo attuale sia giustificato e, se non desidera aggiornare la CPU in un secondo momento, può acquistarla senza esitazioni.
Prezzo e disponibilità
Al momento in cui scriviamo, può acquistare il Minisforum BD790i su Amazon a 479,99 dollari.
Transparency
The selection of devices to be reviewed is made by our editorial team. The test sample was given to the author by the manufacturer free of charge for the purposes of review. There was no third-party influence on this review, nor did the manufacturer receive a copy of this review before publication. There was no obligation to publish this review. We never accept compensation or payment in return for our reviews. As an independent media company, Notebookcheck is not subjected to the authority of manufacturers, retailers or publishers.
This is how Notebookcheck is testing
Every year, Notebookcheck independently reviews hundreds of laptops and smartphones using standardized procedures to ensure that all results are comparable. We have continuously developed our test methods for around 20 years and set industry standards in the process. In our test labs, high-quality measuring equipment is utilized by experienced technicians and editors. These tests involve a multi-stage validation process. Our complex rating system is based on hundreds of well-founded measurements and benchmarks, which maintains objectivity. Further information on our test methods can be found here.

