 Deutsch
 English
 Español
 Français
 Italiano
 Nederlands
 Polski
 Português
 Русский
 Türkçe
 Svenska
 Chinese
 Magyar
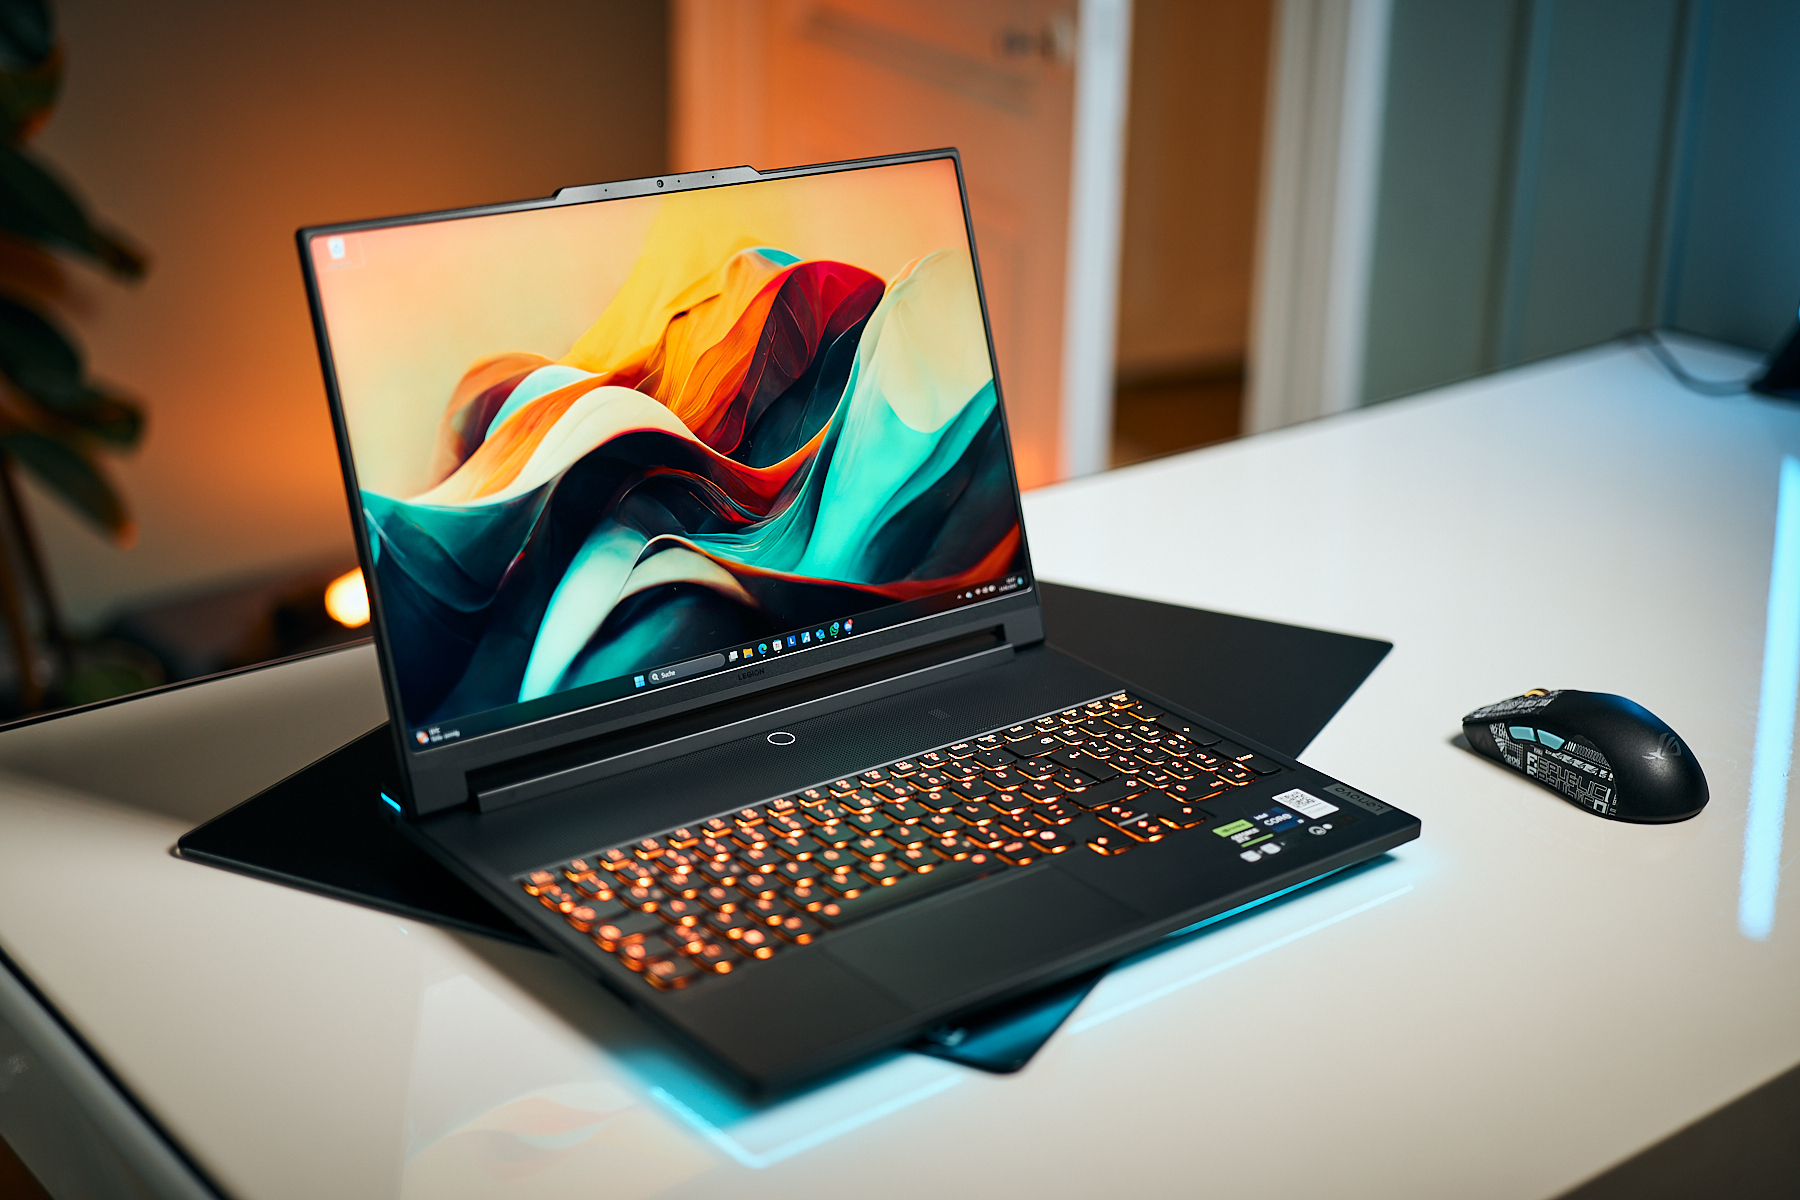
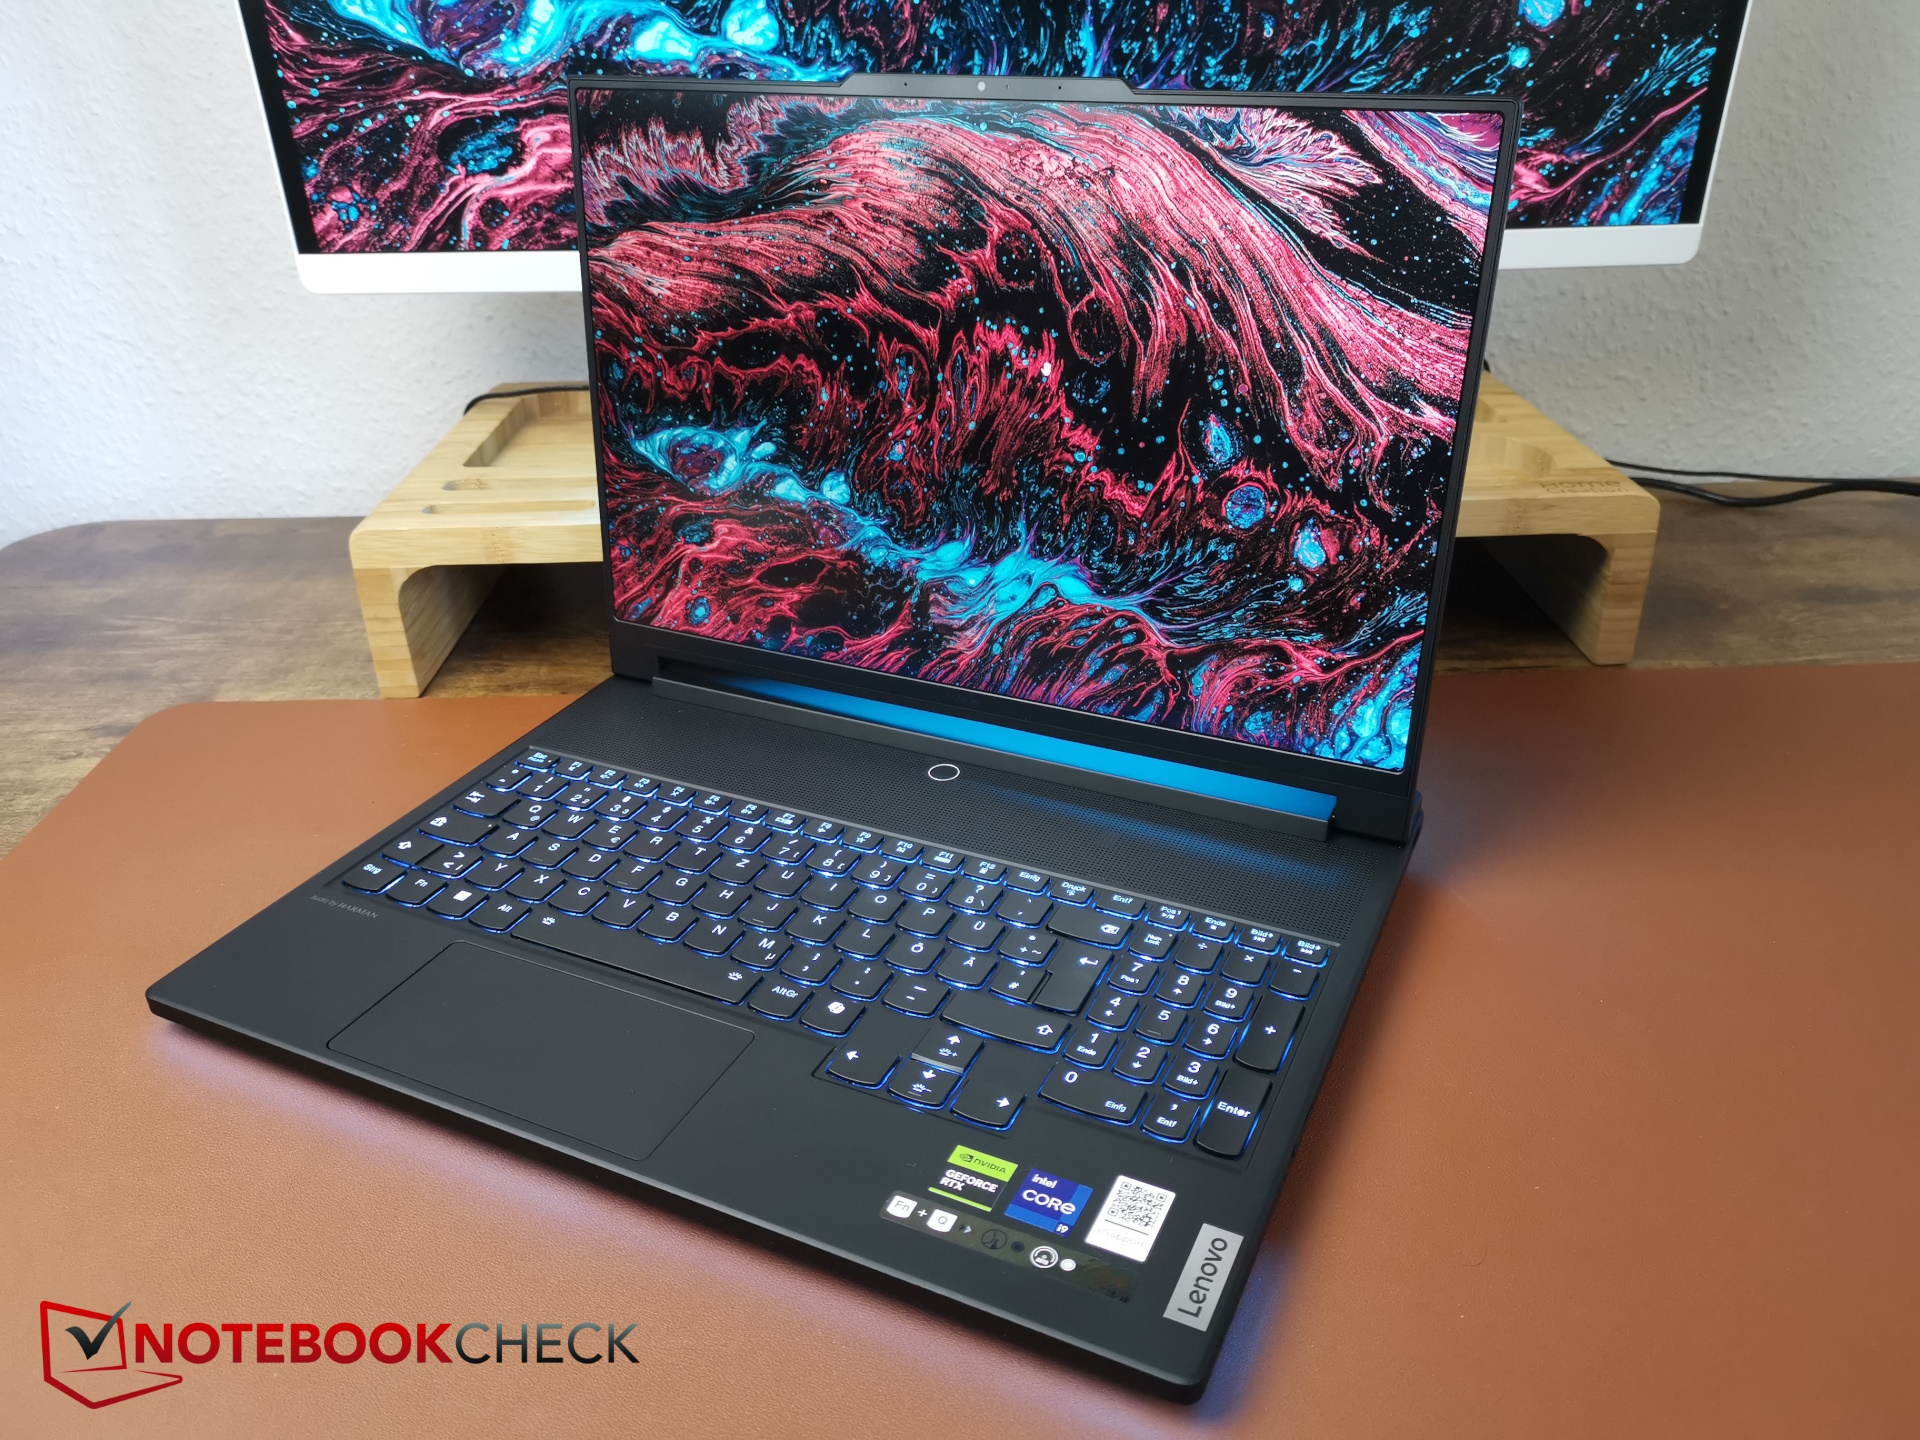
Recensione di Lenovo Legion 9 16IRX9 (Legion 9i): Quanto è alto il gamer RTX 4090?
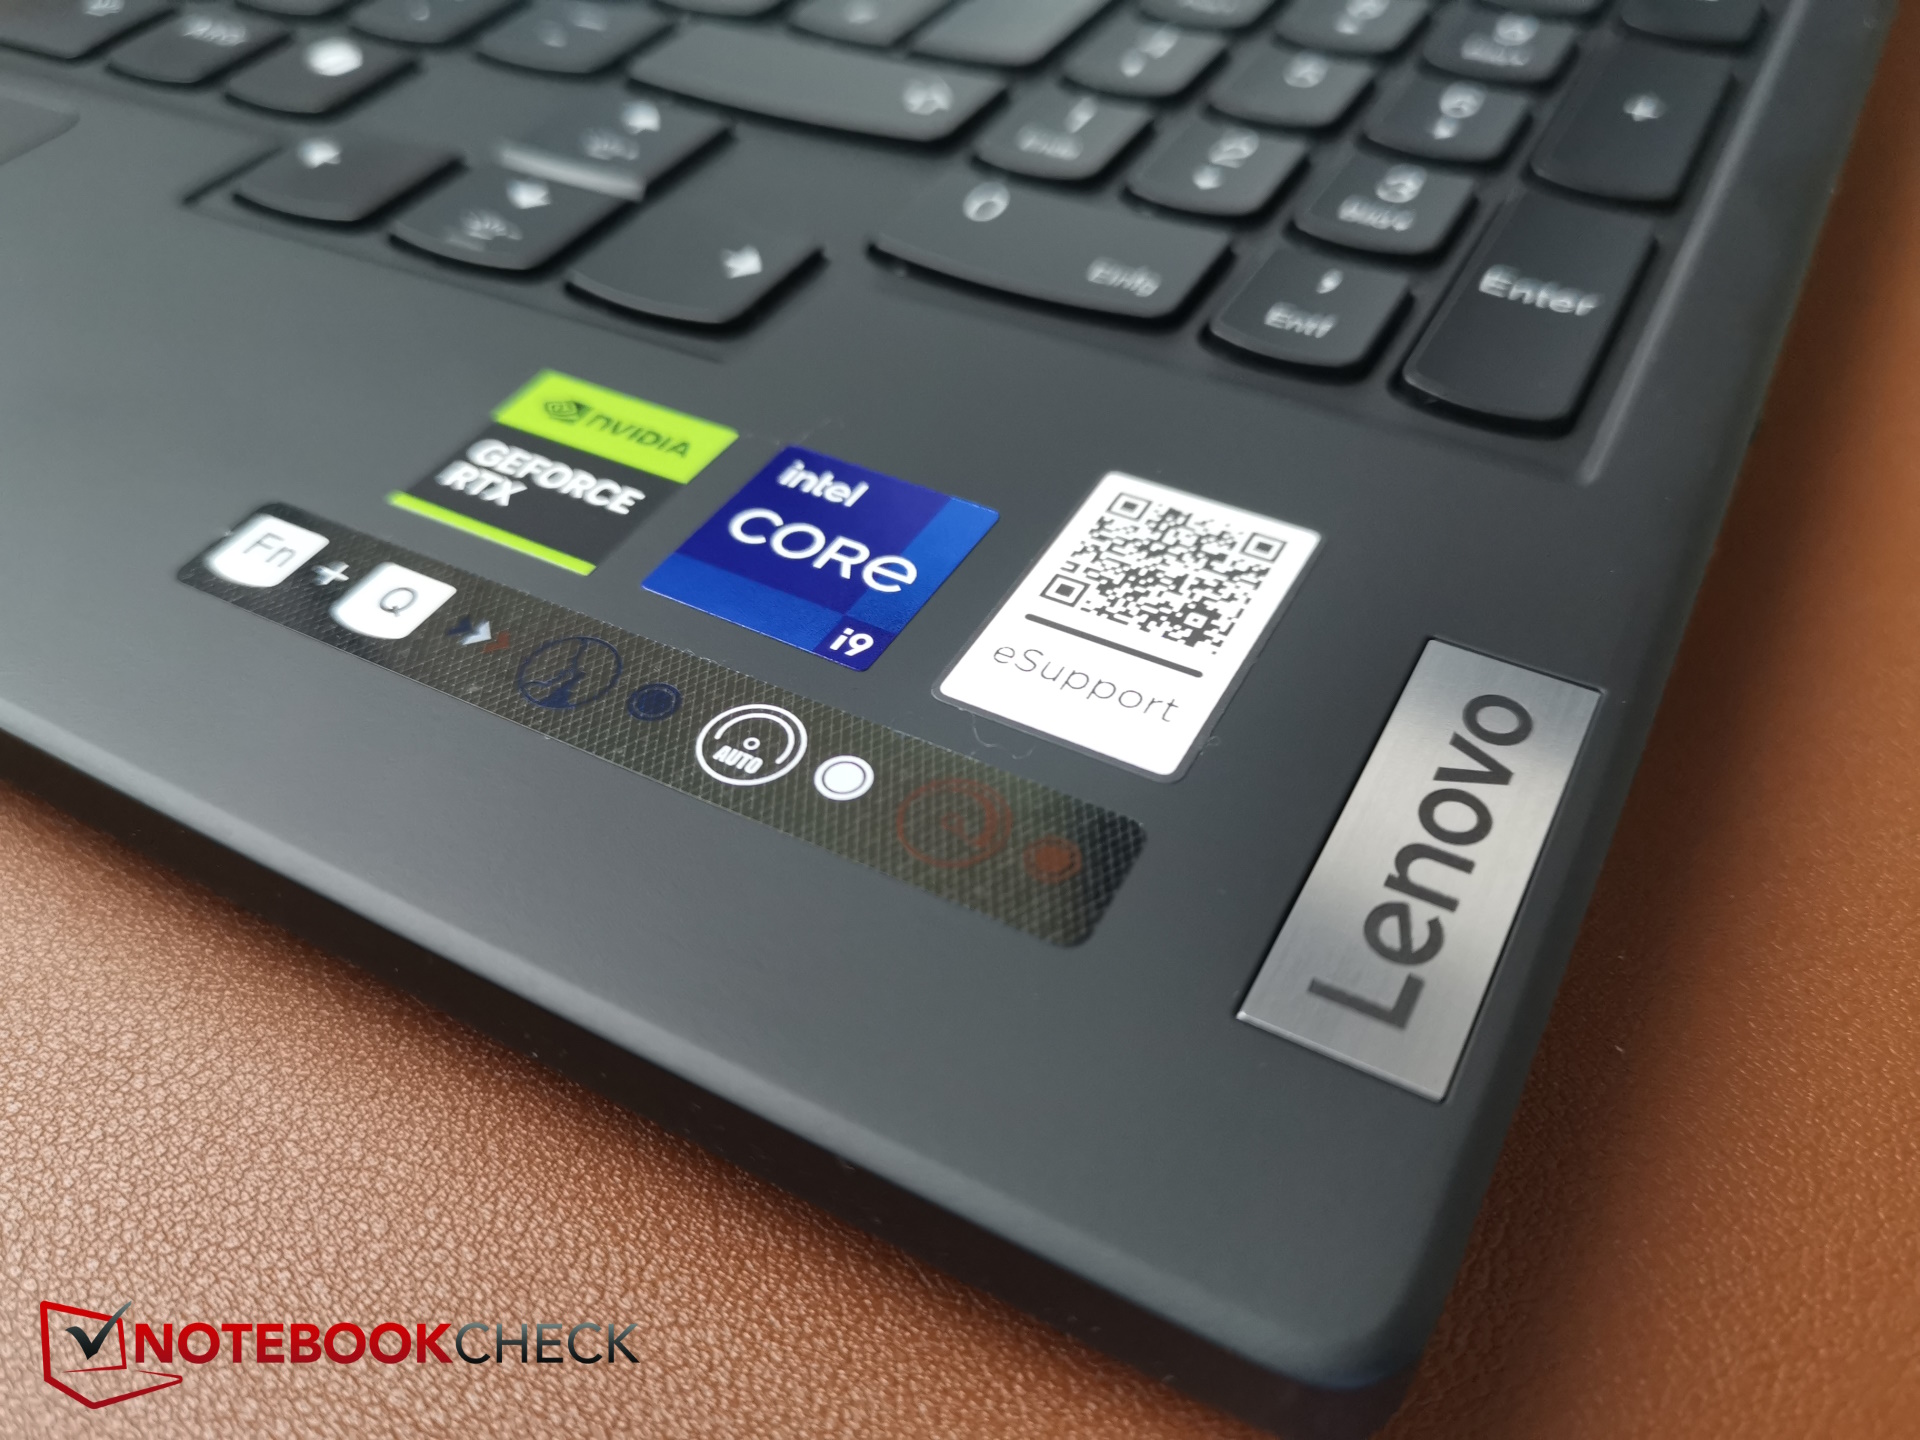
L'anno scorso abbiamo definito Legion 9i "il portatile da gioco più ambizioso di Lenovo fino ad oggi". La prossima generazione potrebbe non essere meno ambiziosa, ma le modifiche effettivamente apportate al gamer di fascia alta sono molto limitate. Solo la CPU è stata sostituita con l'ultima 14esima generazione di Intel, che rende il laptop più capace di gestire l'intelligenza artificiale.
Dato che i portatili da 16 pollici non sono spesso equipaggiati con la RTX 4090la confronteremo con il suo predecessore, il Razer Blade 16 (2024) così come ai gamer da 18 pollici, come l' Alienware m18 R2 e l' Asus ROG Strix Scar 18 (2024)e il 17 pollici Medion Erazer Beast X40 da 17 pollici (2024).
Aggiornamento: a causa dei problemi menzionati in questo test (cali di frame rate, basso punteggio single-core), ci siamo messi in contatto con il produttore (tramite la sua agenzia). Un potenziale dispositivo sostitutivo ha mostrato lo stesso punteggio single-core (misurato dall'agenzia), quindi almeno questo è stato confermato. Siamo ancora in contatto per quanto riguarda i frame rate e pubblicheremo una risposta il prima possibile.
Potenziali concorrenti a confrontos
Punteggio | Version | Data | Modello | Peso | Altezza | Dimensione | Risoluzione | Miglior Prezzo |
|---|---|---|---|---|---|---|---|---|
| 83.9 % | v8 (new) | 06/2024 | Lenovo Legion 9 16IRX9, RTX 4090 i9-14900HX, NVIDIA GeForce RTX 4090 Laptop GPU | 2.5 kg | 22.7 mm | 16.00" | 3200x2000 | |
| 90.2 % | v7 (old) | 10/2023 | Lenovo Legion 9 16IRX8 i9-13980HX, NVIDIA GeForce RTX 4090 Laptop GPU | 2.6 kg | 22.7 mm | 16.00" | 3200x2000 | |
| 91.1 % | v7 (old) | 02/2024 | Razer Blade 16 2024, RTX 4090 i9-14900HX, NVIDIA GeForce RTX 4090 Laptop GPU | 2.5 kg | 22 mm | 16.00" | 2560x1600 | |
| 89.5 % | v7 (old) | 03/2024 | Alienware m18 R2 i9-14900HX, NVIDIA GeForce RTX 4090 Laptop GPU | 4 kg | 26.7 mm | 18.00" | 2560x1600 | |
| 88.3 % | v7 (old) | 02/2024 | Asus ROG Strix Scar 18 G834JYR (2024) i9-14900HX, NVIDIA GeForce RTX 4090 Laptop GPU | 3.1 kg | 30.8 mm | 18.00" | 2560x1600 | |
| 89.2 % | v7 (old) | 02/2024 | Medion Erazer Beast X40 2024 i9-14900HX, NVIDIA GeForce RTX 4090 Laptop GPU | 2.9 kg | 36 mm | 17.00" | 2560x1600 |
Nota: abbiamo recentemente aggiornato il nostro sistema di valutazione e i risultati della versione 8 non sono paragonabili ai risultati della versione 7. Ulteriori informazioni sono disponibili qui .
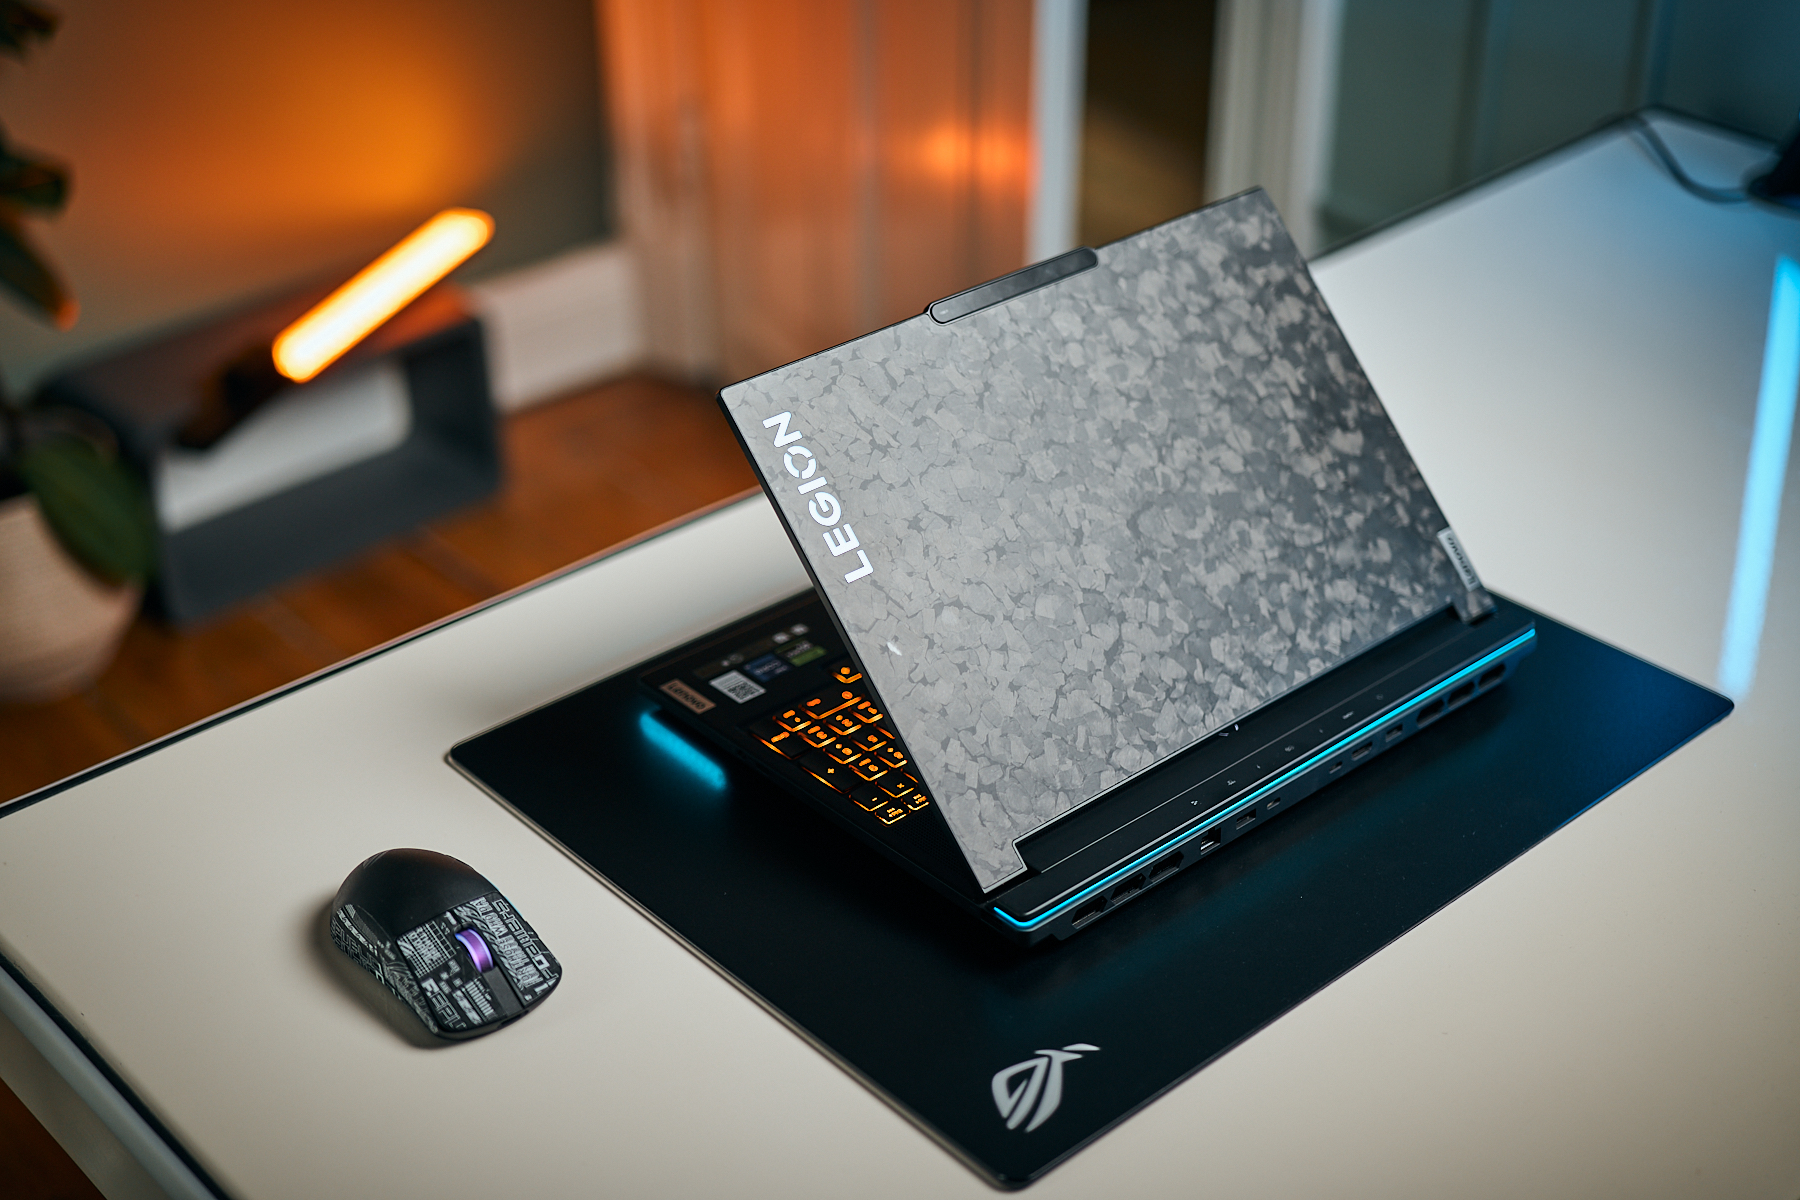
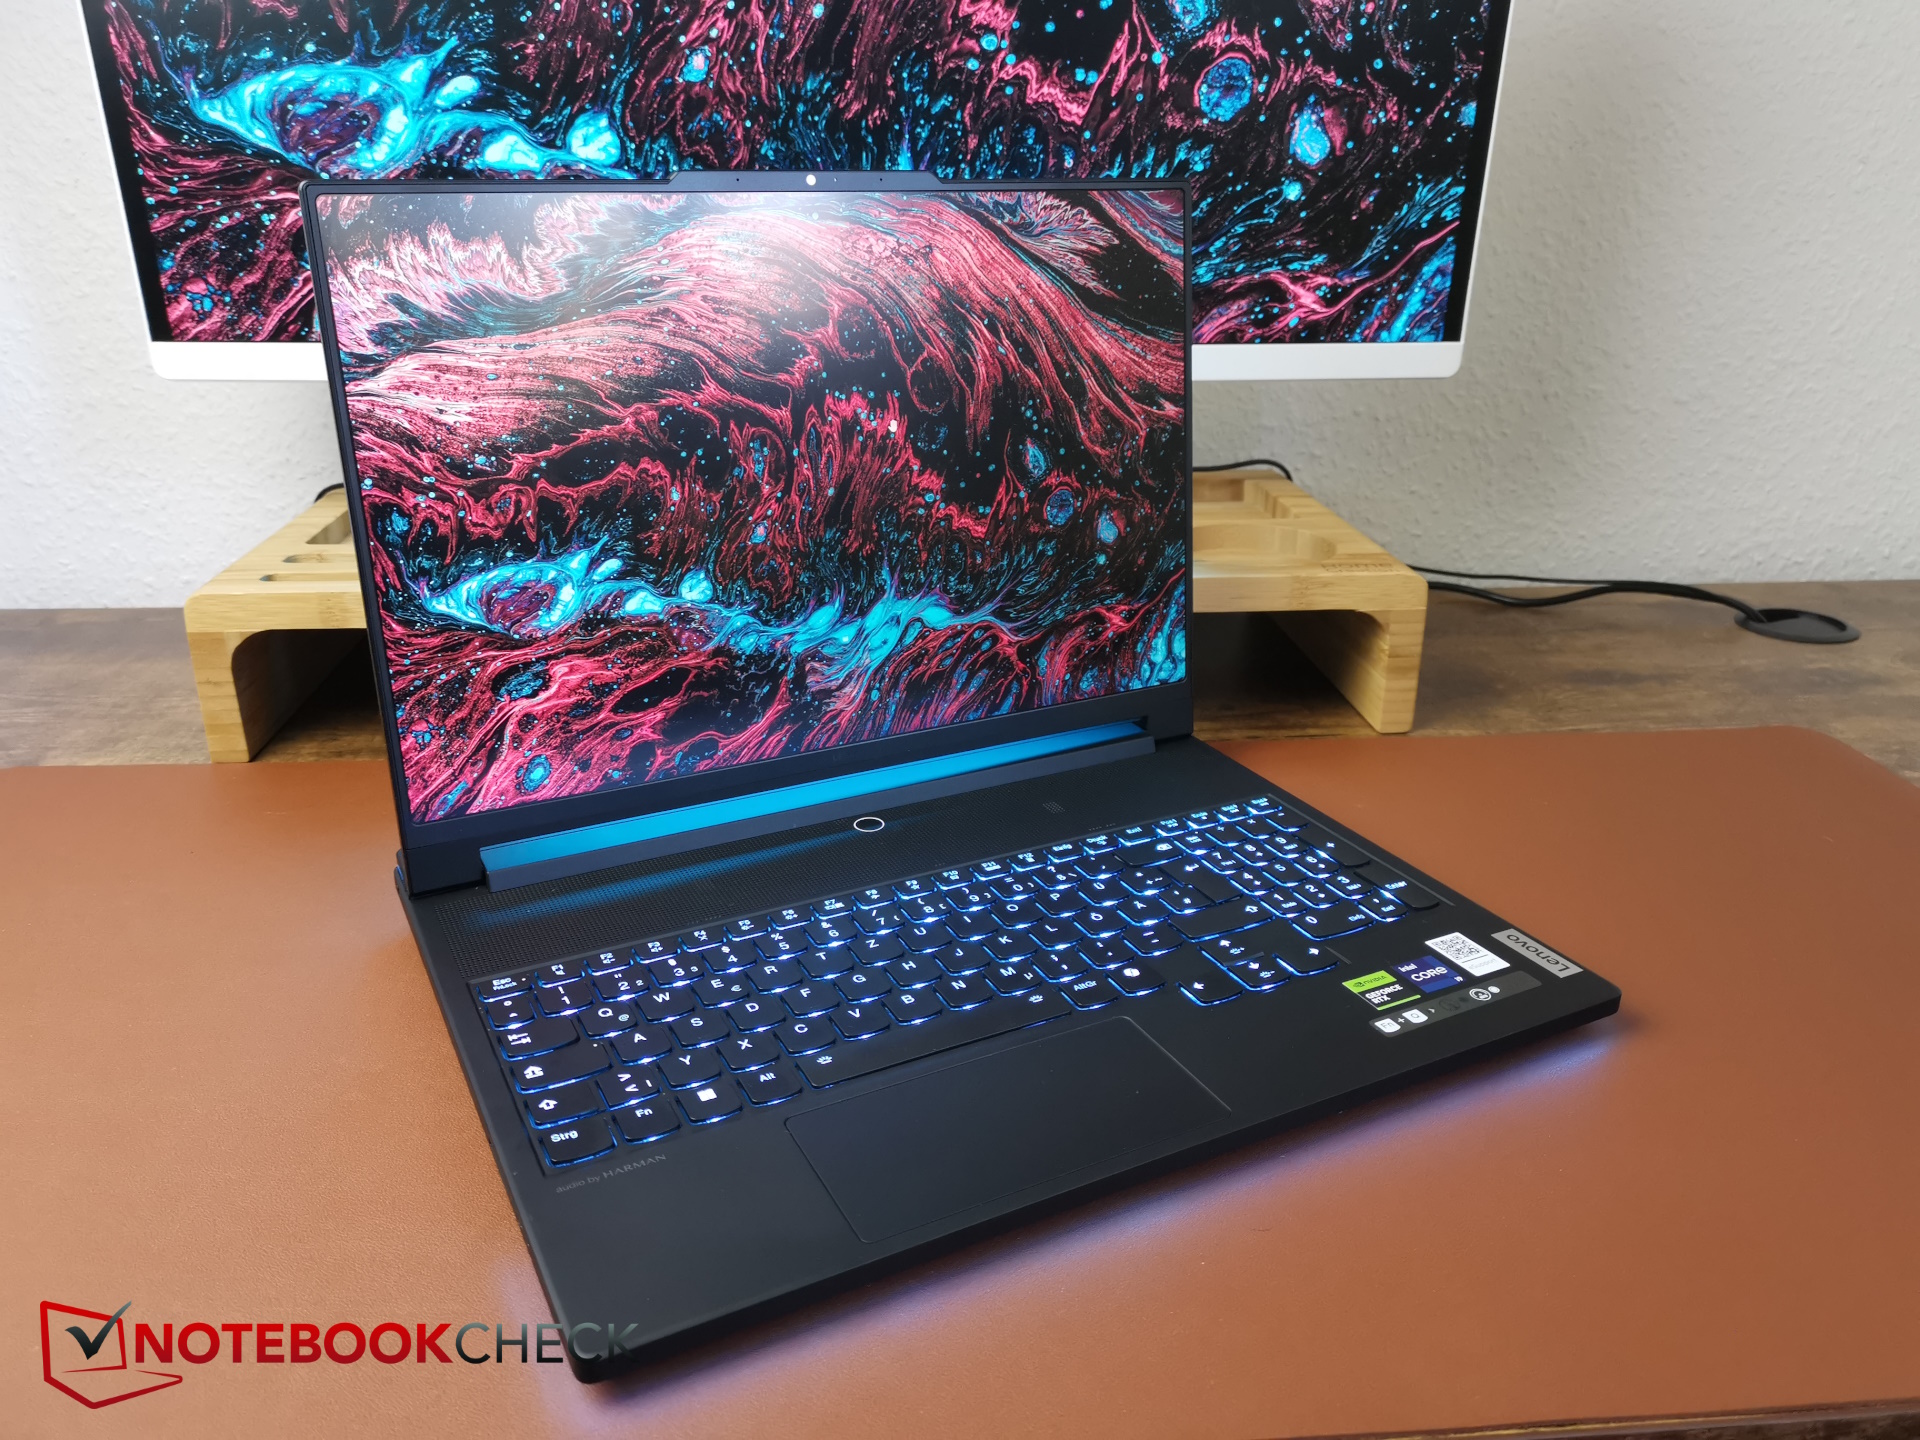
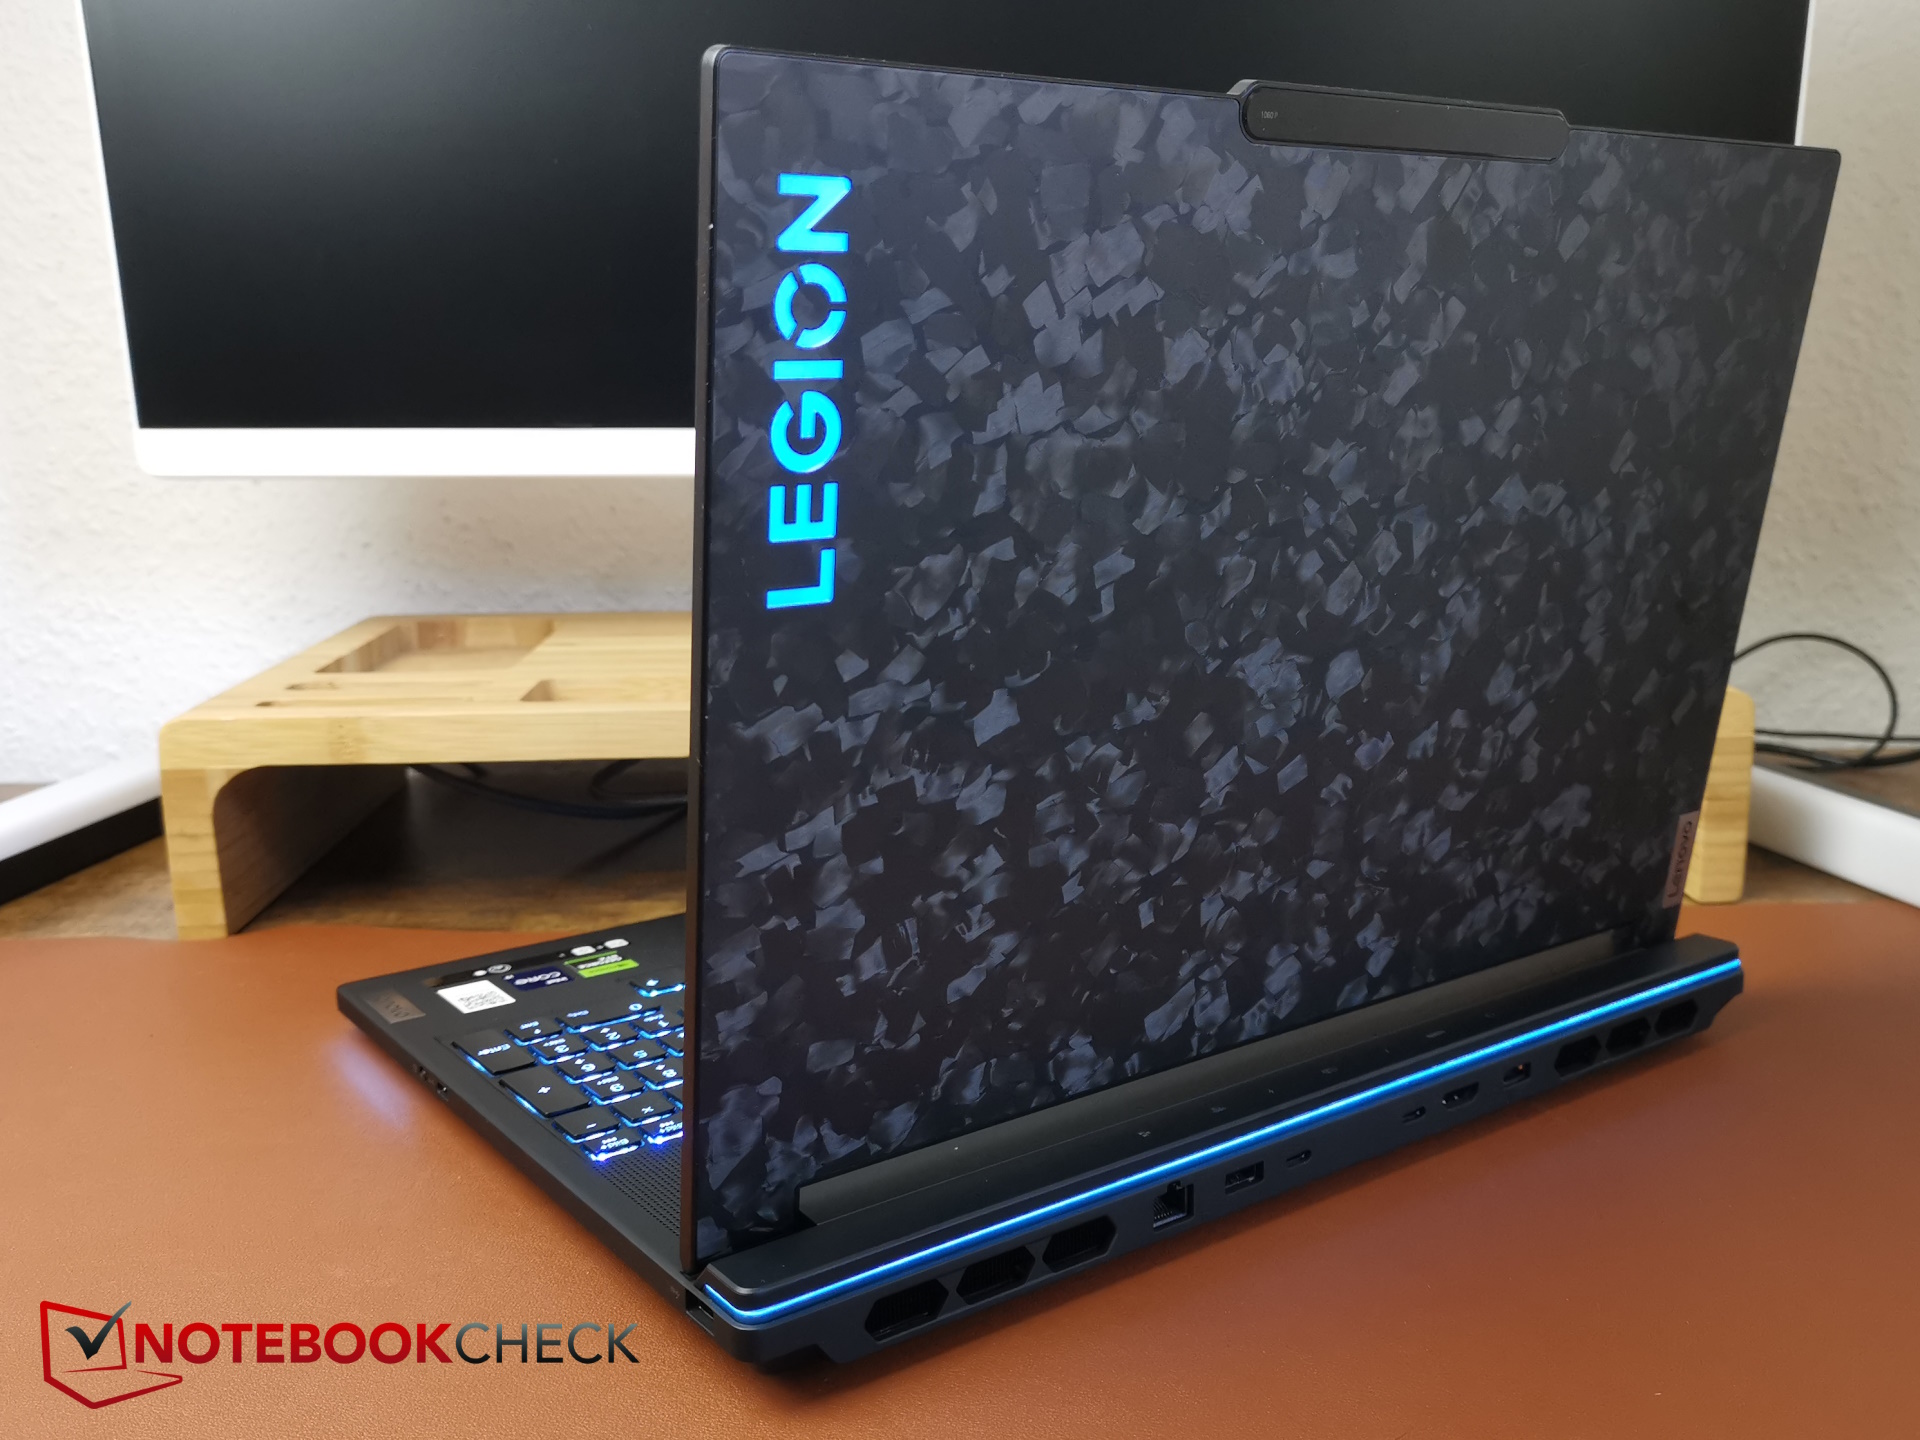
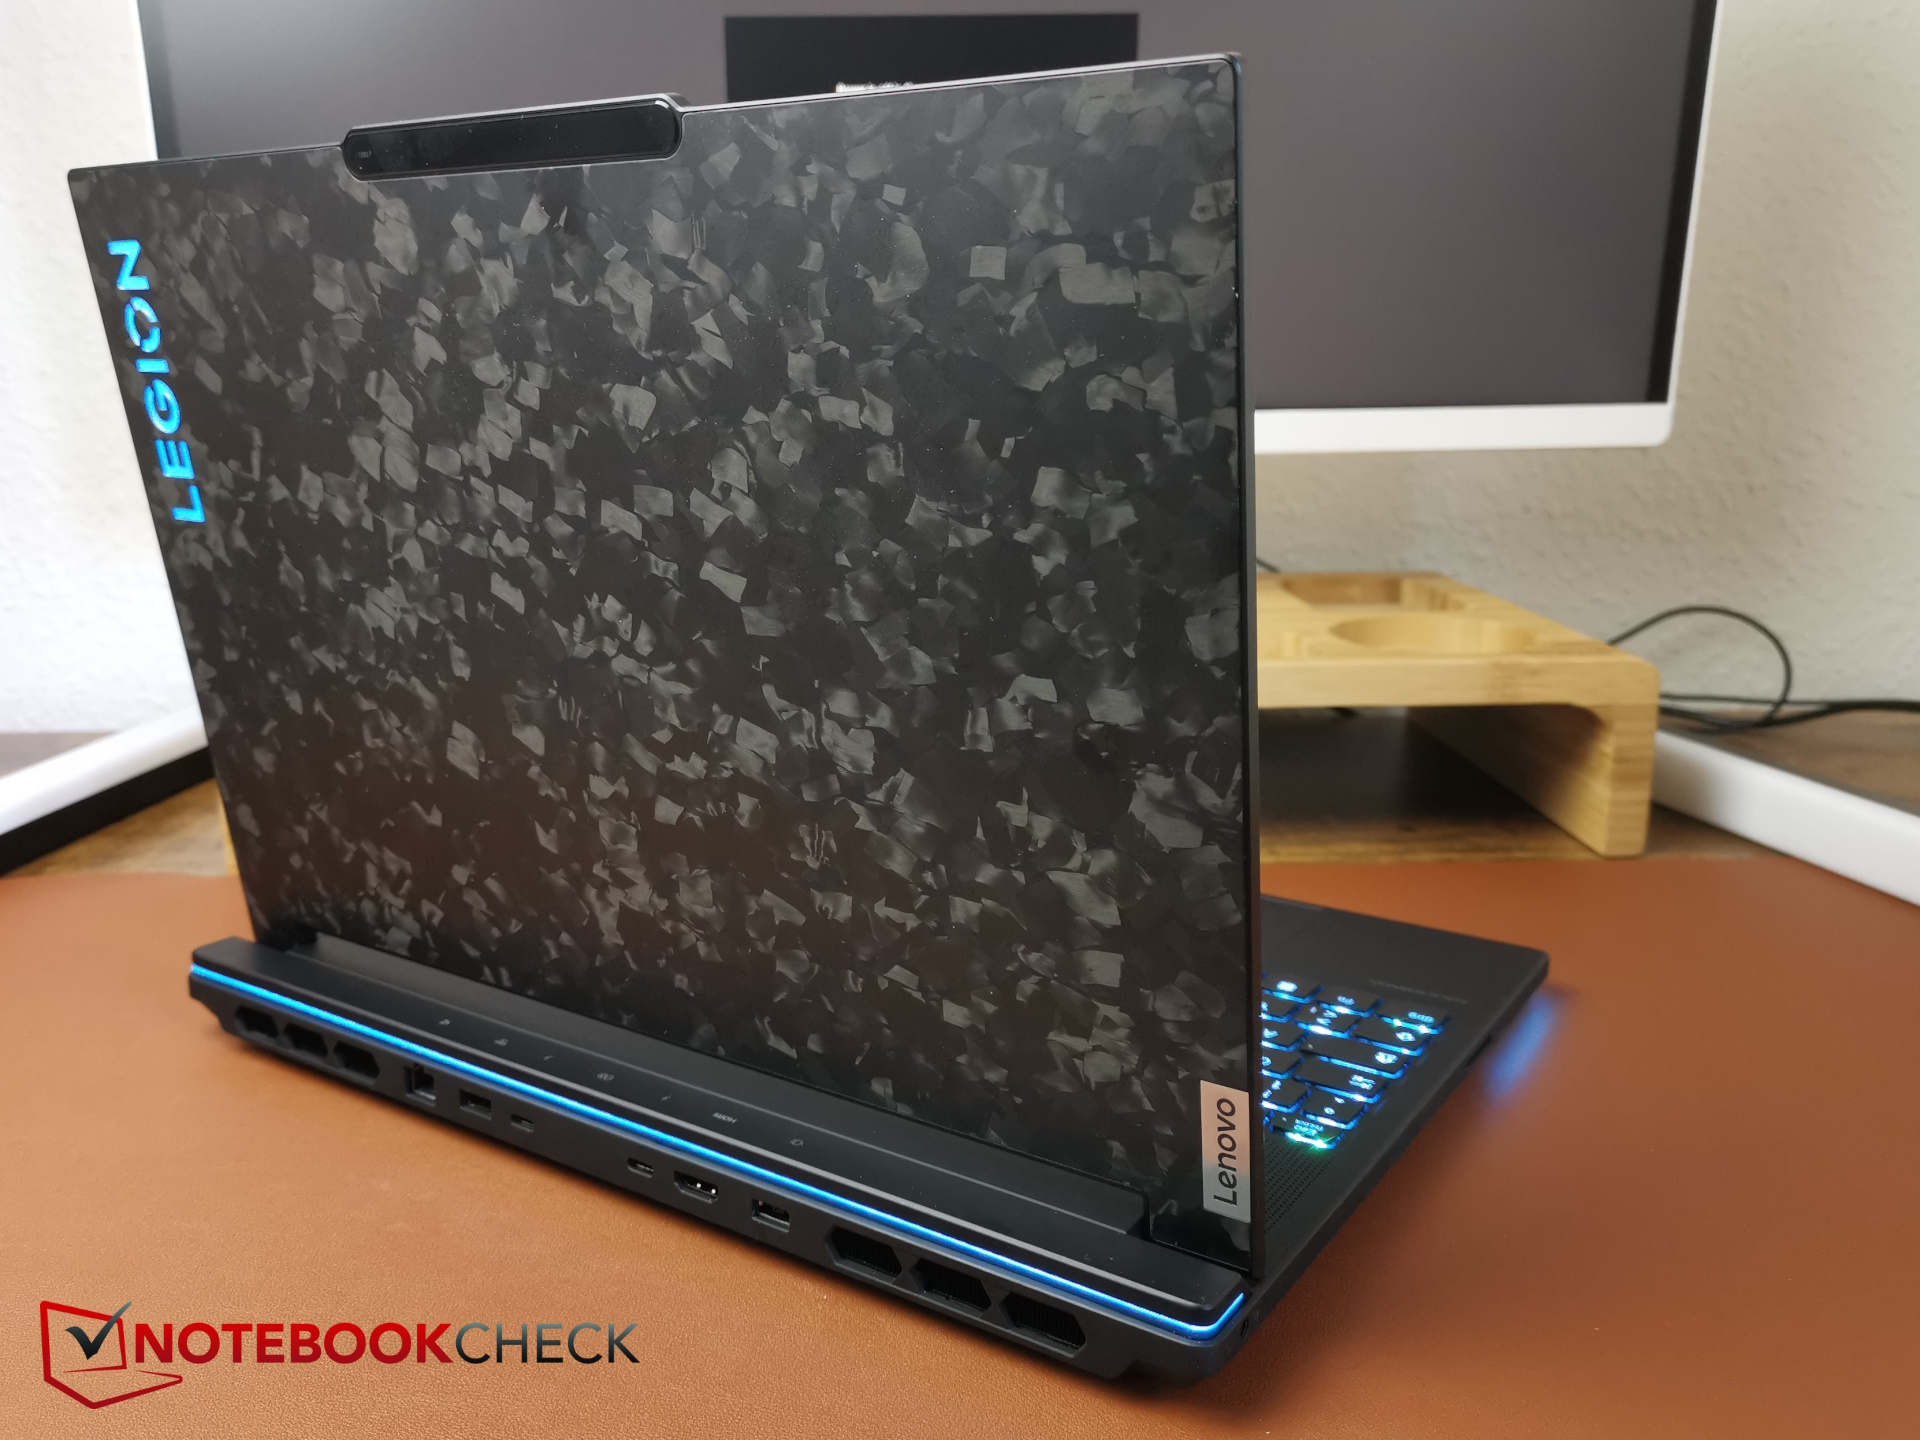
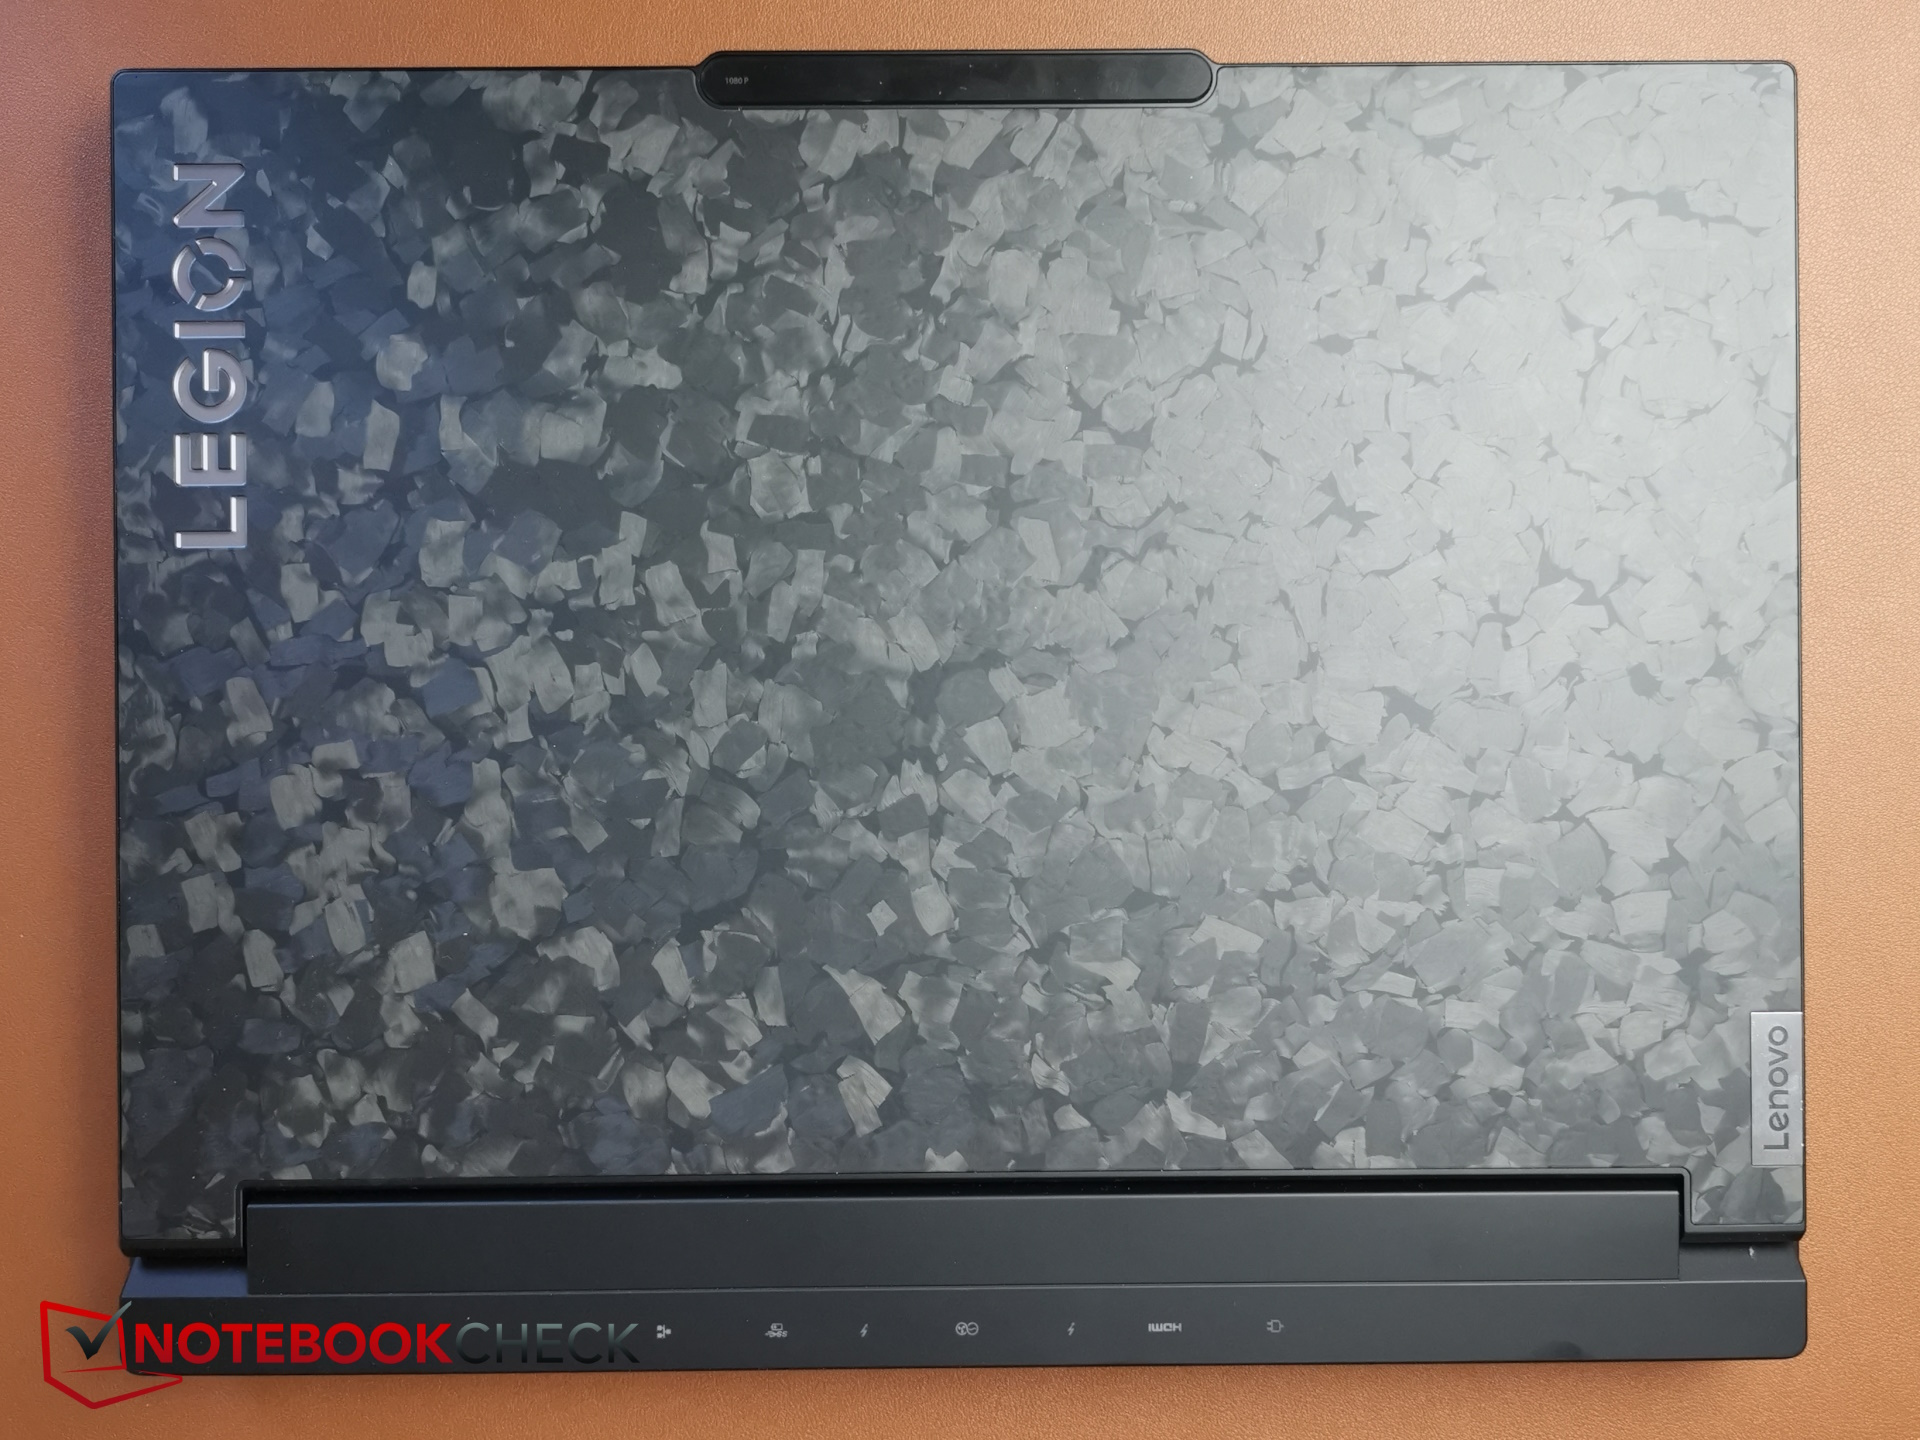
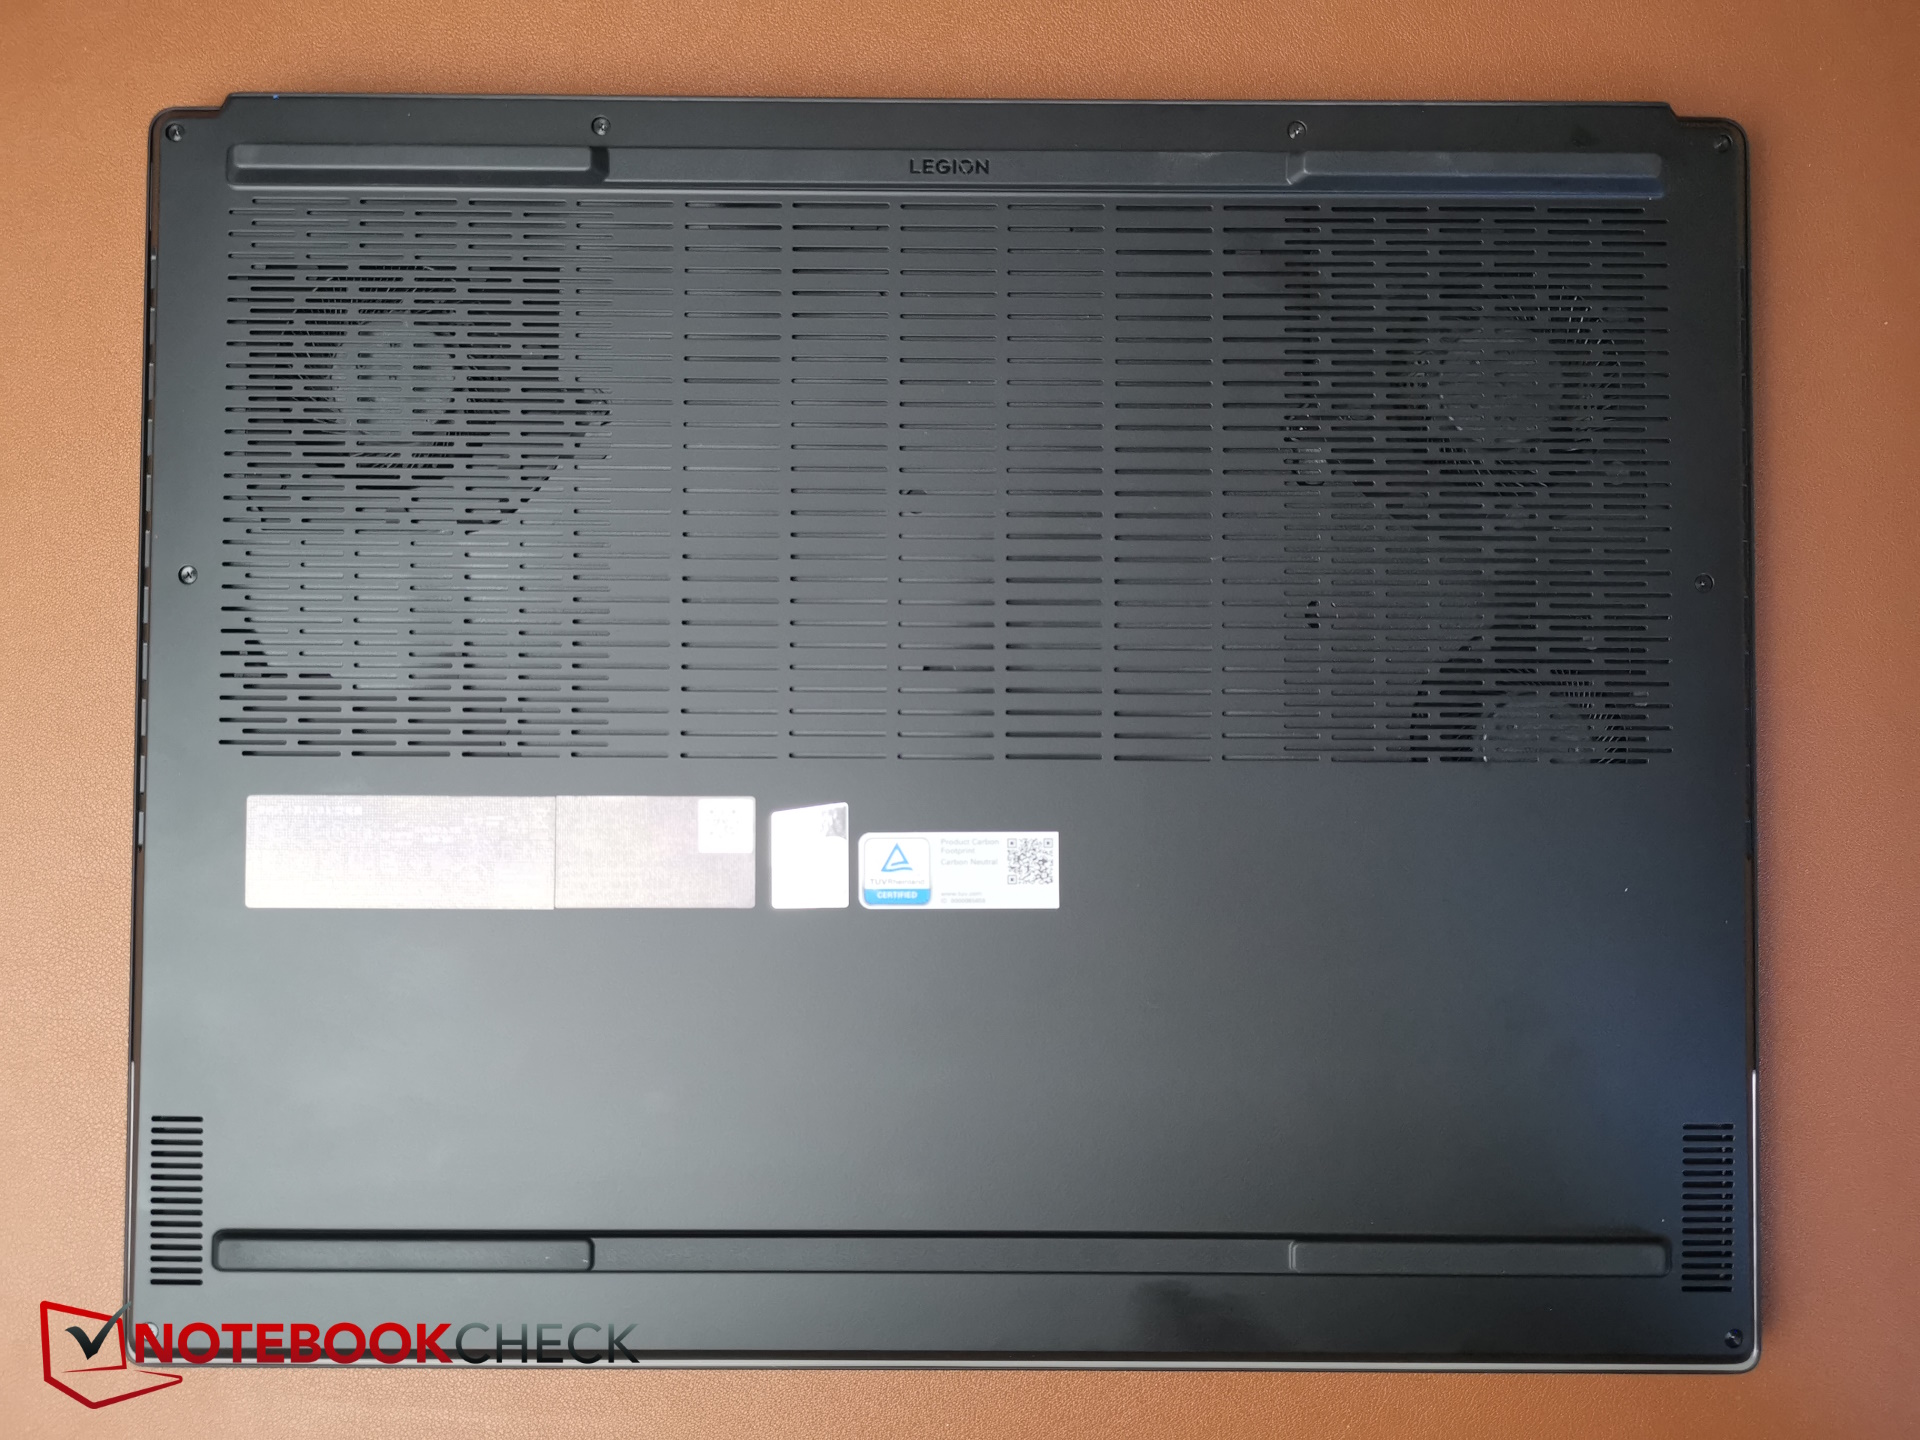
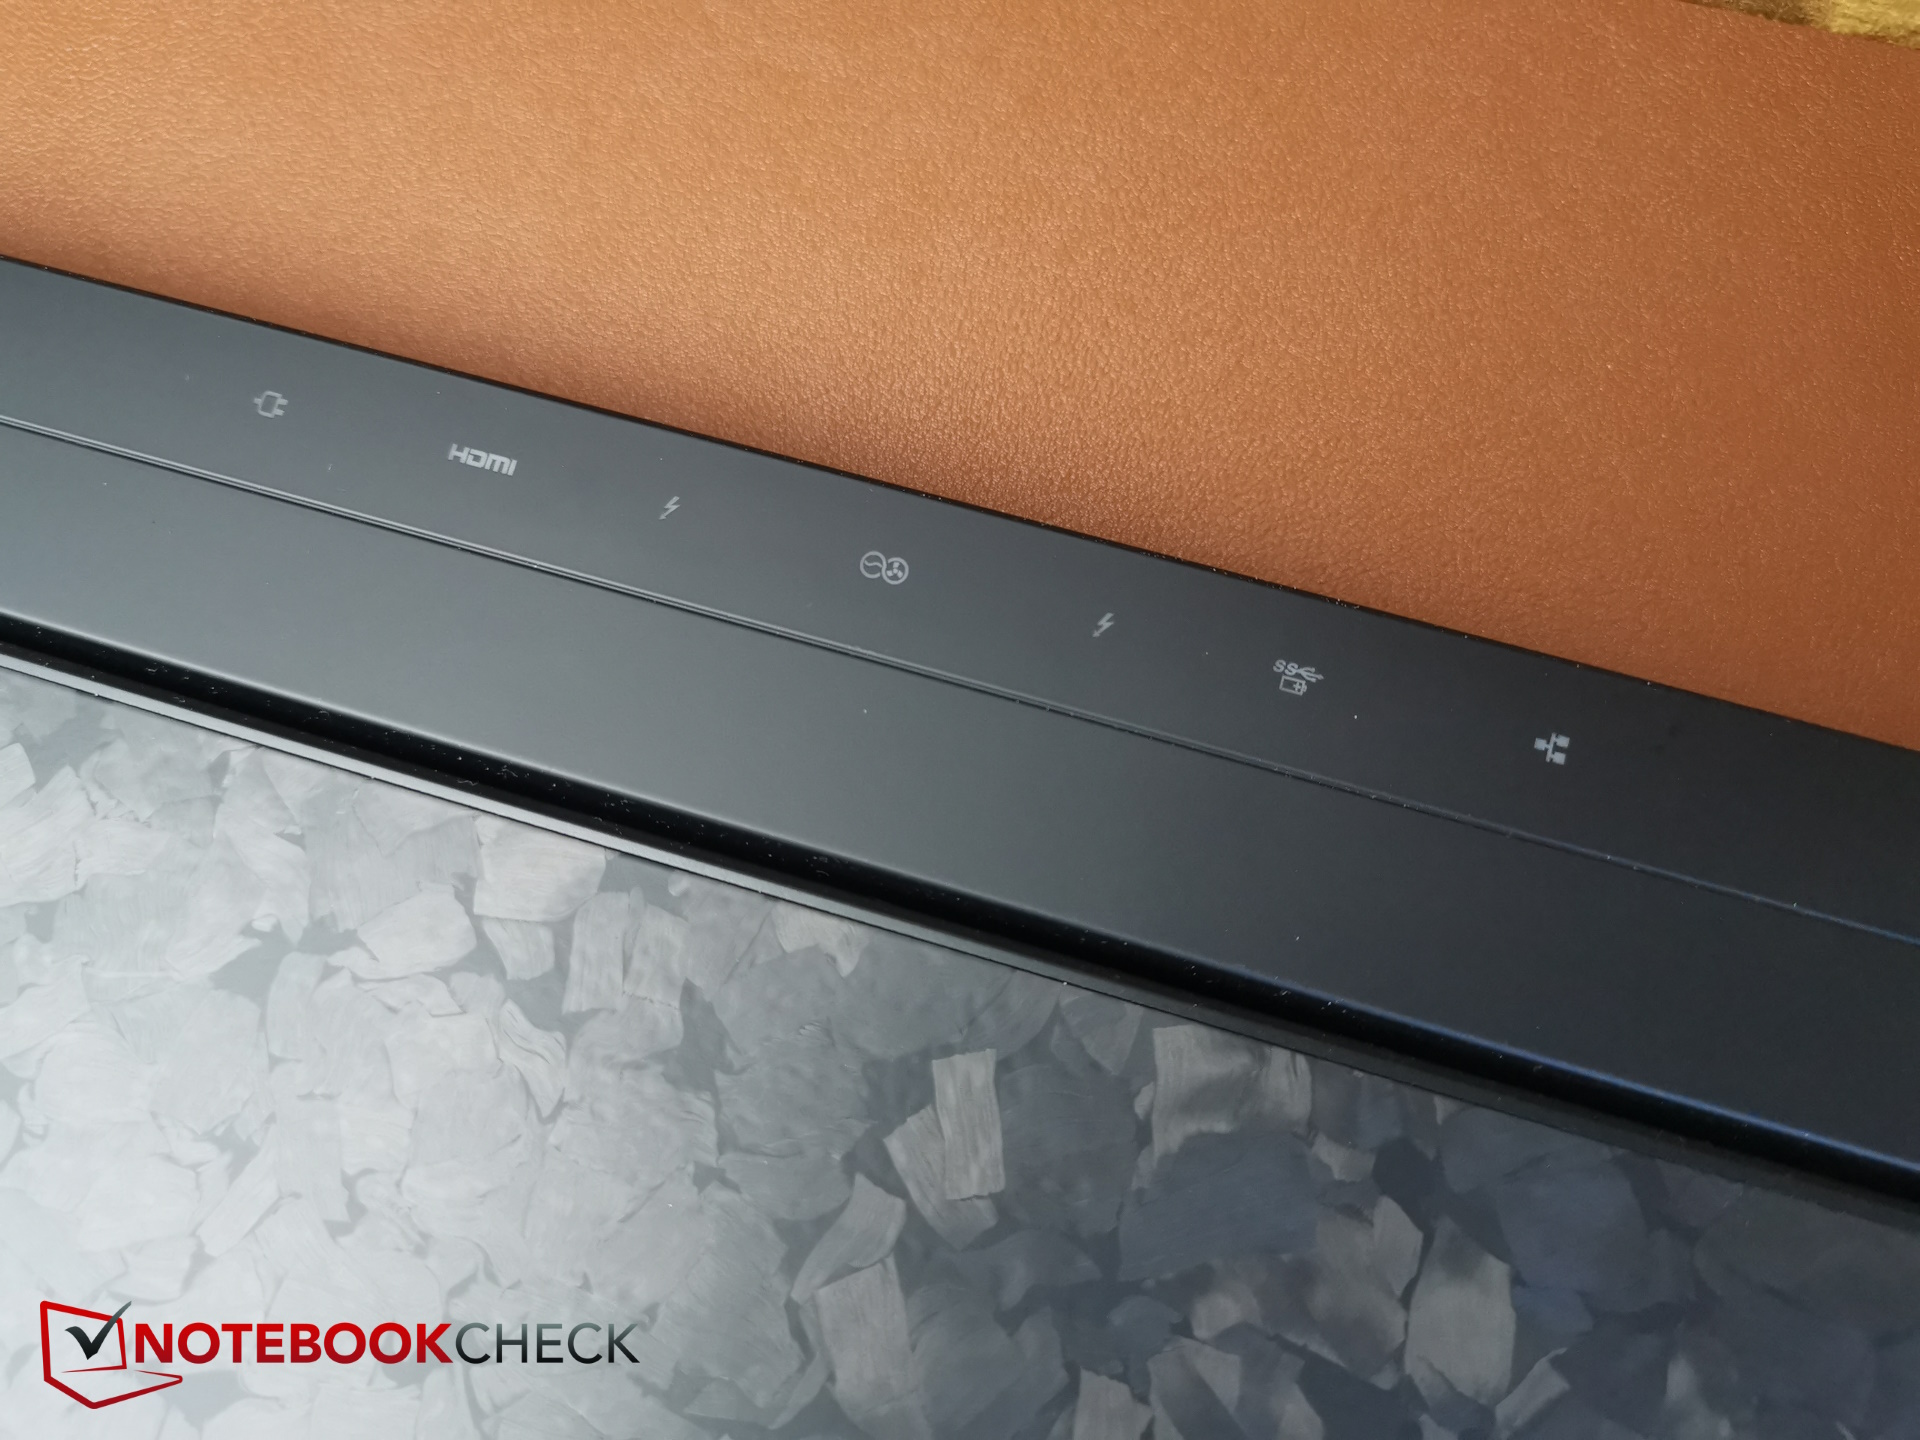
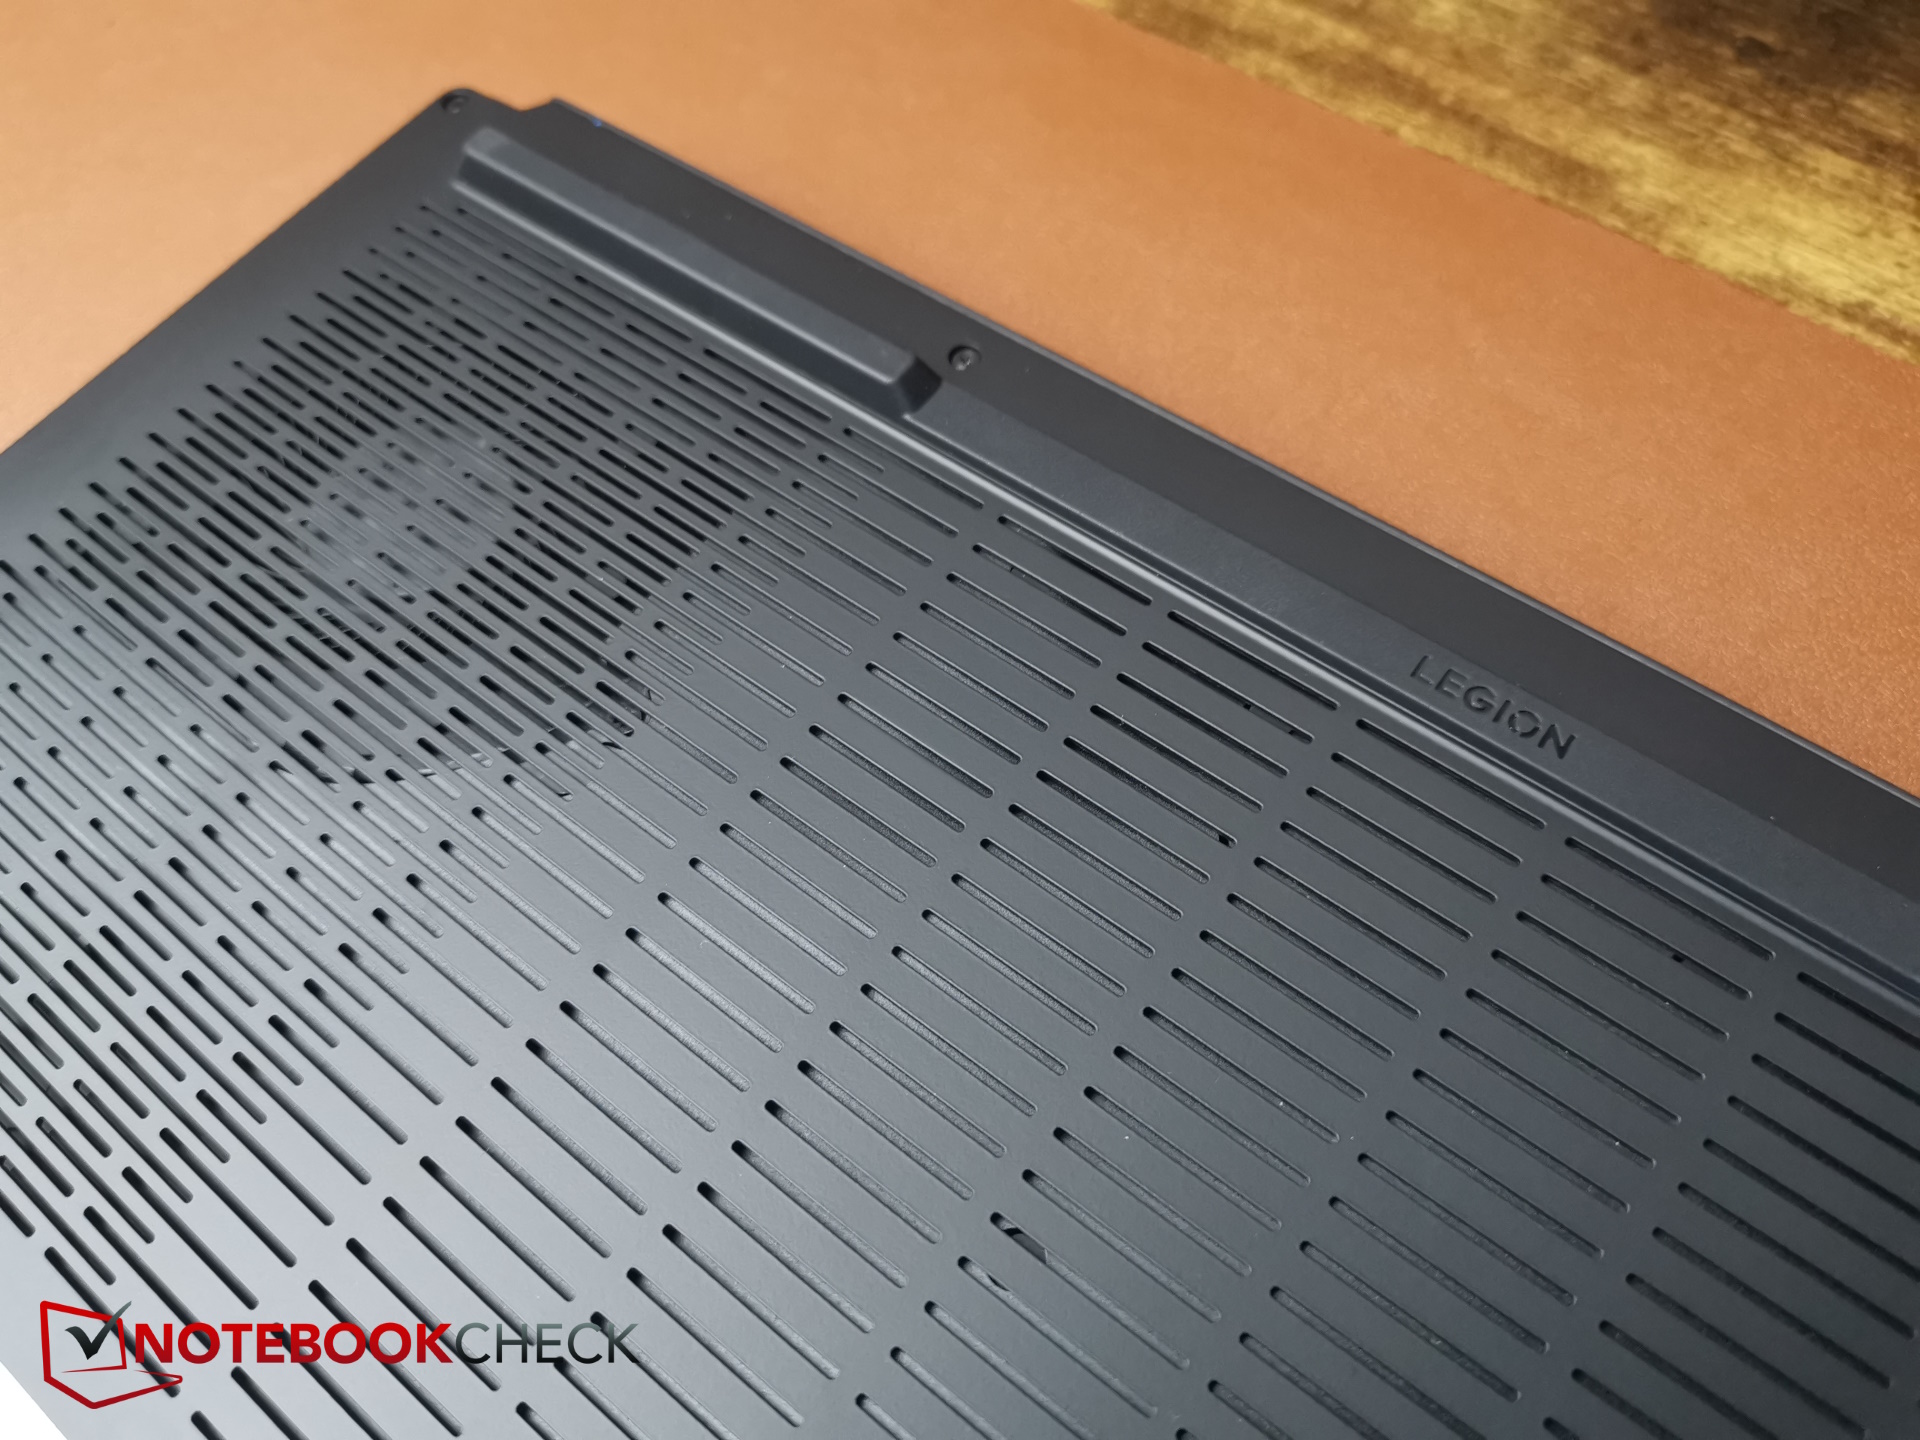
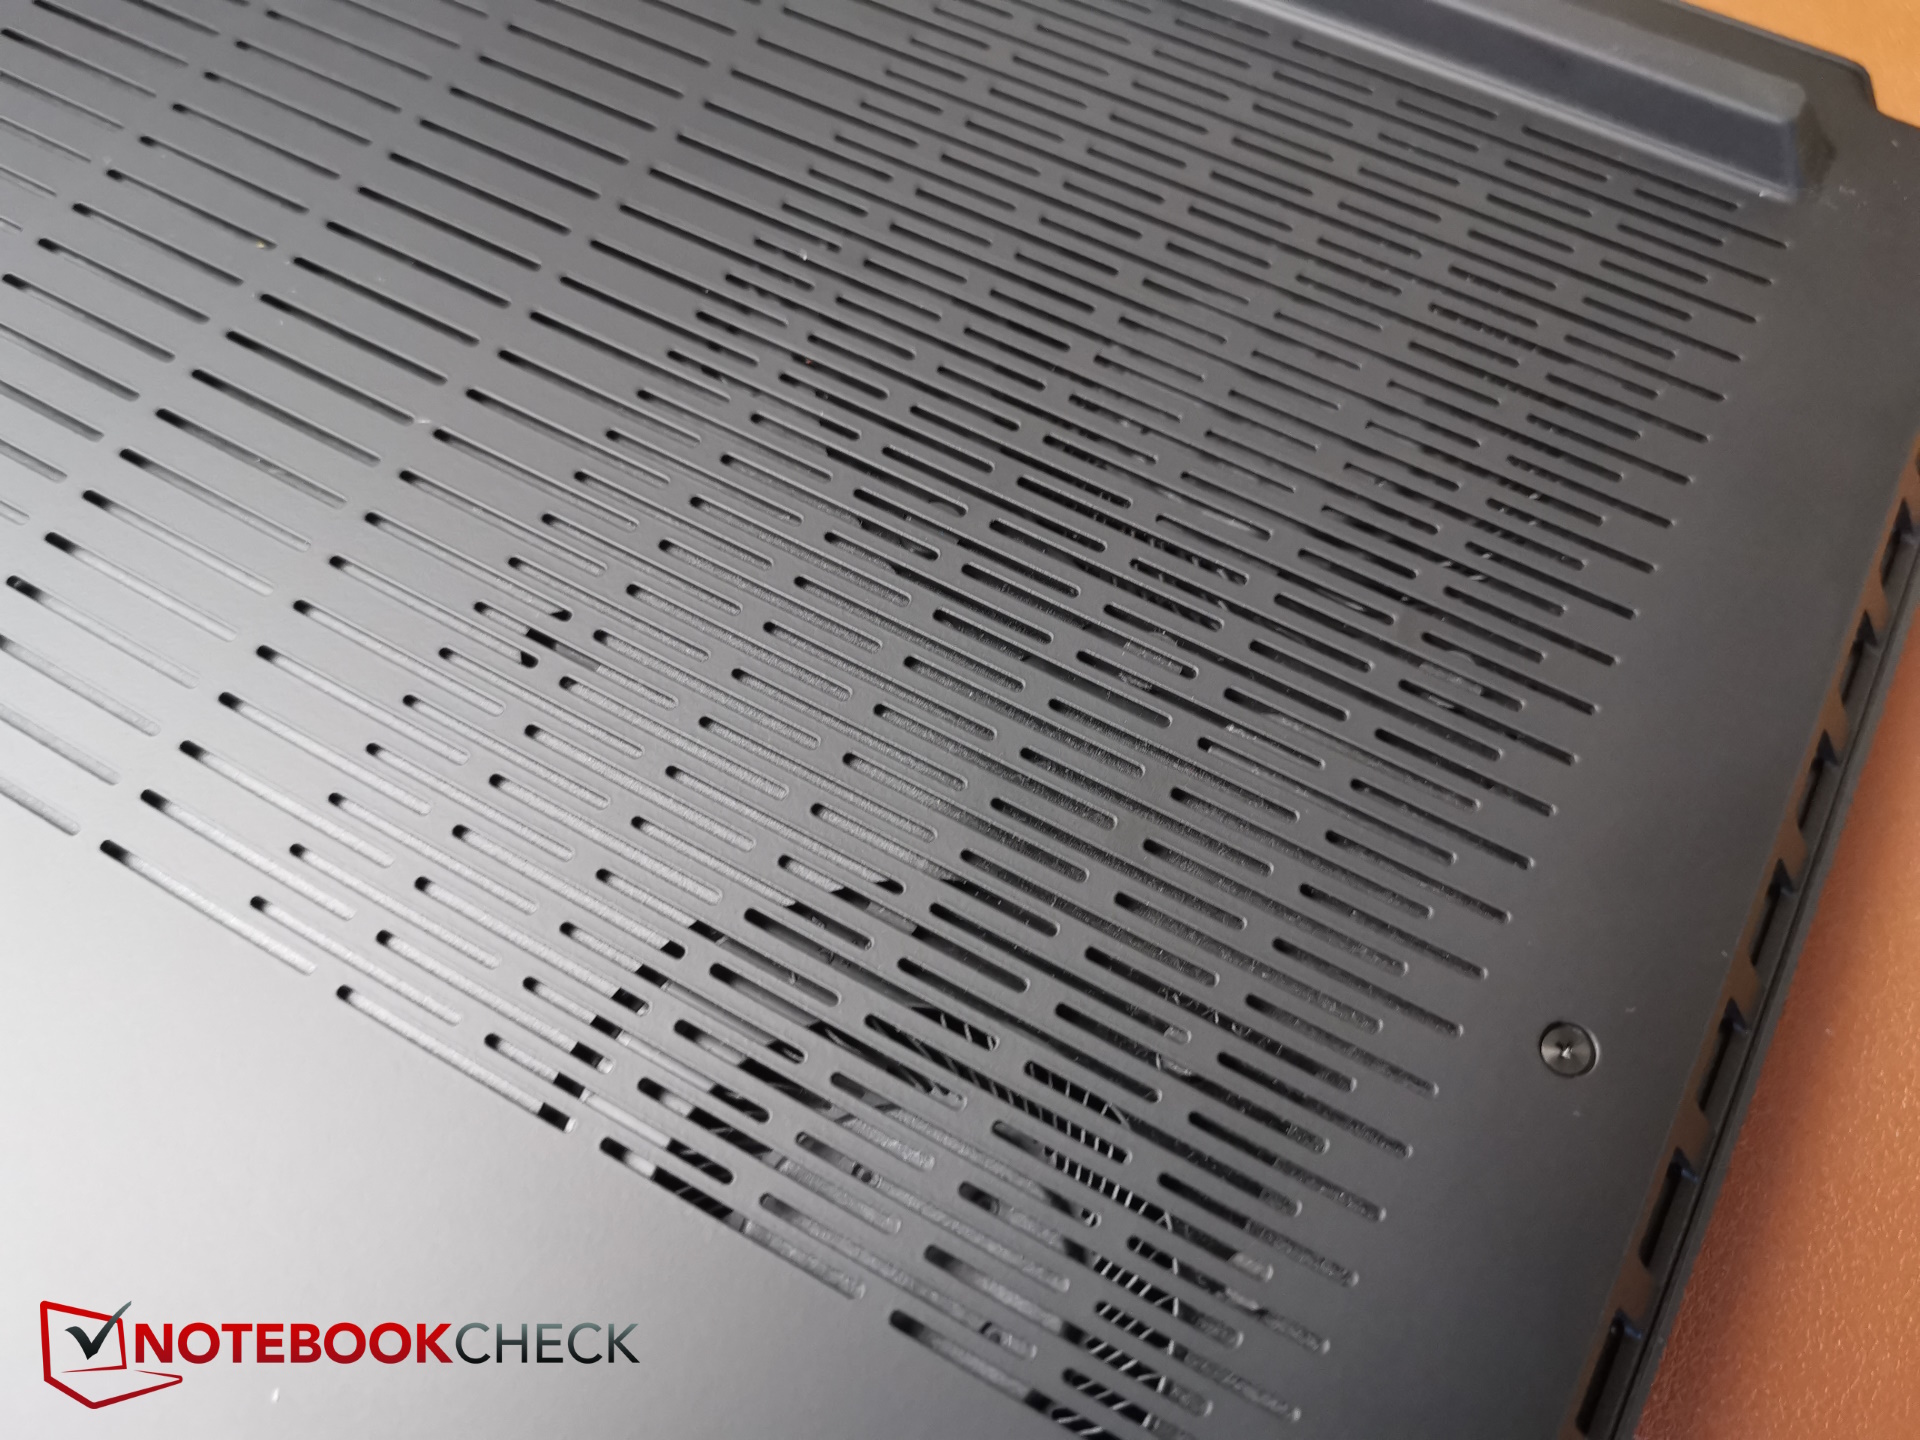
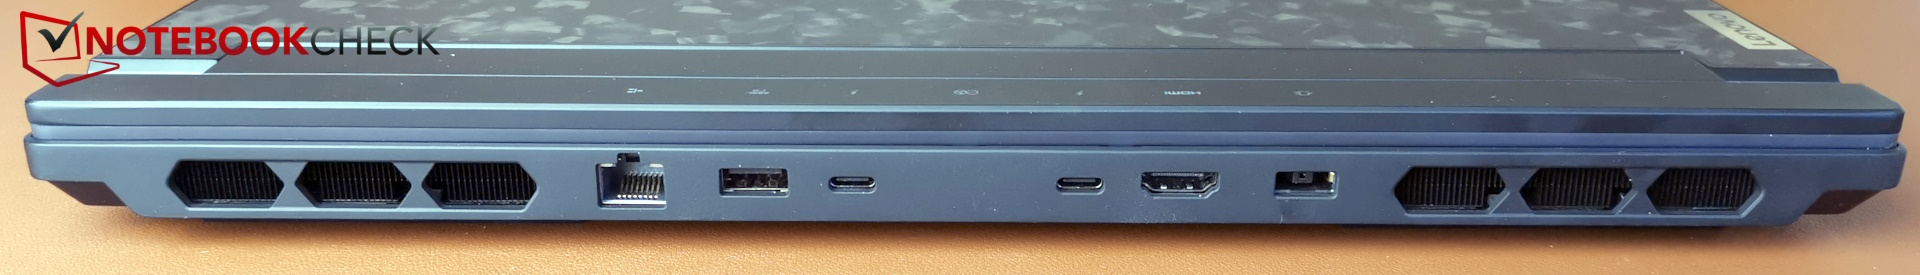
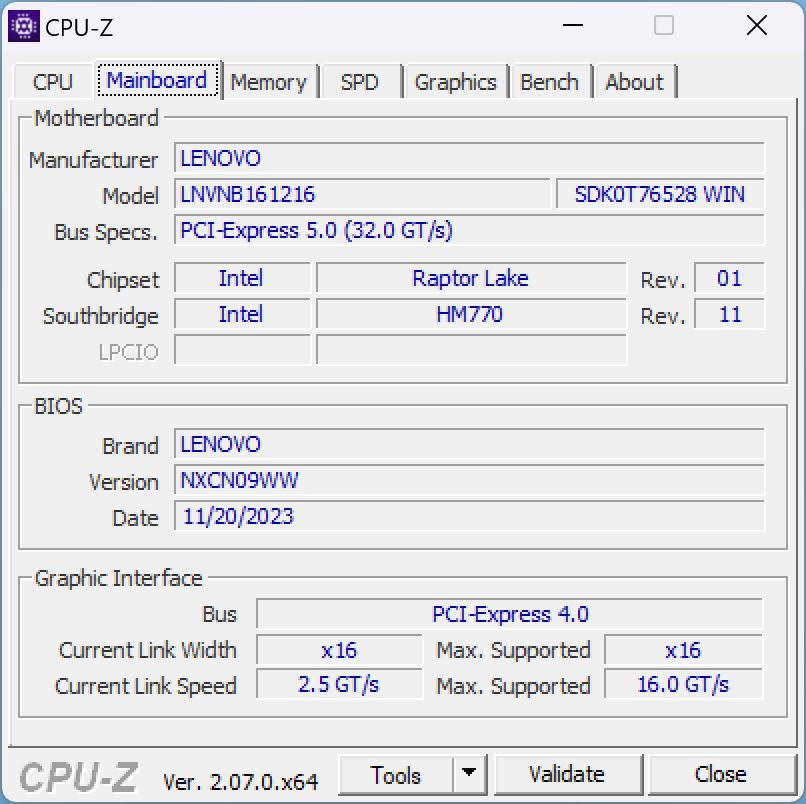
Cassa e connettività - Carbonio forgiato
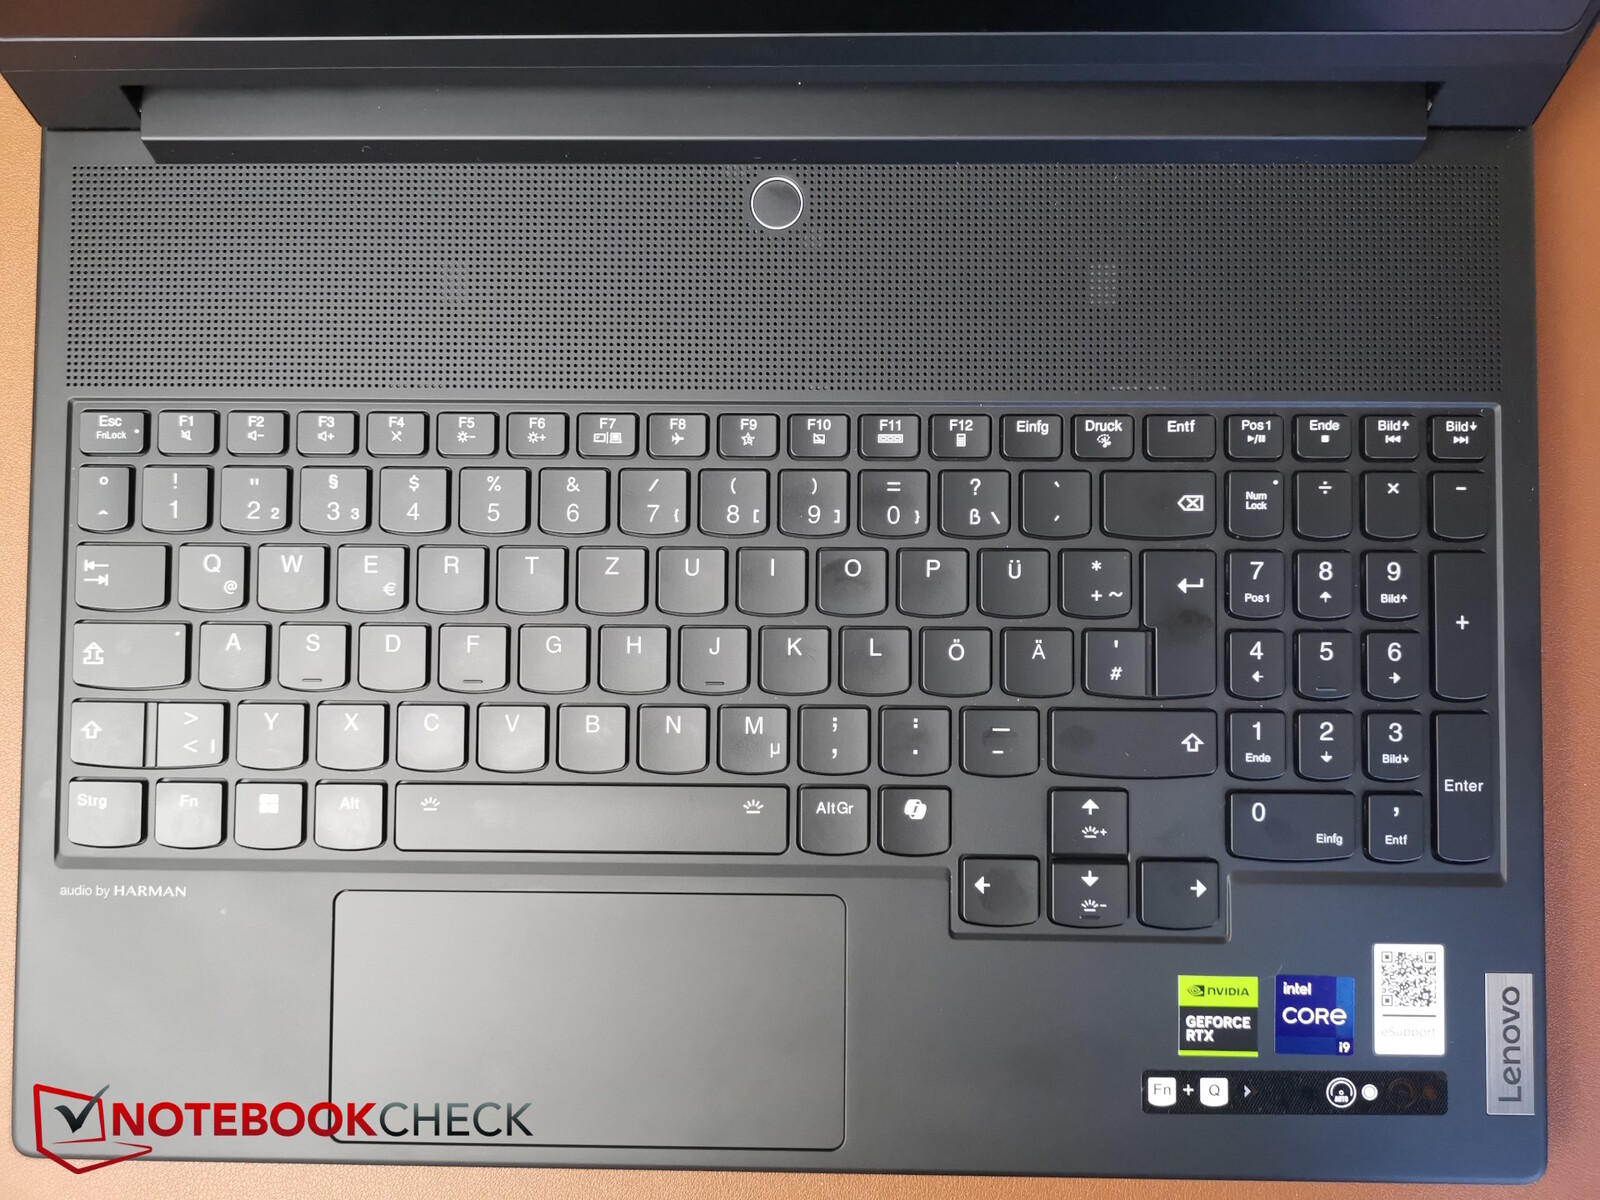
Poiché almeno visivamente tutto è rimasto invariato sul nuovo modello, le consigliamo di dare un'occhiata alla nostra recensione di Lenovo Legion 9i Gen8 per informazioni sul suo telaio forgiato al carbonio, sulle opzioni di manutenzione e sui dispositivi di input.
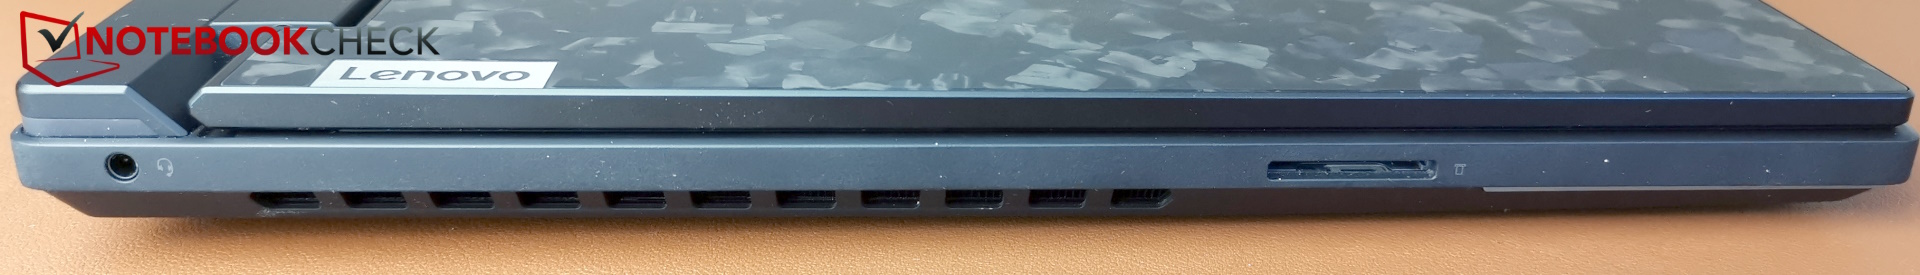
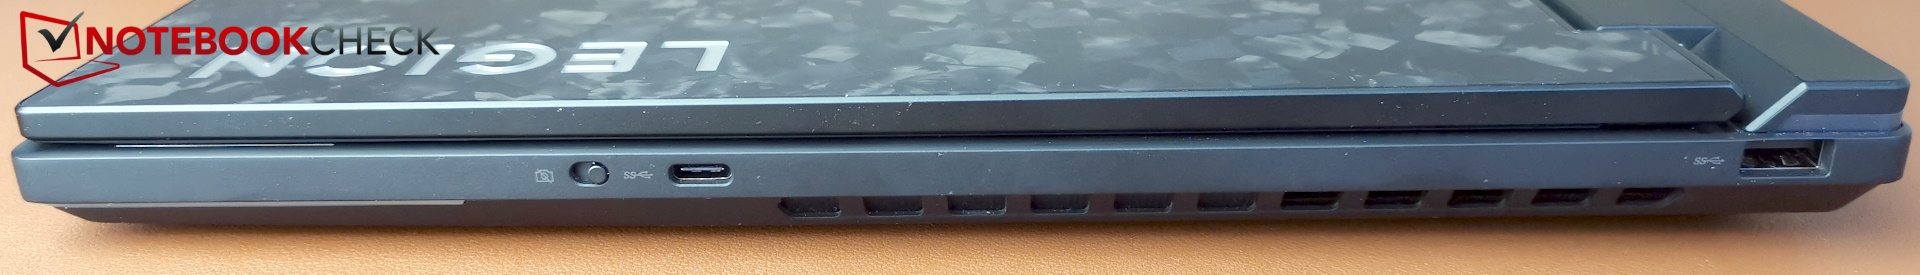
Lettore di schede SD
Per un portatile di fascia alta, le velocità di trasferimento del lettore di schede SD sono deludenti. Sono leggermente peggiori rispetto all'anno scorso e sono lontane dalle velocità di trasferimento di un Razer Blade 16 o di un Alienware m18 R2.
| SD Card Reader | |
| average JPG Copy Test (av. of 3 runs) | |
| Alienware m18 R2 (Toshiba Exceria Pro SDXC 64 GB UHS-II) | |
| Razer Blade 16 2024, RTX 4090 | |
| Media della classe Gaming (19 - 202, n=96, ultimi 2 anni) | |
| Lenovo Legion 9 16IRX8 (Toshiba Exceria Pro SDXC 64 GB UHS-II) | |
| Medion Erazer Beast X40 2024 (AV PRO microSD 128 GB V60) | |
| Lenovo Legion 9 16IRX9, RTX 4090 | |
| maximum AS SSD Seq Read Test (1GB) | |
| Alienware m18 R2 (Toshiba Exceria Pro SDXC 64 GB UHS-II) | |
| Razer Blade 16 2024, RTX 4090 | |
| Media della classe Gaming (25.8 - 269, n=93, ultimi 2 anni) | |
| Medion Erazer Beast X40 2024 (AV PRO microSD 128 GB V60) | |
| Lenovo Legion 9 16IRX9, RTX 4090 | |
| Lenovo Legion 9 16IRX8 (Toshiba Exceria Pro SDXC 64 GB UHS-II) | |
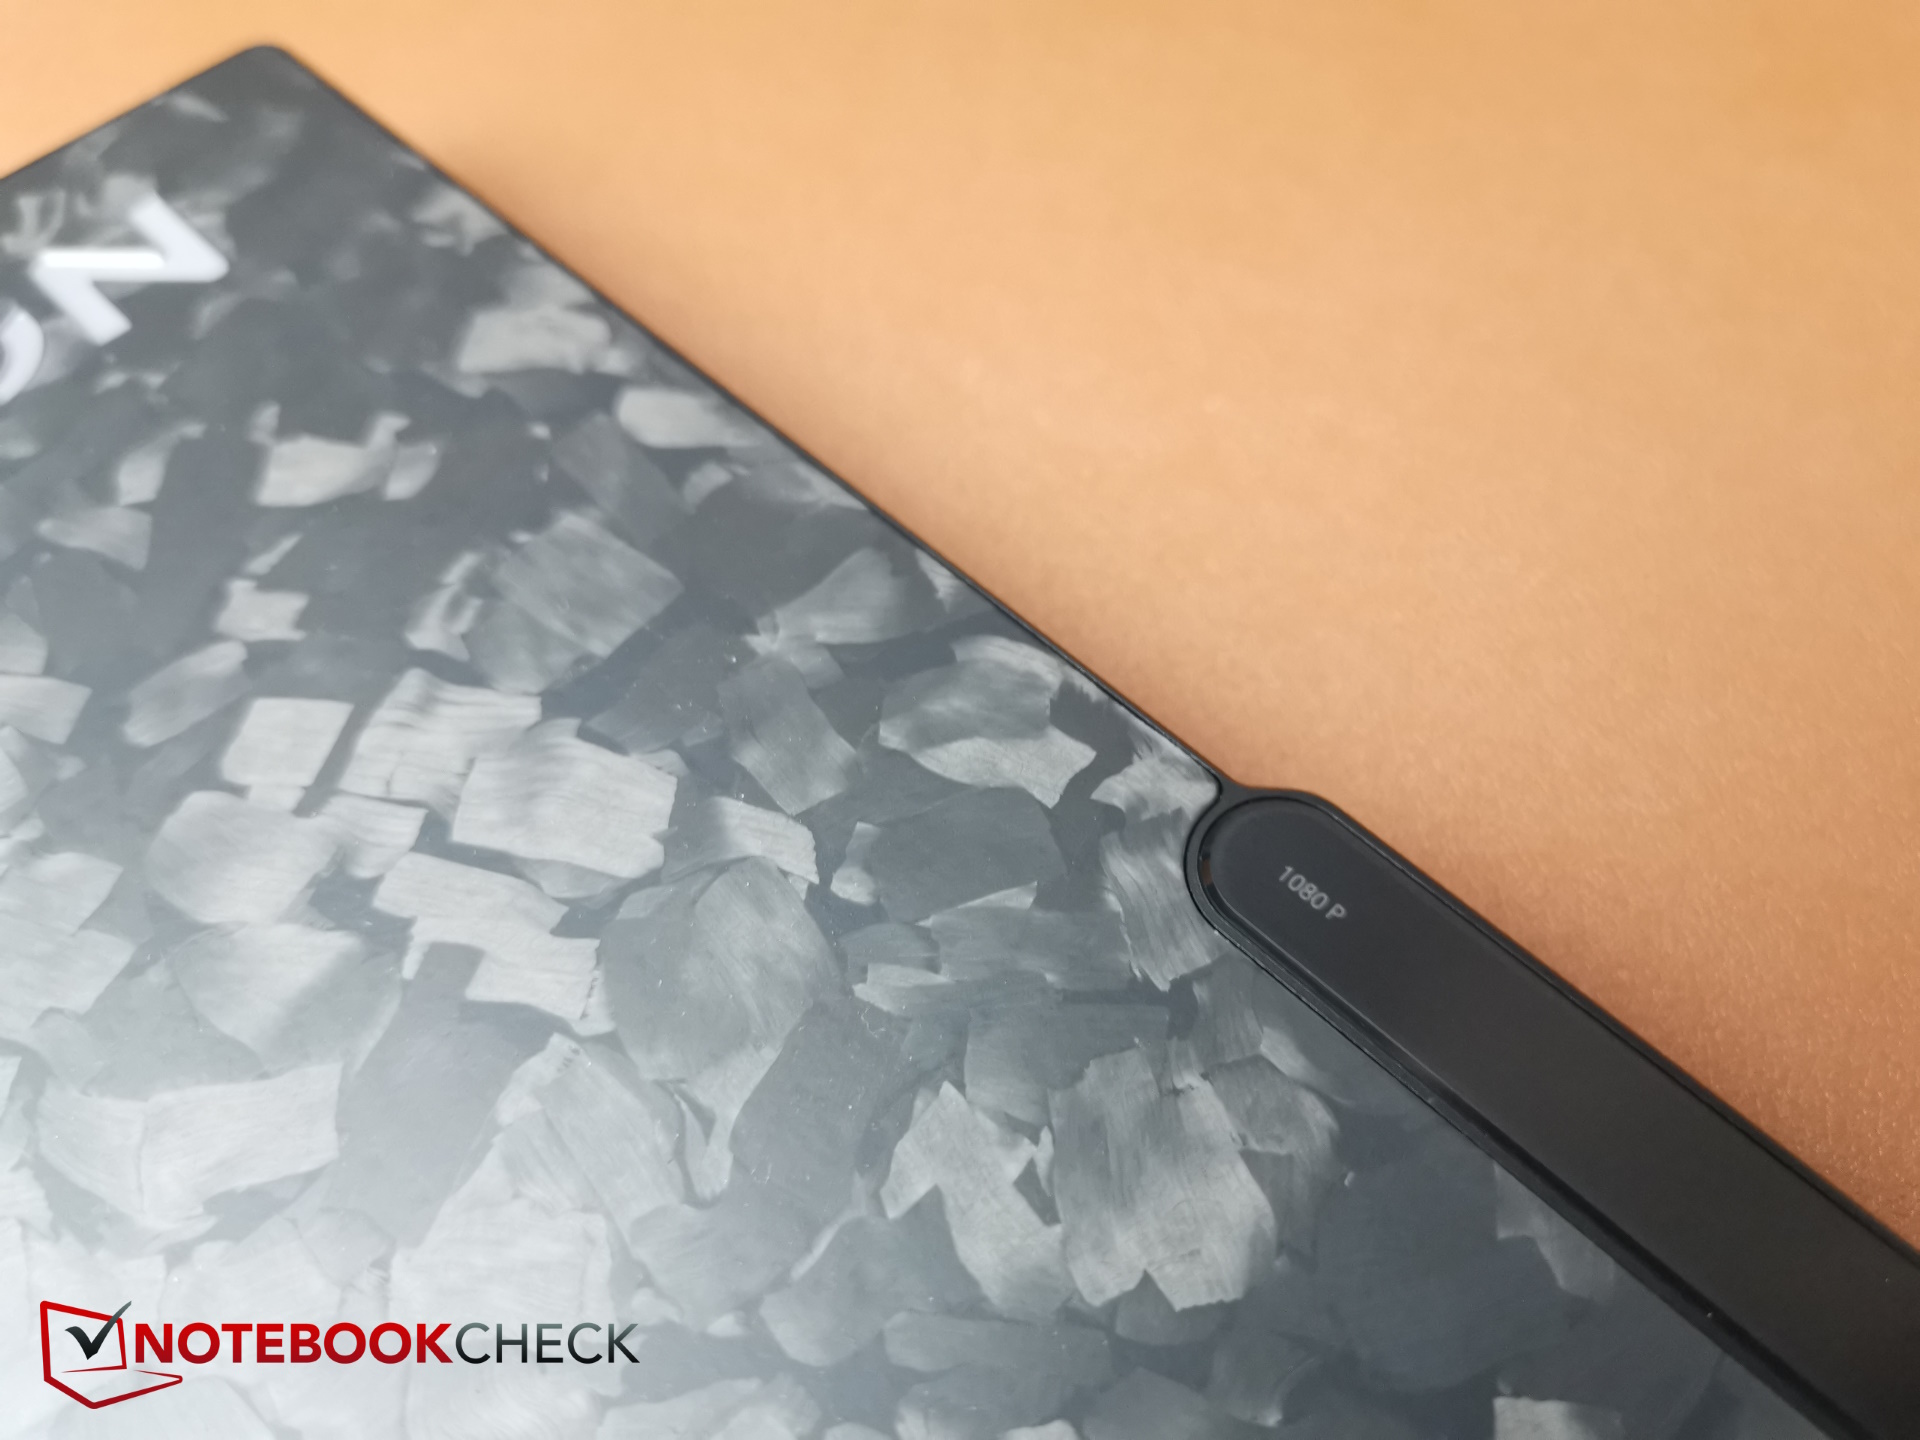
Webcam
La webcam Full HD da 1.080p presenta deviazioni di colore medio-alte e la nitidezza dell'immagine è buona.


Dispositivi di input - Ora con Co-Pilot
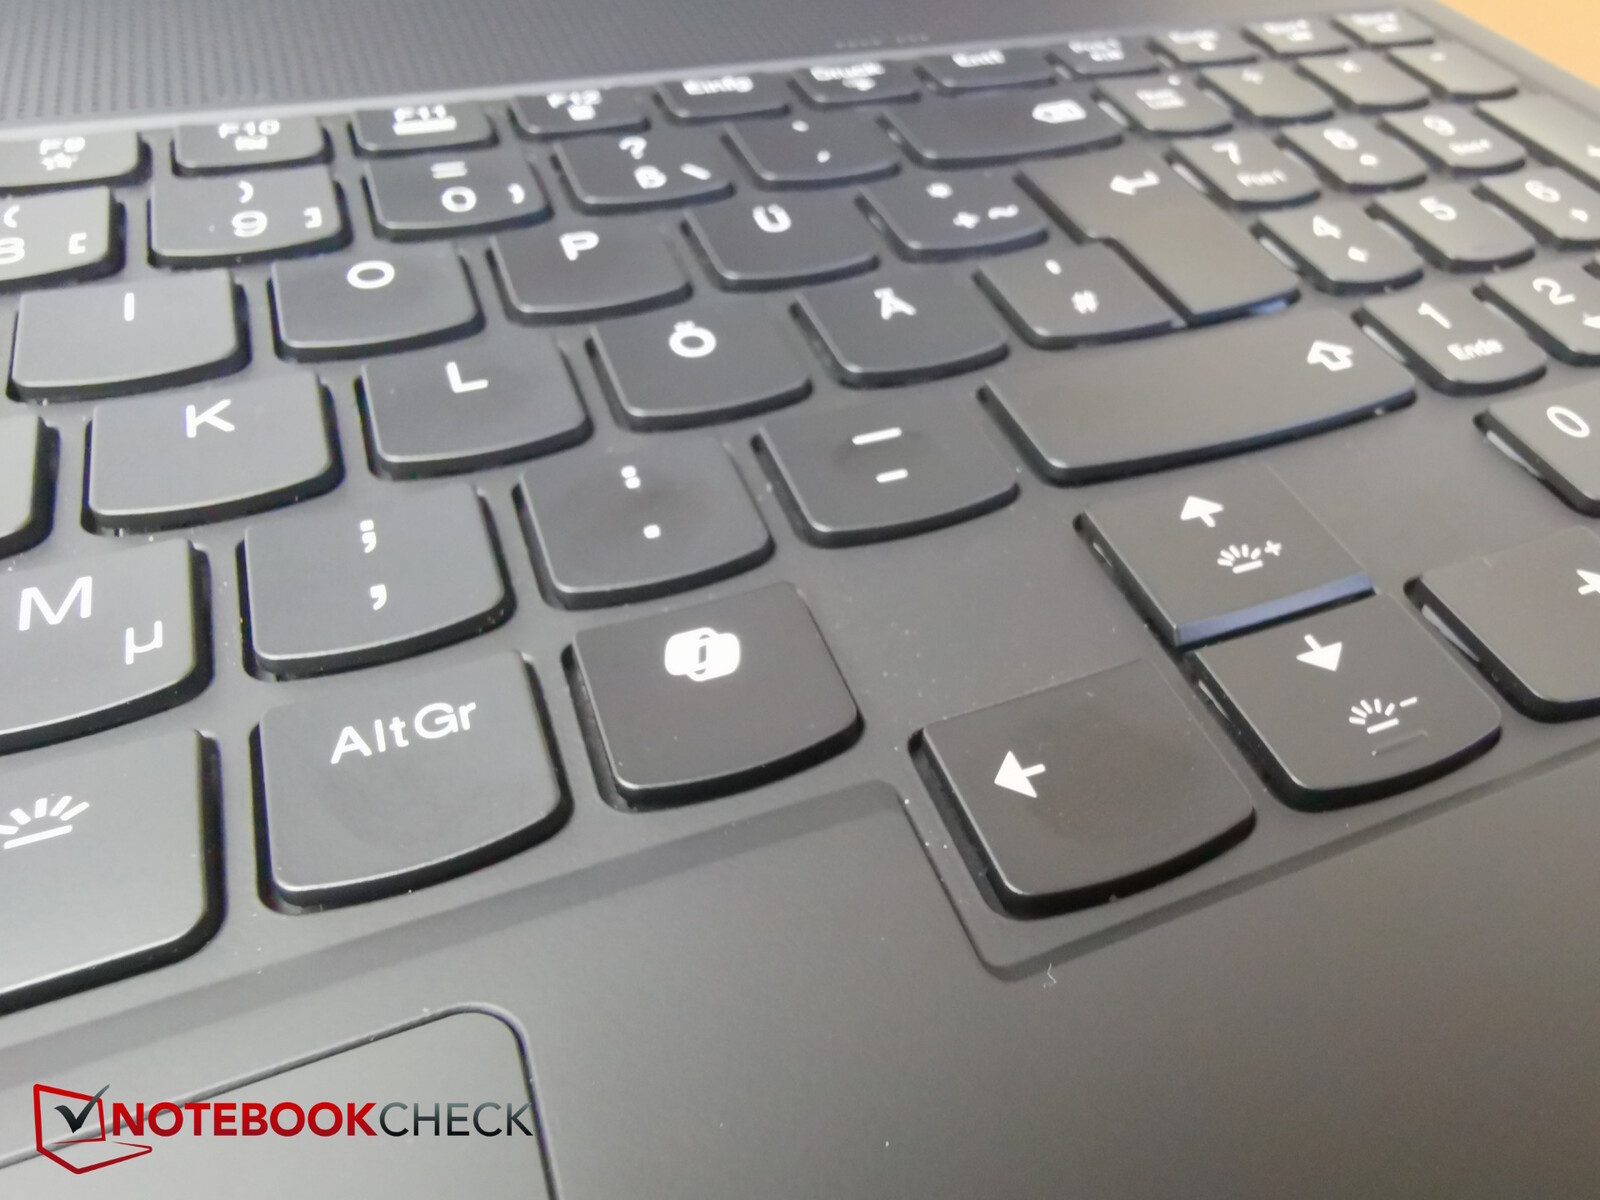
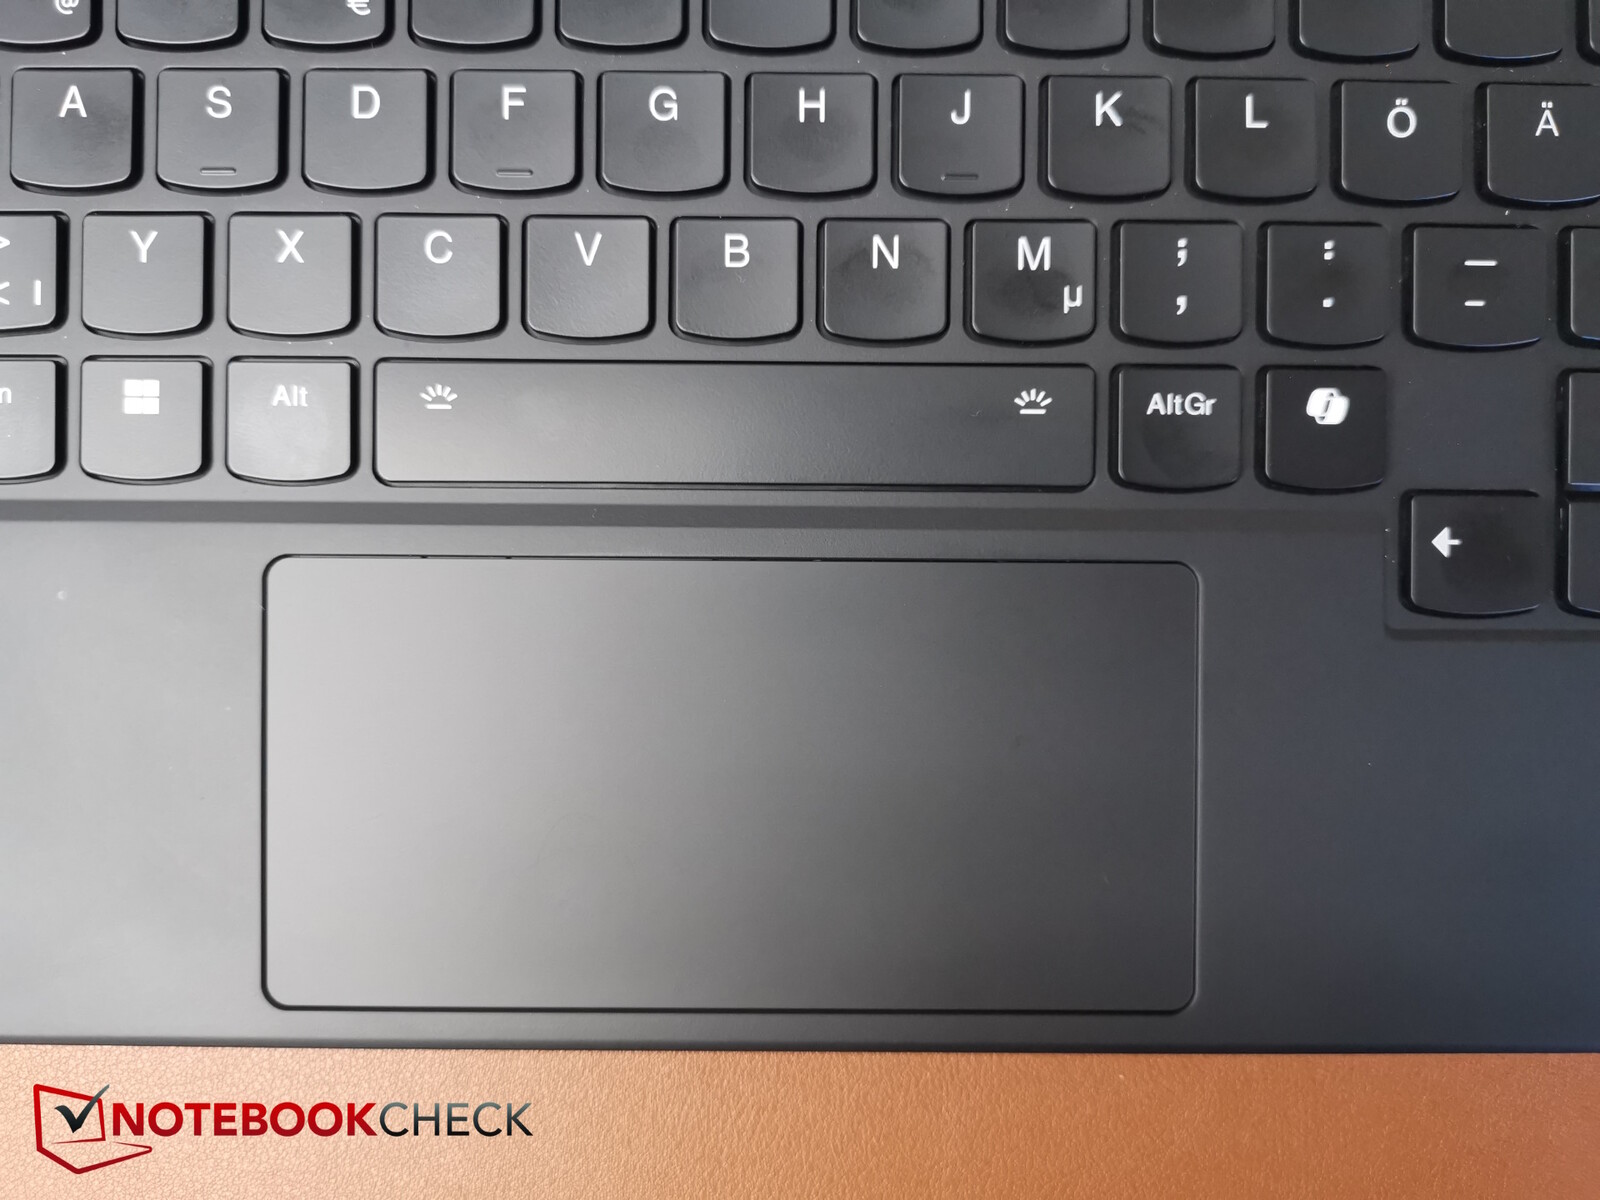
La sua comoda tastiera a membrana e il touchpad rimangono in gran parte invariati. Quest'ultimo è ancora molto stretto, con soli 5,9 cm. Alla tastiera è stato aggiunto un tasto Co-Pilot. Il tasto Ctrl destro ha dovuto lasciare il posto a questo.
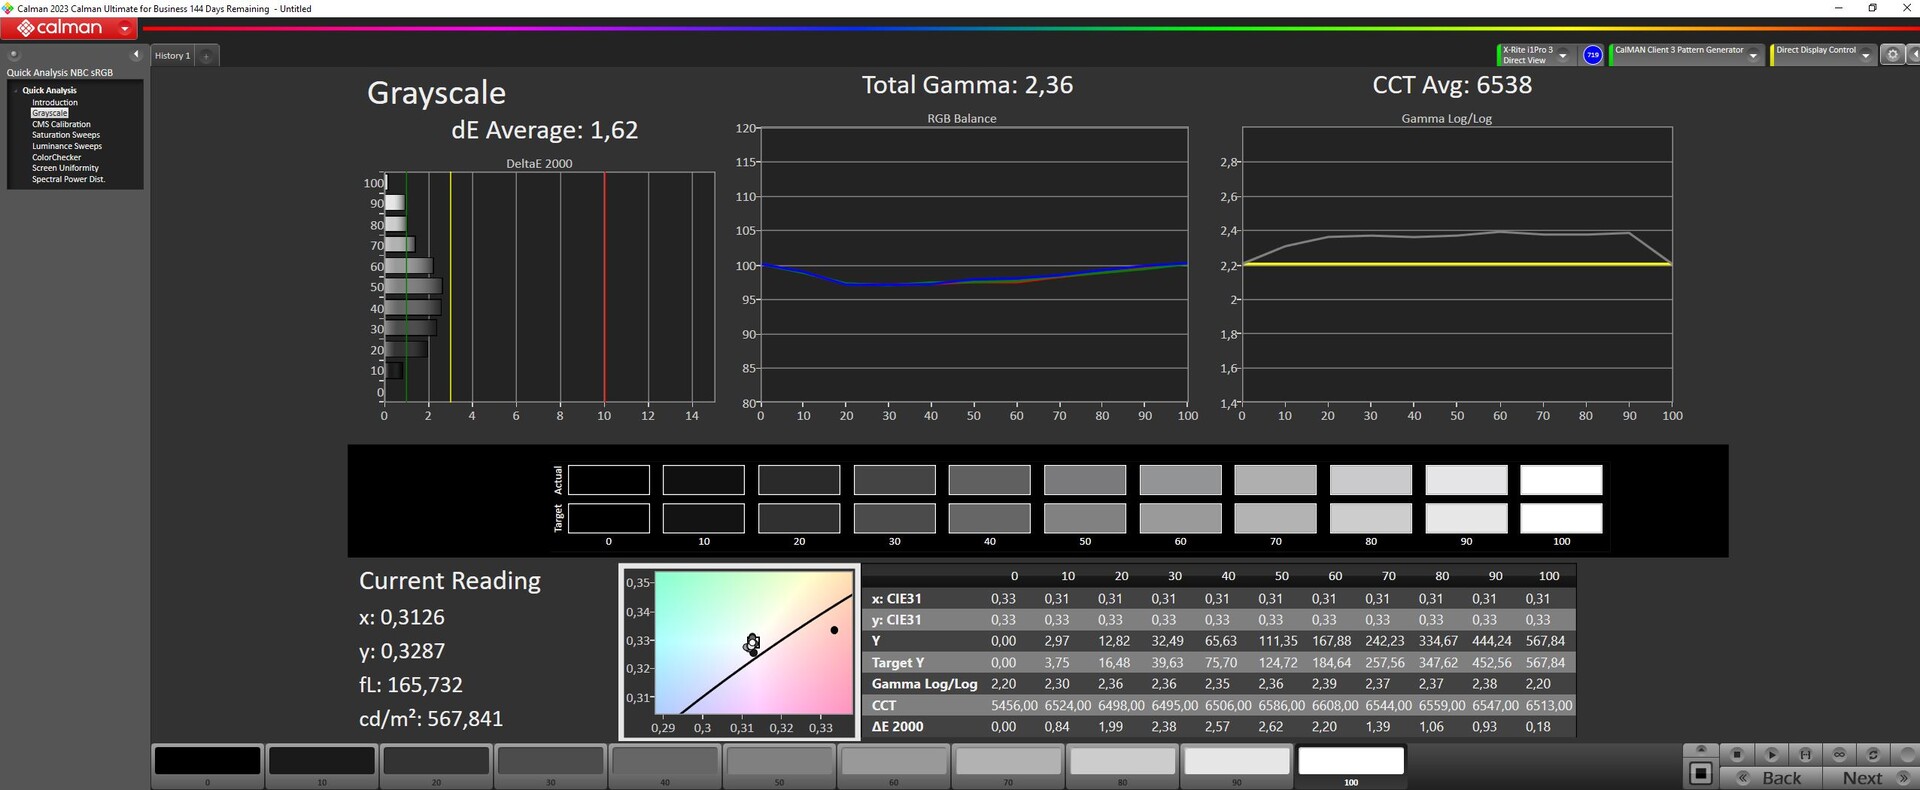
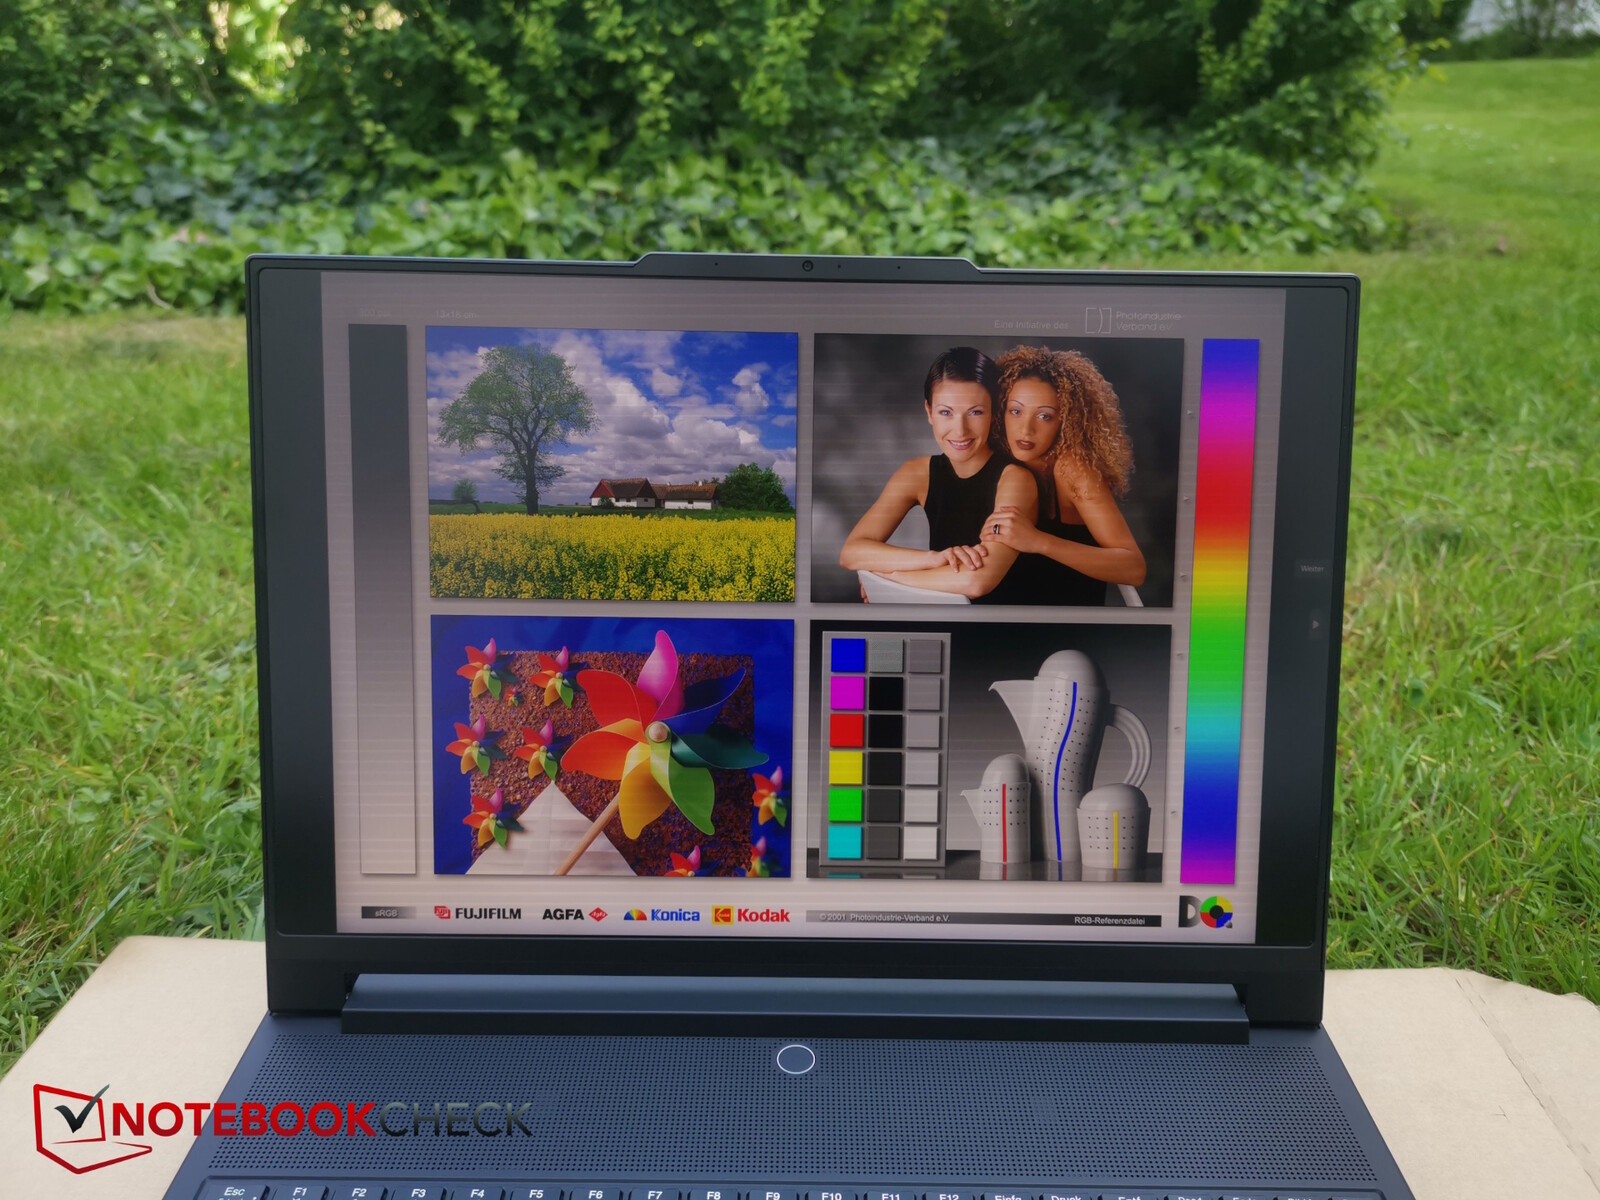
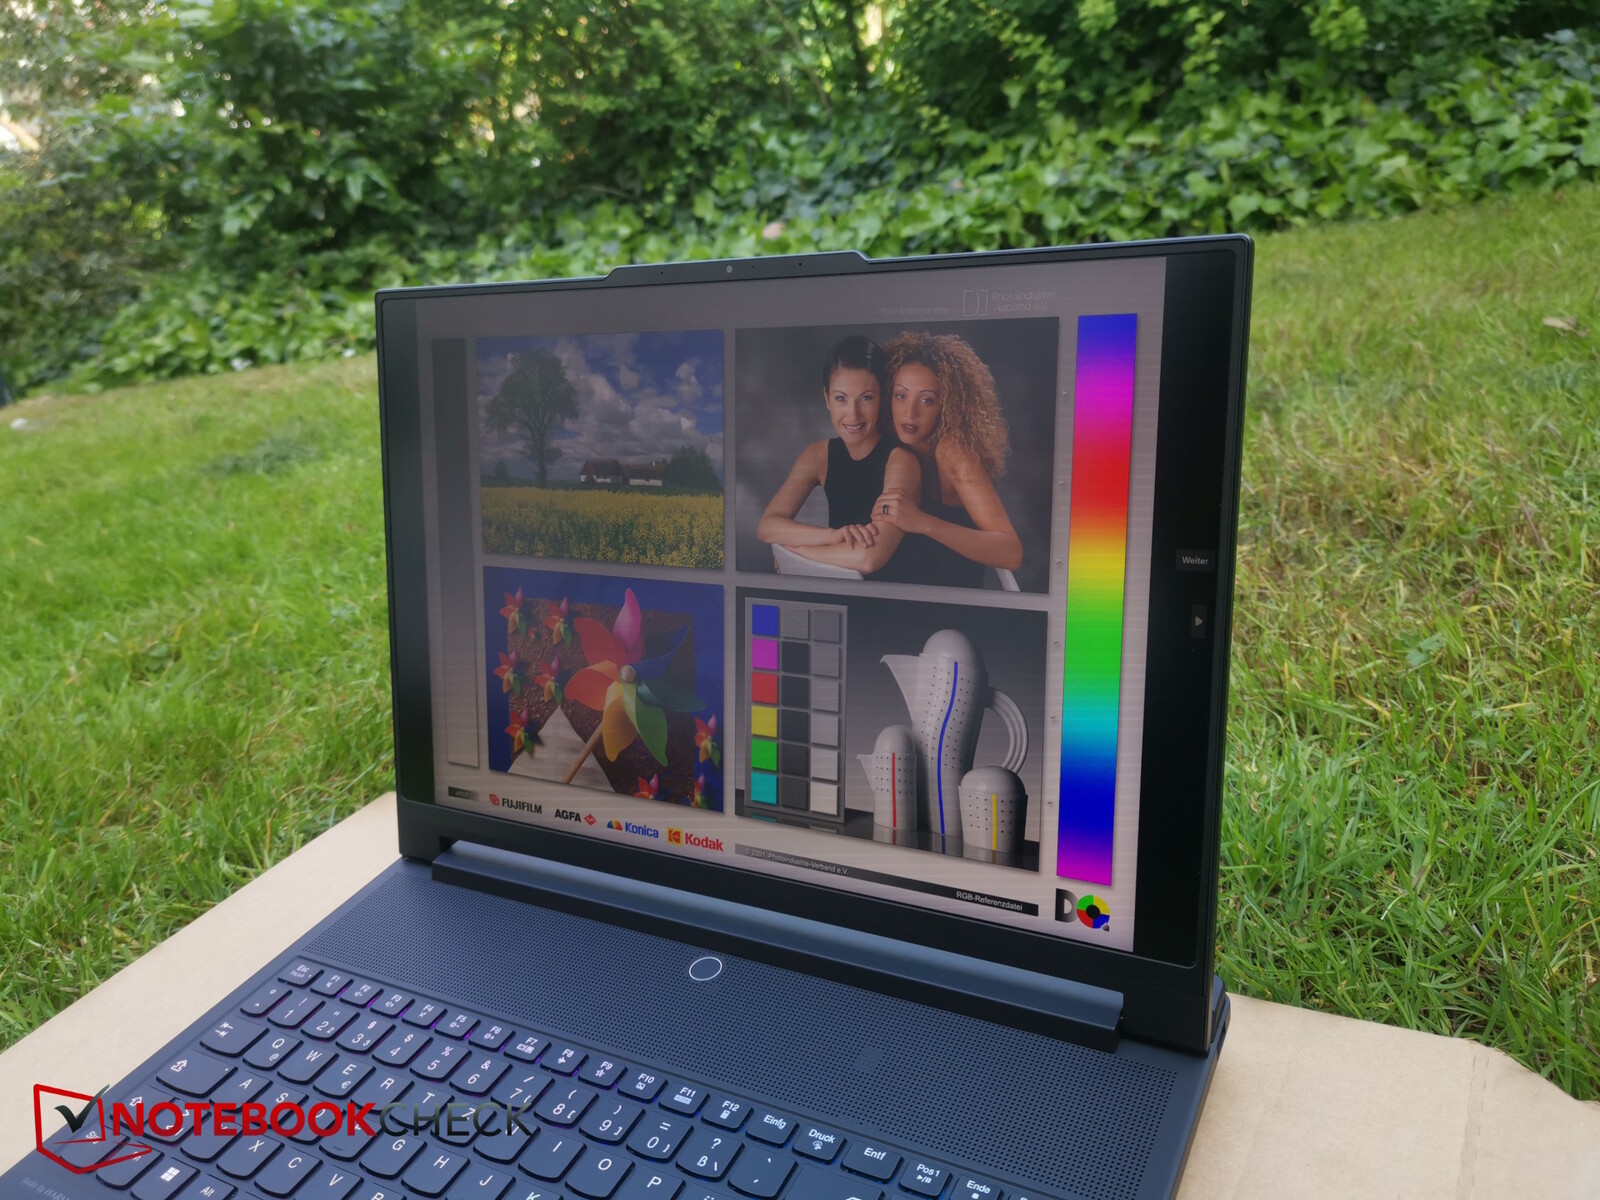
Display - MiniLED da 1.200 nit
Il mini display LED da 16 pollici 3.2K (3.200 x 2.000) con Dolby Vision e G-Sync è ancora una delle principali attrazioni all'interno di Legion 9. Si dice che abbia una luminosità fino a 1.200 nit e che quindi soddisfi lo standard HDR 1000. Si dice che abbia una luminosità fino a 1.200 nits e che quindi soddisfi lo standard HDR 1000. In realtà abbiamo misurato più di 1.000 nits in modalità HDR.
In modalità SD, con una migliore precisione del colore, il display brilla ancora con una media di 664 nits! Al 43% di luminosità dello schermo, il suo valore di luminosità è di circa 150 nits, che è il valore che utilizziamo per alcuni dei nostri test della batteria. Il suo livello di nero è eccellente grazie ai mini LED che possono essere spenti in molte zone, il che porta a contrasti molto elevati.
Non c'è alcun bleeding della retroilluminazione e anche i tempi di risposta sono sufficientemente rapidi, anche se ovviamente non al livello degli OLED. Abbiamo potuto misurare il PWM, anche se a una frequenza piuttosto alta, da 5 kHz a 40 kHz, che non dovrebbe essere un problema nemmeno per le persone sensibili.
| |||||||||||||||||||||||||
Distribuzione della luminosità: 91 %
Al centro con la batteria: 630 cd/m²
Contrasto: 21033:1 (Nero: 0.03 cd/m²)
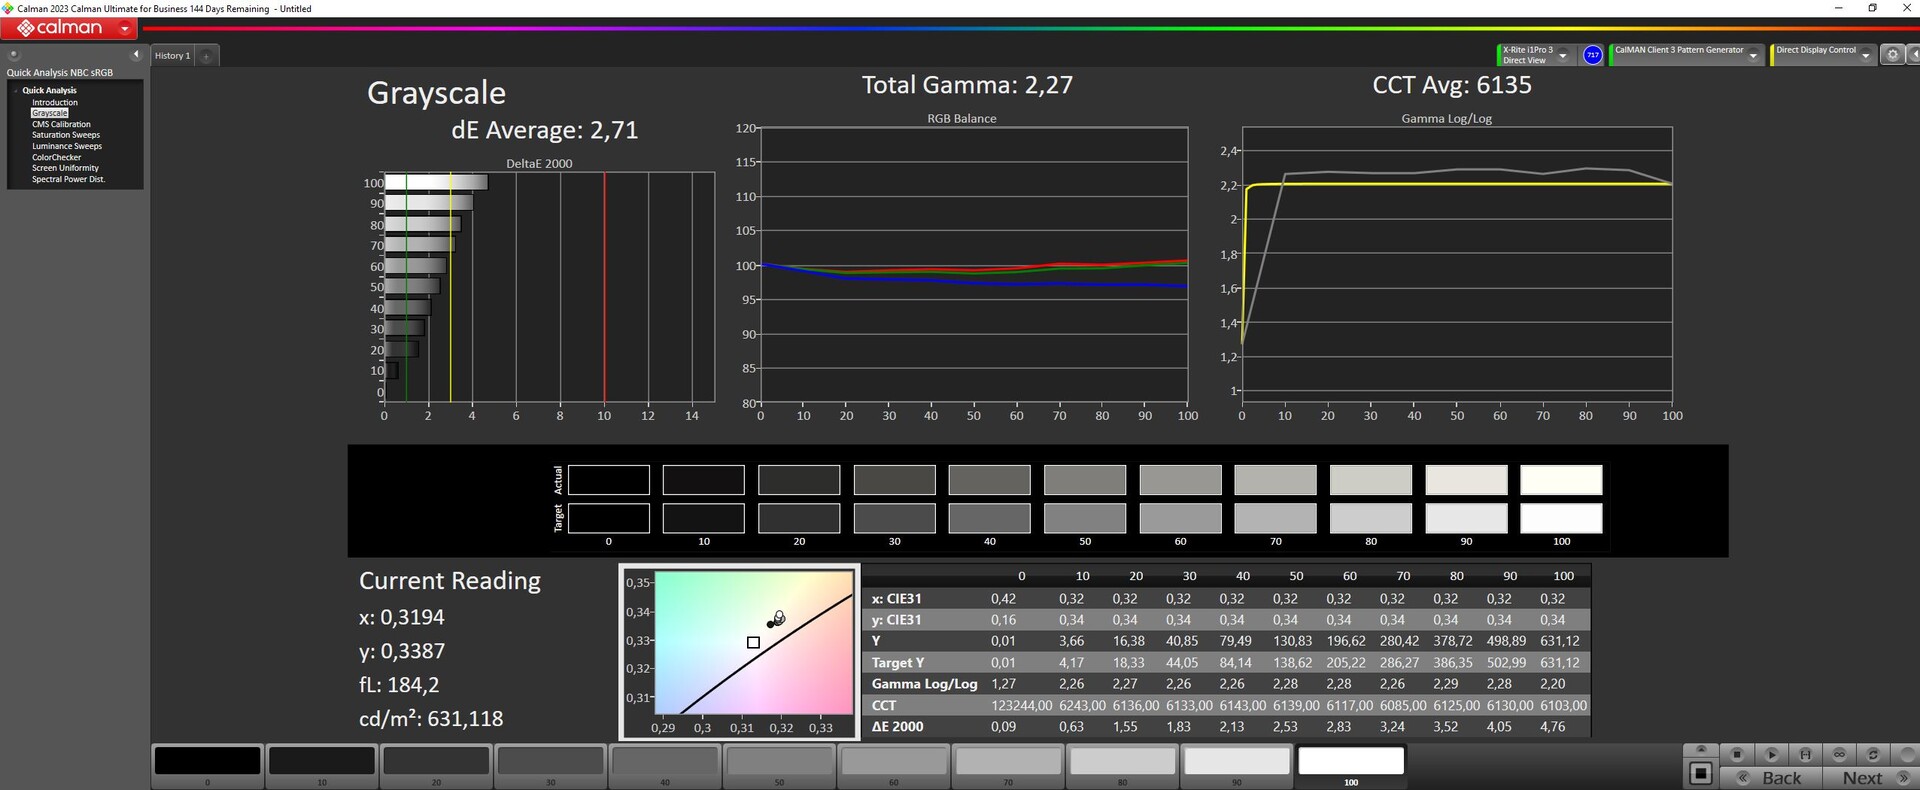
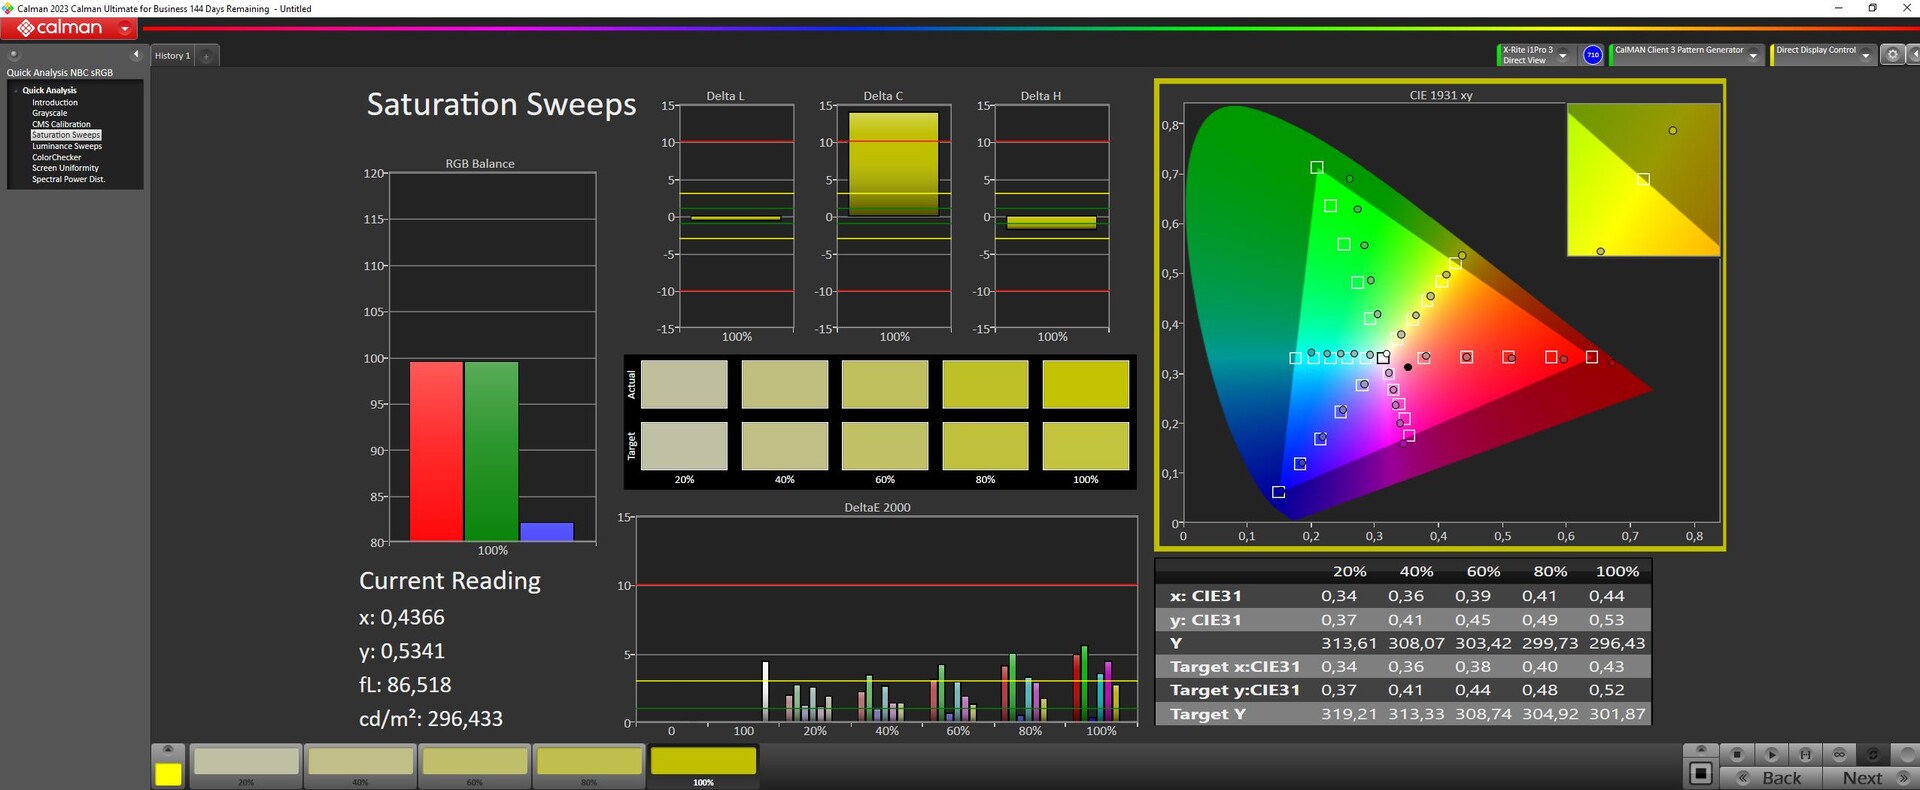
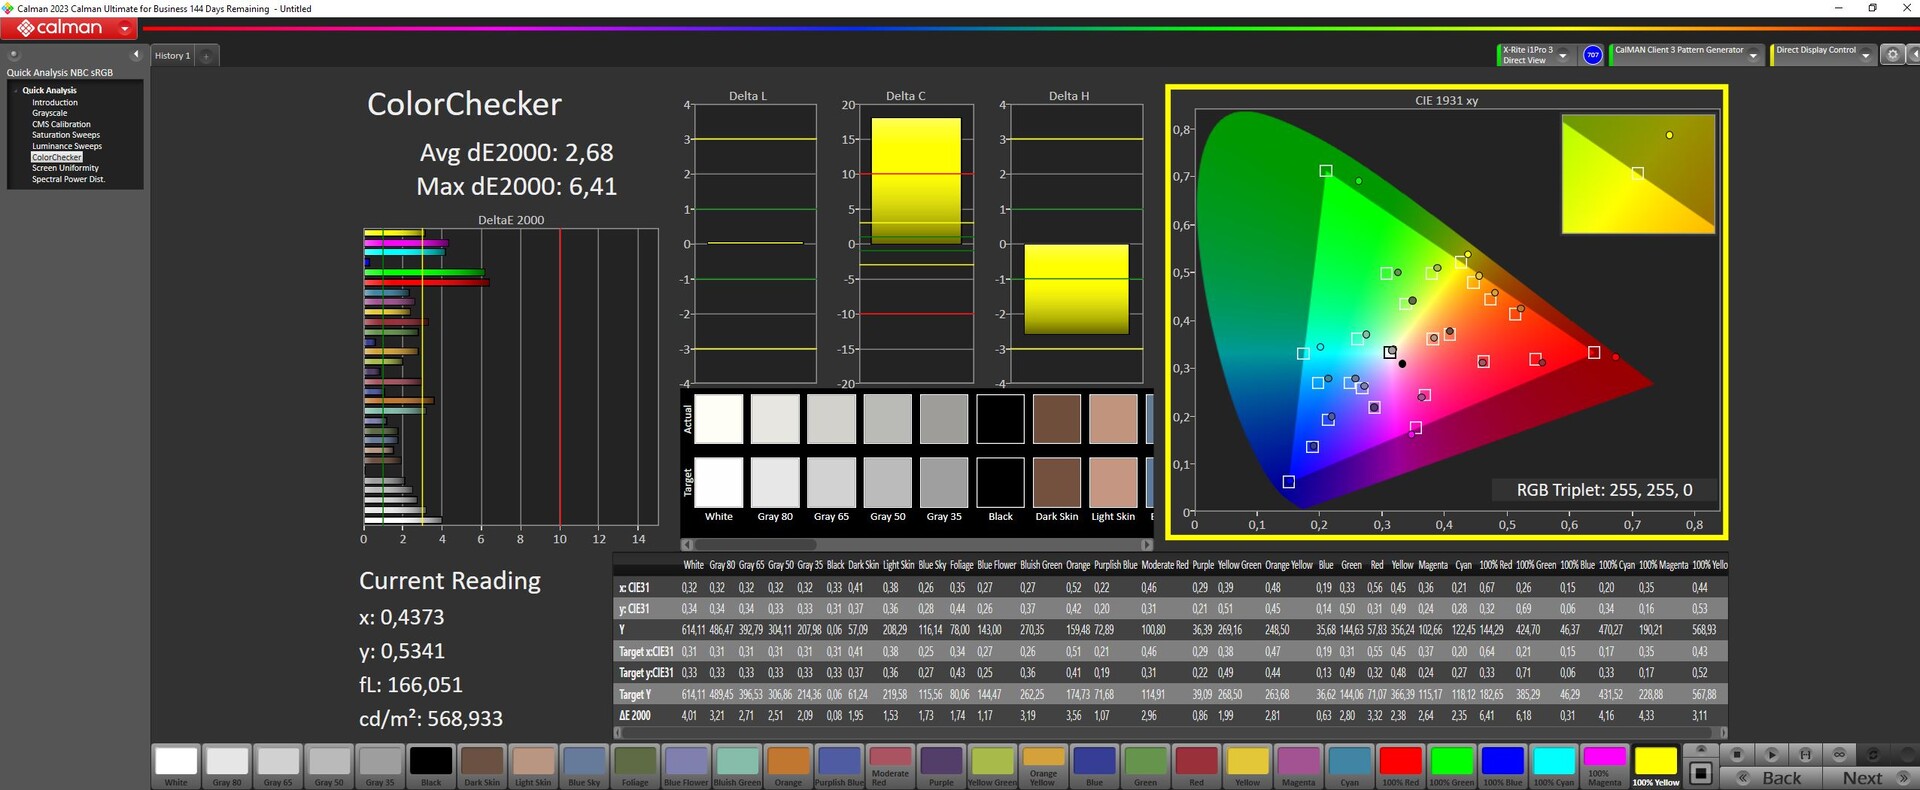
ΔE Color 2.68 | 0.5-29.43 Ø4.99, calibrated: 2.68
ΔE Greyscale 2.71 | 0.57-98 Ø5.2
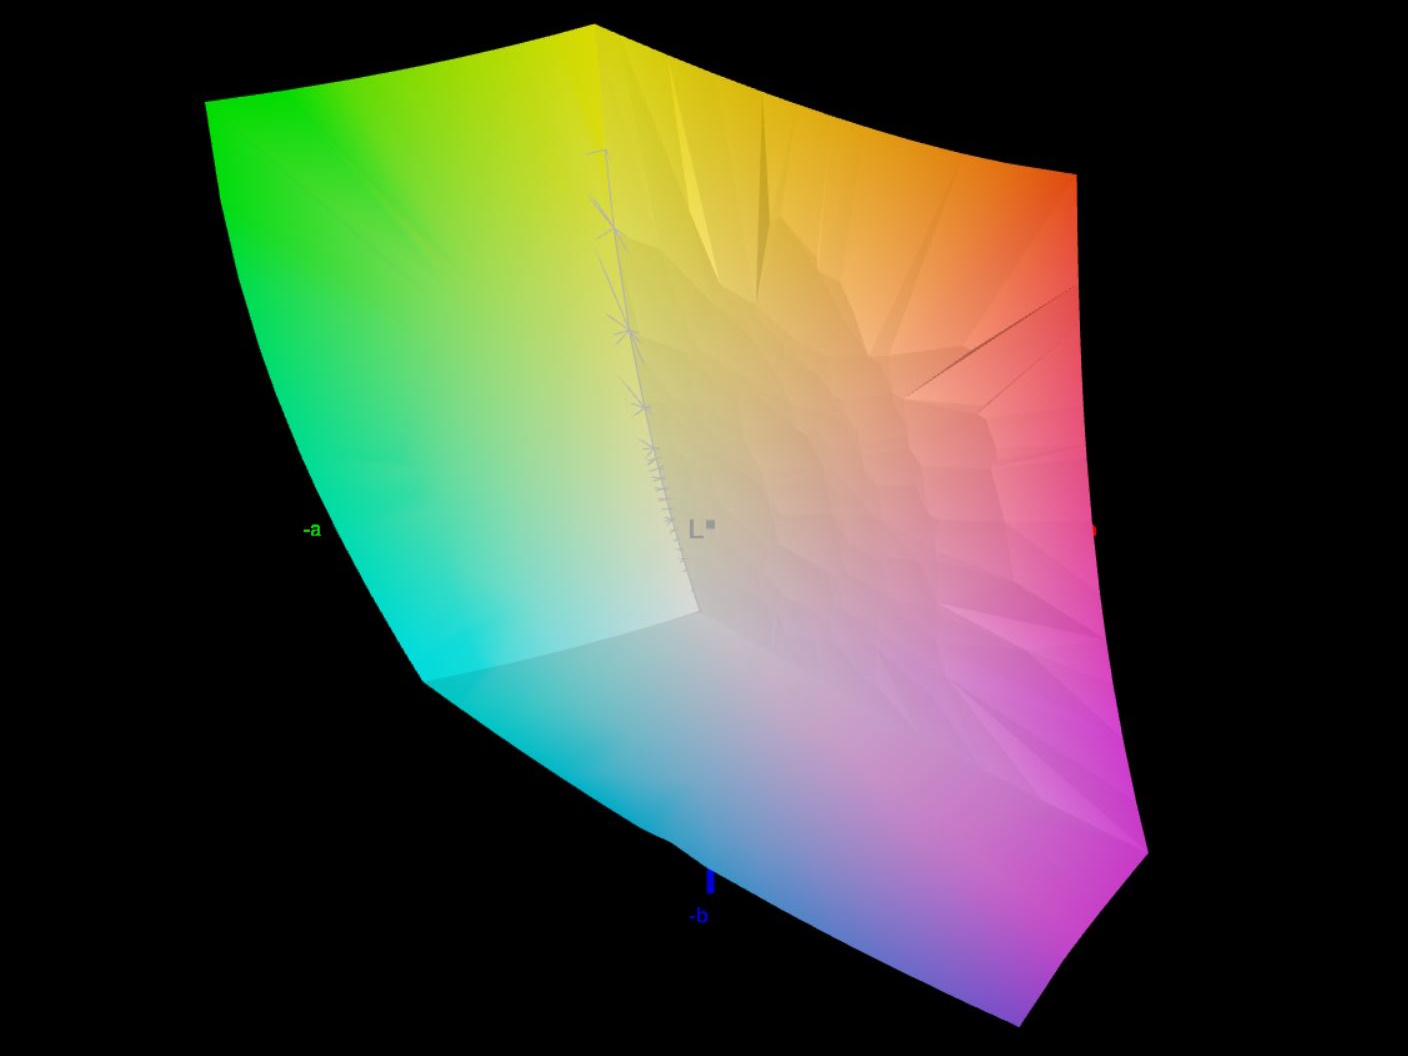
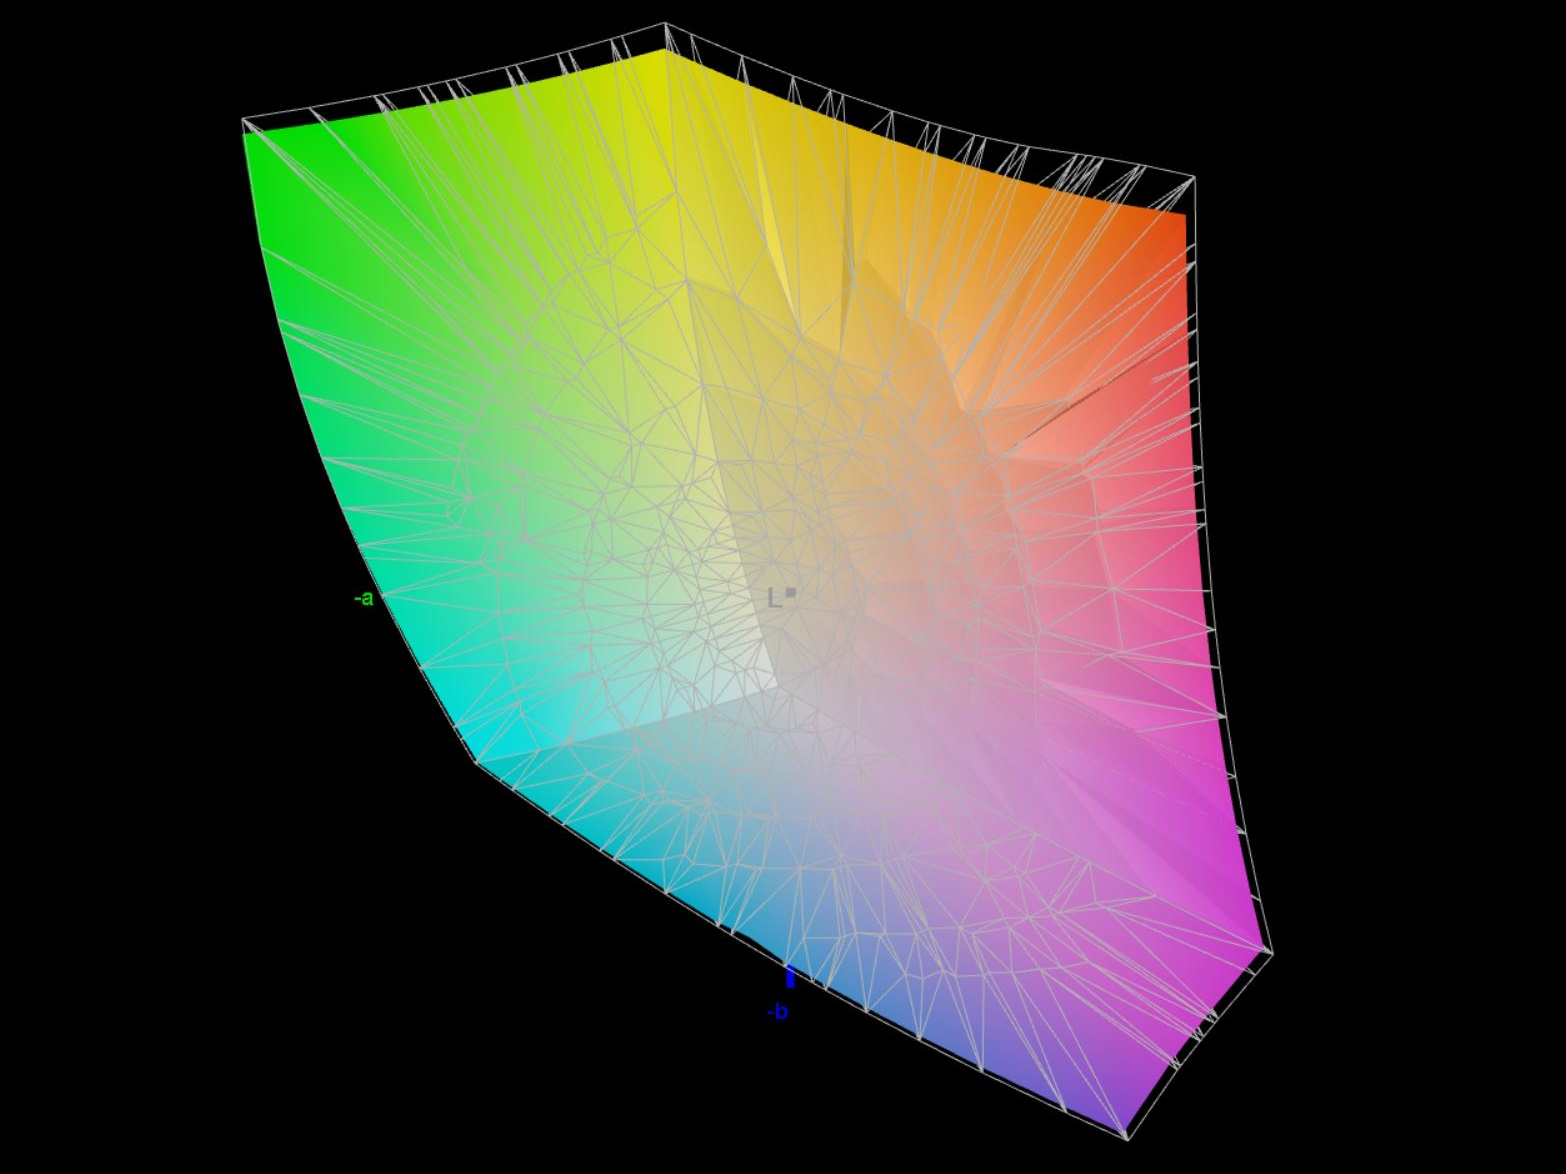
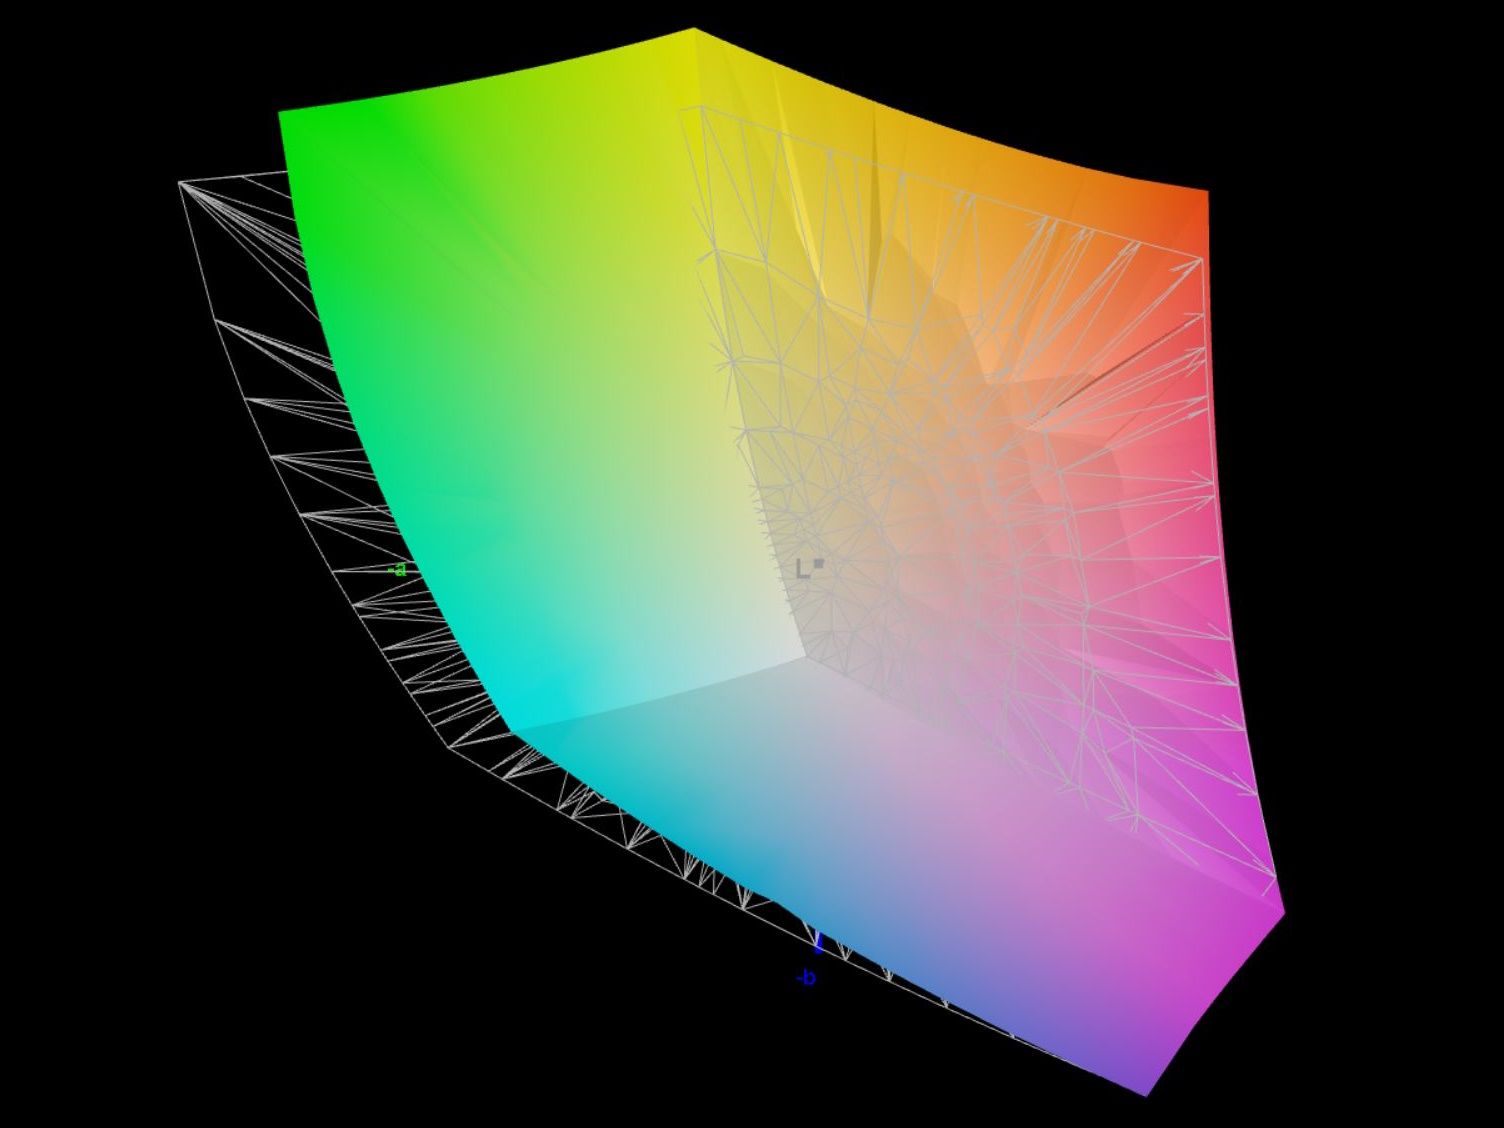
86.6% AdobeRGB 1998 (Argyll 2.2.0 3D)
99.9% sRGB (Argyll 2.2.0 3D)
95.3% Display P3 (Argyll 2.2.0 3D)
Gamma: 2.27
| Lenovo Legion 9 16IRX9, RTX 4090 CSOT T3 MNG007ZA2-2, MiniLED, 3200x2000, 16.00 | Lenovo Legion 9 16IRX8 CSOT T3 MNG007ZA2-2, Mini-LED, 3200x2000, 16.00 | Razer Blade 16 2024, RTX 4090 Samsung SDC41AB (ATNA60DL03-0), OLED, 2560x1600, 16.00 | Alienware m18 R2 BOE NE18NZ1, IPS, 2560x1600, 18.00 | Asus ROG Strix Scar 18 G834JYR (2024) BOE NE180QDM-NM1, Mini LED, 2560x1600, 18.00 | Medion Erazer Beast X40 2024 BOE NE170QDM-NZ1, IPS, 2560x1600, 17.00 | |
|---|---|---|---|---|---|---|
| Display | 1% | 5% | 2% | 3% | -16% | |
| Display P3 Coverage | 95.3 | 97.2 2% | 99.1 4% | 97.8 3% | 99.9 5% | 68.1 -29% |
| sRGB Coverage | 99.9 | 99.9 0% | 99.9 0% | 99.5 0% | 100 0% | 99.5 0% |
| AdobeRGB 1998 Coverage | 86.6 | 87 0% | 95.6 10% | 88.9 3% | 90 4% | 69 -20% |
| Response Times | -12% | 37% | 27% | 1% | 19% | |
| Response Time Grey 50% / Grey 80% * | 12.6 ? | 13.3 ? -6% | 0.24 ? 98% | 5.3 ? 58% | 12 ? 5% | 11.7 ? 7% |
| Response Time Black / White * | 10 ? | 11.6 ? -16% | 0.4 ? 96% | 10.4 ? -4% | 10.7 ? -7% | 6.9 ? 31% |
| PWM Frequency | 5430 | 4742 -13% | 960 -82% | 5733 ? 6% | ||
| Screen | -0% | 21% | -107% | 14% | -136% | |
| Brightness middle | 631 | 674.9 7% | 418 -34% | 271.8 -57% | 937 48% | 422 -33% |
| Brightness | 664 | 682 3% | 420 -37% | 275 -59% | 934 41% | 388 -42% |
| Brightness Distribution | 91 | 96 5% | 98 8% | 78 -14% | 89 -2% | 87 -4% |
| Black Level * | 0.03 | 0.04 -33% | 0.02 33% | 0.27 -800% | 0.066 -120% | 0.42 -1300% |
| Contrast | 21033 | 16873 -20% | 20900 -1% | 1007 -95% | 14197 -33% | 1005 -95% |
| Colorchecker dE 2000 * | 2.68 | 2.56 4% | 1.07 60% | 2.48 7% | 1.52 43% | 1.42 47% |
| Colorchecker dE 2000 max. * | 6.41 | 4.16 35% | 4.04 37% | 5.59 13% | 2.82 56% | 1.97 69% |
| Colorchecker dE 2000 calibrated * | 2.68 | 2.47 8% | 1.07 60% | 0.56 79% | 1.21 55% | 0.7 74% |
| Greyscale dE 2000 * | 2.71 | 3 -11% | 1.12 59% | 3.7 -37% | 1.7 37% | 1.2 56% |
| Gamma | 2.27 97% | 2.38 92% | 2.29 96% | 2.2 100% | 2.042 108% | 2.078 106% |
| CCT | 6135 106% | 6799 96% | 6417 101% | 6355 102% | 6578 99% | 6581 99% |
| Media totale (Programma / Settaggio) | -4% /
-2% | 21% /
21% | -26% /
-65% | 6% /
9% | -44% /
-89% |
* ... Meglio usare valori piccoli
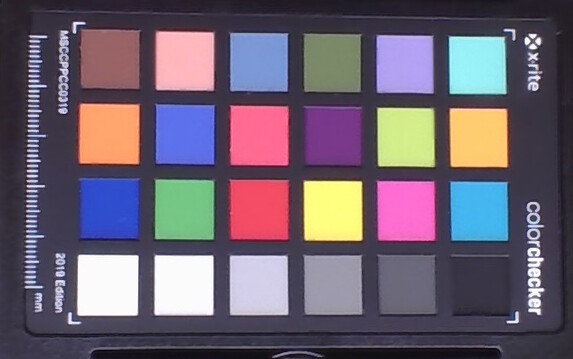
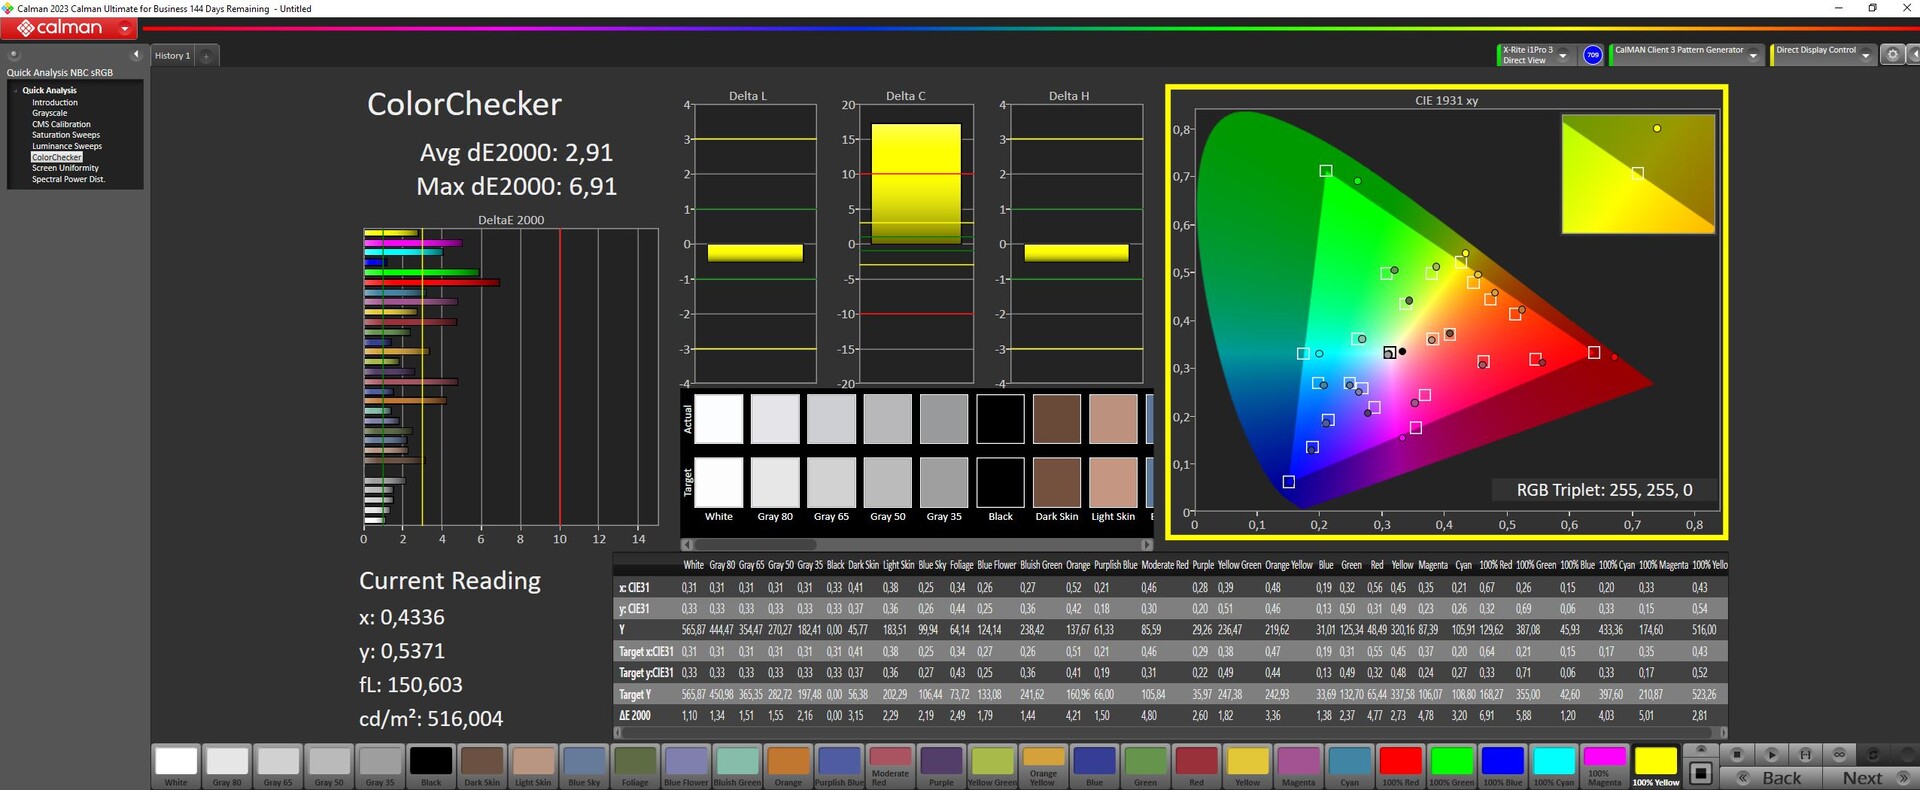
DisplayP3 è coperto da circa il 95 percento, sRGB completamente e AdobeRGB dall'86 all'87 percento.
Ex funziona, il display è calibrato correttamente rispetto allo standard P3. La nostra ricalibrazione ha migliorato i suoi valori DeltaE della scala di grigi, ma ha peggiorato i suoi valori DeltaE di ClocChecker, motivo per cui non vale la pena fare questo sforzo. Tuttavia, le sue deviazioni di colore non sono ideali, con una media di 2,68 e valori anomali fino a 6,41.

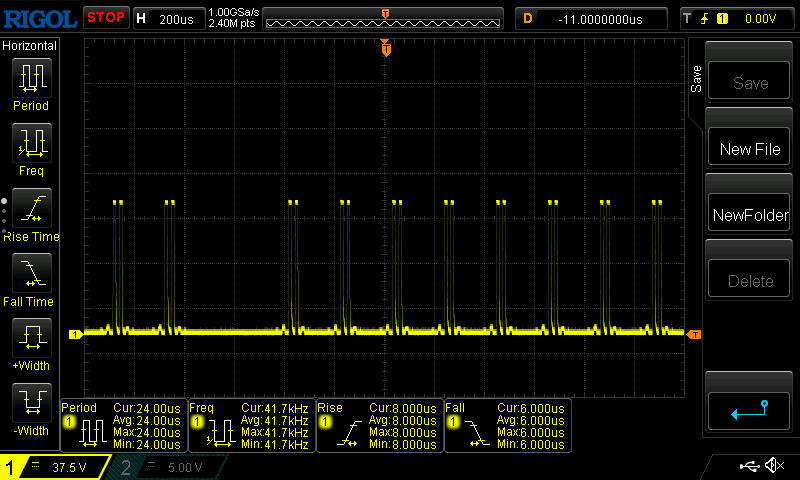
Tempi di risposta del Display
| ↔ Tempi di risposta dal Nero al Bianco | ||
|---|---|---|
| 10 ms ... aumenta ↗ e diminuisce ↘ combinato | ↗ 5.2 ms Incremento |   |
| ↘ 4.8 ms Calo | ||
| Lo schermo mostra buoni tempi di risposta durante i nostri tests, ma potrebbe essere troppo lento per i gamers competitivi. In confronto, tutti i dispositivi di test variano da 0.1 (minimo) a 240 (massimo) ms. » 22 % di tutti i dispositivi è migliore. Questo significa che i tempi di risposta rilevati sono migliori rispettto alla media di tutti i dispositivi testati (21.3 ms). | ||
| ↔ Tempo di risposta dal 50% Grigio all'80% Grigio | ||
| 12.6 ms ... aumenta ↗ e diminuisce ↘ combinato | ↗ 6.6 ms Incremento | 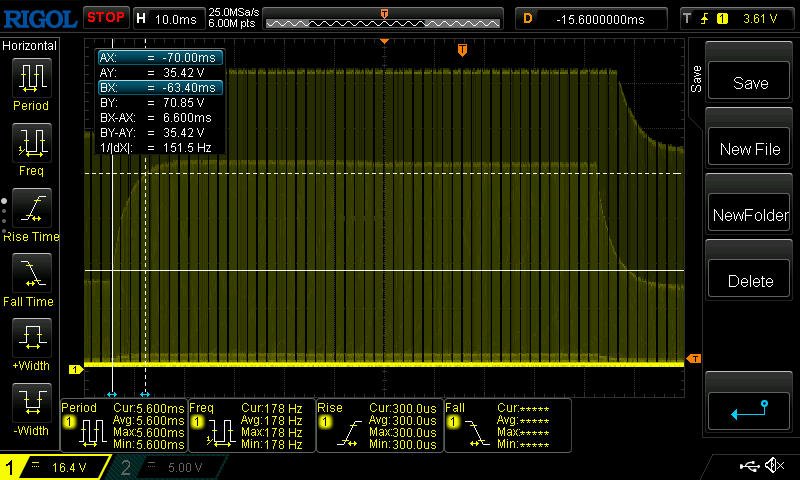 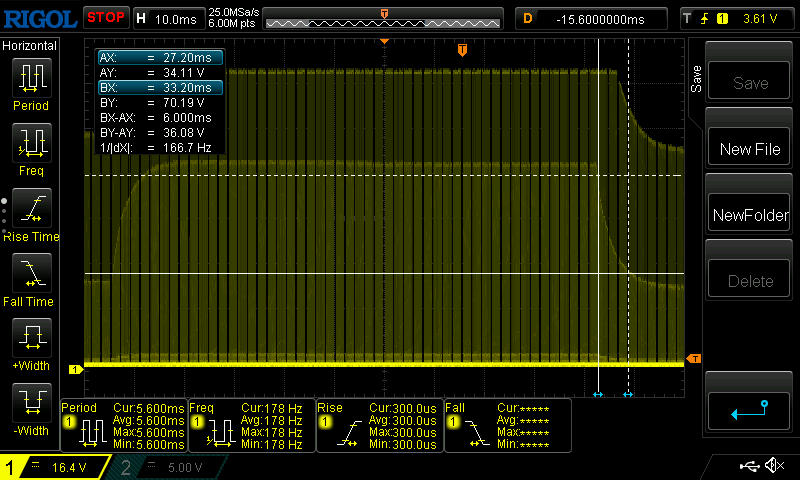 |
| ↘ 6 ms Calo | ||
| Lo schermo mostra buoni tempi di risposta durante i nostri tests, ma potrebbe essere troppo lento per i gamers competitivi. In confronto, tutti i dispositivi di test variano da 0.2 (minimo) a 636 (massimo) ms. » 21 % di tutti i dispositivi è migliore. Questo significa che i tempi di risposta rilevati sono migliori rispettto alla media di tutti i dispositivi testati (33.5 ms). | ||
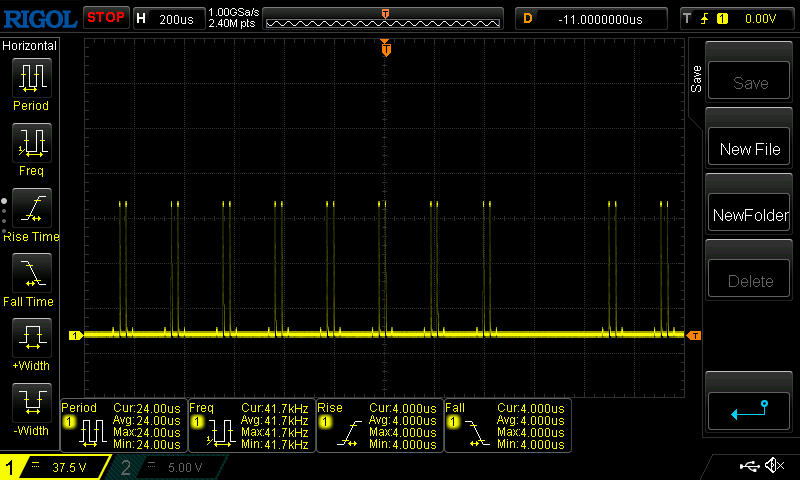
Sfarfallio dello schermo / PWM (Pulse-Width Modulation)
| flickering dello schermo / PWM rilevato | 5430 Hz Amplitude: 8 % | |
Il display sfarfalla a 5430 Hz (Probabilmente a causa dell'uso di PWM) . La frequenza di 5430 Hz è abbastanza alta, quindi la maggioranza degli utenti sensibili al PWM non dovrebbero notare alcun flickering. In confronto: 53 % di tutti i dispositivi testati non utilizza PWM per ridurre la luminosita' del display. Se è rilevato PWM, una media di 17655 (minimo: 5 - massimo: 3846000) Hz è stata rilevata. | ||

All'esterno, la visibilità è abbastanza buona grazie all'elevata luminosità dello schermo e alla superficie opaca. Tuttavia, è necessario evitare la luce diretta del sole.

Prestazioni - Elevate, ma non senza problemi
Il nuovo i9-14900HX in combinazione con la potente RTX 4090 e 64 GB di RAM fanno chiaramente di Legion 9i un gamer di fascia alta. Ciò è suggerito anche dal suo design sporgente sul retro, motivo per cui i creatori potrebbero cercare alternative più sottili, nonostante le prestazioni potenzialmente elevate del dispositivo.
Condizioni di test
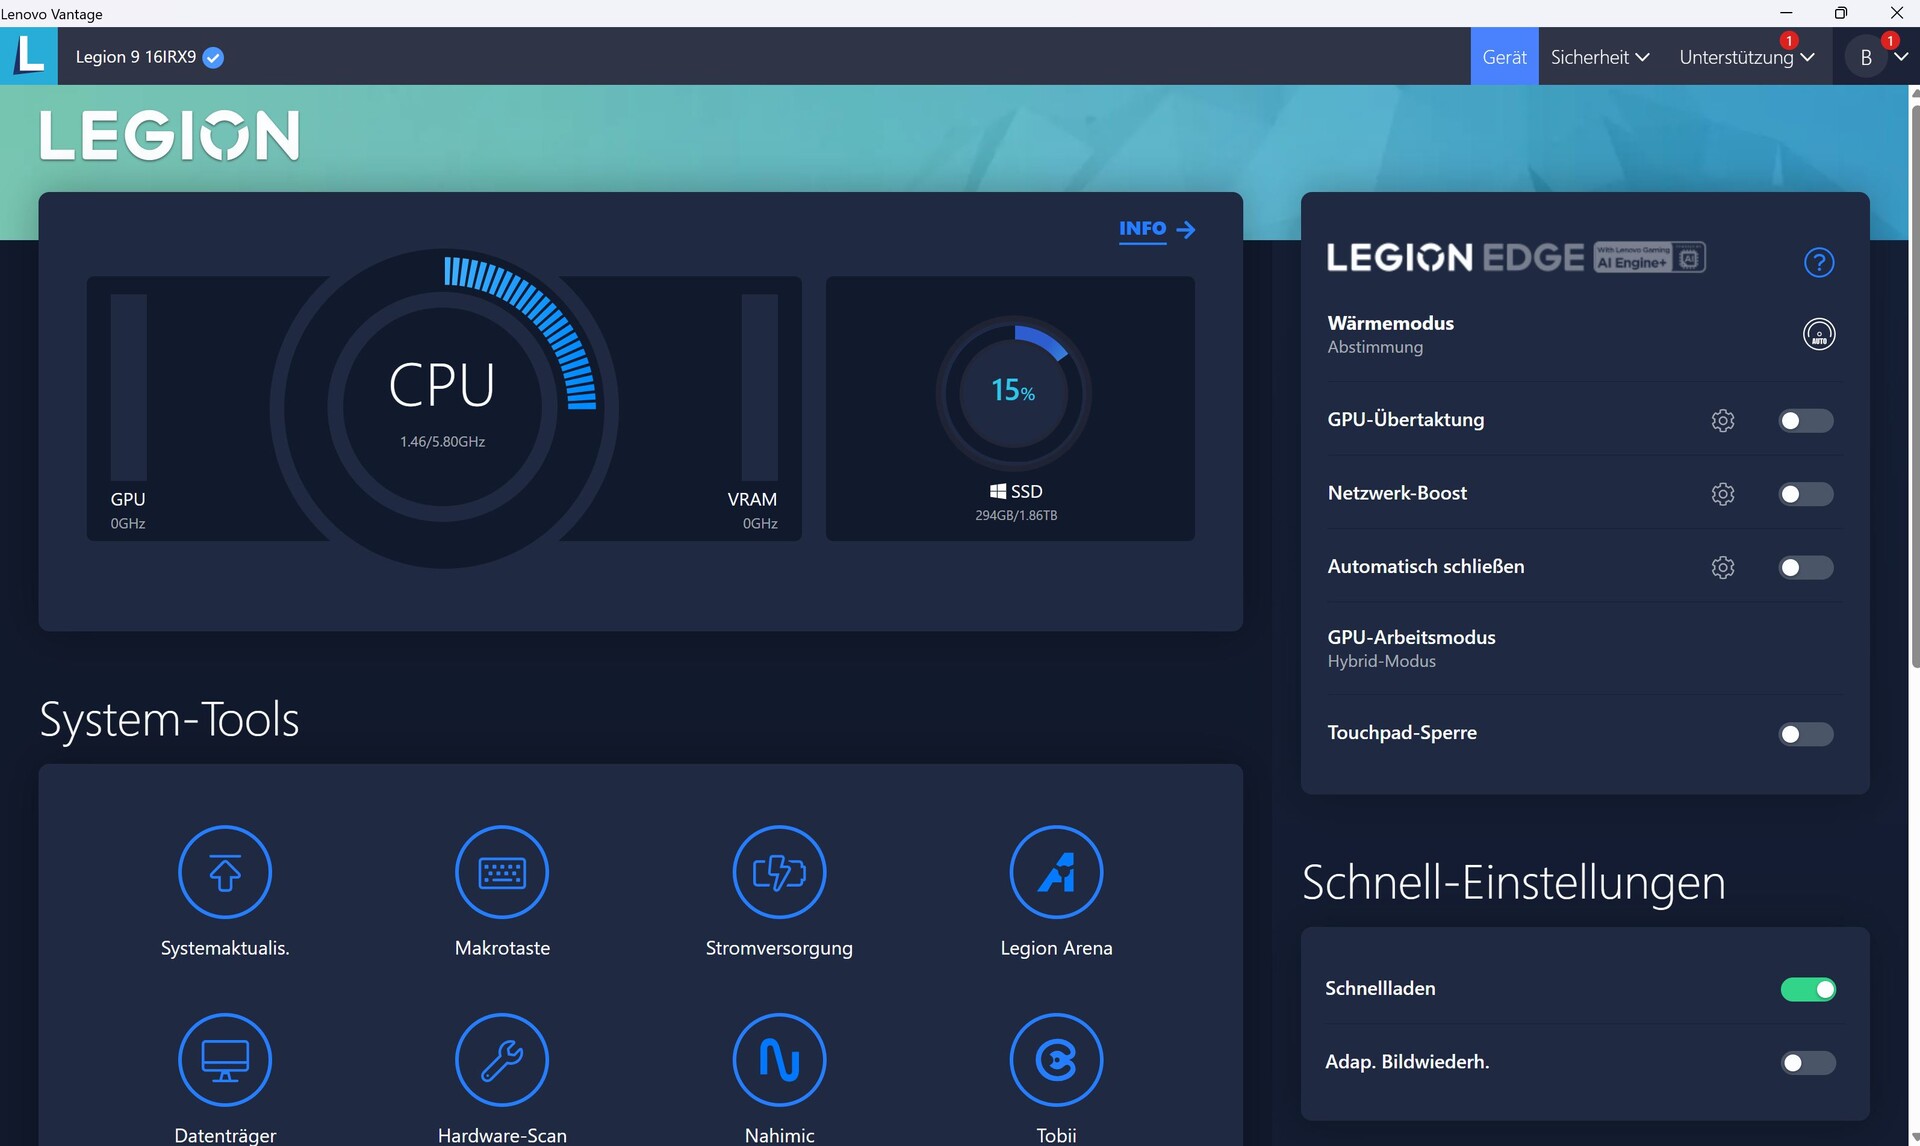
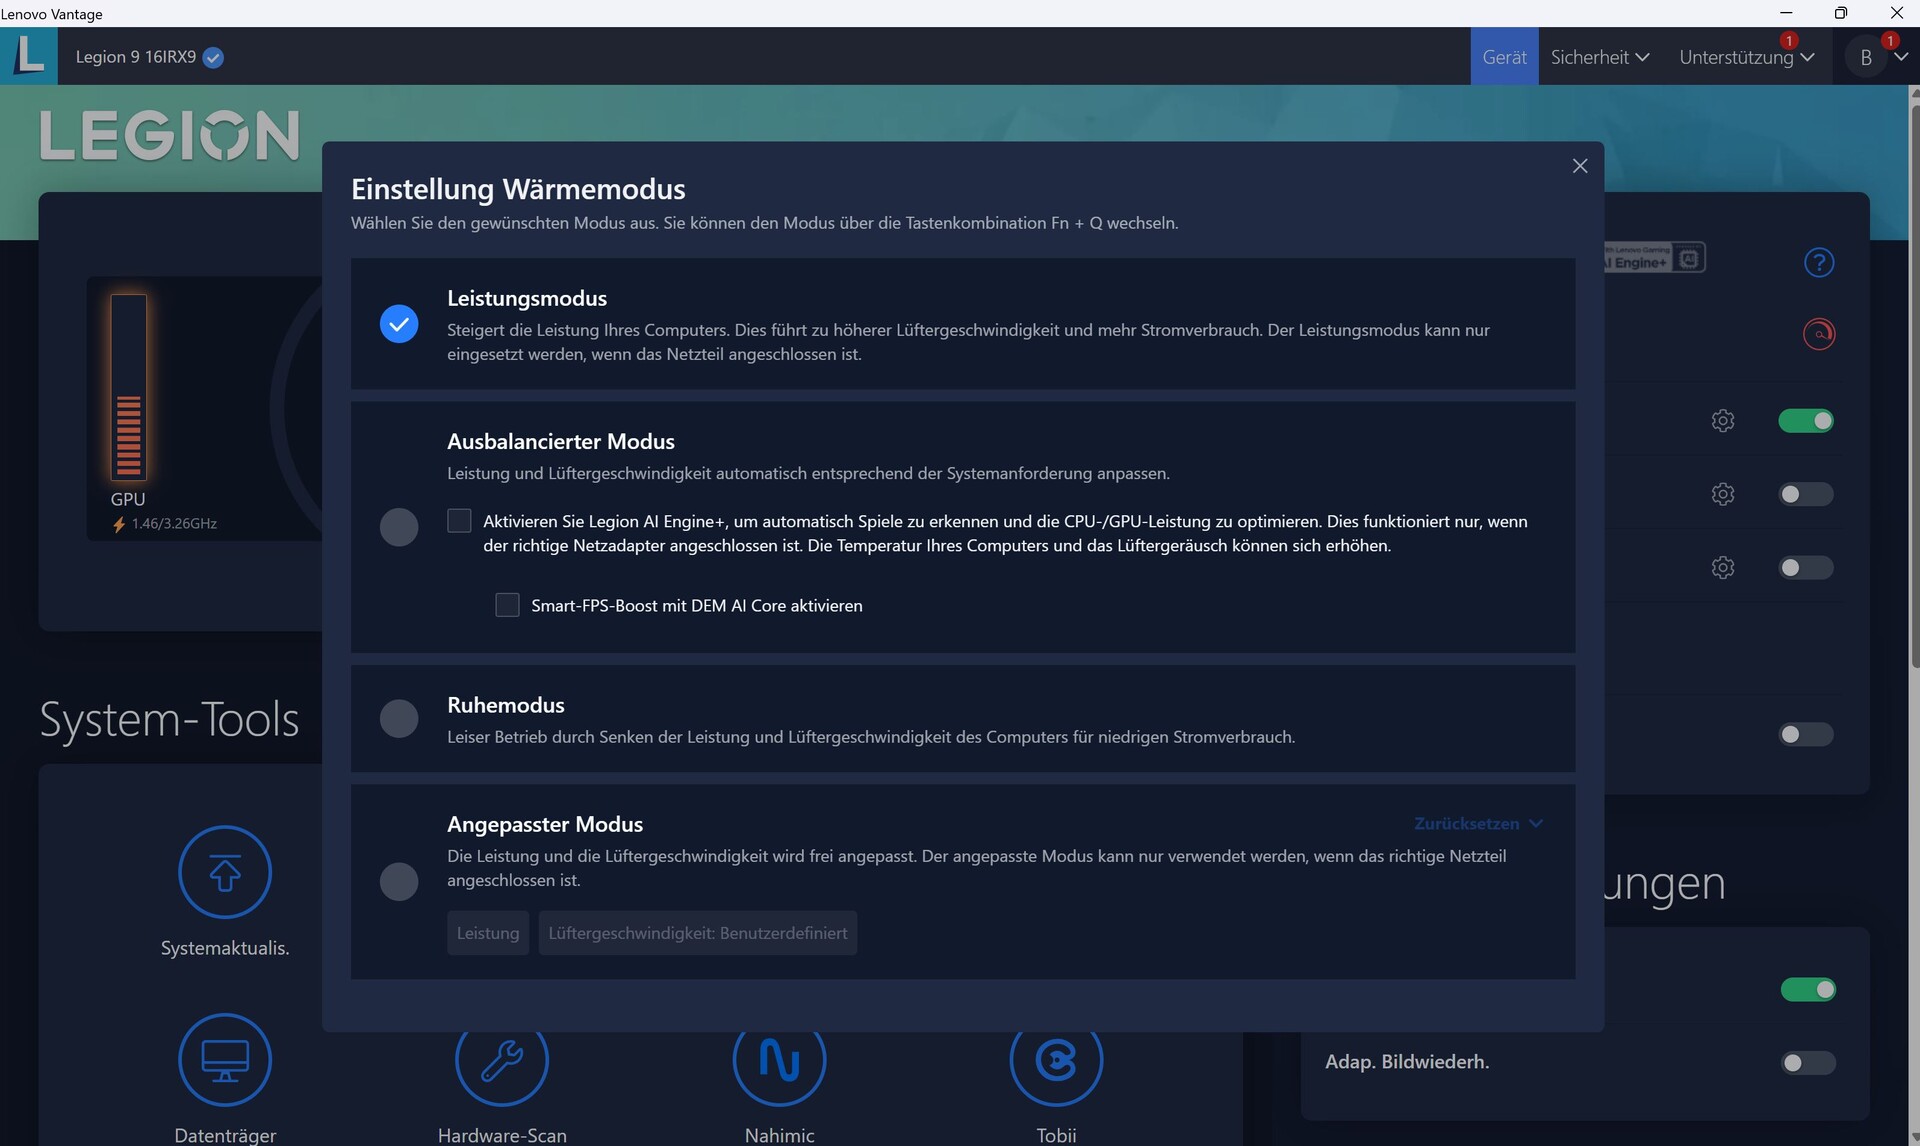
Lenovo Vantage è il nome del Centro di Controllo di Legion 9 e comprende i profili di prestazioni Prestazioni, Bilanciato (qui può anche selezionare AI per l'ottimizzazione) e Silenzioso. Esiste anche la modalità Personalizzata, che consente di impostare manualmente vari parametri.
Purtroppo, Vantage a volte ci ha infastidito con la pubblicità, ad esempio per Amazon Music, le app di YouTube, ecc. Questo perché i messaggi di marketing sono attivi per impostazione predefinita in Vantage e bisogna prima disattivarli per non essere più infastiditi da essi.
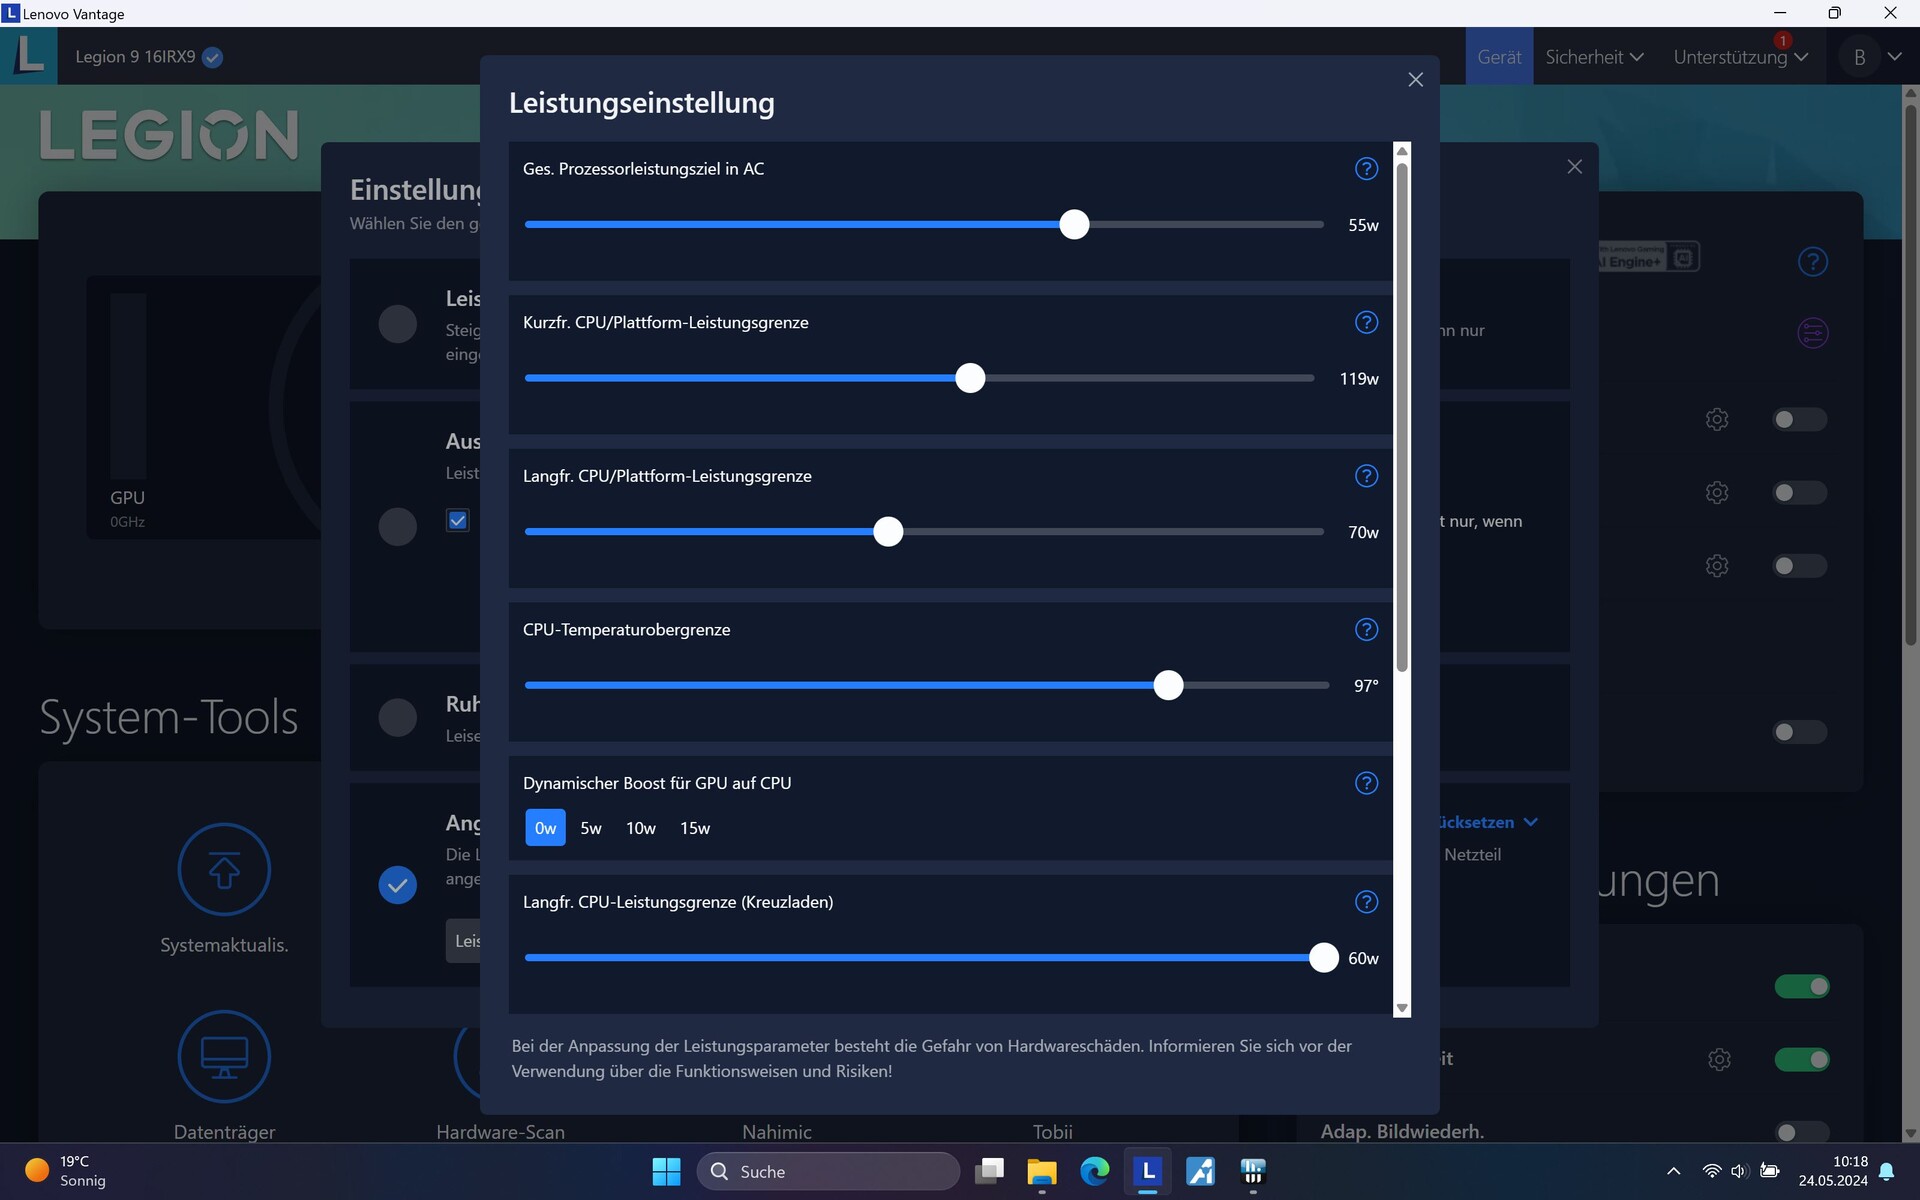
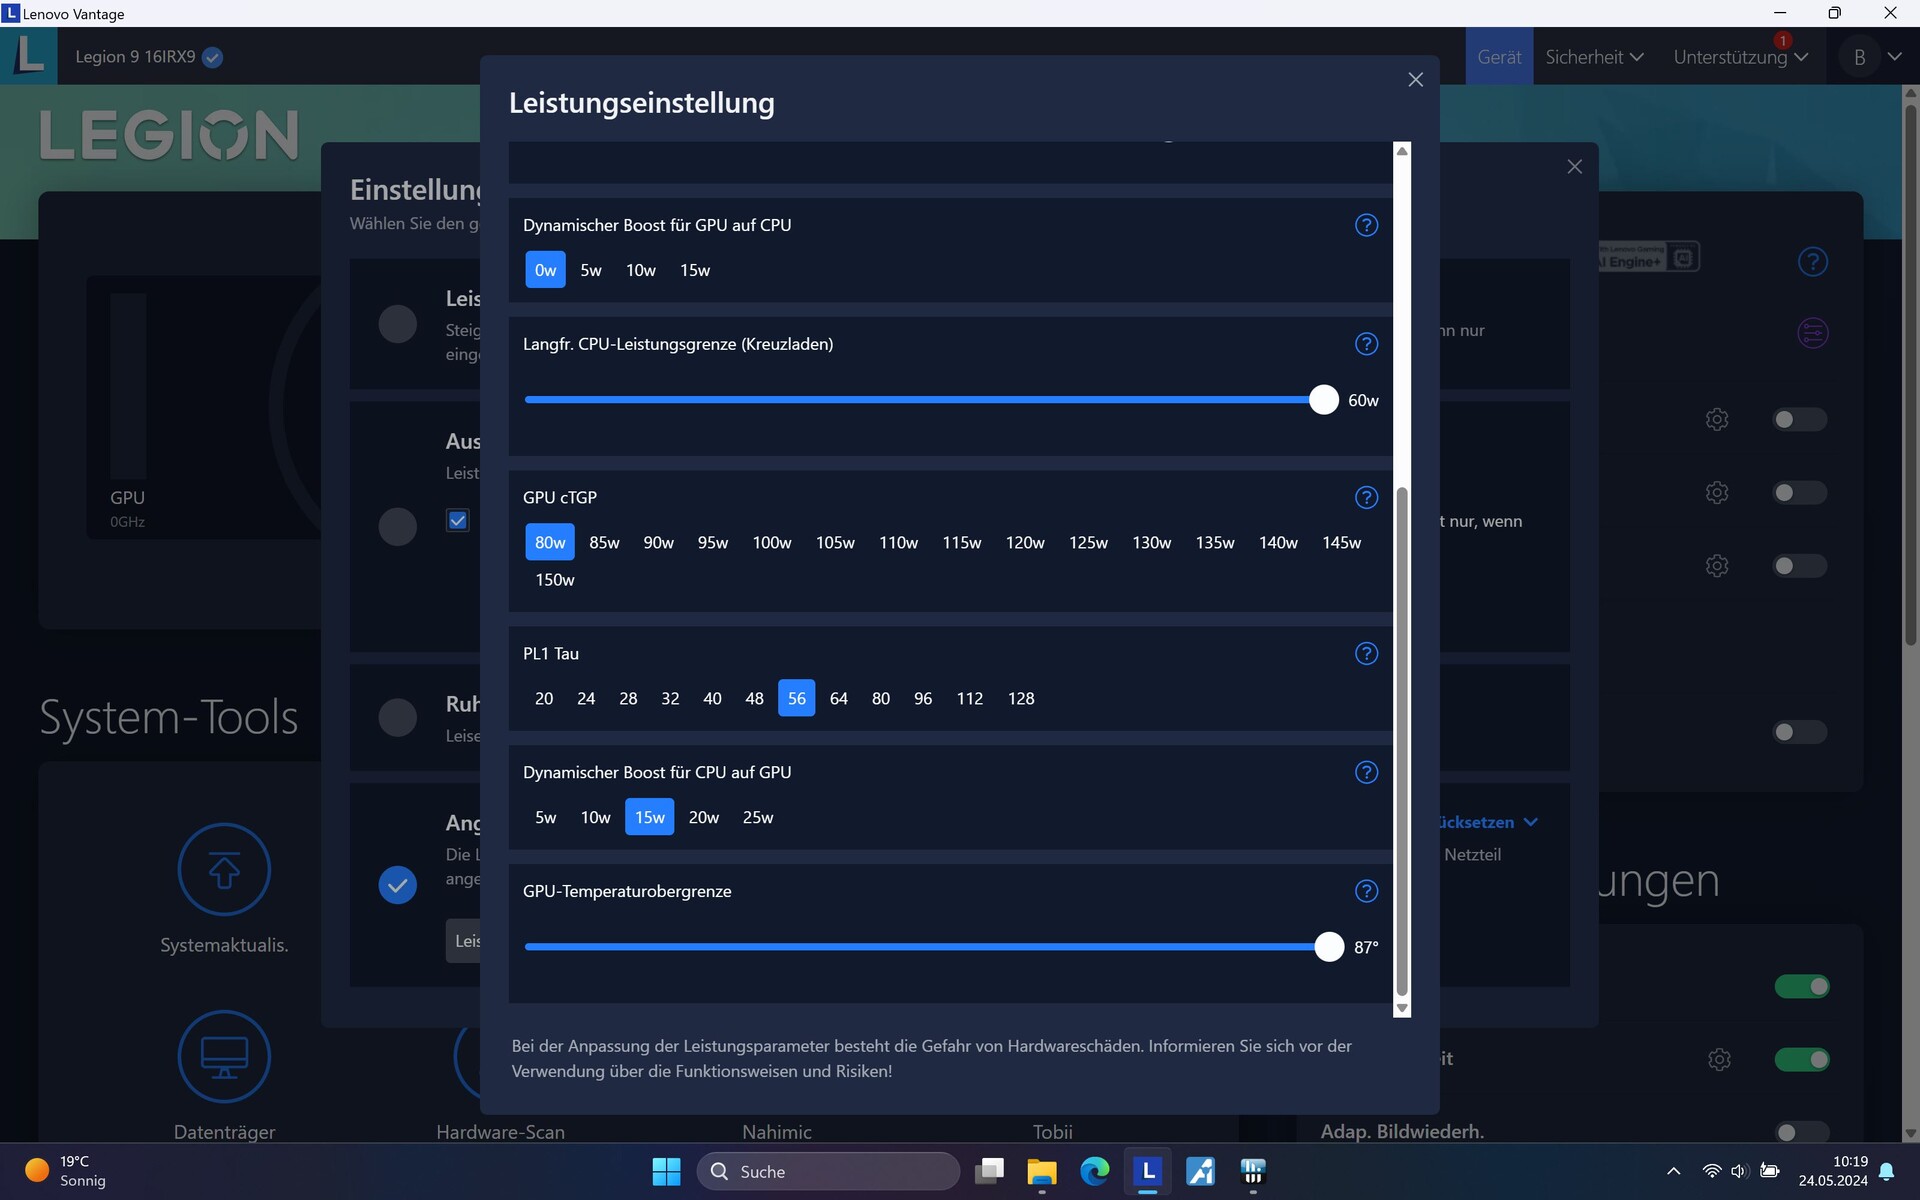
Abbiamo selezionato la modalità Performance per i nostri benchmark, ma abbiamo lasciato disattivato l'interruttore per l'overclocking della GPU.

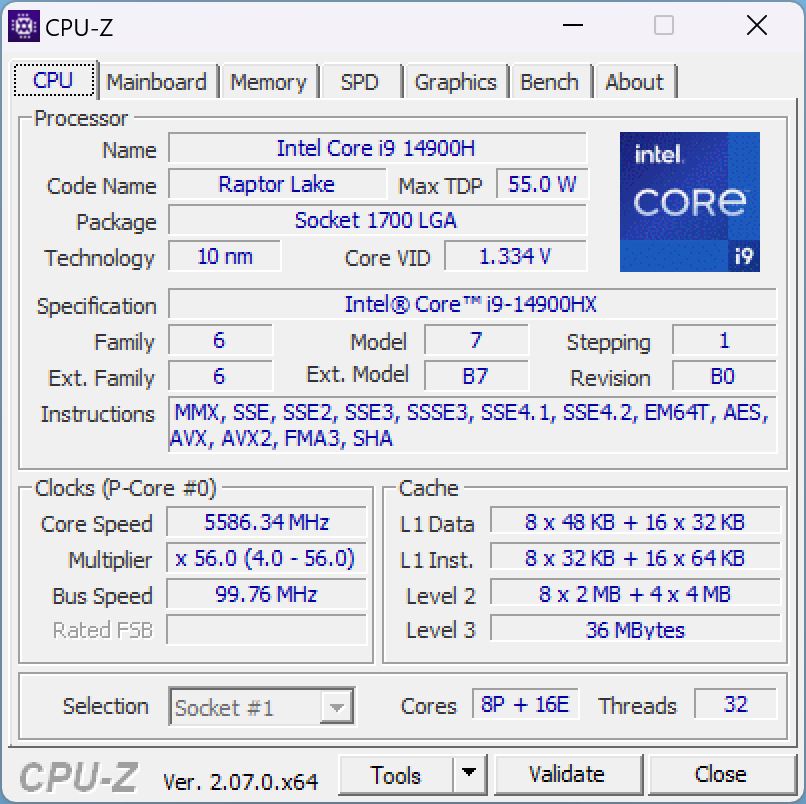
Processore
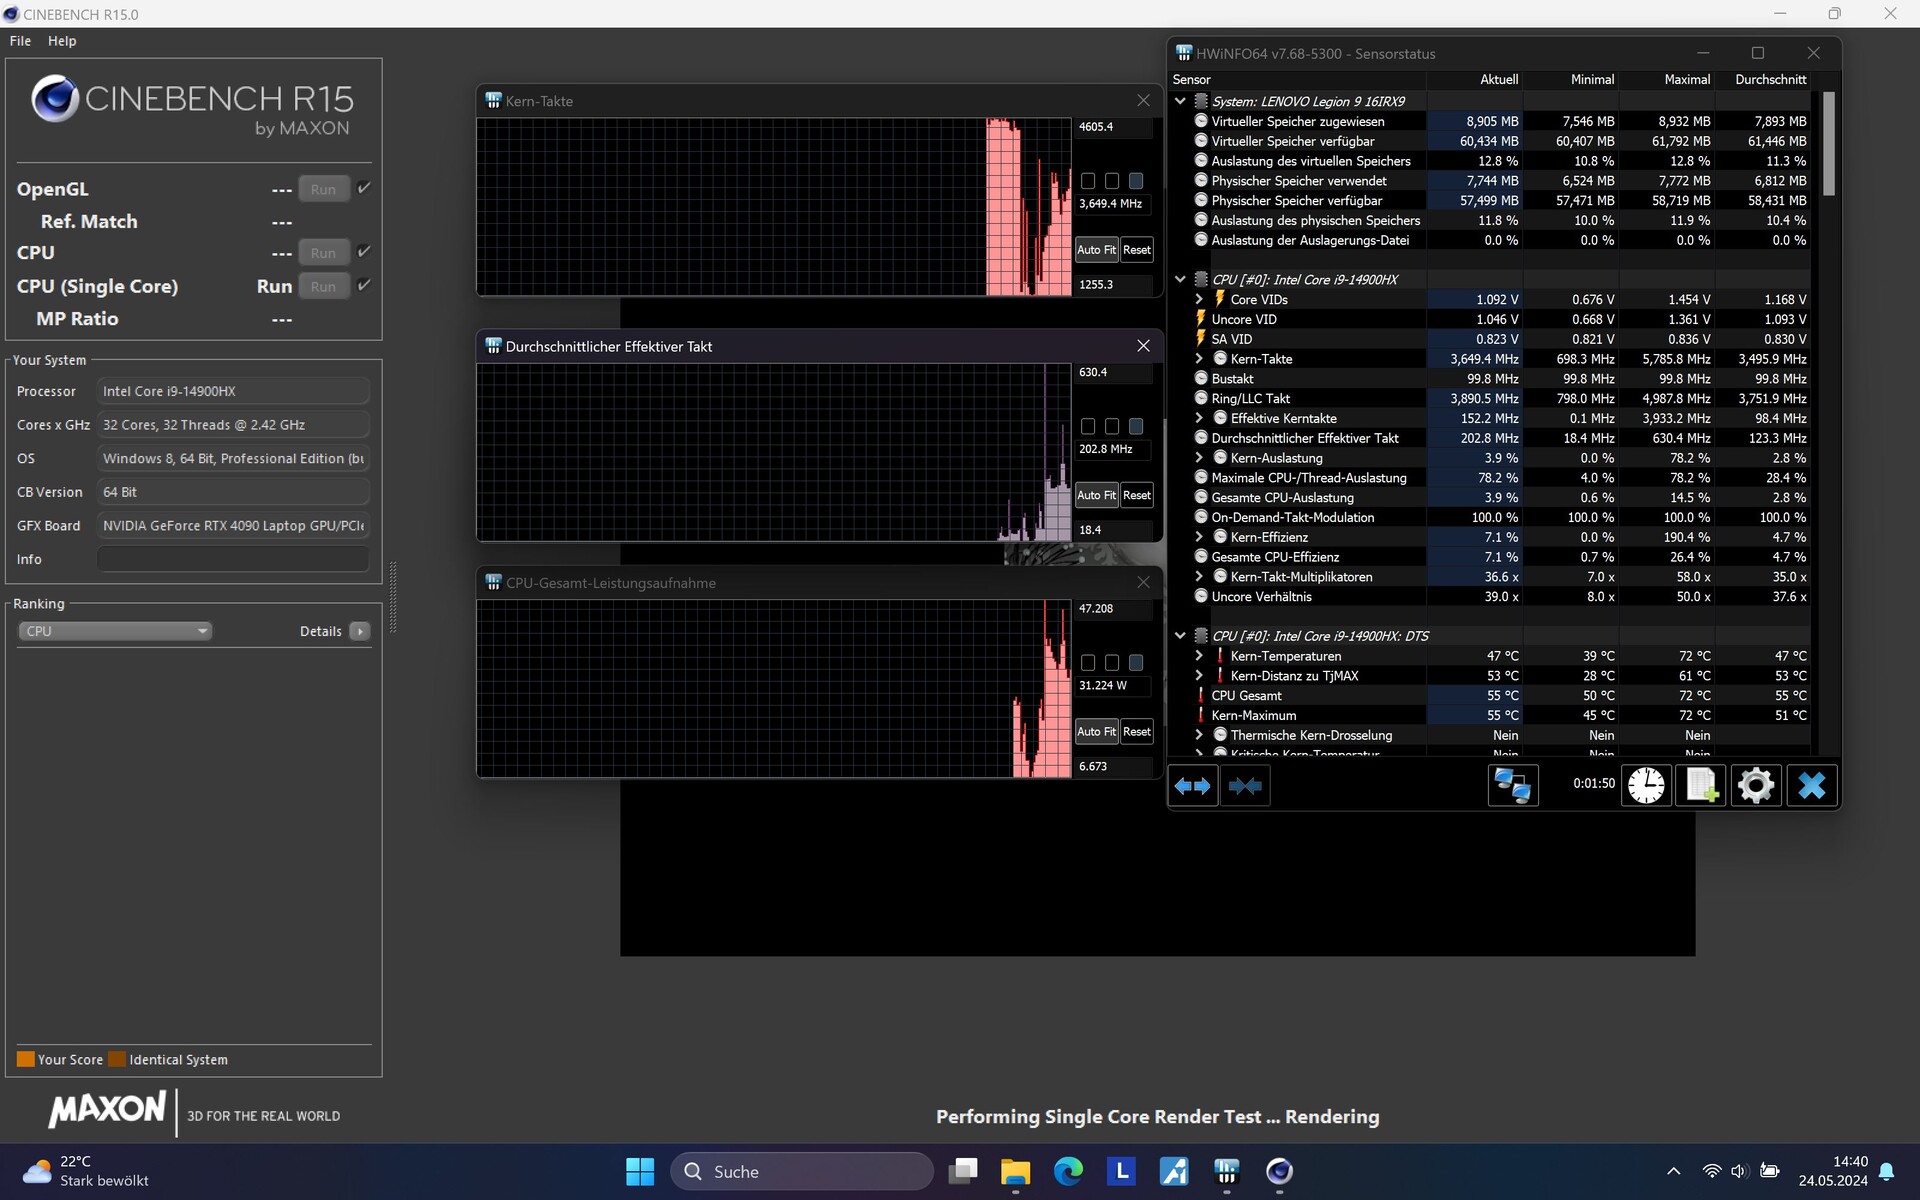
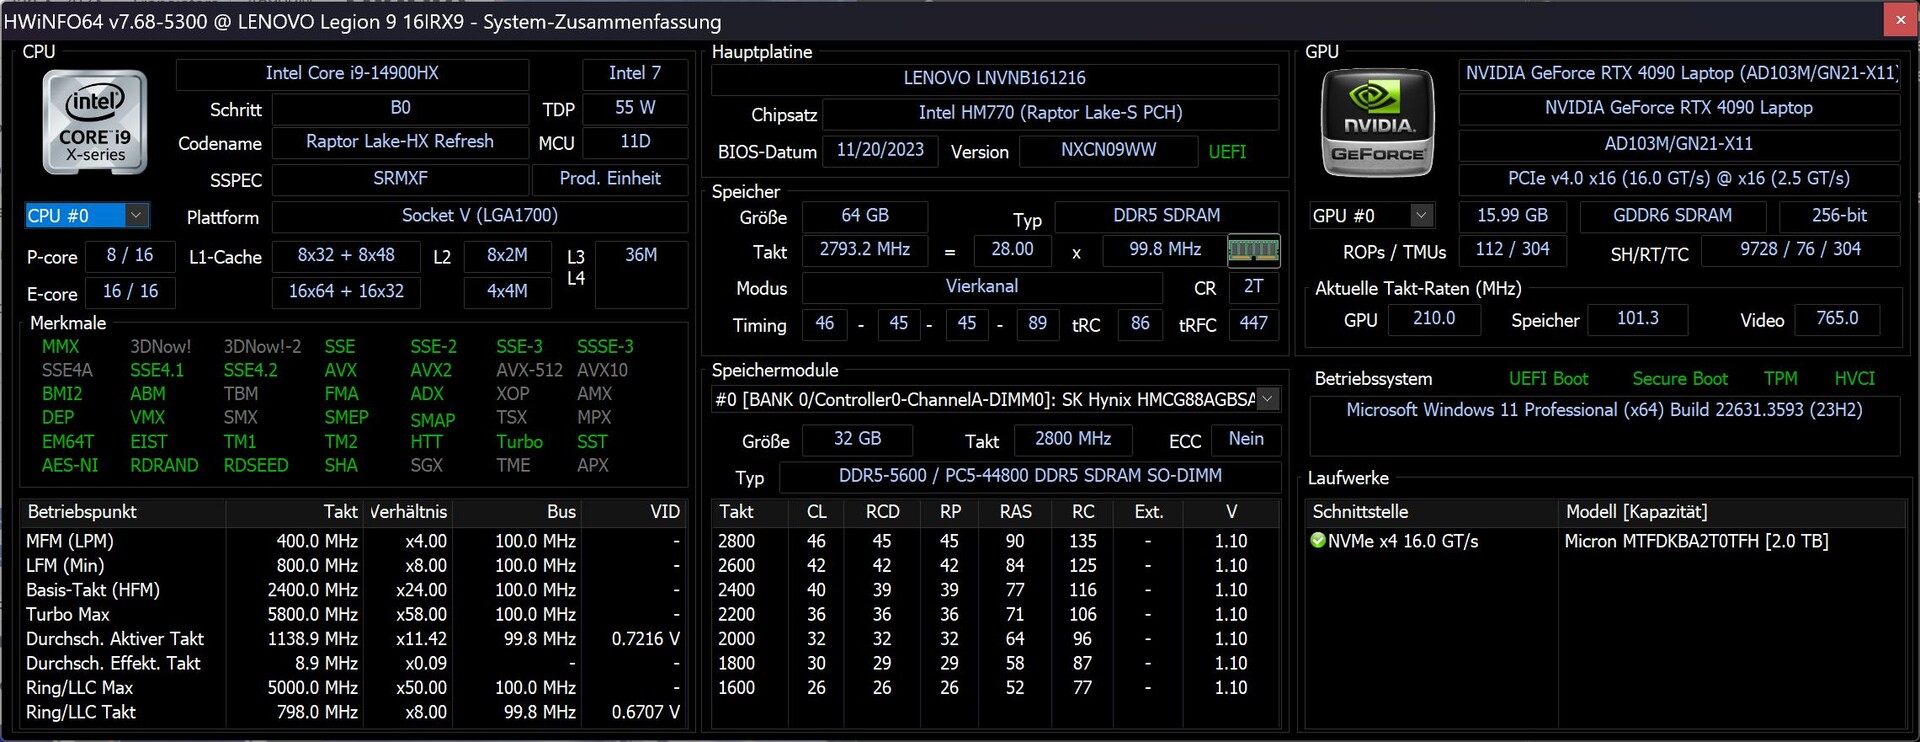
Il i9-14900HX è una CPU di fascia alta dell'ultima serie Raptor Lake Refresh di Intel. I suoi 8 core P hanno un clock fino a 5,8 GHz e la frequenza di clock di base dei 16 core E è di 1,6 GHz. Insieme possono elaborare un totale di 32 thread.
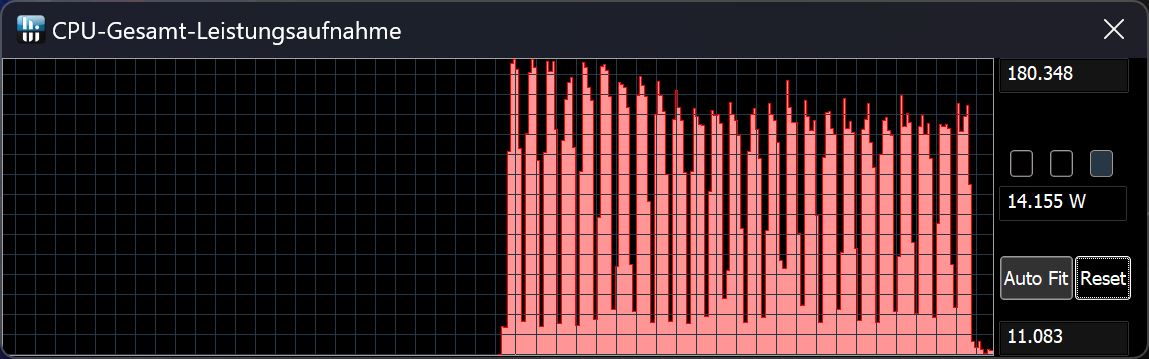
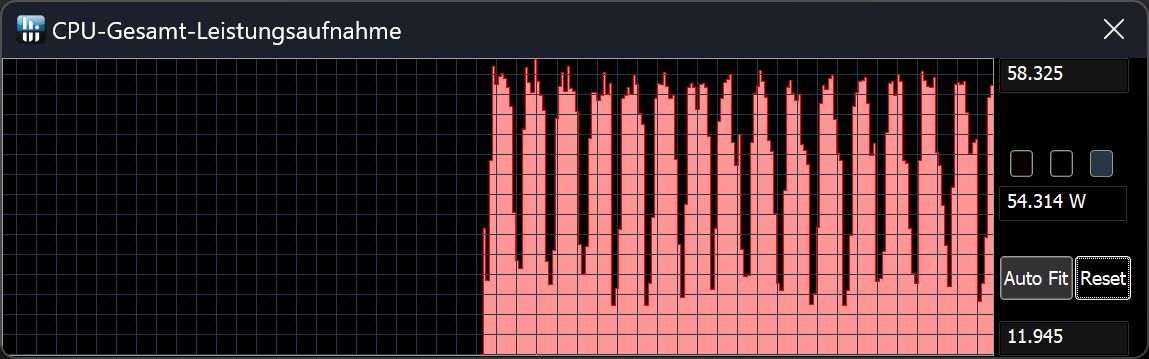
Durante il ciclo Cinebench R15, il nostro Legion 9i ha avuto le prestazioni iniziali più elevate; tuttavia, a differenza della concorrenza con la stessa CPU, le sue prestazioni sono diminuite costantemente nel tempo: circa il 7,5% dopo mezz'ora. Poi, le sue prestazioni erano appena superiori a quelle del suo predecessore con i9-13980HX. Nonostante ciò, la CPU all'interno di Legion 9 è ancora una delle più veloci nel campo del confronto, anche se l'aumento delle prestazioni rispetto al suo predecessore è piuttosto basso.
Mentre le sue prestazioni multi-thread sono fuori discussione,
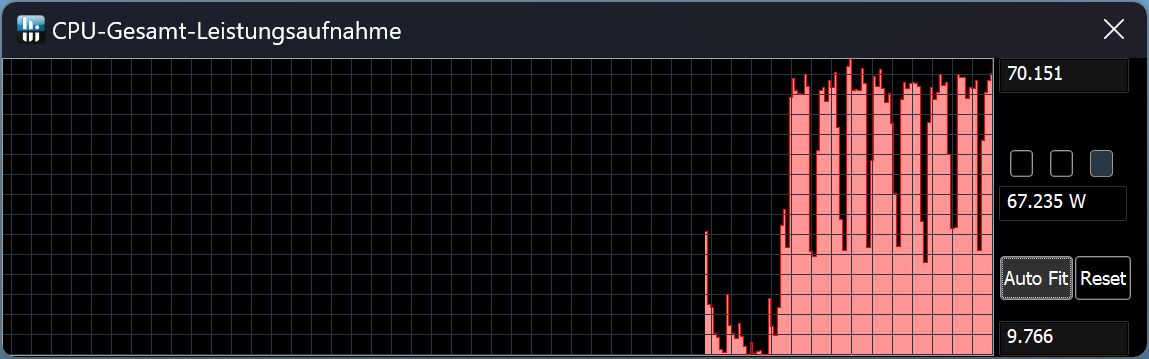
Legion 9i si è chiaramente indebolito quando si è trattato di prestazioni single-core in tutti i benchmark della CPU. Questo è stato riproducibile: a quanto pare le sue riserve di prestazioni single-core non sono esaurite nella modalità Prestazioni, per cui è necessario aumentare manualmente le cifre chiave utilizzando la modalità Personalizzata.Abbiamo quindi dato un'occhiata alle cifre chiave: In Cinebench R15 Single Core, il core ha inizialmente raggiunto un clock di 4,6 GHz. Dopo circa 50 secondi, il clock del core è sceso brevemente a soli 1,2 GHz, per poi stabilizzarsi tra 3 e 3,5 GHz. Il TDP era di circa 30 watt. In un altro test, il calo è stato molto meno pronunciato.
Con la spina di alimentazione staccata, le sue prestazioni multi-thread in Cinebench R15 sono diminuite di circa il 48,5 percento, ossia quasi la metà rispetto all'utilizzo del portatile collegato alla rete elettrica!
| Profilo delle prestazioni/valore della misurazione | Cinebench-15-Score 1a esecuzione | Consumo di potenza della CPU in Watt |
|---|---|---|
| Prestazioni senza overclock della CPU | 4.879 | 140 - 180 |
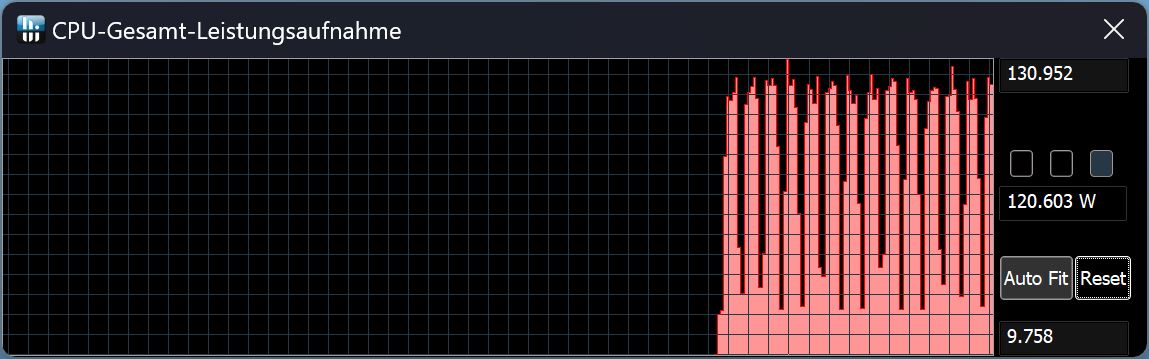
| Bilanciato con AI | 4.115 | 120 - 130 |
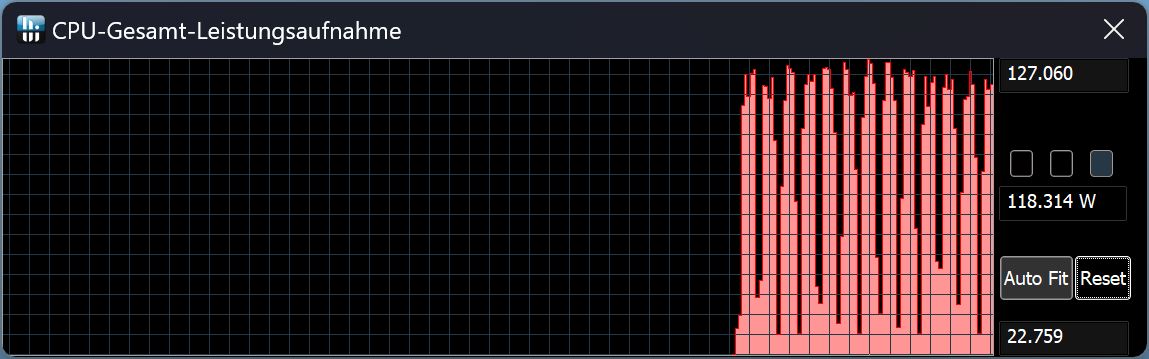
| Bilanciato senza AI | 4.091 | 115 - 127 |
| Silenzioso | 2.938 | 65 - 70 |
| Batteria | 2.516 | 40 - 58 |
Cinebench R15 Multi continuous test
Cinebench R23: Multi Core | Single Core
Cinebench R20: CPU (Multi Core) | CPU (Single Core)
Cinebench R15: CPU Multi 64Bit | CPU Single 64Bit
Blender: v2.79 BMW27 CPU
7-Zip 18.03: 7z b 4 | 7z b 4 -mmt1
Geekbench 6.2: Multi-Core | Single-Core
Geekbench 5.5: Multi-Core | Single-Core
HWBOT x265 Benchmark v2.2: 4k Preset
LibreOffice : 20 Documents To PDF
R Benchmark 2.5: Overall mean
| CPU Performance Rating | |
| Alienware m18 R2 | |
| Lenovo Legion 9 16IRX8 | |
| Media Intel Core i9-14900HX | |
| Razer Blade 16 2024, RTX 4090 | |
| Asus ROG Strix Scar 18 G834JYR (2024) | |
| Lenovo Legion 9 16IRX9, RTX 4090 | |
| Medion Erazer Beast X40 2024 | |
| Media della classe Gaming | |
| Cinebench R23 / Multi Core | |
| Lenovo Legion 9 16IRX9, RTX 4090 | |
| Alienware m18 R2 | |
| Lenovo Legion 9 16IRX8 | |
| Media Intel Core i9-14900HX (20702 - 36249, n=26) | |
| Razer Blade 16 2024, RTX 4090 | |
| Asus ROG Strix Scar 18 G834JYR (2024) | |
| Medion Erazer Beast X40 2024 | |
| Media della classe Gaming (5668 - 36249, n=213, ultimi 2 anni) | |
| Cinebench R23 / Single Core | |
| Alienware m18 R2 | |
| Medion Erazer Beast X40 2024 | |
| Asus ROG Strix Scar 18 G834JYR (2024) | |
| Media Intel Core i9-14900HX (1720 - 2235, n=26) | |
| Lenovo Legion 9 16IRX8 | |
| Razer Blade 16 2024, RTX 4090 | |
| Media della classe Gaming (1136 - 2235, n=211, ultimi 2 anni) | |
| Lenovo Legion 9 16IRX9, RTX 4090 | |
| Cinebench R20 / CPU (Multi Core) | |
| Lenovo Legion 9 16IRX9, RTX 4090 | |
| Alienware m18 R2 | |
| Media Intel Core i9-14900HX (8427 - 13832, n=26) | |
| Lenovo Legion 9 16IRX8 | |
| Razer Blade 16 2024, RTX 4090 | |
| Asus ROG Strix Scar 18 G834JYR (2024) | |
| Medion Erazer Beast X40 2024 | |
| Media della classe Gaming (2179 - 13832, n=211, ultimi 2 anni) | |
| Cinebench R20 / CPU (Single Core) | |
| Medion Erazer Beast X40 2024 | |
| Alienware m18 R2 | |
| Asus ROG Strix Scar 18 G834JYR (2024) | |
| Media Intel Core i9-14900HX (657 - 859, n=26) | |
| Razer Blade 16 2024, RTX 4090 | |
| Lenovo Legion 9 16IRX8 | |
| Media della classe Gaming (439 - 855, n=211, ultimi 2 anni) | |
| Lenovo Legion 9 16IRX9, RTX 4090 | |
| Cinebench R15 / CPU Multi 64Bit | |
| Lenovo Legion 9 16IRX9, RTX 4090 | |
| Alienware m18 R2 | |
| Lenovo Legion 9 16IRX8 | |
| Media Intel Core i9-14900HX (3263 - 5589, n=26) | |
| Razer Blade 16 2024, RTX 4090 | |
| Asus ROG Strix Scar 18 G834JYR (2024) | |
| Medion Erazer Beast X40 2024 | |
| Media della classe Gaming (905 - 5663, n=215, ultimi 2 anni) | |
| Cinebench R15 / CPU Single 64Bit | |
| Alienware m18 R2 | |
| Medion Erazer Beast X40 2024 | |
| Razer Blade 16 2024, RTX 4090 | |
| Media Intel Core i9-14900HX (247 - 320, n=26) | |
| Lenovo Legion 9 16IRX8 | |
| Asus ROG Strix Scar 18 G834JYR (2024) | |
| Media della classe Gaming (198 - 318, n=214, ultimi 2 anni) | |
| Lenovo Legion 9 16IRX9, RTX 4090 | |
| Blender / v2.79 BMW27 CPU | |
| Media della classe Gaming (87 - 555, n=206, ultimi 2 anni) | |
| Medion Erazer Beast X40 2024 | |
| Asus ROG Strix Scar 18 G834JYR (2024) | |
| Media Intel Core i9-14900HX (91 - 164, n=26) | |
| Razer Blade 16 2024, RTX 4090 | |
| Lenovo Legion 9 16IRX9, RTX 4090 | |
| Lenovo Legion 9 16IRX8 | |
| Alienware m18 R2 | |
| 7-Zip 18.03 / 7z b 4 | |
| Lenovo Legion 9 16IRX9, RTX 4090 | |
| Alienware m18 R2 | |
| Lenovo Legion 9 16IRX8 | |
| Razer Blade 16 2024, RTX 4090 | |
| Media Intel Core i9-14900HX (87555 - 136645, n=26) | |
| Asus ROG Strix Scar 18 G834JYR (2024) | |
| Medion Erazer Beast X40 2024 | |
| Media della classe Gaming (23795 - 140932, n=209, ultimi 2 anni) | |
| 7-Zip 18.03 / 7z b 4 -mmt1 | |
| Medion Erazer Beast X40 2024 | |
| Asus ROG Strix Scar 18 G834JYR (2024) | |
| Alienware m18 R2 | |
| Media Intel Core i9-14900HX (5452 - 7508, n=26) | |
| Razer Blade 16 2024, RTX 4090 | |
| Lenovo Legion 9 16IRX8 | |
| Media della classe Gaming (4502 - 7581, n=209, ultimi 2 anni) | |
| Lenovo Legion 9 16IRX9, RTX 4090 | |
| Geekbench 6.2 / Multi-Core | |
| Alienware m18 R2 | |
| Media Intel Core i9-14900HX (15849 - 19665, n=26) | |
| Asus ROG Strix Scar 18 G834JYR (2024) | |
| Razer Blade 16 2024, RTX 4090 | |
| Lenovo Legion 9 16IRX9, RTX 4090 | |
| Lenovo Legion 9 16IRX8 | |
| Medion Erazer Beast X40 2024 | |
| Media della classe Gaming (5340 - 19665, n=90, ultimi 2 anni) | |
| Geekbench 6.2 / Single-Core | |
| Medion Erazer Beast X40 2024 | |
| Alienware m18 R2 | |
| Asus ROG Strix Scar 18 G834JYR (2024) | |
| Media Intel Core i9-14900HX (2419 - 3129, n=26) | |
| Razer Blade 16 2024, RTX 4090 | |
| Lenovo Legion 9 16IRX8 | |
| Media della classe Gaming (1599 - 3129, n=90, ultimi 2 anni) | |
| Lenovo Legion 9 16IRX9, RTX 4090 | |
| Geekbench 5.5 / Multi-Core | |
| Lenovo Legion 9 16IRX9, RTX 4090 | |
| Alienware m18 R2 | |
| Lenovo Legion 9 16IRX8 | |
| Asus ROG Strix Scar 18 G834JYR (2024) | |
| Media Intel Core i9-14900HX (8618 - 23194, n=26) | |
| Razer Blade 16 2024, RTX 4090 | |
| Medion Erazer Beast X40 2024 | |
| Media della classe Gaming (4557 - 23194, n=214, ultimi 2 anni) | |
| Geekbench 5.5 / Single-Core | |
| Alienware m18 R2 | |
| Medion Erazer Beast X40 2024 | |
| Lenovo Legion 9 16IRX8 | |
| Razer Blade 16 2024, RTX 4090 | |
| Asus ROG Strix Scar 18 G834JYR (2024) | |
| Media Intel Core i9-14900HX (1669 - 2210, n=26) | |
| Media della classe Gaming (1196 - 2210, n=214, ultimi 2 anni) | |
| Lenovo Legion 9 16IRX9, RTX 4090 | |
| HWBOT x265 Benchmark v2.2 / 4k Preset | |
| Alienware m18 R2 | |
| Lenovo Legion 9 16IRX8 | |
| Lenovo Legion 9 16IRX9, RTX 4090 | |
| Media Intel Core i9-14900HX (22.7 - 38.9, n=26) | |
| Razer Blade 16 2024, RTX 4090 | |
| Asus ROG Strix Scar 18 G834JYR (2024) | |
| Medion Erazer Beast X40 2024 | |
| Media della classe Gaming (6.72 - 38.9, n=210, ultimi 2 anni) | |
| LibreOffice / 20 Documents To PDF | |
| Lenovo Legion 9 16IRX9, RTX 4090 | |
| Media della classe Gaming (31.4 - 96.6, n=206, ultimi 2 anni) | |
| Razer Blade 16 2024, RTX 4090 | |
| Alienware m18 R2 | |
| Media Intel Core i9-14900HX (31.4 - 85.1, n=26) | |
| Asus ROG Strix Scar 18 G834JYR (2024) | |
| Medion Erazer Beast X40 2024 | |
| Lenovo Legion 9 16IRX8 | |
| R Benchmark 2.5 / Overall mean | |
| Lenovo Legion 9 16IRX9, RTX 4090 | |
| Media della classe Gaming (0.3609 - 0.658, n=209, ultimi 2 anni) | |
| Asus ROG Strix Scar 18 G834JYR (2024) | |
| Media Intel Core i9-14900HX (0.3609 - 0.4859, n=26) | |
| Lenovo Legion 9 16IRX8 | |
| Razer Blade 16 2024, RTX 4090 | |
| Alienware m18 R2 | |
| Medion Erazer Beast X40 2024 | |
* ... Meglio usare valori piccoli
AIDA64: FP32 Ray-Trace | FPU Julia | CPU SHA3 | CPU Queen | FPU SinJulia | FPU Mandel | CPU AES | CPU ZLib | FP64 Ray-Trace | CPU PhotoWorxx
| Performance Rating | |
| Alienware m18 R2 | |
| Lenovo Legion 9 16IRX9, RTX 4090 | |
| Lenovo Legion 9 16IRX8 | |
| Media Intel Core i9-14900HX | |
| Razer Blade 16 2024, RTX 4090 | |
| Asus ROG Strix Scar 18 G834JYR (2024) | |
| Medion Erazer Beast X40 2024 | |
| Media della classe Gaming | |
| AIDA64 / FP32 Ray-Trace | |
| Alienware m18 R2 | |
| Lenovo Legion 9 16IRX9, RTX 4090 | |
| Lenovo Legion 9 16IRX8 | |
| Media Intel Core i9-14900HX (17244 - 33474, n=25) | |
| Razer Blade 16 2024, RTX 4090 | |
| Asus ROG Strix Scar 18 G834JYR (2024) | |
| Media della classe Gaming (4986 - 60169, n=206, ultimi 2 anni) | |
| Medion Erazer Beast X40 2024 | |
| AIDA64 / FPU Julia | |
| Alienware m18 R2 | |
| Lenovo Legion 9 16IRX9, RTX 4090 | |
| Lenovo Legion 9 16IRX8 | |
| Asus ROG Strix Scar 18 G834JYR (2024) | |
| Media Intel Core i9-14900HX (88537 - 166040, n=25) | |
| Razer Blade 16 2024, RTX 4090 | |
| Medion Erazer Beast X40 2024 | |
| Media della classe Gaming (25360 - 252486, n=206, ultimi 2 anni) | |
| AIDA64 / CPU SHA3 | |
| Alienware m18 R2 | |
| Lenovo Legion 9 16IRX9, RTX 4090 | |
| Lenovo Legion 9 16IRX8 | |
| Media Intel Core i9-14900HX (4267 - 7979, n=25) | |
| Asus ROG Strix Scar 18 G834JYR (2024) | |
| Razer Blade 16 2024, RTX 4090 | |
| Medion Erazer Beast X40 2024 | |
| Media della classe Gaming (1339 - 10389, n=206, ultimi 2 anni) | |
| AIDA64 / CPU Queen | |
| Asus ROG Strix Scar 18 G834JYR (2024) | |
| Alienware m18 R2 | |
| Media Intel Core i9-14900HX (118405 - 148966, n=25) | |
| Razer Blade 16 2024, RTX 4090 | |
| Lenovo Legion 9 16IRX8 | |
| Medion Erazer Beast X40 2024 | |
| Lenovo Legion 9 16IRX9, RTX 4090 | |
| Media della classe Gaming (41257 - 200651, n=206, ultimi 2 anni) | |
| AIDA64 / FPU SinJulia | |
| Alienware m18 R2 | |
| Lenovo Legion 9 16IRX9, RTX 4090 | |
| Asus ROG Strix Scar 18 G834JYR (2024) | |
| Razer Blade 16 2024, RTX 4090 | |
| Media Intel Core i9-14900HX (12217 - 18517, n=25) | |
| Lenovo Legion 9 16IRX8 | |
| Medion Erazer Beast X40 2024 | |
| Media della classe Gaming (3925 - 32988, n=206, ultimi 2 anni) | |
| AIDA64 / FPU Mandel | |
| Alienware m18 R2 | |
| Lenovo Legion 9 16IRX9, RTX 4090 | |
| Lenovo Legion 9 16IRX8 | |
| Razer Blade 16 2024, RTX 4090 | |
| Asus ROG Strix Scar 18 G834JYR (2024) | |
| Media Intel Core i9-14900HX (43302 - 83662, n=25) | |
| Media della classe Gaming (12321 - 134044, n=206, ultimi 2 anni) | |
| Medion Erazer Beast X40 2024 | |
| AIDA64 / CPU AES | |
| Media Intel Core i9-14900HX (86964 - 241777, n=25) | |
| Alienware m18 R2 | |
| Lenovo Legion 9 16IRX9, RTX 4090 | |
| Lenovo Legion 9 16IRX8 | |
| Razer Blade 16 2024, RTX 4090 | |
| Asus ROG Strix Scar 18 G834JYR (2024) | |
| Media della classe Gaming (19065 - 328679, n=206, ultimi 2 anni) | |
| Medion Erazer Beast X40 2024 | |
| AIDA64 / CPU ZLib | |
| Alienware m18 R2 | |
| Lenovo Legion 9 16IRX9, RTX 4090 | |
| Lenovo Legion 9 16IRX8 | |
| Razer Blade 16 2024, RTX 4090 | |
| Media Intel Core i9-14900HX (1265 - 2292, n=25) | |
| Asus ROG Strix Scar 18 G834JYR (2024) | |
| Medion Erazer Beast X40 2024 | |
| Media della classe Gaming (269 - 2409, n=206, ultimi 2 anni) | |
| AIDA64 / FP64 Ray-Trace | |
| Alienware m18 R2 | |
| Lenovo Legion 9 16IRX8 | |
| Lenovo Legion 9 16IRX9, RTX 4090 | |
| Razer Blade 16 2024, RTX 4090 | |
| Media Intel Core i9-14900HX (9170 - 18349, n=25) | |
| Asus ROG Strix Scar 18 G834JYR (2024) | |
| Medion Erazer Beast X40 2024 | |
| Media della classe Gaming (2540 - 31796, n=206, ultimi 2 anni) | |
| AIDA64 / CPU PhotoWorxx | |
| Lenovo Legion 9 16IRX9, RTX 4090 | |
| Lenovo Legion 9 16IRX8 | |
| Alienware m18 R2 | |
| Asus ROG Strix Scar 18 G834JYR (2024) | |
| Razer Blade 16 2024, RTX 4090 | |
| Medion Erazer Beast X40 2024 | |
| Media Intel Core i9-14900HX (33960 - 54702, n=25) | |
| Media della classe Gaming (10805 - 60161, n=207, ultimi 2 anni) | |
Prestazioni del sistema
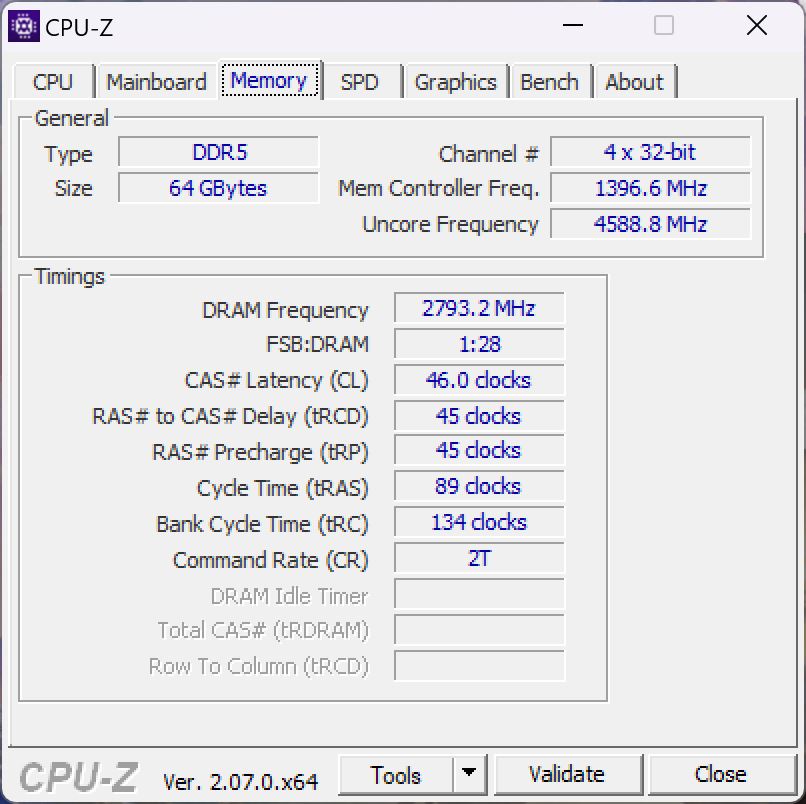
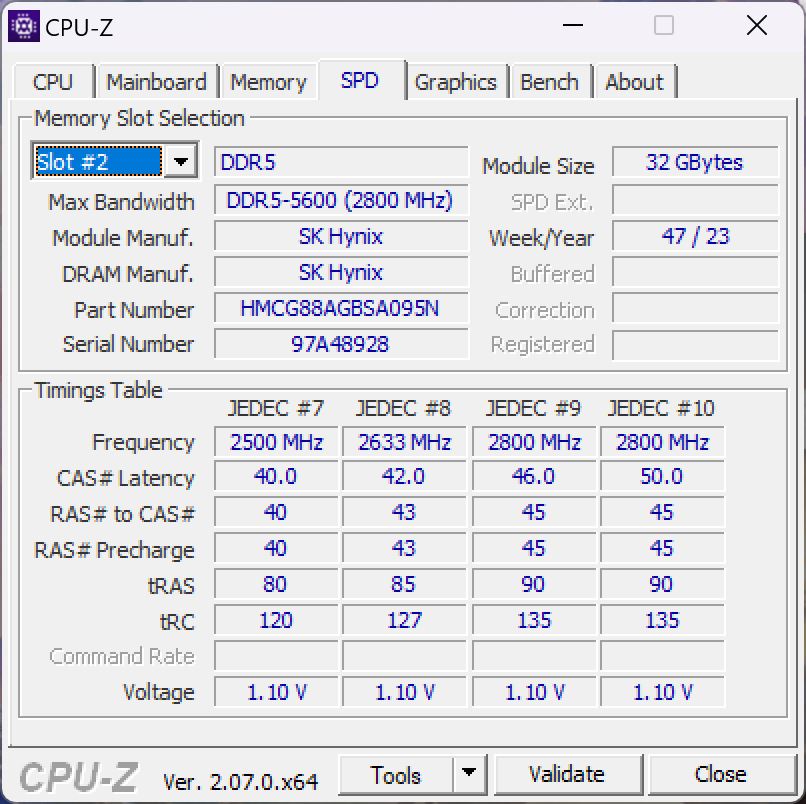
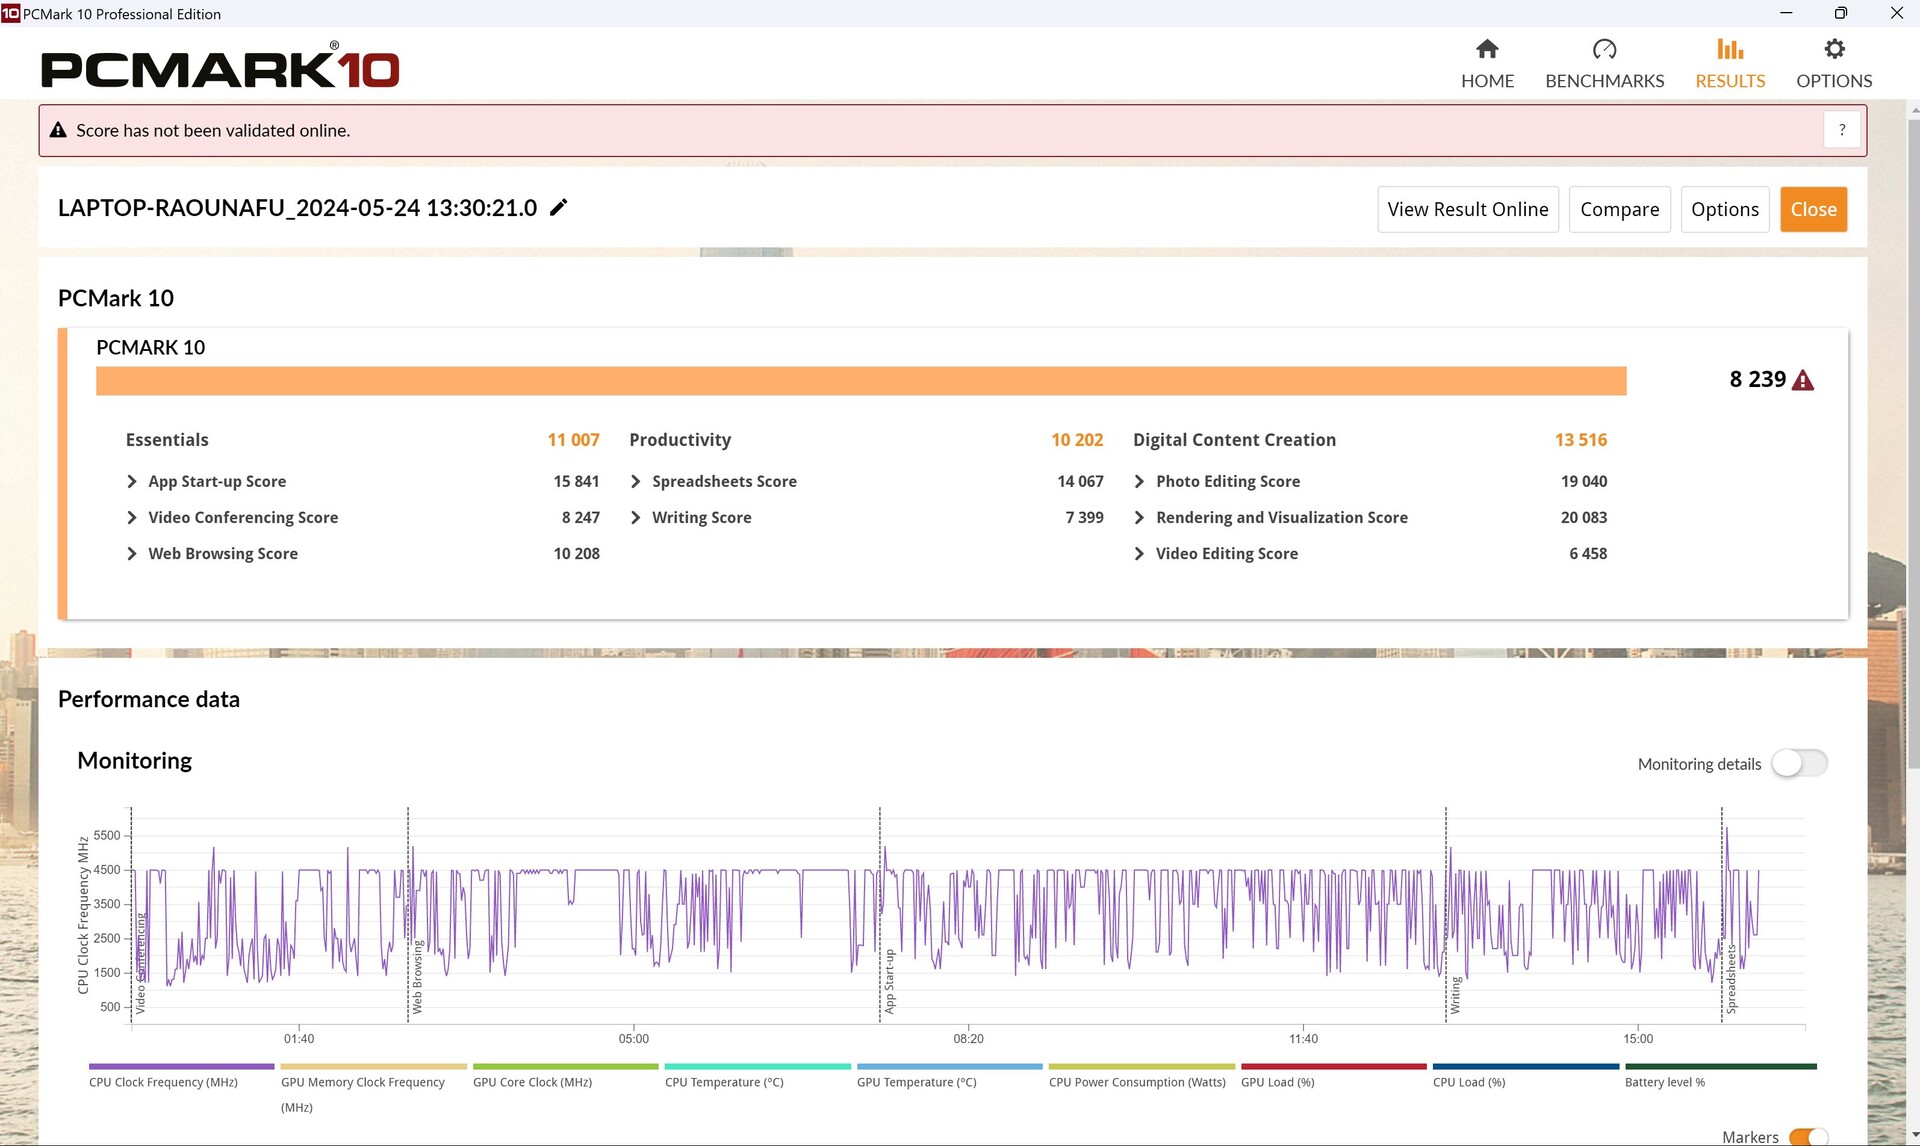
Le sue prestazioni in PCMark 10 sono state inferiori di circa il 5% rispetto alla media dei laptop con la stessa combinazione CPU/GPU. Aida ha anche dimostrato che, sebbene la sua RAM offra buone velocità di lettura e scrittura, la sua latenza di memoria è insolitamente alta, portando a risultati peggiori del previsto in alcuni benchmark, come in questo caso.
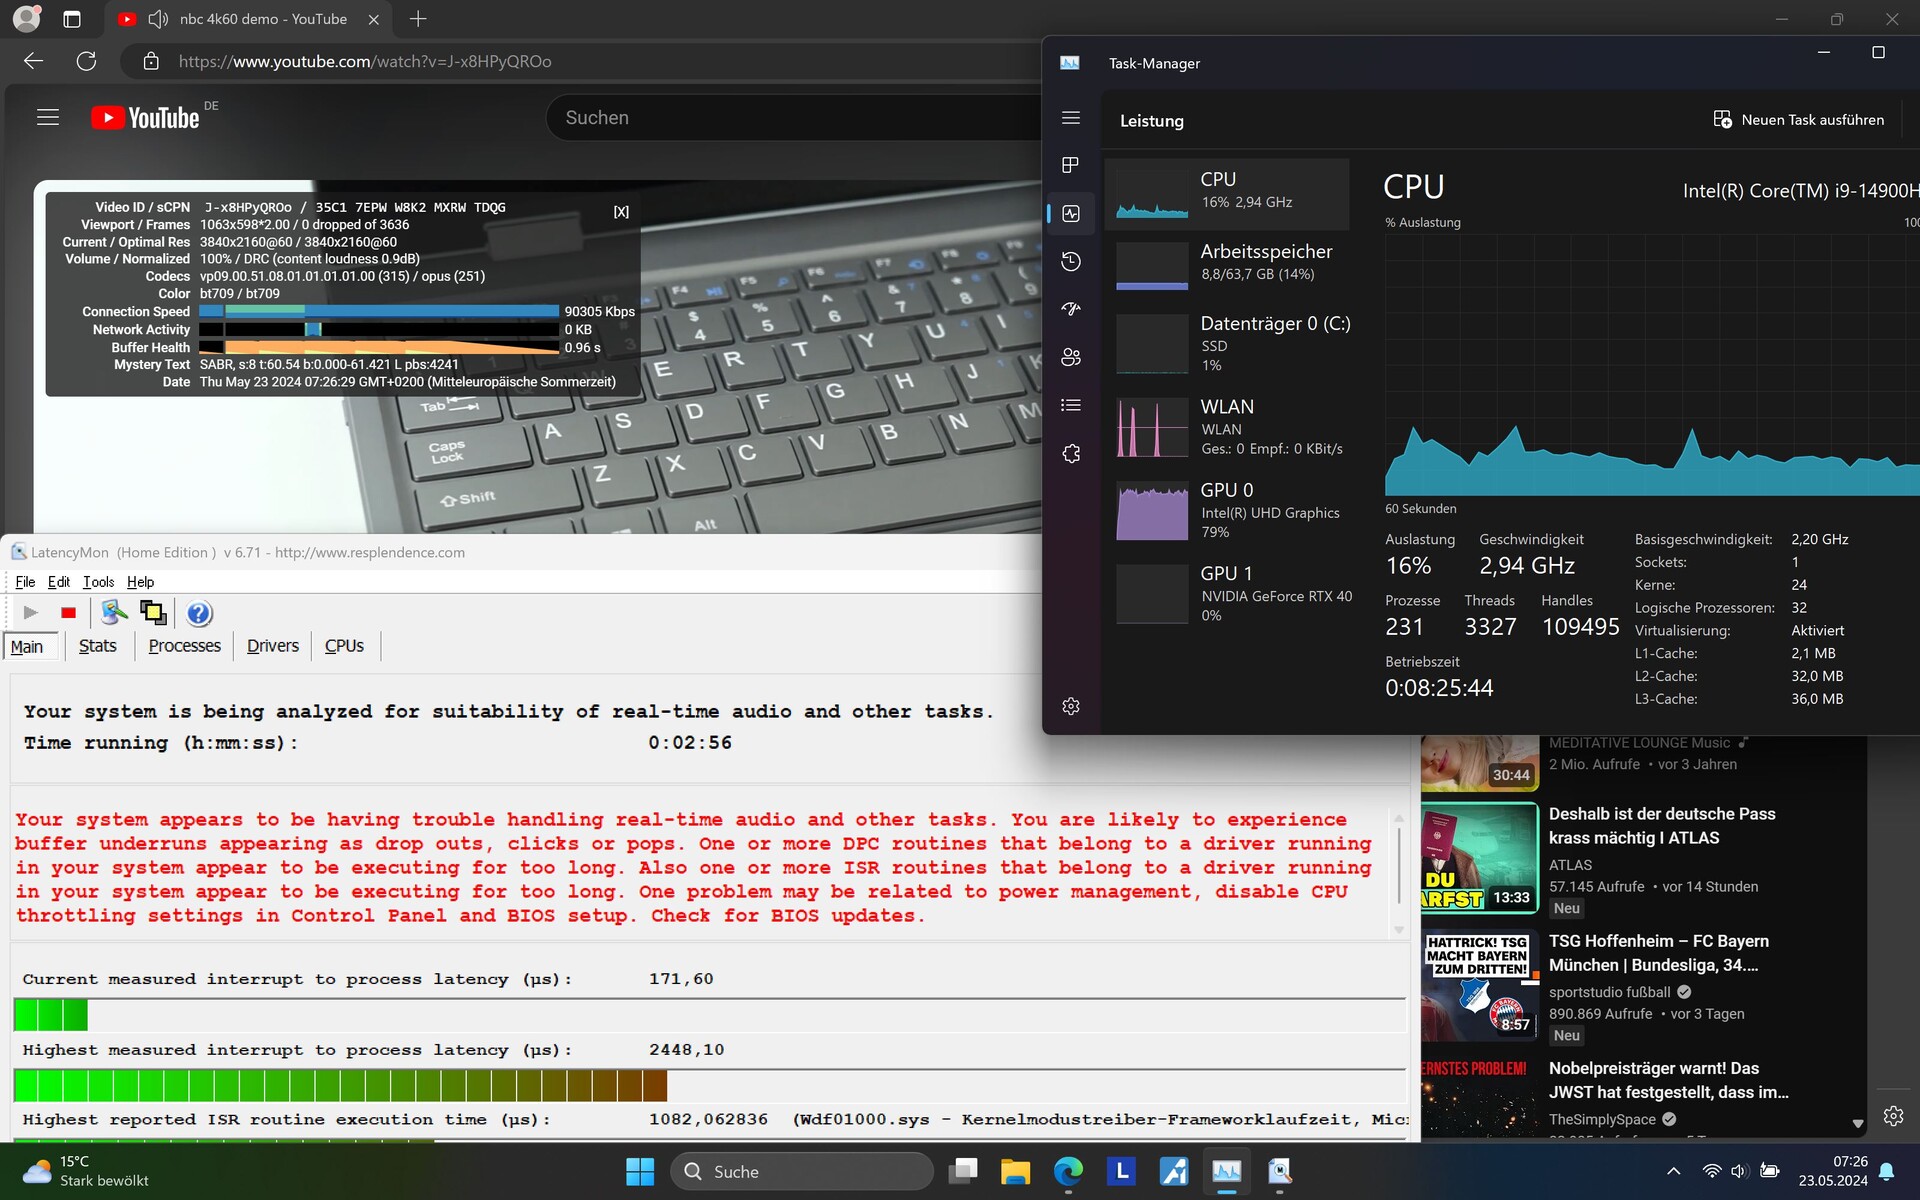
Soggettivamente, abbiamo notato che, sebbene il portatile funzioni in modo fluido per la maggior parte del tempo, di tanto in tanto si "impunta" durante l'esecuzione dei giochi. Ciò è stato confermato anche dal grafico della frequenza dei fotogrammi di Far Cry 5, ad esempio, dove la frequenza dei fotogrammi sembra diminuire brevemente, cosa che sembra verificarsi più spesso. Anche le sue latenze DPC sono piuttosto elevate, si veda la prossima sezione. Anche i suoi risultati con le applicazioni web sono stati ripetutamente deboli.
CrossMark: Overall | Productivity | Creativity | Responsiveness
WebXPRT 3: Overall
WebXPRT 4: Overall
Mozilla Kraken 1.1: Total
| PCMark 10 / Score | |
| Alienware m18 R2 | |
| Lenovo Legion 9 16IRX8 | |
| Medion Erazer Beast X40 2024 | |
| Asus ROG Strix Scar 18 G834JYR (2024) | |
| Media Intel Core i9-14900HX, NVIDIA GeForce RTX 4090 Laptop GPU (8230 - 9234, n=10) | |
| Razer Blade 16 2024, RTX 4090 | |
| Lenovo Legion 9 16IRX9, RTX 4090 | |
| Media della classe Gaming (5442 - 9852, n=185, ultimi 2 anni) | |
| PCMark 10 / Essentials | |
| Lenovo Legion 9 16IRX8 | |
| Alienware m18 R2 | |
| Asus ROG Strix Scar 18 G834JYR (2024) | |
| Media Intel Core i9-14900HX, NVIDIA GeForce RTX 4090 Laptop GPU (10871 - 11628, n=10) | |
| Lenovo Legion 9 16IRX9, RTX 4090 | |
| Razer Blade 16 2024, RTX 4090 | |
| Medion Erazer Beast X40 2024 | |
| Media della classe Gaming (8829 - 12334, n=184, ultimi 2 anni) | |
| PCMark 10 / Productivity | |
| Medion Erazer Beast X40 2024 | |
| Alienware m18 R2 | |
| Razer Blade 16 2024, RTX 4090 | |
| Lenovo Legion 9 16IRX8 | |
| Media Intel Core i9-14900HX, NVIDIA GeForce RTX 4090 Laptop GPU (9951 - 11759, n=10) | |
| Asus ROG Strix Scar 18 G834JYR (2024) | |
| Lenovo Legion 9 16IRX9, RTX 4090 | |
| Media della classe Gaming (6662 - 14612, n=184, ultimi 2 anni) | |
| PCMark 10 / Digital Content Creation | |
| Alienware m18 R2 | |
| Lenovo Legion 9 16IRX8 | |
| Asus ROG Strix Scar 18 G834JYR (2024) | |
| Medion Erazer Beast X40 2024 | |
| Media Intel Core i9-14900HX, NVIDIA GeForce RTX 4090 Laptop GPU (13219 - 16462, n=10) | |
| Lenovo Legion 9 16IRX9, RTX 4090 | |
| Razer Blade 16 2024, RTX 4090 | |
| Media della classe Gaming (6462 - 18475, n=184, ultimi 2 anni) | |
| CrossMark / Overall | |
| Asus ROG Strix Scar 18 G834JYR (2024) | |
| Razer Blade 16 2024, RTX 4090 | |
| Medion Erazer Beast X40 2024 | |
| Media Intel Core i9-14900HX, NVIDIA GeForce RTX 4090 Laptop GPU (1877 - 2344, n=10) | |
| Alienware m18 R2 | |
| Lenovo Legion 9 16IRX9, RTX 4090 | |
| Lenovo Legion 9 16IRX8 | |
| Media della classe Gaming (1247 - 2344, n=162, ultimi 2 anni) | |
| CrossMark / Productivity | |
| Medion Erazer Beast X40 2024 | |
| Asus ROG Strix Scar 18 G834JYR (2024) | |
| Razer Blade 16 2024, RTX 4090 | |
| Media Intel Core i9-14900HX, NVIDIA GeForce RTX 4090 Laptop GPU (1738 - 2162, n=10) | |
| Alienware m18 R2 | |
| Media della classe Gaming (1299 - 2204, n=162, ultimi 2 anni) | |
| Lenovo Legion 9 16IRX8 | |
| Lenovo Legion 9 16IRX9, RTX 4090 | |
| CrossMark / Creativity | |
| Asus ROG Strix Scar 18 G834JYR (2024) | |
| Razer Blade 16 2024, RTX 4090 | |
| Alienware m18 R2 | |
| Media Intel Core i9-14900HX, NVIDIA GeForce RTX 4090 Laptop GPU (2195 - 2660, n=10) | |
| Medion Erazer Beast X40 2024 | |
| Lenovo Legion 9 16IRX8 | |
| Lenovo Legion 9 16IRX9, RTX 4090 | |
| Media della classe Gaming (1275 - 2660, n=162, ultimi 2 anni) | |
| CrossMark / Responsiveness | |
| Asus ROG Strix Scar 18 G834JYR (2024) | |
| Medion Erazer Beast X40 2024 | |
| Media Intel Core i9-14900HX, NVIDIA GeForce RTX 4090 Laptop GPU (1478 - 2327, n=10) | |
| Razer Blade 16 2024, RTX 4090 | |
| Alienware m18 R2 | |
| Lenovo Legion 9 16IRX9, RTX 4090 | |
| Media della classe Gaming (1030 - 2330, n=162, ultimi 2 anni) | |
| Lenovo Legion 9 16IRX8 | |
| WebXPRT 3 / Overall | |
| Lenovo Legion 9 16IRX8 | |
| Razer Blade 16 2024, RTX 4090 | |
| Medion Erazer Beast X40 2024 | |
| Alienware m18 R2 | |
| Media Intel Core i9-14900HX, NVIDIA GeForce RTX 4090 Laptop GPU (279 - 339, n=9) | |
| Asus ROG Strix Scar 18 G834JYR (2024) | |
| Media della classe Gaming (215 - 480, n=186, ultimi 2 anni) | |
| Lenovo Legion 9 16IRX9, RTX 4090 | |
| WebXPRT 4 / Overall | |
| Alienware m18 R2 | |
| Lenovo Legion 9 16IRX8 | |
| Asus ROG Strix Scar 18 G834JYR (2024) | |
| Medion Erazer Beast X40 2024 | |
| Media Intel Core i9-14900HX, NVIDIA GeForce RTX 4090 Laptop GPU (246 - 309, n=7) | |
| Media della classe Gaming (157.9 - 328, n=169, ultimi 2 anni) | |
| Lenovo Legion 9 16IRX9, RTX 4090 | |
| Mozilla Kraken 1.1 / Total | |
| Lenovo Legion 9 16IRX9, RTX 4090 | |
| Media della classe Gaming (421 - 737, n=197, ultimi 2 anni) | |
| Media Intel Core i9-14900HX, NVIDIA GeForce RTX 4090 Laptop GPU (428 - 535, n=10) | |
| Razer Blade 16 2024, RTX 4090 | |
| Asus ROG Strix Scar 18 G834JYR (2024) | |
| Lenovo Legion 9 16IRX8 | |
| Medion Erazer Beast X40 2024 | |
| Alienware m18 R2 | |
* ... Meglio usare valori piccoli
| PCMark 10 Score | 8239 punti | |
Aiuto | ||
| AIDA64 / Memory Copy | |
| Asus ROG Strix Scar 18 G834JYR (2024) | |
| Lenovo Legion 9 16IRX9, RTX 4090 | |
| Alienware m18 R2 | |
| Razer Blade 16 2024, RTX 4090 | |
| Lenovo Legion 9 16IRX8 | |
| Medion Erazer Beast X40 2024 | |
| Media Intel Core i9-14900HX (56992 - 83392, n=25) | |
| Media della classe Gaming (21842 - 94222, n=206, ultimi 2 anni) | |
| AIDA64 / Memory Read | |
| Asus ROG Strix Scar 18 G834JYR (2024) | |
| Razer Blade 16 2024, RTX 4090 | |
| Alienware m18 R2 | |
| Lenovo Legion 9 16IRX8 | |
| Medion Erazer Beast X40 2024 | |
| Media Intel Core i9-14900HX (54443 - 87507, n=25) | |
| Lenovo Legion 9 16IRX9, RTX 4090 | |
| Media della classe Gaming (23681 - 90647, n=206, ultimi 2 anni) | |
| AIDA64 / Memory Write | |
| Lenovo Legion 9 16IRX9, RTX 4090 | |
| Asus ROG Strix Scar 18 G834JYR (2024) | |
| Medion Erazer Beast X40 2024 | |
| Alienware m18 R2 | |
| Lenovo Legion 9 16IRX8 | |
| Razer Blade 16 2024, RTX 4090 | |
| Media Intel Core i9-14900HX (51387 - 80589, n=25) | |
| Media della classe Gaming (22986 - 103259, n=206, ultimi 2 anni) | |
| AIDA64 / Memory Latency | |
| Lenovo Legion 9 16IRX9, RTX 4090 | |
| Media della classe Gaming (59.5 - 152.5, n=204, ultimi 2 anni) | |
| Alienware m18 R2 | |
| Lenovo Legion 9 16IRX8 | |
| Media Intel Core i9-14900HX (76.1 - 105, n=25) | |
| Razer Blade 16 2024, RTX 4090 | |
| Asus ROG Strix Scar 18 G834JYR (2024) | |
| Medion Erazer Beast X40 2024 | |
* ... Meglio usare valori piccoli
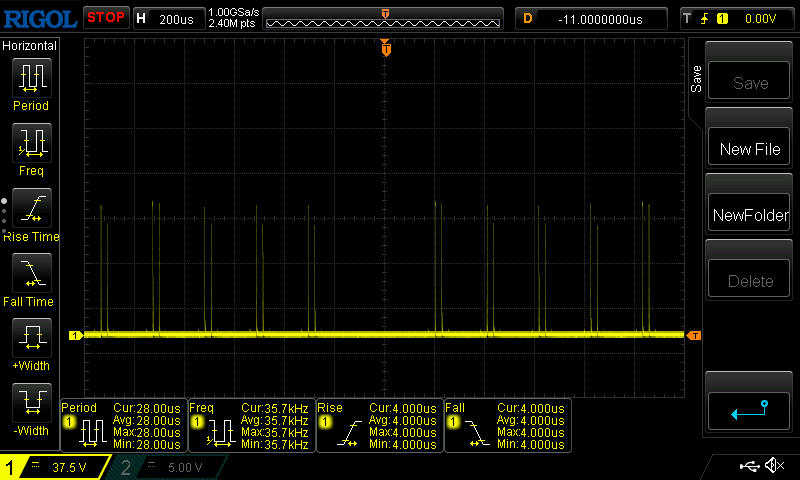
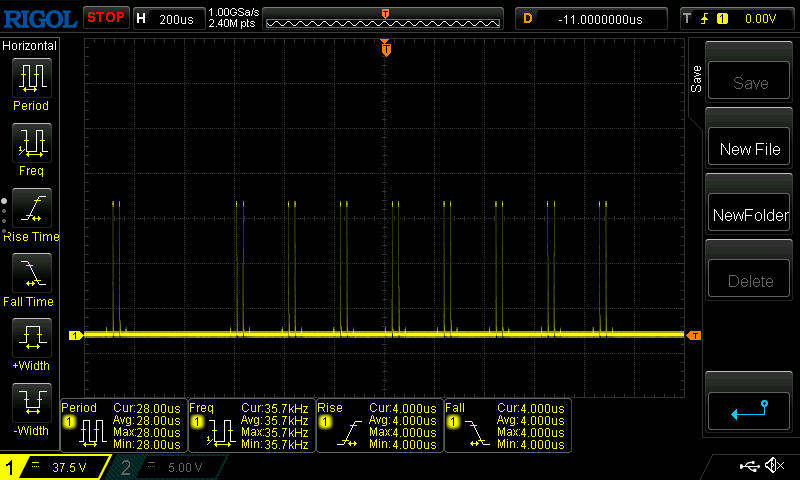
Latenze DPC
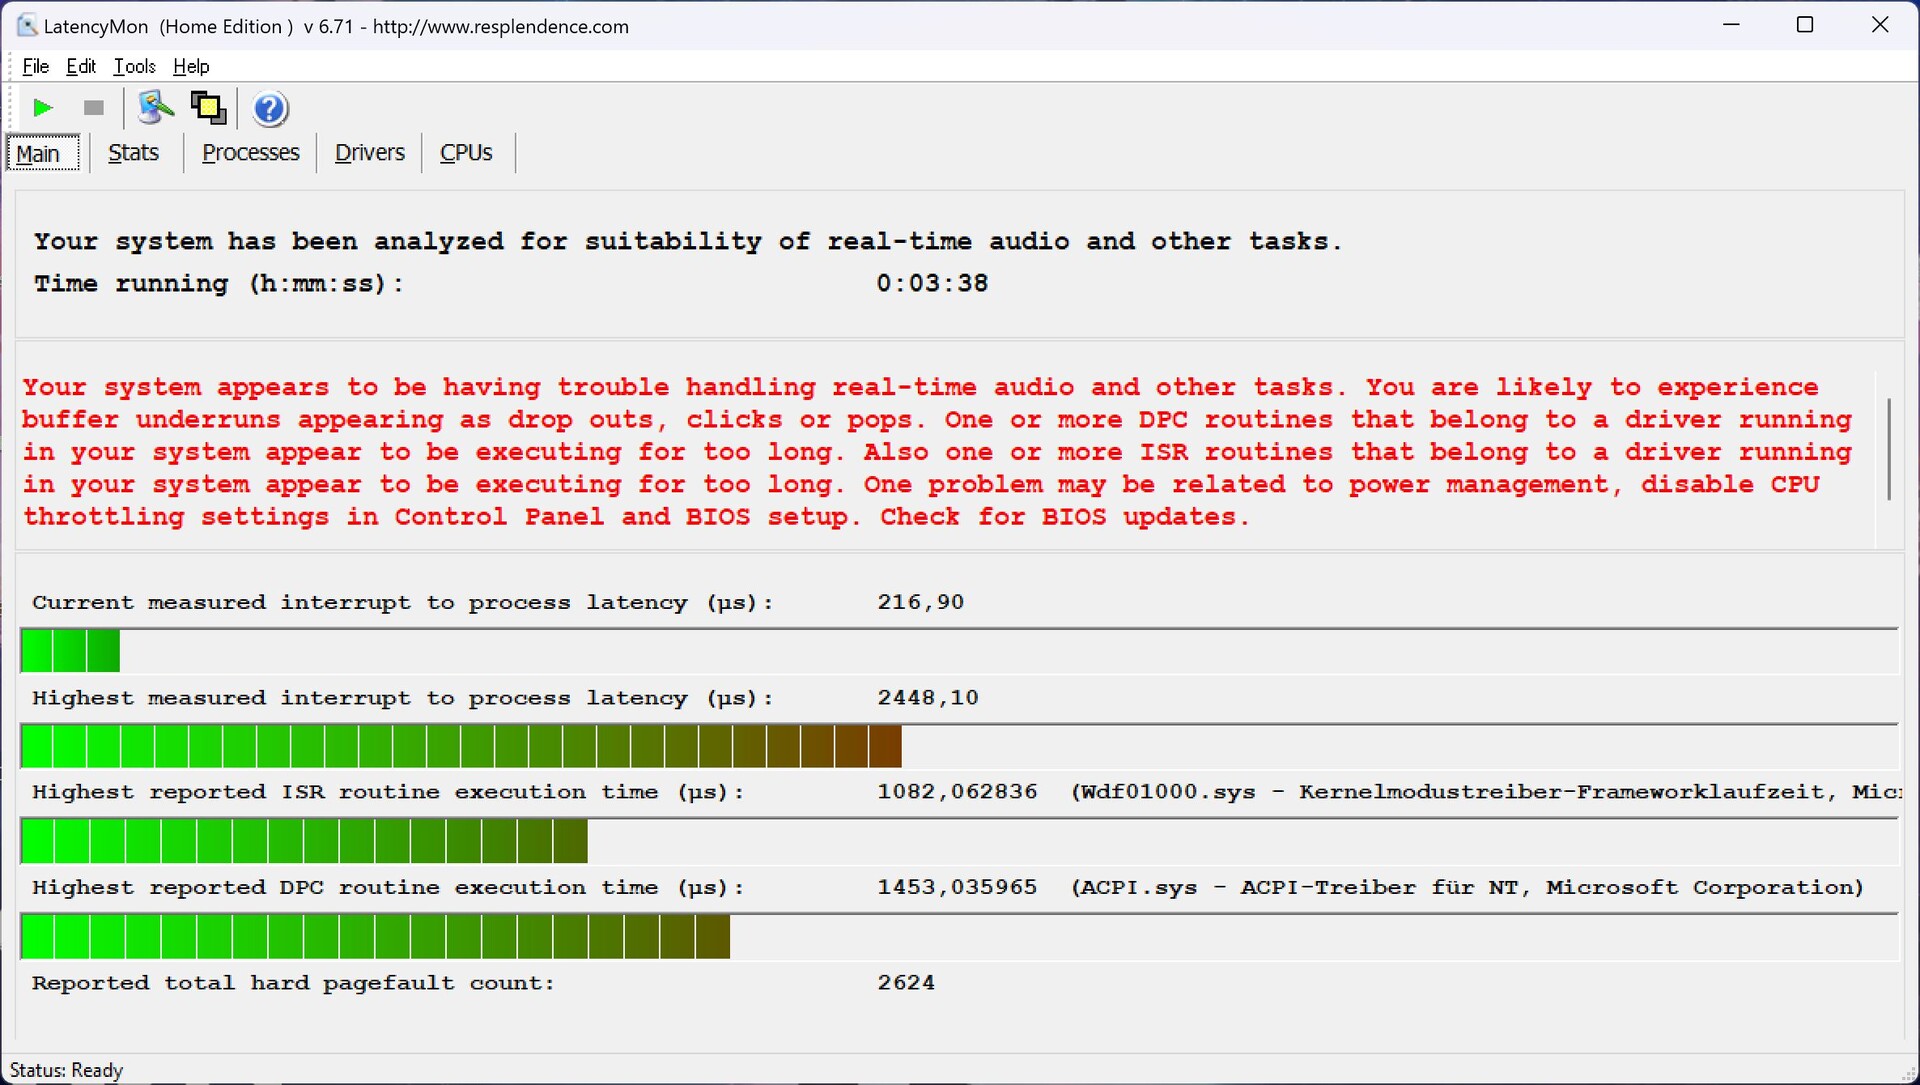
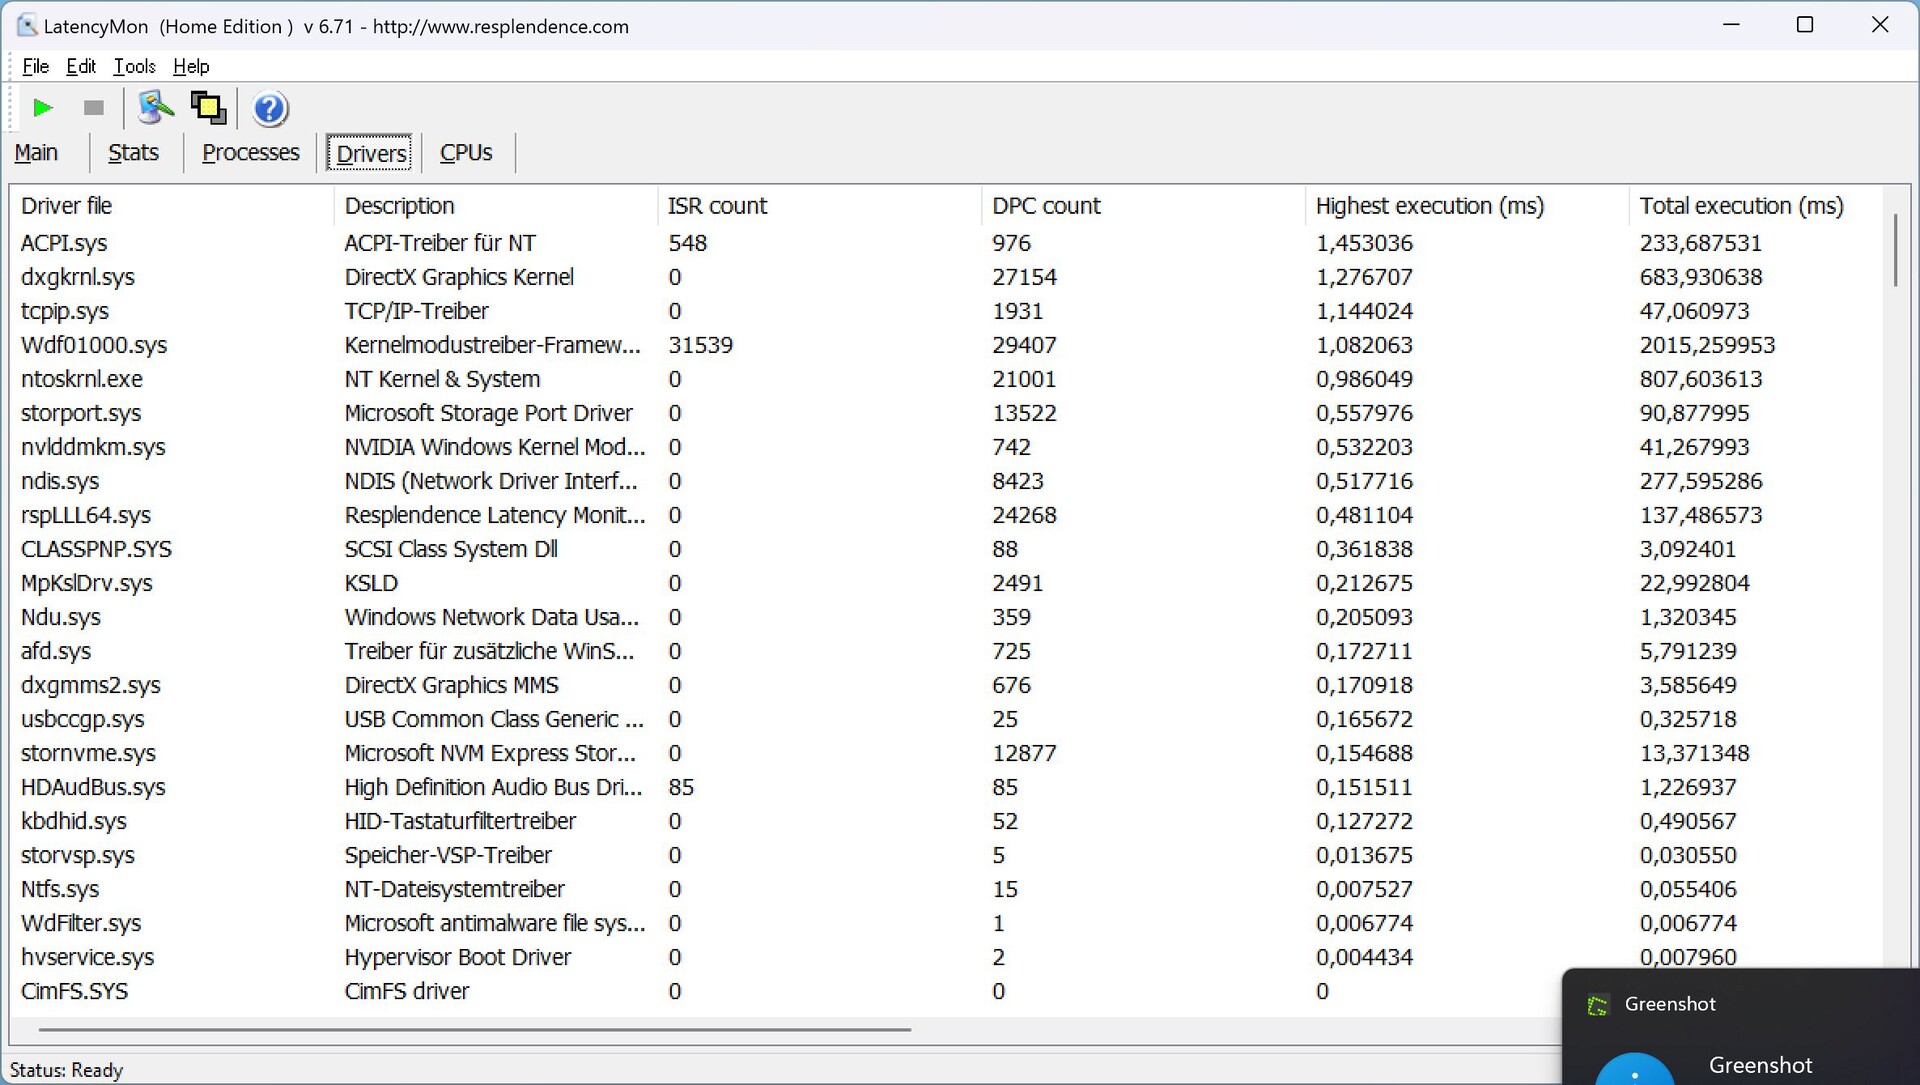
Le prime latenze si sono verificate non appena è stato aperto il browser. Il valore è aumentato minimamente quando si sono aperte diverse schede del nostro sito web. Tuttavia, è stata soprattutto la riproduzione del nostro video YouTube a 4K/60 fps a far schizzare il valore di latenza alle stelle.
Inoltre, il carico della GPU interna - che era attiva in questo caso - era costantemente ad un livello insolitamente alto del 79%; valori di circa il 20% sarebbero normali! Tuttavia, non ci sono state cadute di fotogrammi di cui lamentarsi.
| DPC Latencies / LatencyMon - interrupt to process latency (max), Web, Youtube, Prime95 | |
| Alienware m18 R2 | |
| Lenovo Legion 9 16IRX9, RTX 4090 | |
| Lenovo Legion 9 16IRX8 | |
| Razer Blade 16 2024, RTX 4090 | |
| Medion Erazer Beast X40 2024 | |
| Asus ROG Strix Scar 18 G834JYR (2024) | |
* ... Meglio usare valori piccoli
Dispositivo di archiviazione
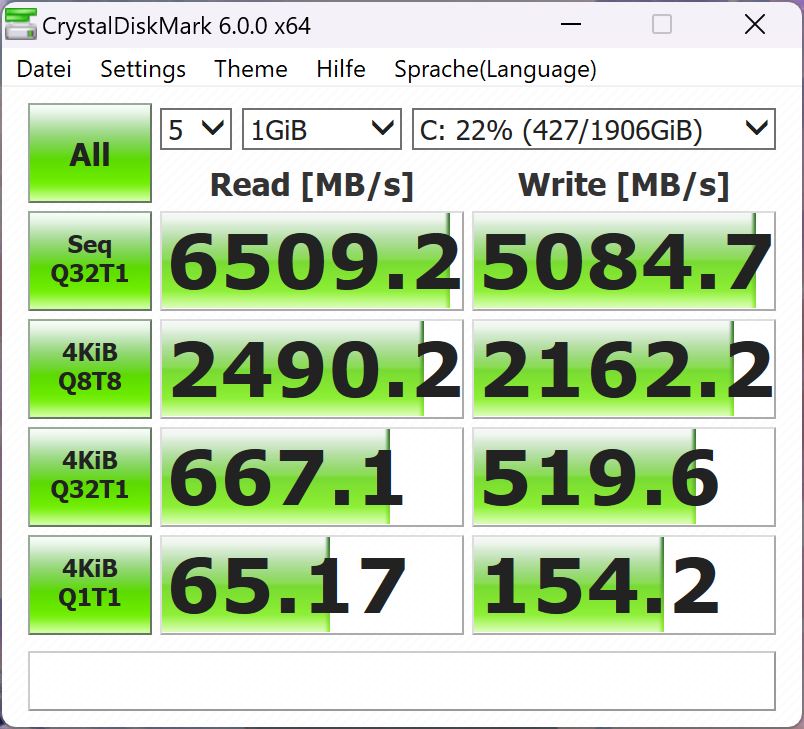
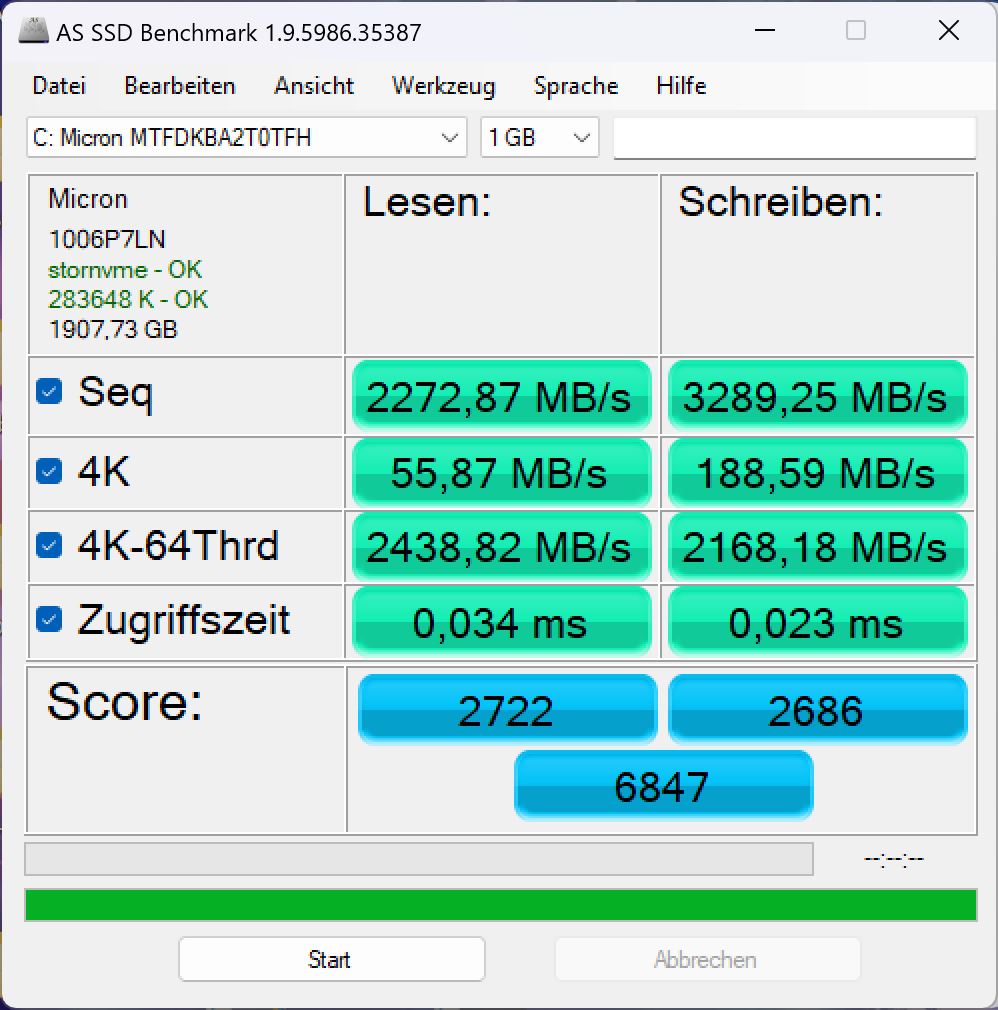
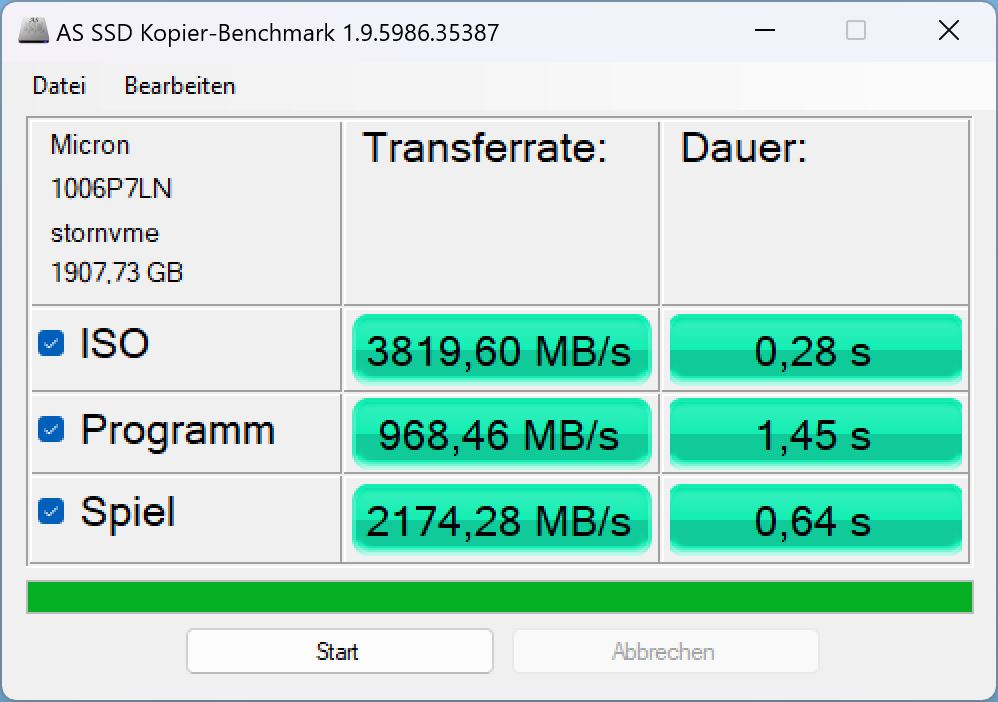
Lenovo ha installato un Micron 3400 con 2 TB di storage nel nostro modello di prova. È al 121° posto nella nostra Elenco dei migliori SSDil che significa che nella migliore delle ipotesi è di fascia media. Secondo Micron, dovrebbe raggiungere velocità di lettura sequenziale fino a 6.600 MB/s e velocità di scrittura sequenziale di 5.000 MB/s, ma il nostro modello era molto lontano da questo dato come il laptop medio con lo stesso SSD nel nostro database. Solo Crystaldiskmark è stato in grado di confermare valori elevati, mentre DiskSpd e AS SSD hanno misurato velocità di trasferimento dati significativamente inferiori.
Il comportamento di carico continuo del portatile è insolito: mentre altri modelli a volte si riscaldavano dopo un certo tempo e poi venivano strozzati, il dispositivo di archiviazione all'interno di Legion 9 si è comportato esattamente al contrario. All'inizio del test, le sue prestazioni fluttuavano molto e scendevano ripetutamente. Tuttavia, l'SSD ha funzionato costantemente alla massima velocità per gli ultimi due terzi del test. Questo potrebbe essere un segno che il sistema di raffreddamento di Legion 9i entra in funzione un po' troppo tardi, o che raggiunge la sua capacità di raffreddamento ottimale solo troppo tardi.

* ... Meglio usare valori piccoli
Reading continuous performance: DiskSpd Read Loop, Queue Depth 8
Scheda grafica
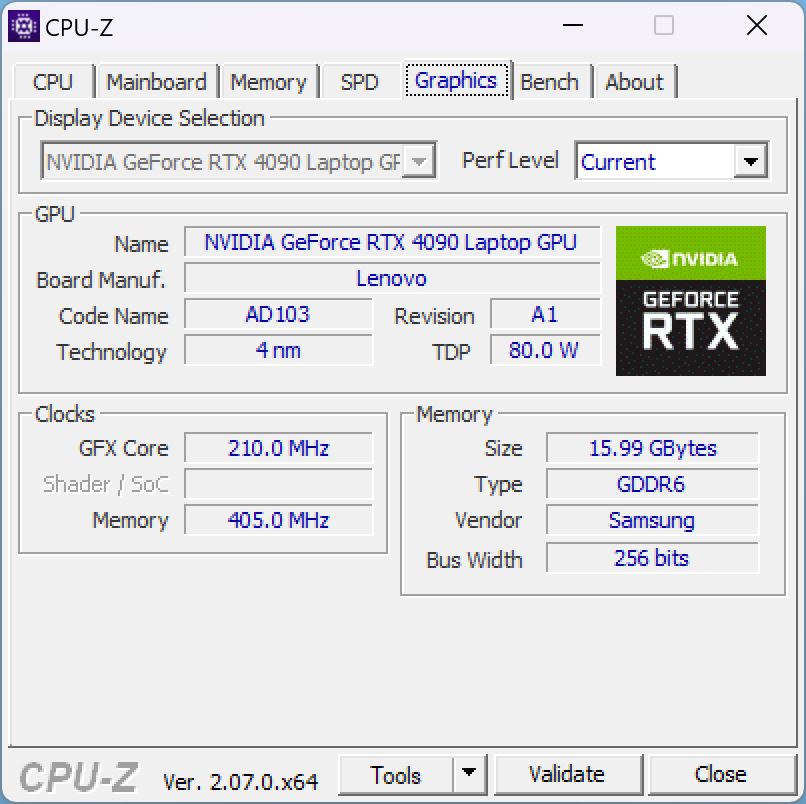
La Nvidia Geforce RTX 4090 all'interno di Legion 9i è l'attuale punta di diamante delle schede grafiche per computer portatili. Di conseguenza, dovrebbe essere in grado di eseguire tutti i giochi attuali ad alta risoluzione e con i massimi dettagli.
Nei test sintetici 3DMark, le sue prestazioni sono state all'incirca al livello previsto, ma ancora una volta sono state un po' inferiori e la concorrenza diretta è stata spesso di qualche punto percentuale più veloce - per inciso anche il Blade 16, significativamente più piccolo e sottile.
Se si scollega il portatile dall'alimentazione, il suo punteggio Fire Strike scende di circa il 40% per quanto riguarda le prestazioni 3D.
Nei giochi, le sue prestazioni sono approssimativamente paragonabili a quelle di Razer Blade 16. I suoi risultati potrebbero essere più elevati se non fosse per i brevi cali di frame rate di cui sopra. Il problema si può vedere chiaramente nei valori della frequenza dei fotogrammi del nostro test di 1 ora su Witcher 3. I cali di frame rate si sono verificati soprattutto nelle fasi iniziali, dopodiché il sistema ha funzionato in modo stabile e le sue prestazioni sono state all'altezza della concorrenza.
Solo quando si eseguono giochi molto attuali ed esigenti, come Skull & Bones, la frequenza dei fotogrammi in 4K scivola a volte al di sotto dei 60 fps, altrimenti tutti i giochi funzionano senza problemi a oltre 60 fps, anche in 4K.
| Profilo delle prestazioni/valore della misurazione | Witcher 3 fps all'inizio | Witcher 3 fps dopo 10 min | Consumo in watt | Consumo di energia della GPU in watt | Clock medio della GPU in MHz | Emissioni di rumore in dB |
|---|---|---|---|---|---|---|
| Prestazioni | 203 | 192 | 246 | 162 | 2.120 | 55,32 |
| Prestazioni con GPU Boost | 201 | 193 | 254 | 160,5 | 2.180 | 55,32 |
| Bilanciato con AI | 197 | 182 | 254 | 159 | 2.080 | 54,81 |
| Equilibrato senza AI | 161 | 145 | 184 | 103 | 1.530 | 47,98 |
| Tranquillo | 108 | 60 | 101 | 43 | prima 1.000, dopo 2 min 800 | 32,19 |
| 3DMark 11 Performance | 46826 punti | |
| 3DMark Cloud Gate Standard Score | 67697 punti | |
| 3DMark Fire Strike Score | 34686 punti | |
| 3DMark Time Spy Score | 20099 punti | |
Aiuto | ||
* ... Meglio usare valori piccoli
| The Witcher 3 - 1920x1080 Ultra Graphics & Postprocessing (HBAO+) | |
| Lenovo Legion 9 16IRX8 | |
| Alienware m18 R2 | |
| Medion Erazer Beast X40 2024 | |
| Lenovo Legion 9 16IRX9, RTX 4090 | |
| Razer Blade 16 2024, RTX 4090 | |
| Asus ROG Strix Scar 18 G834JYR (2024) | |
| Media della classe Gaming (13.1 - 216, n=202, ultimi 2 anni) | |
| GTA V - 1920x1080 Highest Settings possible AA:4xMSAA + FX AF:16x | |
| Lenovo Legion 9 16IRX8 | |
| Medion Erazer Beast X40 2024 | |
| Razer Blade 16 2024, RTX 4090 | |
| Alienware m18 R2 | |
| Lenovo Legion 9 16IRX9, RTX 4090 | |
| Asus ROG Strix Scar 18 G834JYR (2024) | |
| Media della classe Gaming (6.38 - 167.7, n=192, ultimi 2 anni) | |
Witcher 3 FPS diagram
| basso | medio | alto | ultra | QHD | 4K DLSS | 4K FSR | 4K | |
| GTA V (2015) | 186.9 | 185.2 | 183.3 | 136.2 | 138.9 | 95 | ||
| The Witcher 3 (2015) | 540 | 494 | 370 | 203.4 | 165 | 104.5 | ||
| Dota 2 Reborn (2015) | 201 | 181.8 | 174.4 | 164.5 | 160.8 | |||
| Final Fantasy XV Benchmark (2018) | 228 | 194.9 | 165.1 | 142 | ||||
| X-Plane 11.11 (2018) | 193.5 | 166.3 | 125.6 | 109.6 | ||||
| Far Cry 5 (2018) | 201 | 173 | 166 | 155 | 146 | 104 | ||
| Strange Brigade (2018) | 499 | 403 | 387 | 369 | 290 | |||
| F1 23 (2023) | 151.5 | 149.2 | 144.6 | |||||
| Cyberpunk 2077 2.1 Phantom Liberty (2023) | 123 | 83.9 | 81 | 79.2 | 40.6 | |||
| Skull & Bones (2024) | 164 | 140 | 149 | 118 | 98 | 90 | 81 | 61 |
| F1 24 (2024) | 339 | 304 | 113.6 | 72.1 |
Emissioni e potenza - Forte e caldo
Emissioni di rumore
Quando è inattivo sul desktop, le ventole del portatile sono per lo più silenziose. Occasionalmente, possono accelerare brevemente, ma poi si calmano di nuovo. Tuttavia, non appena si sottopone il dispositivo a carichi quotidiani, come la navigazione sul web, le ventole entrano rapidamente in funzione, anche in modalità silenziosa.
Durante il 3DMark06, le ventole hanno prima accelerato continuamente fino a poco più di 40 dB, poi si sono calmate di nuovo fino a 35 dB, prima di stabilizzarsi a circa 39 dB nell'ultimo terzo. Questo potrebbe anche essere un segno che il sistema adatta il raffreddamento e le prestazioni alle condizioni termiche troppo tardi e si stabilizza sui valori ottimali solo dopo un po' di tempo.
Durante il gioco e in modalità Performance, le ventole funzionano al massimo a circa 55 dB, un valore piuttosto alto in confronto; il Blade 16, ad esempio, rimane più silenzioso. In modalità Bilanciata (senza AI), le emissioni acustiche del portatile scendono a 47 dB, più moderati, ma le prestazioni di gioco diminuiscono sensibilmente, in particolare del 20-25 percento.
Rumorosità
| Idle |
| 23 / 23 / 23 dB(A) |
| Sotto carico |
| 39 / 55.56 dB(A) |
 | ||
30 dB silenzioso 40 dB(A) udibile 50 dB(A) rumoroso |
||
min: | ||
| Lenovo Legion 9 16IRX9, RTX 4090 NVIDIA GeForce RTX 4090 Laptop GPU, i9-14900HX, Micron 3400 2TB MTFDKBA2T0TFH | Lenovo Legion 9 16IRX8 NVIDIA GeForce RTX 4090 Laptop GPU, i9-13980HX, 2x SK Hynix HFS001TEJ9X115N (RAID 0) | Razer Blade 16 2024, RTX 4090 NVIDIA GeForce RTX 4090 Laptop GPU, i9-14900HX, Samsung PM9A1 MZVL22T0HBLB | Alienware m18 R2 NVIDIA GeForce RTX 4090 Laptop GPU, i9-14900HX, SK Hynix PC811 HFS002TEM9X152N | Asus ROG Strix Scar 18 G834JYR (2024) NVIDIA GeForce RTX 4090 Laptop GPU, i9-14900HX, Samsung PM9A1a MZVL22T0HDLB | Medion Erazer Beast X40 2024 NVIDIA GeForce RTX 4090 Laptop GPU, i9-14900HX, Phison E18-1TB-PHISON-SSD-BICS5 | |
|---|---|---|---|---|---|---|
| Noise | -2% | -1% | -5% | -13% | -15% | |
| off /ambiente * | 23 | 23.7 -3% | 23 -0% | 23.6 -3% | 24 -4% | 25 -9% |
| Idle Minimum * | 23 | 24 -4% | 23 -0% | 23.8 -3% | 27 -17% | 28 -22% |
| Idle Average * | 23 | 24 -4% | 23 -0% | 26.1 -13% | 28 -22% | 29 -26% |
| Idle Maximum * | 23 | 30.4 -32% | 27.66 -20% | 31.5 -37% | 32 -39% | 32 -39% |
| Load Average * | 39 | 30.4 22% | 43.76 -12% | 31.5 19% | 50 -28% | 48 -23% |
| Witcher 3 ultra * | 55.32 | 52.2 6% | 46.81 15% | 52.1 6% | 50 10% | 50 10% |
| Load Maximum * | 55.56 | 54.9 1% | 50.37 9% | 56.6 -2% | 52 6% | 52 6% |
* ... Meglio usare valori piccoli
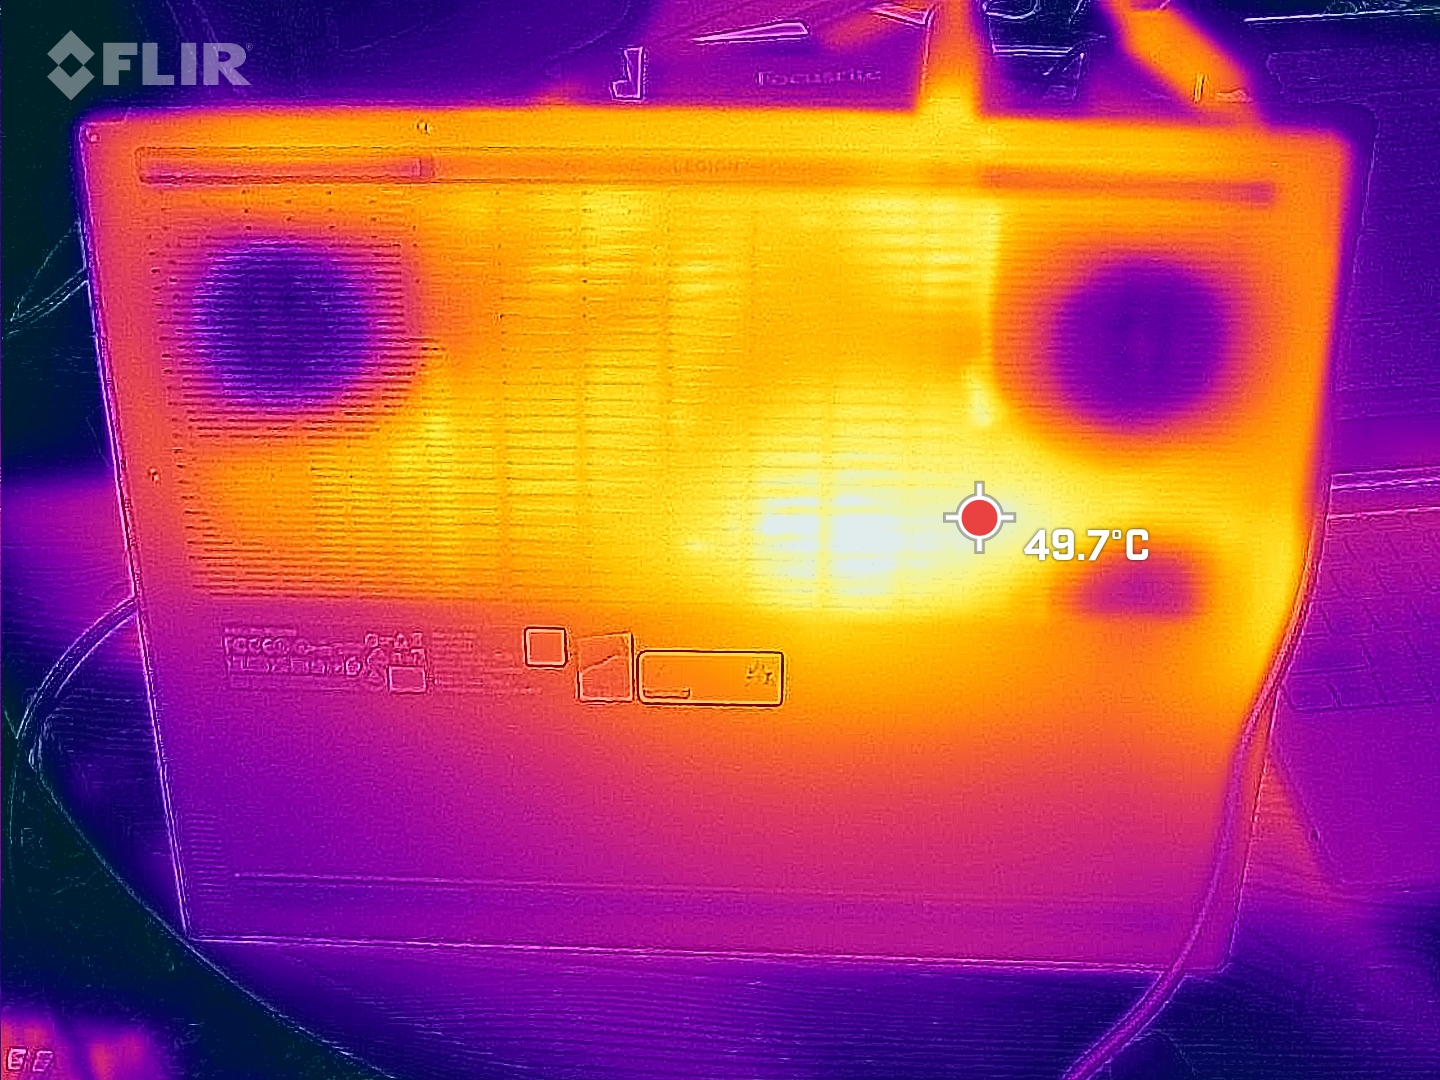
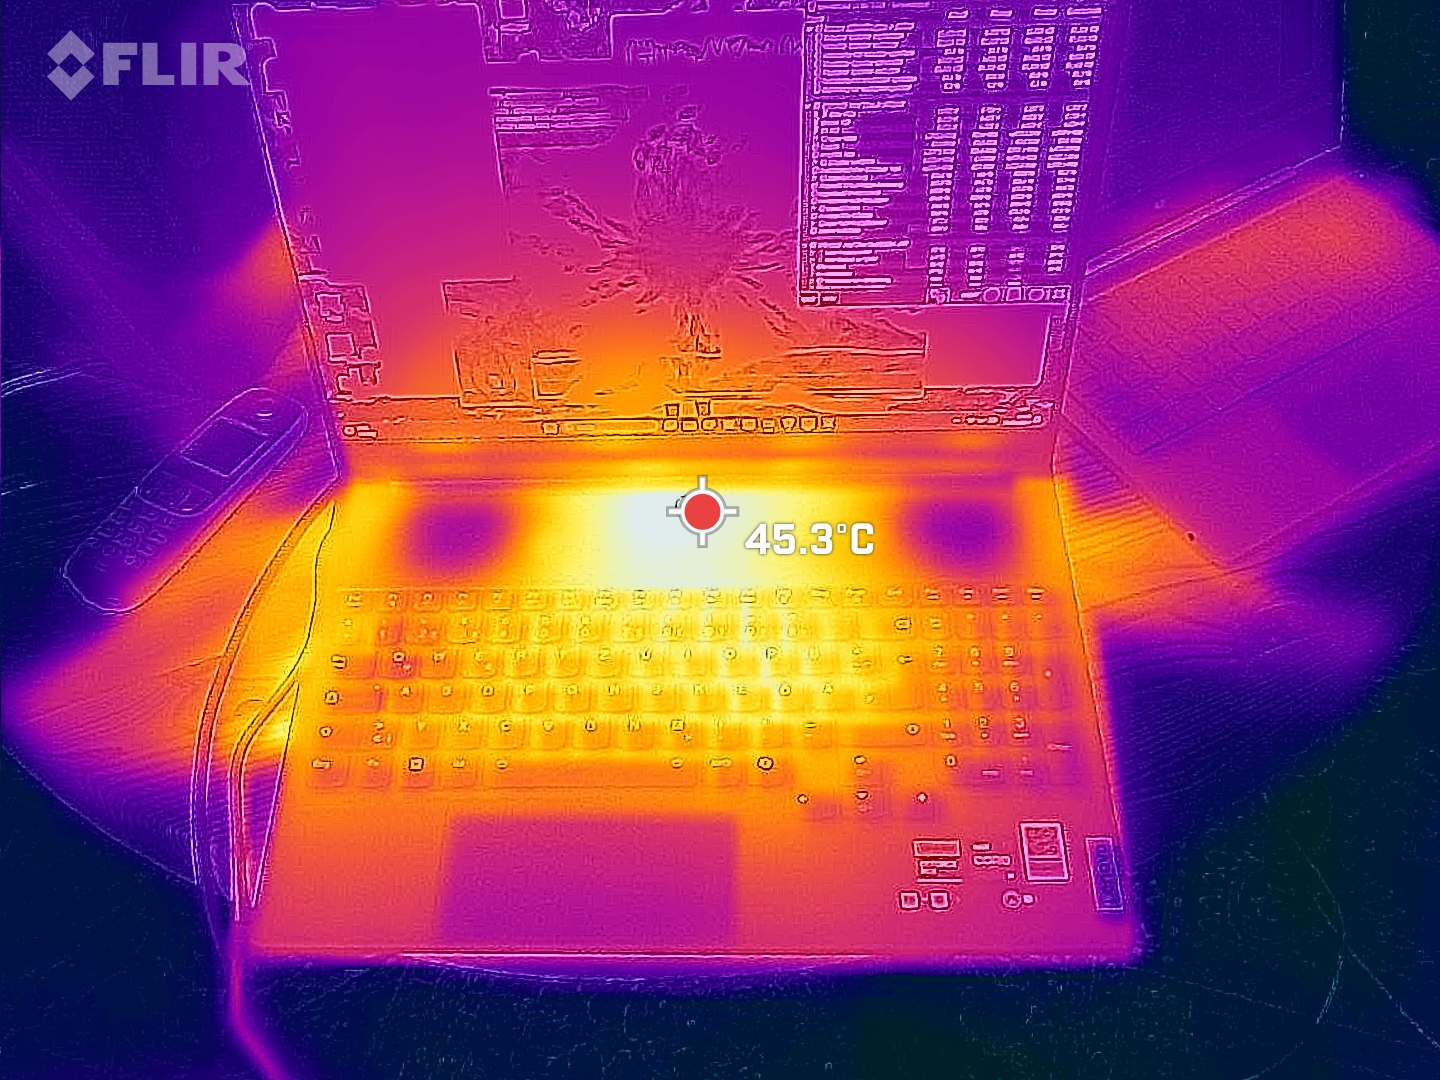
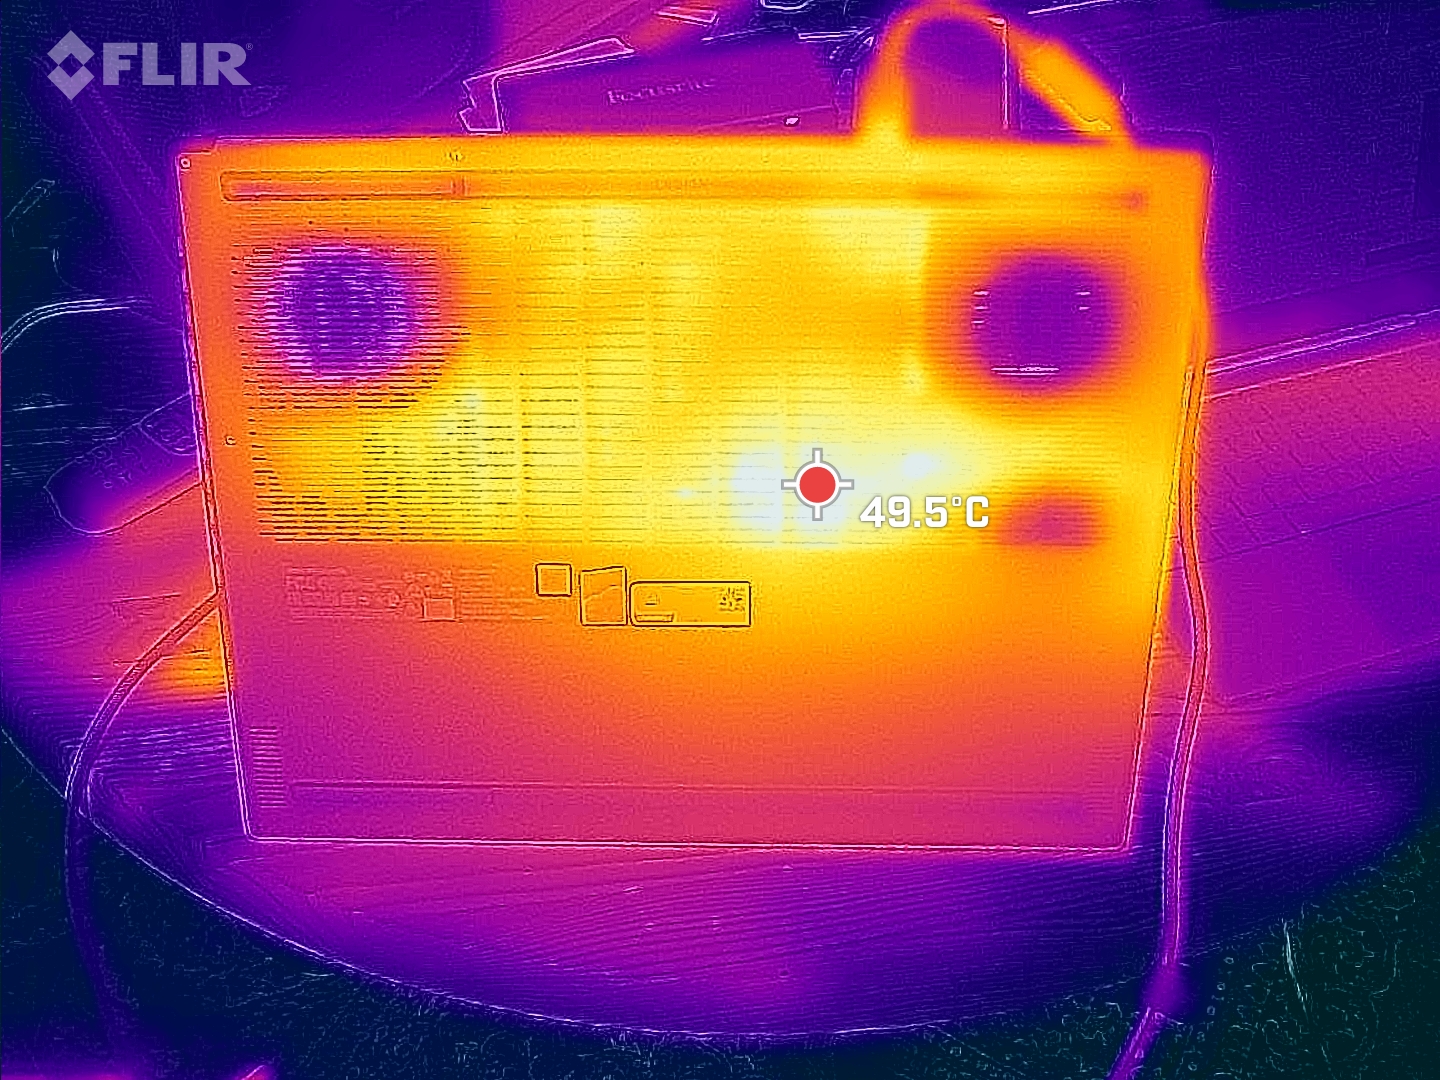
Temperatura
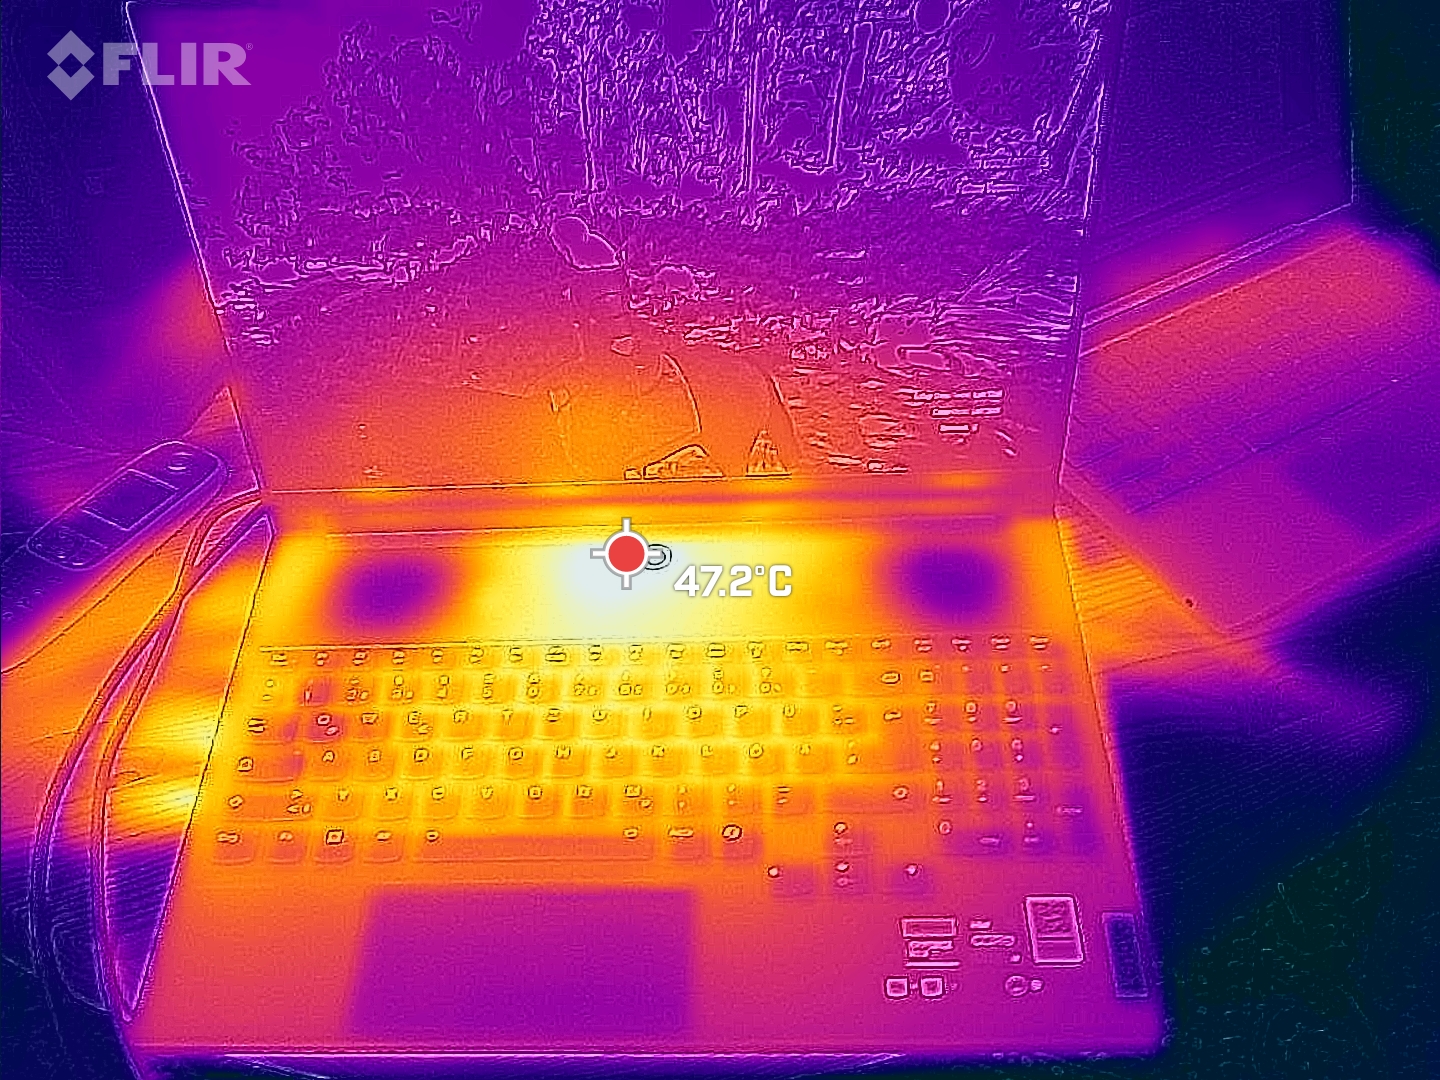
Nonostante il sistema di raffreddamento piuttosto rumoroso, le temperature del portatile sono piuttosto elevate in confronto. I punti caldi durante il gioco e sotto altri carichi pesanti sono al centro e verso lo schermo. Può anche diventare piuttosto caldo intorno ai tasti WASD - abbiamo misurato 46 °C. Almeno i poggiapolsi rimangono a posto. Anche il suo predecessore non era ideale sotto questo aspetto, ma ovviamente Lenovo non ha apportato alcun miglioramento.
(-) La temperatura massima sul lato superiore è di 56 °C / 133 F, rispetto alla media di 40.4 °C / 105 F, che varia da 21.2 a 68.8 °C per questa classe Gaming.
(-) Il lato inferiore si riscalda fino ad un massimo di 53 °C / 127 F, rispetto alla media di 43.2 °C / 110 F
(±) In idle, la temperatura media del lato superiore è di 33.6 °C / 92 F, rispetto alla media deld ispositivo di 33.9 °C / 93 F.
(-) Riproducendo The Witcher 3, la temperatura media per il lato superiore e' di 42.3 °C / 108 F, rispetto alla media del dispositivo di 33.9 °C / 93 F.
(±) I poggiapolsi e il touchpad possono diventare molto caldi al tatto con un massimo di 36 °C / 96.8 F.
(-) La temperatura media della zona del palmo della mano di dispositivi simili e'stata di 28.9 °C / 84 F (-7.1 °C / -12.8 F).
| Lenovo Legion 9 16IRX9, RTX 4090 Intel Core i9-14900HX, NVIDIA GeForce RTX 4090 Laptop GPU | Lenovo Legion 9 16IRX8 Intel Core i9-13980HX, NVIDIA GeForce RTX 4090 Laptop GPU | Razer Blade 16 2024, RTX 4090 Intel Core i9-14900HX, NVIDIA GeForce RTX 4090 Laptop GPU | Alienware m18 R2 Intel Core i9-14900HX, NVIDIA GeForce RTX 4090 Laptop GPU | Asus ROG Strix Scar 18 G834JYR (2024) Intel Core i9-14900HX, NVIDIA GeForce RTX 4090 Laptop GPU | Medion Erazer Beast X40 2024 Intel Core i9-14900HX, NVIDIA GeForce RTX 4090 Laptop GPU | |
|---|---|---|---|---|---|---|
| Heat | 11% | 21% | 9% | 17% | 13% | |
| Maximum Upper Side * | 56 | 49.6 11% | 45 20% | 41.2 26% | 49 12% | 47 16% |
| Maximum Bottom * | 53 | 48.6 8% | 45 15% | 34.6 35% | 47 11% | 54 -2% |
| Idle Upper Side * | 38 | 33.2 13% | 29 24% | 42.8 -13% | 29 24% | 30 21% |
| Idle Bottom * | 39 | 34.2 12% | 30 23% | 43.6 -12% | 31 21% | 32 18% |
* ... Meglio usare valori piccoli
Altoparlanti
La gamma udibile è molto lineare, i toni alti e medi sono ben bilanciati. Tuttavia, i bassi sono naturalmente ridotti, ma ancora percepibili. I diffusori potrebbero anche essere un po' più potenti, cioè più forti.
Lenovo Legion 9 16IRX9, RTX 4090 analisi audio
(±) | potenza degli altiparlanti media ma buona (78.96 dB)
Bassi 100 - 315 Hz
(±) | bassi ridotti - in media 13.2% inferiori alla media
(±) | la linearità dei bassi è media (8.9% delta rispetto alla precedente frequenza)
Medi 400 - 2000 Hz
(+) | medi bilanciati - solo only 3.2% rispetto alla media
(+) | medi lineari (3.4% delta rispetto alla precedente frequenza)
Alti 2 - 16 kHz
(+) | Alti bilanciati - appena 1.8% dalla media
(+) | alti lineari (4% delta rispetto alla precedente frequenza)
Nel complesso 100 - 16.000 Hz
(+) | suono nel complesso lineare (11.3% differenza dalla media)
Rispetto alla stessa classe
» 8% di tutti i dispositivi testati in questa classe è stato migliore, 3% simile, 89% peggiore
» Il migliore ha avuto un delta di 6%, medio di 18%, peggiore di 132%
Rispetto a tutti i dispositivi testati
» 5% di tutti i dispositivi testati in questa classe è stato migliore, 2% similare, 93% peggiore
» Il migliore ha avuto un delta di 4%, medio di 25%, peggiore di 134%
Razer Blade 16 2024, RTX 4090 analisi audio
(±) | potenza degli altiparlanti media ma buona (81.16 dB)
Bassi 100 - 315 Hz
(±) | bassi ridotti - in media 8.2% inferiori alla media
(±) | la linearità dei bassi è media (7.4% delta rispetto alla precedente frequenza)
Medi 400 - 2000 Hz
(+) | medi bilanciati - solo only 3.3% rispetto alla media
(+) | medi lineari (5.9% delta rispetto alla precedente frequenza)
Alti 2 - 16 kHz
(+) | Alti bilanciati - appena 1.6% dalla media
(+) | alti lineari (3.1% delta rispetto alla precedente frequenza)
Nel complesso 100 - 16.000 Hz
(+) | suono nel complesso lineare (9.2% differenza dalla media)
Rispetto alla stessa classe
» 3% di tutti i dispositivi testati in questa classe è stato migliore, 1% simile, 96% peggiore
» Il migliore ha avuto un delta di 6%, medio di 18%, peggiore di 132%
Rispetto a tutti i dispositivi testati
» 2% di tutti i dispositivi testati in questa classe è stato migliore, 1% similare, 97% peggiore
» Il migliore ha avuto un delta di 4%, medio di 25%, peggiore di 134%
Consumo di energia
Il consumo può essere leggermente migliorato rispetto al modello precedente, sia al minimo che in altri casi. Tuttavia, non di molto: anche la concorrenza da 18 pollici è spesso più parsimoniosa, almeno al minimo.
Il presunto problema del nuovo Legion 9 si può notare ancora una volta nei suoi grafici di consumo, in quanto il suo consumo (e quindi anche le sue prestazioni) è calato molto brevemente di tanto in tanto nei vari test. Ciò che era ancora normale in Cinebench 23, non lo era più nei test Witcher 3 o nei test Furmark.
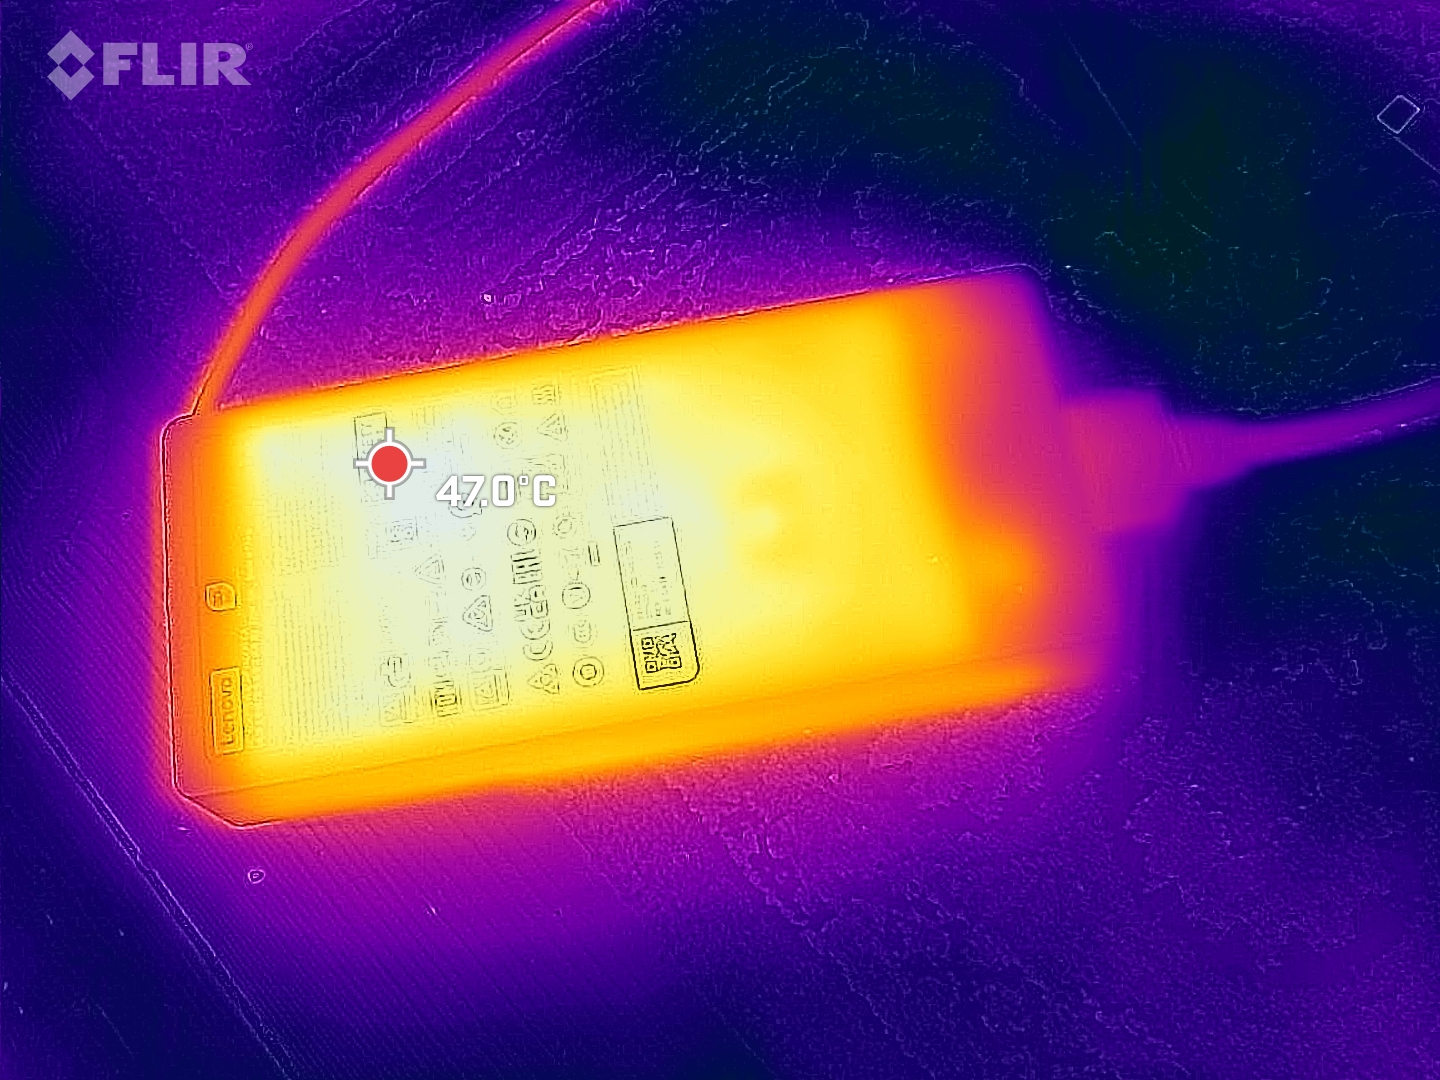
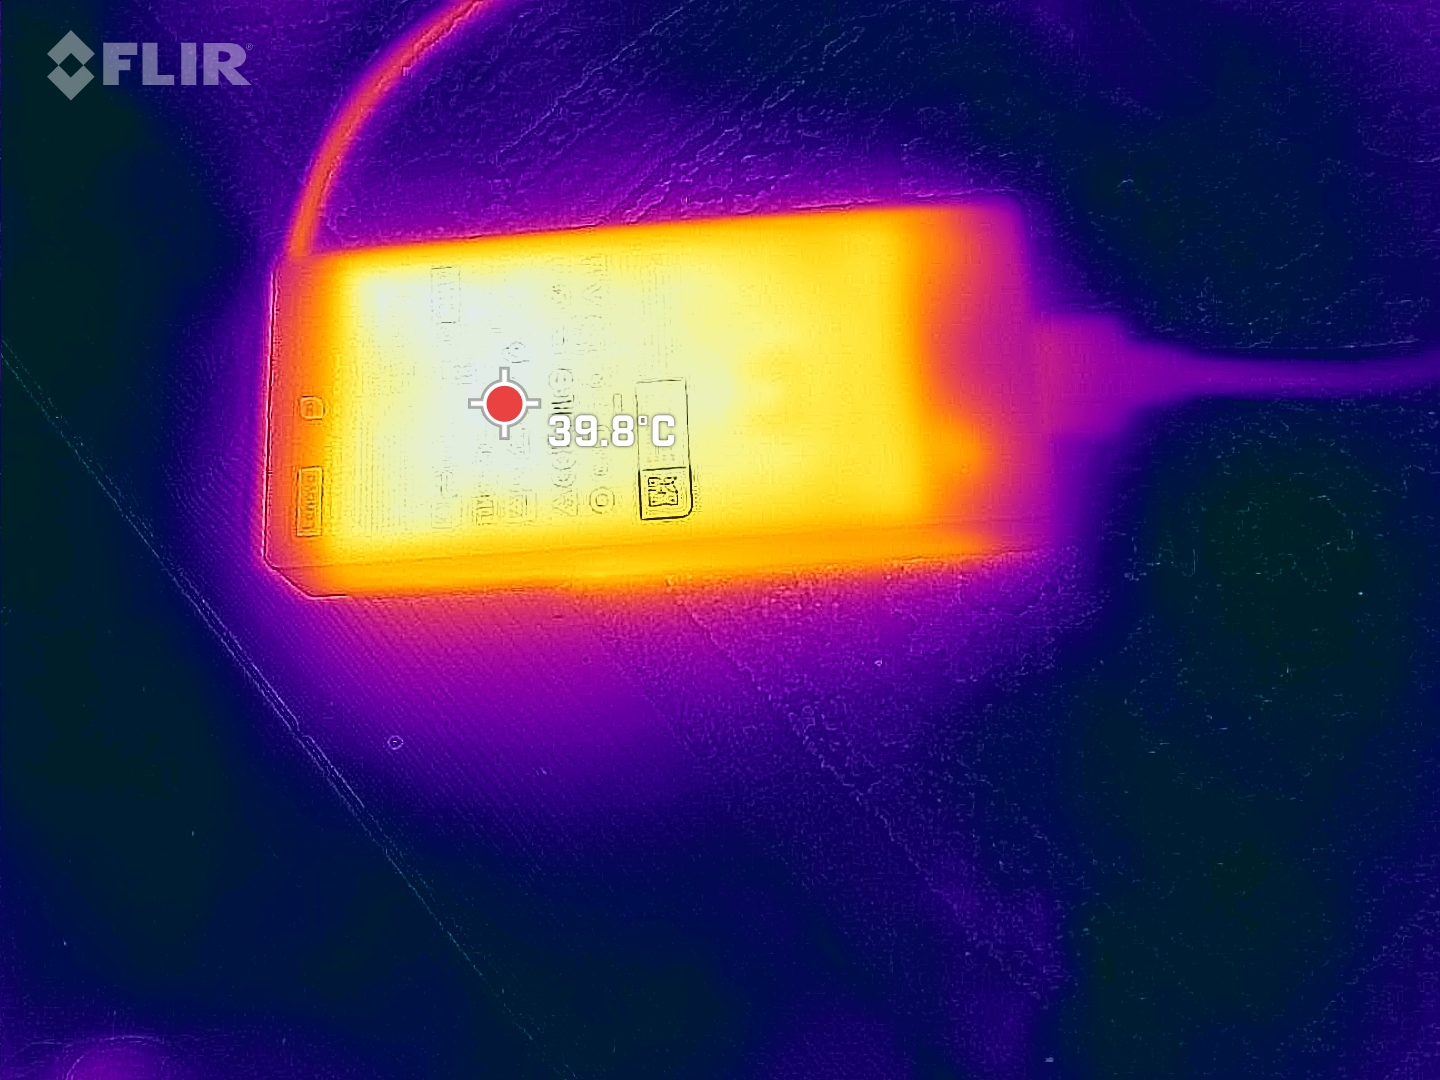
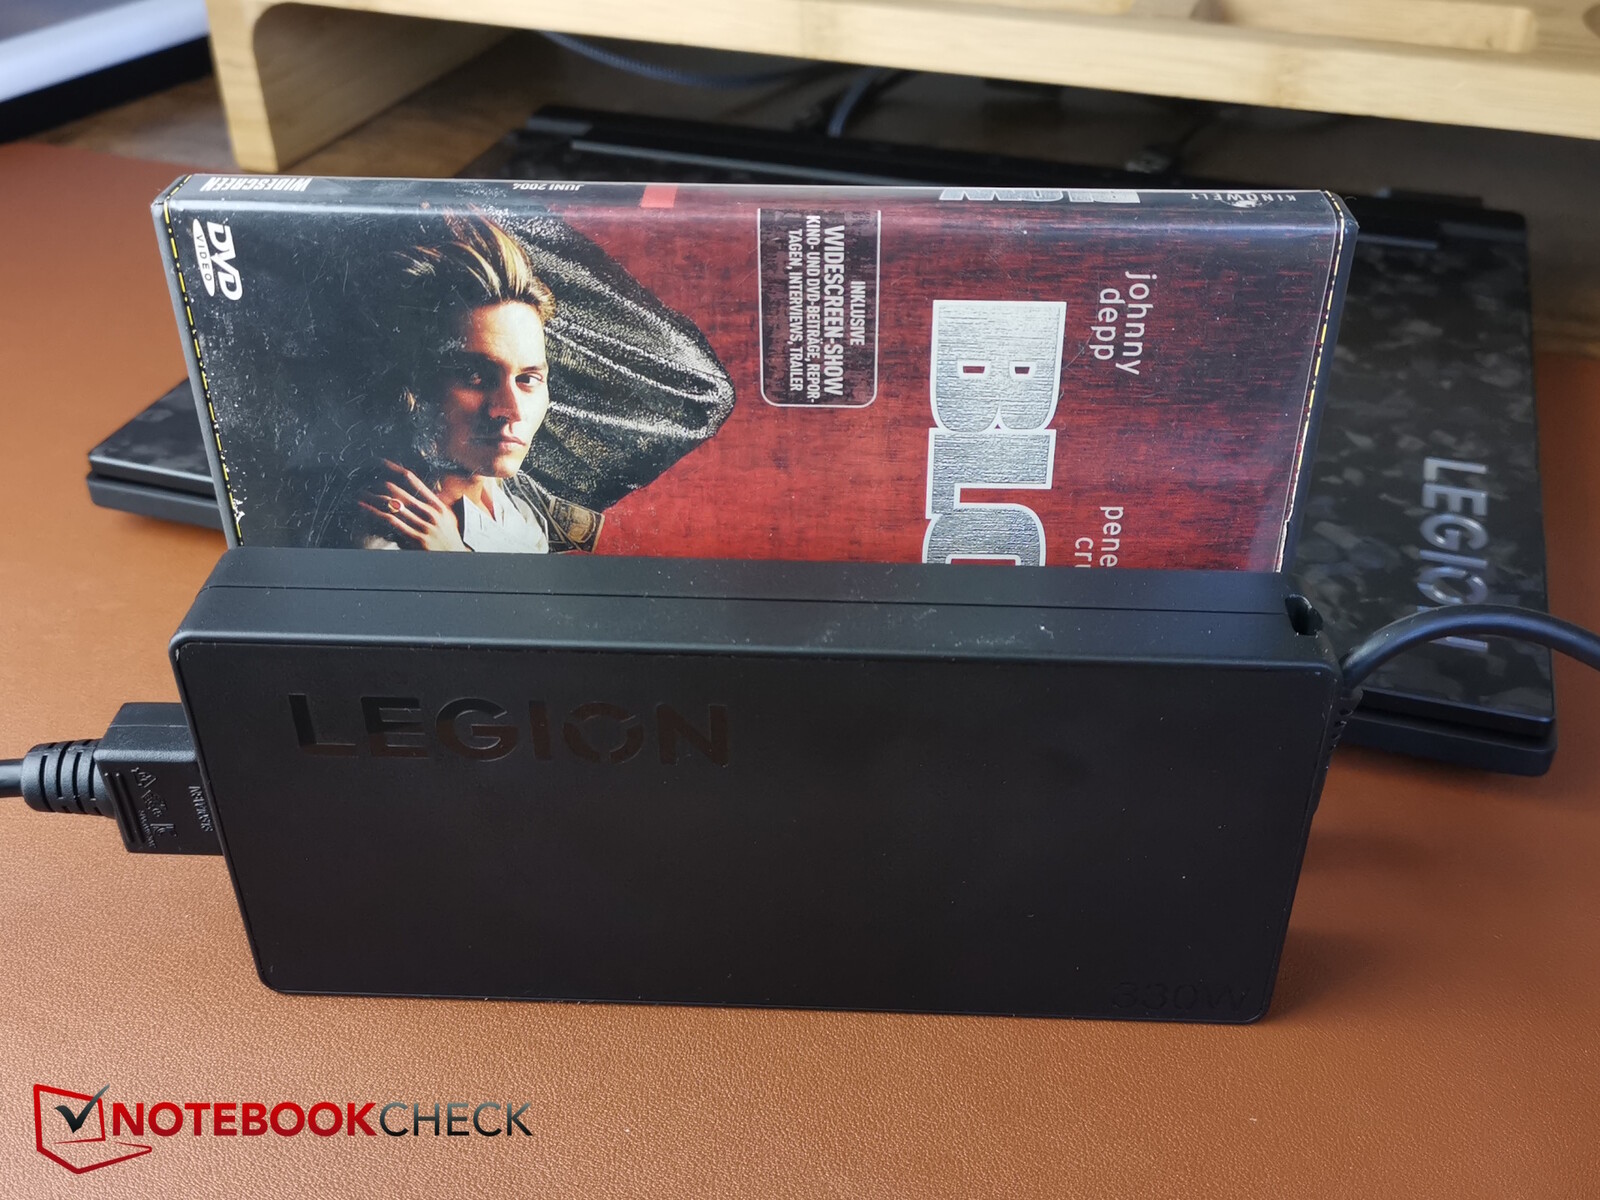
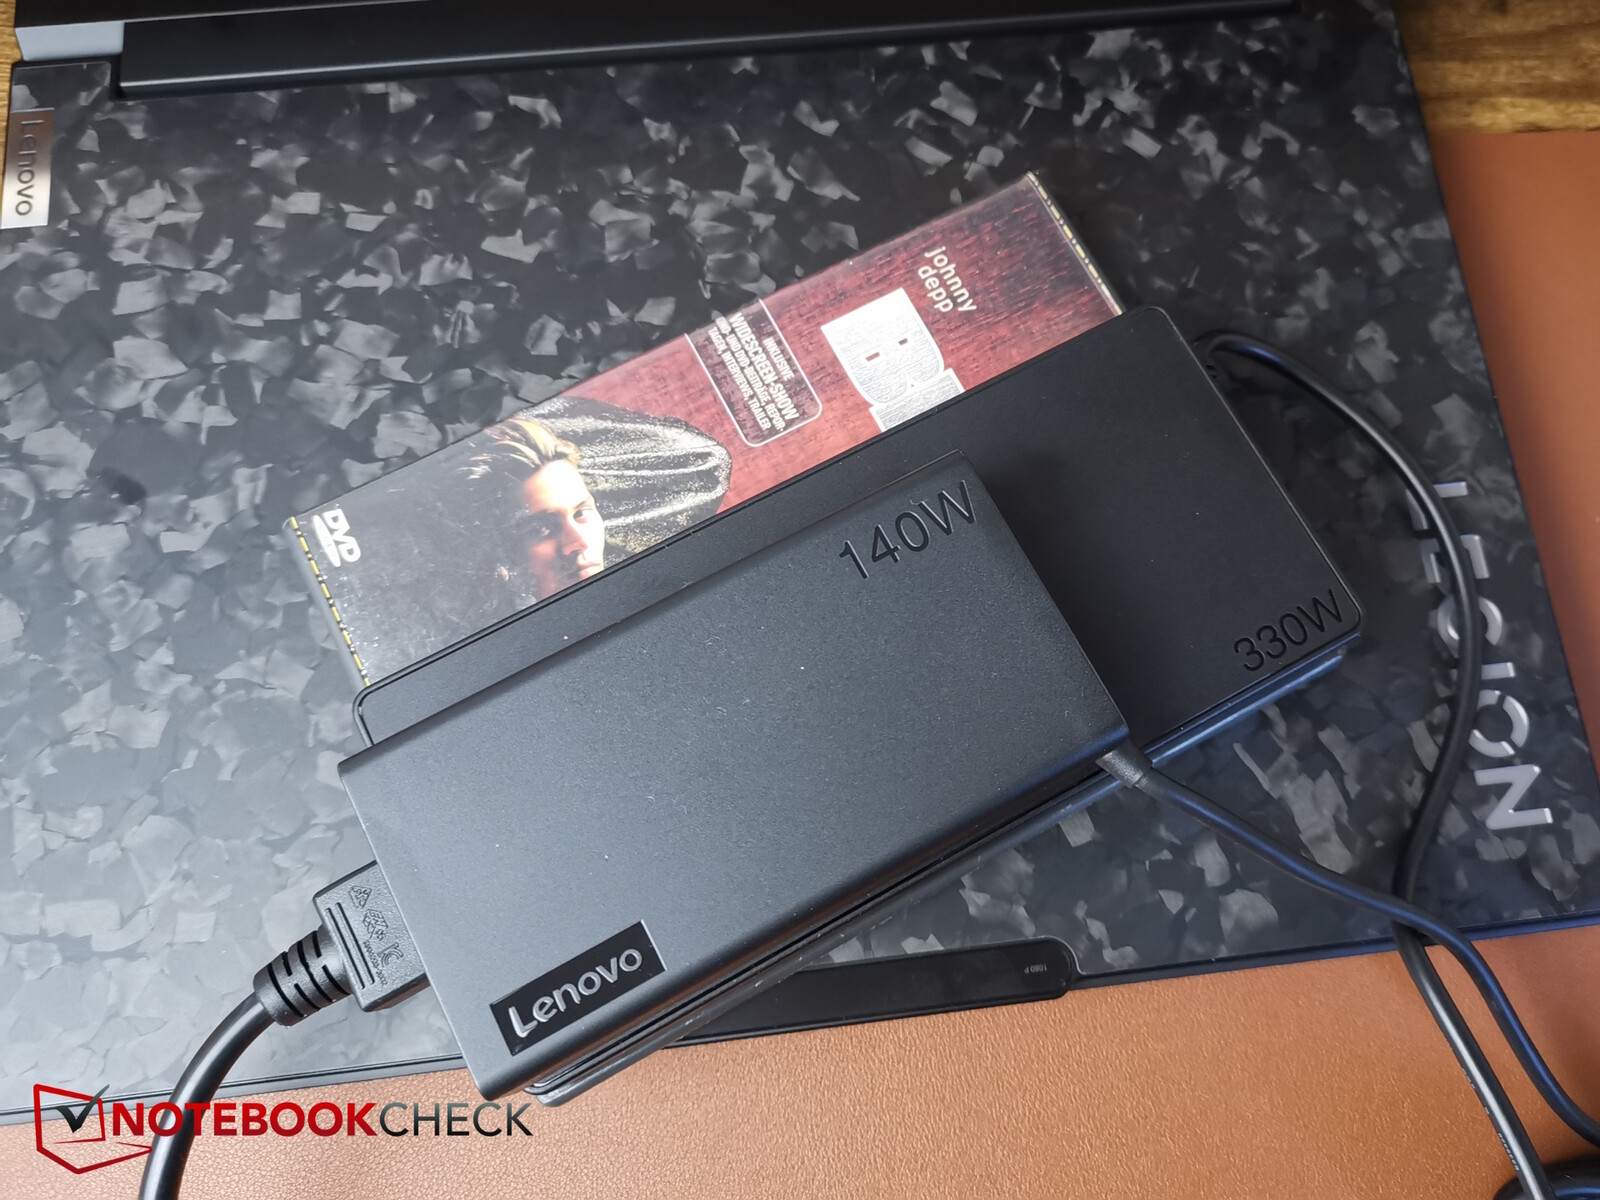
Abbiamo misurato un consumo massimo a breve termine di 323 watt utilizzando l'alimentatore piatto e relativamente piccolo. Questa unità è progettata per 330 watt e quindi non dovrebbe avere problemi a fornire energia al portatile in tutte le situazioni.
Una caratteristica unica: Legion 9 è dotato anche di un secondo alimentatore, un alimentatore USB-C molto più piccolo da 140 watt. Se non sta giocando, l'adattatore più piccolo è ovviamente ancora più adatto all'uso in viaggio.
| Off / Standby | |
| Idle | |
| Sotto carico |
|
Leggenda:
min: Attualmente utilizziamo il Metrahit Energy, un multimetro digitale professionale per la misurazione della qualità della potenza e dell'energia monofase, per le nostre misurazioni. | |
| Lenovo Legion 9 16IRX9, RTX 4090 i9-14900HX, NVIDIA GeForce RTX 4090 Laptop GPU, Micron 3400 2TB MTFDKBA2T0TFH, MiniLED, 3200x2000, 16.00 | Lenovo Legion 9 16IRX8 i9-13980HX, NVIDIA GeForce RTX 4090 Laptop GPU, 2x SK Hynix HFS001TEJ9X115N (RAID 0), Mini-LED, 3200x2000, 16.00 | Razer Blade 16 2024, RTX 4090 i9-14900HX, NVIDIA GeForce RTX 4090 Laptop GPU, Samsung PM9A1 MZVL22T0HBLB, OLED, 2560x1600, 16.00 | Asus ROG Strix Scar 18 G834JYR (2024) i9-14900HX, NVIDIA GeForce RTX 4090 Laptop GPU, Samsung PM9A1a MZVL22T0HDLB, Mini LED, 2560x1600, 18.00 | Medion Erazer Beast X40 2024 i9-14900HX, NVIDIA GeForce RTX 4090 Laptop GPU, Phison E18-1TB-PHISON-SSD-BICS5, IPS, 2560x1600, 17.00 | Media NVIDIA GeForce RTX 4090 Laptop GPU | Media della classe Gaming | |
|---|---|---|---|---|---|---|---|
| Power Consumption | -34% | 12% | 11% | 13% | -1% | 20% | |
| Idle Minimum * | 20.5 | 32.3 -58% | 16.9 18% | 14 32% | 7 66% | 16.7 ? 19% | 13.5 ? 34% |
| Idle Average * | 27.7 | 42.6 -54% | 17.8 36% | 17 39% | 15 46% | 23.8 ? 14% | 19 ? 31% |
| Idle Maximum * | 32.1 | 57.9 -80% | 19.6 39% | 24 25% | 33 -3% | 35.5 ? -11% | 26.9 ? 16% |
| Load Average * | 105 | 121 -15% | 128 -22% | 143 -36% | 134 -28% | 132.3 ? -26% | 110.1 ? -5% |
| Witcher 3 ultra * | 246 | 254 -3% | 243 1% | 251 -2% | 280 -14% | ||
| Load Maximum * | 323 | 297.7 8% | 328 -2% | 302 7% | 294 9% | 328 ? -2% | 253 ? 22% |
* ... Meglio usare valori piccoli
Power consumption Witcher 3 / stress test
Power consumption with external monitor
Tempi di esecuzione
La batteria integrata ha una capacità di circa 100 Wh, che è simile a quella della concorrenza. Tuttavia, i suoi tempi di esecuzione sono spesso più brevi, un problema con cui il suo predecessore e altri laptop con schermi MiniLED devono già fare i conti. Sebbene i suoi tempi di esecuzione siano stati migliorati, i dispositivi di confronto (a parte il laptop Alienware) ottengono tempi di esecuzione più lunghi dalle loro batterie. Lo stesso vale per l'Asus ROG Scar Strix, ad esempio, che ha anche un display MiniLED.
Tuttavia, è sufficiente per poco meno di 5 ore di visione di video o di navigazione sul web con la luminosità ridotta a 150 nits. Il dispositivo Asus dura oltre 6 ore.
Il portatile Lenovo supporta una funzione di ricarica rapida, che deve essere attivata nel software Vantage. Dopodiché, una ricarica completa richiede solo un'ora circa.
| Lenovo Legion 9 16IRX9, RTX 4090 i9-14900HX, NVIDIA GeForce RTX 4090 Laptop GPU, 99.99 Wh | Lenovo Legion 9 16IRX8 i9-13980HX, NVIDIA GeForce RTX 4090 Laptop GPU, 99.9 Wh | Razer Blade 16 2024, RTX 4090 i9-14900HX, NVIDIA GeForce RTX 4090 Laptop GPU, 95.2 Wh | Alienware m18 R2 i9-14900HX, NVIDIA GeForce RTX 4090 Laptop GPU, 97 Wh | Asus ROG Strix Scar 18 G834JYR (2024) i9-14900HX, NVIDIA GeForce RTX 4090 Laptop GPU, 90 Wh | Medion Erazer Beast X40 2024 i9-14900HX, NVIDIA GeForce RTX 4090 Laptop GPU, 99.8 Wh | Media della classe Gaming | |
|---|---|---|---|---|---|---|---|
| Autonomia della batteria | -50% | 10% | 0% | 24% | 29% | 10% | |
| H.264 | 294 | 456 55% | 447 52% | 399 ? 36% | |||
| WiFi v1.3 | 290 | 159 -45% | 329 13% | 290 0% | 461 59% | 374 29% | 370 ? 28% |
| Load | 129 | 58 -55% | 79 -39% | 77 -40% | 85.4 ? -34% | ||
| Reader / Idle | 404 | 612 | 552 ? |
Pro
Contro
Verdetto - Più problemi del previsto
Per quanto riguarda il prezzo, Lenovo Legion 9i è un gamer di fascia alta con un design attraente, buoni materiali, una buona qualità costruttiva e un luminoso display Mini LED con HDR1000. Il suo alimentatore piatto, che non si trova nella concorrenza, e l'alimentatore supplementare USB-C da 140 watt possono essere considerati ulteriori punti a favore.
Tuttavia, mentre i modelli più piccoli di Legion convincono per la loro buona ottimizzazione del sistema, il modello di punta soffre di un numero di debolezze e problemi notevolmente superiore alle aspettative. Innanzitutto i problemi di latenza, che non si sono manifestati solo durante il test di LatencyMon: li abbiamo notati anche quando abbiamo testato la latenza della RAM e anche quando si gioca, si notano alcuni fotogrammi caduti. A questo si aggiungono le prestazioni insolitamente deboli in single-core. Un altro problema più grande è il suo sistema di raffreddamento non ottimale. Sembra che si raffreddi troppo tardi e a volte troppo poco, con il risultato che l'SSD viene strozzato, ad esempio. Inoltre, diventa molto rumoroso sotto carico, mentre non previene le alte temperature superficiali come fanno i suoi concorrenti. Anche se la durata della batteria è stata migliorata, non è buona come quella della concorrenza. In totale, quindi, c'è un ampio margine di miglioramento.
Legion 9i è un elegante gamer di fascia alta, ma a differenza dei modelli più piccoli Legion, il costoso modello di fascia alta finisce per essere quello che soffre di problemi fastidiosi come un sistema di raffreddamento non ottimale e grandi problemi di latenza.
Un'alternativa potrebbe essere Razer Blade 16, ad esempio, che offre prestazioni paragonabili in un case più piccolo e non presenta gli stessi problemi di Legion 9i. A parte questo, il suo predecessore sembrava un sistema più maturo e vanta persino prestazioni più elevate a causa dei numerosi problemi del modello successivo. Di conseguenza, il nuovo Legion 9i non vale attualmente la pena di essere acquistato.
Prezzo e disponibilità
La nostra configurazione di Lenovo Legion 9 16IRX9 o di Lenovo Legion 9i può essere acquistata direttamente da Lenovo per 3.804,66 dollari.
Nota: abbiamo recentemente aggiornato il nostro sistema di valutazione e i risultati della versione 8 non sono paragonabili ai risultati della versione 7. Ulteriori informazioni sono disponibili qui .
Lenovo Legion 9 16IRX9, RTX 4090
-
06/20/2024 v8 (new)
Christian Hintze
 Total Sustainability Score:
 Transparency
The present review sample was made available to the author as a loan by the manufacturer or a shop for the purposes of review. The lender had no influence on this review, nor did the manufacturer receive a copy of this review before publication. There was no obligation to publish this review.
Price comparison

