

Recensione della workstation Lenovo ThinkPad P16 Gen 2: Pesante con una grafica superaccessoriata
Nvidia RTX 4000 Ada debutta con numeri impressionanti.
L'opzione grafica TGP da 130 W rende questa workstation da 16 pollici una delle più veloci del portafoglio Lenovo. Tuttavia, aspetti come la temperatura e la rumorosità della ventola sono più caldi e rumorosi della media, rispettivamente, come conseguenza della GPU esigente.Allen Ngo (traduzione a cura di DeepL / Ninh Duy) Pubblicato 🇺🇸 🇫🇷 ...
Verdetto - Il potere ha un costo
Il ThinkPad P16 Gen 2 dà priorità alle prestazioni, anche se ciò significa un sistema più grande, più pesante, più rumoroso e più caldo. Se riesce a sopportare gli svantaggi, troverà la sua RTX 4000 Ada da 130 W un mostro di workstation mobile.
Il ThinkPad P16 Gen 2 è in grado di affrontare carichi di lavoro impegnativi grazie alla sua grafica TGP da 130 W, che lo distingue dalla maggior parte delle altre workstation da 16 pollici.
Forse l'inconveniente più rilevante è che la GPU può accelerare di circa il 10% dopo alcuni minuti di stress, il che suggerisce che la soluzione di raffreddamento non è in grado di sostenere tutte le richieste della GPU all'infinito. Anche la durata della batteria è molto breve, con un massimo di poche ore. Nonostante ciò, il ThinkPad P16 Gen 2 è ancora una delle workstation più veloci per la sua classe di dimensioni da 16 pollici.
Pro
Contro
Prezzo e disponibilità
Lenovo sta spedendo il ThinkPad P16 Gen 2 direttamente dal suo negozio online a partire da 1850 dollari o 3770 dollari se configurato con RTX 4000. Un piccolo numero di SKU è disponibile anche su Amazon.
Price comparison
Potenziali concorrenti a confrontos
Immagine | Modello | Geizhals | Peso | Altezza | Schermo |
|---|---|---|---|---|---|
1. 85.9%  | Lenovo ThinkPad P16 Gen 2 Intel Core i7-14700HX ⎘ NVIDIA RTX 4000 Ada Generation Laptop GPU ⎘ 32 GB Memoria, 1024 GB SSD | 3.1 kg | 30.23 mm | 16.00" 2560x1600 189 PPI IPS | |
2. 90.2% v7 (old)  | Lenovo ThinkPad P16 G2 21FA000FGE Intel Core i7-13700HX ⎘ NVIDIA RTX 2000 Ada Generation Laptop GPU ⎘ 32 GB Memoria, 1024 GB SSD | 3 kg | 30.23 mm | 16.00" 2560x1600 189 PPI IPS LED | |
3. 88.6% v7 (old)  | Lenovo ThinkPad P16s G2 21K9000CGE AMD Ryzen 7 PRO 7840U ⎘ AMD Radeon 780M ⎘ 32 GB Memoria, 1024 GB SSD | 1.8 kg | 24.4 mm | 16.00" 3840x2400 283 PPI OLED | |
4. 91% v7 (old)  | Lenovo ThinkPad P16 G1 RTX A5500 Intel Core i9-12950HX ⎘ NVIDIA RTX A5500 Laptop GPU ⎘ 64 GB Memoria, 2048 GB SSD | Listenpreis 9000 USD | 3 kg | 30.23 mm | 16.00" 3840x2400 283 PPI IPS |
5. 85.4%  | HP ZBook Power 16 G11 A AMD Ryzen 7 8845HS ⎘ NVIDIA RTX 2000 Ada Generation Laptop GPU ⎘ 64 GB Memoria, 2048 GB SSD | 2.2 kg | 22.9 mm | 16.00" 2560x1600 189 PPI IPS | |
6. 88.3% v7 (old)  | Dell Precision 5690 Intel Core Ultra 9 185H ⎘ Nvidia RTX 5000 Ada Generation Laptop GPU ⎘ 32 GB Memoria, 2048 GB SSD | 2.3 kg | 22.17 mm | 16.00" 3840x2400 283 PPI OLED |
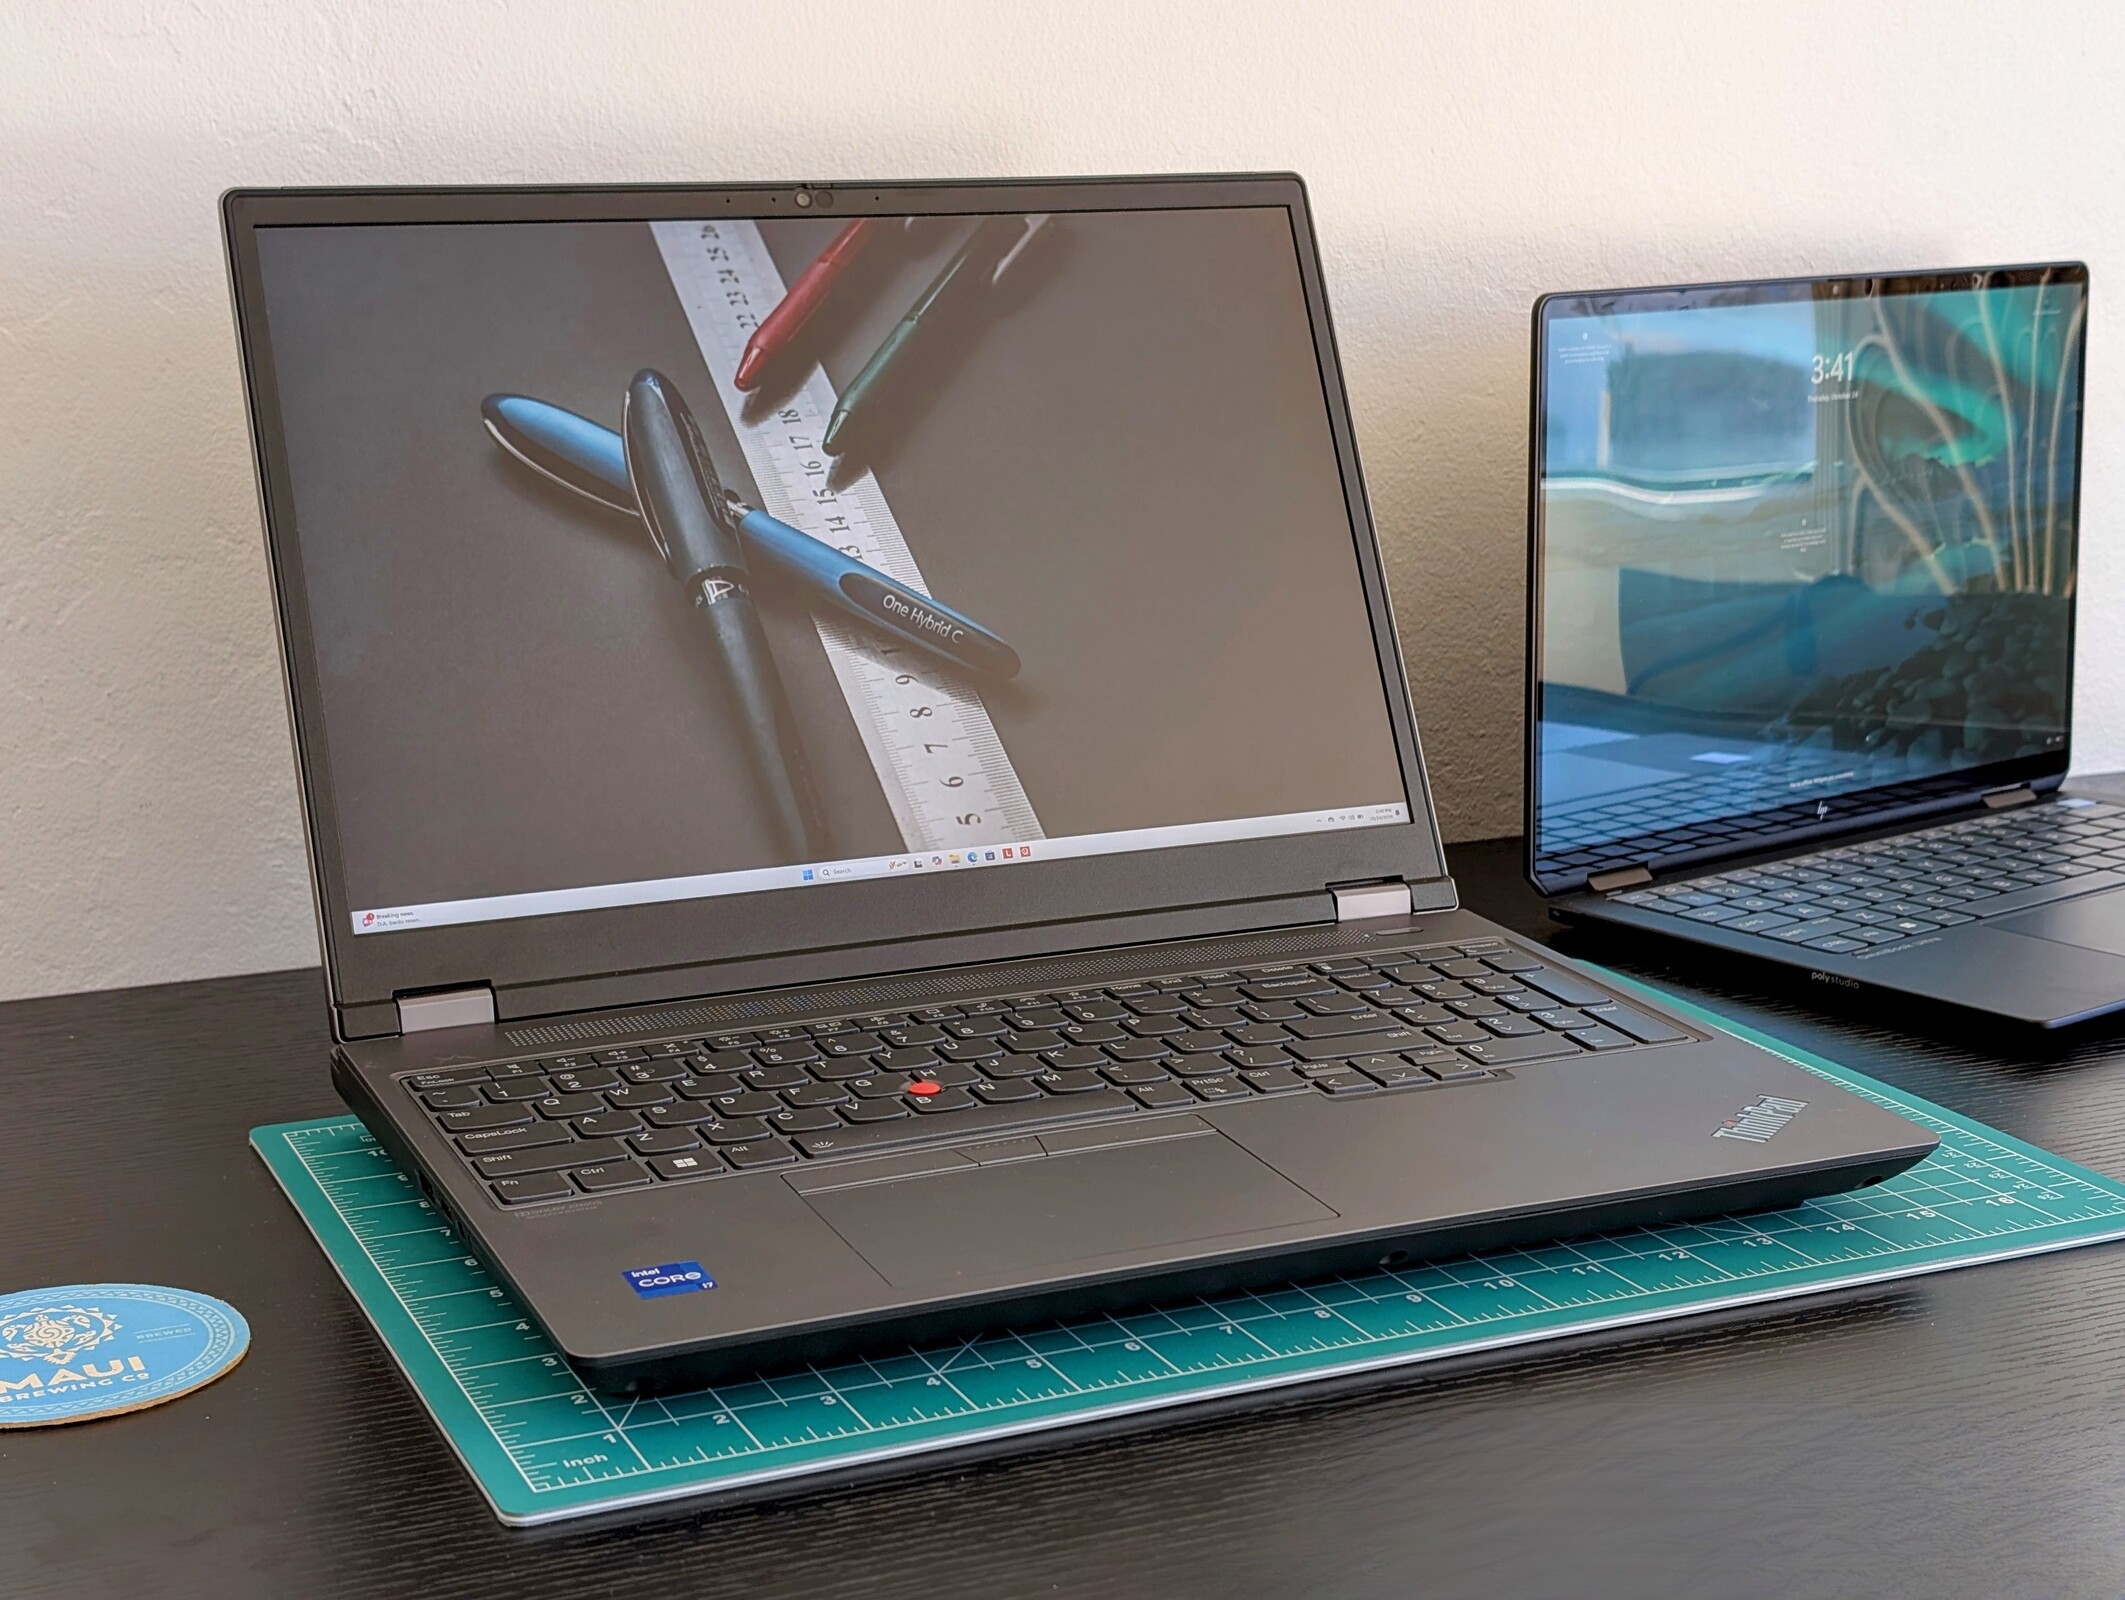
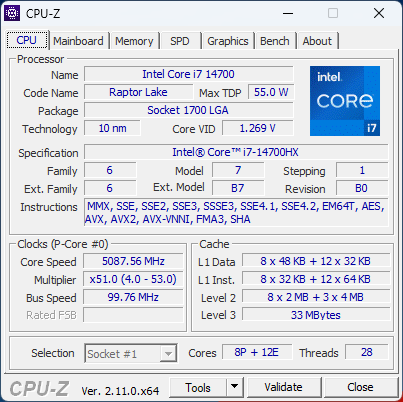
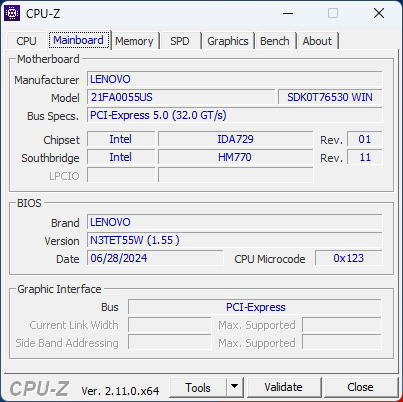
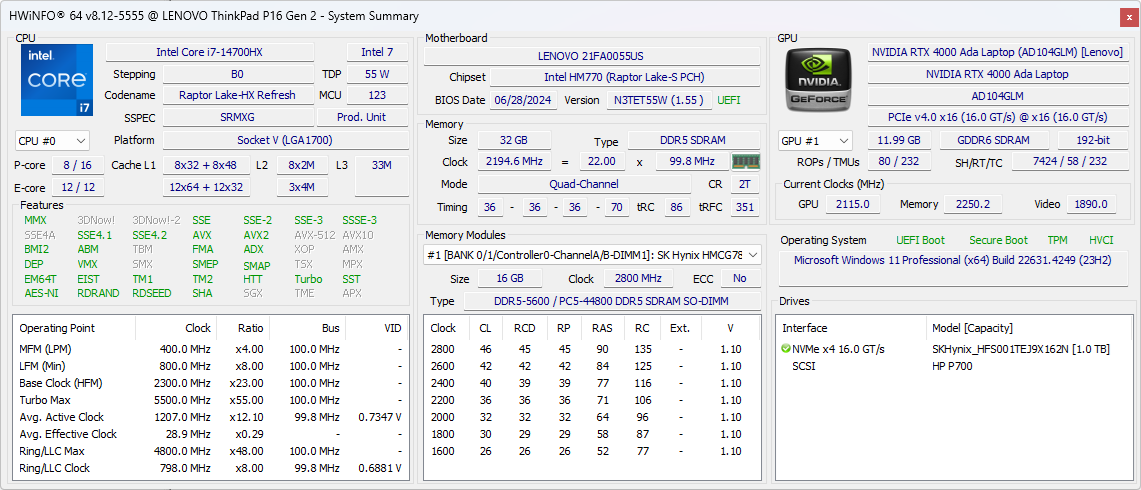
Lenovo sta aggiornando la sua linea premium ThinkPad P16 Gen 2 con le nuove CPU Raptor Lake-HX Refresh per il quarto trimestre del 2024, per sostituire le opzioni Raptor Lake-HX originali rilasciate all'inizio di quest'anno. Il design del telaio rimane invariato e quindi tutte le nostre impressioni sull'originale ThinkPad P16 Gen 2 recensione originale del ThinkPad P16 Gen 2 si applicano anche in questo caso, comprese le porte.
La nostra unità di prova è equipaggiata con la CPU Core i7-14700HX e la GPU Nvidia RTX 4000 Ada da 130 W, rispetto al Core i7-13700HX e alla RTX 2000 da 80 W della nostra prima recensione del ThinkPad P16 Gen 2. L'aumento delle prestazioni è significativo, in quanto il telaio non è stato modificato. L'aumento delle prestazioni è significativo, come dimostrano i nostri dati qui sotto.
I concorrenti del ThinkPad P16 Gen 2 includono altre workstation mobili da 16 pollici ad alte prestazioni, come il modello HP ZBook Power 16 G11 A o Dell Precision 5690.
Altre recensioni Lenovo:
Specifiche
Caso
Lettore di schede SD
| SD Card Reader | |
| average JPG Copy Test (av. of 3 runs) | |
| HP ZBook Power 16 G11 A (Toshiba Exceria Pro SDXC 64 GB UHS-II) | |
| Lenovo ThinkPad P16 Gen 2 (Toshiba Exceria Pro SDXC 64 GB UHS-II) | |
| Lenovo ThinkPad P16 G1 RTX A5500 (Toshiba Exceria Pro SDXC 64 GB UHS-II) | |
| Lenovo ThinkPad P16 G2 21FA000FGE | |
| maximum AS SSD Seq Read Test (1GB) | |
| HP ZBook Power 16 G11 A (Toshiba Exceria Pro SDXC 64 GB UHS-II) | |
| Lenovo ThinkPad P16 Gen 2 (Toshiba Exceria Pro SDXC 64 GB UHS-II) | |
| Lenovo ThinkPad P16 G2 21FA000FGE | |
| Lenovo ThinkPad P16 G1 RTX A5500 (Toshiba Exceria Pro SDXC 64 GB UHS-II) | |
Comunicazione
Webcam


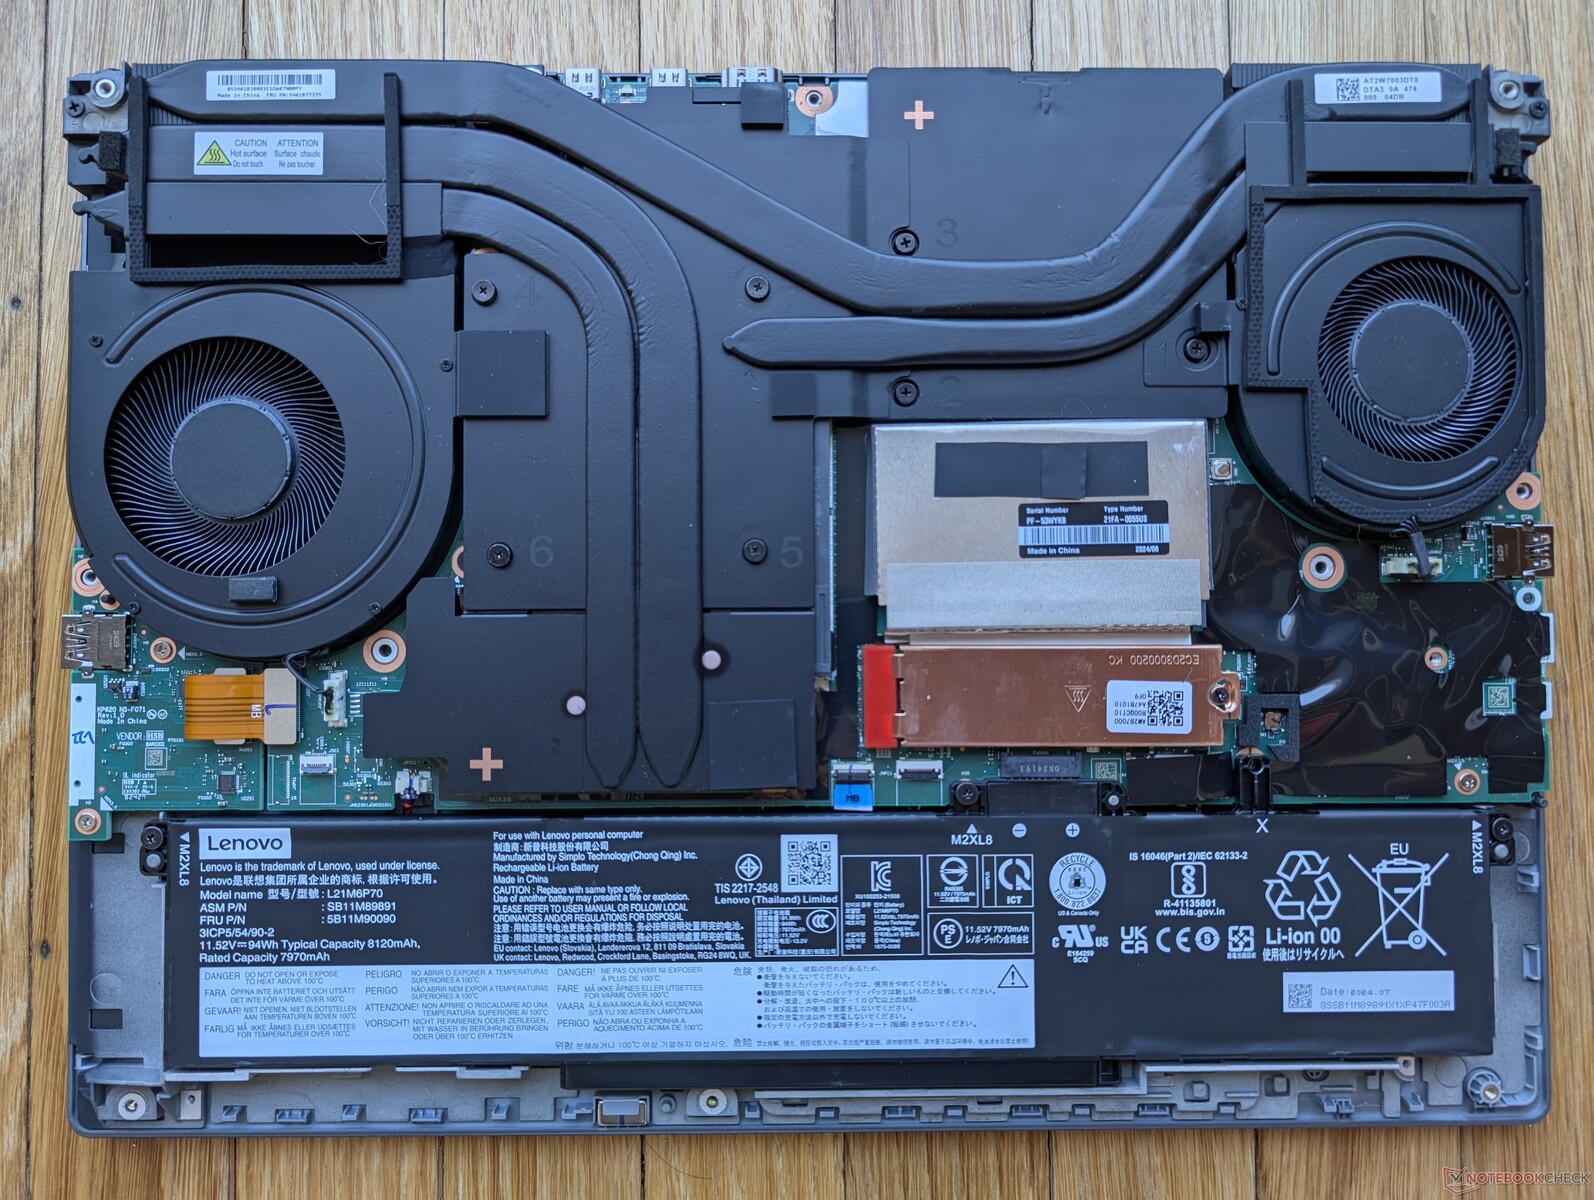
Manutenzione
Sostenibilità
Lenovo incorpora una quantità significativa di materiali riciclati durante la produzione, tra cui il 50 percento di alluminio riciclato per il coperchio esterno (coperchio A), il 90 percento di magnesio per il piano della tastiera (coperchio C) e >85 percento di plastica a contenuto post-consumo per i tappi dei tasti, il pacco batteria e gli altoparlanti.
L'imballaggio è privo di plastica e completamente riciclabile.
Accessori e garanzia
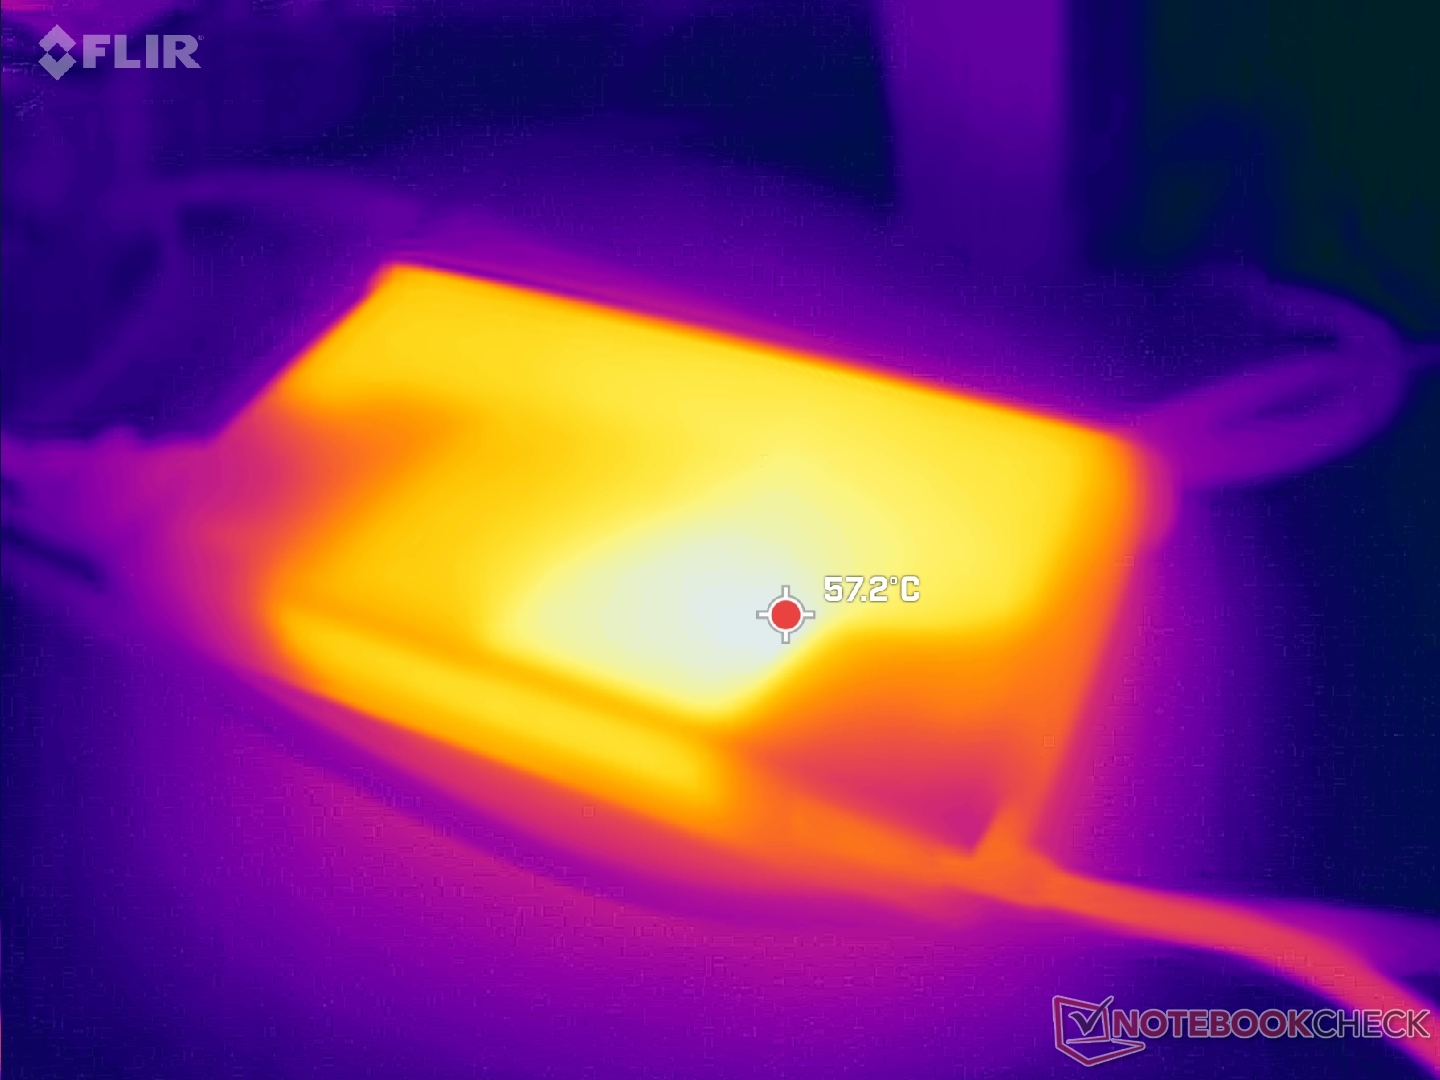
La confezione non contiene altri extra oltre all'adattatore CA e alla documentazione cartacea. Tuttavia, va notato che la nostra unità viene fornita con un adattatore CA più grande da 230 W invece dell'adattatore da 170 W del nostro primo ThinkPad P16 Gen 2, a causa della nostra GPU RTX 4000 Ada più esigente.
La garanzia del produttore di tre anni è standard.
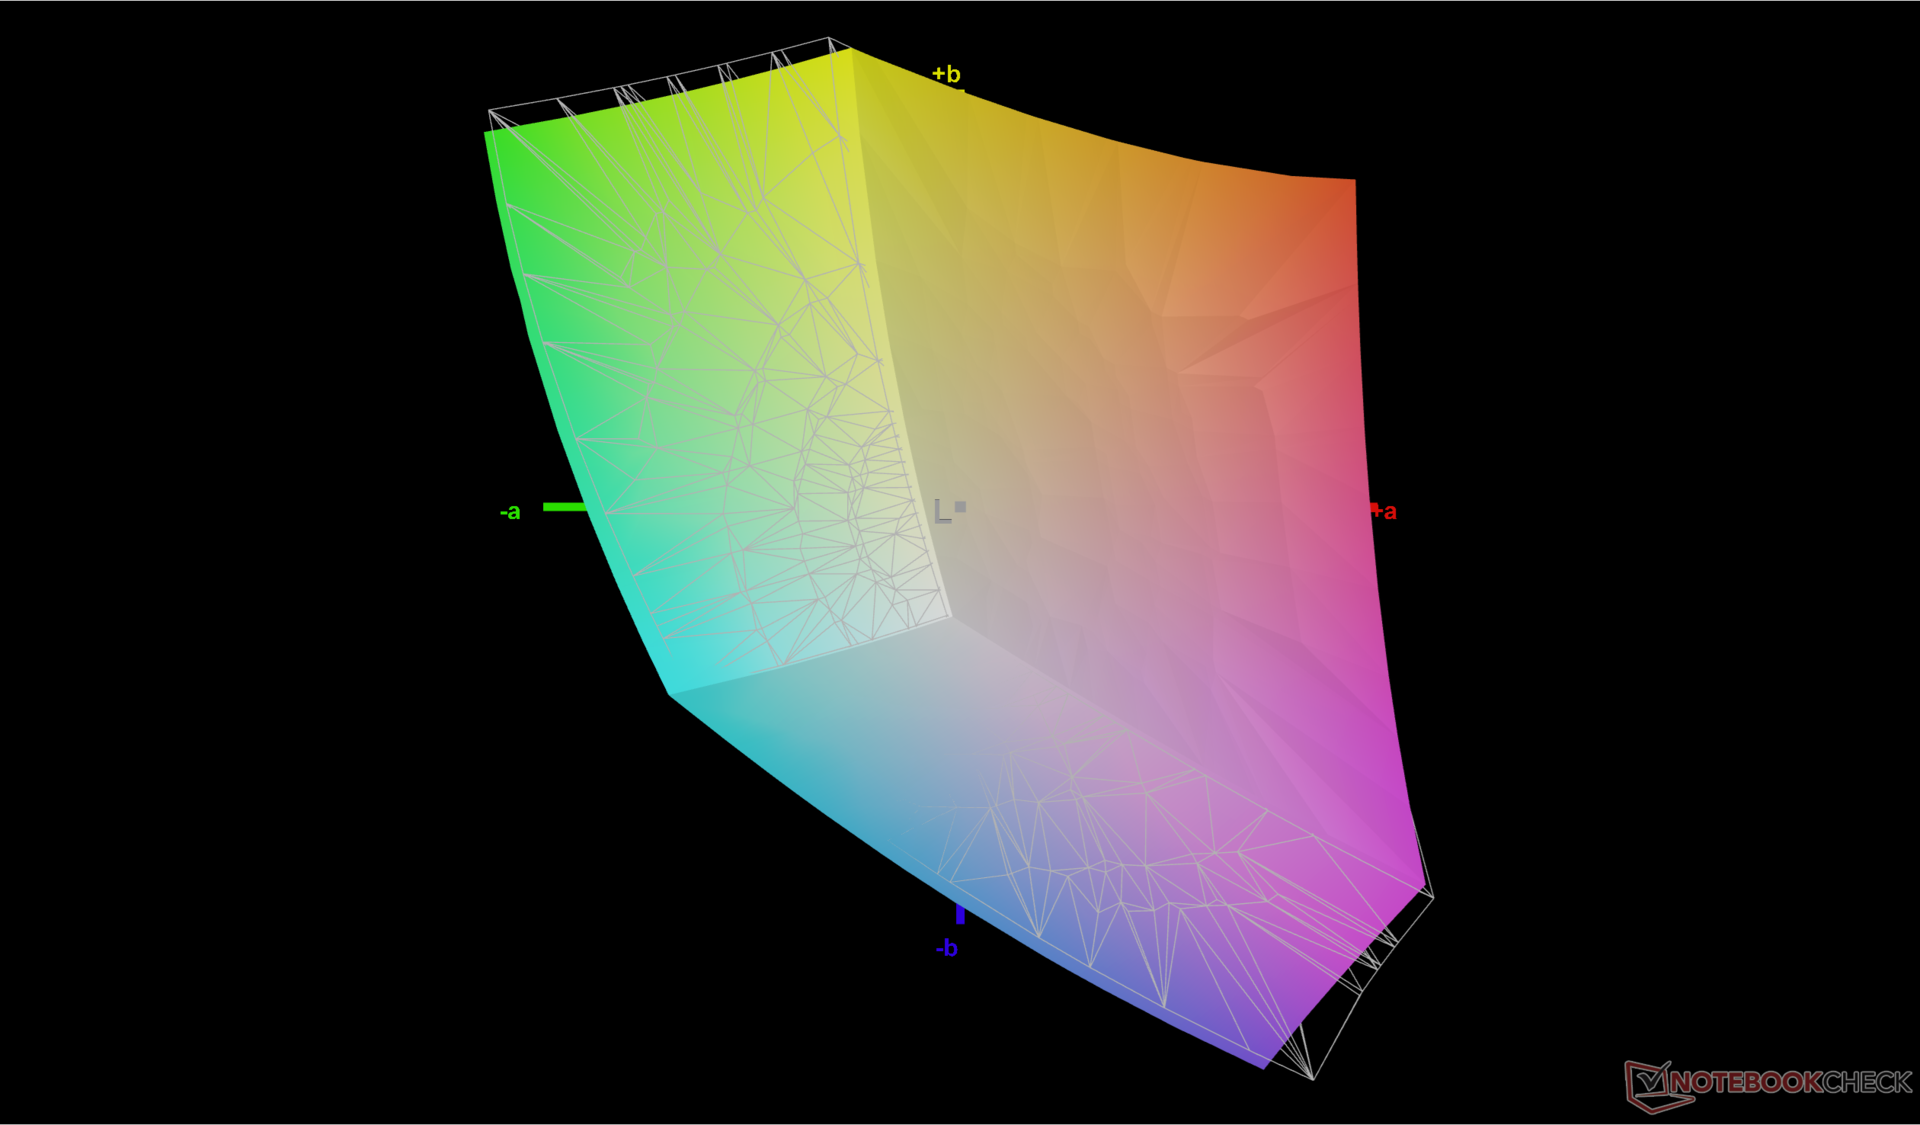
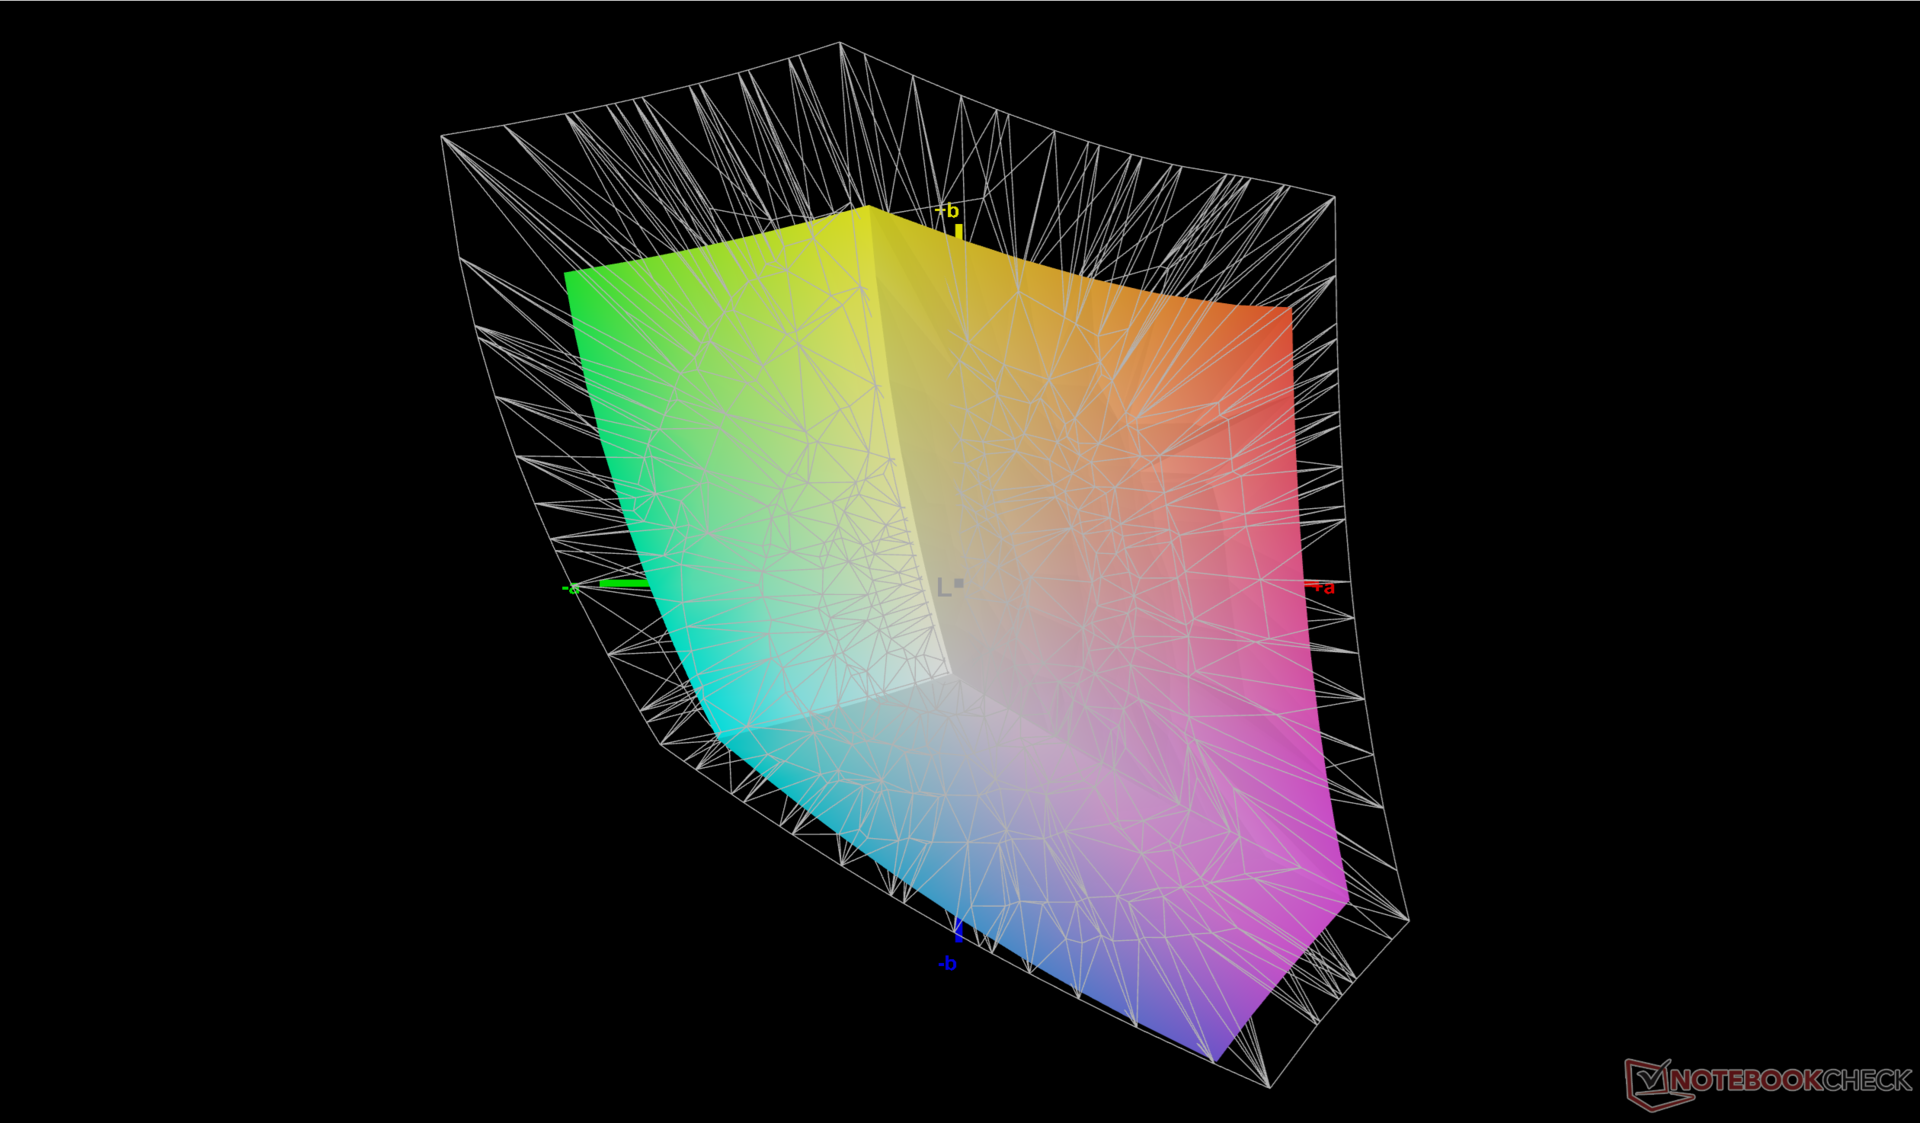
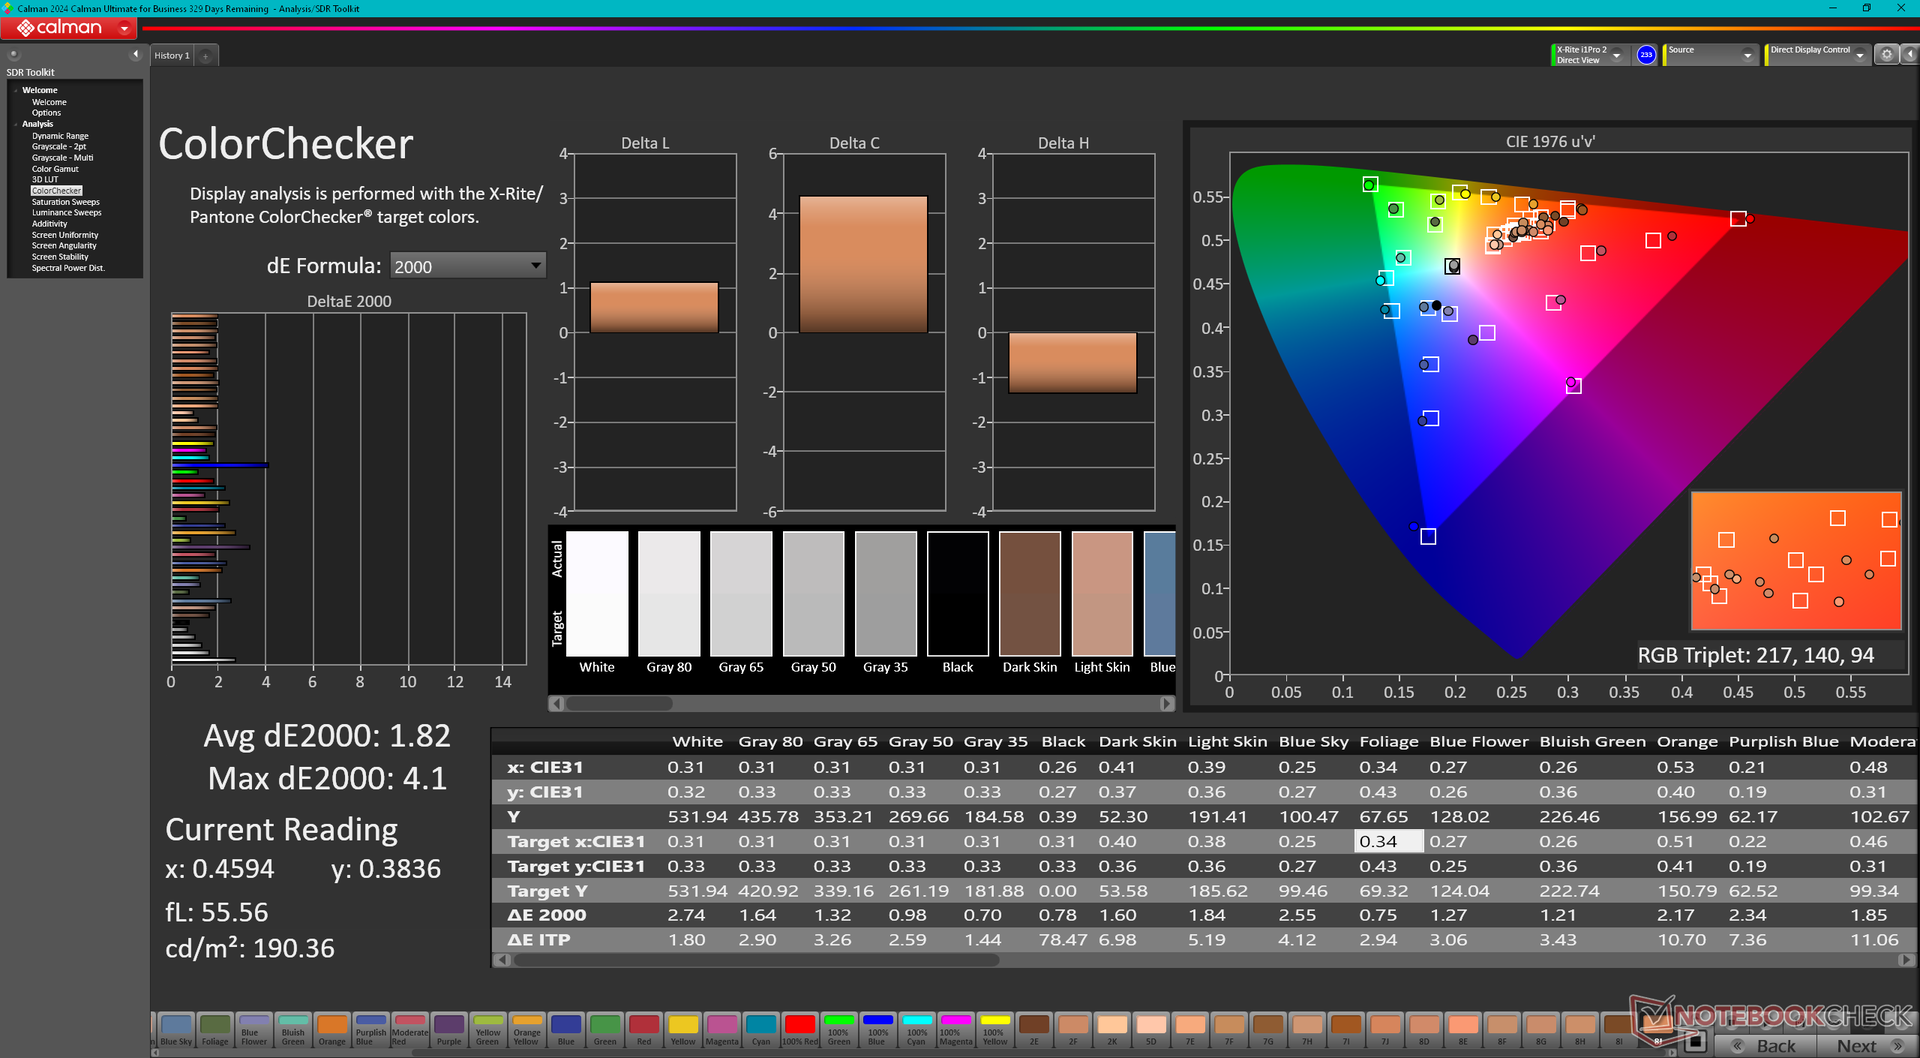
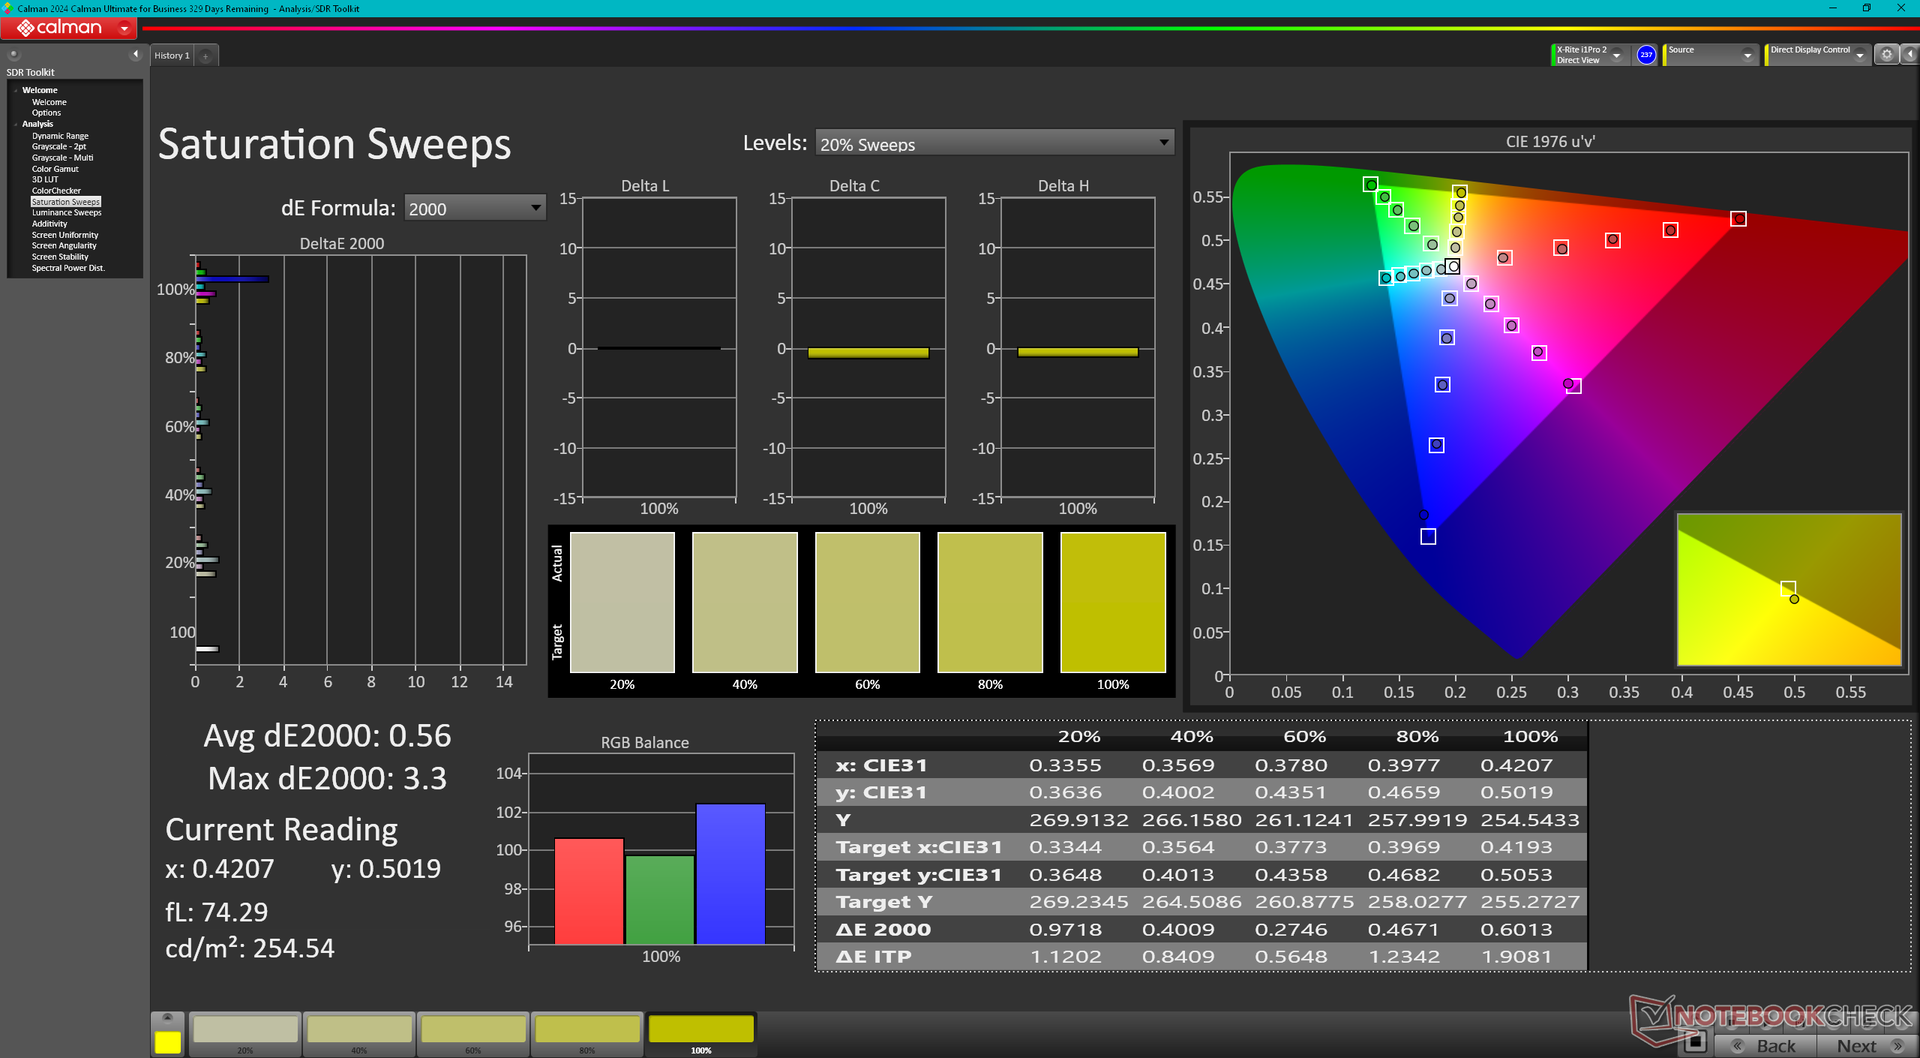
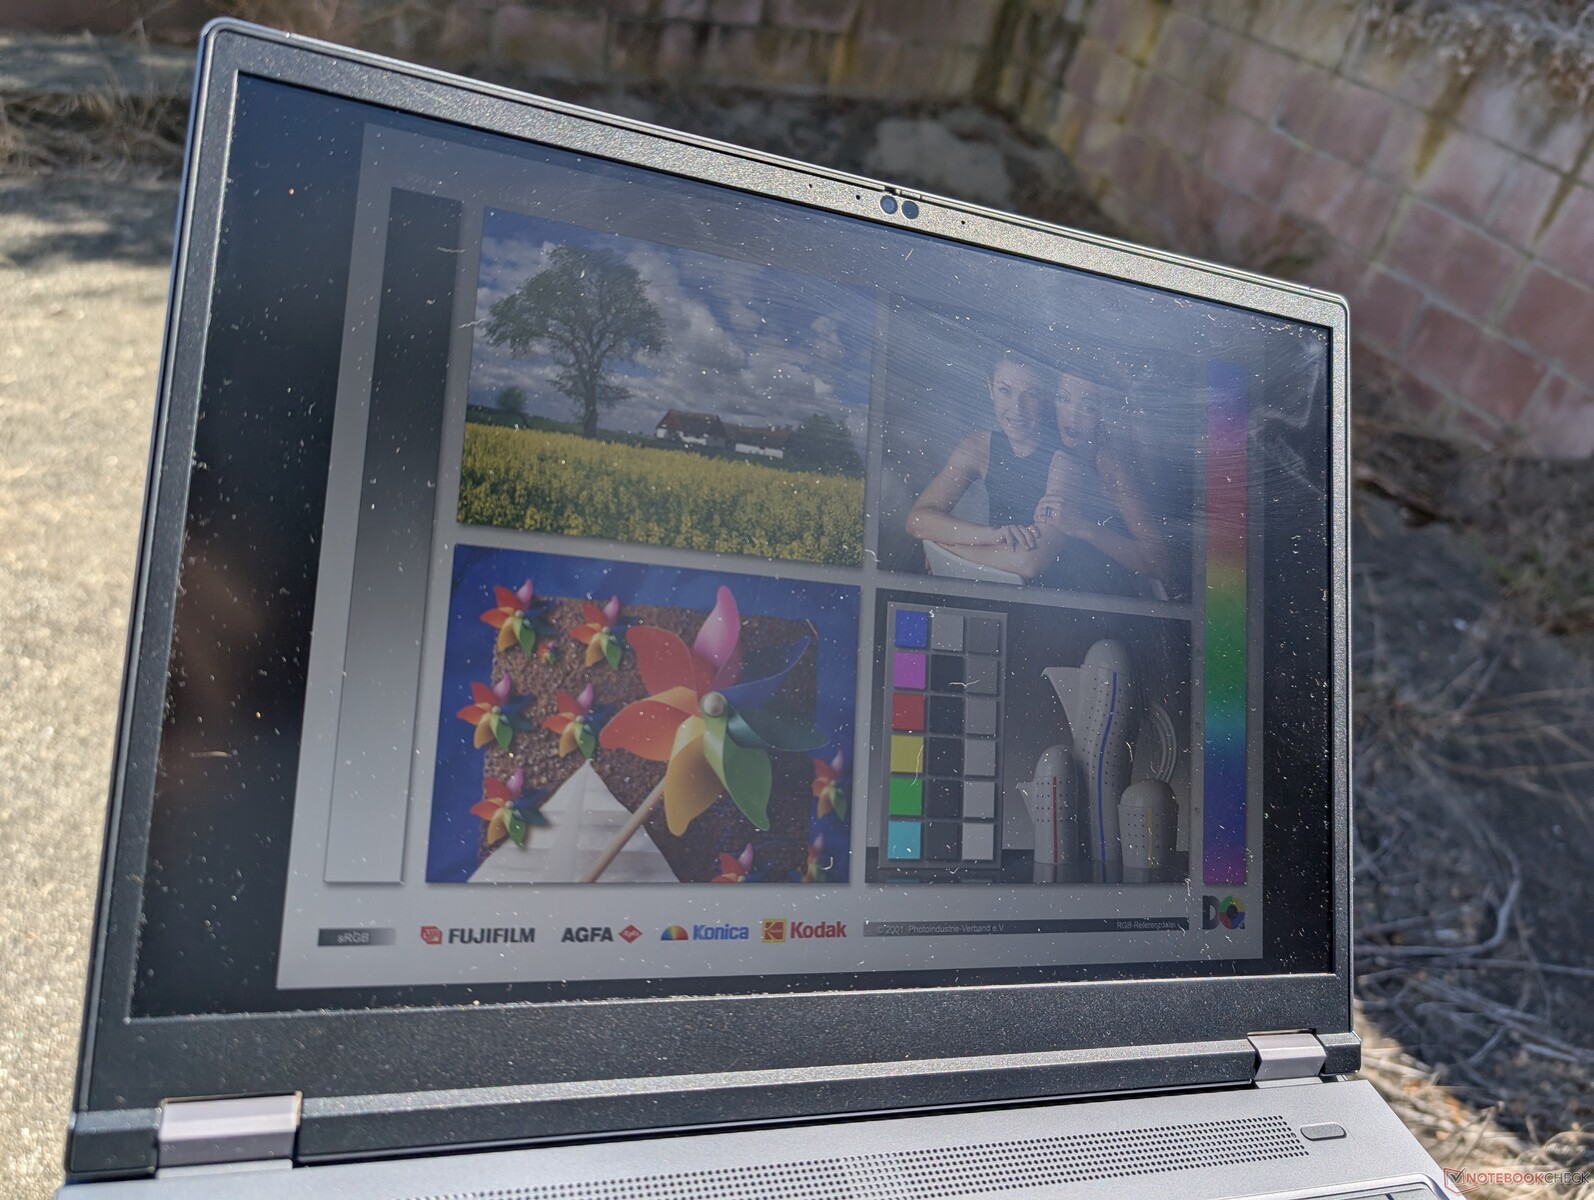
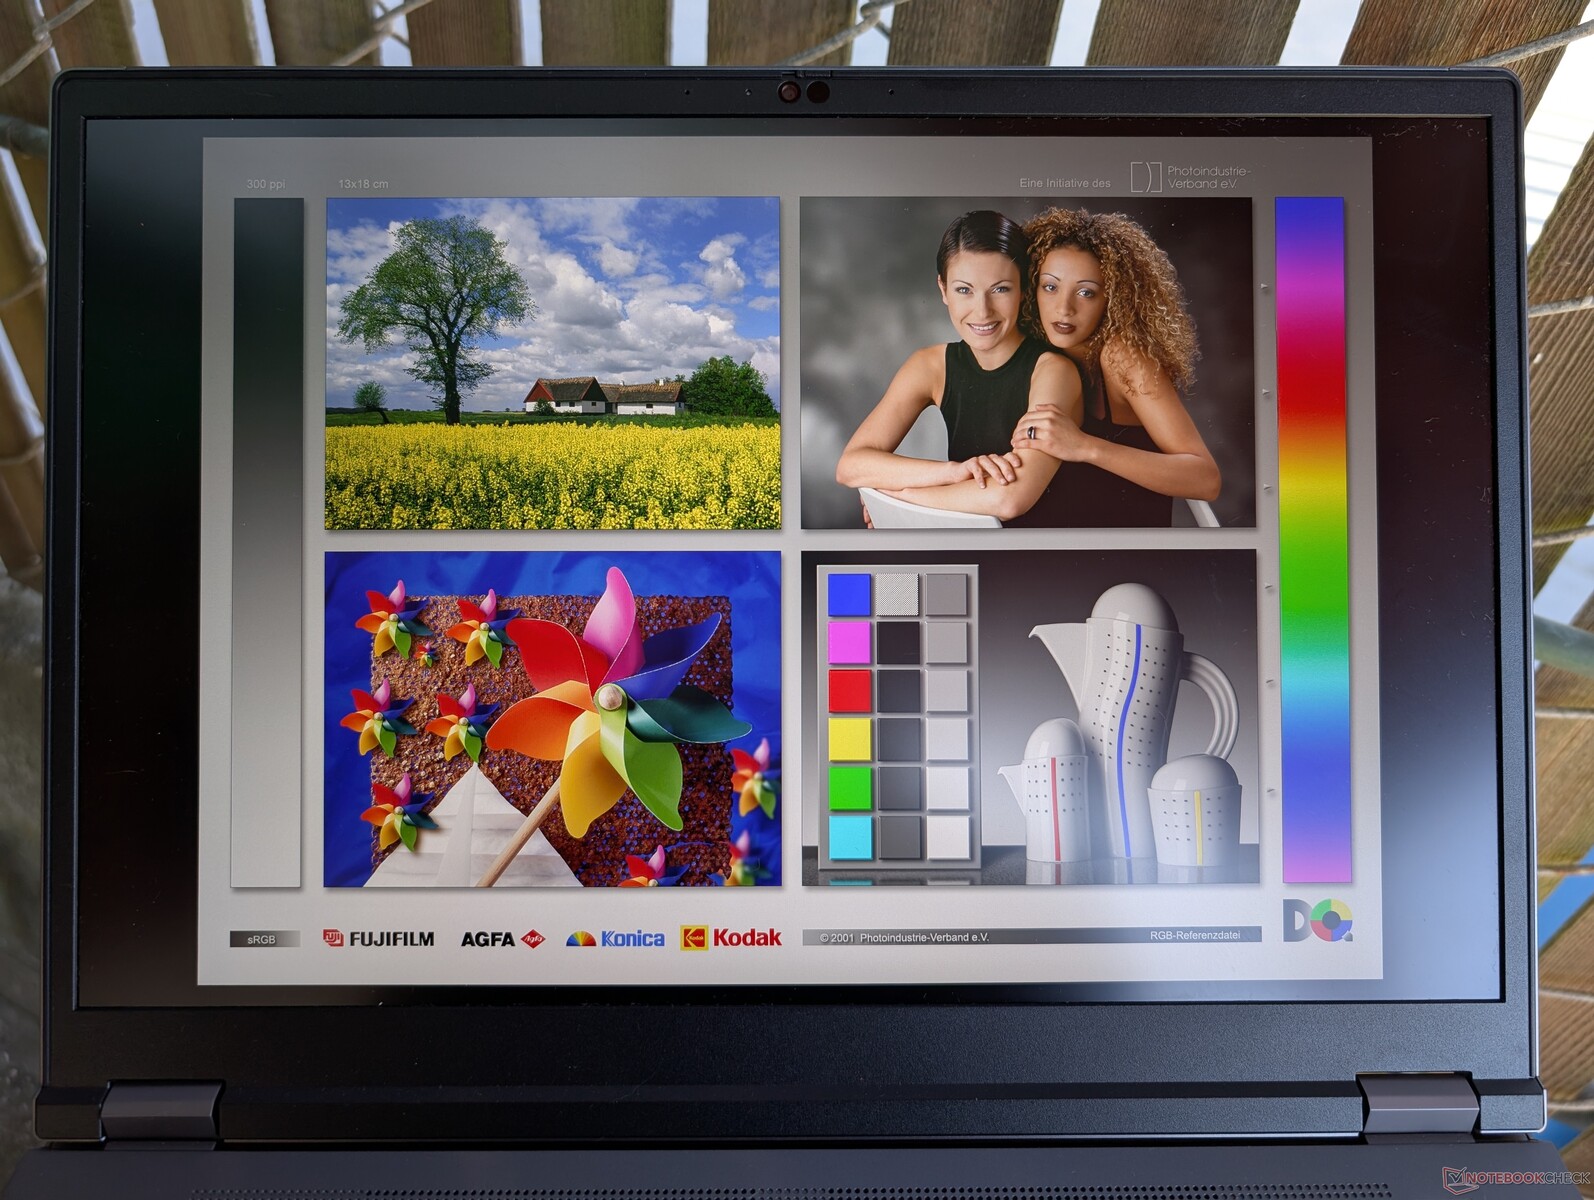
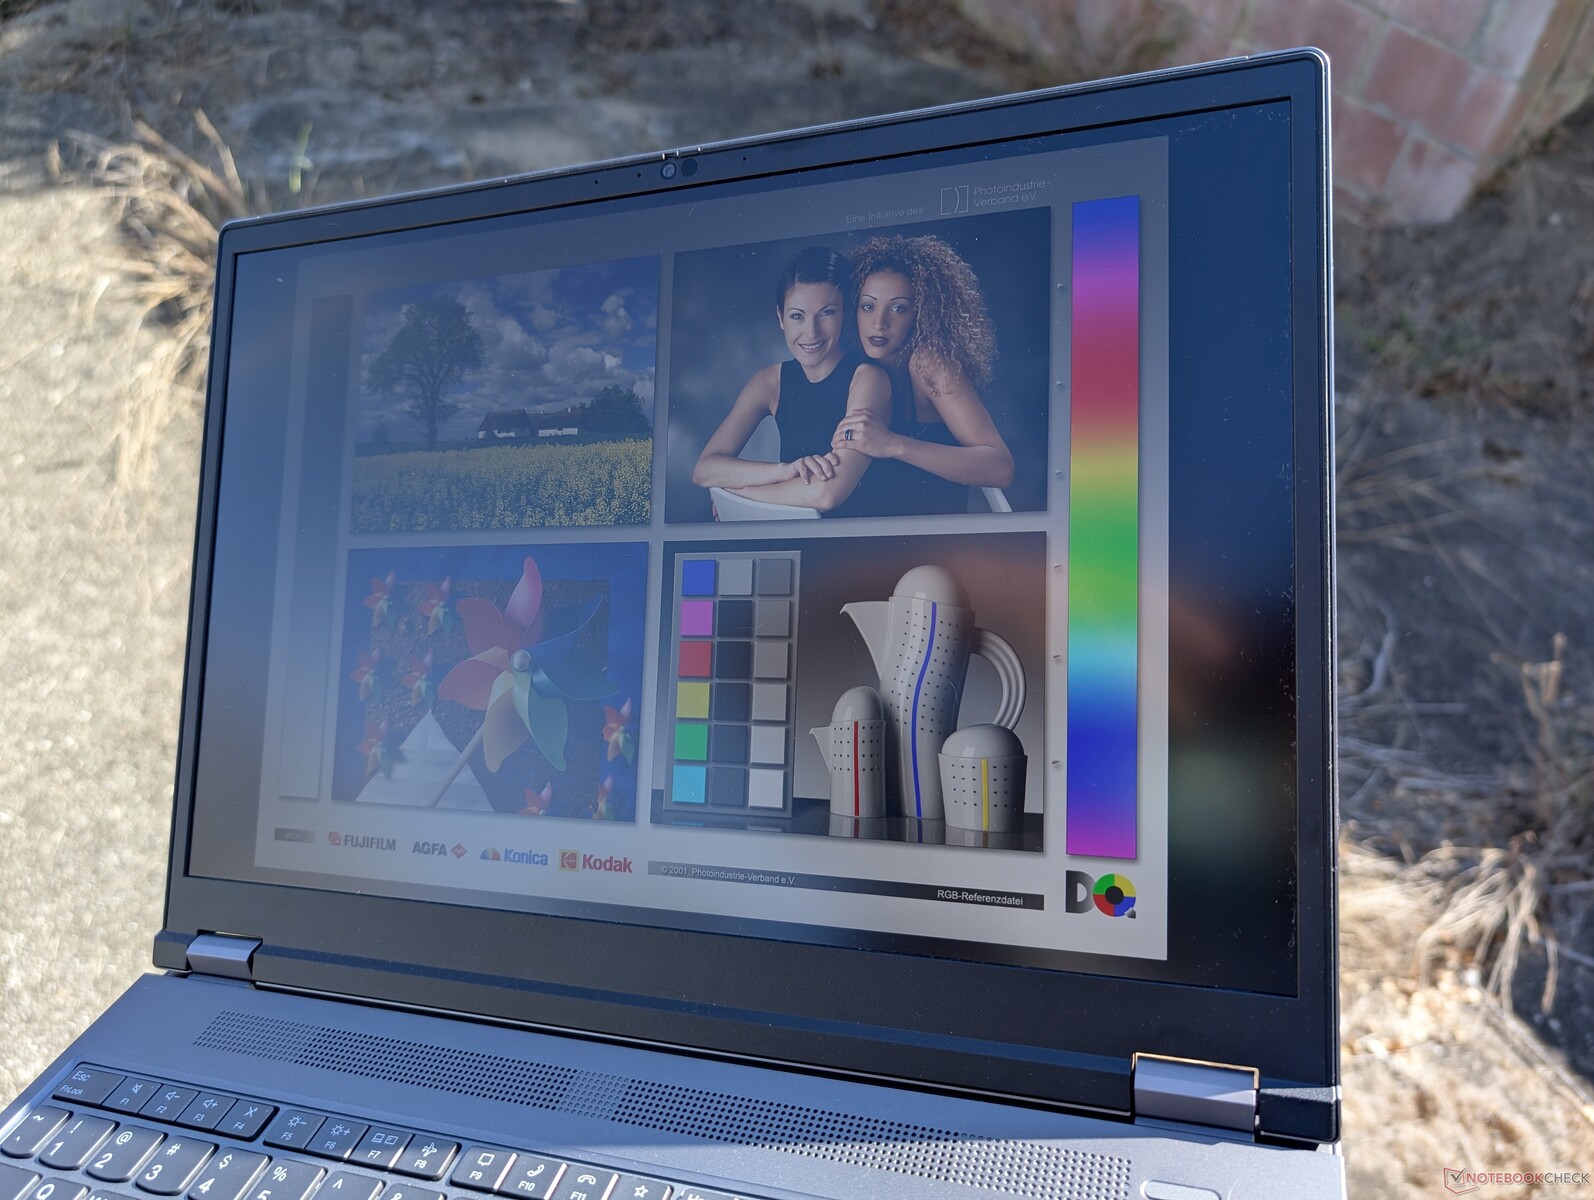
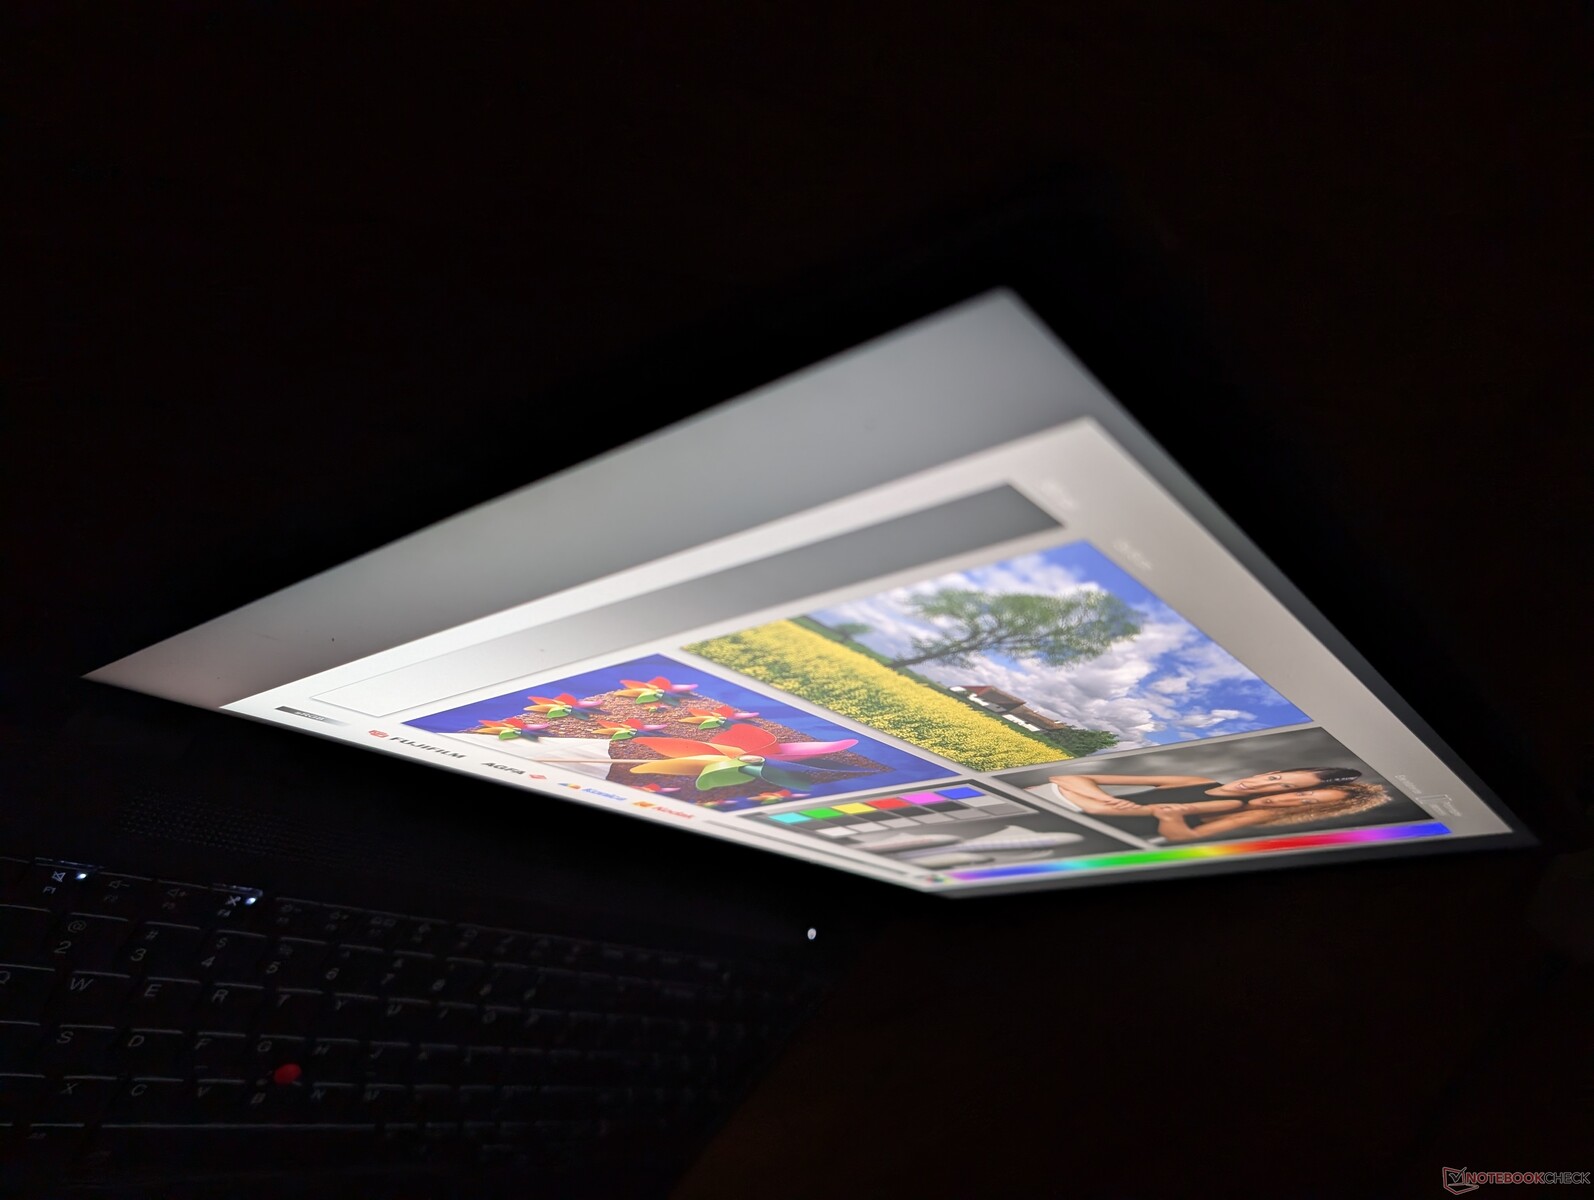
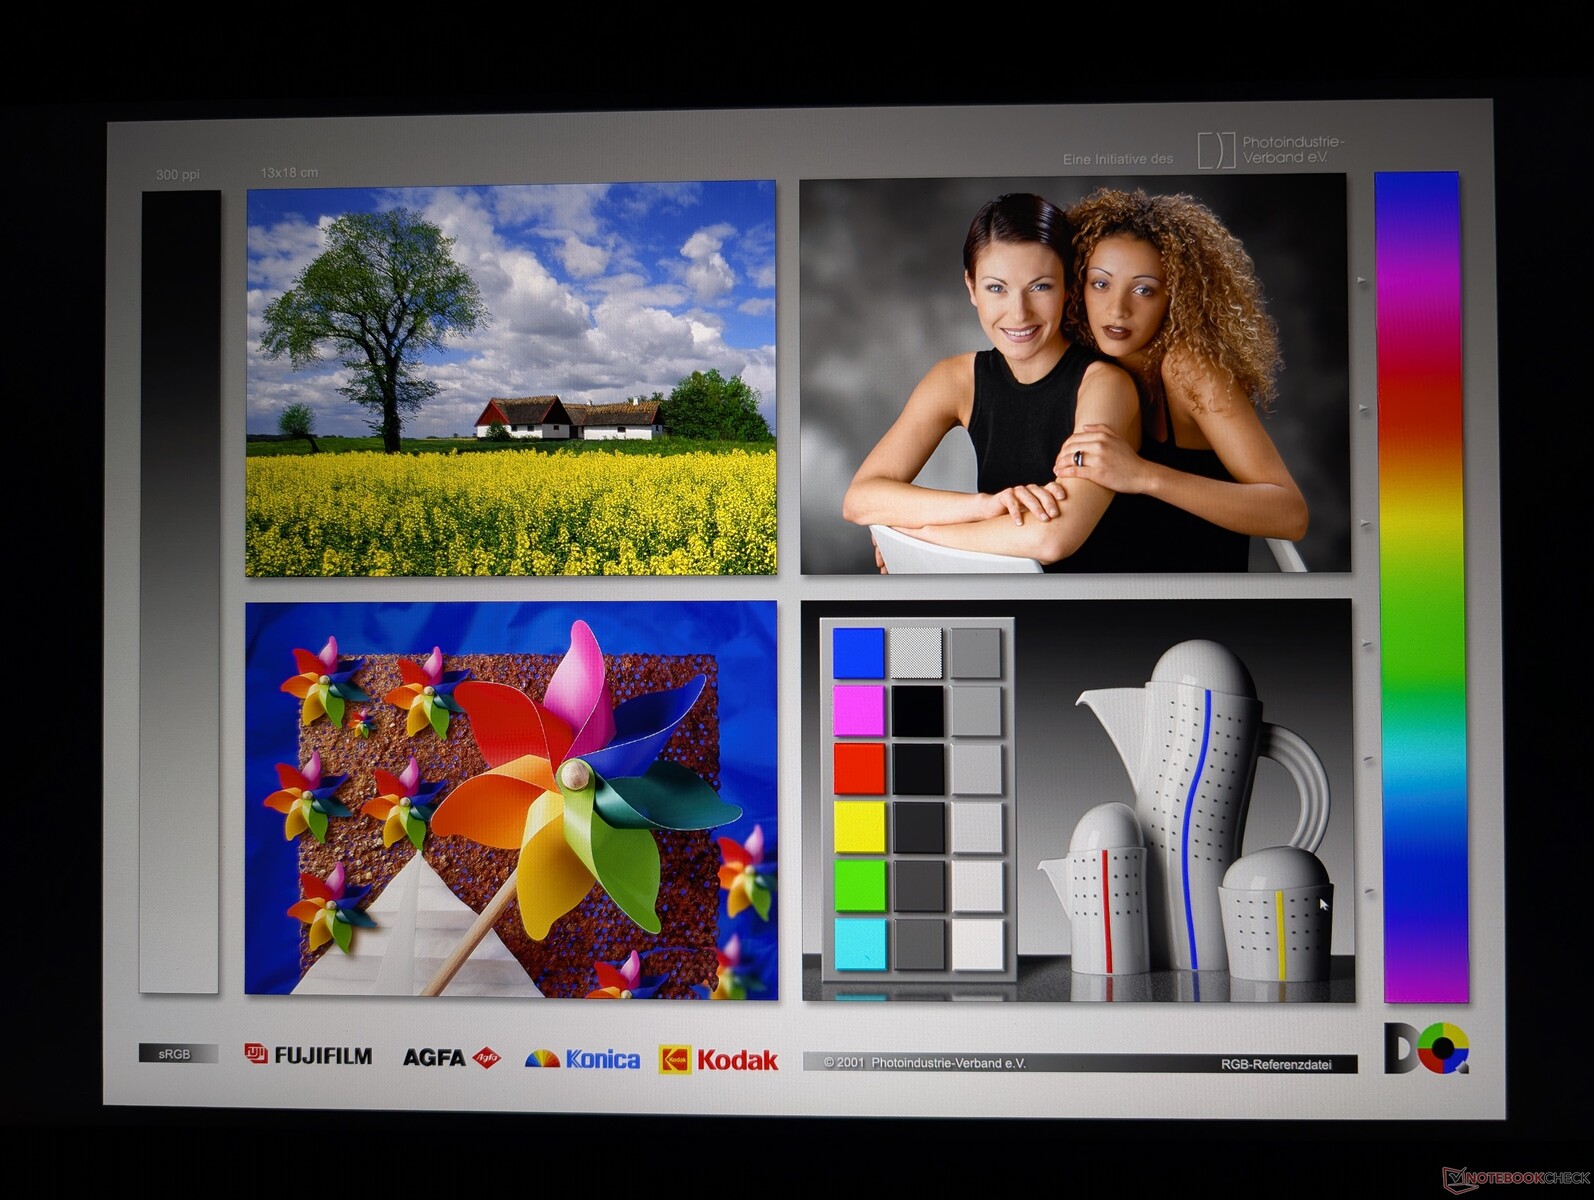
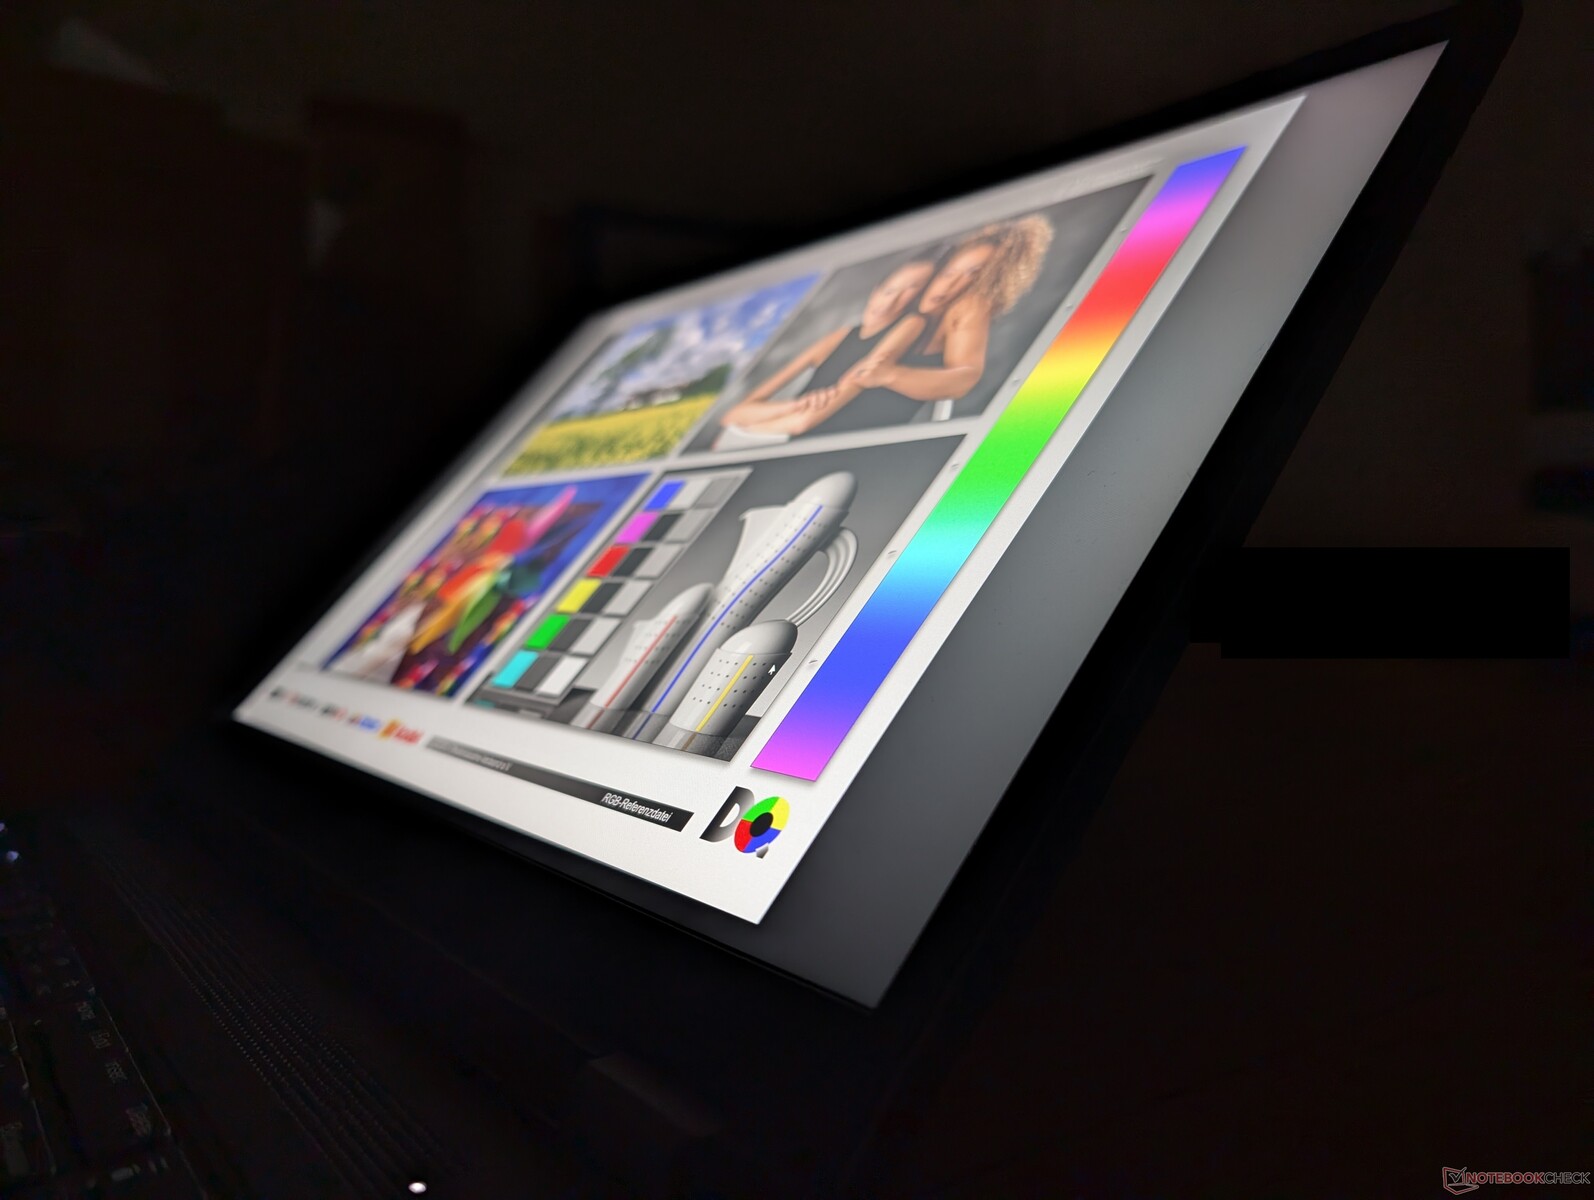
Display
È interessante notare che il nostro pannello IPS 1600p165 è di un produttore diverso rispetto al pannello IPS 1600p165 della nostra prima unità ThinkPad P16 Gen 2 (NE160QDM-NY1 vs. MNG007DA1-9). Per il resto, le caratteristiche principali e la luminosità sono quasi identiche. Sono disponibili altre opzioni di display, tra cui OLED a 2400p e IPS a 1200p.


| |||||||||||||||||||||||||
Distribuzione della luminosità: 89 %
Al centro con la batteria: 531.5 cd/m²
Contrasto: 1399:1 (Nero: 0.38 cd/m²)
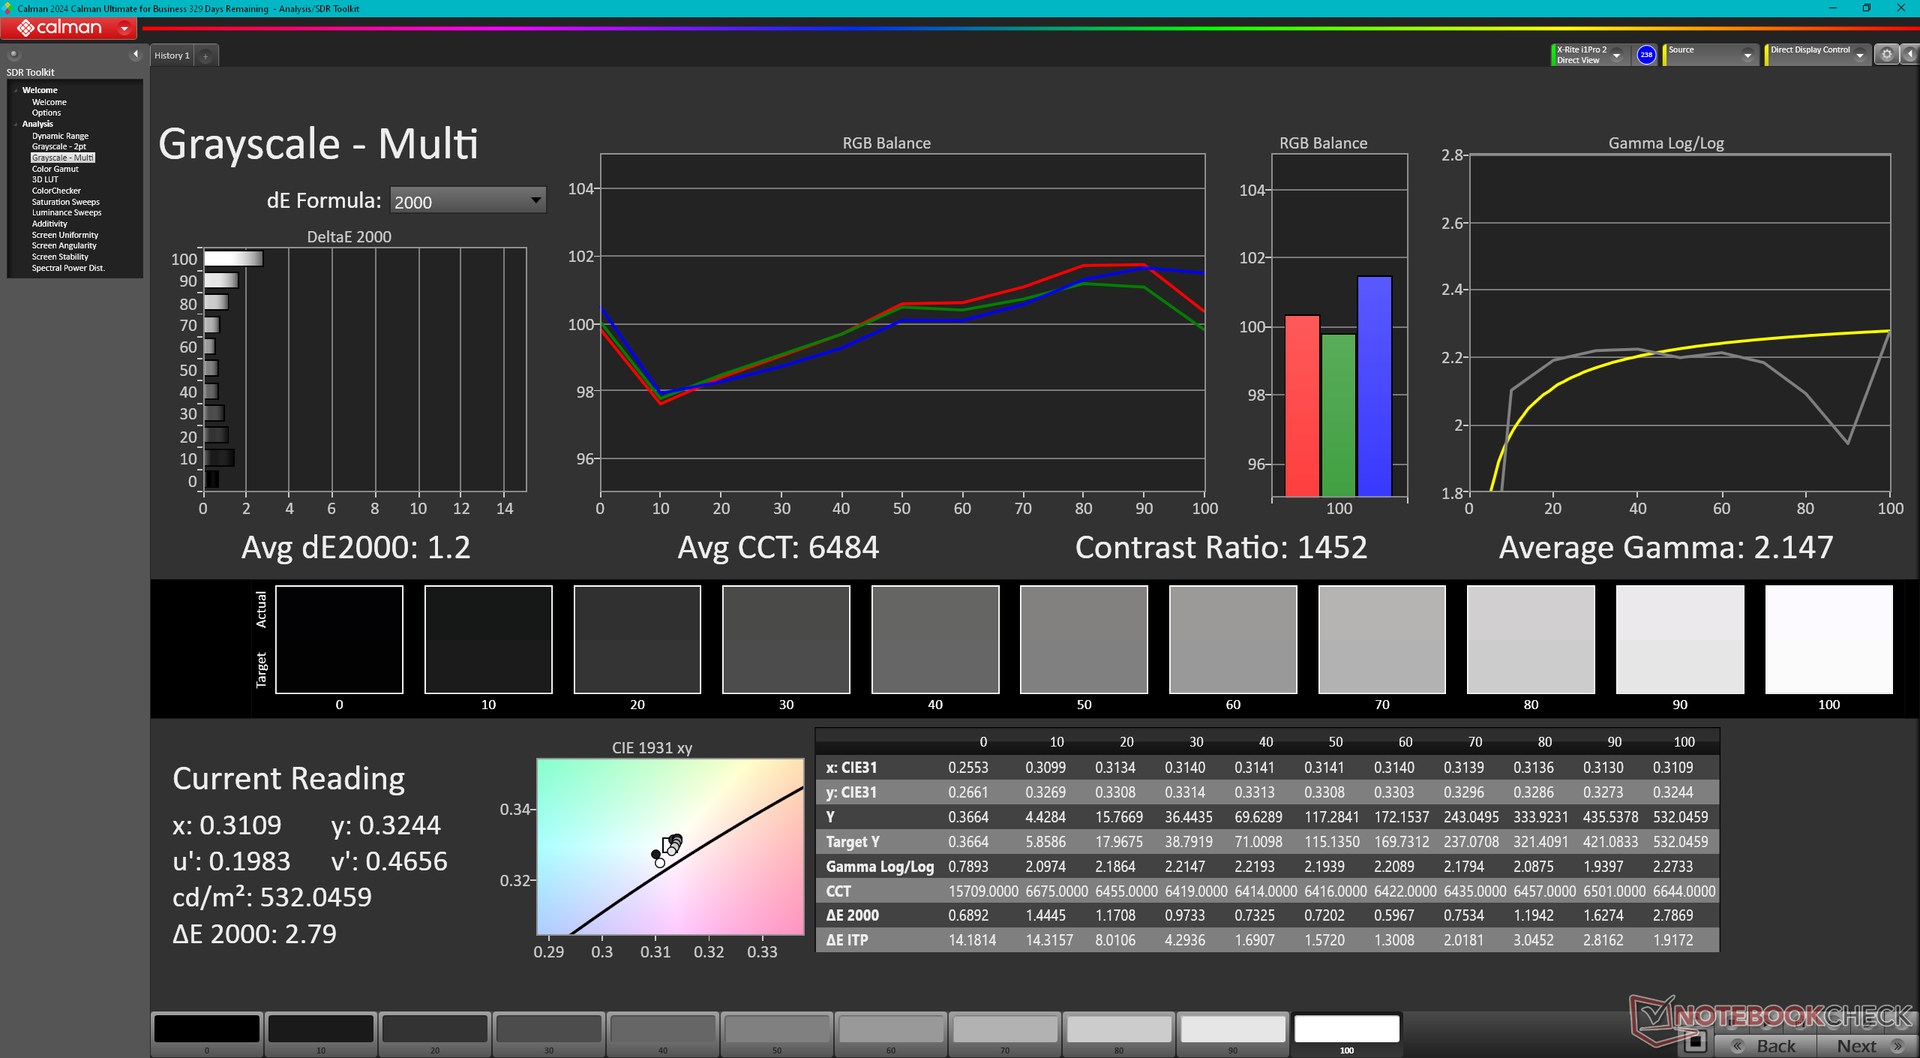
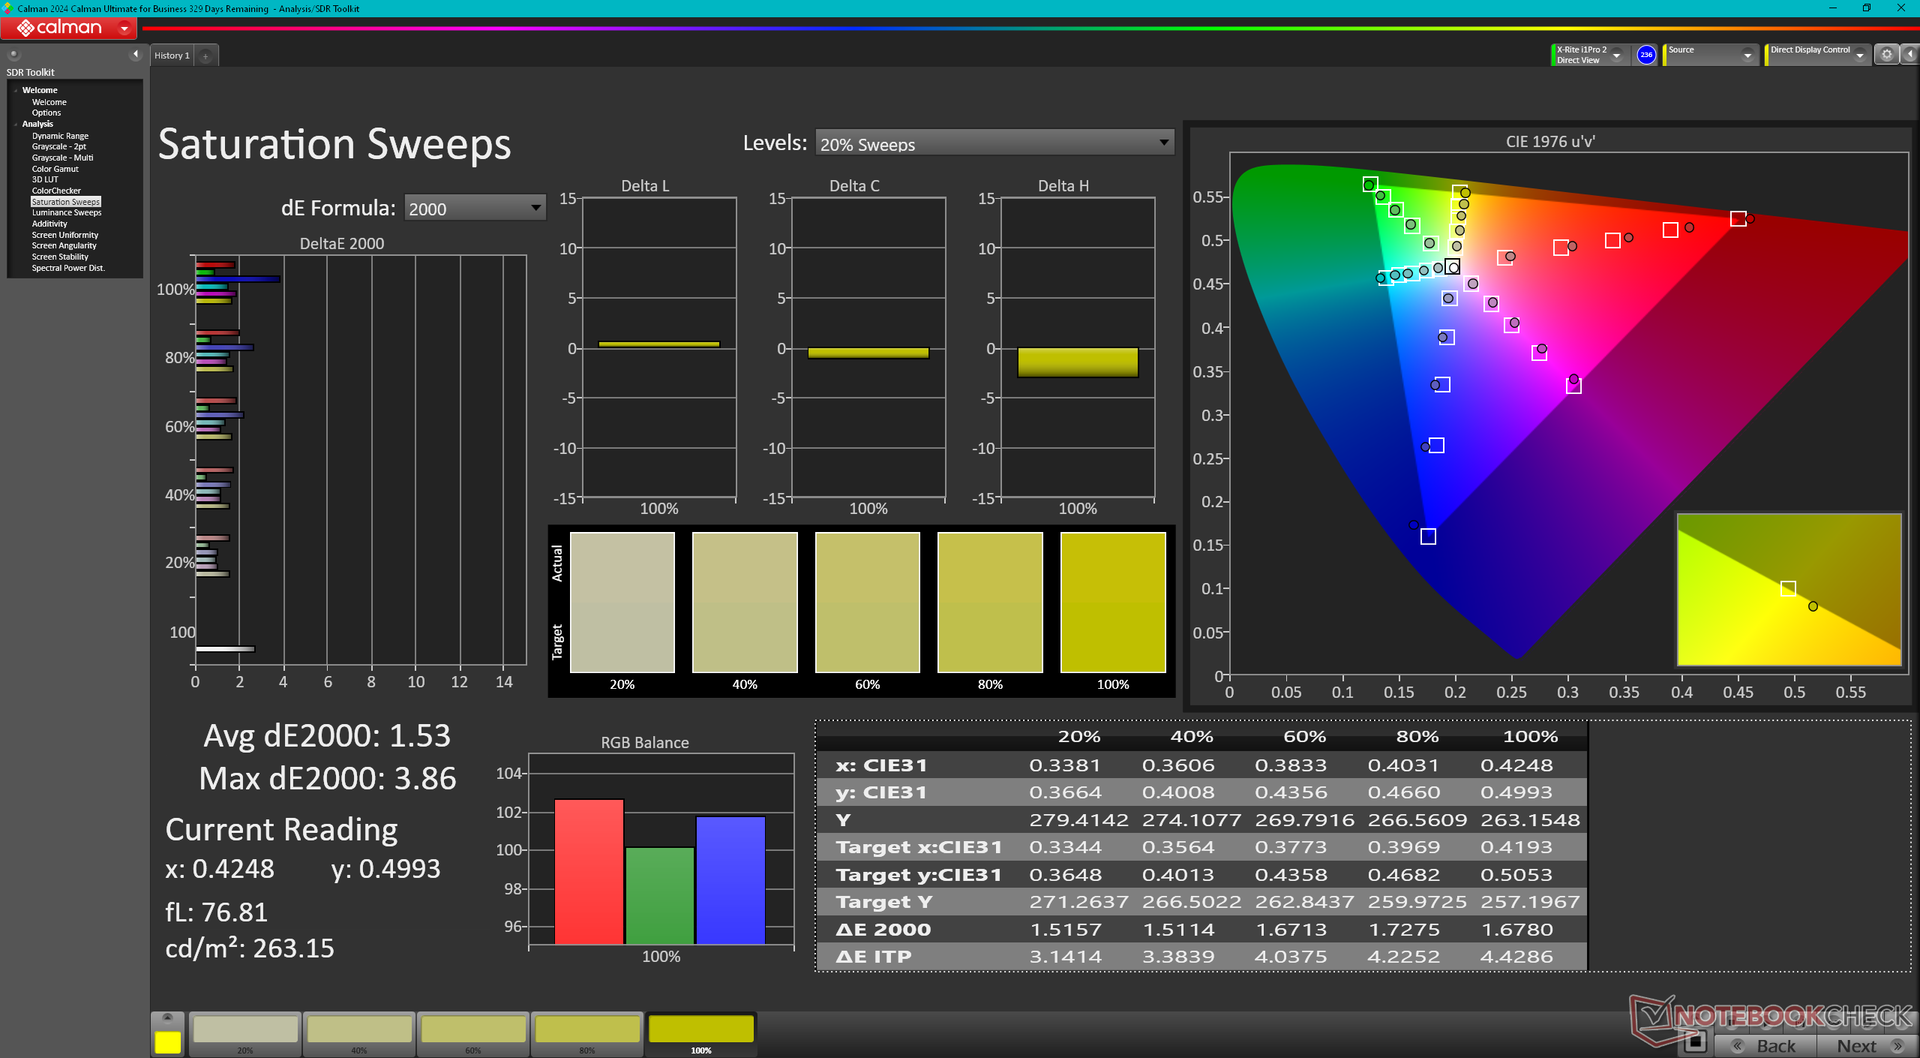
ΔE Color 1.82 | 0.5-29.43 Ø4.87, calibrated: 0.63
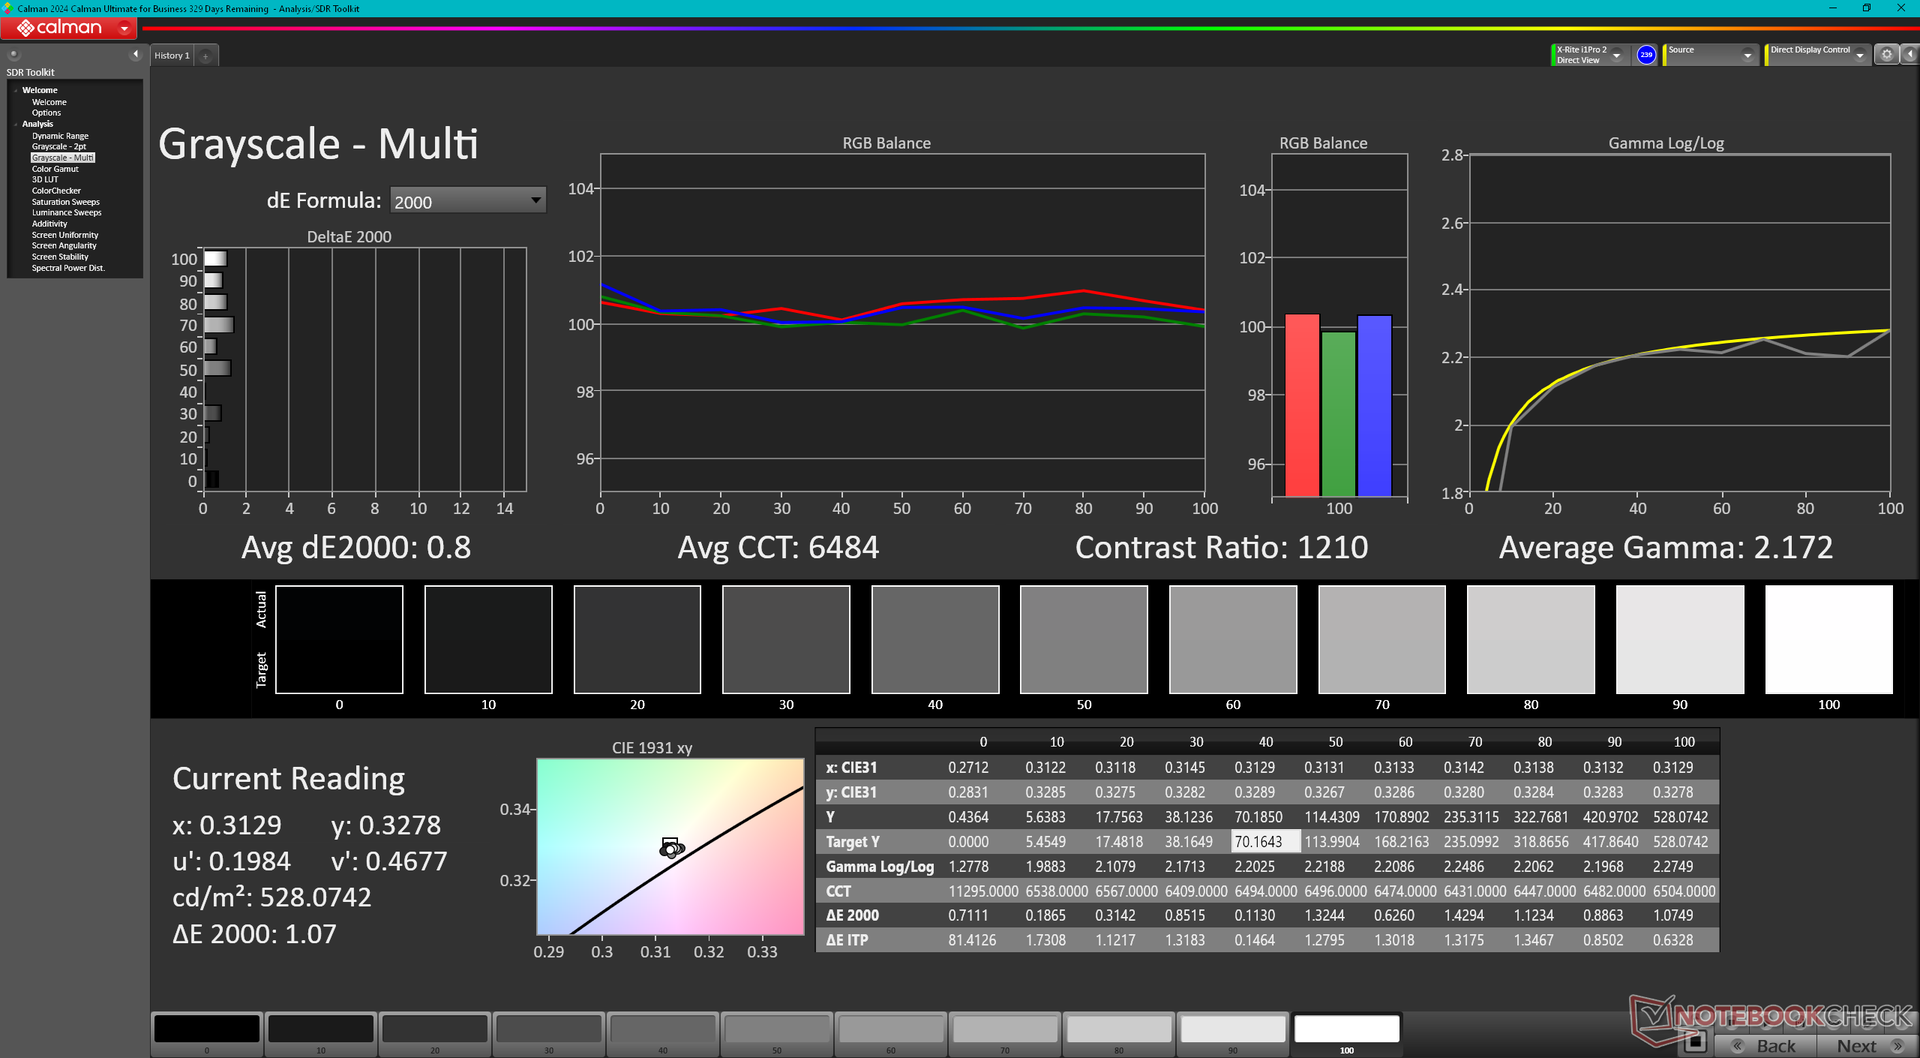
ΔE Greyscale 1.2 | 0.5-98 Ø5.1
70.6% AdobeRGB 1998 (Argyll 2.2.0 3D)
96.9% sRGB (Argyll 2.2.0 3D)
68.4% Display P3 (Argyll 2.2.0 3D)
Gamma: 2.15
| Lenovo ThinkPad P16 Gen 2 NE160QDM-NY1, IPS, 2560x1600, 16", 165 Hz | Lenovo ThinkPad P16 G2 21FA000FGE MNG007DA1-9, IPS LED, 2560x1600, 16", 165 Hz | Lenovo ThinkPad P16s G2 21K9000CGE ATNA60YV04-0, OLED, 3840x2400, 16", 60 Hz | Lenovo ThinkPad P16 G1 RTX A5500 LP160UQ1-SPB1, IPS, 3840x2400, 16", 60 Hz | HP ZBook Power 16 G11 A AUOA0A9, IPS, 2560x1600, 16", 120 Hz | Dell Precision 5690 Samsung 160YV03, OLED, 3840x2400, 16", 60 Hz | |
|---|---|---|---|---|---|---|
| Display | 3% | 29% | 20% | 1% | 29% | |
| Display P3 Coverage | 68.4 | 71 4% | 99.9 46% | 82.9 21% | 69.1 1% | 99.8 46% |
| sRGB Coverage | 96.9 | 99.2 2% | 100 3% | 98.9 2% | 97.7 1% | 100 3% |
| AdobeRGB 1998 Coverage | 70.6 | 73.2 4% | 96.9 37% | 95.9 36% | 71 1% | 96.6 37% |
| Response Times | 4% | 88% | -248% | 10% | 86% | |
| Response Time Grey 50% / Grey 80% * | 14.1 ? | 12.8 ? 9% | 1.5 ? 89% | 45.6 ? -223% | 13.6 ? 4% | 1.7 ? 88% |
| Response Time Black / White * | 9.9 ? | 10.1 ? -2% | 1.3 ? 87% | 36.8 ? -272% | 8.4 ? 15% | 1.7 ? 83% |
| PWM Frequency | 60 | 60 ? | ||||
| Screen | -59% | -54% | -22% | -52% | -49% | |
| Brightness middle | 531.5 | 510 -4% | 416 -22% | 601.9 13% | 470.7 -11% | 348.1 -35% |
| Brightness | 499 | 517 4% | 421 -16% | 569 14% | 431 -14% | 351 -30% |
| Brightness Distribution | 89 | 89 0% | 98 10% | 77 -13% | 88 -1% | 97 9% |
| Black Level * | 0.38 | 0.37 3% | 0.47 -24% | 0.57 -50% | ||
| Contrast | 1399 | 1378 -2% | 1281 -8% | 826 -41% | ||
| Colorchecker dE 2000 * | 1.82 | 2.6 -43% | 1.3 29% | 2.45 -35% | 2.16 -19% | 4.18 -130% |
| Colorchecker dE 2000 max. * | 4.1 | 5.2 -27% | 2.8 32% | 4.46 -9% | 4.39 -7% | 6.68 -63% |
| Colorchecker dE 2000 calibrated * | 0.63 | 2.3 -265% | 2.9 -360% | 1.37 -117% | 0.97 -54% | |
| Greyscale dE 2000 * | 1.2 | 3.6 -200% | 1.8 -50% | 2.6 -117% | 3.7 -208% | 1.7 -42% |
| Gamma | 2.15 102% | 2.26 97% | 2.25 98% | 2.3 96% | 2.38 92% | 2.2 100% |
| CCT | 6484 100% | 5969 109% | 6574 99% | 6805 96% | 6765 96% | 6198 105% |
| Media totale (Programma / Settaggio) | -17% /
-37% | 21% /
-10% | -83% /
-47% | -14% /
-32% | 22% /
-7% |
* ... Meglio usare valori piccoli
Il display viene fornito pre-calibrato rispetto allo standard sRGB con valori medi di deltaE della scala dei grigi di appena 1,2 e 1,82, rispettivamente. Per la maggior parte, quindi, non è necessaria una calibrazione da parte dell'utente finale.

Tempi di risposta del Display
| ↔ Tempi di risposta dal Nero al Bianco | ||
|---|---|---|
| 9.9 ms ... aumenta ↗ e diminuisce ↘ combinato | ↗ 5 ms Incremento | 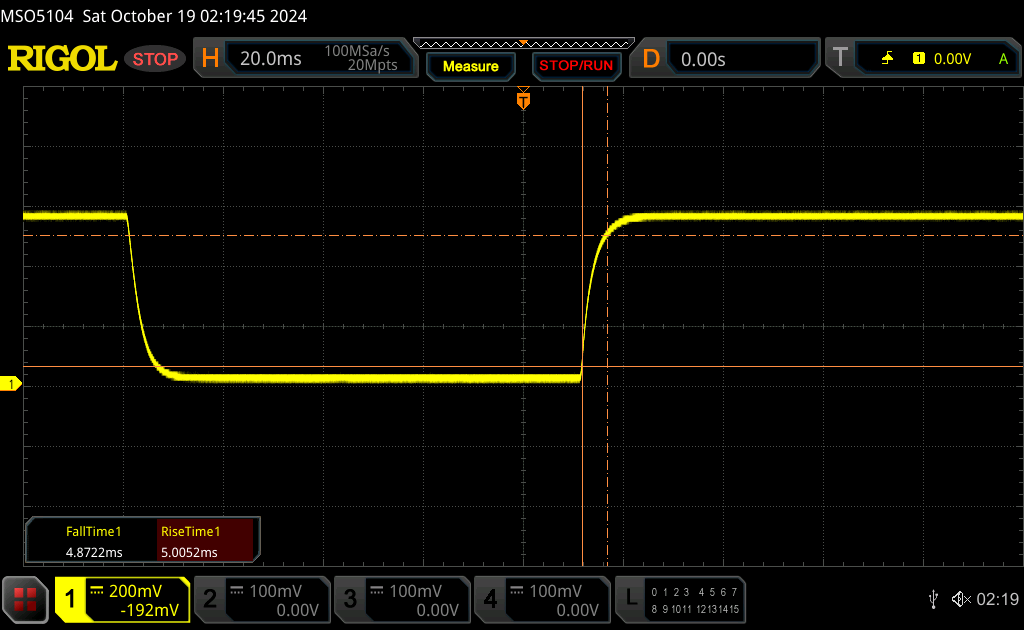 |
| ↘ 4.9 ms Calo | ||
| Lo schermo mostra veloci tempi di risposta durante i nostri tests e dovrebbe esere adatto al gaming In confronto, tutti i dispositivi di test variano da 0.1 (minimo) a 240 (massimo) ms. » 24 % di tutti i dispositivi è migliore. Questo significa che i tempi di risposta rilevati sono migliori rispettto alla media di tutti i dispositivi testati (20.7 ms). | ||
| ↔ Tempo di risposta dal 50% Grigio all'80% Grigio | ||
| 14.1 ms ... aumenta ↗ e diminuisce ↘ combinato | ↗ 6.7 ms Incremento | 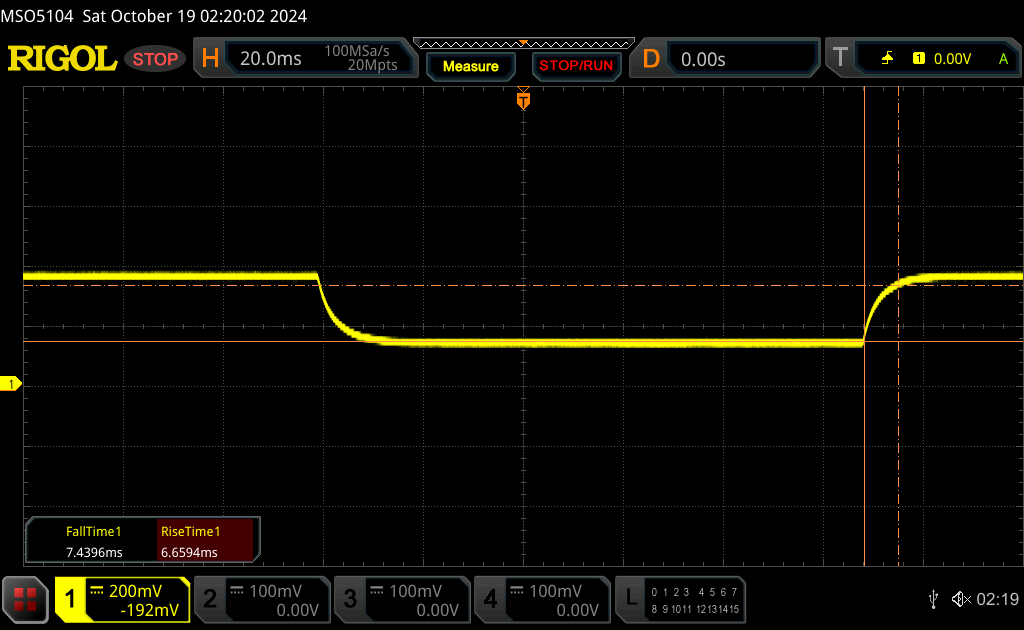 |
| ↘ 7.4 ms Calo | ||
| Lo schermo mostra buoni tempi di risposta durante i nostri tests, ma potrebbe essere troppo lento per i gamers competitivi. In confronto, tutti i dispositivi di test variano da 0.165 (minimo) a 636 (massimo) ms. » 25 % di tutti i dispositivi è migliore. Questo significa che i tempi di risposta rilevati sono migliori rispettto alla media di tutti i dispositivi testati (32.5 ms). | ||
Sfarfallio dello schermo / PWM (Pulse-Width Modulation)
| flickering dello schermo / PWM non rilevato | 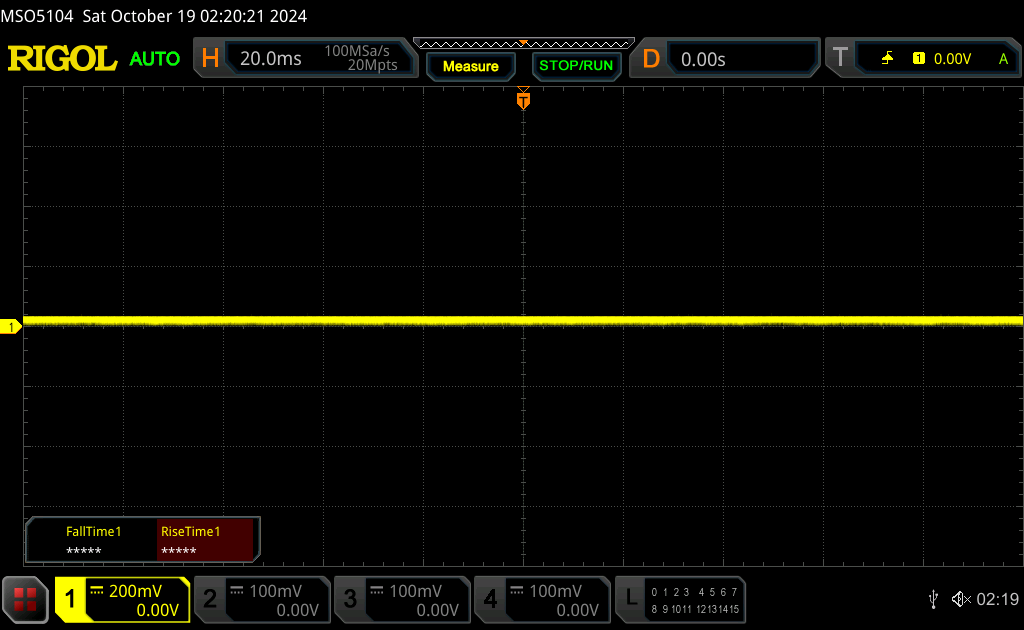 | ||
In confronto: 53 % di tutti i dispositivi testati non utilizza PWM per ridurre la luminosita' del display. Se è rilevato PWM, una media di 8492 (minimo: 5 - massimo: 343500) Hz è stata rilevata. | |||
Prestazioni
Condizioni del test
Abbiamo impostato Windows in modalità Prestazioni e la GPU in modalità discreta prima di eseguire i benchmark qui sotto. Il sistema non supporta Advanced Optimus secondo il Pannello di controllo Nvidia.
Processore
Il Core i7-14700HX è un aumento salutare rispetto al Core i7-13700HX con un aumento del 20-25% nelle prestazioni multi-thread. Le SKU con il Core i9-13980HX sono ancora disponibili e possono fornire prestazioni ancora più elevate rispetto al nostro Core I7-14700HX, nonostante si tratti di un processore più vecchio.
La sostenibilità delle prestazioni è buona, ma potrebbe essere migliore. Quando si esegue CineBench R15 xT in un ciclo, ad esempio, il nostro punteggio iniziale di 3930 punti scendeva del 10% dopo pochi cicli.
Cinebench R15 Multi Loop
Cinebench R23: Multi Core | Single Core
Cinebench R20: CPU (Multi Core) | CPU (Single Core)
Cinebench R15: CPU Multi 64Bit | CPU Single 64Bit
Blender: v2.79 BMW27 CPU
7-Zip 18.03: 7z b 4 | 7z b 4 -mmt1
Geekbench 6.4: Multi-Core | Single-Core
Geekbench 5.5: Multi-Core | Single-Core
HWBOT x265 Benchmark v2.2: 4k Preset
LibreOffice : 20 Documents To PDF
R Benchmark 2.5: Overall mean
| CPU Performance Rating | |
| HP ZBook Fury 16 G11 | |
| Lenovo ThinkPad P16 Gen 2 | |
| Media Intel Core i7-14700HX | |
| Lenovo ThinkPad P16 G1 RTX A5500 -2! | |
| Lenovo ThinkPad P1 G6 21FV001KUS | |
| Lenovo ThinkPad P16 G2 21FA000FGE -2! | |
| Dell Precision 5690 | |
| Lenovo ThinkPad P1 G6-21FV000DGE | |
| Media della classe Workstation | |
| Lenovo ThinkPad P1 Gen 7 21KV001SGE | |
| HP ZBook Fury 16 G9 -2! | |
| HP ZBook Power 16 G11 A | |
| MSI CreatorPro Z16P B12UKST -2! | |
| Lenovo ThinkPad P16v G1 AMD | |
| Lenovo ThinkPad P16s G2 21K9000CGE | |
| HP ZBook Firefly 16 G9-6B897EA -2! | |
| Geekbench 6.4 / Multi-Core | |
| Lenovo ThinkPad P16 Gen 2 | |
| Media Intel Core i7-14700HX (14807 - 17562, n=7) | |
| HP ZBook Fury 16 G11 | |
| Dell Precision 5690 | |
| Media della classe Workstation (10200 - 16855, n=23, ultimi 2 anni) | |
| Lenovo ThinkPad P1 Gen 7 21KV001SGE | |
| Lenovo ThinkPad P1 G6 21FV001KUS | |
| HP ZBook Power 16 G11 A | |
| Lenovo ThinkPad P1 G6-21FV000DGE | |
| Lenovo ThinkPad P16s G2 21K9000CGE | |
| Lenovo ThinkPad P16v G1 AMD | |
| Geekbench 6.4 / Single-Core | |
| HP ZBook Fury 16 G11 | |
| Lenovo ThinkPad P16 Gen 2 | |
| Lenovo ThinkPad P1 G6 21FV001KUS | |
| Media Intel Core i7-14700HX (2378 - 2975, n=7) | |
| Lenovo ThinkPad P1 G6-21FV000DGE | |
| HP ZBook Power 16 G11 A | |
| Media della classe Workstation (2352 - 2949, n=23, ultimi 2 anni) | |
| Lenovo ThinkPad P16v G1 AMD | |
| Dell Precision 5690 | |
| Lenovo ThinkPad P16s G2 21K9000CGE | |
| Lenovo ThinkPad P1 Gen 7 21KV001SGE | |
Cinebench R23: Multi Core | Single Core
Cinebench R20: CPU (Multi Core) | CPU (Single Core)
Cinebench R15: CPU Multi 64Bit | CPU Single 64Bit
Blender: v2.79 BMW27 CPU
7-Zip 18.03: 7z b 4 | 7z b 4 -mmt1
Geekbench 6.4: Multi-Core | Single-Core
Geekbench 5.5: Multi-Core | Single-Core
HWBOT x265 Benchmark v2.2: 4k Preset
LibreOffice : 20 Documents To PDF
R Benchmark 2.5: Overall mean
* ... Meglio usare valori piccoli
AIDA64: FP32 Ray-Trace | FPU Julia | CPU SHA3 | CPU Queen | FPU SinJulia | FPU Mandel | CPU AES | CPU ZLib | FP64 Ray-Trace | CPU PhotoWorxx
| Performance Rating | |
| Lenovo ThinkPad P16 Gen 2 | |
| Media Intel Core i7-14700HX | |
| HP ZBook Power 16 G11 A | |
| Lenovo ThinkPad P16s G2 21K9000CGE | |
| Dell Precision 5690 | |
| Lenovo ThinkPad P16 G1 RTX A5500 | |
| Lenovo ThinkPad P16 G2 21FA000FGE | |
| AIDA64 / FP32 Ray-Trace | |
| HP ZBook Power 16 G11 A | |
| Lenovo ThinkPad P16s G2 21K9000CGE | |
| Media Intel Core i7-14700HX (16932 - 23676, n=7) | |
| Lenovo ThinkPad P16 Gen 2 | |
| Dell Precision 5690 | |
| Lenovo ThinkPad P16 G2 21FA000FGE | |
| Lenovo ThinkPad P16 G1 RTX A5500 | |
| AIDA64 / FPU Julia | |
| HP ZBook Power 16 G11 A | |
| Lenovo ThinkPad P16 Gen 2 | |
| Media Intel Core i7-14700HX (86338 - 116556, n=7) | |
| Lenovo ThinkPad P16s G2 21K9000CGE | |
| Dell Precision 5690 | |
| Lenovo ThinkPad P16 G2 21FA000FGE | |
| Lenovo ThinkPad P16 G1 RTX A5500 | |
| AIDA64 / CPU SHA3 | |
| Lenovo ThinkPad P16 Gen 2 | |
| Media Intel Core i7-14700HX (4008 - 5567, n=7) | |
| HP ZBook Power 16 G11 A | |
| Lenovo ThinkPad P16s G2 21K9000CGE | |
| Dell Precision 5690 | |
| Lenovo ThinkPad P16 G2 21FA000FGE | |
| Lenovo ThinkPad P16 G1 RTX A5500 | |
| AIDA64 / CPU Queen | |
| Lenovo ThinkPad P16 Gen 2 | |
| Media Intel Core i7-14700HX (129836 - 152200, n=7) | |
| HP ZBook Power 16 G11 A | |
| Lenovo ThinkPad P16 G2 21FA000FGE | |
| Lenovo ThinkPad P16 G1 RTX A5500 | |
| Lenovo ThinkPad P16s G2 21K9000CGE | |
| Dell Precision 5690 | |
| AIDA64 / FPU SinJulia | |
| HP ZBook Power 16 G11 A | |
| Lenovo ThinkPad P16s G2 21K9000CGE | |
| Lenovo ThinkPad P16 Gen 2 | |
| Media Intel Core i7-14700HX (11704 - 14434, n=7) | |
| Lenovo ThinkPad P16 G1 RTX A5500 | |
| Lenovo ThinkPad P16 G2 21FA000FGE | |
| Dell Precision 5690 | |
| AIDA64 / FPU Mandel | |
| HP ZBook Power 16 G11 A | |
| Lenovo ThinkPad P16s G2 21K9000CGE | |
| Lenovo ThinkPad P16 Gen 2 | |
| Media Intel Core i7-14700HX (42125 - 58380, n=7) | |
| Dell Precision 5690 | |
| Lenovo ThinkPad P16 G1 RTX A5500 | |
| Lenovo ThinkPad P16 G2 21FA000FGE | |
| AIDA64 / CPU AES | |
| Lenovo ThinkPad P16 Gen 2 | |
| Media Intel Core i7-14700HX (82161 - 113157, n=7) | |
| Dell Precision 5690 | |
| Lenovo ThinkPad P16 G2 21FA000FGE | |
| Lenovo ThinkPad P16 G1 RTX A5500 | |
| HP ZBook Power 16 G11 A | |
| Lenovo ThinkPad P16s G2 21K9000CGE | |
| AIDA64 / CPU ZLib | |
| Lenovo ThinkPad P16 Gen 2 | |
| Media Intel Core i7-14700HX (1177 - 1682, n=7) | |
| Dell Precision 5690 | |
| Lenovo ThinkPad P16 G1 RTX A5500 | |
| Lenovo ThinkPad P16 G2 21FA000FGE | |
| HP ZBook Power 16 G11 A | |
| Lenovo ThinkPad P16s G2 21K9000CGE | |
| AIDA64 / FP64 Ray-Trace | |
| HP ZBook Power 16 G11 A | |
| Lenovo ThinkPad P16s G2 21K9000CGE | |
| Media Intel Core i7-14700HX (9029 - 12928, n=7) | |
| Lenovo ThinkPad P16 Gen 2 | |
| Lenovo ThinkPad P16 G1 RTX A5500 | |
| Lenovo ThinkPad P16 G2 21FA000FGE | |
| Dell Precision 5690 | |
| AIDA64 / CPU PhotoWorxx | |
| Dell Precision 5690 | |
| Media Intel Core i7-14700HX (39151 - 49671, n=7) | |
| Lenovo ThinkPad P16 G1 RTX A5500 | |
| HP ZBook Power 16 G11 A | |
| Lenovo ThinkPad P16 Gen 2 | |
| Lenovo ThinkPad P16s G2 21K9000CGE | |
| Lenovo ThinkPad P16 G2 21FA000FGE | |
Test da sforzo
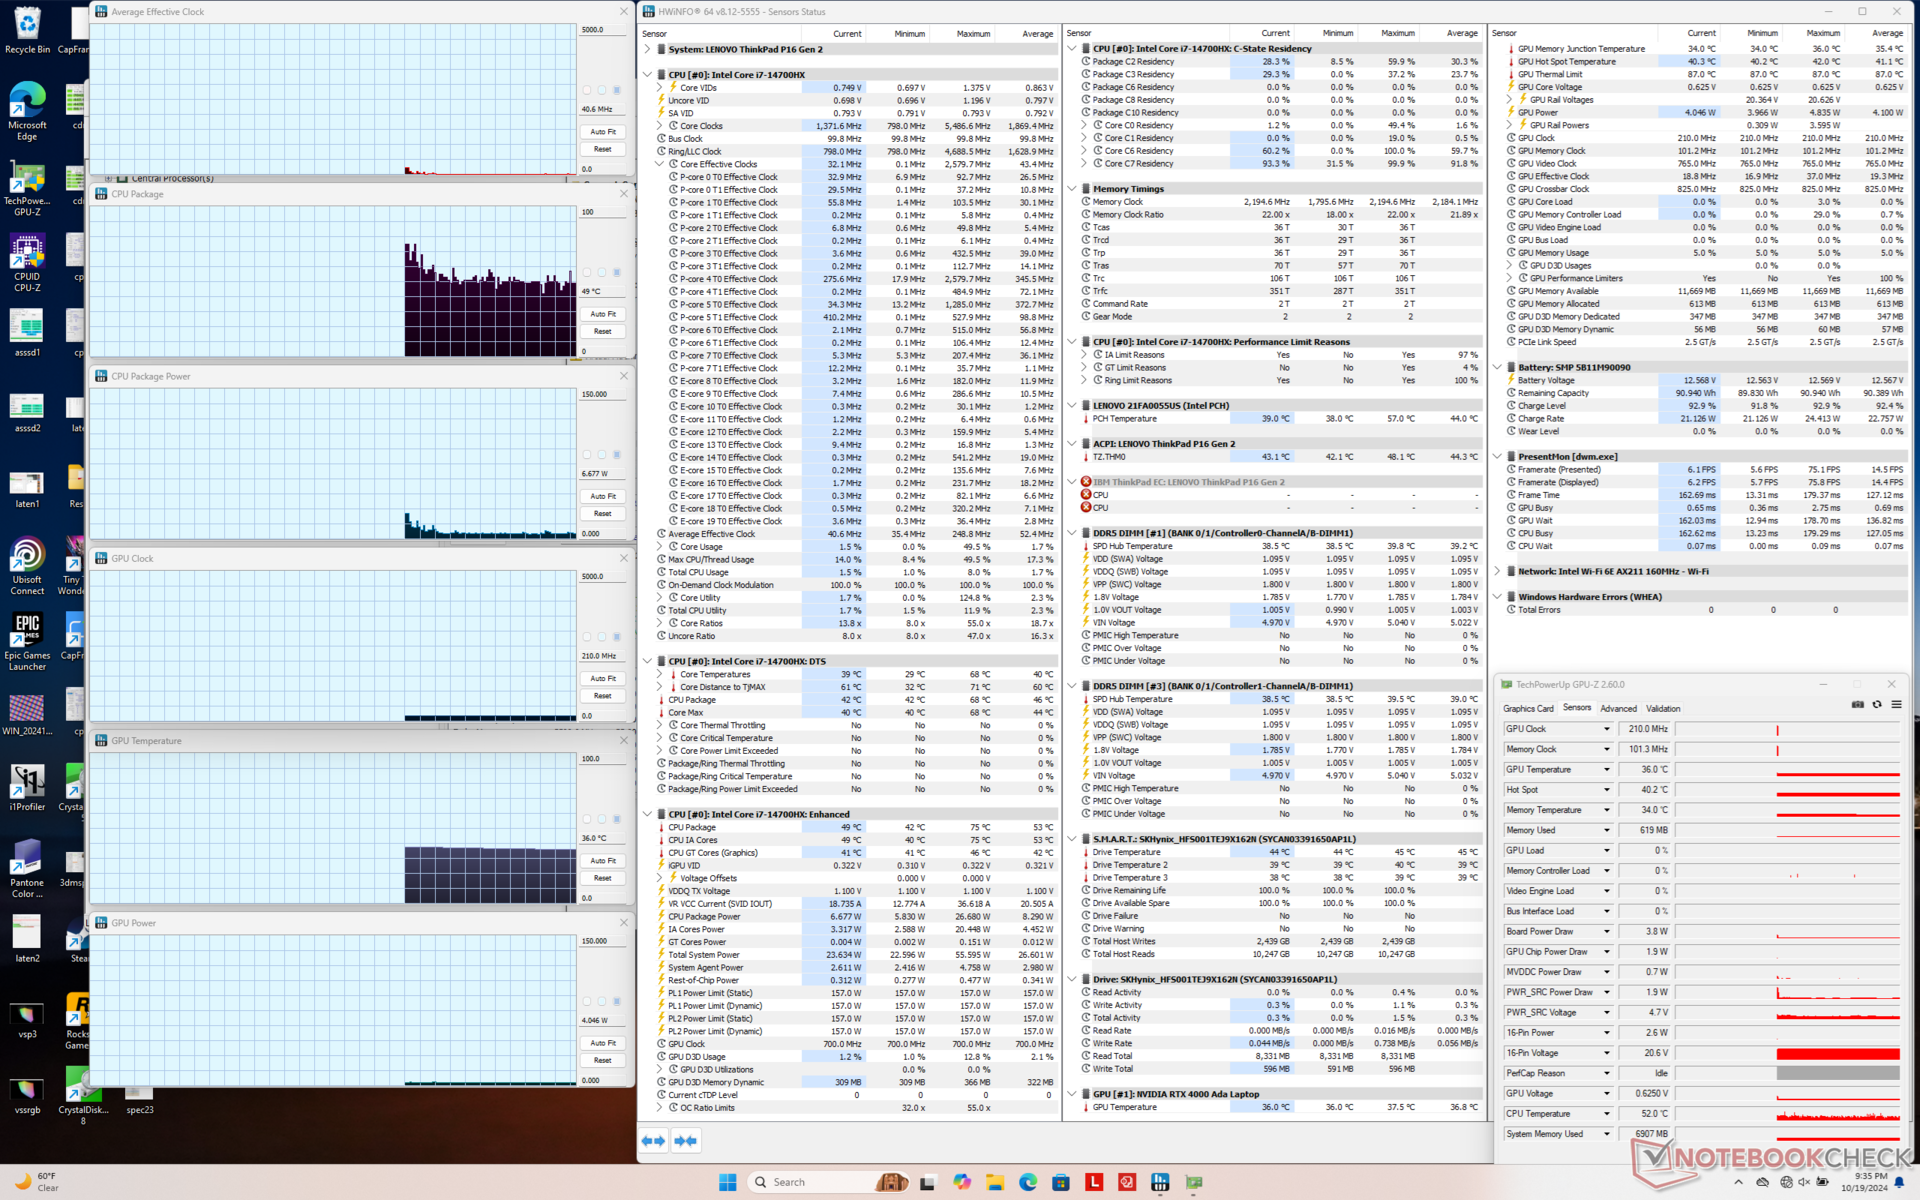
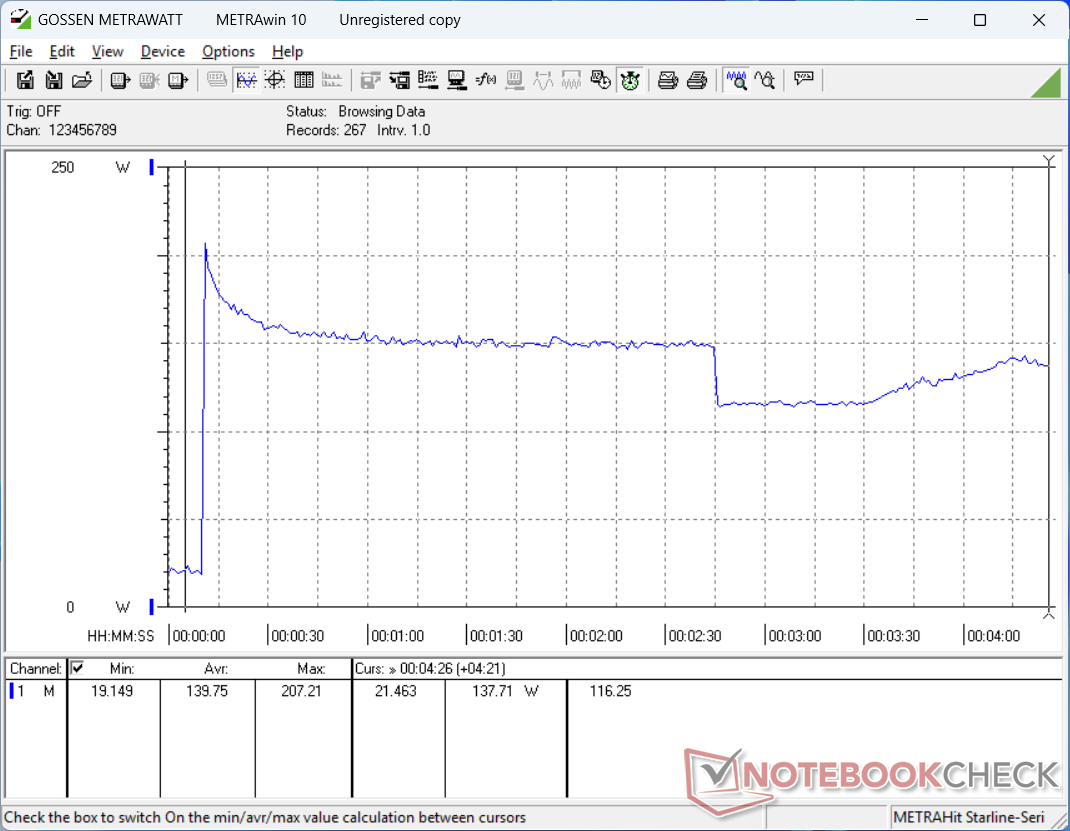
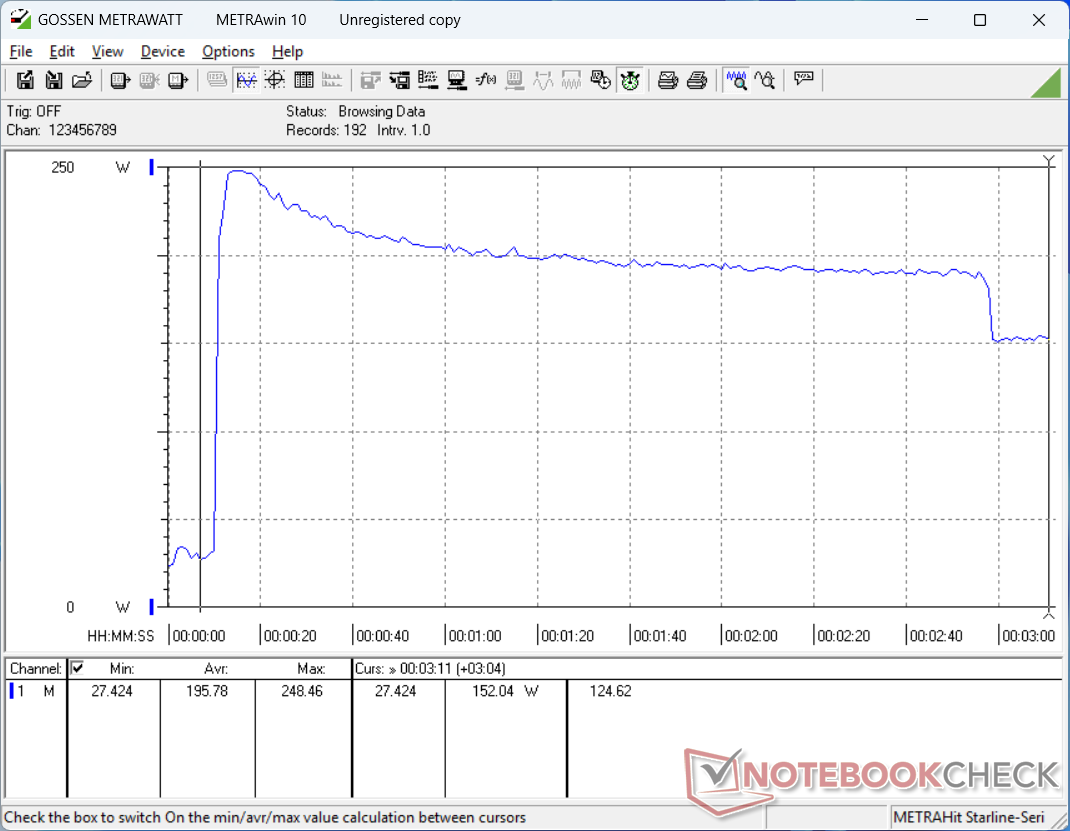
Le temperature del core sono piuttosto elevate quando il sistema è sottoposto a stress, il che porta a temperature superficiali molto calde, come indicato nella sezione Temperature qui sotto. Quando si esegue Prime95 o Cyberpunk 2077, ad esempio, la CPU raggiunge ben oltre 80 C e a volte anche 100 C. L'assorbimento di potenza del pacchetto e quindi la velocità di clock fluttuano tra 66 W e 90 W per mantenere le temperature sotto controllo, come mostrano i nostri screenshot qui sotto.
L'assorbimento di potenza della scheda GPU può raggiungere i 130 W come pubblicizzato quando si esegue Cyberpunk 2077 in modalità Performance. Tuttavia, la temperatura della GPU sarebbe relativamente alta, superiore a 85 C, e quindi i frame rate finiranno per diminuire in risposta, come menzionato nella nostra sezione sulle prestazioni della GPU. Il clock del core, il clock della memoria e l'assorbimento di potenza della scheda diminuiscono ulteriormente se si gioca in modalità Bilanciata.
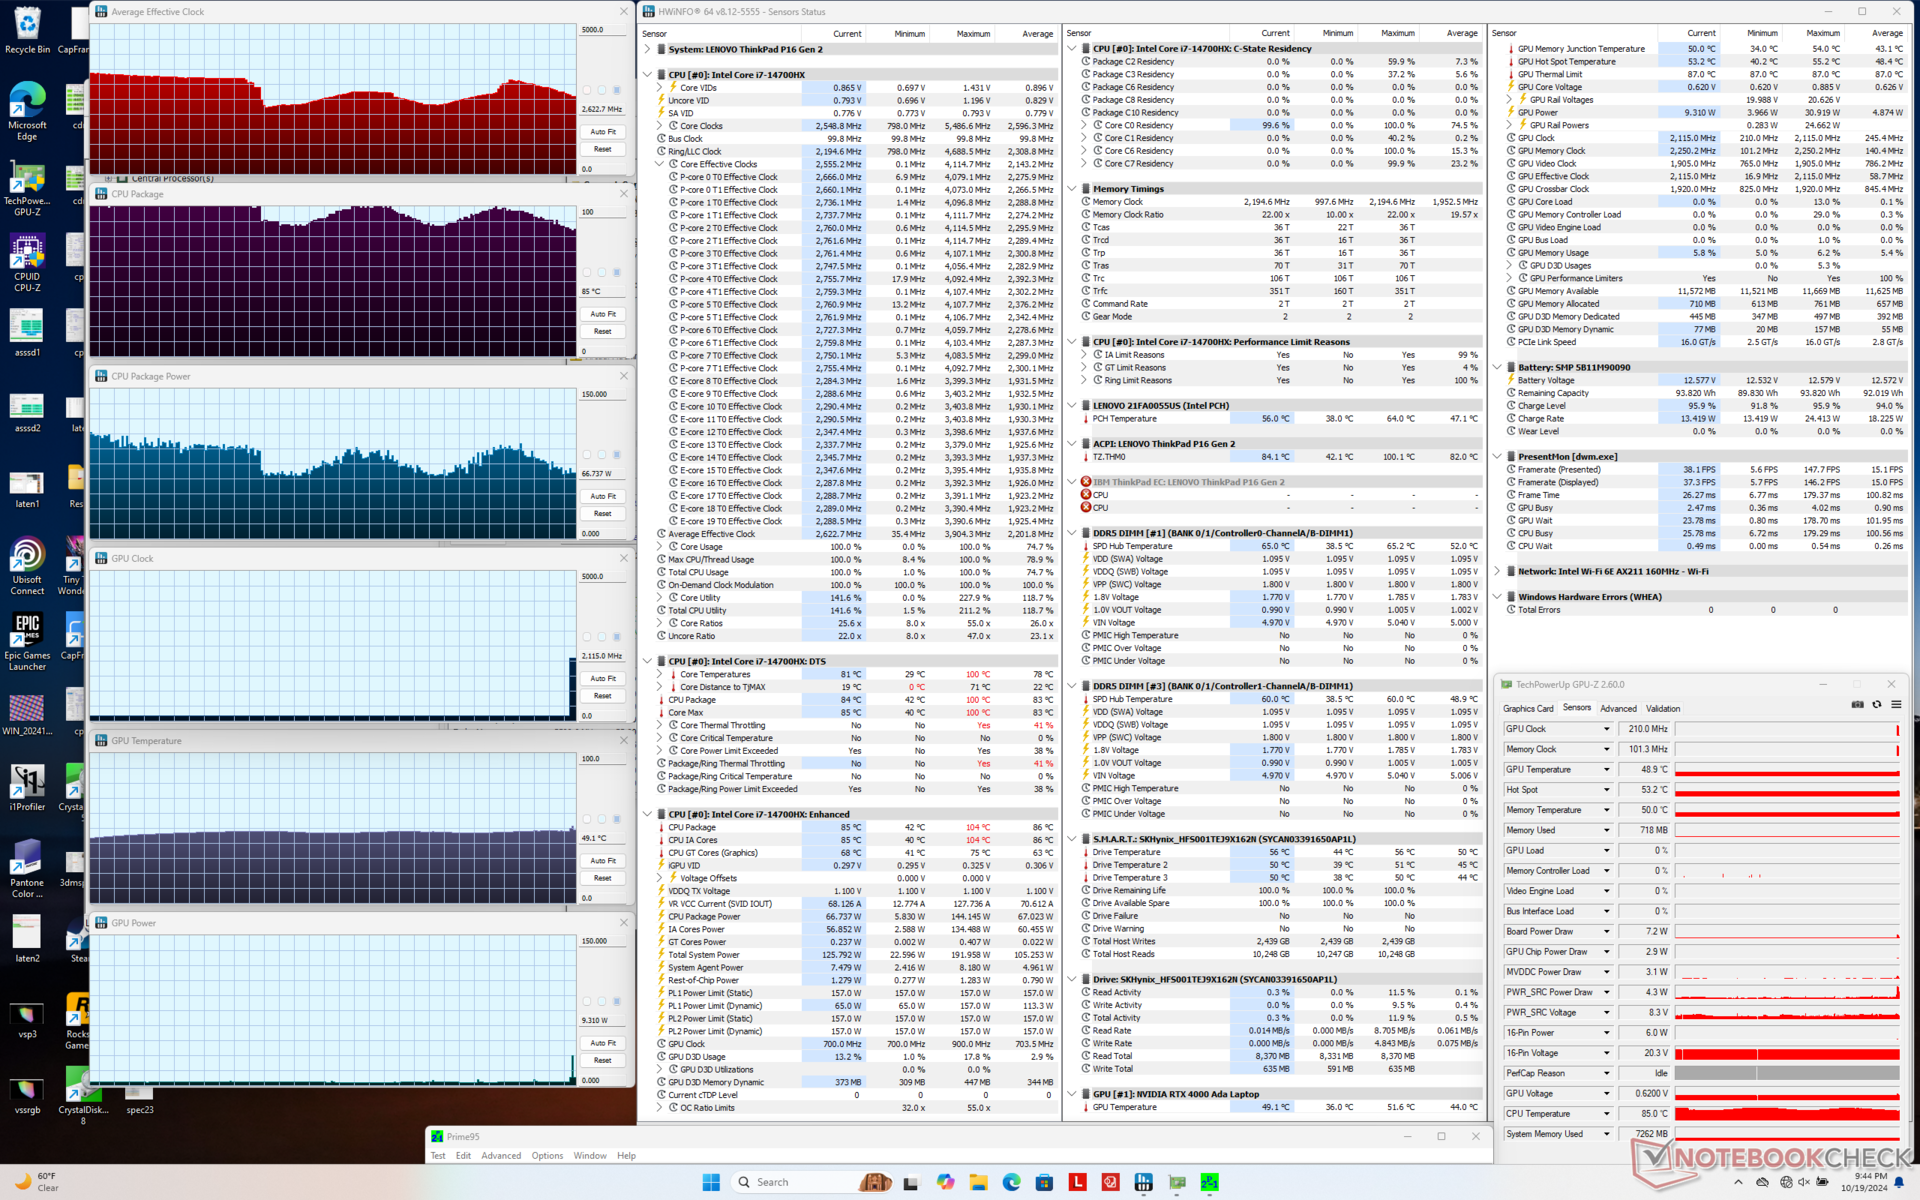
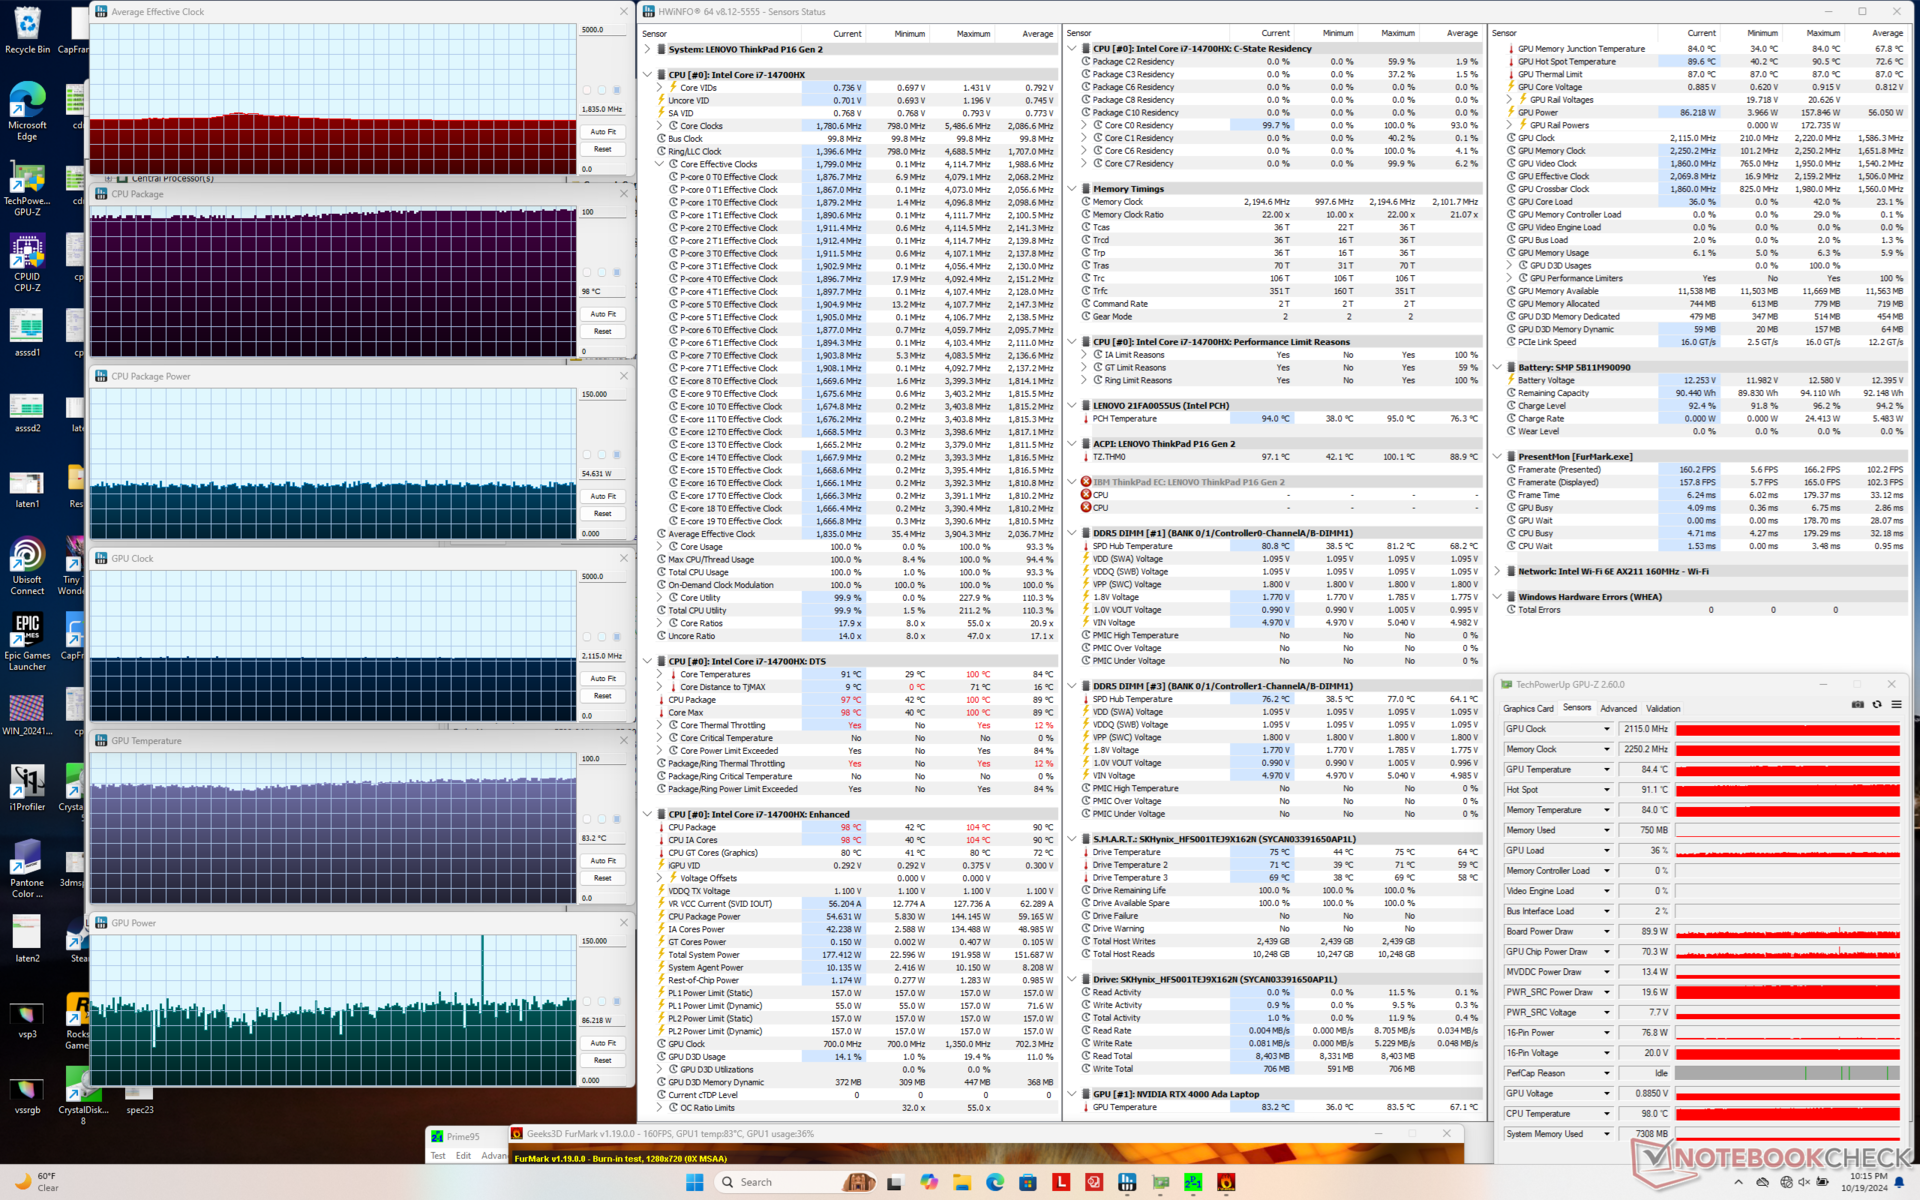
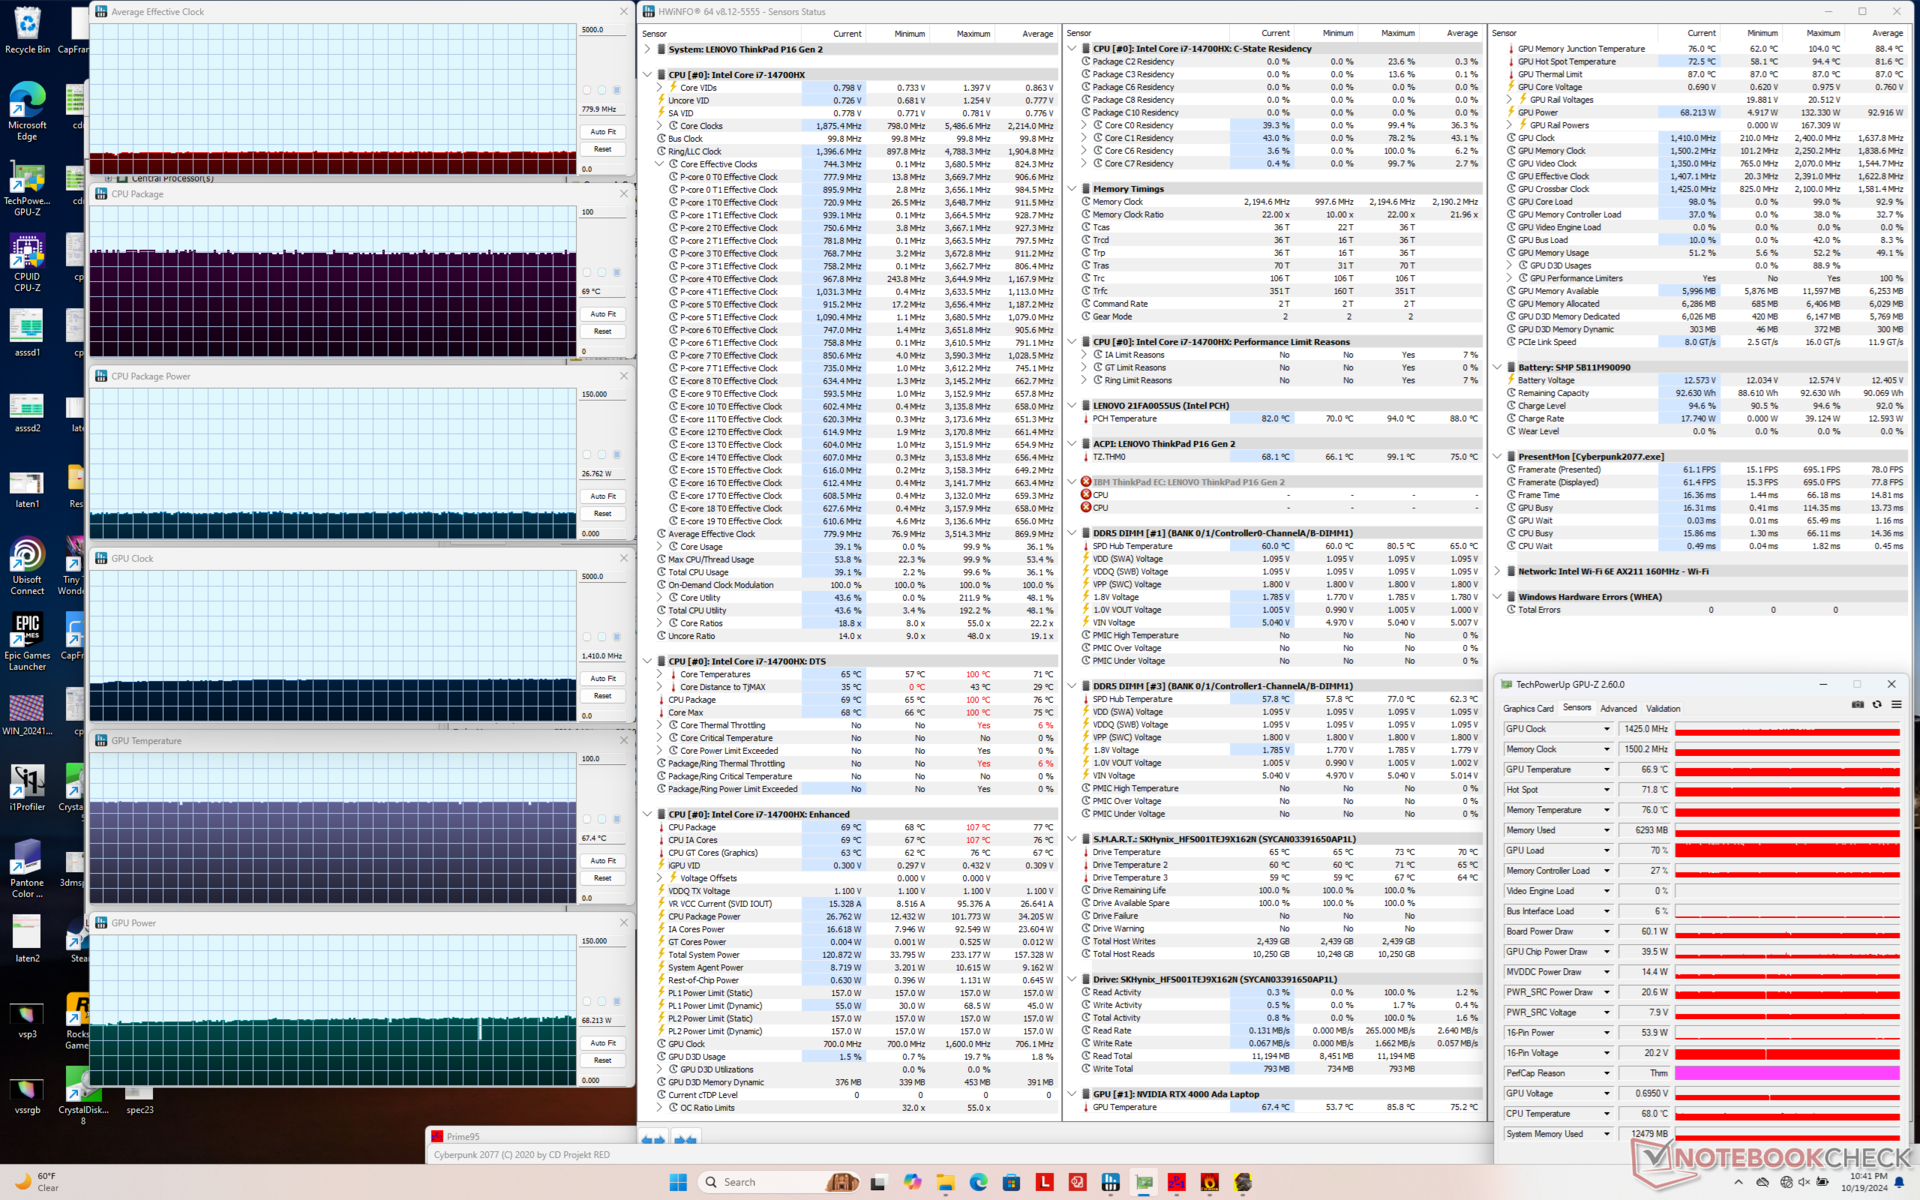
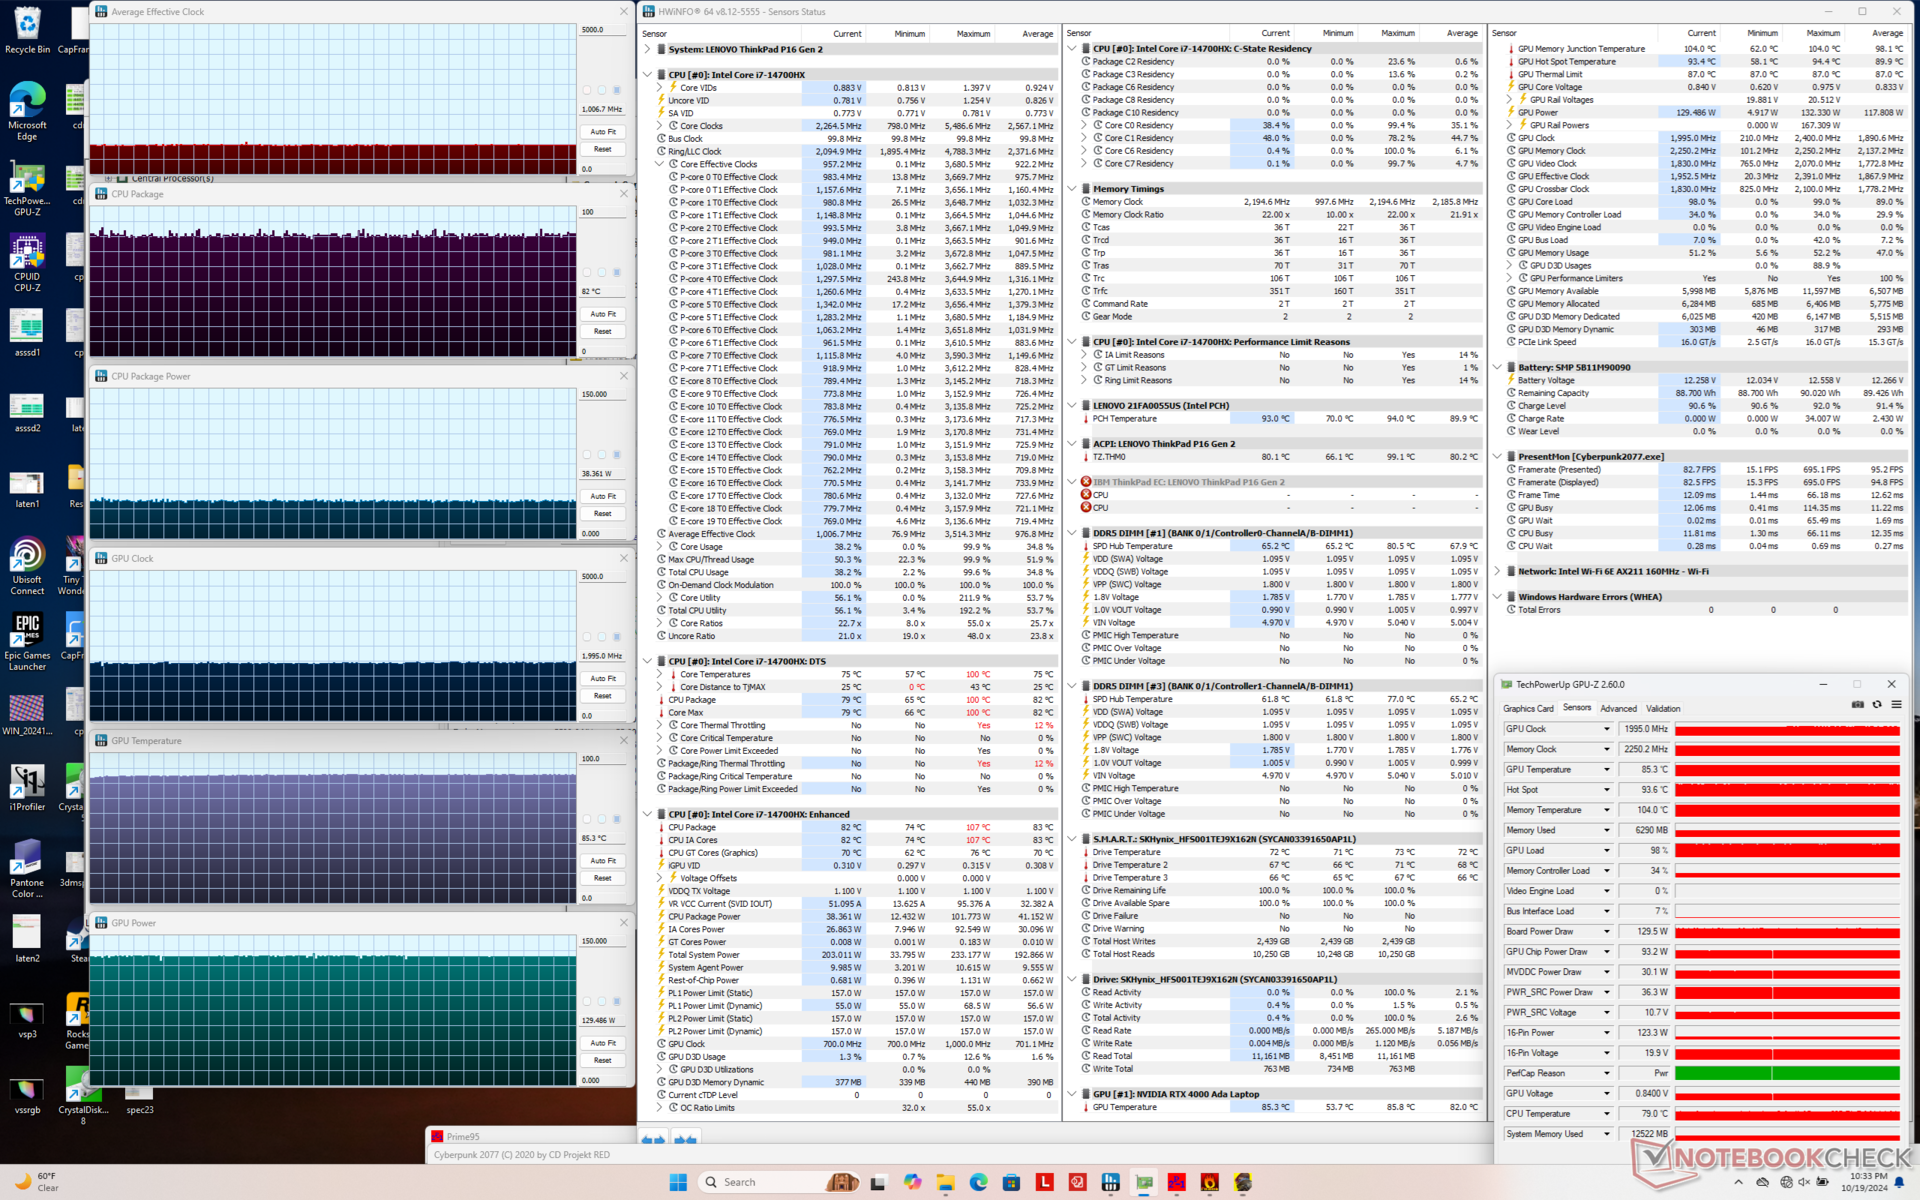
| Clock della CPU (GHz) | Clock della GPU (MHz) | Temperatura media della CPU (°C) | Temperatura media della GPU (°C) | |
| Sistema inattivo | -- | -- | 49 | 36 |
| Stress Prime95 | 2,6 - 3,1 | -- | 85 - 100 | 49 |
| Prime95 + FurMark Stress | 1,8 | 2115 | 98 | 83 |
| Cyberpunk 2077 Stress (modalità Bilanciata) | 0,8 | 1425 | 69 | 67 |
| Cyberpunk 2077 Stress (modalità Performance) | 1.0 | 1995 | 82 | 85 |
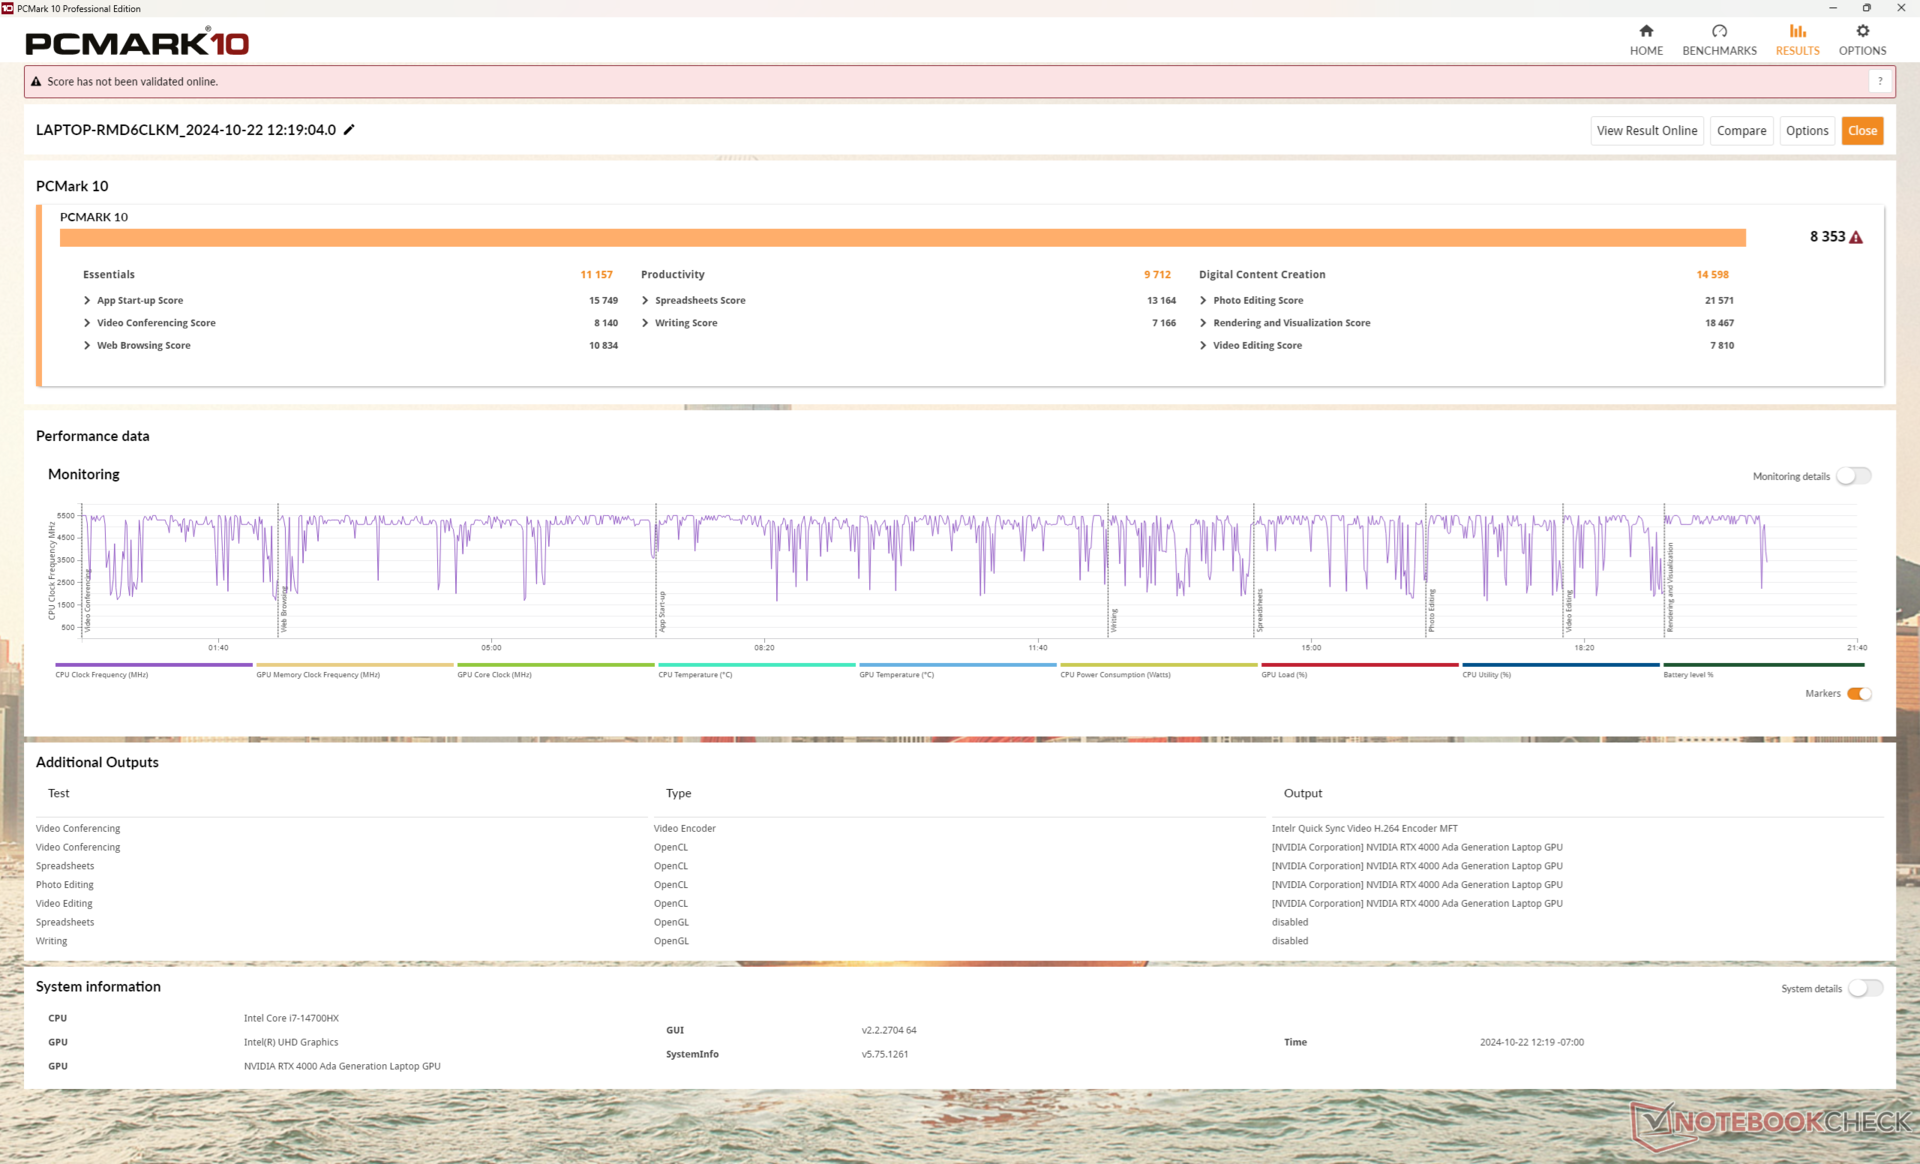
Prestazioni del sistema
CrossMark: Overall | Productivity | Creativity | Responsiveness
WebXPRT 3: Overall
WebXPRT 4: Overall
Mozilla Kraken 1.1: Total
| PCMark 10 / Score | |
| Lenovo ThinkPad P16 Gen 2 | |
| Media Intel Core i7-14700HX, NVIDIA RTX 4000 Ada Generation Laptop GPU (n=1) | |
| Dell Precision 5690 | |
| HP ZBook Power 16 G11 A | |
| Lenovo ThinkPad P16 G1 RTX A5500 | |
| Lenovo ThinkPad P16 G2 21FA000FGE | |
| Lenovo ThinkPad P16s G2 21K9000CGE | |
| PCMark 10 / Essentials | |
| Lenovo ThinkPad P16 Gen 2 | |
| Media Intel Core i7-14700HX, NVIDIA RTX 4000 Ada Generation Laptop GPU (n=1) | |
| Dell Precision 5690 | |
| Lenovo ThinkPad P16 G2 21FA000FGE | |
| Lenovo ThinkPad P16 G1 RTX A5500 | |
| HP ZBook Power 16 G11 A | |
| Lenovo ThinkPad P16s G2 21K9000CGE | |
| PCMark 10 / Productivity | |
| Dell Precision 5690 | |
| Lenovo ThinkPad P16 Gen 2 | |
| Media Intel Core i7-14700HX, NVIDIA RTX 4000 Ada Generation Laptop GPU (n=1) | |
| HP ZBook Power 16 G11 A | |
| Lenovo ThinkPad P16 G1 RTX A5500 | |
| Lenovo ThinkPad P16 G2 21FA000FGE | |
| Lenovo ThinkPad P16s G2 21K9000CGE | |
| PCMark 10 / Digital Content Creation | |
| Lenovo ThinkPad P16 Gen 2 | |
| Media Intel Core i7-14700HX, NVIDIA RTX 4000 Ada Generation Laptop GPU (n=1) | |
| Dell Precision 5690 | |
| HP ZBook Power 16 G11 A | |
| Lenovo ThinkPad P16 G1 RTX A5500 | |
| Lenovo ThinkPad P16 G2 21FA000FGE | |
| Lenovo ThinkPad P16s G2 21K9000CGE | |
| CrossMark / Overall | |
| Lenovo ThinkPad P16 Gen 2 | |
| Media Intel Core i7-14700HX, NVIDIA RTX 4000 Ada Generation Laptop GPU (n=1) | |
| Lenovo ThinkPad P16 G1 RTX A5500 | |
| Lenovo ThinkPad P16 G2 21FA000FGE | |
| Dell Precision 5690 | |
| HP ZBook Power 16 G11 A | |
| Lenovo ThinkPad P16s G2 21K9000CGE | |
| CrossMark / Productivity | |
| Lenovo ThinkPad P16 Gen 2 | |
| Media Intel Core i7-14700HX, NVIDIA RTX 4000 Ada Generation Laptop GPU (n=1) | |
| Lenovo ThinkPad P16 G1 RTX A5500 | |
| Dell Precision 5690 | |
| Lenovo ThinkPad P16 G2 21FA000FGE | |
| HP ZBook Power 16 G11 A | |
| Lenovo ThinkPad P16s G2 21K9000CGE | |
| CrossMark / Creativity | |
| Lenovo ThinkPad P16 Gen 2 | |
| Media Intel Core i7-14700HX, NVIDIA RTX 4000 Ada Generation Laptop GPU (n=1) | |
| Lenovo ThinkPad P16 G1 RTX A5500 | |
| Lenovo ThinkPad P16 G2 21FA000FGE | |
| HP ZBook Power 16 G11 A | |
| Dell Precision 5690 | |
| Lenovo ThinkPad P16s G2 21K9000CGE | |
| CrossMark / Responsiveness | |
| Lenovo ThinkPad P16 Gen 2 | |
| Media Intel Core i7-14700HX, NVIDIA RTX 4000 Ada Generation Laptop GPU (n=1) | |
| Dell Precision 5690 | |
| Lenovo ThinkPad P16 G1 RTX A5500 | |
| Lenovo ThinkPad P16 G2 21FA000FGE | |
| HP ZBook Power 16 G11 A | |
| Lenovo ThinkPad P16s G2 21K9000CGE | |
| WebXPRT 3 / Overall | |
| Lenovo ThinkPad P16 Gen 2 | |
| Media Intel Core i7-14700HX, NVIDIA RTX 4000 Ada Generation Laptop GPU (n=1) | |
| Lenovo ThinkPad P16 G2 21FA000FGE | |
| Lenovo ThinkPad P16 G1 RTX A5500 | |
| HP ZBook Power 16 G11 A | |
| Dell Precision 5690 | |
| Lenovo ThinkPad P16s G2 21K9000CGE | |
| WebXPRT 4 / Overall | |
| Lenovo ThinkPad P16 Gen 2 | |
| Media Intel Core i7-14700HX, NVIDIA RTX 4000 Ada Generation Laptop GPU (n=1) | |
| Lenovo ThinkPad P16 G1 RTX A5500 | |
| Dell Precision 5690 | |
| HP ZBook Power 16 G11 A | |
| Mozilla Kraken 1.1 / Total | |
| Lenovo ThinkPad P16s G2 21K9000CGE | |
| HP ZBook Power 16 G11 A | |
| Dell Precision 5690 | |
| Lenovo ThinkPad P16 G1 RTX A5500 | |
| Lenovo ThinkPad P16 G2 21FA000FGE | |
| Lenovo ThinkPad P16 Gen 2 | |
| Media Intel Core i7-14700HX, NVIDIA RTX 4000 Ada Generation Laptop GPU (n=1) | |
* ... Meglio usare valori piccoli
| PCMark 10 Score | 8353 punti | |
Aiuto | ||
| AIDA64 / Memory Copy | |
| Dell Precision 5690 | |
| Media Intel Core i7-14700HX (63949 - 78742, n=7) | |
| Lenovo ThinkPad P16s G2 21K9000CGE | |
| Lenovo ThinkPad P16 Gen 2 | |
| Lenovo ThinkPad P16 G1 RTX A5500 | |
| HP ZBook Power 16 G11 A | |
| Lenovo ThinkPad P16 G2 21FA000FGE | |
| AIDA64 / Memory Read | |
| Dell Precision 5690 | |
| Media Intel Core i7-14700HX (68593 - 86175, n=7) | |
| Lenovo ThinkPad P16 Gen 2 | |
| Lenovo ThinkPad P16 G1 RTX A5500 | |
| HP ZBook Power 16 G11 A | |
| Lenovo ThinkPad P16 G2 21FA000FGE | |
| Lenovo ThinkPad P16s G2 21K9000CGE | |
| AIDA64 / Memory Write | |
| Lenovo ThinkPad P16s G2 21K9000CGE | |
| HP ZBook Power 16 G11 A | |
| Dell Precision 5690 | |
| Media Intel Core i7-14700HX (64033 - 76689, n=7) | |
| Lenovo ThinkPad P16 Gen 2 | |
| Lenovo ThinkPad P16 G1 RTX A5500 | |
| Lenovo ThinkPad P16 G2 21FA000FGE | |
| AIDA64 / Memory Latency | |
| Dell Precision 5690 | |
| Lenovo ThinkPad P16s G2 21K9000CGE | |
| Lenovo ThinkPad P16 G2 21FA000FGE | |
| HP ZBook Power 16 G11 A | |
| Lenovo ThinkPad P16 Gen 2 | |
| Lenovo ThinkPad P16 G1 RTX A5500 | |
| Media Intel Core i7-14700HX (82.7 - 96.4, n=7) | |
* ... Meglio usare valori piccoli
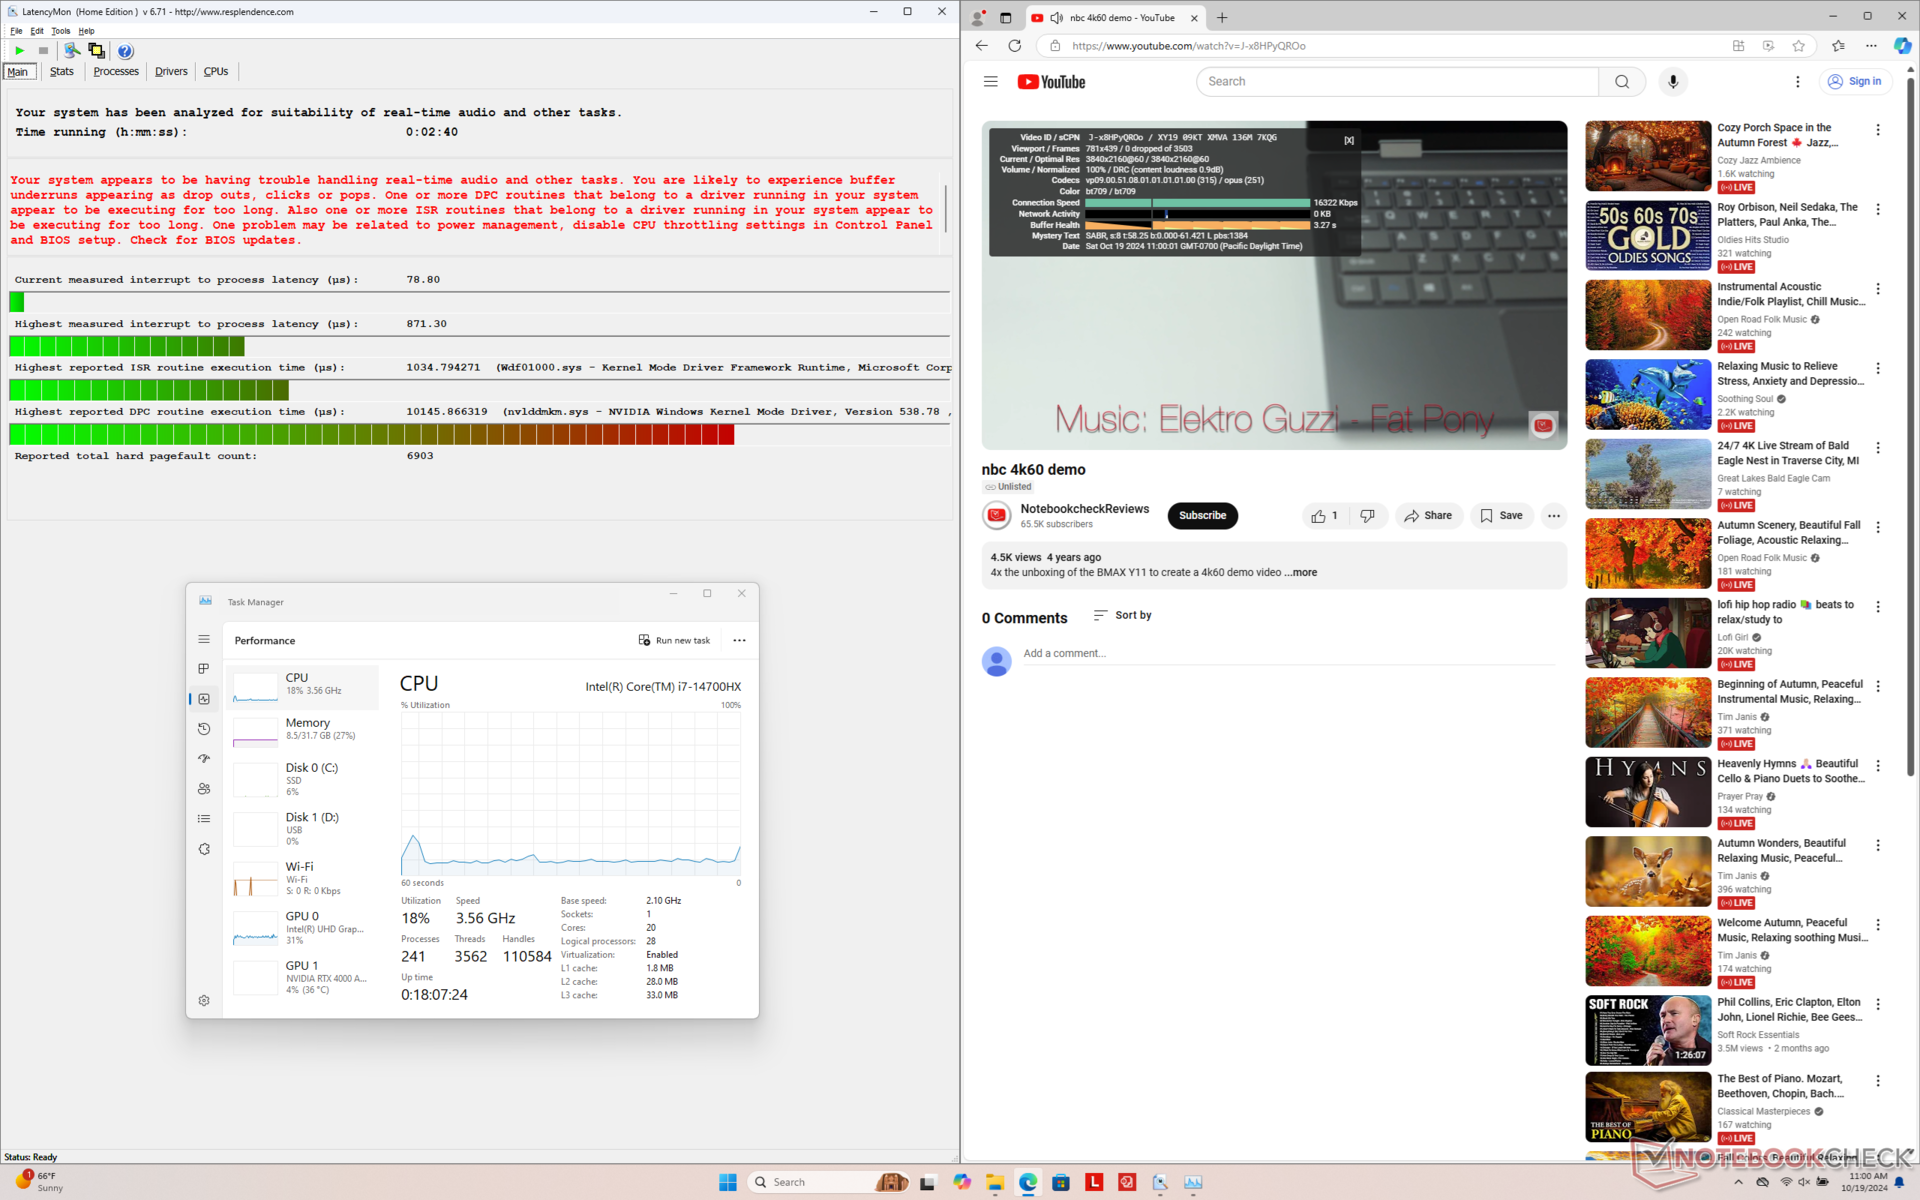
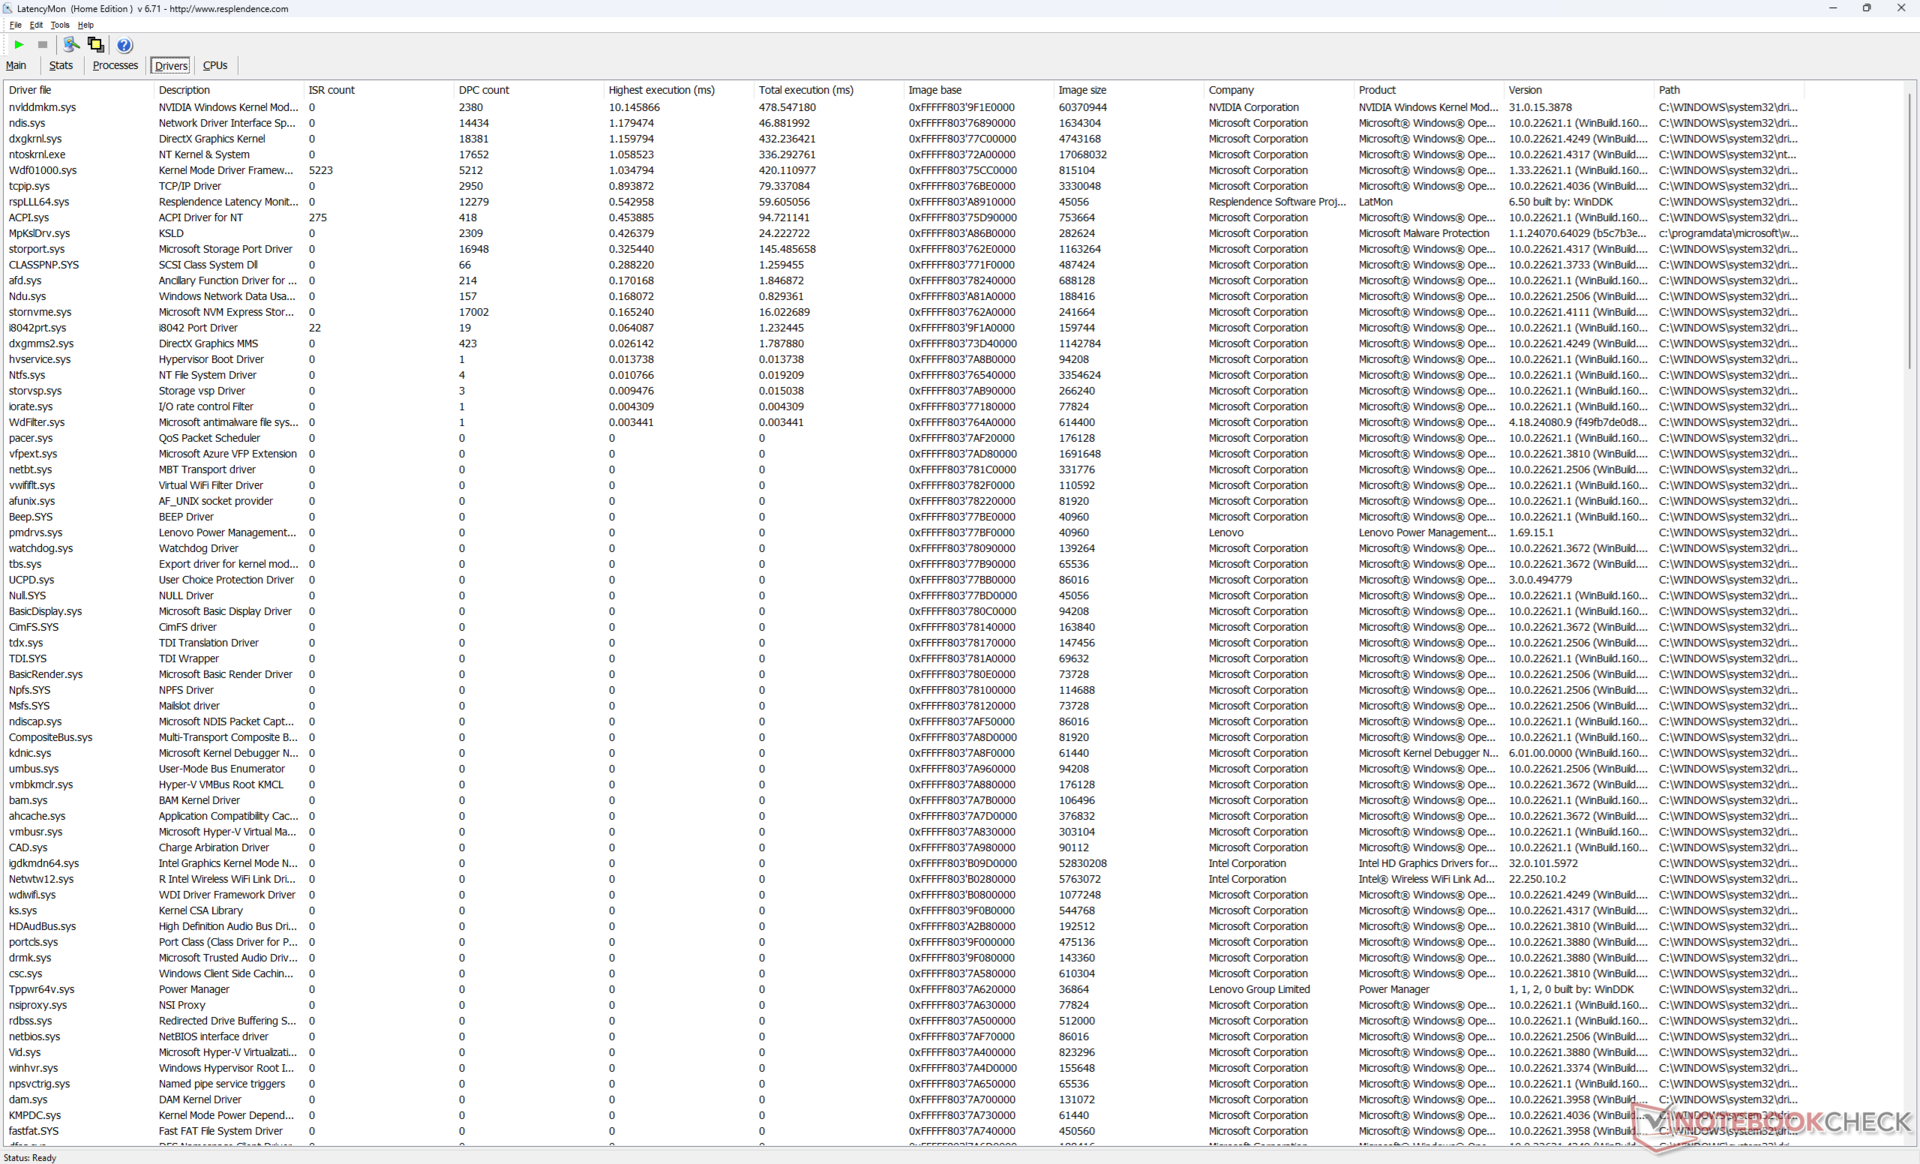
Latenza DPC
LatencyMon rivela lievi problemi di DPC quando si aprono più schede del browser della nostra homepage. la riproduzione di video 4K a 60 FPS è invece perfetta, senza alcuna perdita di fotogrammi.
| DPC Latencies / LatencyMon - interrupt to process latency (max), Web, Youtube, Prime95 | |
| HP ZBook Power 16 G11 A | |
| Lenovo ThinkPad P16 G1 RTX A5500 | |
| Lenovo ThinkPad P16s G2 21K9000CGE | |
| Lenovo ThinkPad P16 G2 21FA000FGE | |
| Lenovo ThinkPad P16 Gen 2 | |
| Dell Precision 5690 | |
* ... Meglio usare valori piccoli
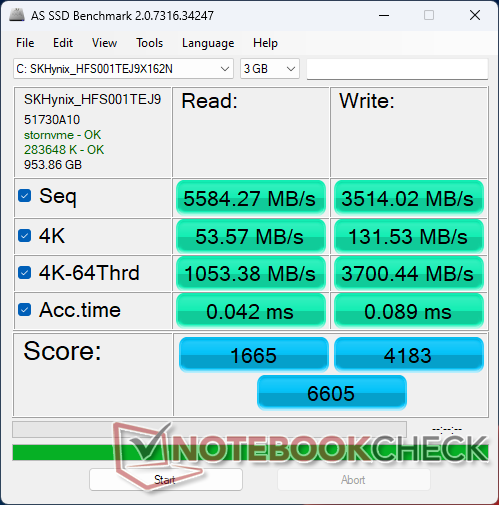
Dispositivi di archiviazione
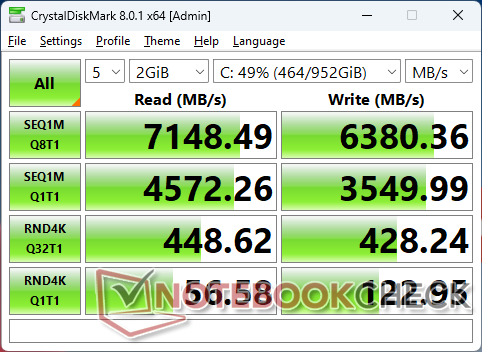
Non sono stati osservati cambiamenti nelle opzioni di archiviazione o nelle prestazioni dell'SSD tra le nostre due unità di test ThinkPad P16 Gen 2.

* ... Meglio usare valori piccoli
Disk Throttling: DiskSpd Read Loop, Queue Depth 8
Prestazioni della GPU
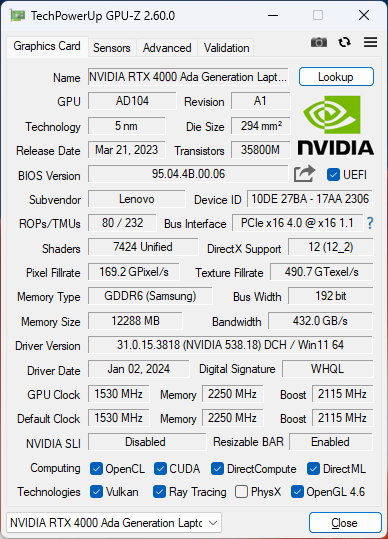
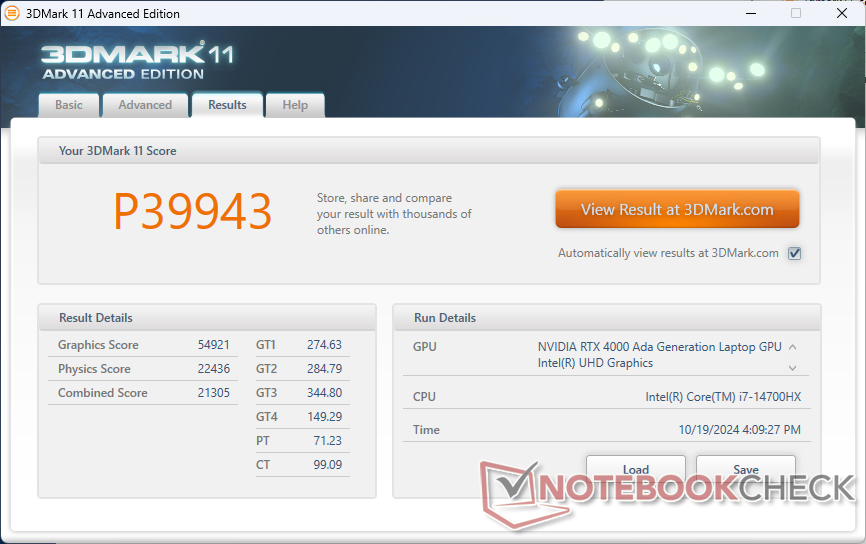
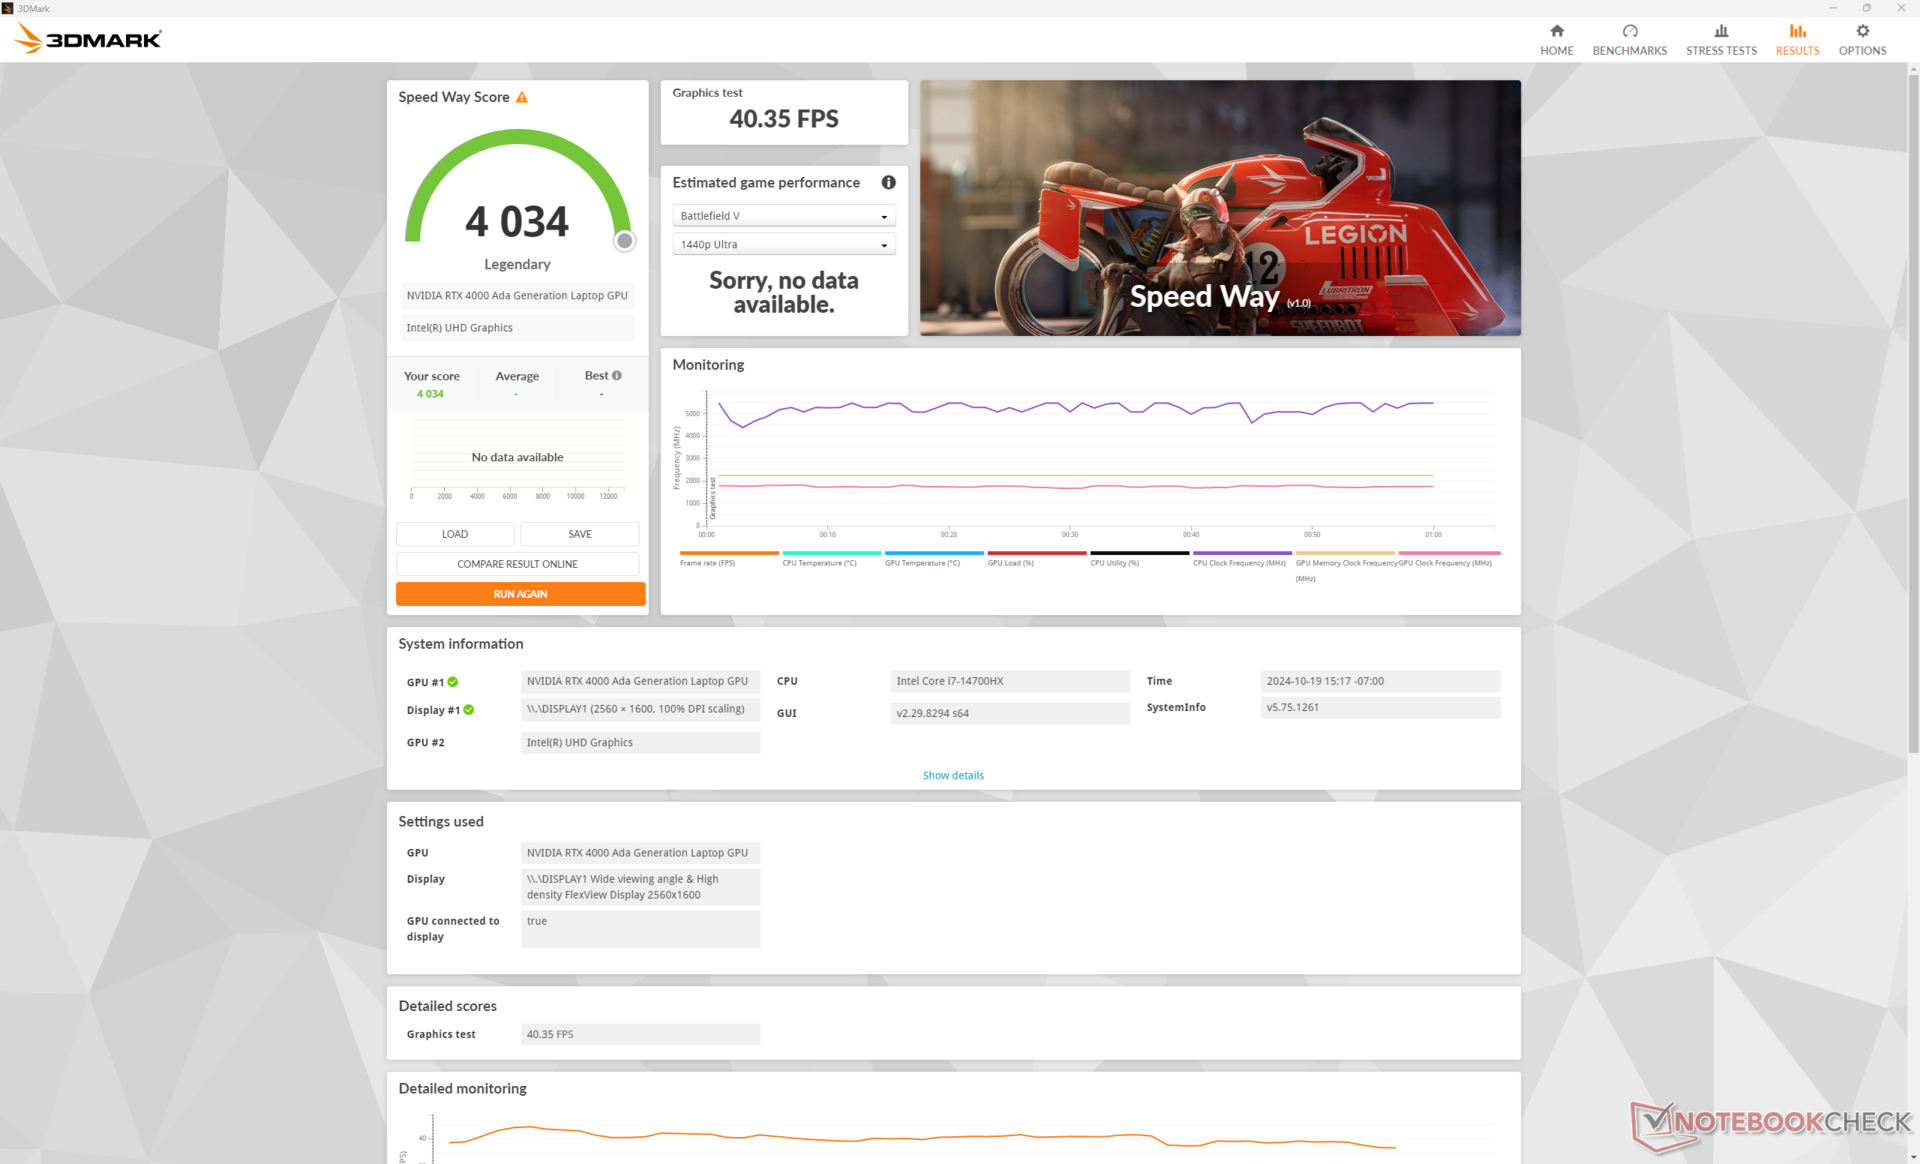
La 130 W RTX 4000 Ada nel nostro Lenovo è molto potente per una GPU mobile, battendo persino la 95 W RTX 5000 Ada di Precision 5690 con margini notevoli. i risultati di 3DMark, ad esempio, sono superiori tra il 10 e il 40% e risultati simili si possono ottenere eseguendo SpecViewPerf.
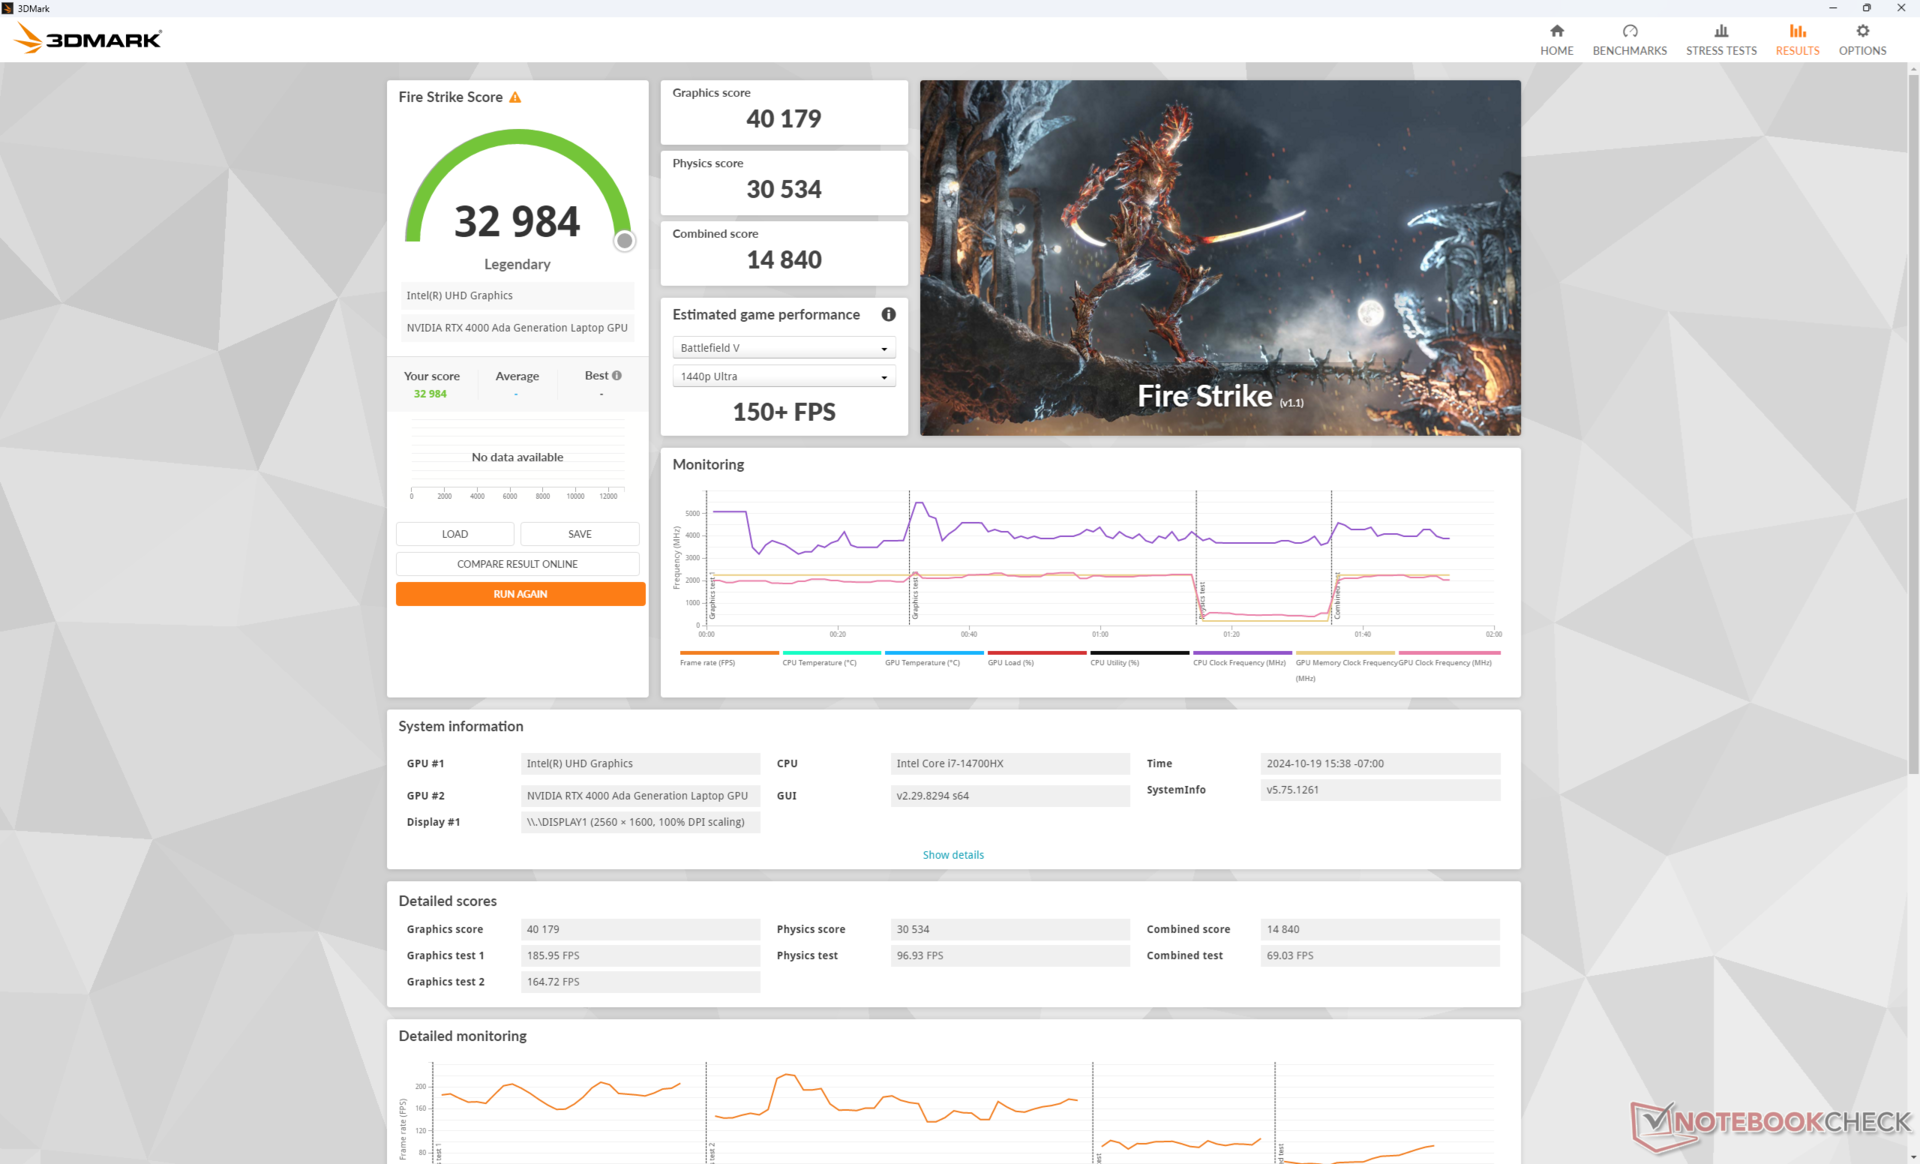
| Profilo di potenza | Punteggio grafico | Punteggio Fisica | Punteggio combinato |
| Modalità Prestazioni | 40179 | 30534 | 14840 |
| Modalità equilibrata | 32889 (-18%) | 29923 (-2%) | 13007 (-12%) |
| Modalità Batteria | 23401 (-42%) | 27793 (-9%) | 8510 (-42%) |
Scendere alla modalità Bilanciata dalla modalità Prestazioni influisce sulle prestazioni grafiche in modo piuttosto significativo, come mostra la nostra tabella dei risultati Fire Strike qui sopra.

| 3DMark Performance Rating - Percent | |
| Lenovo ThinkPad P16 Gen 2 -3! | |
| Media NVIDIA RTX 4000 Ada Generation Laptop GPU -3! | |
| Dell Precision 5690 -3! | |
| HP ZBook Fury 16 G11 | |
| HP ZBook Fury 16 G9 -3! | |
| Dell Precision 5000 5490 -3! | |
| MSI CreatorPro Z16P B12UKST -19! | |
| HP ZBook Power 15 G10 -11! | |
| Asus ExpertBook B6 Flip B6602FC2 -19! | |
| Lenovo ThinkPad P16v G1 AMD -18! | |
| Lenovo ThinkPad P1 G4-20Y4Z9DVUS -19! | |
| Lenovo ThinkPad P16s G2 21K9000CGE -19! | |
| HP ZBook Firefly 16 G9-6B897EA -19! | |
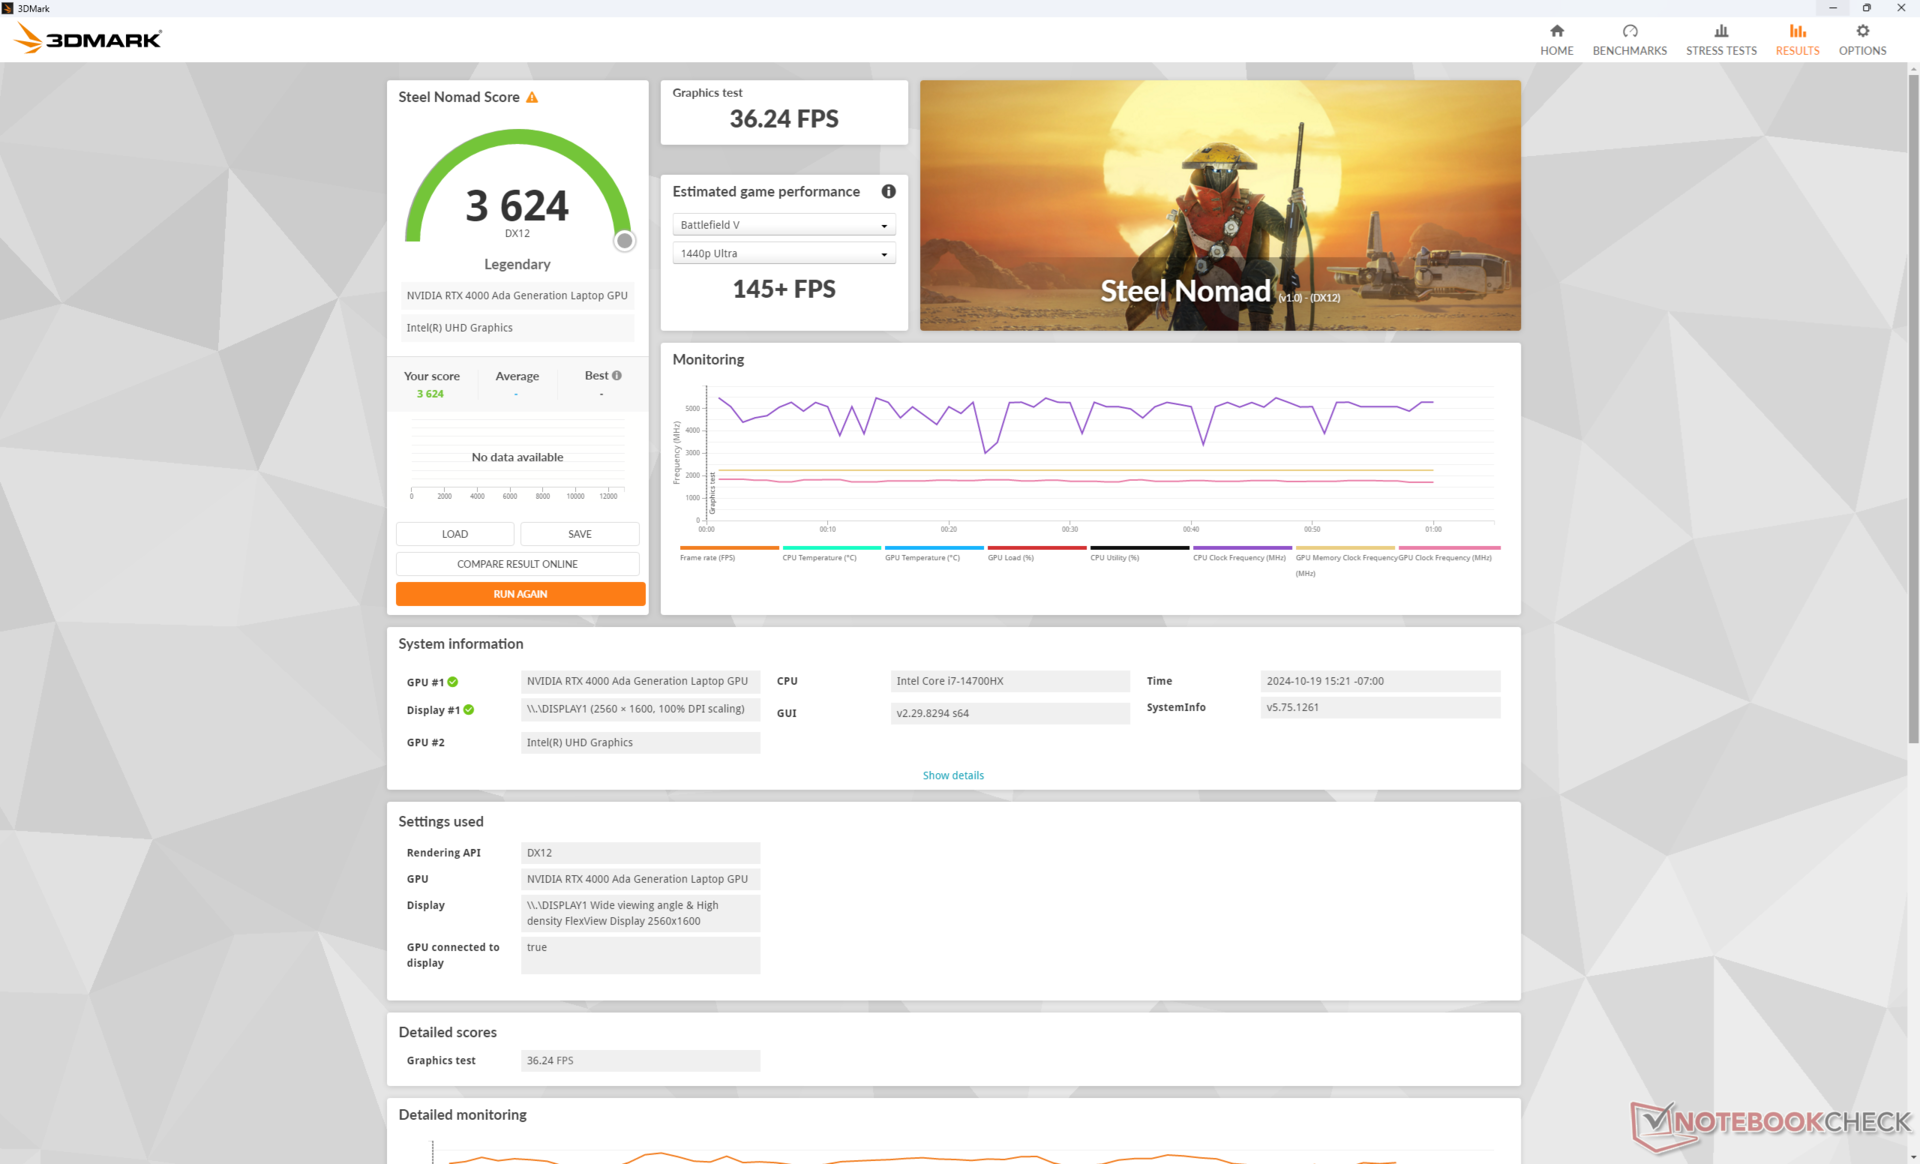
| 3DMark 11 Performance | 39943 punti | |
| 3DMark Cloud Gate Standard Score | 61459 punti | |
| 3DMark Fire Strike Score | 32984 punti | |
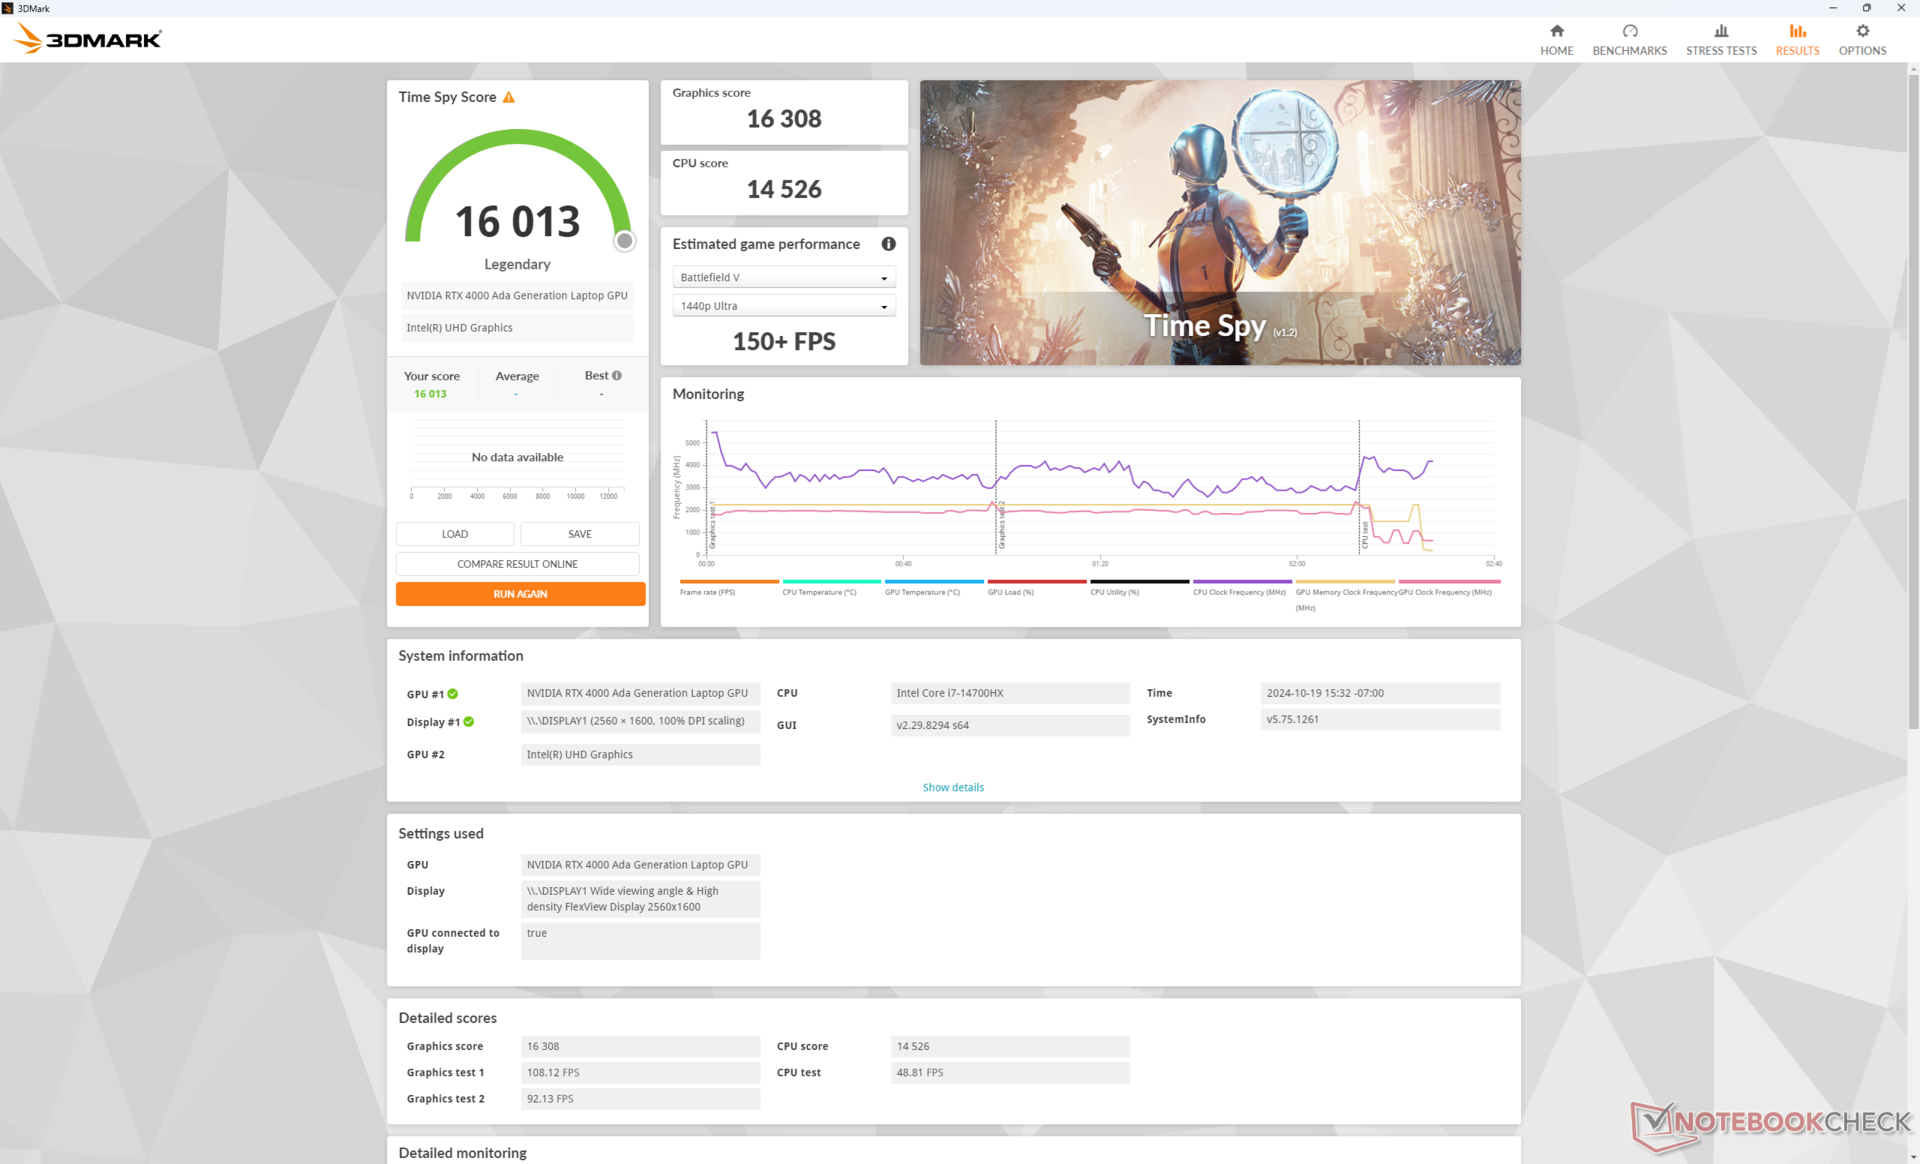
| 3DMark Time Spy Score | 16013 punti | |
| 3DMark Steel Nomad Score | 3624 punti | |
Aiuto | ||
* ... Meglio usare valori piccoli
Prestazioni di gioco
Anche se non è ottimizzata per il gioco, la RTX 4000 Ada è comunque una centrale elettrica, soprattutto se si considera il suo tetto di 130 W TGP. Le prestazioni di gioco sono molto simili a quelle di un computer portatile di fascia alta che utilizza la scheda mobile GeForce RTX 4080.
| Performance Rating - Percent | |
| Lenovo ThinkPad P16 Gen 2 | |
| Dell Precision 5690 -1! | |
| Lenovo ThinkPad P16 G1 RTX A5500 -1! | |
| Lenovo ThinkPad P16 G2 21FA000FGE -1! | |
| HP ZBook Power 16 G11 A | |
| Lenovo ThinkPad P16s G2 21K9000CGE -1! | |
| Baldur's Gate 3 - 1920x1080 Ultra Preset | |
| Lenovo ThinkPad P16 Gen 2 | |
| Dell Precision 5690 | |
| HP ZBook Power 16 G11 A | |
| GTA V - 1920x1080 Highest Settings possible AA:4xMSAA + FX AF:16x | |
| Lenovo ThinkPad P16 Gen 2 | |
| Lenovo ThinkPad P16 G1 RTX A5500 | |
| Lenovo ThinkPad P16 G2 21FA000FGE | |
| HP ZBook Power 16 G11 A | |
| Lenovo ThinkPad P16s G2 21K9000CGE | |
| Final Fantasy XV Benchmark - 1920x1080 High Quality | |
| Lenovo ThinkPad P16 Gen 2 | |
| Dell Precision 5690 | |
| Lenovo ThinkPad P16 G1 RTX A5500 | |
| Lenovo ThinkPad P16 G2 21FA000FGE | |
| HP ZBook Power 16 G11 A | |
| Lenovo ThinkPad P16s G2 21K9000CGE | |
| Strange Brigade - 1920x1080 ultra AA:ultra AF:16 | |
| Lenovo ThinkPad P16 Gen 2 | |
| Dell Precision 5690 | |
| Lenovo ThinkPad P16 G1 RTX A5500 | |
| Lenovo ThinkPad P16 G2 21FA000FGE | |
| HP ZBook Power 16 G11 A | |
| Lenovo ThinkPad P16s G2 21K9000CGE | |
| Dota 2 Reborn - 1920x1080 ultra (3/3) best looking | |
| Lenovo ThinkPad P16 Gen 2 | |
| Lenovo ThinkPad P16 G1 RTX A5500 | |
| Lenovo ThinkPad P16 G2 21FA000FGE | |
| Dell Precision 5690 | |
| HP ZBook Power 16 G11 A | |
| Lenovo ThinkPad P16s G2 21K9000CGE | |
| Cyberpunk 2077 2.2 Phantom Liberty | |
| 1920x1080 High Preset (FSR off) | |
| Lenovo ThinkPad P16 Gen 2 | |
| Media NVIDIA RTX 4000 Ada Generation Laptop GPU (n=1) | |
| HP ZBook Fury 16 G11 | |
| Dell Precision 5690 | |
| Dell Precision 5000 5490 | |
| HP ZBook Power 15 G10 | |
| Lenovo ThinkPad P16v G1 AMD | |
| 1920x1080 Ultra Preset (FSR off) | |
| Dell Precision 5690 | |
| Lenovo ThinkPad P16 Gen 2 | |
| Media NVIDIA RTX 4000 Ada Generation Laptop GPU (n=1) | |
| HP ZBook Fury 16 G11 | |
| Dell Precision 5000 5490 | |
| HP ZBook Power 15 G10 | |
| Lenovo ThinkPad P16v G1 AMD | |
| 2560x1440 Ultra Preset (FSR off) | |
| Lenovo ThinkPad P16 Gen 2 | |
| Media NVIDIA RTX 4000 Ada Generation Laptop GPU (n=1) | |
| Dell Precision 5690 | |
| HP ZBook Fury 16 G11 | |
| HP ZBook Power 15 G10 | |
Purtroppo, c'è una leggera perdita di prestazioni quando si esegue Cyberpunk 2077. I tassi di frame passano da ~103 a ~96 dopo pochi minuti di inattività nel gioco e i risultati non migliorano dopo aver ripetuto il test. Questo suggerisce che la GPU avrebbe potuto beneficiare di una soluzione di raffreddamento più performante.
Cyberpunk 2077 ultra FPS Chart
| basso | medio | alto | ultra | QHD | |
|---|---|---|---|---|---|
| GTA V (2015) | 185.8 | 183.9 | 179.4 | 125.6 | 118.7 |
| Dota 2 Reborn (2015) | 215.4 | 189.7 | 185.2 | 164.4 | |
| Final Fantasy XV Benchmark (2018) | 207 | 185.3 | 150 | 119.5 | |
| X-Plane 11.11 (2018) | 166.8 | 144 | 113.1 | ||
| Far Cry 5 (2018) | 168 | 148 | 138 | 128 | 125 |
| Strange Brigade (2018) | 452 | 372 | 323 | 292 | 210 |
| Tiny Tina's Wonderlands (2022) | 275.4 | 232.6 | 171.4 | 137.1 | 92 |
| F1 22 (2022) | 275 | 264 | 238 | 95.5 | 65.7 |
| Baldur's Gate 3 (2023) | 178.3 | 160.6 | 141.6 | 137 | 90.7 |
| Cyberpunk 2077 2.2 Phantom Liberty (2023) | 129.3 | 115.1 | 108.4 | 98.3 | 68.5 |
Emissioni - Forte e in carica
Rumore del sistema
Le ventole della nostra unità tendono ad aumentare più facilmente il numero di giri e la rumorosità rispetto alla nostra configurazione inferiore RTX 2000 Ada. Pertanto, i proprietari possono aspettarsi un maggior numero di pulsazioni della ventola e variazioni del rumore della ventola quando si eseguono diversi tipi di carichi. Carichi impegnativi come i giochi indurrebbero un rumore della ventola di 53 dB(A), per essere una delle workstation da 16 pollici più rumorose che abbiamo testato.
L'esecuzione di Cyberpunk 2077 in modalità Bilanciata invece che in modalità Prestazioni ridurrebbe sensibilmente il rumore della ventola da 52,8 dB(A) a 47,9 dB(A). Tuttavia, ciò avviene a scapito delle prestazioni, come indicato nella sezione Prestazioni della GPU di cui sopra.
Rumorosità
| Idle |
| 29.1 / 29.1 / 29.1 dB(A) |
| Sotto carico |
| 41 / 52.9 dB(A) |
 | ||
30 dB silenzioso 40 dB(A) udibile 50 dB(A) rumoroso |
||
min: | ||
| Lenovo ThinkPad P16 Gen 2 NVIDIA RTX 4000 Ada Generation Laptop GPU, i7-14700HX, SK hynix PC801 HFS001TEJ9X162N | Lenovo ThinkPad P16 G2 21FA000FGE NVIDIA RTX 2000 Ada Generation Laptop GPU, i7-13700HX, SK hynix PC801 HFS001TEJ9X162N | Lenovo ThinkPad P16s G2 21K9000CGE Radeon 780M, R7 PRO 7840U, SK hynix PC801 HFS001TEJ9X162N | Lenovo ThinkPad P16 G1 RTX A5500 RTX A5500 Laptop GPU, i9-12950HX, WDC PC SN810 2TB | HP ZBook Power 16 G11 A NVIDIA RTX 2000 Ada Generation Laptop GPU, R7 8845HS, Samsung PM9A1 MZVL22T0HBLB | Dell Precision 5690 NVIDIA RTX 5000 Ada Generation Laptop GPU, Ultra 9 185H, 2x Samsung PM9A1 1TB (RAID 0) | |
|---|---|---|---|---|---|---|
| Noise | 6% | 17% | 17% | 18% | 5% | |
| off /ambiente * | 23.9 | 23.5 2% | 22.6 5% | 23.1 3% | 23.5 2% | 23.4 2% |
| Idle Minimum * | 29.1 | 23.5 19% | 22.6 22% | 23.1 21% | 23.8 18% | 23.6 19% |
| Idle Average * | 29.1 | 29.2 -0% | 22.6 22% | 23.1 21% | 24.2 17% | 24.9 14% |
| Idle Maximum * | 29.1 | 29.5 -1% | 22.6 22% | 23.1 21% | 24.2 17% | 30.9 -6% |
| Load Average * | 41 | 32.7 20% | 37.8 8% | 28.9 30% | 25.4 38% | 40.4 1% |
| Cyberpunk 2077 ultra * | 52.8 | 43 19% | ||||
| Load Maximum * | 52.9 | 56.6 -7% | 40.5 23% | 51.4 3% | 45 15% | 51.9 2% |
| Witcher 3 ultra * | 50.6 | 40.3 | 51.6 | 48.3 |
* ... Meglio usare valori piccoli
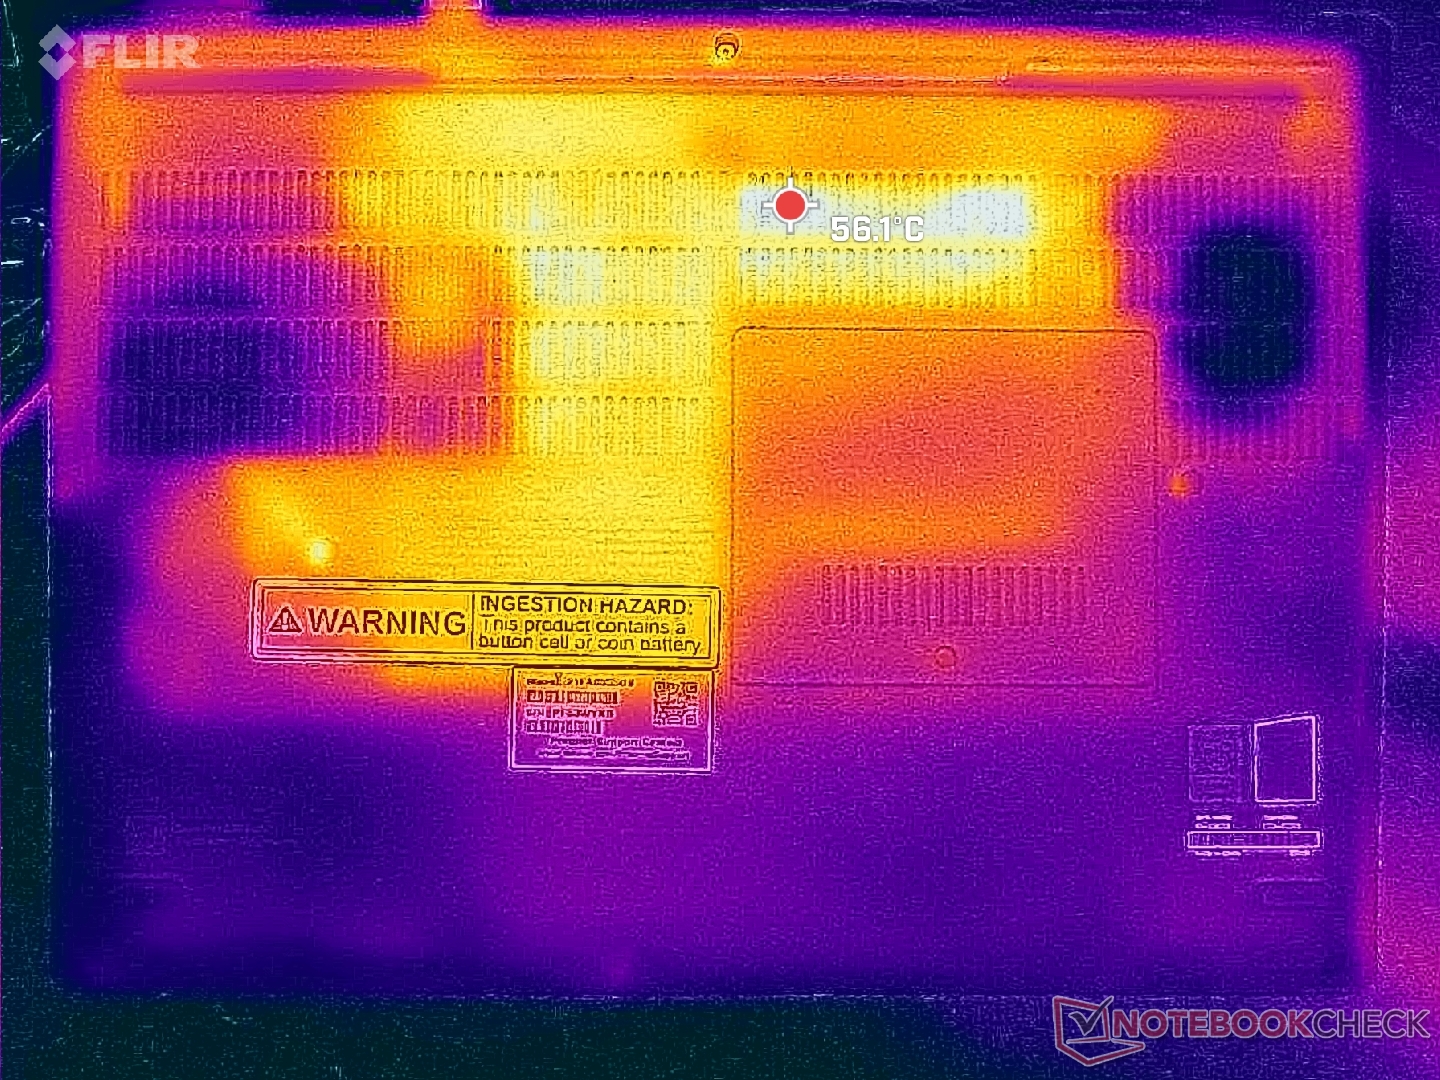
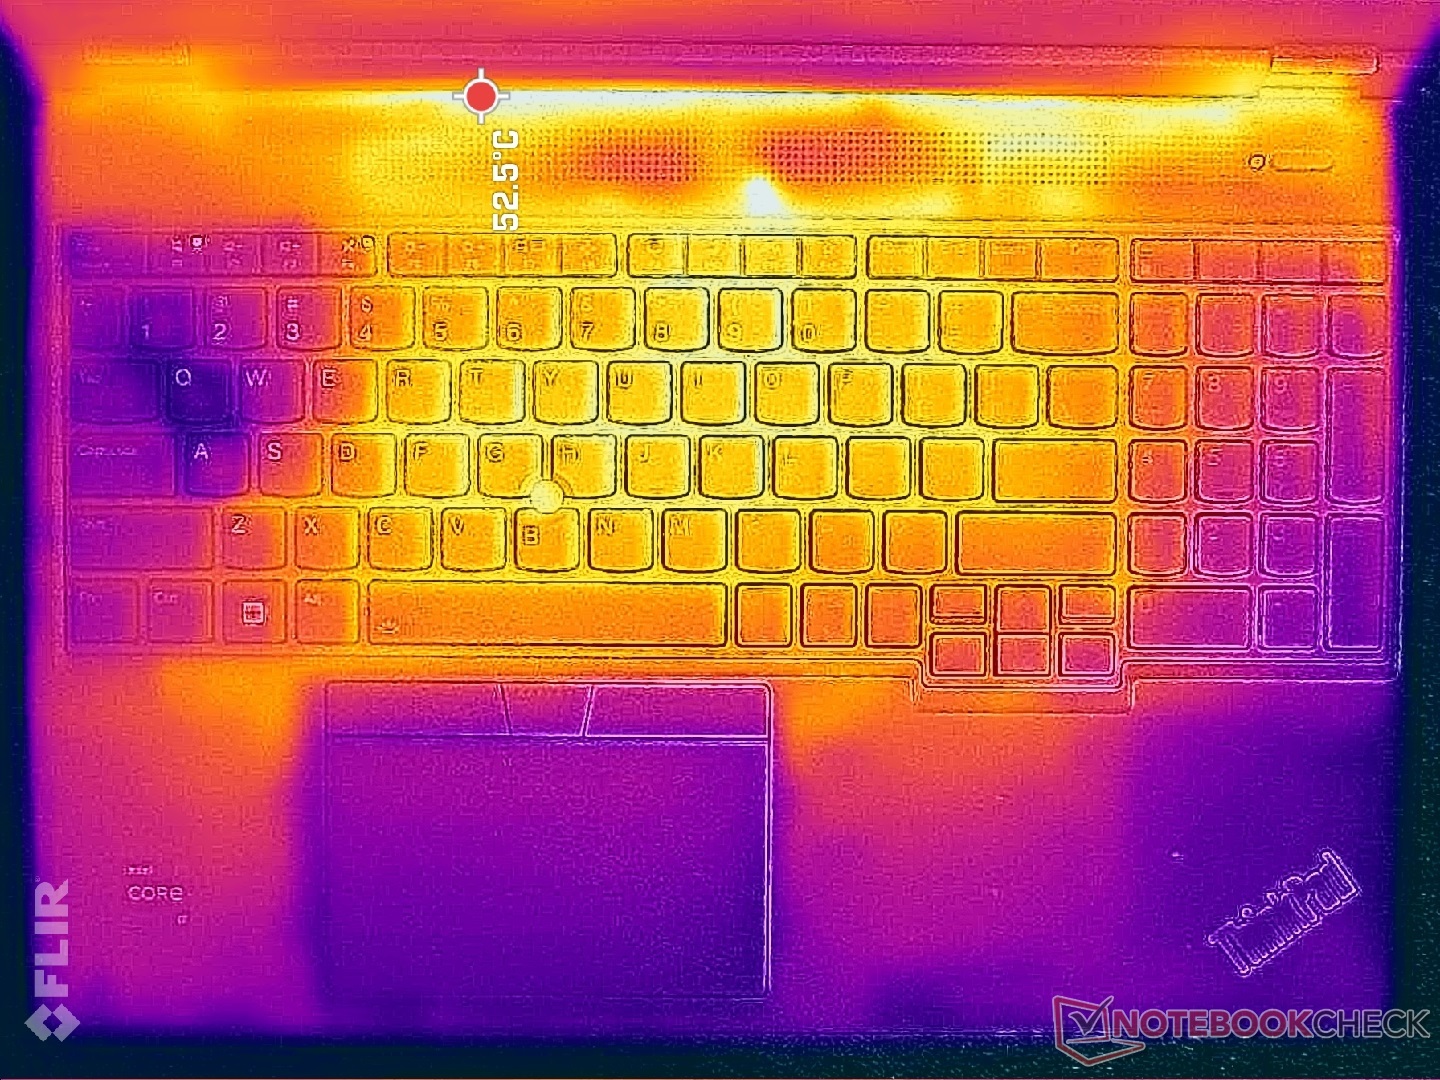
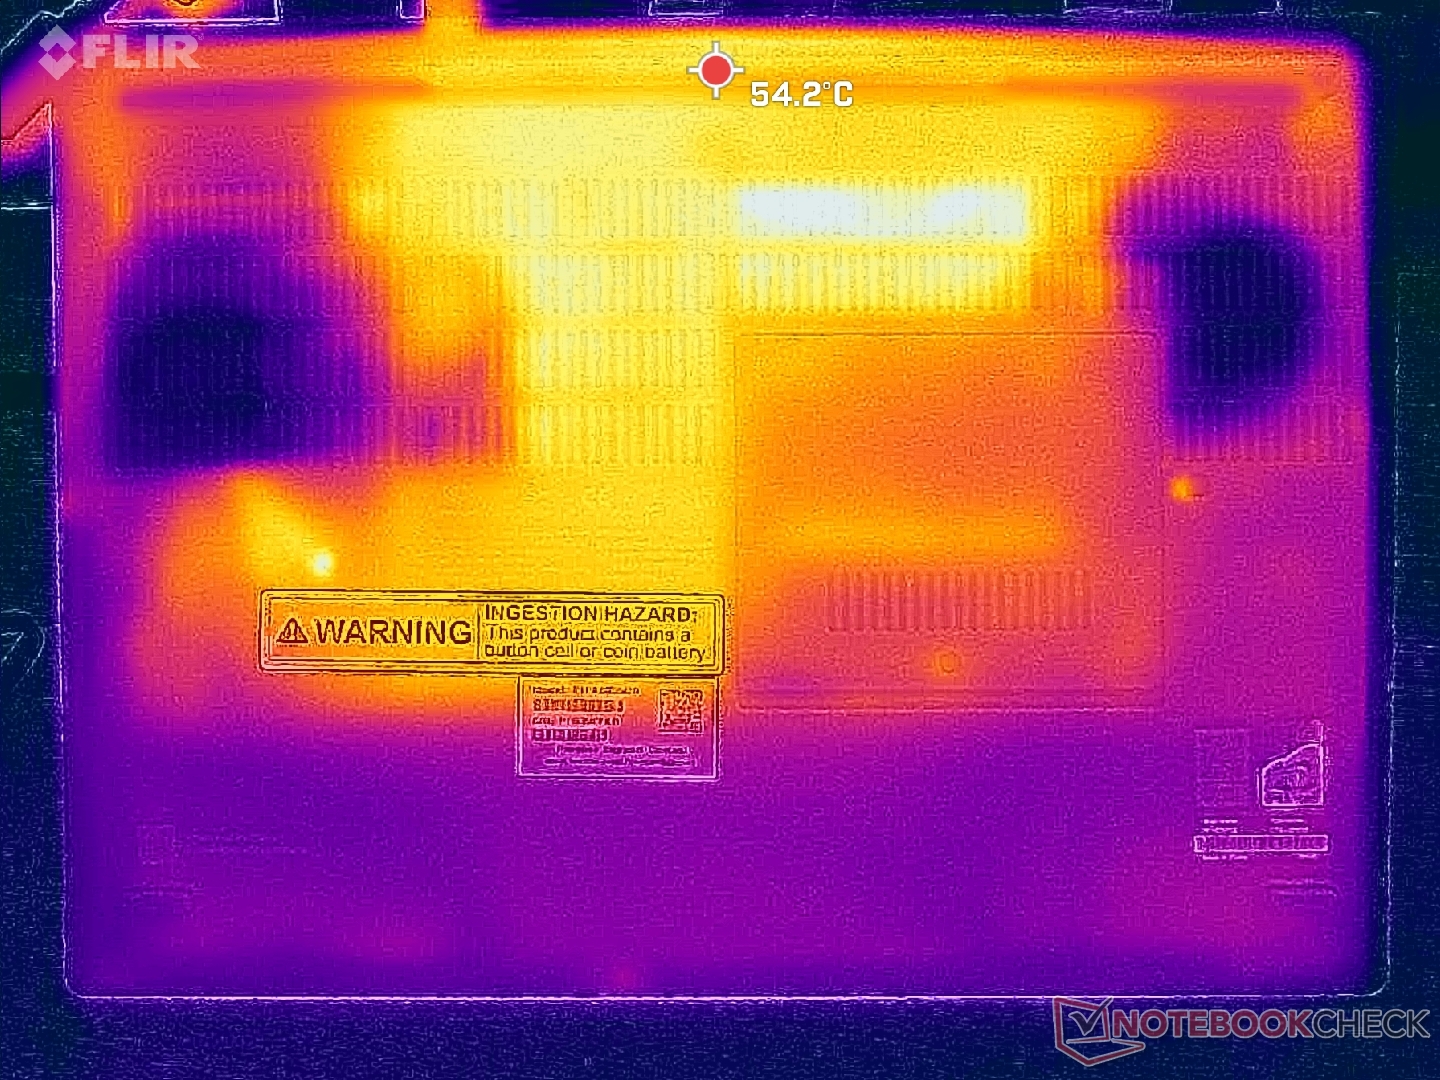
Temperatura
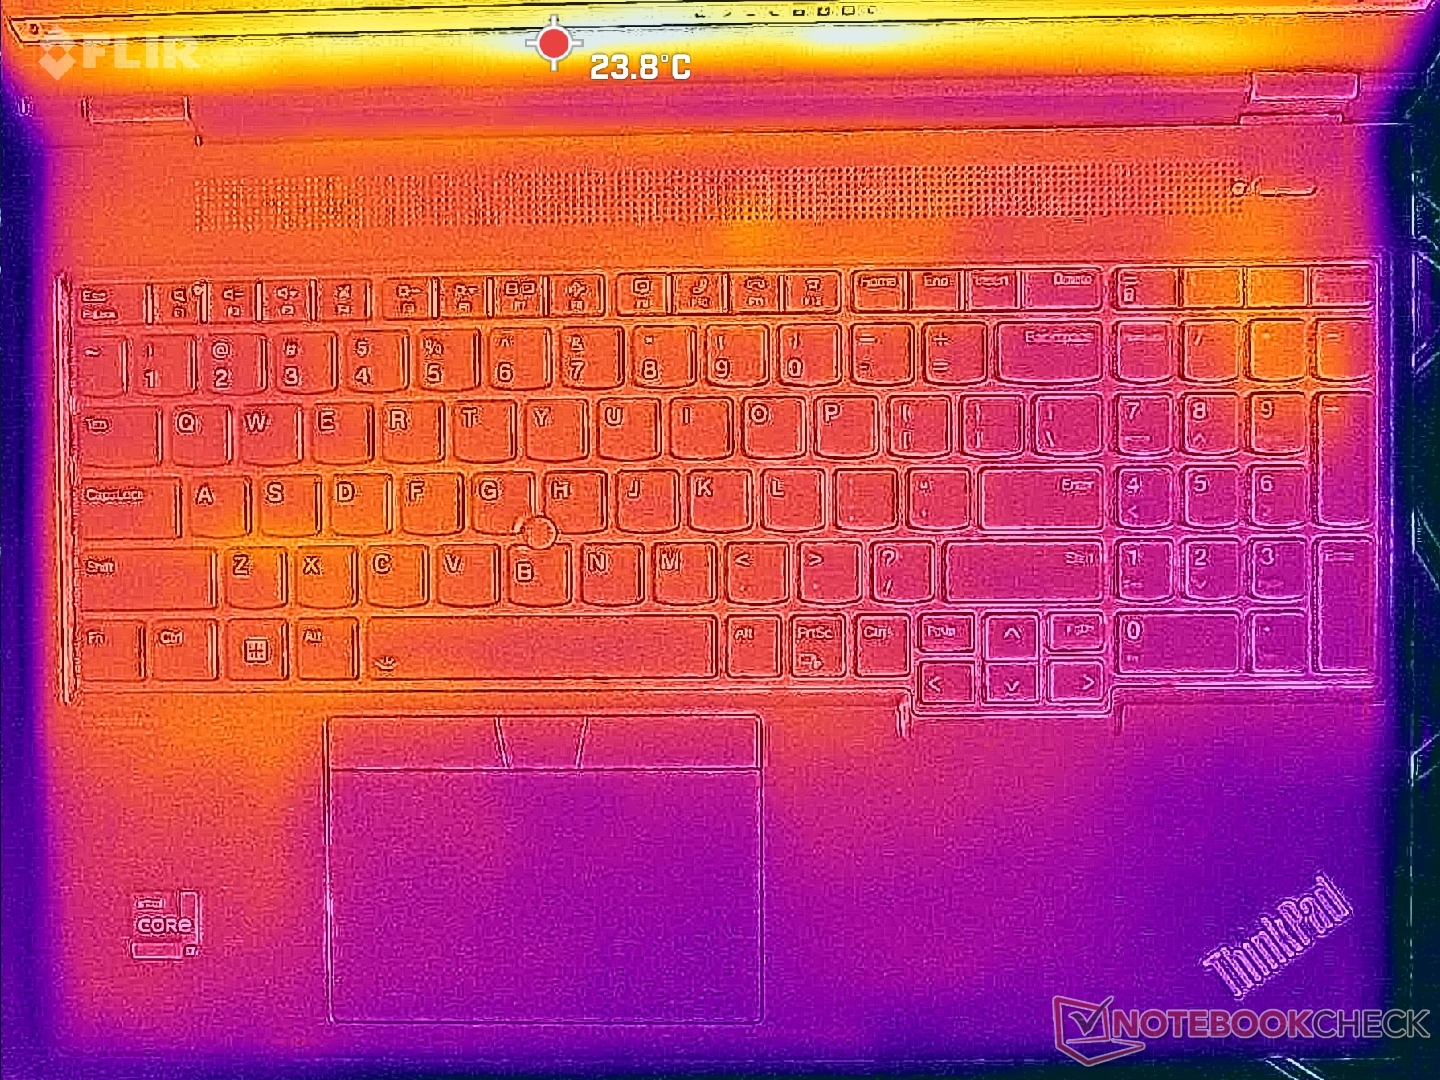
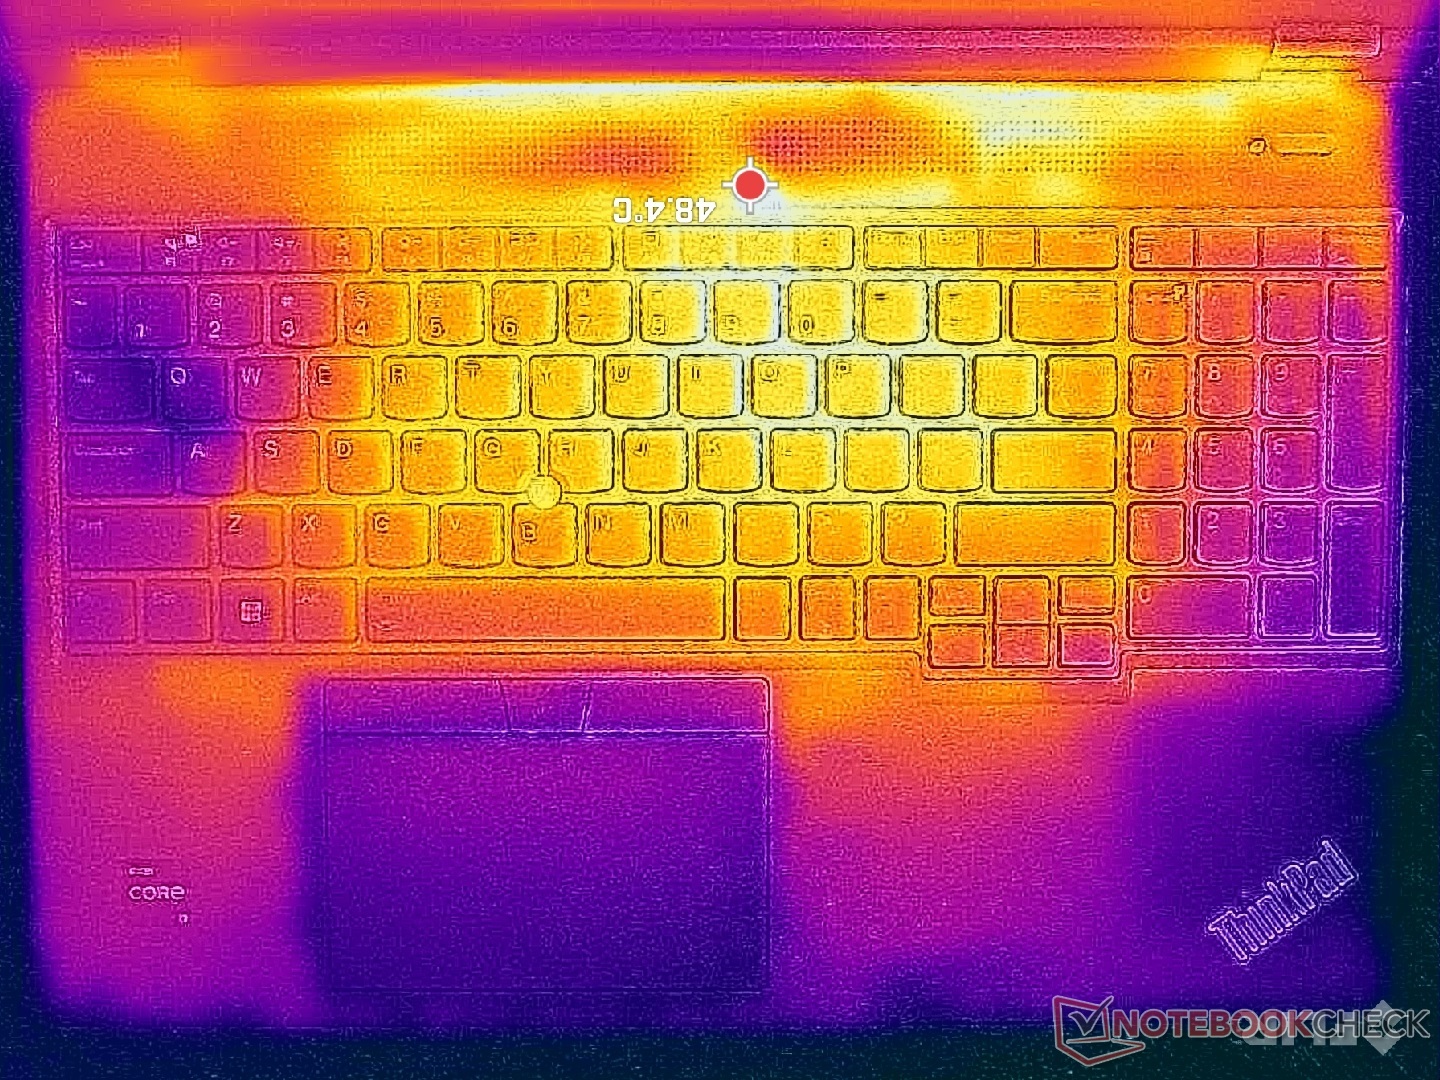
Le temperature di superficie sono prevedibilmente più calde rispetto alla nostra prima unità di test ThinkPad P16 Gen 2, grazie alla nostra GPU RTX 4000 Ada da 130 W, più esigente, ma la differenza è più ampia del previsto. La temperatura media delle coperture C e D può raggiungere i 43 C, rispetto ai soli 32 C della nostra configurazione meno equipaggiata, quando si eseguono carichi impegnativi.
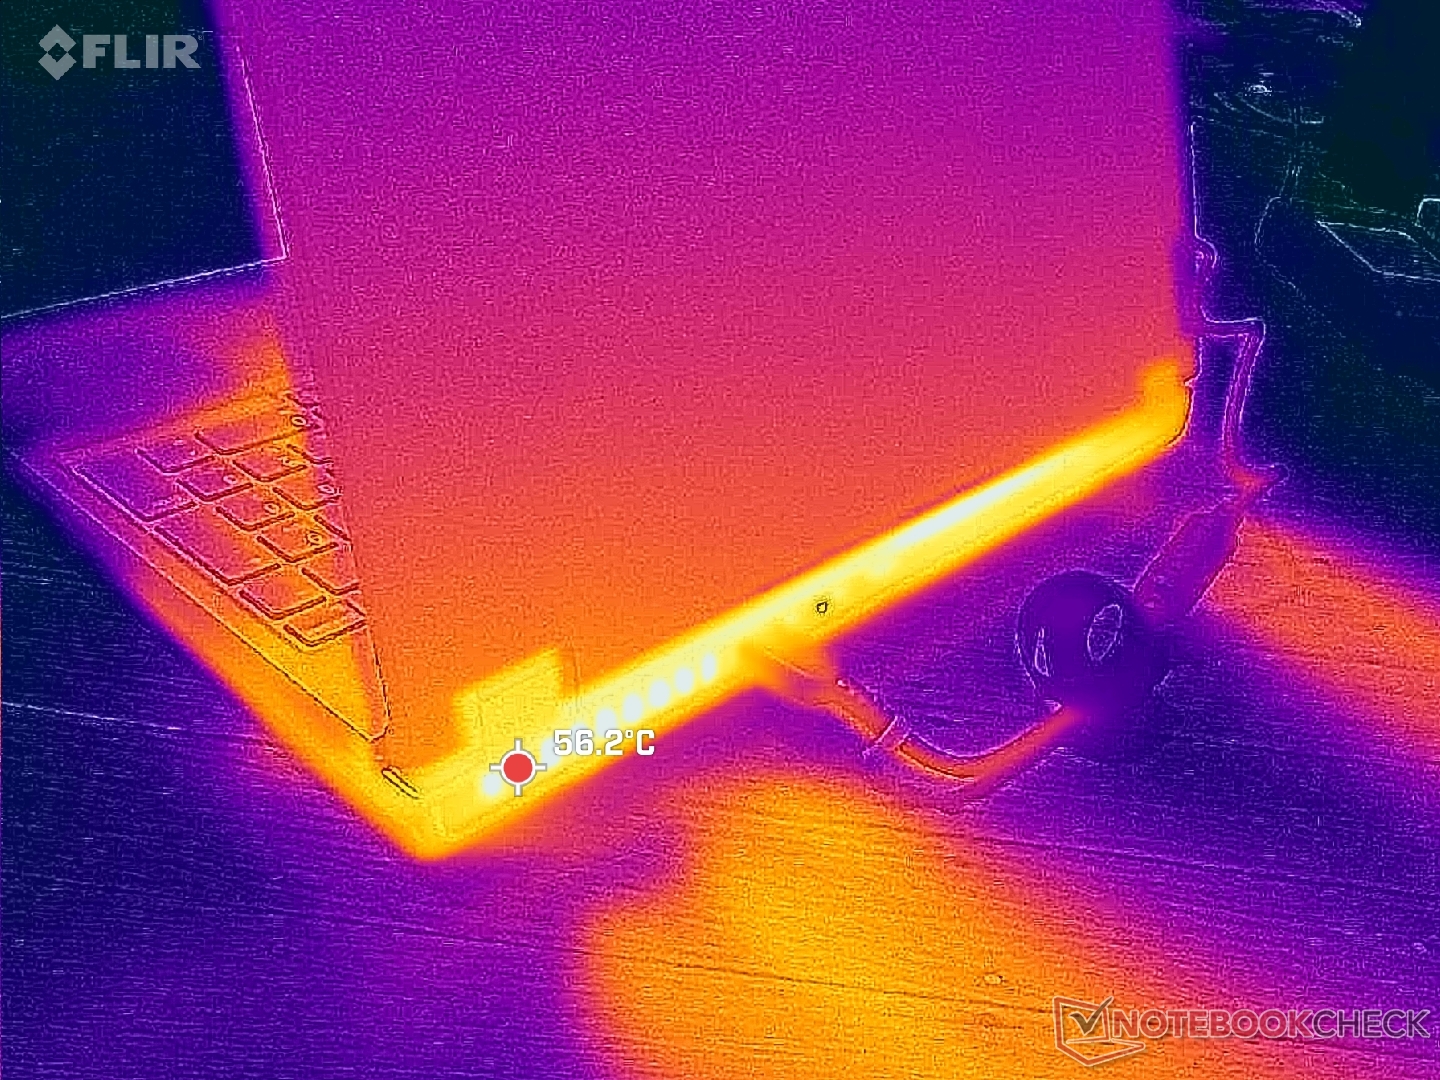
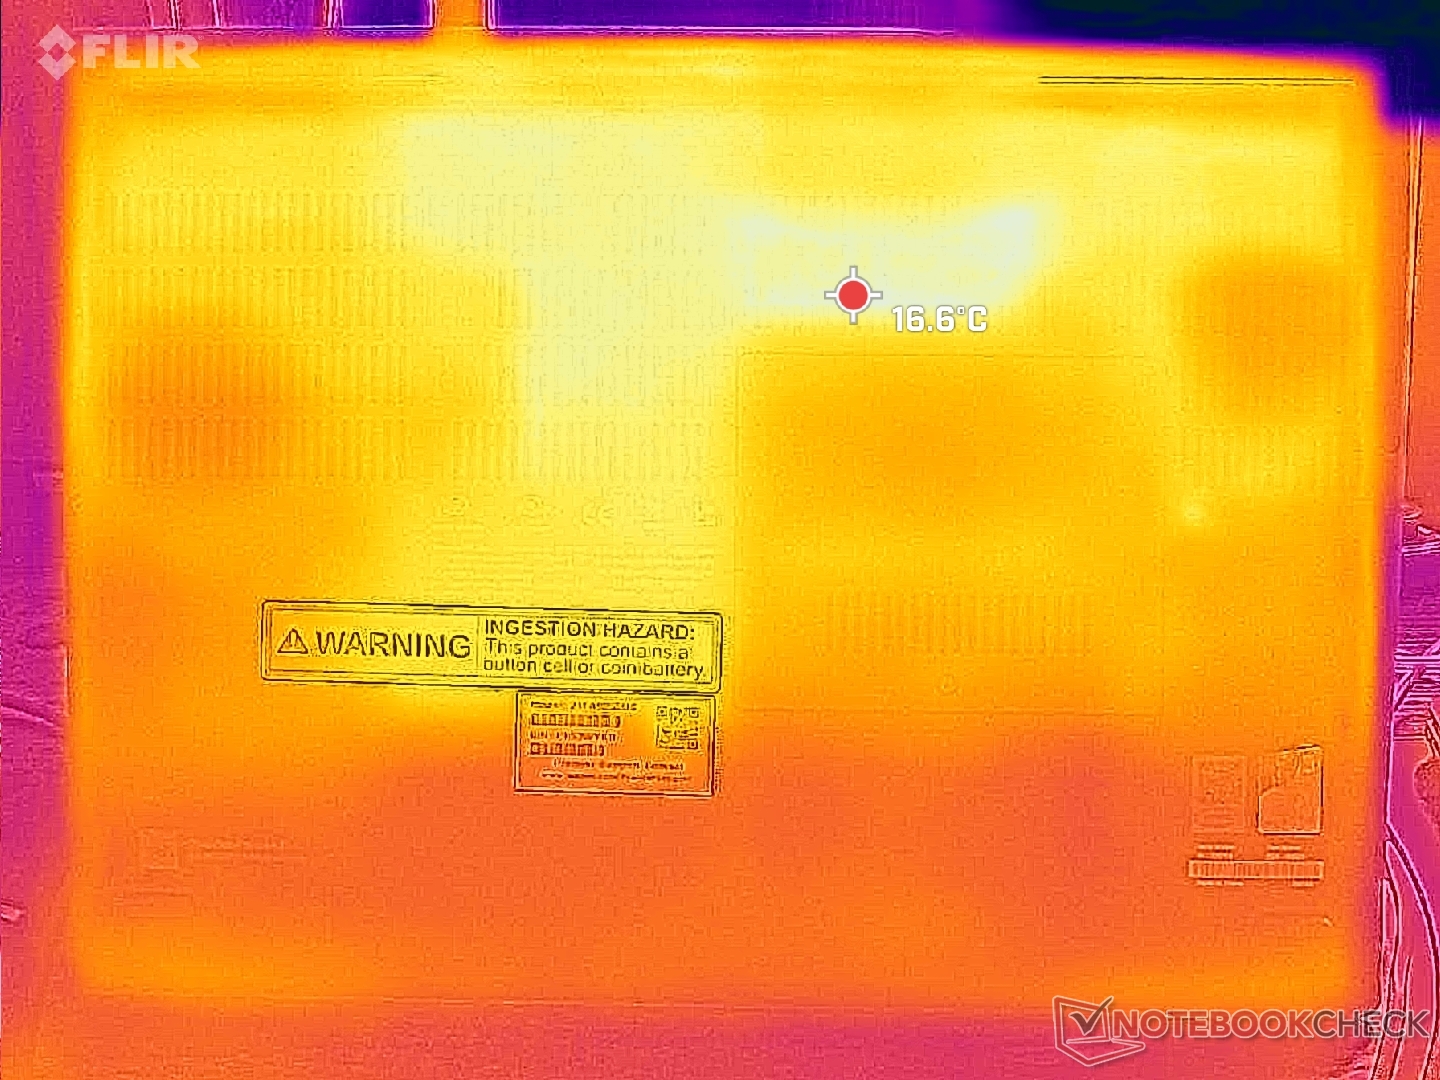
(-) La temperatura massima sul lato superiore è di 46.6 °C / 116 F, rispetto alla media di 38.2 °C / 101 F, che varia da 22.2 a 69.8 °C per questa classe Workstation.
(-) Il lato inferiore si riscalda fino ad un massimo di 51 °C / 124 F, rispetto alla media di 41.2 °C / 106 F
(+) In idle, la temperatura media del lato superiore è di 23.9 °C / 75 F, rispetto alla media deld ispositivo di 32 °C / 90 F.
(-) 3: The average temperature for the upper side is 39.6 °C / 103 F, compared to the average of 32 °C / 90 F for the class Workstation.
(+) I poggiapolsi e il touchpad raggiungono la temperatura massima della pelle (35.6 °C / 96.1 F) e quindi non sono caldi.
(-) La temperatura media della zona del palmo della mano di dispositivi simili e'stata di 27.8 °C / 82 F (-7.8 °C / -14.1 F).
| Lenovo ThinkPad P16 Gen 2 Intel Core i7-14700HX, NVIDIA RTX 4000 Ada Generation Laptop GPU | Lenovo ThinkPad P16 G2 21FA000FGE Intel Core i7-13700HX, NVIDIA RTX 2000 Ada Generation Laptop GPU | Lenovo ThinkPad P16s G2 21K9000CGE AMD Ryzen 7 PRO 7840U, AMD Radeon 780M | Lenovo ThinkPad P16 G1 RTX A5500 Intel Core i9-12950HX, NVIDIA RTX A5500 Laptop GPU | HP ZBook Power 16 G11 A AMD Ryzen 7 8845HS, NVIDIA RTX 2000 Ada Generation Laptop GPU | Dell Precision 5690 Intel Core Ultra 9 185H, Nvidia RTX 5000 Ada Generation Laptop GPU | |
|---|---|---|---|---|---|---|
| Heat | 3% | -2% | -17% | 6% | -3% | |
| Maximum Upper Side * | 46.6 | 47.2 -1% | 42.7 8% | 44.8 4% | 40.6 13% | 46.6 -0% |
| Maximum Bottom * | 51 | 39.5 23% | 47.2 7% | 49.8 2% | 40.6 20% | 33 35% |
| Idle Upper Side * | 24.8 | 28.1 -13% | 27.8 -12% | 30.6 -23% | 26 -5% | 32.4 -31% |
| Idle Bottom * | 25.6 | 25.3 1% | 28.4 -11% | 38.6 -51% | 26.6 -4% | 29.4 -15% |
* ... Meglio usare valori piccoli
Altoparlanti
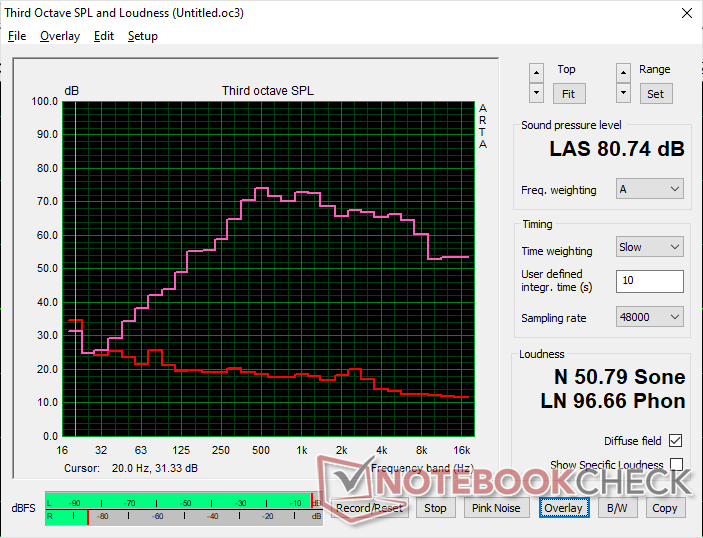
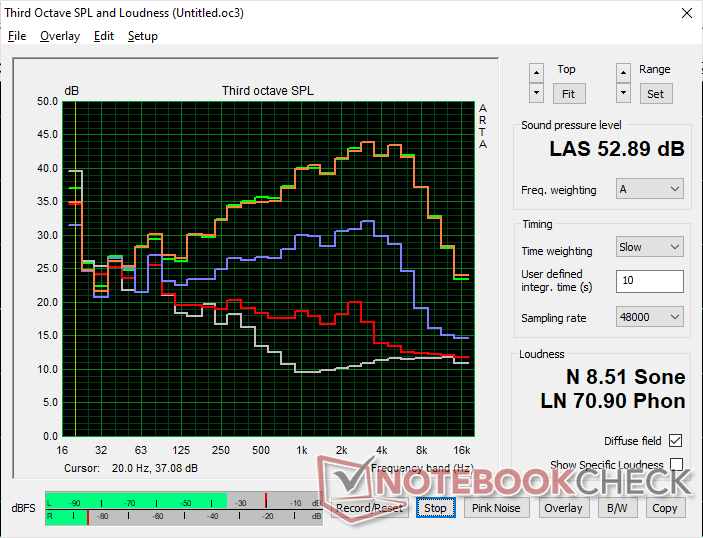
Lenovo ThinkPad P16 Gen 2 analisi audio
(±) | potenza degli altiparlanti media ma buona (80.7 dB)
Bassi 100 - 315 Hz
(±) | bassi ridotti - in media 10.8% inferiori alla media
(±) | la linearità dei bassi è media (8% delta rispetto alla precedente frequenza)
Medi 400 - 2000 Hz
(±) | medi elevati - circa 5.4% superiore alla media
(+) | medi lineari (6.2% delta rispetto alla precedente frequenza)
Alti 2 - 16 kHz
(+) | Alti bilanciati - appena 3.3% dalla media
(+) | alti lineari (5.5% delta rispetto alla precedente frequenza)
Nel complesso 100 - 16.000 Hz
(±) | la linearità complessiva del suono è media (15.6% di differenza rispetto alla media
Rispetto alla stessa classe
» 32% di tutti i dispositivi testati in questa classe è stato migliore, 10% simile, 59% peggiore
» Il migliore ha avuto un delta di 7%, medio di 18%, peggiore di 35%
Rispetto a tutti i dispositivi testati
» 21% di tutti i dispositivi testati in questa classe è stato migliore, 4% similare, 74% peggiore
» Il migliore ha avuto un delta di 4%, medio di 24%, peggiore di 134%
Apple MacBook Pro 16 2021 M1 Pro analisi audio
(+) | gli altoparlanti sono relativamente potenti (84.7 dB)
Bassi 100 - 315 Hz
(+) | bassi buoni - solo 3.8% dalla media
(+) | bassi in lineaa (5.2% delta rispetto alla precedente frequenza)
Medi 400 - 2000 Hz
(+) | medi bilanciati - solo only 1.3% rispetto alla media
(+) | medi lineari (2.1% delta rispetto alla precedente frequenza)
Alti 2 - 16 kHz
(+) | Alti bilanciati - appena 1.9% dalla media
(+) | alti lineari (2.7% delta rispetto alla precedente frequenza)
Nel complesso 100 - 16.000 Hz
(+) | suono nel complesso lineare (4.6% differenza dalla media)
Rispetto alla stessa classe
» 0% di tutti i dispositivi testati in questa classe è stato migliore, 0% simile, 100% peggiore
» Il migliore ha avuto un delta di 5%, medio di 18%, peggiore di 45%
Rispetto a tutti i dispositivi testati
» 0% di tutti i dispositivi testati in questa classe è stato migliore, 0% similare, 100% peggiore
» Il migliore ha avuto un delta di 4%, medio di 24%, peggiore di 134%
Gestione dell'energia
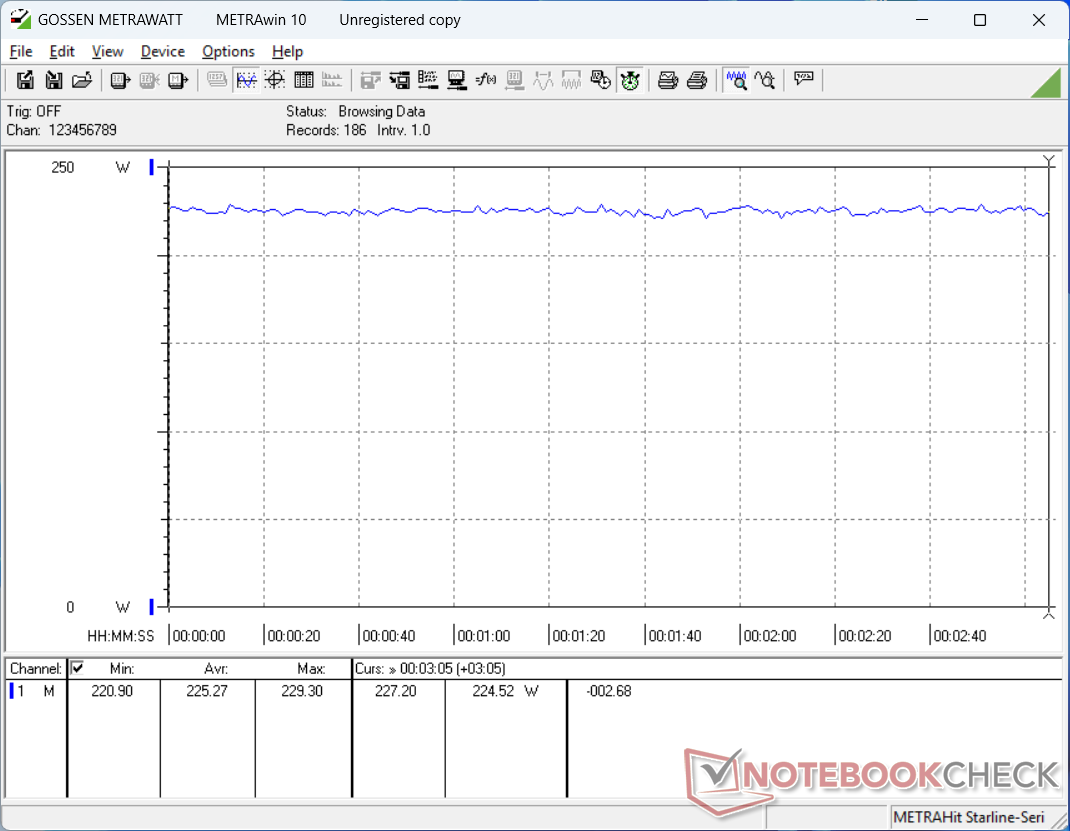
Consumo di energia
L'inattività su desktop può richiedere fino a 25 W, rispetto ai soli 16 W della configurazione RTX 2000 meno equipaggiata. Quando si eseguono carichi impegnativi come i giochi, il delta può arrivare a 80 W, per un aumento del 55% del consumo. Si assicuri di utilizzare l'adattatore CA da 230 W, più capace, per ottenere il massimo dalla configurazione RTX 4000.
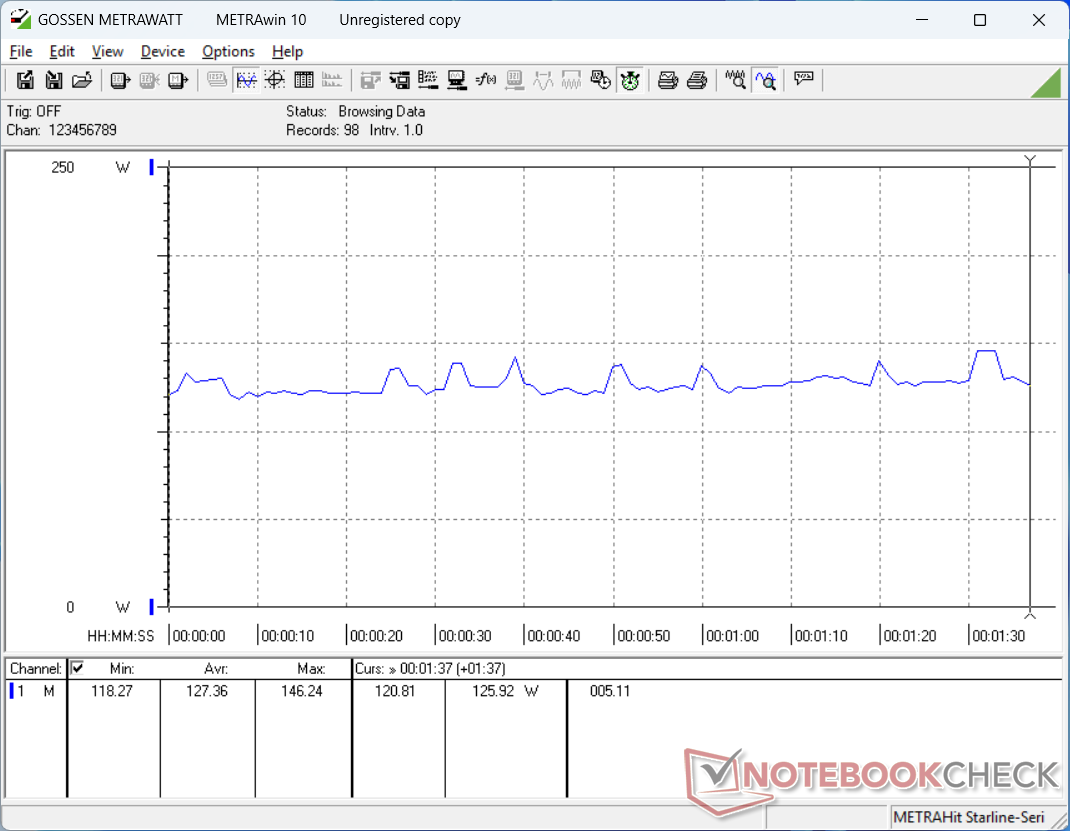
| Off / Standby | |
| Idle | |
| Sotto carico |
|
Leggenda:
min: | |
| Lenovo ThinkPad P16 Gen 2 i7-14700HX, NVIDIA RTX 4000 Ada Generation Laptop GPU, SK hynix PC801 HFS001TEJ9X162N, IPS, 2560x1600, 16" | Lenovo ThinkPad P16 G2 21FA000FGE i7-13700HX, NVIDIA RTX 2000 Ada Generation Laptop GPU, SK hynix PC801 HFS001TEJ9X162N, IPS LED, 2560x1600, 16" | Lenovo ThinkPad P16s G2 21K9000CGE R7 PRO 7840U, Radeon 780M, SK hynix PC801 HFS001TEJ9X162N, OLED, 3840x2400, 16" | Lenovo ThinkPad P16 G1 RTX A5500 i9-12950HX, RTX A5500 Laptop GPU, WDC PC SN810 2TB, IPS, 3840x2400, 16" | HP ZBook Power 16 G11 A R7 8845HS, NVIDIA RTX 2000 Ada Generation Laptop GPU, Samsung PM9A1 MZVL22T0HBLB, IPS, 2560x1600, 16" | Dell Precision 5690 Ultra 9 185H, NVIDIA RTX 5000 Ada Generation Laptop GPU, 2x Samsung PM9A1 1TB (RAID 0), OLED, 3840x2400, 16" | |
|---|---|---|---|---|---|---|
| Power Consumption | 7% | 55% | -27% | 47% | 8% | |
| Idle Minimum * | 7.9 | 9.3 -18% | 6.1 23% | 7.5 5% | 4.6 42% | 7.9 -0% |
| Idle Average * | 13.1 | 14.1 -8% | 6.5 50% | 20.1 -53% | 10 24% | 12 8% |
| Idle Maximum * | 24.2 | 15.5 36% | 7 71% | 40 -65% | 10.6 56% | 28.6 -18% |
| Load Average * | 127.4 | 133.6 -5% | 56.6 56% | 137 -8% | 60.9 52% | 98.8 22% |
| Cyberpunk 2077 ultra external monitor * | 219 | 92.8 58% | ||||
| Cyberpunk 2077 ultra * | 225 | 96.8 57% | ||||
| Load Maximum * | 248.5 | 179.6 28% | 68.3 73% | 285.9 -15% | 154.8 38% | 174.8 30% |
| Witcher 3 ultra * | 144.9 | 61.2 | 208 | 144.5 |
* ... Meglio usare valori piccoli
Power Consumption Cyberpunk / Stress Test
Power Consumption external Monitor
Durata della batteria
I tempi di esecuzione sono inferiori a quelli che abbiamo registrato sulla configurazione inferiore ThinkPad P16 Gen 2 di oltre la metà, anche quando si imposta la modalità Bilanciata e la luminosità a 150 nit. La differenza può essere attribuita principalmente alla mancanza del supporto Advanced Optimus sulla nostra unità RTX 4000 Ada e quindi la GPU discreta non è mai completamente disattivata.
La ricarica da vuoto a pieno richiede circa 130 minuti, anche con Lenovo Quick Charge attivato.
| Lenovo ThinkPad P16 Gen 2 i7-14700HX, NVIDIA RTX 4000 Ada Generation Laptop GPU, 94 Wh | Lenovo ThinkPad P16 G2 21FA000FGE i7-13700HX, NVIDIA RTX 2000 Ada Generation Laptop GPU, 94 Wh | Lenovo ThinkPad P16s G2 21K9000CGE R7 PRO 7840U, Radeon 780M, 84 Wh | Lenovo ThinkPad P16 G1 RTX A5500 i9-12950HX, RTX A5500 Laptop GPU, 94 Wh | HP ZBook Power 16 G11 A R7 8845HS, NVIDIA RTX 2000 Ada Generation Laptop GPU, 83 Wh | Dell Precision 5690 Ultra 9 185H, NVIDIA RTX 5000 Ada Generation Laptop GPU, 98 Wh | |
|---|---|---|---|---|---|---|
| Autonomia della batteria | 248% | 329% | 136% | 293% | 271% | |
| WiFi v1.3 | 148 | 515 248% | 635 329% | 350 136% | 582 293% | 549 271% |
| H.264 | 797 | |||||
| Load | 92 | 103 | ||||
| Reader / Idle | 1566 |
Notebookcheck Rating
Lenovo ThinkPad P16 Gen 2
- 10/25/2024 v8
Allen Ngo
 Total Sustainability Score:
Lenovo ThinkPad P16 Gen 2
- 10/25/2024 v8
Allen Ngo
Total Sustainability Score: Transparency
La selezione dei dispositivi da recensire viene effettuata dalla nostra redazione. Il campione di prova è stato fornito all'autore come prestito dal produttore o dal rivenditore ai fini di questa recensione. L'istituto di credito non ha avuto alcuna influenza su questa recensione, né il produttore ne ha ricevuto una copia prima della pubblicazione. Non vi era alcun obbligo di pubblicare questa recensione. Non accettiamo mai compensi o pagamenti in cambio delle nostre recensioni. In quanto società mediatica indipendente, Notebookcheck non è soggetta all'autorità di produttori, rivenditori o editori.
Ecco come Notebookcheck esegue i test
Ogni anno, Notebookcheck esamina in modo indipendente centinaia di laptop e smartphone utilizzando procedure standardizzate per garantire che tutti i risultati siano comparabili. Da circa 20 anni sviluppiamo continuamente i nostri metodi di prova e nel frattempo stabiliamo gli standard di settore. Nei nostri laboratori di prova, tecnici ed editori esperti utilizzano apparecchiature di misurazione di alta qualità. Questi test comportano un processo di validazione in più fasi. Il nostro complesso sistema di valutazione si basa su centinaia di misurazioni e parametri di riferimento ben fondati, che mantengono l'obiettività.
