

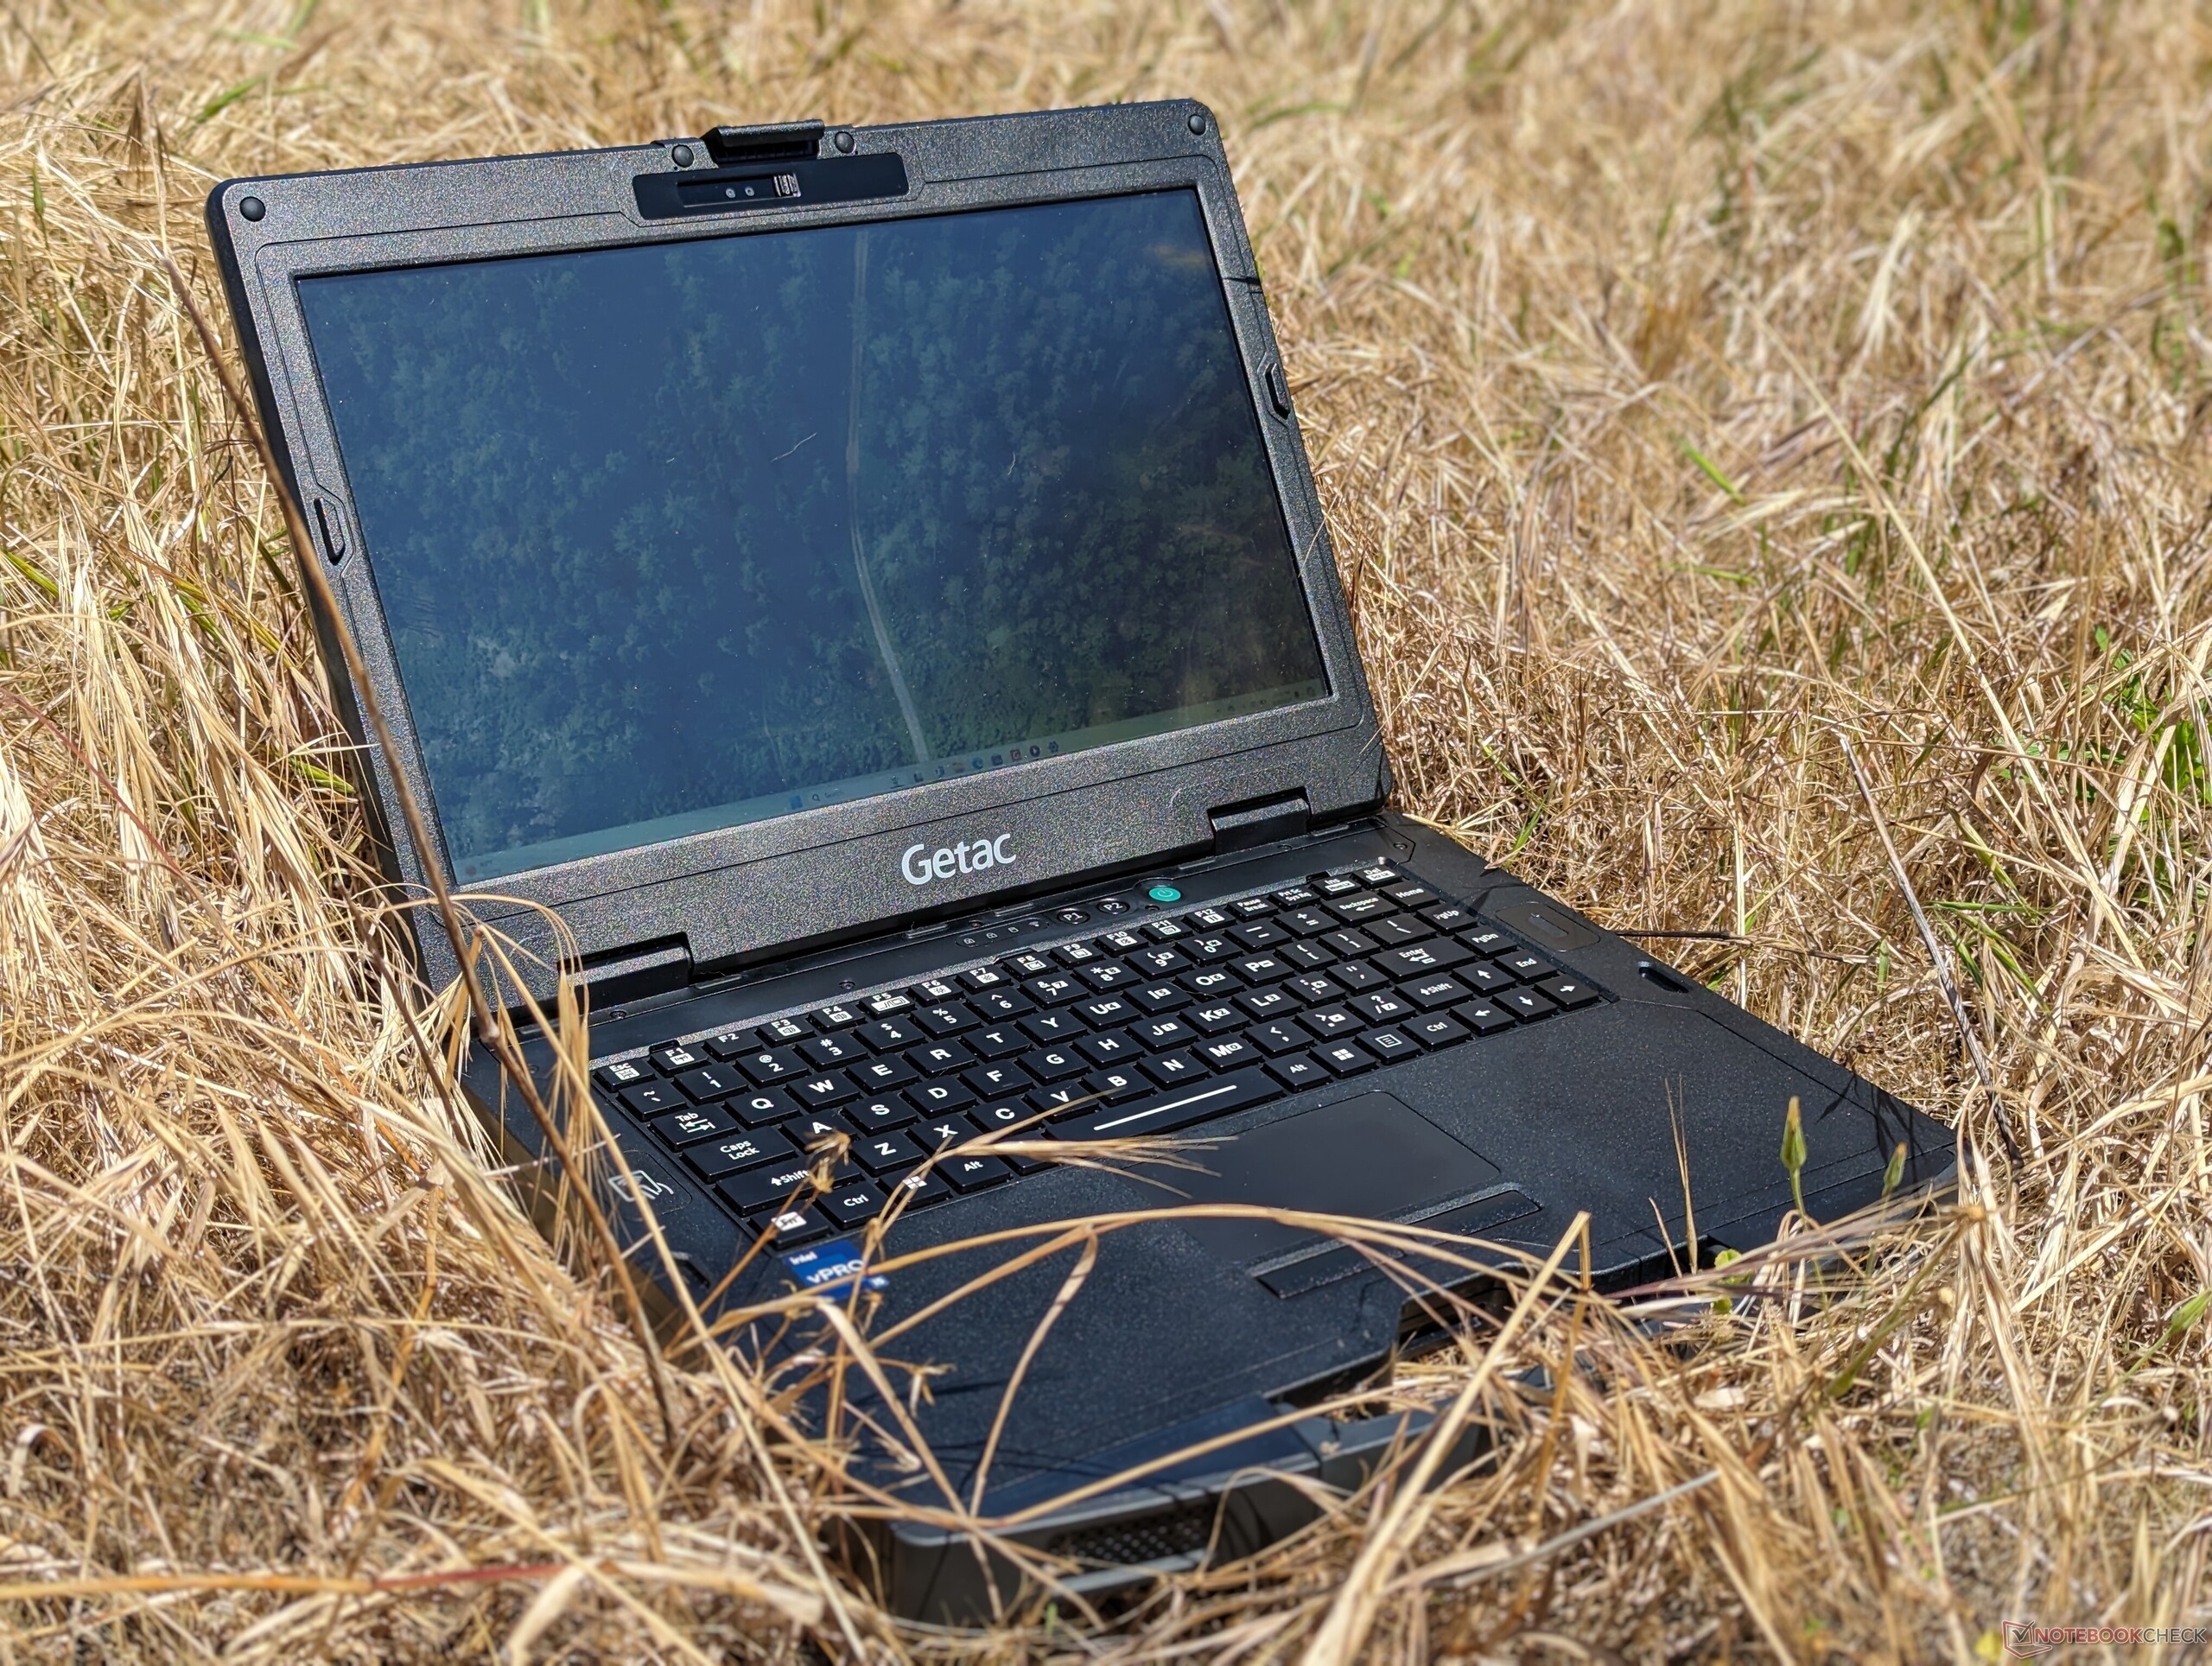
Recensione del notebook rugged Getac S410 Gen 5: Raptor Lake-P per prestazioni extra

L'S410 è tornato quest'anno come modello di quinta generazione con le stesse caratteristiche fisiche delle quattro precedenti iterazioni. I suoi interni sono stati aggiornati con i processori Raptor Lake-P vPro, che succedono alle vecchie opzioni Tiger Lake-U. Le consigliamo di consultare le nostre recensioni sul modello S410 G4 e sull'originale 2018 S410 per saperne di più sul telaio e sulle caratteristiche dell'S410 G5, dal momento che è cambiato ben poco per mantenere la compatibilità con i componenti e gli accessori. Questa recensione si concentrerà invece sulle differenze di prestazioni tra la S410 G5 e le sue alternative e predecessori.
Maggiori informazioni sull'S410 G5 e sul suo lungo elenco di caratteristiche personalizzabili sono disponibili nella pagina ufficiale del prodotto in PDF qui.
Altre recensioni di Getac:
Potenziali concorrenti a confrontos
Punteggio | Data | Modello | Peso | Altezza | Dimensione | Risoluzione | Prezzo |
|---|---|---|---|---|---|---|---|
| 82.9 % v7 (old) | 06/2024 | Getac S410 G5 i5-1350P, Iris Xe G7 80EUs | 2.9 kg | 34.9 mm | 14.00" | 1920x1080 | |
| 81.7 % v7 (old) | 05/2022 | Getac S410 Gen 4 i7-1185G7, Iris Xe G7 96EUs | 3.2 kg | 34.9 mm | 14.00" | 1920x1080 | |
v (old) | 04/2021 | Durabook S14I i7-1165G7, Iris Xe G7 96EUs | 3 kg | 38.1 mm | 14.00" | 1920x1080 | |
| 84.8 % v7 (old) | 01/2022 | Dell Latitude 14 5420-D2G5W i5-1135G7, Iris Xe G7 80EUs | 1.5 kg | 20.9 mm | 14.00" | 1920x1080 | |
v (old) | 05/2022 | Dell Latitude 7330 Rugged Extreme i7-1185G7, Iris Xe G7 96EUs | 2.7 kg | 36.5 mm | 13.30" | 1920x1080 | |
v (old) | 07/2022 | Panasonic Toughbook 40 i7-1185G7, Iris Xe G7 96EUs | 3.9 kg | 53.4 mm | 14.00" | 1920x1080 |
Custodia - Robusta con certificazione MIL-STD-810H e IP53
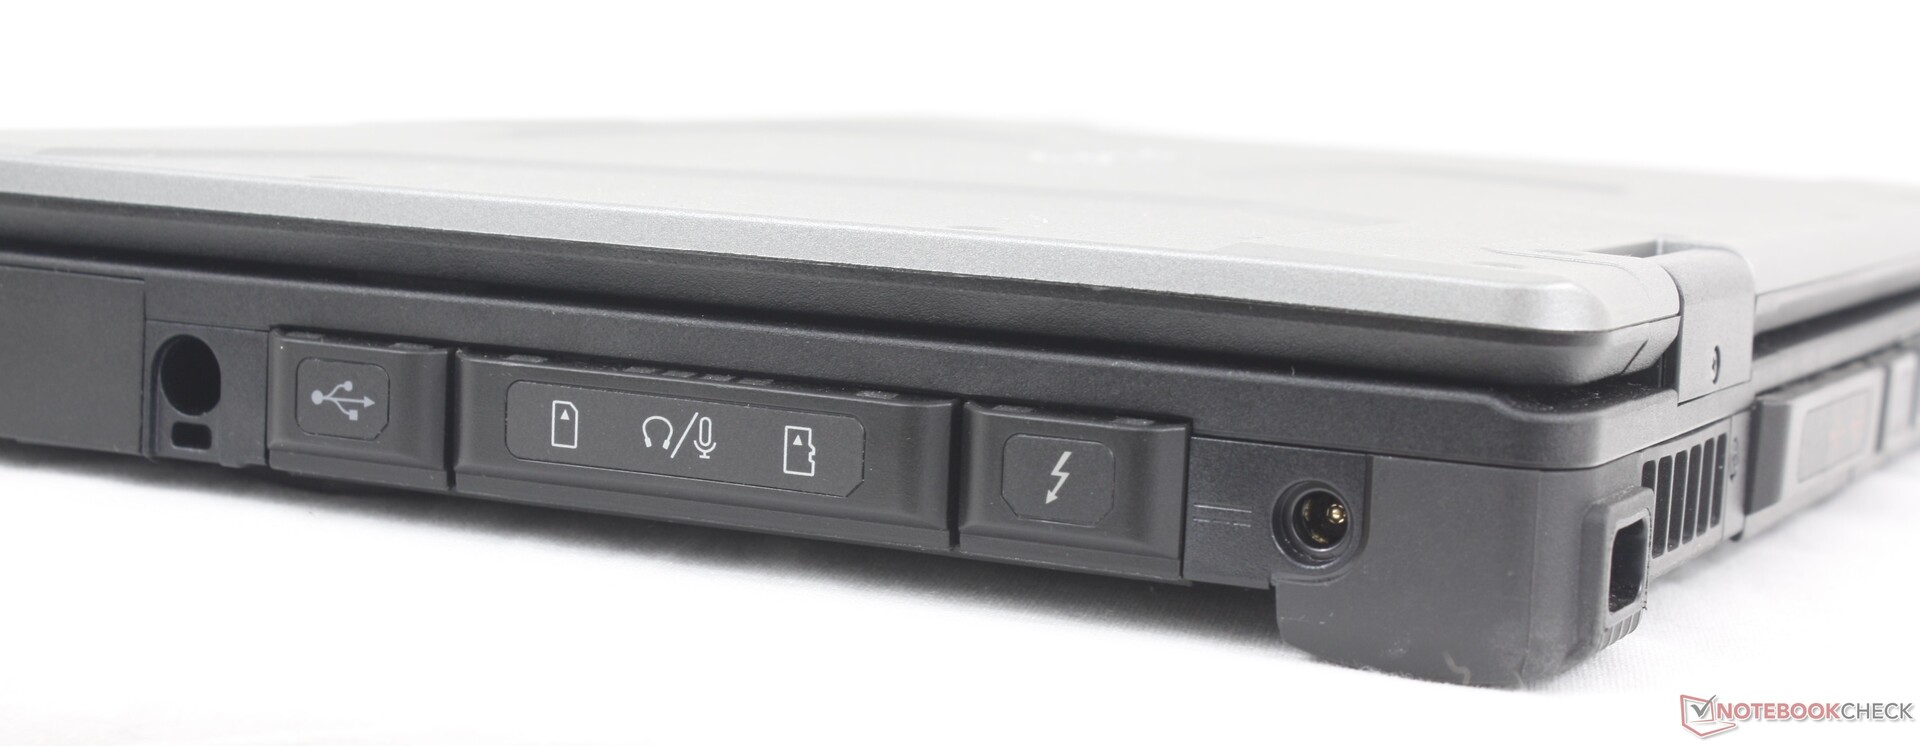
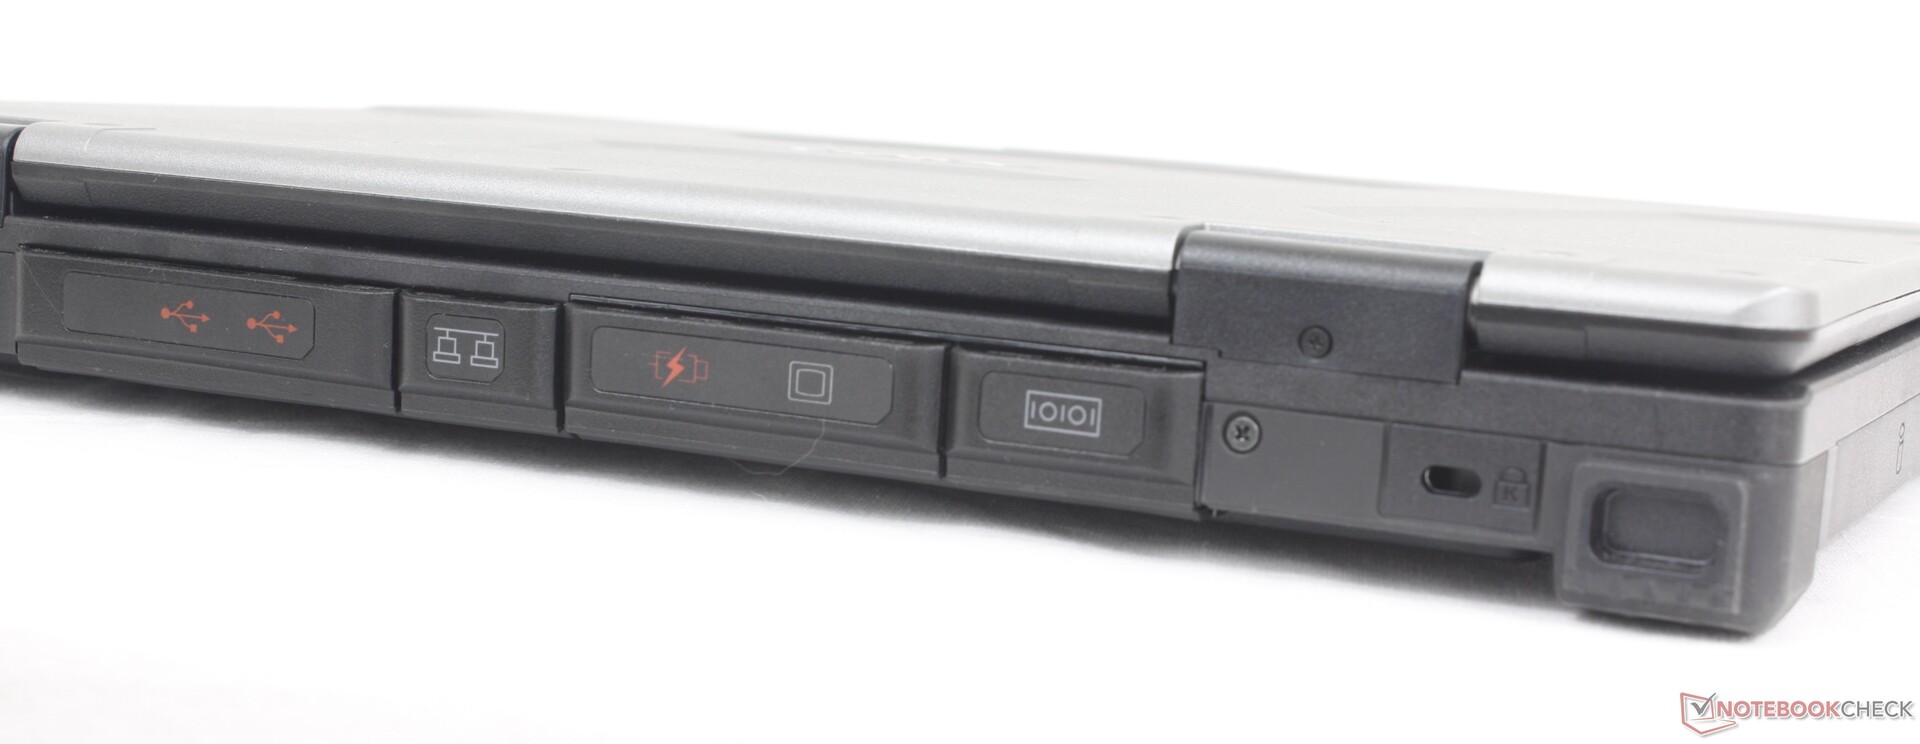
Connettività

Lettore di schede SD
| SD Card Reader | |
| average JPG Copy Test (av. of 3 runs) | |
| Dell Latitude 14 5420-D2G5W (AV Pro SD microSD 128 GB V60) | |
| Dell Latitude 7330 Rugged Extreme (AV Pro V60) | |
| Getac S410 G5 (AV Pro V60) | |
| Panasonic Toughbook 40 (AV Pro V60) | |
| Durabook S14I (Angelbird 128GB AV Pro UHS-II) | |
| maximum AS SSD Seq Read Test (1GB) | |
| Dell Latitude 7330 Rugged Extreme (AV Pro V60) | |
| Dell Latitude 14 5420-D2G5W (AV Pro SD microSD 128 GB V60) | |
| Getac S410 G5 (AV Pro V60) | |
| Panasonic Toughbook 40 (AV Pro V60) | |
| Durabook S14I (Angelbird 128GB AV Pro UHS-II) | |
Comunicazione
La WLAN è stata aggiornata dall'Intel AX201 all'AX211 per supportare la velocità del Wi-Fi 6E.
| Networking | |
| iperf3 transmit AX12 | |
| Durabook S14I | |
| Dell Latitude 7330 Rugged Extreme | |
| Getac S410 Gen 4 | |
| Dell Latitude 14 5420-D2G5W | |
| iperf3 receive AX12 | |
| Durabook S14I | |
| Getac S410 Gen 4 | |
| Dell Latitude 7330 Rugged Extreme | |
| Dell Latitude 14 5420-D2G5W | |
| iperf3 transmit AXE11000 | |
| Panasonic Toughbook 40 | |
| Getac S410 G5 | |
| iperf3 receive AXE11000 | |
| Panasonic Toughbook 40 | |
| Getac S410 G5 | |
| iperf3 transmit AXE11000 6GHz | |
| Getac S410 G5 | |
| iperf3 receive AXE11000 6GHz | |
| Getac S410 G5 | |
Webcam
La nostra unità di prova è stata configurata con una webcam da 5 MP, che rappresenta un enorme upgrade rispetto alla webcam da 1 MP dell'S410 G4. È supportato il riconoscimento facciale Windows Hello.


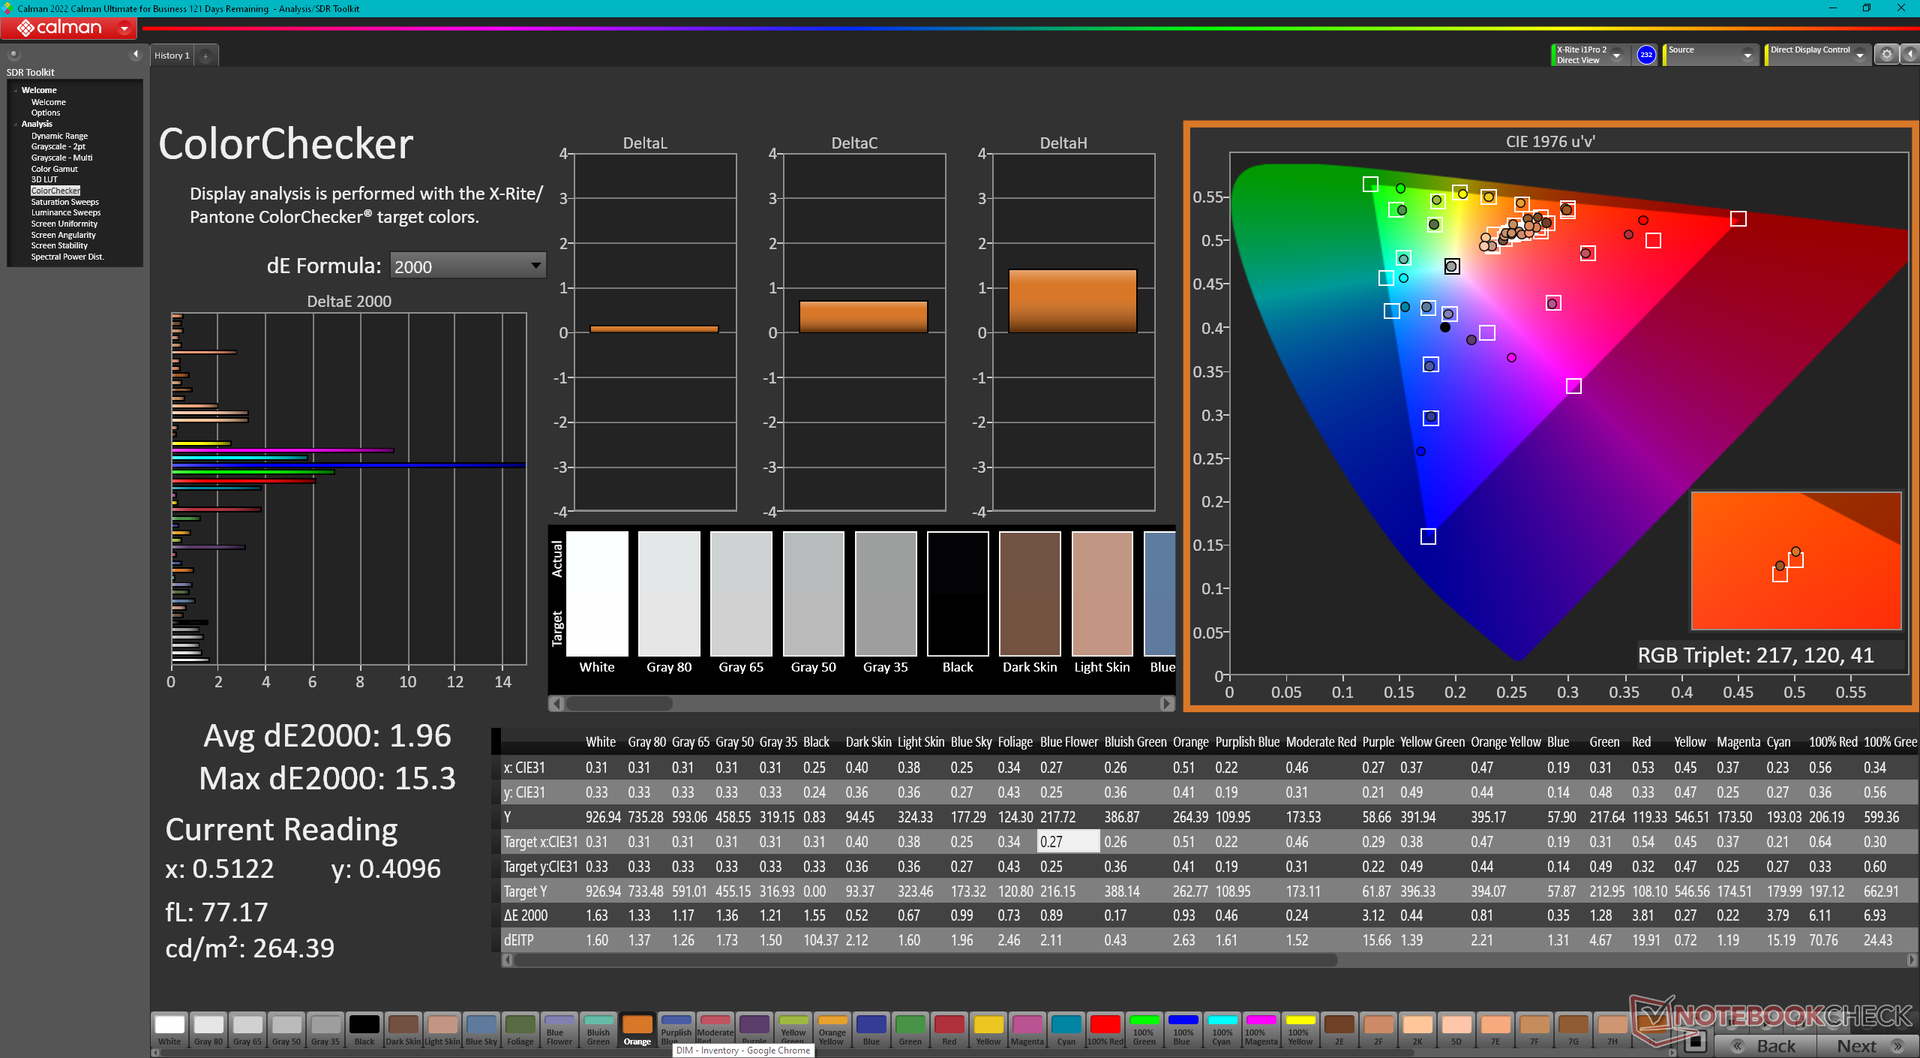
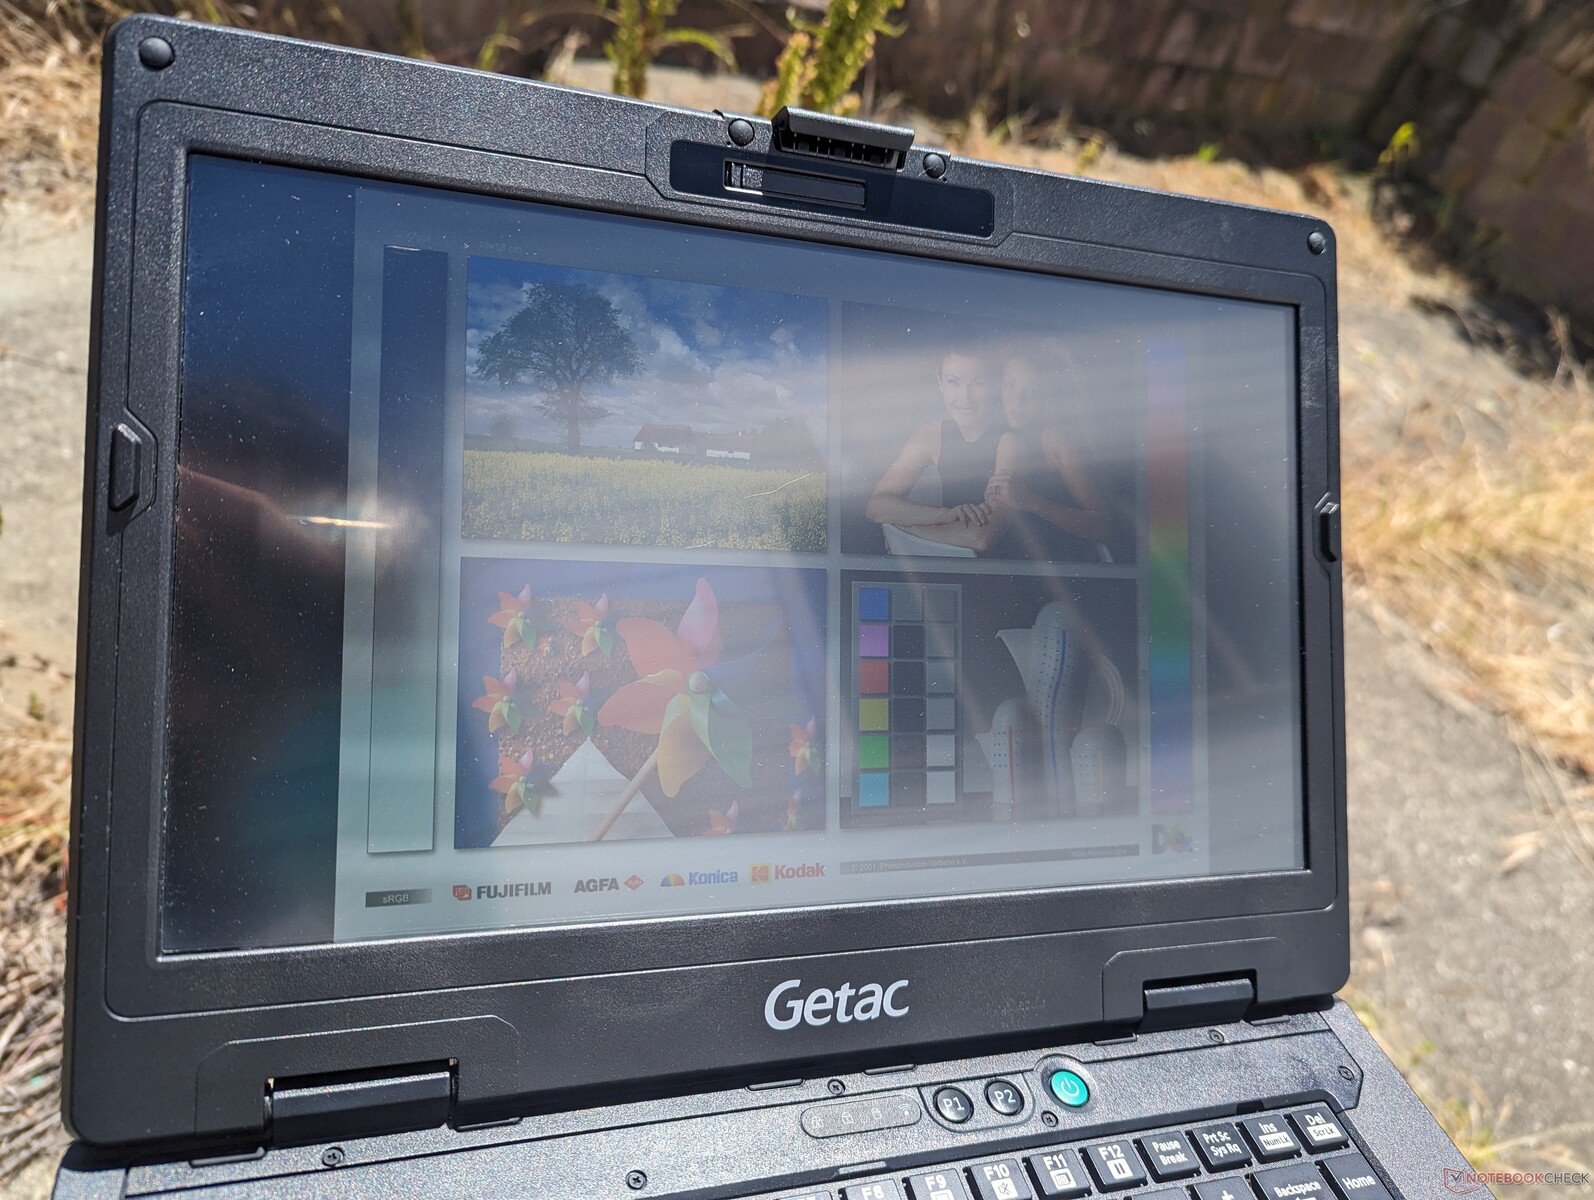
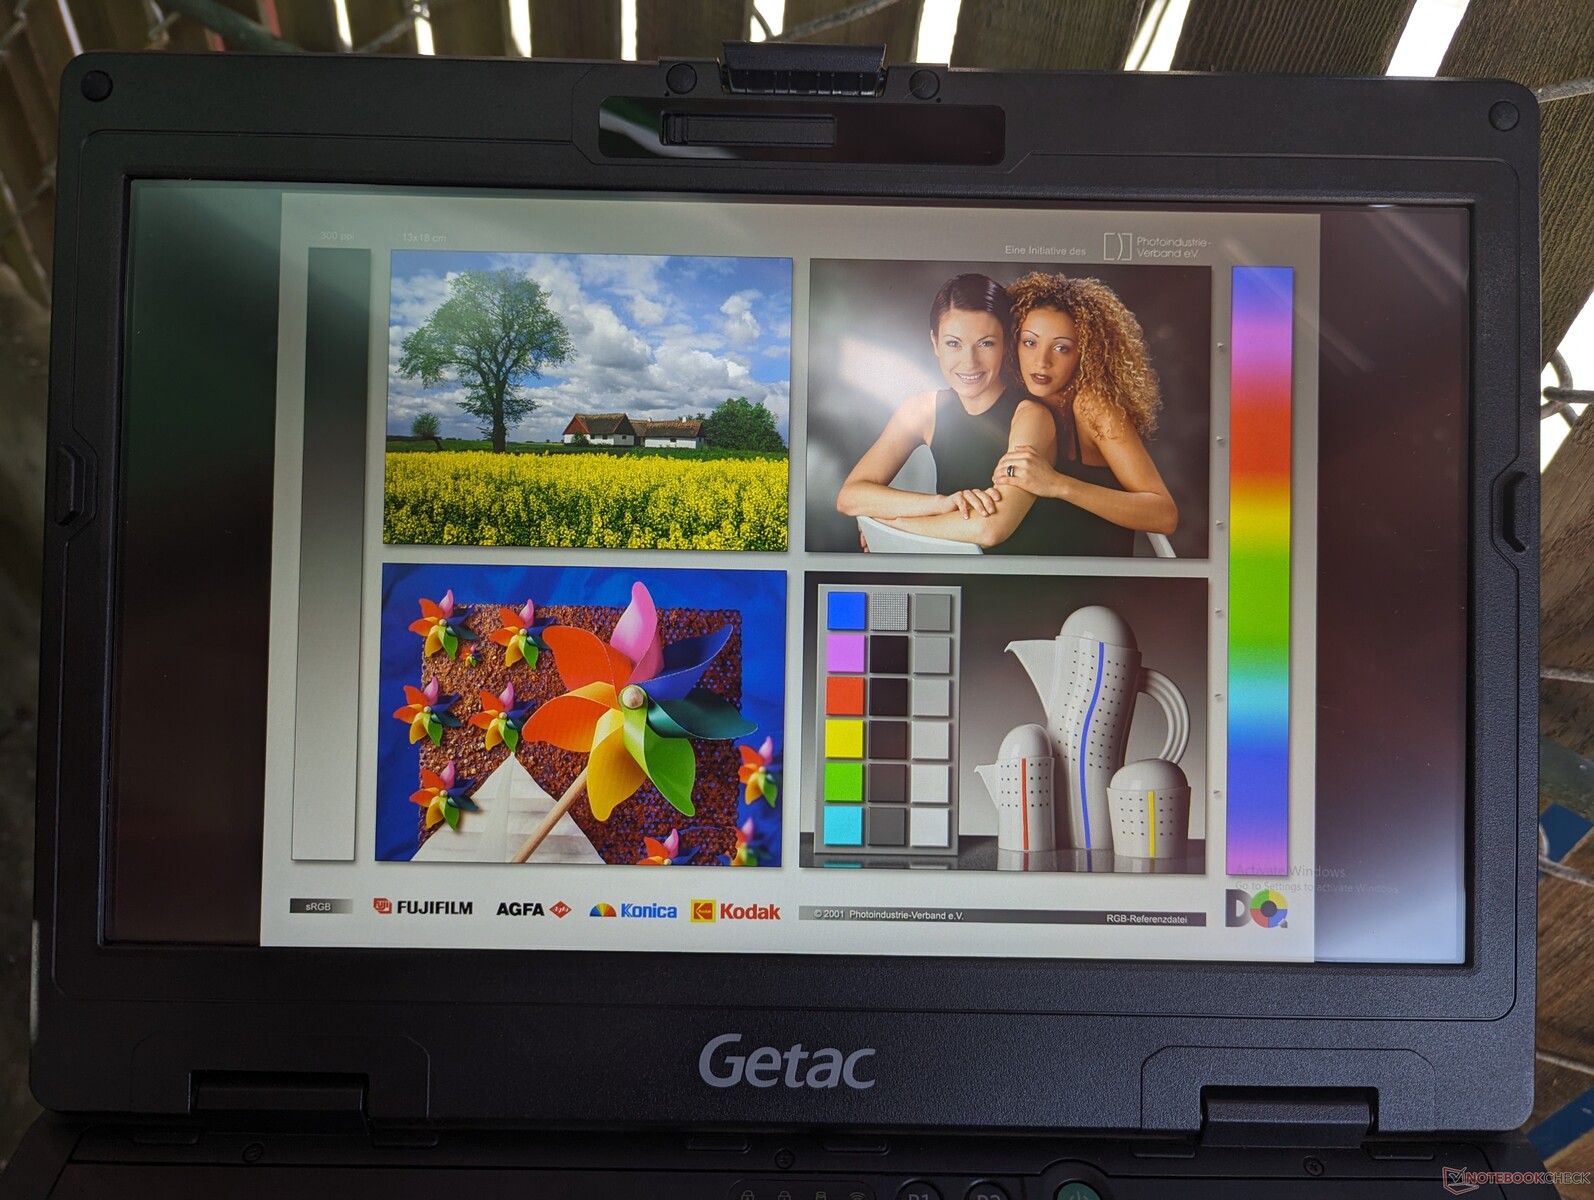
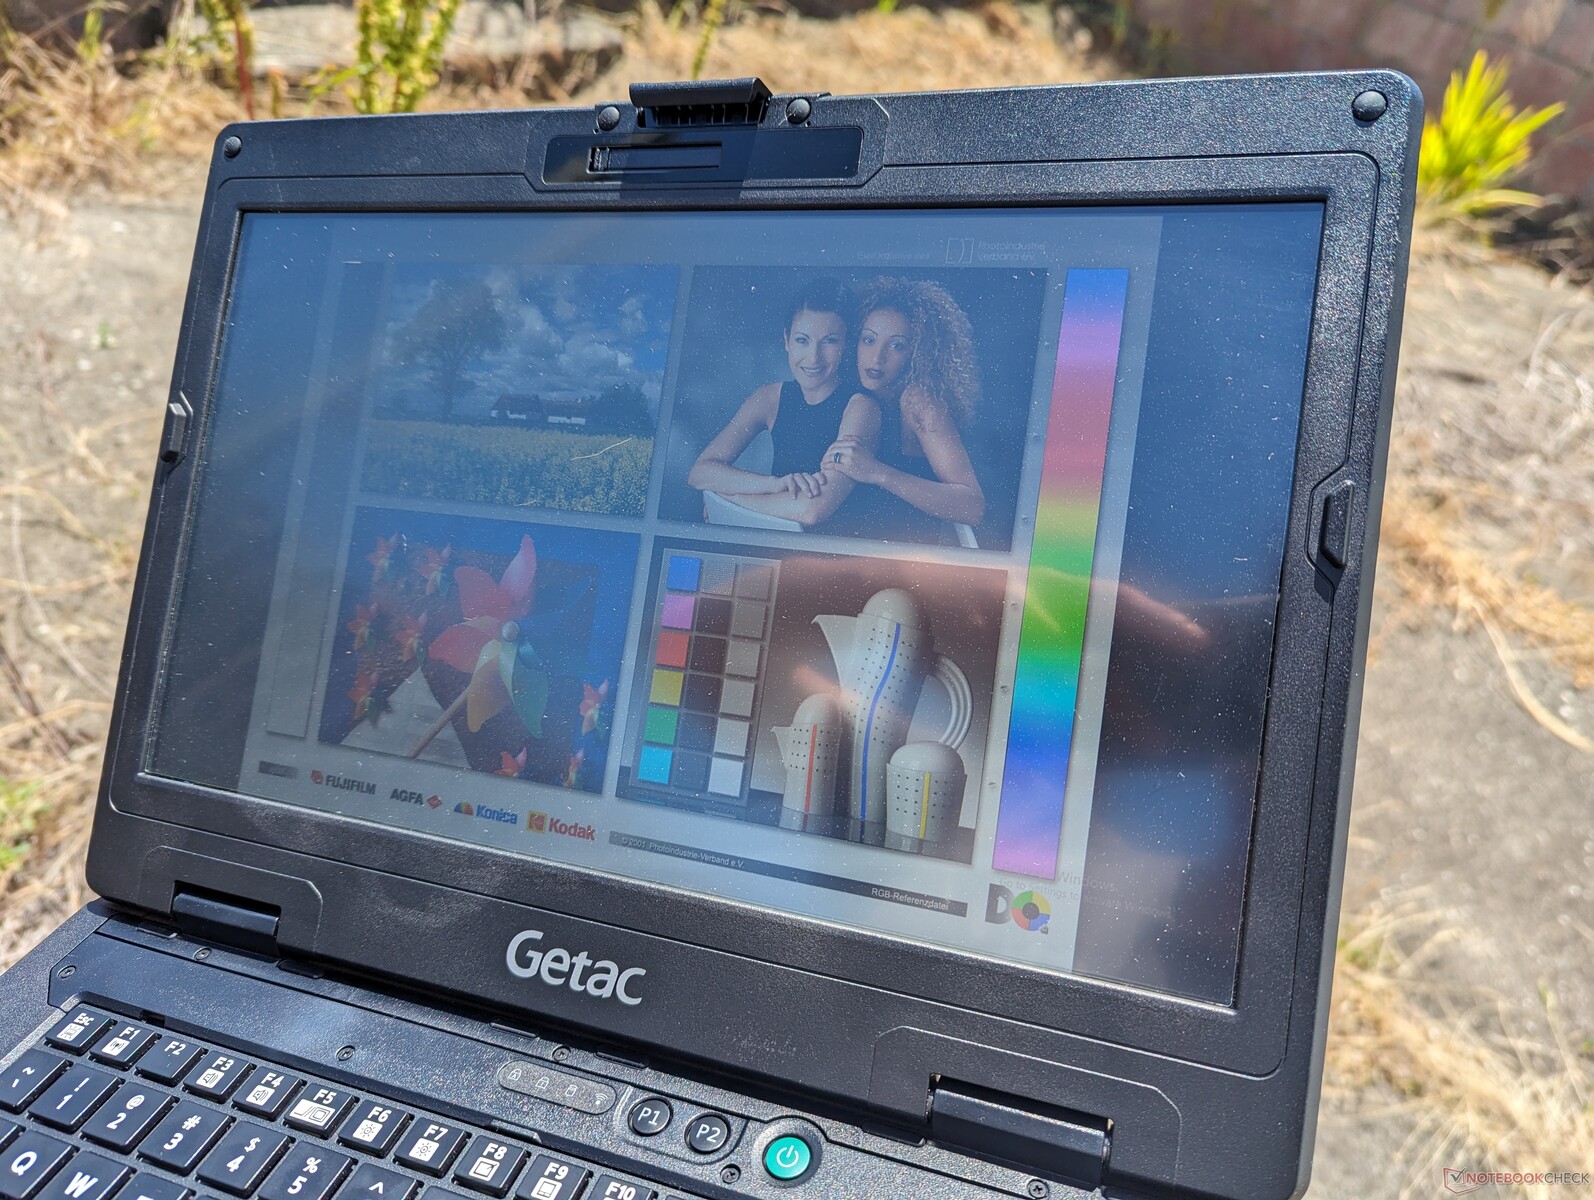
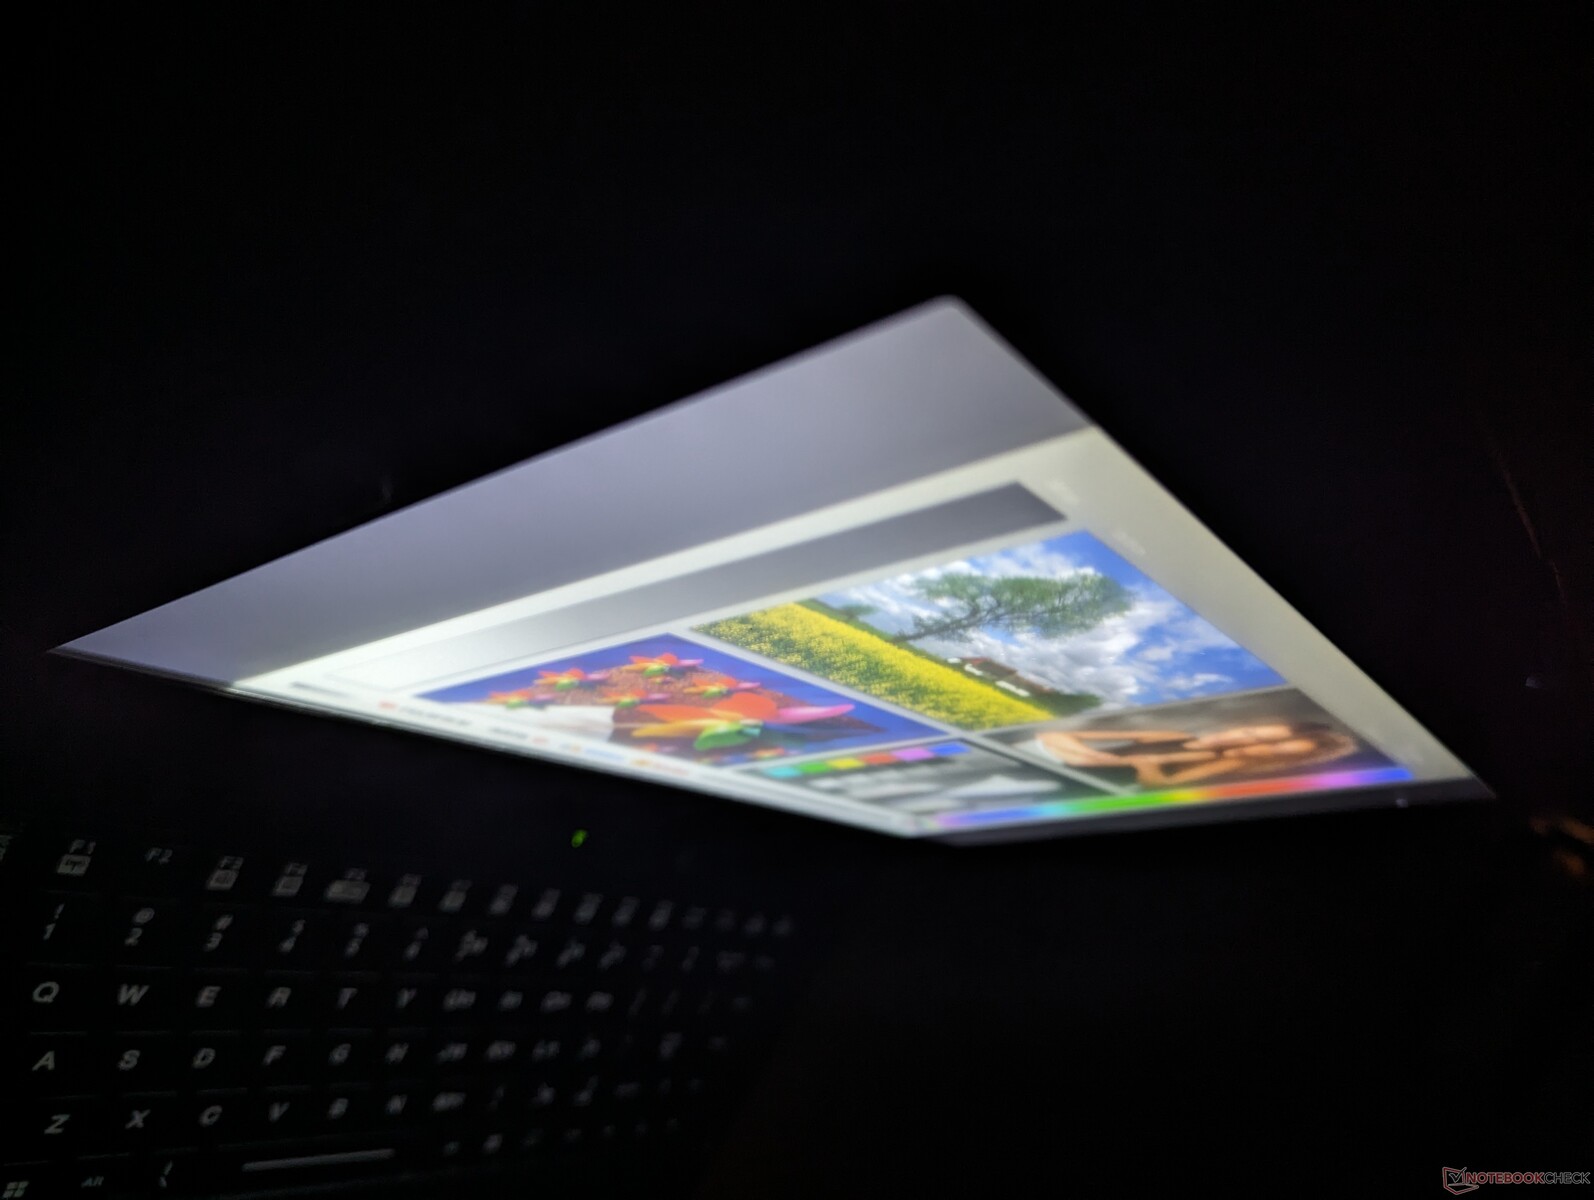
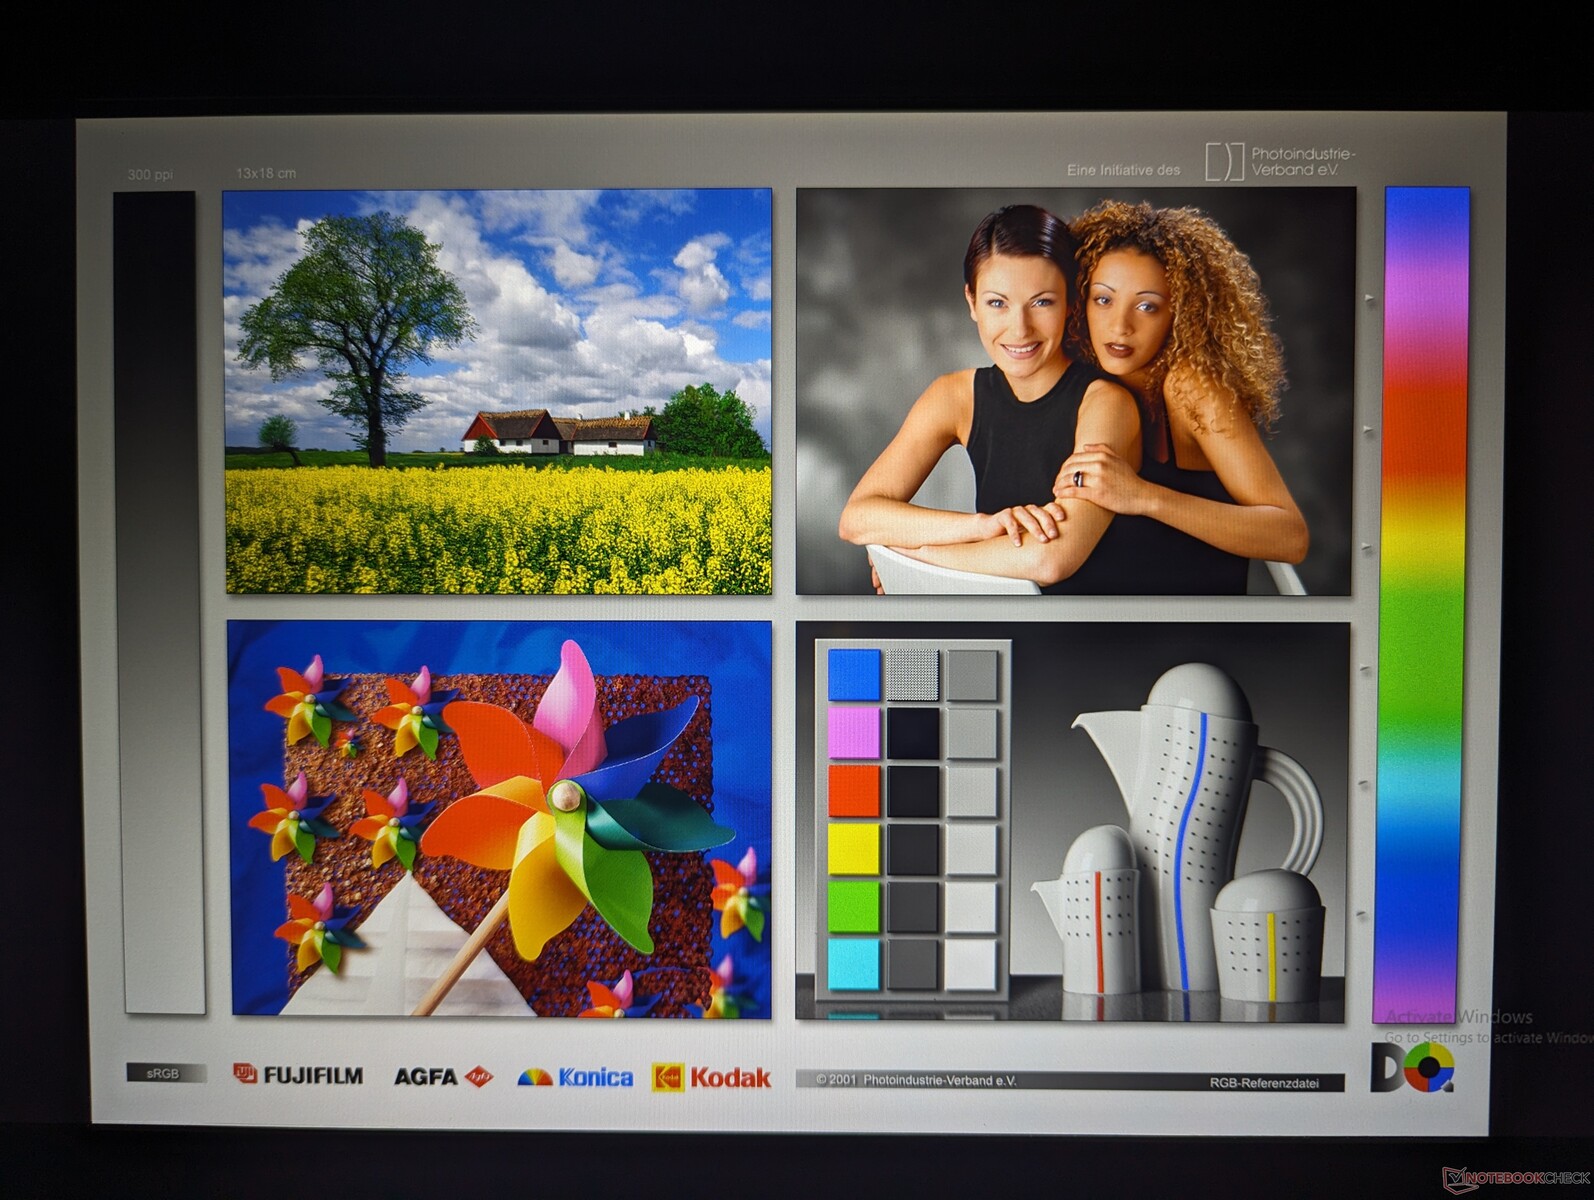
Display - Tempi di risposta nero-bianco più rapidi
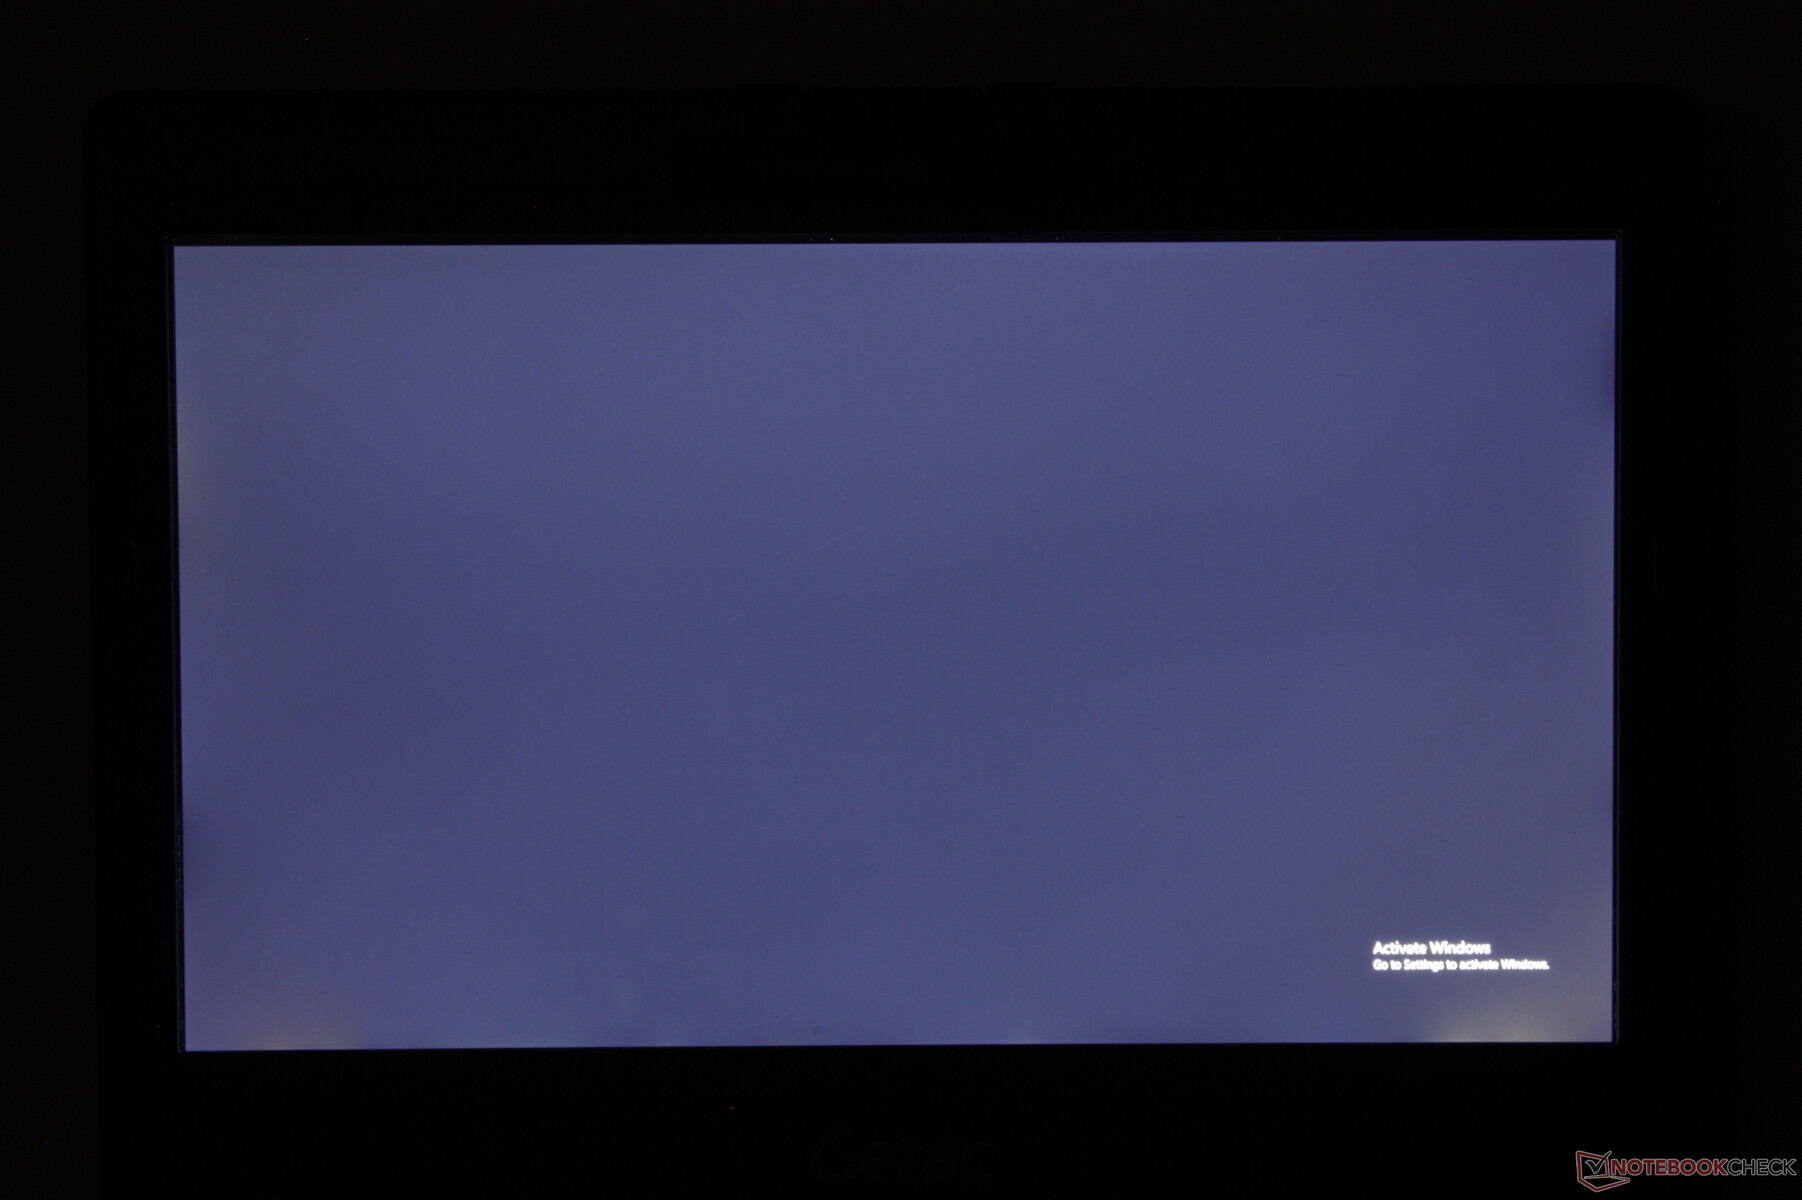
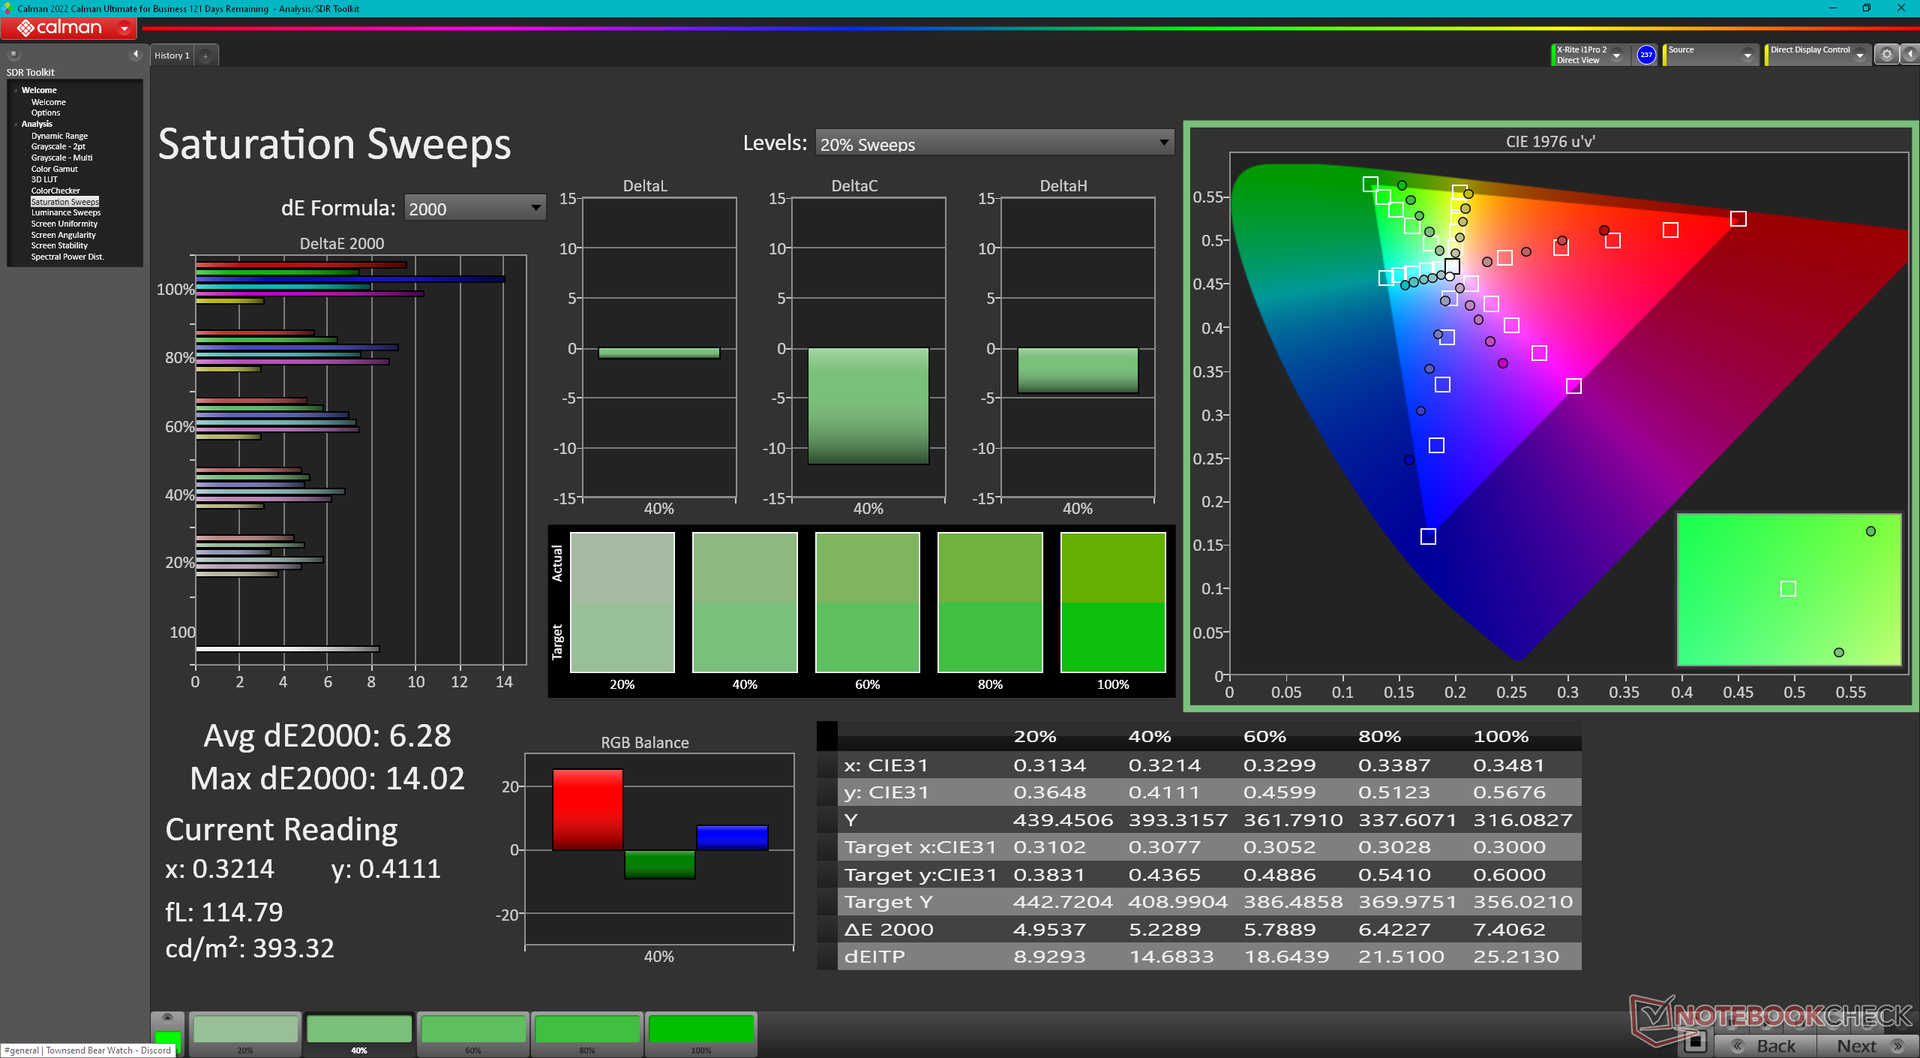
Il nostro S410 G5 viene fornito con un pannello di TCL CSOT (SNE001BS1-1), mentre l'S410 G4 viene fornito con un pannello di AU Optronics. Il pannello TCL offre tempi di risposta più rapidi per il bianco-nero e il grigio-grigio, per ridurre le immagini fantasma, che erano un problema evidente sull'S410 G4. Per il resto, tutte le altre caratteristiche rimangono pressoché invariate, compresa la luminosità di 1000 nit, il rapporto di contrasto decente di 1000:1 e i colori limitati <60% sRGB.

| |||||||||||||||||||||||||
Distribuzione della luminosità: 86 %
Al centro con la batteria: 958.4 cd/m²
Contrasto: 998:1 (Nero: 0.96 cd/m²)
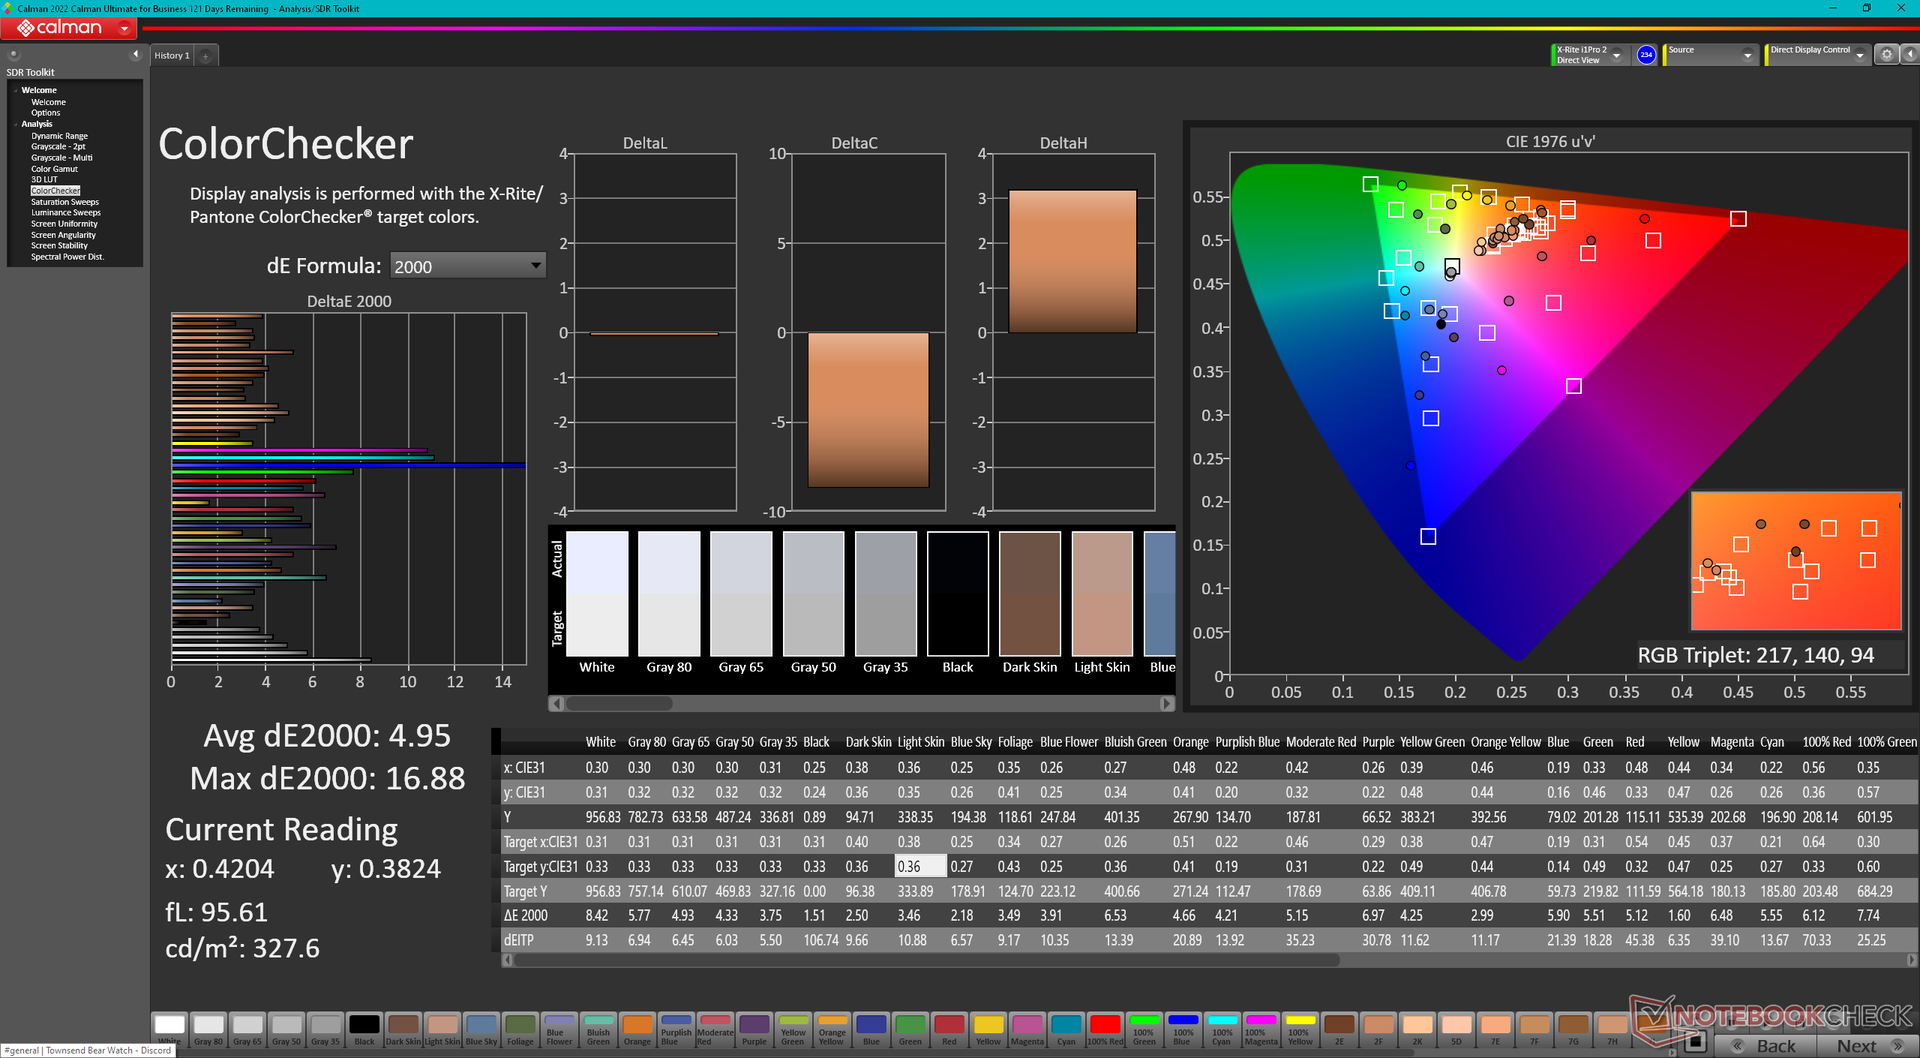
ΔE Color 4.95 | 0.5-29.43 Ø4.87, calibrated: 1.96
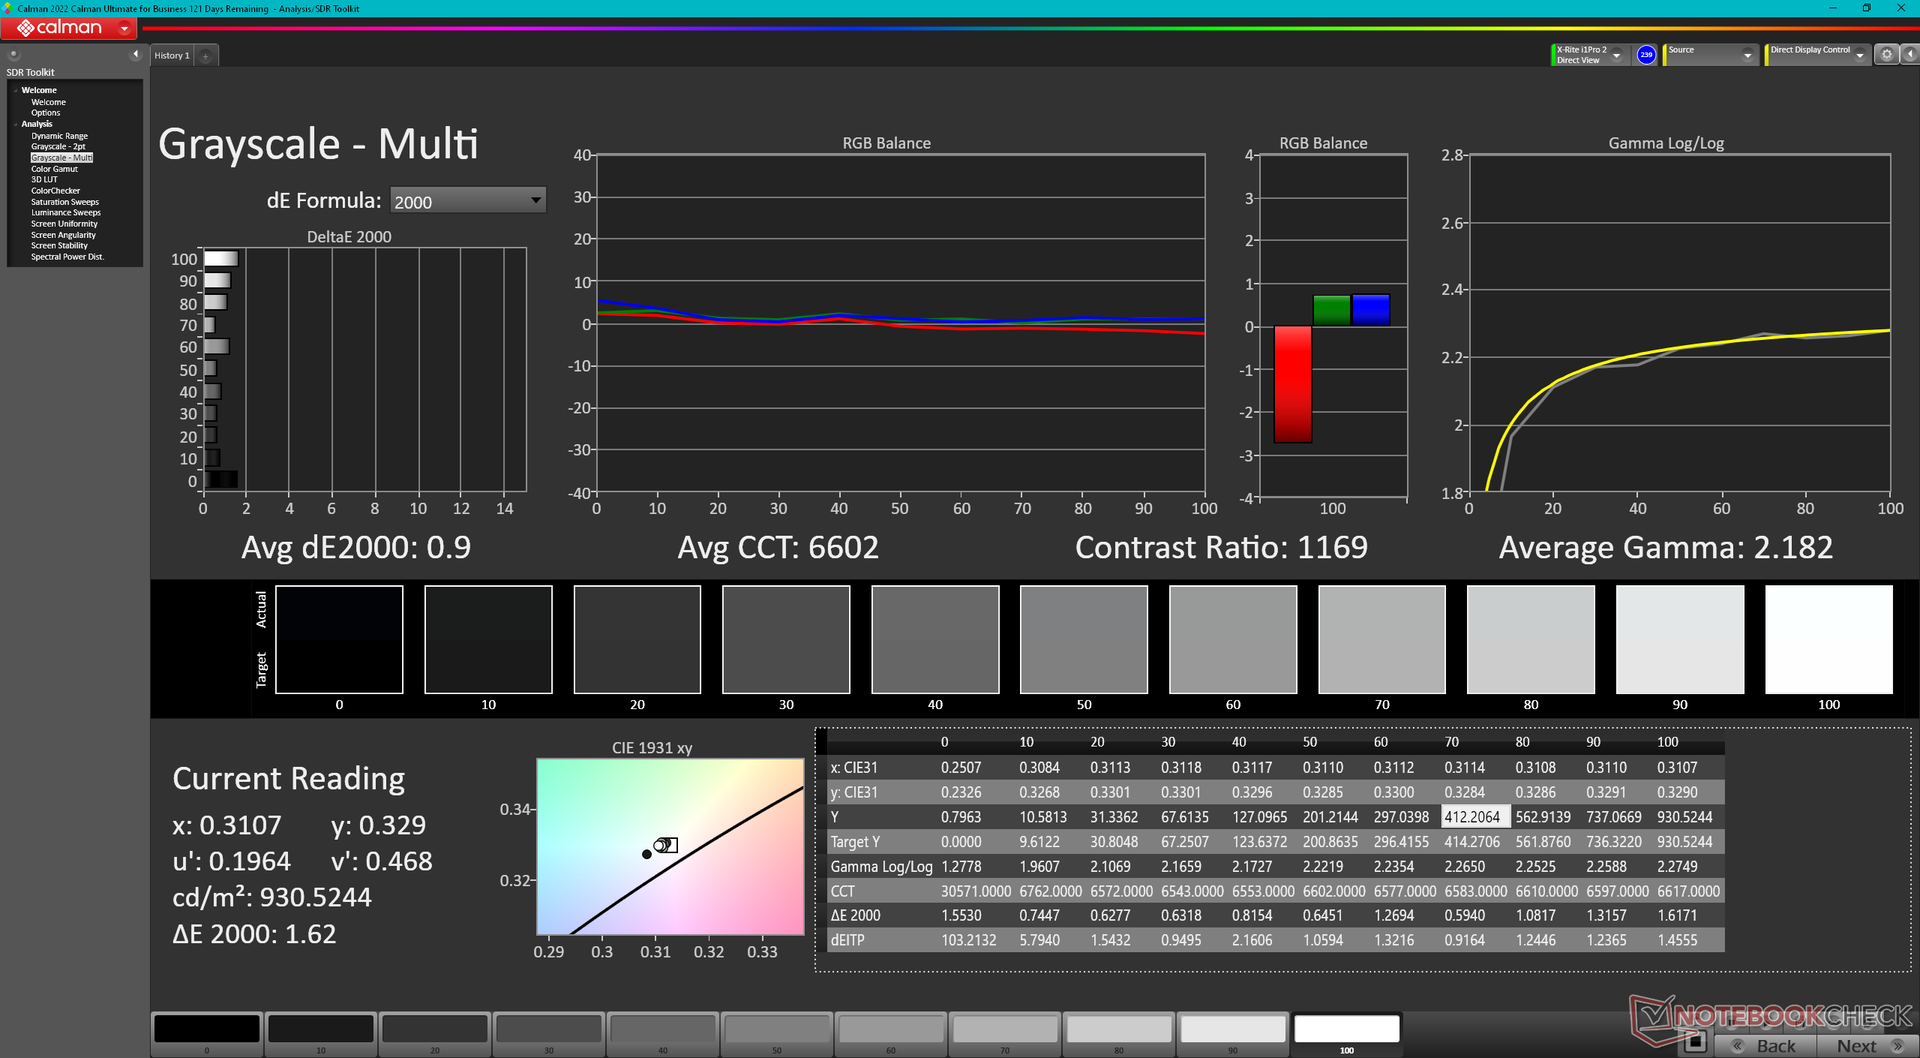
ΔE Greyscale 3.9 | 0.5-98 Ø5.1
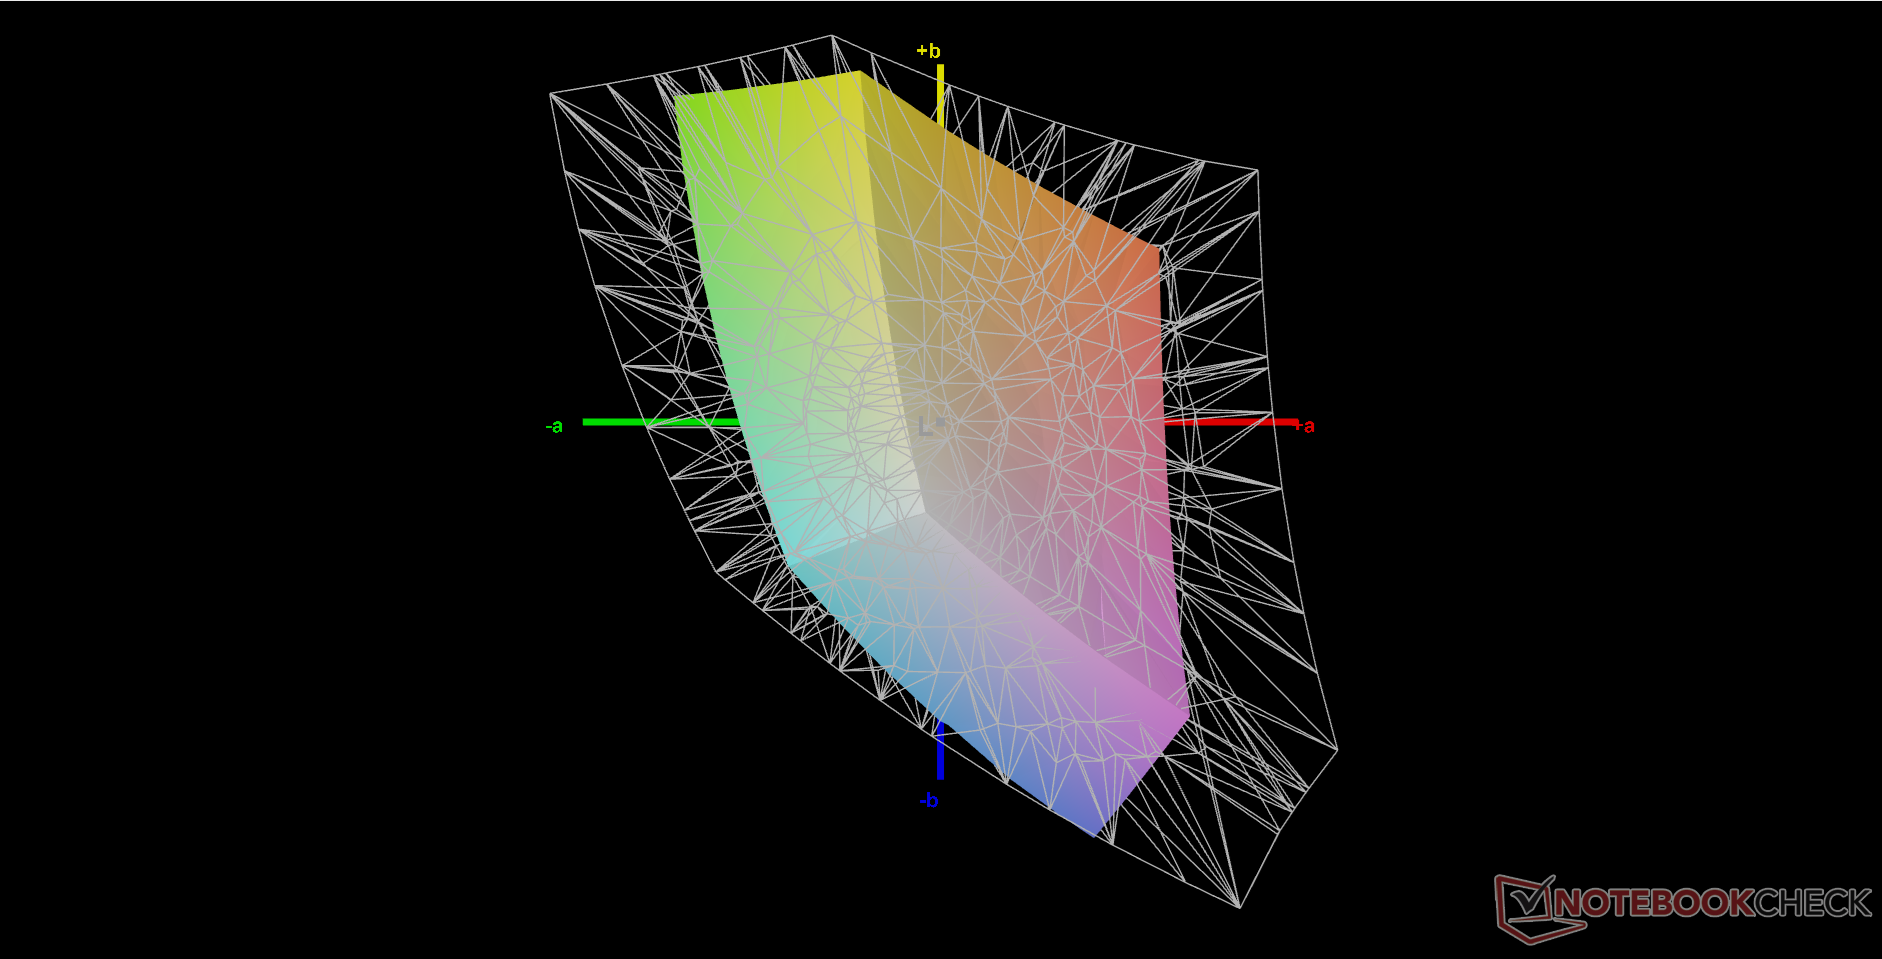
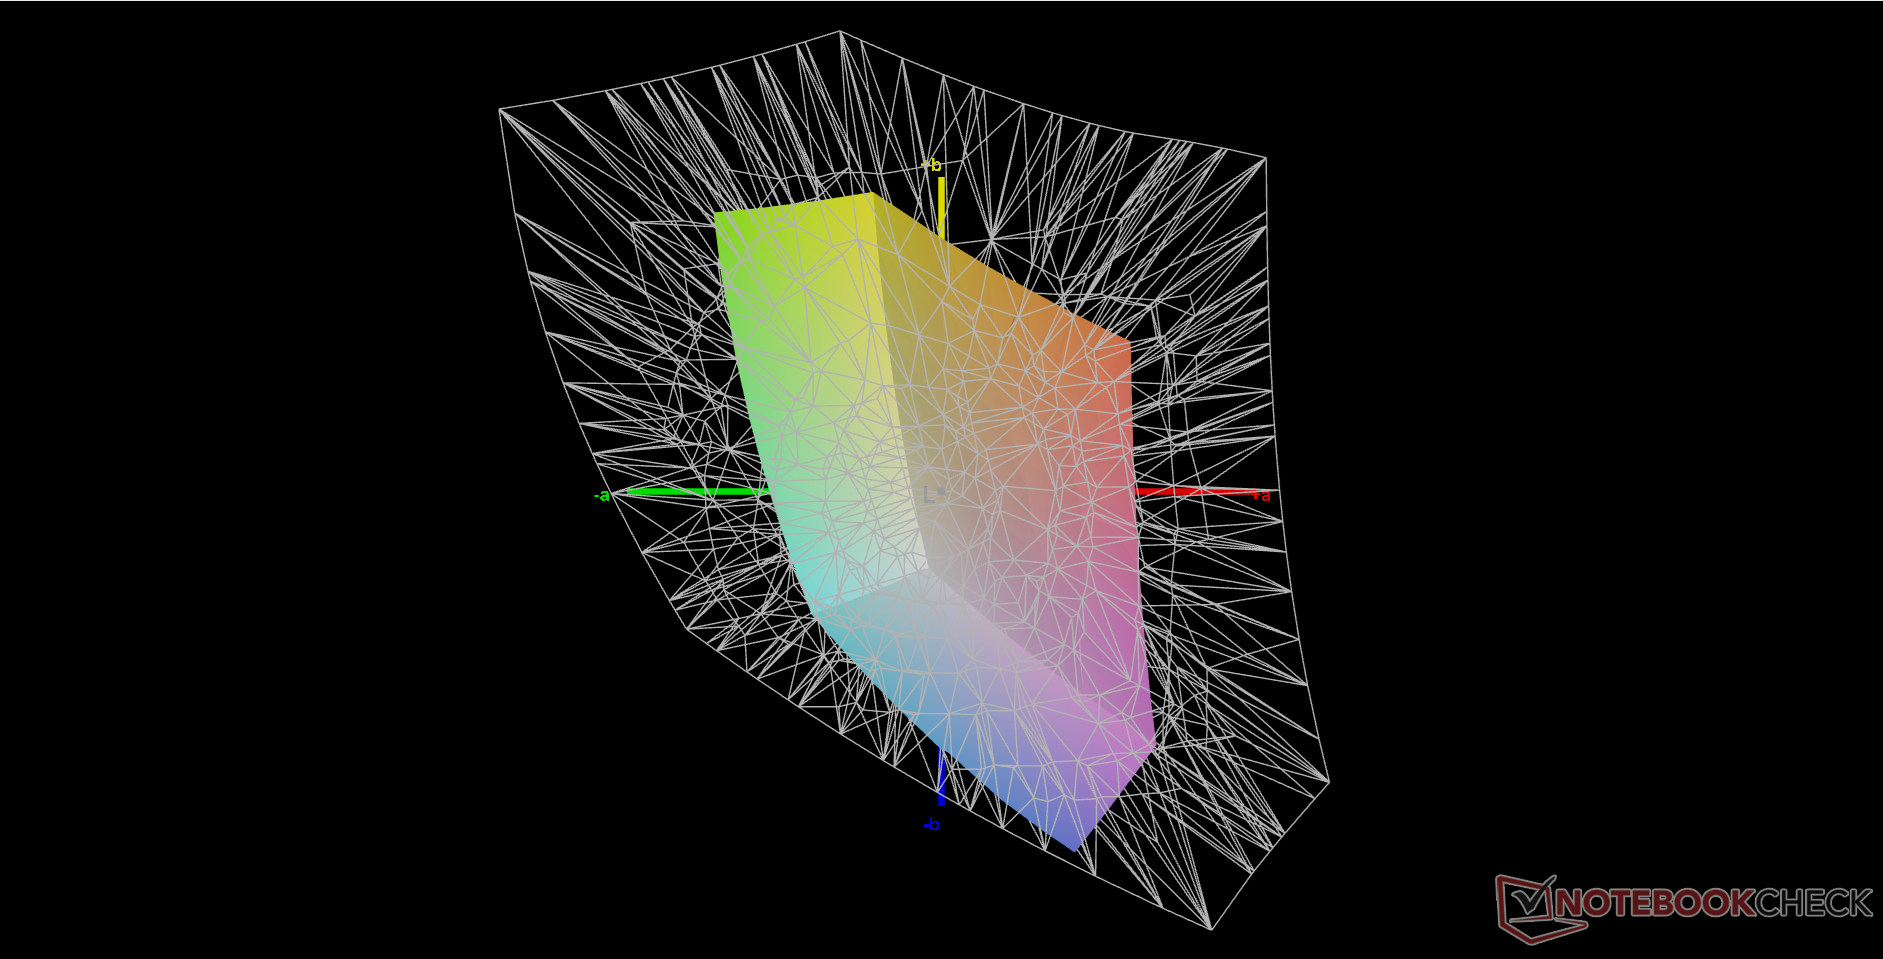
39.8% AdobeRGB 1998 (Argyll 2.2.0 3D)
57.9% sRGB (Argyll 2.2.0 3D)
38.5% Display P3 (Argyll 2.2.0 3D)
Gamma: 2.14
| Getac S410 G5 CSOT T9 SNE001BS1-1, IPS, 1920x1080, 14" | Getac S410 Gen 4 AU Optronics AUO413D, IPS, 1920x1080, 14" | Durabook S14I KD140N0730A01, TN, 1920x1080, 14" | Dell Latitude 14 5420-D2G5W AUO5491 / B140HAN, IPS, 1920x1080, 14" | Dell Latitude 7330 Rugged Extreme Sharp LQ133M1, IPS, 1920x1080, 13.3" | Panasonic Toughbook 40 InfoVision M140NWF5 R3, IPS, 1920x1080, 14" | |
|---|---|---|---|---|---|---|
| Display | -1% | 13% | -7% | 72% | -7% | |
| Display P3 Coverage | 38.5 | 38.3 -1% | 43.55 13% | 36 -6% | 67.1 74% | 35.8 -7% |
| sRGB Coverage | 57.9 | 57.2 -1% | 65.4 13% | 54 -7% | 98.2 70% | 53.8 -7% |
| AdobeRGB 1998 Coverage | 39.8 | 39.5 -1% | 45 13% | 37 -7% | 69 73% | 37 -7% |
| Response Times | -30% | -11% | -41% | -143% | -48% | |
| Response Time Grey 50% / Grey 80% * | 29 ? | 35.2 ? -21% | 30.4 ? -5% | 41 ? -41% | 74.4 ? -157% | 50.4 ? -74% |
| Response Time Black / White * | 18.6 ? | 31.2 ? -68% | 11.8 ? 37% | 26 ? -40% | 42.4 ? -128% | 27.6 ? -48% |
| PWM Frequency | 876 ? | 870 ? -1% | 304.9 ? -65% | 694.4 ? -21% | ||
| Screen | -22% | -73% | -10% | 43% | 13% | |
| Brightness middle | 958.4 | 956.9 0% | 1180.7 23% | 290 -70% | 1414.1 48% | 1284.3 34% |
| Brightness | 978 | 984 1% | 1102 13% | 282 -71% | 1282 31% | 1289 32% |
| Brightness Distribution | 86 | 84 -2% | 89 3% | 81 -6% | 84 -2% | 82 -5% |
| Black Level * | 0.96 | 0.81 16% | 1.91 -99% | 0.26 73% | 0.83 14% | 0.89 7% |
| Contrast | 998 | 1181 18% | 618 -38% | 1115 12% | 1704 71% | 1443 45% |
| Colorchecker dE 2000 * | 4.95 | 6.6 -33% | 13.45 -172% | 4.65 6% | 1.99 60% | 4.67 6% |
| Colorchecker dE 2000 max. * | 16.88 | 22.94 -36% | 22.52 -33% | 7.5 56% | 3.75 78% | 19.85 -18% |
| Colorchecker dE 2000 calibrated * | 1.96 | 4.05 -107% | 3.19 -63% | 3.98 -103% | 0.72 63% | 2.21 -13% |
| Greyscale dE 2000 * | 3.9 | 6 -54% | 15.4 -295% | 3.22 17% | 2.8 28% | 2.7 31% |
| Gamma | 2.14 103% | 2.19 100% | 1.97 112% | 2.54 87% | 2.06 107% | 1.97 112% |
| CCT | 7174 91% | 7276 89% | 21134 31% | 6169 105% | 6775 96% | 6222 104% |
| Color Space (Percent of AdobeRGB 1998) | 41.6 | |||||
| Color Space (Percent of sRGB) | 65.5 | |||||
| Media totale (Programma / Settaggio) | -18% /
-19% | -24% /
-44% | -19% /
-13% | -9% /
23% | -14% /
-3% |
* ... Meglio usare valori piccoli
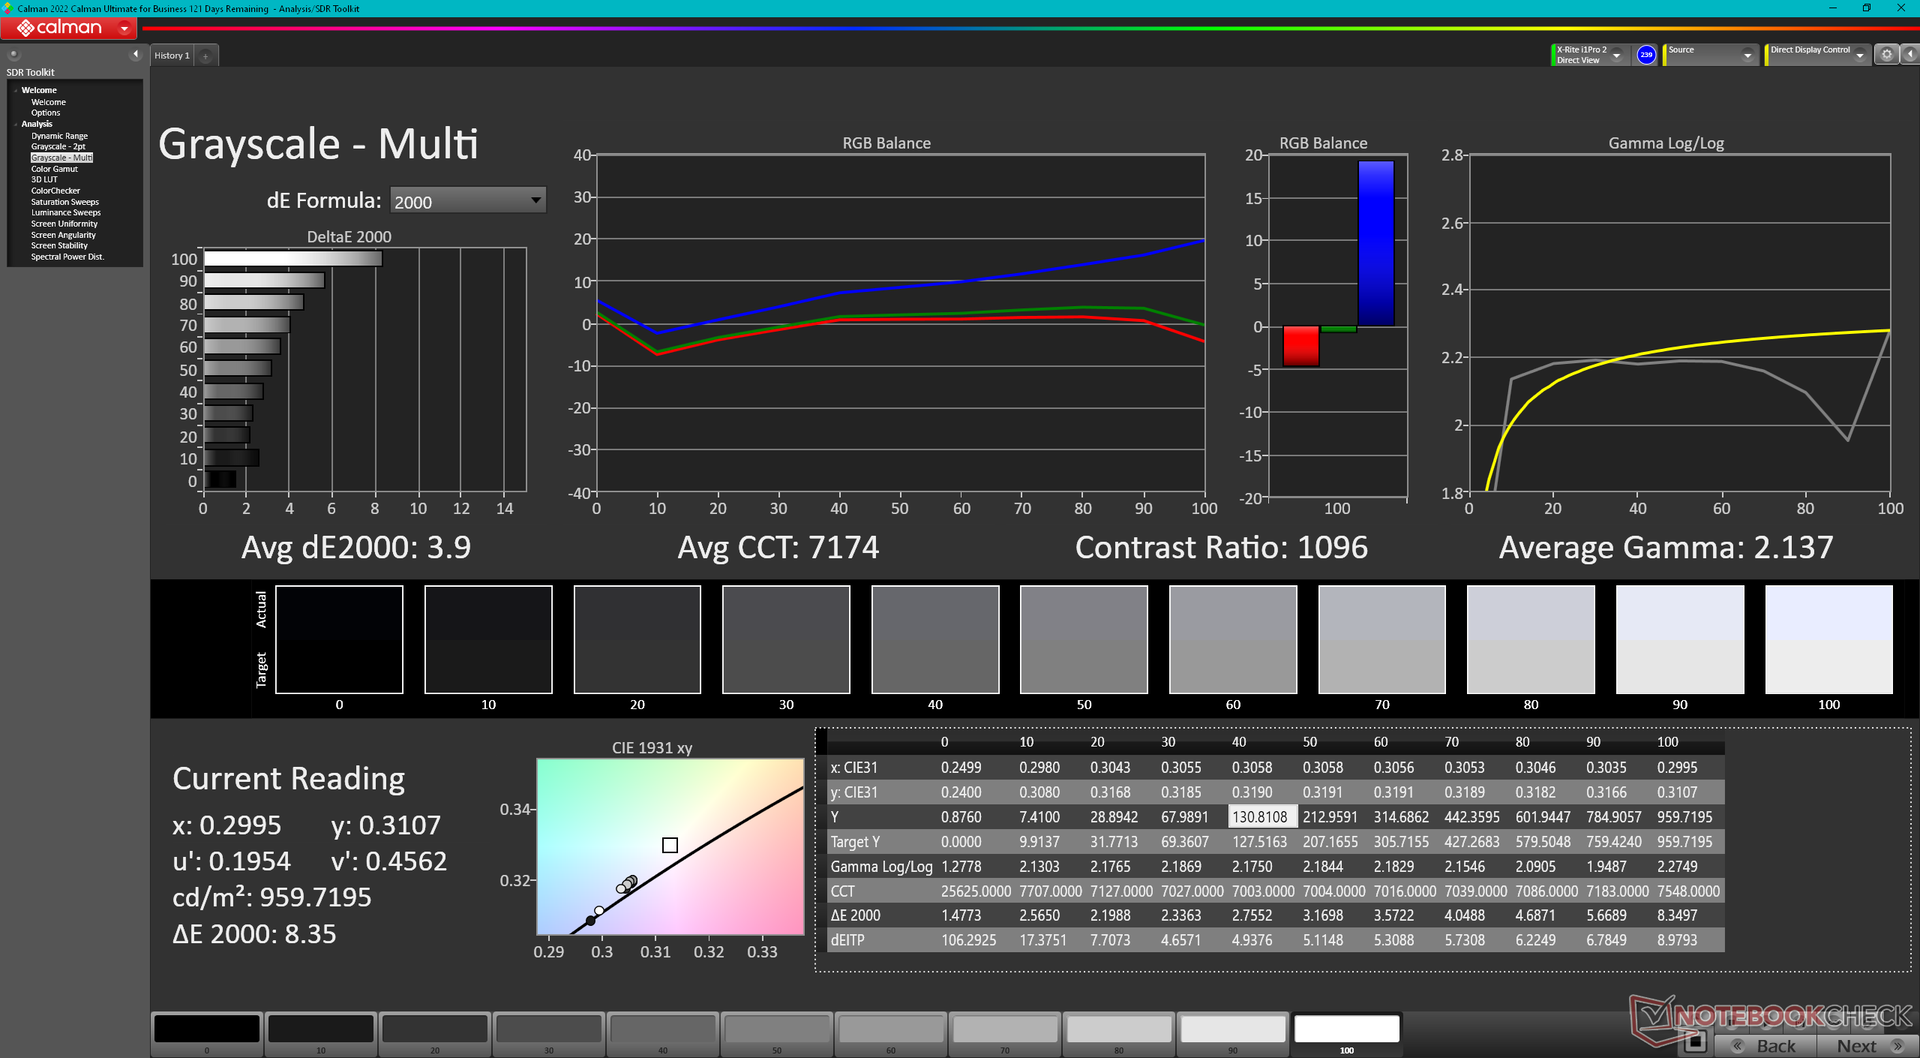
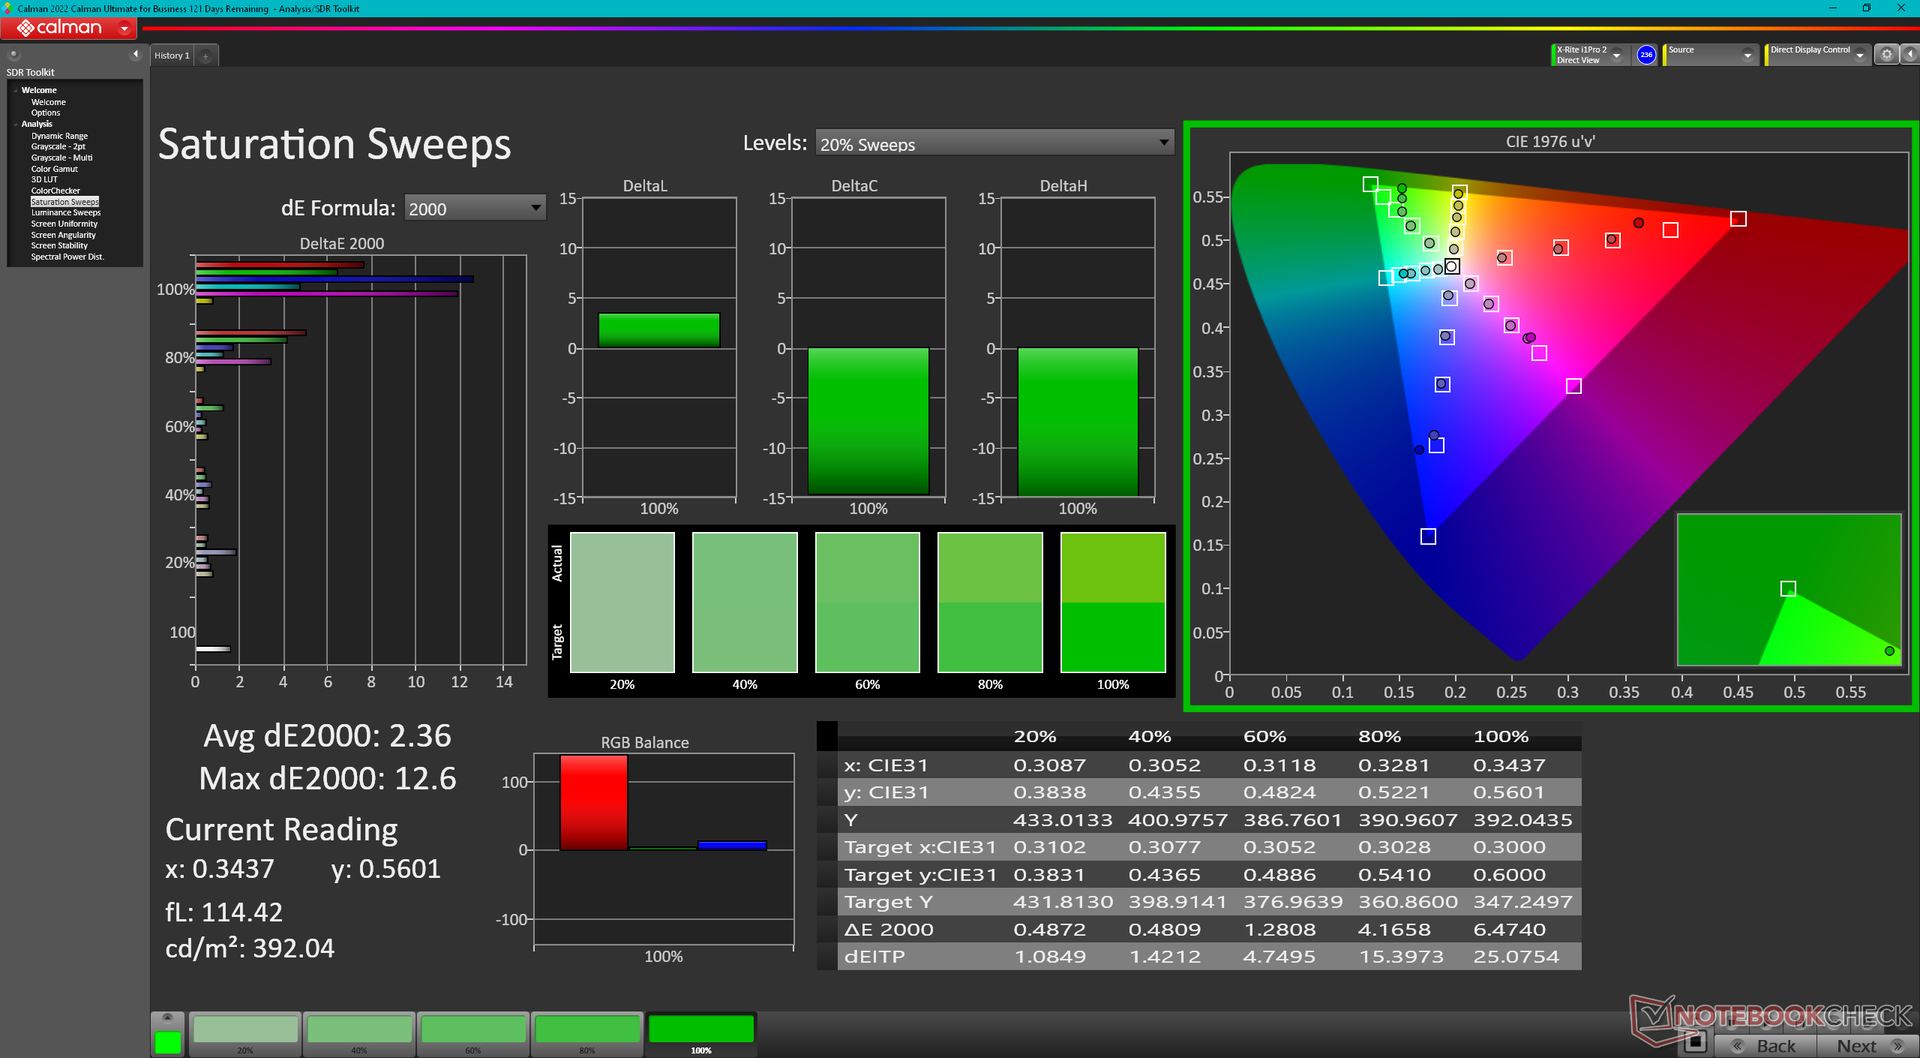
Il display viene fornito mal calibrato, con valori medi di deltaE superiori a 4 e una temperatura del colore eccessivamente fredda. Una corretta calibrazione con il nostro colorimetro X-Rite risolve questi problemi, ma i colori diventano comunque più imprecisi a livelli di saturazione più elevati, a causa dello spazio cromatico limitato di cui sopra. Consigliamo di applicare il nostro profilo ICM calibrato per ottenere il massimo dal display.
Tempi di risposta del Display
| ↔ Tempi di risposta dal Nero al Bianco | ||
|---|---|---|
| 18.6 ms ... aumenta ↗ e diminuisce ↘ combinato | ↗ 9.4 ms Incremento | 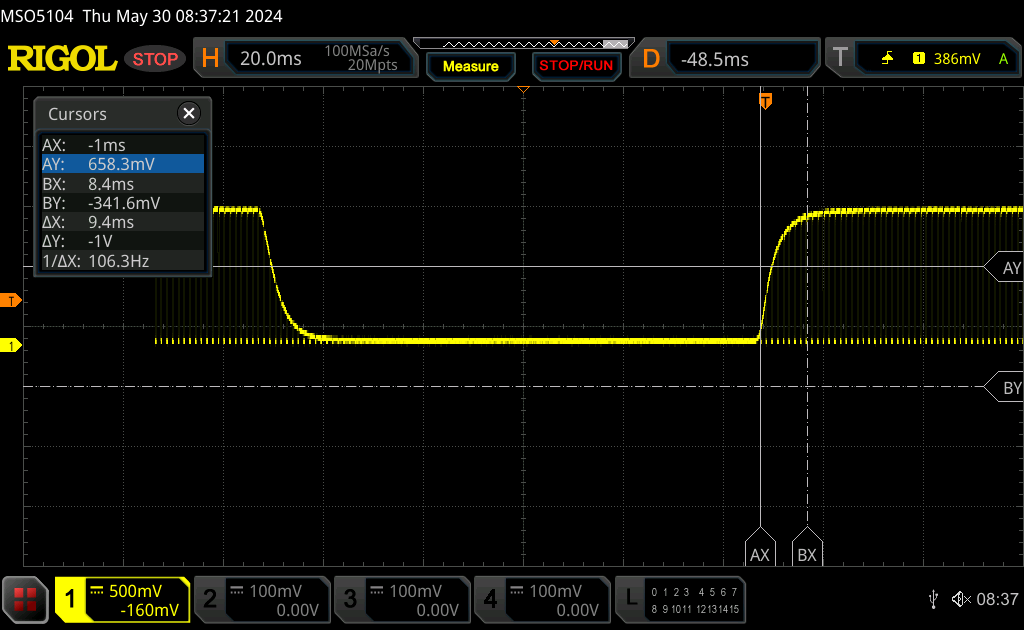 |
| ↘ 9.2 ms Calo | ||
| Lo schermo mostra buoni tempi di risposta durante i nostri tests, ma potrebbe essere troppo lento per i gamers competitivi. In confronto, tutti i dispositivi di test variano da 0.1 (minimo) a 240 (massimo) ms. » 38 % di tutti i dispositivi è migliore. Questo significa che i tempi di risposta rilevati sono migliori rispettto alla media di tutti i dispositivi testati (20.8 ms). | ||
| ↔ Tempo di risposta dal 50% Grigio all'80% Grigio | ||
| 29 ms ... aumenta ↗ e diminuisce ↘ combinato | ↗ 14.6 ms Incremento | 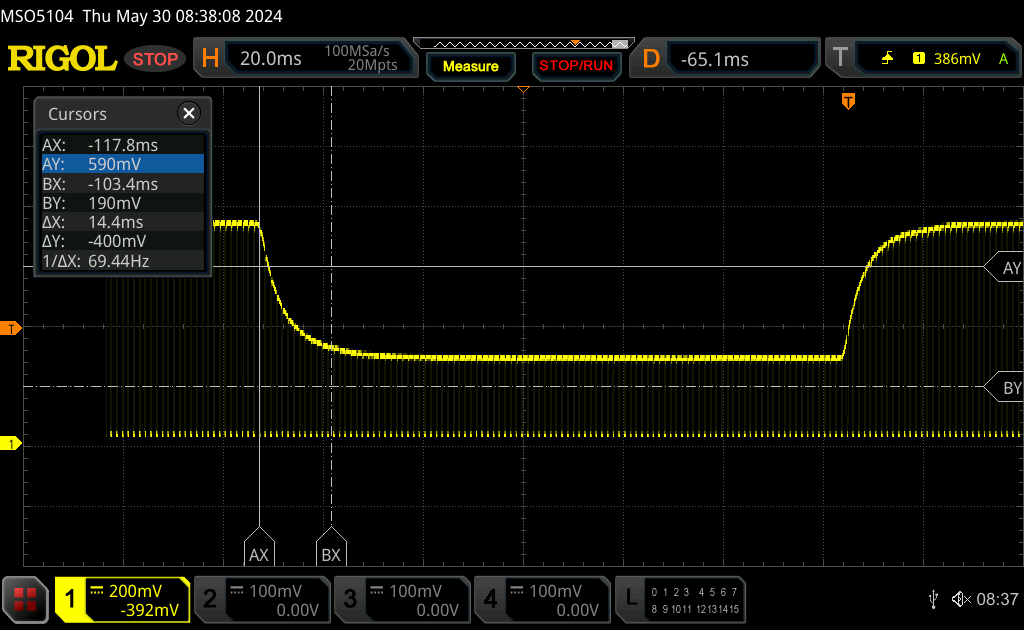 |
| ↘ 14.4 ms Calo | ||
| Lo schermo mostra tempi di risposta relativamente lenti nei nostri tests e potrebbe essere troppo lento per i gamers. In confronto, tutti i dispositivi di test variano da 0.165 (minimo) a 636 (massimo) ms. » 36 % di tutti i dispositivi è migliore. Questo significa che i tempi di risposta rilevati sono migliori rispettto alla media di tutti i dispositivi testati (32.5 ms). | ||
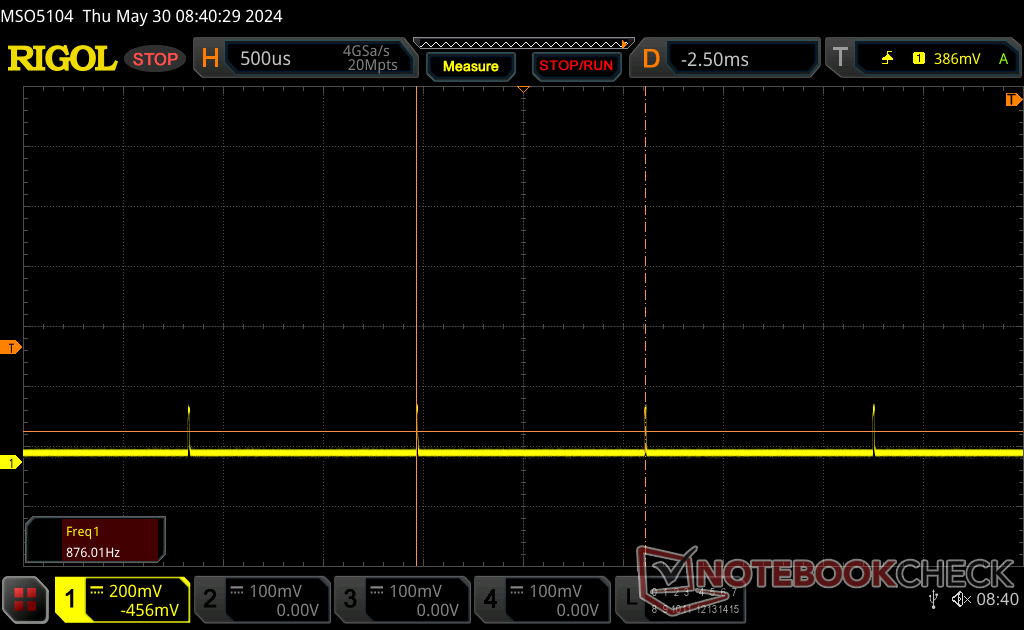
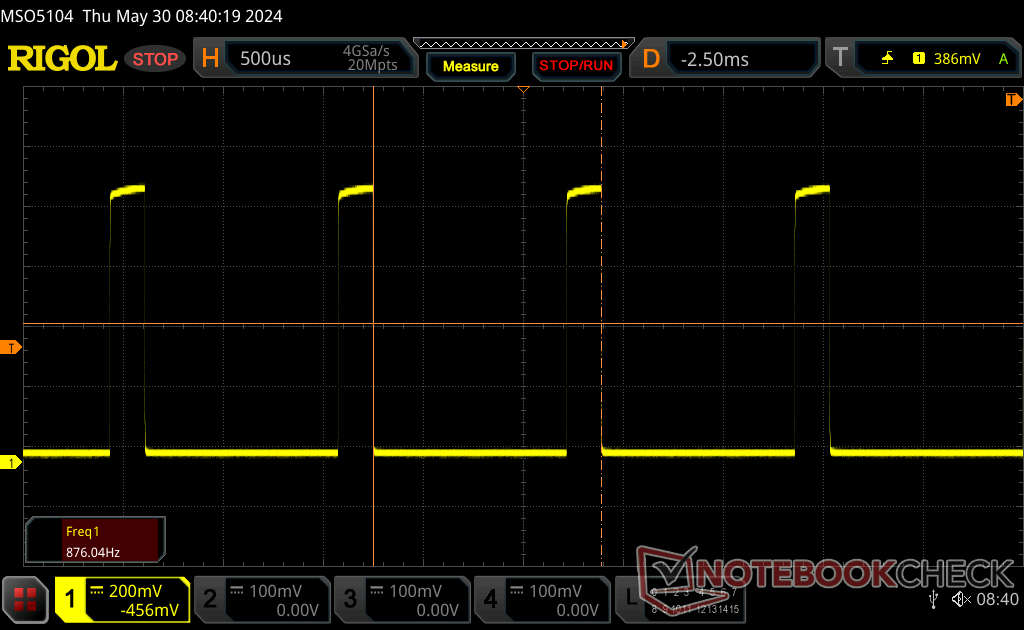
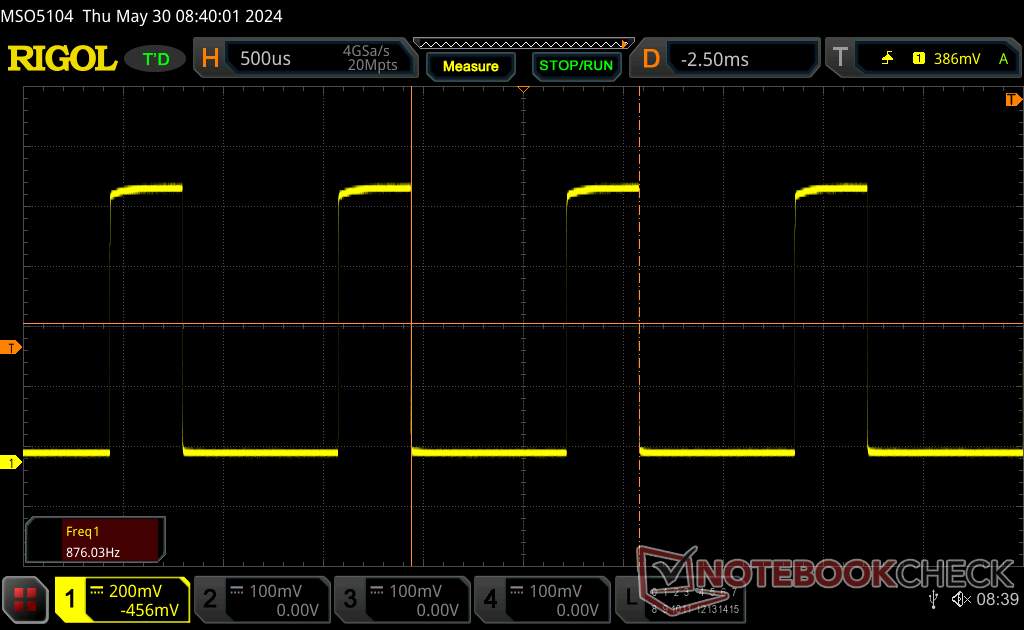
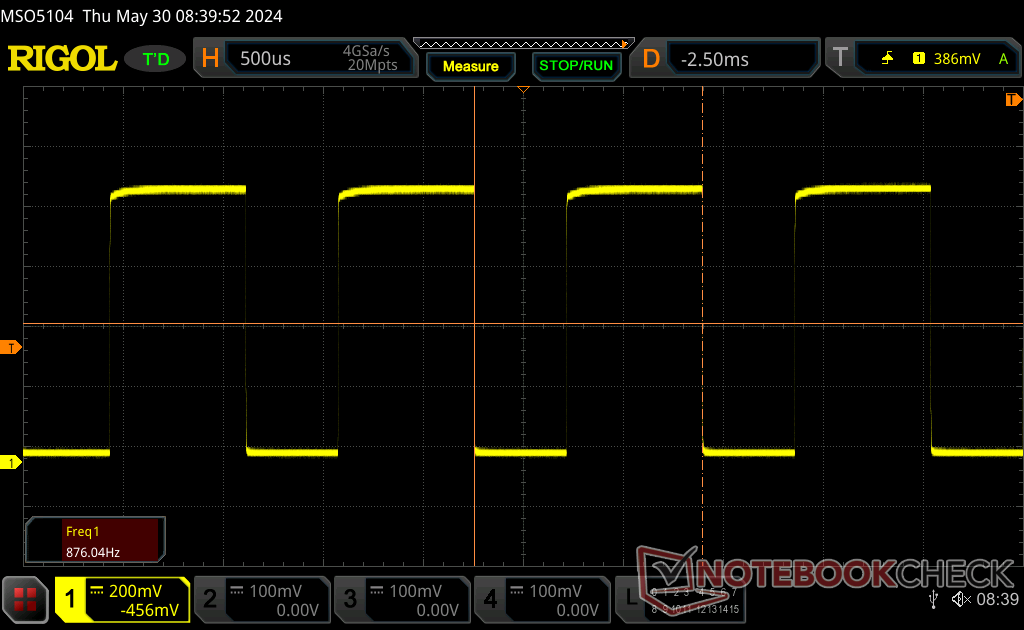
Sfarfallio dello schermo / PWM (Pulse-Width Modulation)
| flickering dello schermo / PWM rilevato | 876 Hz | ≤ 100 % settaggio luminosita' | 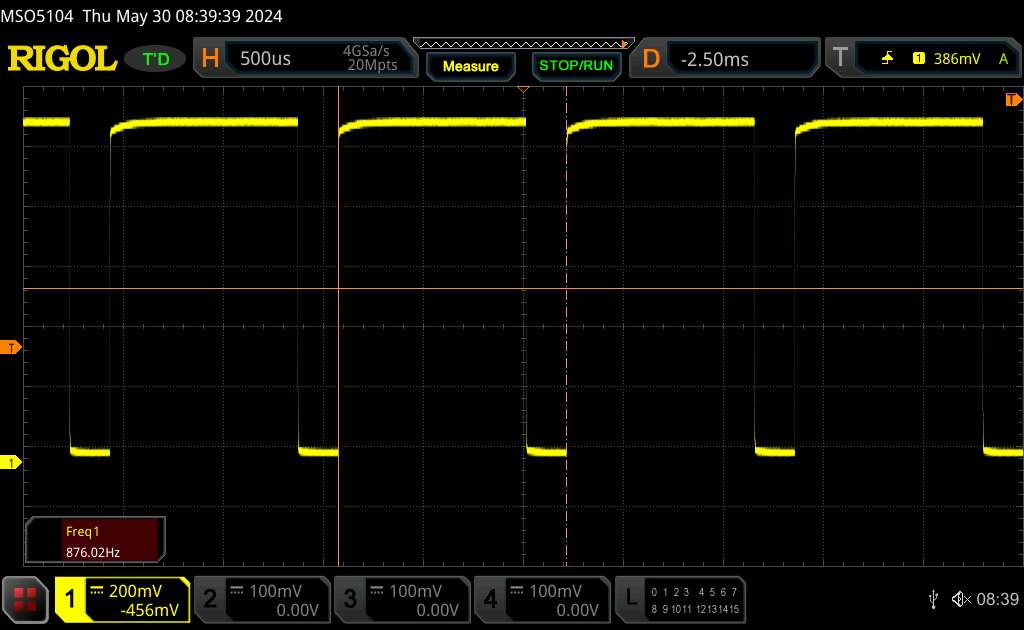 |
Il display sfarfalla a 876 Hz (Probabilmente a causa dell'uso di PWM) Flickering rilevato ad una luminosita' di 100 % o inferiore. Non dovrebbe verificarsi flickering o PWM sopra questo valore di luminosita'. La frequenza di 876 Hz è abbastanza alta, quindi la maggioranza degli utenti sensibili al PWM non dovrebbero notare alcun flickering. In confronto: 53 % di tutti i dispositivi testati non utilizza PWM per ridurre la luminosita' del display. Se è rilevato PWM, una media di 8516 (minimo: 5 - massimo: 343500) Hz è stata rilevata. | |||
La modulazione di larghezza di impulso o sfarfallio è presente su tutti i livelli di luminosità ad una frequenza di 876 Hz. Gli utenti sensibili allo sfarfallio potrebbero voler evitare di utilizzare lo schermo per lunghi periodi o almeno ridurre il livello di luminosità.
Prestazioni - Aggiornamento Raptor Lake-P
Condizioni del test
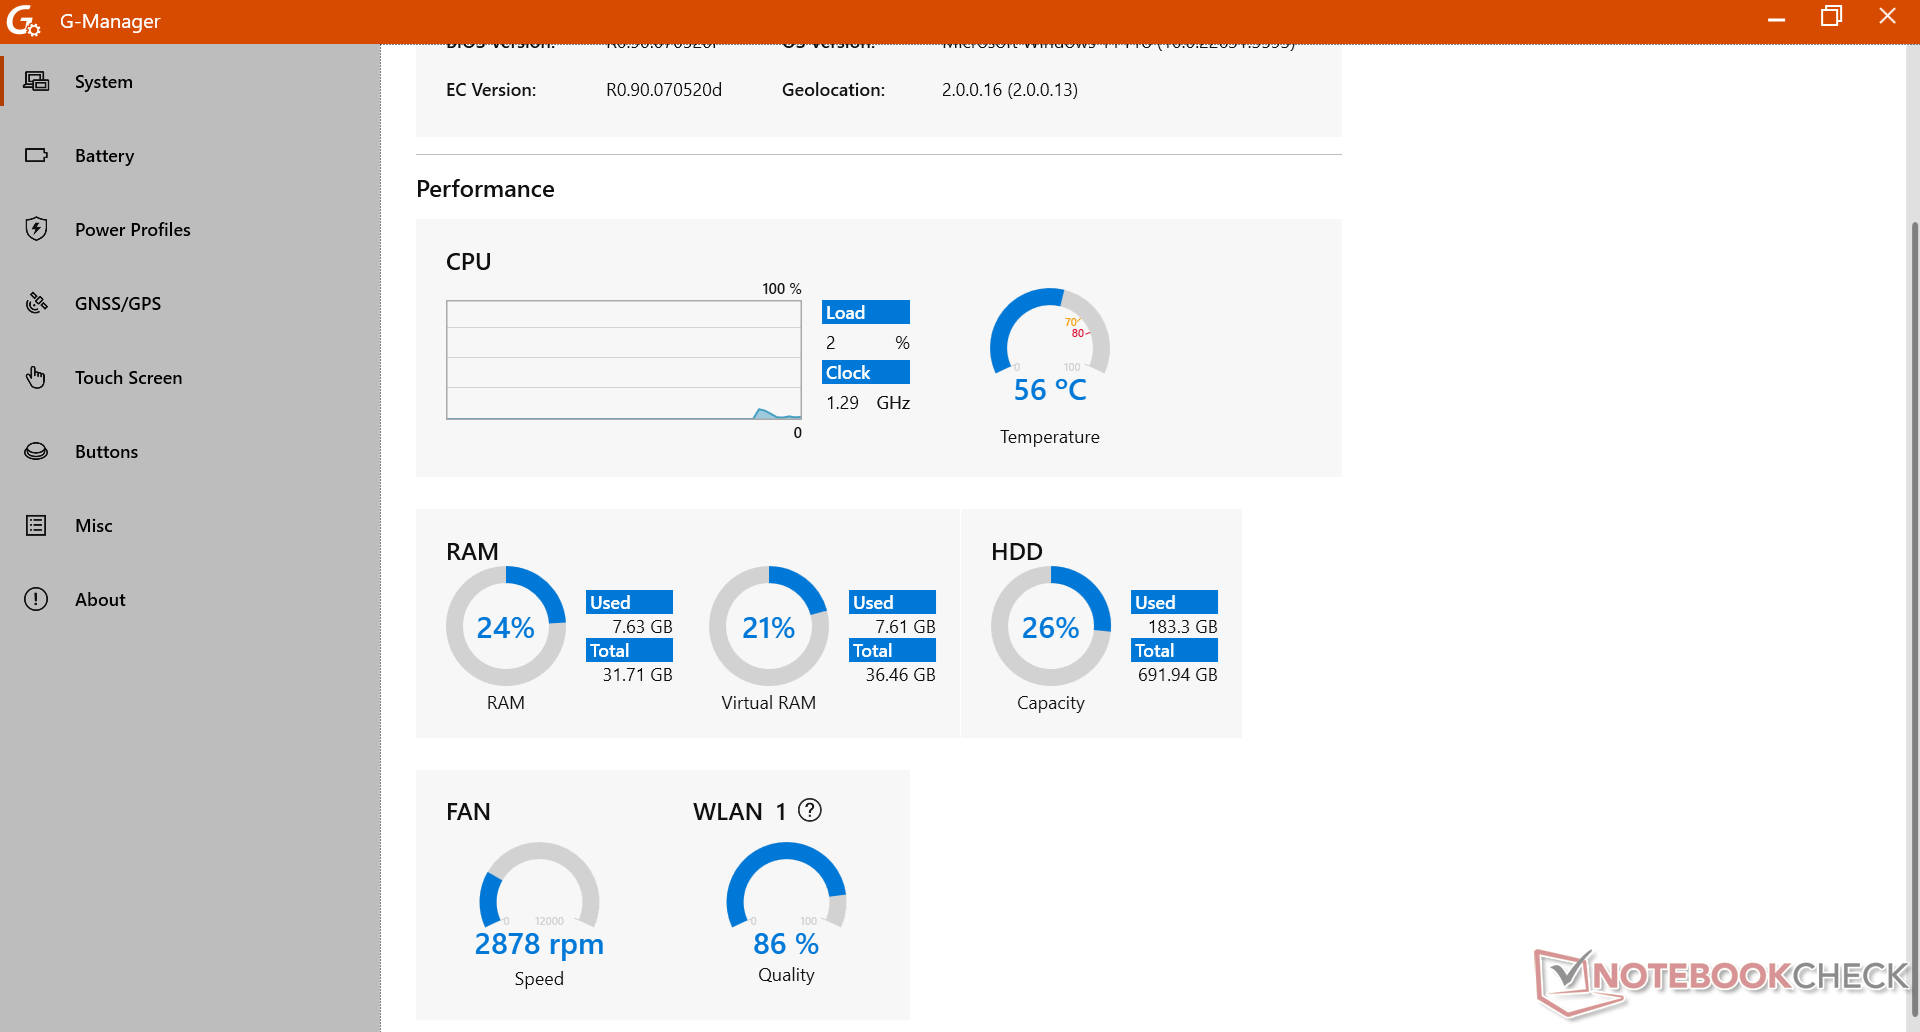
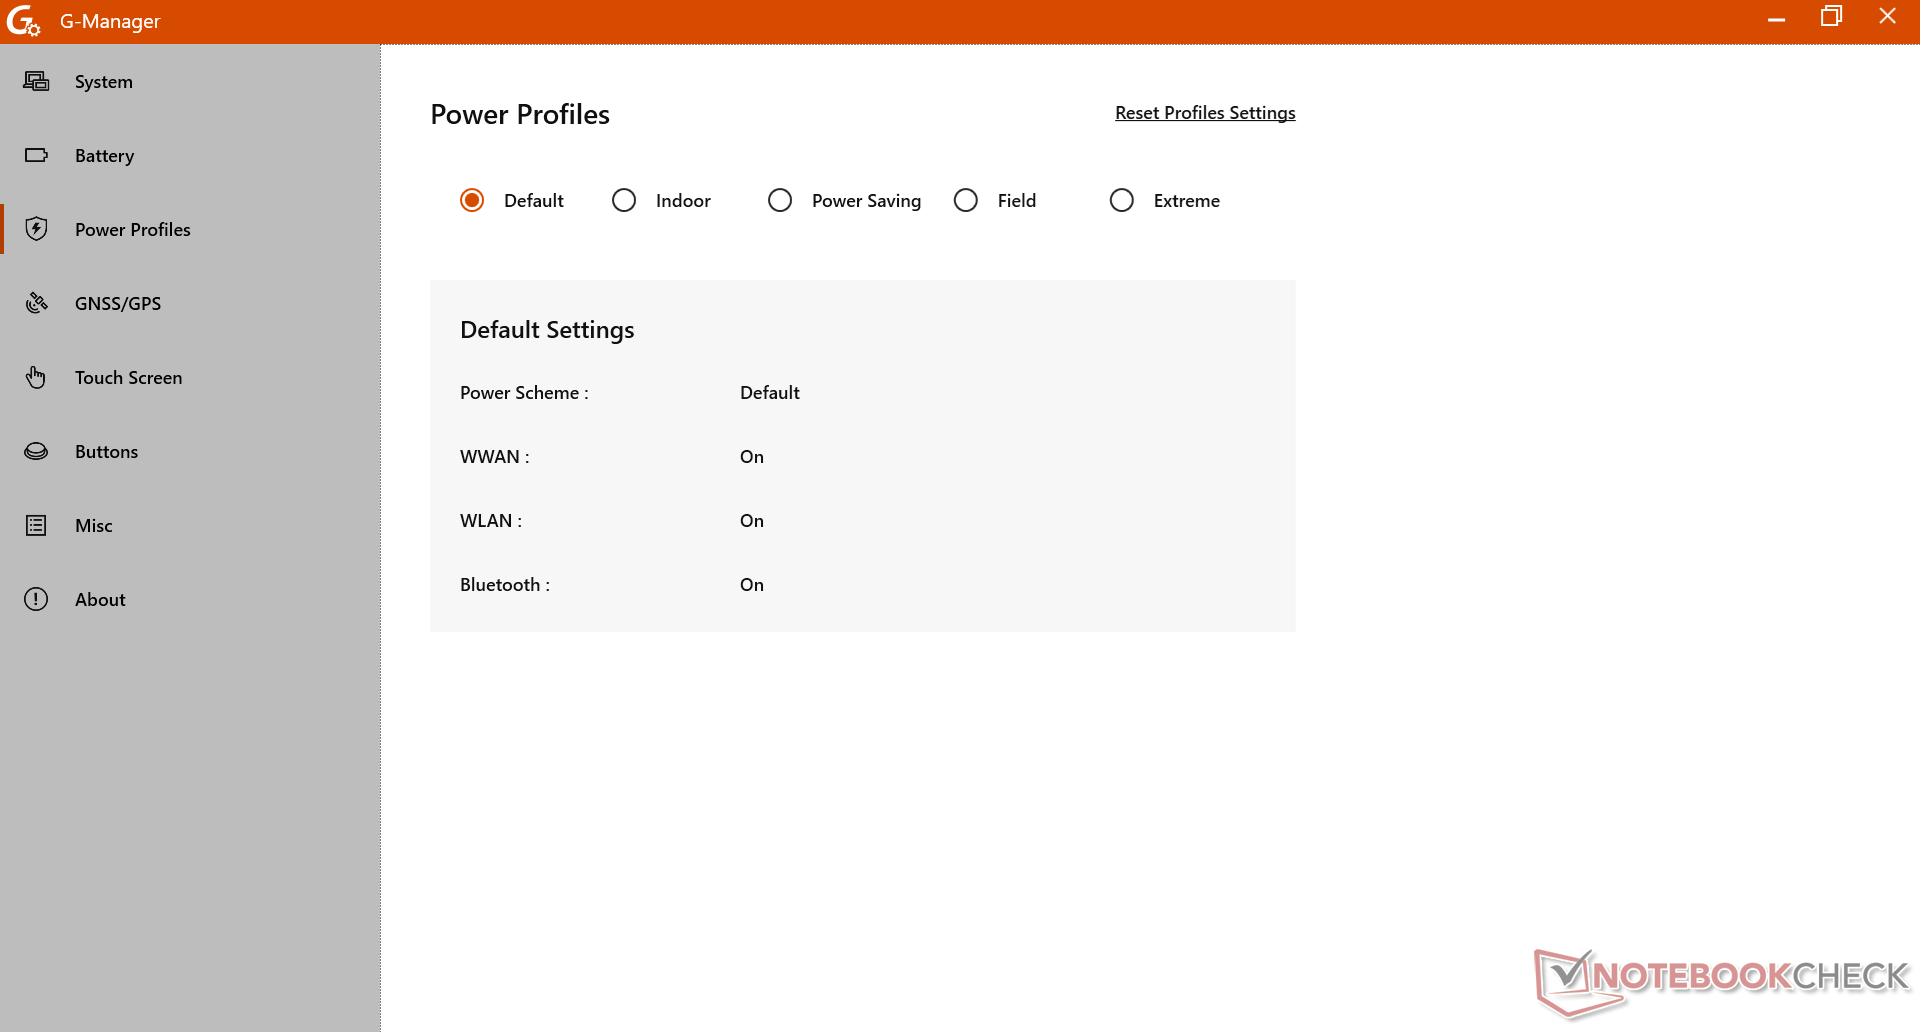
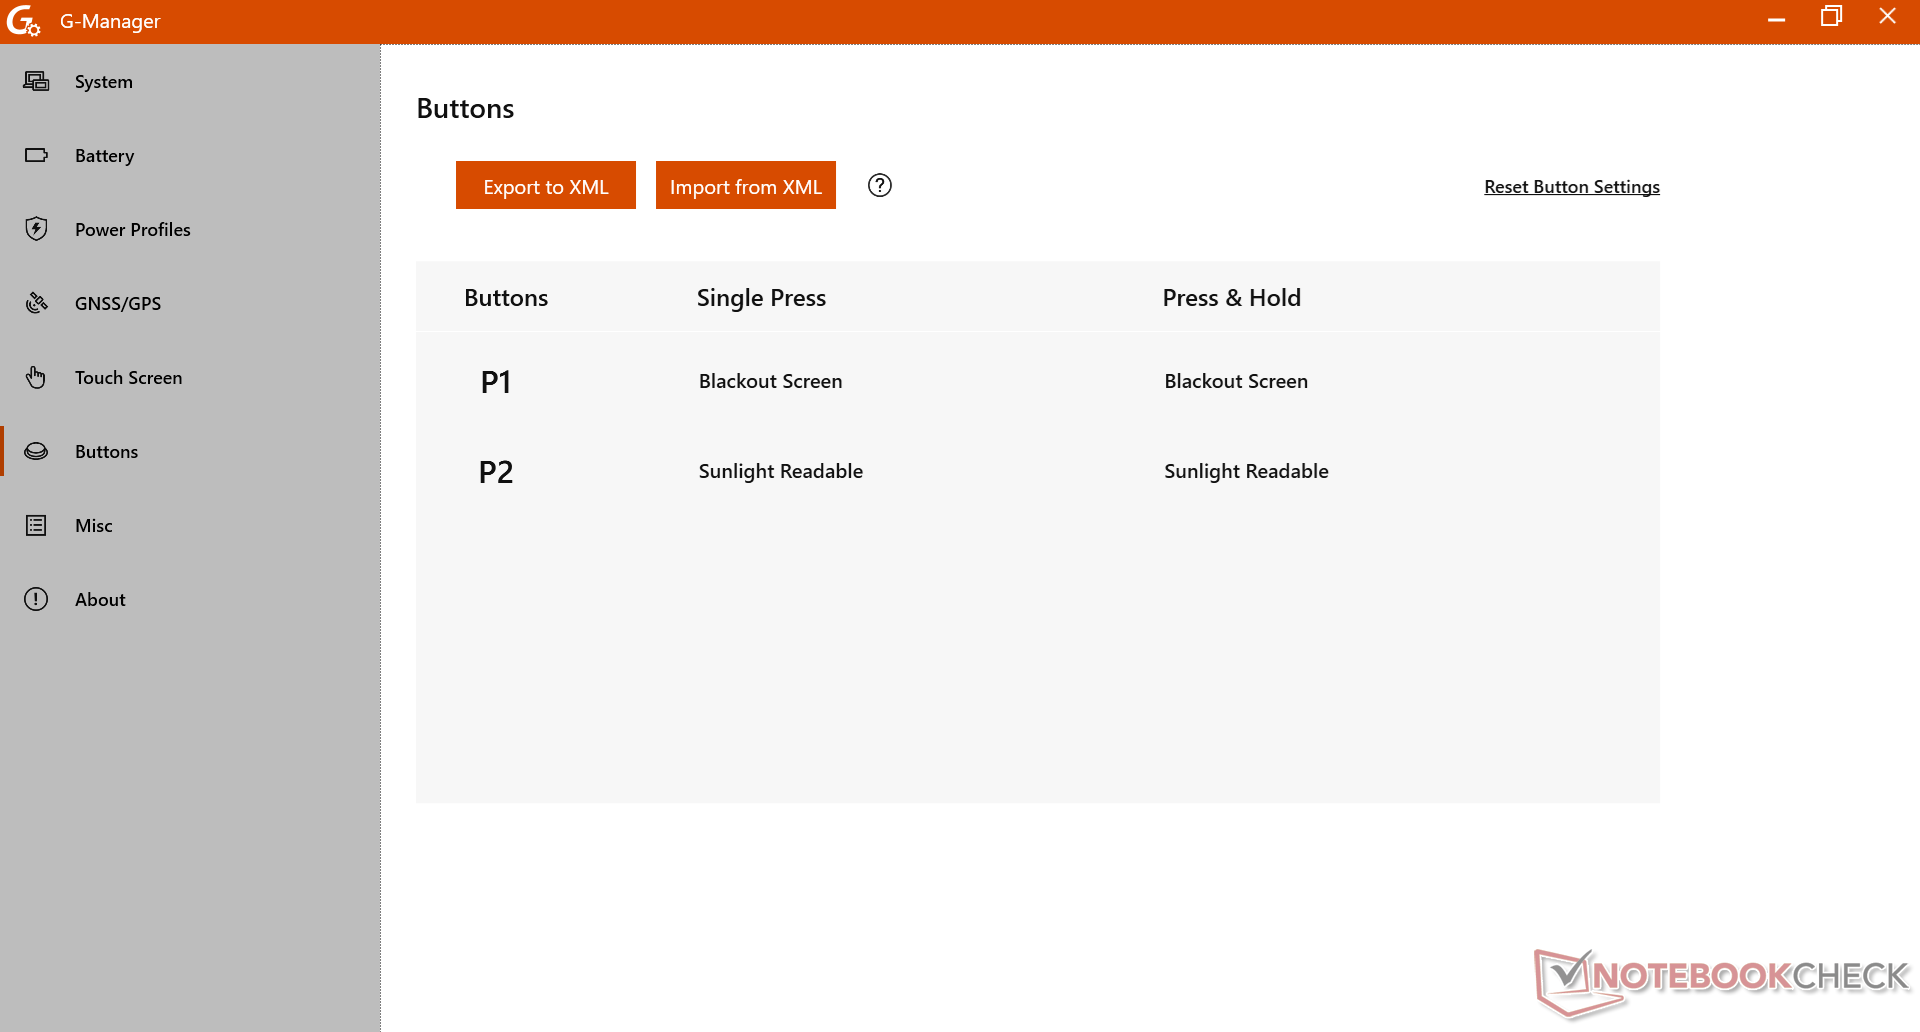
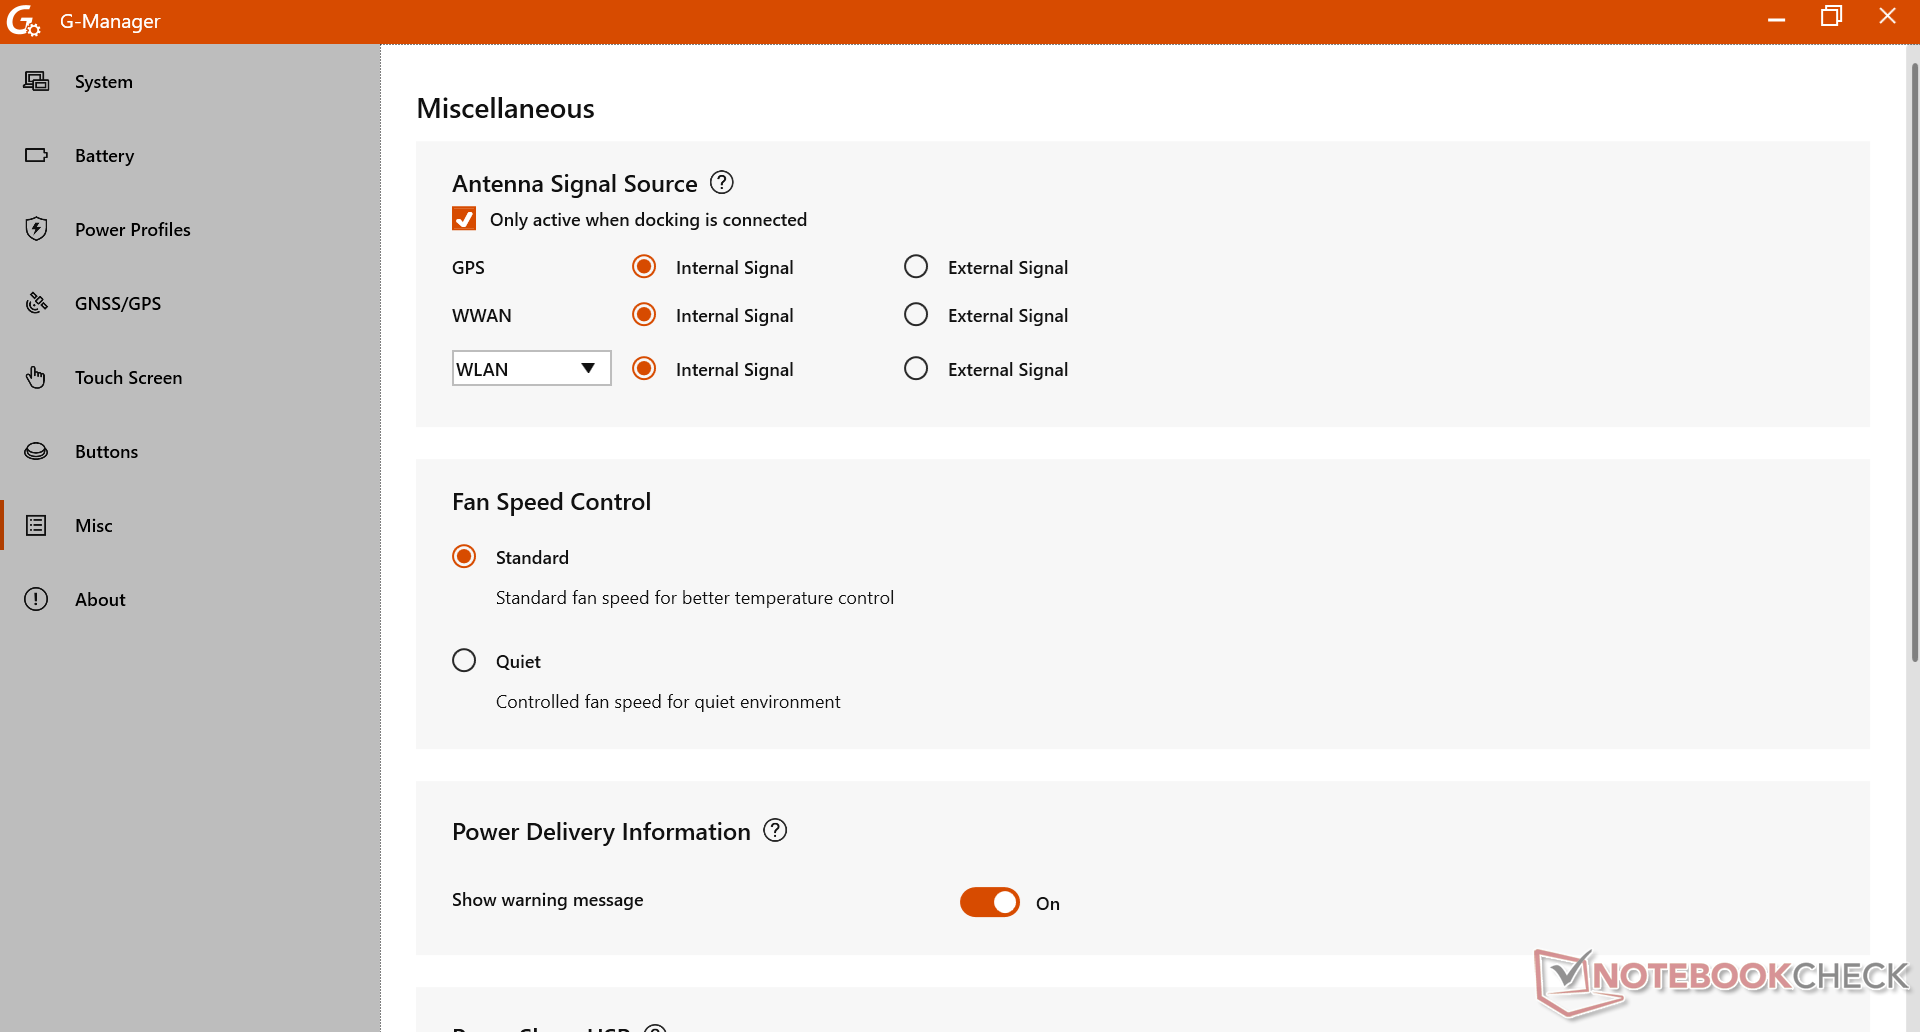
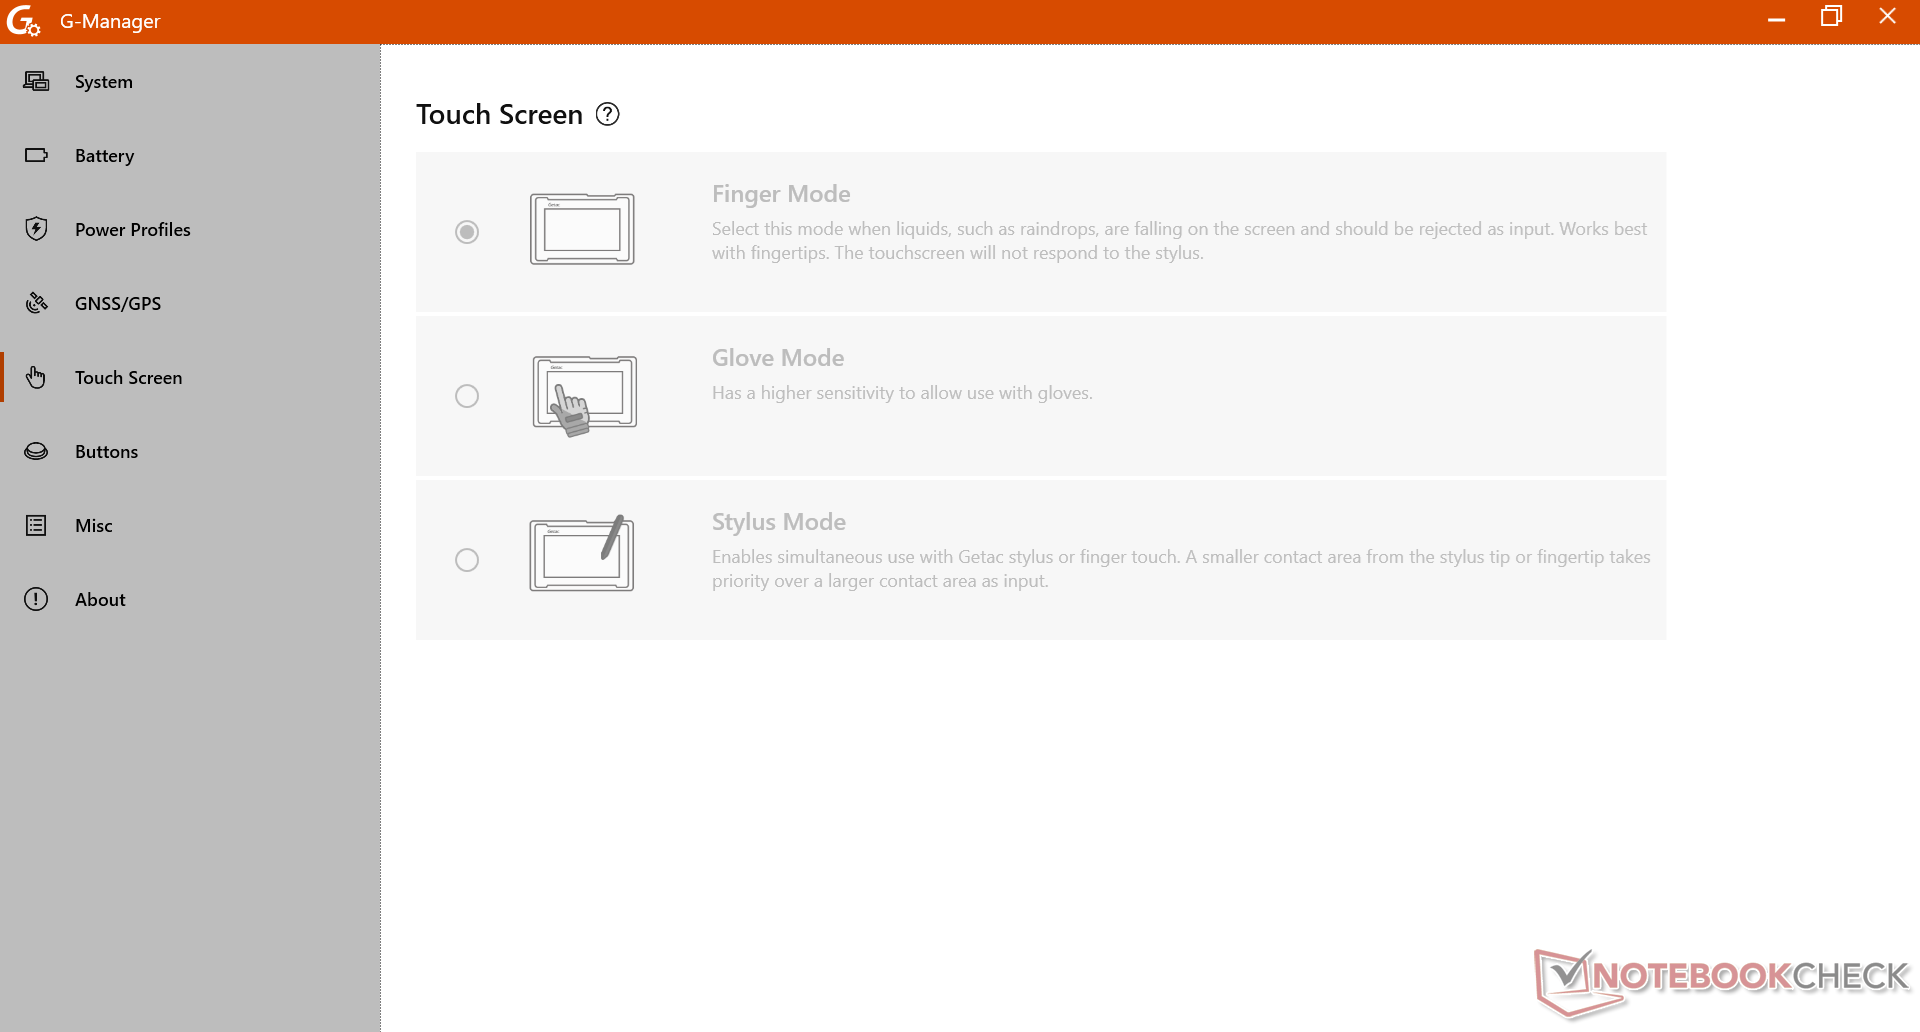
Abbiamo impostato Windows in modalità Prestazioni e G-Manager in modalità Prestazioni estreme prima di eseguire i benchmark qui sotto. Gli utenti sono invitati a familiarizzare con G-Manager, in quanto è l'hub per regolare diverse caratteristiche uniche dell'S410, tra cui il GPS/GNSS integrato, i pulsanti personalizzabili e la sensibilità del touchscreen.
Processore
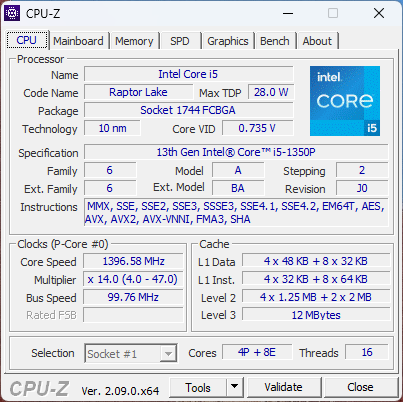
Il salto di prestazioni rispetto al Core i7-1185G7 nel vecchio S410 G4 al nostro più recente Core i5-1350P è significativo, in quanto la CPU Raptor Lake-P può essere due volte più veloce di Tiger Lake-U quando si tratta di carichi di lavoro multi-threaded. Il Turbo Boost è però limitato, come dimostra il nostro grafico del test CineBench R15 xT di seguito. Nonostante questo, il sistema è ancora molto più veloce di prima, anche dopo aver tenuto conto del forte throttling.
Cinebench R15 Multi Loop
Cinebench R23: Multi Core | Single Core
Cinebench R20: CPU (Multi Core) | CPU (Single Core)
Cinebench R15: CPU Multi 64Bit | CPU Single 64Bit
Blender: v2.79 BMW27 CPU
7-Zip 18.03: 7z b 4 | 7z b 4 -mmt1
Geekbench 6.4: Multi-Core | Single-Core
Geekbench 5.5: Multi-Core | Single-Core
HWBOT x265 Benchmark v2.2: 4k Preset
LibreOffice : 20 Documents To PDF
R Benchmark 2.5: Overall mean
| CPU Performance Rating | |
| Getac S410 G5 | |
| Media Intel Core i5-1350P | |
| Dell Latitude 7330 Rugged Extreme -2! | |
| Panasonic Toughbook FZ-55 MK2 -4! | |
| Getac S410 Gen 4 -2! | |
| Dell Latitude 14 5420-D2G5W -2! | |
| Panasonic Toughbook 40 -2! | |
| Durabook S14I -2! | |
| Panasonic Toughbook FZ-55 -14! | |
| Getac B360 -3! | |
| Getac S410 -14! | |
| Cinebench R23 / Multi Core | |
| Getac S410 G5 | |
| Media Intel Core i5-1350P (n=1) | |
| Dell Latitude 7330 Rugged Extreme | |
| Dell Latitude 14 5420-D2G5W | |
| Panasonic Toughbook FZ-55 MK2 | |
| Getac S410 Gen 4 | |
| Panasonic Toughbook 40 | |
| Getac B360 | |
| Durabook S14I | |
| Cinebench R23 / Single Core | |
| Getac S410 G5 | |
| Media Intel Core i5-1350P (n=1) | |
| Dell Latitude 7330 Rugged Extreme | |
| Panasonic Toughbook FZ-55 MK2 | |
| Getac S410 Gen 4 | |
| Panasonic Toughbook 40 | |
| Durabook S14I | |
| Dell Latitude 14 5420-D2G5W | |
| Getac B360 | |
| Cinebench R20 / CPU (Multi Core) | |
| Getac S410 G5 | |
| Media Intel Core i5-1350P (n=1) | |
| Dell Latitude 14 5420-D2G5W | |
| Dell Latitude 7330 Rugged Extreme | |
| Panasonic Toughbook FZ-55 MK2 | |
| Getac S410 Gen 4 | |
| Panasonic Toughbook 40 | |
| Getac B360 | |
| Durabook S14I | |
| Cinebench R20 / CPU (Single Core) | |
| Getac S410 G5 | |
| Media Intel Core i5-1350P (n=1) | |
| Dell Latitude 7330 Rugged Extreme | |
| Panasonic Toughbook FZ-55 MK2 | |
| Getac S410 Gen 4 | |
| Durabook S14I | |
| Panasonic Toughbook 40 | |
| Dell Latitude 14 5420-D2G5W | |
| Getac B360 | |
| Cinebench R15 / CPU Multi 64Bit | |
| Getac S410 G5 | |
| Media Intel Core i5-1350P (n=1) | |
| Dell Latitude 14 5420-D2G5W | |
| Dell Latitude 7330 Rugged Extreme | |
| Panasonic Toughbook FZ-55 MK2 | |
| Getac S410 Gen 4 | |
| Panasonic Toughbook 40 | |
| Getac B360 | |
| Durabook S14I | |
| Panasonic Toughbook FZ-55 | |
| Getac S410 | |
| Cinebench R15 / CPU Single 64Bit | |
| Getac S410 G5 | |
| Media Intel Core i5-1350P (n=1) | |
| Dell Latitude 7330 Rugged Extreme | |
| Panasonic Toughbook FZ-55 MK2 | |
| Getac S410 Gen 4 | |
| Durabook S14I | |
| Panasonic Toughbook 40 | |
| Dell Latitude 14 5420-D2G5W | |
| Getac B360 | |
| Panasonic Toughbook FZ-55 | |
| Getac S410 | |
| Blender / v2.79 BMW27 CPU | |
| Durabook S14I | |
| Getac B360 | |
| Panasonic Toughbook 40 | |
| Getac S410 Gen 4 | |
| Panasonic Toughbook FZ-55 MK2 | |
| Dell Latitude 7330 Rugged Extreme | |
| Dell Latitude 14 5420-D2G5W | |
| Getac S410 G5 | |
| Media Intel Core i5-1350P (n=1) | |
| 7-Zip 18.03 / 7z b 4 | |
| Getac S410 G5 | |
| Media Intel Core i5-1350P (n=1) | |
| Dell Latitude 7330 Rugged Extreme | |
| Panasonic Toughbook FZ-55 MK2 | |
| Dell Latitude 14 5420-D2G5W | |
| Getac S410 Gen 4 | |
| Getac B360 | |
| Panasonic Toughbook 40 | |
| Durabook S14I | |
| 7-Zip 18.03 / 7z b 4 -mmt1 | |
| Dell Latitude 7330 Rugged Extreme | |
| Panasonic Toughbook FZ-55 MK2 | |
| Durabook S14I | |
| Getac S410 G5 | |
| Media Intel Core i5-1350P (n=1) | |
| Panasonic Toughbook 40 | |
| Getac S410 Gen 4 | |
| Dell Latitude 14 5420-D2G5W | |
| Getac B360 | |
| Geekbench 6.4 / Multi-Core | |
| Getac S410 G5 | |
| Media Intel Core i5-1350P (n=1) | |
| Geekbench 6.4 / Single-Core | |
| Getac S410 G5 | |
| Media Intel Core i5-1350P (n=1) | |
| Geekbench 5.5 / Multi-Core | |
| Getac S410 G5 | |
| Media Intel Core i5-1350P (n=1) | |
| Dell Latitude 7330 Rugged Extreme | |
| Getac S410 Gen 4 | |
| Panasonic Toughbook 40 | |
| Getac B360 | |
| Durabook S14I | |
| Dell Latitude 14 5420-D2G5W | |
| Geekbench 5.5 / Single-Core | |
| Getac S410 G5 | |
| Media Intel Core i5-1350P (n=1) | |
| Dell Latitude 7330 Rugged Extreme | |
| Durabook S14I | |
| Getac S410 Gen 4 | |
| Panasonic Toughbook 40 | |
| Getac B360 | |
| Dell Latitude 14 5420-D2G5W | |
| HWBOT x265 Benchmark v2.2 / 4k Preset | |
| Getac S410 G5 | |
| Media Intel Core i5-1350P (n=1) | |
| Dell Latitude 7330 Rugged Extreme | |
| Panasonic Toughbook FZ-55 MK2 | |
| Getac S410 Gen 4 | |
| Dell Latitude 14 5420-D2G5W | |
| Panasonic Toughbook 40 | |
| Getac B360 | |
| Durabook S14I | |
| LibreOffice / 20 Documents To PDF | |
| Dell Latitude 14 5420-D2G5W | |
| Panasonic Toughbook 40 | |
| Getac S410 Gen 4 | |
| Dell Latitude 7330 Rugged Extreme | |
| Panasonic Toughbook FZ-55 MK2 | |
| Durabook S14I | |
| Getac S410 G5 | |
| Media Intel Core i5-1350P (n=1) | |
| R Benchmark 2.5 / Overall mean | |
| Getac B360 | |
| Dell Latitude 14 5420-D2G5W | |
| Panasonic Toughbook 40 | |
| Getac S410 Gen 4 | |
| Durabook S14I | |
| Panasonic Toughbook FZ-55 MK2 | |
| Dell Latitude 7330 Rugged Extreme | |
| Getac S410 G5 | |
| Media Intel Core i5-1350P (n=1) | |
* ... Meglio usare valori piccoli
AIDA64: FP32 Ray-Trace | FPU Julia | CPU SHA3 | CPU Queen | FPU SinJulia | FPU Mandel | CPU AES | CPU ZLib | FP64 Ray-Trace | CPU PhotoWorxx
| Performance Rating | |
| Getac S410 G5 | |
| Media Intel Core i5-1350P | |
| Dell Latitude 7330 Rugged Extreme | |
| Dell Latitude 14 5420-D2G5W | |
| Getac S410 Gen 4 | |
| Panasonic Toughbook 40 | |
| Durabook S14I | |
| AIDA64 / FP32 Ray-Trace | |
| Getac S410 G5 | |
| Media Intel Core i5-1350P (n=1) | |
| Dell Latitude 14 5420-D2G5W | |
| Dell Latitude 7330 Rugged Extreme | |
| Getac S410 Gen 4 | |
| Panasonic Toughbook 40 | |
| Durabook S14I | |
| AIDA64 / FPU Julia | |
| Getac S410 G5 | |
| Media Intel Core i5-1350P (n=1) | |
| Dell Latitude 7330 Rugged Extreme | |
| Dell Latitude 14 5420-D2G5W | |
| Getac S410 Gen 4 | |
| Panasonic Toughbook 40 | |
| Durabook S14I | |
| AIDA64 / CPU SHA3 | |
| Dell Latitude 7330 Rugged Extreme | |
| Dell Latitude 14 5420-D2G5W | |
| Getac S410 G5 | |
| Media Intel Core i5-1350P (n=1) | |
| Getac S410 Gen 4 | |
| Panasonic Toughbook 40 | |
| Durabook S14I | |
| AIDA64 / CPU Queen | |
| Getac S410 G5 | |
| Media Intel Core i5-1350P (n=1) | |
| Dell Latitude 7330 Rugged Extreme | |
| Durabook S14I | |
| Getac S410 Gen 4 | |
| Dell Latitude 14 5420-D2G5W | |
| Panasonic Toughbook 40 | |
| AIDA64 / FPU SinJulia | |
| Getac S410 G5 | |
| Media Intel Core i5-1350P (n=1) | |
| Dell Latitude 7330 Rugged Extreme | |
| Dell Latitude 14 5420-D2G5W | |
| Getac S410 Gen 4 | |
| Panasonic Toughbook 40 | |
| Durabook S14I | |
| AIDA64 / FPU Mandel | |
| Getac S410 G5 | |
| Media Intel Core i5-1350P (n=1) | |
| Dell Latitude 7330 Rugged Extreme | |
| Dell Latitude 14 5420-D2G5W | |
| Getac S410 Gen 4 | |
| Panasonic Toughbook 40 | |
| Durabook S14I | |
| AIDA64 / CPU AES | |
| Dell Latitude 7330 Rugged Extreme | |
| Dell Latitude 14 5420-D2G5W | |
| Durabook S14I | |
| Getac S410 G5 | |
| Media Intel Core i5-1350P (n=1) | |
| Getac S410 Gen 4 | |
| Panasonic Toughbook 40 | |
| AIDA64 / CPU ZLib | |
| Getac S410 G5 | |
| Media Intel Core i5-1350P (n=1) | |
| Dell Latitude 7330 Rugged Extreme | |
| Dell Latitude 14 5420-D2G5W | |
| Panasonic Toughbook 40 | |
| Getac S410 Gen 4 | |
| Durabook S14I | |
| AIDA64 / FP64 Ray-Trace | |
| Getac S410 G5 | |
| Media Intel Core i5-1350P (n=1) | |
| Dell Latitude 7330 Rugged Extreme | |
| Dell Latitude 14 5420-D2G5W | |
| Getac S410 Gen 4 | |
| Panasonic Toughbook 40 | |
| Durabook S14I | |
| AIDA64 / CPU PhotoWorxx | |
| Dell Latitude 7330 Rugged Extreme | |
| Getac S410 G5 | |
| Media Intel Core i5-1350P (n=1) | |
| Getac S410 Gen 4 | |
| Panasonic Toughbook 40 | |
| Durabook S14I | |
| Dell Latitude 14 5420-D2G5W | |
Prestazioni del sistema
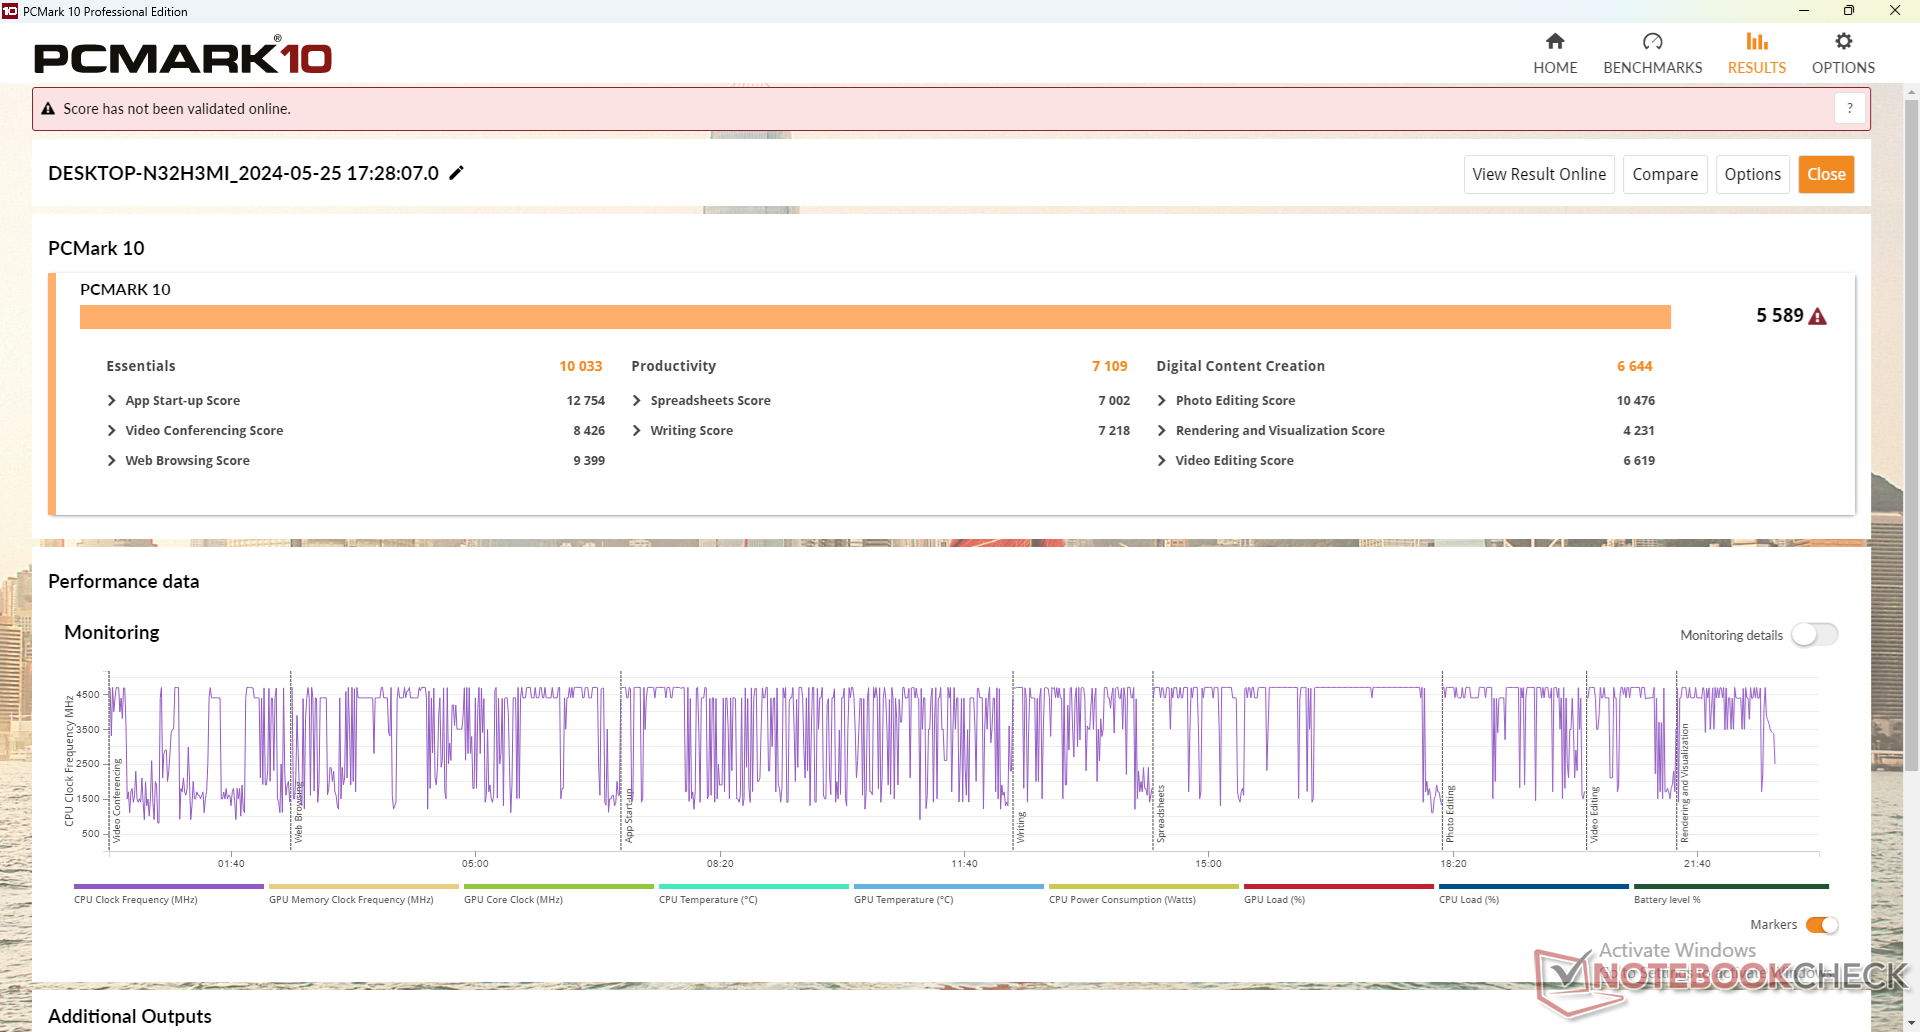
I risultati di PCMark sono costantemente superiori rispetto al modello dello scorso anno, per riflettere le prestazioni complessive più veloci con il processore più recente.
CrossMark: Overall | Productivity | Creativity | Responsiveness
WebXPRT 3: Overall
WebXPRT 4: Overall
Mozilla Kraken 1.1: Total
| PCMark 10 / Score | |
| Getac S410 G5 | |
| Media Intel Core i5-1350P, Intel Iris Xe Graphics G7 80EUs (n=1) | |
| Dell Latitude 7330 Rugged Extreme | |
| Panasonic Toughbook 40 | |
| Durabook S14I | |
| Getac S410 Gen 4 | |
| Dell Latitude 14 5420-D2G5W | |
| PCMark 10 / Essentials | |
| Dell Latitude 7330 Rugged Extreme | |
| Durabook S14I | |
| Getac S410 G5 | |
| Media Intel Core i5-1350P, Intel Iris Xe Graphics G7 80EUs (n=1) | |
| Getac S410 Gen 4 | |
| Panasonic Toughbook 40 | |
| Dell Latitude 14 5420-D2G5W | |
| PCMark 10 / Productivity | |
| Getac S410 G5 | |
| Media Intel Core i5-1350P, Intel Iris Xe Graphics G7 80EUs (n=1) | |
| Durabook S14I | |
| Dell Latitude 7330 Rugged Extreme | |
| Panasonic Toughbook 40 | |
| Dell Latitude 14 5420-D2G5W | |
| Getac S410 Gen 4 | |
| PCMark 10 / Digital Content Creation | |
| Getac S410 G5 | |
| Media Intel Core i5-1350P, Intel Iris Xe Graphics G7 80EUs (n=1) | |
| Dell Latitude 7330 Rugged Extreme | |
| Panasonic Toughbook 40 | |
| Getac S410 Gen 4 | |
| Dell Latitude 14 5420-D2G5W | |
| Durabook S14I | |
| CrossMark / Overall | |
| Getac S410 G5 | |
| Media Intel Core i5-1350P, Intel Iris Xe Graphics G7 80EUs (n=1) | |
| Panasonic Toughbook 40 | |
| Getac S410 Gen 4 | |
| Dell Latitude 14 5420-D2G5W | |
| CrossMark / Productivity | |
| Getac S410 G5 | |
| Media Intel Core i5-1350P, Intel Iris Xe Graphics G7 80EUs (n=1) | |
| Panasonic Toughbook 40 | |
| Getac S410 Gen 4 | |
| Dell Latitude 14 5420-D2G5W | |
| CrossMark / Creativity | |
| Getac S410 G5 | |
| Media Intel Core i5-1350P, Intel Iris Xe Graphics G7 80EUs (n=1) | |
| Panasonic Toughbook 40 | |
| Getac S410 Gen 4 | |
| Dell Latitude 14 5420-D2G5W | |
| CrossMark / Responsiveness | |
| Getac S410 G5 | |
| Media Intel Core i5-1350P, Intel Iris Xe Graphics G7 80EUs (n=1) | |
| Panasonic Toughbook 40 | |
| Dell Latitude 14 5420-D2G5W | |
| Getac S410 Gen 4 | |
| WebXPRT 3 / Overall | |
| Getac S410 G5 | |
| Media Intel Core i5-1350P, Intel Iris Xe Graphics G7 80EUs (n=1) | |
| Dell Latitude 7330 Rugged Extreme | |
| Durabook S14I | |
| Getac S410 Gen 4 | |
| Panasonic Toughbook 40 | |
| Dell Latitude 14 5420-D2G5W | |
| WebXPRT 4 / Overall | |
| Getac S410 G5 | |
| Media Intel Core i5-1350P, Intel Iris Xe Graphics G7 80EUs (n=1) | |
| Mozilla Kraken 1.1 / Total | |
| Dell Latitude 14 5420-D2G5W | |
| Dell Latitude 7330 Rugged Extreme | |
| Panasonic Toughbook 40 | |
| Durabook S14I | |
| Getac S410 G5 | |
| Media Intel Core i5-1350P, Intel Iris Xe Graphics G7 80EUs (n=1) | |
* ... Meglio usare valori piccoli
| PCMark 10 Score | 5589 punti | |
Aiuto | ||
| AIDA64 / Memory Copy | |
| Dell Latitude 7330 Rugged Extreme | |
| Getac S410 G5 | |
| Media Intel Core i5-1350P (n=1) | |
| Getac S410 Gen 4 | |
| Panasonic Toughbook 40 | |
| Durabook S14I | |
| Dell Latitude 14 5420-D2G5W | |
| AIDA64 / Memory Read | |
| Dell Latitude 7330 Rugged Extreme | |
| Getac S410 G5 | |
| Media Intel Core i5-1350P (n=1) | |
| Getac S410 Gen 4 | |
| Panasonic Toughbook 40 | |
| Durabook S14I | |
| Dell Latitude 14 5420-D2G5W | |
| AIDA64 / Memory Write | |
| Dell Latitude 7330 Rugged Extreme | |
| Getac S410 G5 | |
| Media Intel Core i5-1350P (n=1) | |
| Getac S410 Gen 4 | |
| Panasonic Toughbook 40 | |
| Durabook S14I | |
| Dell Latitude 14 5420-D2G5W | |
| AIDA64 / Memory Latency | |
| Getac S410 G5 | |
| Media Intel Core i5-1350P (n=1) | |
| Panasonic Toughbook 40 | |
| Dell Latitude 7330 Rugged Extreme | |
| Getac S410 Gen 4 | |
| Durabook S14I | |
| Dell Latitude 14 5420-D2G5W | |
* ... Meglio usare valori piccoli
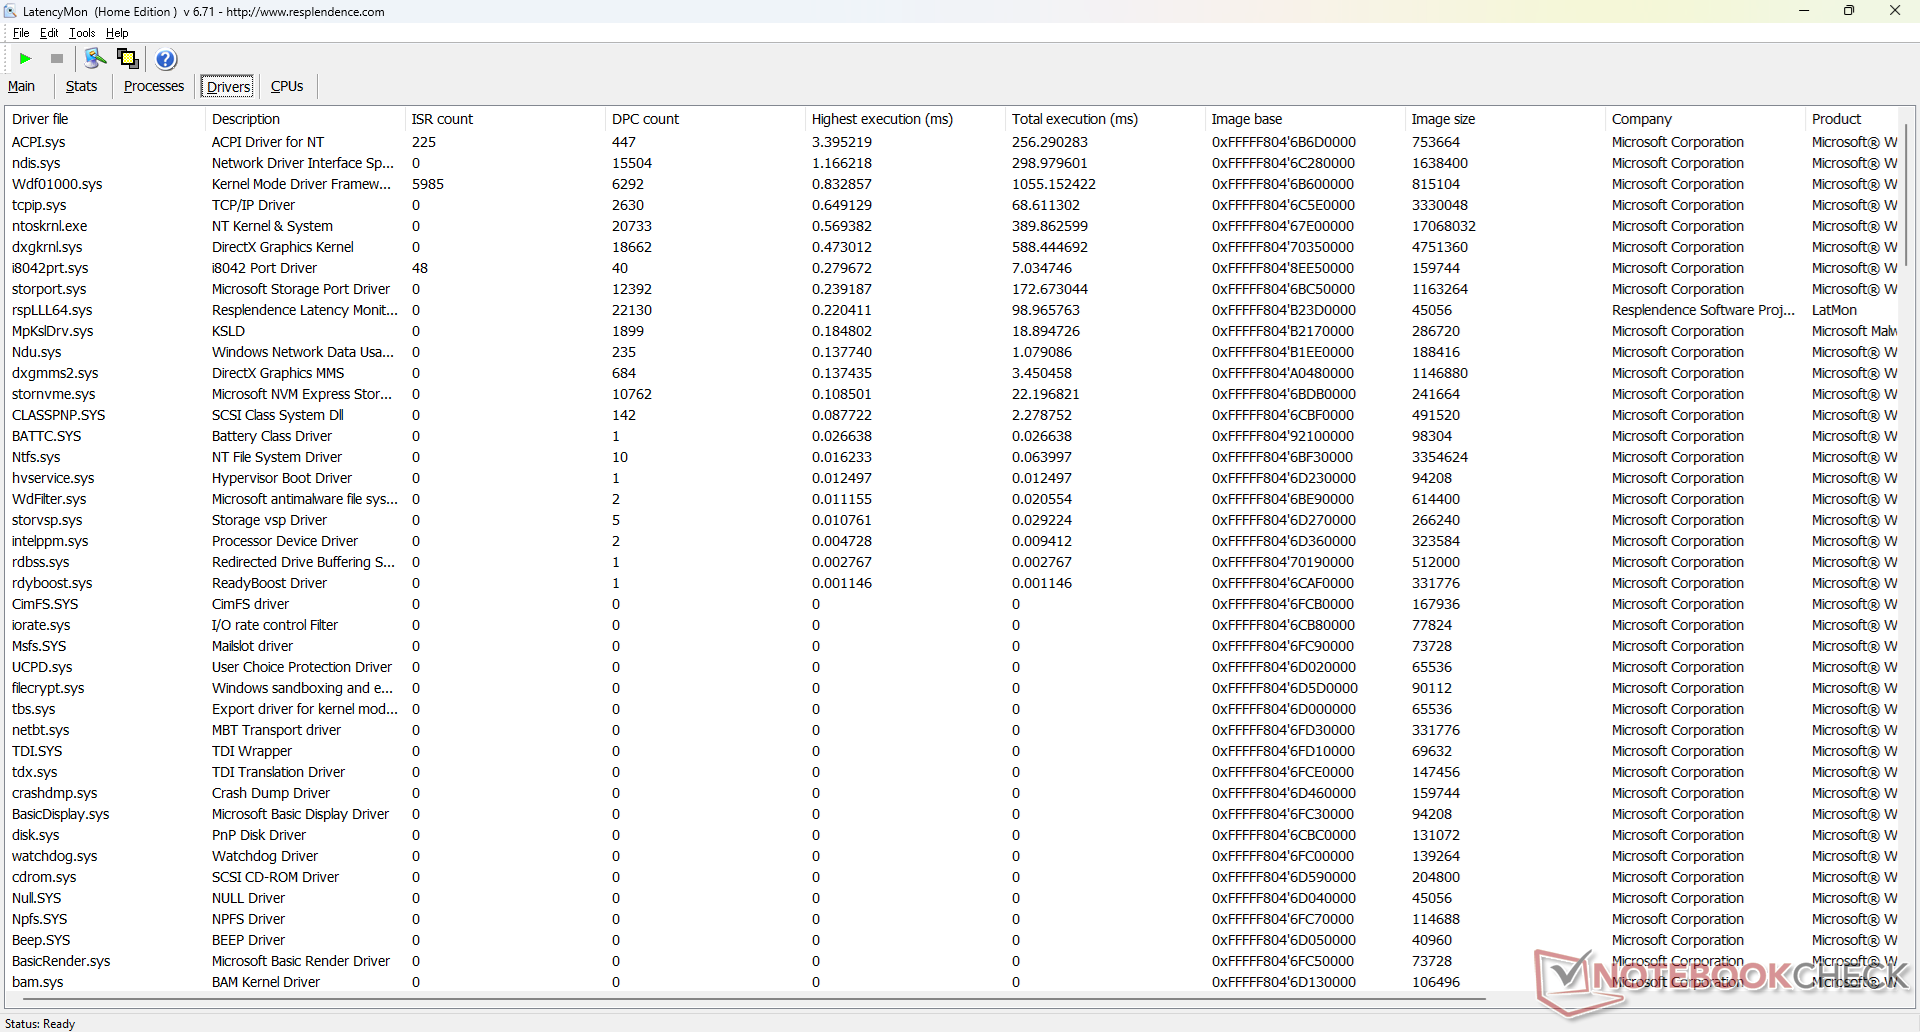
Latenza DPC
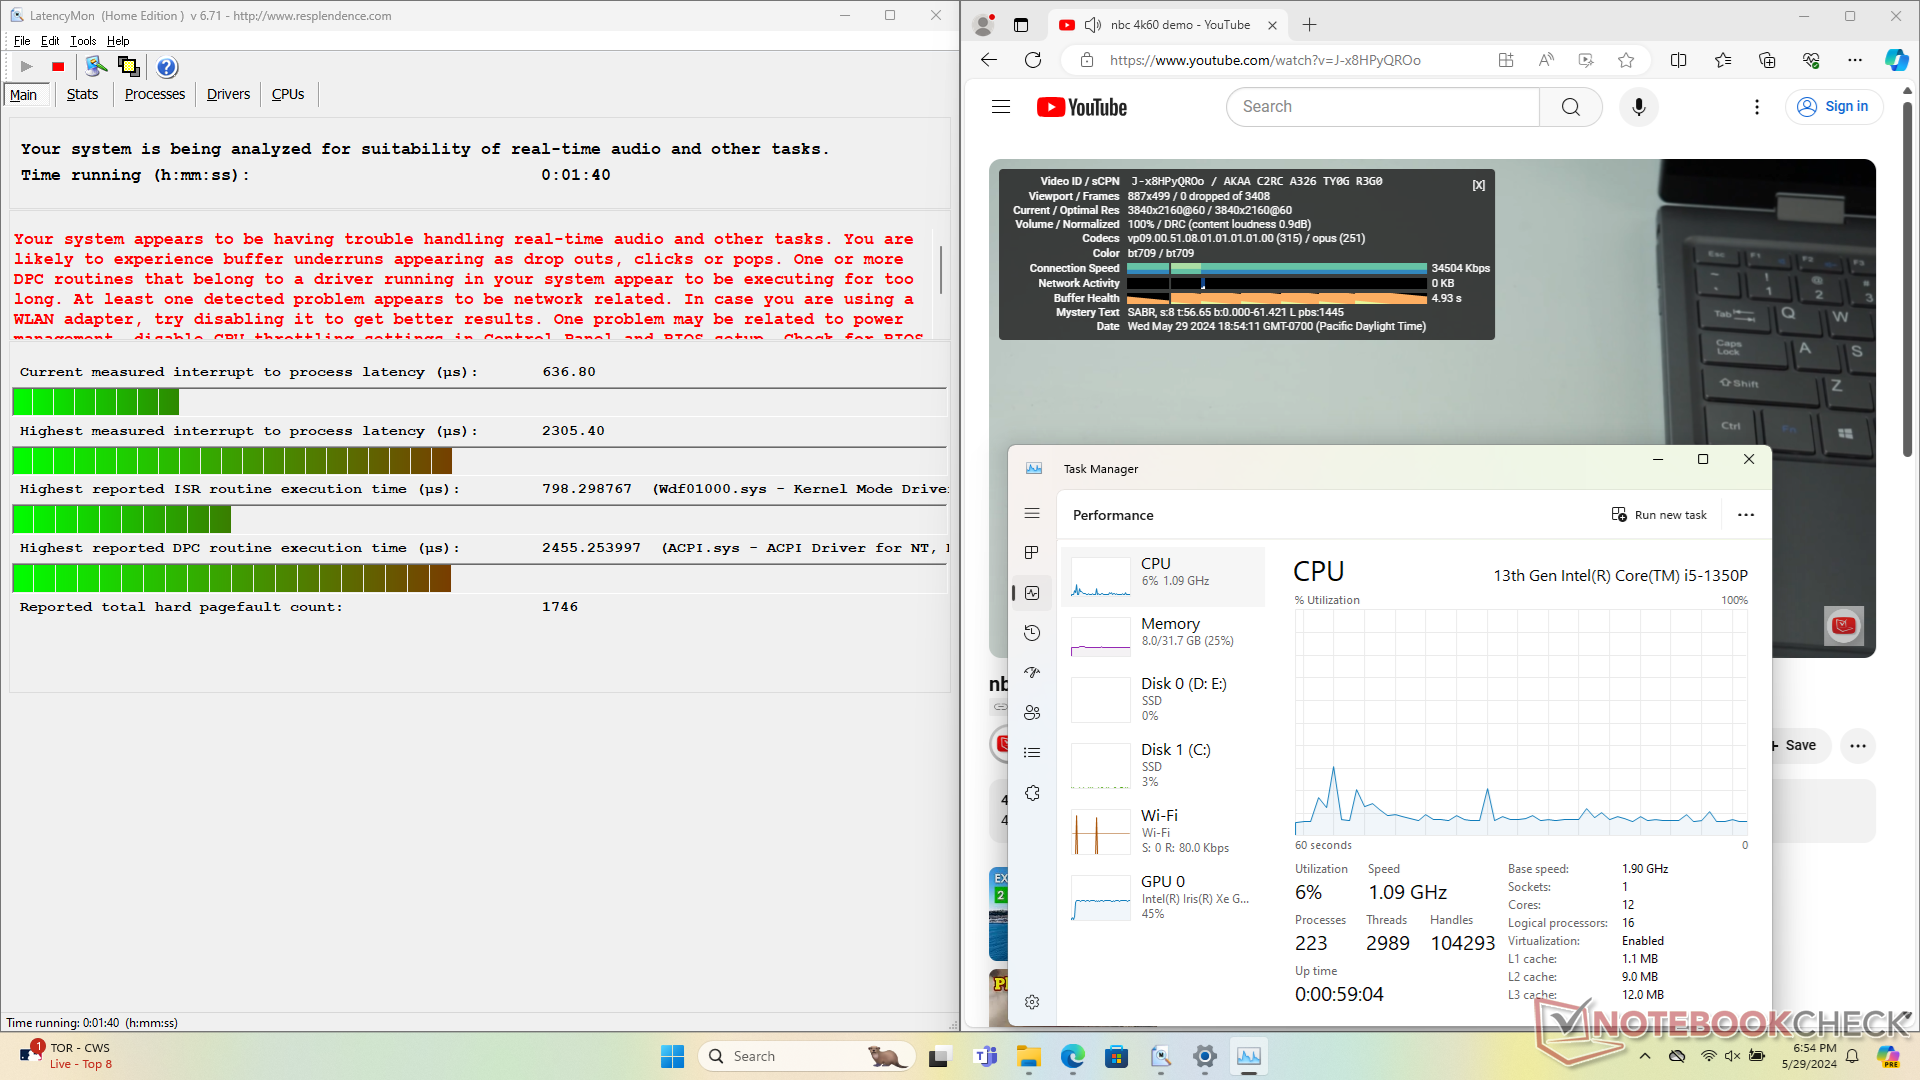
Ci sono lievi problemi di DPC quando si aprono più schede del browser della nostra homepage. la riproduzione di video 4K a 60 FPS è invece perfetta, senza alcun salto di fotogrammi.
| DPC Latencies / LatencyMon - interrupt to process latency (max), Web, Youtube, Prime95 | |
| Dell Latitude 14 5420-D2G5W | |
| Getac S410 G5 | |
| Durabook S14I | |
| Getac S410 Gen 4 | |
| Panasonic Toughbook 40 | |
| Dell Latitude 7330 Rugged Extreme | |
* ... Meglio usare valori piccoli
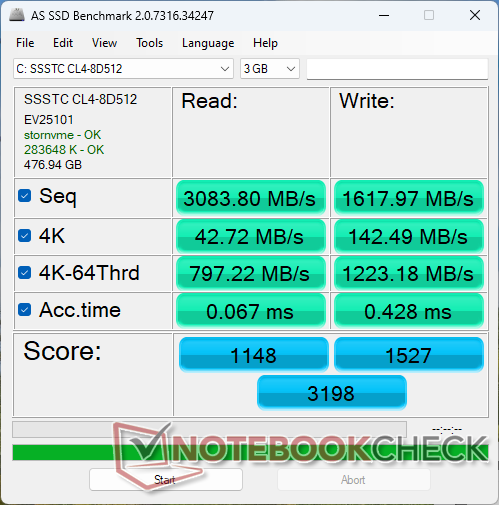
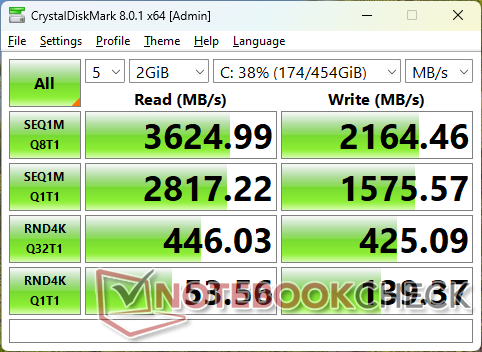
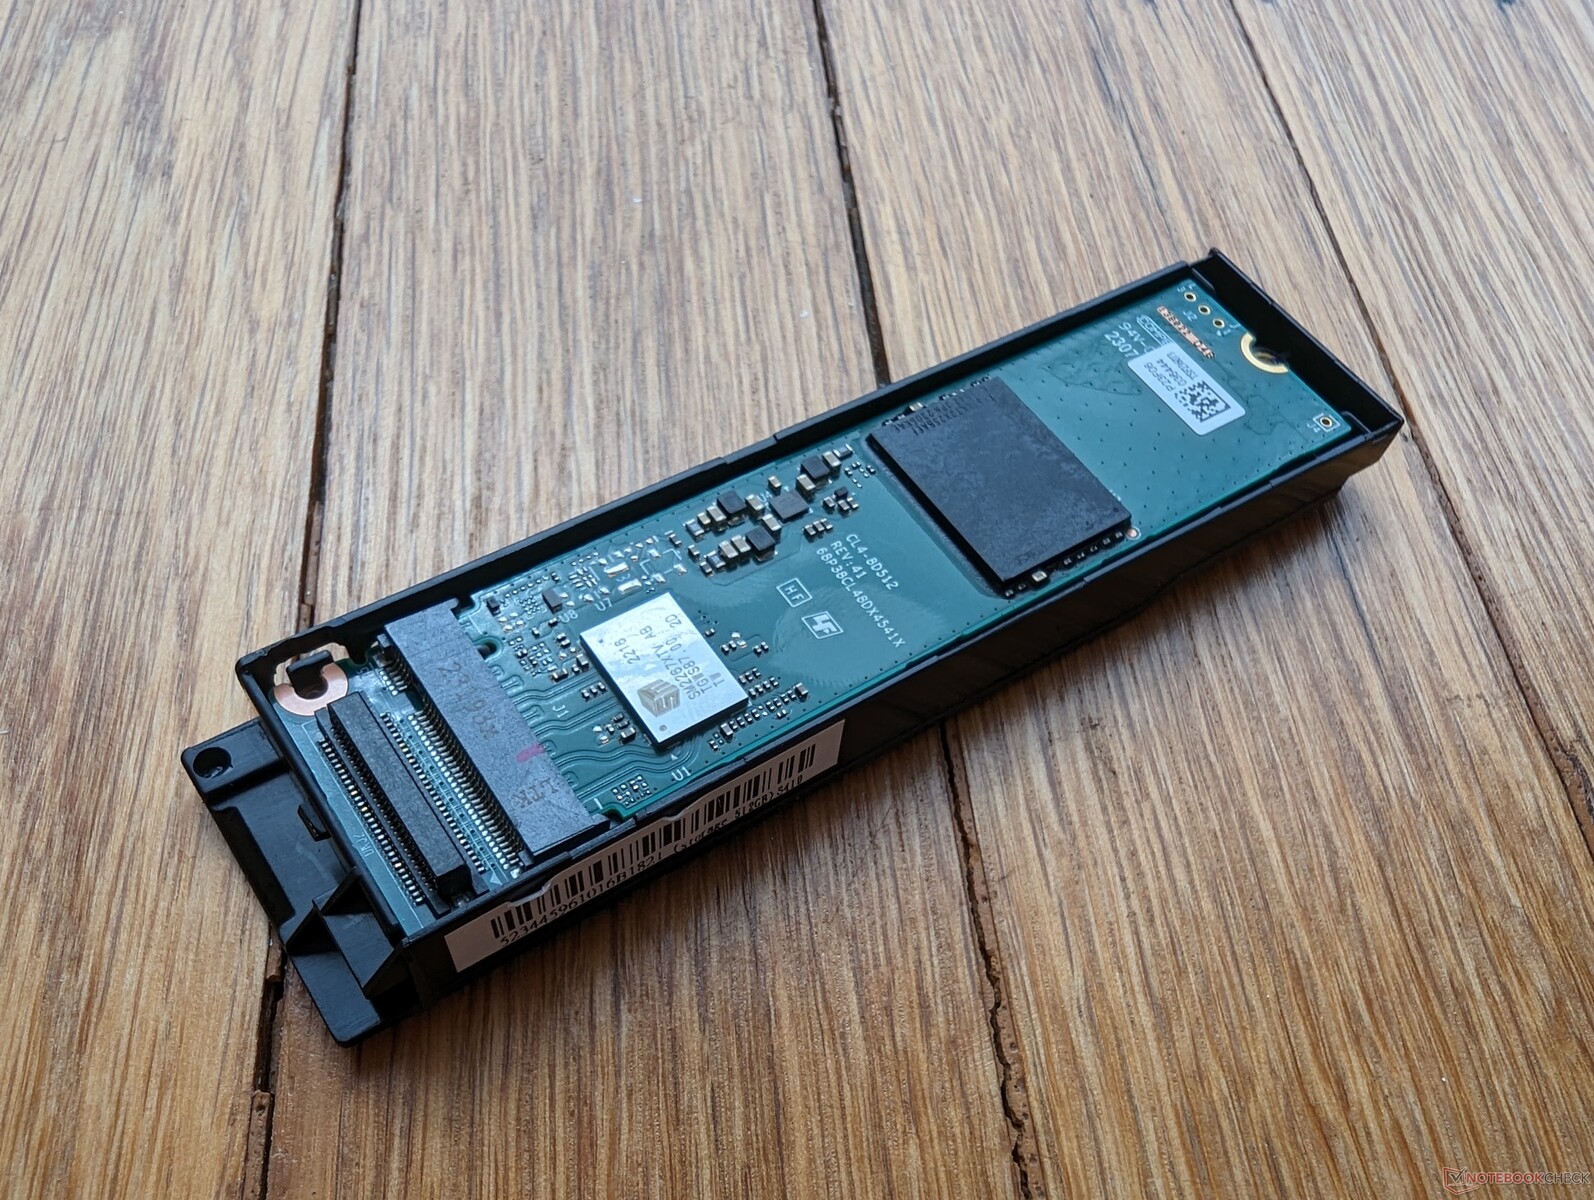
Dispositivi di archiviazione
La nostra unità di prova viene fornita con il SSSTC CL4-8D512 mentre il vecchio S410 G4 viene fornito con l'unità SSSTC CA5-8D256. L'unità più recente è un po' più veloce su tutti i fronti, ma soffre ancora di tempi di accesso leggermente più lunghi rispetto alla maggior parte delle altre unità.

| Drive Performance Rating - Percent | |
| Dell Latitude 7330 Rugged Extreme | |
| Getac S410 G5 | |
| Durabook S14I | |
| Panasonic Toughbook 40 | |
| Dell Latitude 14 5420-D2G5W | |
| Getac S410 Gen 4 | |
* ... Meglio usare valori piccoli
Disk Throttling: DiskSpd Read Loop, Queue Depth 8
Prestazioni della GPU - Iris Xe ancora una volta
Tiger Lake-U e Raptor Lake-P condividono la stessa architettura di base Iris Xe e quindi qualsiasi incremento di prestazioni tra S410 G4 e S410 G5 è minimo. La Iris Xe Graphics G7 80 EUs nella nostra unità è più veloce solo del 10 percento circa rispetto all'unità Iris Xe Graphics G7 96 EUs del modello dello scorso anno. Questo piccolo vantaggio non sarà percepibile per la maggior parte delle applicazioni.
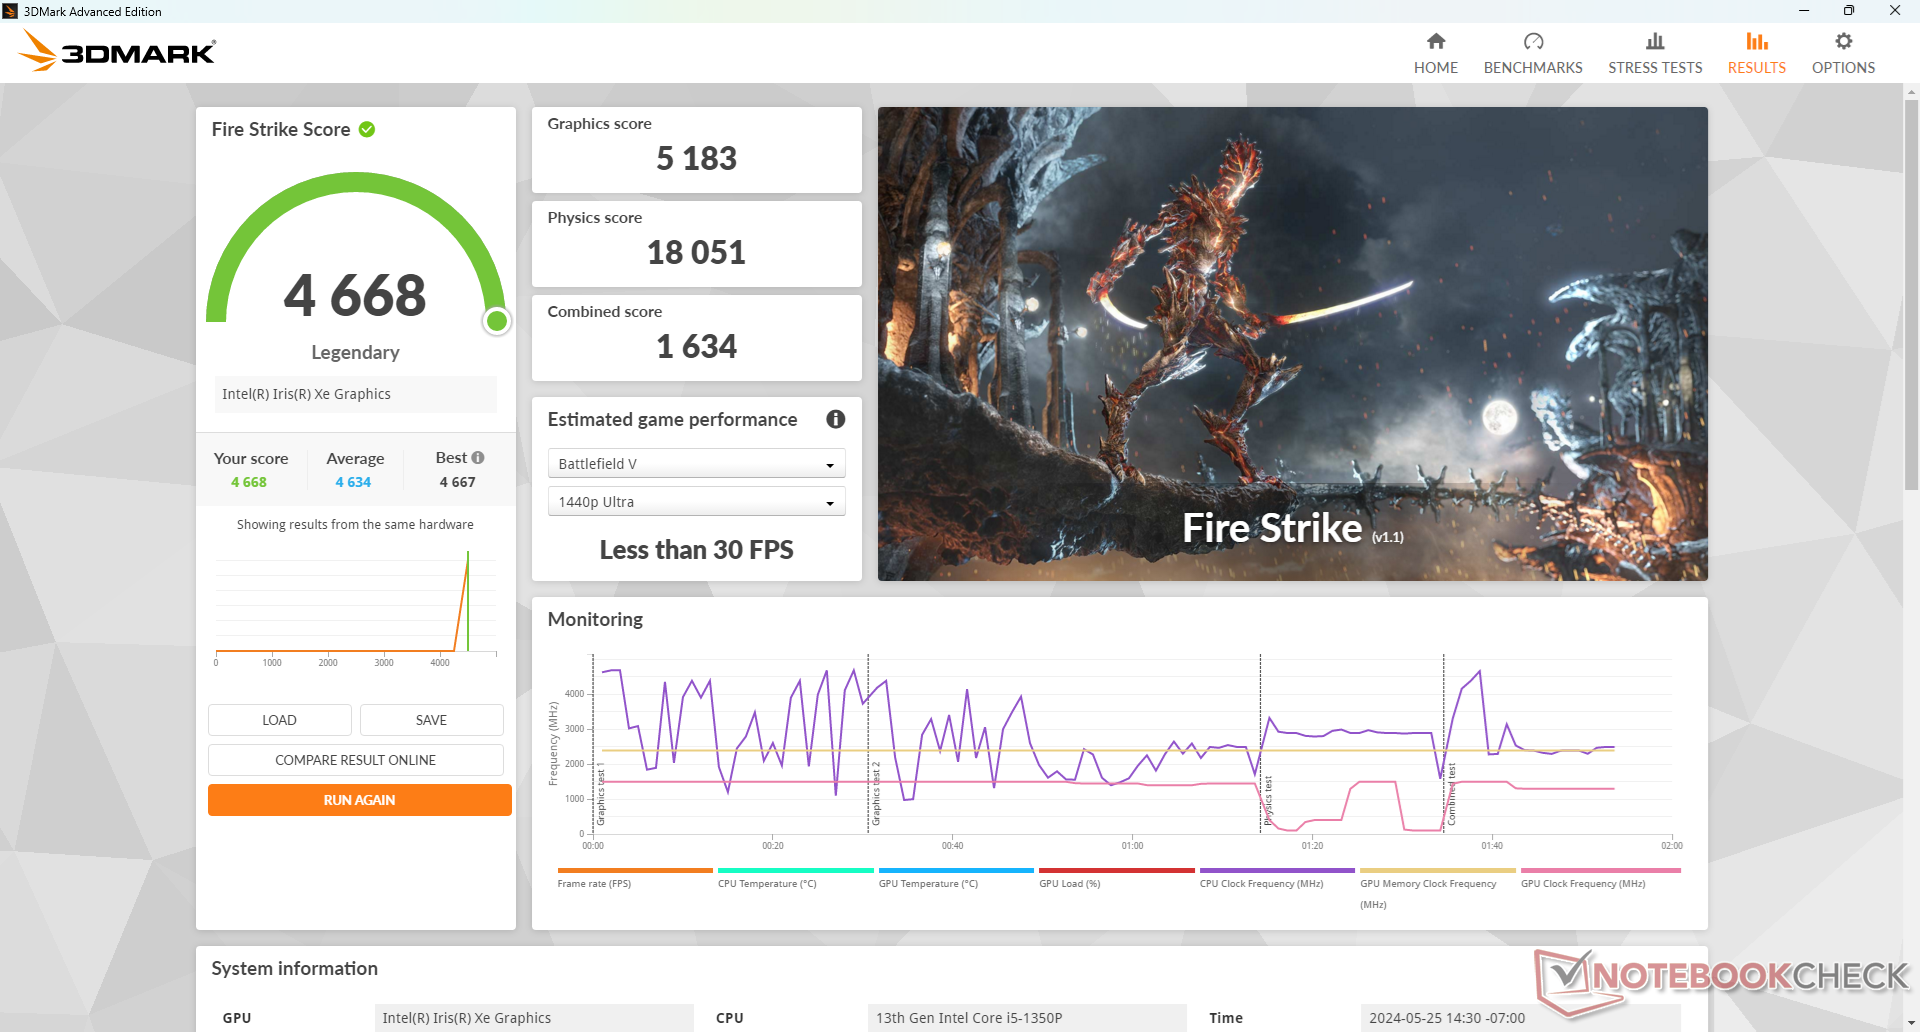
| Profilo di potenza | Punteggio grafico | Punteggio di fisica | Punteggio combinato |
| Profilo estremo | 5183 | 18051 | 1634 |
| Profilo predefinito | 5169 (-0%) | 17729 (-2%) | 1648 (-0%) |
| Potenza della batteria | 5186 (-0%) | 11113 (-38%) | 1725 (-0%) |
L'esecuzione in modalità prestazioni estreme non comporta prestazioni più rapide rispetto alla normale modalità prestazioni predefinita, come mostra la nostra tabella dei risultati Fire Strike qui sopra. Tuttavia, le prestazioni della CPU sono fortemente ridotte se si utilizza l'alimentazione a batteria, il che può essere deludente se si è sul campo.
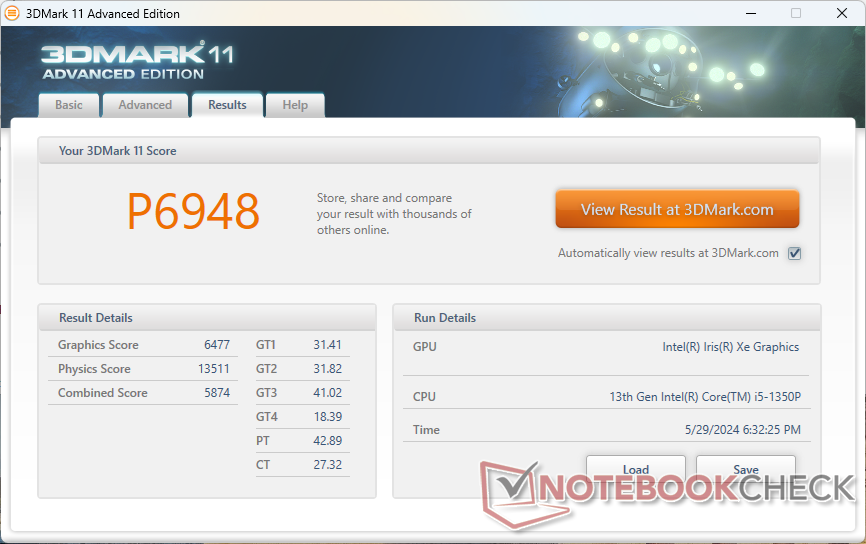
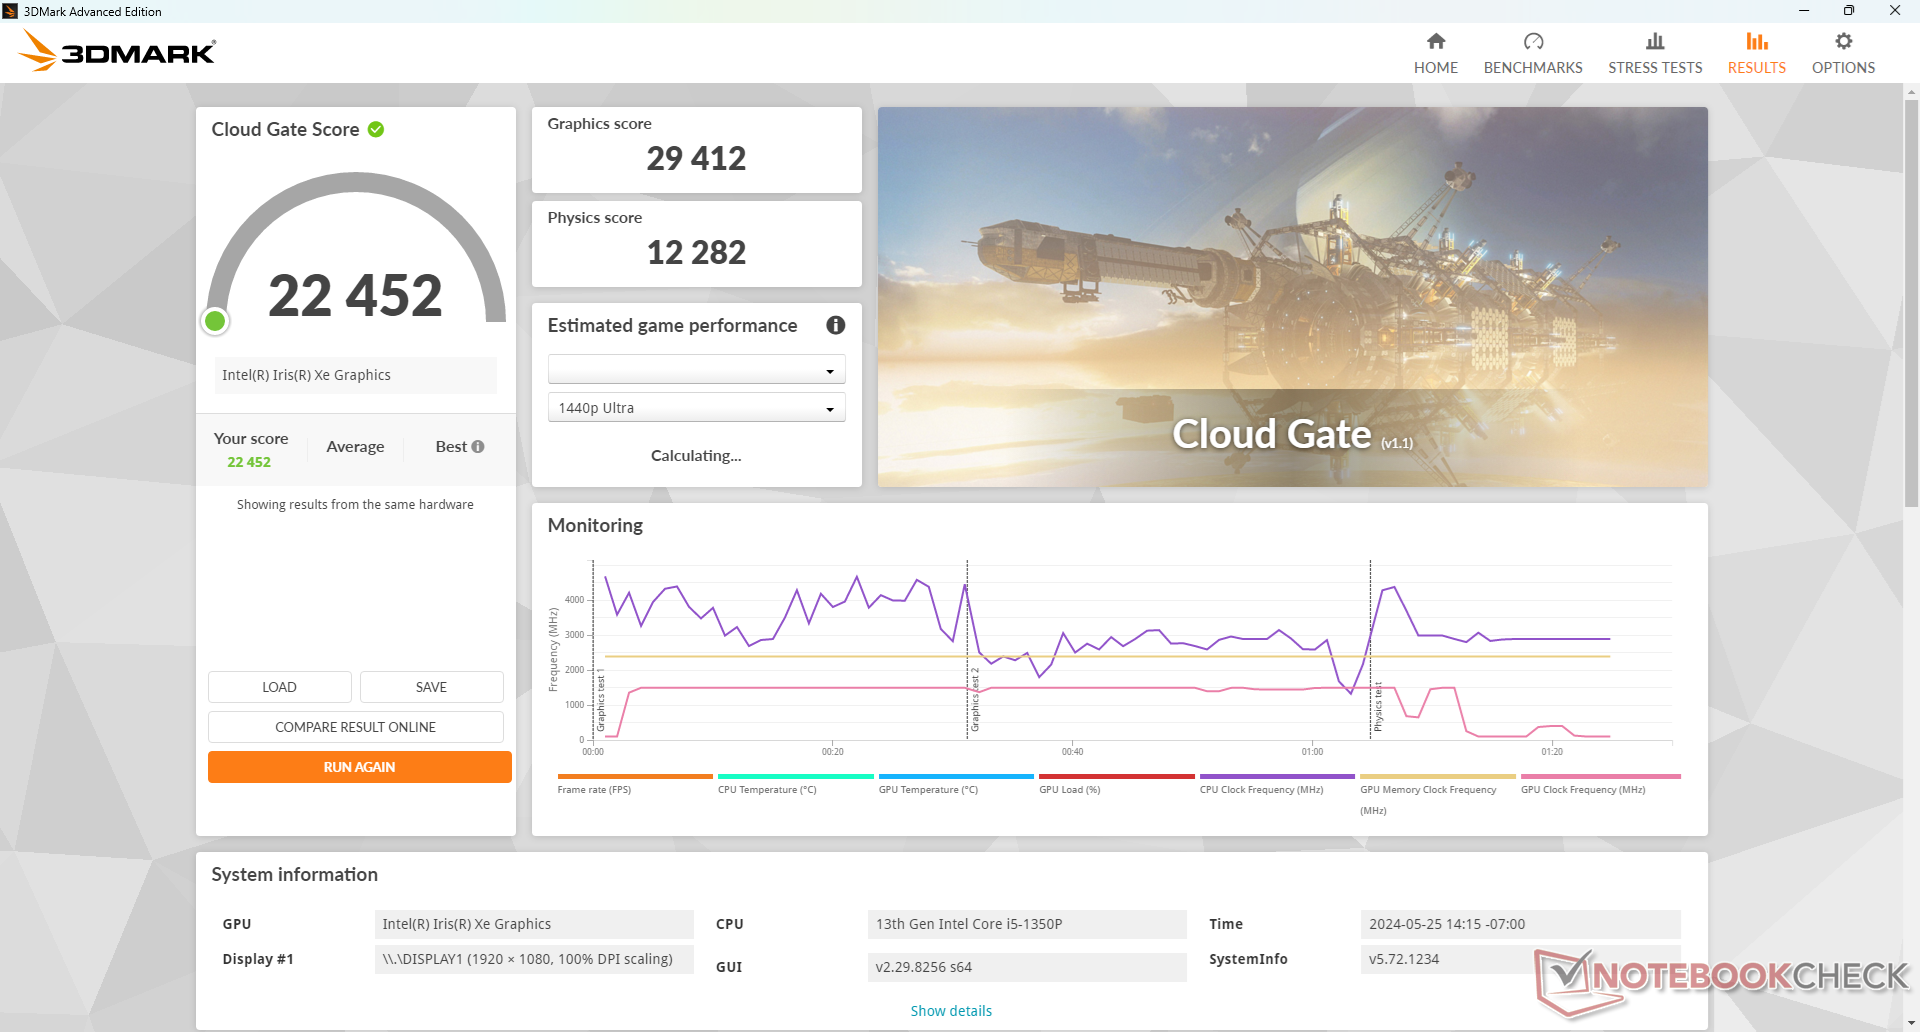
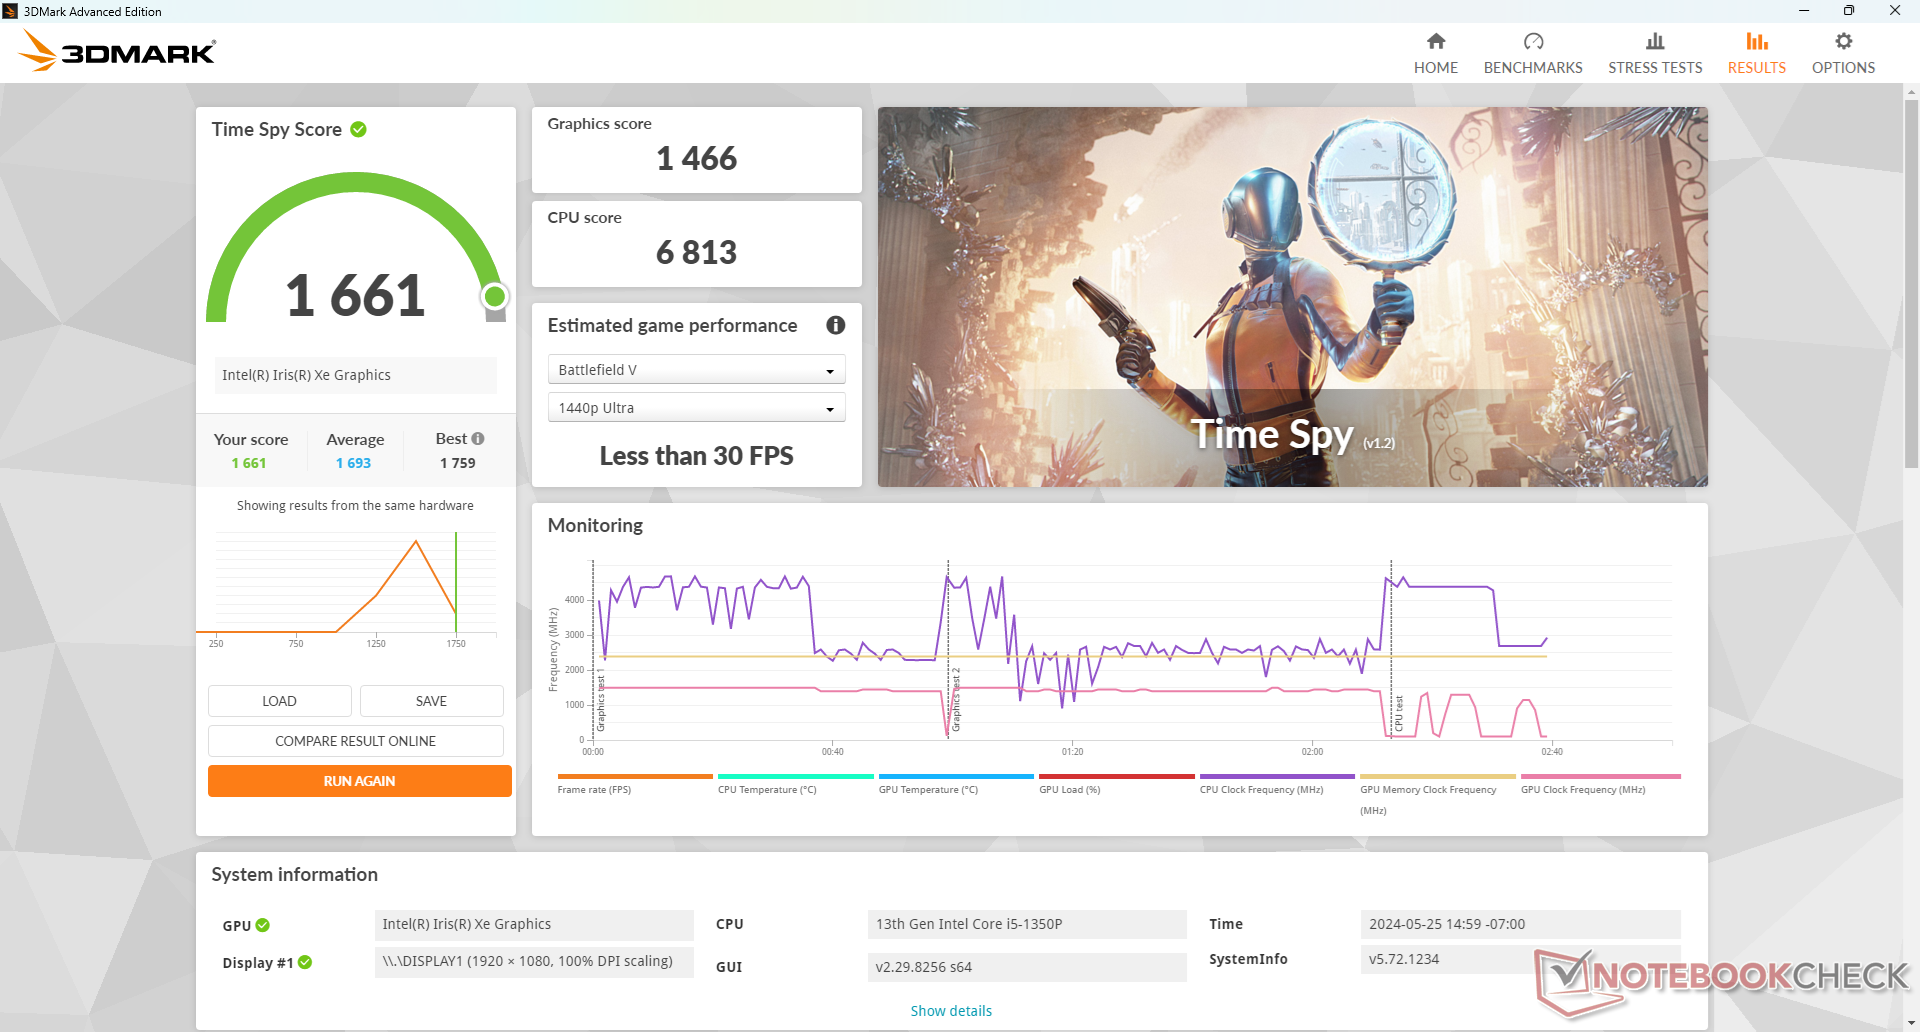
| 3DMark 11 Performance | 6948 punti | |
| 3DMark Cloud Gate Standard Score | 22452 punti | |
| 3DMark Fire Strike Score | 4668 punti | |
| 3DMark Time Spy Score | 1661 punti | |
Aiuto | ||
| Blender - v3.3 Classroom CPU | |
| Getac S410 G5 | |
* ... Meglio usare valori piccoli
| Performance Rating - Percent | |
| Getac S410 G5 | |
| Dell Latitude 7330 Rugged Extreme -2! | |
| Getac S410 Gen 4 | |
| Panasonic Toughbook 40 -2! | |
| Durabook S14I -3! | |
| Dell Latitude 14 5420-D2G5W -3! | |
| The Witcher 3 - 1920x1080 Ultra Graphics & Postprocessing (HBAO+) | |
| Getac S410 G5 | |
| Dell Latitude 7330 Rugged Extreme | |
| Panasonic Toughbook 40 | |
| Getac S410 Gen 4 | |
| Dell Latitude 14 5420-D2G5W | |
| GTA V - 1920x1080 Highest Settings possible AA:4xMSAA + FX AF:16x | |
| Getac S410 G5 | |
| Getac S410 Gen 4 | |
| Final Fantasy XV Benchmark - 1920x1080 High Quality | |
| Dell Latitude 7330 Rugged Extreme | |
| Getac S410 G5 | |
| Panasonic Toughbook 40 | |
| Getac S410 Gen 4 | |
| Durabook S14I | |
| Dell Latitude 14 5420-D2G5W | |
| Strange Brigade - 1920x1080 ultra AA:ultra AF:16 | |
| Getac S410 G5 | |
| Getac S410 Gen 4 | |
| Dota 2 Reborn - 1920x1080 ultra (3/3) best looking | |
| Dell Latitude 7330 Rugged Extreme | |
| Panasonic Toughbook 40 | |
| Getac S410 G5 | |
| Getac S410 Gen 4 | |
| Durabook S14I | |
| X-Plane 11.11 - 1920x1080 high (fps_test=3) | |
| Getac S410 G5 | |
| Getac S410 Gen 4 | |
| Durabook S14I | |
| Panasonic Toughbook 40 | |
| Dell Latitude 14 5420-D2G5W | |
| Dell Latitude 7330 Rugged Extreme | |
| GTA V | |
| 1024x768 Lowest Settings possible | |
| Getac S410 G5 | |
| Media Intel Iris Xe Graphics G7 80EUs (36.5 - 144.6, n=82) | |
| Getac S410 Gen 4 | |
| Dell Latitude 14 5420-D2G5W | |
| 1920x1080 Lowest Settings possible | |
| Getac S410 G5 | |
| Media Intel Iris Xe Graphics G7 80EUs (21.5 - 98.1, n=66) | |
| Getac S410 Gen 4 | |
| 1366x768 Normal/Off AF:4x | |
| Getac S410 G5 | |
| Media Intel Iris Xe Graphics G7 80EUs (28.9 - 133.8, n=85) | |
| Getac S410 Gen 4 | |
| Dell Latitude 14 5420-D2G5W | |
| 1920x1080 Normal/Off AF:4x | |
| Getac S410 G5 | |
| Media Intel Iris Xe Graphics G7 80EUs (18.8 - 97.2, n=66) | |
| Getac S410 Gen 4 | |
| 1920x1080 High/On (Advanced Graphics Off) AA:2xMSAA + FX AF:8x | |
| Getac S410 G5 | |
| Getac S410 Gen 4 | |
| Media Intel Iris Xe Graphics G7 80EUs (7.81 - 32, n=84) | |
| Dell Latitude 14 5420-D2G5W | |
| 1920x1080 Highest Settings possible AA:4xMSAA + FX AF:16x | |
| Getac S410 G5 | |
| Getac S410 Gen 4 | |
| Media Intel Iris Xe Graphics G7 80EUs (3.07 - 11.6, n=71) | |
| Strange Brigade | |
| 1280x720 lowest AF:1 | |
| Getac S410 G5 | |
| Getac S410 Gen 4 | |
| Media Intel Iris Xe Graphics G7 80EUs (22.7 - 98.7, n=82) | |
| Dell Latitude 14 5420-D2G5W | |
| 1920x1080 medium AA:medium AF:4 | |
| Getac S410 G5 | |
| Getac S410 Gen 4 | |
| Media Intel Iris Xe Graphics G7 80EUs (6 - 48.8, n=84) | |
| Dell Latitude 14 5420-D2G5W | |
| 1920x1080 high AA:high AF:8 | |
| Getac S410 G5 | |
| Getac S410 Gen 4 | |
| Media Intel Iris Xe Graphics G7 80EUs (11.4 - 34, n=81) | |
| Dell Latitude 14 5420-D2G5W | |
| 1920x1080 ultra AA:ultra AF:16 | |
| Getac S410 G5 | |
| Getac S410 Gen 4 | |
| Media Intel Iris Xe Graphics G7 80EUs (13.6 - 27, n=57) | |
Le frequenze dei fotogrammi al minimo su Witcher 3 sono costanti, tranne in un caso in cui, dopo 40 minuti di test, sono scese a soli 10 FPS per suggerire l'interruzione di un'attività in background. Questo è deludente per un sistema industriale o robusto, dove la stabilità è di estrema importanza e le applicazioni in background non dovrebbero avere la priorità.
Witcher 3 FPS Chart
| basso | medio | alto | ultra | |
|---|---|---|---|---|
| GTA V (2015) | 101.8 | 94.6 | 22.5 | 9.58 |
| The Witcher 3 (2015) | 79.9 | 56.3 | 31.5 | 28 |
| Dota 2 Reborn (2015) | 94.8 | 71.3 | 55.8 | 49.5 |
| Final Fantasy XV Benchmark (2018) | 40.4 | 22 | 15.8 | |
| X-Plane 11.11 (2018) | 47.6 | 36.1 | 32.7 | |
| Strange Brigade (2018) | 86.2 | 38.9 | 31 | 25.1 |
Emissioni
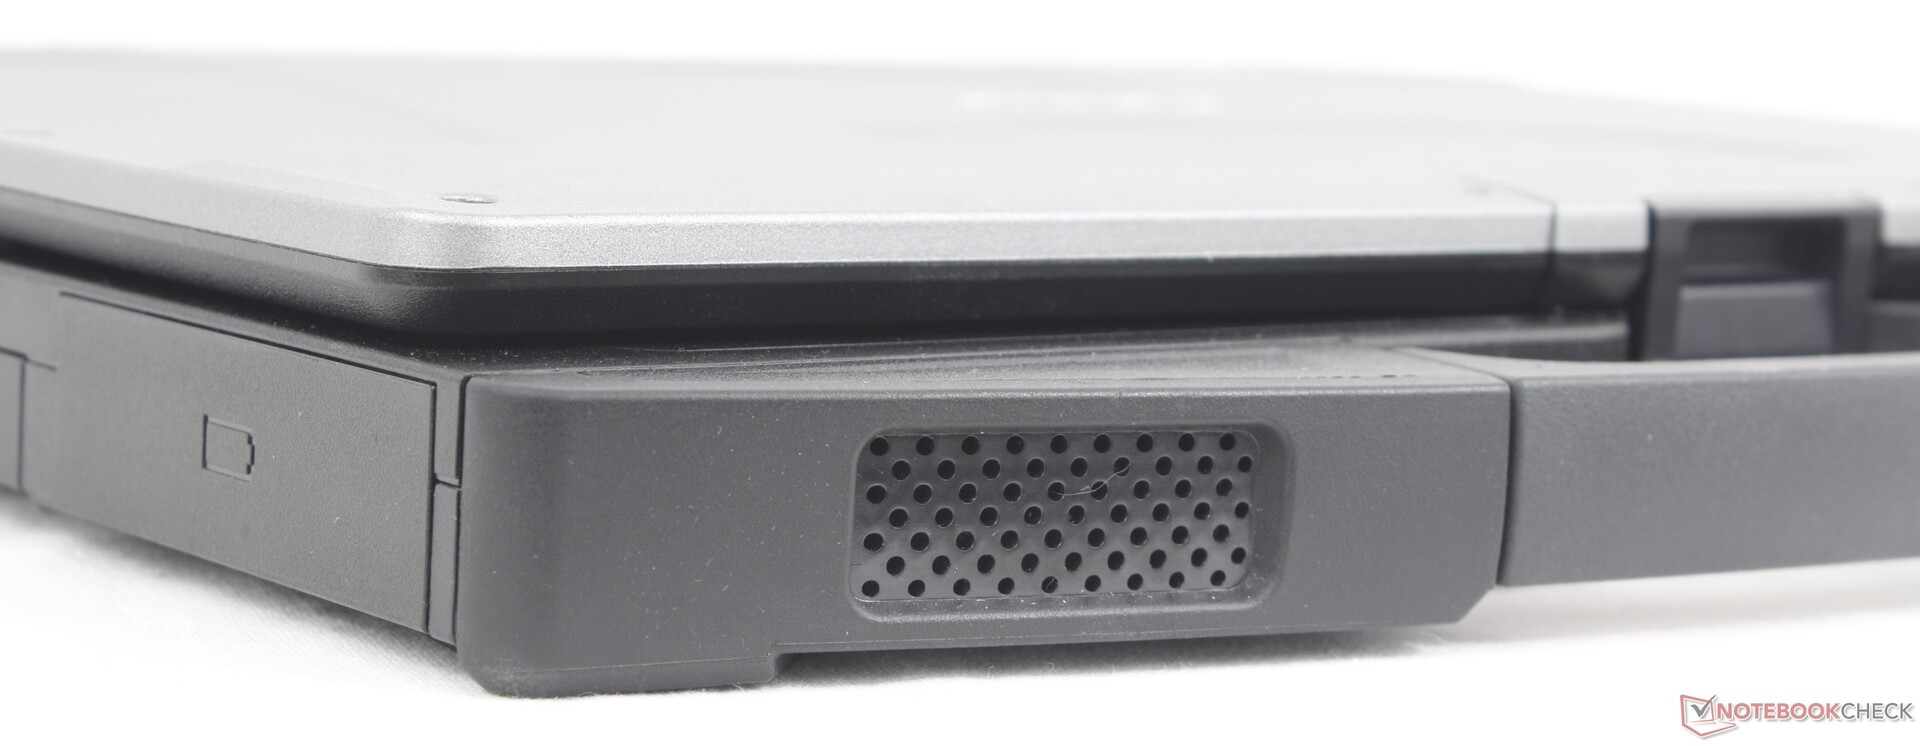
Rumore del sistema - Ventola ad alta frequenza
Il comportamento del rumore del ventilatore è in gran parte lo stesso di prima, con un pavimento e un soffitto simili. La cosa più deludente è che il rumore relativamente acuto della ventola rimane, rendendo la ventola più evidente di quanto sia necessario durante l'uso.
Rumorosità
| Idle |
| 23.4 / 25.9 / 26 dB(A) |
| Sotto carico |
| 38.7 / 42.1 dB(A) |
 | ||
30 dB silenzioso 40 dB(A) udibile 50 dB(A) rumoroso |
||
min: | ||
| Getac S410 G5 Iris Xe G7 80EUs, i5-1350P, SSSTC CL4-8D512 | Getac S410 Gen 4 Iris Xe G7 96EUs, i7-1185G7, SSSTC CA5-8D256 | Durabook S14I Iris Xe G7 96EUs, i7-1165G7, UDinfo M2P M2P80DE512GBAEP | Dell Latitude 14 5420-D2G5W Iris Xe G7 80EUs, i5-1135G7, WDC PC SN530 SDBPTPZ-256G | Dell Latitude 7330 Rugged Extreme Iris Xe G7 96EUs, i7-1185G7 | Panasonic Toughbook 40 Iris Xe G7 96EUs, i7-1185G7, Samsung PM991 MZVLQ1T0HALB | |
|---|---|---|---|---|---|---|
| Noise | -2% | -4% | -4% | 13% | 1% | |
| off /ambiente * | 23.4 | 23.3 -0% | 25.2 -8% | 25 -7% | 22.9 2% | 22.8 3% |
| Idle Minimum * | 23.4 | 23.5 -0% | 25.2 -8% | 25 -7% | 23.1 1% | 26 -11% |
| Idle Average * | 25.9 | 23.5 9% | 25.2 3% | 25 3% | 23.1 11% | 26 -0% |
| Idle Maximum * | 26 | 28 -8% | 34.5 -33% | 25 4% | 23.1 11% | 26 -0% |
| Load Average * | 38.7 | 42.8 -11% | 34.5 11% | 36.5 6% | 28 28% | 37.6 3% |
| Witcher 3 ultra * | 42.1 | 42.3 -0% | 31.2 26% | 37.8 10% | ||
| Load Maximum * | 42.1 | 42.6 -1% | 36.2 14% | 52.4 -24% | 36.2 14% | 40.3 4% |
* ... Meglio usare valori piccoli
Temperatura
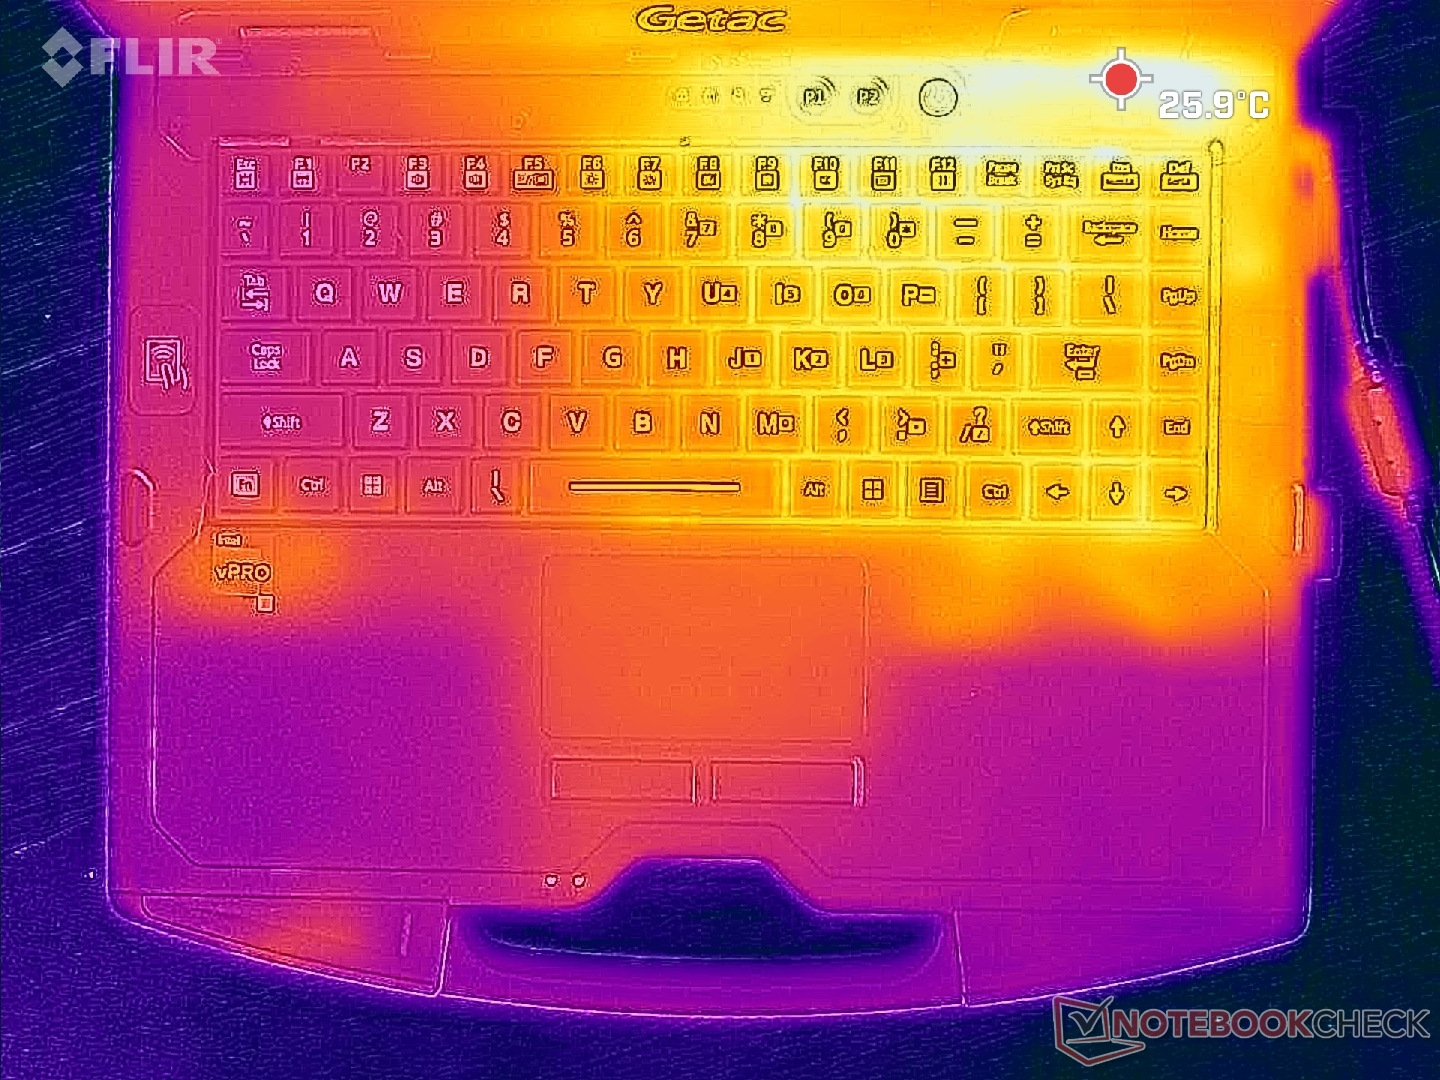
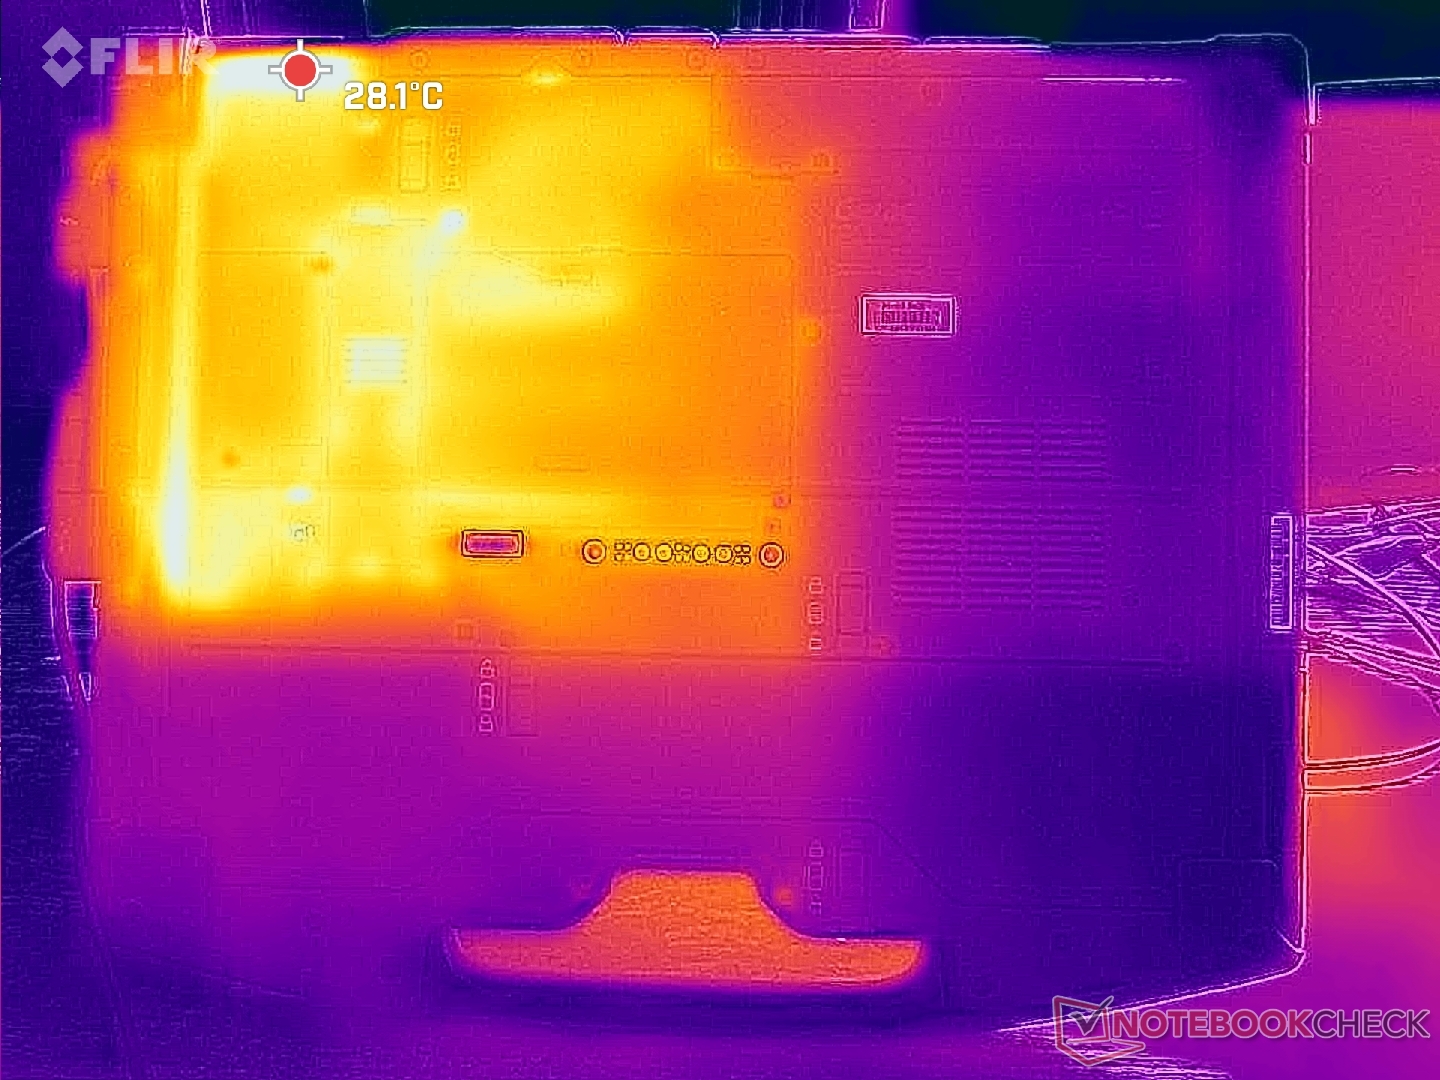
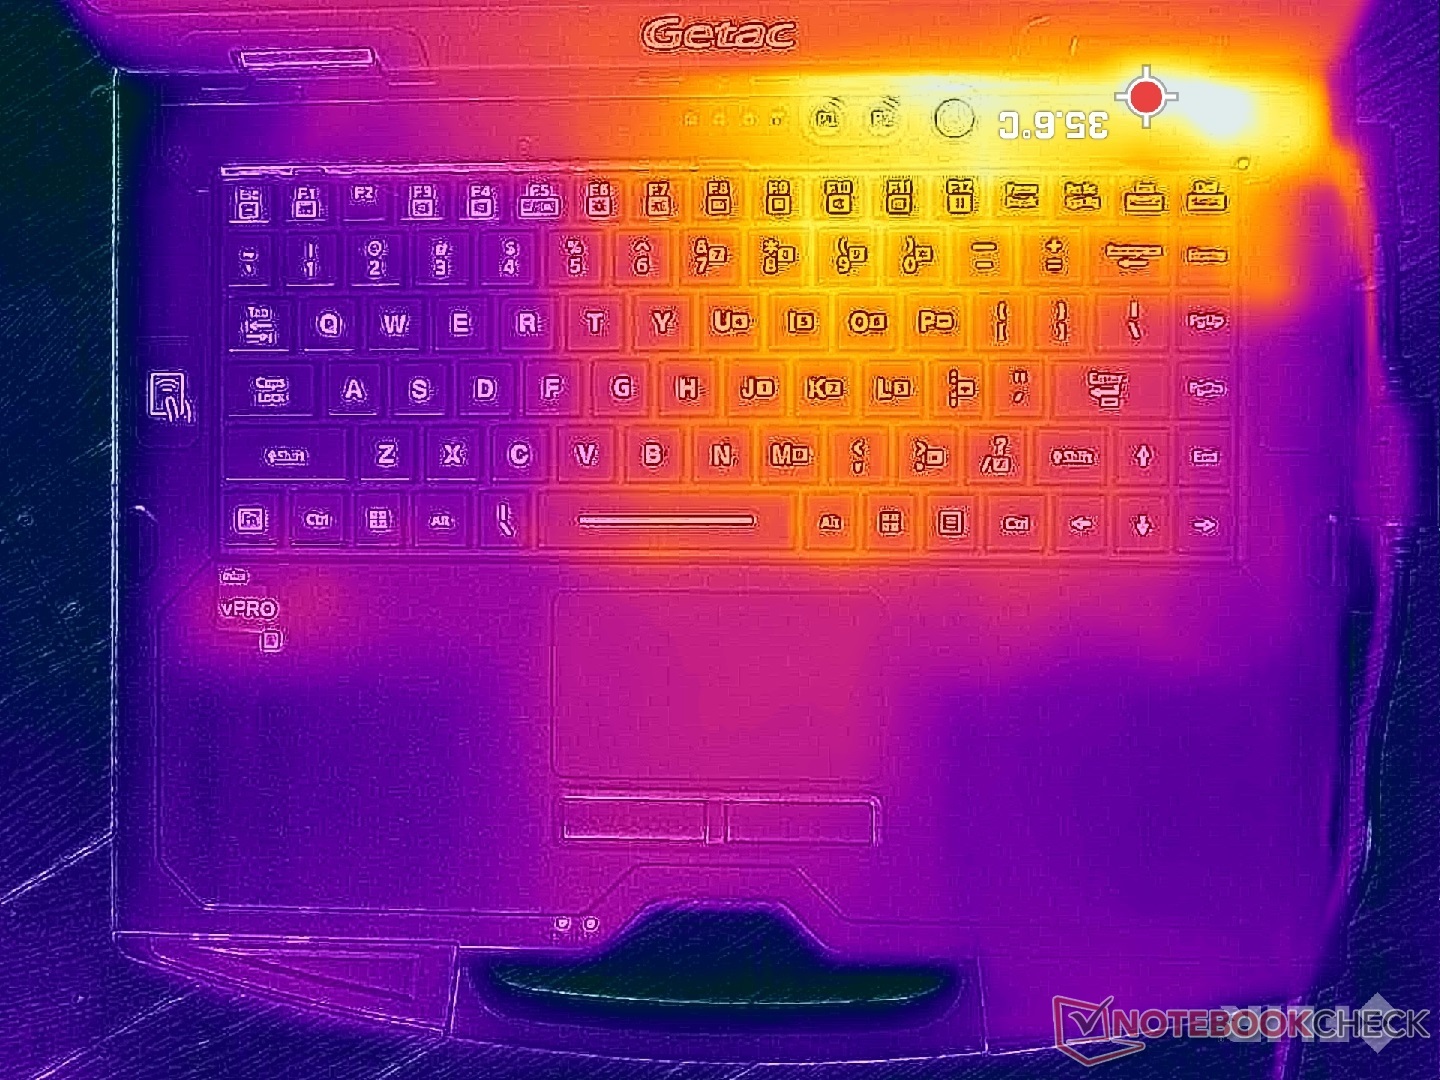
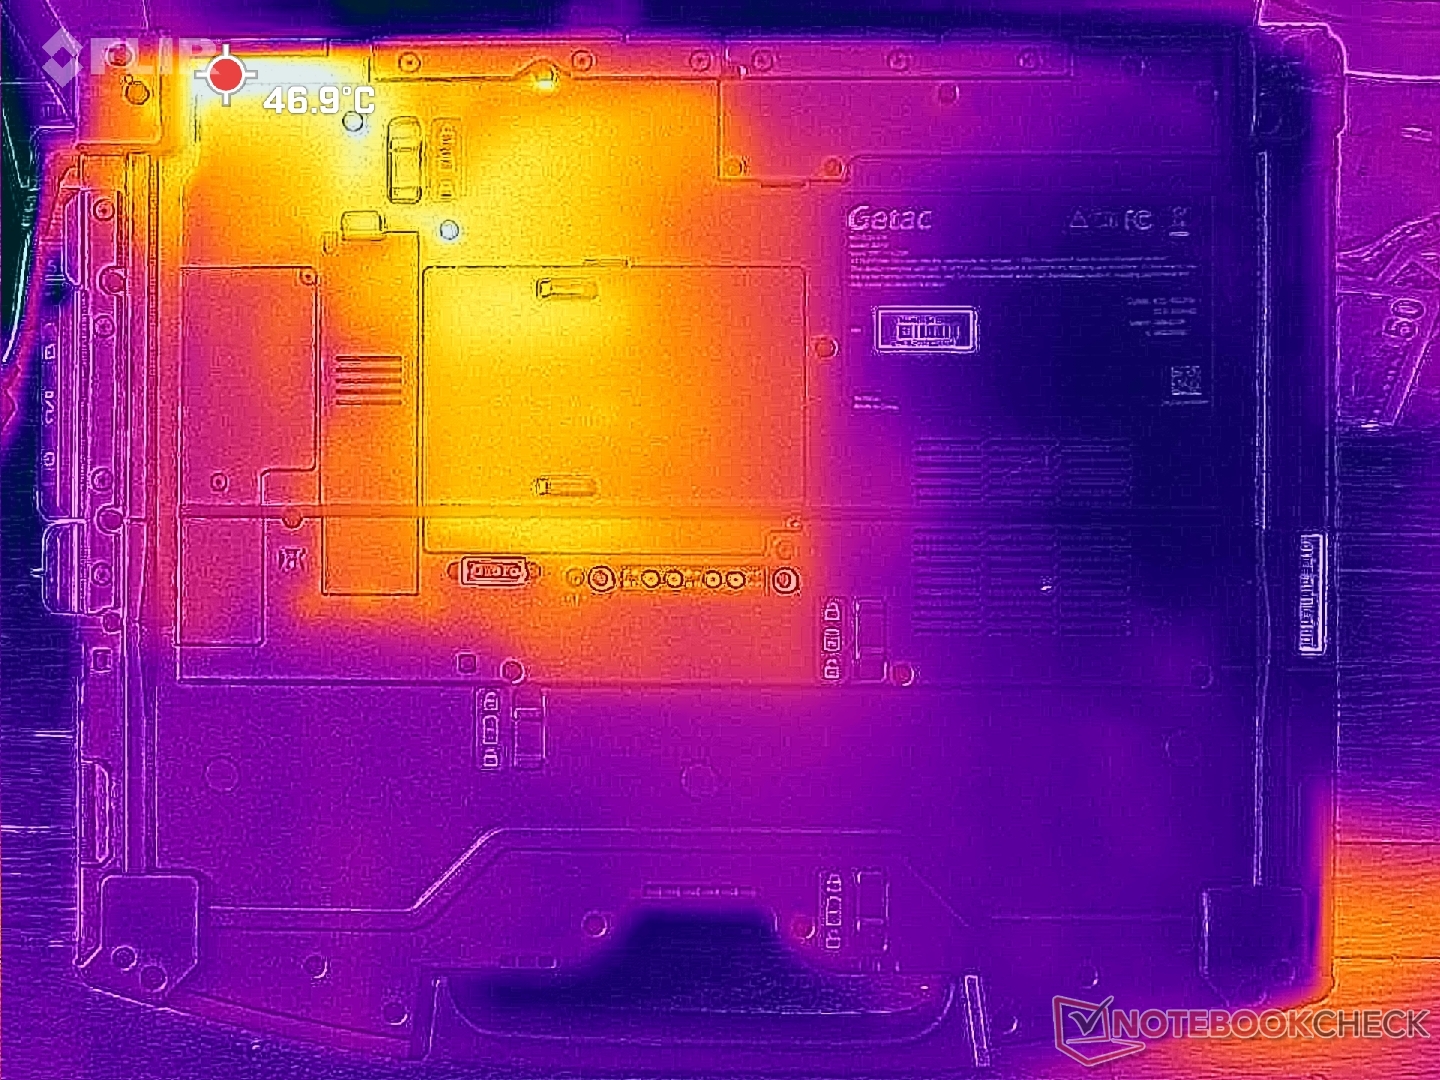
Le temperature di superficie sono più calde sulla metà destra dello chassis rispetto alla parte sinistra. I punti caldi possono raggiungere oltre 36 C e 47 C sulle coperture C e D del portatile, rispettivamente, ma queste aree sono concentrate verso la parte posteriore, dove è improbabile che le dita o la pelle vengano a contatto.
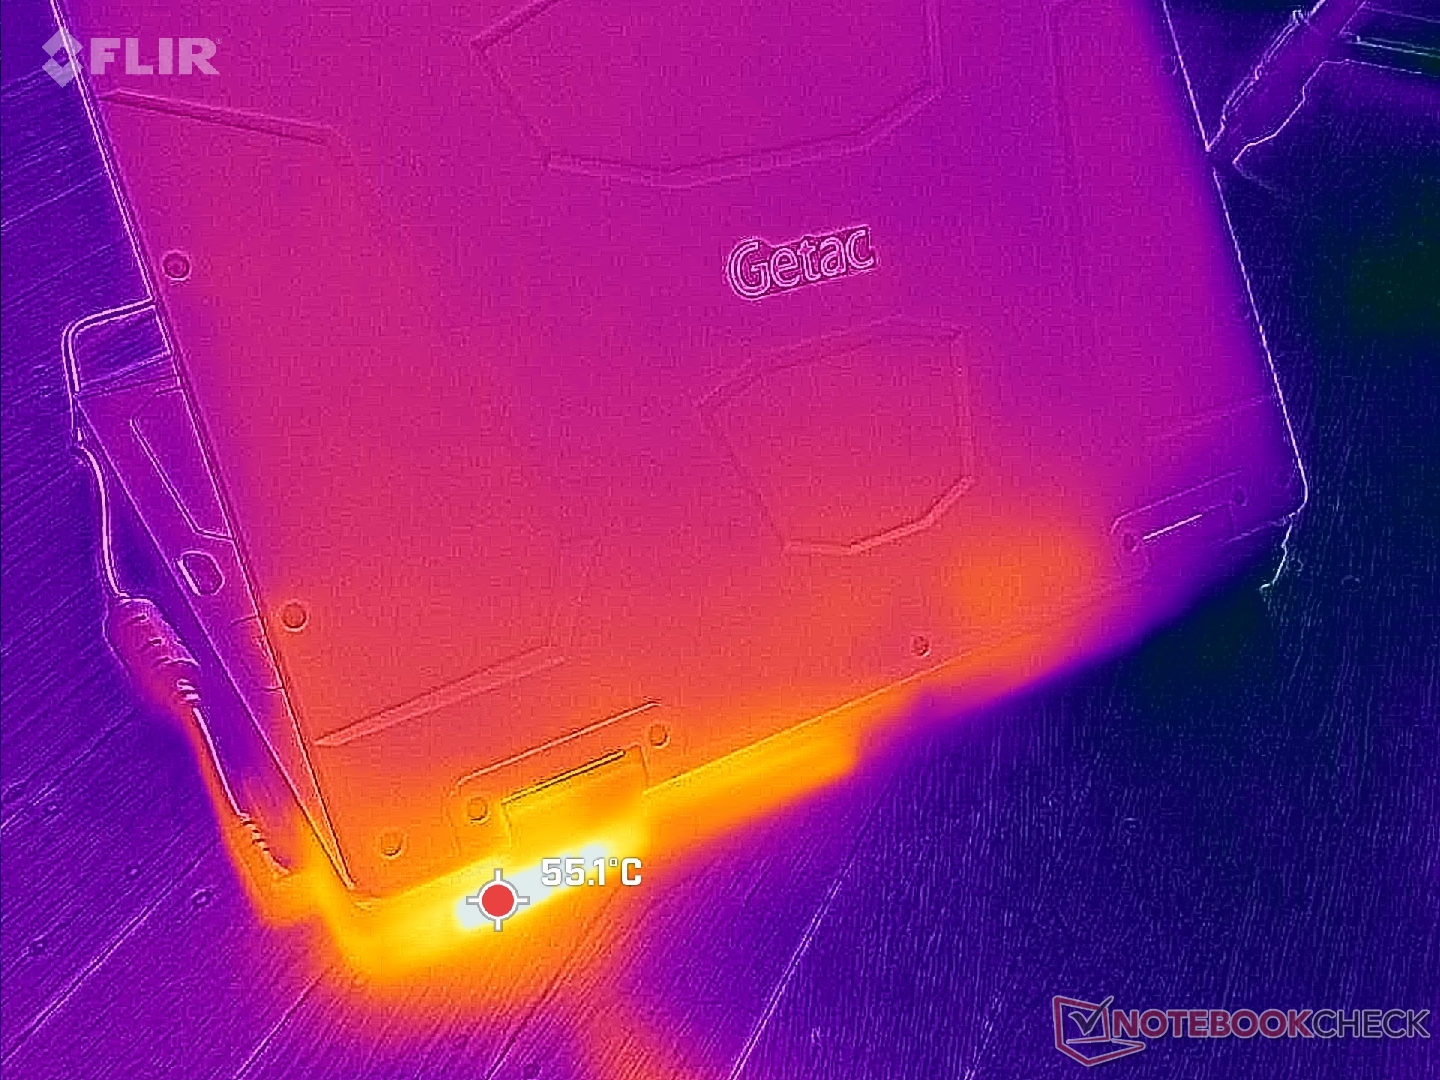
(+) La temperatura massima sul lato superiore è di 37 °C / 99 F, rispetto alla media di 34.3 °C / 94 F, che varia da 21.2 a 62.5 °C per questa classe Office.
(±) Il lato inferiore si riscalda fino ad un massimo di 42.2 °C / 108 F, rispetto alla media di 36.8 °C / 98 F
(+) In idle, la temperatura media del lato superiore è di 25.6 °C / 78 F, rispetto alla media deld ispositivo di 29.5 °C / 85 F.
(+) I poggiapolsi e il touchpad sono piu' freddi della temperatura della pelle con un massimo di 26.8 °C / 80.2 F e sono quindi freddi al tatto.
(±) La temperatura media della zona del palmo della mano di dispositivi simili e'stata di 27.6 °C / 81.7 F (+0.8 °C / 1.5 F).
| Getac S410 G5 Intel Core i5-1350P, Intel Iris Xe Graphics G7 80EUs | Getac S410 Gen 4 Intel Core i7-1185G7, Intel Iris Xe Graphics G7 96EUs | Durabook S14I Intel Core i7-1165G7, Intel Iris Xe Graphics G7 96EUs | Dell Latitude 14 5420-D2G5W Intel Core i5-1135G7, Intel Iris Xe Graphics G7 80EUs | Dell Latitude 7330 Rugged Extreme Intel Core i7-1185G7, Intel Iris Xe Graphics G7 96EUs | Panasonic Toughbook 40 Intel Core i7-1185G7, Intel Iris Xe Graphics G7 96EUs | |
|---|---|---|---|---|---|---|
| Heat | -7% | -1% | 2% | 14% | 5% | |
| Maximum Upper Side * | 37 | 36 3% | 36.4 2% | 41.7 -13% | 34.6 6% | 35.6 4% |
| Maximum Bottom * | 42.2 | 46.8 -11% | 38.6 9% | 35.6 16% | 36.6 13% | 40 5% |
| Idle Upper Side * | 28.8 | 30 -4% | 32.6 -13% | 29.9 -4% | 24.8 14% | 28.6 1% |
| Idle Bottom * | 33 | 38.2 -16% | 33.8 -2% | 29.7 10% | 25.2 24% | 29.4 11% |
* ... Meglio usare valori piccoli
Test da sforzo
La temperatura del core sotto carico è leggermente più fredda di qualche grado C rispetto all'S410 G4 dello scorso anno. Durante l'esecuzione dello stress Prime95, la CPU aumentava a 3,1 GHz, 53 W e 97 C, fino a scendere a 1,9 GHz, 88 C e 29 W dopo un minuto di test, a causa della sostenibilità limitata del Turbo Boost. Anche la temperatura del core sarebbe stata simile durante l'esecuzione Witcher 3 mentre la CPU dell'S410 G4 si stabilizzava ben oltre i 90 C.
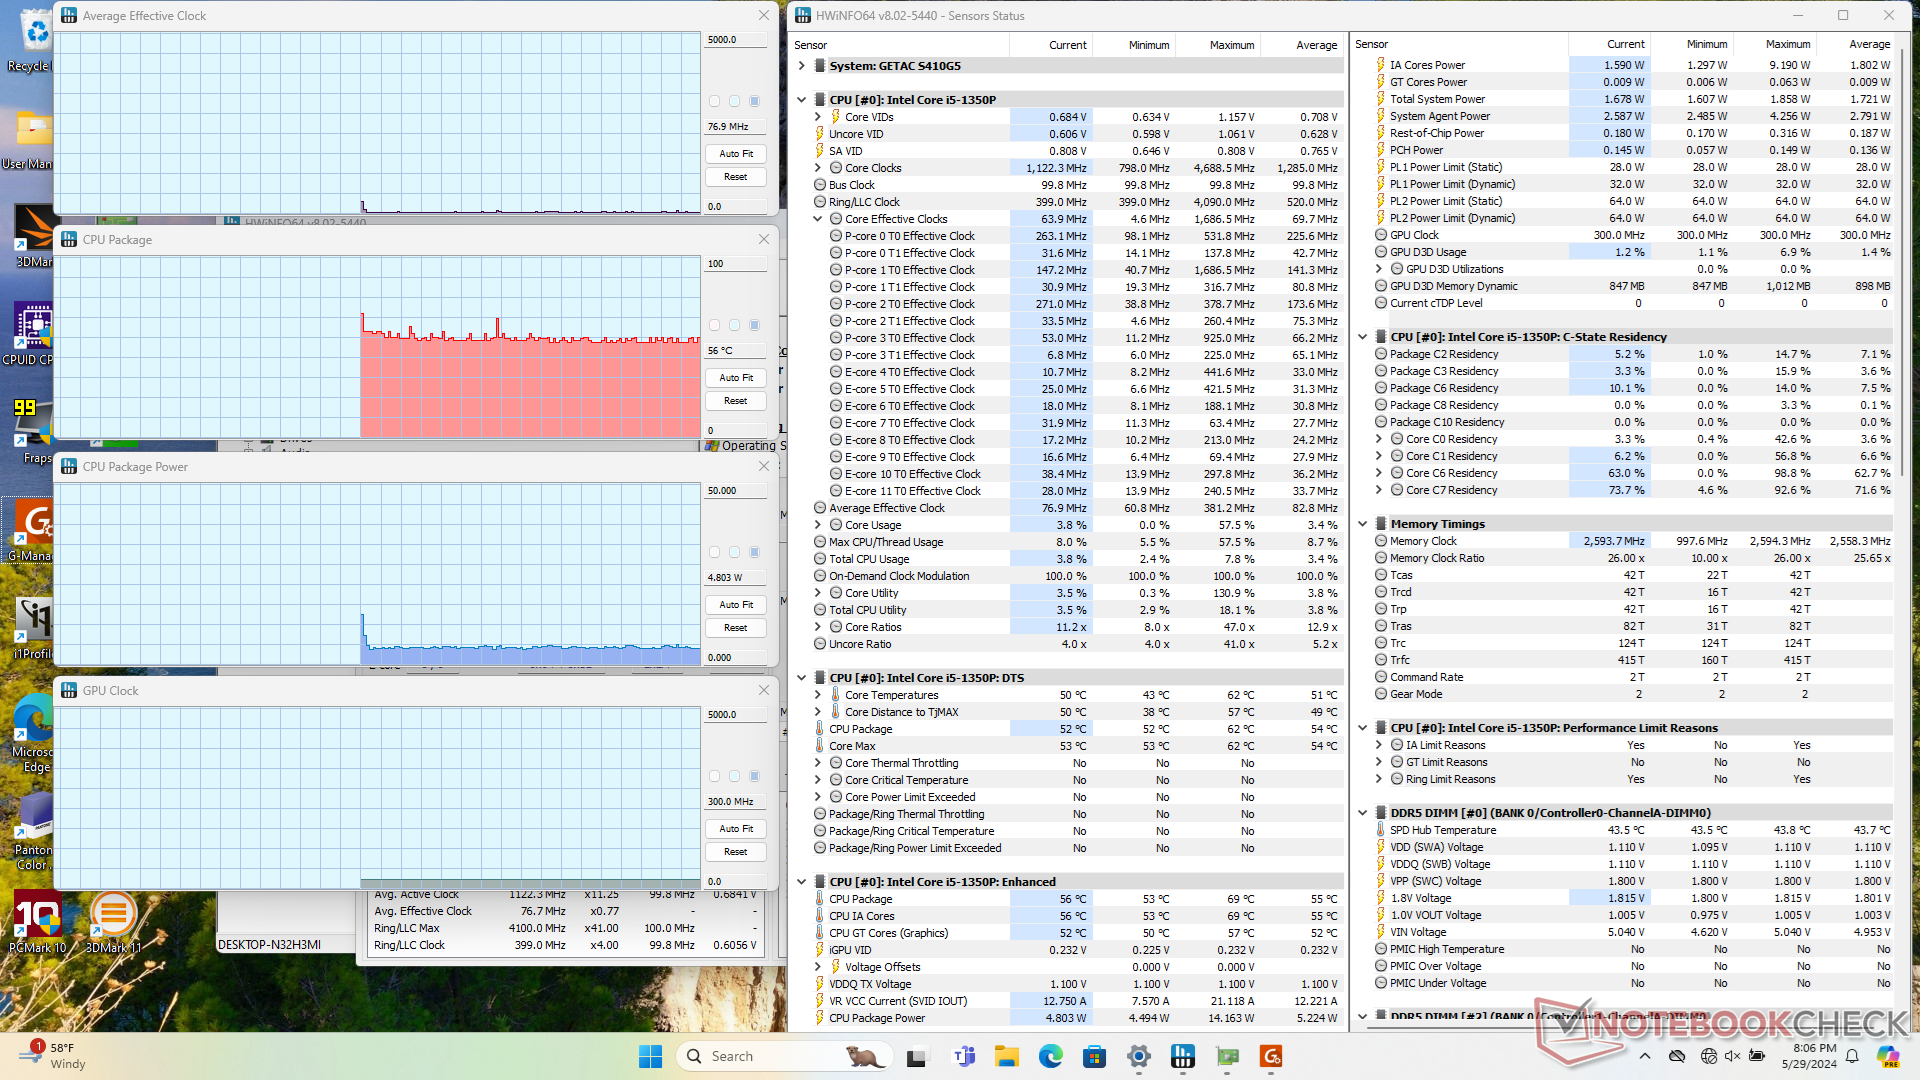
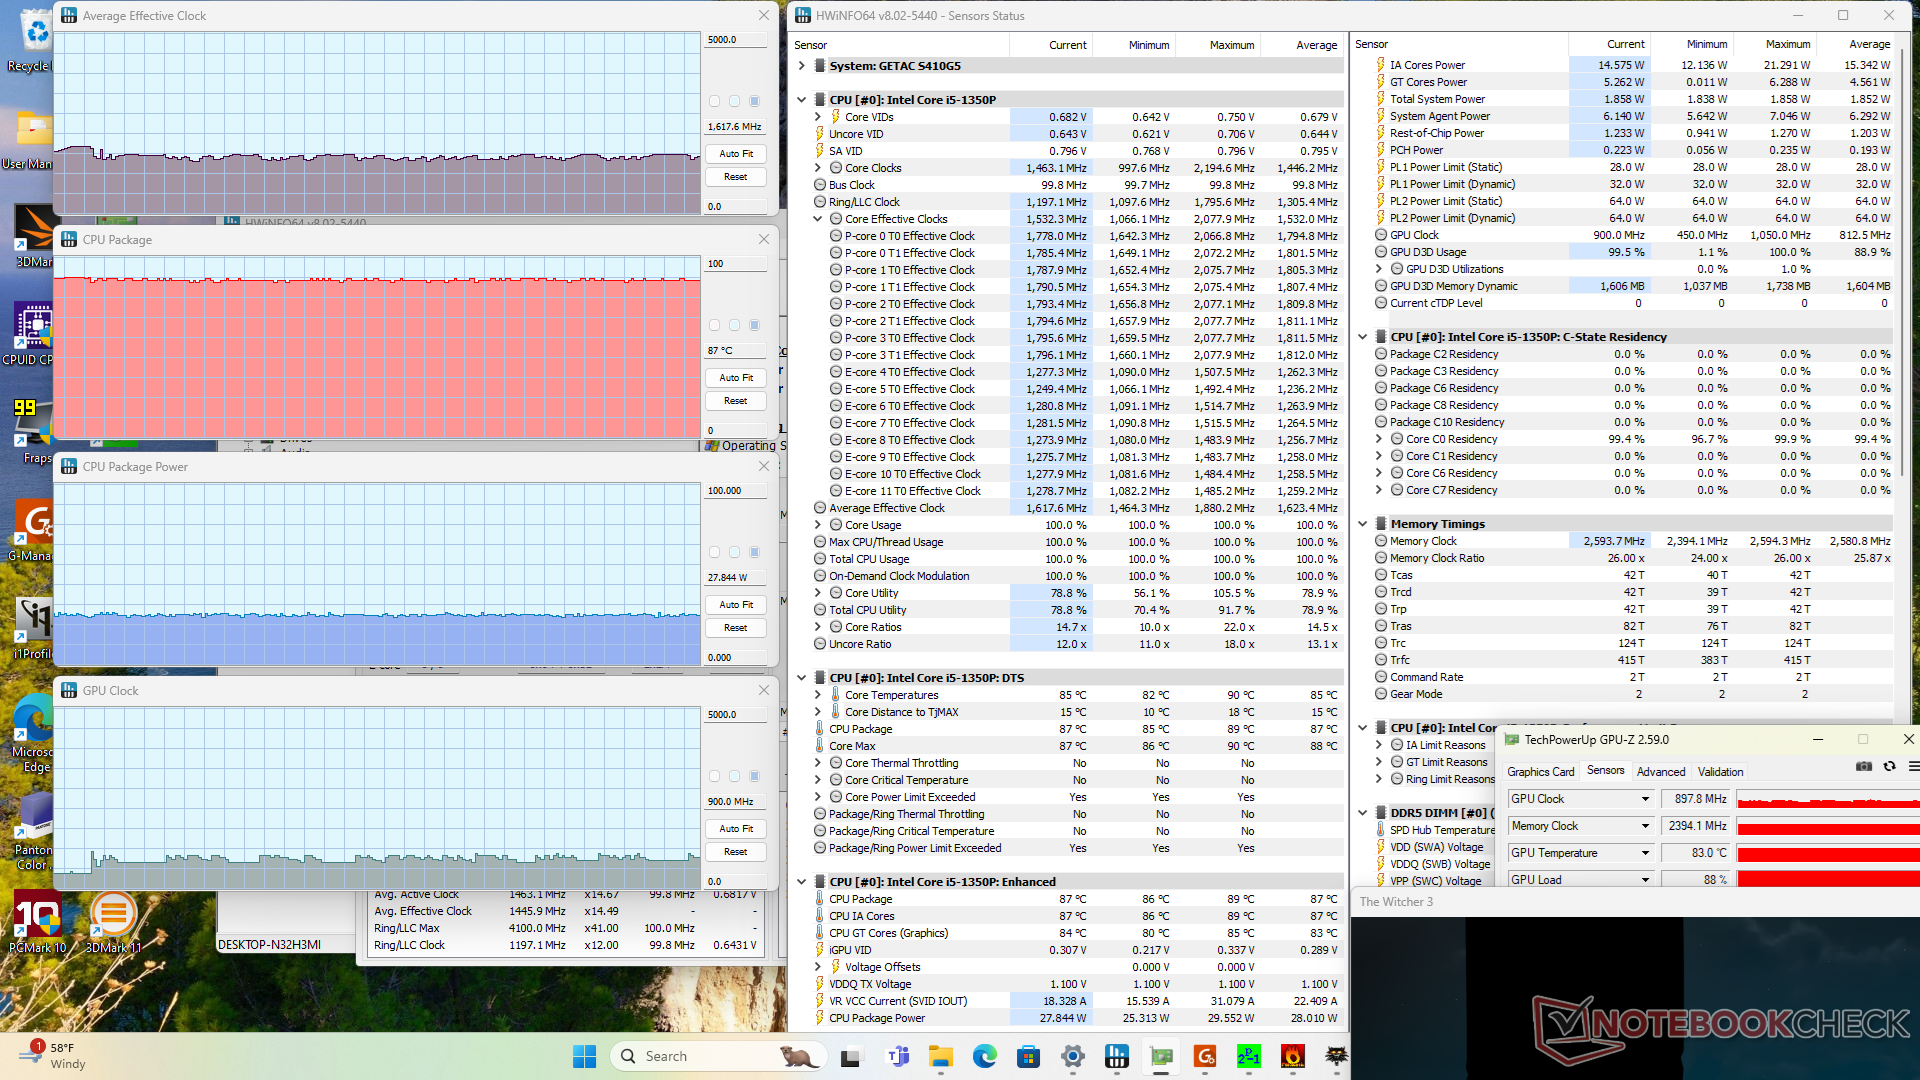
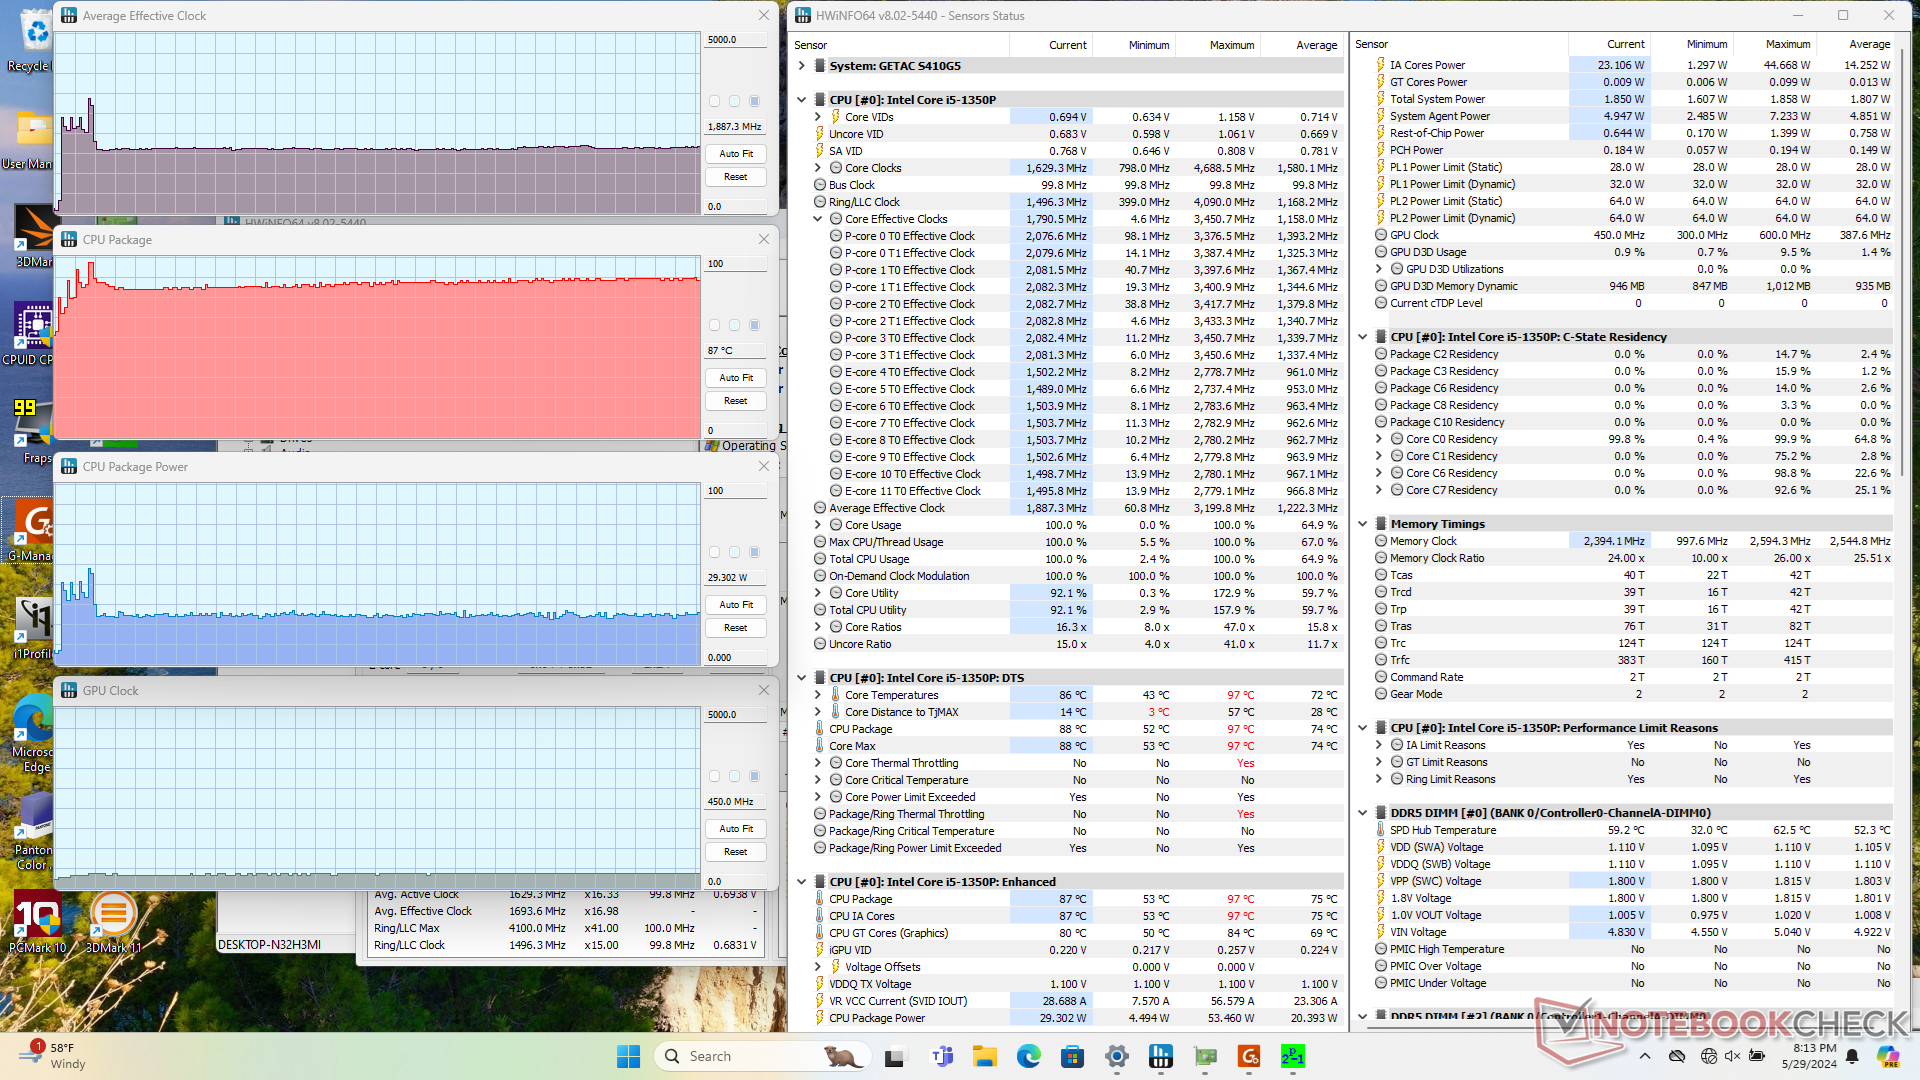
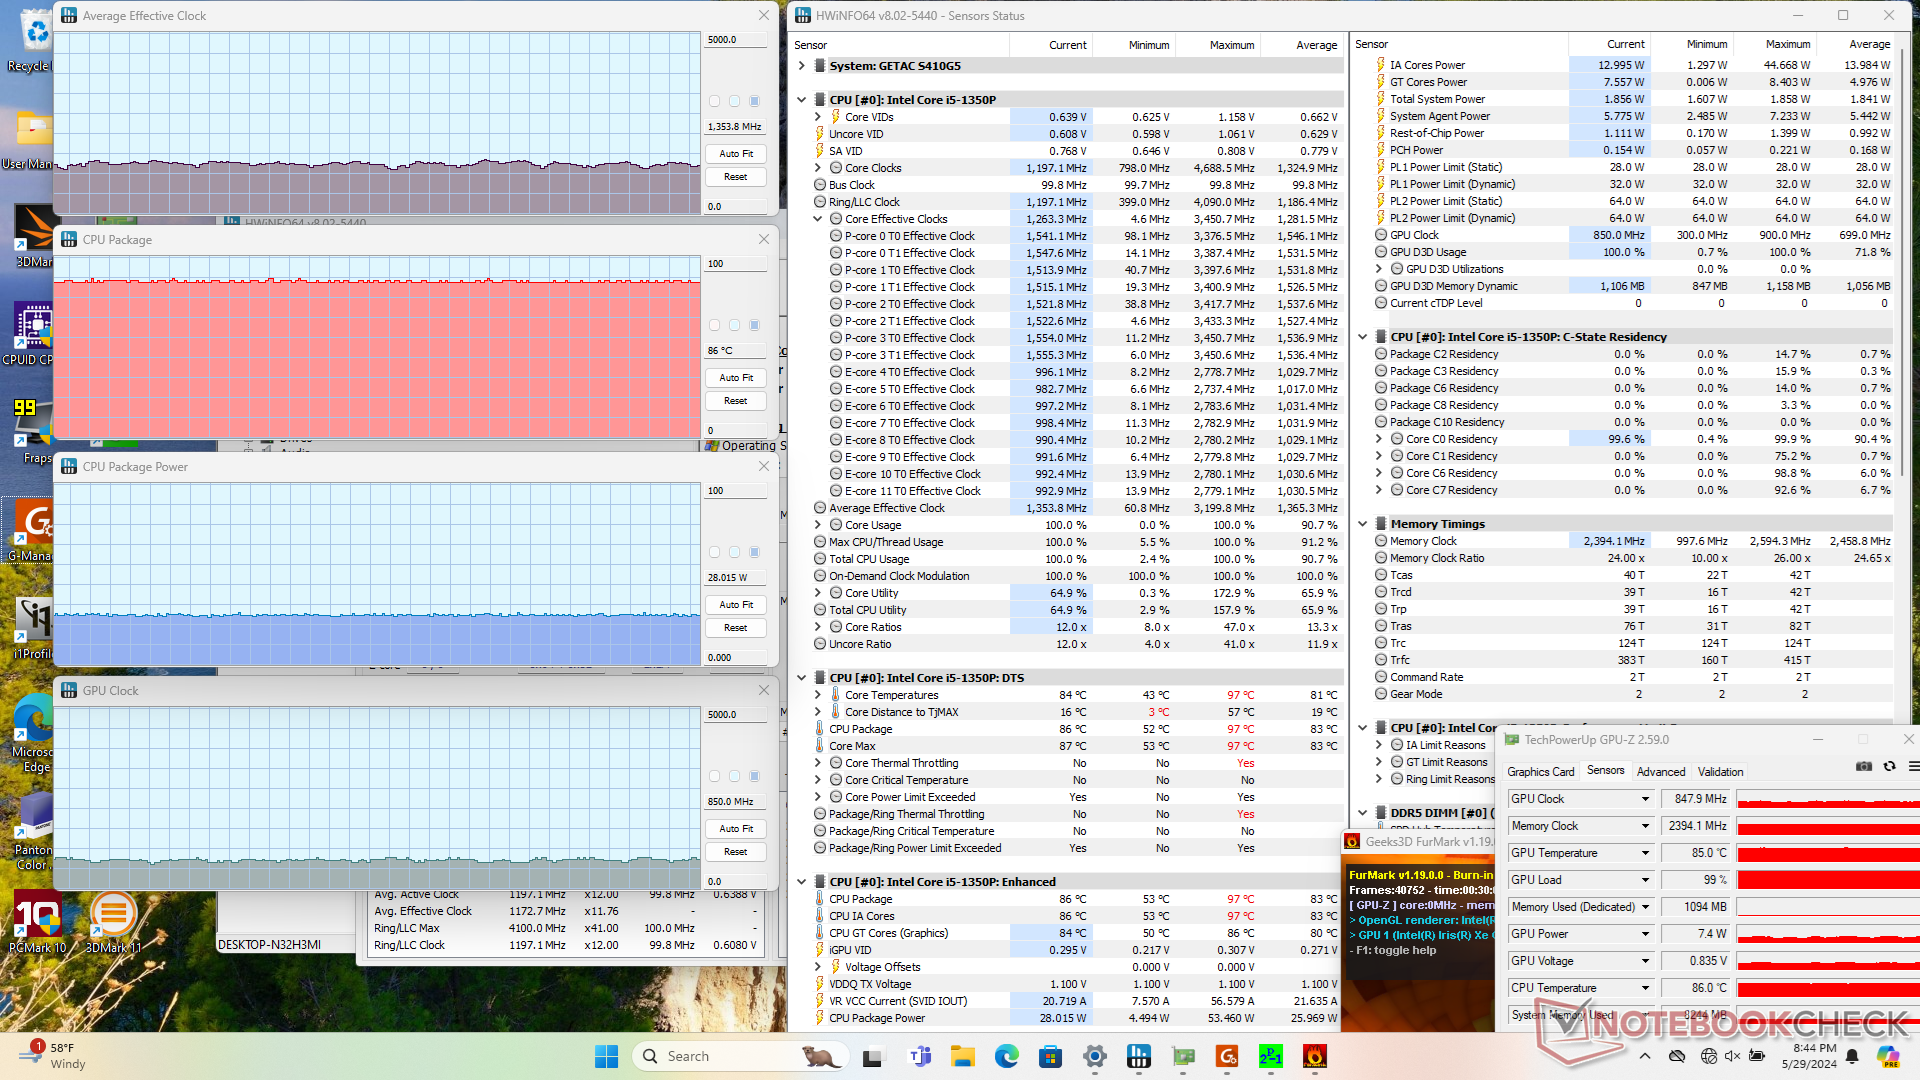
| Clock medio della CPU (GHz) | Clock della GPU (MHz) | Temperatura media della CPU (°C) | |
| Sistema inattivo | -- | -- | 56 |
| Prime95 Stress | 1,9 | -- | 88 |
| Prime95 + FurMark Stress | 1,2 - 1,5 | 850 | 86 |
| Witcher 3 Sollecitazione | 1,6 | 900 | 87 |
Altoparlanti
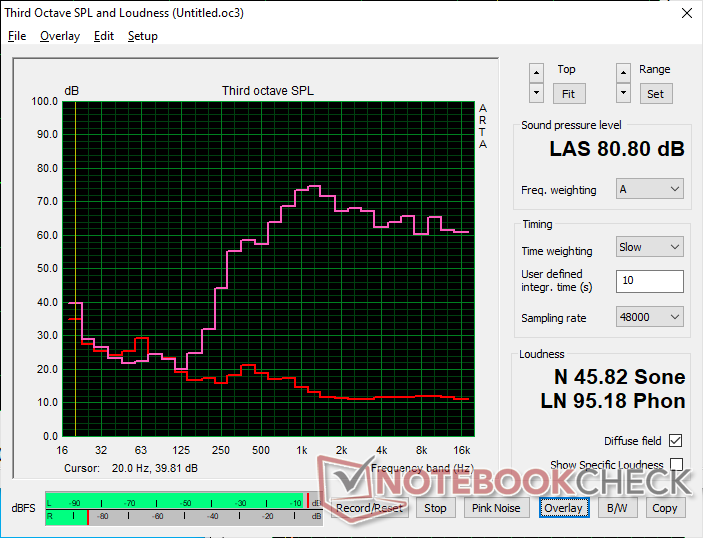
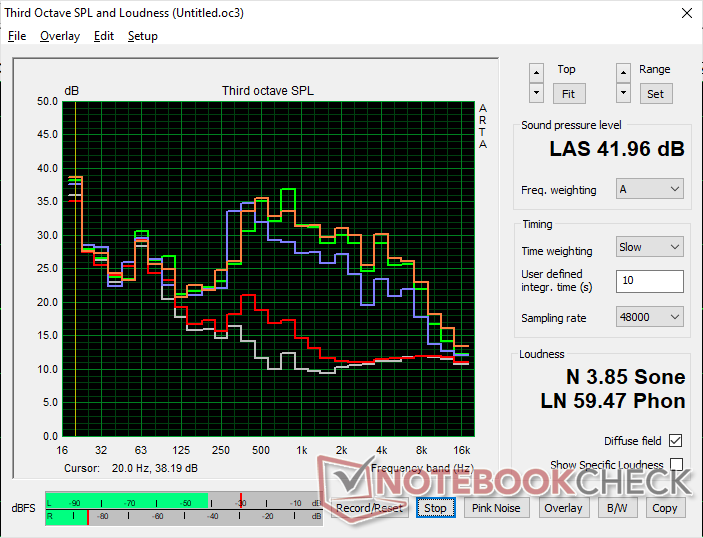
Getac S410 G5 analisi audio
(±) | potenza degli altiparlanti media ma buona (80.8 dB)
Bassi 100 - 315 Hz
(-) | quasi nessun basso - in media 29.2% inferiori alla media
(±) | la linearità dei bassi è media (13.4% delta rispetto alla precedente frequenza)
Medi 400 - 2000 Hz
(±) | medi elevati - circa 6.7% superiore alla media
(±) | linearità dei medi adeguata (7.5% delta rispetto alla precedente frequenza)
Alti 2 - 16 kHz
(+) | Alti bilanciati - appena 2.9% dalla media
(+) | alti lineari (6% delta rispetto alla precedente frequenza)
Nel complesso 100 - 16.000 Hz
(±) | la linearità complessiva del suono è media (23.3% di differenza rispetto alla media
Rispetto alla stessa classe
» 64% di tutti i dispositivi testati in questa classe è stato migliore, 8% simile, 28% peggiore
» Il migliore ha avuto un delta di 7%, medio di 21%, peggiore di 53%
Rispetto a tutti i dispositivi testati
» 68% di tutti i dispositivi testati in questa classe è stato migliore, 6% similare, 27% peggiore
» Il migliore ha avuto un delta di 4%, medio di 24%, peggiore di 134%
Apple MacBook Pro 16 2021 M1 Pro analisi audio
(+) | gli altoparlanti sono relativamente potenti (84.7 dB)
Bassi 100 - 315 Hz
(+) | bassi buoni - solo 3.8% dalla media
(+) | bassi in lineaa (5.2% delta rispetto alla precedente frequenza)
Medi 400 - 2000 Hz
(+) | medi bilanciati - solo only 1.3% rispetto alla media
(+) | medi lineari (2.1% delta rispetto alla precedente frequenza)
Alti 2 - 16 kHz
(+) | Alti bilanciati - appena 1.9% dalla media
(+) | alti lineari (2.7% delta rispetto alla precedente frequenza)
Nel complesso 100 - 16.000 Hz
(+) | suono nel complesso lineare (4.6% differenza dalla media)
Rispetto alla stessa classe
» 0% di tutti i dispositivi testati in questa classe è stato migliore, 0% simile, 100% peggiore
» Il migliore ha avuto un delta di 5%, medio di 18%, peggiore di 45%
Rispetto a tutti i dispositivi testati
» 0% di tutti i dispositivi testati in questa classe è stato migliore, 0% similare, 100% peggiore
» Il migliore ha avuto un delta di 4%, medio di 24%, peggiore di 134%
Gestione dell'energia
Consumo di energia
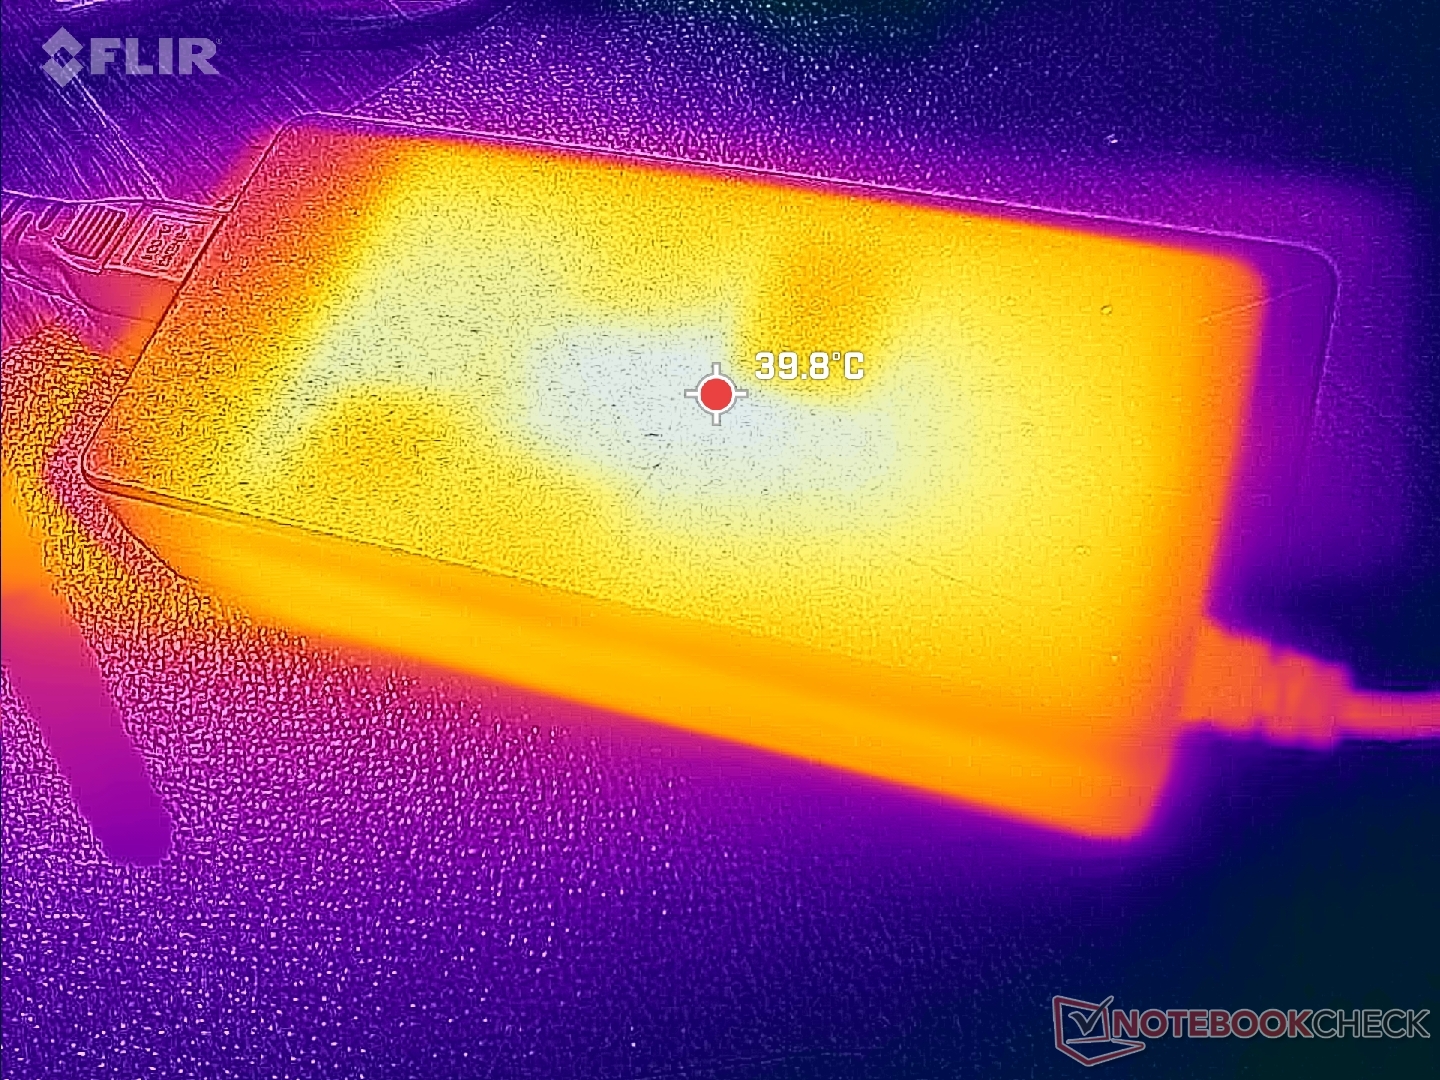
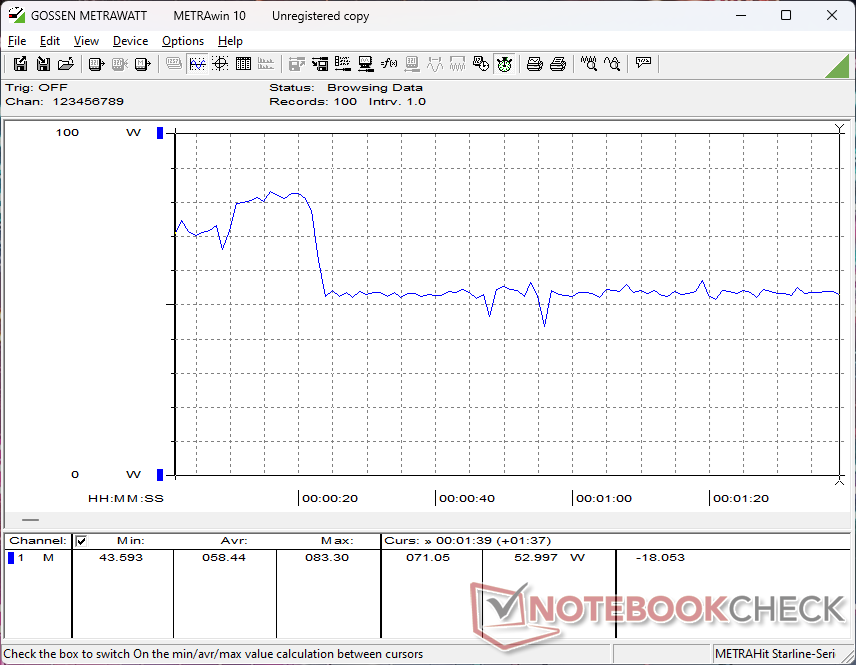
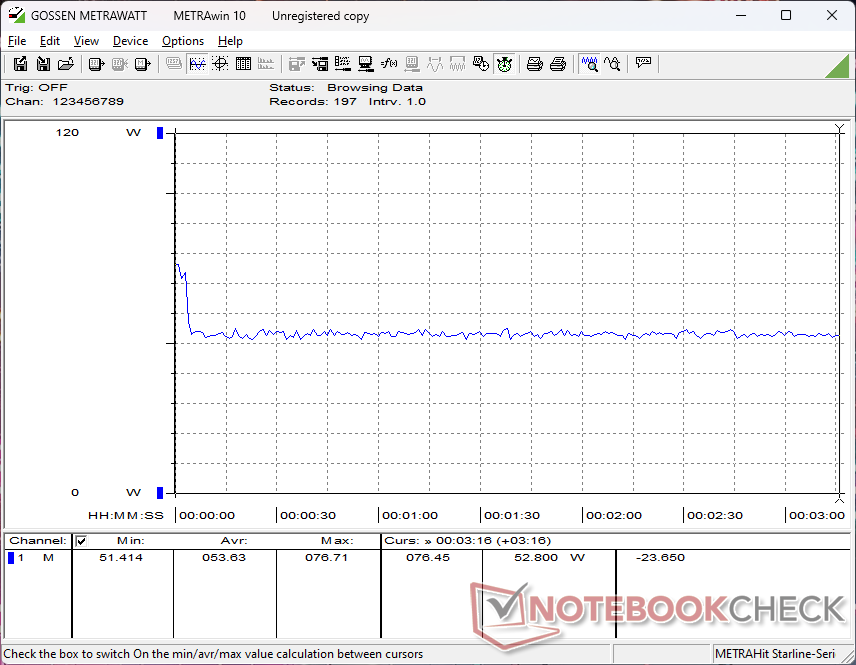
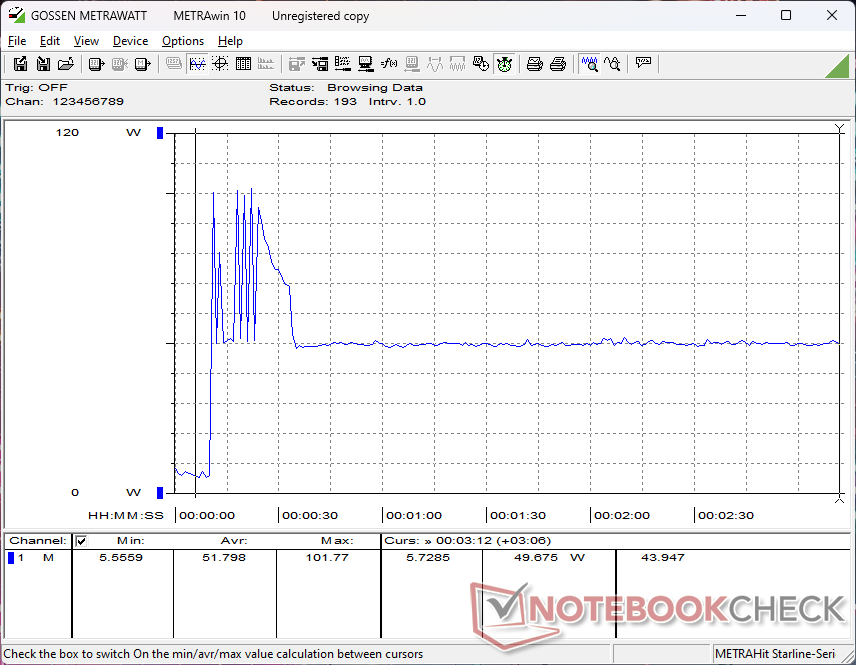
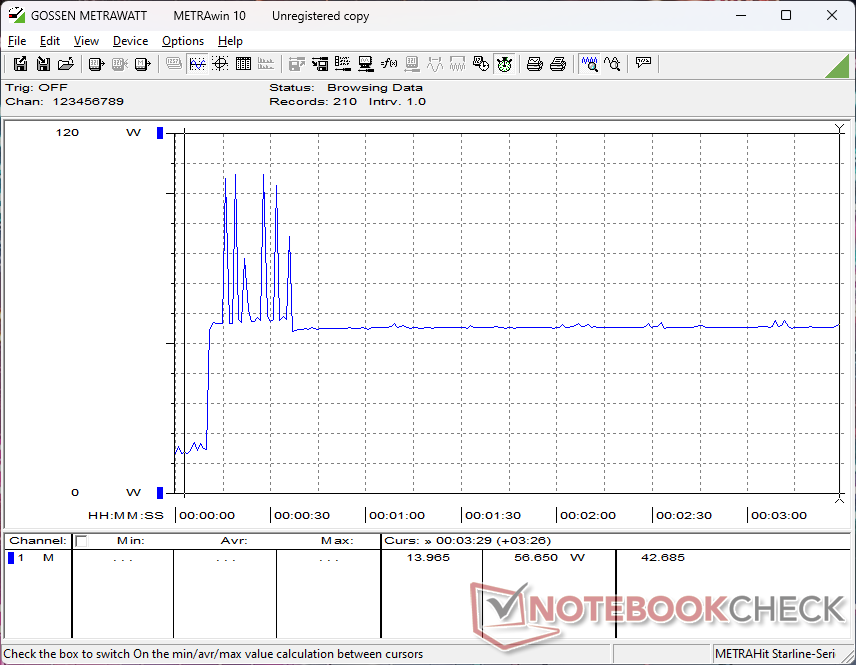
Il consumo energetico è paragonabile a quello dell'S410 G4, ma con una notevole eccezione legata alla CPU. Il nuovo Core i5-1350P è significativamente più veloce del Core i7-1185G7, come menzionato in precedenza, ma questo ha il prezzo di un consumo energetico più elevato, soprattutto quando Turbo Boost è attivo. Ad esempio, il consumo può raggiungere i 102 W durante i primi secondi di stress Prime95, quando Turbo Boost è attivo, rispetto ai soli 73 W dell'S410 G4. Tuttavia, le prestazioni per watt sono ancora superiori con la CPU più recente, sia prima che dopo il throttling.
Il modello viene fornito con lo stesso adattatore CA da 90 W di prima.
| Off / Standby | |
| Idle | |
| Sotto carico |
|
Leggenda:
min: | |
| Getac S410 G5 i5-1350P, Iris Xe G7 80EUs, SSSTC CL4-8D512, IPS, 1920x1080, 14" | Getac S410 Gen 4 i7-1185G7, Iris Xe G7 96EUs, SSSTC CA5-8D256, IPS, 1920x1080, 14" | Durabook S14I i7-1165G7, Iris Xe G7 96EUs, UDinfo M2P M2P80DE512GBAEP, TN, 1920x1080, 14" | Dell Latitude 14 5420-D2G5W i5-1135G7, Iris Xe G7 80EUs, WDC PC SN530 SDBPTPZ-256G, IPS, 1920x1080, 14" | Dell Latitude 7330 Rugged Extreme i7-1185G7, Iris Xe G7 96EUs, , IPS, 1920x1080, 13.3" | Panasonic Toughbook 40 i7-1185G7, Iris Xe G7 96EUs, Samsung PM991 MZVLQ1T0HALB, IPS, 1920x1080, 14" | |
|---|---|---|---|---|---|---|
| Power Consumption | 10% | 11% | 44% | 23% | 18% | |
| Idle Minimum * | 7.9 | 8.3 -5% | 6.8 14% | 3.4 57% | 4.1 48% | 4.9 38% |
| Idle Average * | 14.4 | 10.5 27% | 16.4 -14% | 7.1 51% | 11.7 19% | 12.3 15% |
| Idle Maximum * | 15.2 | 14.9 2% | 16.9 -11% | 8.4 45% | 11.8 22% | 14 8% |
| Load Average * | 58.4 | 48.6 17% | 39.2 33% | 35.3 40% | 48.5 17% | 54 8% |
| Witcher 3 ultra * | 53.7 | 50.9 5% | 35.4 34% | 44.3 18% | 46.3 14% | |
| Load Maximum * | 106.5 | 90.1 15% | 73.1 31% | 67 37% | 91 15% | 83.6 22% |
* ... Meglio usare valori piccoli
Power Consumption Witcher 3 / Stresstest
Power Consumption external Monitor
Durata della batteria
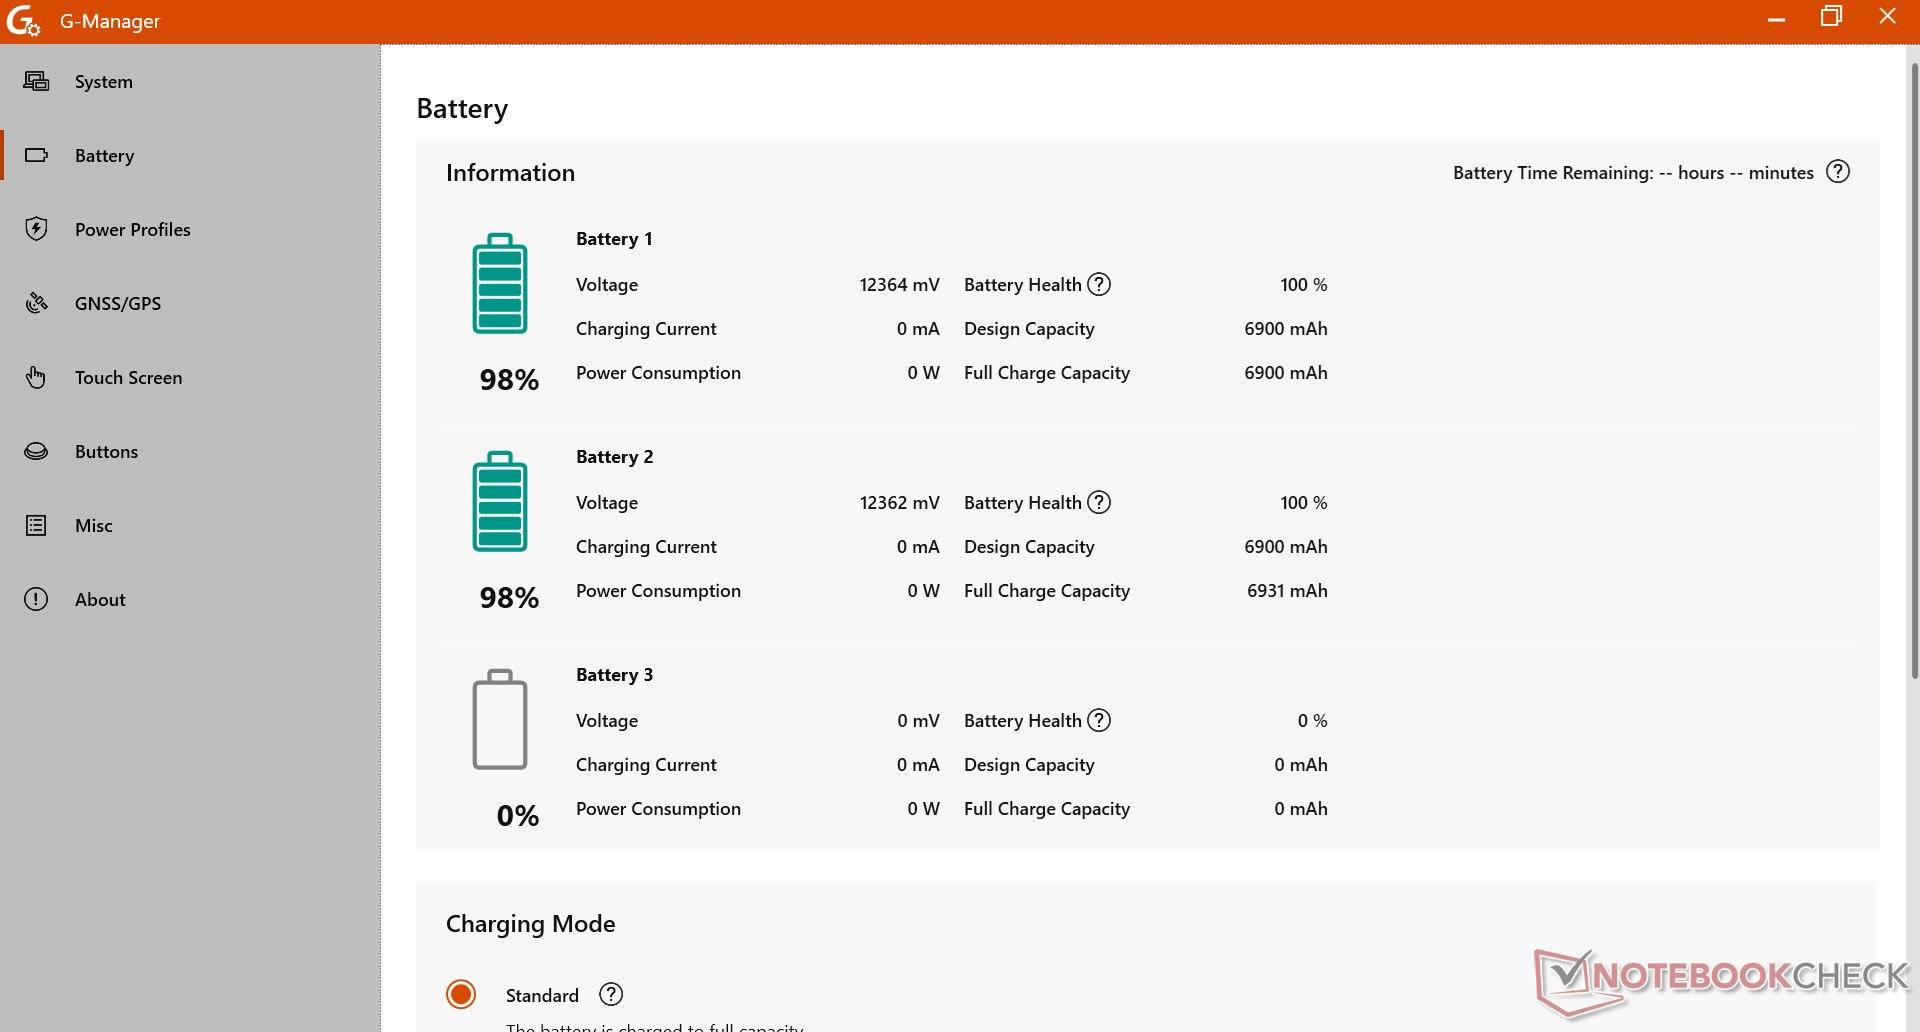
La nostra unità di prova S410 G5 non include una batteria interna, a differenza della nostra unità S410 G4, e quindi si affida a due batterie rimovibili da 75 Wh per una capacità totale di 150 Wh. L'autonomia WLAN è comunque molto più breve rispetto al modello dello scorso anno (17,5 ore contro 28,5 ore), anche dopo aver tenuto conto della minore capacità totale. La discrepanza nella durata della batteria può essere in gran parte attribuita alla CPU Raptor Lake-P, più esigente, come menzionato nella sezione Consumo energetico sopra.
| Getac S410 G5 i5-1350P, Iris Xe G7 80EUs, 150 Wh | Getac S410 Gen 4 i7-1185G7, Iris Xe G7 96EUs, 194 Wh | Durabook S14I i7-1165G7, Iris Xe G7 96EUs, 50 Wh | Dell Latitude 14 5420-D2G5W i5-1135G7, Iris Xe G7 80EUs, 63 Wh | Dell Latitude 7330 Rugged Extreme i7-1185G7, Iris Xe G7 96EUs, 107 Wh | Panasonic Toughbook 40 i7-1185G7, Iris Xe G7 96EUs, 136 Wh | |
|---|---|---|---|---|---|---|
| Autonomia della batteria | 63% | -69% | -27% | 2% | 8% | |
| WiFi v1.3 | 1052 | 1715 63% | 329 -69% | 769 -27% | 1077 2% | 1137 8% |
| Reader / Idle | 1371 | |||||
| Load | 146 |
Pro
Contro
Il verdetto
L'S410 G5 mantiene la compatibilità con i modelli della generazione precedente, il che è importante per le applicazioni industriali e governative. La riduzione dell'effetto ghosting del display e l'aumento delle prestazioni della CPU sono sicuramente i punti di forza dell'ultimo modello e i motivi principali per acquistare l'S410 G5 rispetto al vecchio S410 G4. La durata della batteria subisce una battuta d'arresto a causa della CPU più veloce, ma è comunque molto lunga, soprattutto perché il sistema può supportare più batterie. Nel frattempo, la webcam a risoluzione più elevata e il supporto adeguato del Wi-Fi 6E sono degli extra piacevoli.
Il rugged Getac S410 G5 è più veloce di prima, con margini significativi, grazie alla nuova CPU di 13a generazione. Tuttavia, alcune funzioni interne ed esterne necessitano di aggiornamenti per migliorare l'esperienza dell'utente.
Ci piacerebbe che alcuni aspetti fastidiosi del design venissero affrontati nelle versioni future. Una ventola più grande, ad esempio, aiuterebbe a ridurre il rumore della ventola. Gli altoparlanti potrebbero essere più forti e i coperchi delle porte potrebbero essere più facili da aprire. Anche i tasti della tastiera non sono molto affidabili, in quanto è possibile colpire un tasto senza registrare l'input. Questi inconvenienti sono persistenti nella serie S410 e diventano sempre più difficili da ignorare dopo ogni anno.
Prezzo e disponibilità
I preventivi sono disponibili su richiesta, dal sito ufficiale di Getac.
Getac S410 G5
- 06/05/2024 v7 (old)
Allen Ngo
Transparency
La selezione dei dispositivi da recensire viene effettuata dalla nostra redazione. Il campione di prova è stato fornito all'autore come prestito dal produttore o dal rivenditore ai fini di questa recensione. L'istituto di credito non ha avuto alcuna influenza su questa recensione, né il produttore ne ha ricevuto una copia prima della pubblicazione. Non vi era alcun obbligo di pubblicare questa recensione. Non accettiamo mai compensi o pagamenti in cambio delle nostre recensioni. In quanto società mediatica indipendente, Notebookcheck non è soggetta all'autorità di produttori, rivenditori o editori.
Ecco come Notebookcheck esegue i test
Ogni anno, Notebookcheck esamina in modo indipendente centinaia di laptop e smartphone utilizzando procedure standardizzate per garantire che tutti i risultati siano comparabili. Da circa 20 anni sviluppiamo continuamente i nostri metodi di prova e nel frattempo stabiliamo gli standard di settore. Nei nostri laboratori di prova, tecnici ed editori esperti utilizzano apparecchiature di misurazione di alta qualità. Questi test comportano un processo di validazione in più fasi. Il nostro complesso sistema di valutazione si basa su centinaia di misurazioni e parametri di riferimento ben fondati, che mantengono l'obiettività.Price comparison

