 Deutsch
 English
 Español
 Français
 Italiano
 Nederlands
 Polski
 Português
 Русский
 Türkçe
 Svenska
 Chinese
 Magyar
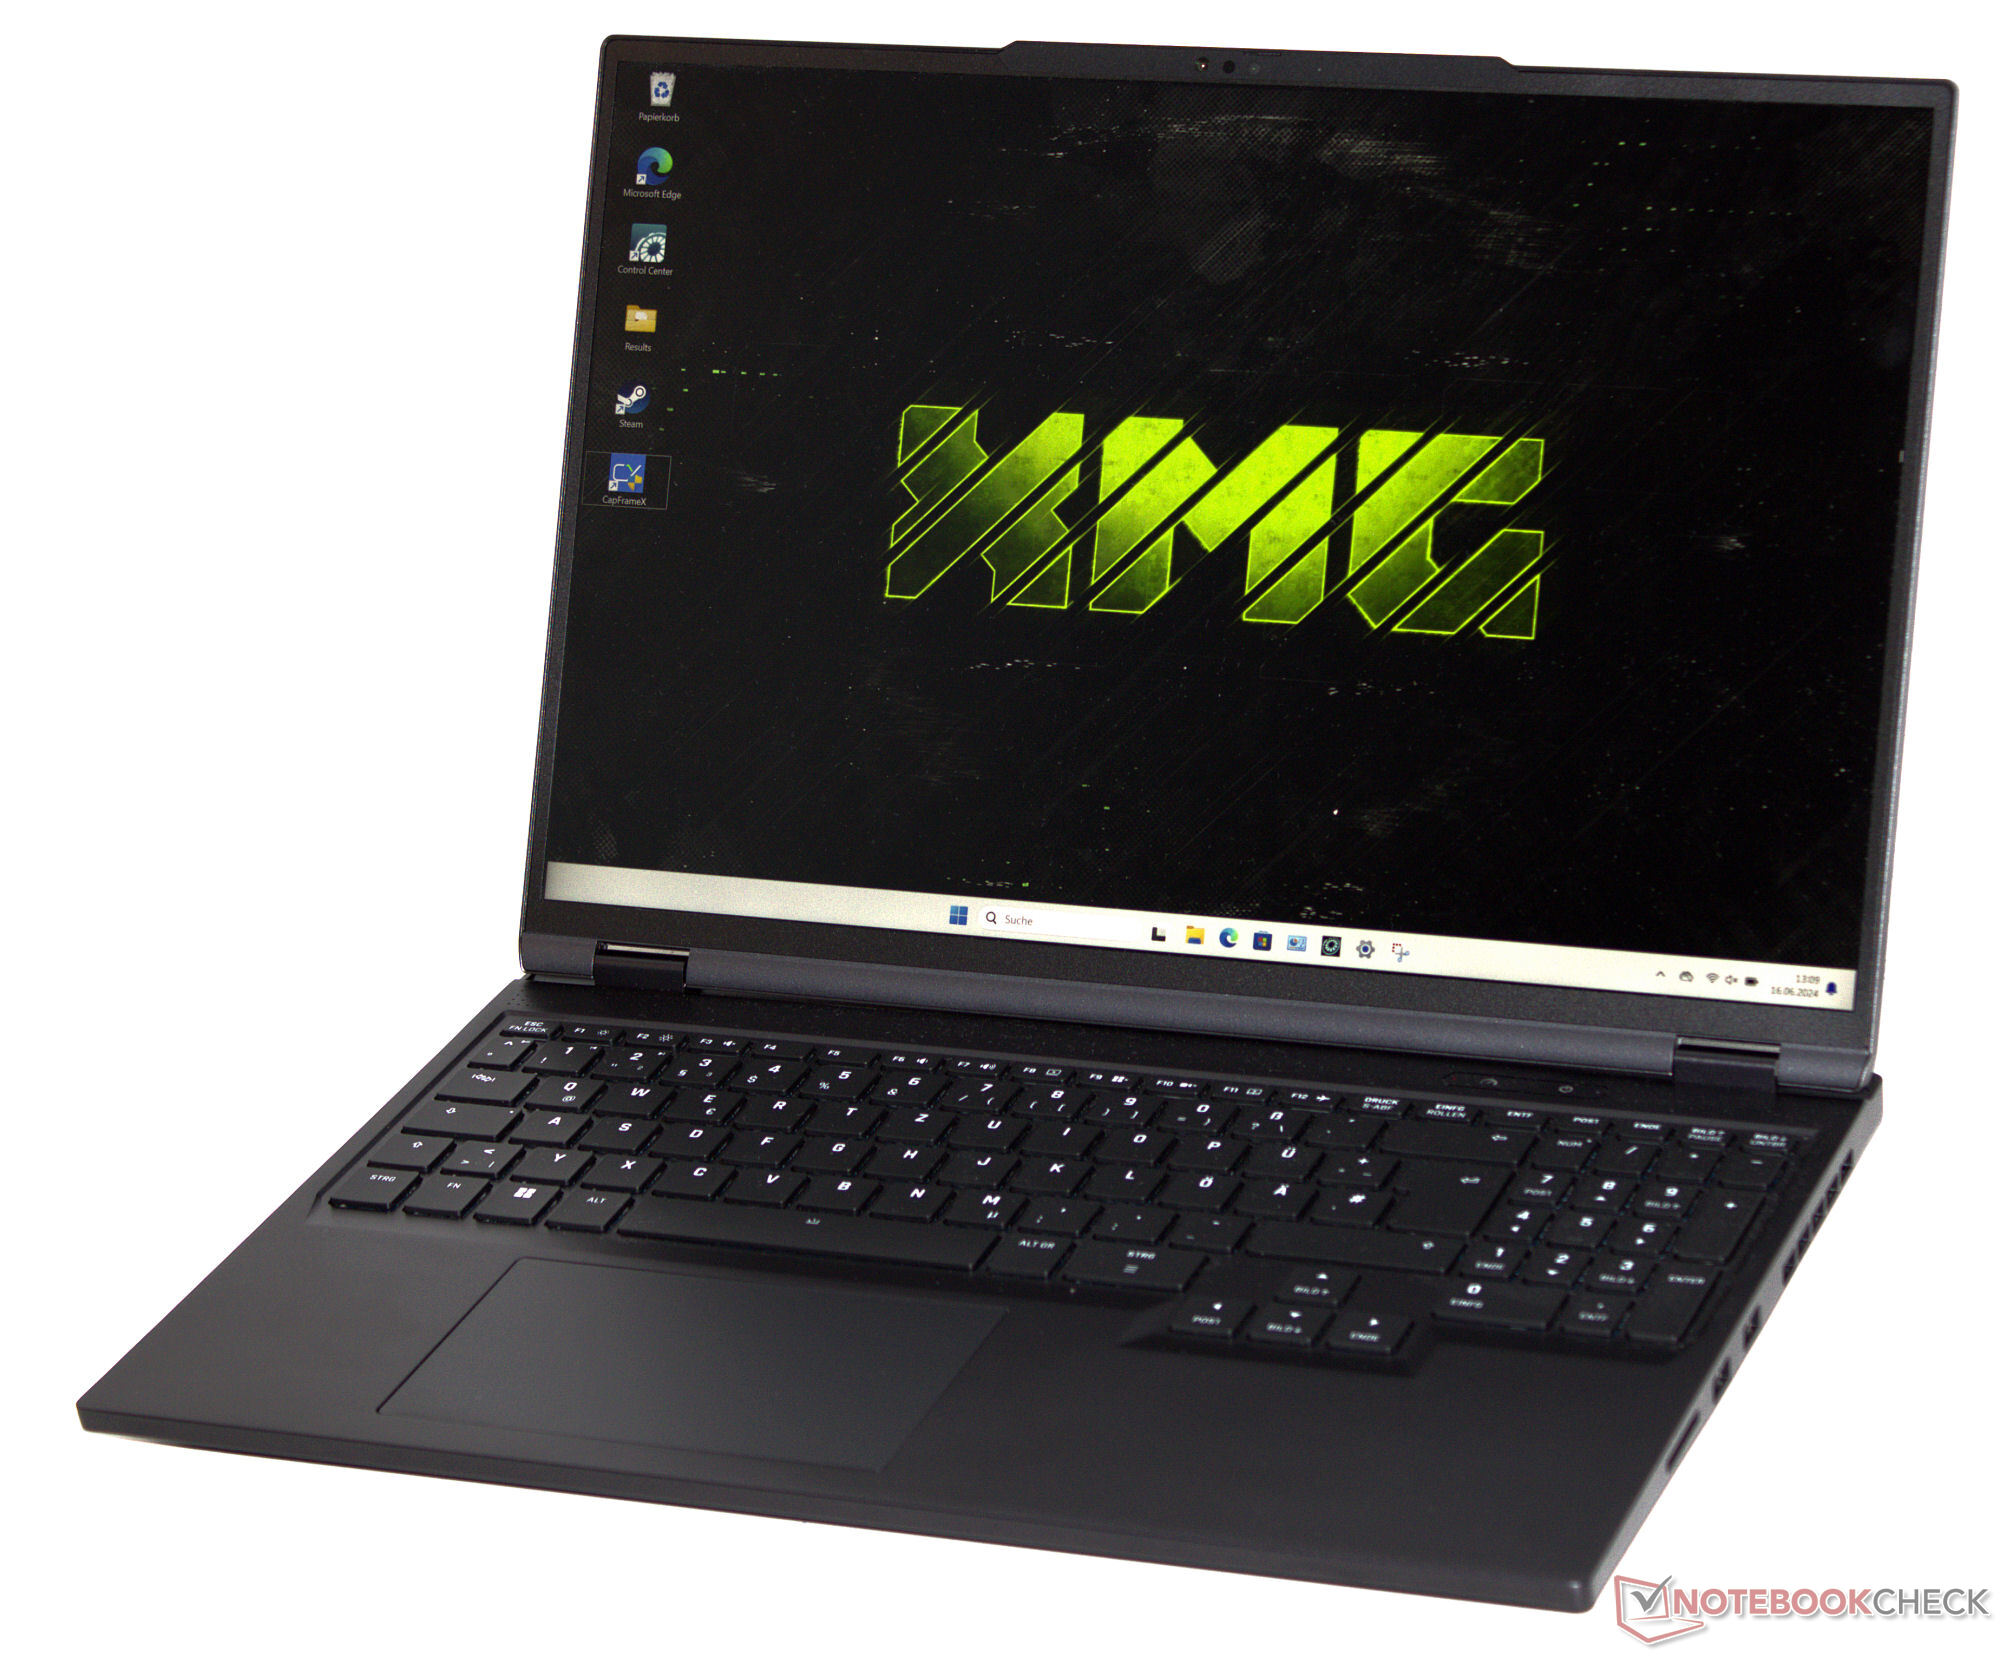
Recensione dell'XMG Neo 16 (Early 24): Tutta la potenza della RTX 4090 in un portatile gaming compatto

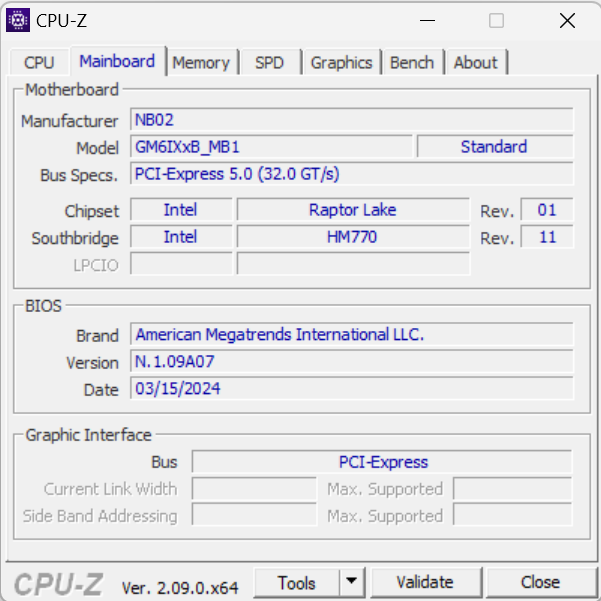
Con Neo 16, Schenker si rivolge al segmento di fascia alta e, di conseguenza, non ci sono mezze misure: Core i9, GeForce RTX 4090 e 32 GB di RAM equipaggiano il portatile per scenari applicativi impegnativi (streaming, rendering, gaming). Ma tutto questo ha un costo: Dovrà sborsare circa 4.000 dollari (tasso di cambio attuale dollaro/euro) per il modello in esame, anche se si possono avere varianti più economiche a partire da 2.000 dollari. La base è fornita dal barebone Tongfang (GM6IX9B). I concorrenti si presentano sotto forma, ad esempio, del Razer Blade 16il Medion Erazer Beast X40 e il Asus ROG Strix Scar 17.
Il dispositivo è simile al modello 2023, ma presenta alcune novità: Un display più luminoso, un sistema di raffreddamento rinnovato e un angolo di apertura più ampio. La tastiera meccanica (opzionale) presente nel predecessore non fa parte dell'offerta del modello 2024.
Potenziali concorrenti a confrontos
Punteggio | Version | Data | Modello | Peso | Altezza | Dimensione | Risoluzione | Miglior Prezzo |
|---|---|---|---|---|---|---|---|---|
| 85.5 % | v8 (new) | 06/2024 | SCHENKER XMG Neo 16 (Early 24) i9-14900HX, NVIDIA GeForce RTX 4090 Laptop GPU | 2.5 kg | 26.6 mm | 16.00" | 2560x1600 | |
| 91.1 % | v7 (old) | 02/2024 | Razer Blade 16 2024, RTX 4090 i9-14900HX, NVIDIA GeForce RTX 4090 Laptop GPU | 2.5 kg | 22 mm | 16.00" | 2560x1600 | |
| 89.2 % | v7 (old) | 02/2024 | Medion Erazer Beast X40 2024 i9-14900HX, NVIDIA GeForce RTX 4090 Laptop GPU | 2.9 kg | 36 mm | 17.00" | 2560x1600 | |
| 87.2 % | v7 (old) | 08/2023 | Asus ROG Strix Scar 17 G733PYV-LL053X R9 7945HX3D, NVIDIA GeForce RTX 4090 Laptop GPU | 2.9 kg | 28.3 mm | 17.30" | 2560x1440 |
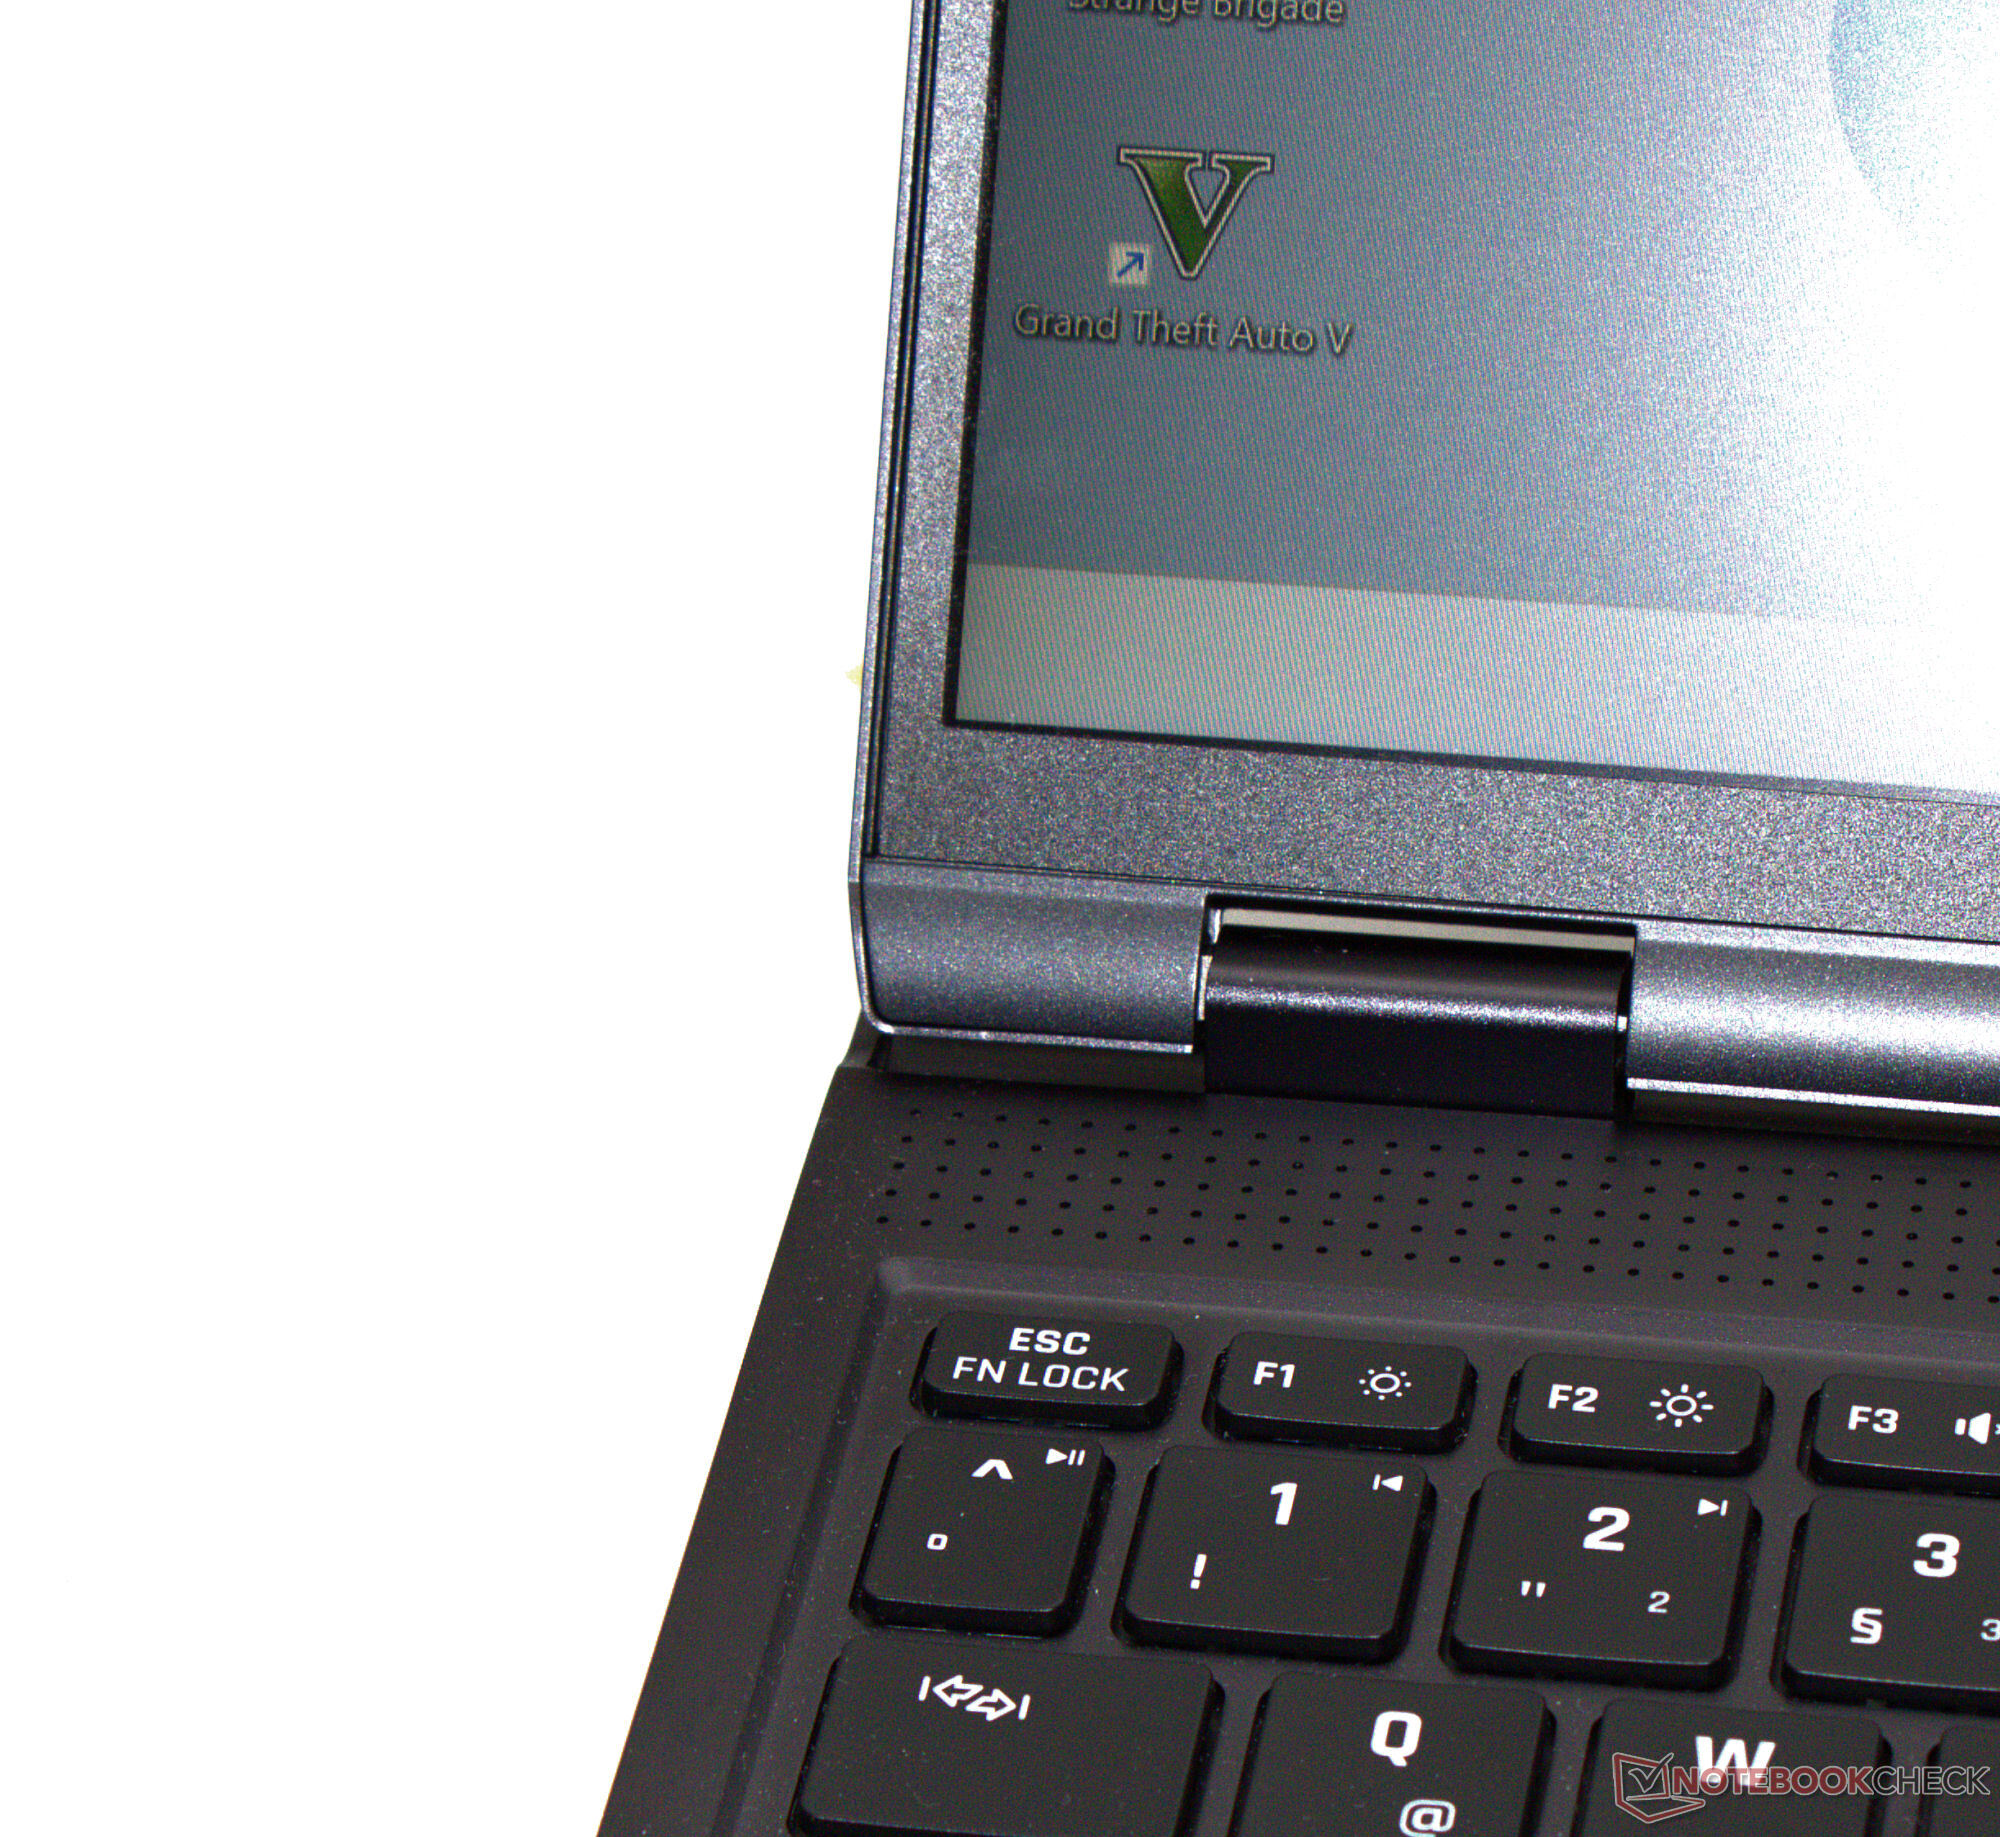
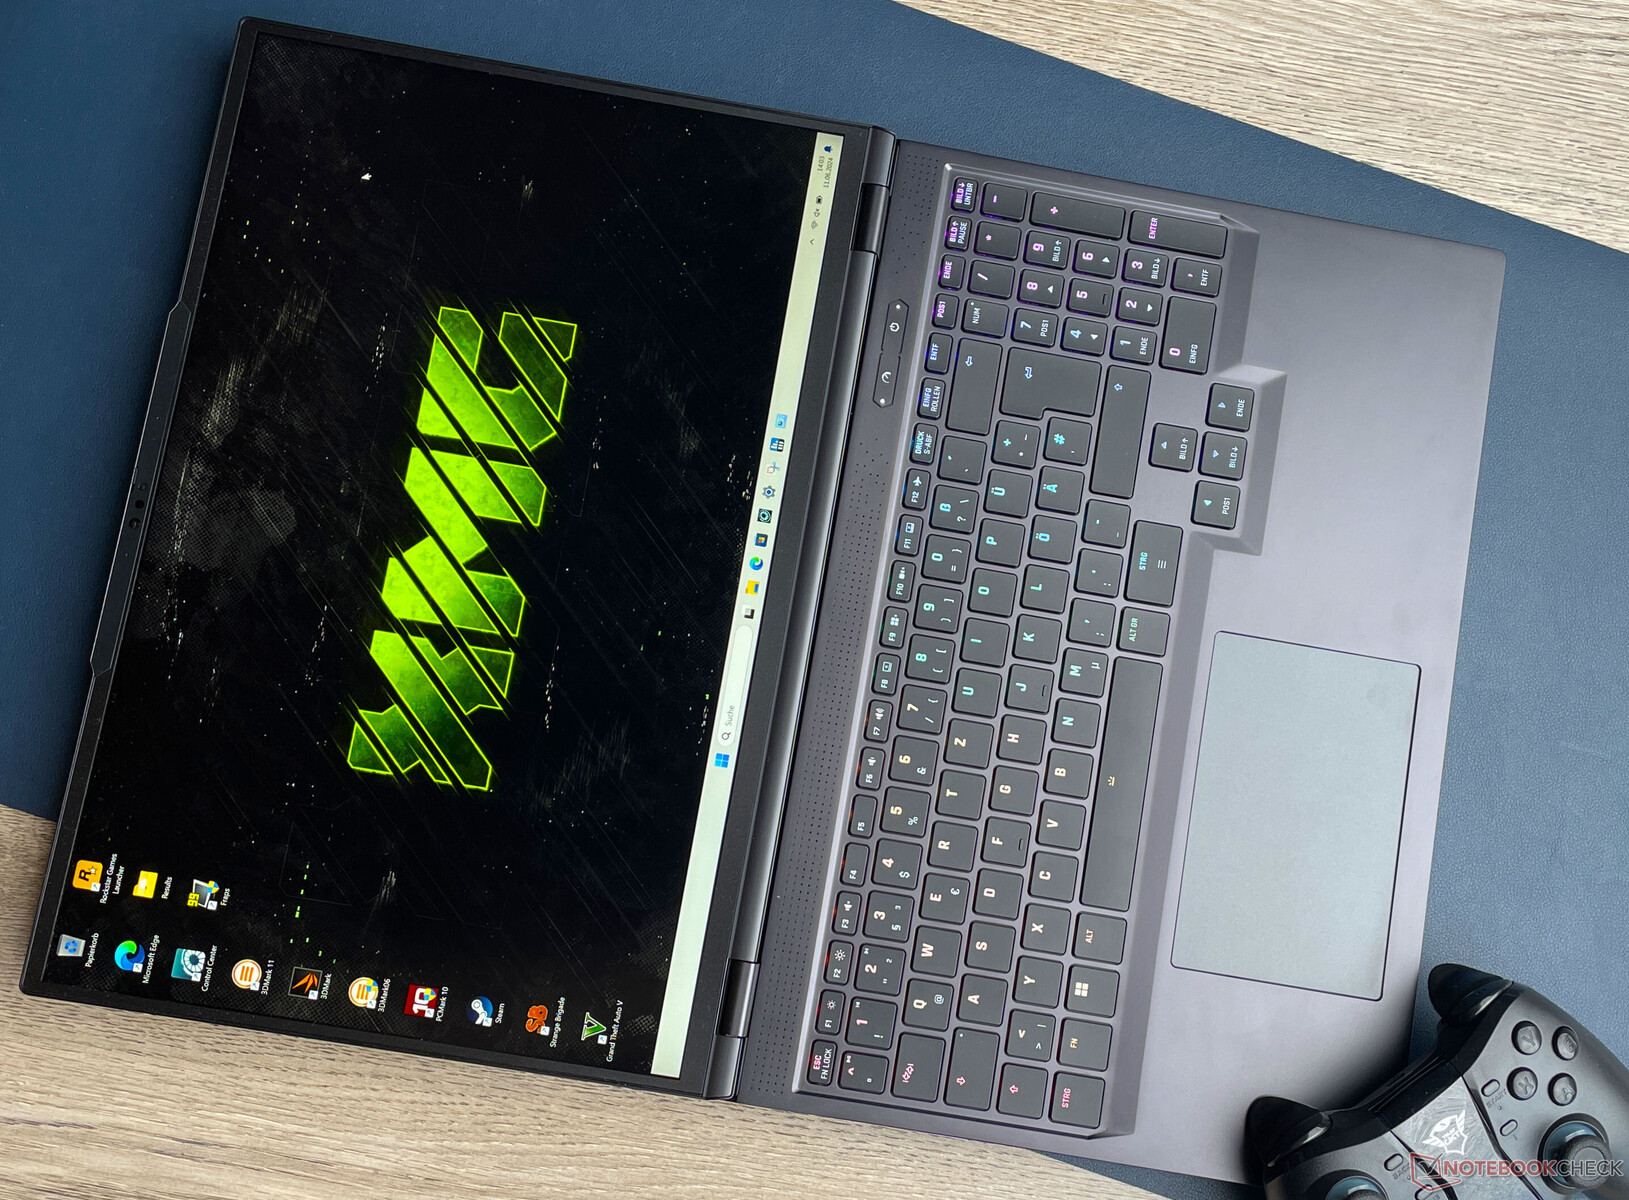
Case - Il laptop XMG ha uno chassis in alluminio
Lo chassis del modello 2023 non è utilizzato nell'attuale modello Neo. La nuova cover ha più in comune con il case visto negli ultimi laptop XMG - un passo nella giusta direzione: Invece di un mix di plastica e metallo, il produttore ha optato per un case interamente in metallo (eccezione: le cornici del display sono in plastica). Il telaio è stabile come ci si aspetta. L'unità base e il coperchio possono essere ruotati solo leggermente. Il coperchio consente un angolo di apertura fino a 180 gradi (modello 2023: 135 gradi). Questo facilita la visione dei contenuti quando sono presenti più persone. Le cerniere strette mantengono il coperchio saldamente in posizione e in quasi tutte le angolazioni. È possibile aprire il dispositivo con una sola mano.
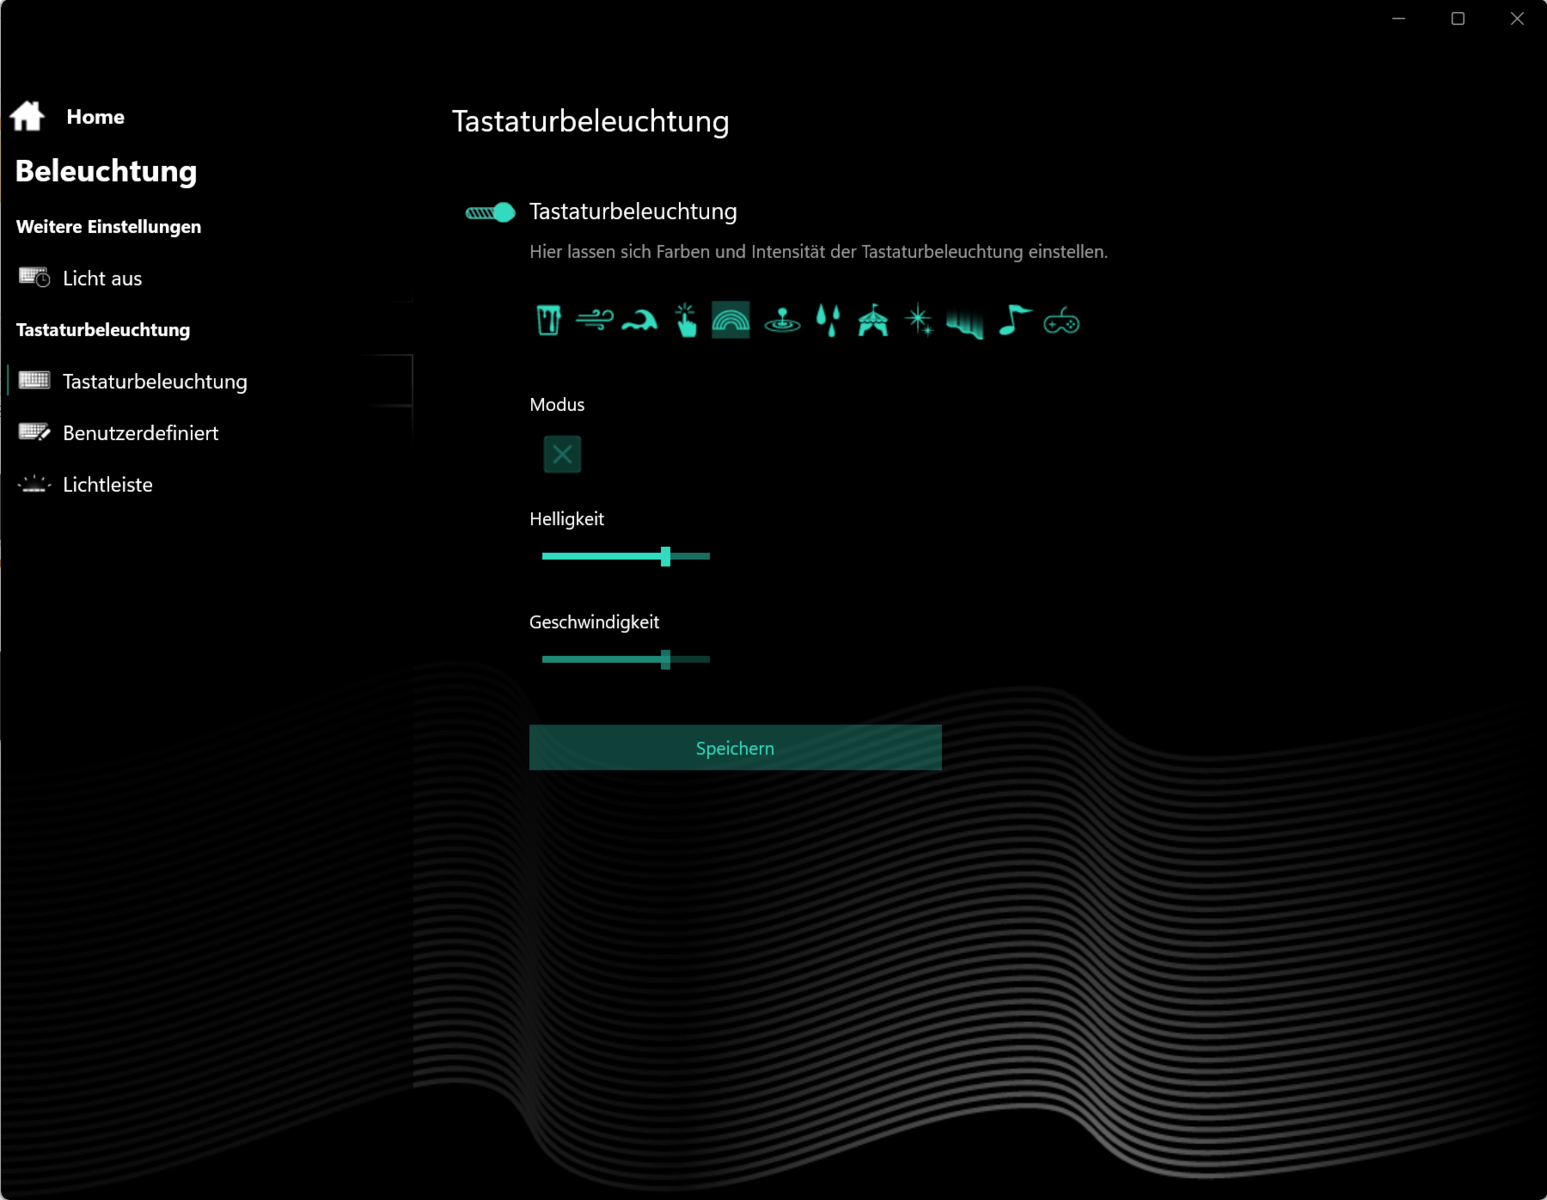
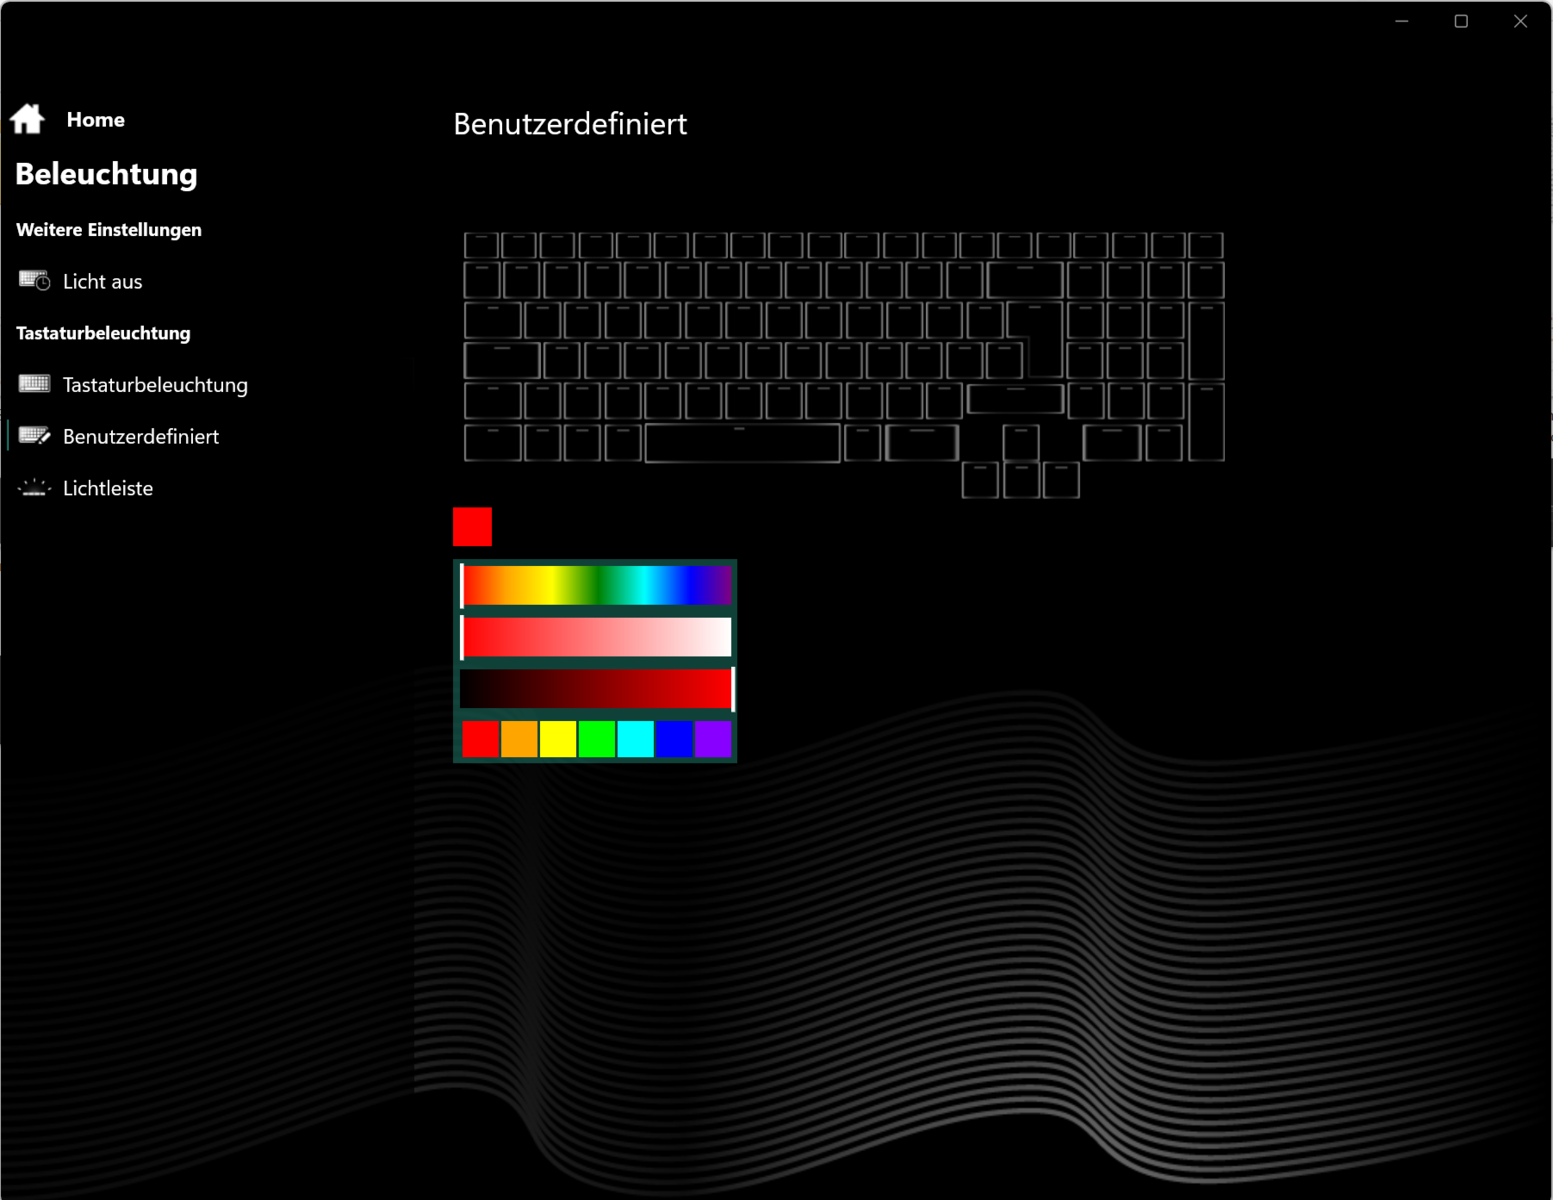
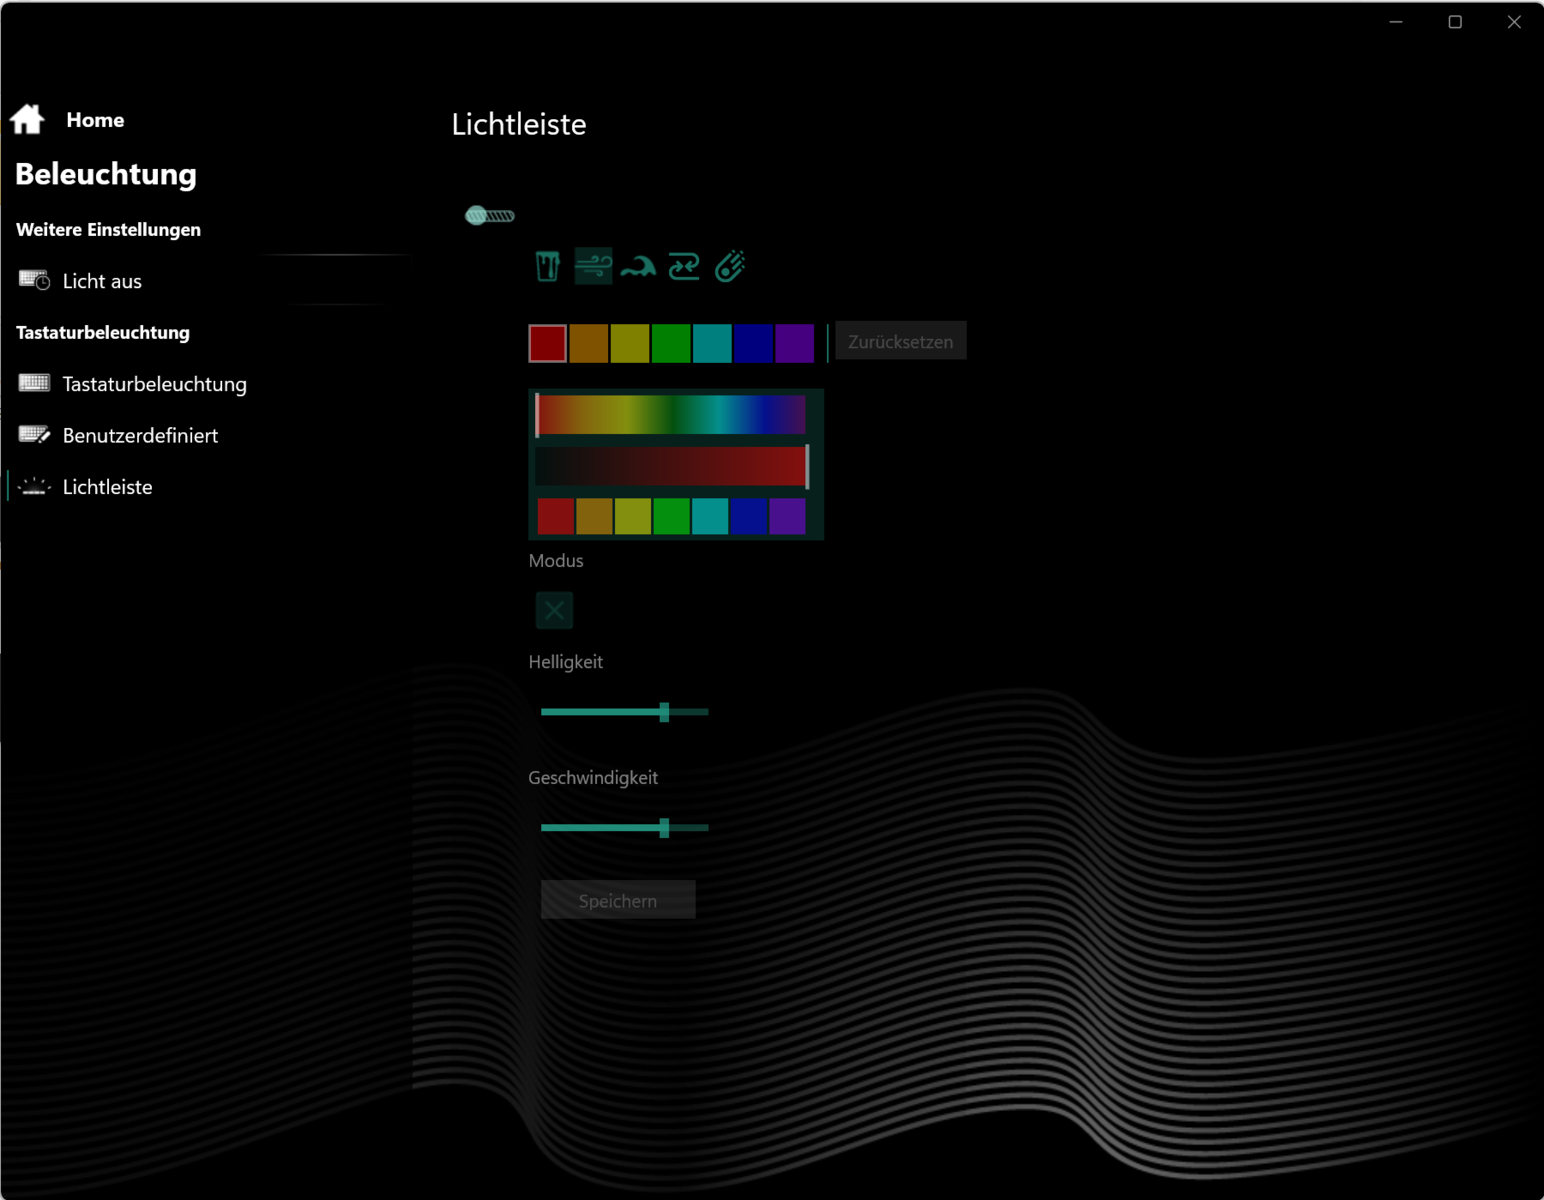
Gli elementi di design accattivanti sono assenti, il che significa che il computer nero opaco ha un aspetto piuttosto serio. L'illuminazione colorata è fornita, oltre che dai tasti retroilluminati (RGB), da una striscia LED definita dall'utente e personalizzabile.
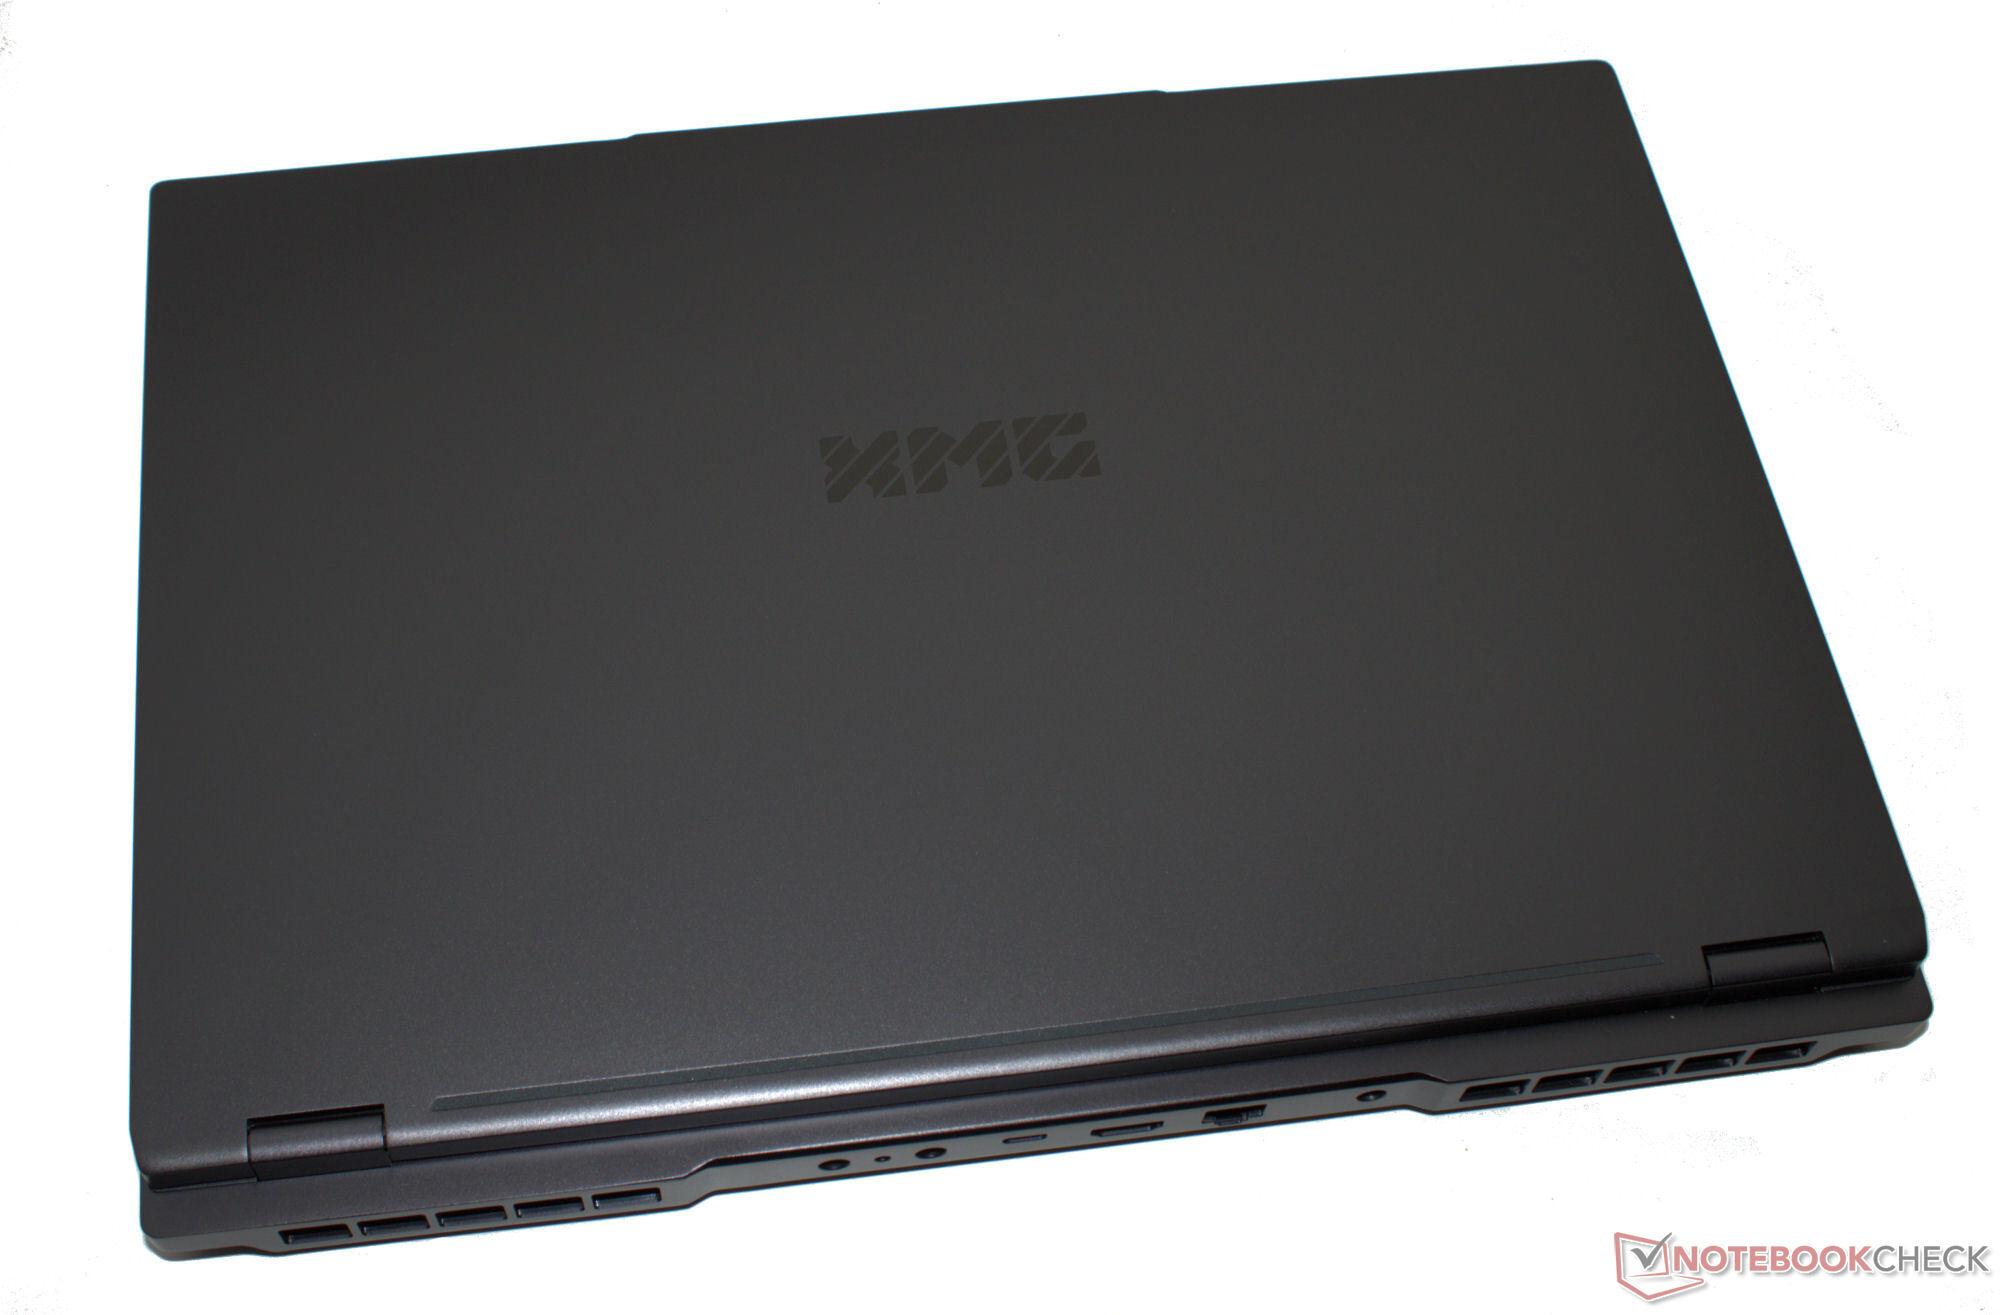
L'ultimo Neo 16 appare un po' più compatto rispetto al predecessore, ma, per quanto riguarda il peso, i portatili non si distinguono. Solo il Blade 16 offre una maggiore compattezza - e con un peso quasi identico.
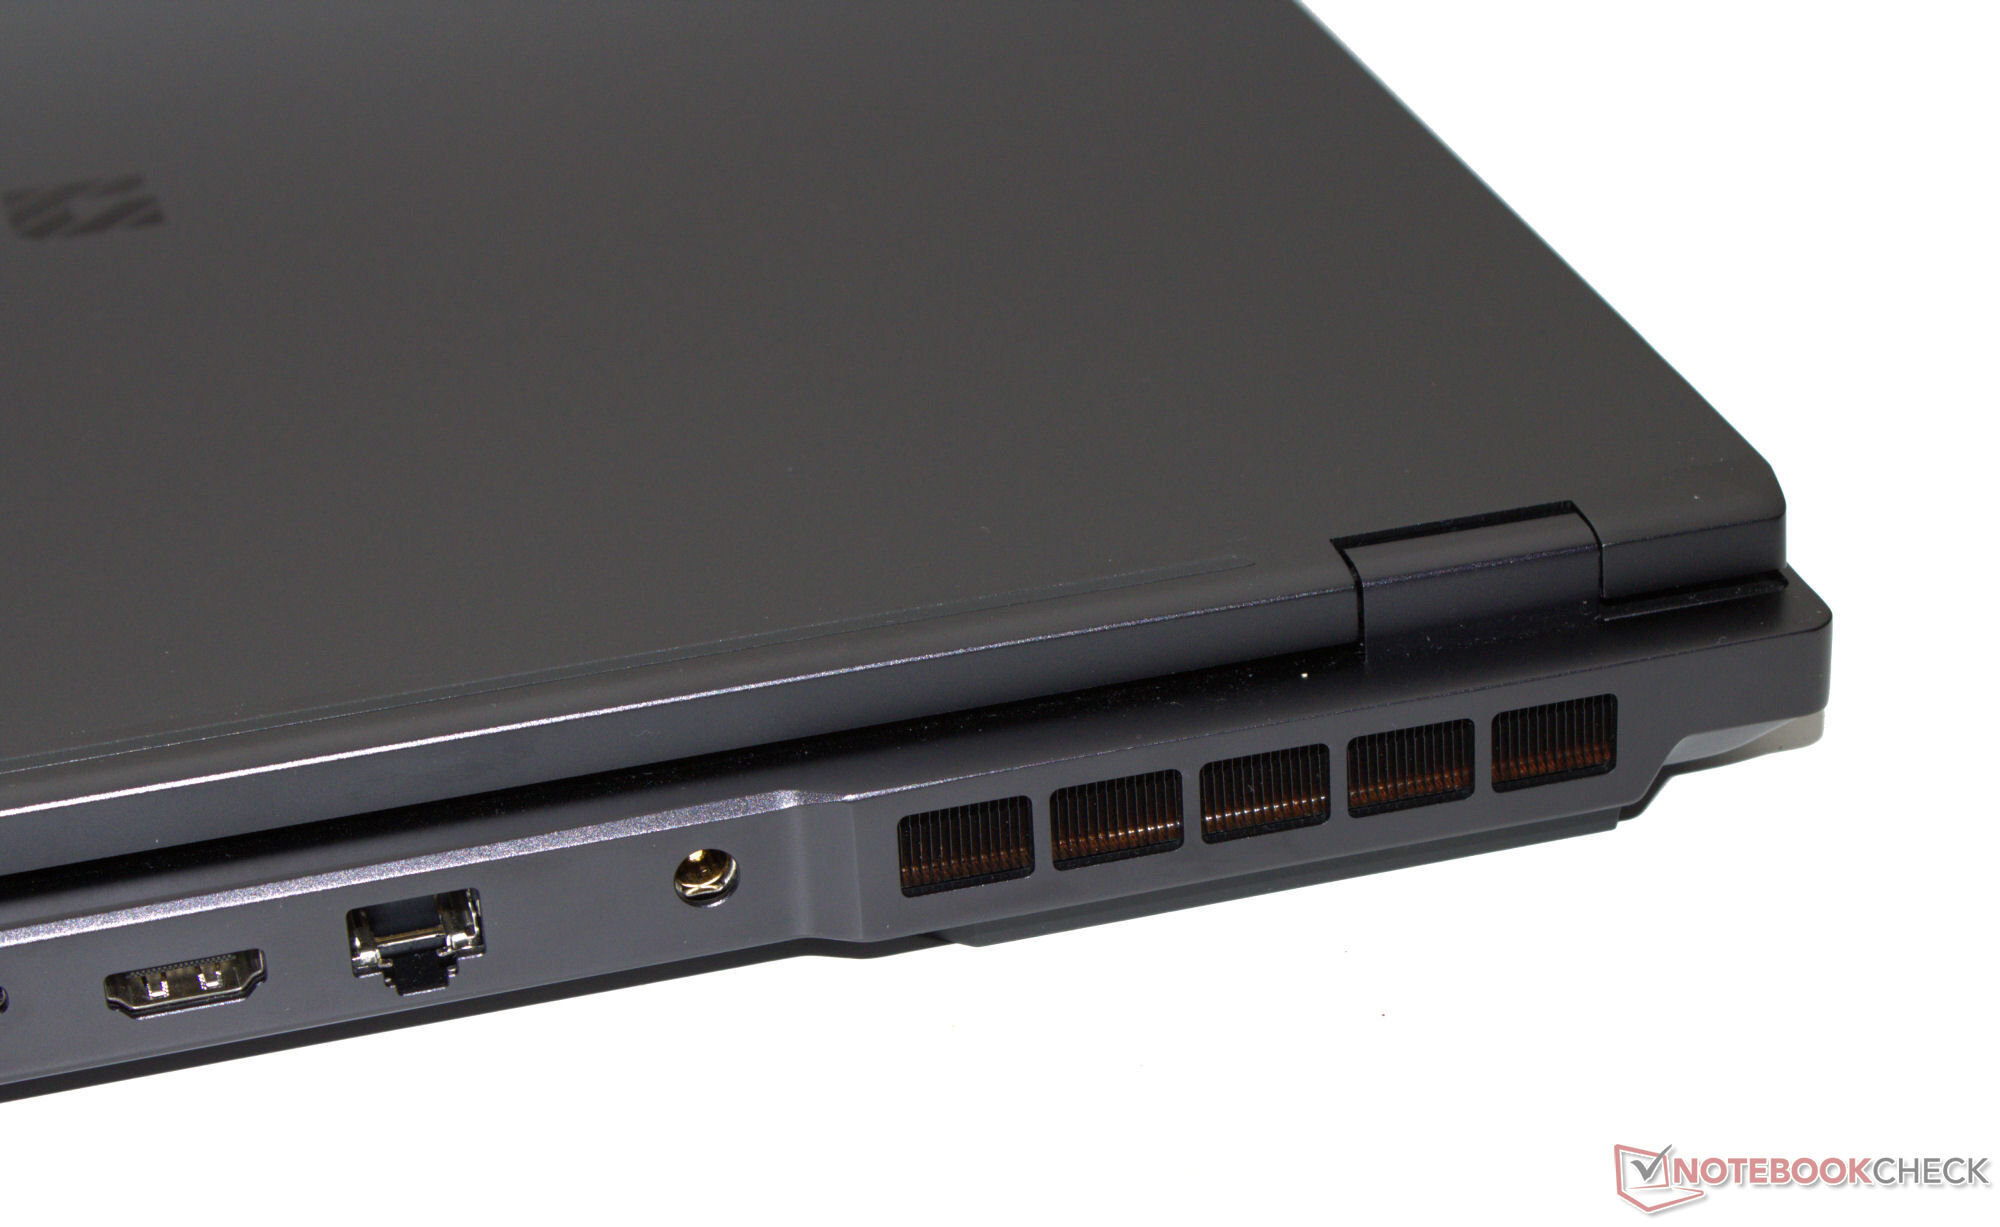
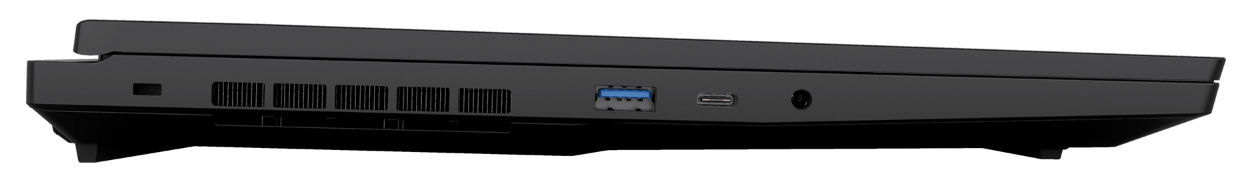
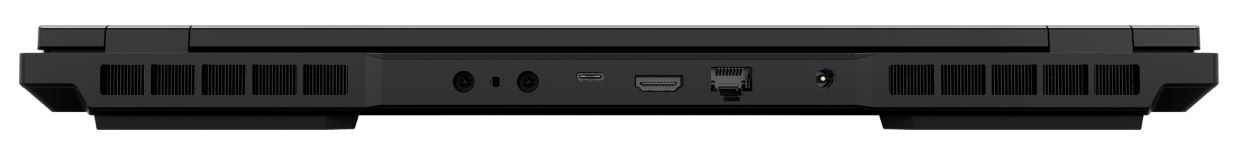
Caratteristiche - L'USB 4 è a bordo
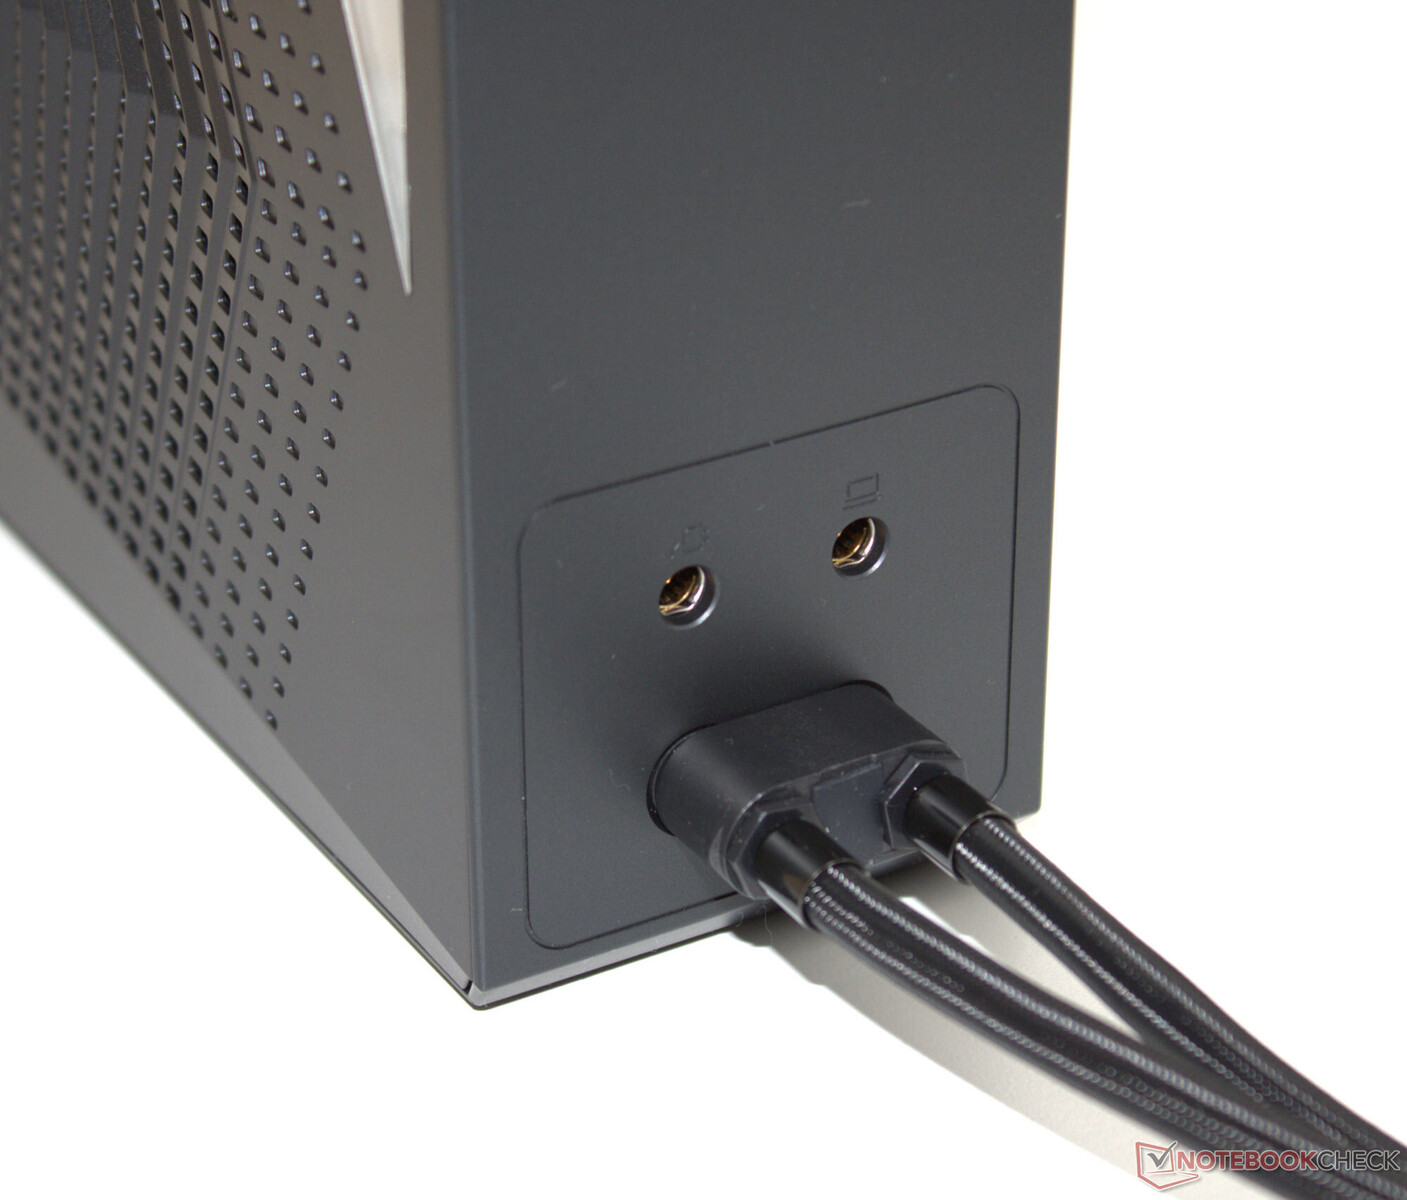
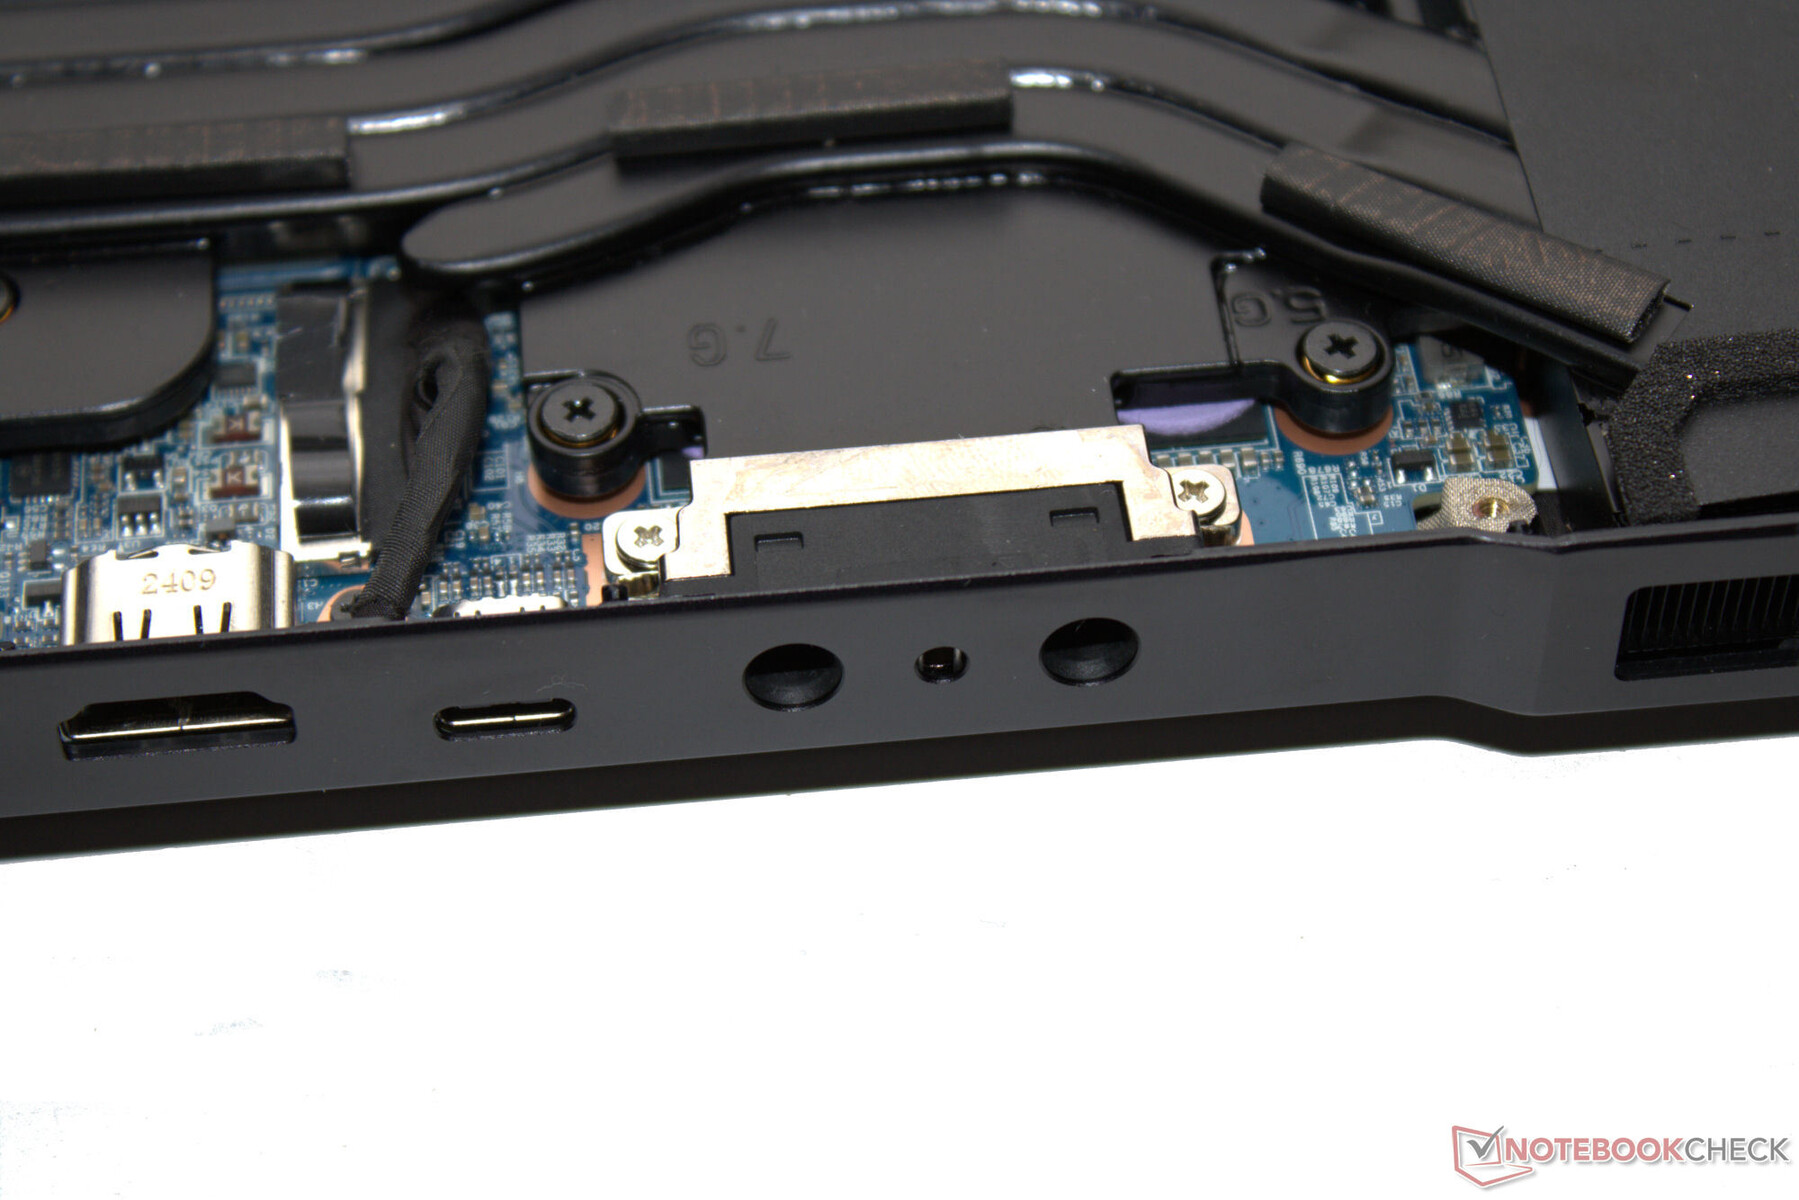
Quattro delle cinque porte USB di Neo 16 (3x USB-A, 2x USB-C) funzionano secondo lo standard USB 3.2 Gen 1. Solo la porta USB-C sul retro porta in tavola la Thunderbolt 4 (USB 4), compreso il supporto della modalità Power Delivery (modalità Display Alt). Solo la porta USB-C sul retro offre Thunderbolt 4 (USB 4), compreso il supporto per Power Delivery e la modalità Display Alt. Sono disponibili un totale di due uscite video (1x HDMI, 1x DP). Un jack audio e una porta Gigabit Ethernet (2,5 GBit/s) completano l'offerta.
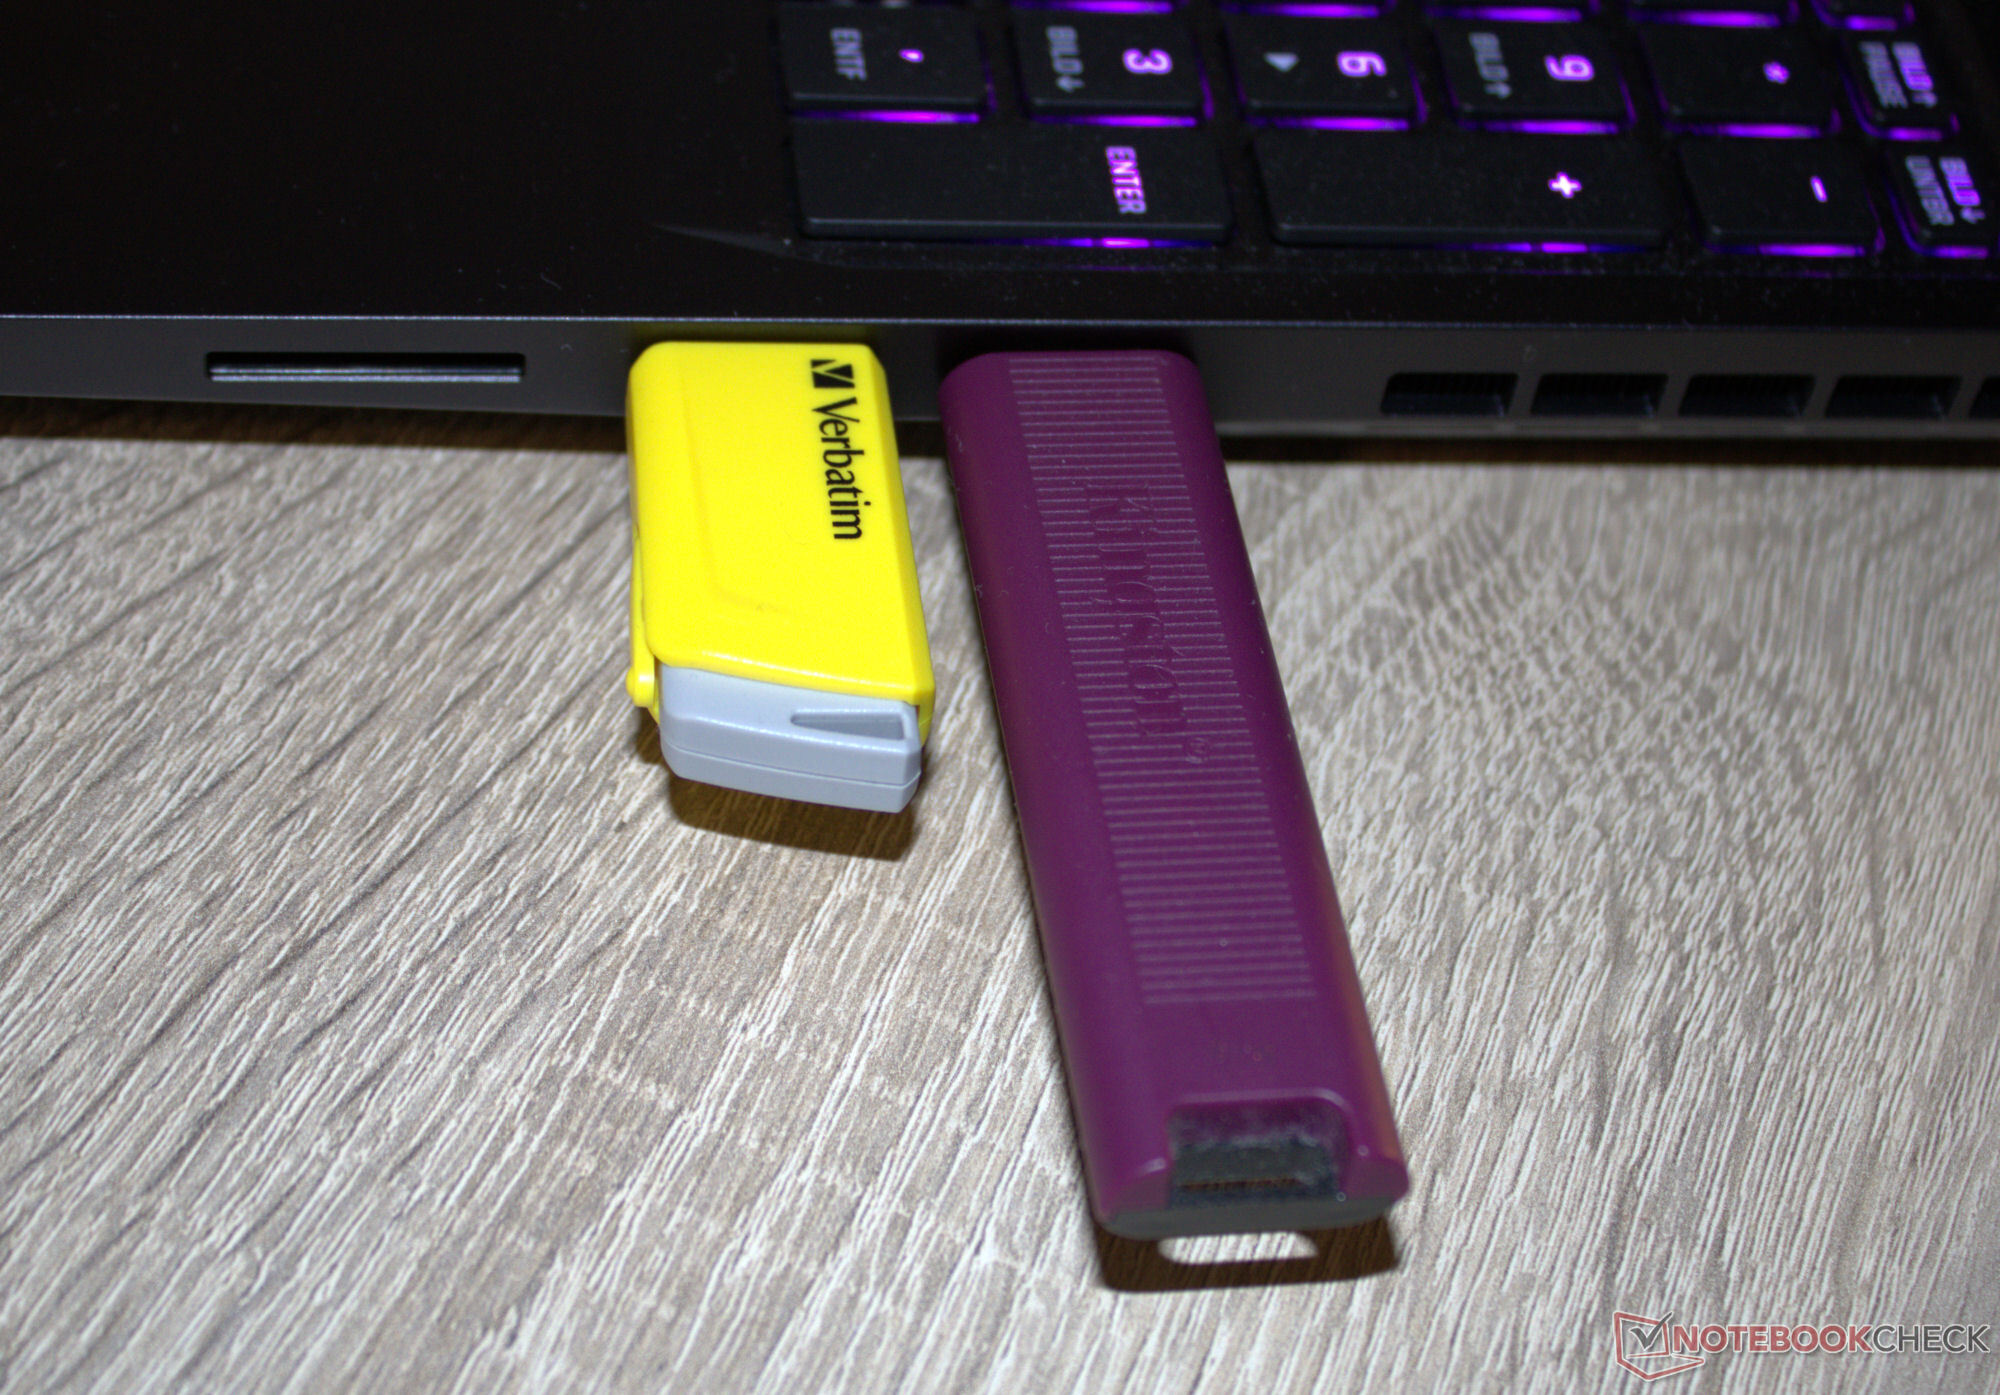
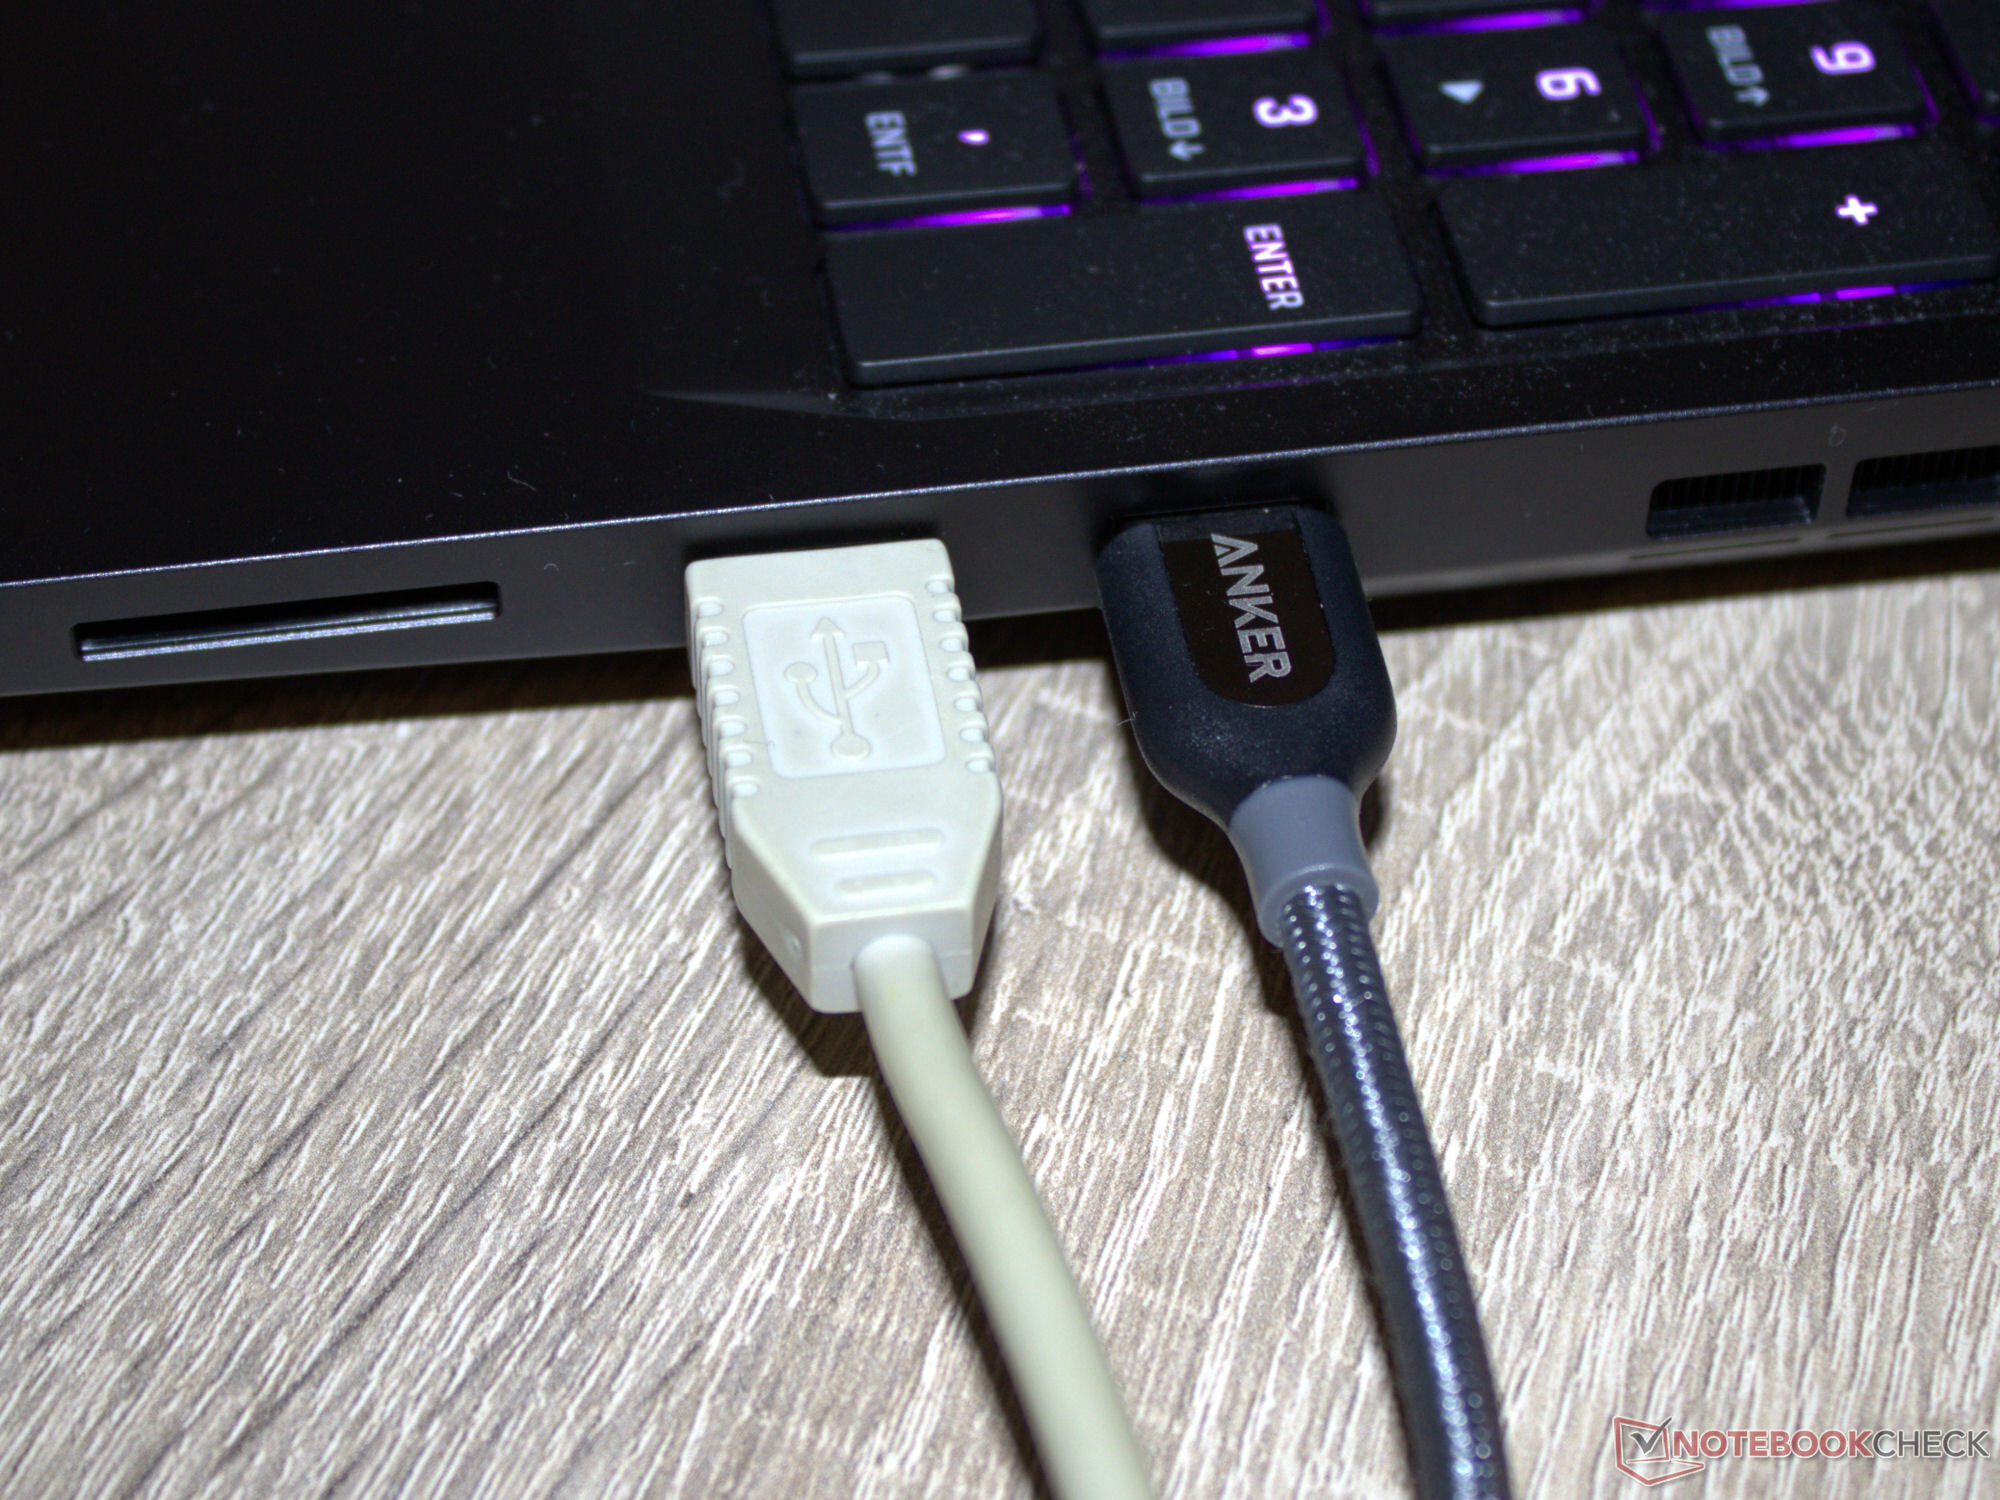
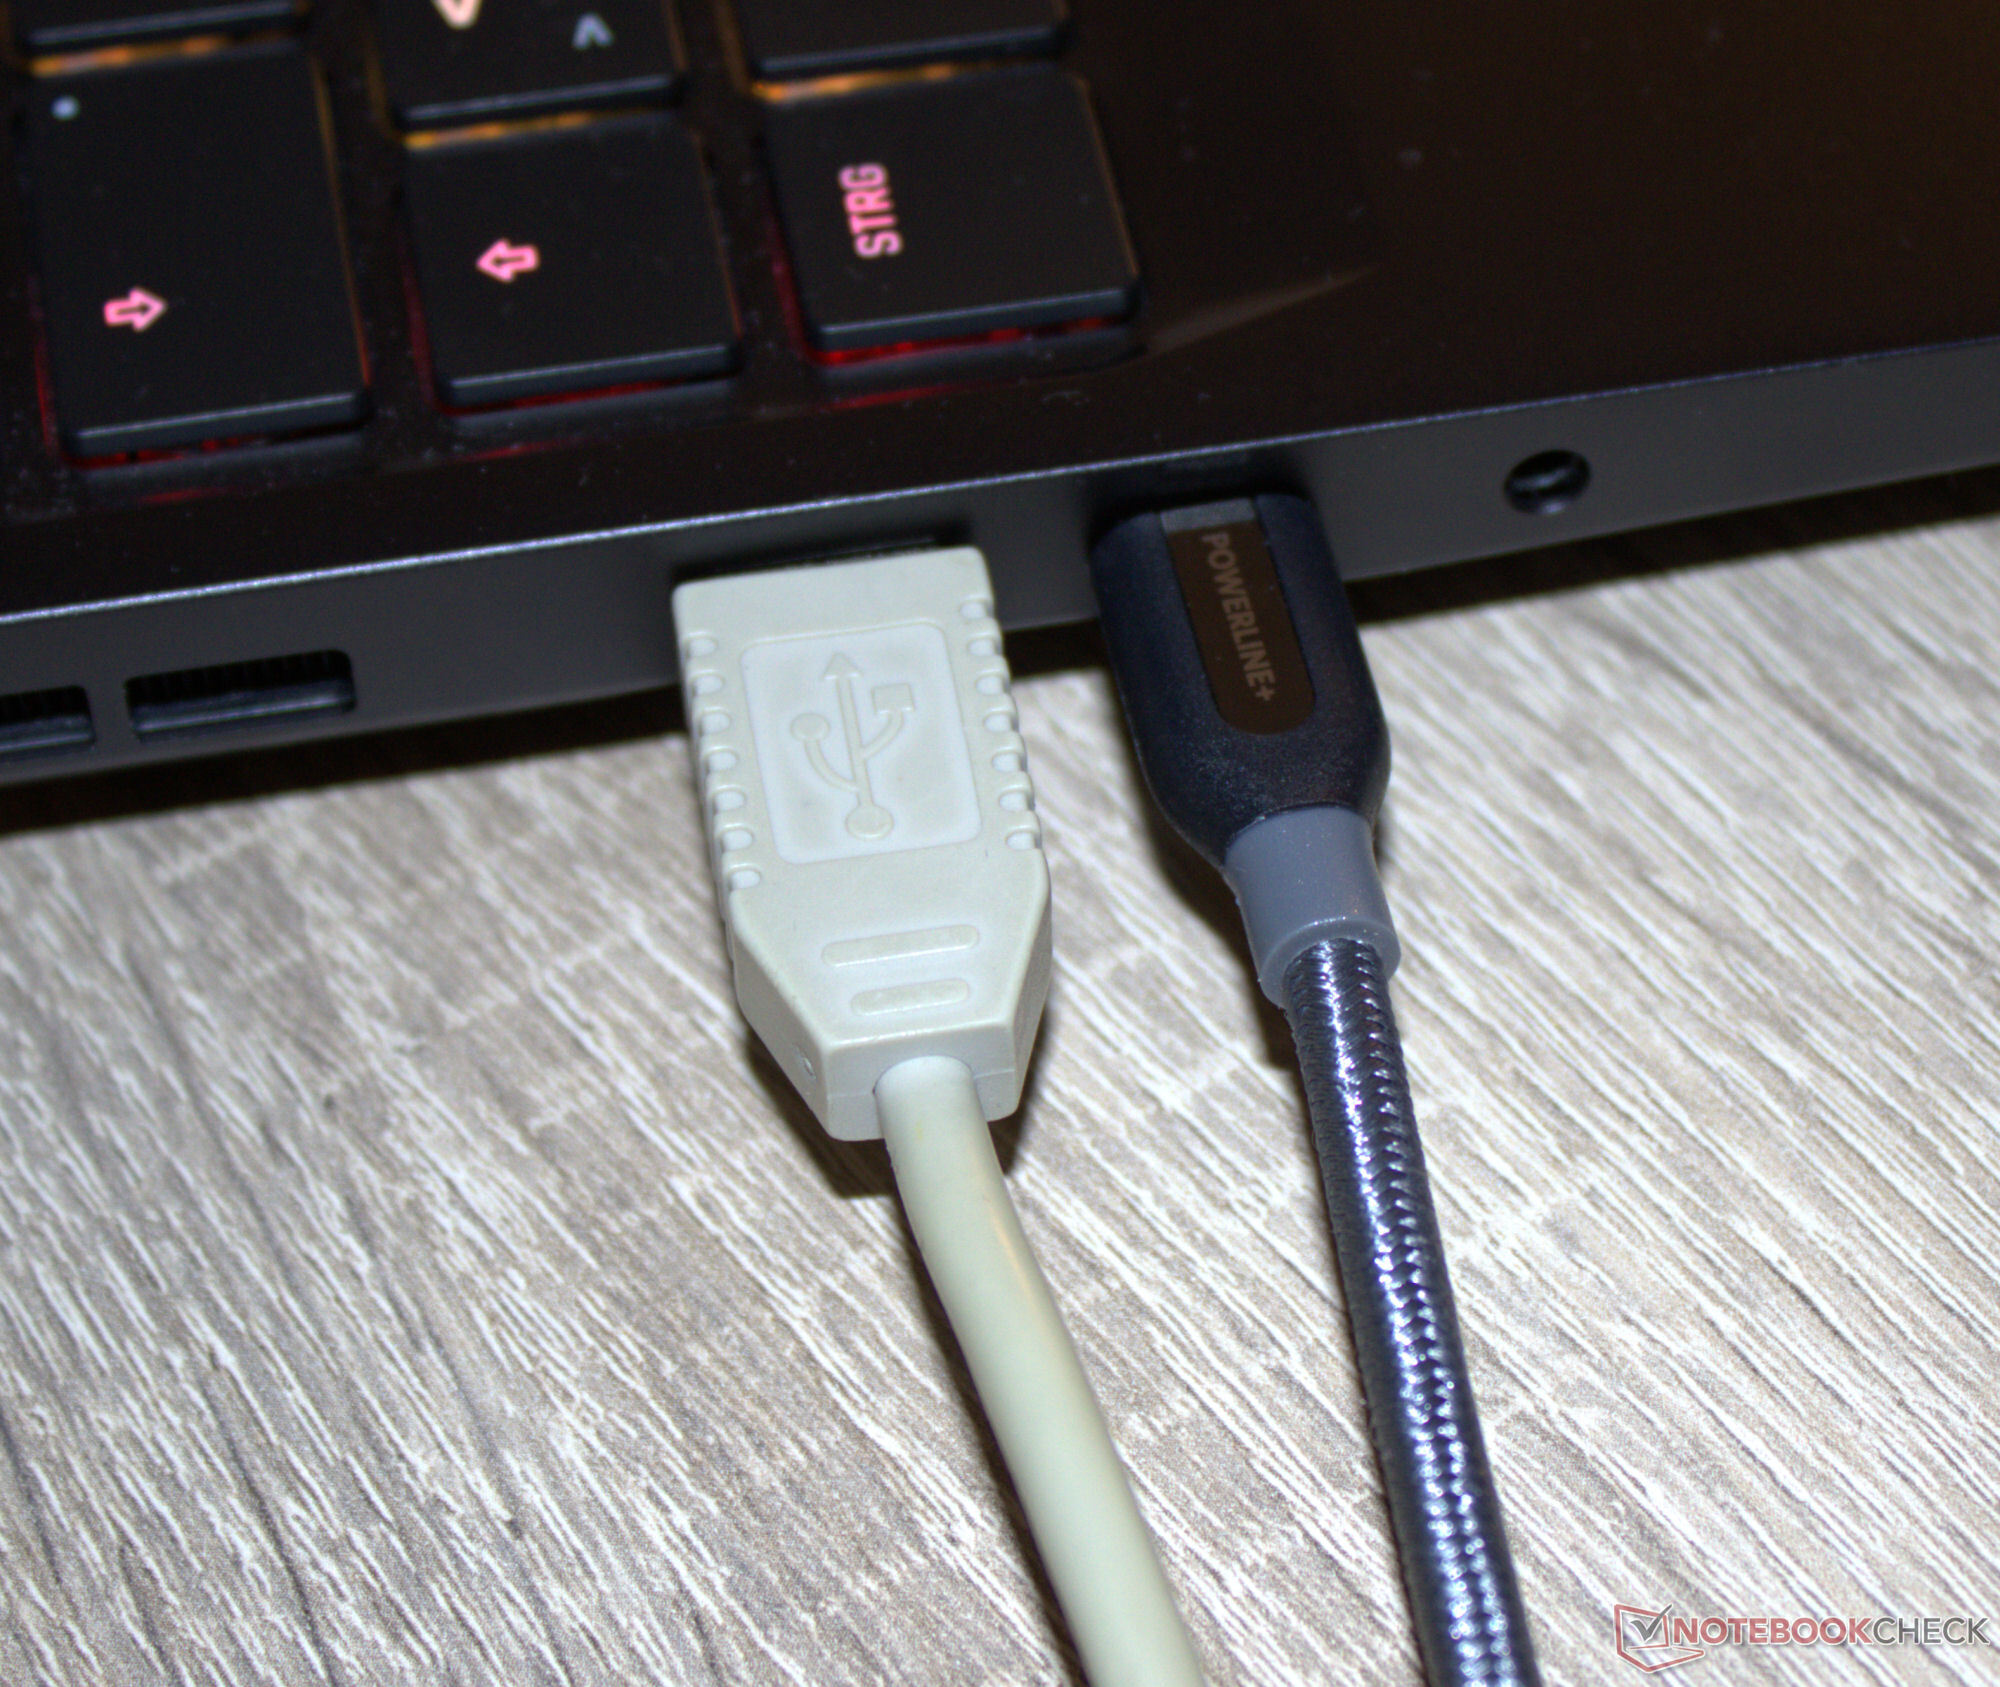
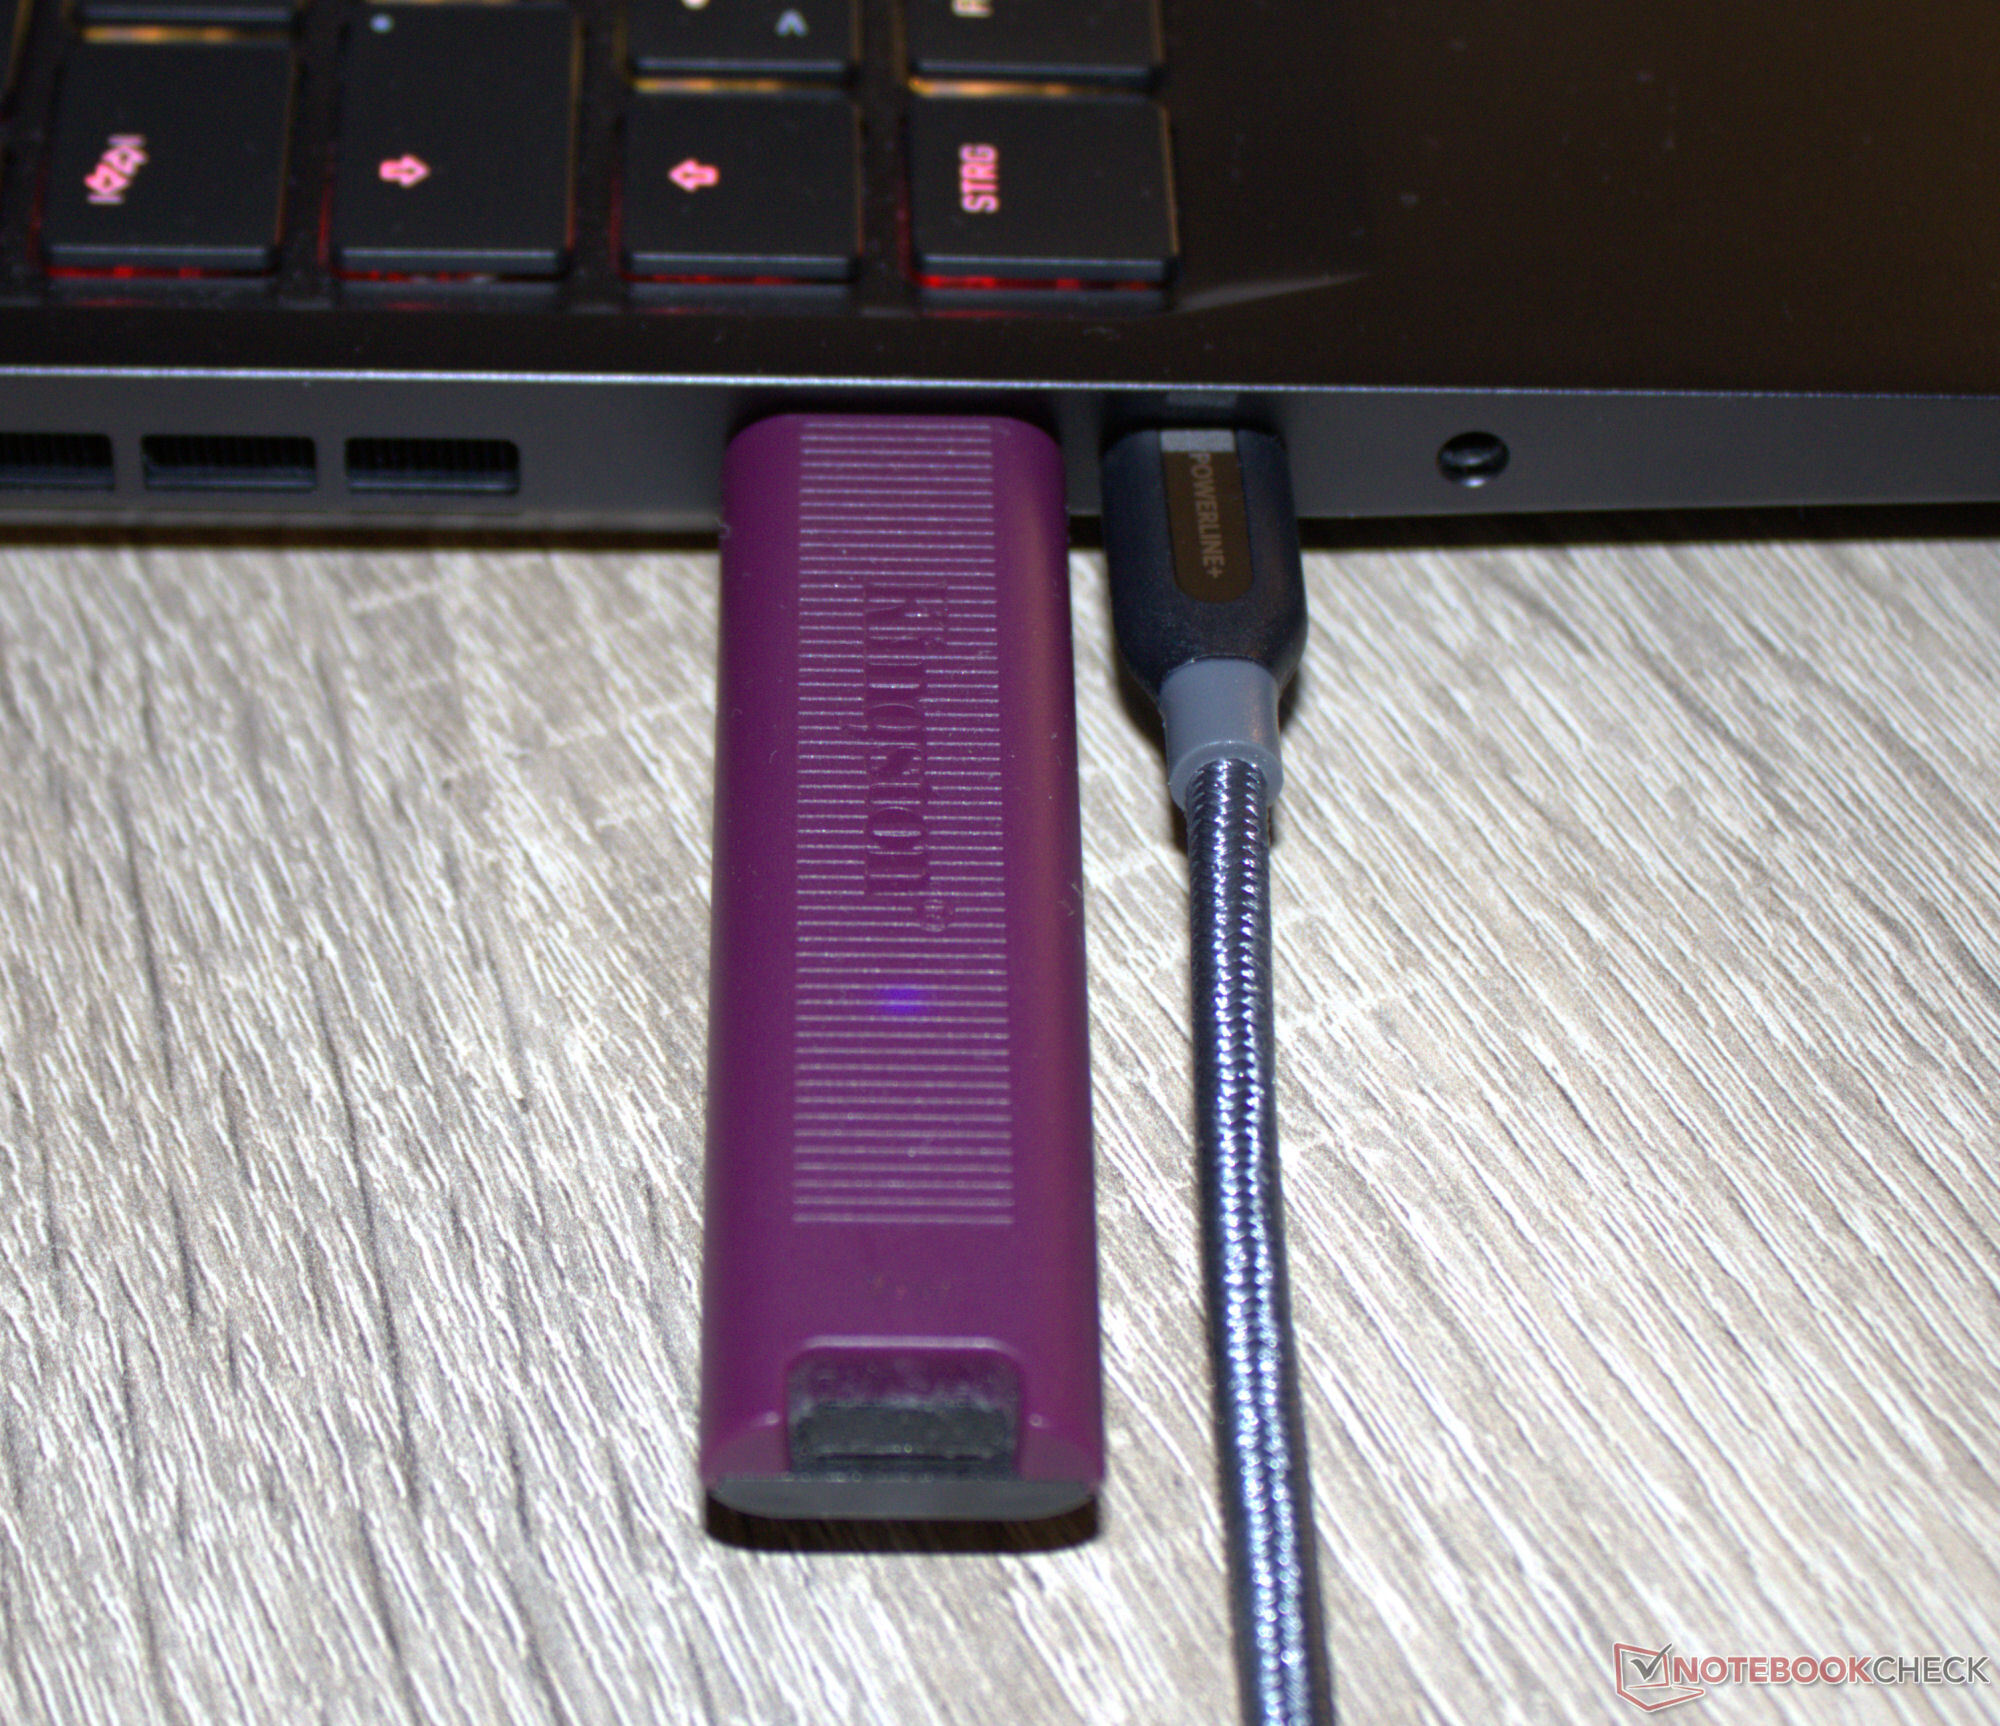
La distanza tra le porte USB (lato destro: 12 mm, lato sinistro: 8 mm) sembra essere adeguatamente proporzionata: È possibile collegare contemporaneamente due chiavette (connettori) di dimensioni tipiche (vedere le immagini della galleria). Le uscite video e i connettori di alimentazione si trovano sul retro del dispositivo. I cavi associati passerebbero sul retro e, quindi, non sarebbero d'intralcio.
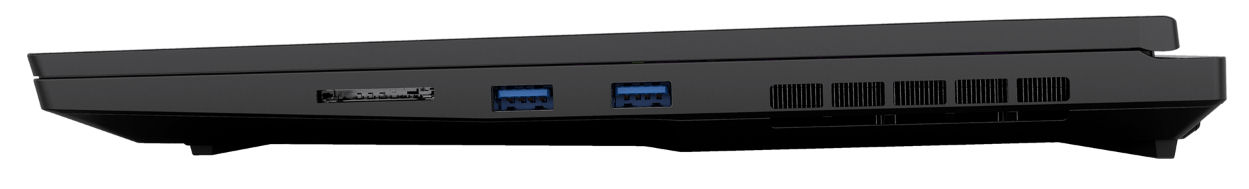
Lettore di schede SD
Il lettore di schede SD (riferimento: AV PRO microSD 128 GB V60) è uno dei modelli medio-veloci: Le velocità di trasferimento di 76 MB/s (trasferimento di 250 immagini jpg, 5 MB per file) e 87 MB/s (copia di grandi blocchi di dati) possono essere definite accettabili. Il Razer Blade 16 dimostra che è possibile raggiungere cifre significativamente più alte.
| SD Card Reader | |
| average JPG Copy Test (av. of 3 runs) | |
| Razer Blade 16 2024, RTX 4090 | |
| Media della classe Gaming (19 - 202, n=97, ultimi 2 anni) | |
| Medion Erazer Beast X40 2024 (AV PRO microSD 128 GB V60) | |
| SCHENKER XMG Neo 16 (Early 24) (AV PRO microSD 128 GB V60) | |
| SCHENKER XMG Neo 16 E23 (AV PRO microSD 128 GB V60) | |
| maximum AS SSD Seq Read Test (1GB) | |
| Razer Blade 16 2024, RTX 4090 | |
| Media della classe Gaming (25.8 - 269, n=94, ultimi 2 anni) | |
| Medion Erazer Beast X40 2024 (AV PRO microSD 128 GB V60) | |
| SCHENKER XMG Neo 16 (Early 24) (AV PRO microSD 128 GB V60) | |
| SCHENKER XMG Neo 16 E23 (AV PRO microSD 128 GB V60) | |
Comunicazione
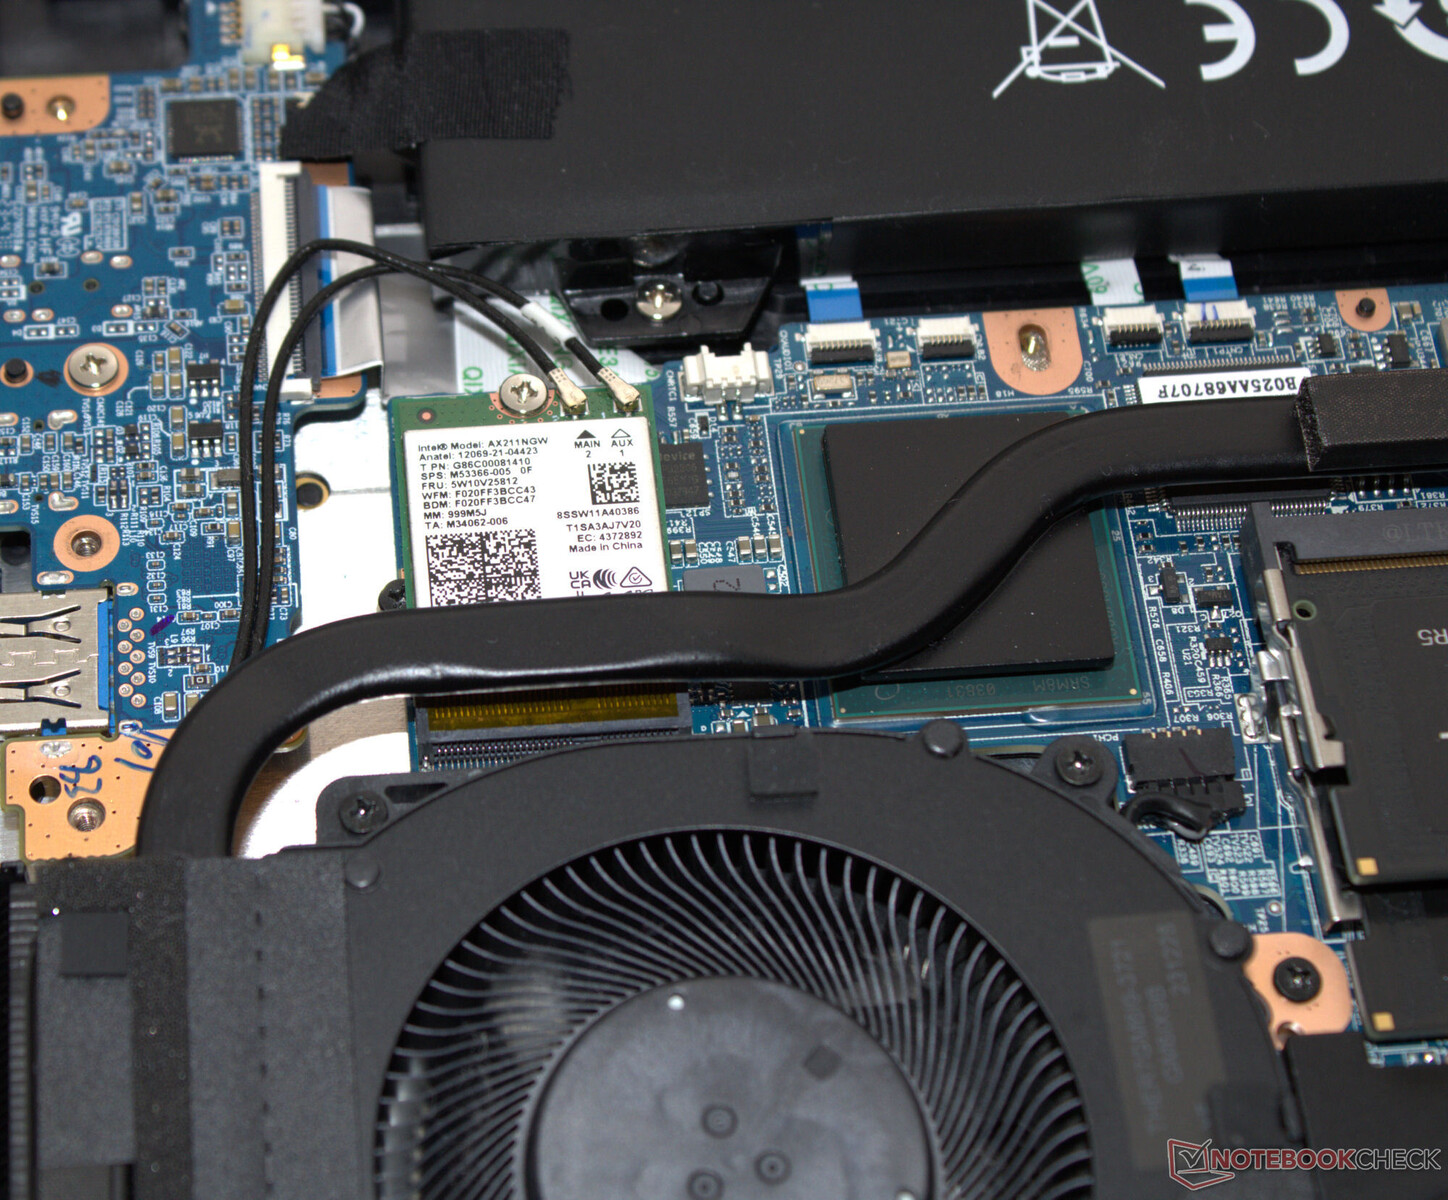
In condizioni ottimali (assenza di dispositivi Wi-Fi nelle vicinanze, breve distanza tra il portatile e il PC server) è possibile raggiungere velocità di dati da buone a eccellenti - un chip WiFi 6E (Intel AX211) lo rende possibile. Le connessioni cablate sono eseguite da un controller Realtek Gigabit Ethernet (RTL8125, 2,5 GBit/s).
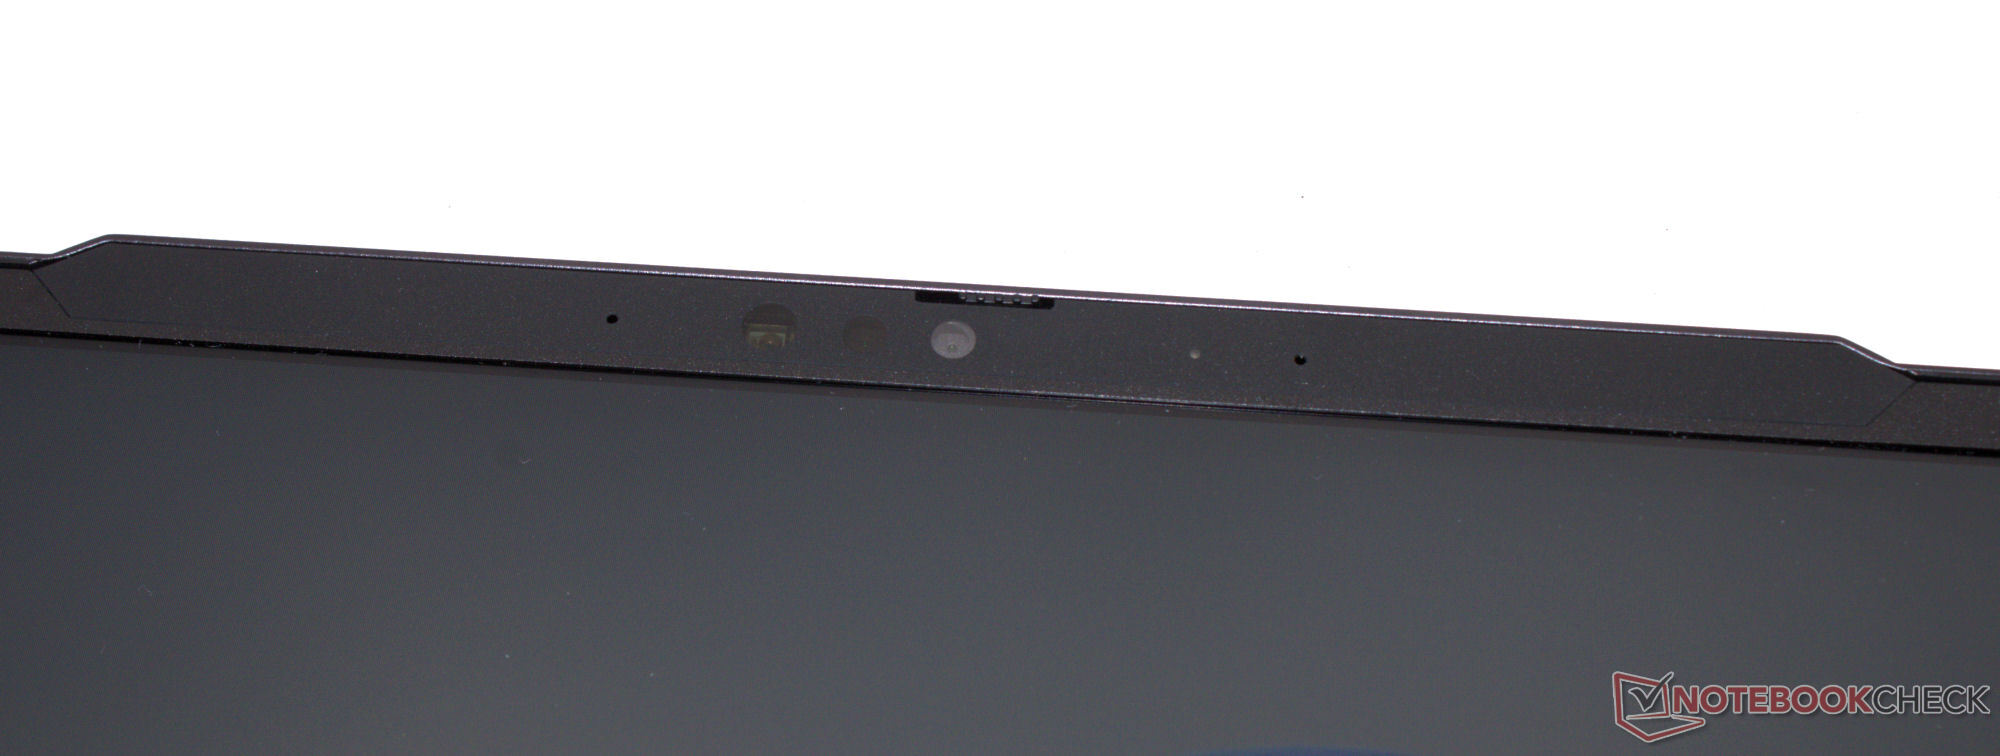
Webcam
La webcam (2,1 MP) offre una qualità media e viene fornito il supporto per Windows Hello. Inoltre, è presente un otturatore meccanico.
 NVIDIA GeForce RTX 4090 Laptop GPU, i9-14900HX, Samsung 990 Pro 1 TB")
 NVIDIA GeForce RTX 4090 Laptop GPU, i9-14900HX, Samsung 990 Pro 1 TB")
Accessori
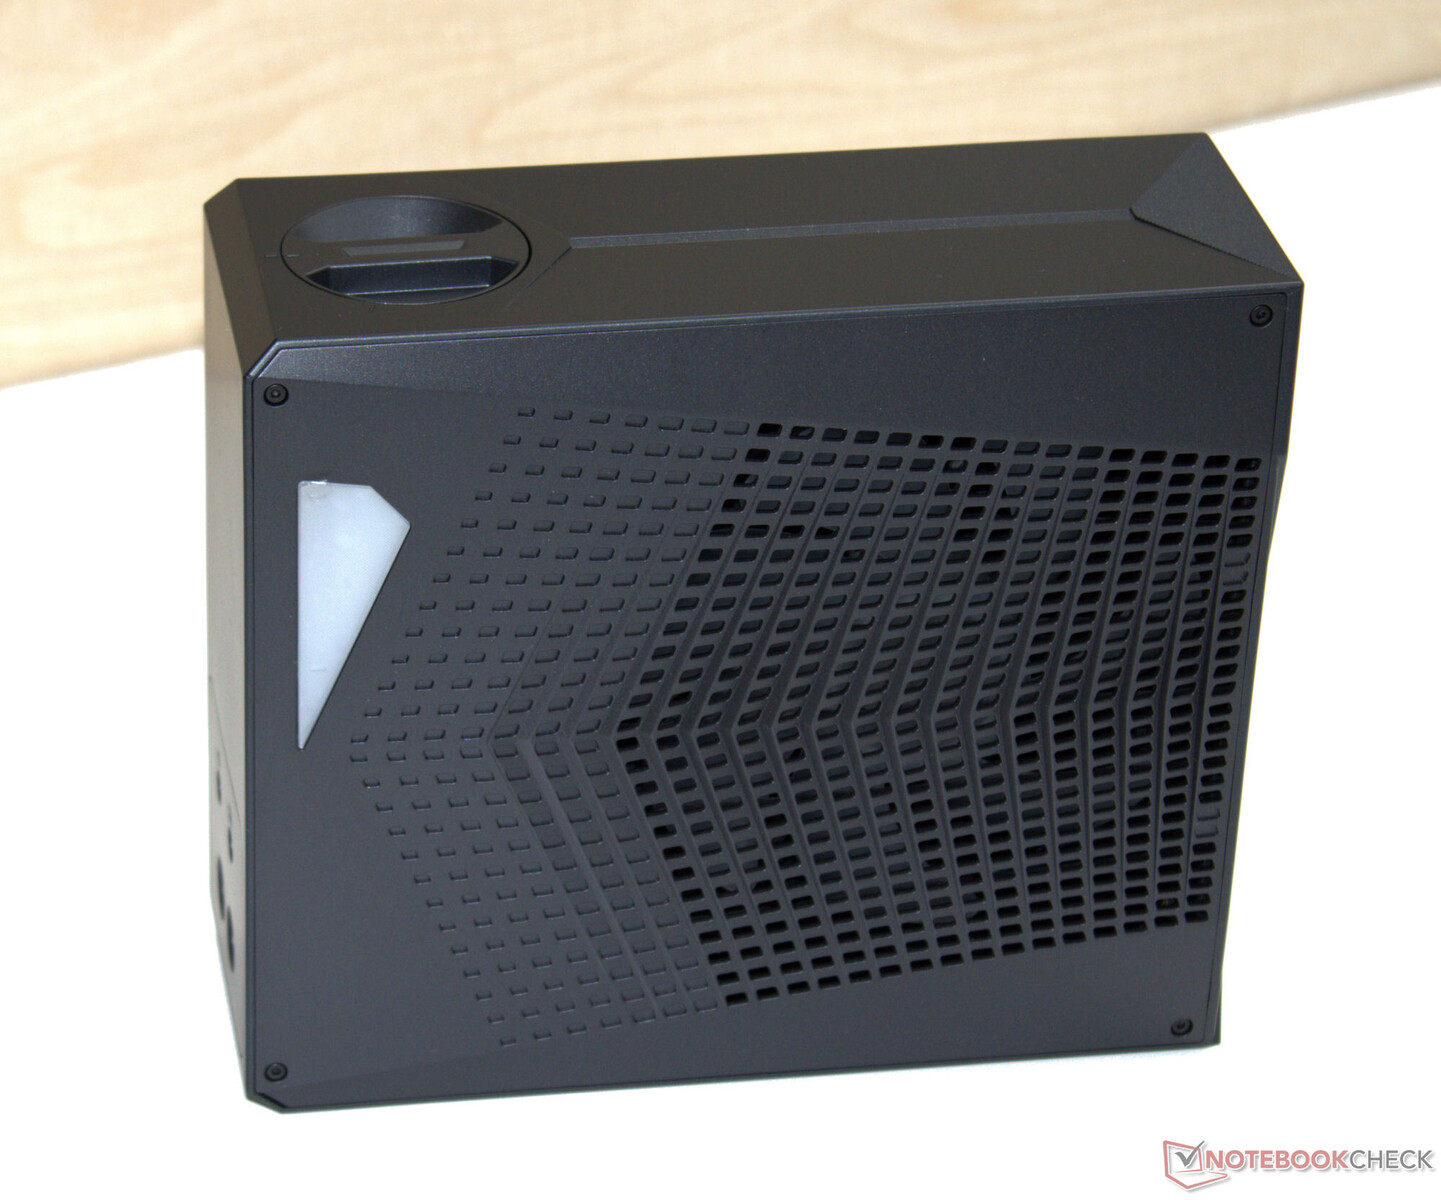
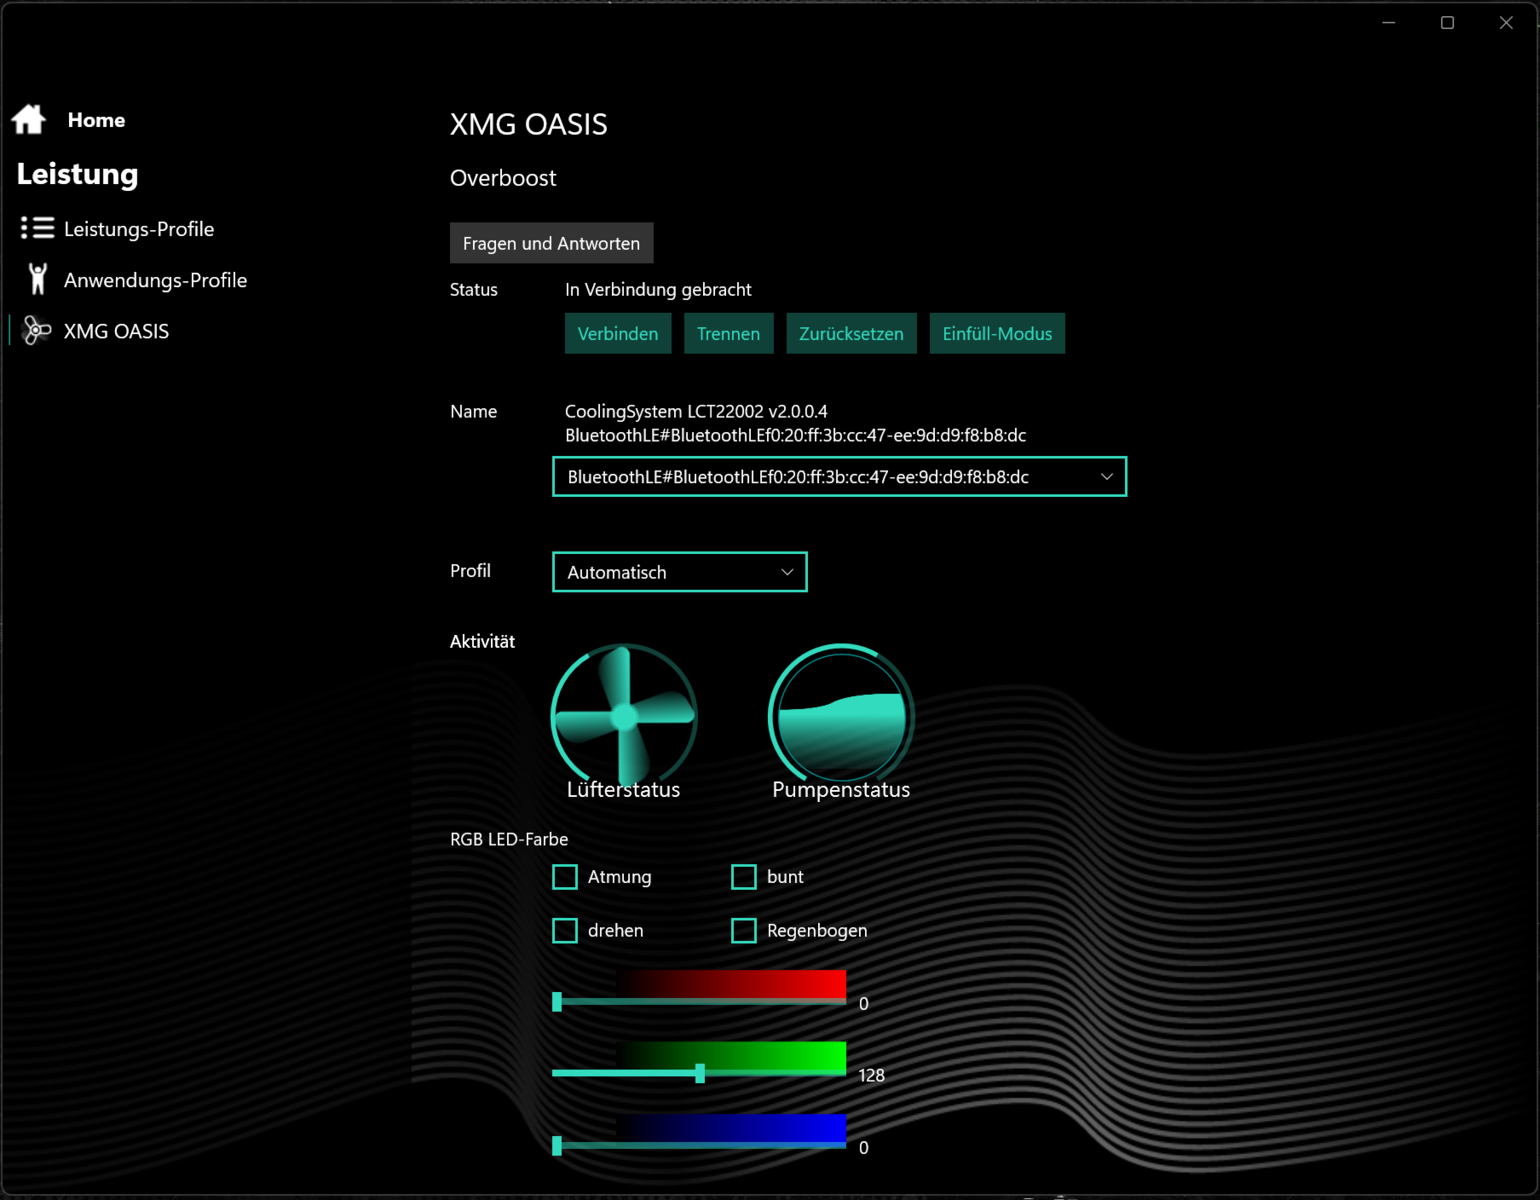
Il portatile viene fornito con una chiavetta USB (driver, istruzioni), adesivi e un mousepad. Un accessorio opzionale è rappresentato dal raffreddamento ad acqua esterno https://www.xmg.gg/xmg-oasis-mk2/ ($230).

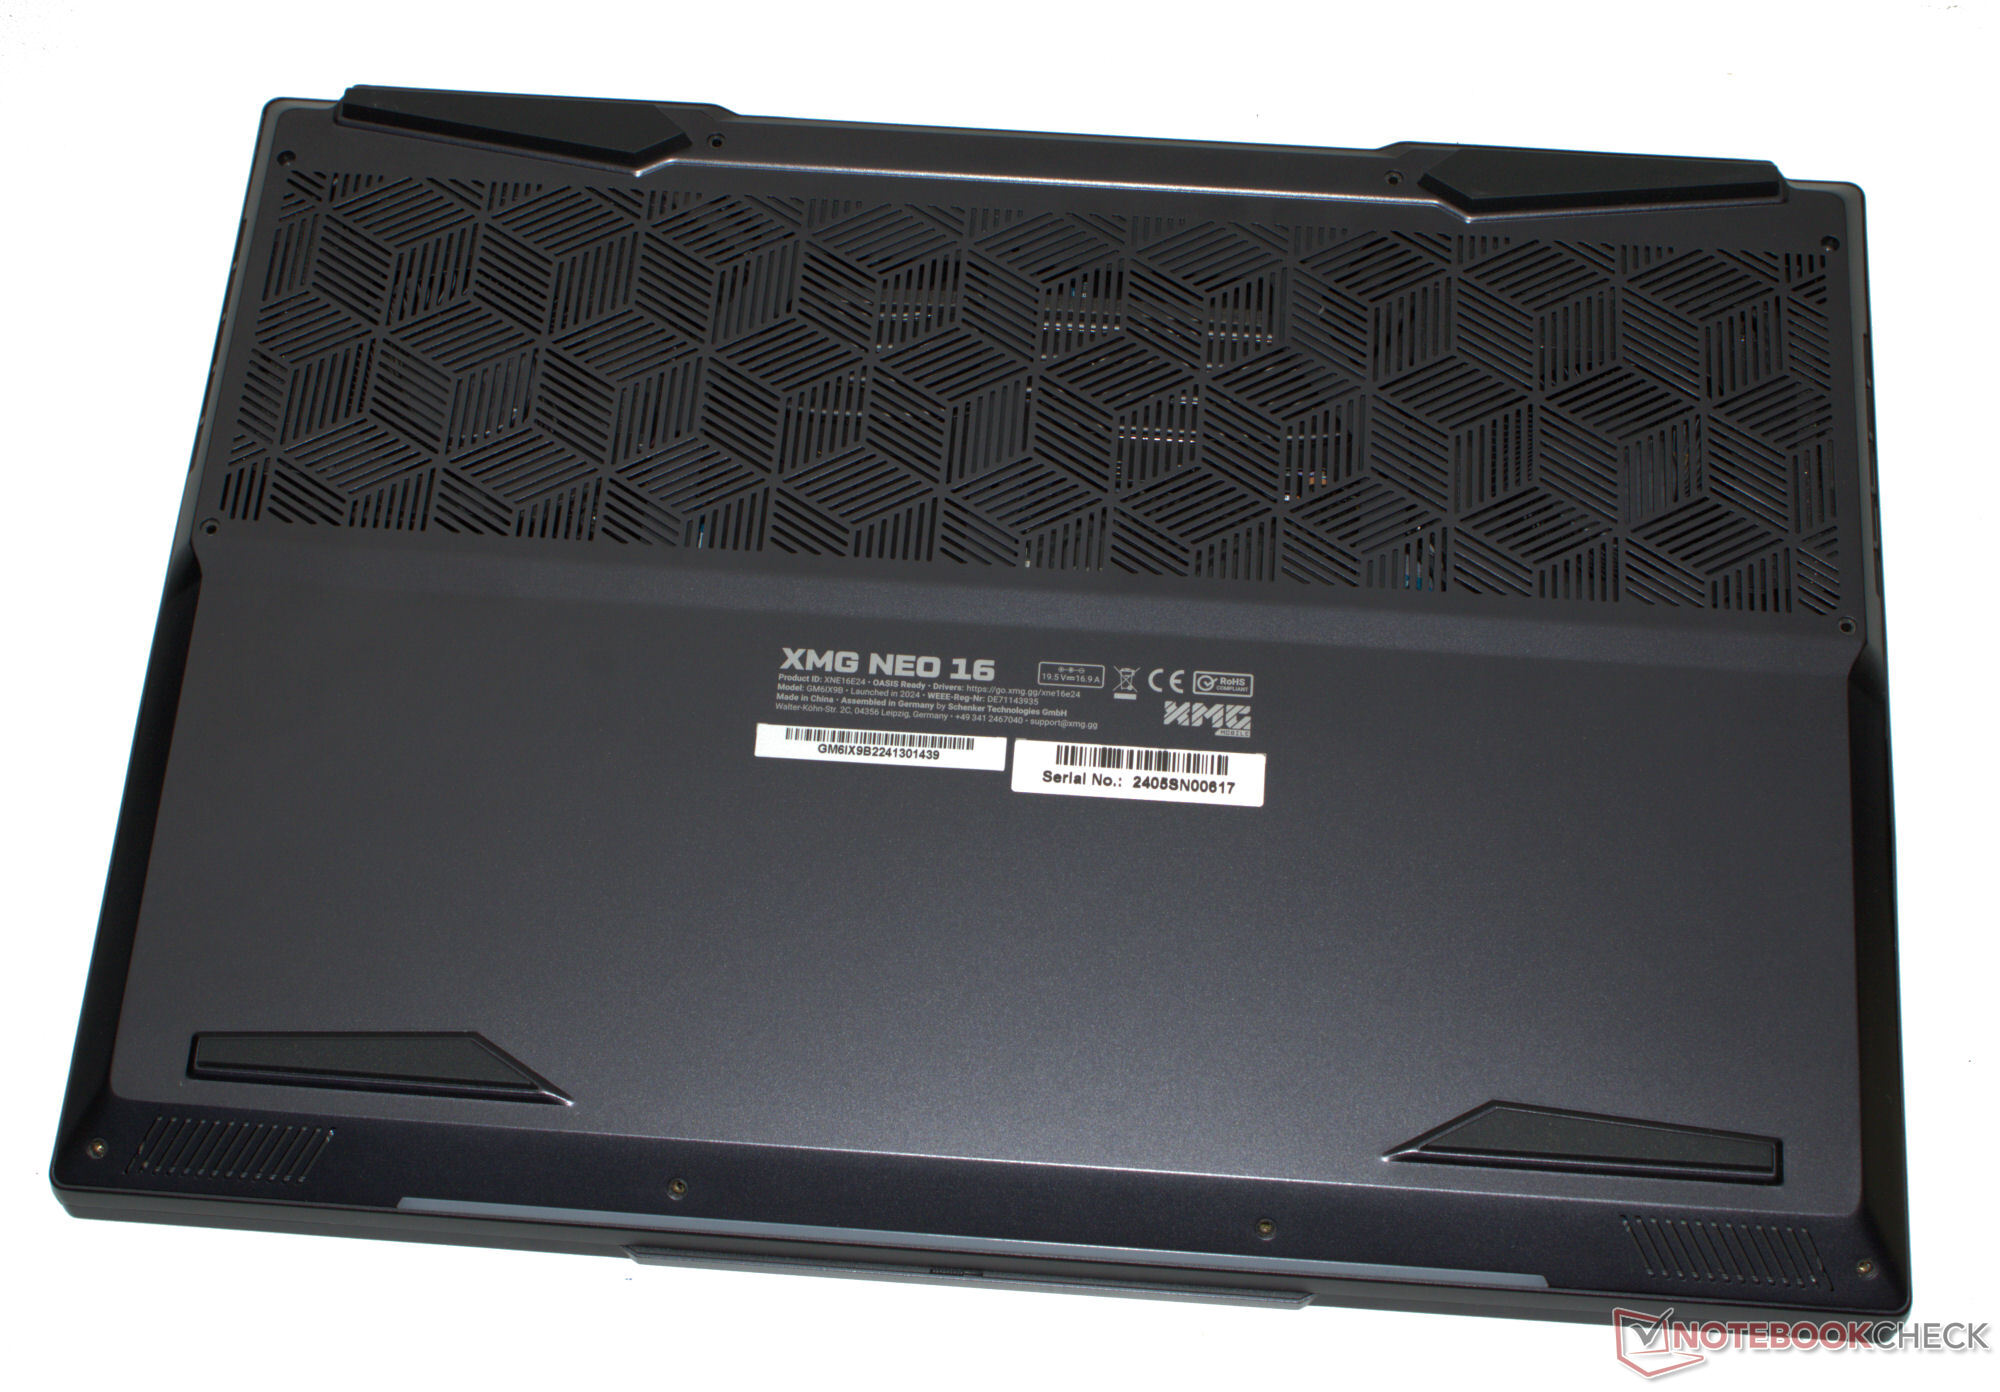
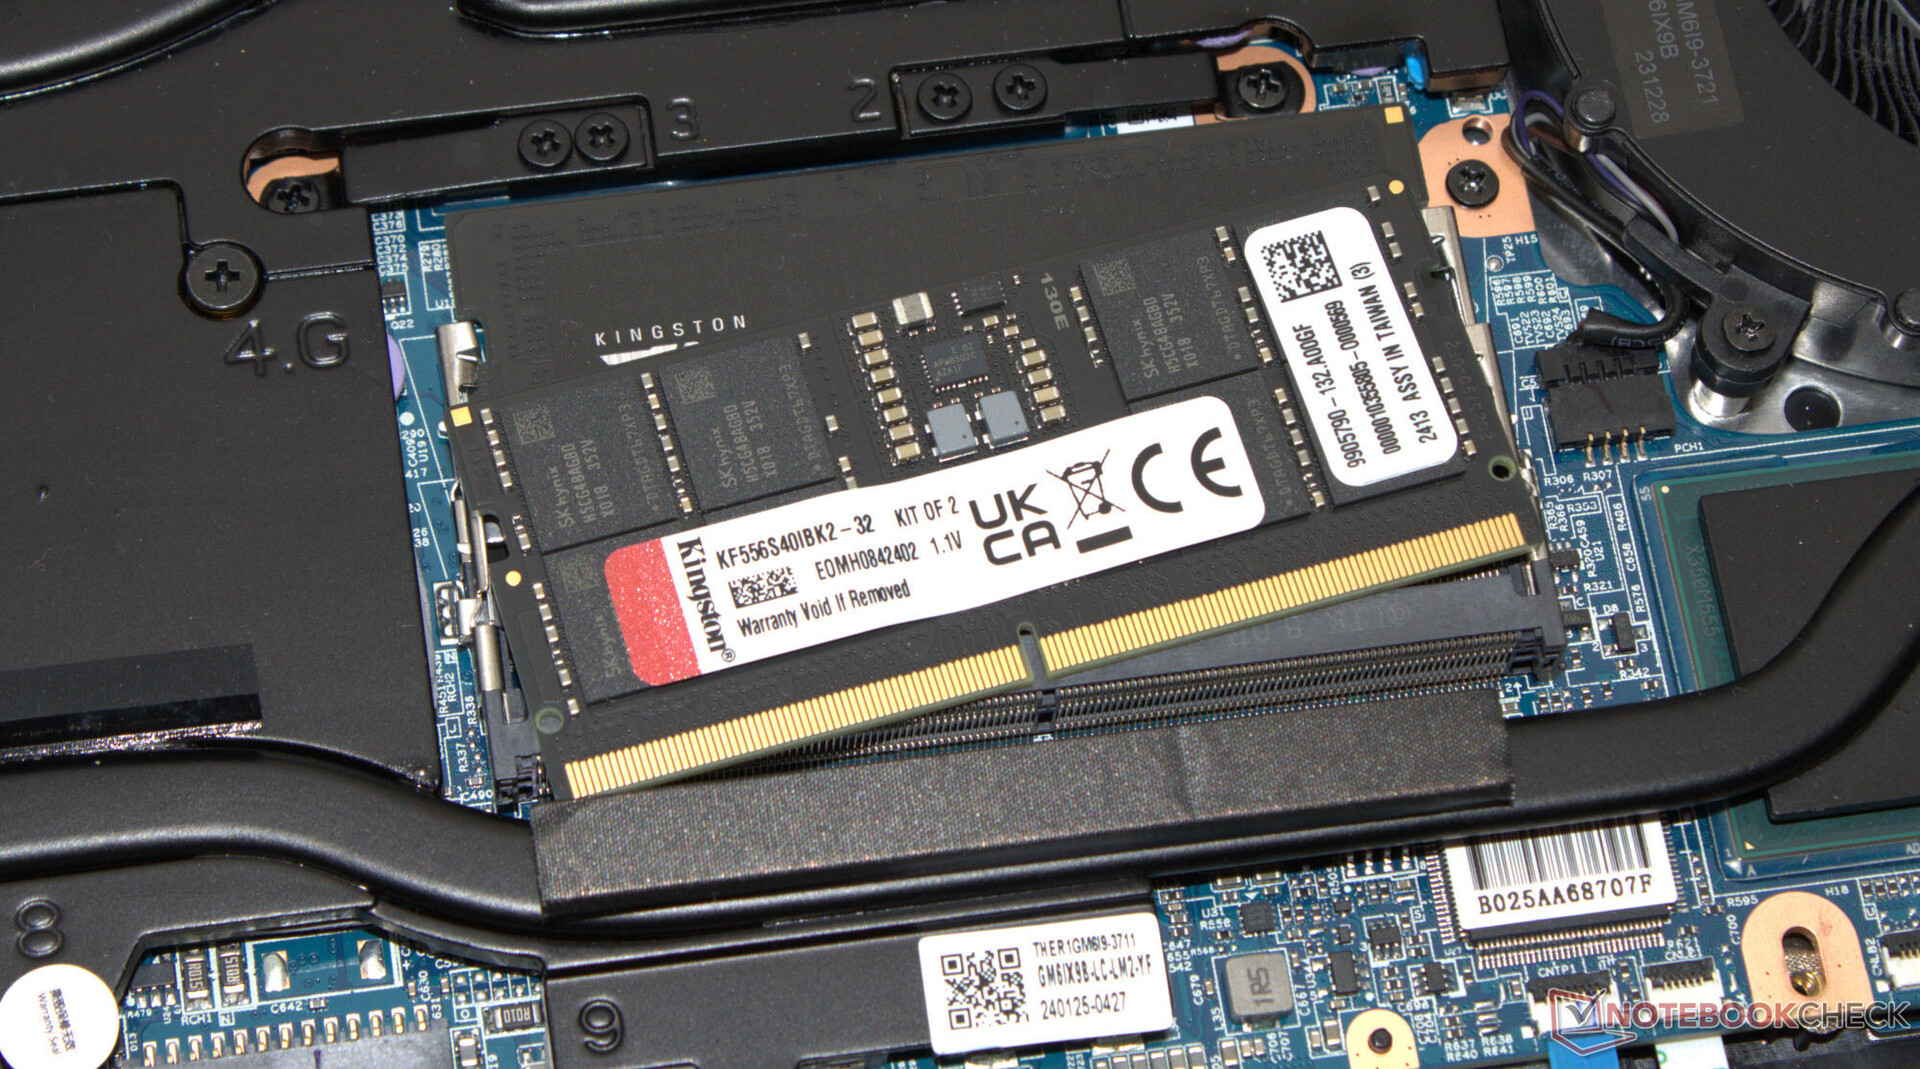
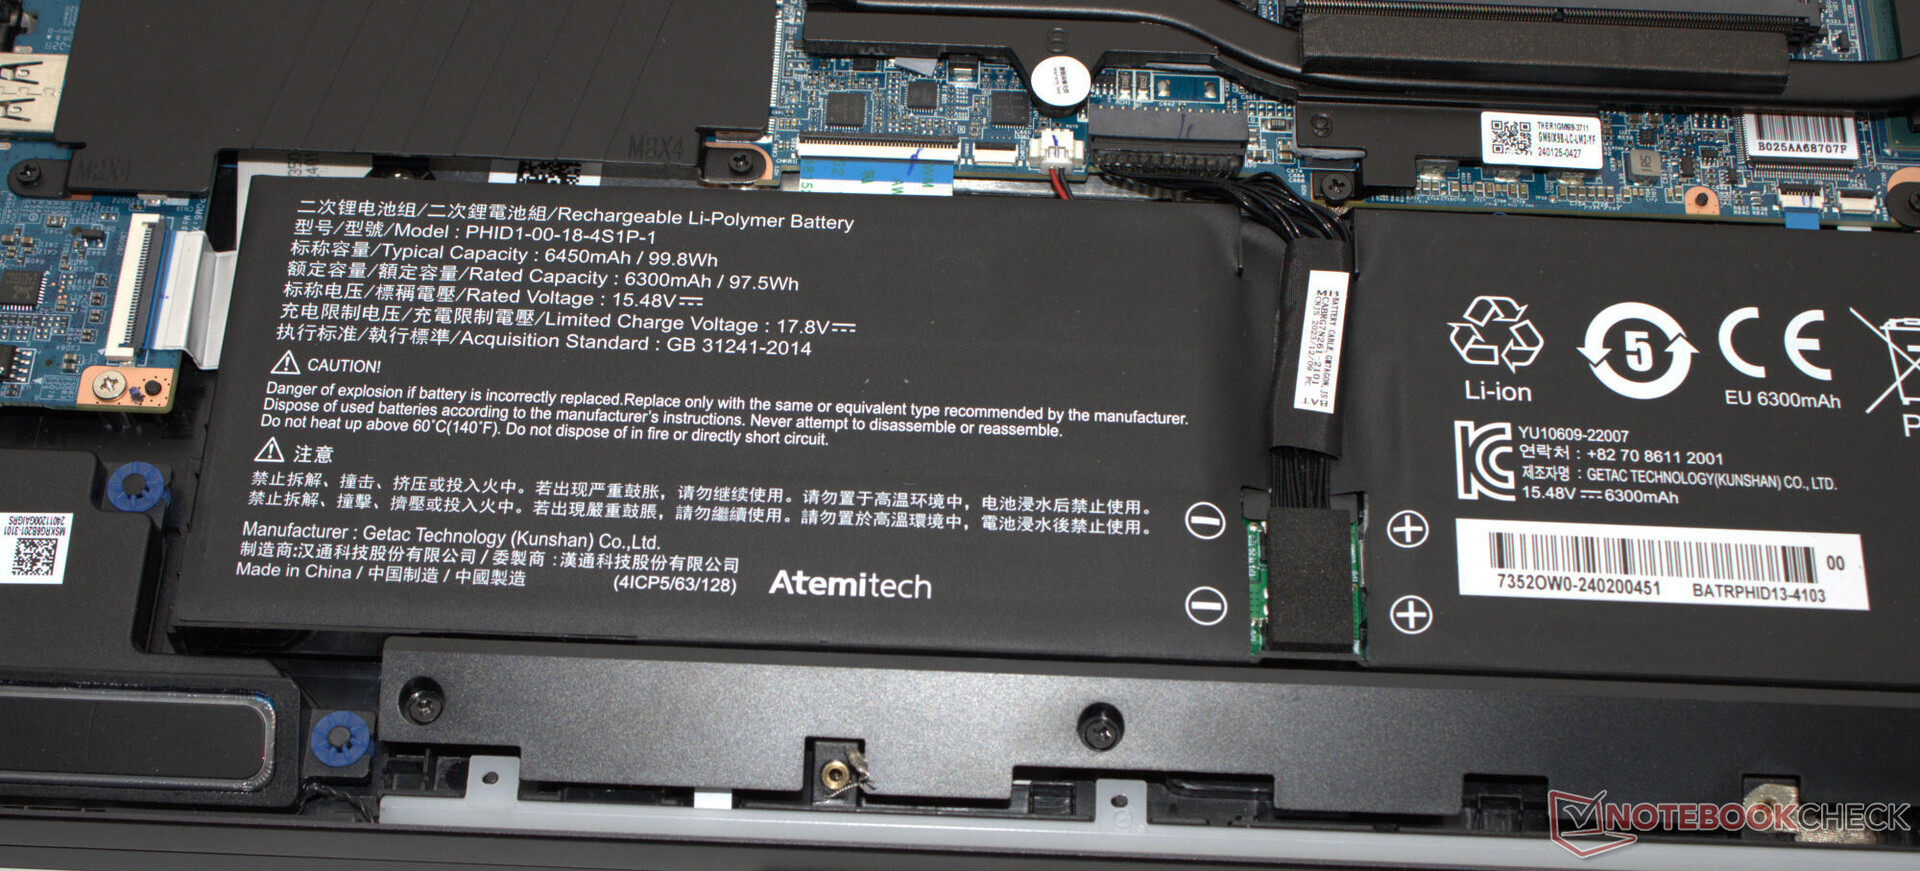
Manutenzione
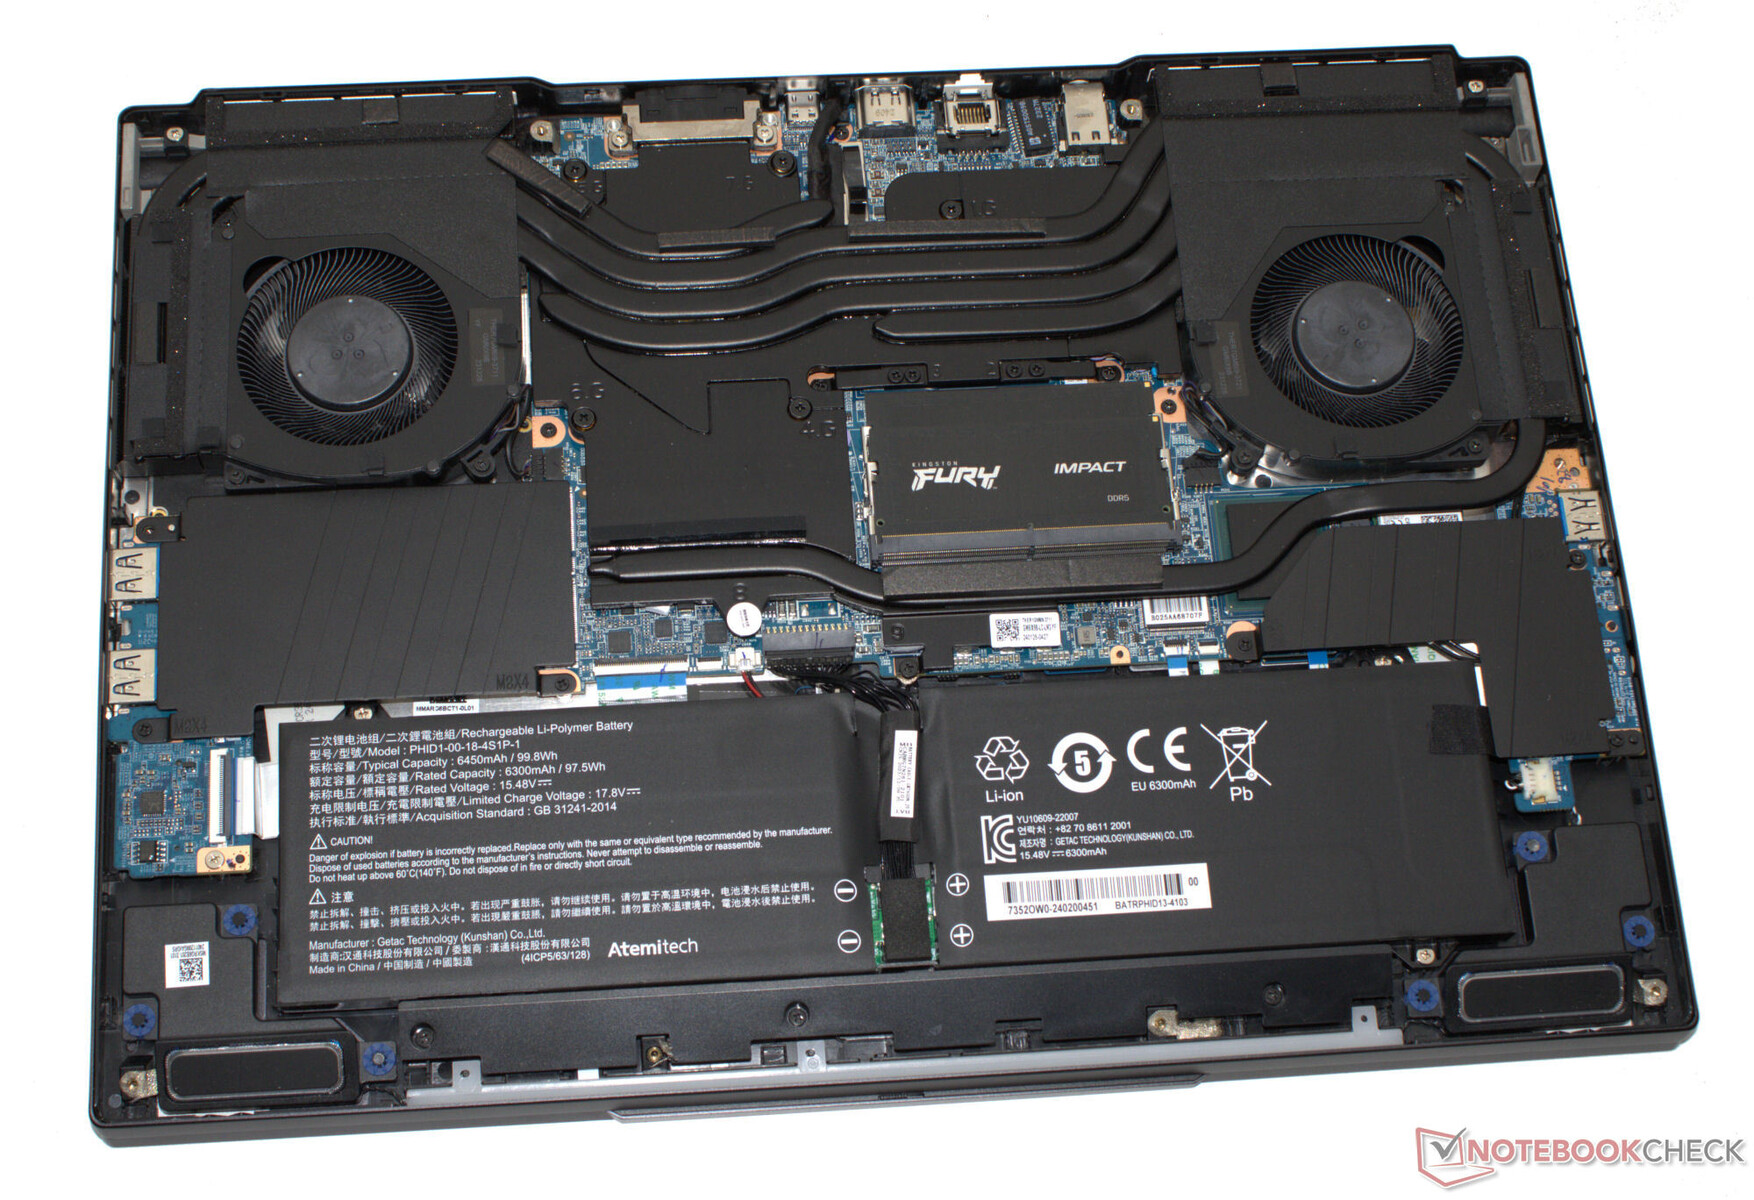
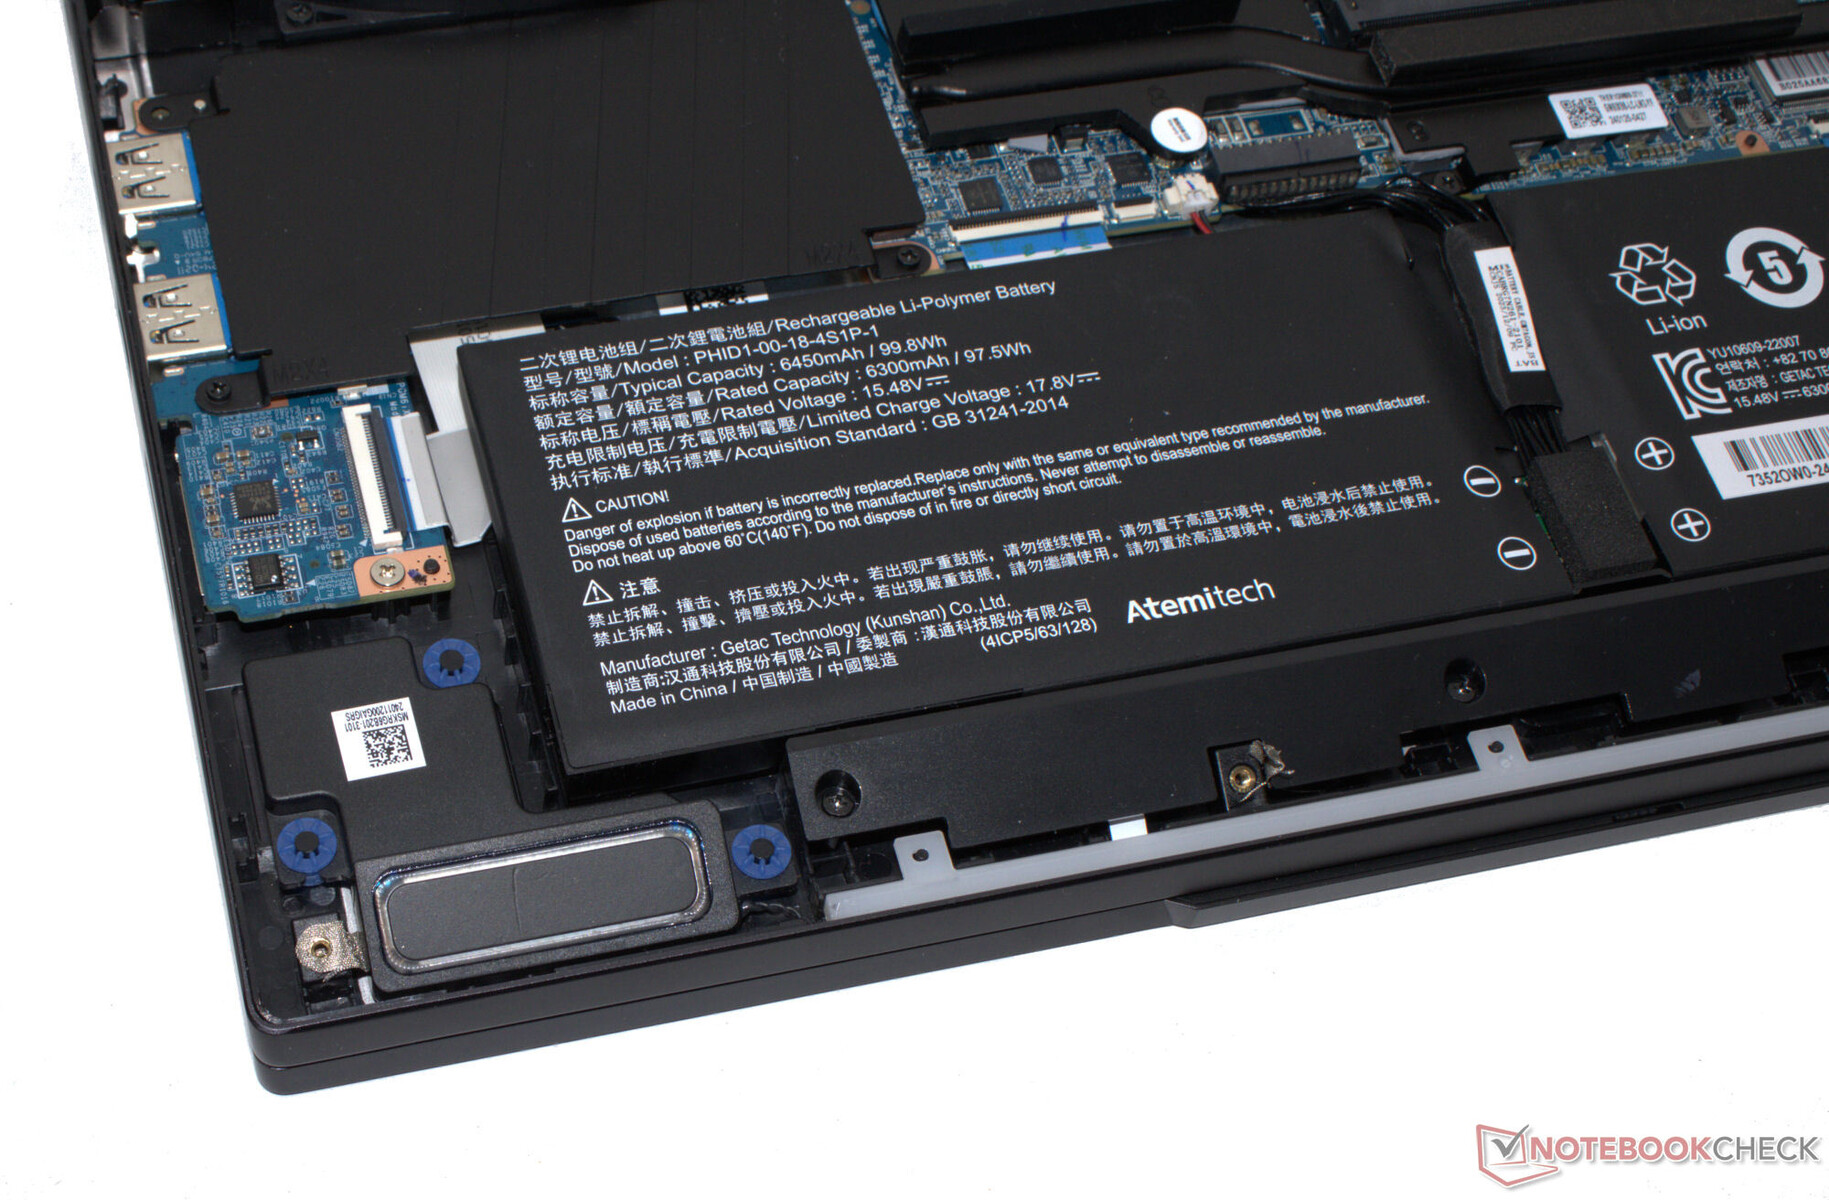
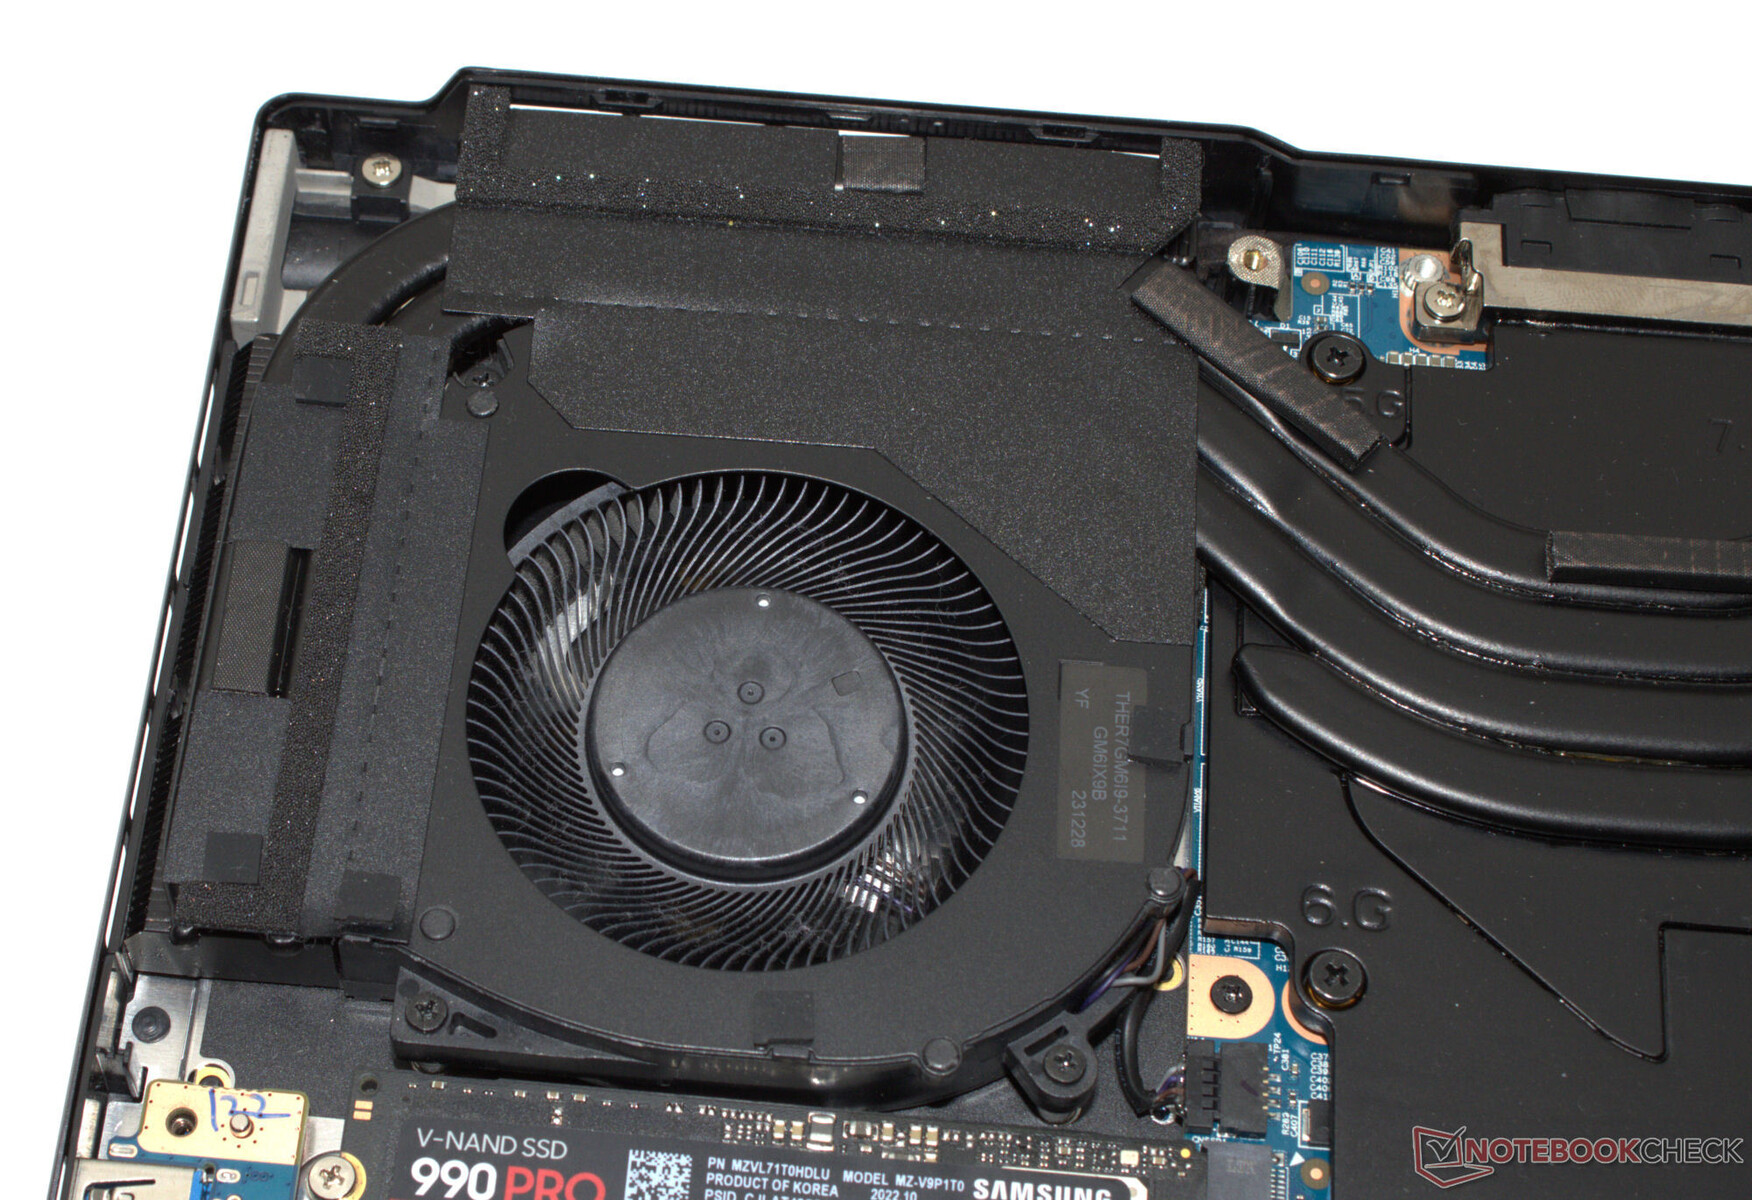
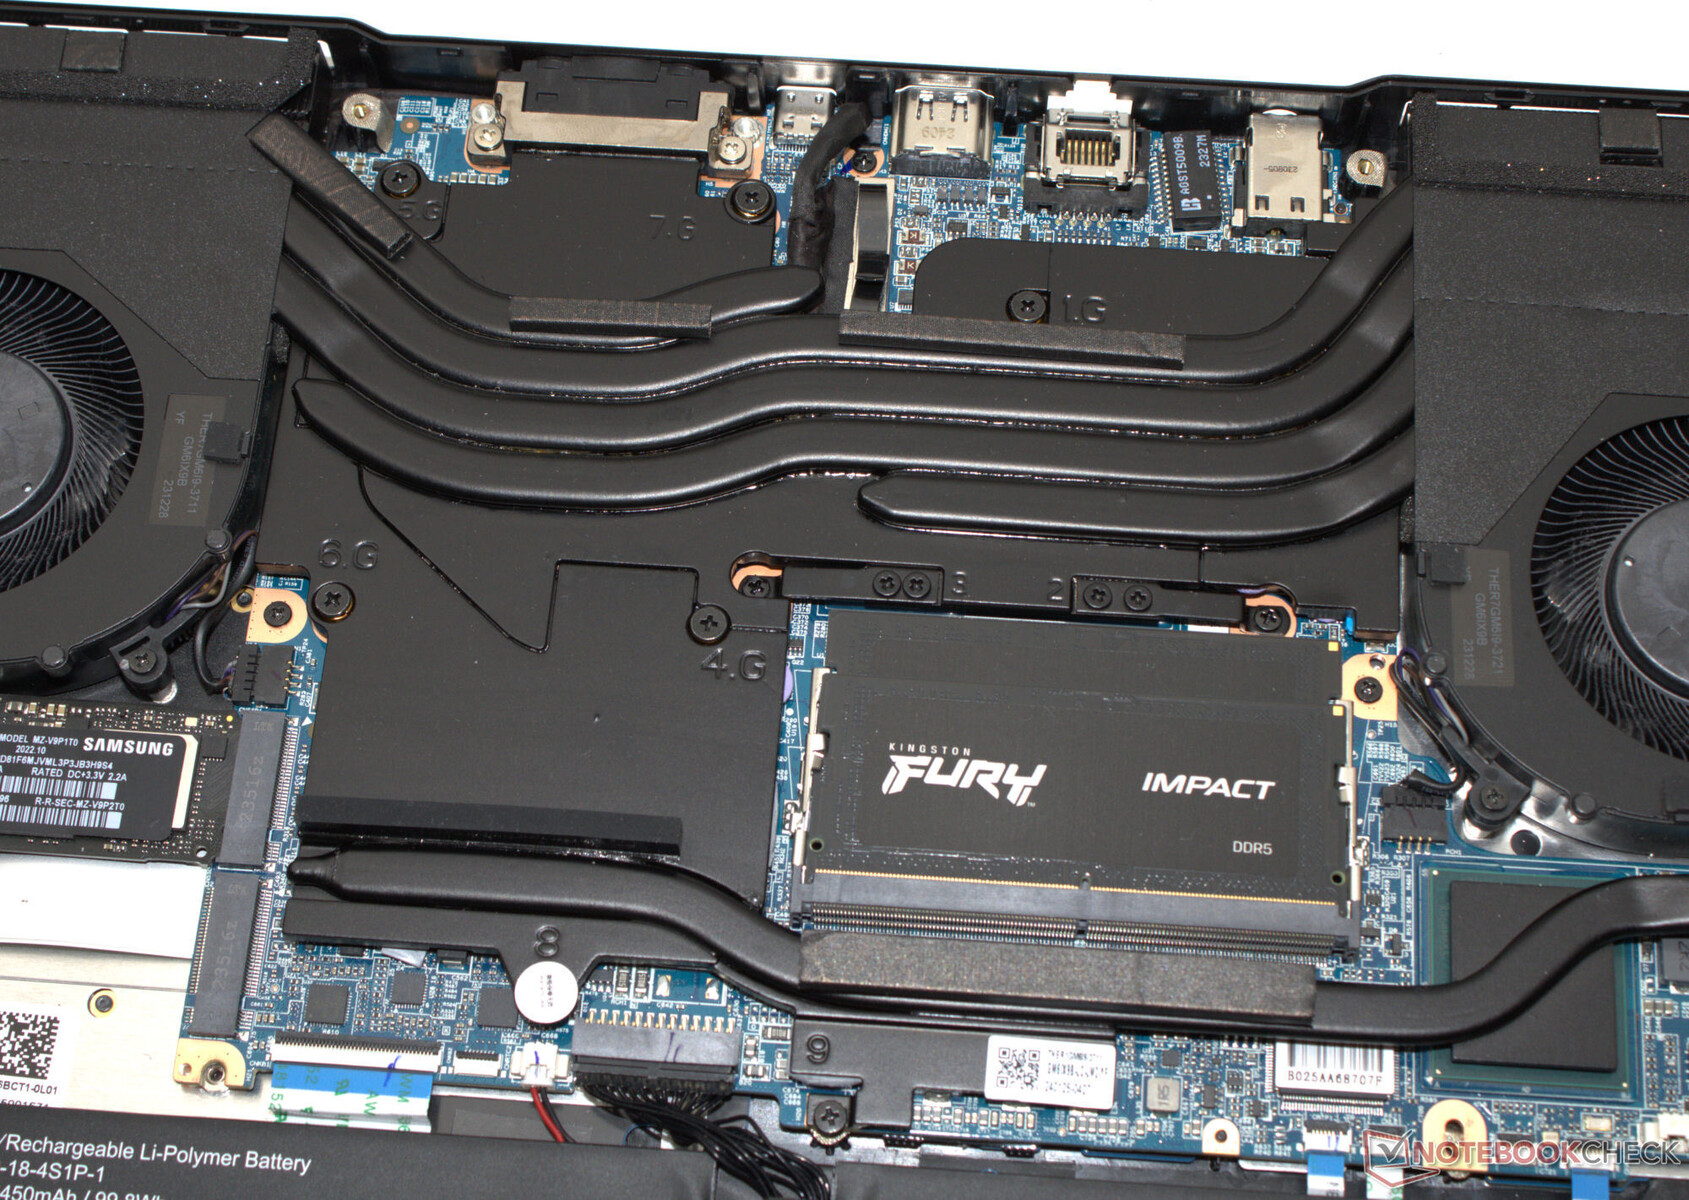
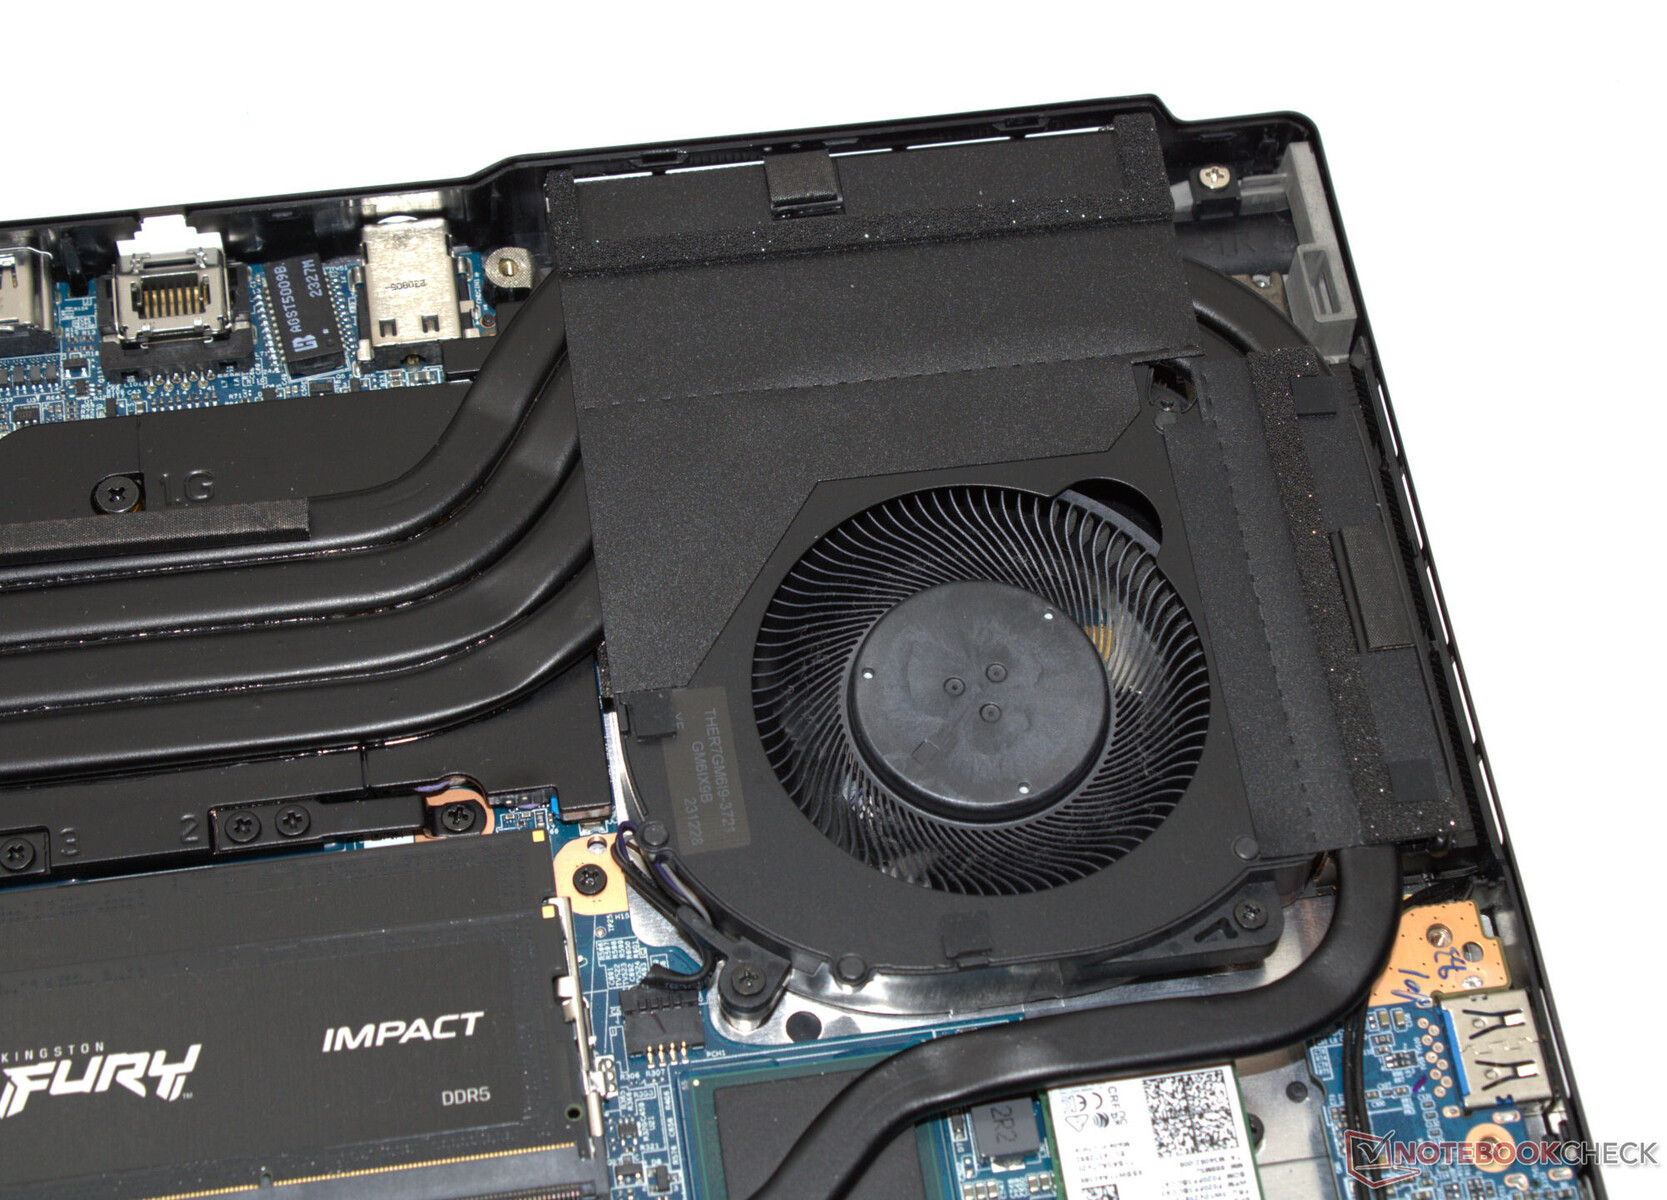
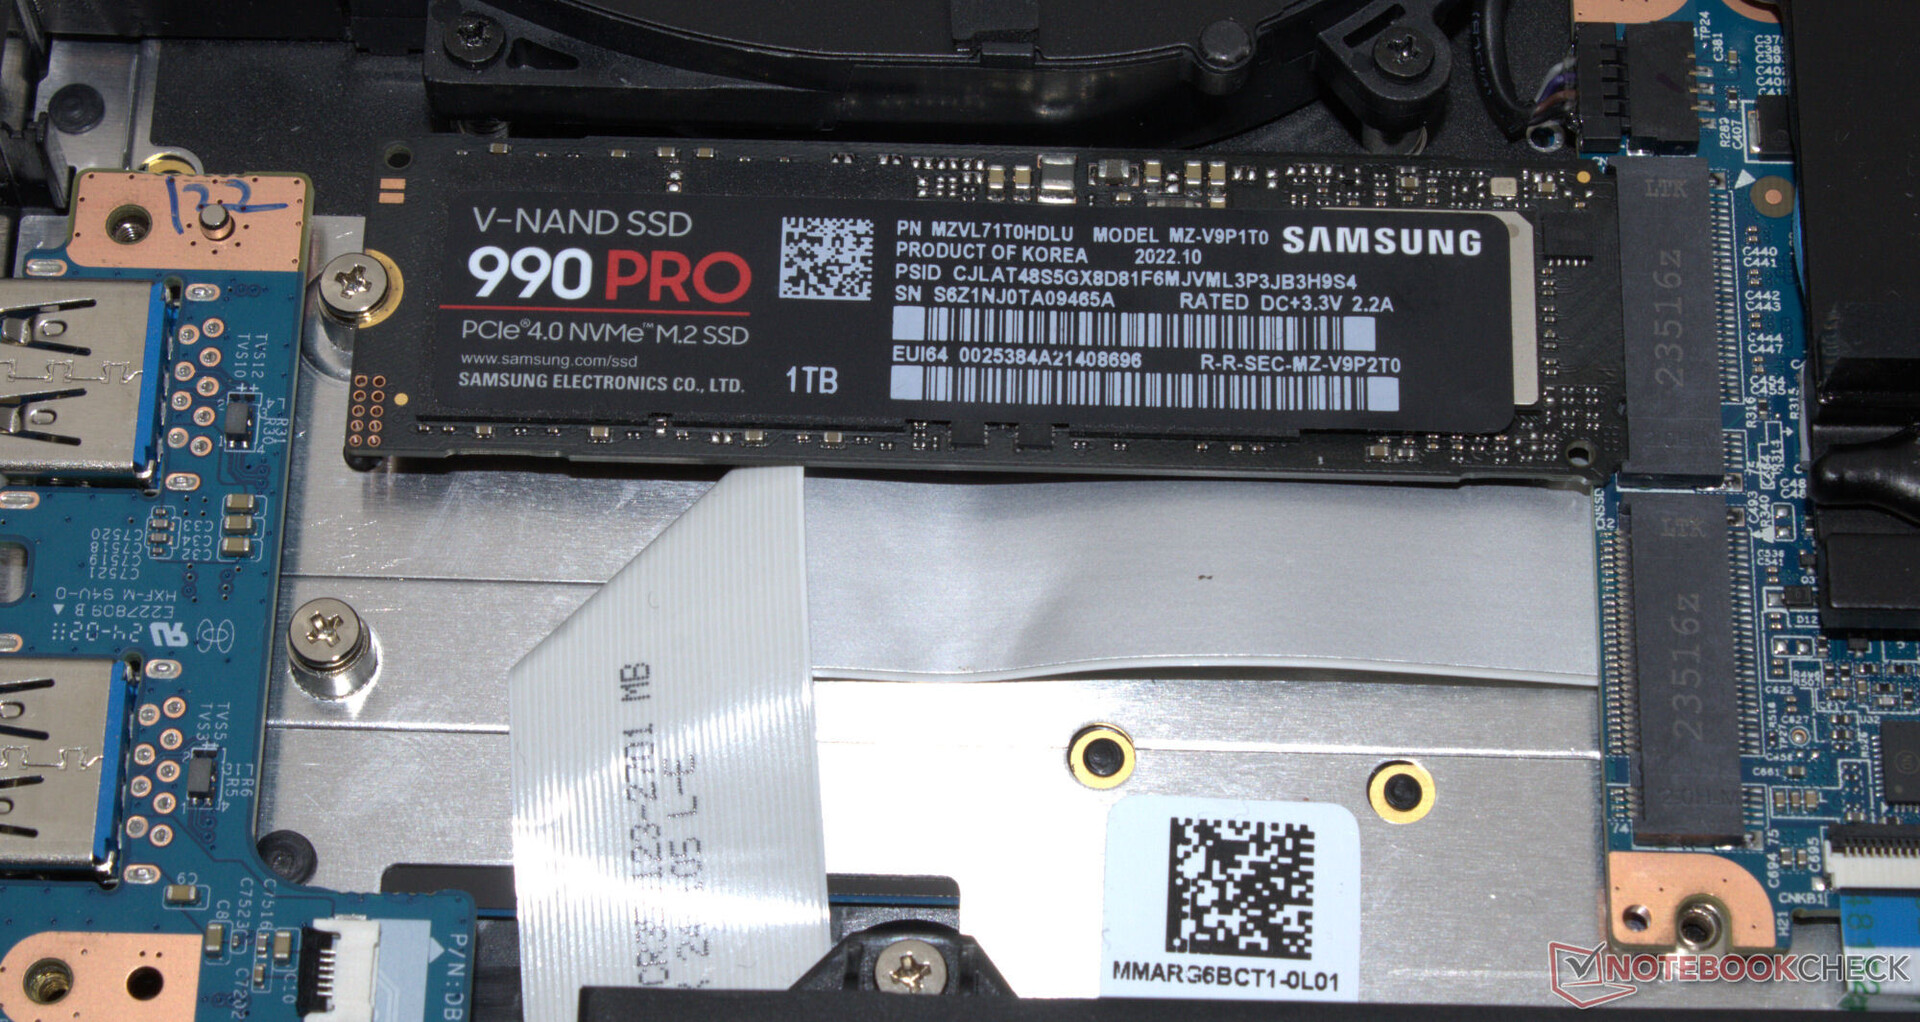
Dopo aver rimosso tutte le viti sulla base del dispositivo, il coperchio della base può essere separato con l'aiuto di un plettro o di una spatola piatta. In questo modo è possibile accedere ai banchi di RAM (entrambi sono occupati), alle ventole e alla batteria. L'SSD e gli slot SSD (PCIe 4, M.2 2280) e il modulo Wi-Fi sono coperti da ulteriori piastre avvitate.

Garanzia
Nell'UE, Schenker offre una garanzia di base di due anni che include un servizio di ritiro e un servizio di riparazione rapida di 6 mesi (riparazioni entro 48 ore). Una garanzia di 36 mesi le costerà tra i 100 e i 160 dollari, a seconda del periodo di riparazione rapida selezionato.
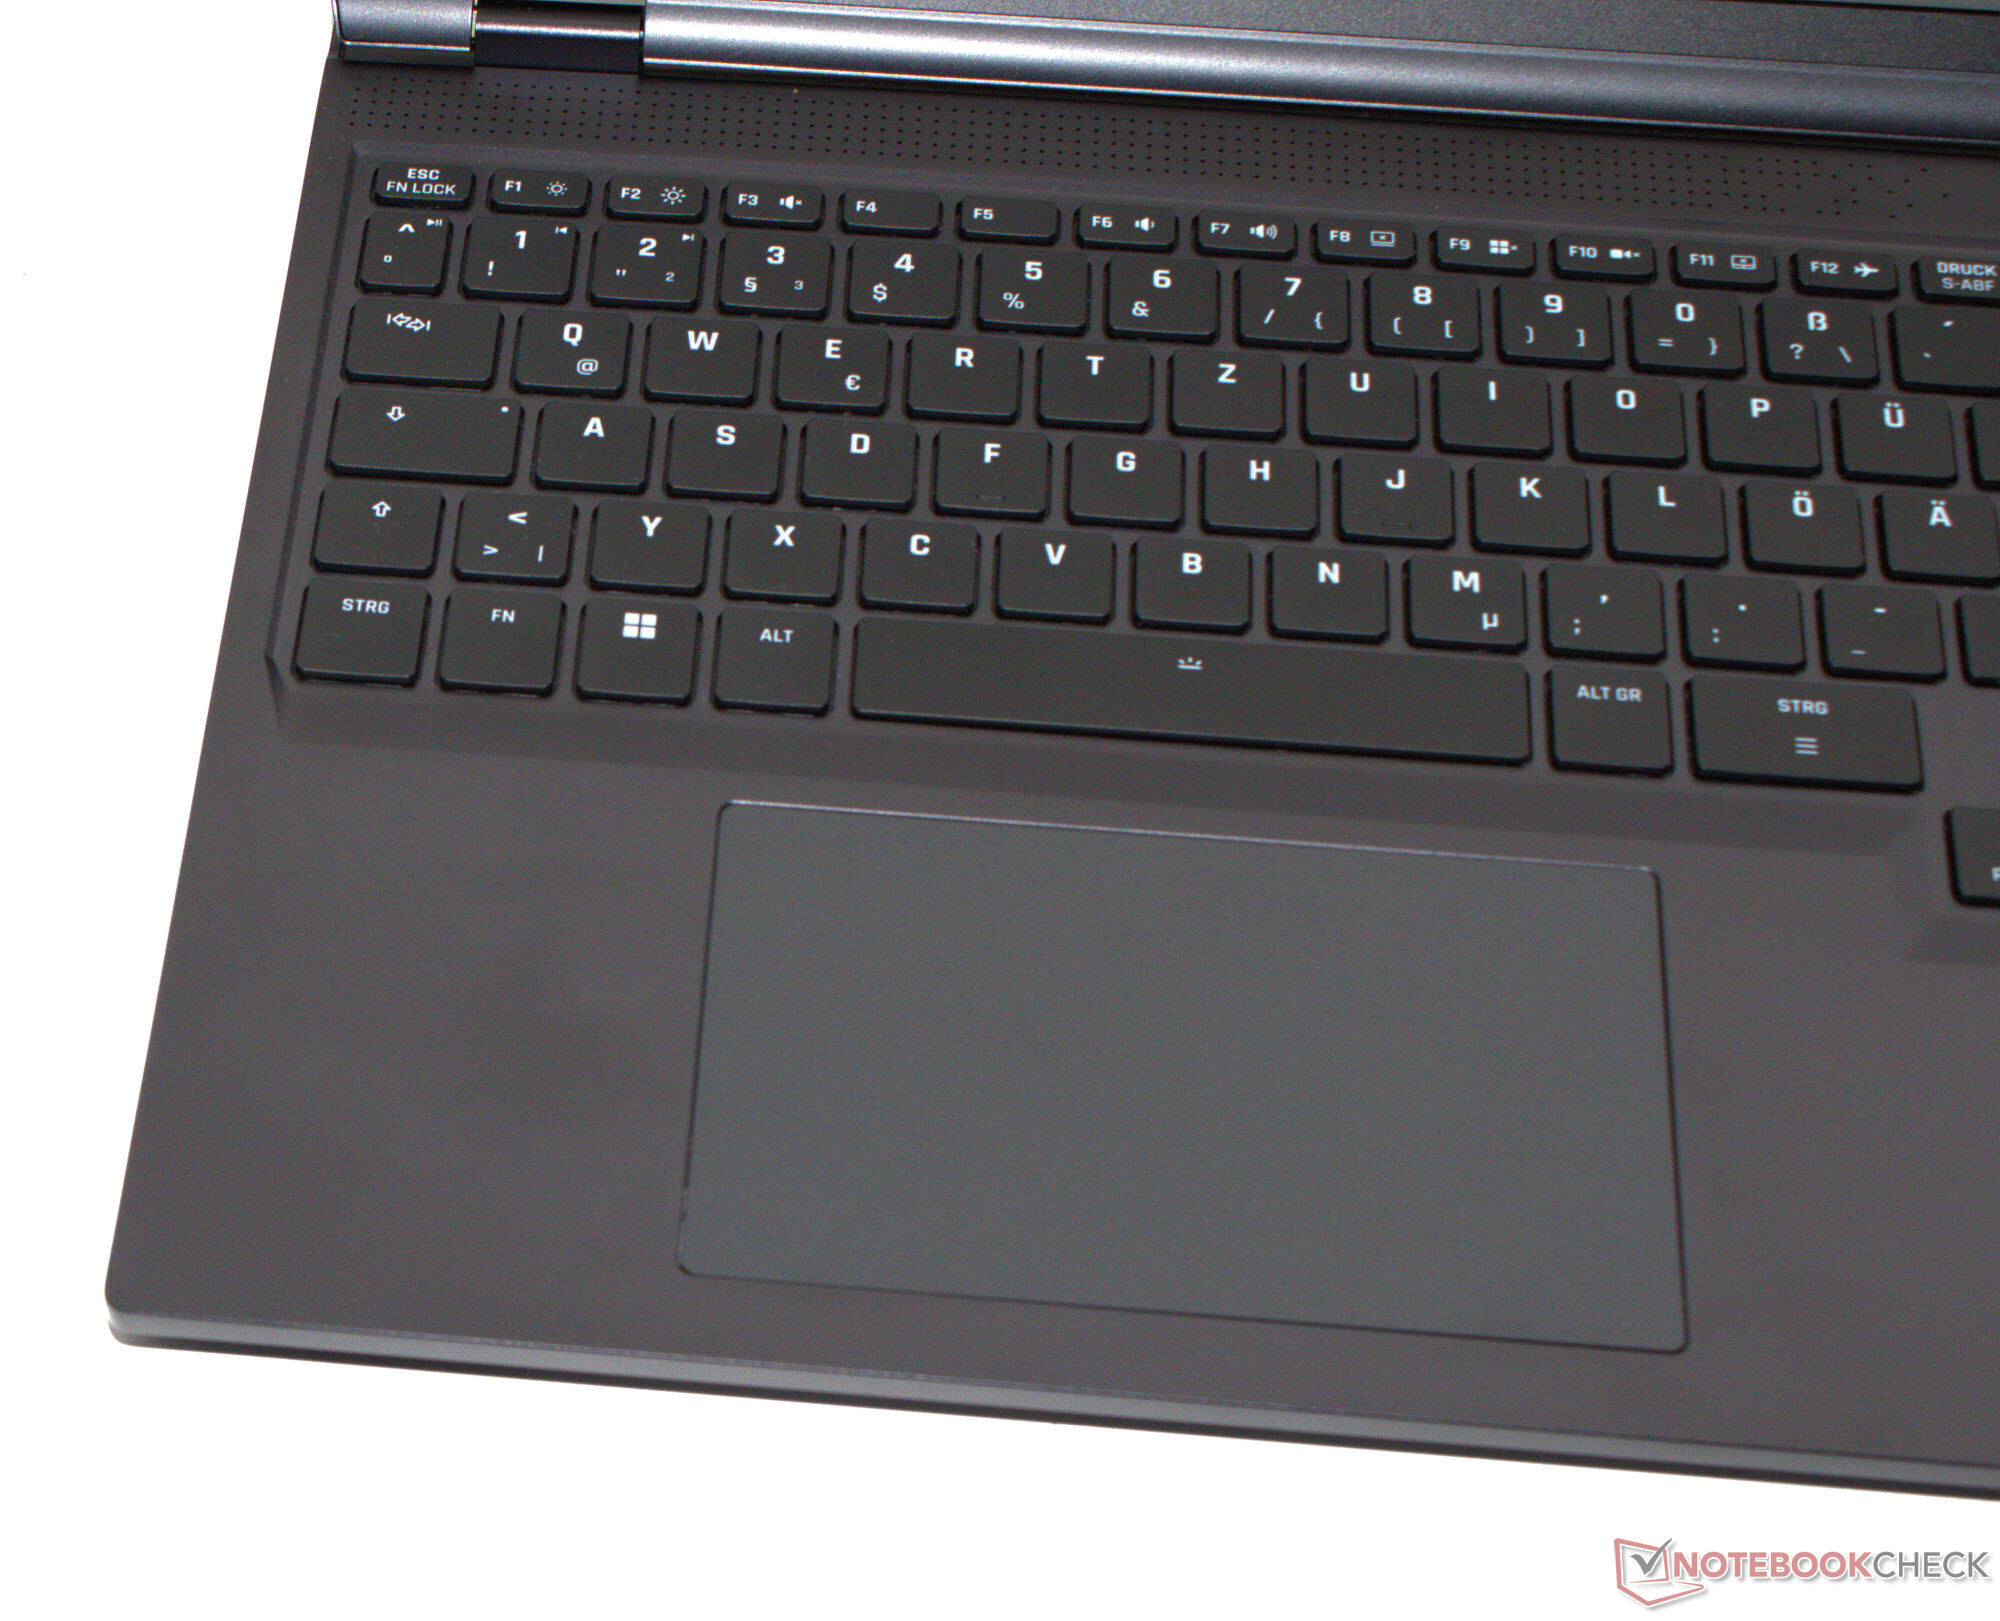
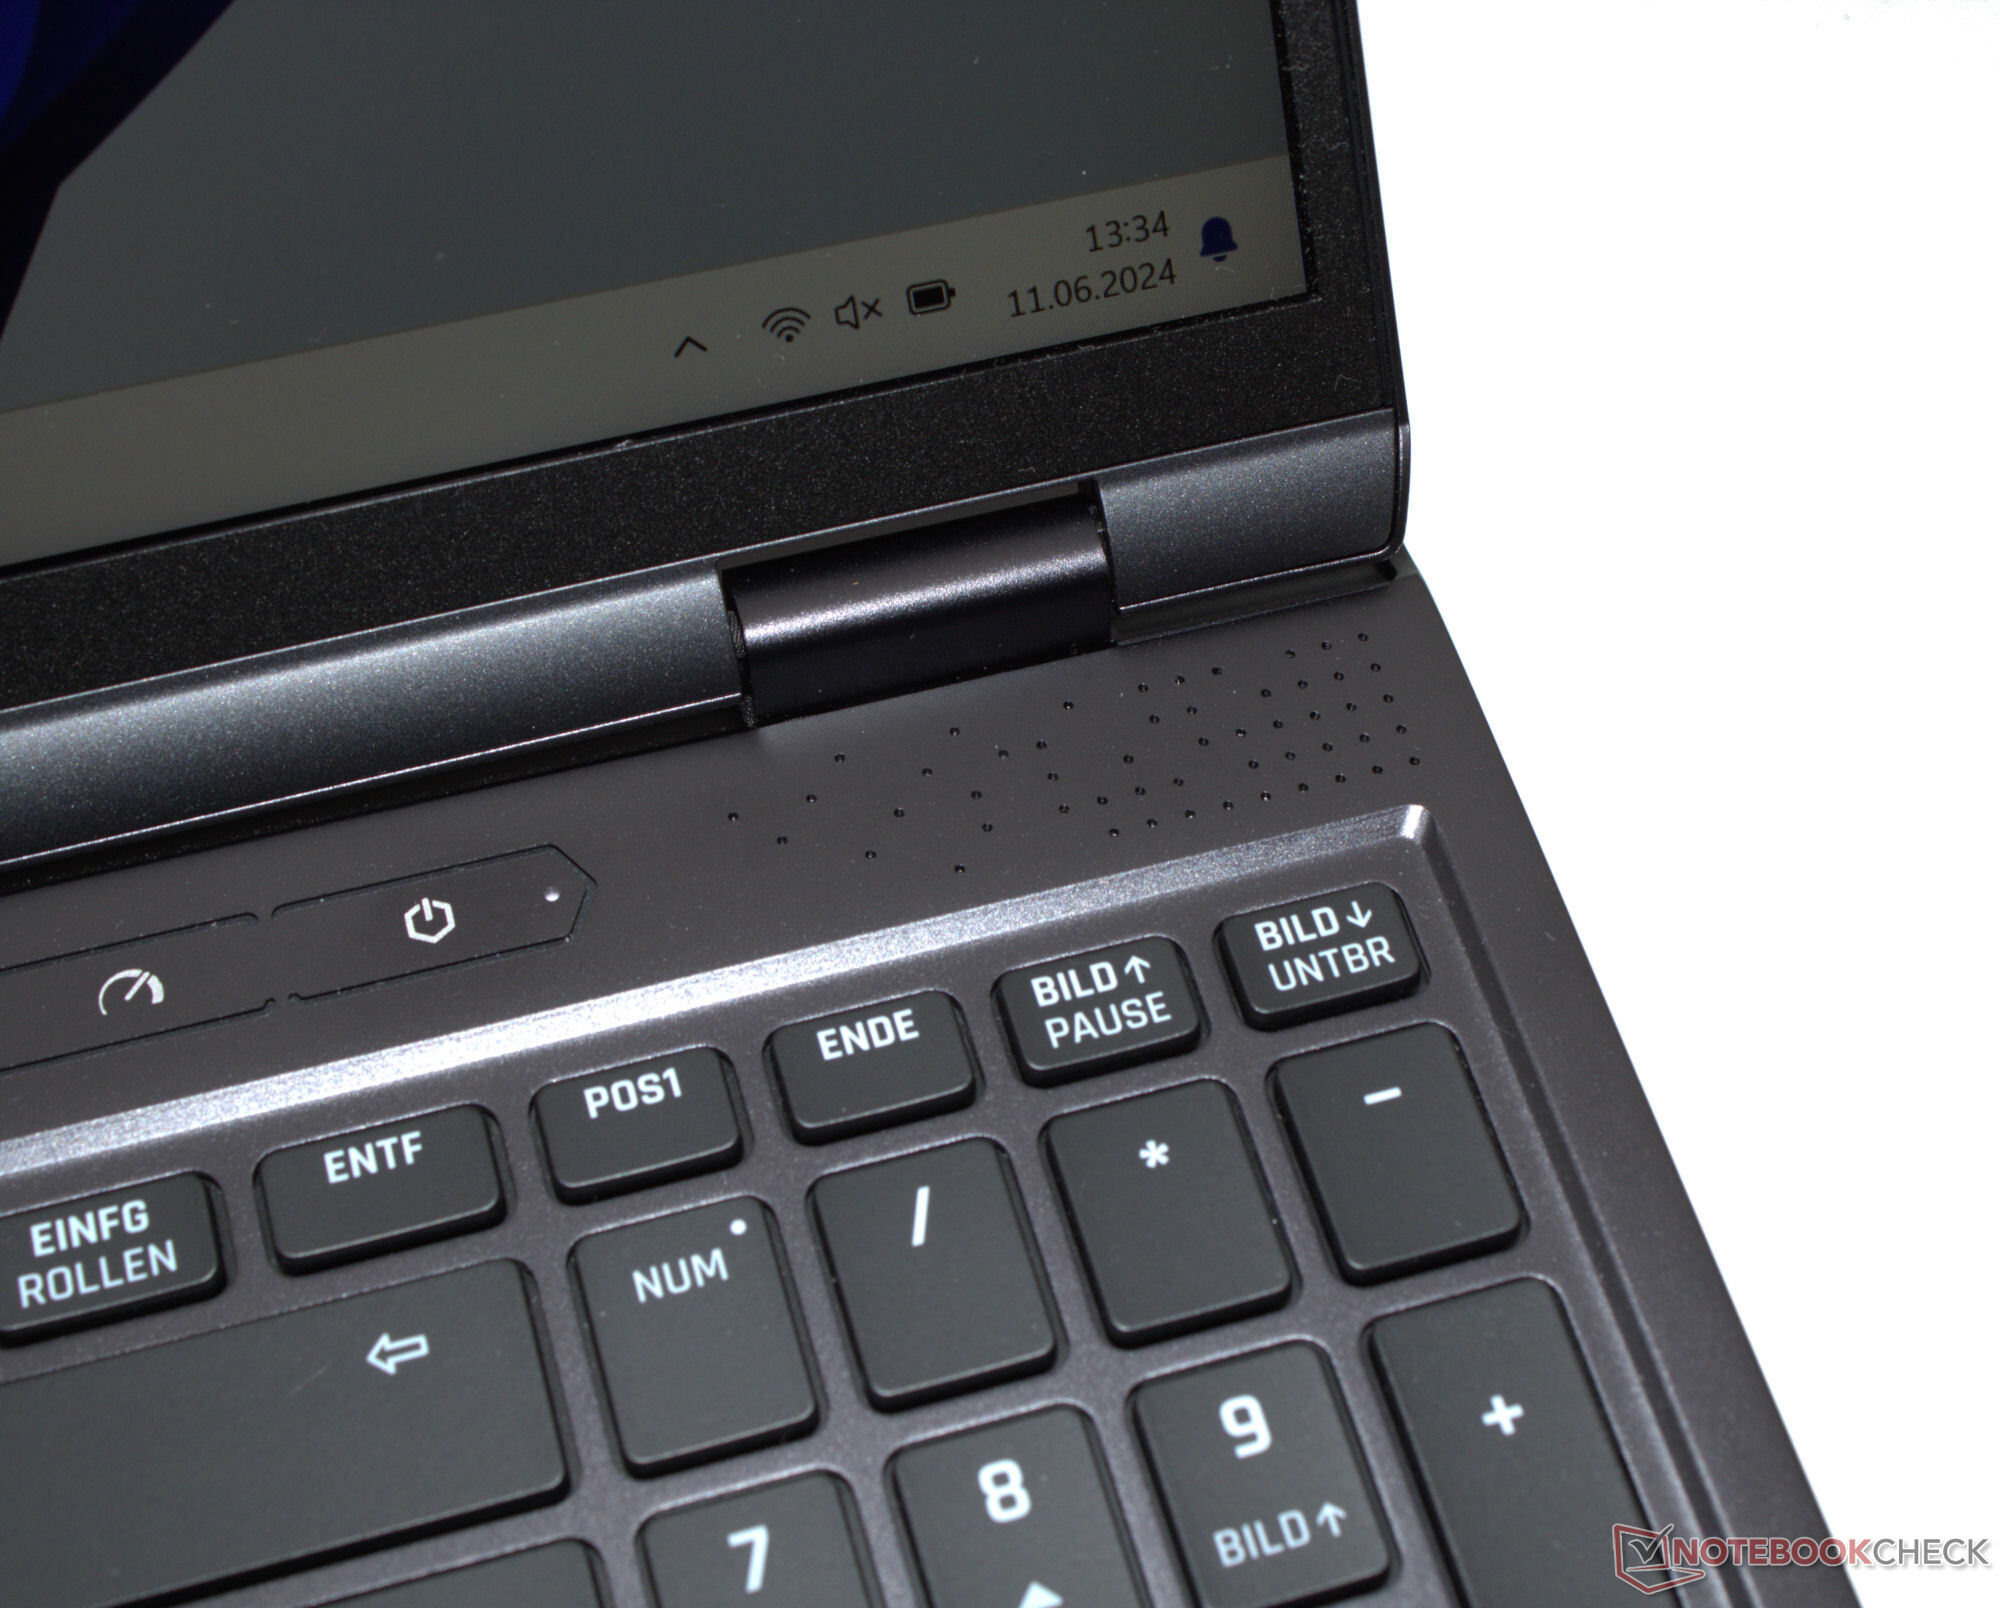
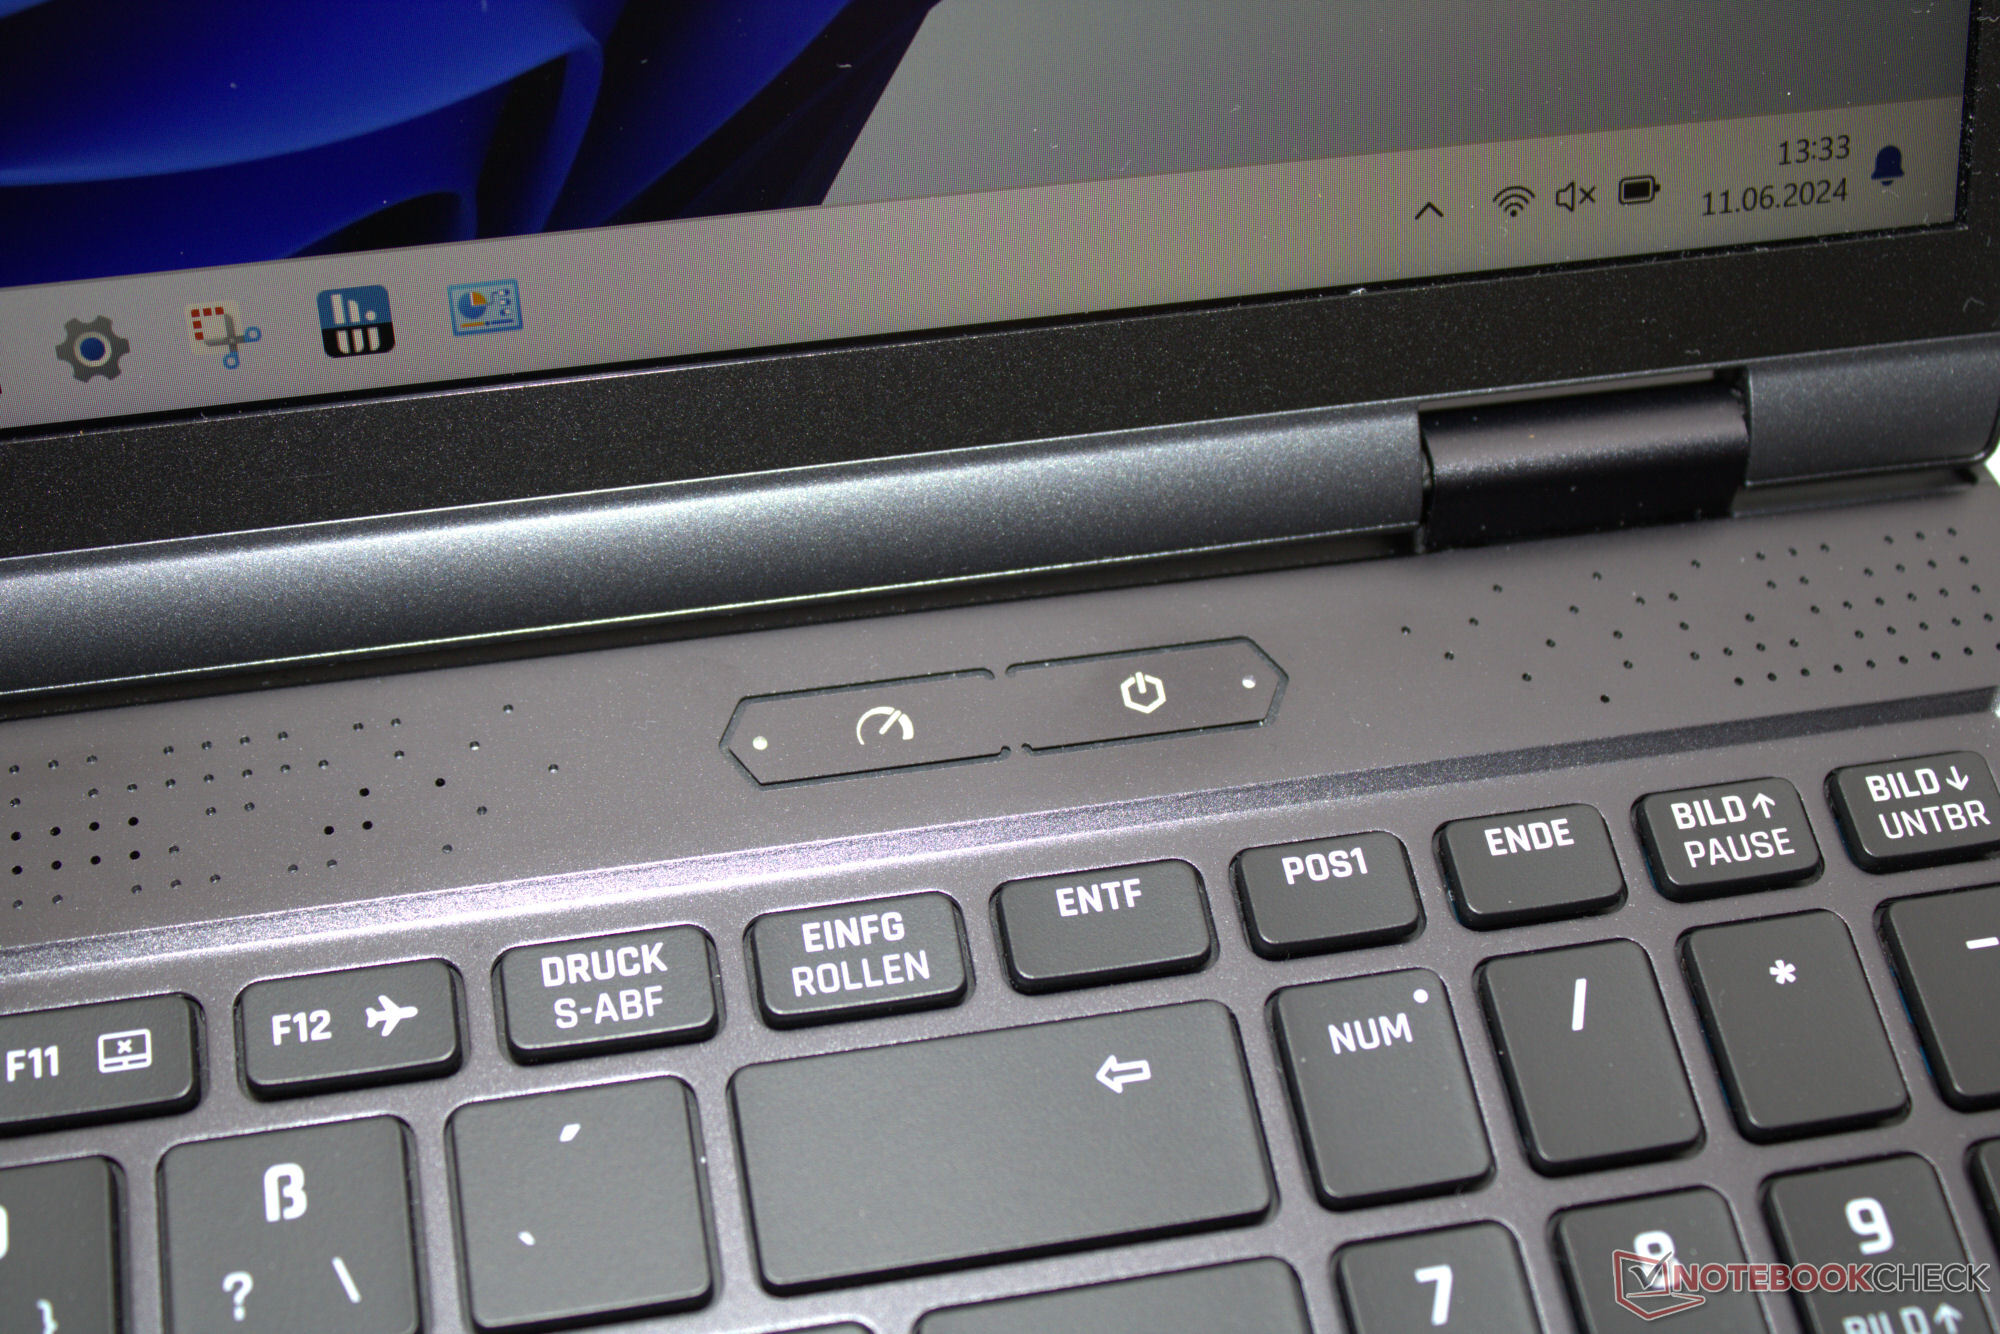
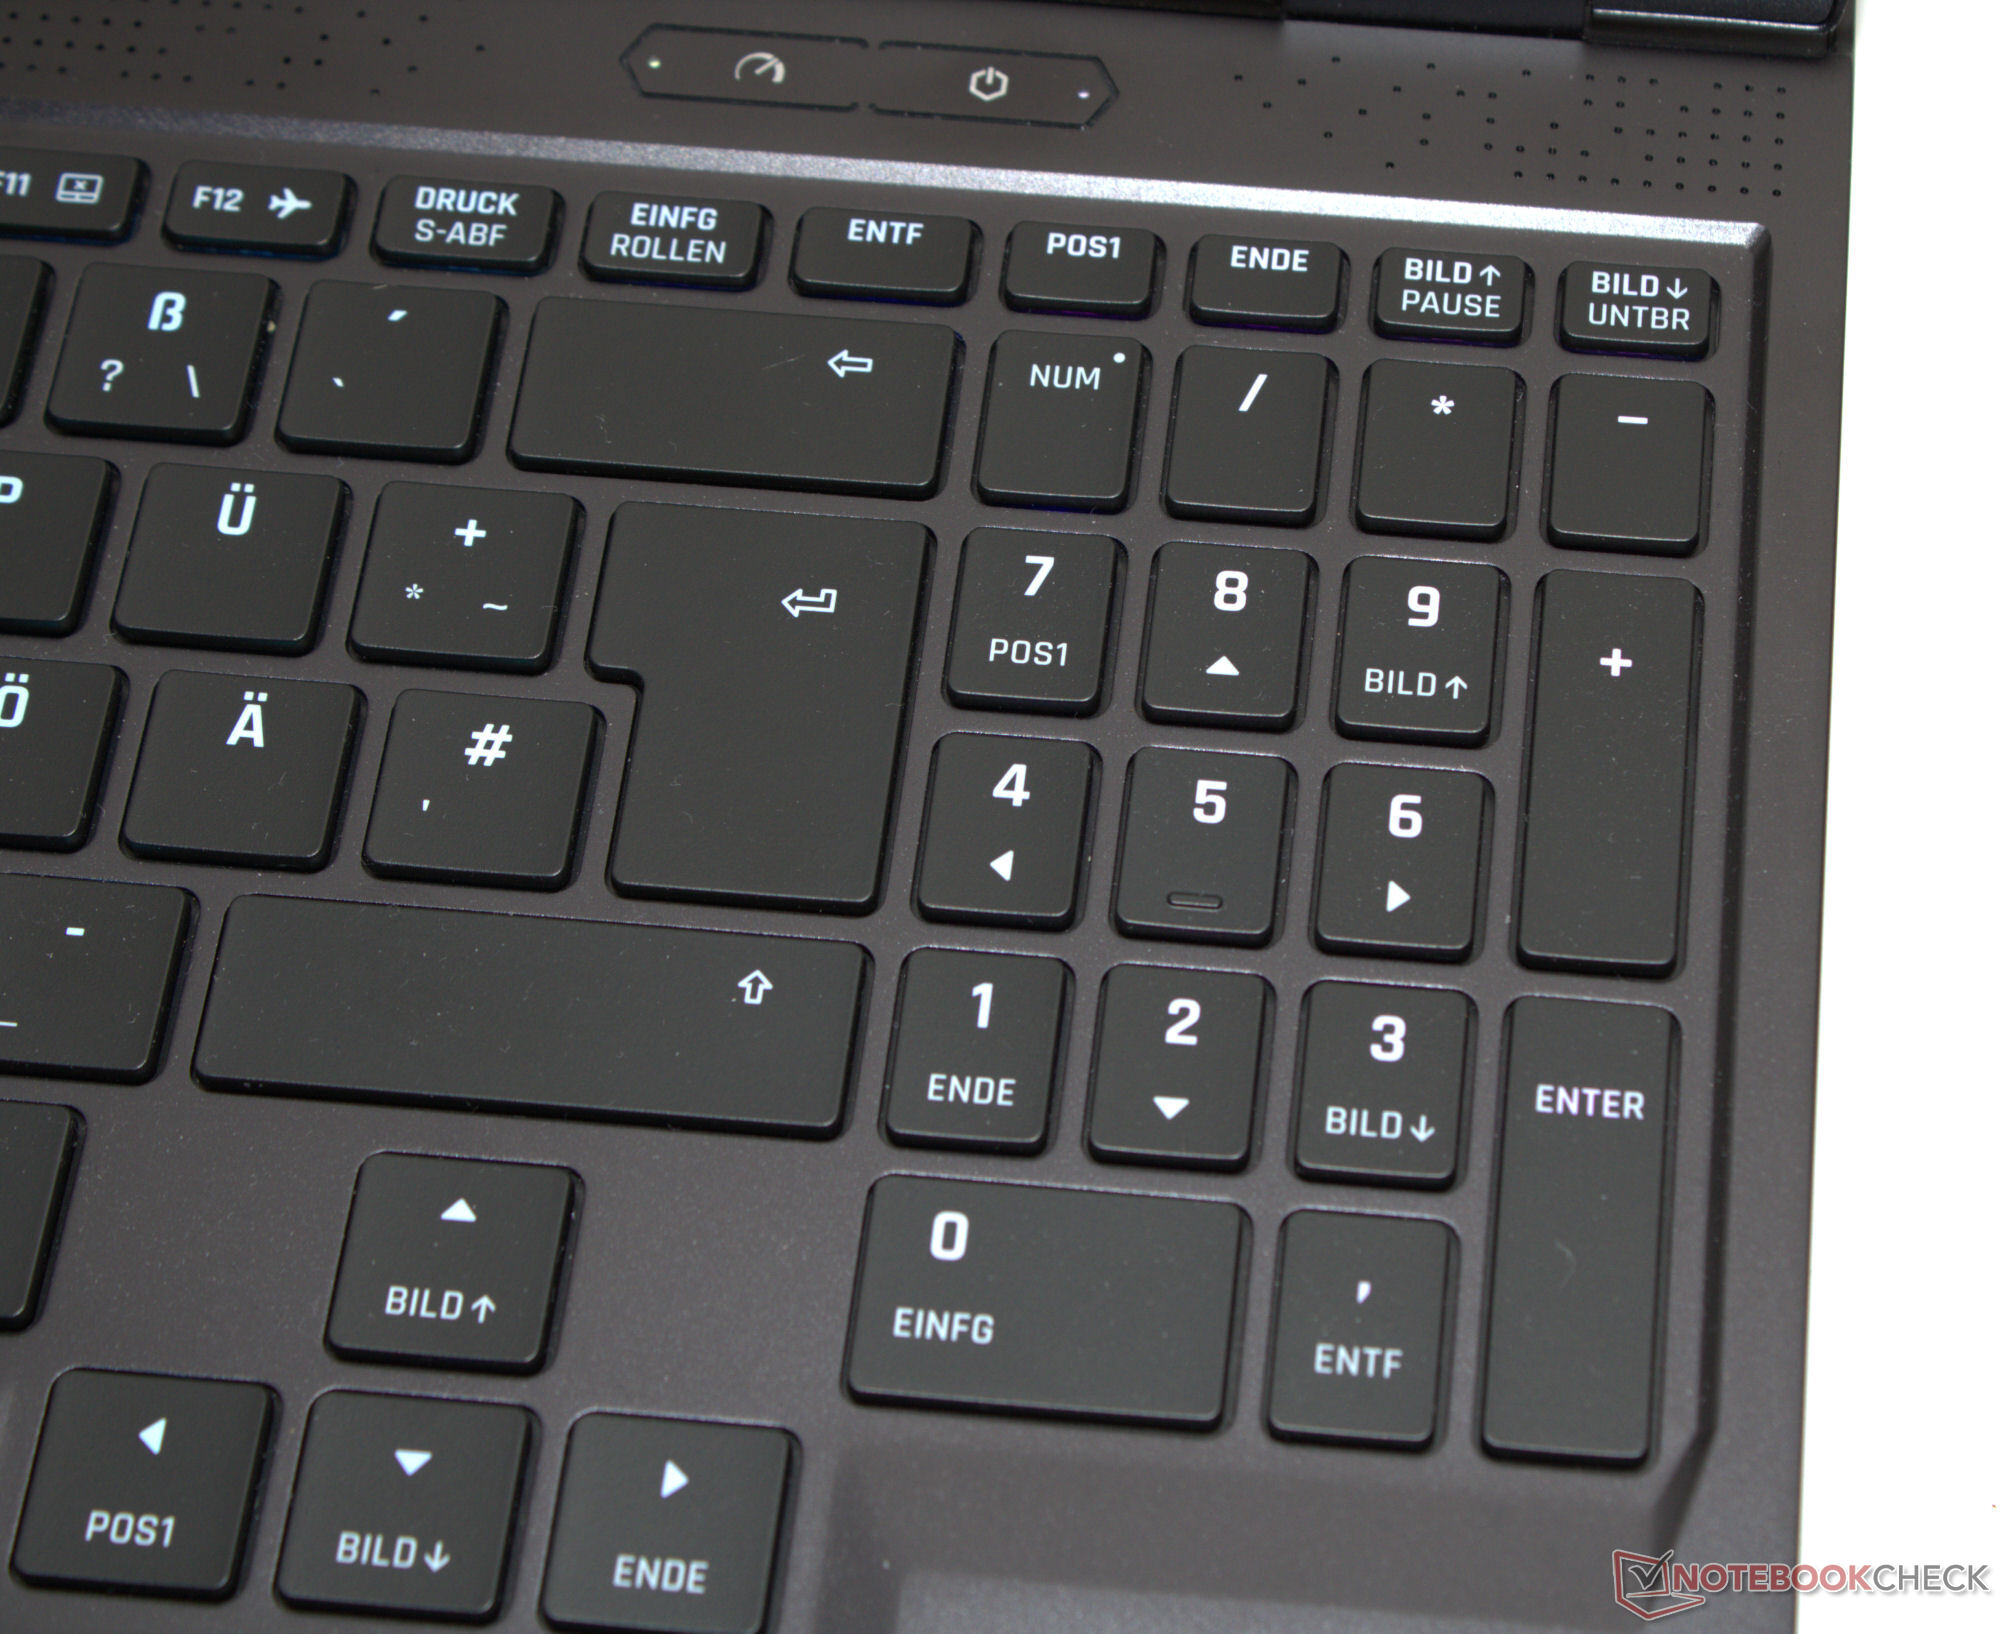
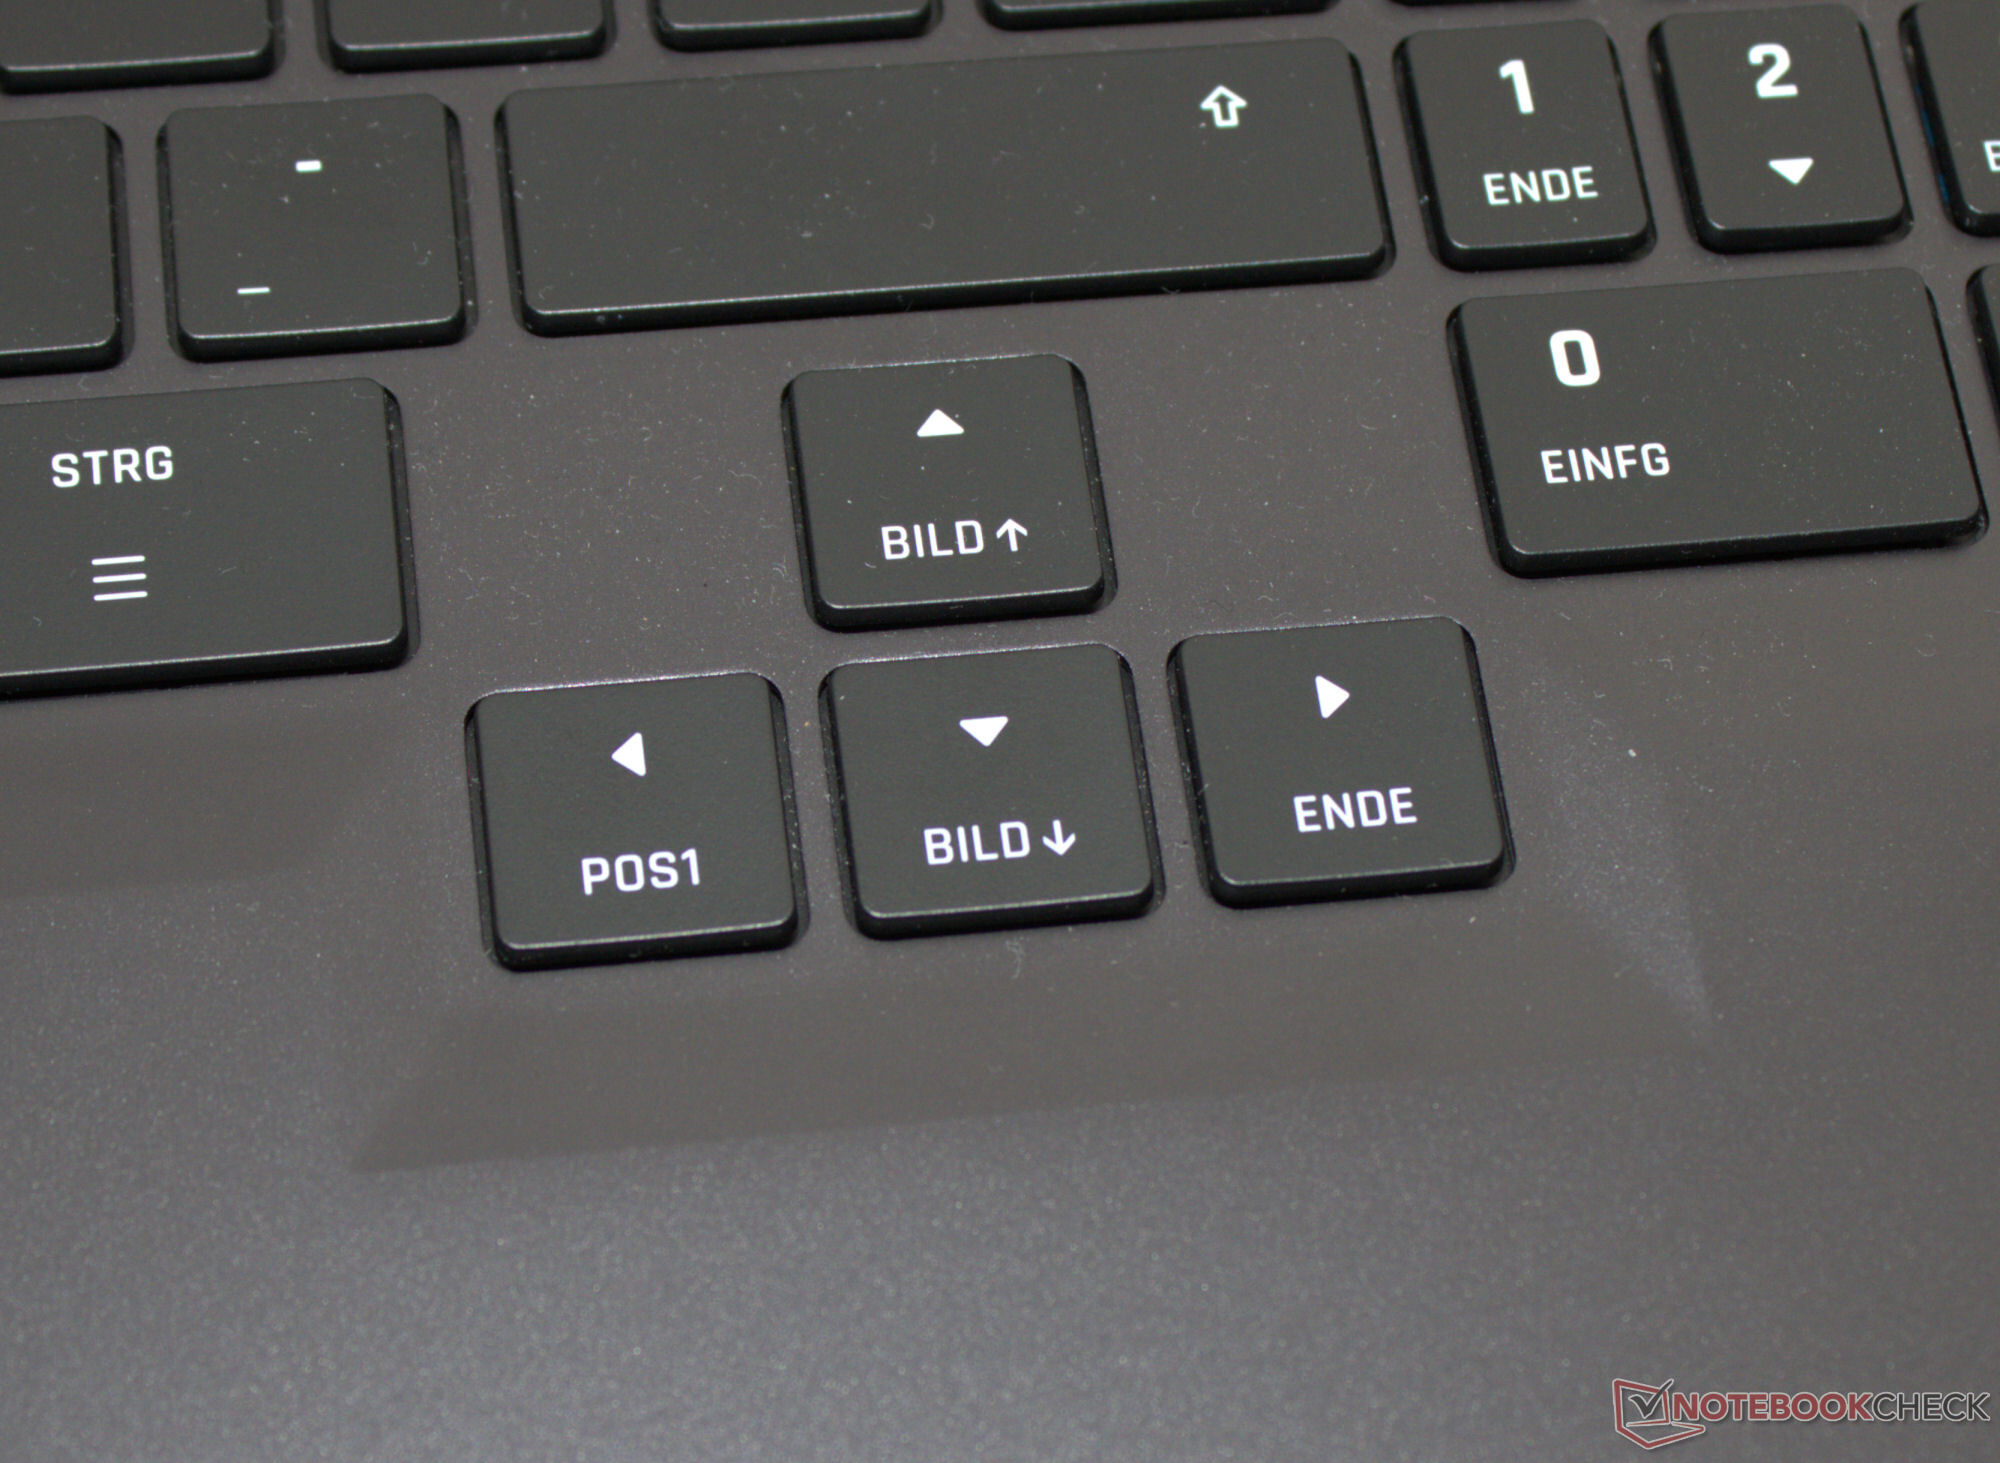
Dispositivi di input - Una tastiera con illuminazione individuale dei tasti
Tastiera
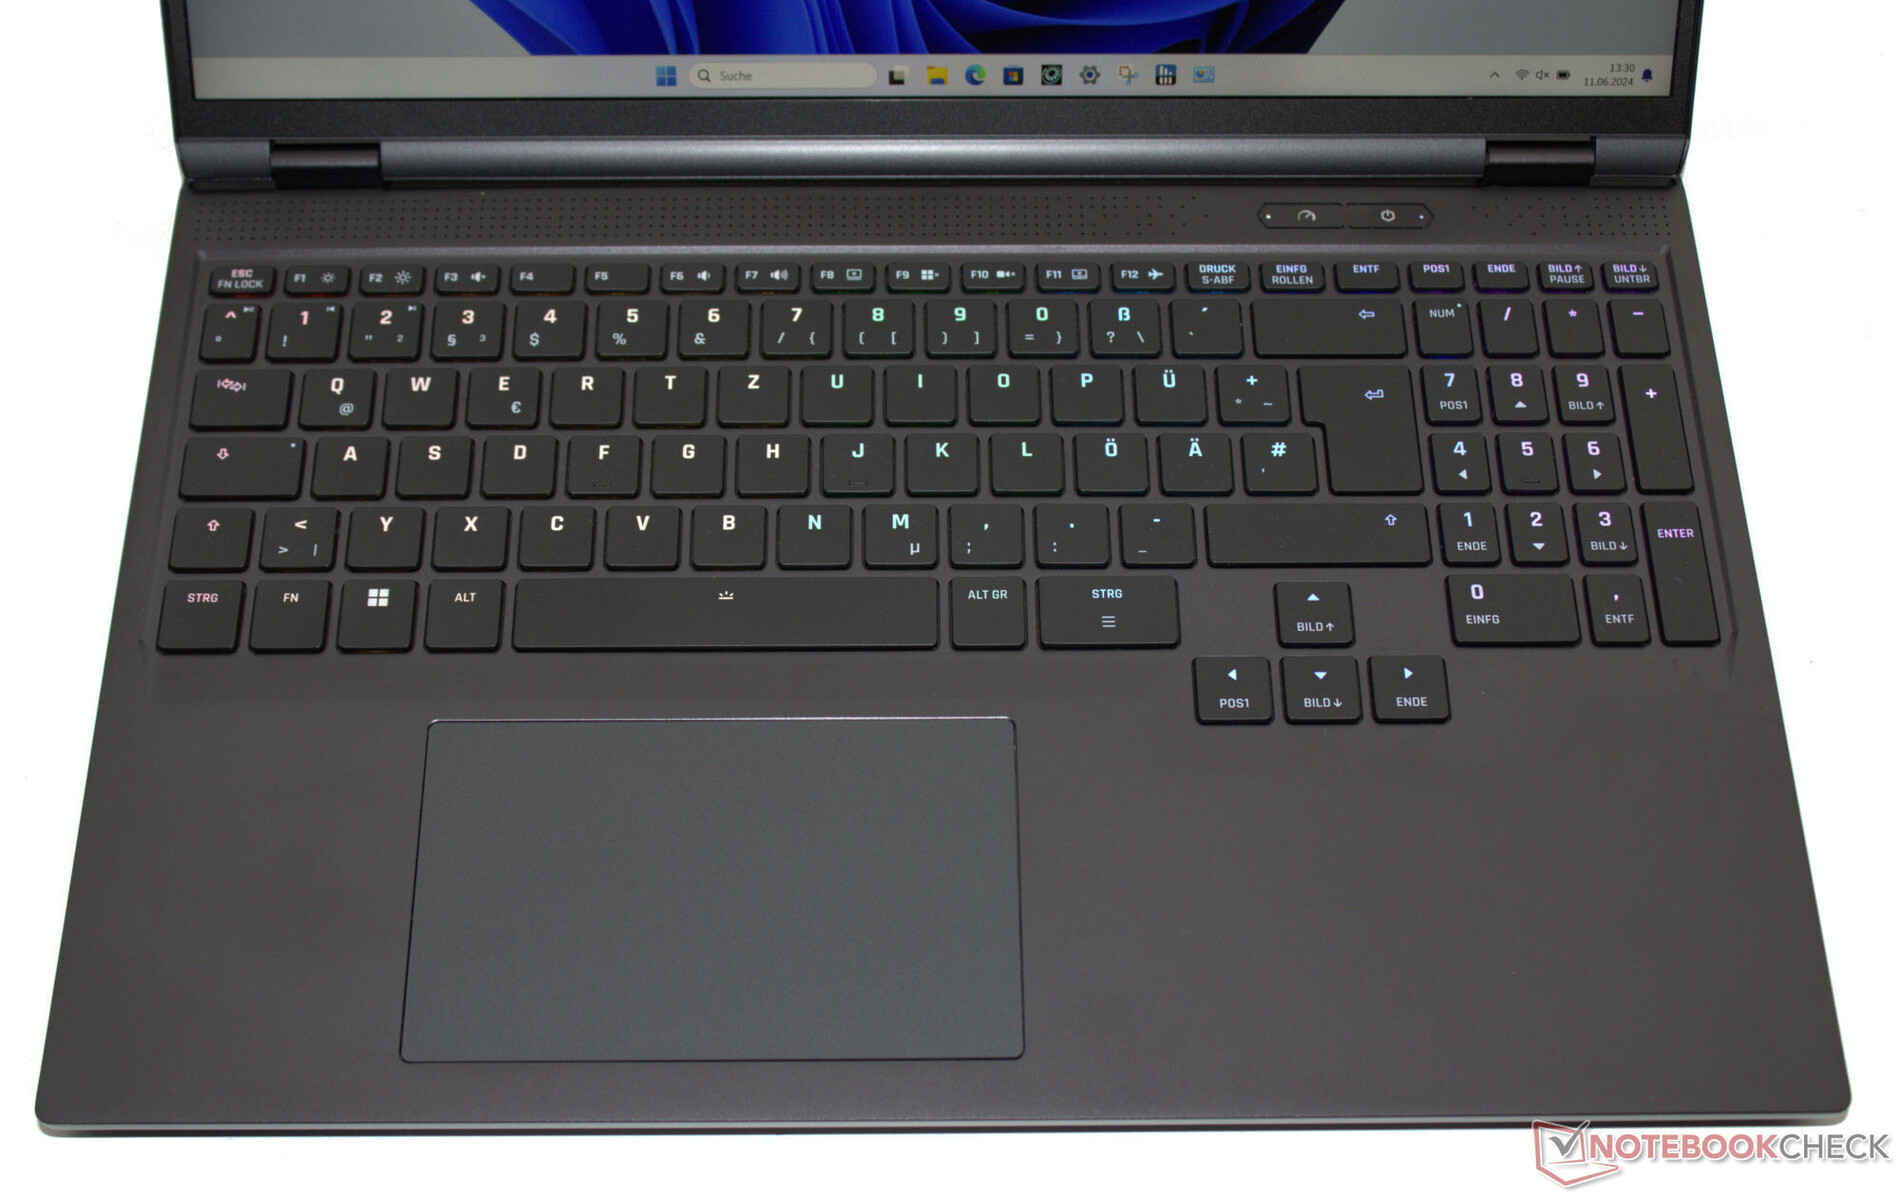
In precedenza era possibile ordinare il Neo 16 dello scorso anno con una tastiera meccanica opzionale, ma il modello attuale ha solo una tastiera chiclet. La tastiera copre l'intera larghezza del portatile e sono presenti anche un tastierino numerico e un'illuminazione individuale dei tasti (RGB). I tasti concavi e curvi offrono una corsa media, un punto di pressione ben definito e una resistenza molto piacevole. La tastiera non si flette durante la digitazione. Ciò che si nota è quanto siano comodi da usare i tasti freccia decentrati e di dimensioni standard, un miglioramento rispetto al modello dello scorso anno.
Touchpad
Un'alternativa al mouse è rappresentata da un clickpad multitouch (circa 12,3 x 7,7 cm), le cui superfici lisce consentono di eseguire gesti di scorrimento con la massima facilità. Offre una corsa breve e un punto di pressione ben definito.
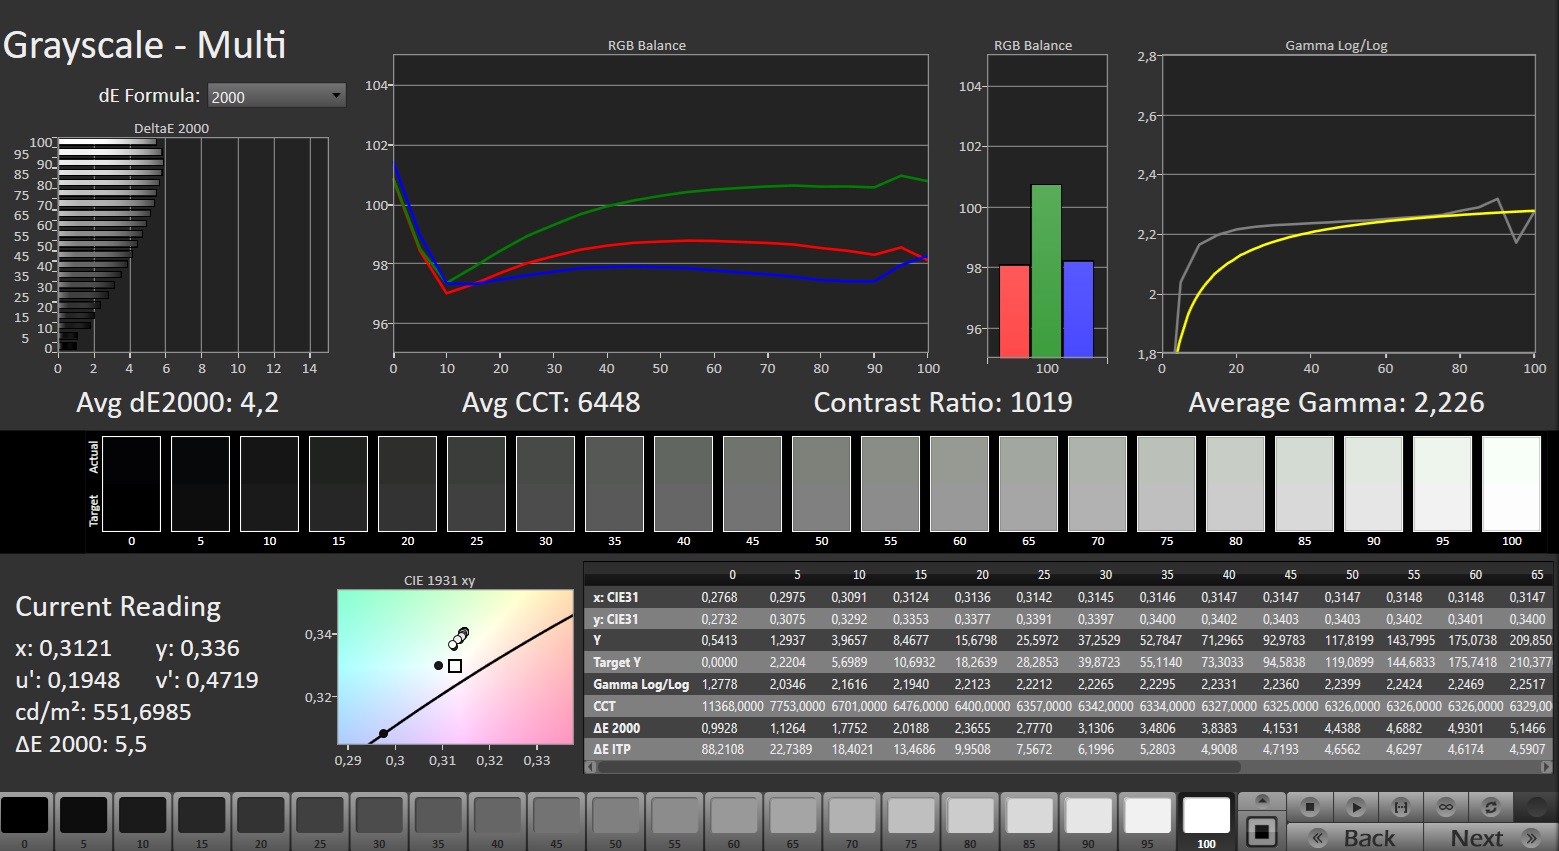
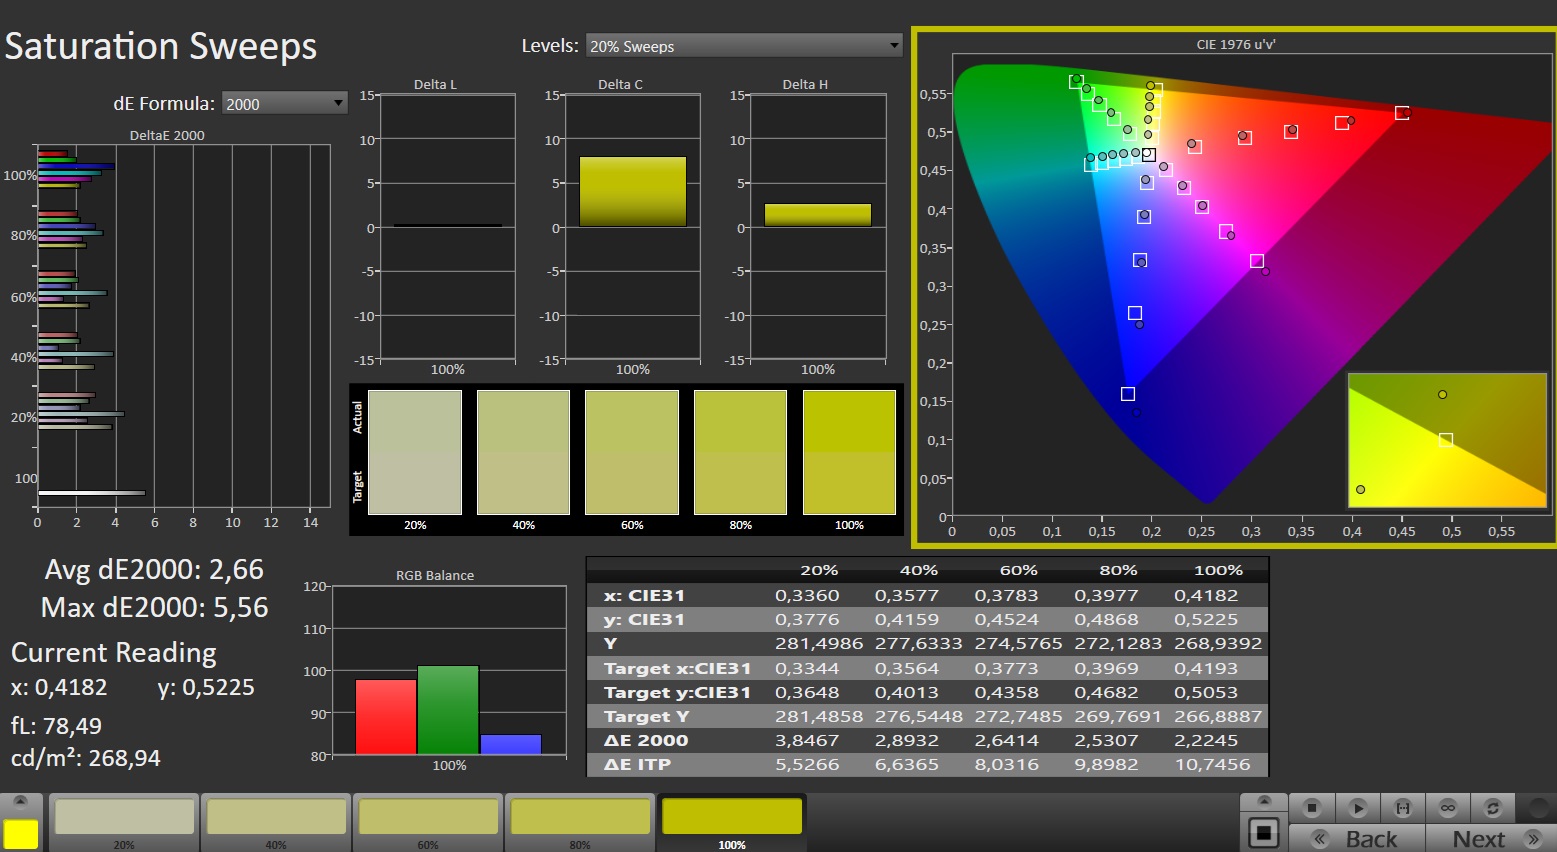
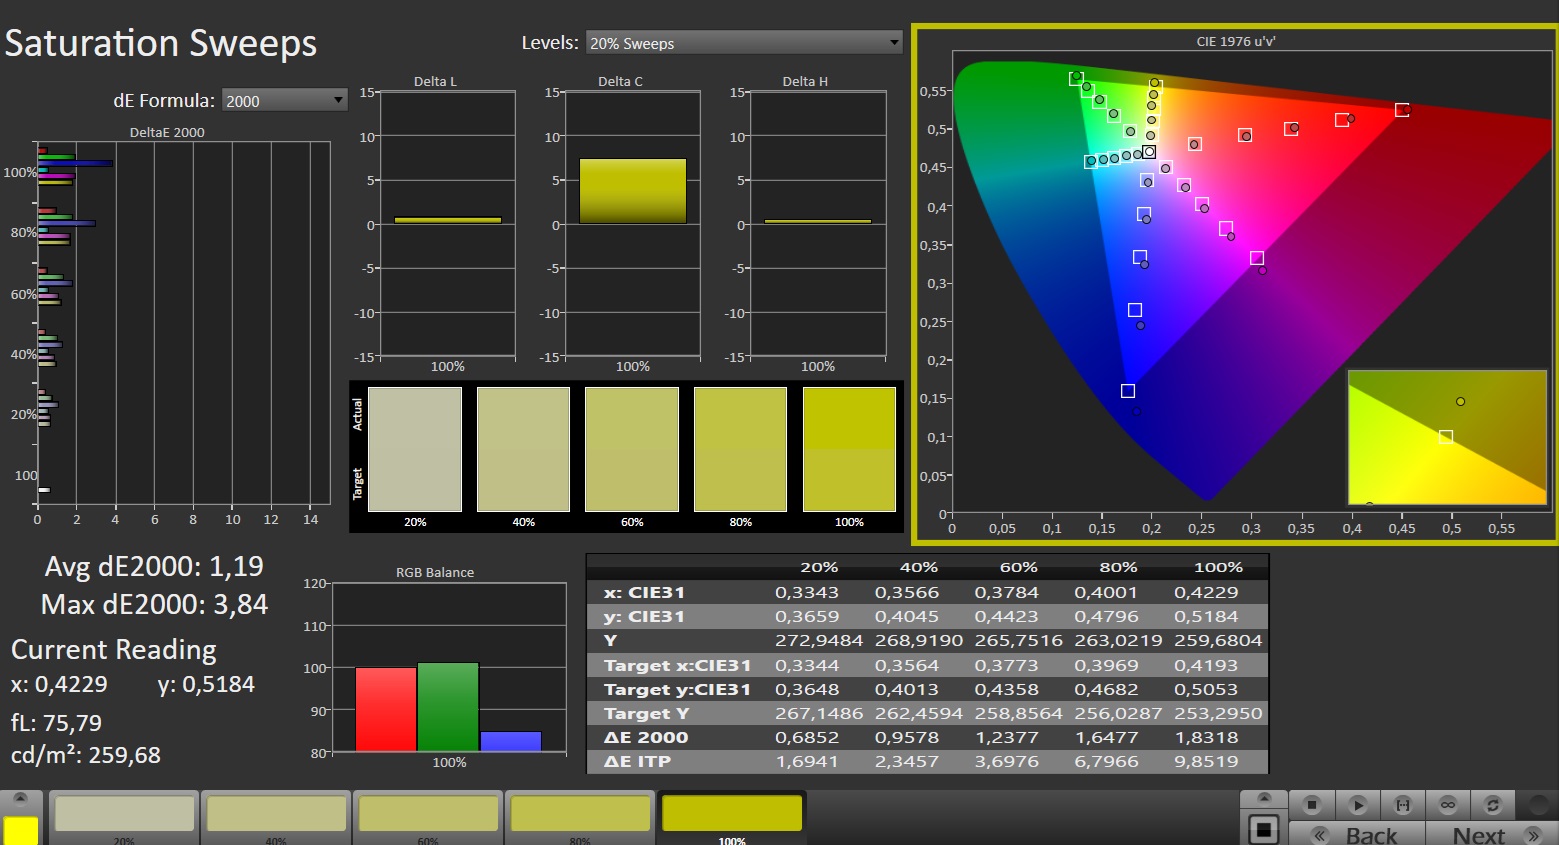
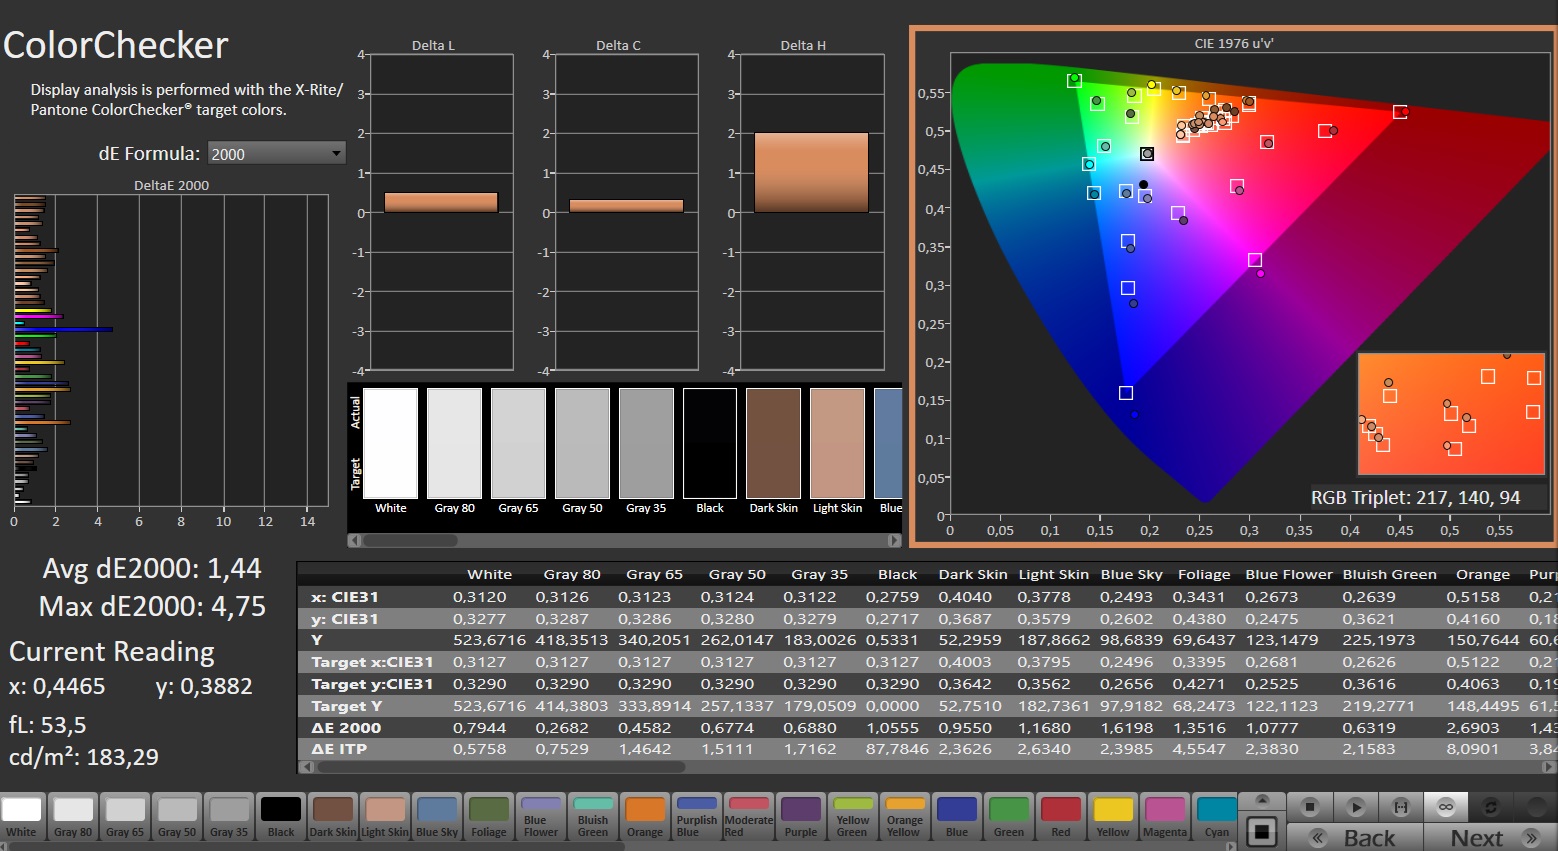
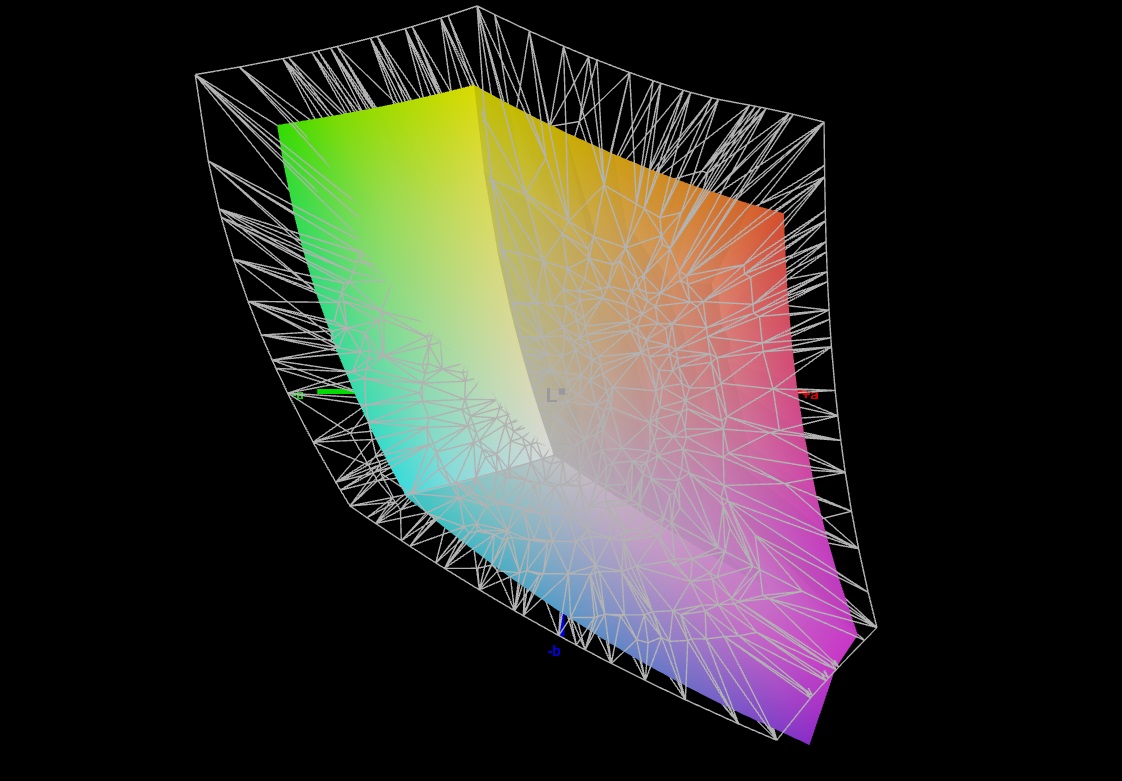
Display - Schenker ha optato per un luminoso pannello IPS
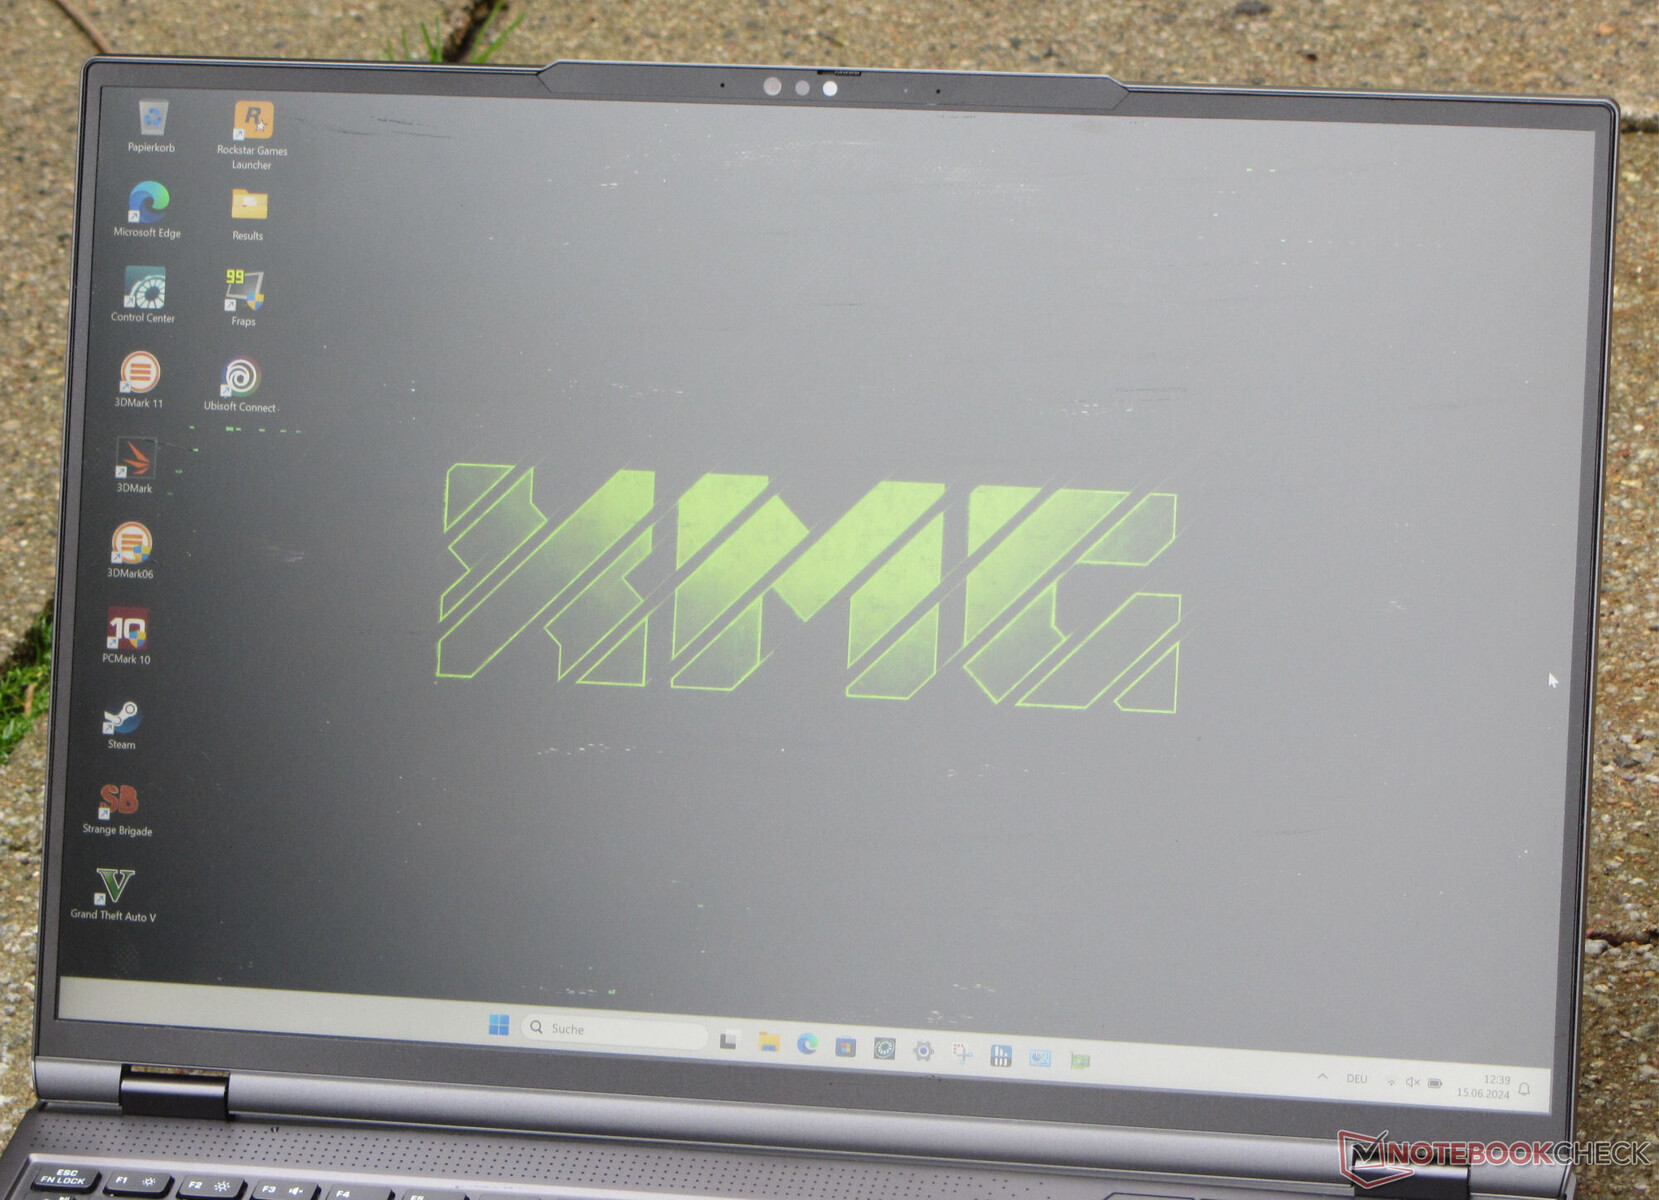
Il display da 16 pollici installato (2.560 x 1.600 pixel) non manca di nulla in termini di luminosità (~ 500 cd/m²), ma il contrasto (1.000:1) potrebbe essere superiore. Per quanto riguarda quest'area, il Blade 16 OLED del Blade 16 offre un pacchetto complessivo migliore: grazie al suo design, offre valori di nero e contrasto meravigliosi. In generale, i valori raggiunti dal Neo 16 sono più che sufficienti per poter utilizzare il dispositivo in ambienti chiusi. All'esterno, il display è leggibile, a condizione che il sole non sia troppo forte. Alcuni aspetti positivi sono che il pannello 16:10, 240 Hz (IPS, G-Sync), altamente reattivo e stabile sull'angolo di visione, non mostra alcun segno di sfarfallio PWM, indipendentemente dall'impostazione della luminosità. Non sono disponibili opzioni di visualizzazione alternative.

| |||||||||||||||||||||||||
Distribuzione della luminosità: 85 %
Al centro con la batteria: 530 cd/m²
Contrasto: 1000:1 (Nero: 0.53 cd/m²)
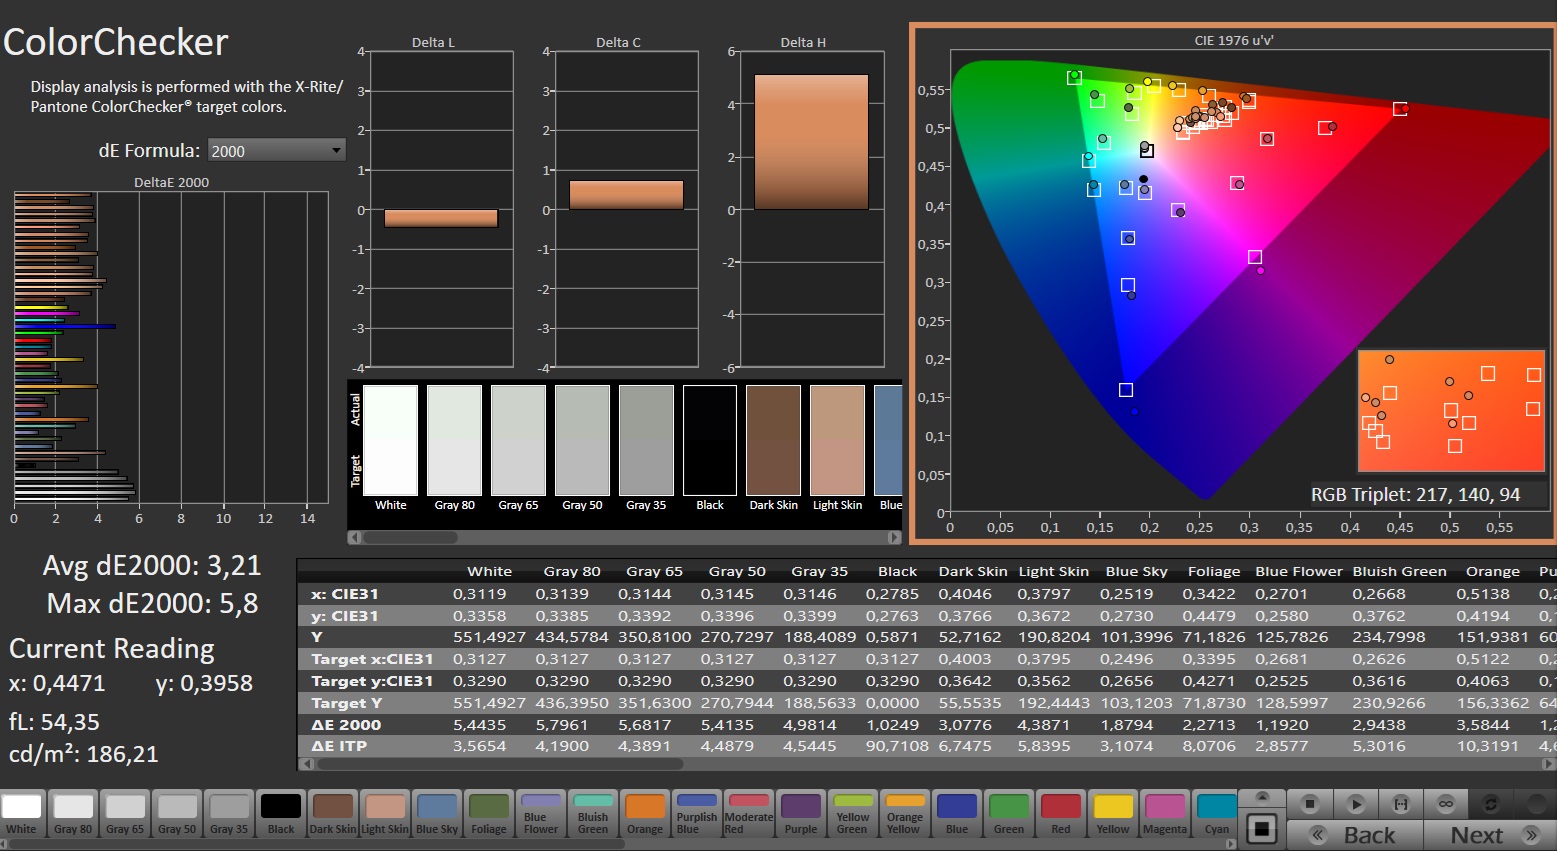
ΔE Color 3.21 | 0.5-29.43 Ø4.99, calibrated: 1.44
ΔE Greyscale 4.2 | 0.57-98 Ø5.2
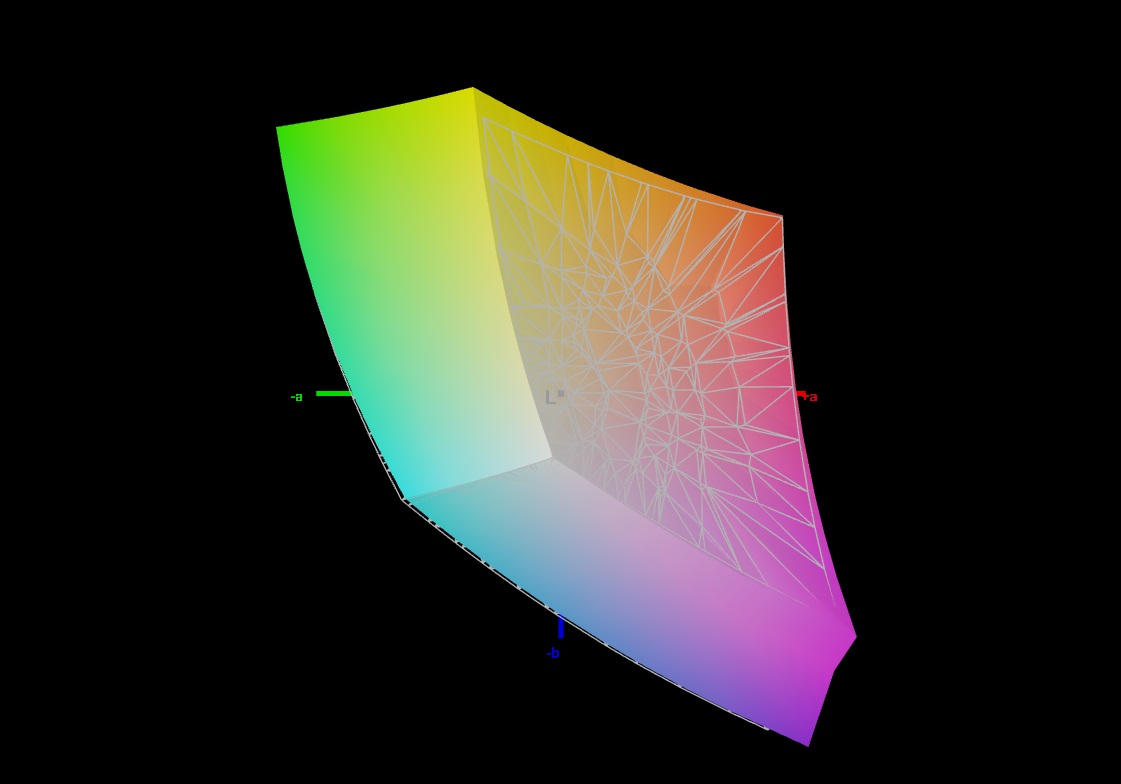
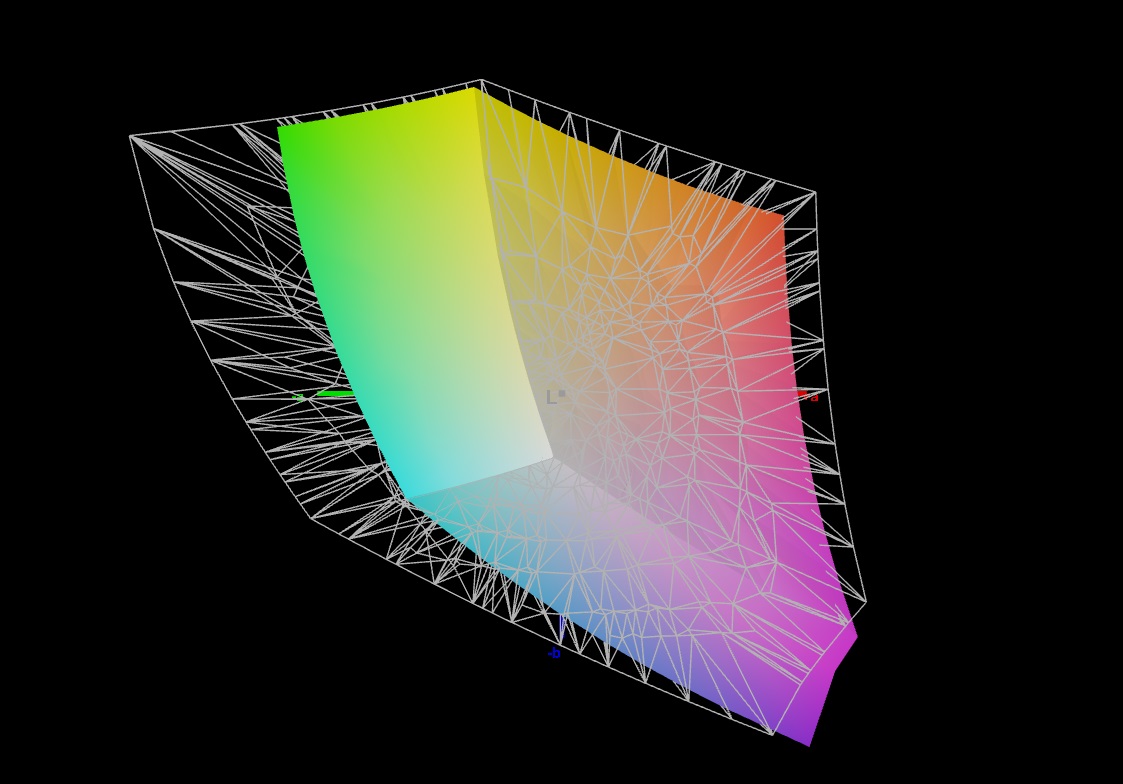
70.6% AdobeRGB 1998 (Argyll 2.2.0 3D)
98% sRGB (Argyll 2.2.0 3D)
70.2% Display P3 (Argyll 2.2.0 3D)
Gamma: 2.226
| SCHENKER XMG Neo 16 (Early 24) BOE NE160QDM-NZA, IPS, 2560x1600, 16.00 | Razer Blade 16 2024, RTX 4090 Samsung SDC41AB (ATNA60DL03-0), OLED, 2560x1600, 16.00 | Medion Erazer Beast X40 2024 BOE NE170QDM-NZ1, IPS, 2560x1600, 17.00 | SCHENKER XMG Neo 16 E23 BOE0AF0 NE160QDM-NZ1, IPS, 2560x1600, 16.00 | |
|---|---|---|---|---|
| Display | 26% | -1% | -2% | |
| Display P3 Coverage | 70.2 | 99.1 41% | 68.1 -3% | 67.3 -4% |
| sRGB Coverage | 98 | 99.9 2% | 99.5 2% | 96.7 -1% |
| AdobeRGB 1998 Coverage | 70.6 | 95.6 35% | 69 -2% | 68.9 -2% |
| Response Times | 95% | -20% | -49% | |
| Response Time Grey 50% / Grey 80% * | 11.2 ? | 0.24 ? 98% | 11.7 ? -4% | 14.5 ? -29% |
| Response Time Black / White * | 5.1 ? | 0.4 ? 92% | 6.9 ? -35% | 8.6 ? -69% |
| PWM Frequency | 960 | |||
| Screen | 251% | 25% | 15% | |
| Brightness middle | 530 | 418 -21% | 422 -20% | 372 -30% |
| Brightness | 497 | 420 -15% | 388 -22% | 349 -30% |
| Brightness Distribution | 85 | 98 15% | 87 2% | 88 4% |
| Black Level * | 0.53 | 0.02 96% | 0.42 21% | 0.32 40% |
| Contrast | 1000 | 20900 1990% | 1005 1% | 1163 16% |
| Colorchecker dE 2000 * | 3.21 | 1.07 67% | 1.42 56% | 2.06 36% |
| Colorchecker dE 2000 max. * | 5.8 | 4.04 30% | 1.97 66% | 3 48% |
| Colorchecker dE 2000 calibrated * | 1.44 | 1.07 26% | 0.7 51% | 1.5 -4% |
| Greyscale dE 2000 * | 4.2 | 1.12 73% | 1.2 71% | 1.9 55% |
| Gamma | 2.226 99% | 2.29 96% | 2.078 106% | 2.312 95% |
| CCT | 6448 101% | 6417 101% | 6581 99% | 6747 96% |
| Media totale (Programma / Settaggio) | 124% /
181% | 1% /
13% | -12% /
2% |
* ... Meglio usare valori piccoli
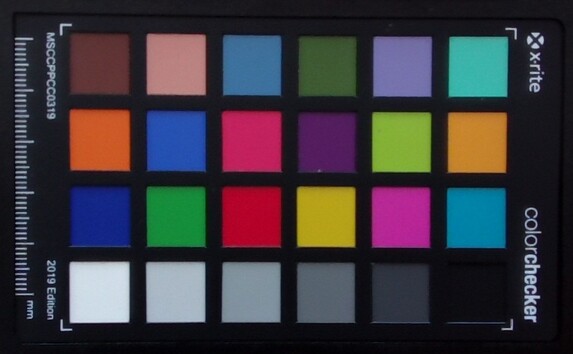
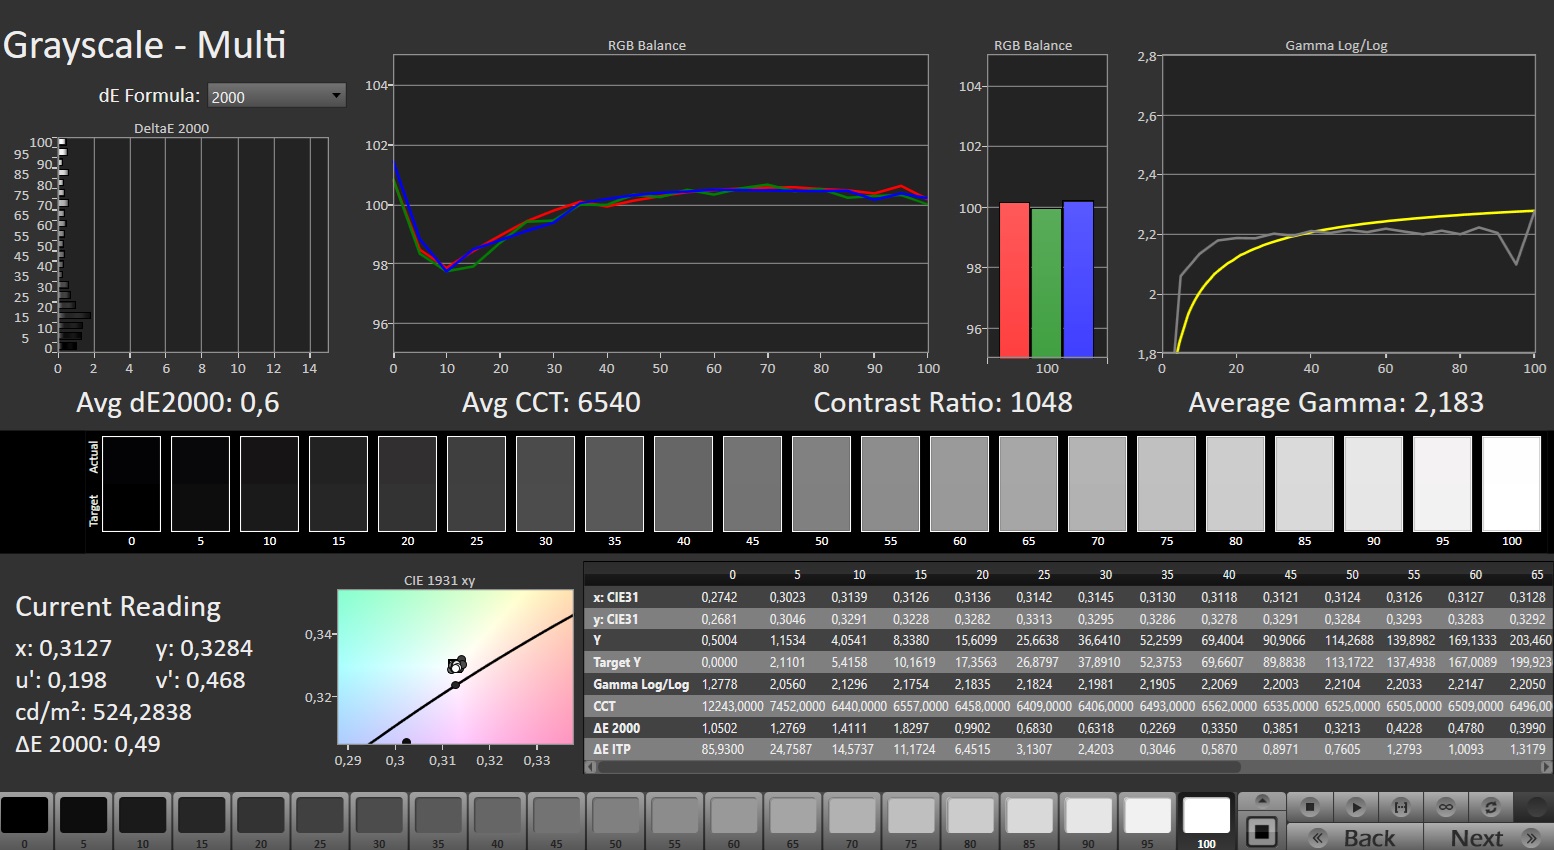
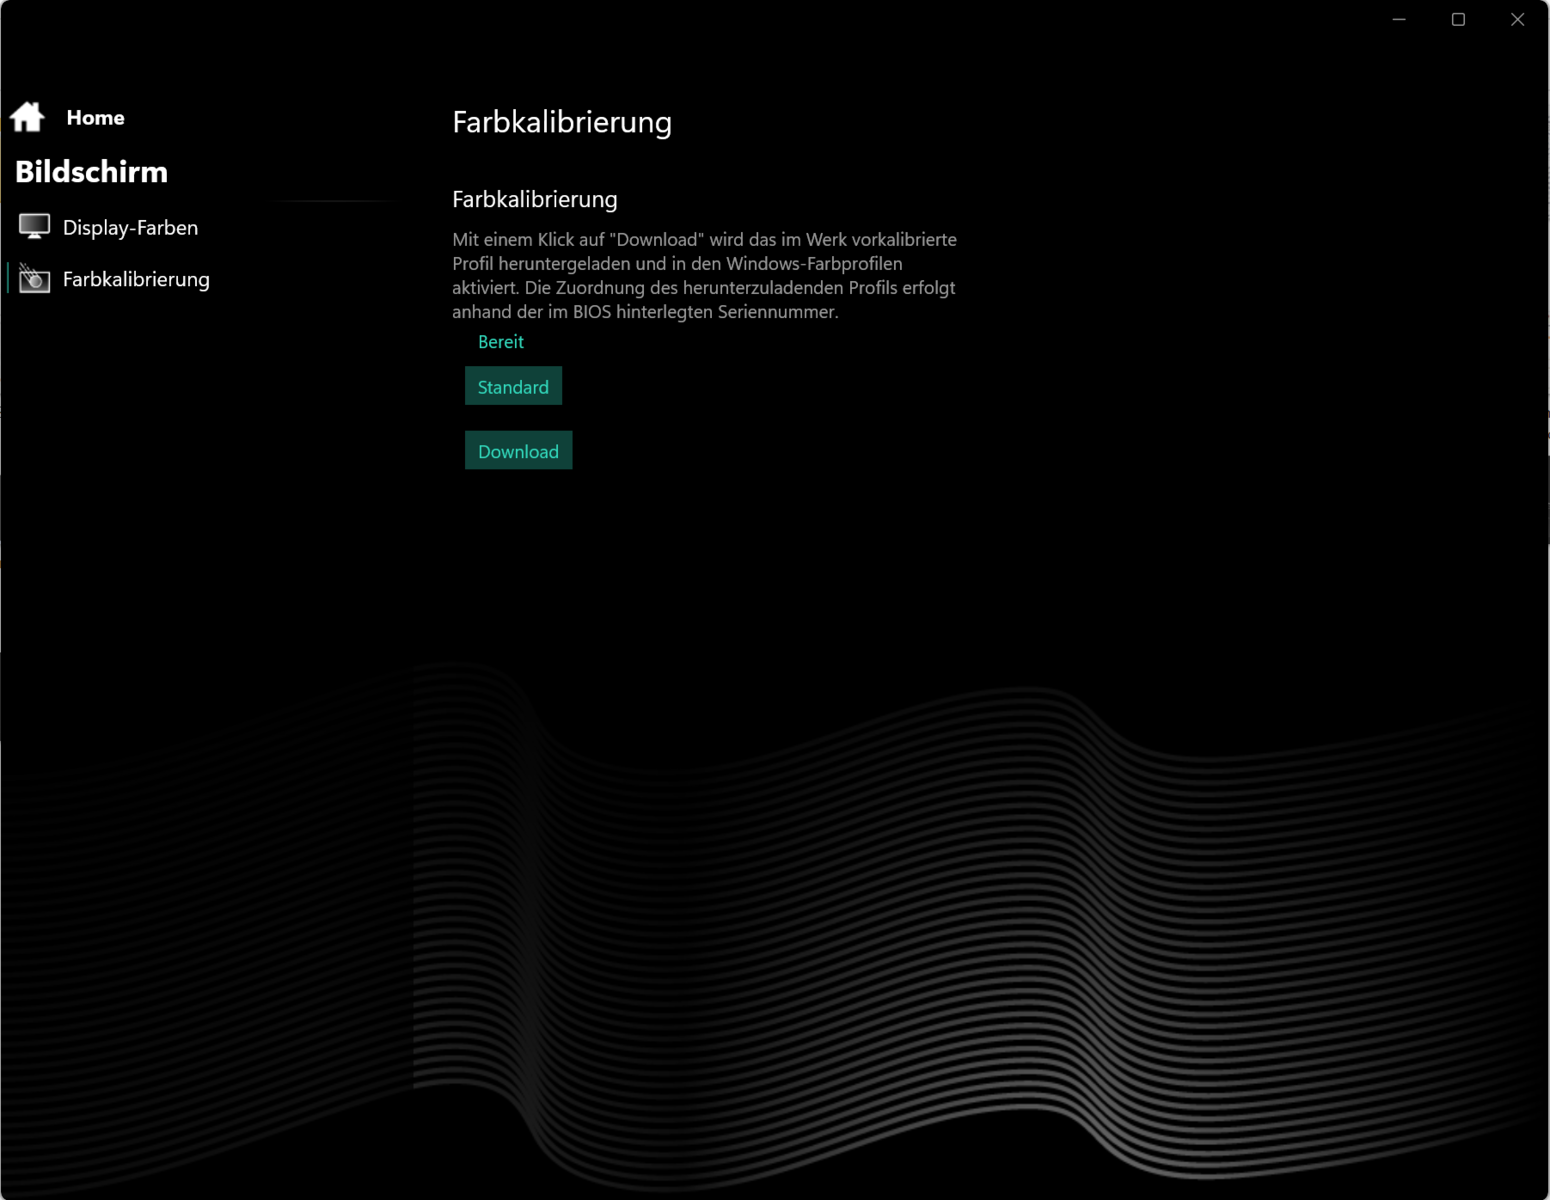
Fuori dalla scatola, il display offre una riproduzione dei colori decente: Con un DeltaE di 3,2, la deviazione manca appena il valore target (DeltaE < 3). Una calibrazione riduce questo valore a 1,44 - un buon dato. Tra tutti gli spazi colore standard (AdobeRGB, sRGB, DCI P3), il pannello - proprio come il pannello di Erazer Beast X40 display di Erazer Beast X40 - può visualizzare solo lo spazio sRGB in modo quasi completo. La visualizzazione di tutti e tre gli spazi di colore è riservata al pannello OLED del modello Blade 16.
Il Profilo colore che abbiamo creato può essere scaricato e utilizzato gratuitamente. Un link si trova nella casella informativa del display.
Tempi di risposta del Display
| ↔ Tempi di risposta dal Nero al Bianco | ||
|---|---|---|
| 5.1 ms ... aumenta ↗ e diminuisce ↘ combinato | ↗ 1.6 ms Incremento | 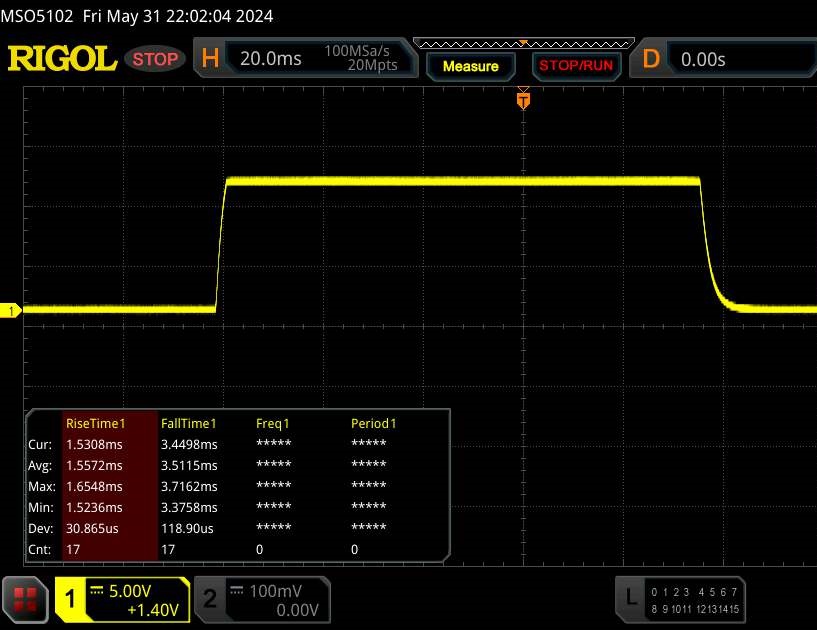 |
| ↘ 3.5 ms Calo | ||
| Lo schermo ha mostrato valori di risposta molto veloci nei nostri tests ed è molto adatto per i gaming veloce. In confronto, tutti i dispositivi di test variano da 0.1 (minimo) a 240 (massimo) ms. » 13 % di tutti i dispositivi è migliore. Questo significa che i tempi di risposta rilevati sono migliori rispettto alla media di tutti i dispositivi testati (21.3 ms). | ||
| ↔ Tempo di risposta dal 50% Grigio all'80% Grigio | ||
| 11.2 ms ... aumenta ↗ e diminuisce ↘ combinato | ↗ 5.2 ms Incremento | 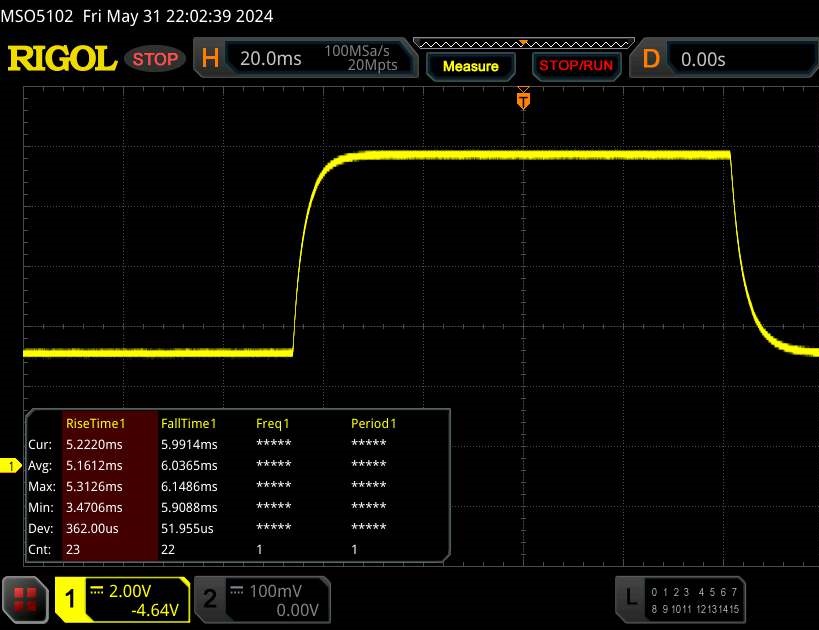 |
| ↘ 6 ms Calo | ||
| Lo schermo mostra buoni tempi di risposta durante i nostri tests, ma potrebbe essere troppo lento per i gamers competitivi. In confronto, tutti i dispositivi di test variano da 0.2 (minimo) a 636 (massimo) ms. » 20 % di tutti i dispositivi è migliore. Questo significa che i tempi di risposta rilevati sono migliori rispettto alla media di tutti i dispositivi testati (33.5 ms). | ||
Sfarfallio dello schermo / PWM (Pulse-Width Modulation)
| flickering dello schermo / PWM non rilevato | 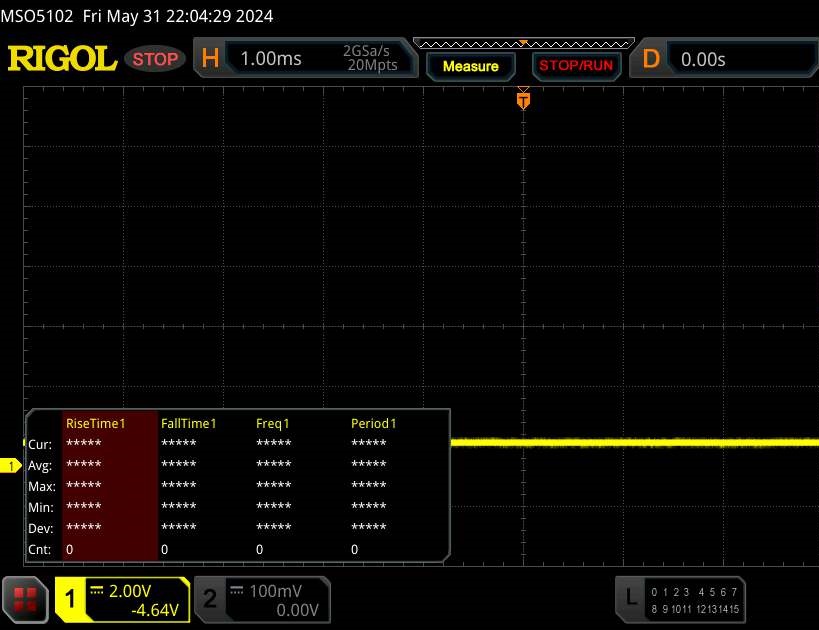 | ||
In confronto: 53 % di tutti i dispositivi testati non utilizza PWM per ridurre la luminosita' del display. Se è rilevato PWM, una media di 17655 (minimo: 5 - massimo: 3846000) Hz è stata rilevata. | |||
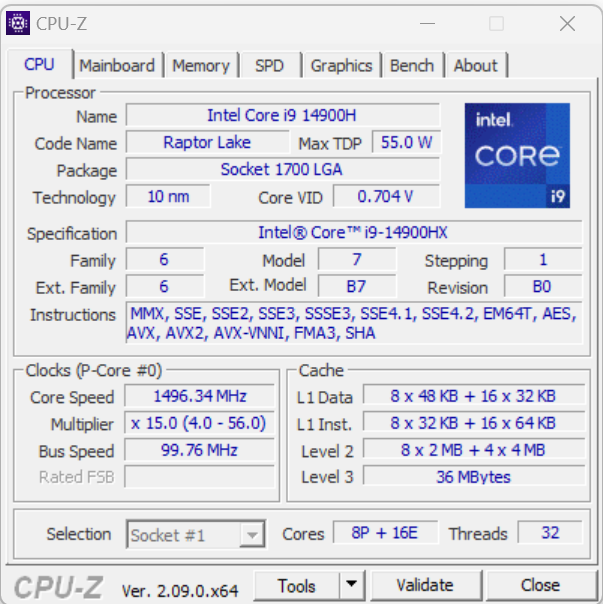
Prestazioni - Raptor Lake e Ada Lovelace assicurano una tonnellata di potenza
Neo 16 (Early 24) si rivolge ai giocatori, ai creatori e, in generale, a tutti i gruppi di utenti che richiedono molta potenza. Ogni variante di specifiche è dotata di un Core i9 14900HX e la gamma di GPU va da RTX 4060 a RTX 4090 - il nostro modello è un RTX 4090. Le configurazioni individuali e l'acquisto del portatile sono possibili tramite Bestware.com (in tedesco). Il dispositivo oggetto della nostra recensione può essere acquistato a circa 4.000 dollari, mentre il modello base (RTX 4060) costa circa 2.000 dollari. Il raffreddamento ad acqua (Oasis MK2), disponibile come opzione, è incluso nei modelli RTX 4080 e RTX 4090 Neo 16.
Condizioni del test
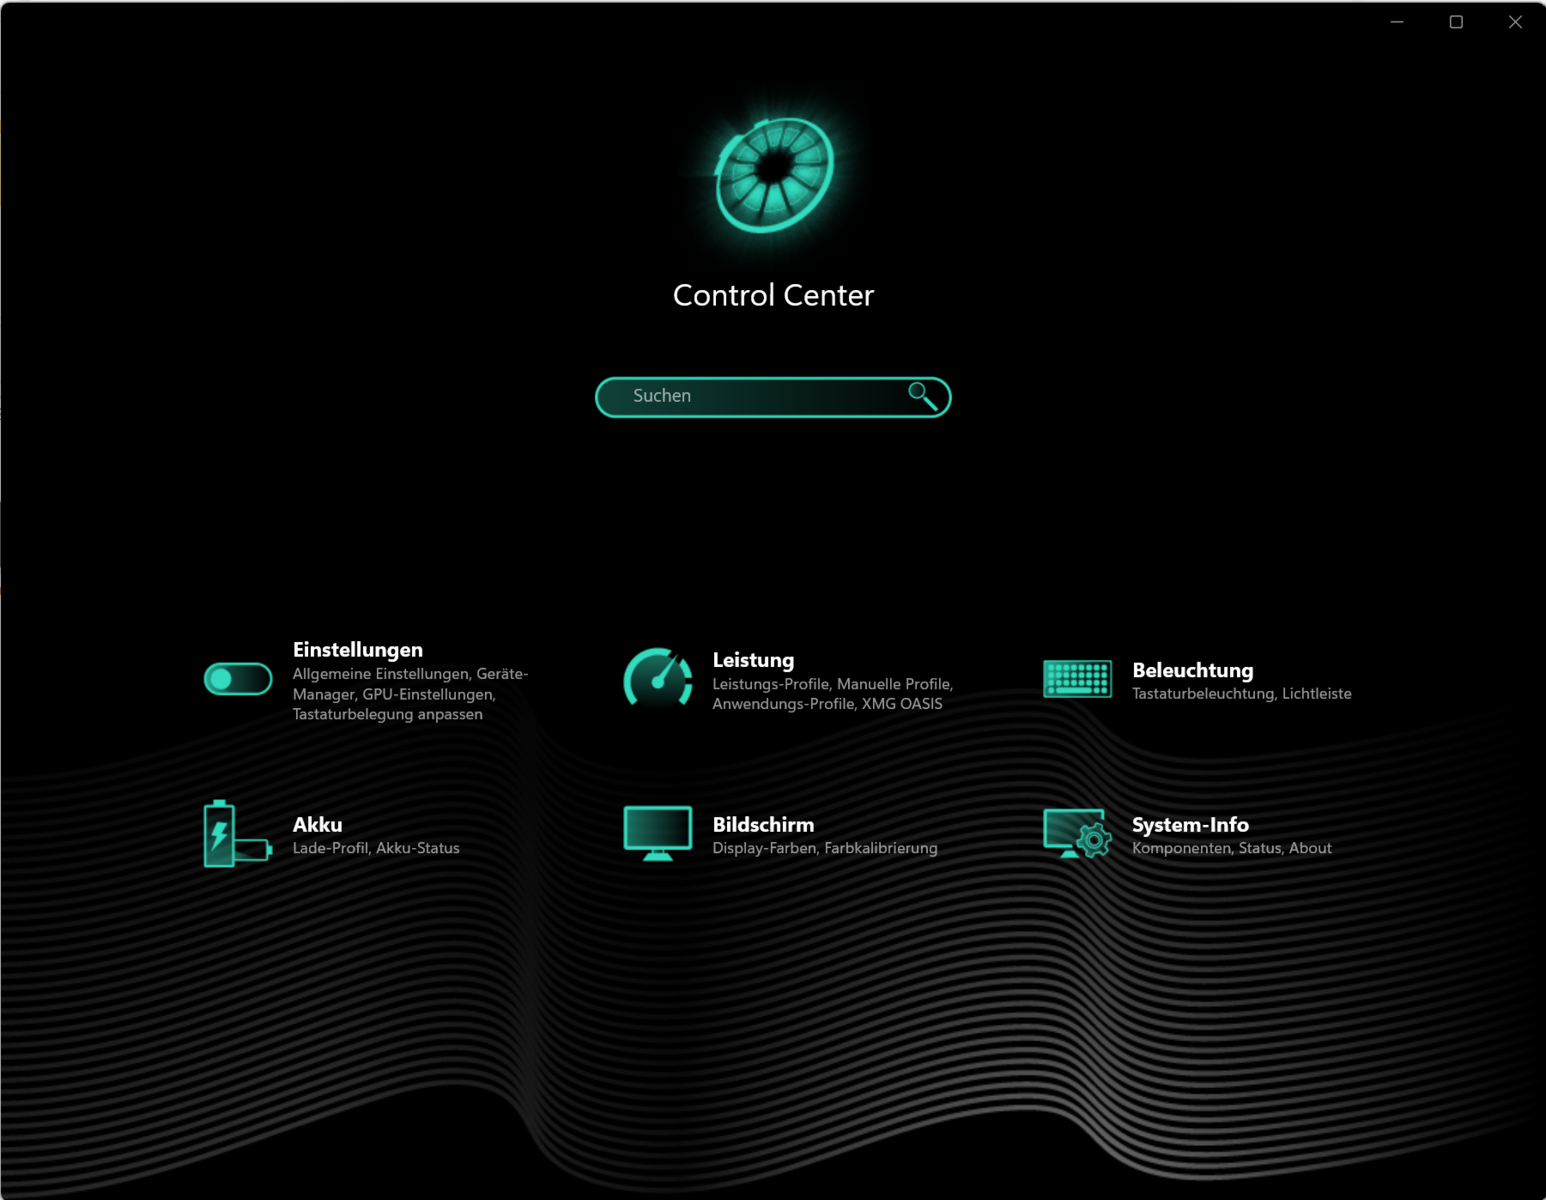
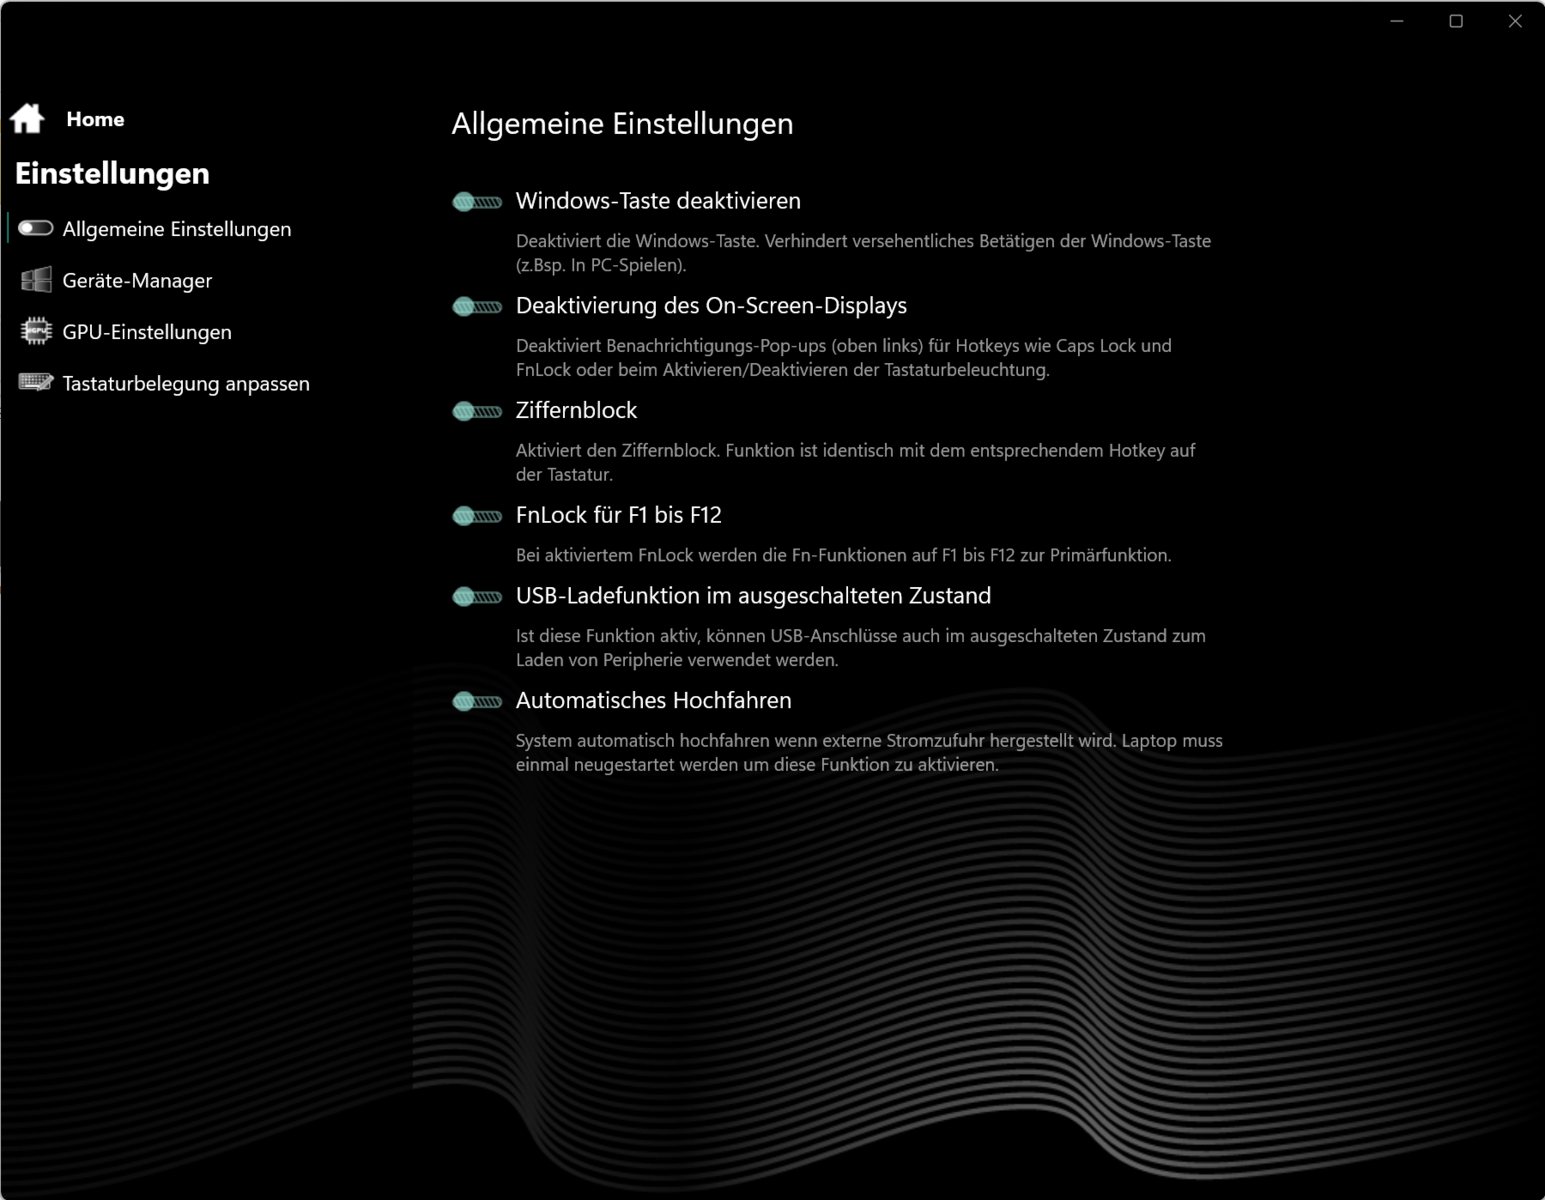
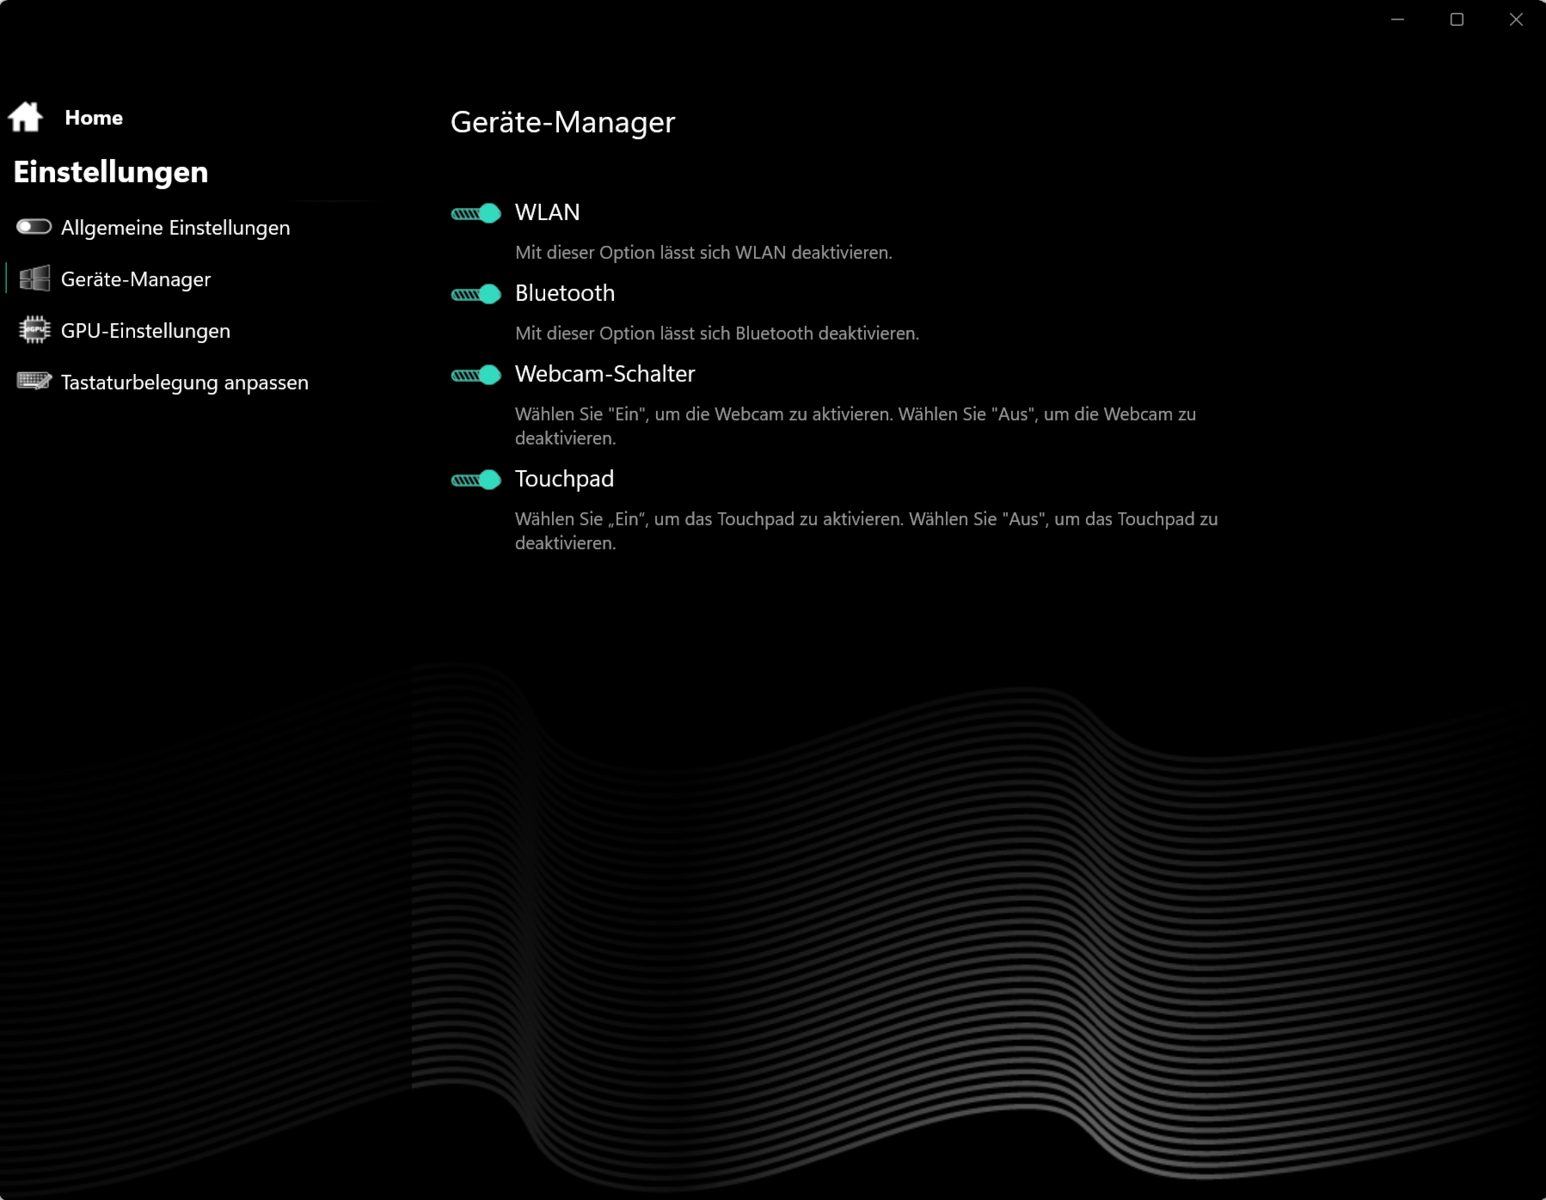
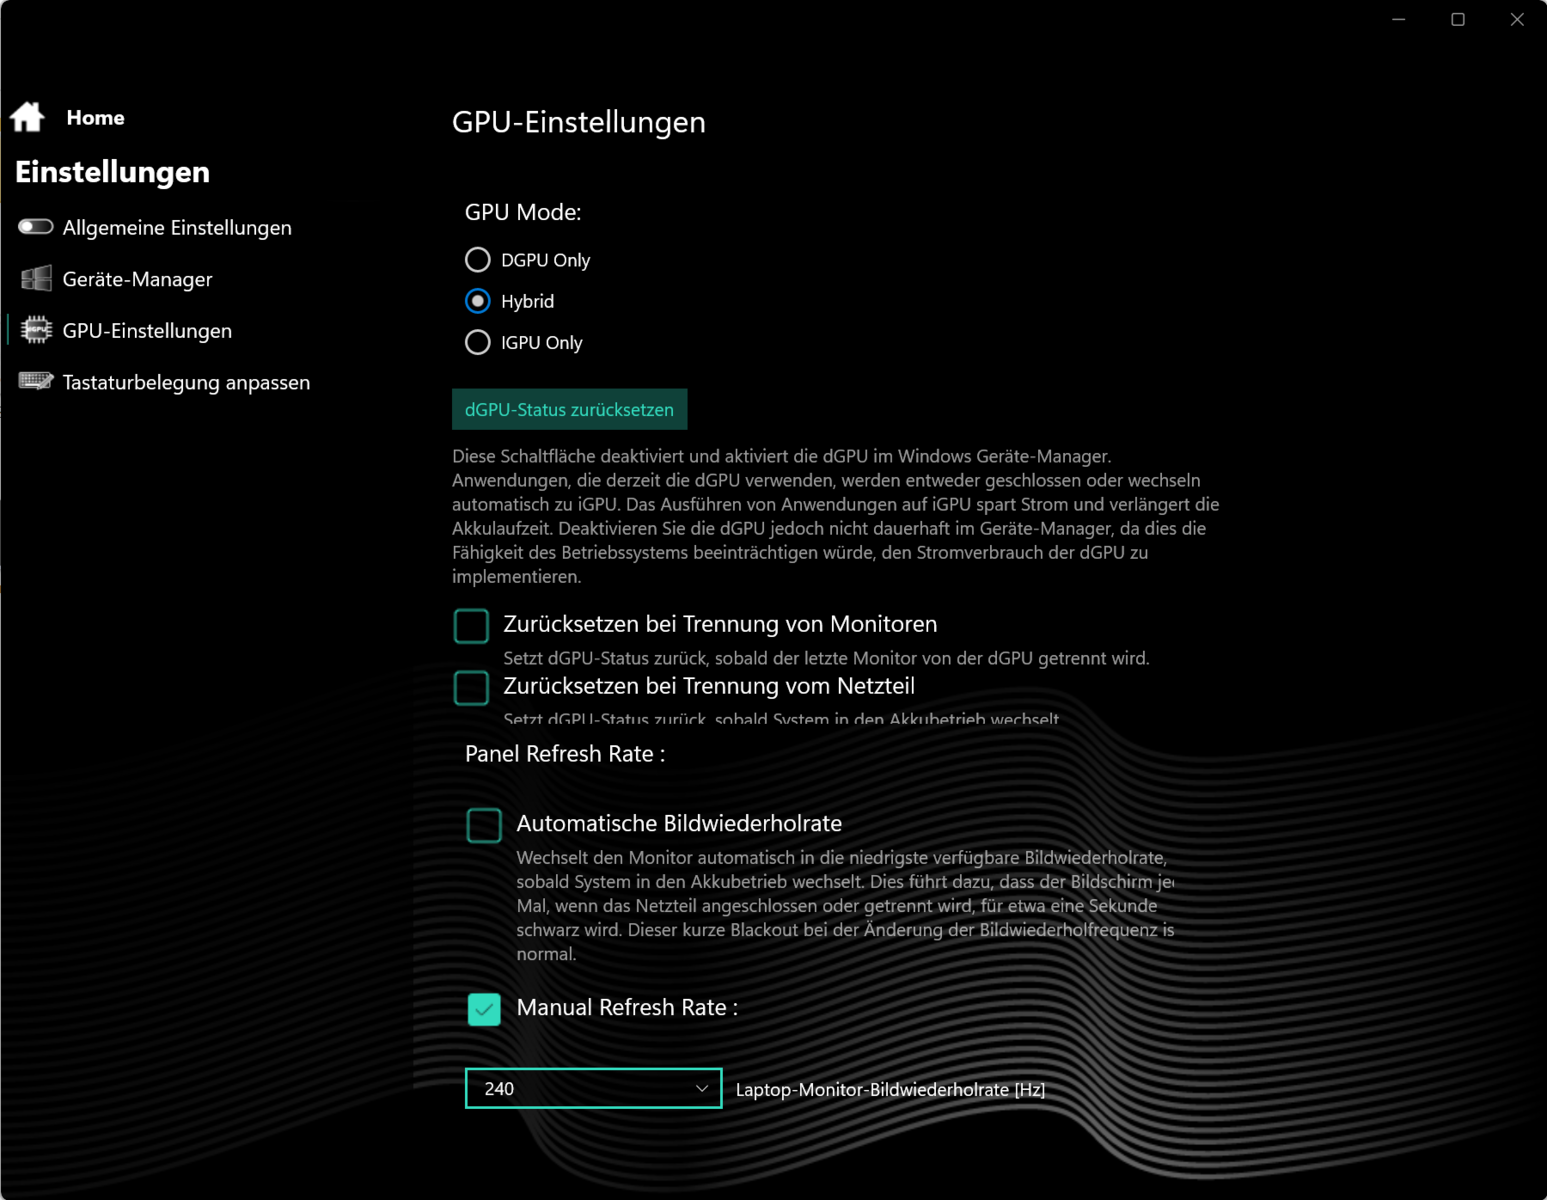
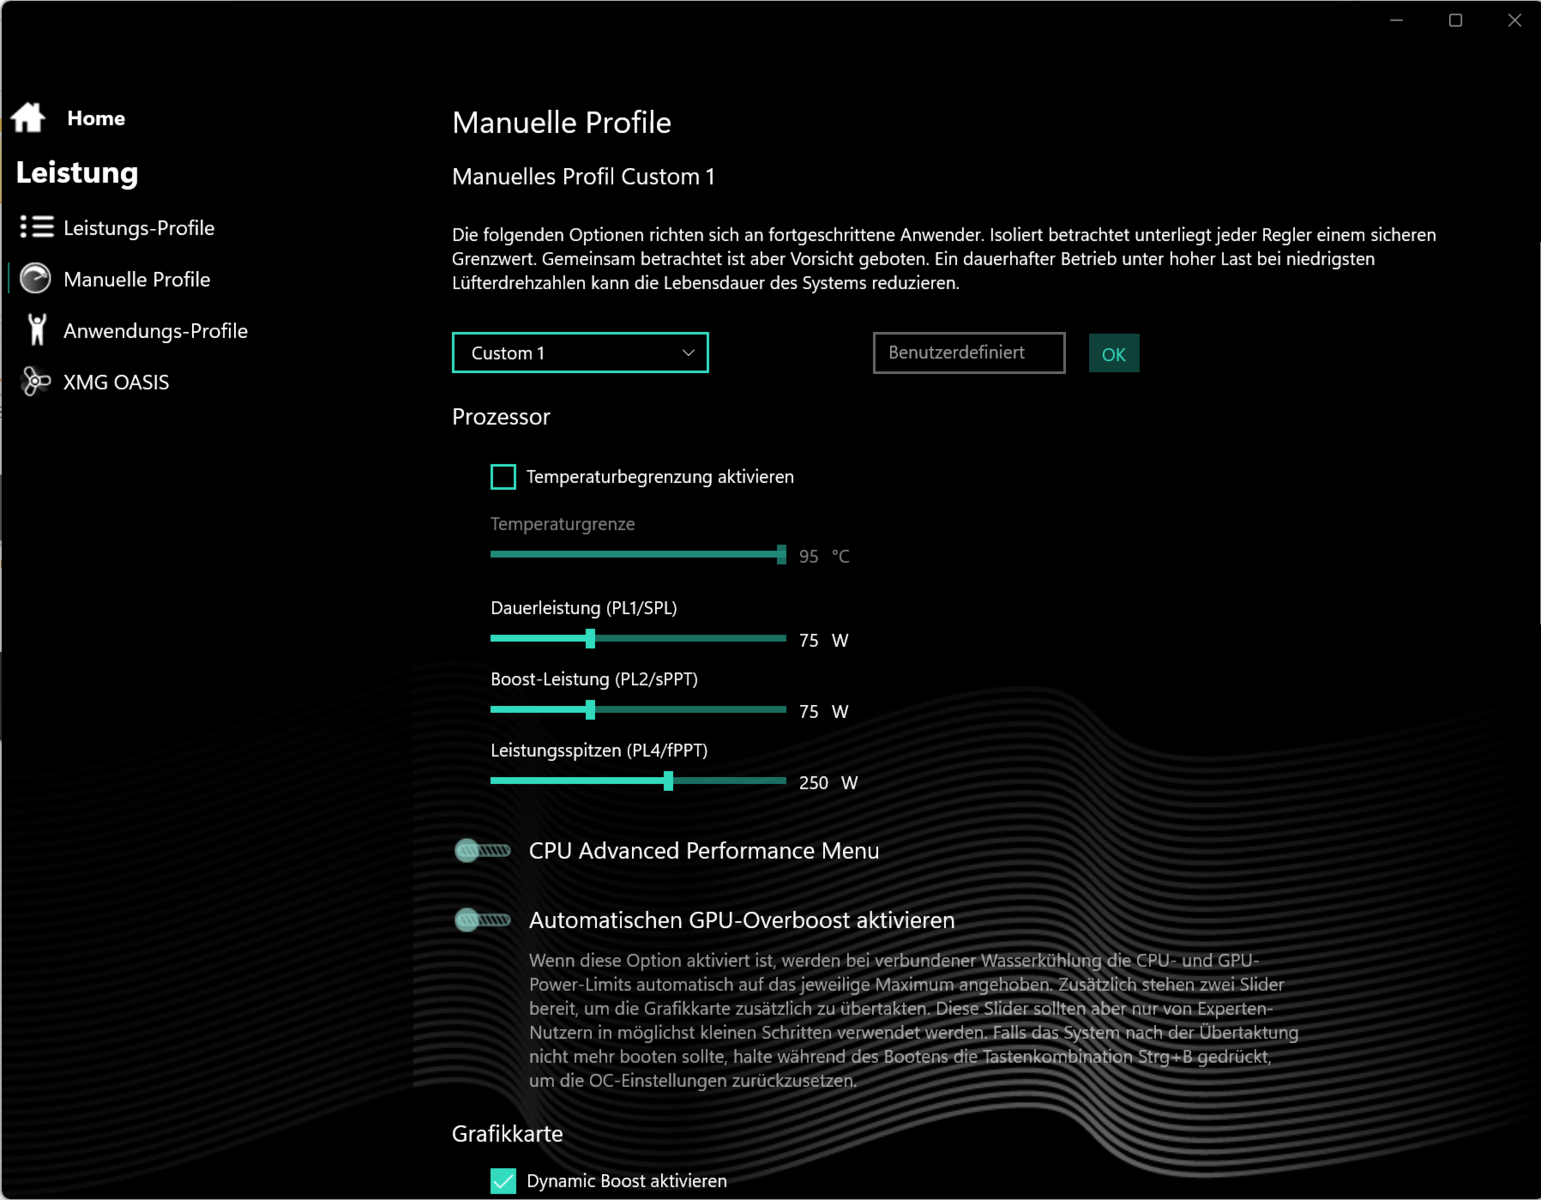
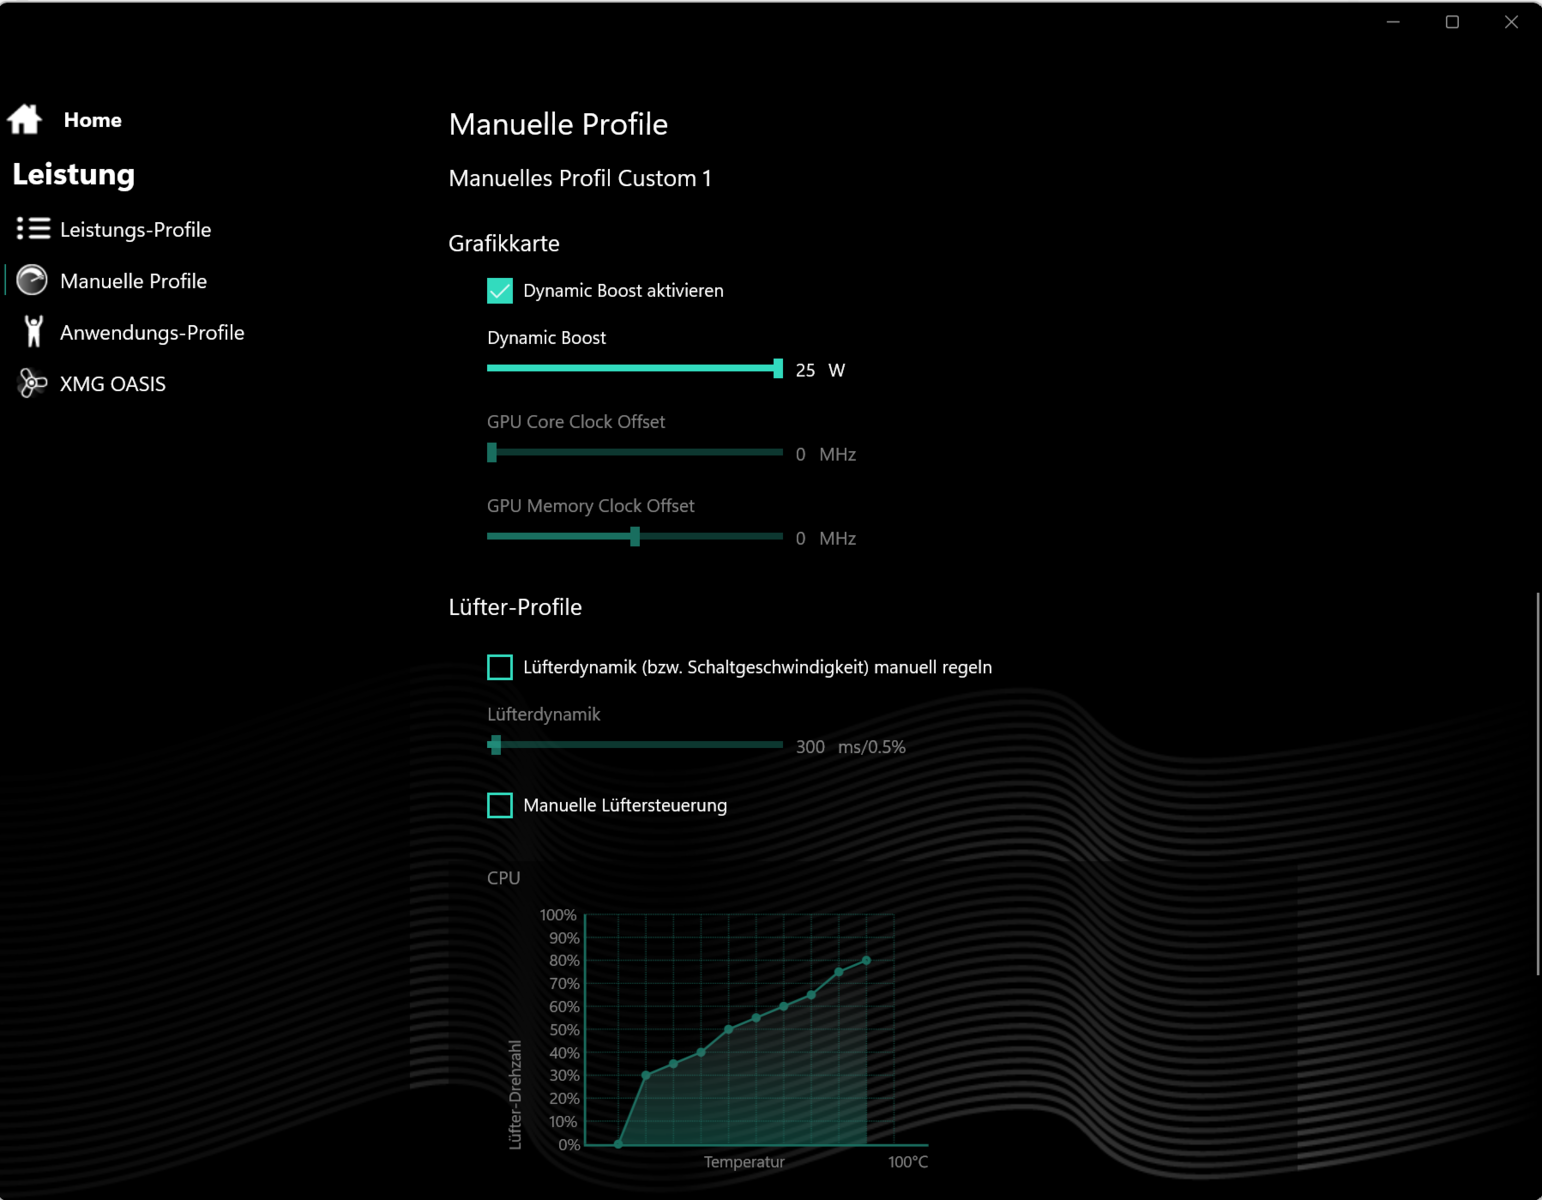
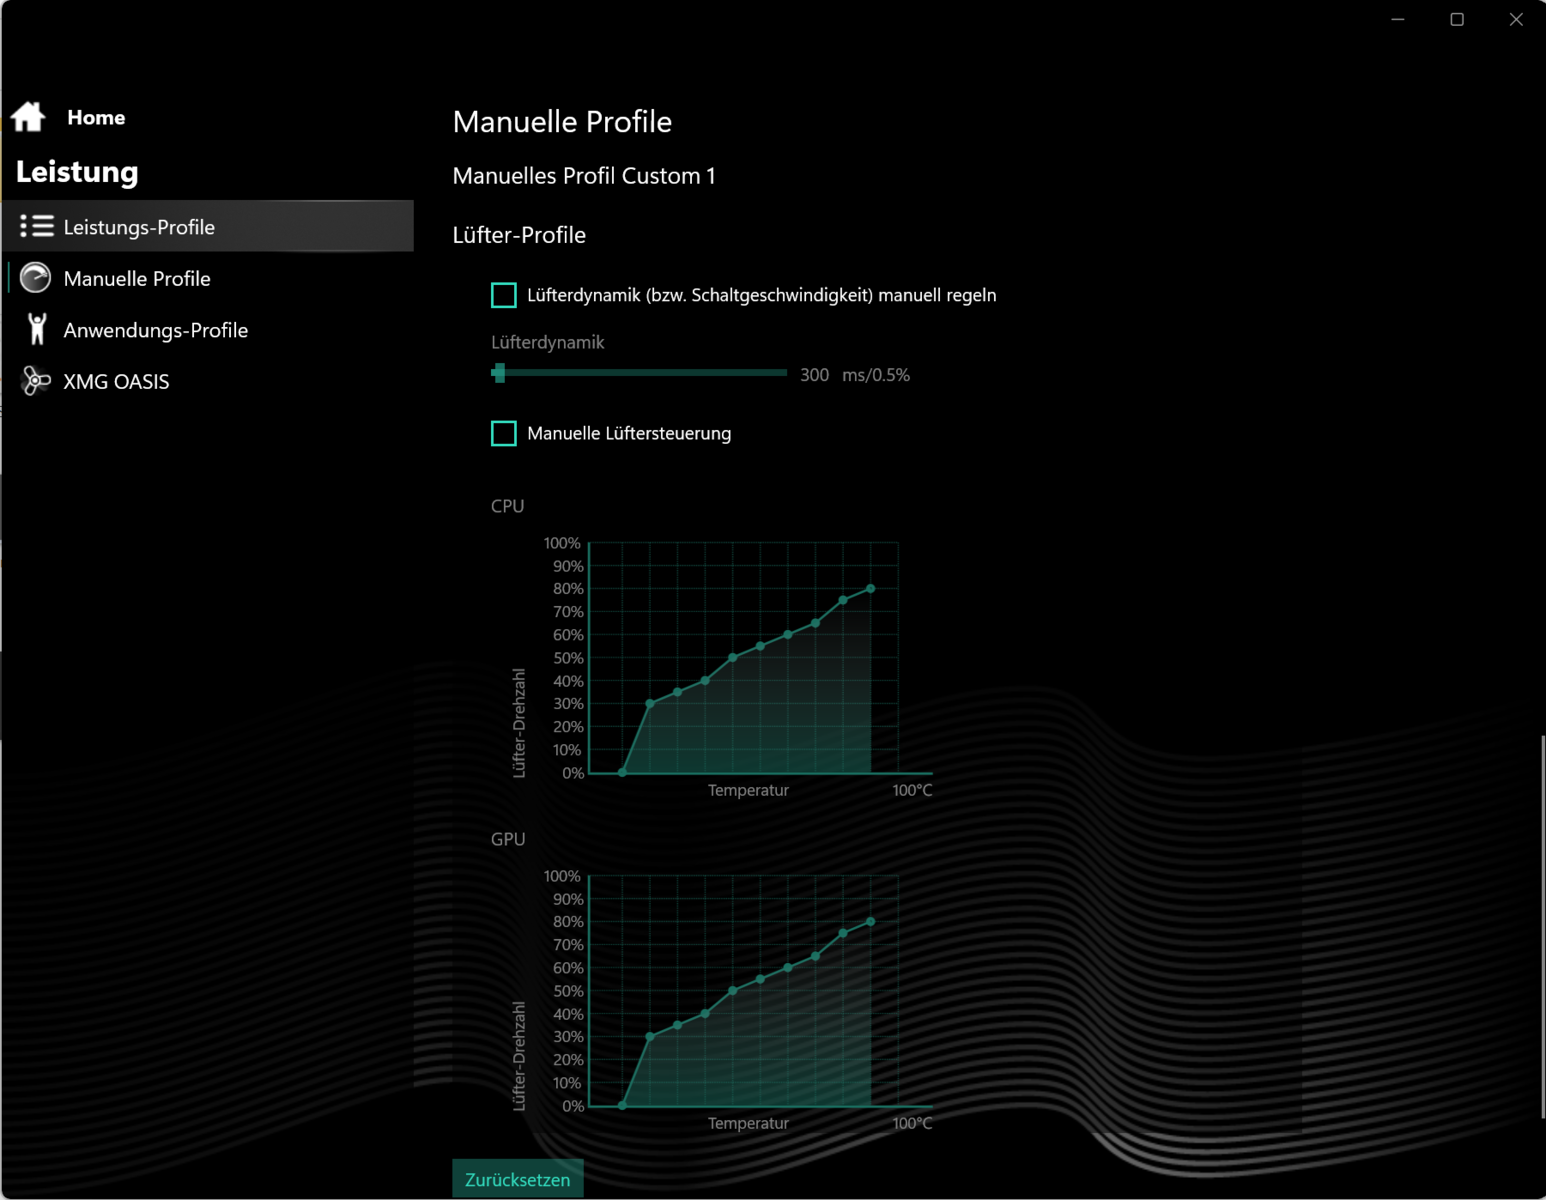
È possibile scegliere tra tre modalità di prestazioni specifiche del produttore (vedere tabella). Durante il test, abbiamo utilizzato le modalità "Overboost" (benchmark) e "Bilanciato" (test della batteria). La modalità GPU era impostata su "Ibrida" (= Optimus). È possibile gestire i singoli profili tramite il Centro di controllo. Ciò significa che può regolare il limite di potenza della CPU, il TGP della GPU e/o il limite superiore della temperatura. Un tasto separato (accanto al pulsante di accensione) consente di passare rapidamente da una modalità all'altra.
Avevamo a disposizione il raffreddamento ad acqua esterno (Oasis Mk2 ), disponibile come opzione, ma non l'abbiamo usato durante i test. Tuttavia, abbiamo effettuato alcune misurazioni indipendenti dai test ufficiali (vedere la tabella di confronto).
| Overboost | Enthusiast | Bilanciato | |
|---|---|---|---|
| Limite di potenza 1 (HWInfo) | 205 Watt | 205 Watt | 205 Watt |
| Limite di potenza 2 (HWInfo) | 205 Watt | 205 Watt | 205 Watt |
| Rumore (Witcher 3) | 54 dB(A) | 51 dB(A) | 32 dB(A) |
| Prestazioni (Witcher 3) | 214fps | 198fps | 30fps (blocco) |

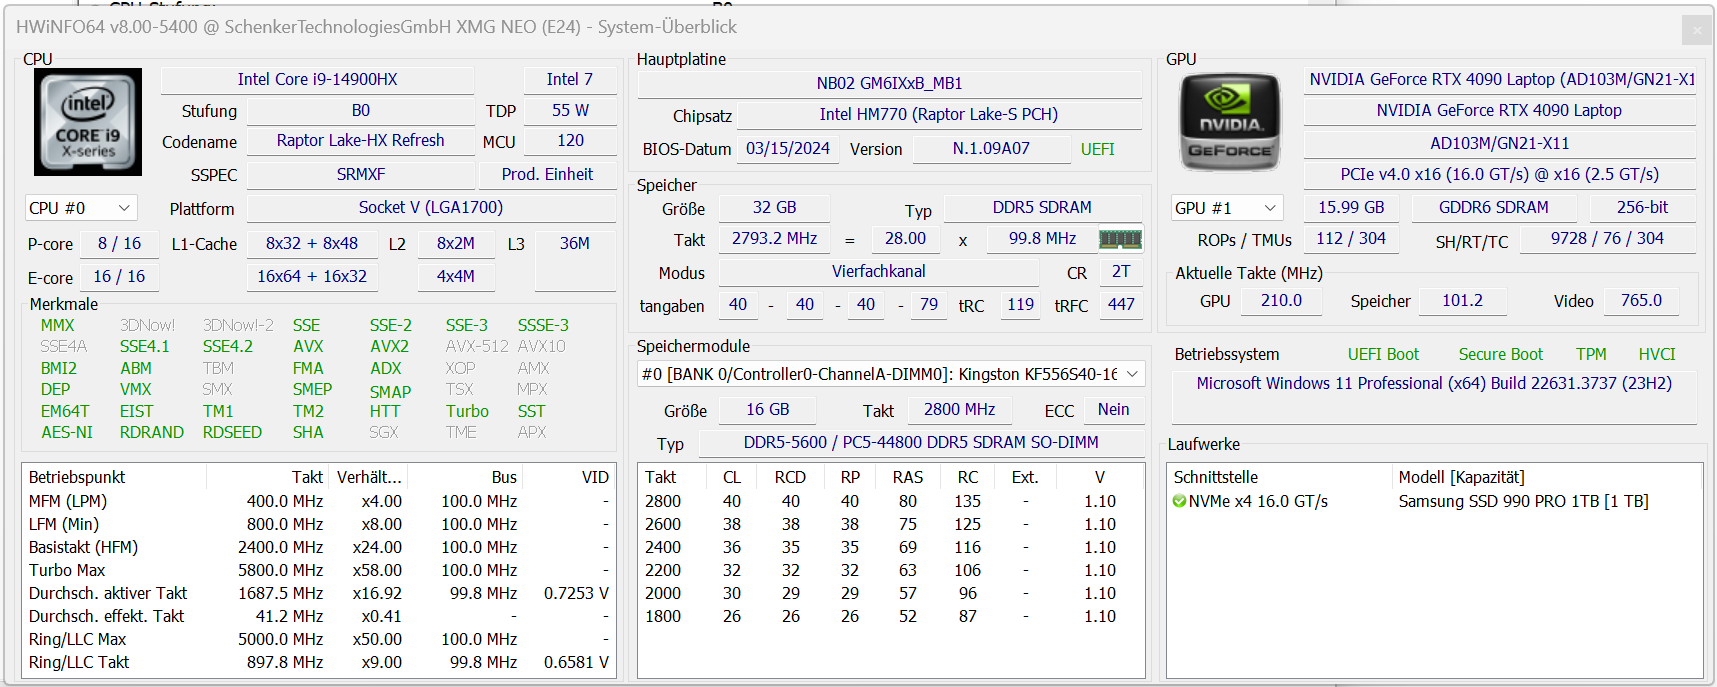
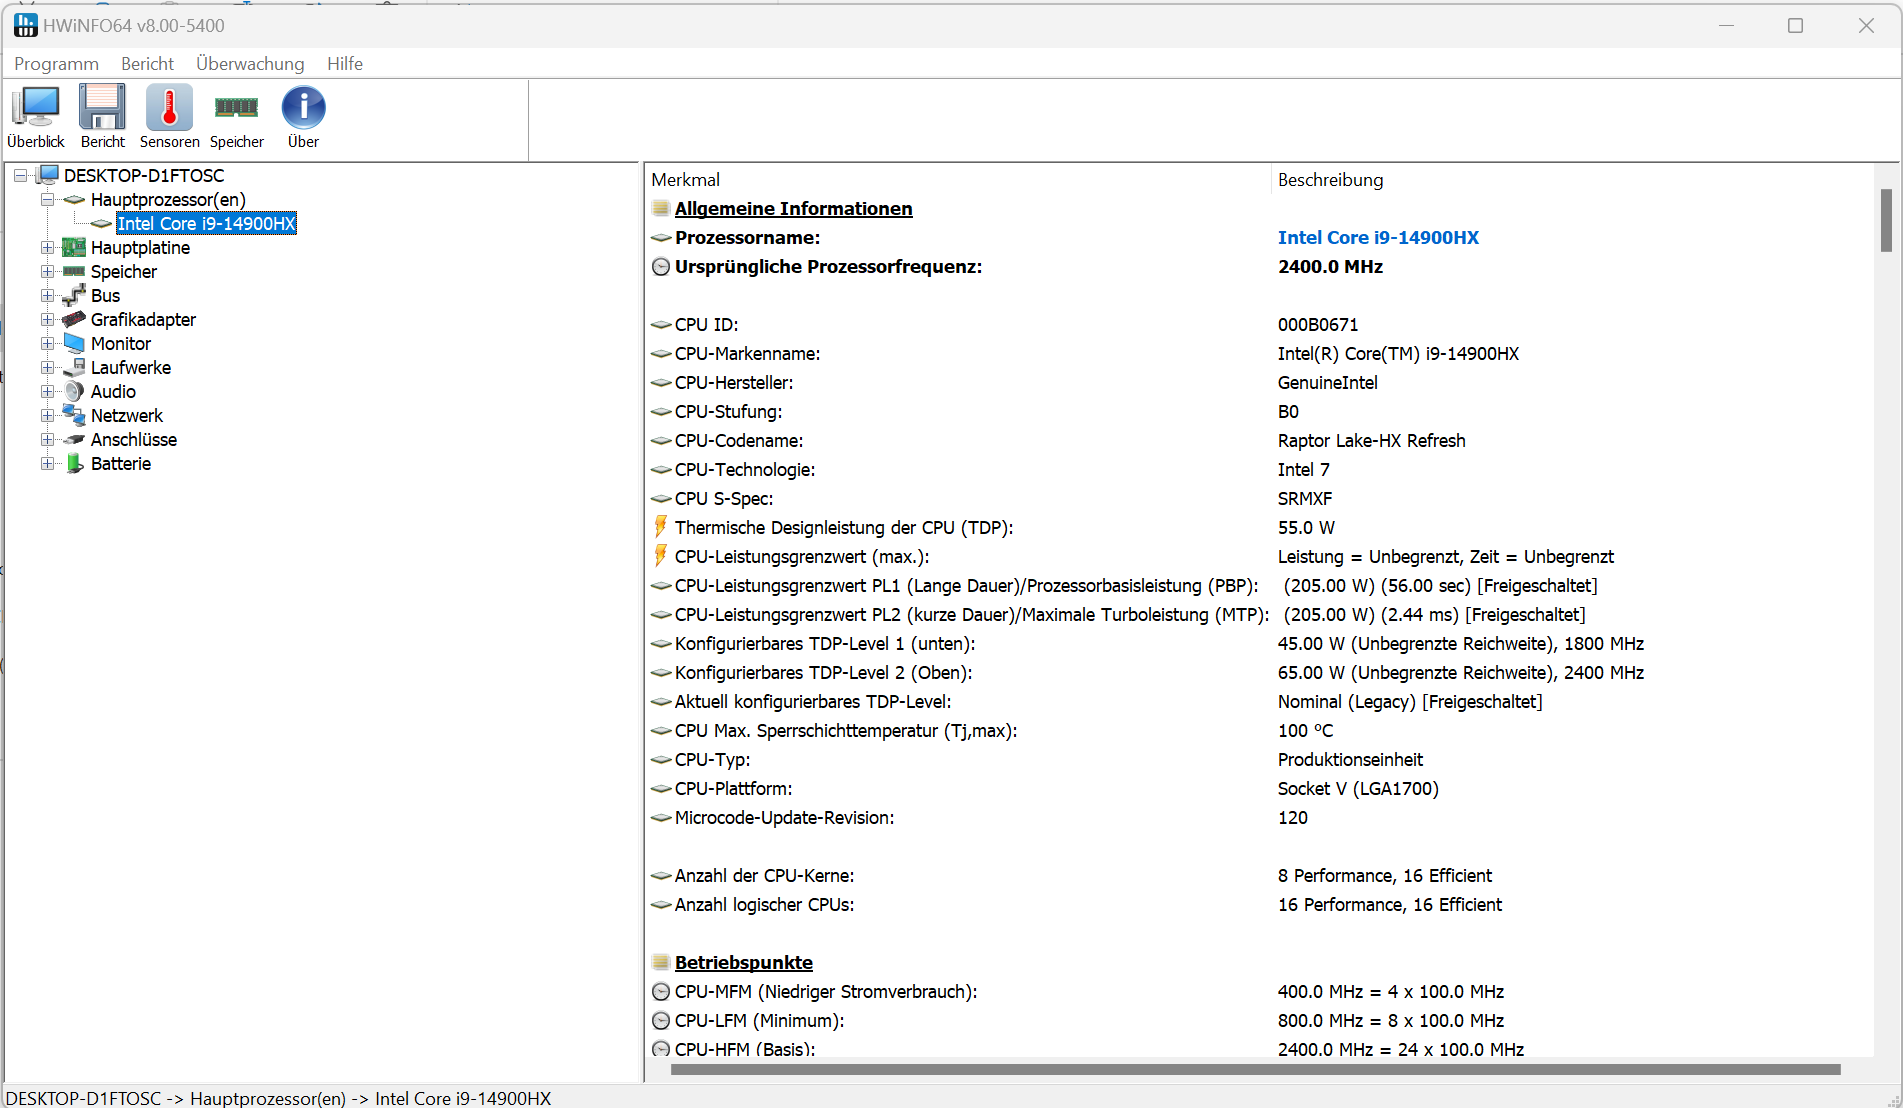
Processore
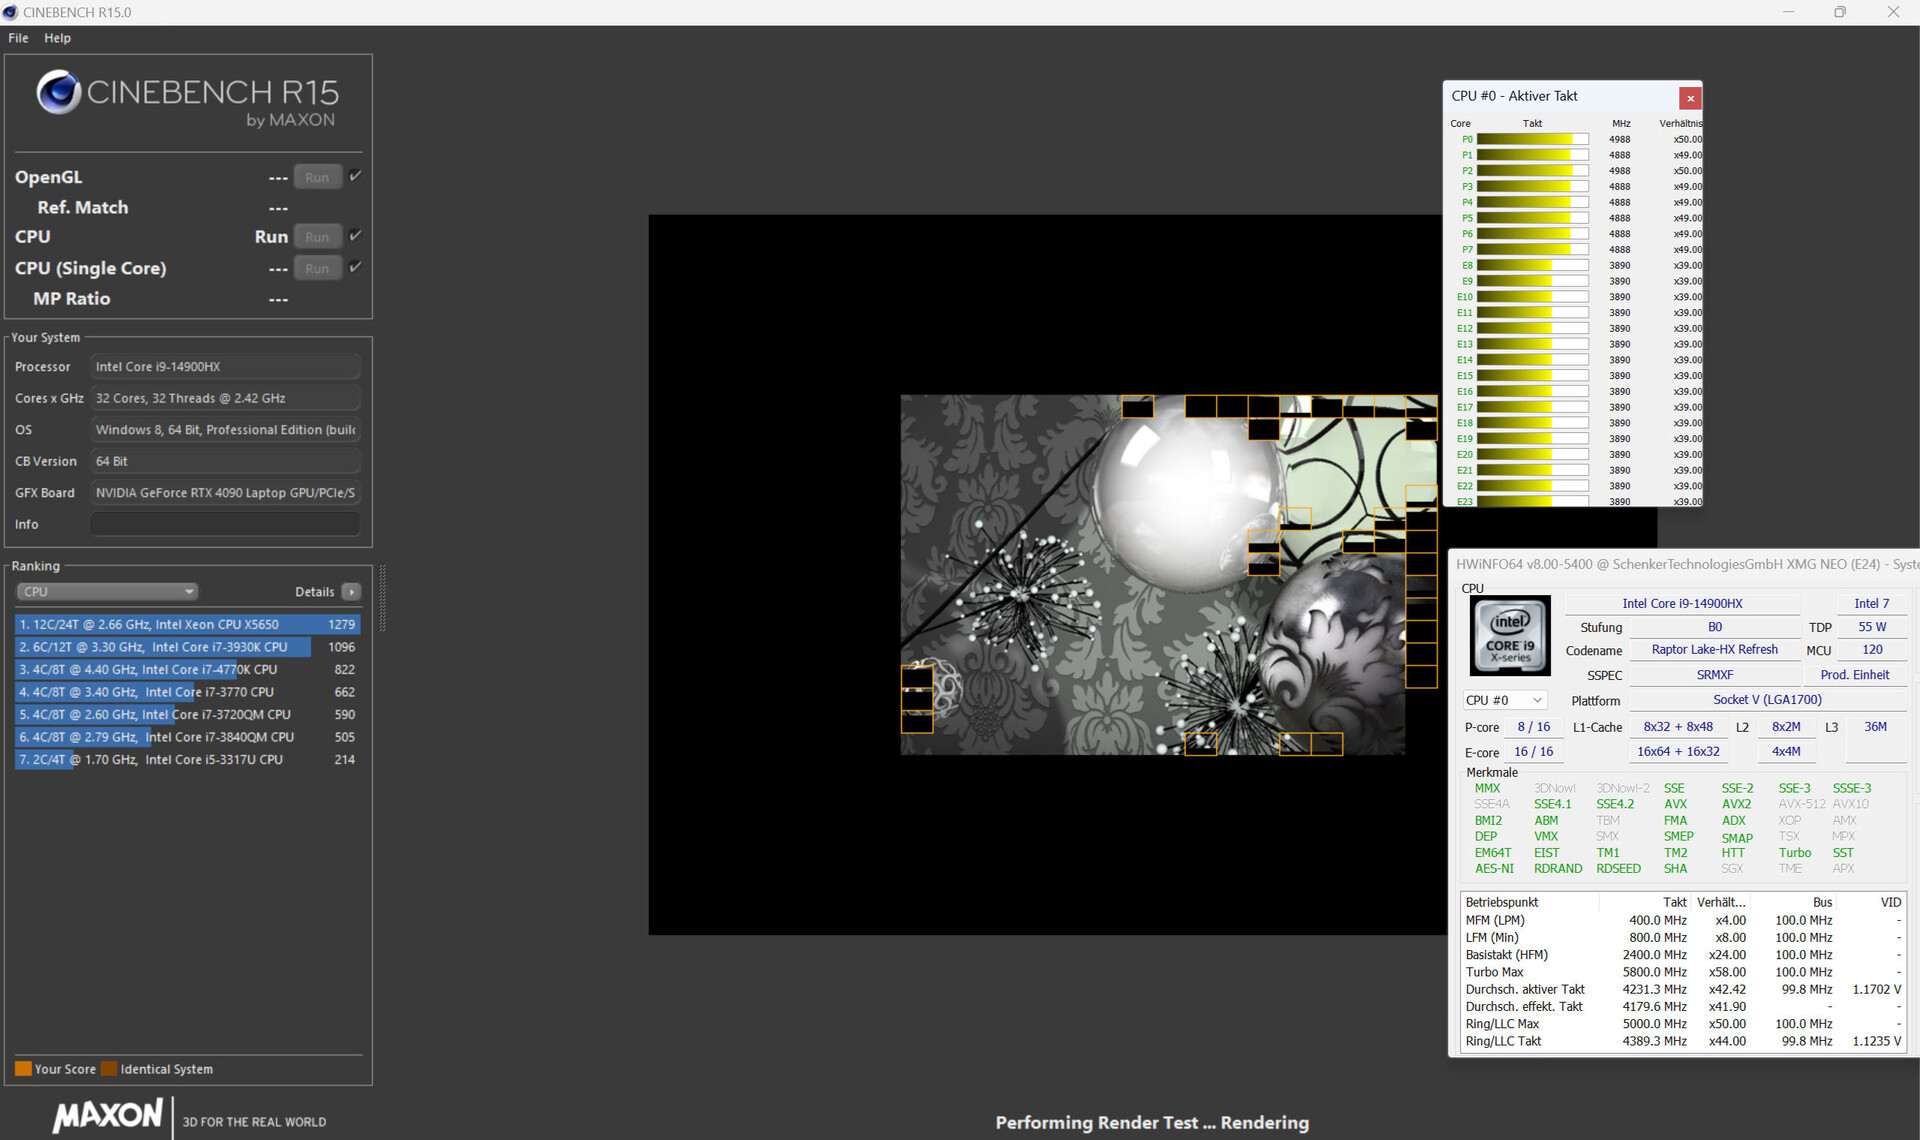
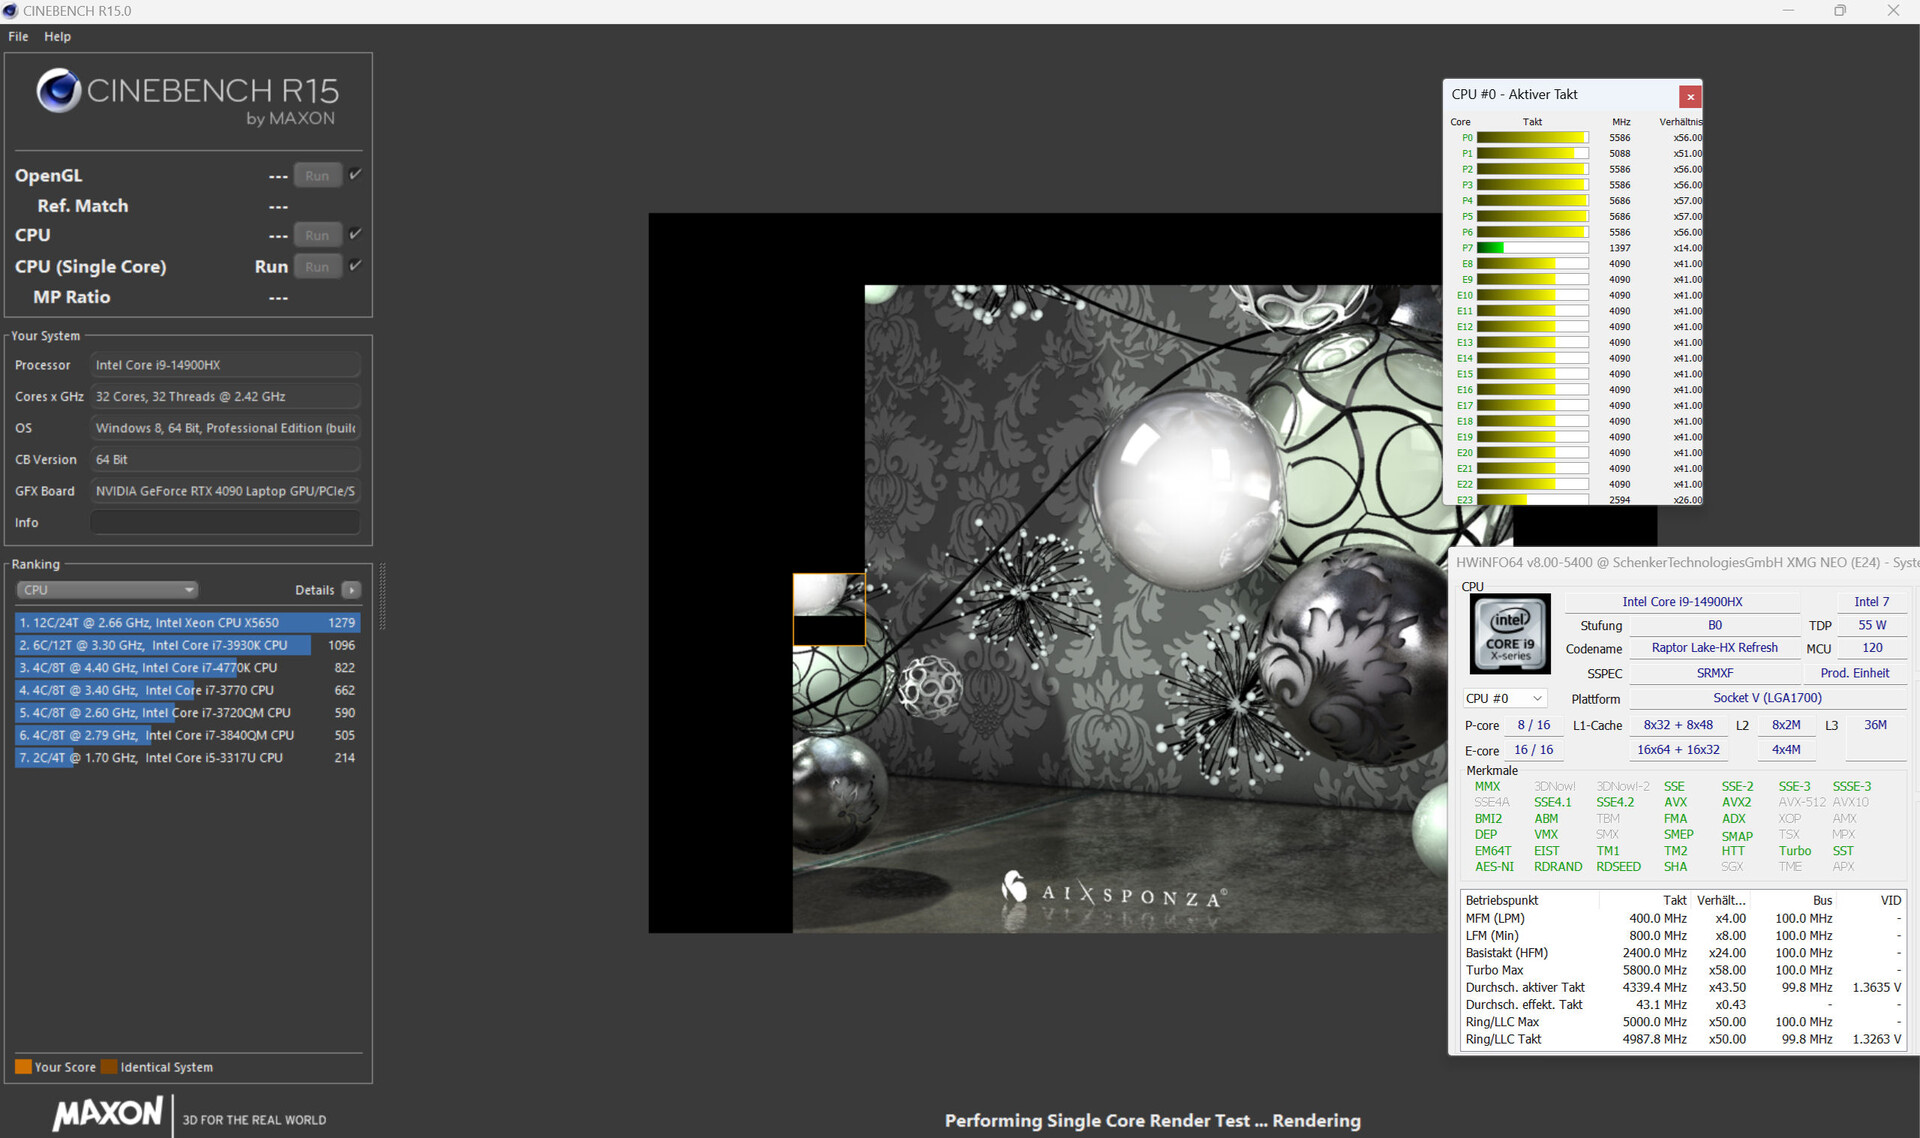
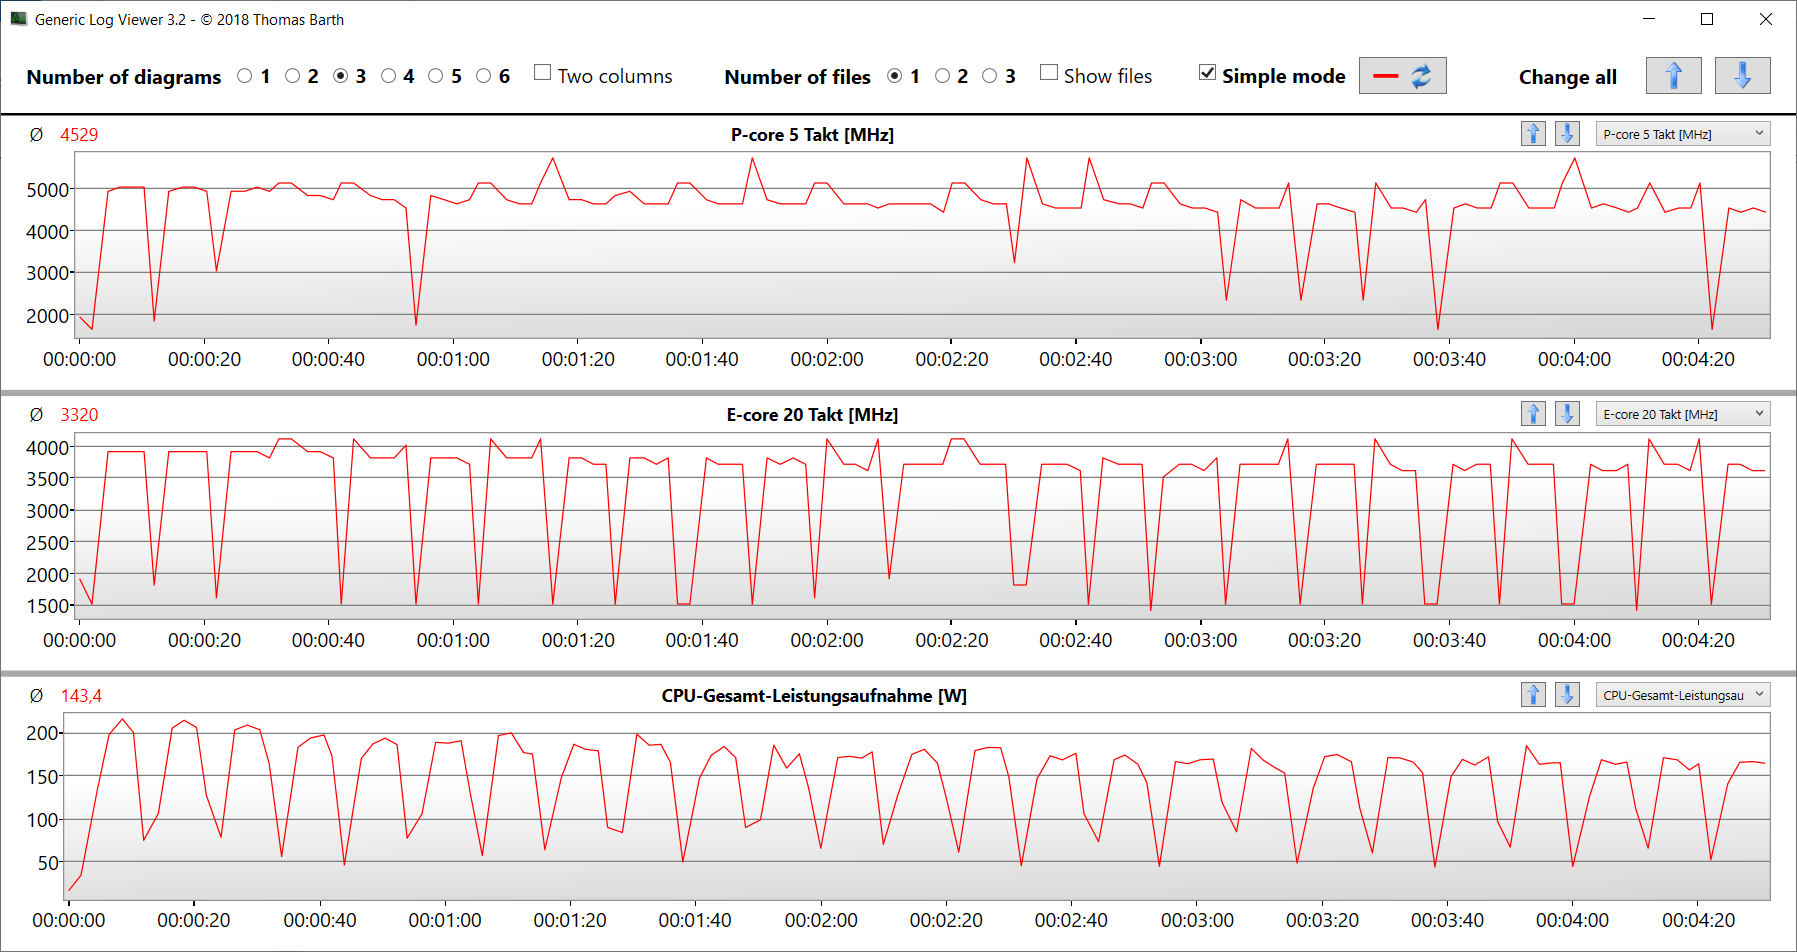
Il portatile è alimentato da un Core i9 14900HX (Raptor Lake) - altre CPU non sono disponibili. Il Core i9 offre ben 24 core (8P + 16E = 32 thread) a una velocità massima di 5,8 GHz (P) e 4,1 GHz (E). Il carico continuo multi-thread (ciclo CB15) comporta prestazioni in continua ma leggera diminuzione (Overboost) - l'utilizzo del raffreddamento ad acqua Oasis contrasta questo effetto. Le altre due modalità di alimentazione garantiscono prestazioni costanti anche senza il raffreddamento ad acqua - ovviamente, a un livello basso.
"Overboost" offre cifre della CPU superiori alla media, mentre "Enthusiast" è leggermente inferiore alla media - questo vale soprattutto per le prestazioni multi-thread. In ognuno dei tre profili, le prestazioni single-thread si attestano su un livello altrettanto elevato. Il raffreddamento ad acqua opzionale (Oasis) comporta un piccolo aumento delle prestazioni.
Cinebench R15 Multi Continuous Test
| Cinebench R20 | |
| CPU (Multi Core) | |
| SCHENKER XMG Neo 16 (Early 24) (Overboost, Oasis, Overboost, Oasis) | |
| SCHENKER XMG Neo 16 (Early 24) | |
| Asus ROG Strix Scar 17 G733PYV-LL053X | |
| Lenovo Legion 9 16IRX9, RTX 4090 | |
| Lenovo Legion Pro 7 RTX4090 | |
| Asus ROG Strix Scar 16 G634JZR | |
| Media Intel Core i9-14900HX (8427 - 13832, n=26) | |
| SCHENKER XMG Neo 16 E23 | |
| Razer Blade 16 2024, RTX 4090 | |
| Medion Erazer Beast X40 2024 | |
| Media della classe Gaming (2179 - 13832, n=210, ultimi 2 anni) | |
| Alienware x16 R2 P120F | |
| CPU (Single Core) | |
| Medion Erazer Beast X40 2024 | |
| SCHENKER XMG Neo 16 (Early 24) (Overboost, Oasis, Overboost, Oasis) | |
| SCHENKER XMG Neo 16 (Early 24) | |
| Asus ROG Strix Scar 16 G634JZR | |
| Media Intel Core i9-14900HX (657 - 859, n=26) | |
| Razer Blade 16 2024, RTX 4090 | |
| SCHENKER XMG Neo 16 E23 | |
| Lenovo Legion Pro 7 RTX4090 | |
| Asus ROG Strix Scar 17 G733PYV-LL053X | |
| Media della classe Gaming (439 - 855, n=210, ultimi 2 anni) | |
| Lenovo Legion 9 16IRX9, RTX 4090 | |
| Alienware x16 R2 P120F | |
| Geekbench 6.2 | |
| Multi-Core | |
| SCHENKER XMG Neo 16 (Early 24) (6.2.1, Overboost, Oasis) | |
| SCHENKER XMG Neo 16 (Early 24) (6.2.1) | |
| Asus ROG Strix Scar 16 G634JZR (6.2.1) | |
| Media Intel Core i9-14900HX (15849 - 19665, n=26) | |
| Razer Blade 16 2024, RTX 4090 (6.2.1) | |
| Lenovo Legion 9 16IRX9, RTX 4090 (6.2.1) | |
| Asus ROG Strix Scar 17 G733PYV-LL053X | |
| Medion Erazer Beast X40 2024 (6.2.1) | |
| Media della classe Gaming (5340 - 19665, n=88, ultimi 2 anni) | |
| Alienware x16 R2 P120F (6.2.1) | |
| Single-Core | |
| SCHENKER XMG Neo 16 (Early 24) (6.2.1) | |
| SCHENKER XMG Neo 16 (Early 24) (6.2.1, Overboost, Oasis) | |
| Medion Erazer Beast X40 2024 (6.2.1) | |
| Asus ROG Strix Scar 16 G634JZR (6.2.1) | |
| Media Intel Core i9-14900HX (2419 - 3129, n=26) | |
| Razer Blade 16 2024, RTX 4090 (6.2.1) | |
| Asus ROG Strix Scar 17 G733PYV-LL053X | |
| Media della classe Gaming (1599 - 3129, n=88, ultimi 2 anni) | |
| Lenovo Legion 9 16IRX9, RTX 4090 (6.2.1) | |
| Alienware x16 R2 P120F (6.2.1) | |
| HWBOT x265 Benchmark v2.2 - 4k Preset | |
| SCHENKER XMG Neo 16 (Early 24) (Overboost, Oasis) | |
| Asus ROG Strix Scar 17 G733PYV-LL053X | |
| SCHENKER XMG Neo 16 (Early 24) | |
| Lenovo Legion Pro 7 RTX4090 | |
| Asus ROG Strix Scar 16 G634JZR | |
| SCHENKER XMG Neo 16 E23 | |
| Lenovo Legion 9 16IRX9, RTX 4090 | |
| Media Intel Core i9-14900HX (22.7 - 38.9, n=26) | |
| Razer Blade 16 2024, RTX 4090 | |
| Medion Erazer Beast X40 2024 | |
| Media della classe Gaming (6.72 - 38.9, n=209, ultimi 2 anni) | |
| Alienware x16 R2 P120F | |
| LibreOffice - 20 Documents To PDF | |
| Lenovo Legion 9 16IRX9, RTX 4090 (6.3.4.2) | |
| Media della classe Gaming (31.4 - 96.6, n=205, ultimi 2 anni) | |
| Asus ROG Strix Scar 16 G634JZR (6.3.4.2) | |
| Razer Blade 16 2024, RTX 4090 (6.3.4.2) | |
| Alienware x16 R2 P120F (6.3.4.2) | |
| Media Intel Core i9-14900HX (31.4 - 85.1, n=26) | |
| Medion Erazer Beast X40 2024 (6.3.4.2) | |
| Lenovo Legion Pro 7 RTX4090 | |
| Asus ROG Strix Scar 17 G733PYV-LL053X | |
| SCHENKER XMG Neo 16 E23 | |
| SCHENKER XMG Neo 16 (Early 24) (6.3.4.2) | |
| SCHENKER XMG Neo 16 (Early 24) (6.3.4.2, Overboost, Oasis) | |
| R Benchmark 2.5 - Overall mean | |
| Alienware x16 R2 P120F | |
| Lenovo Legion 9 16IRX9, RTX 4090 | |
| Media della classe Gaming (0.3609 - 0.658, n=208, ultimi 2 anni) | |
| Asus ROG Strix Scar 17 G733PYV-LL053X | |
| Lenovo Legion Pro 7 RTX4090 | |
| Media Intel Core i9-14900HX (0.3609 - 0.4859, n=26) | |
| SCHENKER XMG Neo 16 (Early 24) (Overboost, Oasis, Overboost, Oasis) | |
| Razer Blade 16 2024, RTX 4090 | |
| SCHENKER XMG Neo 16 E23 | |
| Medion Erazer Beast X40 2024 | |
| Asus ROG Strix Scar 16 G634JZR | |
| SCHENKER XMG Neo 16 (Early 24) | |
* ... Meglio usare valori piccoli
AIDA64: FP32 Ray-Trace | FPU Julia | CPU SHA3 | CPU Queen | FPU SinJulia | FPU Mandel | CPU AES | CPU ZLib | FP64 Ray-Trace | CPU PhotoWorxx
| Performance Rating | |
| Asus ROG Strix Scar 17 G733PYV-LL053X | |
| SCHENKER XMG Neo 16 (Early 24) | |
| SCHENKER XMG Neo 16 (Early 24) | |
| Asus ROG Strix Scar 16 G634JZR | |
| Lenovo Legion 9 16IRX9, RTX 4090 | |
| Lenovo Legion Pro 7 RTX4090 | |
| Media Intel Core i9-14900HX | |
| Razer Blade 16 2024, RTX 4090 | |
| SCHENKER XMG Neo 16 E23 | |
| Medion Erazer Beast X40 2024 | |
| Media della classe Gaming | |
| Alienware x16 R2 P120F | |
| AIDA64 / FP32 Ray-Trace | |
| Asus ROG Strix Scar 17 G733PYV-LL053X (v6.88.6413 Beta) | |
| SCHENKER XMG Neo 16 (Early 24) (v6.92.6600, Overboost, Oasis) | |
| SCHENKER XMG Neo 16 (Early 24) (v6.92.6600) | |
| Lenovo Legion 9 16IRX9, RTX 4090 (v6.92.6600) | |
| Lenovo Legion Pro 7 RTX4090 (v6.85.6300) | |
| Asus ROG Strix Scar 16 G634JZR (v6.92.6600) | |
| Media Intel Core i9-14900HX (17244 - 33474, n=25) | |
| Razer Blade 16 2024, RTX 4090 (v6.92.6600) | |
| SCHENKER XMG Neo 16 E23 (v6.75.6100) | |
| Media della classe Gaming (4986 - 60169, n=205, ultimi 2 anni) | |
| Medion Erazer Beast X40 2024 (v6.92.6600) | |
| Alienware x16 R2 P120F (v6.92.6600) | |
| AIDA64 / FPU Julia | |
| Asus ROG Strix Scar 17 G733PYV-LL053X (v6.88.6413 Beta) | |
| SCHENKER XMG Neo 16 (Early 24) (v6.92.6600, Overboost, Oasis) | |
| SCHENKER XMG Neo 16 (Early 24) (v6.92.6600) | |
| Lenovo Legion 9 16IRX9, RTX 4090 (v6.92.6600) | |
| Lenovo Legion Pro 7 RTX4090 (v6.85.6300) | |
| Media Intel Core i9-14900HX (88537 - 166040, n=25) | |
| Razer Blade 16 2024, RTX 4090 (v6.92.6600) | |
| Asus ROG Strix Scar 16 G634JZR (v6.92.6600) | |
| SCHENKER XMG Neo 16 E23 (v6.75.6100) | |
| Medion Erazer Beast X40 2024 (v6.92.6600) | |
| Media della classe Gaming (25360 - 252486, n=205, ultimi 2 anni) | |
| Alienware x16 R2 P120F (v6.92.6600) | |
| AIDA64 / CPU SHA3 | |
| Asus ROG Strix Scar 17 G733PYV-LL053X (v6.88.6413 Beta) | |
| SCHENKER XMG Neo 16 (Early 24) (v6.92.6600, Overboost, Oasis) | |
| SCHENKER XMG Neo 16 (Early 24) (v6.92.6600) | |
| Lenovo Legion 9 16IRX9, RTX 4090 (v6.92.6600) | |
| Lenovo Legion Pro 7 RTX4090 (v6.85.6300) | |
| Asus ROG Strix Scar 16 G634JZR (v6.92.6600) | |
| Media Intel Core i9-14900HX (4267 - 7979, n=25) | |
| Razer Blade 16 2024, RTX 4090 (v6.92.6600) | |
| SCHENKER XMG Neo 16 E23 (v6.75.6100) | |
| Medion Erazer Beast X40 2024 (v6.92.6600) | |
| Media della classe Gaming (1339 - 10389, n=205, ultimi 2 anni) | |
| Alienware x16 R2 P120F (v6.92.6600) | |
| AIDA64 / CPU Queen | |
| Asus ROG Strix Scar 17 G733PYV-LL053X (v6.88.6413 Beta) | |
| SCHENKER XMG Neo 16 (Early 24) (v6.92.6600) | |
| SCHENKER XMG Neo 16 (Early 24) (v6.92.6600, Overboost, Oasis) | |
| Asus ROG Strix Scar 16 G634JZR (v6.92.6600) | |
| Media Intel Core i9-14900HX (118405 - 148966, n=25) | |
| Razer Blade 16 2024, RTX 4090 (v6.92.6600) | |
| SCHENKER XMG Neo 16 E23 (v6.75.6100) | |
| Lenovo Legion Pro 7 RTX4090 (v6.85.6300) | |
| Medion Erazer Beast X40 2024 (v6.92.6600) | |
| Lenovo Legion 9 16IRX9, RTX 4090 (v6.92.6600) | |
| Media della classe Gaming (41257 - 200651, n=205, ultimi 2 anni) | |
| Alienware x16 R2 P120F (v6.92.6600) | |
| AIDA64 / FPU SinJulia | |
| Asus ROG Strix Scar 17 G733PYV-LL053X (v6.88.6413 Beta) | |
| SCHENKER XMG Neo 16 (Early 24) (v6.92.6600, Overboost, Oasis) | |
| SCHENKER XMG Neo 16 (Early 24) (v6.92.6600) | |
| Lenovo Legion 9 16IRX9, RTX 4090 (v6.92.6600) | |
| Asus ROG Strix Scar 16 G634JZR (v6.92.6600) | |
| Razer Blade 16 2024, RTX 4090 (v6.92.6600) | |
| Media Intel Core i9-14900HX (12217 - 18517, n=25) | |
| Lenovo Legion Pro 7 RTX4090 (v6.85.6300) | |
| SCHENKER XMG Neo 16 E23 (v6.75.6100) | |
| Medion Erazer Beast X40 2024 (v6.92.6600) | |
| Media della classe Gaming (3925 - 32988, n=205, ultimi 2 anni) | |
| Alienware x16 R2 P120F (v6.92.6600) | |
| AIDA64 / FPU Mandel | |
| Asus ROG Strix Scar 17 G733PYV-LL053X (v6.88.6413 Beta) | |
| SCHENKER XMG Neo 16 (Early 24) (v6.92.6600, Overboost, Oasis) | |
| SCHENKER XMG Neo 16 (Early 24) (v6.92.6600) | |
| Lenovo Legion 9 16IRX9, RTX 4090 (v6.92.6600) | |
| Lenovo Legion Pro 7 RTX4090 (v6.85.6300) | |
| Asus ROG Strix Scar 16 G634JZR (v6.92.6600) | |
| Razer Blade 16 2024, RTX 4090 (v6.92.6600) | |
| Media Intel Core i9-14900HX (43302 - 83662, n=25) | |
| SCHENKER XMG Neo 16 E23 (v6.75.6100) | |
| Media della classe Gaming (12321 - 134044, n=205, ultimi 2 anni) | |
| Medion Erazer Beast X40 2024 | |
| Alienware x16 R2 P120F (v6.92.6600) | |
| AIDA64 / CPU AES | |
| Asus ROG Strix Scar 17 G733PYV-LL053X (v6.88.6413 Beta) | |
| Asus ROG Strix Scar 16 G634JZR (v6.92.6600) | |
| SCHENKER XMG Neo 16 E23 (v6.75.6100) | |
| SCHENKER XMG Neo 16 (Early 24) (v6.92.6600, Overboost, Oasis) | |
| SCHENKER XMG Neo 16 (Early 24) (v6.92.6600) | |
| Media Intel Core i9-14900HX (86964 - 241777, n=25) | |
| Lenovo Legion 9 16IRX9, RTX 4090 (v6.92.6600) | |
| Lenovo Legion Pro 7 RTX4090 (v6.85.6300) | |
| Razer Blade 16 2024, RTX 4090 (v6.92.6600) | |
| Media della classe Gaming (19065 - 328679, n=205, ultimi 2 anni) | |
| Medion Erazer Beast X40 2024 (v6.92.6600) | |
| Alienware x16 R2 P120F (v6.92.6600) | |
| AIDA64 / CPU ZLib | |
| SCHENKER XMG Neo 16 (Early 24) (v6.92.6600, Overboost, Oasis) | |
| SCHENKER XMG Neo 16 (Early 24) (v6.92.6600) | |
| Asus ROG Strix Scar 17 G733PYV-LL053X (v6.88.6413 Beta) | |
| Lenovo Legion 9 16IRX9, RTX 4090 (v6.92.6600) | |
| Lenovo Legion Pro 7 RTX4090 (v6.85.6300) | |
| Razer Blade 16 2024, RTX 4090 (v6.92.6600) | |
| Asus ROG Strix Scar 16 G634JZR (v6.92.6600) | |
| Media Intel Core i9-14900HX (1265 - 2292, n=25) | |
| SCHENKER XMG Neo 16 E23 (v6.75.6100) | |
| Medion Erazer Beast X40 2024 (v6.92.6600) | |
| Alienware x16 R2 P120F (v6.92.6600) | |
| Media della classe Gaming (269 - 2409, n=205, ultimi 2 anni) | |
| AIDA64 / FP64 Ray-Trace | |
| Asus ROG Strix Scar 17 G733PYV-LL053X (v6.88.6413 Beta) | |
| SCHENKER XMG Neo 16 (Early 24) (v6.92.6600, Overboost, Oasis) | |
| SCHENKER XMG Neo 16 (Early 24) (v6.92.6600) | |
| Lenovo Legion 9 16IRX9, RTX 4090 (v6.92.6600) | |
| Lenovo Legion Pro 7 RTX4090 (v6.85.6300) | |
| Asus ROG Strix Scar 16 G634JZR (v6.92.6600) | |
| Razer Blade 16 2024, RTX 4090 (v6.92.6600) | |
| Media Intel Core i9-14900HX (9170 - 18349, n=25) | |
| SCHENKER XMG Neo 16 E23 (v6.75.6100) | |
| Medion Erazer Beast X40 2024 (v6.92.6600) | |
| Media della classe Gaming (2540 - 31796, n=205, ultimi 2 anni) | |
| Alienware x16 R2 P120F (v6.92.6600) | |
| AIDA64 / CPU PhotoWorxx | |
| Lenovo Legion 9 16IRX9, RTX 4090 (v6.92.6600) | |
| Alienware x16 R2 P120F (v6.92.6600) | |
| Lenovo Legion Pro 7 RTX4090 (v6.85.6300) | |
| Asus ROG Strix Scar 16 G634JZR (v6.92.6600) | |
| Razer Blade 16 2024, RTX 4090 (v6.92.6600) | |
| SCHENKER XMG Neo 16 (Early 24) (v6.92.6600, Overboost, Oasis) | |
| SCHENKER XMG Neo 16 (Early 24) (v6.92.6600) | |
| Medion Erazer Beast X40 2024 (v6.92.6600) | |
| SCHENKER XMG Neo 16 E23 (v6.75.6100) | |
| Media Intel Core i9-14900HX (33960 - 54702, n=25) | |
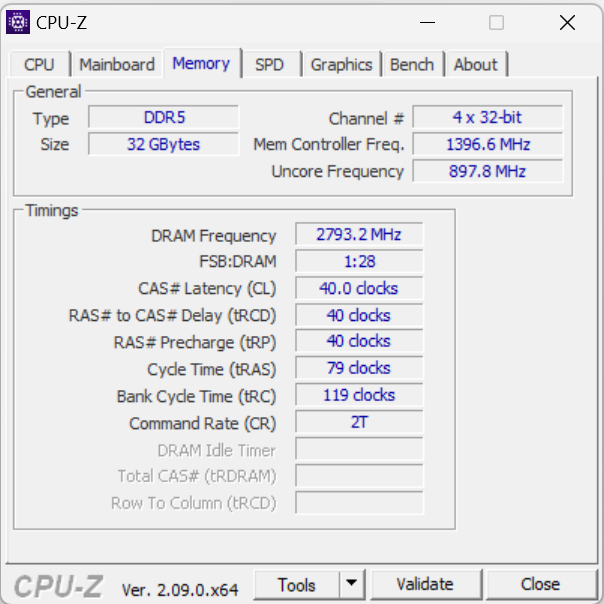
| Media della classe Gaming (10805 - 60161, n=206, ultimi 2 anni) | |
| Asus ROG Strix Scar 17 G733PYV-LL053X (v6.88.6413 Beta) | |
Prestazioni del sistema
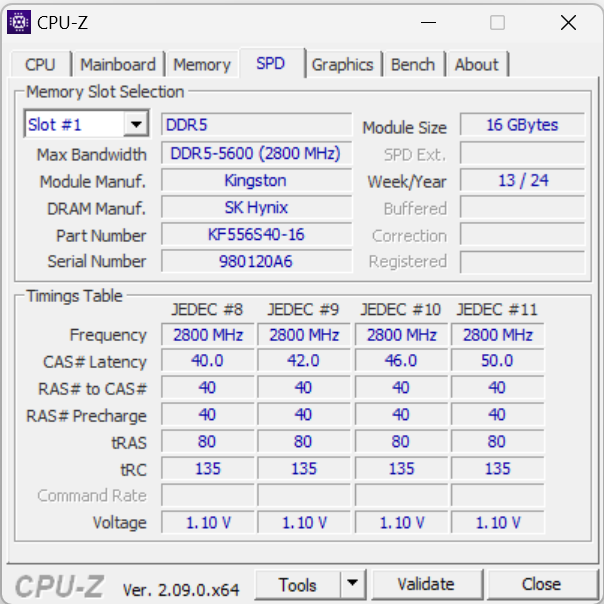
L'elenco delle specifiche tecniche lo rivela già: La potenza di calcolo non manca - non da ultimo, lo confermano gli ottimi punteggi di PCMark. Il gioco, lo streaming e il rendering dovrebbero essere le aree operative principali di questo computer veloce. Le velocità di trasferimento della RAM sono nella norma per una RAM DDR5 5600.
CrossMark: Overall | Productivity | Creativity | Responsiveness
WebXPRT 3: Overall
WebXPRT 4: Overall
Mozilla Kraken 1.1: Total
| PCMark 10 / Score | |
| Asus ROG Strix Scar 17 G733PYV-LL053X | |
| SCHENKER XMG Neo 16 (Early 24) | |
| Medion Erazer Beast X40 2024 | |
| Media Intel Core i9-14900HX, NVIDIA GeForce RTX 4090 Laptop GPU (8230 - 9234, n=10) | |
| Razer Blade 16 2024, RTX 4090 | |
| SCHENKER XMG Neo 16 E23 | |
| Lenovo Legion 9 16IRX9, RTX 4090 | |
| Lenovo Legion Pro 7 RTX4090 | |
| Asus ROG Strix Scar 16 G634JZR | |
| Media della classe Gaming (5442 - 9852, n=185, ultimi 2 anni) | |
| Alienware x16 R2 P120F | |
| PCMark 10 / Essentials | |
| Asus ROG Strix Scar 16 G634JZR | |
| Asus ROG Strix Scar 17 G733PYV-LL053X | |
| Media Intel Core i9-14900HX, NVIDIA GeForce RTX 4090 Laptop GPU (10871 - 11628, n=10) | |
| Lenovo Legion Pro 7 RTX4090 | |
| SCHENKER XMG Neo 16 (Early 24) | |
| Lenovo Legion 9 16IRX9, RTX 4090 | |
| SCHENKER XMG Neo 16 E23 | |
| Razer Blade 16 2024, RTX 4090 | |
| Medion Erazer Beast X40 2024 | |
| Media della classe Gaming (8829 - 12334, n=184, ultimi 2 anni) | |
| Alienware x16 R2 P120F | |
| PCMark 10 / Productivity | |
| Medion Erazer Beast X40 2024 | |
| SCHENKER XMG Neo 16 (Early 24) | |
| Razer Blade 16 2024, RTX 4090 | |
| Asus ROG Strix Scar 17 G733PYV-LL053X | |
| Media Intel Core i9-14900HX, NVIDIA GeForce RTX 4090 Laptop GPU (9951 - 11759, n=10) | |
| Lenovo Legion 9 16IRX9, RTX 4090 | |
| SCHENKER XMG Neo 16 E23 | |
| Media della classe Gaming (6662 - 14612, n=184, ultimi 2 anni) | |
| Lenovo Legion Pro 7 RTX4090 | |
| Alienware x16 R2 P120F | |
| Asus ROG Strix Scar 16 G634JZR | |
| PCMark 10 / Digital Content Creation | |
| Asus ROG Strix Scar 17 G733PYV-LL053X | |
| Asus ROG Strix Scar 16 G634JZR | |
| SCHENKER XMG Neo 16 (Early 24) | |
| Medion Erazer Beast X40 2024 | |
| Media Intel Core i9-14900HX, NVIDIA GeForce RTX 4090 Laptop GPU (13219 - 16462, n=10) | |
| SCHENKER XMG Neo 16 E23 | |
| Lenovo Legion Pro 7 RTX4090 | |
| Lenovo Legion 9 16IRX9, RTX 4090 | |
| Razer Blade 16 2024, RTX 4090 | |
| Alienware x16 R2 P120F | |
| Media della classe Gaming (6462 - 18475, n=184, ultimi 2 anni) | |
| CrossMark / Overall | |
| SCHENKER XMG Neo 16 (Early 24) | |
| Razer Blade 16 2024, RTX 4090 | |
| Medion Erazer Beast X40 2024 | |
| Media Intel Core i9-14900HX, NVIDIA GeForce RTX 4090 Laptop GPU (1877 - 2344, n=10) | |
| SCHENKER XMG Neo 16 E23 | |
| Asus ROG Strix Scar 17 G733PYV-LL053X | |
| Asus ROG Strix Scar 16 G634JZR | |
| Lenovo Legion 9 16IRX9, RTX 4090 | |
| Media della classe Gaming (1247 - 2344, n=162, ultimi 2 anni) | |
| Alienware x16 R2 P120F | |
| CrossMark / Productivity | |
| SCHENKER XMG Neo 16 (Early 24) | |
| Medion Erazer Beast X40 2024 | |
| Razer Blade 16 2024, RTX 4090 | |
| Media Intel Core i9-14900HX, NVIDIA GeForce RTX 4090 Laptop GPU (1738 - 2162, n=10) | |
| SCHENKER XMG Neo 16 E23 | |
| Asus ROG Strix Scar 17 G733PYV-LL053X | |
| Asus ROG Strix Scar 16 G634JZR | |
| Media della classe Gaming (1299 - 2204, n=162, ultimi 2 anni) | |
| Lenovo Legion 9 16IRX9, RTX 4090 | |
| Alienware x16 R2 P120F | |
| CrossMark / Creativity | |
| SCHENKER XMG Neo 16 (Early 24) | |
| SCHENKER XMG Neo 16 E23 | |
| Razer Blade 16 2024, RTX 4090 | |
| Asus ROG Strix Scar 17 G733PYV-LL053X | |
| Media Intel Core i9-14900HX, NVIDIA GeForce RTX 4090 Laptop GPU (2195 - 2660, n=10) | |
| Asus ROG Strix Scar 16 G634JZR | |
| Medion Erazer Beast X40 2024 | |
| Lenovo Legion 9 16IRX9, RTX 4090 | |
| Media della classe Gaming (1275 - 2660, n=162, ultimi 2 anni) | |
| Alienware x16 R2 P120F | |
| CrossMark / Responsiveness | |
| SCHENKER XMG Neo 16 (Early 24) | |
| Medion Erazer Beast X40 2024 | |
| Media Intel Core i9-14900HX, NVIDIA GeForce RTX 4090 Laptop GPU (1478 - 2327, n=10) | |
| Razer Blade 16 2024, RTX 4090 | |
| Lenovo Legion 9 16IRX9, RTX 4090 | |
| Asus ROG Strix Scar 16 G634JZR | |
| SCHENKER XMG Neo 16 E23 | |
| Media della classe Gaming (1030 - 2330, n=162, ultimi 2 anni) | |
| Asus ROG Strix Scar 17 G733PYV-LL053X | |
| Alienware x16 R2 P120F | |
| WebXPRT 3 / Overall | |
| Asus ROG Strix Scar 17 G733PYV-LL053X | |
| SCHENKER XMG Neo 16 (Early 24) | |
| SCHENKER XMG Neo 16 E23 | |
| Razer Blade 16 2024, RTX 4090 | |
| Medion Erazer Beast X40 2024 | |
| Media Intel Core i9-14900HX, NVIDIA GeForce RTX 4090 Laptop GPU (279 - 339, n=9) | |
| Asus ROG Strix Scar 16 G634JZR | |
| Media della classe Gaming (215 - 480, n=186, ultimi 2 anni) | |
| Lenovo Legion 9 16IRX9, RTX 4090 | |
| Lenovo Legion Pro 7 RTX4090 | |
| Alienware x16 R2 P120F | |
| WebXPRT 4 / Overall | |
| Asus ROG Strix Scar 17 G733PYV-LL053X | |
| Asus ROG Strix Scar 16 G634JZR | |
| SCHENKER XMG Neo 16 (Early 24) | |
| SCHENKER XMG Neo 16 E23 | |
| Medion Erazer Beast X40 2024 | |
| Media Intel Core i9-14900HX, NVIDIA GeForce RTX 4090 Laptop GPU (246 - 309, n=7) | |
| Lenovo Legion Pro 7 RTX4090 | |
| Media della classe Gaming (157.9 - 328, n=168, ultimi 2 anni) | |
| Lenovo Legion 9 16IRX9, RTX 4090 | |
| Alienware x16 R2 P120F | |
| Mozilla Kraken 1.1 / Total | |
| Alienware x16 R2 P120F | |
| Lenovo Legion 9 16IRX9, RTX 4090 | |
| Media della classe Gaming (421 - 737, n=197, ultimi 2 anni) | |
| Lenovo Legion Pro 7 RTX4090 | |
| Media Intel Core i9-14900HX, NVIDIA GeForce RTX 4090 Laptop GPU (428 - 535, n=10) | |
| SCHENKER XMG Neo 16 E23 | |
| Razer Blade 16 2024, RTX 4090 | |
| Asus ROG Strix Scar 16 G634JZR | |
| Medion Erazer Beast X40 2024 | |
| SCHENKER XMG Neo 16 (Early 24) | |
| Asus ROG Strix Scar 17 G733PYV-LL053X | |
* ... Meglio usare valori piccoli
| PCMark 10 Score | 9017 punti | |
Aiuto | ||
| AIDA64 / Memory Copy | |
| Alienware x16 R2 P120F | |
| Lenovo Legion 9 16IRX9, RTX 4090 | |
| SCHENKER XMG Neo 16 (Early 24) | |
| Asus ROG Strix Scar 16 G634JZR | |
| Razer Blade 16 2024, RTX 4090 | |
| SCHENKER XMG Neo 16 (Early 24) | |
| Lenovo Legion Pro 7 RTX4090 | |
| Medion Erazer Beast X40 2024 | |
| Media Intel Core i9-14900HX (56992 - 83392, n=25) | |
| SCHENKER XMG Neo 16 E23 | |
| Media della classe Gaming (21842 - 94222, n=205, ultimi 2 anni) | |
| Asus ROG Strix Scar 17 G733PYV-LL053X | |
| AIDA64 / Memory Read | |
| Asus ROG Strix Scar 16 G634JZR | |
| SCHENKER XMG Neo 16 (Early 24) | |
| Lenovo Legion Pro 7 RTX4090 | |
| SCHENKER XMG Neo 16 (Early 24) | |
| Razer Blade 16 2024, RTX 4090 | |
| Medion Erazer Beast X40 2024 | |
| Alienware x16 R2 P120F | |
| Media Intel Core i9-14900HX (54443 - 87507, n=25) | |
| SCHENKER XMG Neo 16 E23 | |
| Lenovo Legion 9 16IRX9, RTX 4090 | |
| Media della classe Gaming (23681 - 90647, n=205, ultimi 2 anni) | |
| Asus ROG Strix Scar 17 G733PYV-LL053X | |
| AIDA64 / Memory Write | |
| Lenovo Legion 9 16IRX9, RTX 4090 | |
| SCHENKER XMG Neo 16 (Early 24) | |
| SCHENKER XMG Neo 16 (Early 24) | |
| Asus ROG Strix Scar 16 G634JZR | |
| Medion Erazer Beast X40 2024 | |
| Lenovo Legion Pro 7 RTX4090 | |
| Razer Blade 16 2024, RTX 4090 | |
| Media Intel Core i9-14900HX (51387 - 80589, n=25) | |
| Alienware x16 R2 P120F | |
| SCHENKER XMG Neo 16 E23 | |
| Media della classe Gaming (22986 - 103259, n=205, ultimi 2 anni) | |
| Asus ROG Strix Scar 17 G733PYV-LL053X | |
| AIDA64 / Memory Latency | |
| Alienware x16 R2 P120F | |
| Lenovo Legion 9 16IRX9, RTX 4090 | |
| Media della classe Gaming (59.5 - 152.5, n=203, ultimi 2 anni) | |
| Asus ROG Strix Scar 17 G733PYV-LL053X | |
| SCHENKER XMG Neo 16 E23 | |
| Lenovo Legion Pro 7 RTX4090 | |
| Media Intel Core i9-14900HX (76.1 - 105, n=25) | |
| Razer Blade 16 2024, RTX 4090 | |
| Medion Erazer Beast X40 2024 | |
| Asus ROG Strix Scar 16 G634JZR | |
| SCHENKER XMG Neo 16 (Early 24) | |
| SCHENKER XMG Neo 16 (Early 24) | |
* ... Meglio usare valori piccoli
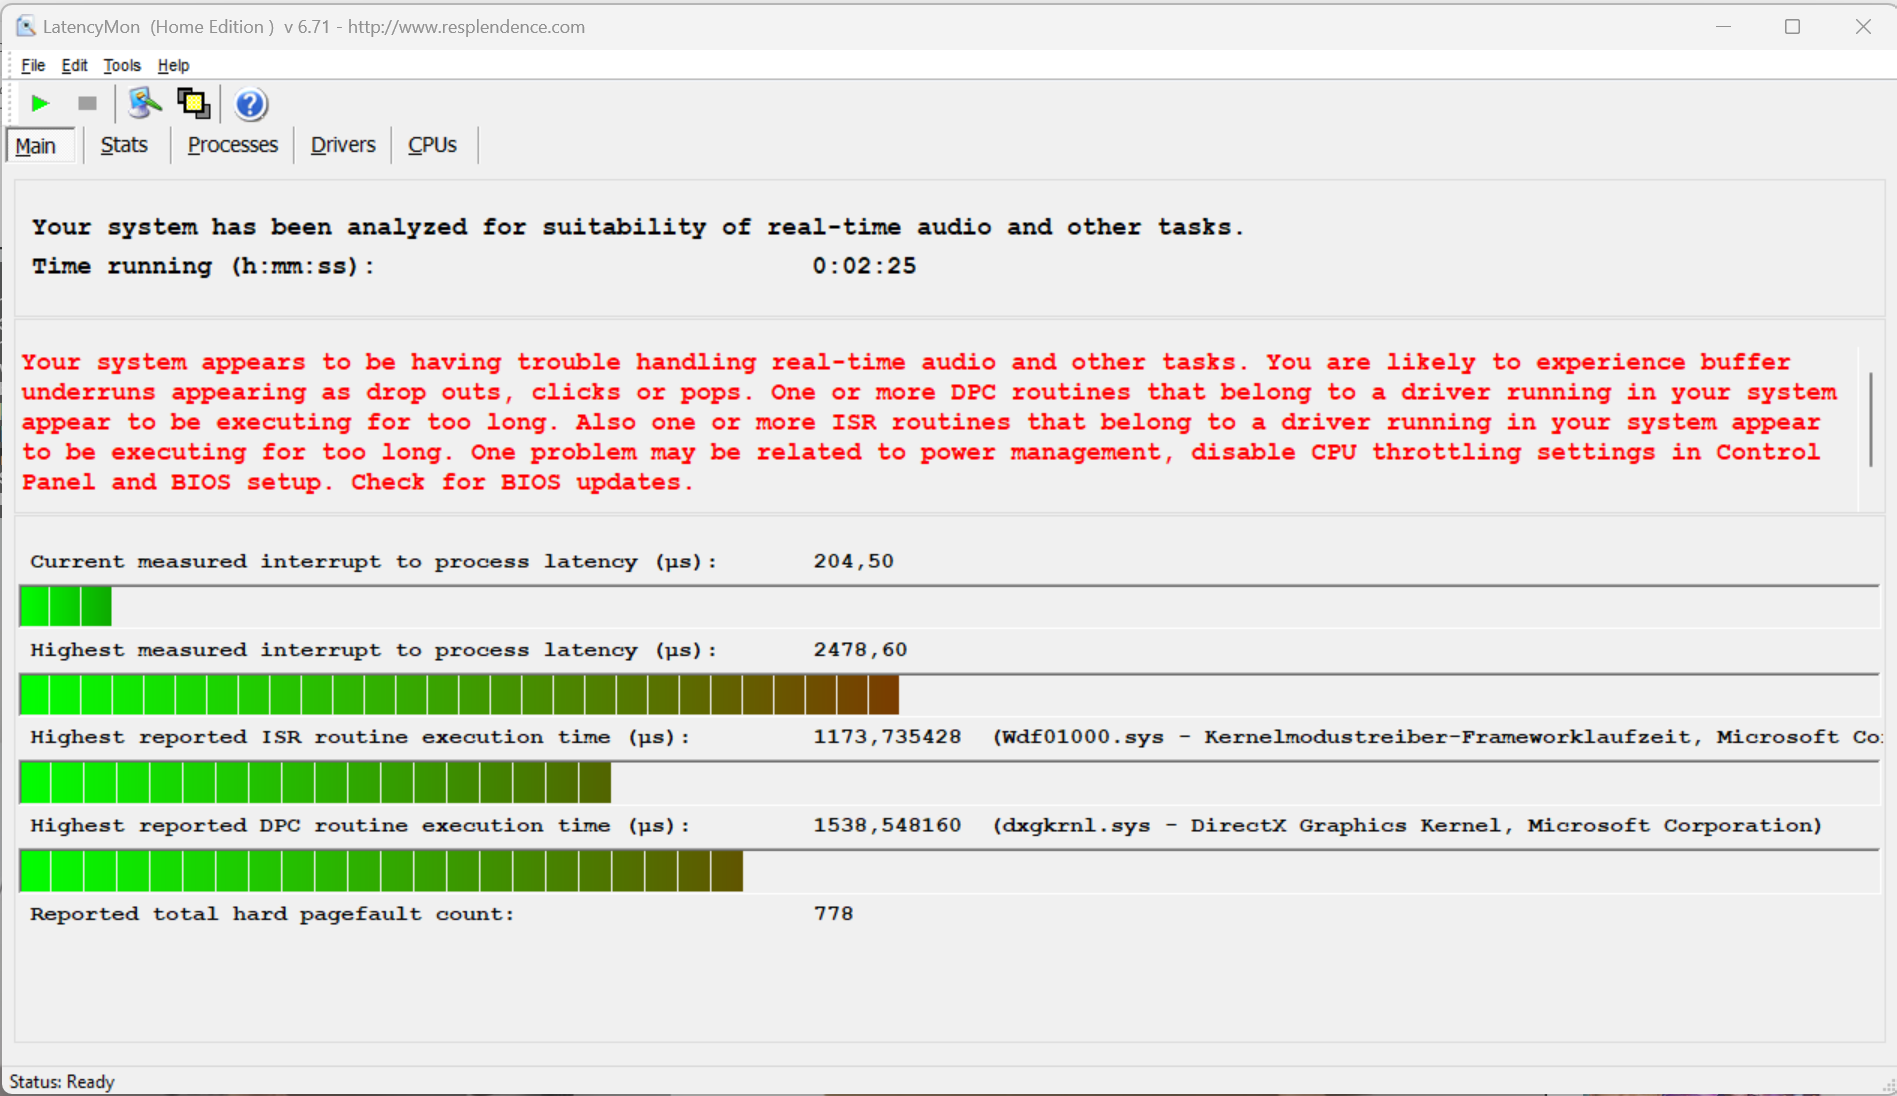
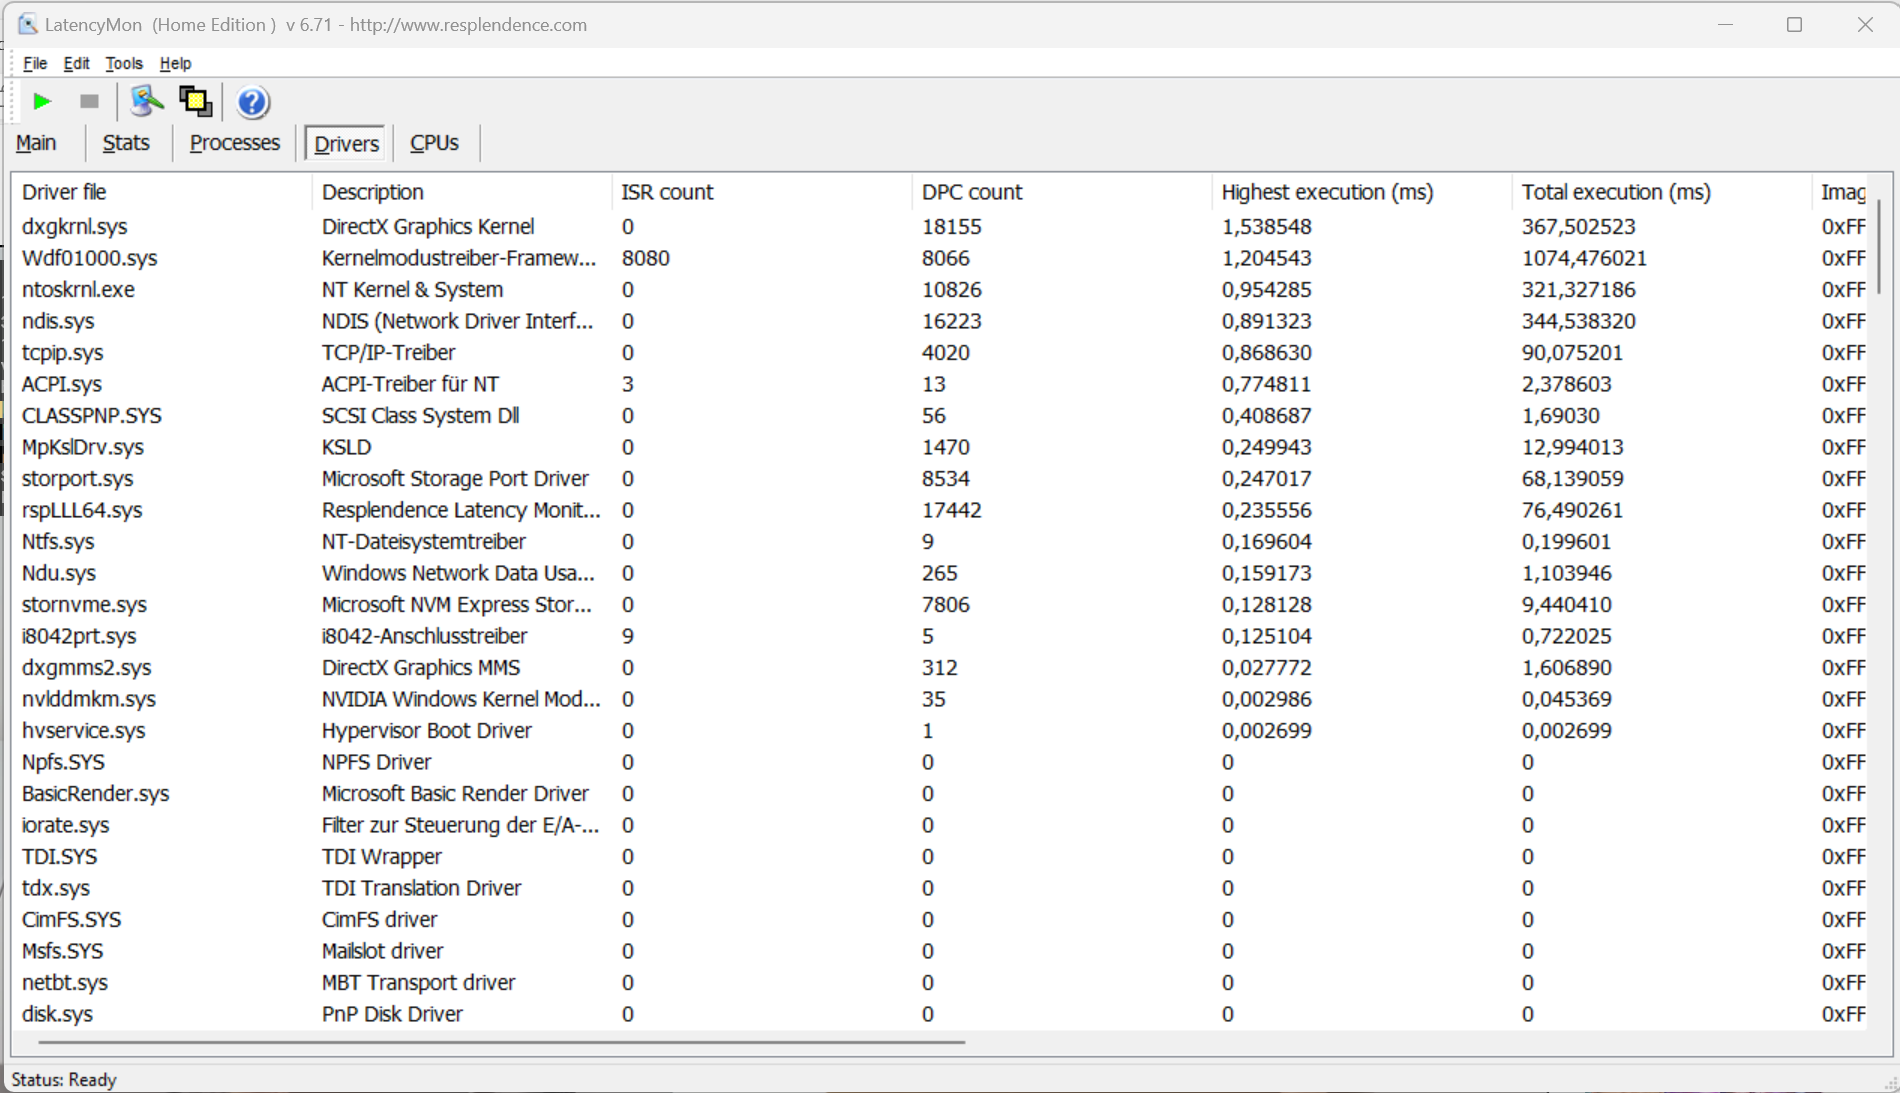
Latenze DPC
Il test standardizzato Latency Monitor (navigazione in Internet, riproduzione di video 4k, Prime95 ad alto carico) ha rivelato alcune anomalie. Il sistema non sembra essere adatto all'editing video e audio in tempo reale. I futuri aggiornamenti del software potrebbero influire su questo aspetto.
| DPC Latencies / LatencyMon - interrupt to process latency (max), Web, Youtube, Prime95 | |
| SCHENKER XMG Neo 16 E23 | |
| SCHENKER XMG Neo 16 (Early 24) | |
| Razer Blade 16 2024, RTX 4090 | |
| Medion Erazer Beast X40 2024 | |
| Asus ROG Strix Scar 17 G733PYV-LL053X | |
* ... Meglio usare valori piccoli
Memoria di massa
Come di consueto, Schenker offre ai clienti un'ampia selezione di SSD sul suo negozio online - c'è spazio per due all'interno di Neo. Viene offerto il supporto RAID 0/1. L'SSD Samsung del dispositivo in prova (1 TB, PCIe 4, M.2 2280) offre buone velocità di trasferimento. Una caratteristica positiva è l'assenza di throttling termico.

* ... Meglio usare valori piccoli
Continuous Performance: DiskSpd Read Loop, Queue Depth 8
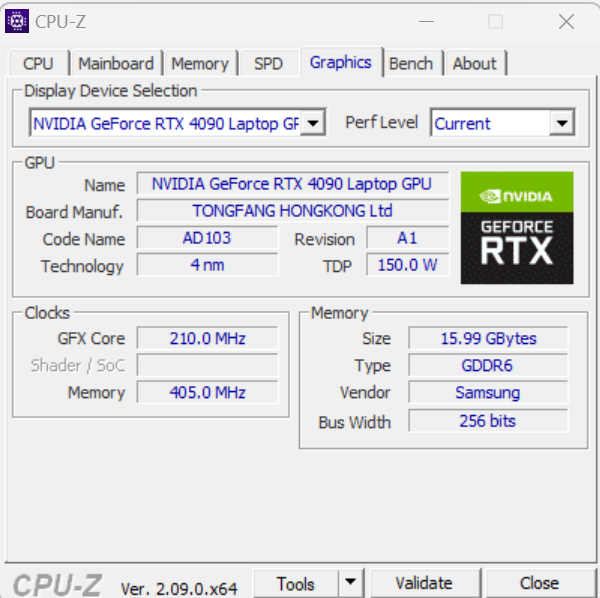
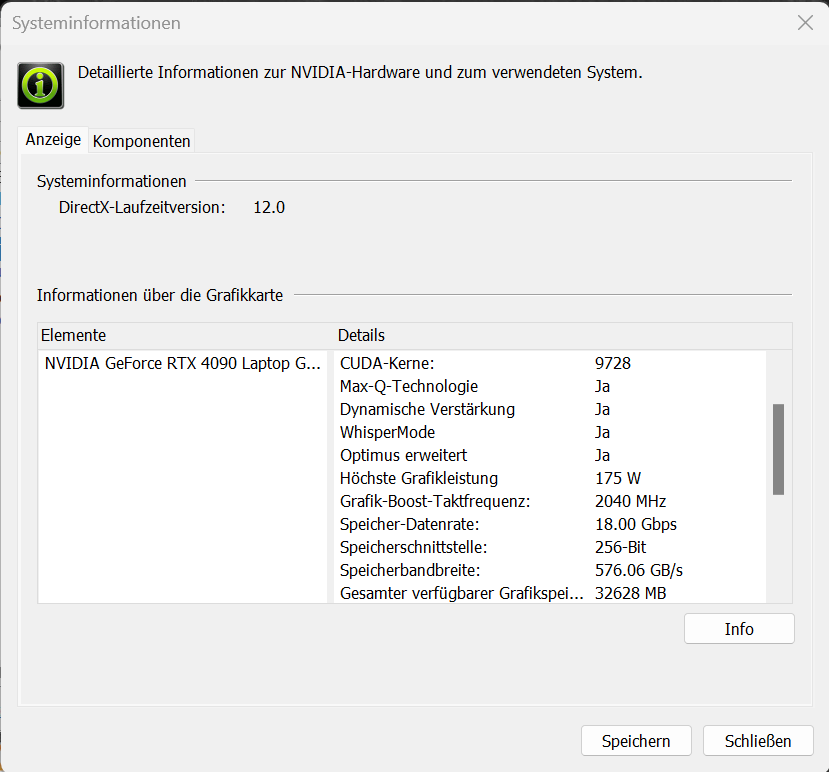
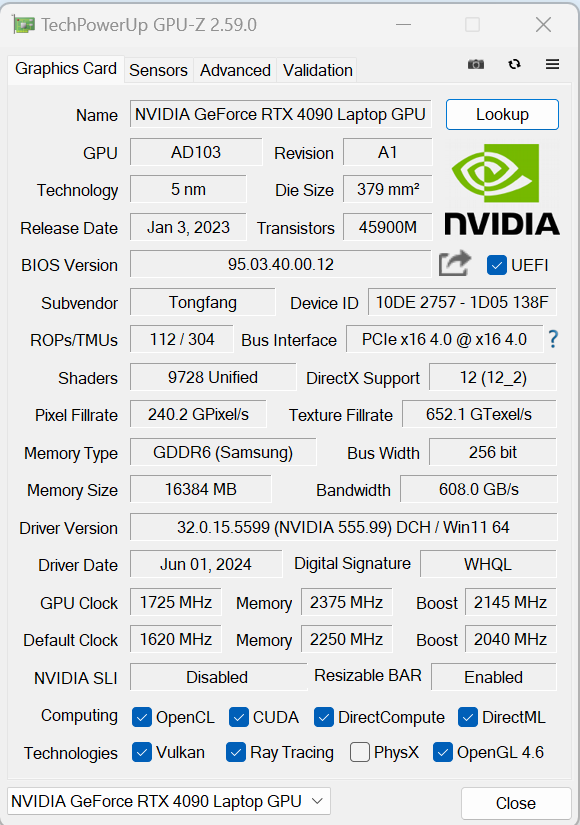
Scheda grafica
Attualmente, la GeForce RTX 4090 offre le prestazioni più elevate tra le GPU mobili di Nvidia. 9.728 shader, un bus a 256 bit e una veloce RAM GDDR6 (16.384 MB) caratterizzano l'acceleratore di pixel. Il TGP massimo è di 175 watt (150 watt + 25 watt di Dynamic Boost) - non è possibile fare di più.
I risultati dei benchmark sono superiori (Overboost) e inferiori (Enthusiast, Balanced) alla media della RTX 4090 fino ad ora. Il raffreddamento ad acqua Oasis aiuta a ottenere un piccolo aumento delle prestazioni. In ogni caso, il principale concorrente, il Blade 16è tenuto a distanza. La commutazione tra dGPU e Optimus non richiede un riavvio: Optimus avanzato è supportato.
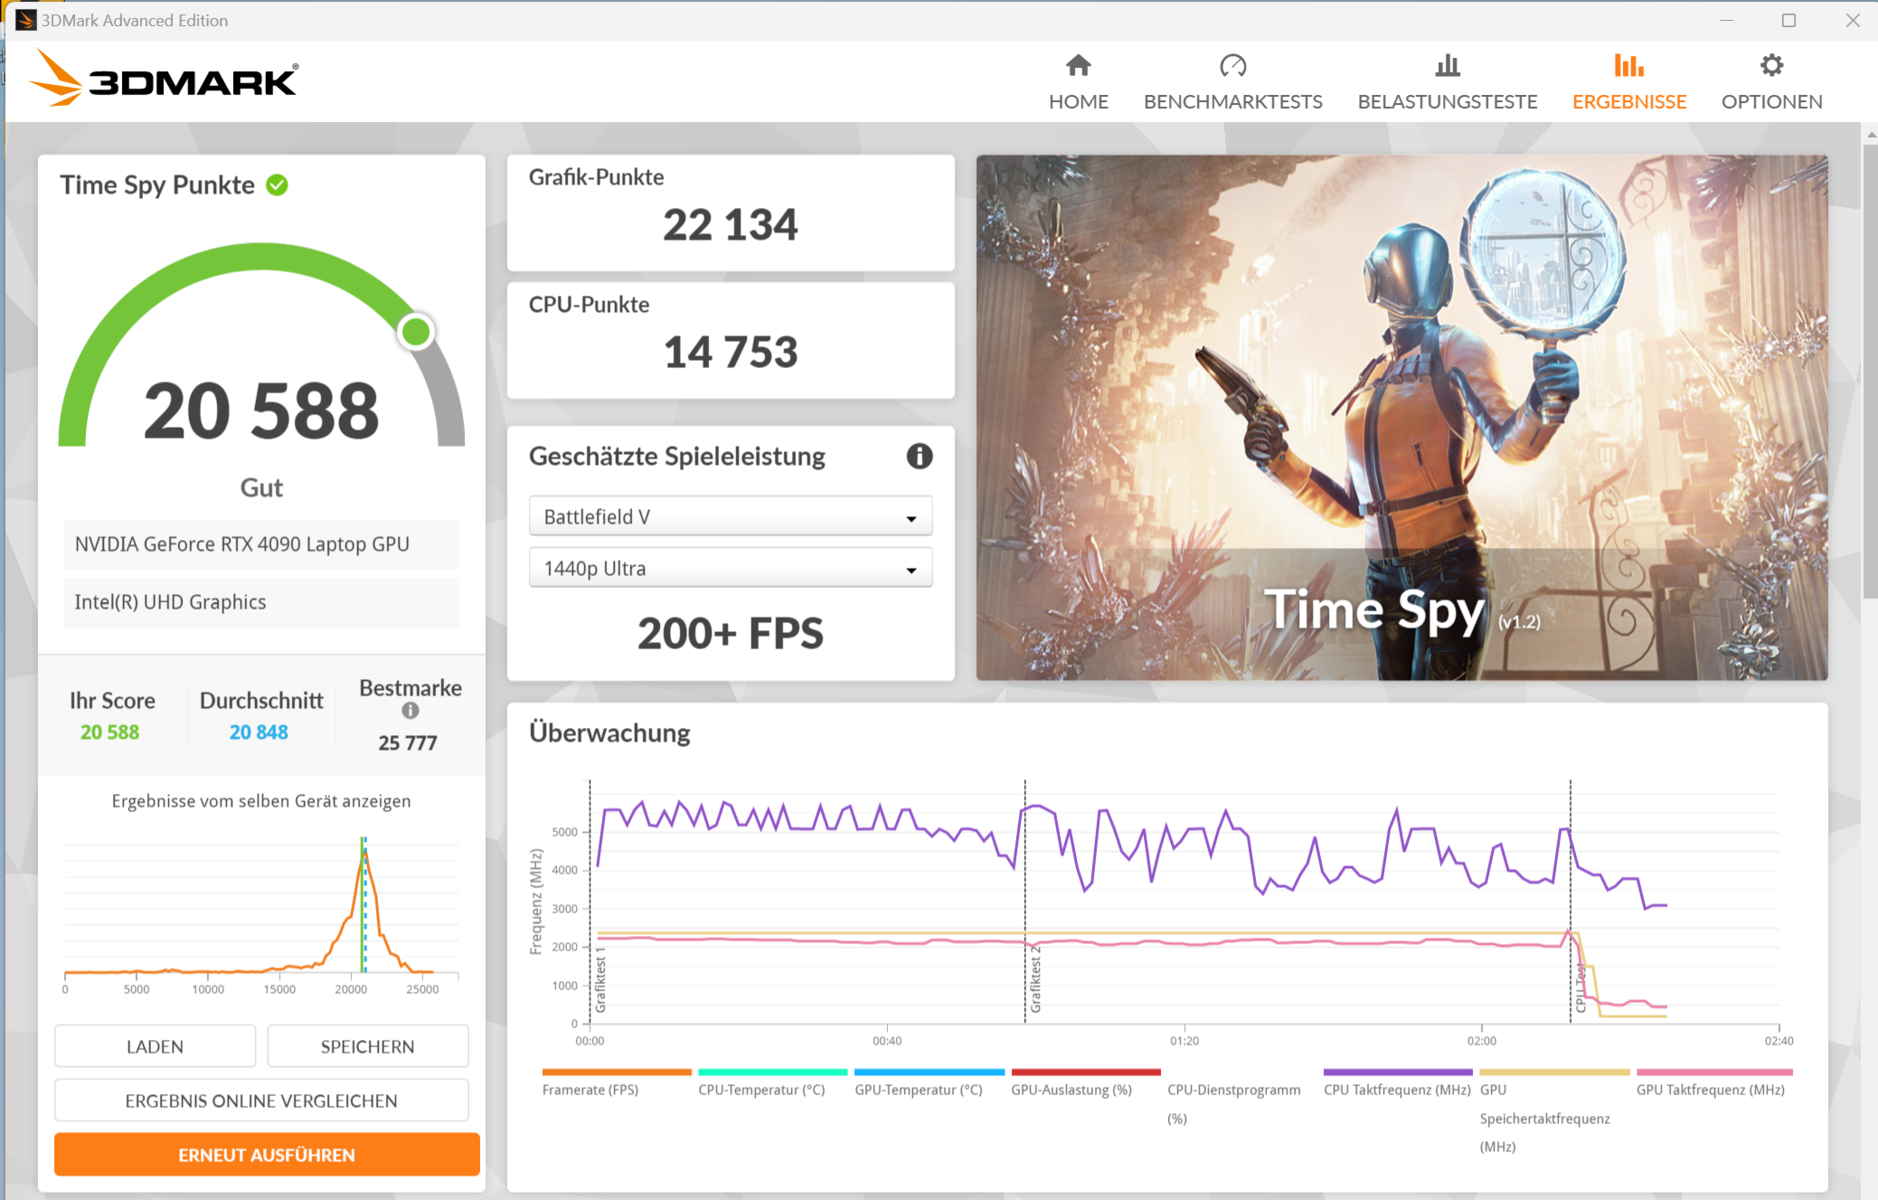
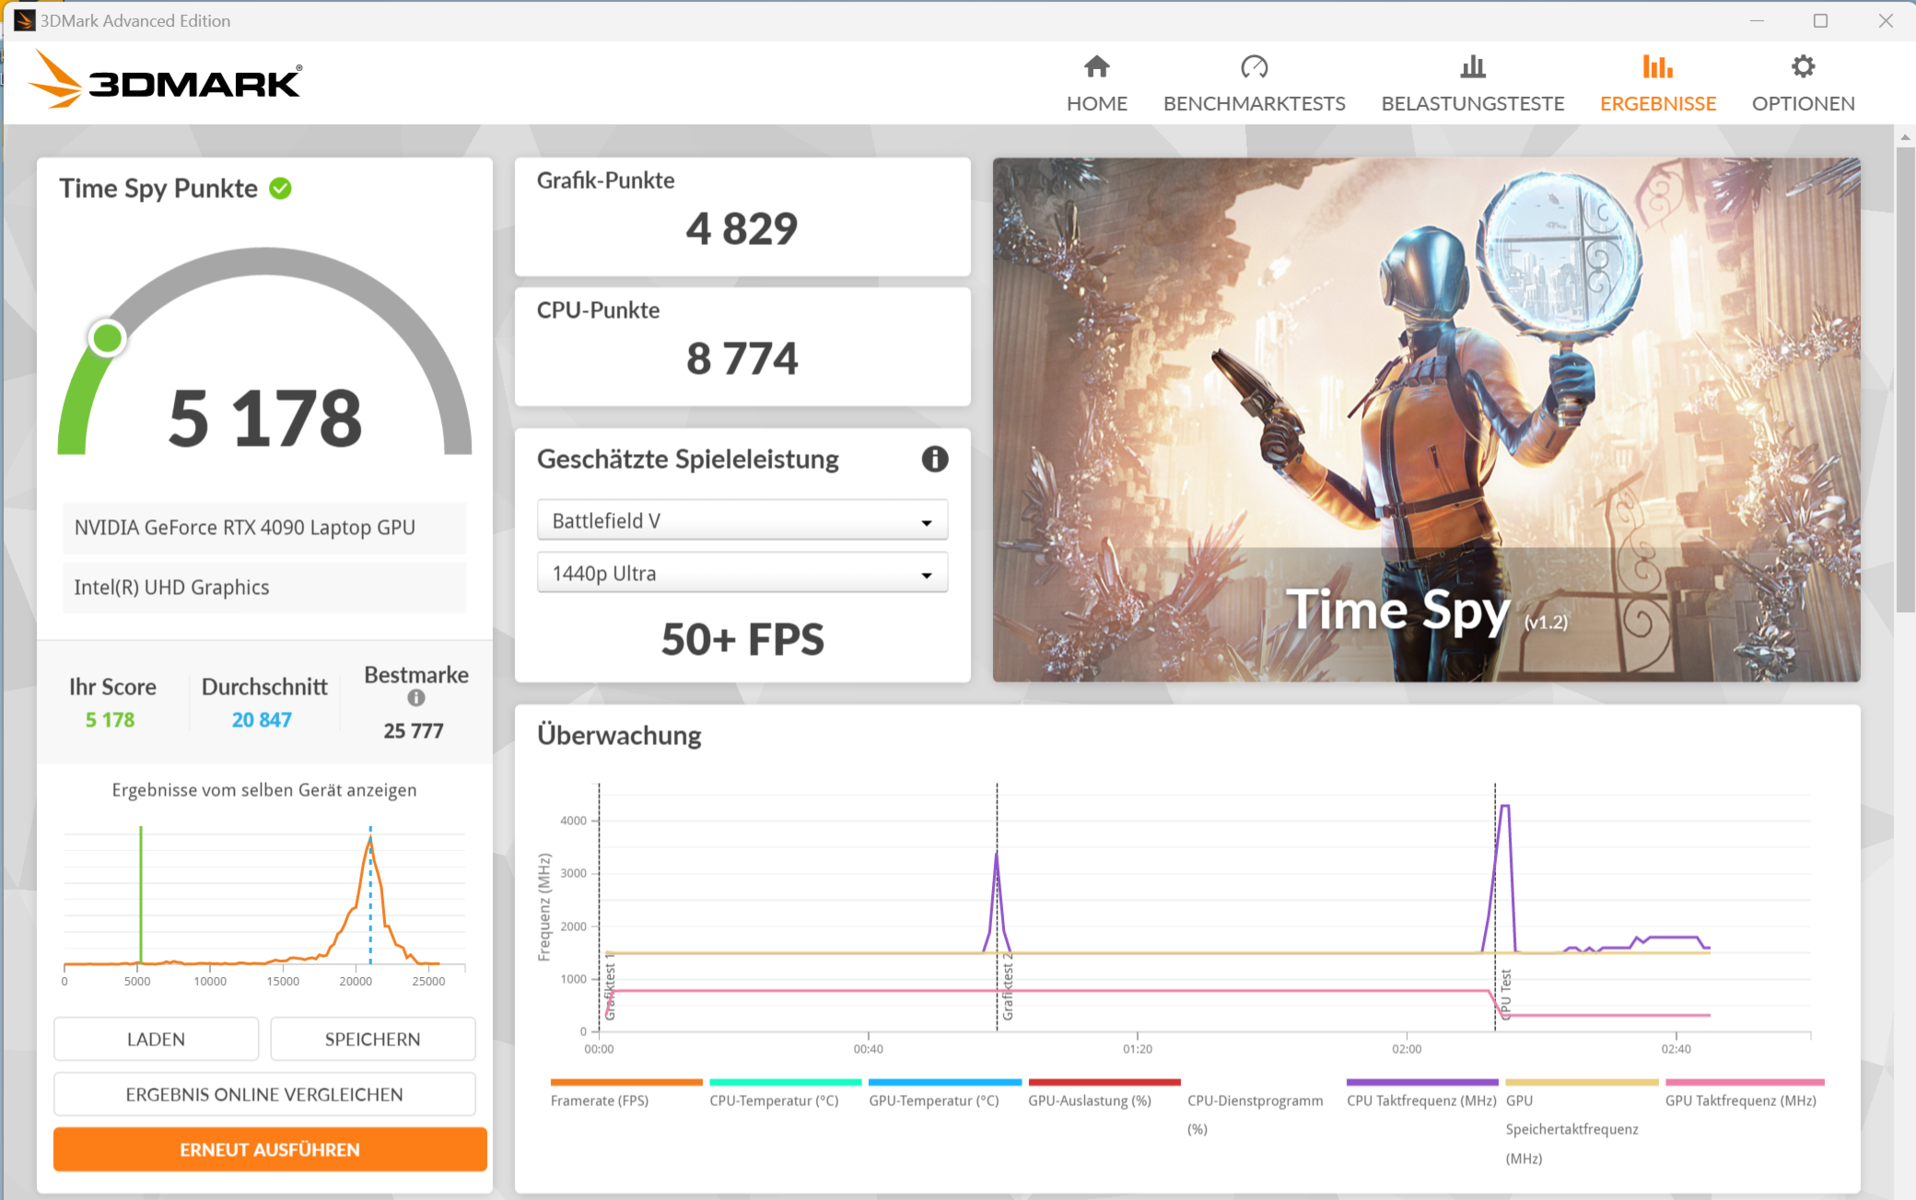
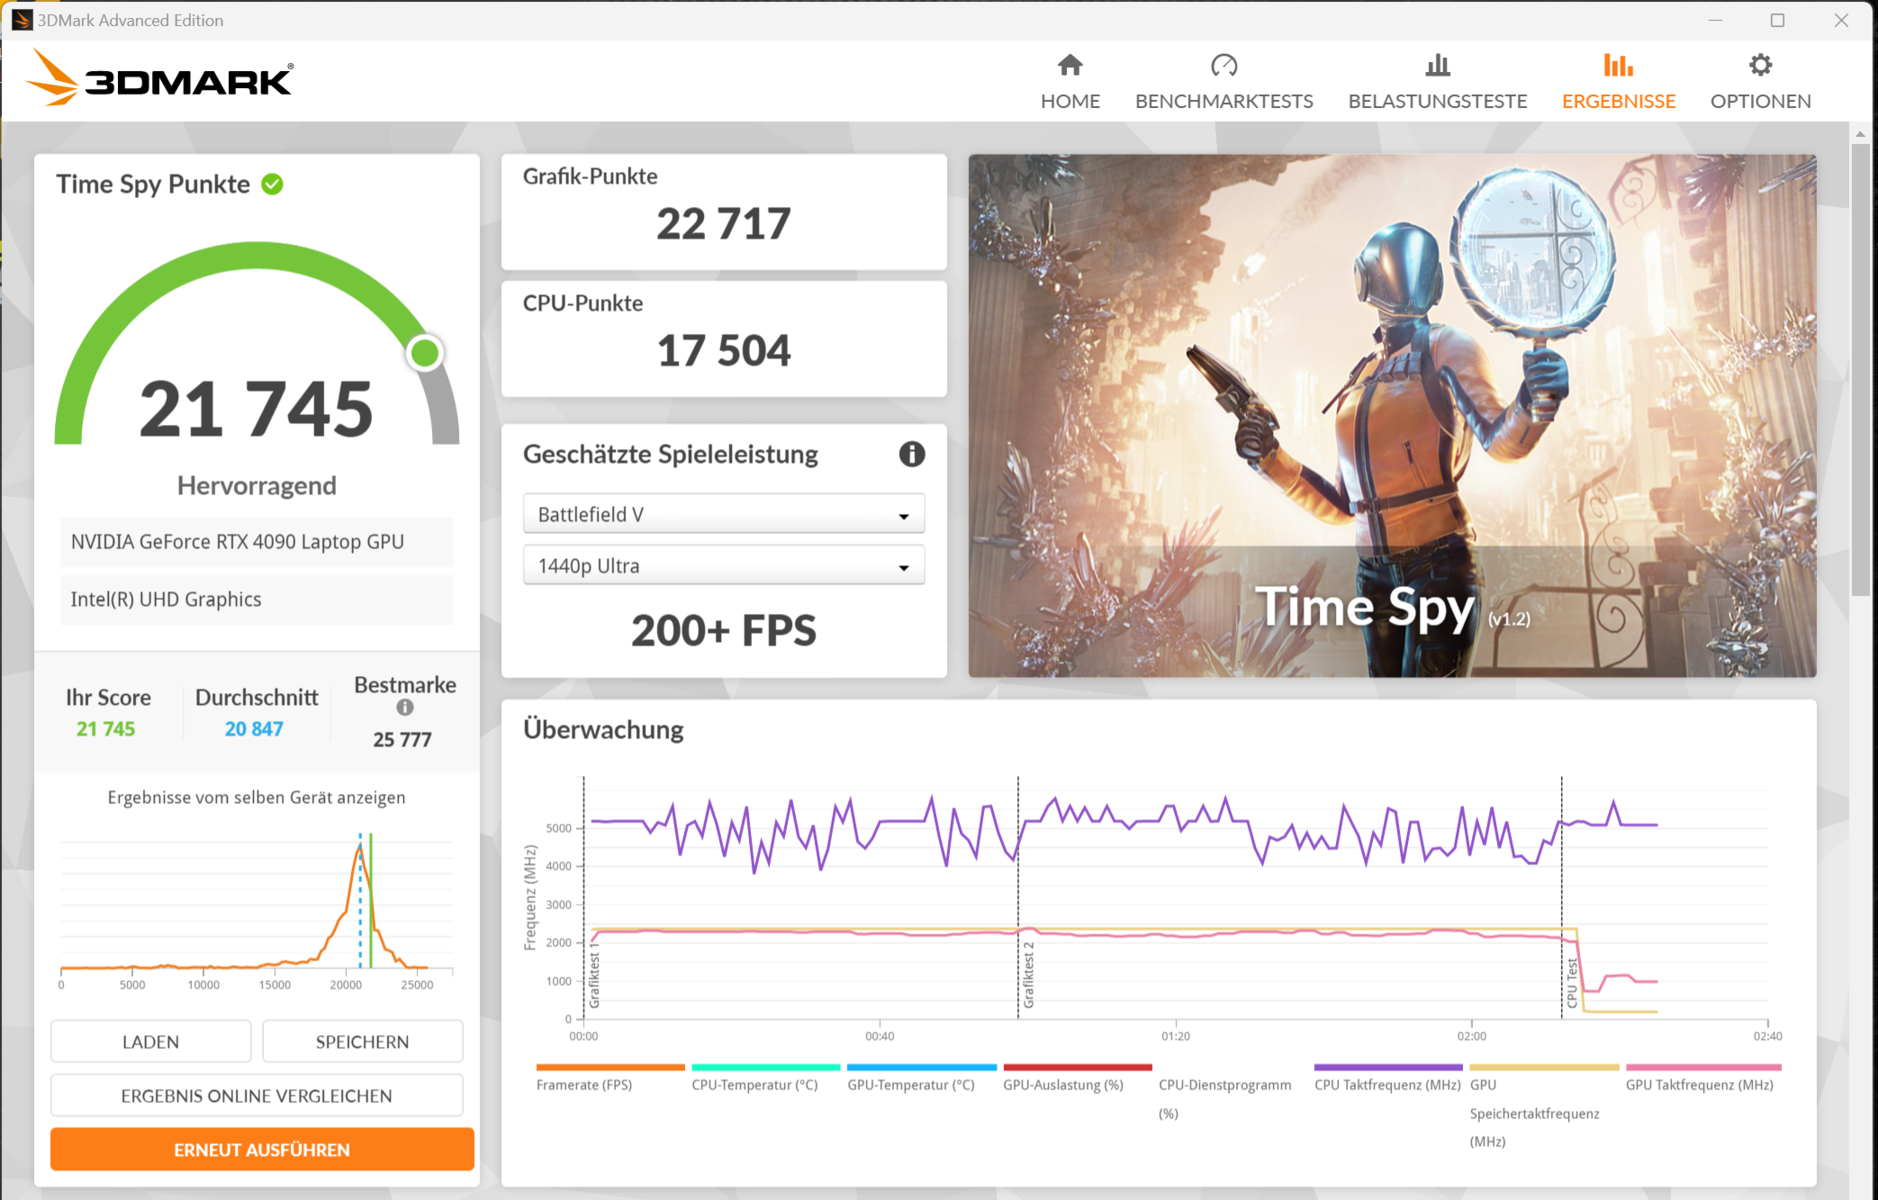
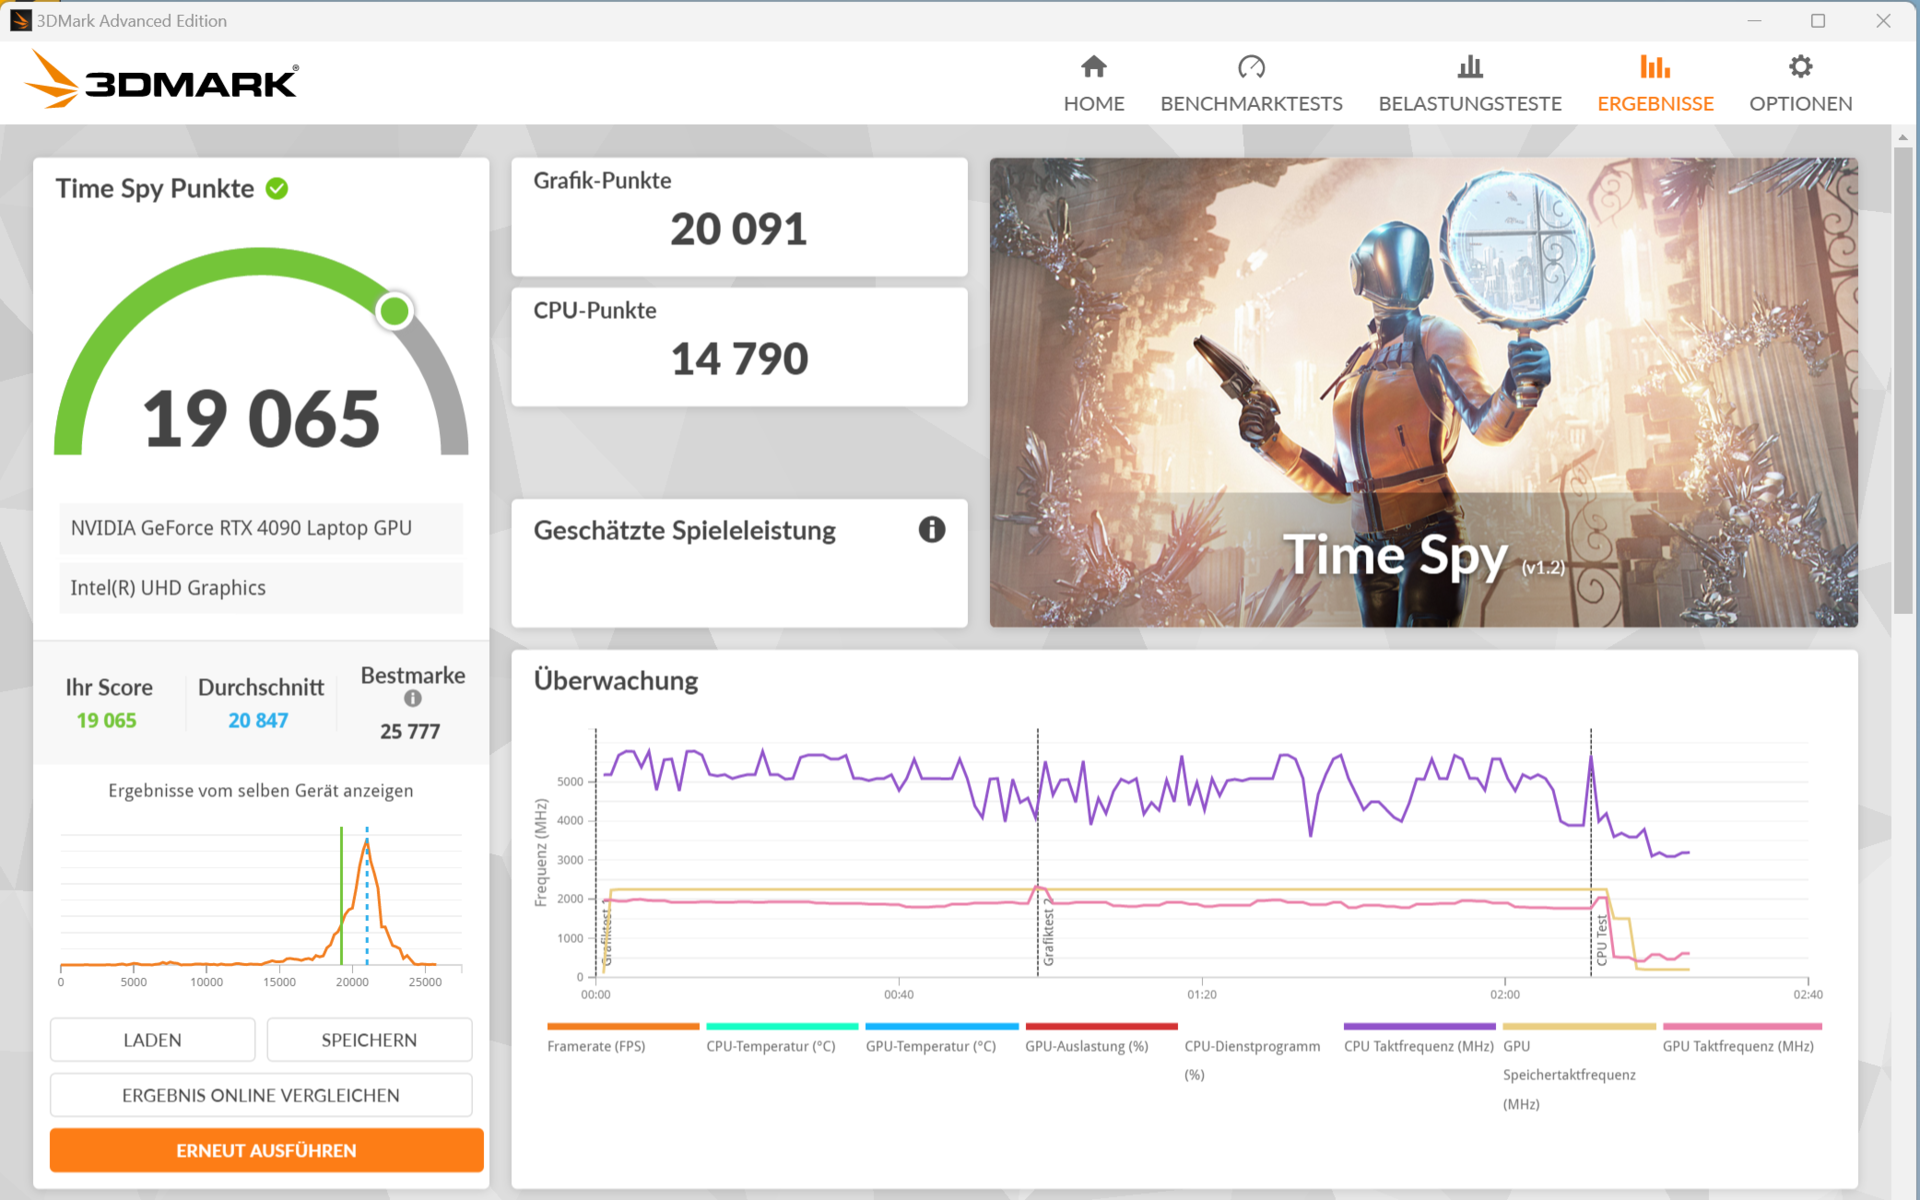
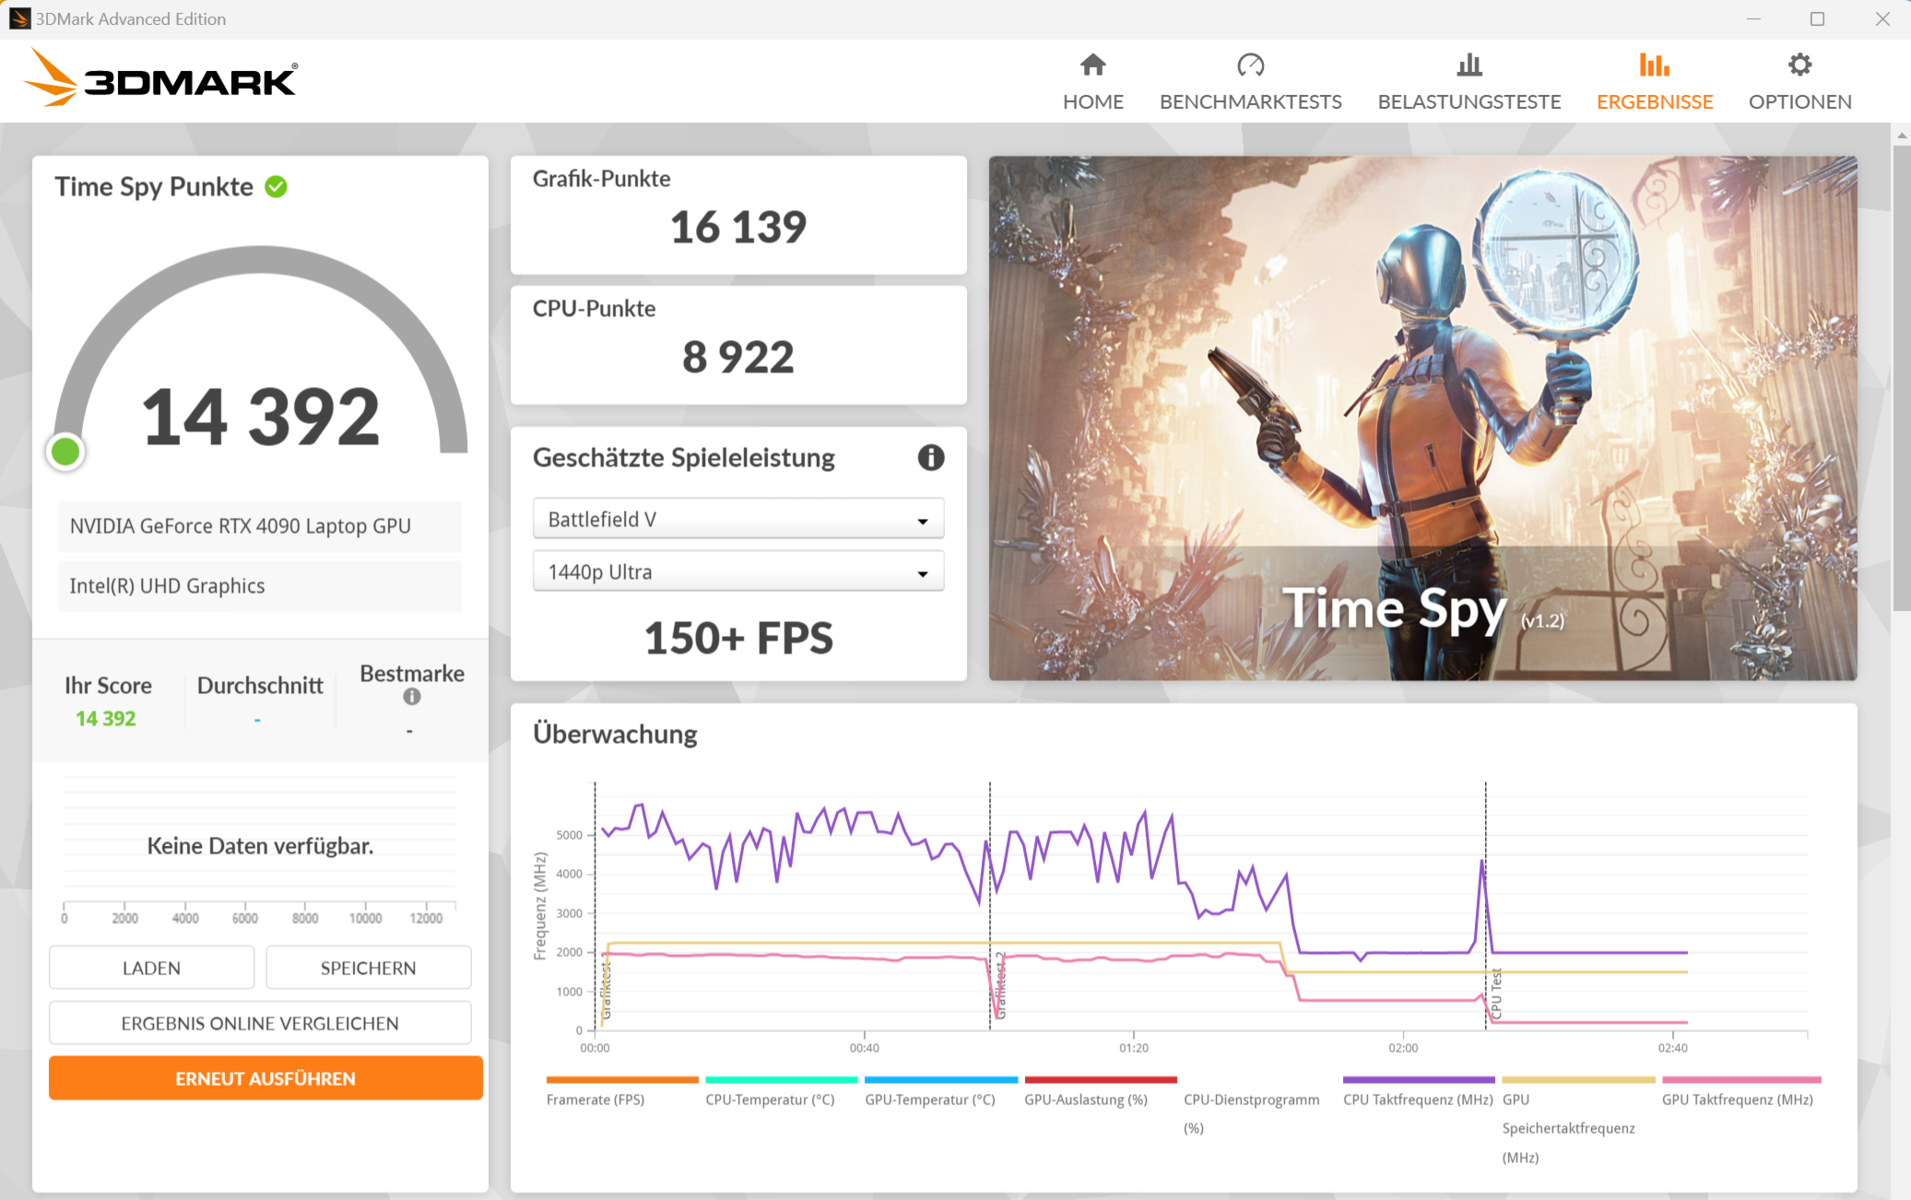
| 3DMark 06 Standard Score | 62889 punti | |
| 3DMark 11 Performance | 43829 punti | |
| 3DMark Fire Strike Score | 38597 punti | |
| 3DMark Time Spy Score | 20588 punti | |
| 3DMark Steel Nomad Score | 5102 punti | |
Aiuto | ||
| Geekbench 6.2 | |
| GPU Vulkan 6.2 | |
| Razer Blade 16 2024, RTX 4090 (6.2.1) | |
| Medion Erazer Beast X40 2024 (6.2.1) | |
| SCHENKER XMG Neo 16 (Early 24) (6.2.1) | |
| Asus ROG Strix Scar 17 G733PYV-LL053X | |
| SCHENKER XMG Neo 16 (Early 24) (6.2.1, Overboost, Oasis) | |
| Lenovo Legion 9 16IRX9, RTX 4090 (6.2.1) | |
| Media NVIDIA GeForce RTX 4090 Laptop GPU (9584 - 196201, n=16) | |
| Alienware x16 R2 P120F (6.2.1) | |
| Asus ROG Strix Scar 16 G634JZR (6.2.1) | |
| Media della classe Gaming (4286 - 196201, n=85, ultimi 2 anni) | |
| GPU OpenCL | |
| Medion Erazer Beast X40 2024 (6.2.1) | |
| SCHENKER XMG Neo 16 (Early 24) (6.2.1, Overboost, Oasis) | |
| Asus ROG Strix Scar 17 G733PYV-LL053X | |
| SCHENKER XMG Neo 16 (Early 24) (6.2.1) | |
| Lenovo Legion 9 16IRX9, RTX 4090 (6.2.1) | |
| Media NVIDIA GeForce RTX 4090 Laptop GPU (159127 - 209521, n=18) | |
| Razer Blade 16 2024, RTX 4090 (6.2.1) | |
| Asus ROG Strix Scar 16 G634JZR (6.2.1) | |
| Alienware x16 R2 P120F (6.2.1) | |
| Media della classe Gaming (4321 - 207373, n=87, ultimi 2 anni) | |
* ... Meglio usare valori piccoli
Prestazioni di gioco
Il computer XMG è progettato per gestire i giochi QHD con le impostazioni massime. I frame rate sono superiori alla media per la RTX 4090 (Overboost), con il raffreddamento ad acqua che aumenta leggermente le prestazioni. Le funzioni della GPU, Frame Generation e DLSS 3, consentirebbero risoluzioni più elevate alle impostazioni massime e con il ray-tracing - anche se solo con i giochi che offrono queste funzioni.
| The Witcher 3 - 1920x1080 Ultra Graphics & Postprocessing (HBAO+) | |
| SCHENKER XMG Neo 16 (Early 24) | |
| SCHENKER XMG Neo 16 (Early 24) (Overboost, Oasis) | |
| SCHENKER XMG Neo 16 E23 | |
| Asus ROG Strix Scar 17 G733PYV-LL053X | |
| Medion Erazer Beast X40 2024 | |
| Lenovo Legion 9 16IRX9, RTX 4090 | |
| Lenovo Legion Pro 7 RTX4090 | |
| Razer Blade 16 2024, RTX 4090 | |
| Media NVIDIA GeForce RTX 4090 Laptop GPU (139.2 - 216, n=35) | |
| Asus ROG Strix Scar 16 G634JZR | |
| Alienware x16 R2 P120F | |
| Media della classe Gaming (13.1 - 216, n=203, ultimi 2 anni) | |
| GTA V - 1920x1080 Highest Settings possible AA:4xMSAA + FX AF:16x | |
| Asus ROG Strix Scar 17 G733PYV-LL053X | |
| SCHENKER XMG Neo 16 (Early 24) (Overboost, Oasis) | |
| SCHENKER XMG Neo 16 (Early 24) | |
| SCHENKER XMG Neo 16 E23 | |
| Lenovo Legion Pro 7 RTX4090 | |
| Medion Erazer Beast X40 2024 | |
| Media NVIDIA GeForce RTX 4090 Laptop GPU (91.1 - 167.7, n=38) | |
| Asus ROG Strix Scar 16 G634JZR | |
| Razer Blade 16 2024, RTX 4090 | |
| Lenovo Legion 9 16IRX9, RTX 4090 | |
| Media della classe Gaming (6.38 - 167.7, n=191, ultimi 2 anni) | |
| Final Fantasy XV Benchmark - 1920x1080 High Quality | |
| SCHENKER XMG Neo 16 (Early 24) (1.3, Overboost, Oasis) | |
| SCHENKER XMG Neo 16 (Early 24) (1.3) | |
| SCHENKER XMG Neo 16 E23 (1.3) | |
| Lenovo Legion Pro 7 RTX4090 (1.3) | |
| Medion Erazer Beast X40 2024 (1.3) | |
| Asus ROG Strix Scar 17 G733PYV-LL053X (1.3) | |
| Asus ROG Strix Scar 16 G634JZR (1.3) | |
| Media NVIDIA GeForce RTX 4090 Laptop GPU (122.2 - 201, n=38) | |
| Lenovo Legion 9 16IRX9, RTX 4090 (1.3) | |
| Alienware x16 R2 P120F (1.3) | |
| Razer Blade 16 2024, RTX 4090 (1.3) | |
| Media della classe Gaming (9.13 - 201, n=204, ultimi 2 anni) | |
| Strange Brigade - 1920x1080 ultra AA:ultra AF:16 | |
| Asus ROG Strix Scar 17 G733PYV-LL053X (1.47.22.14 D3D12) | |
| SCHENKER XMG Neo 16 (Early 24) (1.47.22.14 D3D12, Overboost, Oasis) | |
| SCHENKER XMG Neo 16 (Early 24) (1.47.22.14 D3D12) | |
| SCHENKER XMG Neo 16 E23 (1.47.22.14 D3D12) | |
| Medion Erazer Beast X40 2024 (1.47.22.14 D3D12) | |
| Lenovo Legion 9 16IRX9, RTX 4090 (1.47.22.14 D3D12) | |
| Razer Blade 16 2024, RTX 4090 (1.47.22.14 D3D12) | |
| Media NVIDIA GeForce RTX 4090 Laptop GPU (233 - 421, n=37) | |
| Lenovo Legion Pro 7 RTX4090 (1.47.22.14 D3D12) | |
| Asus ROG Strix Scar 16 G634JZR (1.47.22.14 D3D12) | |
| Alienware x16 R2 P120F (1.47.22.14 D3D12) | |
| Media della classe Gaming (14.6 - 421, n=202, ultimi 2 anni) | |
| Dota 2 Reborn - 1920x1080 ultra (3/3) best looking | |
| Asus ROG Strix Scar 17 G733PYV-LL053X | |
| SCHENKER XMG Neo 16 (Early 24) | |
| SCHENKER XMG Neo 16 (Early 24) (Overboost, Oasis) | |
| Medion Erazer Beast X40 2024 | |
| Razer Blade 16 2024, RTX 4090 | |
| SCHENKER XMG Neo 16 E23 | |
| Lenovo Legion Pro 7 RTX4090 | |
| Asus ROG Strix Scar 16 G634JZR | |
| Media NVIDIA GeForce RTX 4090 Laptop GPU (115.7 - 220, n=40) | |
| Lenovo Legion 9 16IRX9, RTX 4090 | |
| Media della classe Gaming (33.2 - 220, n=211, ultimi 2 anni) | |
| Alienware x16 R2 P120F | |
| X-Plane 11.11 - 1920x1080 high (fps_test=3) | |
| Asus ROG Strix Scar 17 G733PYV-LL053X | |
| Razer Blade 16 2024, RTX 4090 | |
| SCHENKER XMG Neo 16 (Early 24) | |
| Medion Erazer Beast X40 2024 | |
| Asus ROG Strix Scar 16 G634JZR | |
| SCHENKER XMG Neo 16 (Early 24) (v6.92.6600, Overboost, Oasis) | |
| Lenovo Legion Pro 7 RTX4090 | |
| SCHENKER XMG Neo 16 E23 | |
| Media NVIDIA GeForce RTX 4090 Laptop GPU (77.8 - 166.2, n=44) | |
| Lenovo Legion 9 16IRX9, RTX 4090 | |
| Media della classe Gaming (31.5 - 166.2, n=217, ultimi 2 anni) | |
| Alienware x16 R2 P120F | |
| F1 24 | |
| 1920x1080 Ultra High Preset AA:T AF:16x | |
| SCHENKER XMG Neo 16 (Early 24) (1119215) | |
| Media NVIDIA GeForce RTX 4090 Laptop GPU (113.6 - 127, n=3) | |
| XMG Neo 16 E23 | |
| Lenovo Legion 9 16IRX9, RTX 4090 (1118244) | |
| Media della classe Gaming (60.6 - 127, n=4, ultimi 2 anni) | |
| 2560x1440 Ultra High Preset AA:T AF:16x | |
| SCHENKER XMG Neo 16 (Early 24) (1119215) | |
| XMG Neo 16 E23 | |
| Media NVIDIA GeForce RTX 4090 Laptop GPU (72.1 - 84.7, n=3) | |
| Lenovo Legion 9 16IRX9, RTX 4090 (1118244) | |
| Media della classe Gaming (59.1 - 84.7, n=3, ultimi 2 anni) | |
| 2560x1440 Ultra High Preset + Quality DLSS AF:16x | |
| SCHENKER XMG Neo 16 (Early 24) (1119215) | |
| Media NVIDIA GeForce RTX 4090 Laptop GPU () | |
| Media della classe Gaming (86.3 - 129.5, n=2, ultimi 2 anni) | |
| Senua's Saga Hellblade 2 | |
| 1920x1080 High Preset | |
| SCHENKER XMG Neo 16 (Early 24) | |
| Media della classe Gaming (ultimi 2 anni) | |
| Media NVIDIA GeForce RTX 4090 Laptop GPU (74 - 78.8, n=2) | |
| XMG Neo 16 E23 | |
| 2560x1440 High Preset | |
| SCHENKER XMG Neo 16 (Early 24) | |
| Media della classe Gaming (ultimi 2 anni) | |
| Media NVIDIA GeForce RTX 4090 Laptop GPU (51.8 - 57.3, n=2) | |
| XMG Neo 16 E23 | |
| 2560x1440 High Preset + Quality DLSS | |
| SCHENKER XMG Neo 16 (Early 24) | |
| Media NVIDIA GeForce RTX 4090 Laptop GPU () | |
| Media della classe Gaming (ultimi 2 anni) | |
| Horizon Forbidden West | |
| 1920x1080 Very High Preset AA:T | |
| SCHENKER XMG Neo 16 (Early 24) | |
| Media NVIDIA GeForce RTX 4090 Laptop GPU (93.7 - 125.2, n=2) | |
| Media della classe Gaming (30.2 - 125.2, n=7, ultimi 2 anni) | |
| 2560x1440 Very High Preset AA:T | |
| SCHENKER XMG Neo 16 (Early 24) | |
| Media NVIDIA GeForce RTX 4090 Laptop GPU (75.2 - 98, n=2) | |
| Media della classe Gaming (24.1 - 98, n=7, ultimi 2 anni) | |
| Alone in the Dark | |
| 1920x1080 Cinematic Preset | |
| SCHENKER XMG Neo 16 (Early 24) | |
| Media NVIDIA GeForce RTX 4090 Laptop GPU (141 - 189.9, n=2) | |
| Media della classe Gaming (13.6 - 189.9, n=5, ultimi 2 anni) | |
| 2560x1440 Cinematic Preset | |
| SCHENKER XMG Neo 16 (Early 24) | |
| Media NVIDIA GeForce RTX 4090 Laptop GPU (99 - 133.6, n=2) | |
| Media della classe Gaming (64.7 - 133.6, n=4, ultimi 2 anni) | |
Abbiamo utilizzato Witcher 3 per verificare la stabilità della frequenza dei fotogrammi: Il gioco (impostazioni massime, FHD) ha funzionato per circa 1 ora, il personaggio del gioco non è stato spostato e non abbiamo osservato alcun calo nella frequenza dei fotogrammi.
Witcher 3 FPS diagram
| basso | medio | alto | ultra | QHD | |
| GTA V (2015) | 187.6 | 187.4 | 185.7 | 159.3 | 156 |
| The Witcher 3 (2015) | 643 | 562.3 | 412.7 | 214 | 169.4 |
| Dota 2 Reborn (2015) | 248 | 221 | 210 | 194.6 | |
| Final Fantasy XV Benchmark (2018) | 233 | 225 | 196.9 | 162.5 | |
| X-Plane 11.11 (2018) | 208 | 184.2 | 144.5 | ||
| Far Cry 5 (2018) | 194 | 184 | 172 | 156 | |
| Strange Brigade (2018) | 579 | 444 | 397 | 403 | 305 |
| Cyberpunk 2077 2.1 Phantom Liberty (2023) | 168.5 | 157.8 | 138 | 131.5 | 93.8 |
| Alan Wake 2 (2023) | 128.5 | 128 | 123.3 | 87.1 | |
| Alone in the Dark (2024) | 219 | 217 | 216 | 189.9 | 133.6 |
| Horizon Forbidden West (2024) | 165.4 | 160.5 | 126.2 | 125.2 | 98 |
| Senua's Saga Hellblade 2 (2024) | 122.3 | 103.3 | 78.8 | 57.3 | |
| F1 24 (2024) | 346 | 369 | 302 | 127 | 84.7 |
Emissioni - Il computer portatile XMG ha emissioni specifiche della classe
Emissioni di rumore
Sono possibili livelli di rumore fino a 56 dB(A) ma, quando gioca, questa cifra è leggermente inferiore (Overboost). È possibile ottenere un livello di rumore significativamente più basso utilizzando "Bilanciato" - a scapito delle prestazioni. Il gioco sarebbe possibile. Nell'uso quotidiano (ufficio, internet) e in condizioni di inattività, il computer generalmente svolge il suo lavoro in modo silenzioso - indipendentemente dalla modalità di prestazioni attiva.
L'utilizzo del raffreddamento ad acqua esterno causa una certa produzione di rumore: La pompa funziona in modo molto silenzioso e le ventole sono molto più evidenti. Da un punto di vista soggettivo, riteniamo che il livello di rumore con il raffreddamento ad acqua esterno sia più piacevole, ma non necessariamente più silenzioso.
Di tanto in tanto, dall'interno del portatile vengono emessi dei crepitii elettronici, ad esempio durante il test Diskspd. Presumibilmente, ciò è dovuto all'SSD.
Rumorosità
| Idle |
| 28 / 29 / 31 dB(A) |
| Sotto carico |
| 51 / 56 dB(A) |
 | ||
30 dB silenzioso 40 dB(A) udibile 50 dB(A) rumoroso |
||
min: | ||
| SCHENKER XMG Neo 16 (Early 24) NVIDIA GeForce RTX 4090 Laptop GPU, i9-14900HX, Samsung 990 Pro 1 TB | Razer Blade 16 2024, RTX 4090 NVIDIA GeForce RTX 4090 Laptop GPU, i9-14900HX, Samsung PM9A1 MZVL22T0HBLB | Medion Erazer Beast X40 2024 NVIDIA GeForce RTX 4090 Laptop GPU, i9-14900HX, Phison E18-1TB-PHISON-SSD-BICS5 | Asus ROG Strix Scar 17 G733PYV-LL053X NVIDIA GeForce RTX 4090 Laptop GPU, R9 7945HX3D, SK hynix PC801 HFS001TEJ9X101N | SCHENKER XMG Neo 16 E23 NVIDIA GeForce RTX 4090 Laptop GPU, i9-13900HX, Crucial P5 Plus 1TB CT1000P5PSSD8 | |
|---|---|---|---|---|---|
| Noise | 14% | 3% | 3% | -12% | |
| off /ambiente * | 26 | 23 12% | 25 4% | 23 12% | 25 4% |
| Idle Minimum * | 28 | 23 18% | 28 -0% | 23 18% | 31 -11% |
| Idle Average * | 29 | 23 21% | 29 -0% | 27.7 4% | 33 -14% |
| Idle Maximum * | 31 | 27.66 11% | 32 -3% | 34.7 -12% | 42 -35% |
| Load Average * | 51 | 43.76 14% | 48 6% | 53.4 -5% | 58 -14% |
| Witcher 3 ultra * | 54 | 46.81 13% | 50 7% | 53.4 1% | 57 -6% |
| Load Maximum * | 56 | 50.37 10% | 52 7% | 53.4 5% | 59 -5% |
* ... Meglio usare valori piccoli
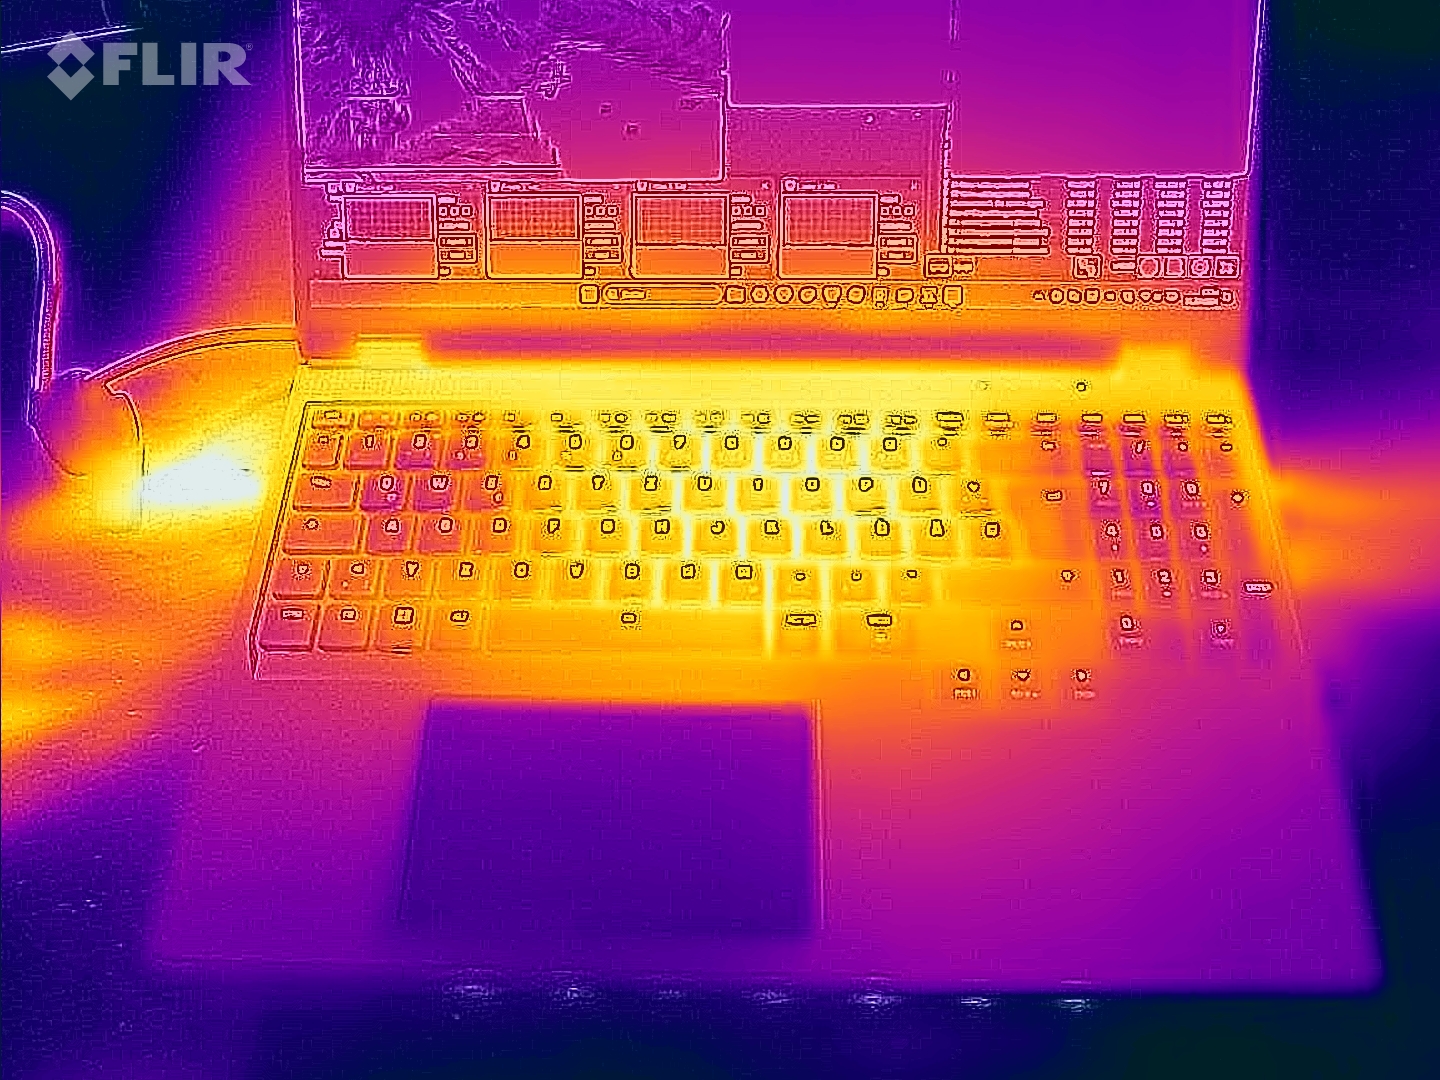
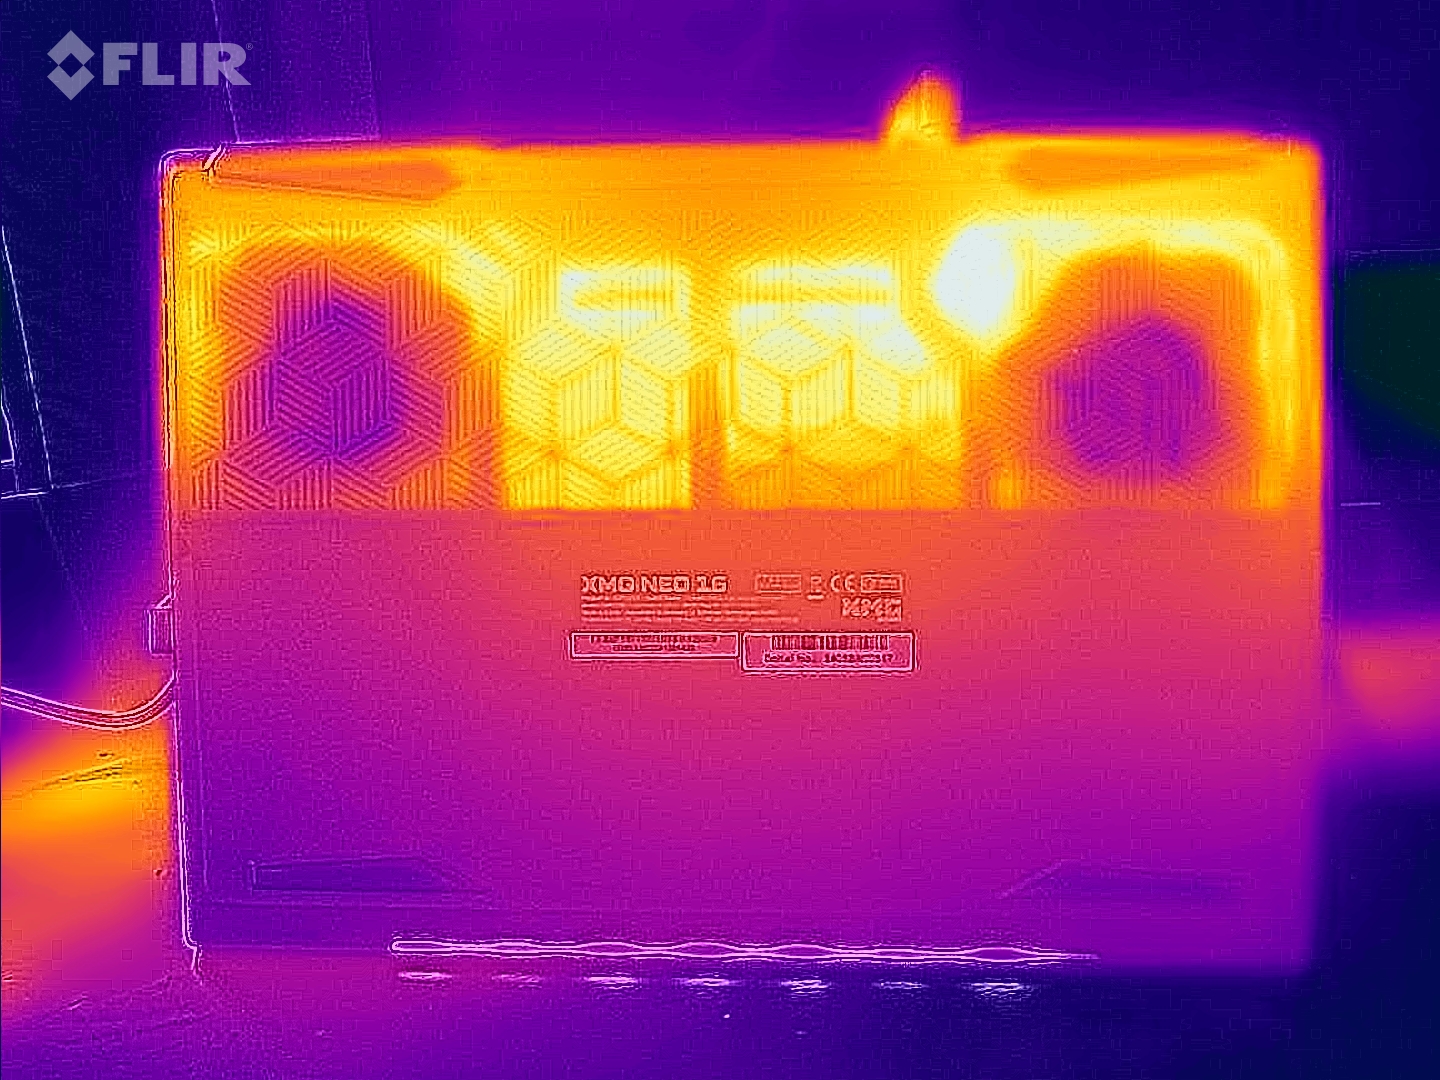
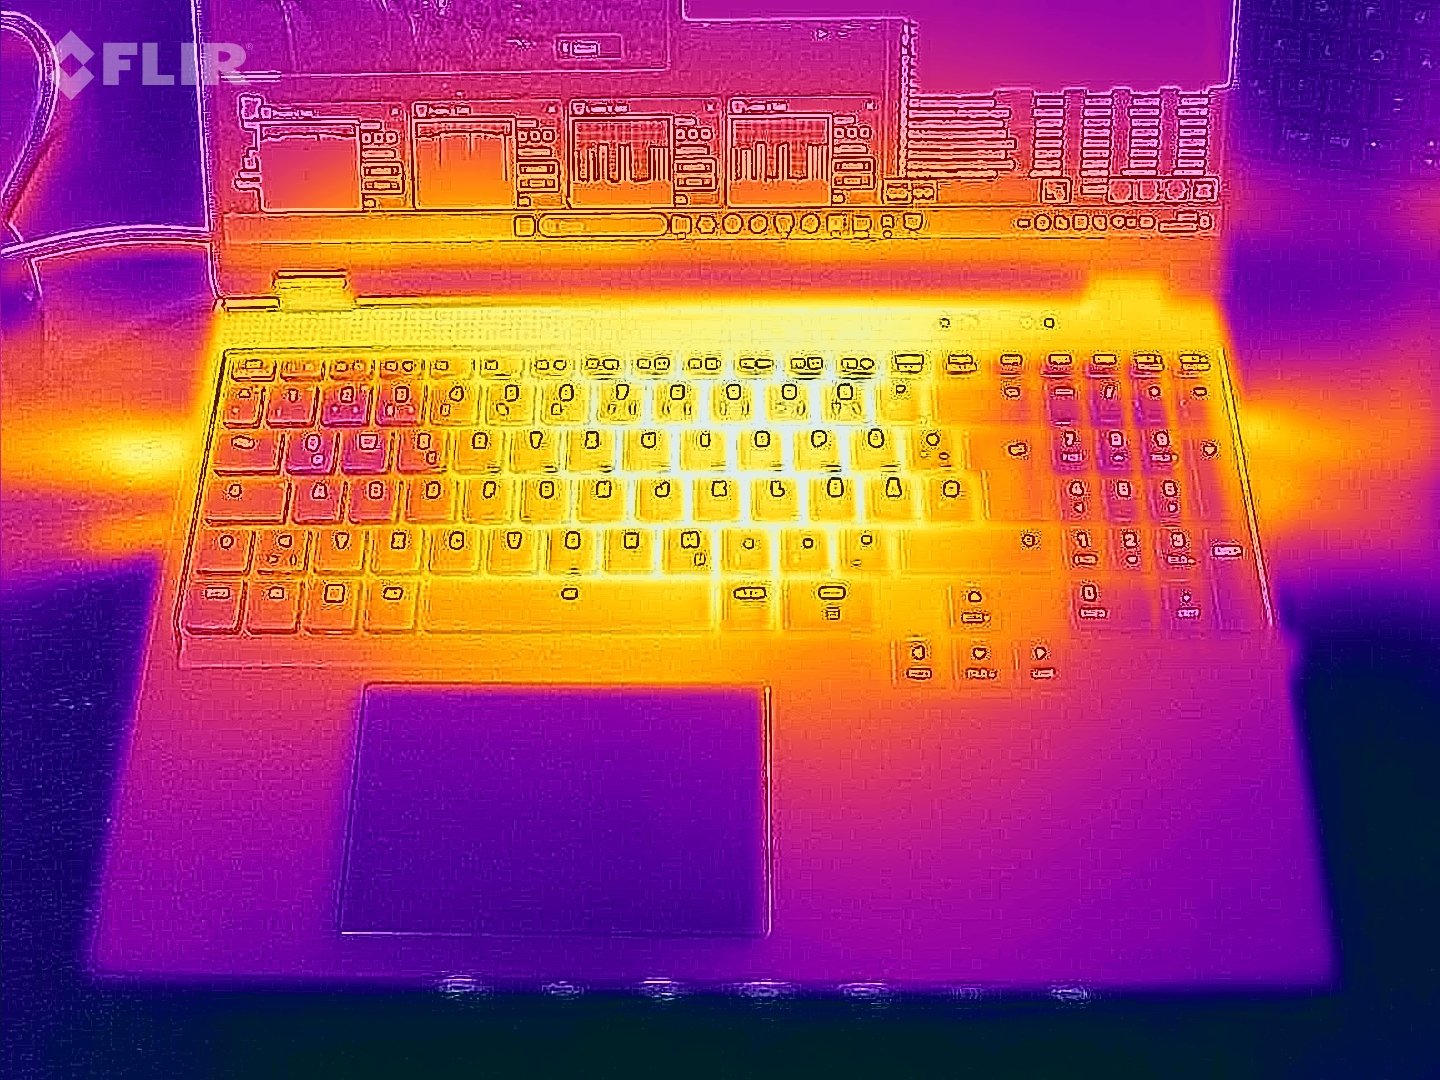
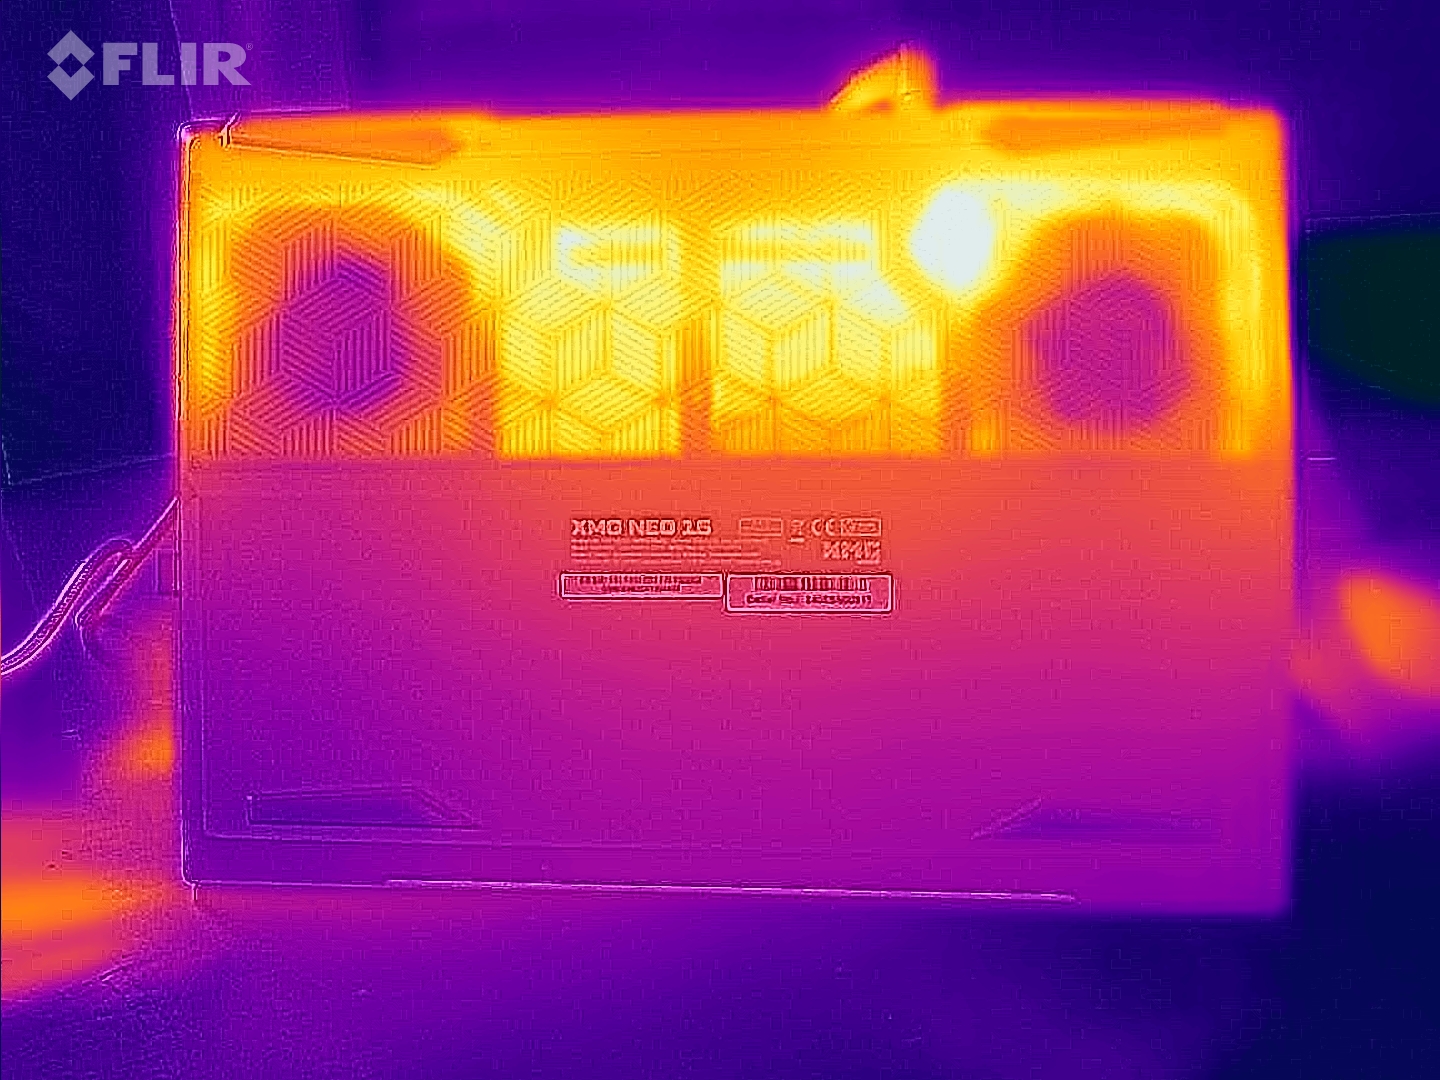
Temperatura
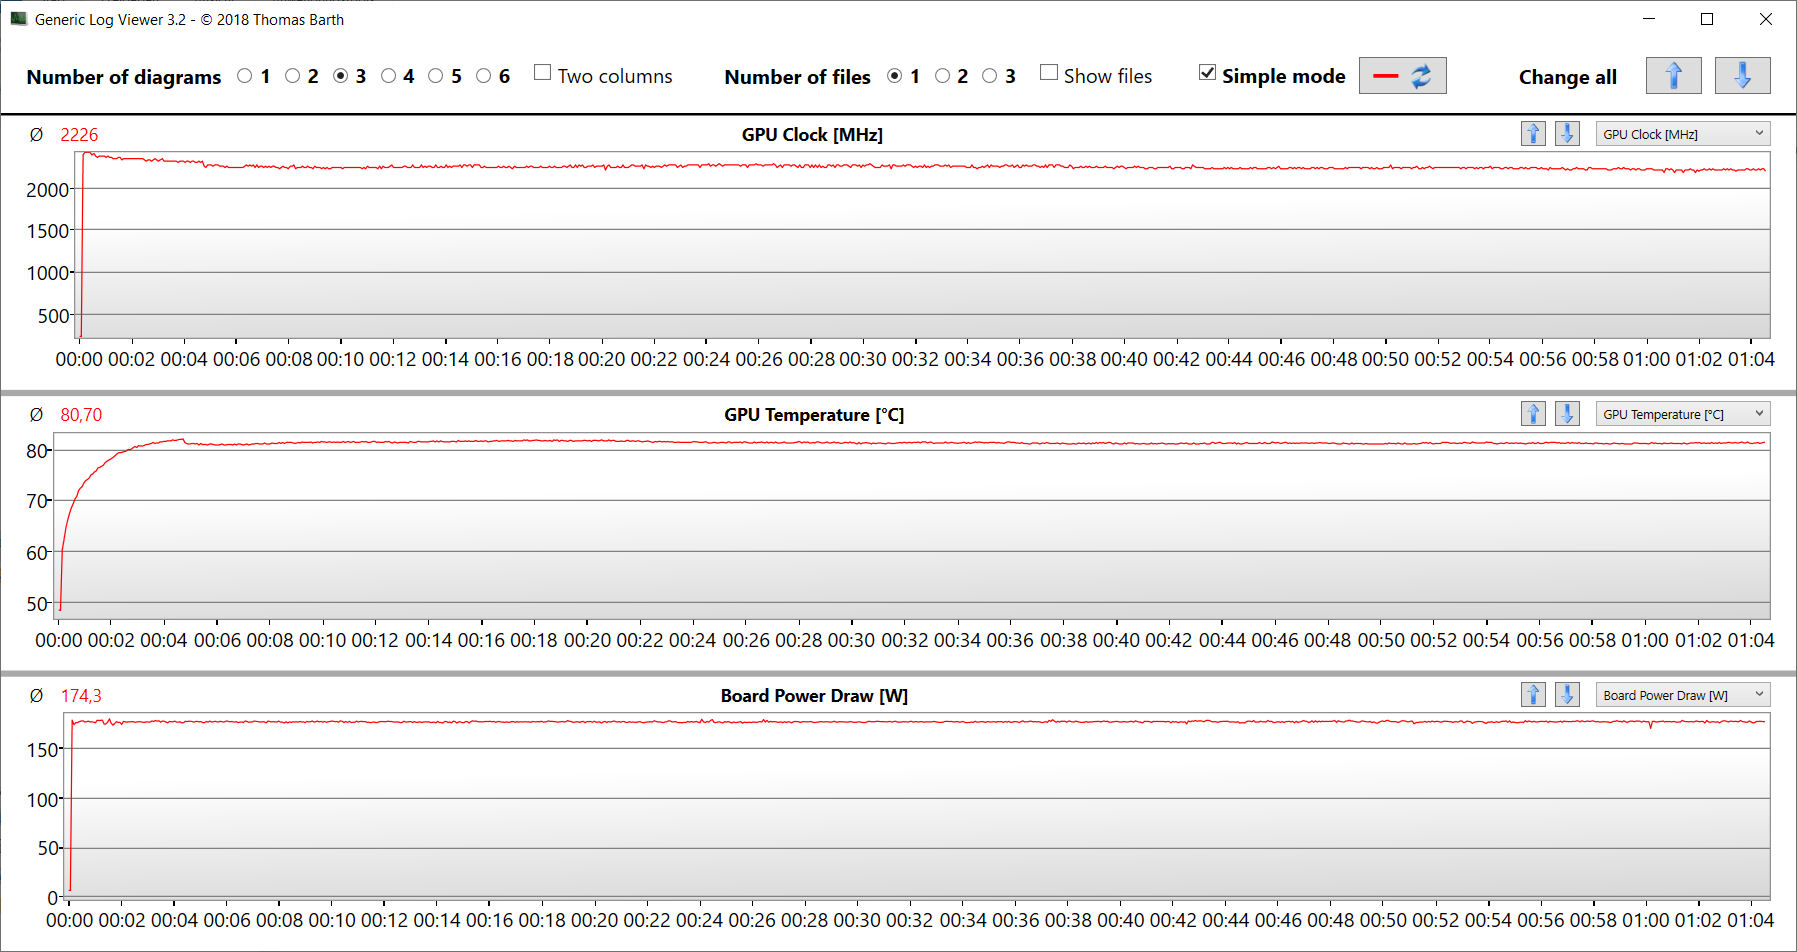
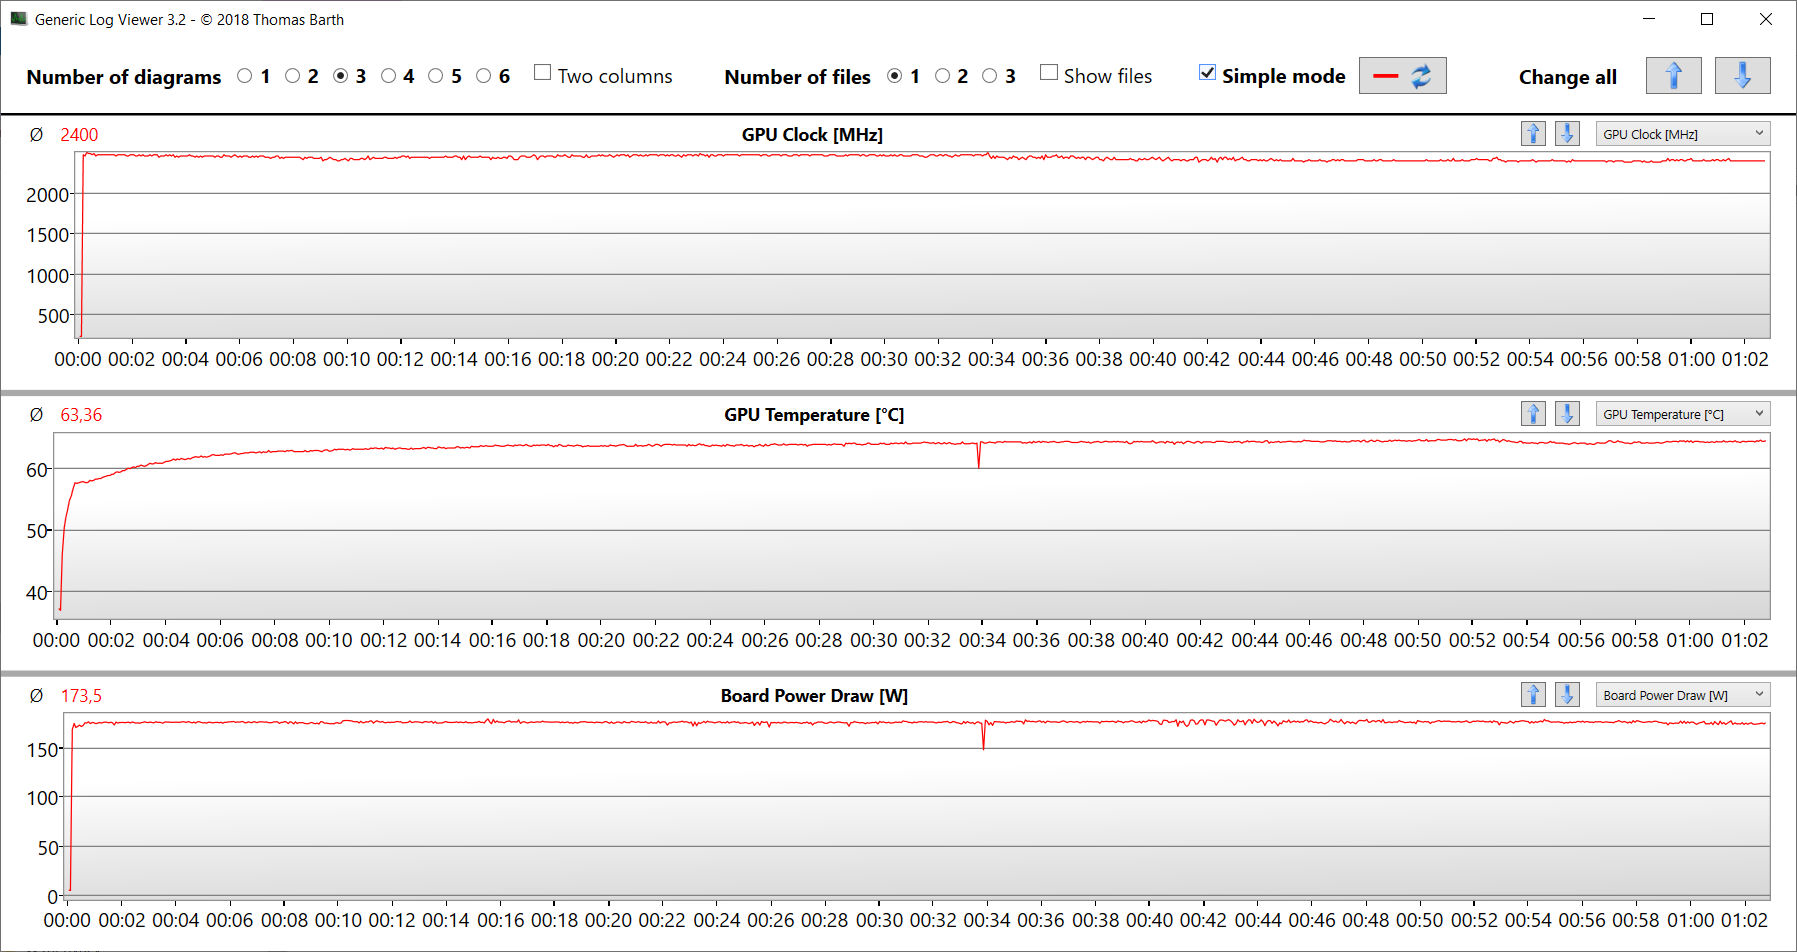
Il portatile si riscalda notevolmente sotto carico (stress test e test Witcher 3 ): In alcune aree, a volte le temperature superano i 50 °C. Tuttavia, sul palm rest, le temperature rimangono su un livello moderato. Nell'uso quotidiano (ufficio, internet), i valori si collocano nella zona verde.
Il test di Witcher 3 evidenzia l'effetto del raffreddamento ad acqua opzionale: La temperatura della GPU differisce di circa 17 °C (80,7 °C contro 63,4 °C).
(-) La temperatura massima sul lato superiore è di 47 °C / 117 F, rispetto alla media di 40.4 °C / 105 F, che varia da 21.2 a 68.8 °C per questa classe Gaming.
(-) Il lato inferiore si riscalda fino ad un massimo di 56 °C / 133 F, rispetto alla media di 43.2 °C / 110 F
(+) In idle, la temperatura media del lato superiore è di 26 °C / 79 F, rispetto alla media deld ispositivo di 33.9 °C / 93 F.
(-) Riproducendo The Witcher 3, la temperatura media per il lato superiore e' di 42.4 °C / 108 F, rispetto alla media del dispositivo di 33.9 °C / 93 F.
(+) I poggiapolsi e il touchpad raggiungono la temperatura massima della pelle (35 °C / 95 F) e quindi non sono caldi.
(-) La temperatura media della zona del palmo della mano di dispositivi simili e'stata di 28.9 °C / 84 F (-6.1 °C / -11 F).
| SCHENKER XMG Neo 16 (Early 24) Intel Core i9-14900HX, NVIDIA GeForce RTX 4090 Laptop GPU | Razer Blade 16 2024, RTX 4090 Intel Core i9-14900HX, NVIDIA GeForce RTX 4090 Laptop GPU | Medion Erazer Beast X40 2024 Intel Core i9-14900HX, NVIDIA GeForce RTX 4090 Laptop GPU | Asus ROG Strix Scar 17 G733PYV-LL053X AMD Ryzen 9 7945HX3D, NVIDIA GeForce RTX 4090 Laptop GPU | SCHENKER XMG Neo 16 E23 Intel Core i9-13900HX, NVIDIA GeForce RTX 4090 Laptop GPU | |
|---|---|---|---|---|---|
| Heat | 2% | -7% | 8% | 1% | |
| Maximum Upper Side * | 47 | 45 4% | 47 -0% | 40.1 15% | 50 -6% |
| Maximum Bottom * | 56 | 45 20% | 54 4% | 46.7 17% | 51 9% |
| Idle Upper Side * | 27 | 29 -7% | 30 -11% | 26.5 2% | 28 -4% |
| Idle Bottom * | 27 | 30 -11% | 32 -19% | 27.7 -3% | 26 4% |
* ... Meglio usare valori piccoli
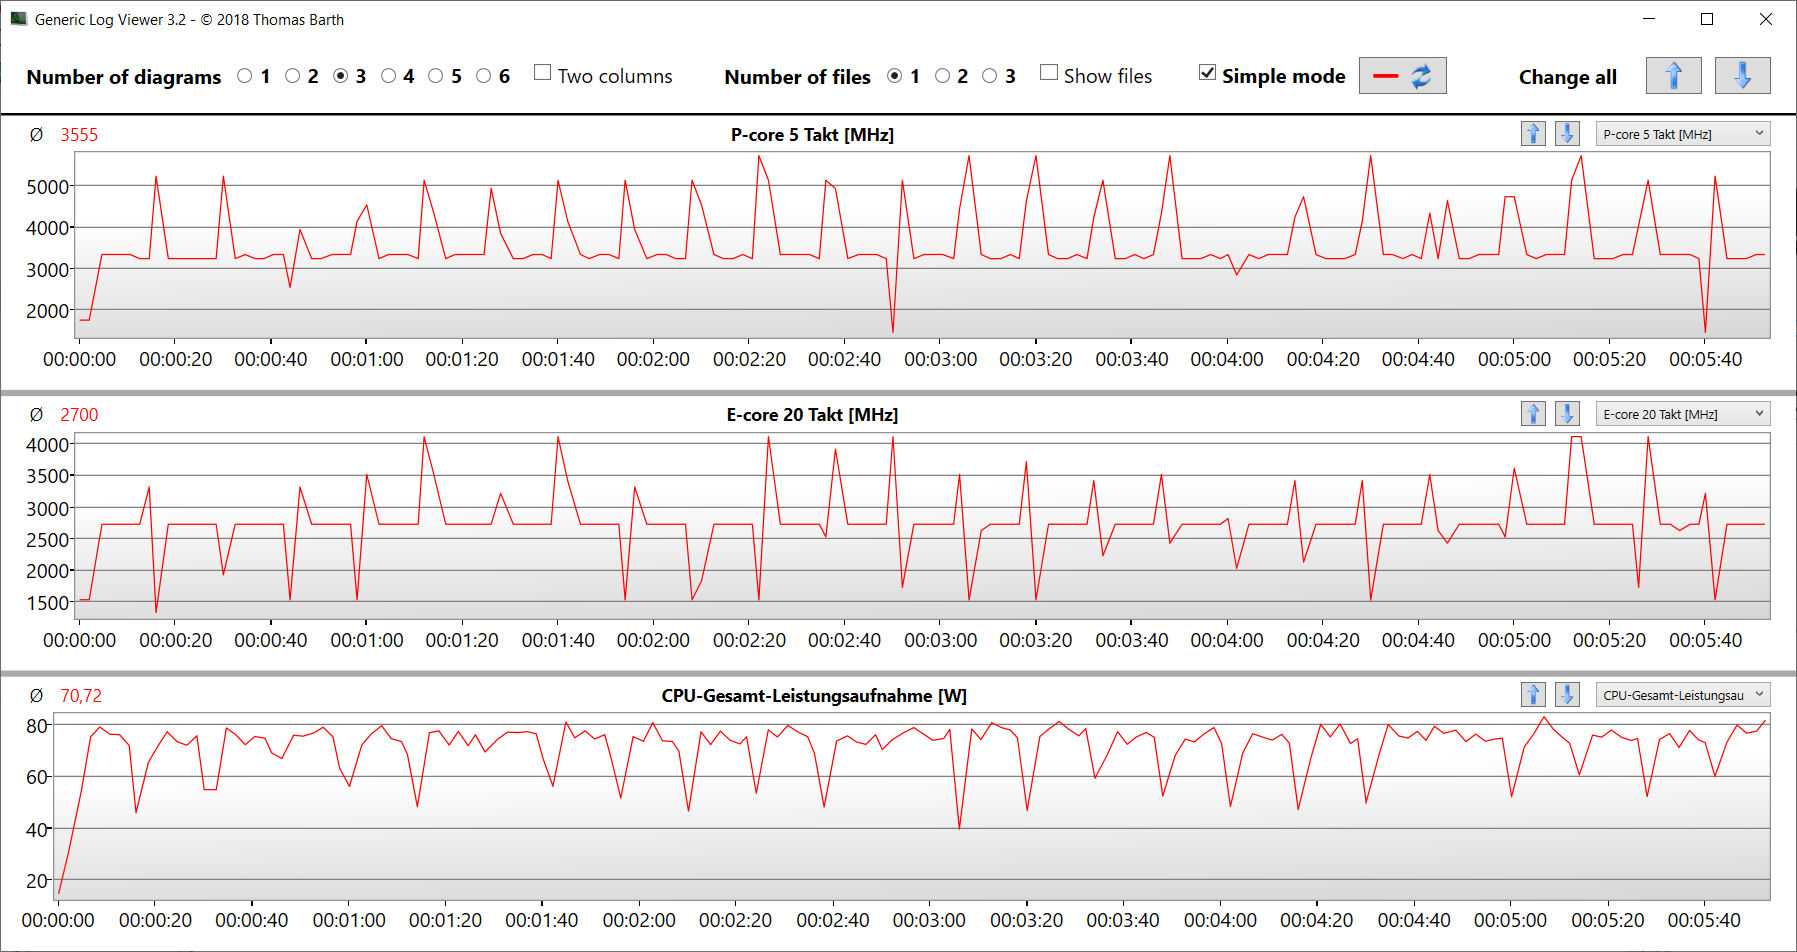
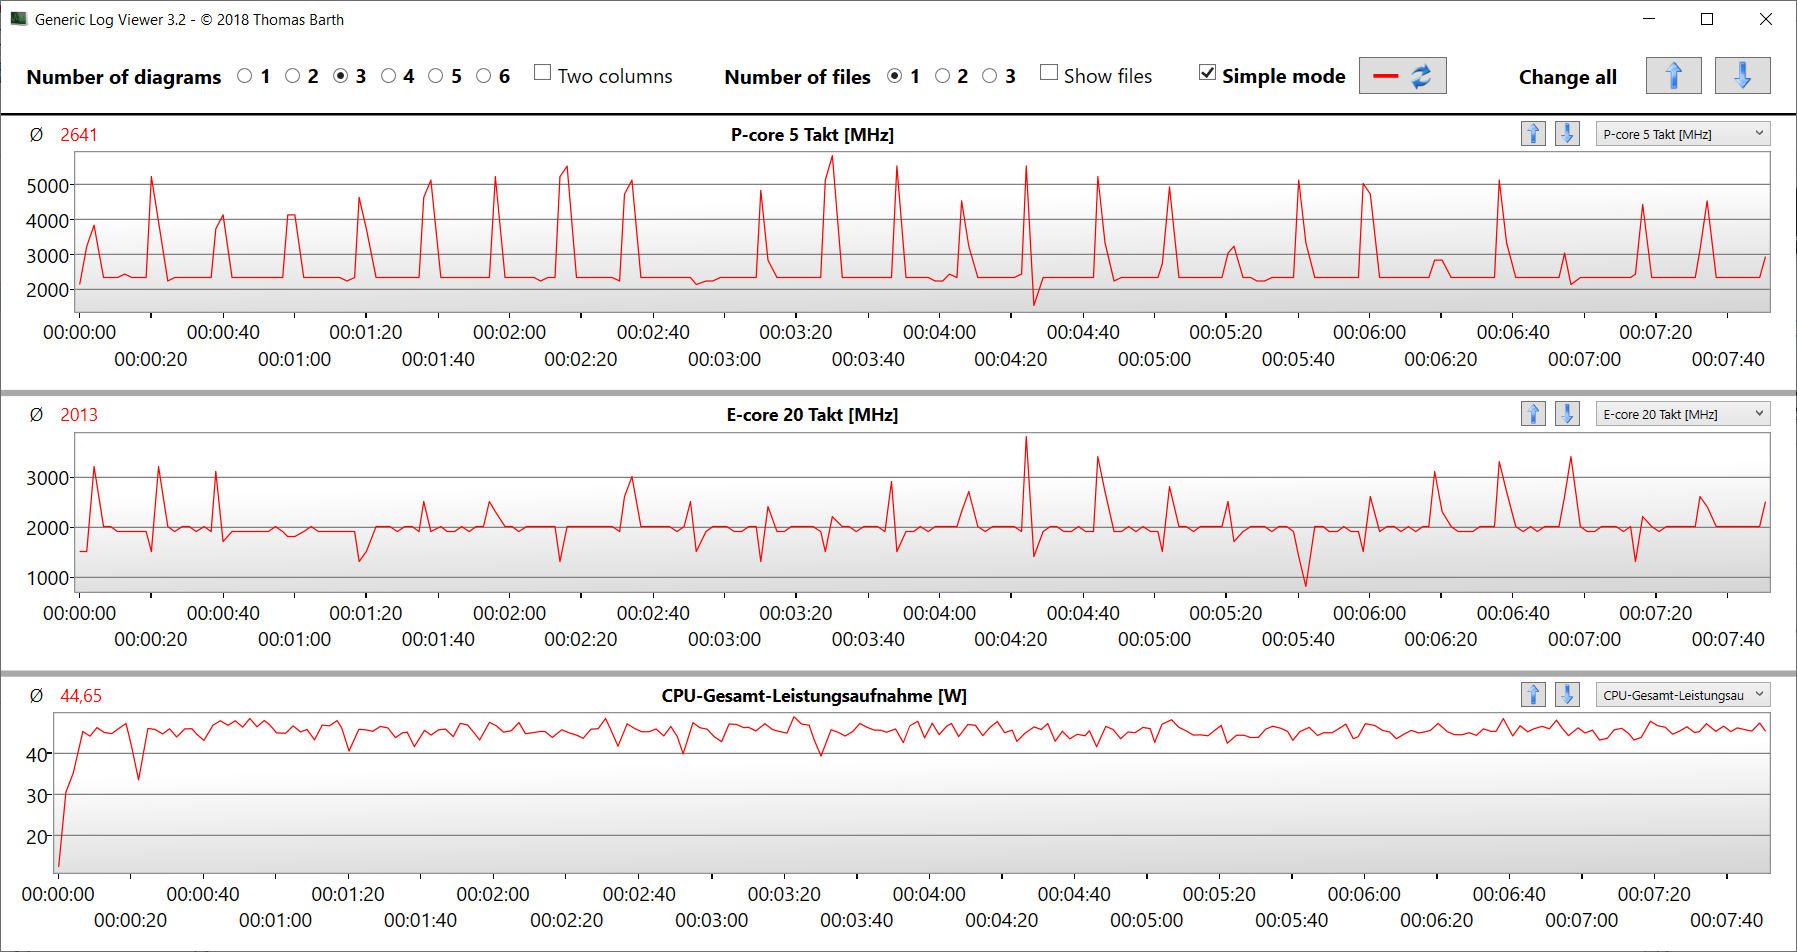
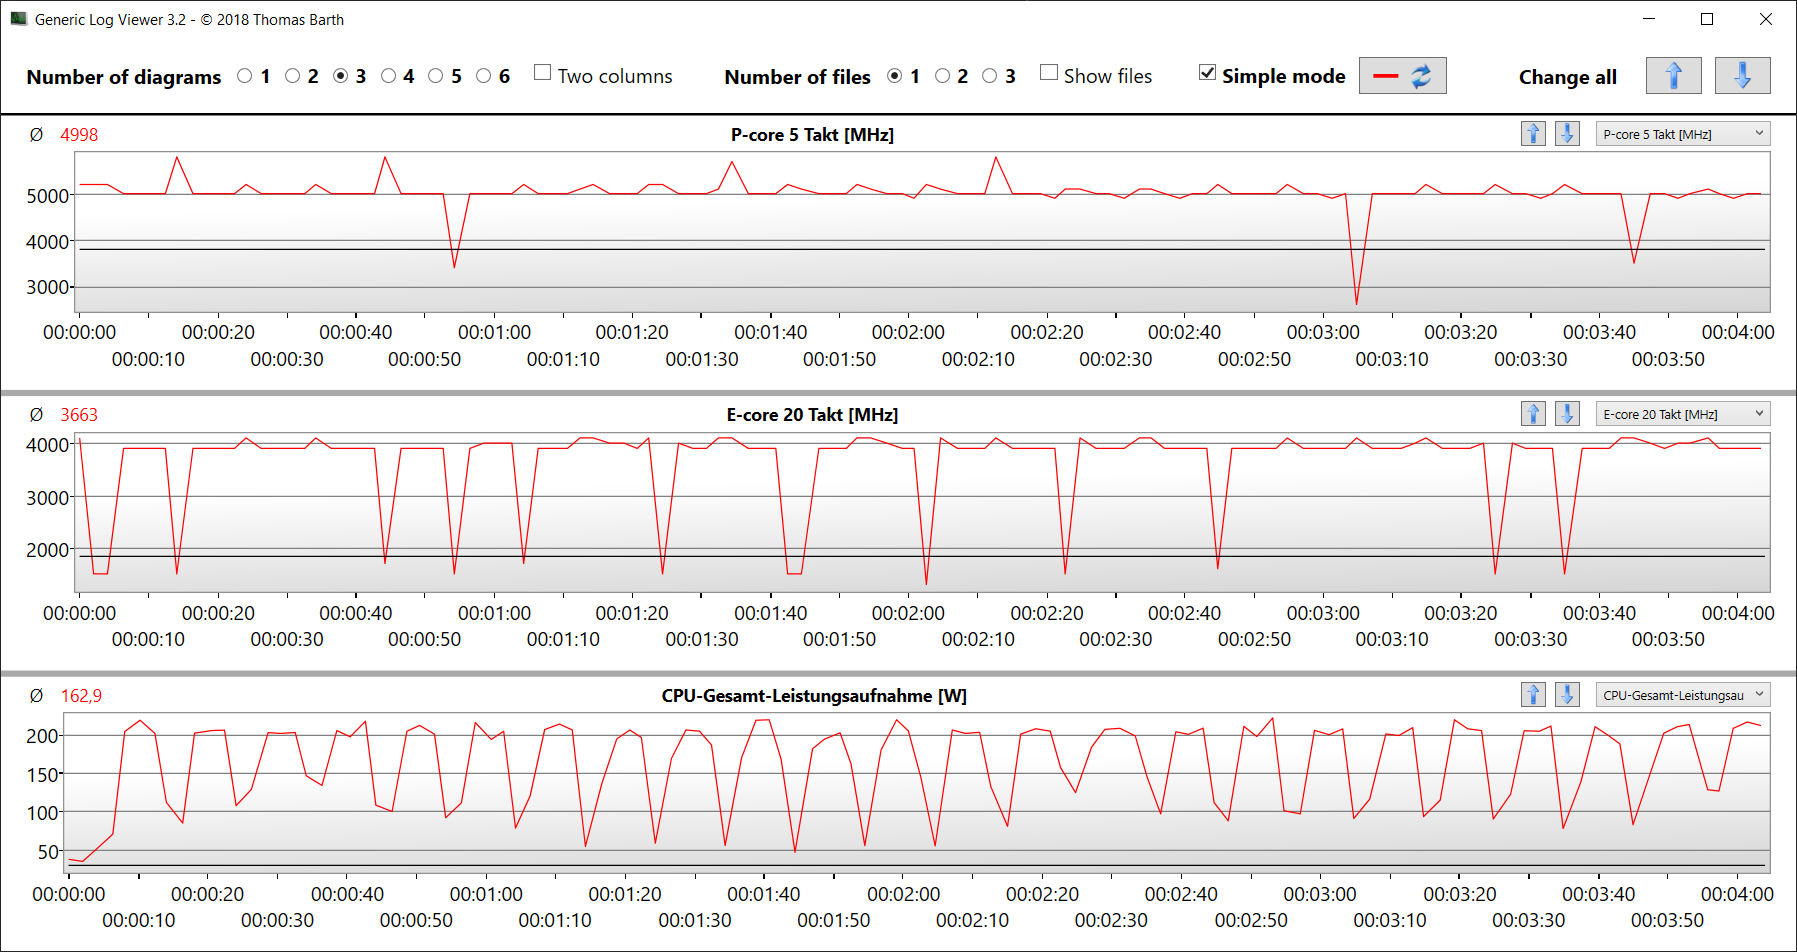
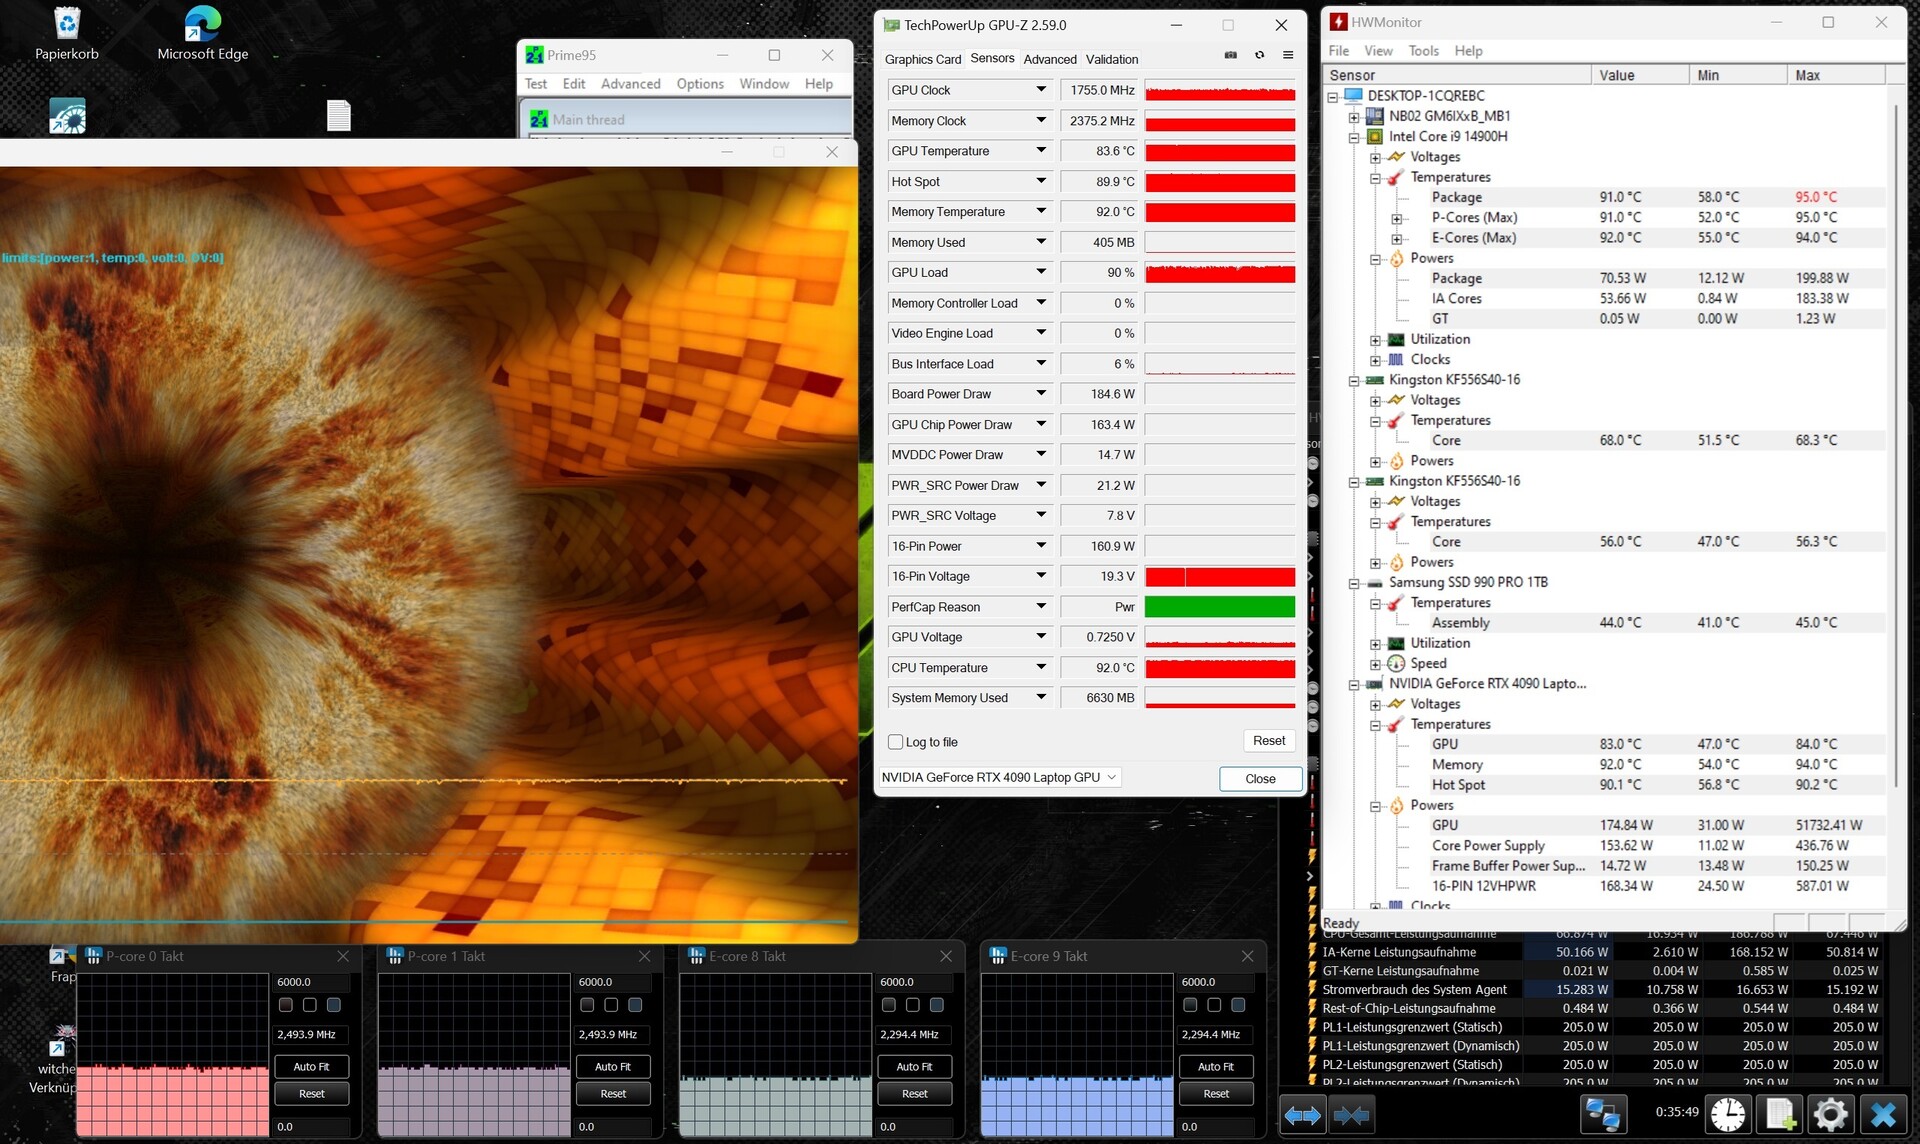
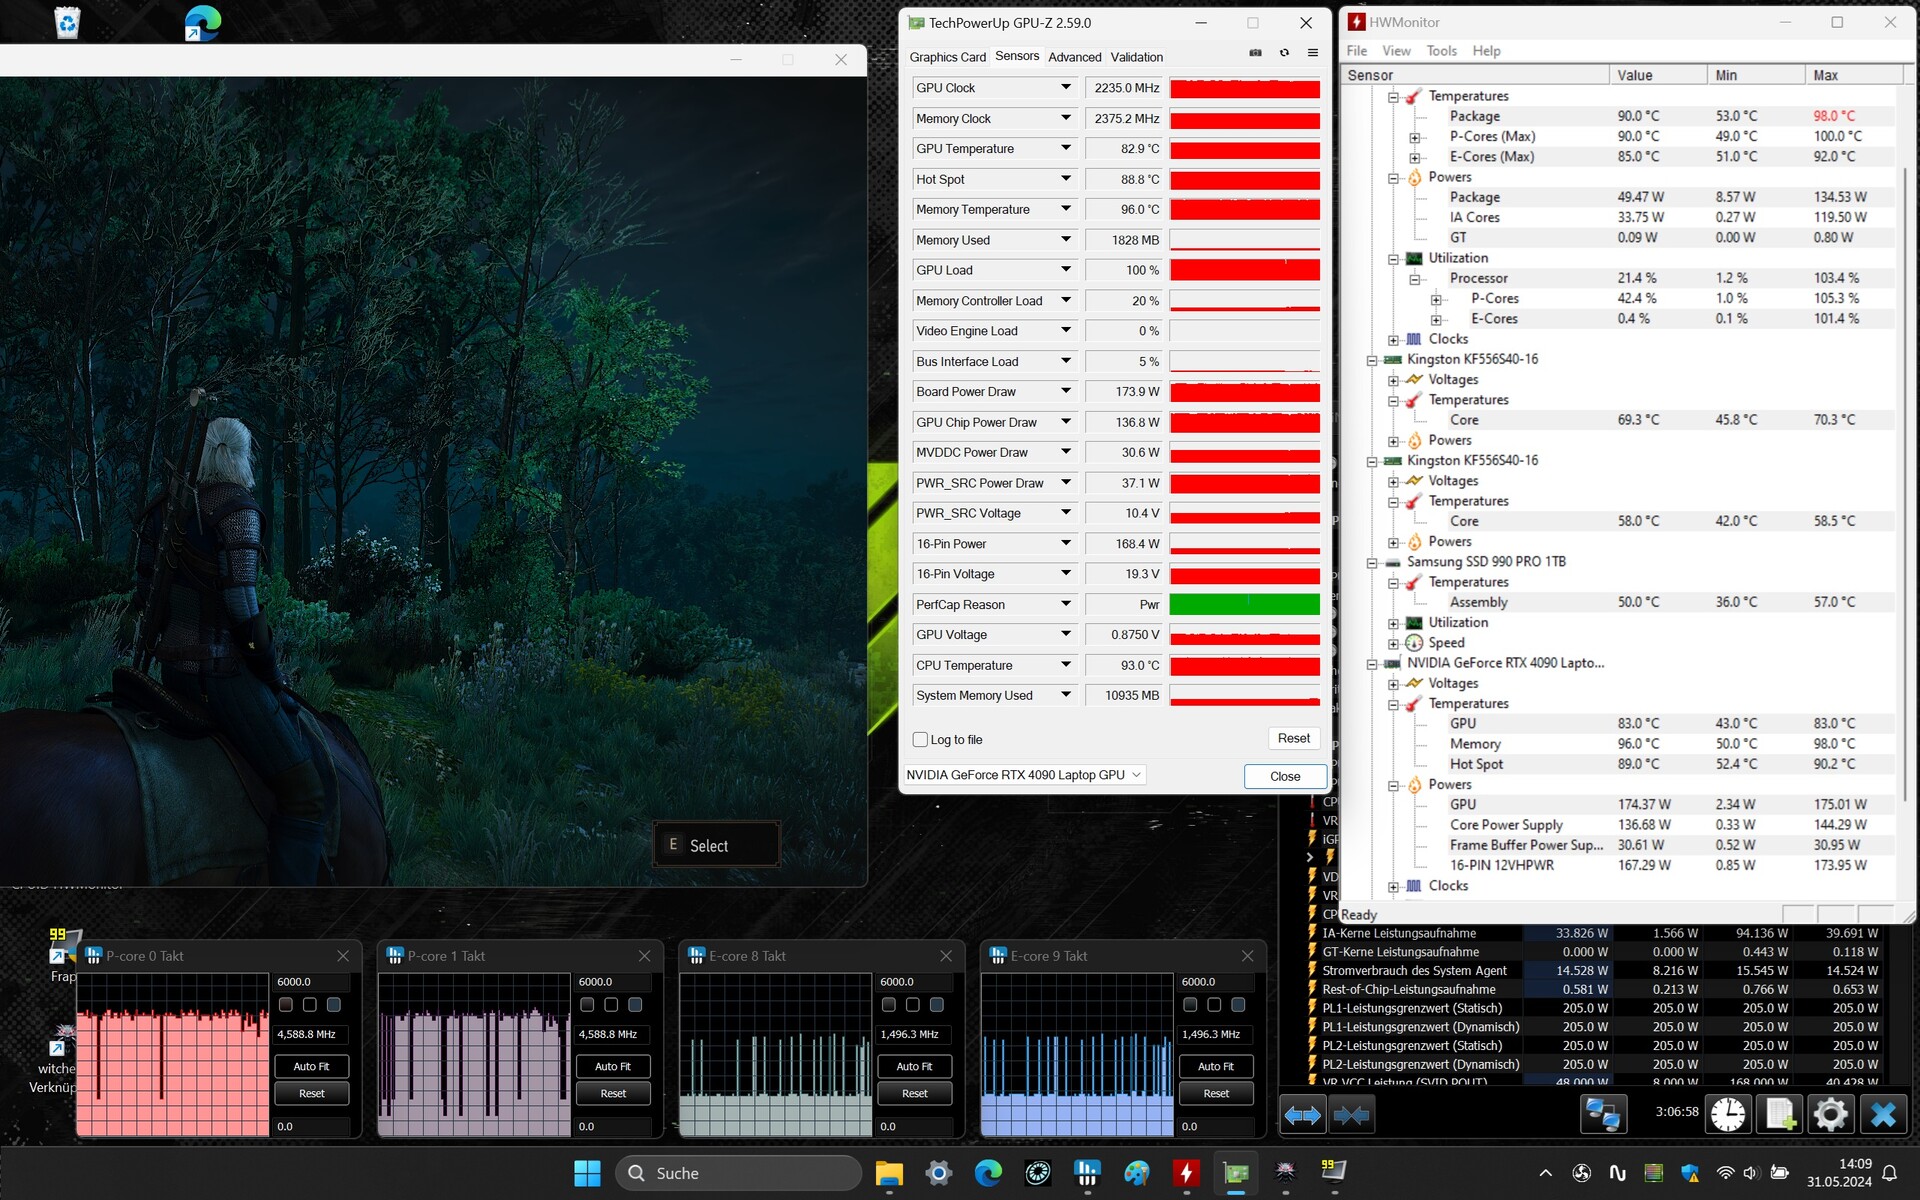
Test da sforzo
Lo scenario estremo dello stress test (Prime95 e Furmark in funzionamento continuo) verifica la stabilità del sistema a pieno carico. La velocità della CPU scende entro il primo minuto del test da circa 4,3-4,5 GHz (P) e 3,5-3,6 GHz (E) a 2,5 GHz (P) e 2,3 GHz (E). Allo stesso tempo, la velocità della GPU aumenta da un punto di partenza di 1.600 MHz a oltre 2.000 MHz.
Altoparlanti
Gli altoparlanti stereo mancano di bassi. A parte questo, nella maggior parte dei casi producono un suono decente. Una qualità migliore può essere ottenuta utilizzando delle cuffie o degli altoparlanti esterni.
SCHENKER XMG Neo 16 (Early 24) analisi audio
(+) | gli altoparlanti sono relativamente potenti (86 dB)
Bassi 100 - 315 Hz
(-) | quasi nessun basso - in media 16.3% inferiori alla media
(±) | la linearità dei bassi è media (8.6% delta rispetto alla precedente frequenza)
Medi 400 - 2000 Hz
(+) | medi bilanciati - solo only 3% rispetto alla media
(+) | medi lineari (3.6% delta rispetto alla precedente frequenza)
Alti 2 - 16 kHz
(+) | Alti bilanciati - appena 2.5% dalla media
(+) | alti lineari (4.9% delta rispetto alla precedente frequenza)
Nel complesso 100 - 16.000 Hz
(+) | suono nel complesso lineare (12.4% differenza dalla media)
Rispetto alla stessa classe
» 13% di tutti i dispositivi testati in questa classe è stato migliore, 4% simile, 83% peggiore
» Il migliore ha avuto un delta di 6%, medio di 18%, peggiore di 132%
Rispetto a tutti i dispositivi testati
» 8% di tutti i dispositivi testati in questa classe è stato migliore, 2% similare, 90% peggiore
» Il migliore ha avuto un delta di 4%, medio di 25%, peggiore di 134%
Razer Blade 16 2024, RTX 4090 analisi audio
(±) | potenza degli altiparlanti media ma buona (81.16 dB)
Bassi 100 - 315 Hz
(±) | bassi ridotti - in media 8.2% inferiori alla media
(±) | la linearità dei bassi è media (7.4% delta rispetto alla precedente frequenza)
Medi 400 - 2000 Hz
(+) | medi bilanciati - solo only 3.3% rispetto alla media
(+) | medi lineari (5.9% delta rispetto alla precedente frequenza)
Alti 2 - 16 kHz
(+) | Alti bilanciati - appena 1.6% dalla media
(+) | alti lineari (3.1% delta rispetto alla precedente frequenza)
Nel complesso 100 - 16.000 Hz
(+) | suono nel complesso lineare (9.2% differenza dalla media)
Rispetto alla stessa classe
» 3% di tutti i dispositivi testati in questa classe è stato migliore, 1% simile, 96% peggiore
» Il migliore ha avuto un delta di 6%, medio di 18%, peggiore di 132%
Rispetto a tutti i dispositivi testati
» 2% di tutti i dispositivi testati in questa classe è stato migliore, 1% similare, 97% peggiore
» Il migliore ha avuto un delta di 4%, medio di 25%, peggiore di 134%
Gestione dell'energia - Schenker Neo offre una discreta durata della batteria
Consumo di energia
Il consumo energetico è a un livello normale per l'hardware installato che abbiamo qui. Il test Witcher 3 e lo stress test sono stati eseguiti con un consumo energetico leggermente inferiore. L'alimentatore (330 watt) è adeguatamente dimensionato.
| Off / Standby | |
| Idle | |
| Sotto carico |
|
Leggenda:
min: Attualmente utilizziamo il Metrahit Energy, un multimetro digitale professionale per la misurazione della qualità della potenza e dell'energia monofase, per le nostre misurazioni. | |
| SCHENKER XMG Neo 16 (Early 24) i9-14900HX, NVIDIA GeForce RTX 4090 Laptop GPU, Samsung 990 Pro 1 TB, IPS, 2560x1600, 16.00 | Razer Blade 16 2024, RTX 4090 i9-14900HX, NVIDIA GeForce RTX 4090 Laptop GPU, Samsung PM9A1 MZVL22T0HBLB, OLED, 2560x1600, 16.00 | Medion Erazer Beast X40 2024 i9-14900HX, NVIDIA GeForce RTX 4090 Laptop GPU, Phison E18-1TB-PHISON-SSD-BICS5, IPS, 2560x1600, 17.00 | Asus ROG Strix Scar 17 G733PYV-LL053X R9 7945HX3D, NVIDIA GeForce RTX 4090 Laptop GPU, SK hynix PC801 HFS001TEJ9X101N, IPS, 2560x1440, 17.30 | SCHENKER XMG Neo 16 E23 i9-13900HX, NVIDIA GeForce RTX 4090 Laptop GPU, Crucial P5 Plus 1TB CT1000P5PSSD8, IPS, 2560x1600, 16.00 | Media della classe Gaming | |
|---|---|---|---|---|---|---|
| Power Consumption | -22% | -1% | -23% | -9% | -19% | |
| Idle Minimum * | 6 | 16.9 -182% | 7 -17% | 15.4 -157% | 8 -33% | 13.5 ? -125% |
| Idle Average * | 16 | 17.8 -11% | 15 6% | 21.6 -35% | 18 -13% | 19 ? -19% |
| Idle Maximum * | 28 | 19.6 30% | 33 -18% | 22.2 21% | 28 -0% | 26.9 ? 4% |
| Load Average * | 130 | 128 2% | 134 -3% | 116.7 10% | 133 -2% | 110.1 ? 15% |
| Witcher 3 ultra * | 302 | 243 20% | 280 7% | 262 13% | 294 3% | |
| Load Maximum * | 361 | 328 9% | 294 19% | 327.1 9% | 399 -11% | 253 ? 30% |
* ... Meglio usare valori piccoli
Power consumption Witcher 3 / stress test
Power consumption with an external monitor
Durata della batteria
Nei test Wi-Fi e video (caricamento di siti web con l'aiuto di uno script e del breve video Big Buck Bunny (codifica H.264, FHD) in loop), la macchina da 16 pollici ha raggiunto tempi di esecuzione di 5 ore e 50 minuti e 6 ore e 58 minuti. Tutto sommato, si tratta di cifre decenti.
| SCHENKER XMG Neo 16 (Early 24) i9-14900HX, NVIDIA GeForce RTX 4090 Laptop GPU, 99.8 Wh | Razer Blade 16 2024, RTX 4090 i9-14900HX, NVIDIA GeForce RTX 4090 Laptop GPU, 95.2 Wh | Medion Erazer Beast X40 2024 i9-14900HX, NVIDIA GeForce RTX 4090 Laptop GPU, 99.8 Wh | Asus ROG Strix Scar 17 G733PYV-LL053X R9 7945HX3D, NVIDIA GeForce RTX 4090 Laptop GPU, 90 Wh | SCHENKER XMG Neo 16 E23 i9-13900HX, NVIDIA GeForce RTX 4090 Laptop GPU, 99 Wh | Media della classe Gaming | |
|---|---|---|---|---|---|---|
| Autonomia della batteria | -11% | 7% | -34% | -2% | -9% | |
| Reader / Idle | 600 | 551 ? -8% | ||||
| H.264 | 418 | 456 9% | 302 -28% | 349 -17% | 399 ? -5% | |
| WiFi v1.3 | 350 | 329 -6% | 374 7% | 287 -18% | 399 14% | 370 ? 6% |
| Load | 122 | 79 -35% | 55 -55% | 85.7 ? -30% | ||
| Witcher 3 ultra | 84 | 77 ? |
Pro
Contro
Verdetto - Un bolide di alto livello
Neo 16 mantiene ciò che promette: L'hardware (Core i9, RTX 4090) dell'estremità superiore della scala delle prestazioni consente l'editing video, il rendering, lo streaming e, naturalmente, il gioco QHD. Le emissioni elevate previste possono essere ridotte a un livello più moderato selezionando la modalità di prestazioni appropriata.
Con XMG Neo 16 (Early 24), Schenker offre una grande potenza in un fattore di forma compatto.
Chi è alla ricerca di una soluzione senza compromessi, dovrà optare per il raffreddamento ad acqua esterno, disponibile come optional (230 dollari): Questo aiuta a ottenere un piccolo aumento delle prestazioni e a ridurre le emissioni. Detto questo, il portatile è legato a una postazione fissa.
Il display opaco da 16 pollici, 16:10 (2.560 x 1.600 pixel, sRGB, IPS, 240 Hz) ha fatto in gran parte una buona impressione, con l'elevata luminosità come punto particolarmente piacevole. C'è un certo margine di miglioramento per quanto riguarda il contrasto e la copertura dello spazio colore. Due slot SSD (PCIe 4), compreso il supporto RAID 0/1, consentono di avere un sacco di spazio di archiviazione e tempi di caricamento brevi.
Una singola carica della batteria (99,8 Wh) è sufficiente per un'autonomia di vita reale di circa 6-7 ore - cifre decenti. Positivo: La batteria può essere caricata tramite un caricatore USB-C (100 watt, 20 V, 5 A) - la porta TB4 supporta Power Delivery, il che significa che l'alimentatore (330 watt) potrebbe teoricamente rimanere a casa.
Un'alternativa potrebbe essere il Razer Blade 16 (2024). Questo computer offre una potenza di calcolo leggermente inferiore ma, a differenza di Neo, offre un contrasto maggiore e un display OLED più vivido.
Prezzo e disponibilità
L'XMG Neo 16 (Early 24) può essere configurato individualmente e acquistato sul negozio online di Schenker (tedesco) e i prezzi rappresentano il tasso di cambio dollaro/euro al momento del test. Il nostro modello in prova costa circa 4.000 dollari. I modelli entry-level (con una RTX 4060) partono da circa 2.000 dollari. Schenker ha dichiarato che la loro disponibilità è prevista per la fine di giugno (RTX 4090) e la metà di luglio (RTX 4060/70/80). Per il raffreddamento ad acqua opzionale dovrà sborsare circa 230 dollari.
SCHENKER XMG Neo 16 (Early 24)
-
06/19/2024 v8 (new)
Sascha Mölck
 Total Sustainability Score:
 Transparency
The present review sample was made available to the author as a loan by the manufacturer or a shop for the purposes of review. The lender had no influence on this review, nor did the manufacturer receive a copy of this review before publication. There was no obligation to publish this review.
Pricecompare

