


Recensione di Dell Pro 13 Premium: Il portatile business quasi perfetto
Il computer portatile "Promium".
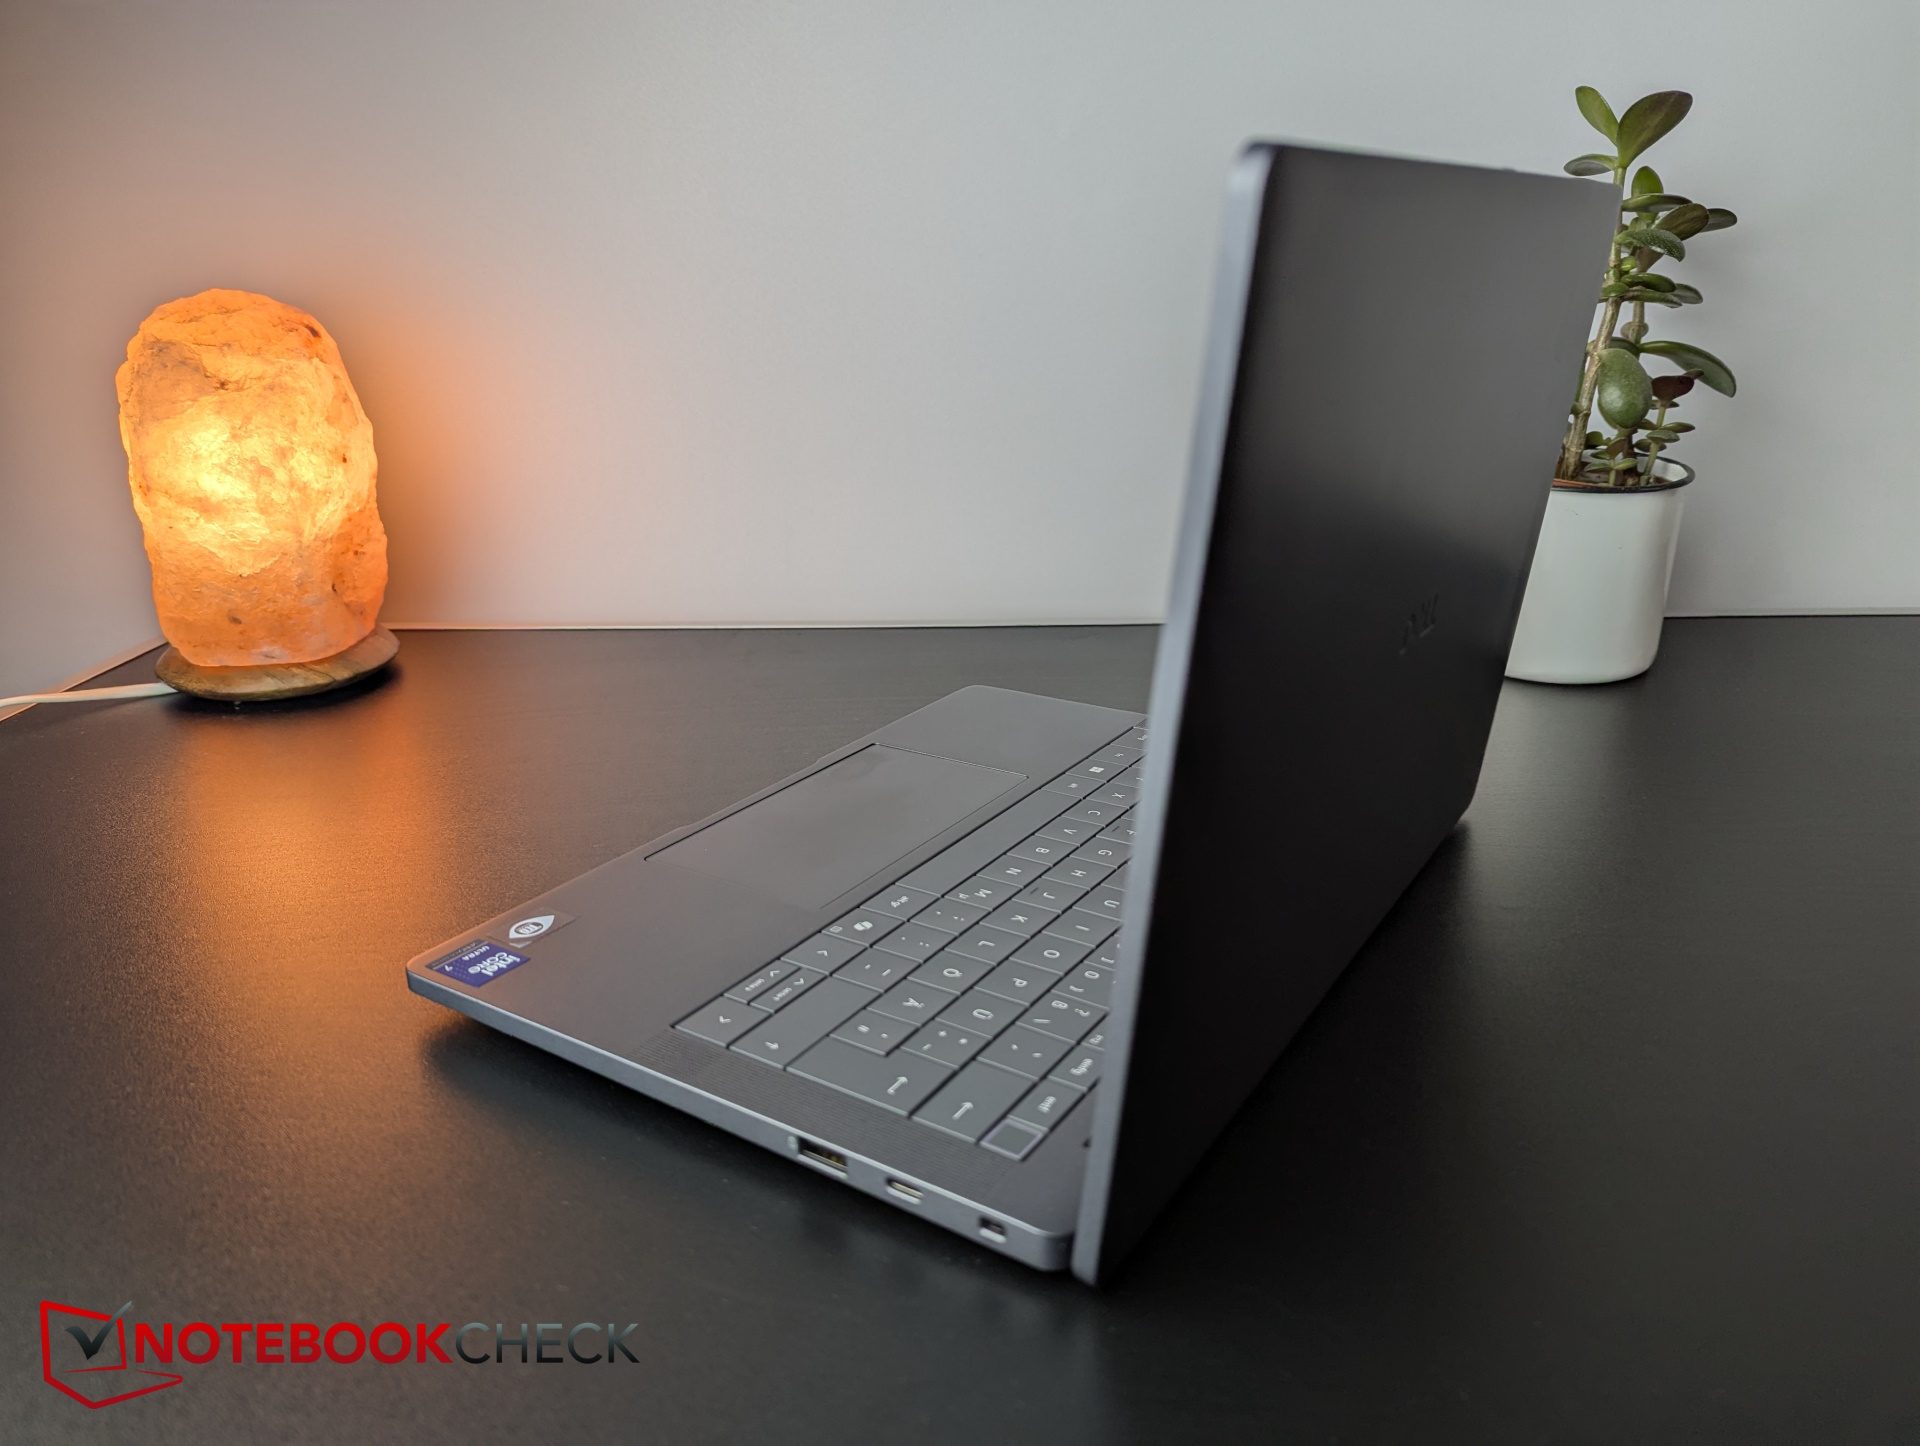
Cogliamo l'opportunità di recensire il laptop business da 13 pollici della linea di prodotti Dell. Rivolto agli utenti business esigenti e progettato per attirare gli imprenditori con le sue porte moderne, il Dell Pro 13 Premium ha un telaio in magnesio robusto ma leggero, AI e gode anche di una batteria di lunghissima durata.Christian Hintze, 👁 Christian Hintze (traduzione a cura di DeepL / Ninh Duy) Pubblicato 🇺🇸 🇩🇪 ...
Verdetto - Un portatile business quasi completo
Il Dell Pro 13 Premium è un ottimo computer portatile per il business, praticamente senza punti deboli, ma con molte caratteristiche positive che fanno guadagnare a questo portatile il nostro premio. I dipendenti aziendali e altri potenziali acquirenti ottengono un portatile compatto, piccolo, leggero, economico, estremamente longevo (24 ore!) e potente, con uno chassis in magnesio di alta qualità, una webcam ad alta risoluzione da 8 MP e interfacce moderne come la doppia Thunderbolt 4 e il Wi-Fi 7. Inoltre, il laptop rimane sempre fresco in quasi tutte le situazioni.
Tuttavia, questo ha un costo, con un prezzo del laptop che va da 1.900 a 2.500 dollari! Tenendo conto di questo, la zoppicante SSD M.2 2230 è quasi scandalosa, ma nelle situazioni quotidiane, difficilmente si noterà la differenza. Le uniche aree in cui sono necessari miglioramenti sono il nome e l'aggiornabilità.
Pro
Contro
Prezzo e disponibilità
Il nostro modello di recensione è dotato di un display FHD+ e costa circa 2.100 dollari sul negozio online di Dell.
- $29.99Smatree Hard EVA Protective Sleeve Compatible for 13.3 inch Dell Pro 13 Premium (PA13250), for 13 inch DELL Latitude 7350/7320 Detachable, for 12 inch DELL Latitude 7230 Rugged Extreme Tablet (X8016)
- $49.99Smatree 13 inch Laptop Sleeve for DELL Pro 13 Premium PA13250, Protective Laptop Case with Accessory Pocket, YKK Zipper, Patented Shockproof Design (E431)
Possibili alternative a confronto
Immagine | Modello | Prezzo | Peso | Altezza | Schermo |
|---|---|---|---|---|---|
1. 89.9%  | Dell Pro 13 Premium PA13250 Intel Core Ultra 7 268V ⎘ Intel Arc Graphics 140V ⎘ 32 GB Memoria, 1024 GB SSD | Amazon: 1. $39.99 Smatree Hard Shell Laptop Ca... 2. $29.99 Smatree Hard EVA Protective ... 3. $49.99 Smatree 13 inch Laptop Sleev... Prezzo di listino: 2700 Euro | 1.1 kg | 17.2 mm | 13.30" 1920x1200 170 PPI IPS |
2. 85%  | MSI Prestige 13 AI Plus Evo A2VMG Intel Core Ultra 7 258V ⎘ Intel Arc Graphics 140V ⎘ 32 GB Memoria | Amazon: $1,349.99 Prezzo di listino: 1400 USD | 970 gr | 16.9 mm | 13.30" 2880x1800 255 PPI OLED |
3. 85.1%  | Lenovo ThinkPad X13 2-in-1 Gen 5 Intel Core Ultra 7 165U ⎘ Intel Graphics 4-Core iGPU (Arc) ⎘ 32 GB Memoria, 1000 GB SSD | Amazon: $1,601.95 Prezzo di listino: 2107.23 Euro | 1.3 kg | 16.4 mm | 13.30" 1920x1200 170 PPI IPS |
4. 84%  | Framework Laptop 13.5 Core Ultra 7 155H Intel Core Ultra 7 155H ⎘ Intel Arc 8-Core iGPU ⎘ 32 GB Memoria | Prezzo di listino: 1500 USD | 1.4 kg | 15.85 mm | 13.50" 2880x1920 256 PPI IPS |
5. 85.3%  | Dell XPS 13 9350 Intel Core Ultra 7 256V ⎘ Intel Arc Graphics 140V ⎘ 16 GB Memoria, 512 GB SSD | Amazon: 1. $1,499.99 2025 Latest Dell XPS 13 9350... 2. $1,699.00 NewDell XPS 13 9350 Powerful... 3. $1,599.99 Dell XPS 13 9340 Business La... Prezzo di listino: 1400 USD | 1.2 kg | 15.3 mm | 13.40" 1920x1200 169 PPI IPS |
6. 80.7%  | Microsoft Surface Pro Copilot+ Qualcomm Snapdragon X Plus X1P-64-100 ⎘ Qualcomm SD X Adreno X1-85 3.8 TFLOPS ⎘ 16 GB Memoria, 256 GB SSD | Amazon: $1,079.99 Prezzo di listino: 1199€ | 872 gr | 9.3 mm | 13.00" 2880x1920 266 PPI IPS |
Sommario
- Verdetto - Un portatile business quasi completo
- Specifiche
- Caso e caratteristiche - Questo Dell è dotato di una webcam da 8 MP
- Dispositivi di input - Il 13 Premium ha un touchpad per le chiamate in conferenza
- Display - Un pannello da ufficio ad alto contrasto, con opzioni aggiuntive
- Prestazioni - Un arco potente da 140 V
- Emissioni ed energia - Dell Pro è economico
- Valutazione complessiva di Notebookcheck
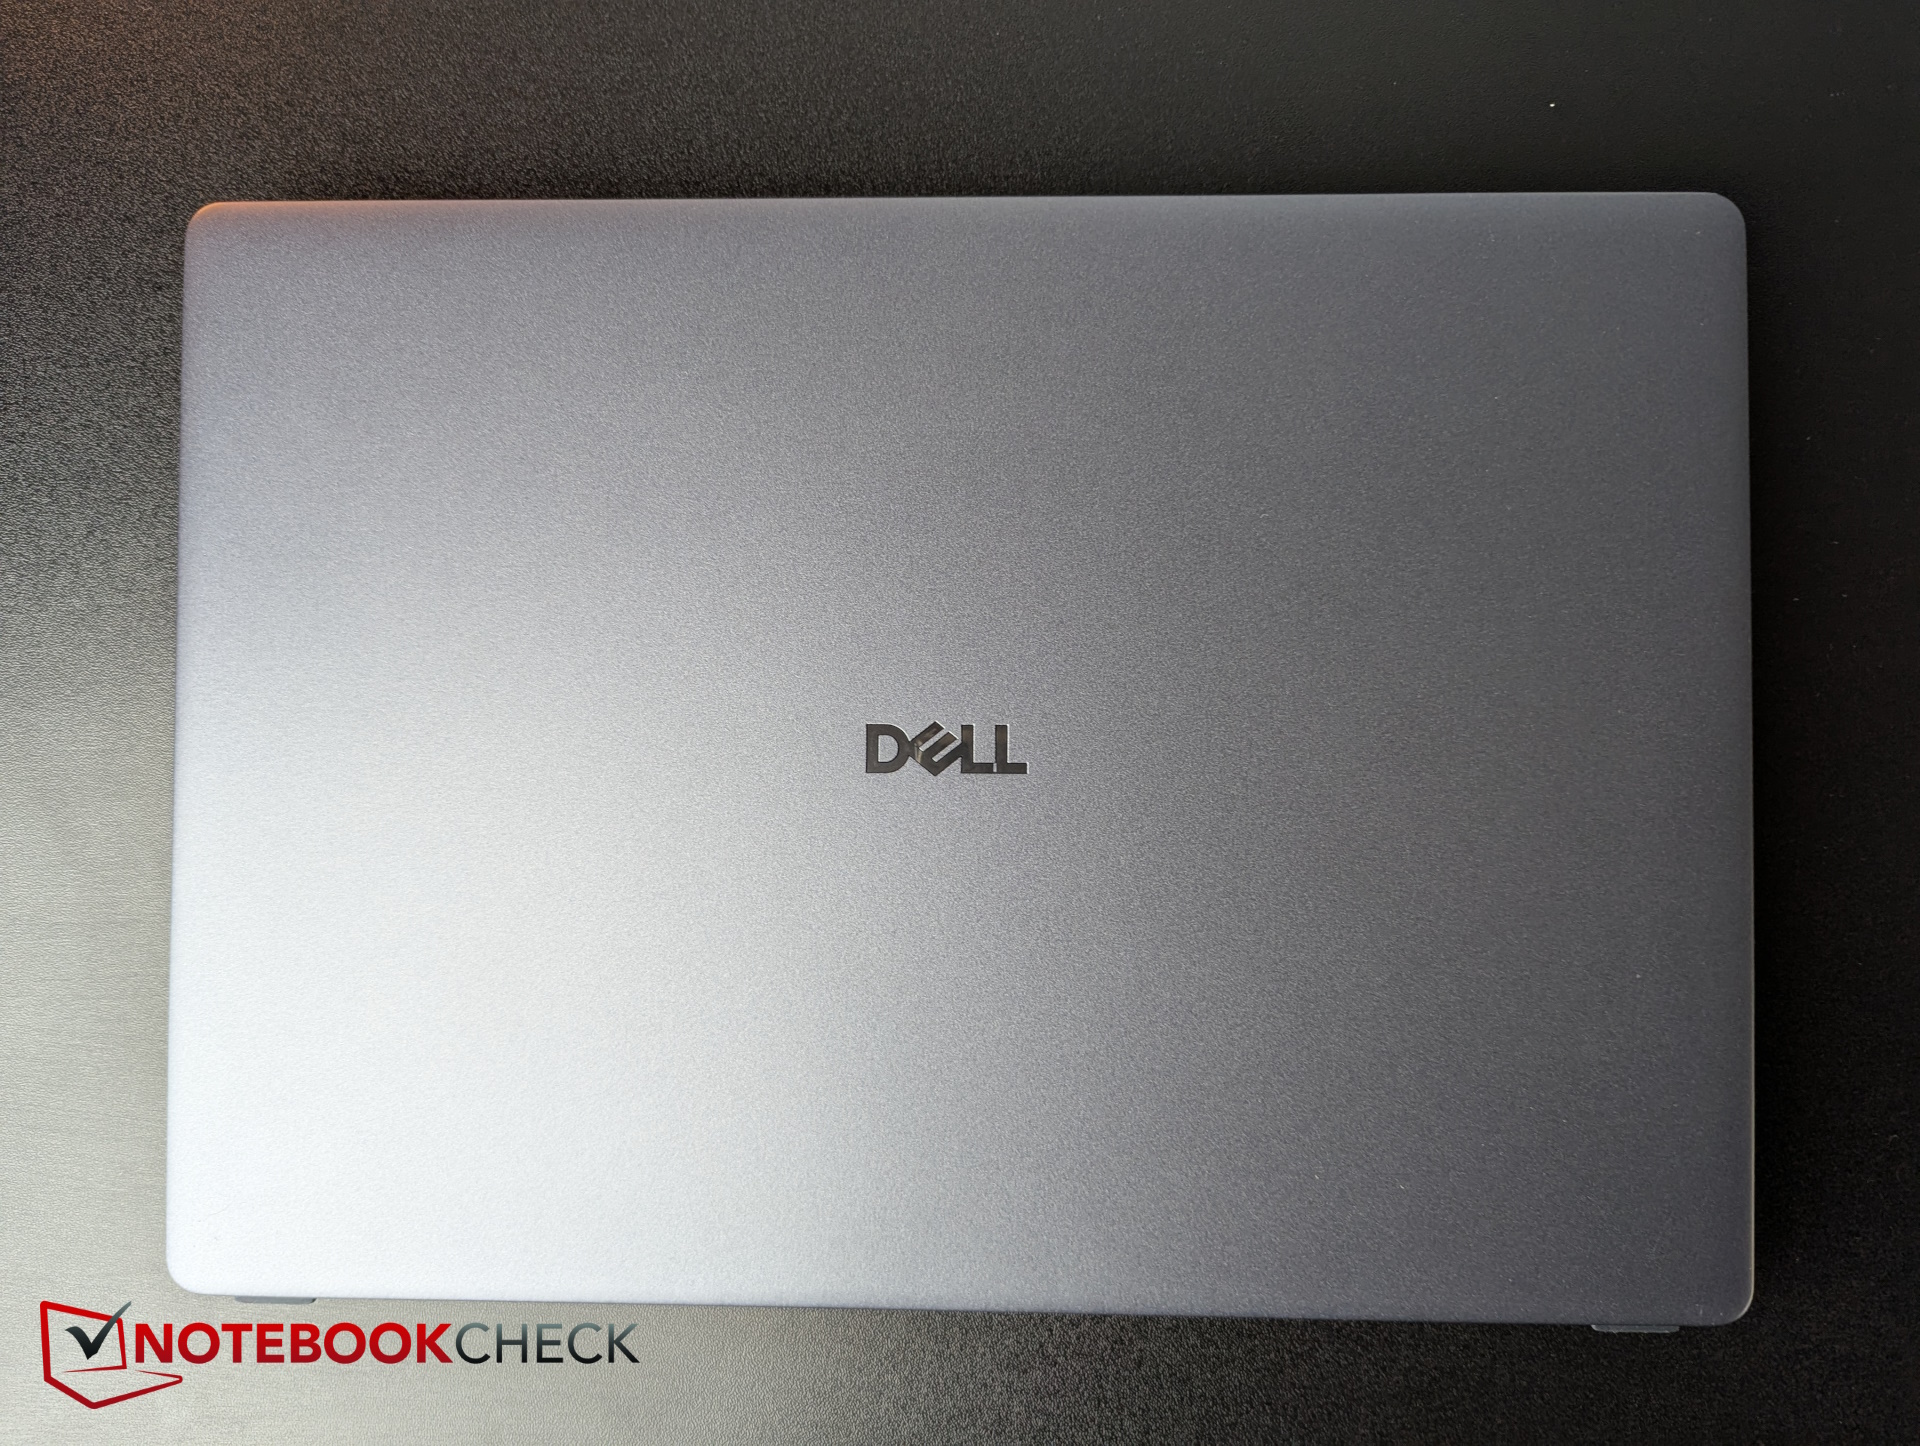
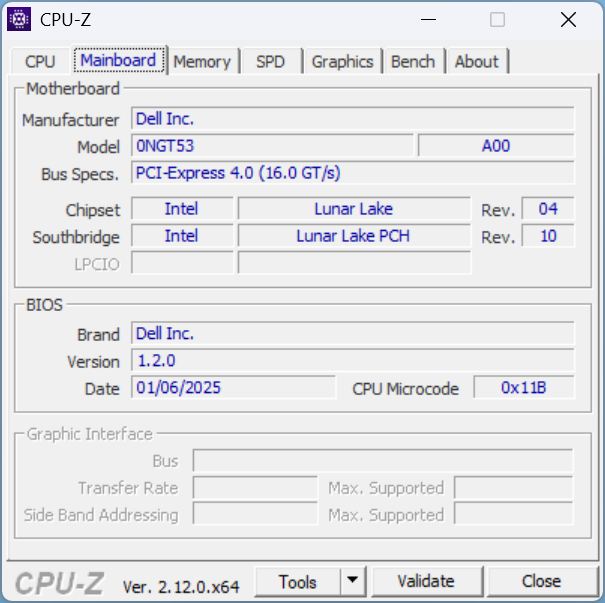
Dell ha recentemente cambiato il suo schema di denominazione. Con la serie Pro, Dell si rivolge al tipico utente business, sostituendo essenzialmente la precedente serie Latitude. Premium è sinonimo di materiali e caratteristiche migliori, e il nostro attuale modello da 13 pollici è dotato di porte moderne, ampia sicurezza, molta intelligenza artificiale, un robusto chassis in magnesio e, nonostante questo, pesa poco più di 1 kg. Quindi, è questo il portatile premium per gli utenti business?
Specifiche
Caso e caratteristiche - Questo Dell è dotato di una webcam da 8 MP
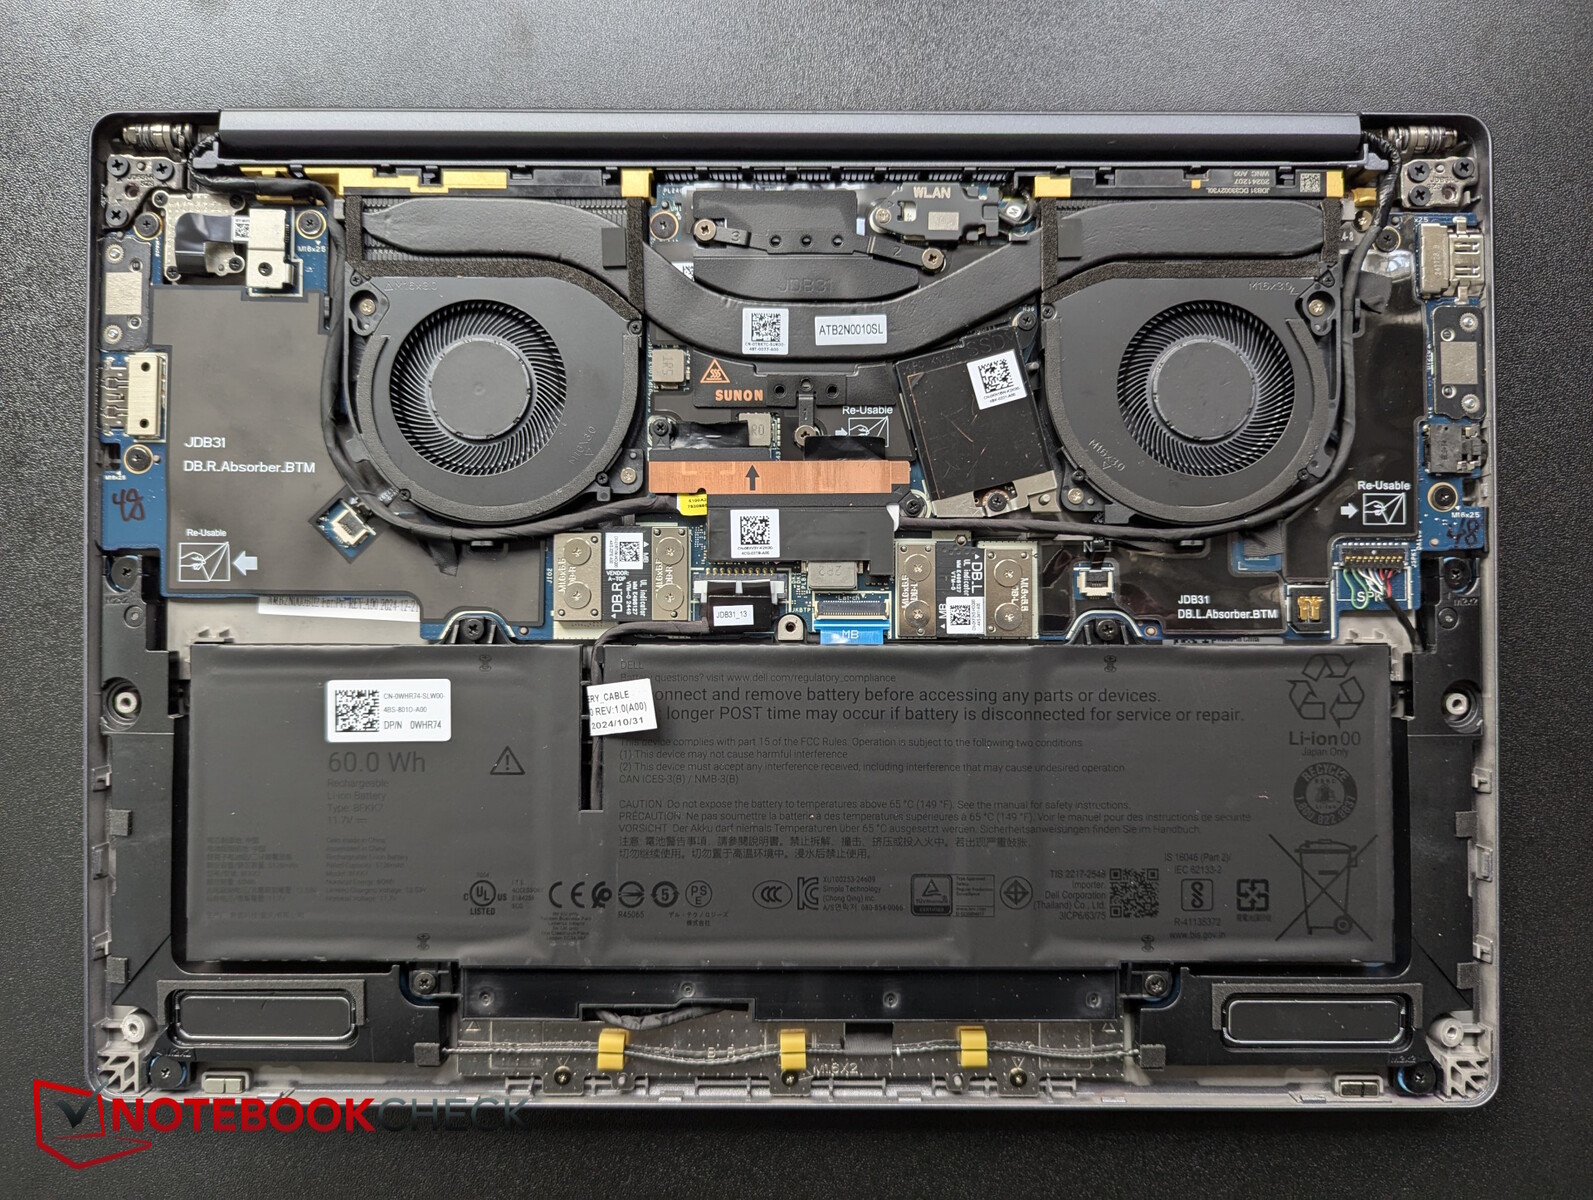
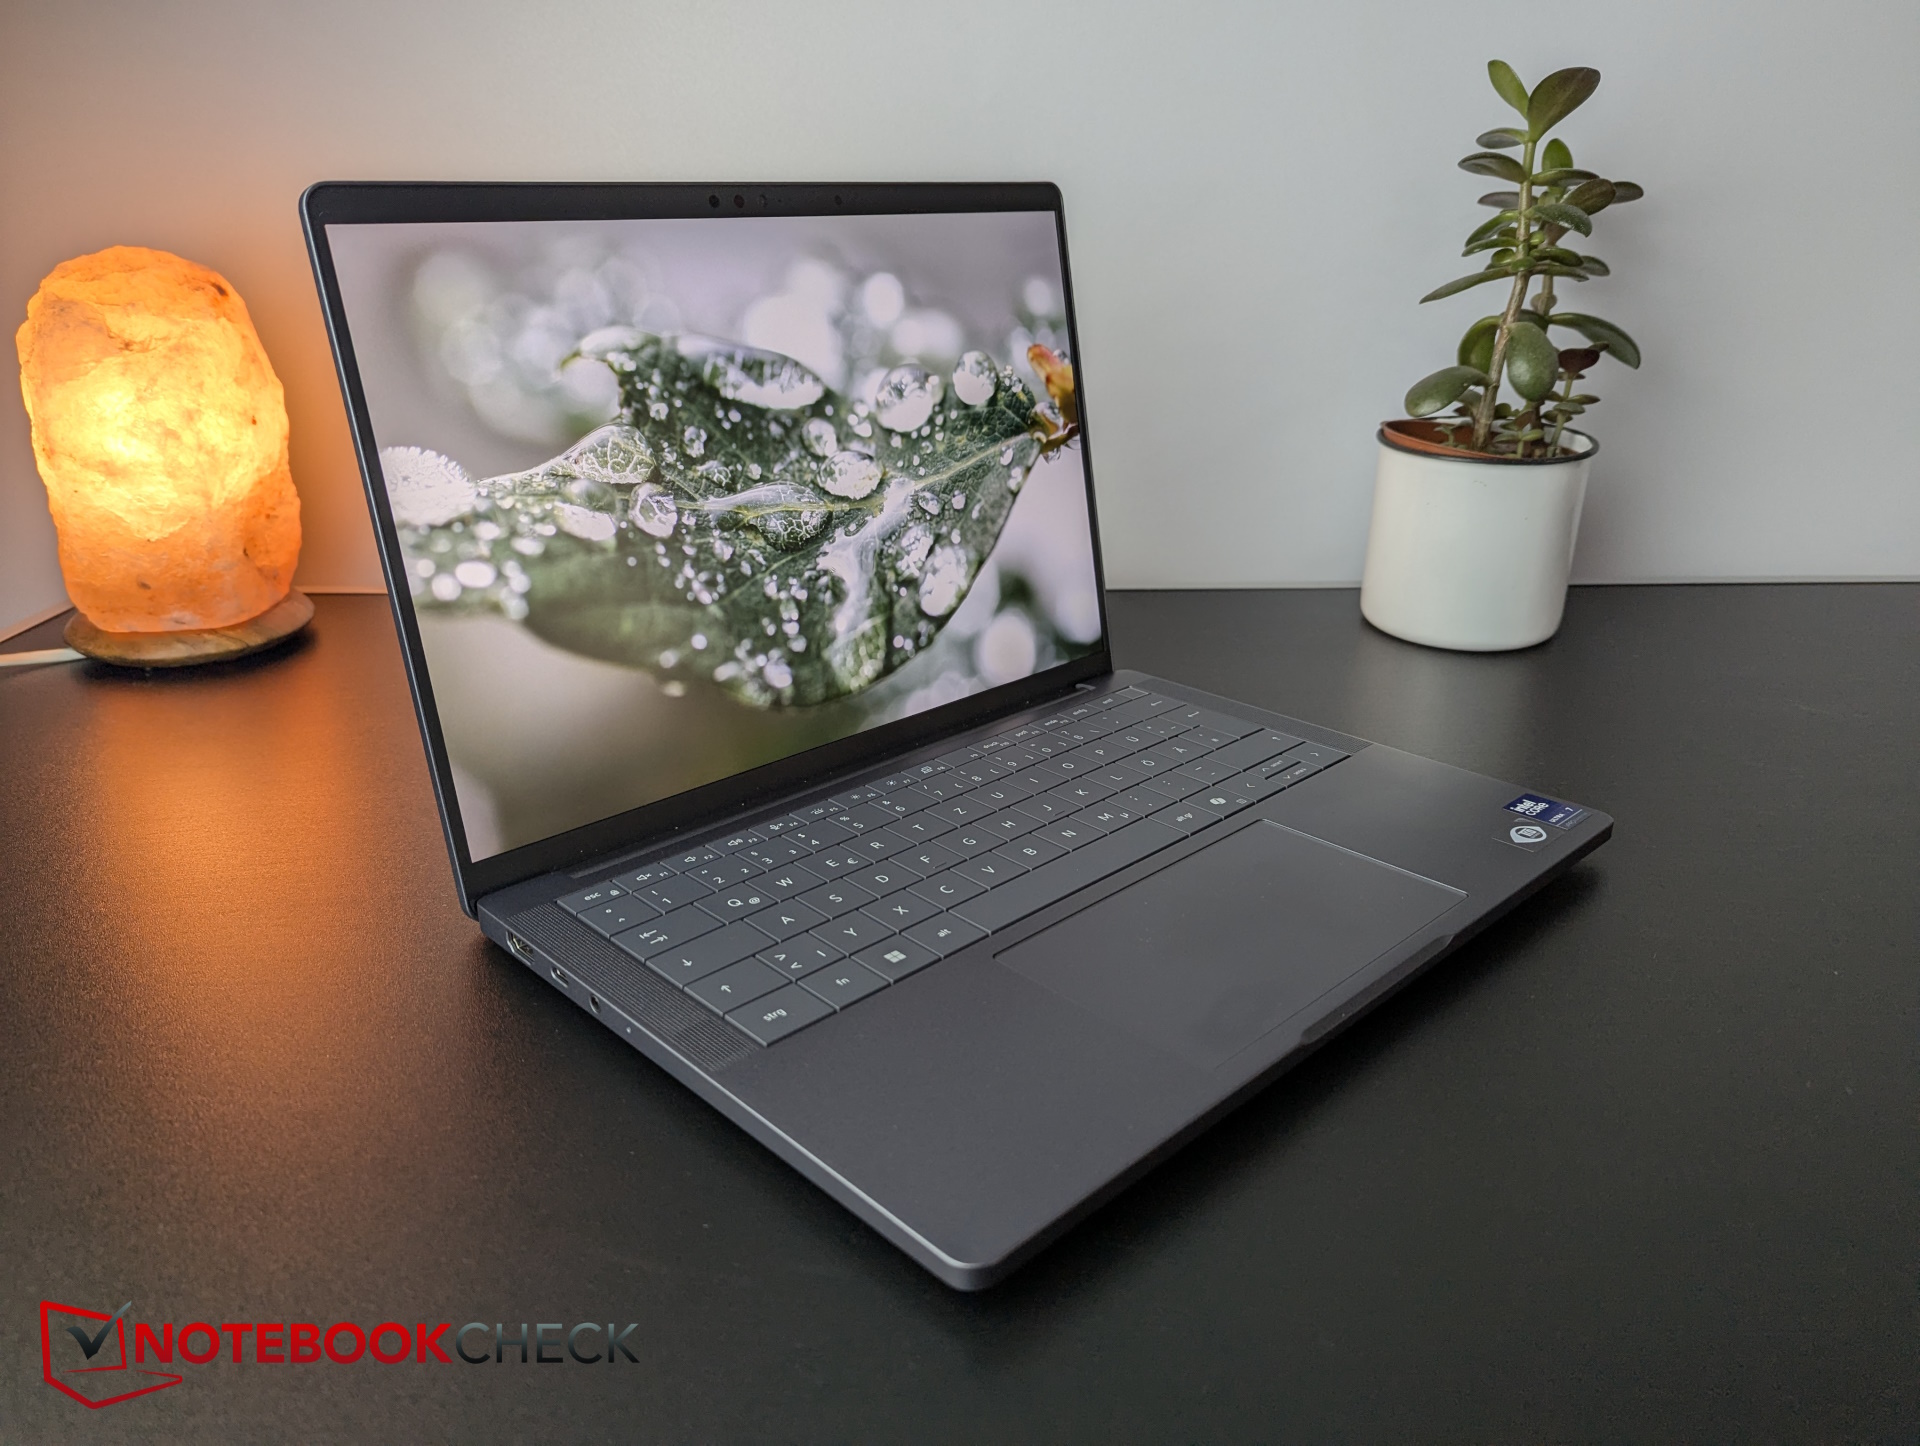
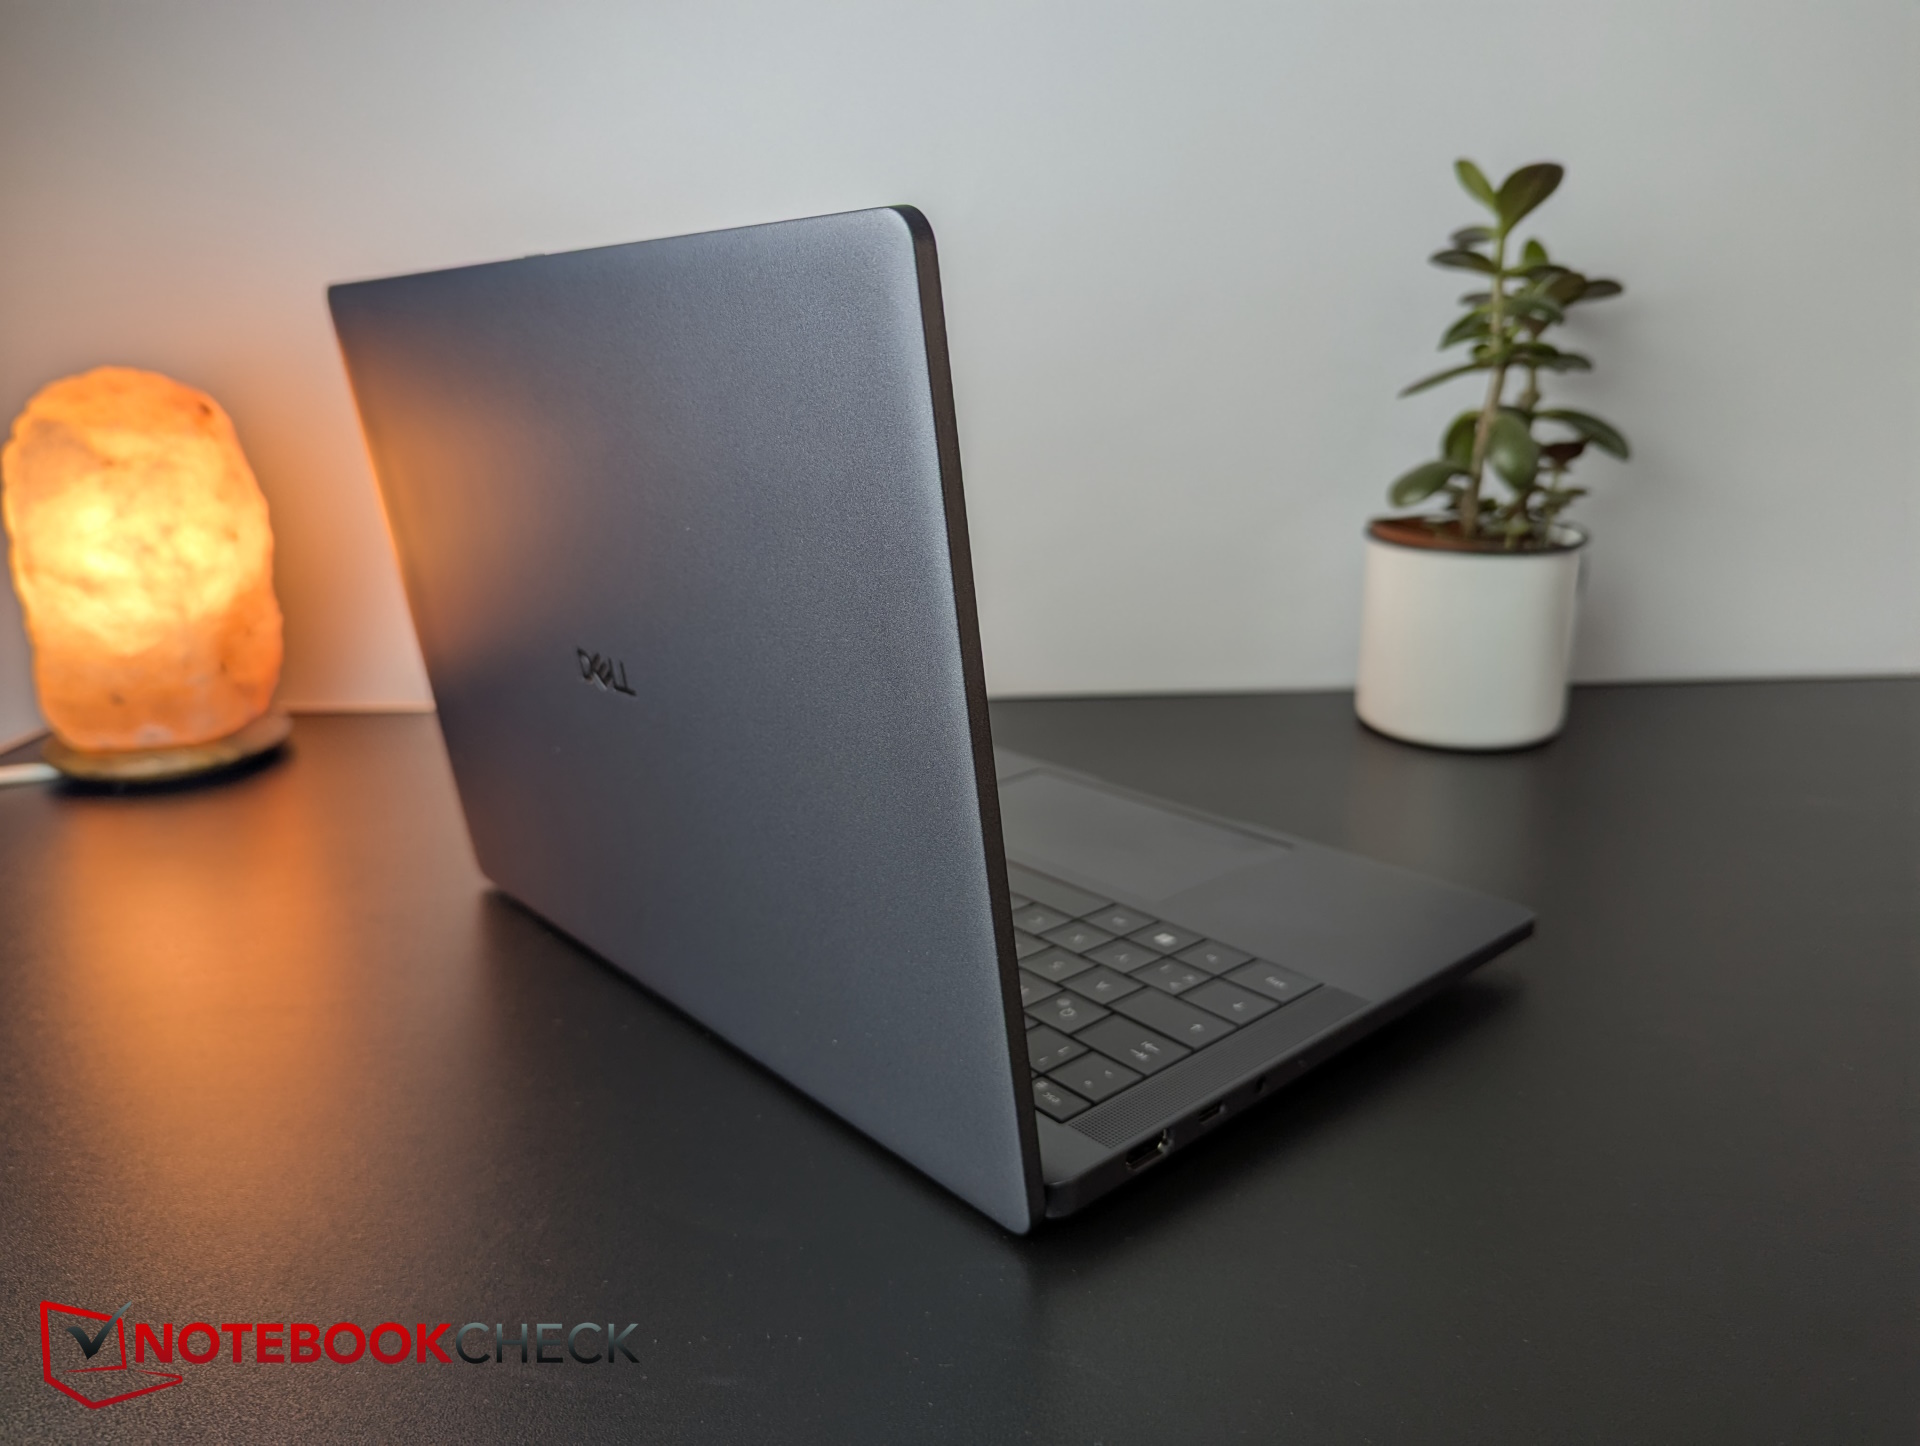
Il case grigio scuro è realizzato con il 90% di magnesio riciclato. Questo rende l'unità di base e il coperchio a 180 gradi molto stabili, e non abbiamo rilevato alcuno scricchiolio durante la rotazione del dispositivo. Il design appare estremamente compatto e semplice, ma elegante.
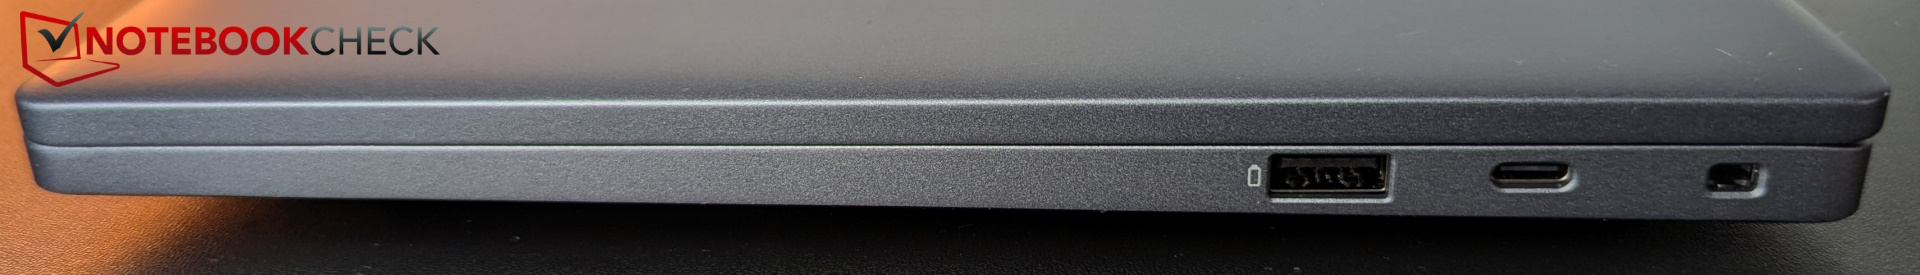
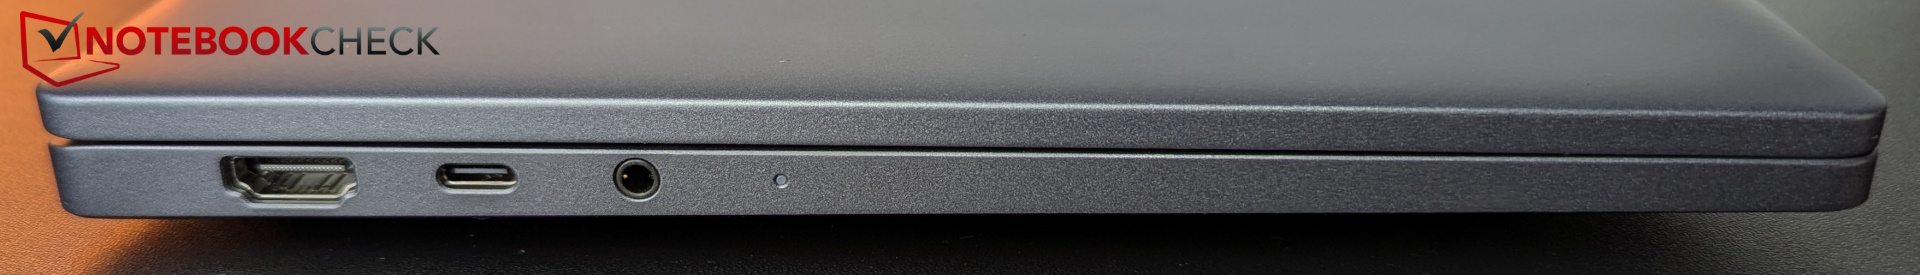
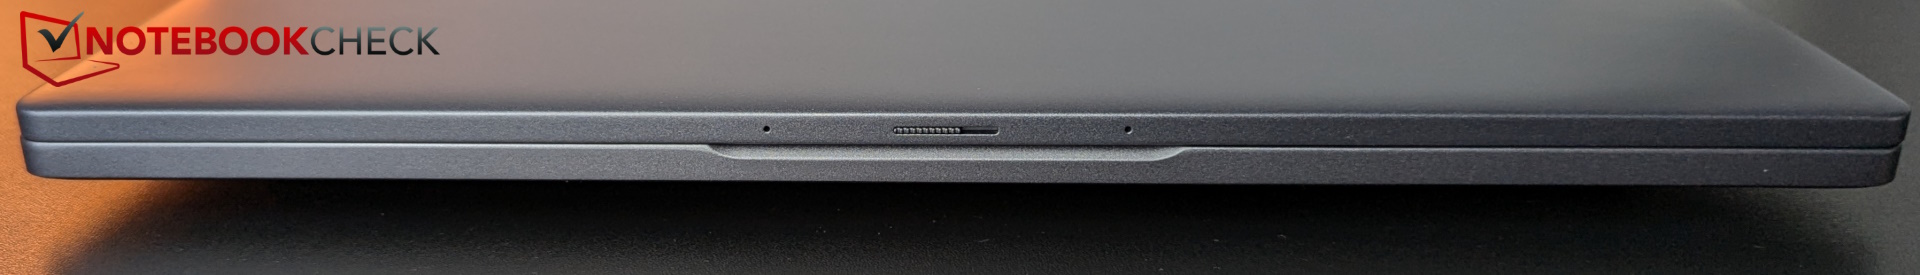
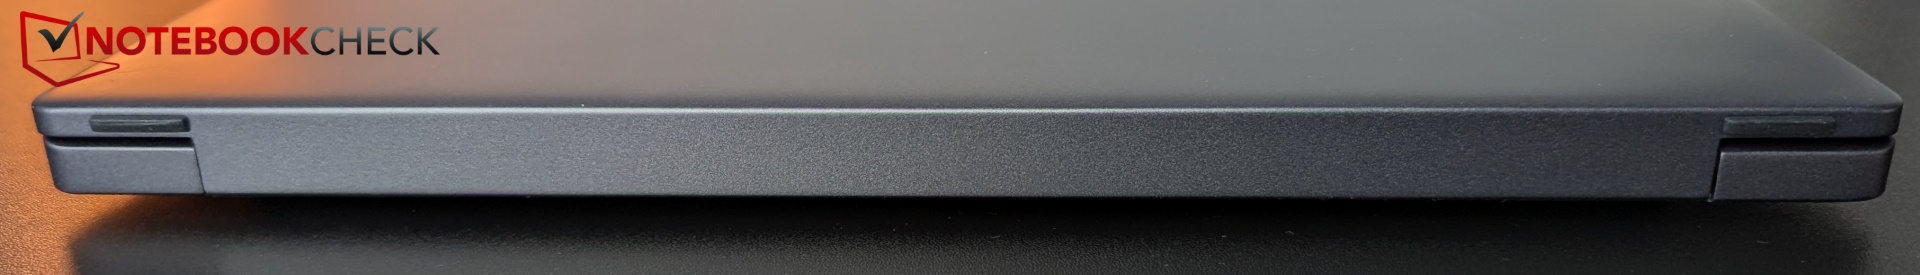
Il Pro 13 Premium dispone di due porte Thunderbolt 4, una su ciascun lato, e di una porta HDMI full-size. Un sensore di impronte digitali è integrato nel pulsante di accensione. Non c'è un lettore di schede o una porta LAN dedicata. Dell offre tuttavia il Wi-Fi 7. Lo slot per la carta SIM è opzionale.
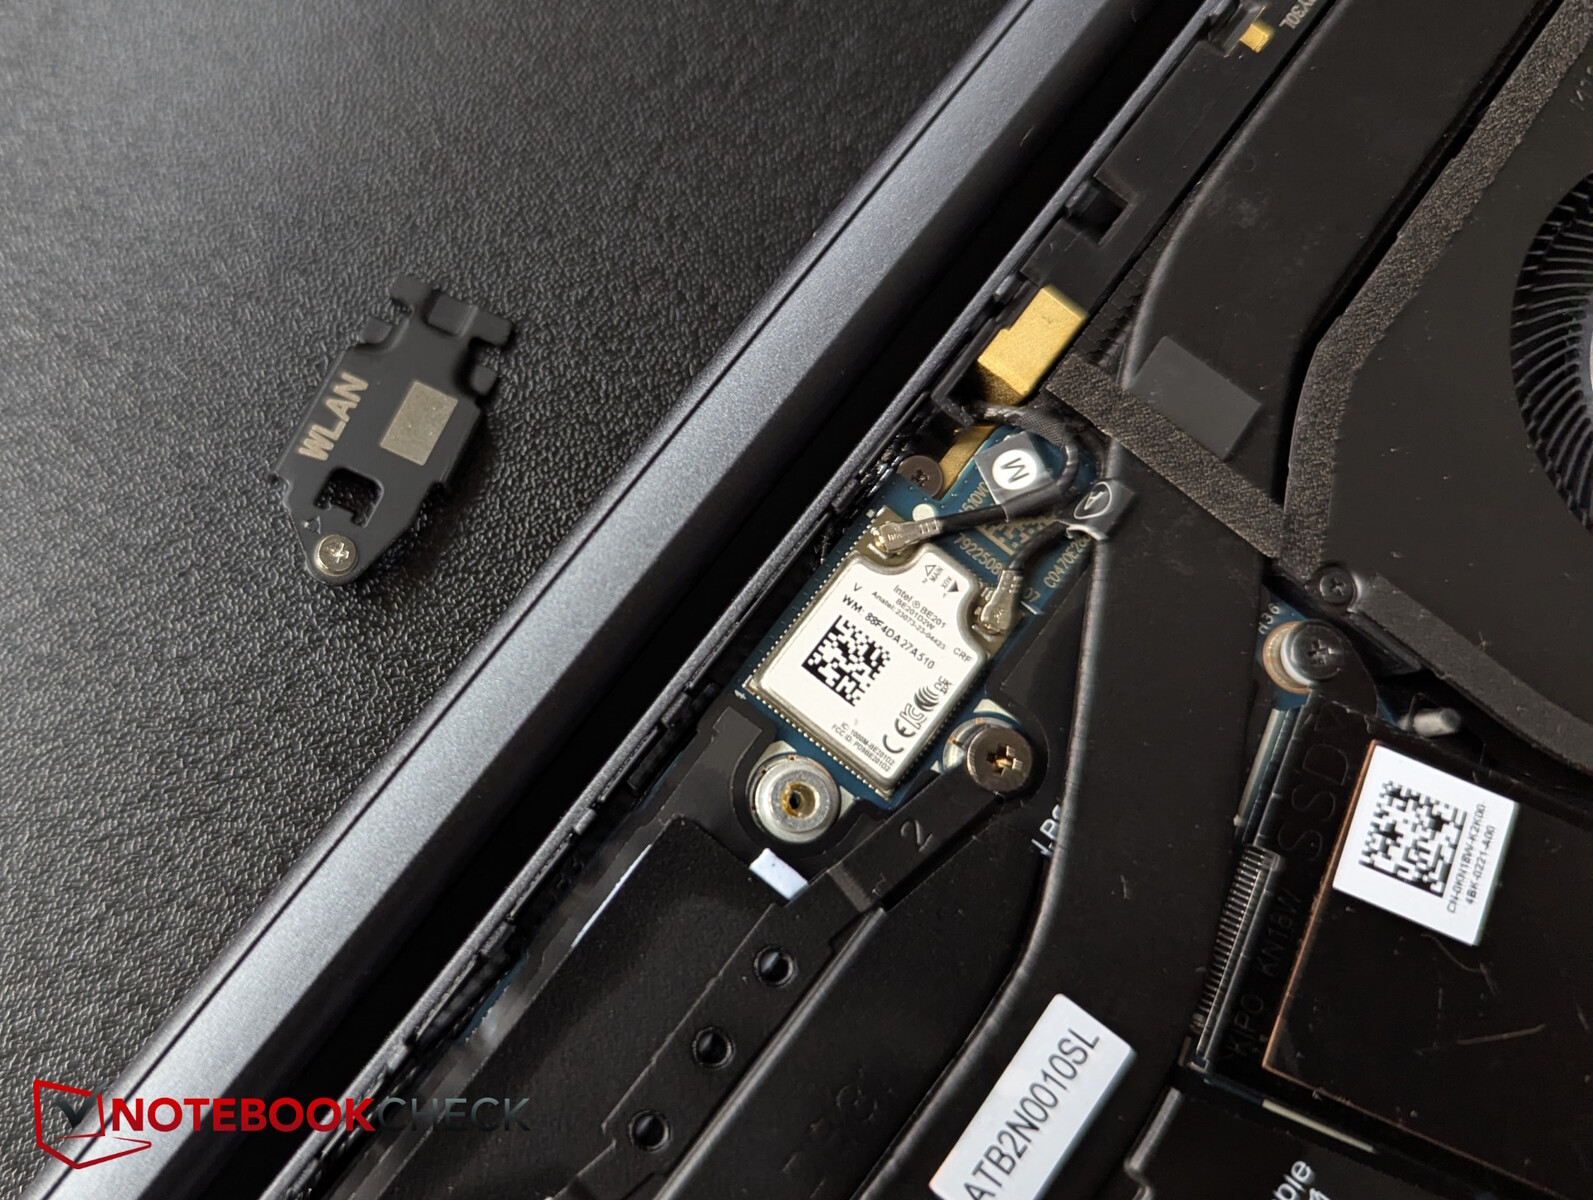
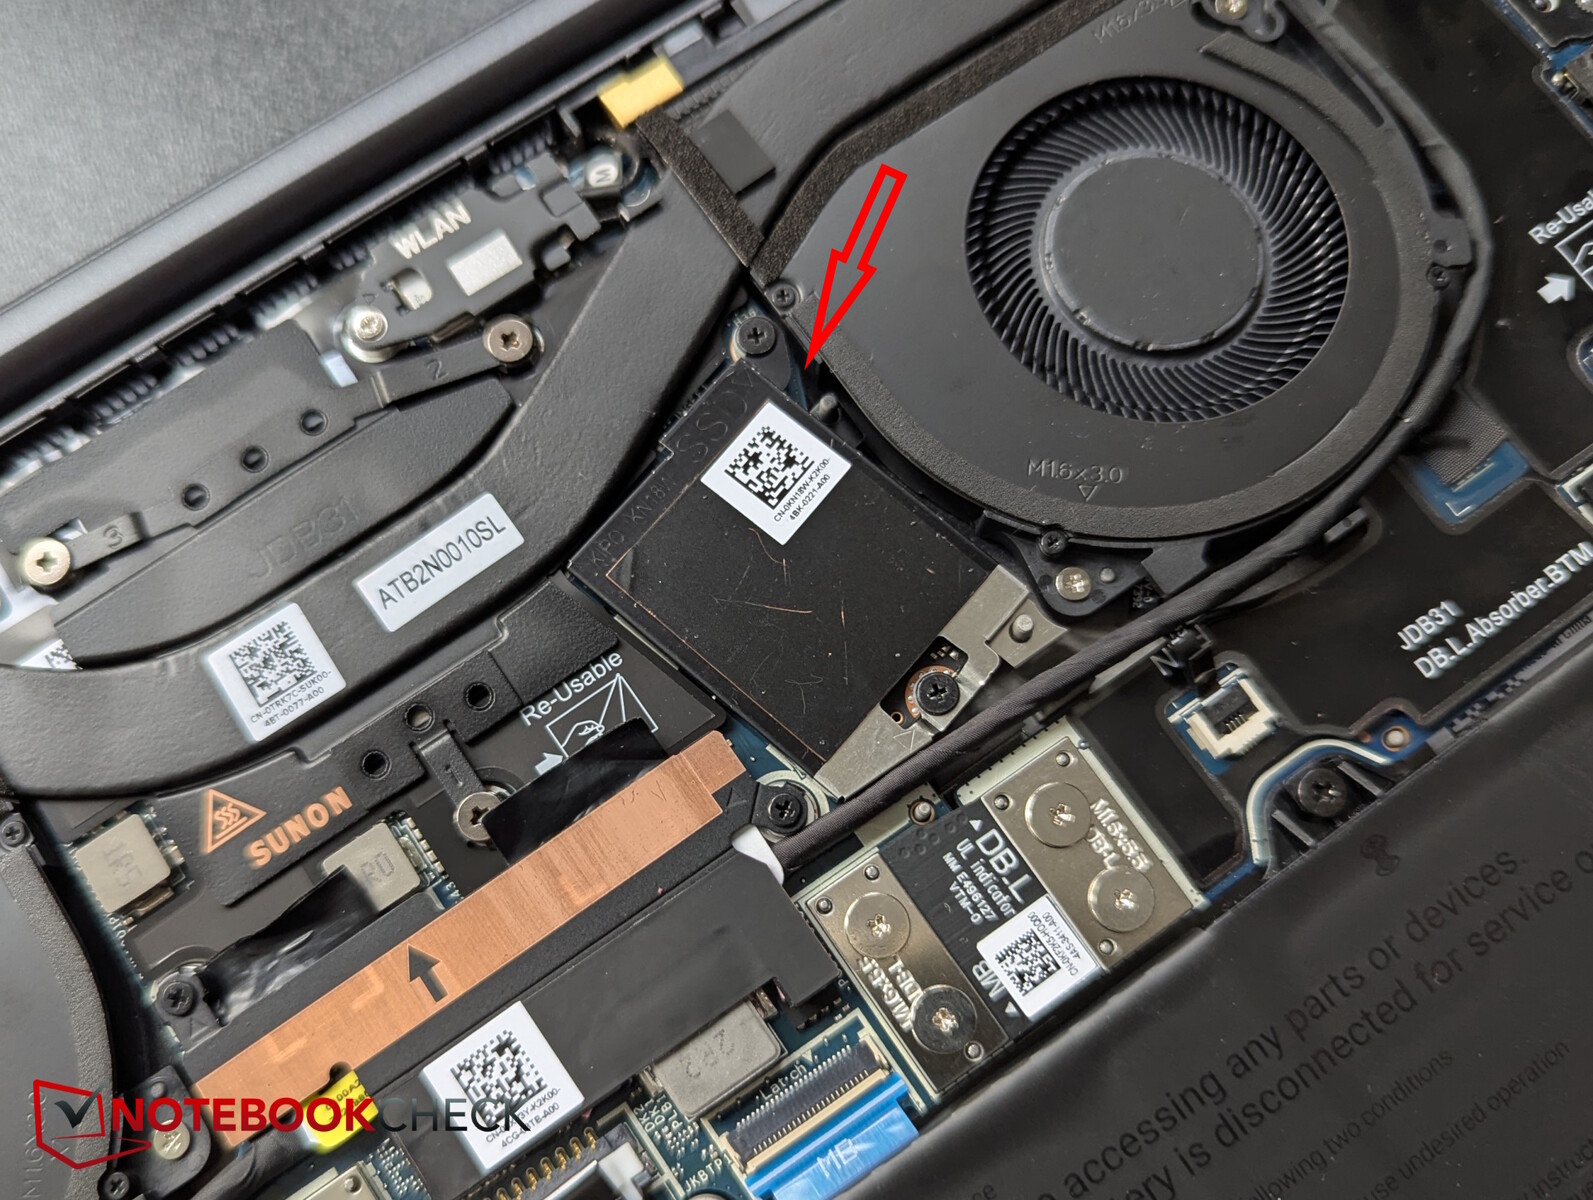
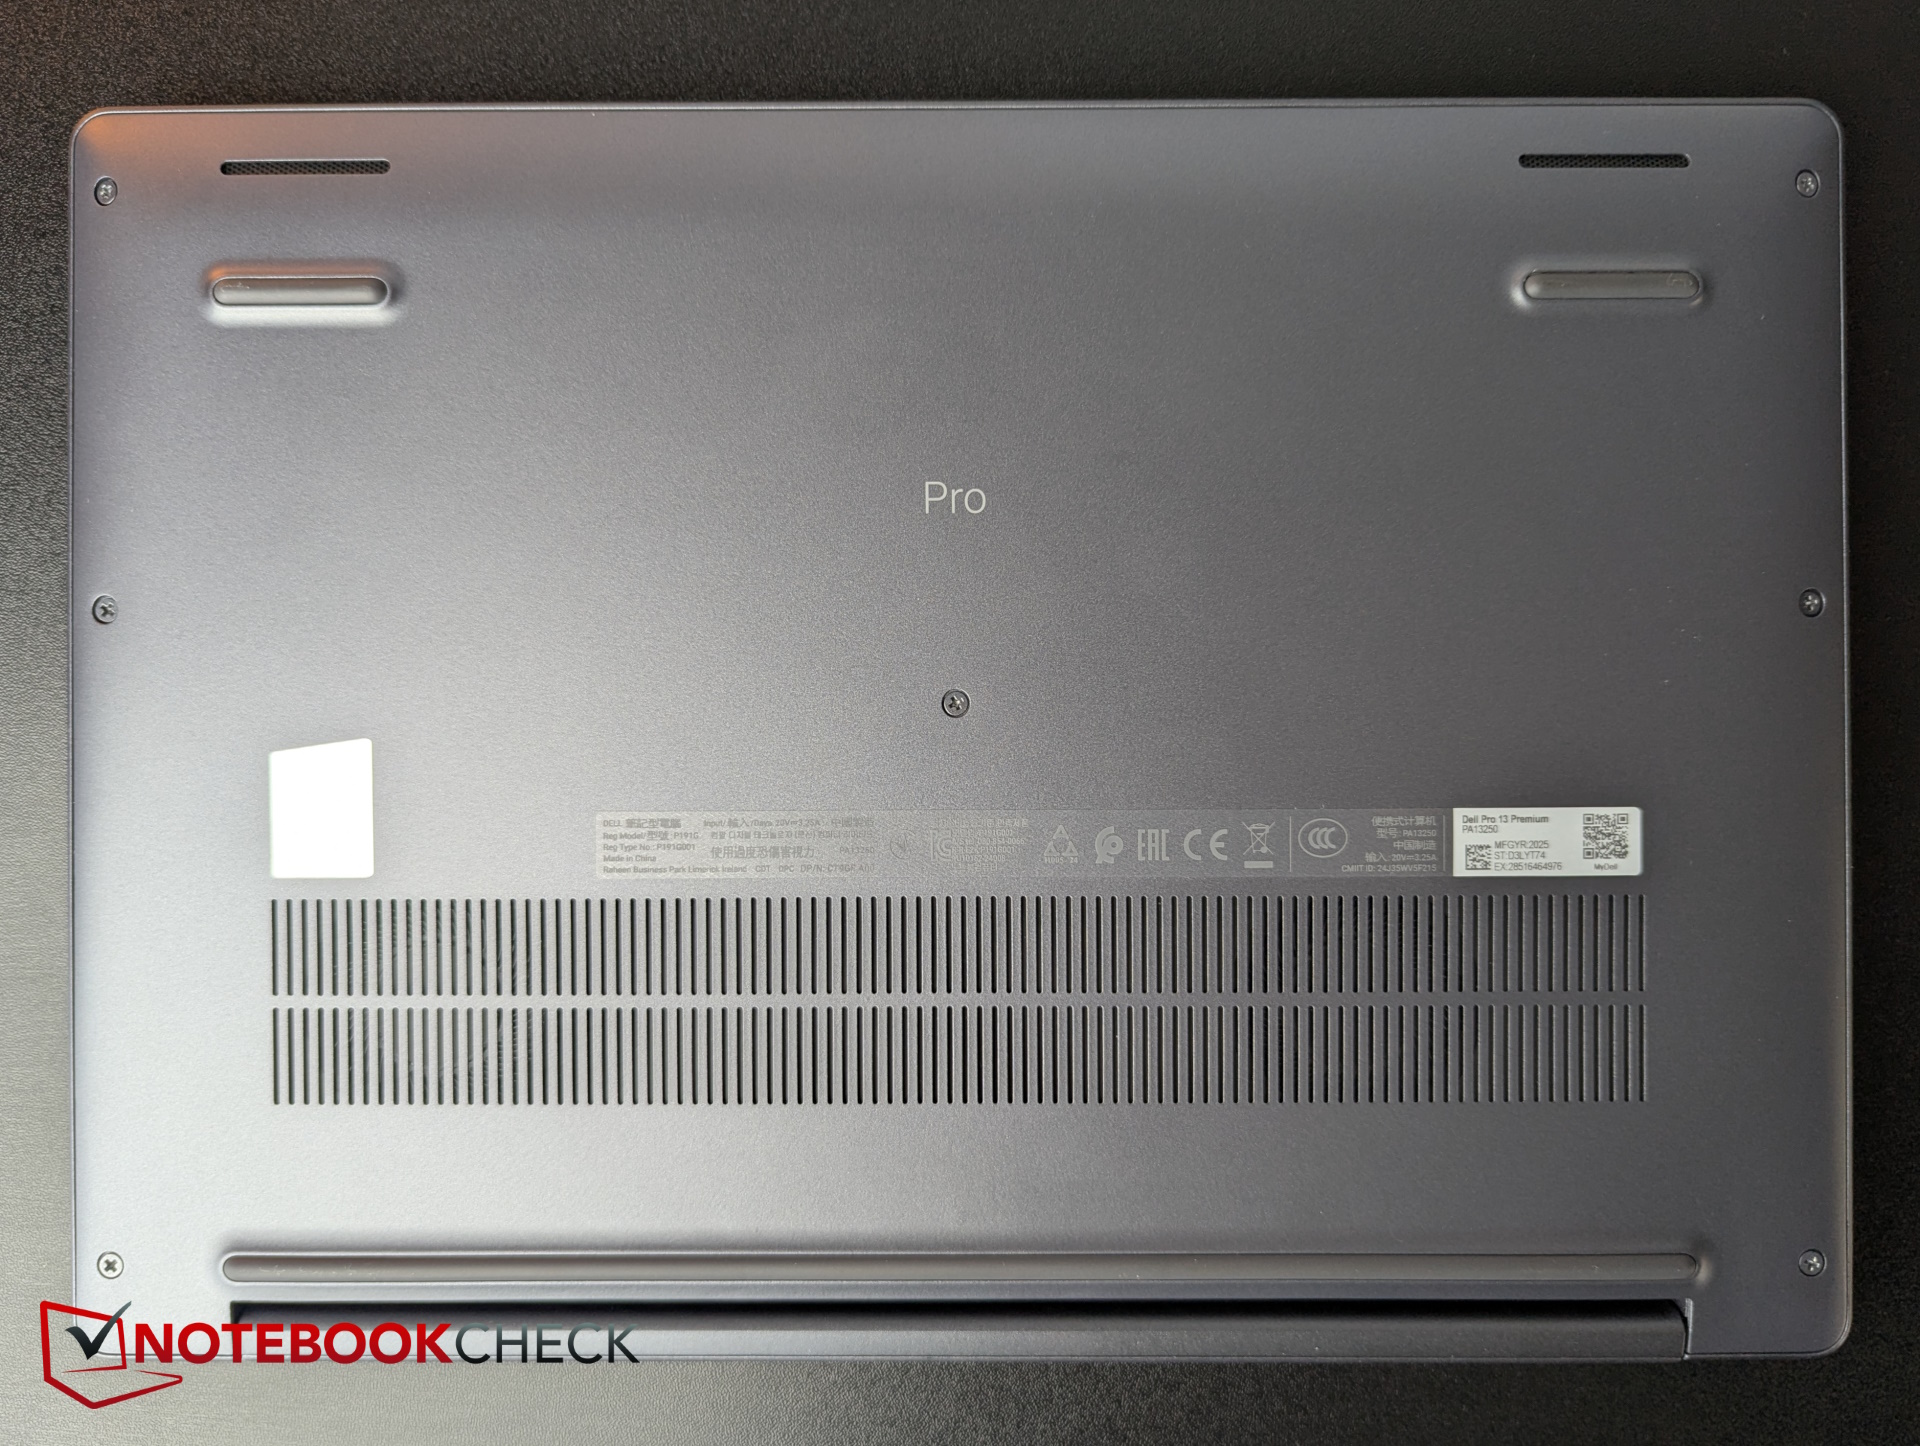
Il portatile business è relativamente facile da aprire con le viti Phillips che rimangono nella piastra di base. Tuttavia, la RAM e il modulo Wi-Fi sono installati in modo permanente all'interno, e l'SSD è solo nel piccolo formato M.2 2230 e manca di un secondo slot.

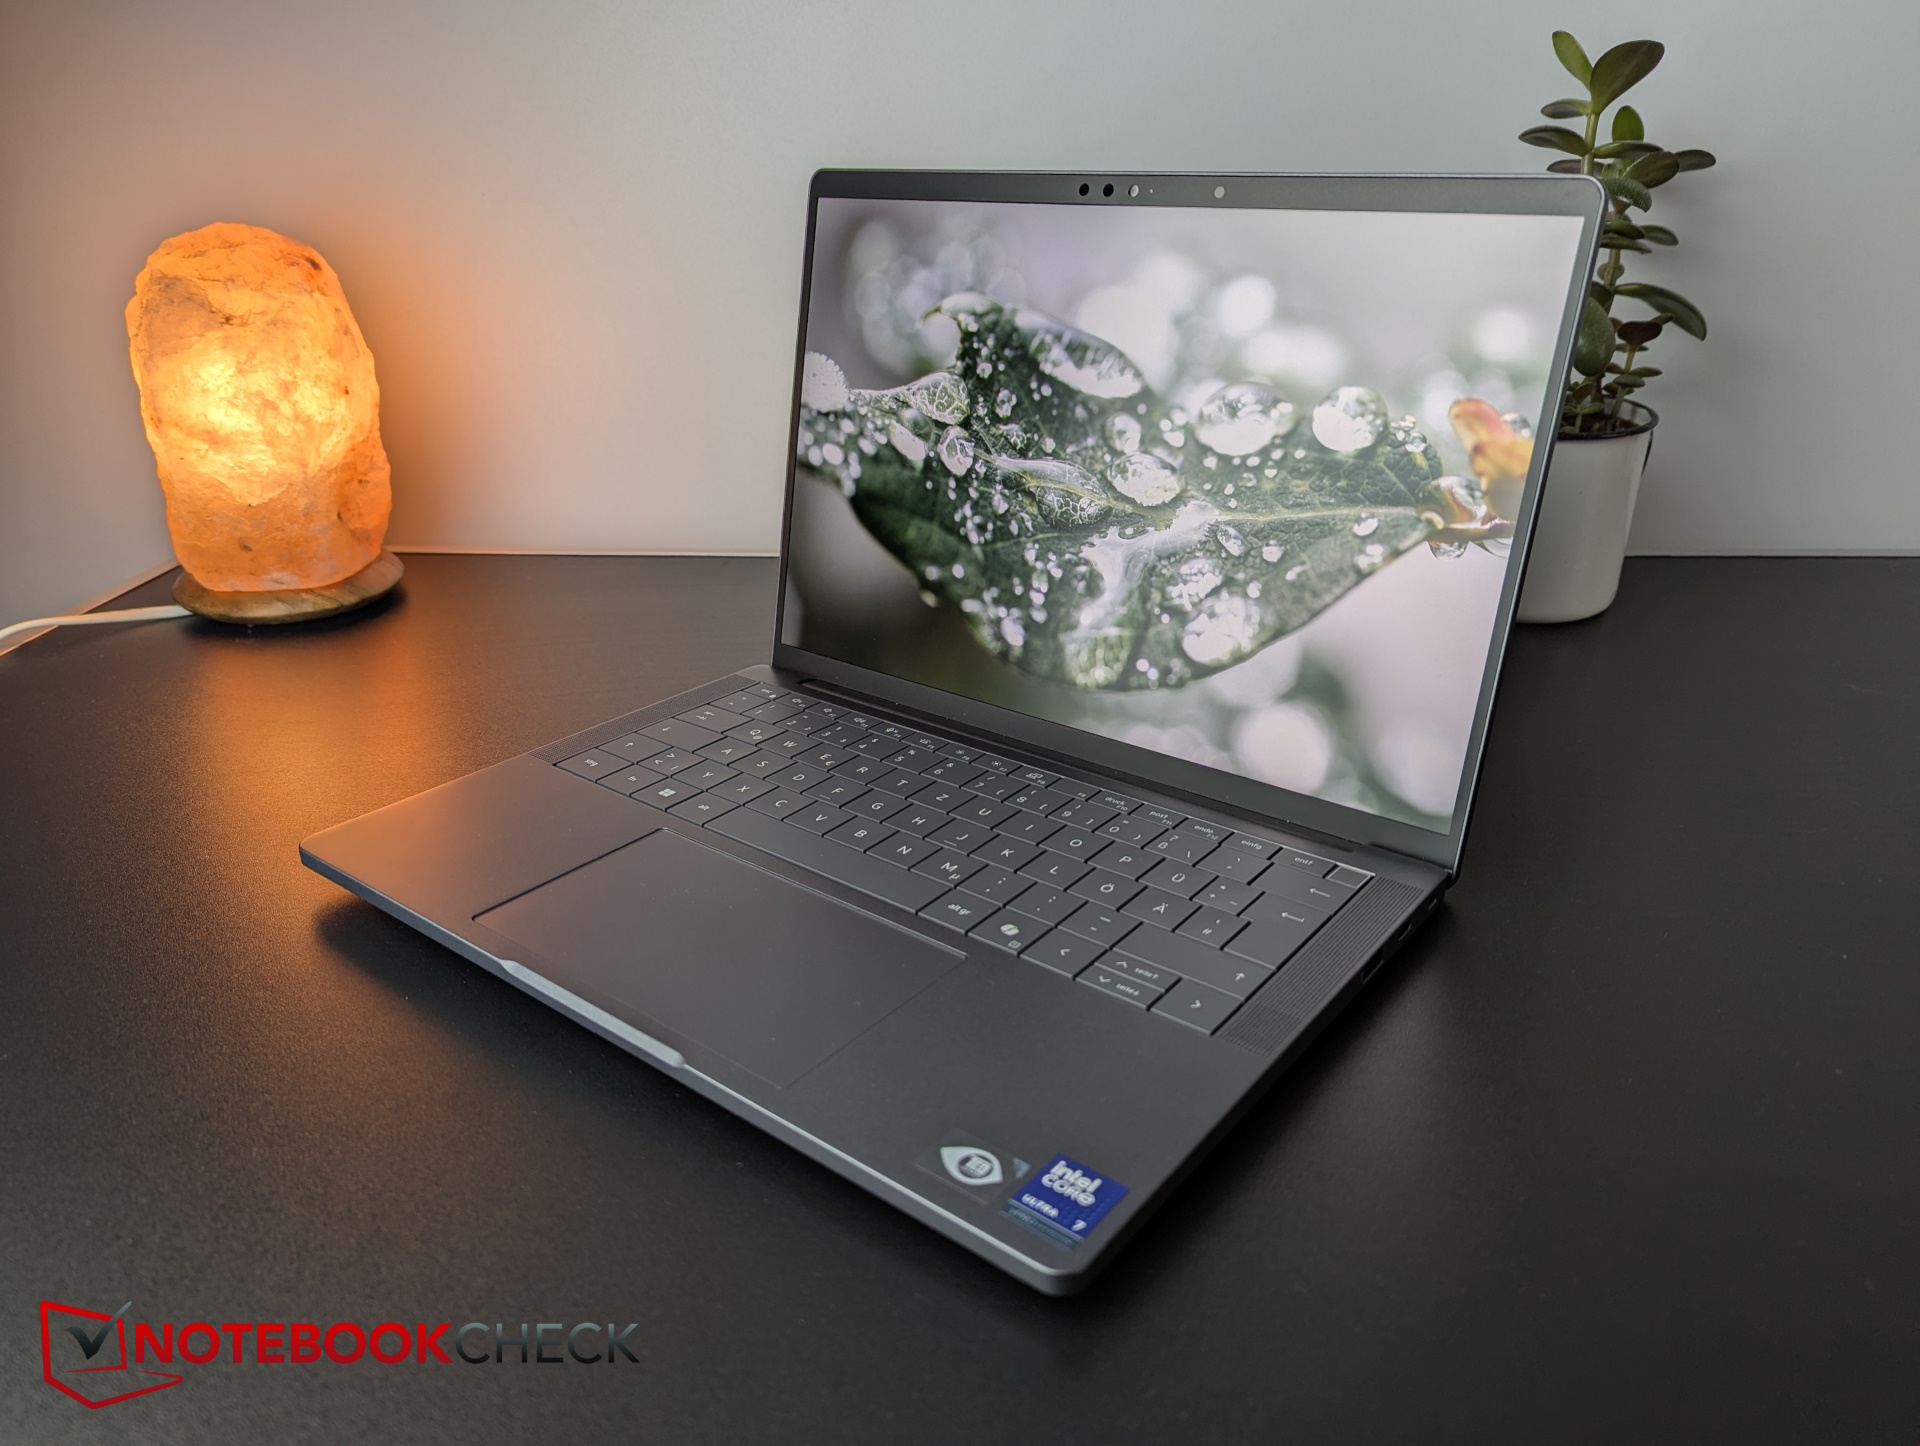
Con 8 MP, la webcam IR ha una risoluzione insolitamente alta. Questo conferisce alle immagini del test una buona nitidezza, ma le deviazioni del colore sono medio-alte, soprattutto nella gamma dei verdi. Il modulo WiFi 7 offre velocità di trasferimento sempre elevate.


Sostenibilità
Secondo Asus, il Pro 13 Premium ha ottenuto la certificazione ENERGY STAR, la registrazione EPEAT Gold e il sigillo Climate+. Inoltre, soddisfa la più recente certificazione TCO Generation 9 per il consumo energetico e la riparabilità.
I materiali utilizzati includono plastica PCR, magnesio riciclato, plastica biobased e cobalto riciclato, mentre l'imballaggio è realizzato al 100% con materiali riciclati o rinnovabili, principalmente cartone.
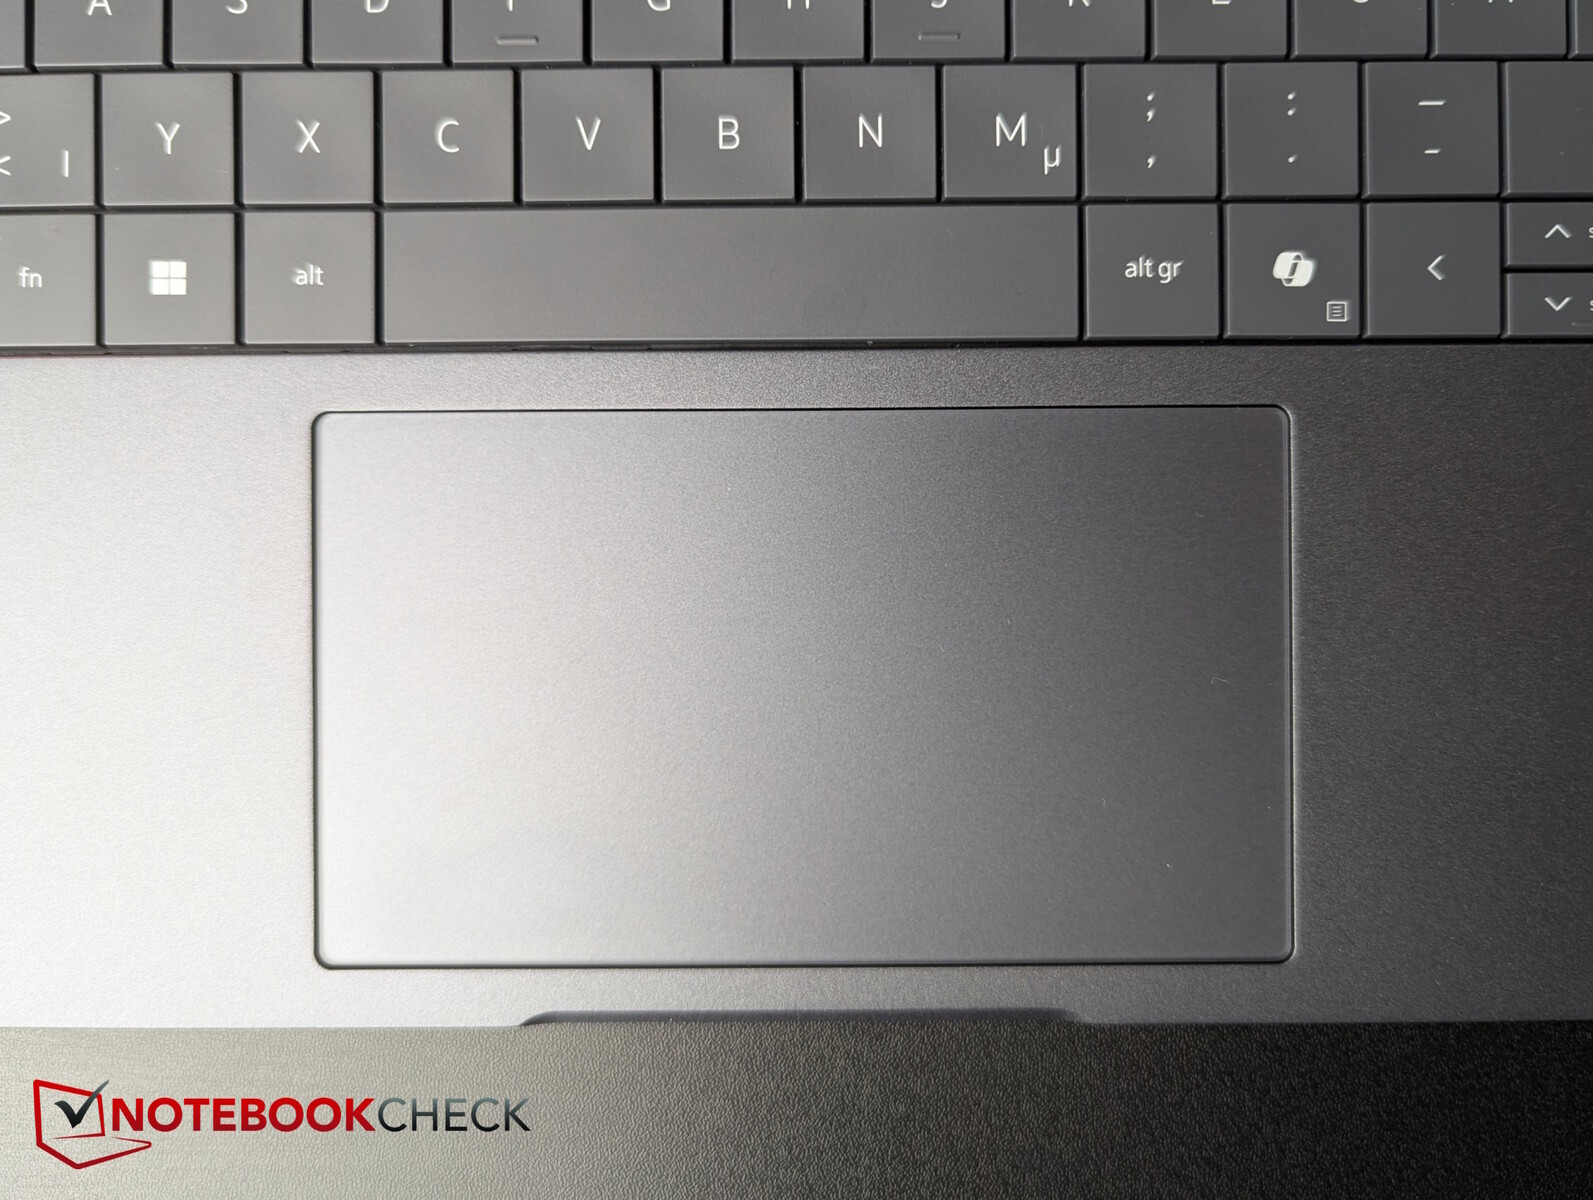
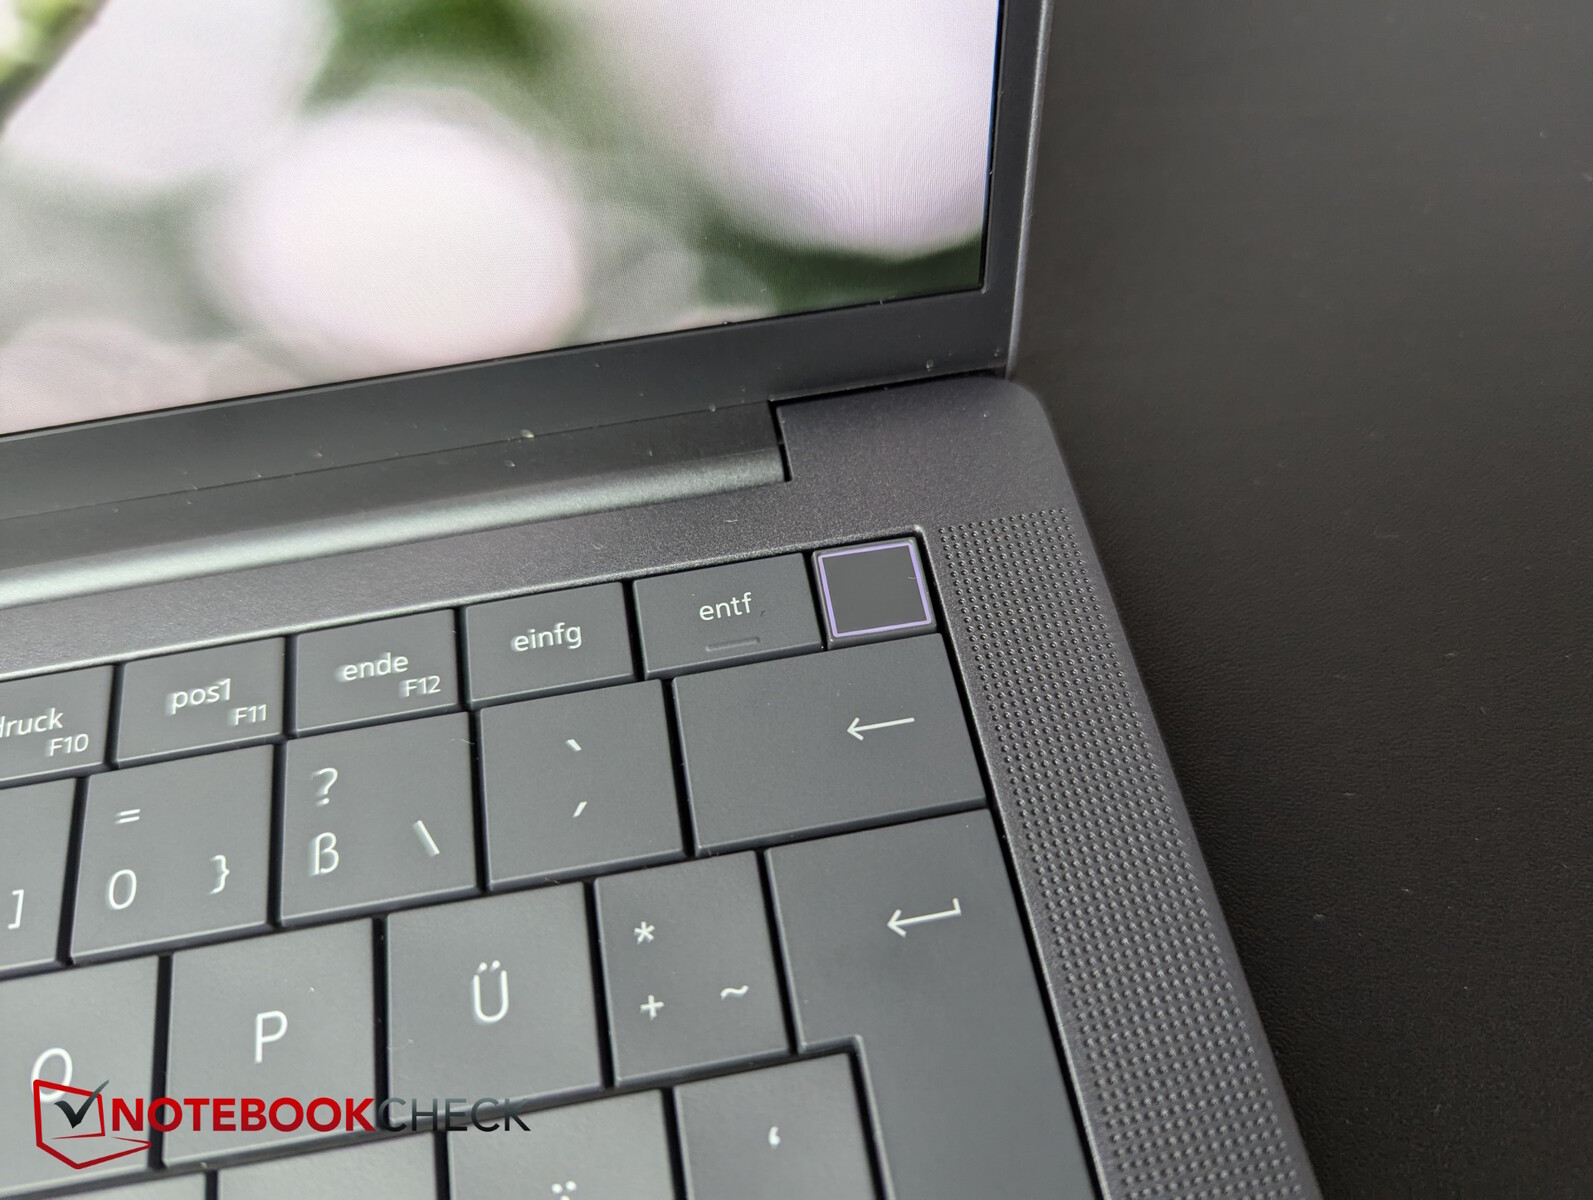
Dispositivi di input - Il 13 Premium ha un touchpad per le chiamate in conferenza
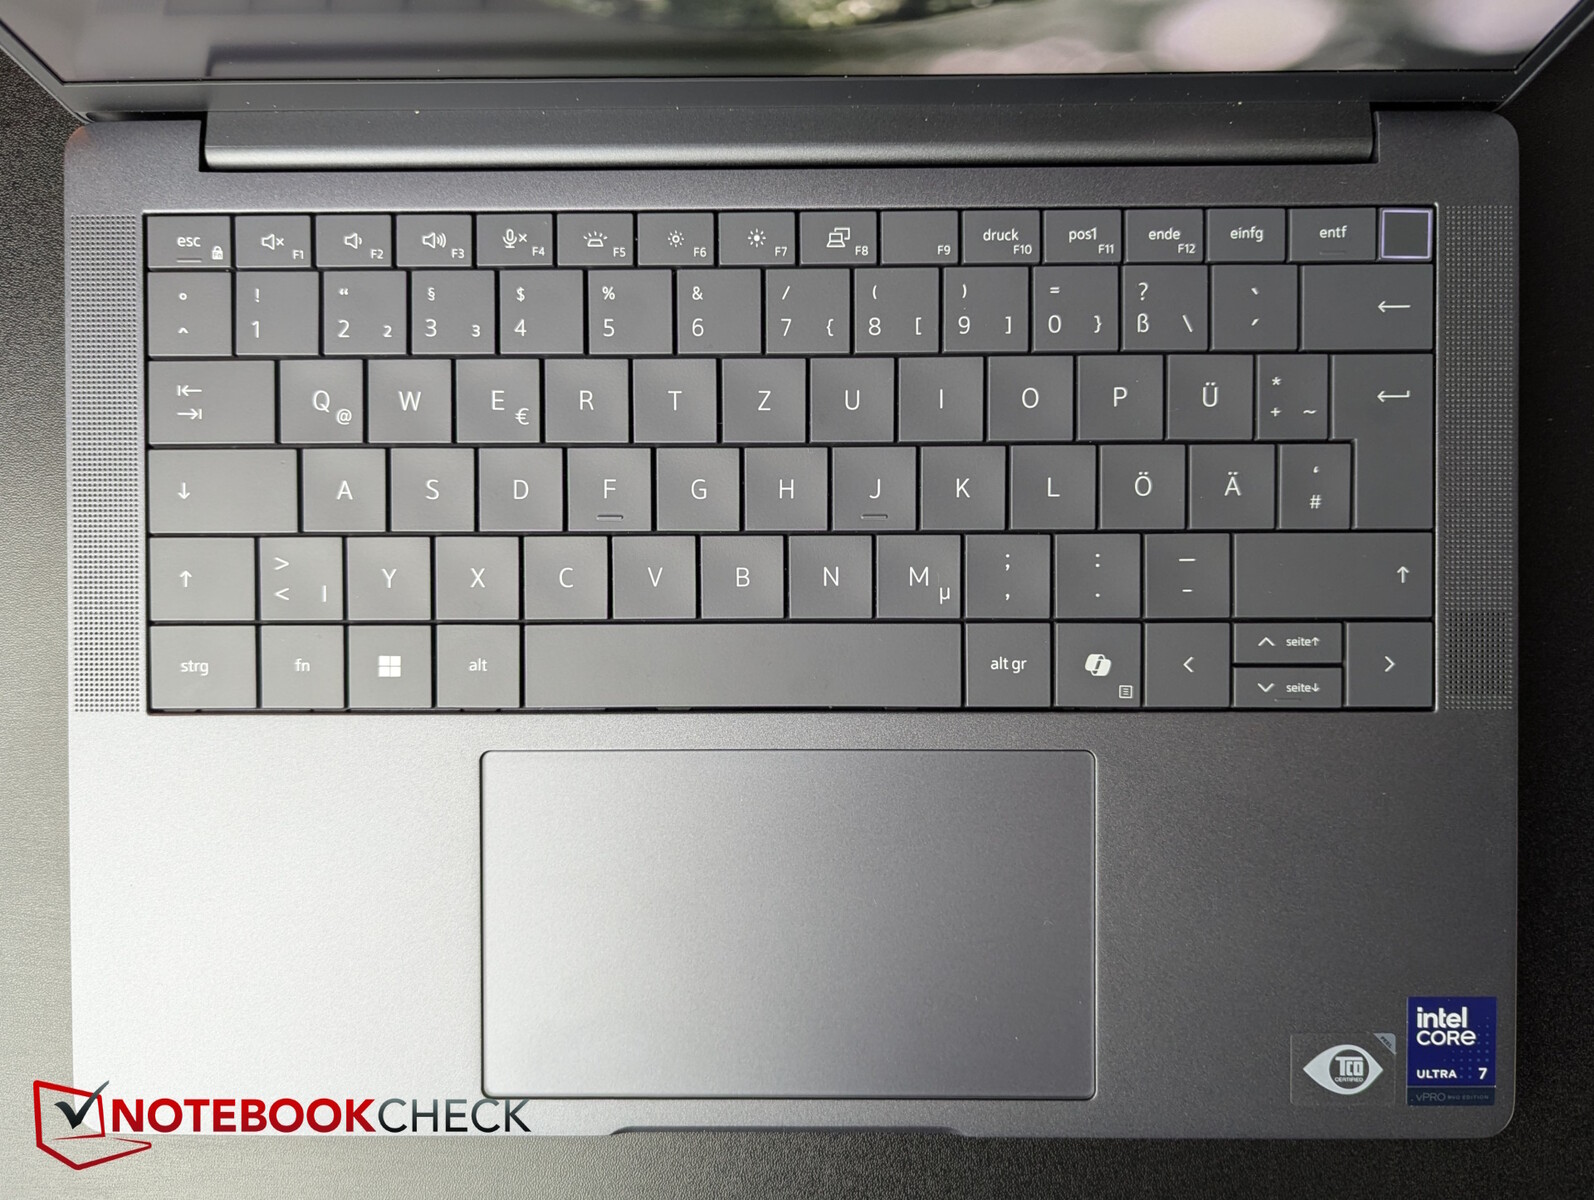
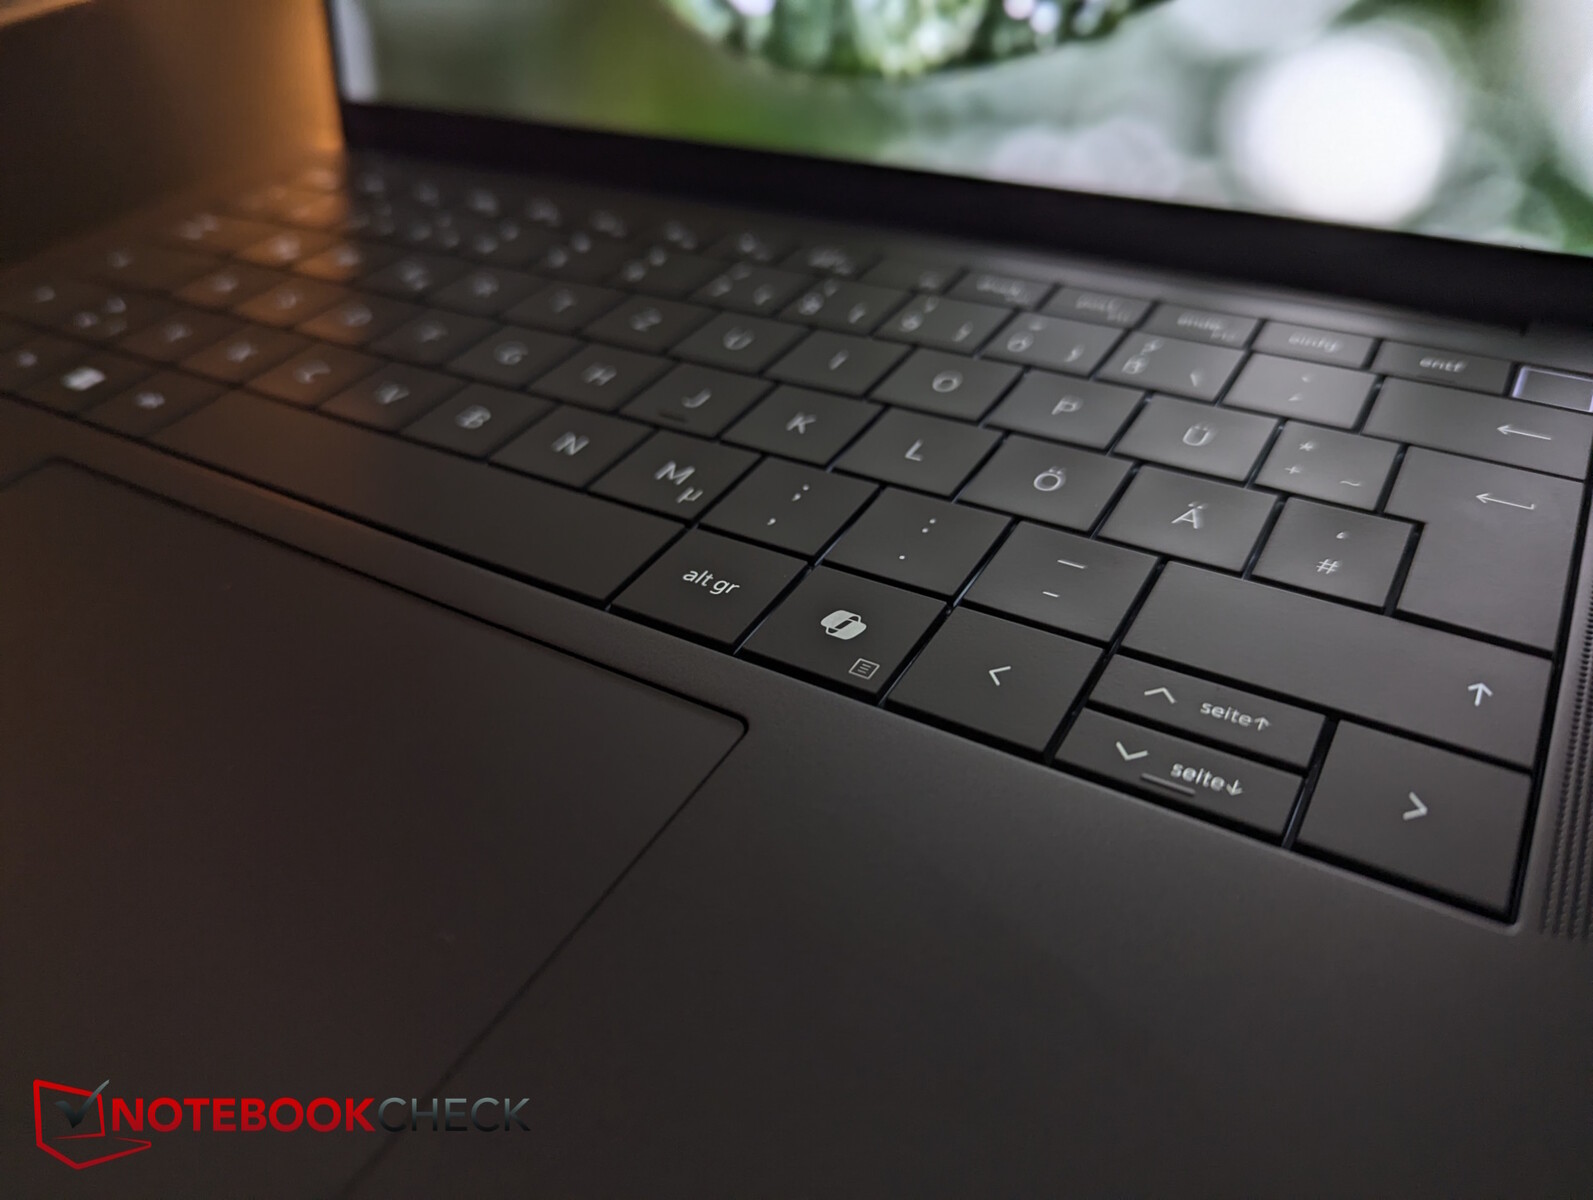
Dell offre un layout molto ordinato e compatto, con tasti grandi (circa 1,7 cm), senza spazi vuoti tra loro, e i tasti freccia verticali sono dimezzati in altezza. Il pulsante di accensione integrato nella tastiera in alto a destra ospita anche un sensore di impronte digitali.
I tasti hanno una corsa medio-bassa ma un feedback tangibile. Ciò consente all'utente di digitare rapidamente, mentre il rumore dei tasti è più che moderato. Il consumo energetico della retroilluminazione a due livelli è stato ridotto fino al 75 percento grazie ai mini LED.
Il touchpad misura circa 12,5 x 7,1 cm e la sua caratteristica principale è l'inclusione di tasti speciali per la video chat nella riga superiore (attivazione/disattivazione della fotocamera, condivisione dello schermo, chat, attivazione/disattivazione del microfono). I simboli touch sono visibili solo durante le chiamate Zoom o Microsoft Teams. La superficie è molto liscia, ma se si è appena lavato le mani o se ha le dita leggermente umide per qualche altro motivo, il touch screen balbetterà notevolmente. I clic silenziosi dei pulsanti del mouse integrati forniscono un feedback piacevole e si attivano in modo affidabile.
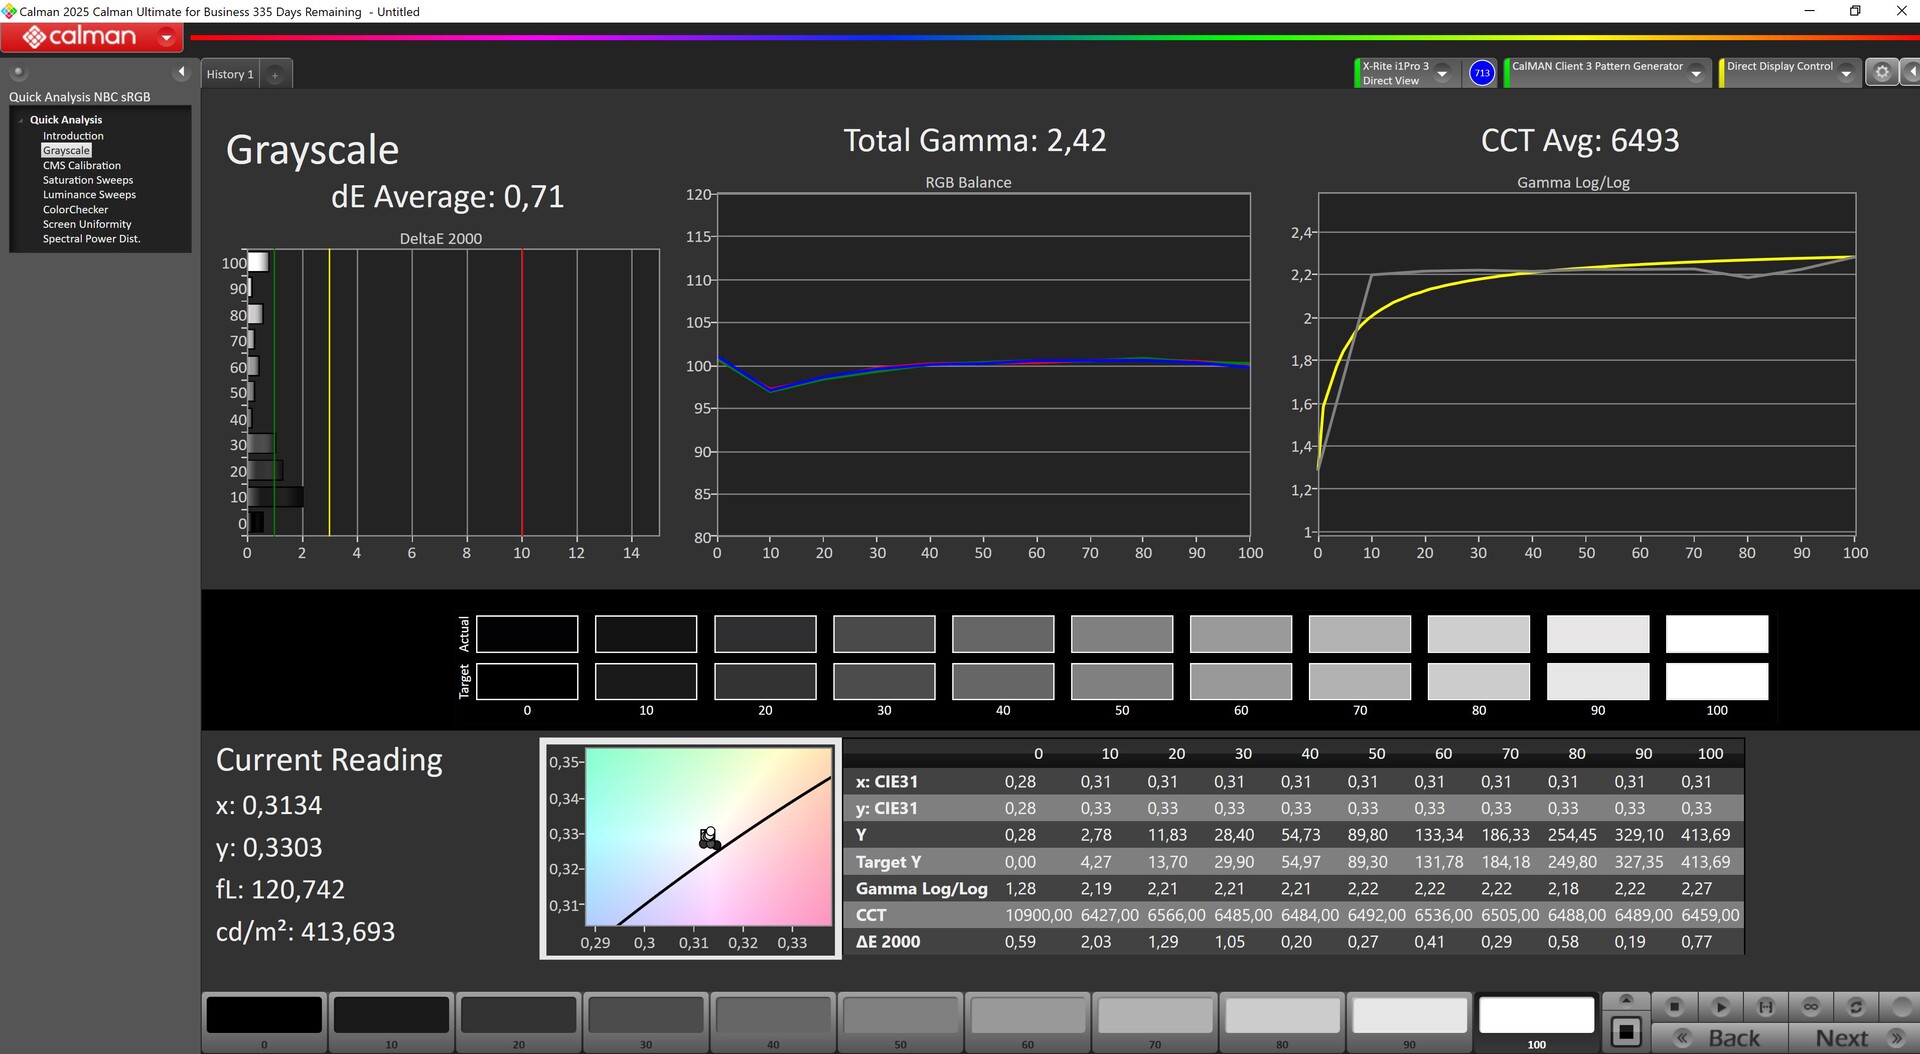
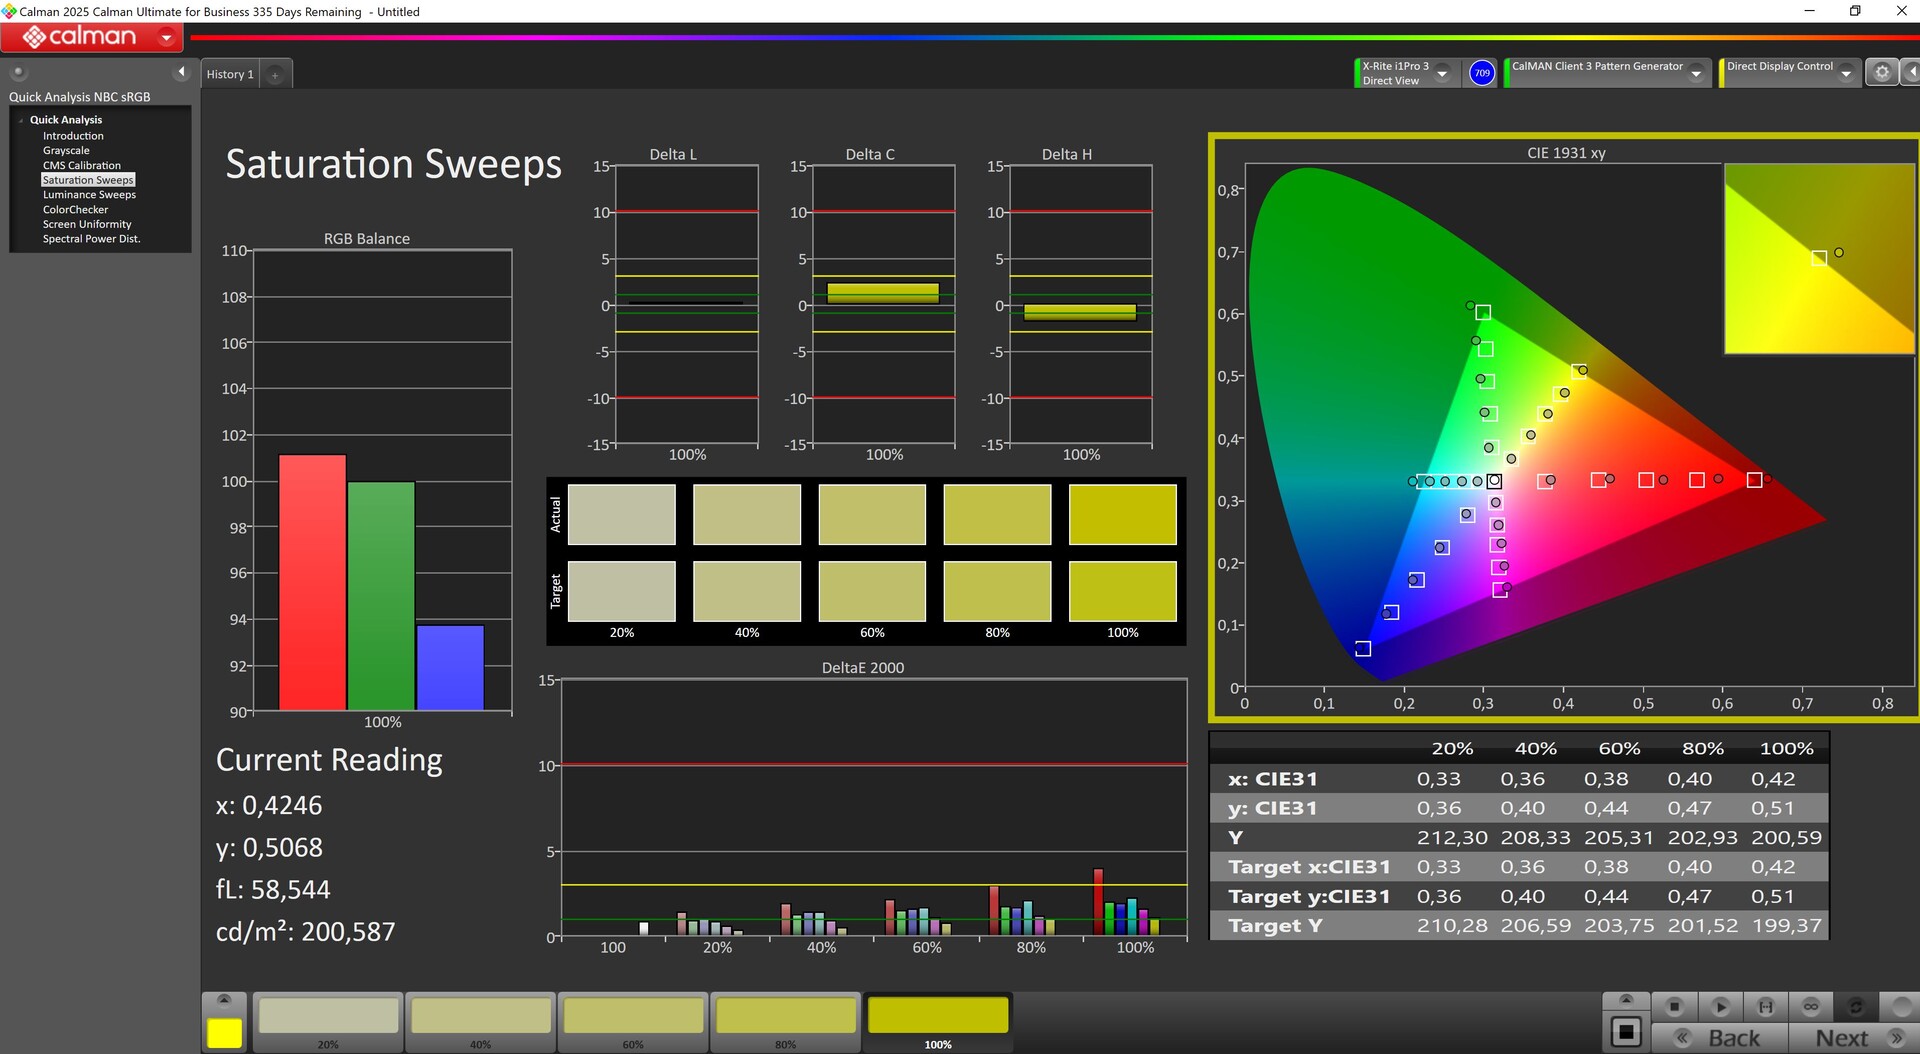
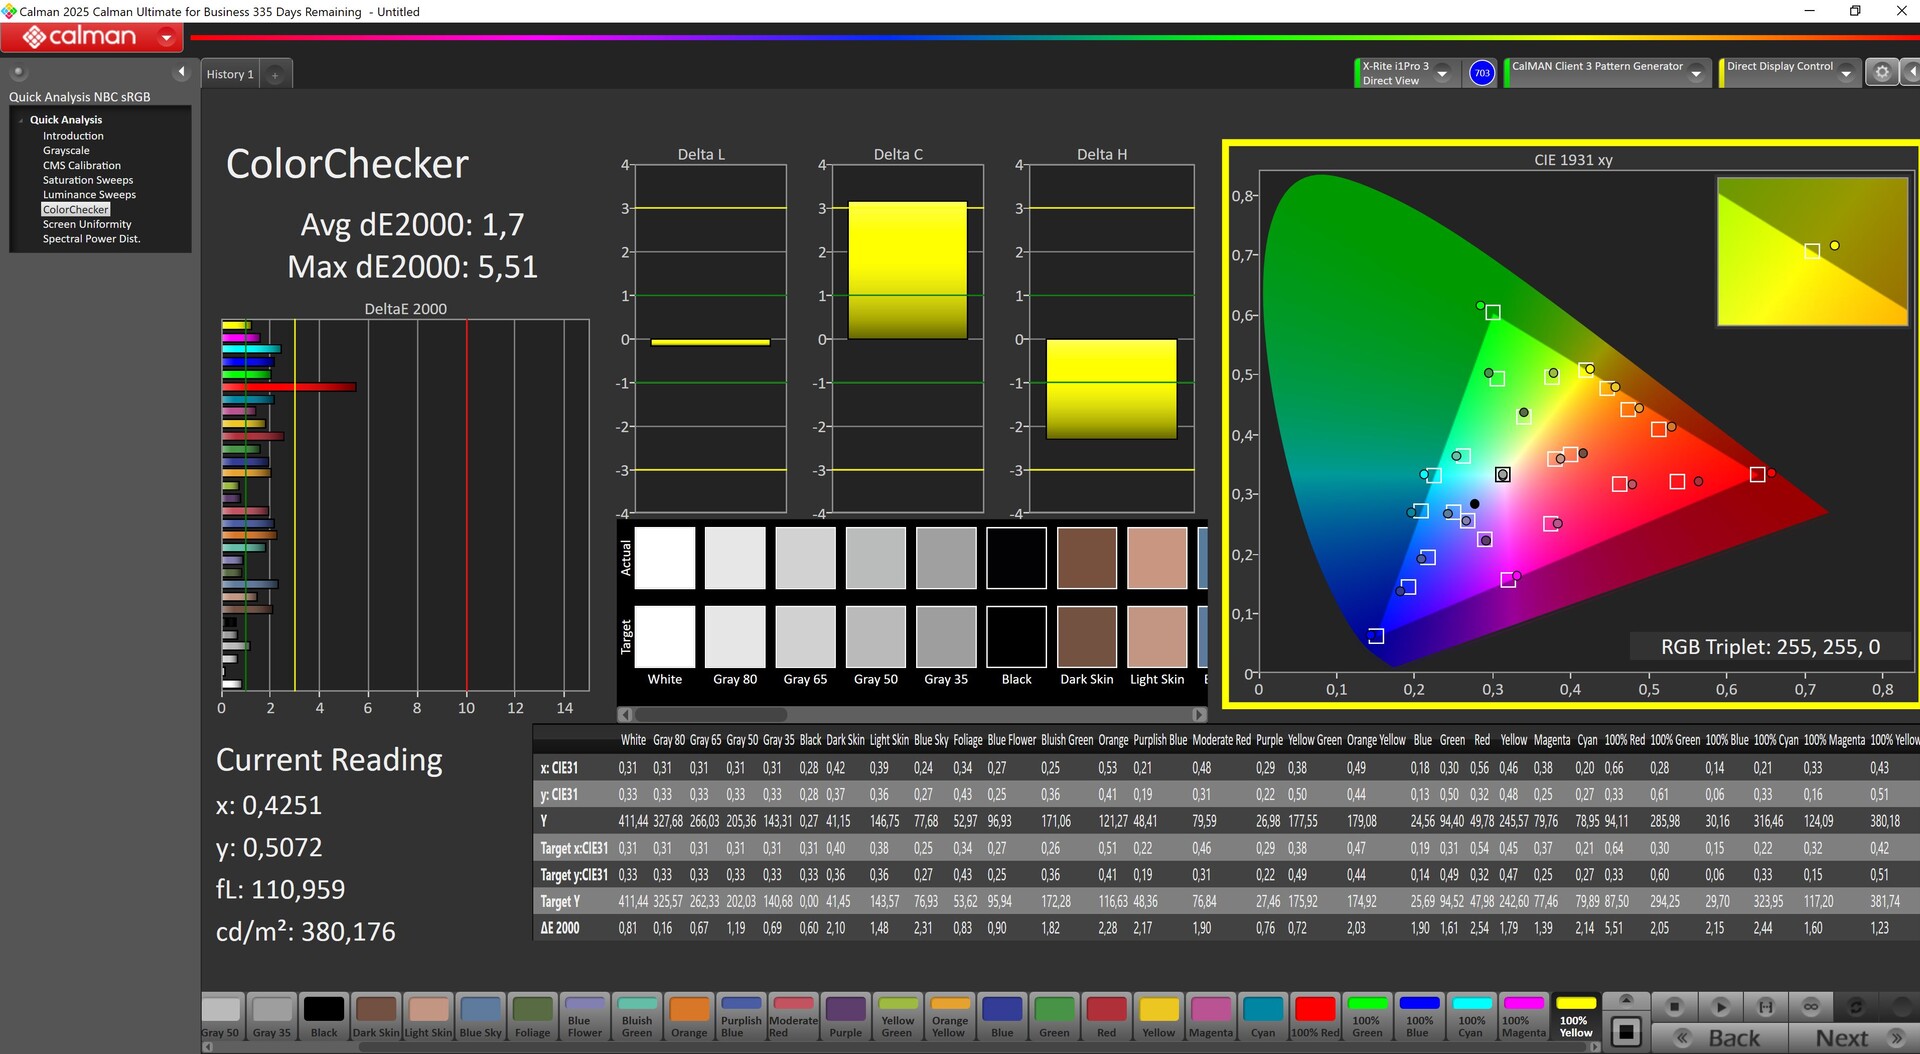
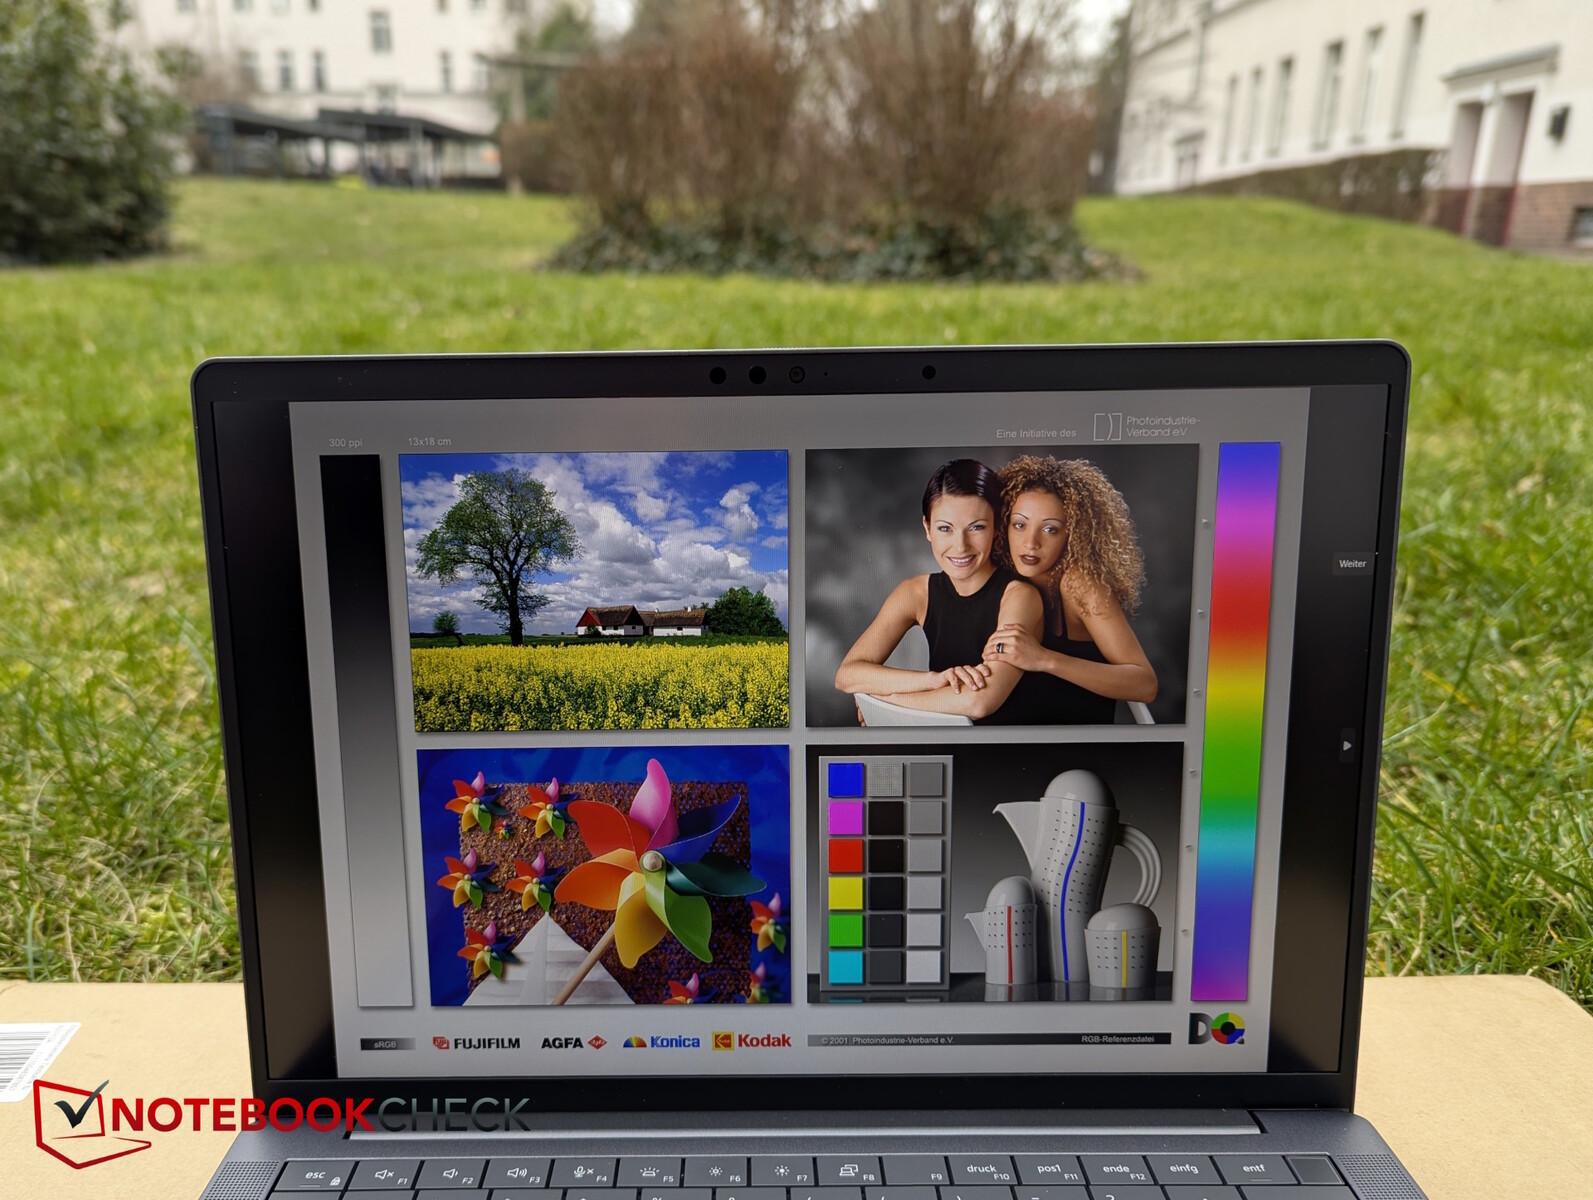
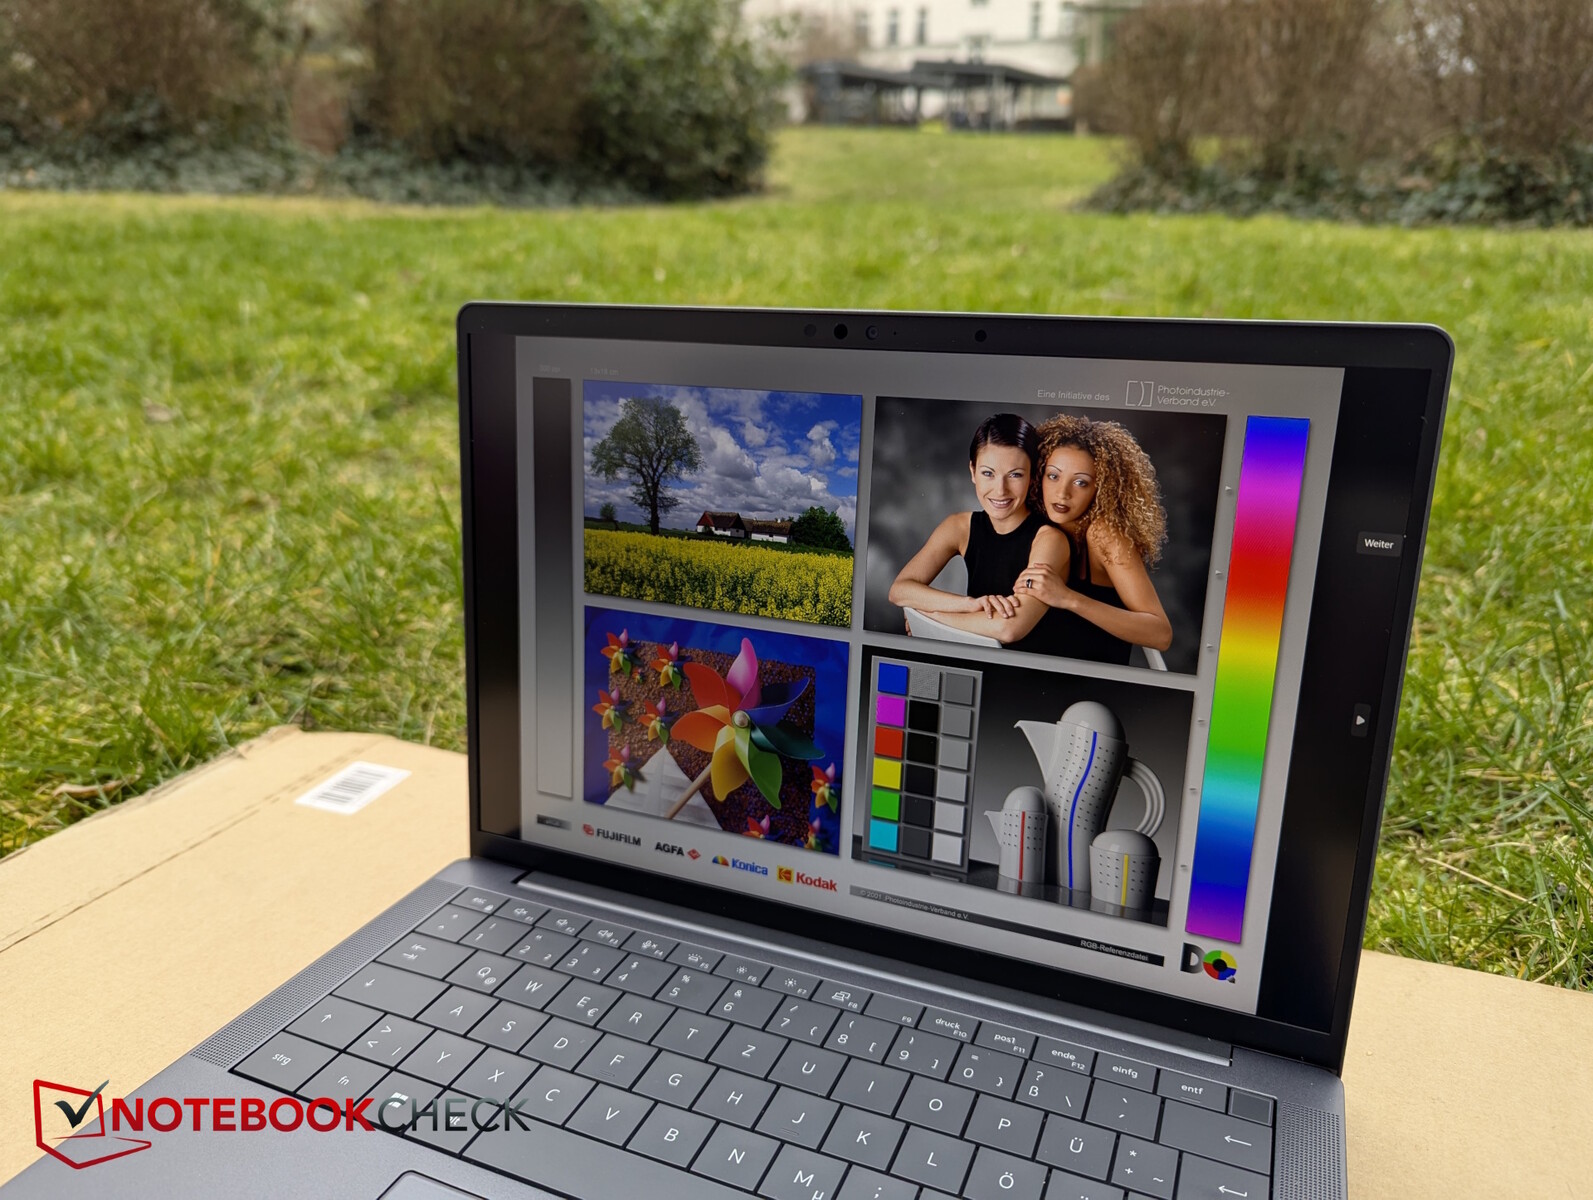
Display - Un pannello da ufficio ad alto contrasto, con opzioni aggiuntive
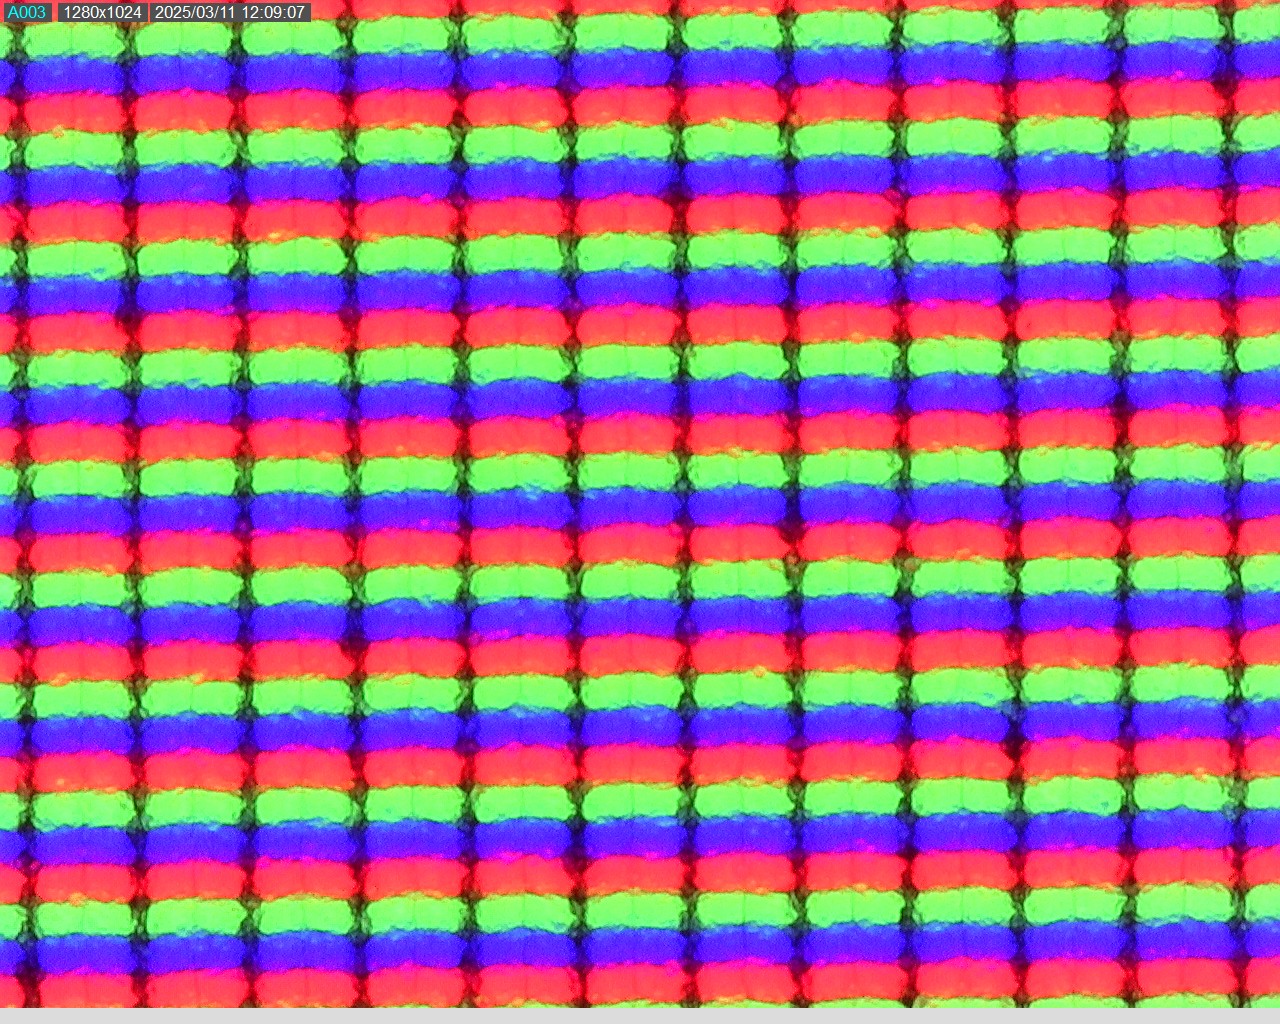
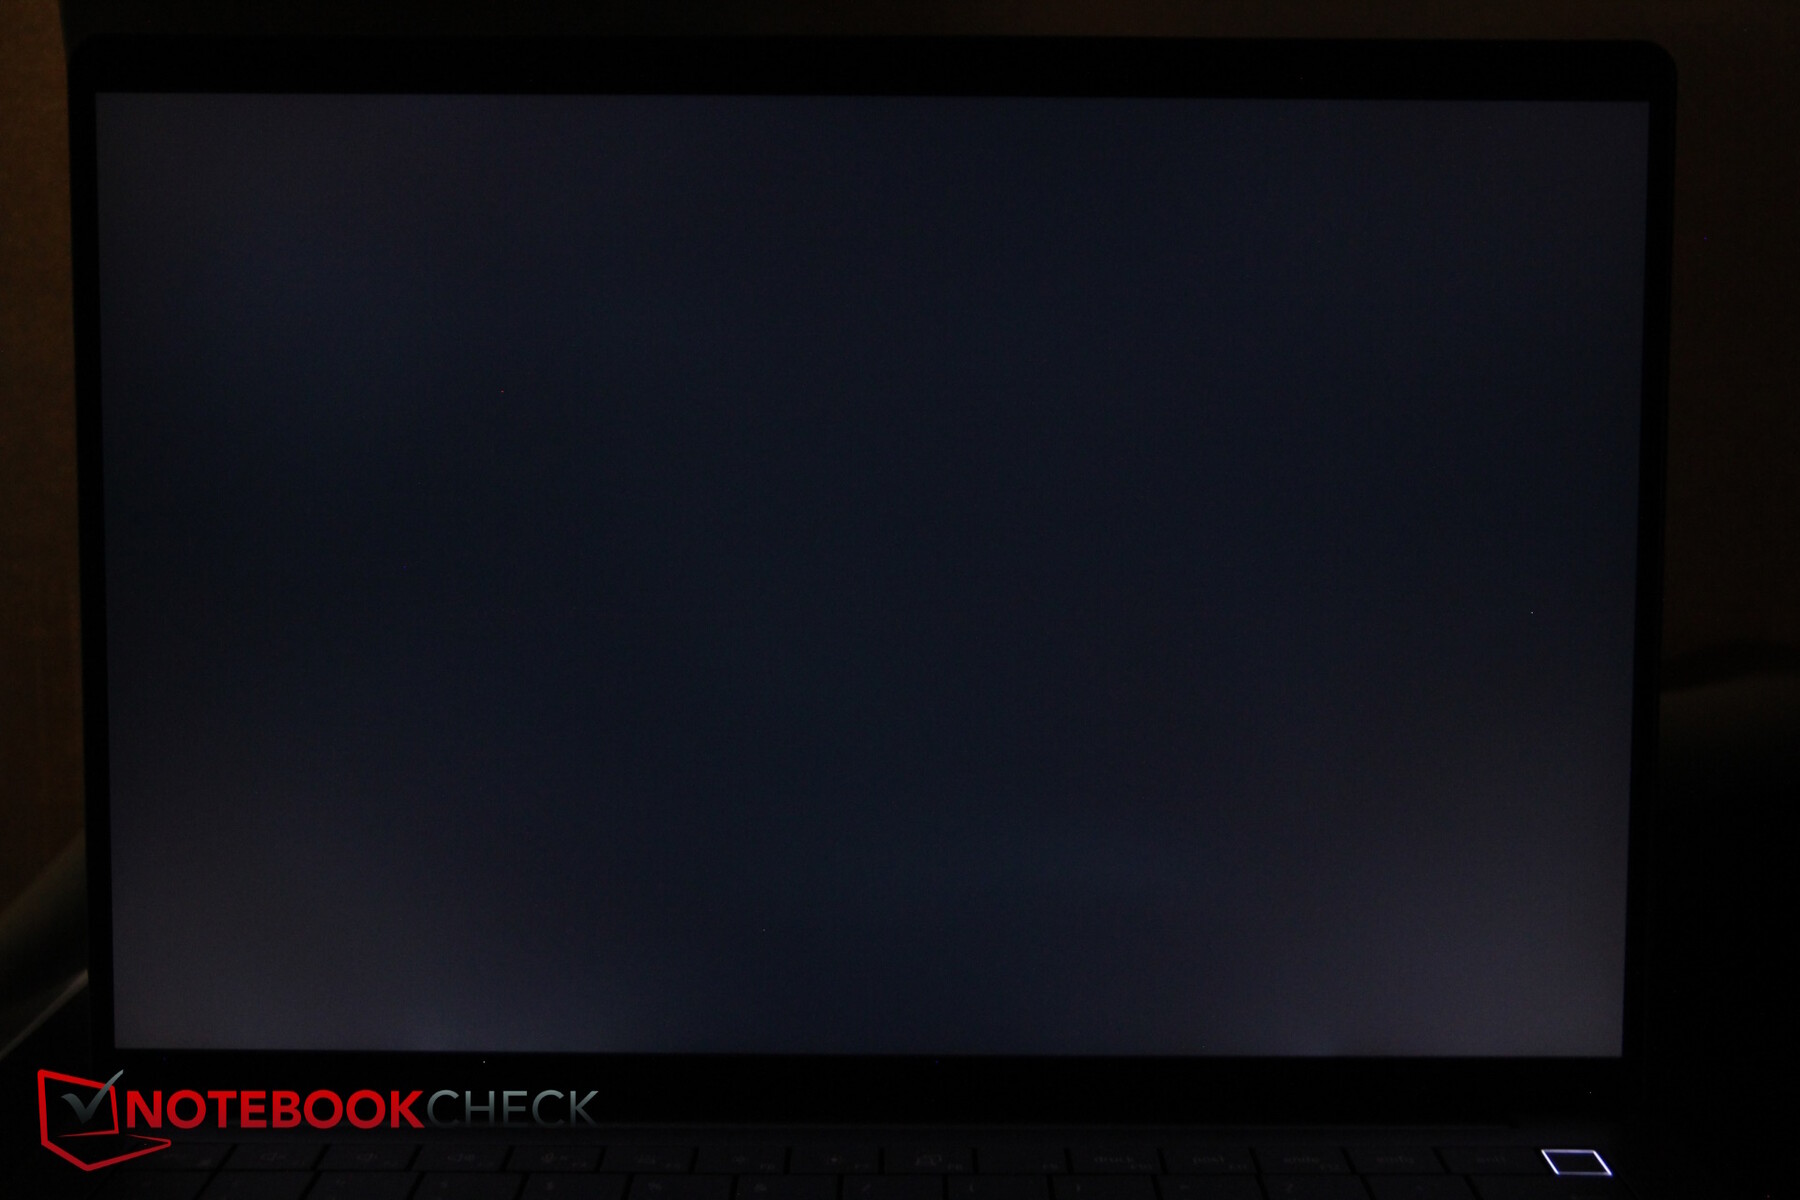
Ci sono diverse opzioni di display, ma quello che vediamo qui è un display opaco, con rapporto di aspetto 16:10, 1.920 x 1.200, con una luminosità ufficiale di 400 nit e nessun input touch. Esiste anche una versione da 300 nit, oltre all'opzione top, che ha una risoluzione di 2.560 x 1.600 pixel, 500 nit e funzionalità touch. Dell sottolinea che tutti i suoi display sono particolarmente efficienti dal punto di vista energetico.
Abbiamo misurato una luminosità media ben illuminata di 460 nits. Anche il contrasto è più che discreto, grazie al livello di nero relativamente basso. AdobeRGB e Display P3 sono coperti fino a circa il 75 percento, e sRGB quasi completamente.
I tempi di risposta, tuttavia, sono piuttosto lenti e il pannello supporta solo 60 Hz.
| |||||||||||||||||||||||||
Distribuzione della luminosità: 89 %
Al centro con la batteria: 456 cd/m²
Contrasto: 1983:1 (Nero: 0.23 cd/m²)
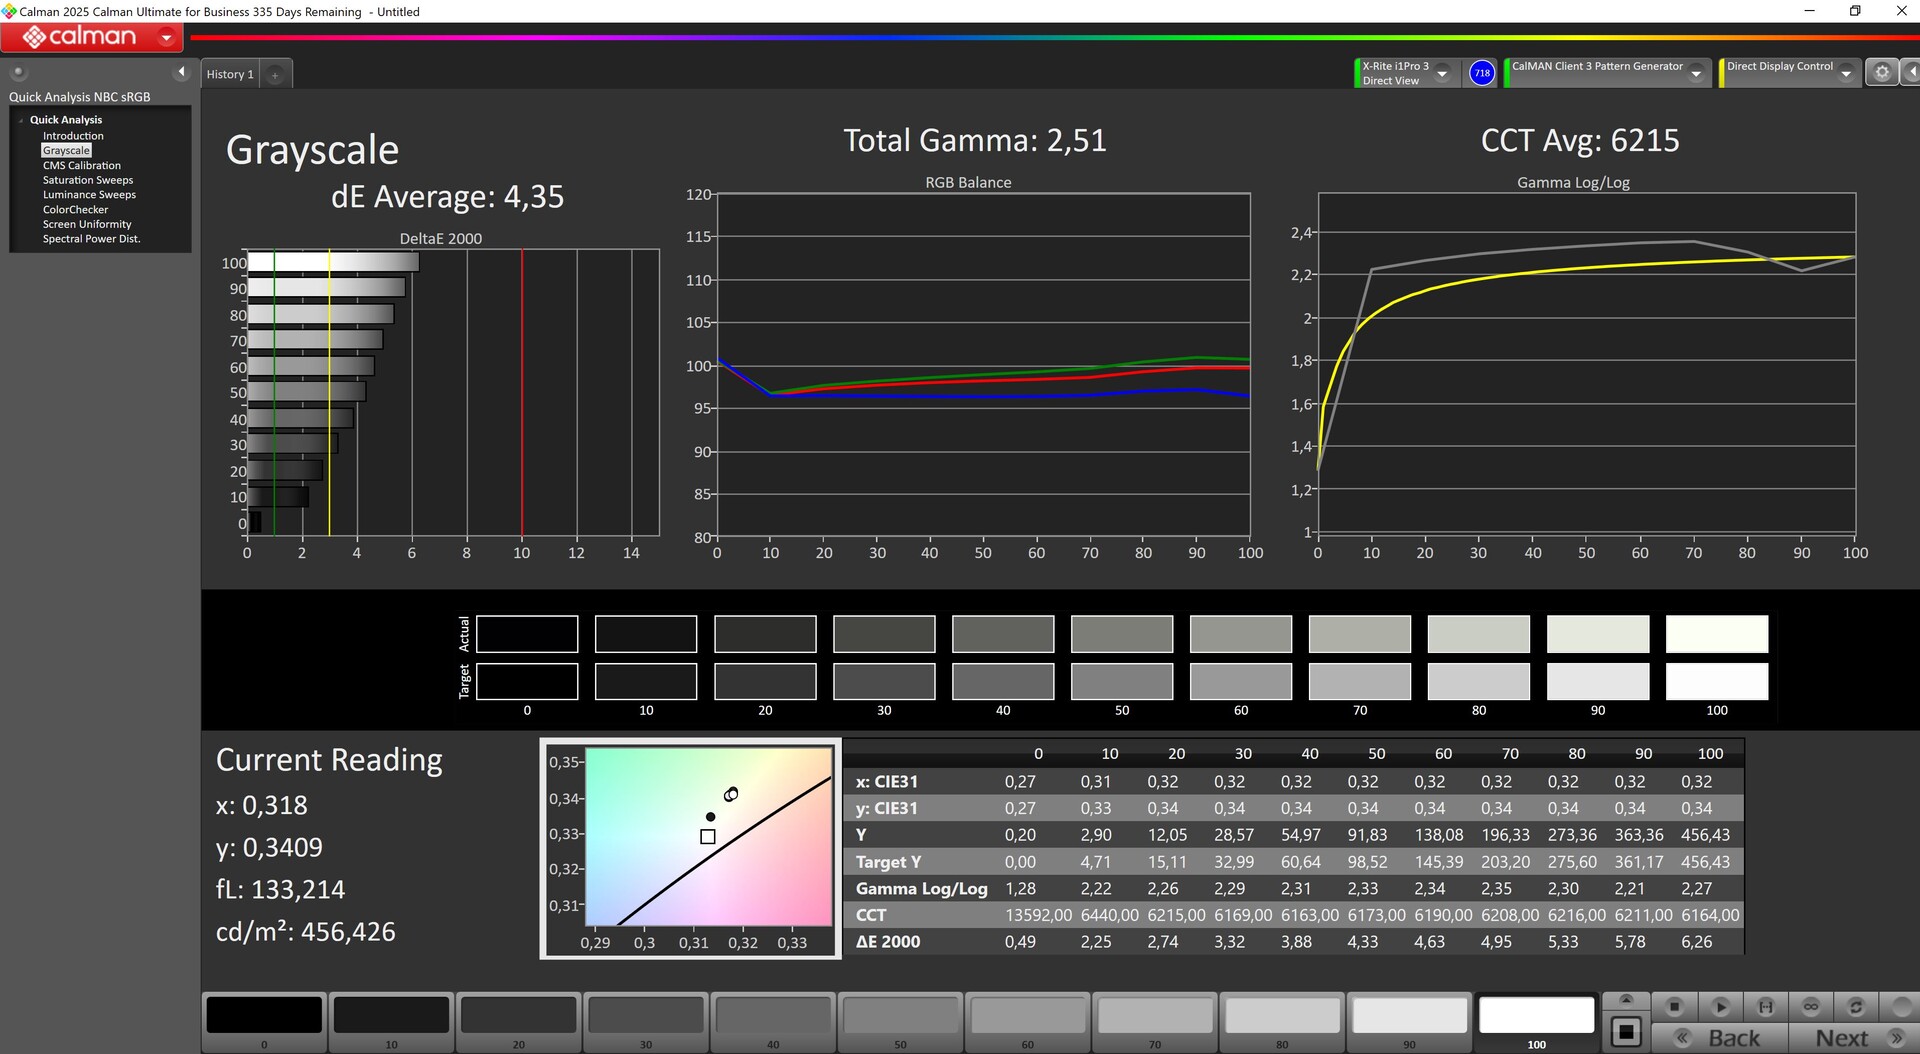
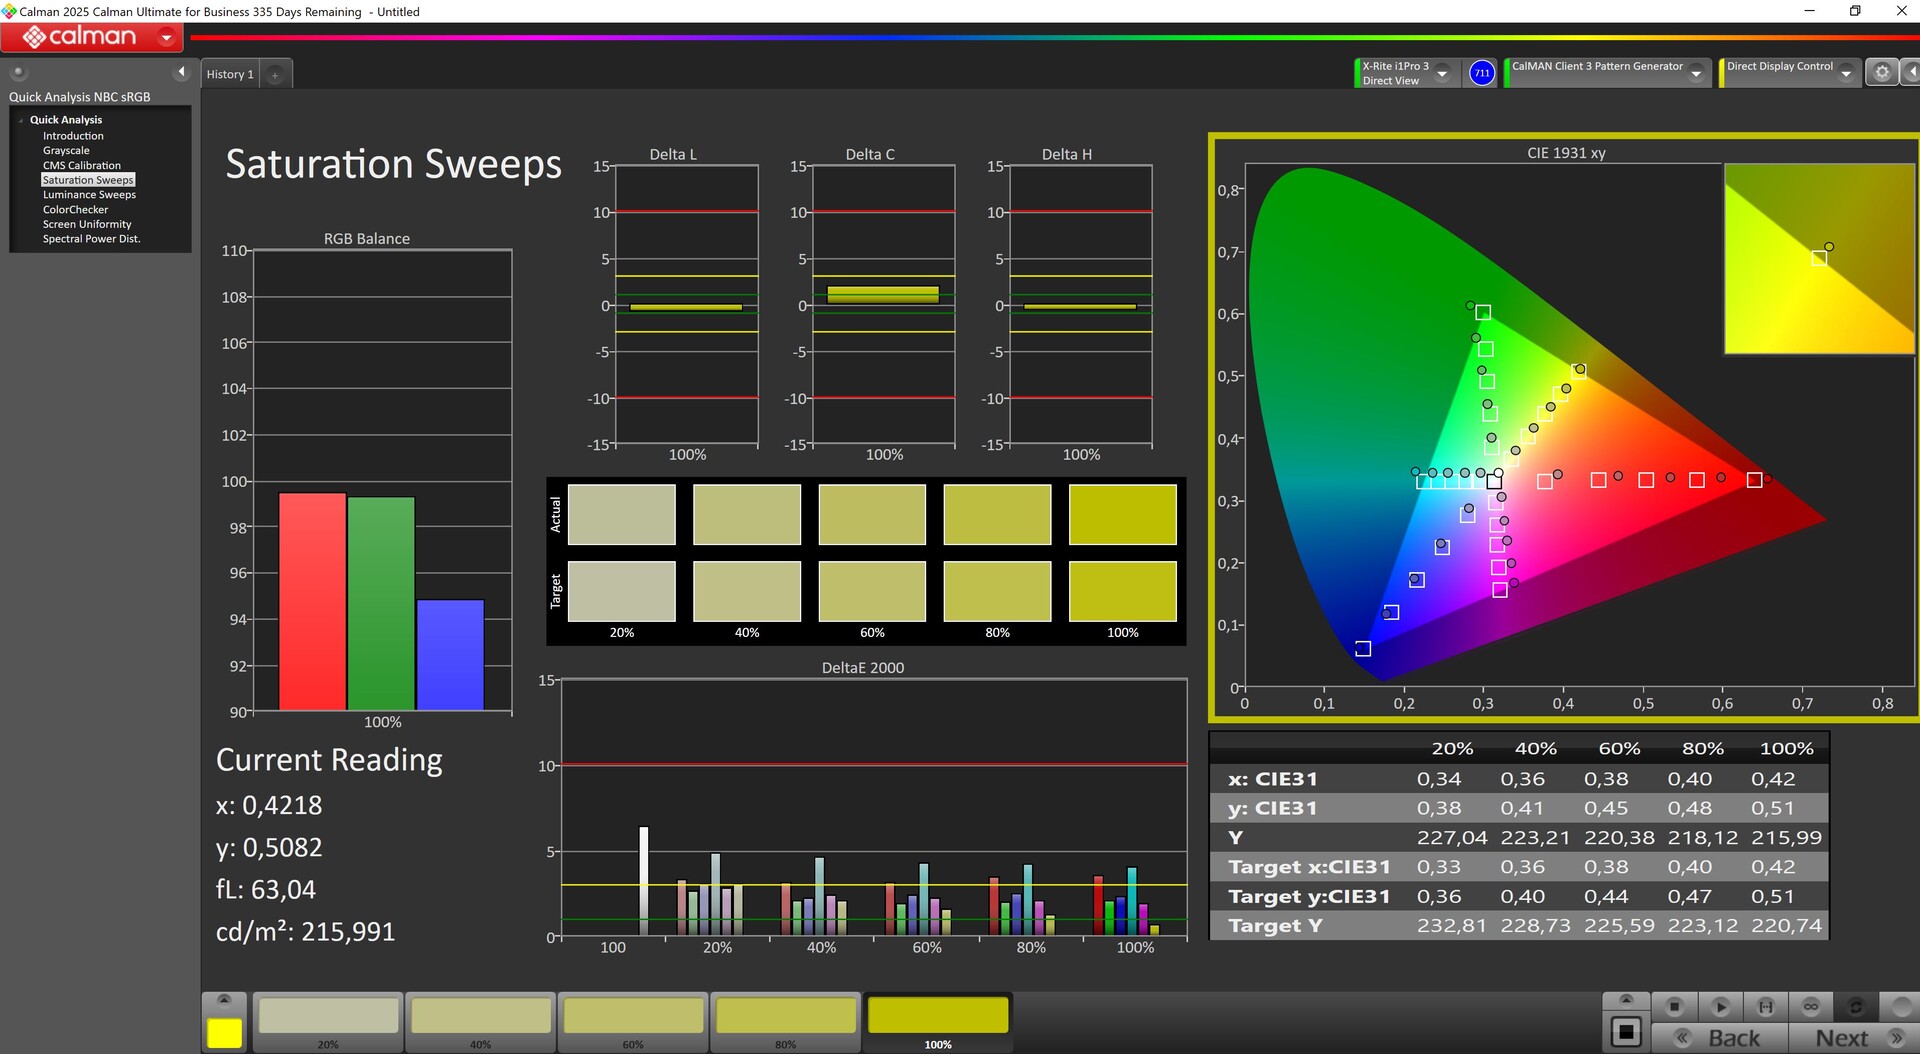
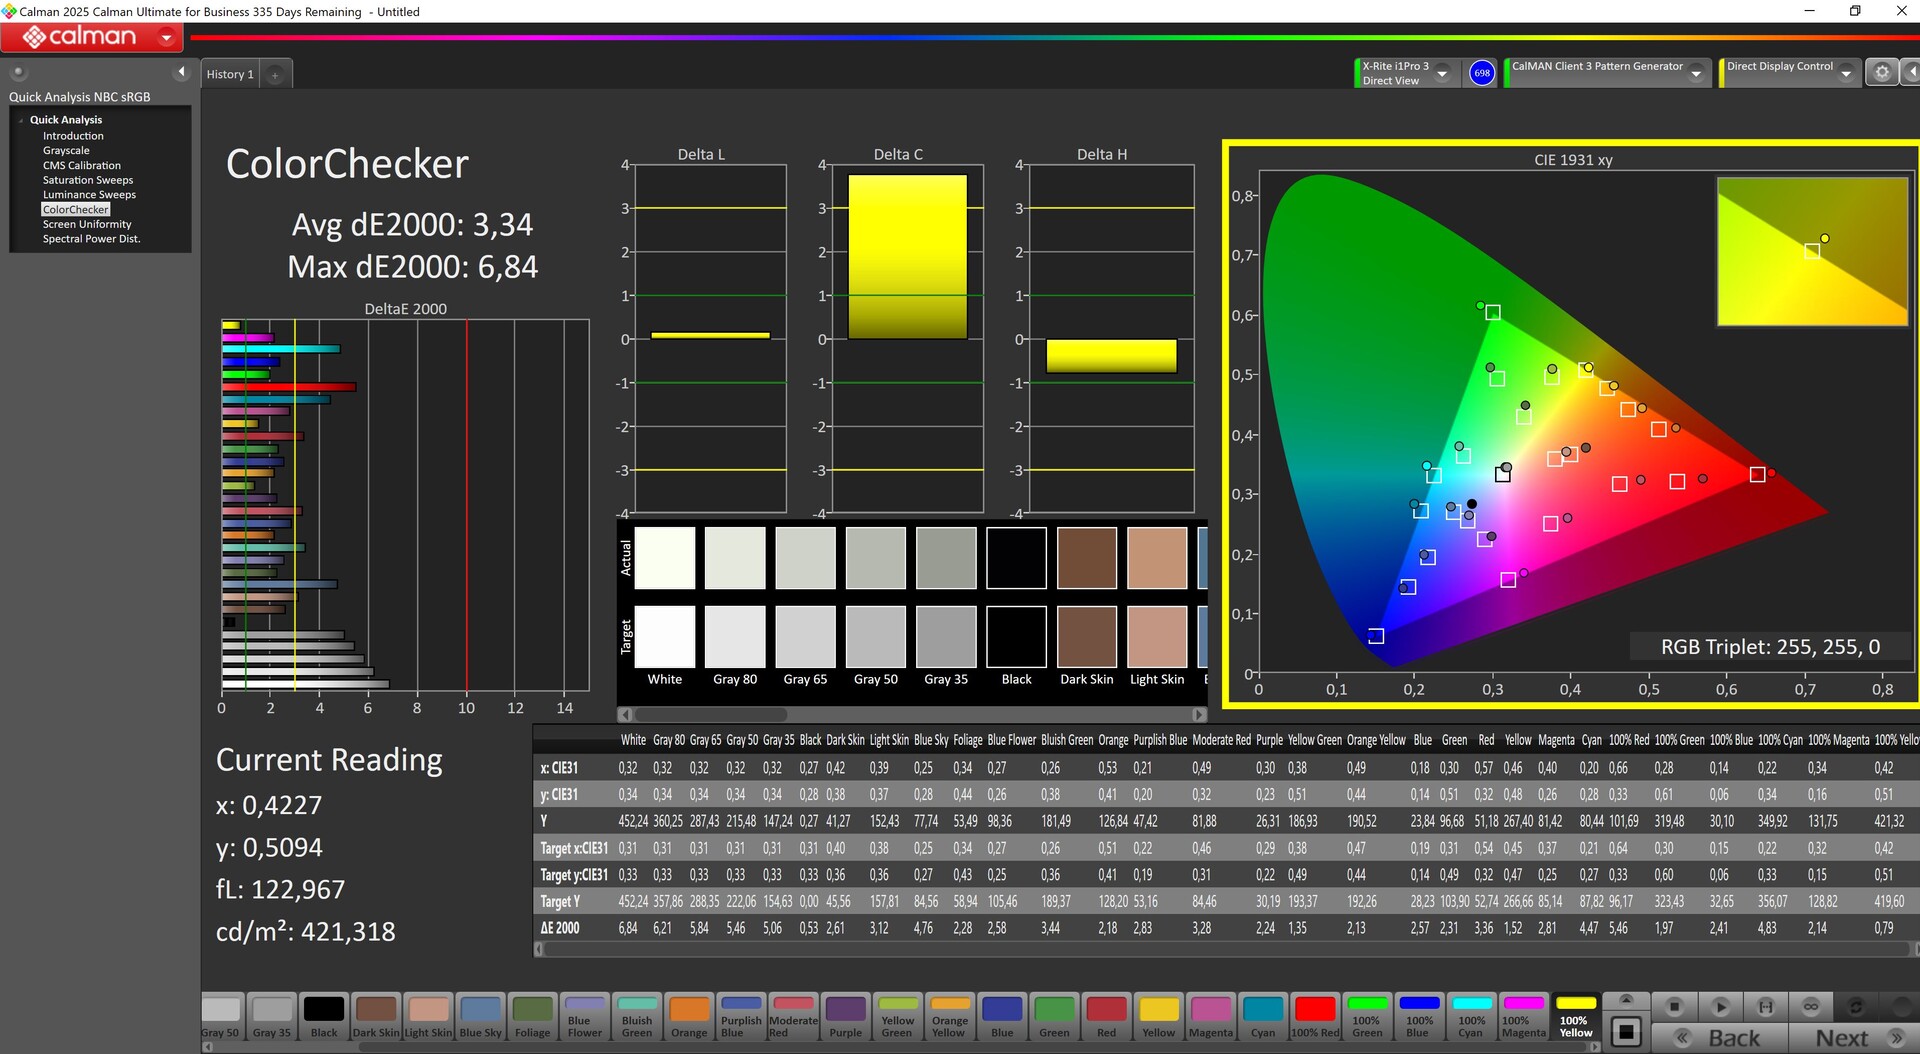
ΔE Color 3.3 | 0.5-29.43 Ø4.87, calibrated: 1.7
ΔE Greyscale 4.35 | 0.5-98 Ø5.1
75.9% AdobeRGB 1998 (Argyll 2.2.0 3D)
99.1% sRGB (Argyll 2.2.0 3D)
74.3% Display P3 (Argyll 2.2.0 3D)
Gamma: 2.51
| Dell Pro 13 Premium PA13250 B133UAN (AUOBEB0), IPS, 1920x1200, 13.3", 60 Hz | MSI Prestige 13 AI Plus Evo A2VMG ATNA33AA07-0, OLED, 2880x1800, 13.3", 60 Hz | Lenovo ThinkPad X13 2-in-1 Gen 5 Lenovo B133UAN01.2, IPS, 1920x1200, 13.3", 60 Hz | Framework Laptop 13.5 Core Ultra 7 155H BOE NE135A1M-NY1, IPS, 2880x1920, 13.5", 120 Hz | Dell XPS 13 9350 LG Philips 134WU2, IPS, 1920x1200, 13.4", 120 Hz | Microsoft Surface Pro Copilot+ LP129WT342166, IPS, 2880x1920, 13", 120 Hz | |
|---|---|---|---|---|---|---|
| Display | 20% | -4% | -2% | -6% | 6% | |
| Display P3 Coverage | 74.3 | 99.9 34% | 71.1 -4% | 72.8 -2% | 67.3 -9% | 83.4 12% |
| sRGB Coverage | 99.1 | 100 1% | 97.1 -2% | 98.6 -1% | 99 0% | 99.7 1% |
| AdobeRGB 1998 Coverage | 75.9 | 95.8 26% | 71.7 -6% | 72.9 -4% | 68.6 -10% | 79.4 5% |
| Response Times | 94% | -9% | 16% | 16% | 29% | |
| Response Time Grey 50% / Grey 80% * | 52.8 ? | 1.94 ? 96% | 50.2 ? 5% | 41.9 ? 21% | 37.3 ? 29% | 39.6 ? 25% |
| Response Time Black / White * | 26.4 ? | 2.02 ? 92% | 32.6 ? -23% | 23.7 ? 10% | 25.9 ? 2% | 18 ? 32% |
| PWM Frequency | 60 ? | |||||
| Screen | 17% | -9% | -11% | 31% | 4% | |
| Brightness middle | 456 | 382.4 -16% | 334 -27% | 498.5 9% | 462.8 1% | 585 28% |
| Brightness | 460 | 383 -17% | 308 -33% | 464 1% | 435 -5% | 574 25% |
| Brightness Distribution | 89 | 99 11% | 86 -3% | 86 -3% | 87 -2% | 89 0% |
| Black Level * | 0.23 | 0.37 -61% | 0.36 -57% | 0.19 17% | 0.56 -143% | |
| Contrast | 1983 | 903 -54% | 1385 -30% | 2436 23% | 1045 -47% | |
| Colorchecker dE 2000 * | 3.3 | 3.84 -16% | 2.36 28% | 4.27 -29% | 1.92 42% | 1.3 61% |
| Colorchecker dE 2000 max. * | 6.47 | 6.66 -3% | 4.93 24% | 7.08 -9% | 3.45 47% | 3 54% |
| Colorchecker dE 2000 calibrated * | 1.7 | 0.41 76% | 1.25 26% | 1.26 26% | 0.48 72% | |
| Greyscale dE 2000 * | 4.35 | 0.7 84% | 3.38 22% | 4.7 -8% | 0.6 86% | 2 54% |
| Gamma | 2.51 88% | 2.23 99% | 2.38 92% | 2.09 105% | 2.19 100% | 2.18 101% |
| CCT | 6215 105% | 6475 100% | 6352 102% | 7417 88% | 6539 99% | 6914 94% |
| Media totale (Programma / Settaggio) | 44% /
31% | -7% /
-8% | 1% /
-5% | 14% /
21% | 13% /
8% |
* ... Meglio usare valori piccoli
Fuori dalla scatola, il pannello non è particolarmente ben calibrato e, sebbene la nostra calibrazione manuale sia riuscita a migliorare i valori DeltaE sia della scala di grigi che di ColorChecker, c'era ancora un'anomalia nell'area del rosso.
Tempi di risposta del Display
| ↔ Tempi di risposta dal Nero al Bianco | ||
|---|---|---|
| 26.4 ms ... aumenta ↗ e diminuisce ↘ combinato | ↗ 12.2 ms Incremento |  |
| ↘ 14.2 ms Calo | ||
| Lo schermo mostra tempi di risposta relativamente lenti nei nostri tests e potrebbe essere troppo lento per i gamers. In confronto, tutti i dispositivi di test variano da 0.1 (minimo) a 240 (massimo) ms. » 63 % di tutti i dispositivi è migliore. Questo significa che i tempi di risposta rilevati sono peggiori rispetto alla media di tutti i dispositivi testati (20.8 ms). | ||
| ↔ Tempo di risposta dal 50% Grigio all'80% Grigio | ||
| 52.8 ms ... aumenta ↗ e diminuisce ↘ combinato | ↗ 23.4 ms Incremento | 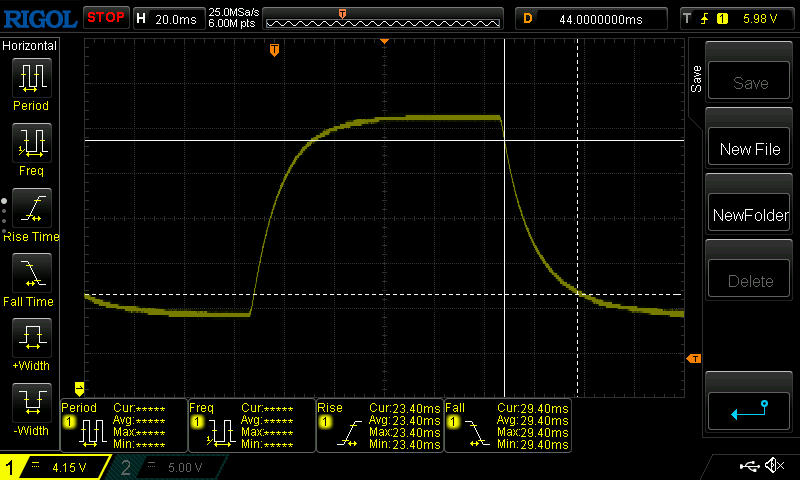 |
| ↘ 29.4 ms Calo | ||
| Lo schermo mostra tempi di risposta lenti nei nostri tests e sarà insoddisfacente per i gamers. In confronto, tutti i dispositivi di test variano da 0.165 (minimo) a 636 (massimo) ms. » 89 % di tutti i dispositivi è migliore. Questo significa che i tempi di risposta rilevati sono peggiori rispetto alla media di tutti i dispositivi testati (32.5 ms). | ||
Sfarfallio dello schermo / PWM (Pulse-Width Modulation)
| flickering dello schermo / PWM non rilevato |  | ||
In confronto: 53 % di tutti i dispositivi testati non utilizza PWM per ridurre la luminosita' del display. Se è rilevato PWM, una media di 8516 (minimo: 5 - massimo: 343500) Hz è stata rilevata. | |||

All'esterno, la buona luminosità e il contrasto, la superficie opaca e la buona stabilità dell'angolo di visione contribuiscono a garantire un funzionamento per lo più privo di problemi.

Prestazioni - Un arco potente da 140 V
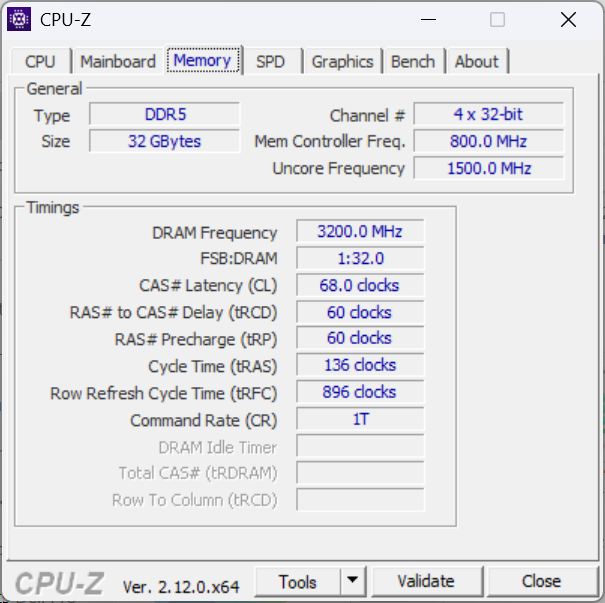
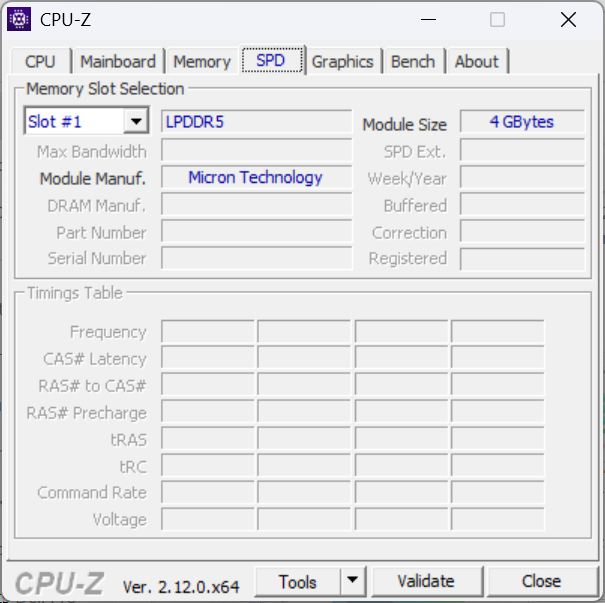
Il cuore pulsante è il nuovo Intel Core Ultra 7 268V che viene fornito anche con 32 GB di RAM integrata. In alternativa, esiste una versione con un più debole Core Ultra 5 236V e 16 GB di RAM. Anche lo storage è disponibile in varie configurazioni (256 GB, 512 GB, 1 TB). Il Dell Pro 13 Premium è chiaramente rivolto agli utenti business mobili.

Condizioni del test
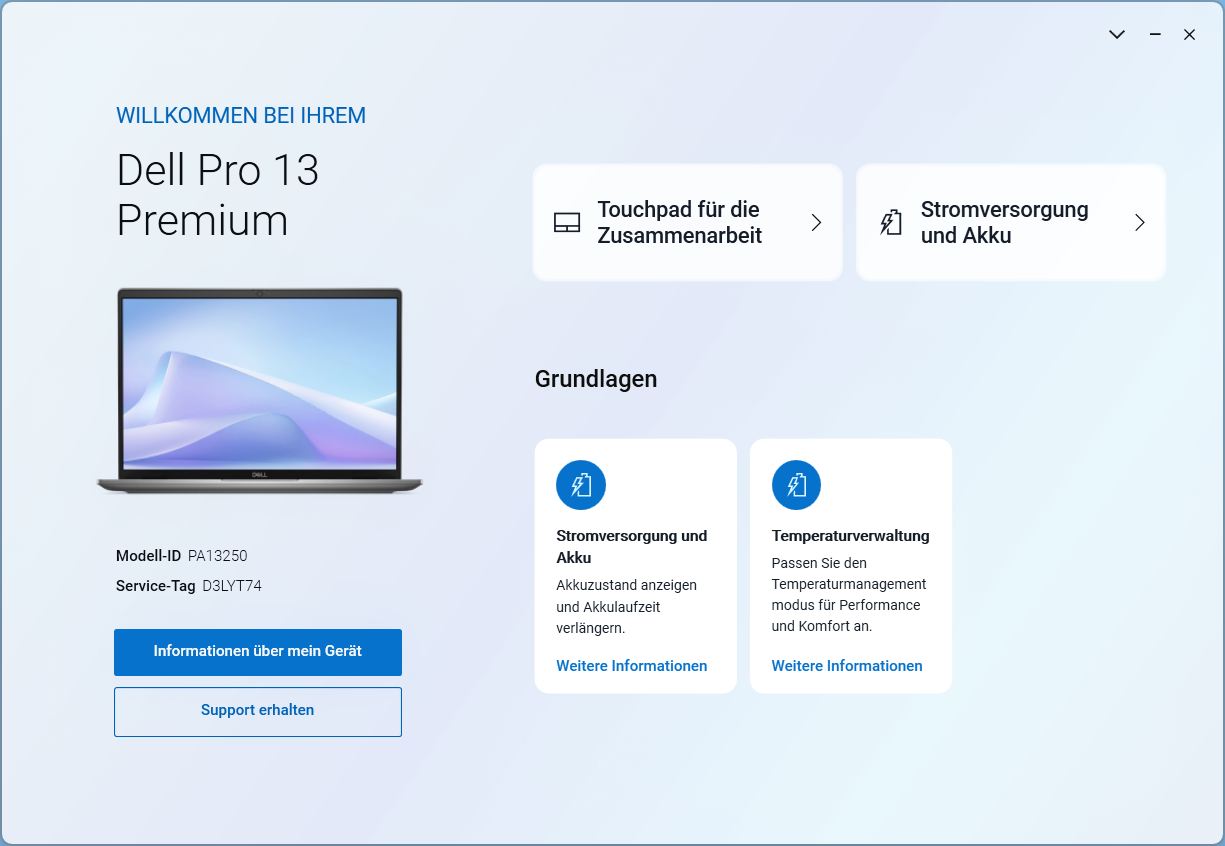
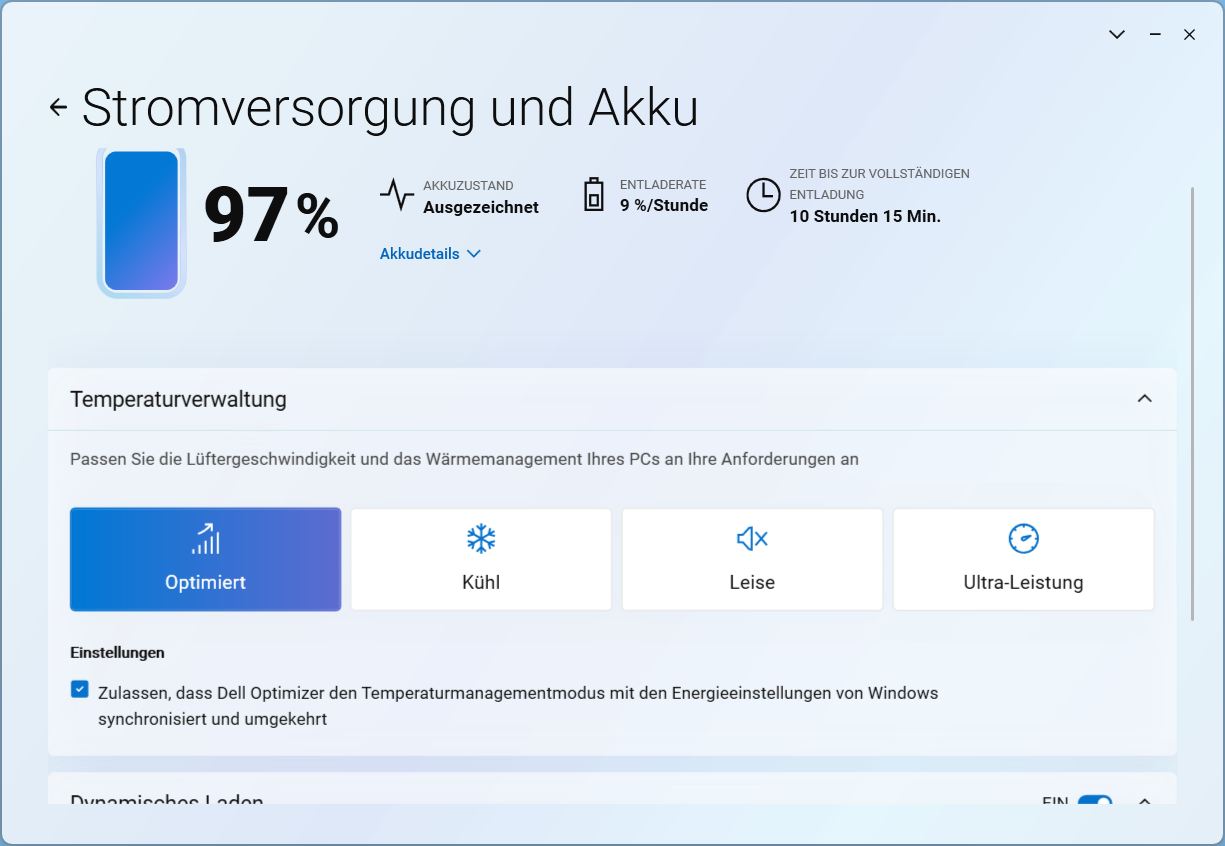
Dell Optimizer funge da centro di controllo, offrendo le impostazioni della ventola che influiscono sulle prestazioni e alcune altre opzioni. Per i nostri benchmark, abbiamo lasciato la modalità "Ottimizzata" preselezionata.

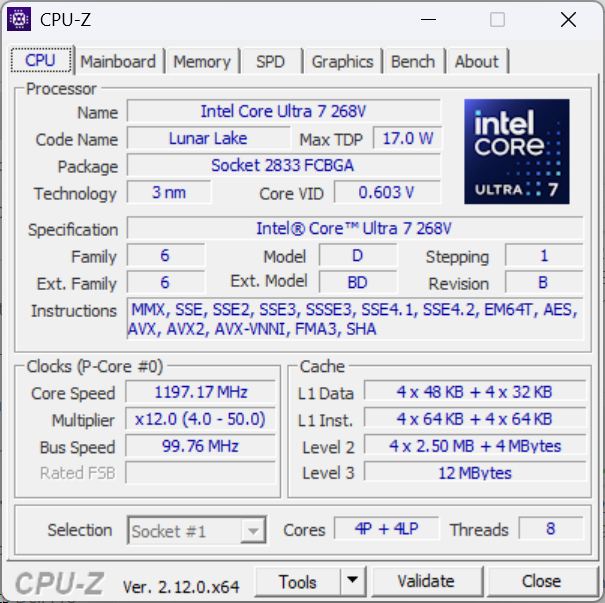
Processore

Il Intel Core Ultra 7 268V è uno dei modelli di fascia alta della famiglia Lunar Lake ad alta efficienza energetica. I suoi quattro core E e quattro core P hanno un clock da 2,2 GHz a 5,0 GHz e dispongono anche di una NPU 48 TOPS.
Le sue prestazioni single-core sono state particolarmente impressionanti in tutti i test che abbiamo eseguito. Nei benchmark multi-core, la CPU del Dell Pro 13 è un po' deludente, spesso in leggero ritardo rispetto alla concorrenza, che in alcuni casi dispone di processori nominalmente più deboli. In modalità batteria, si perde circa il 16% delle prestazioni.
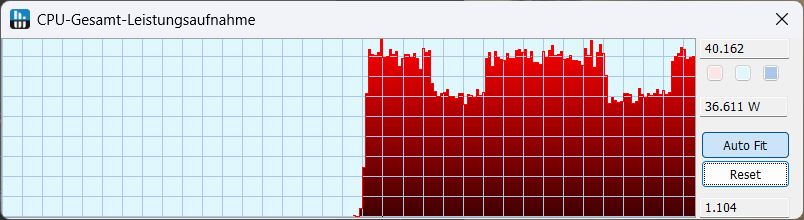
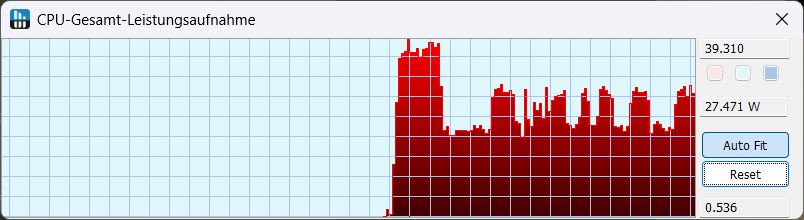
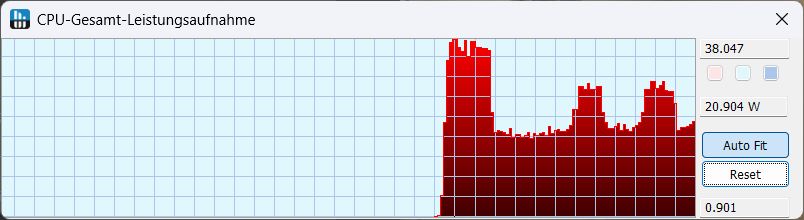
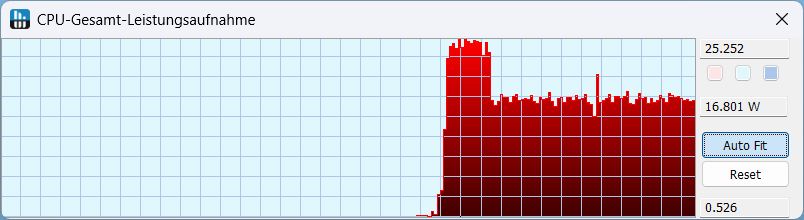
Nel ciclo Cinebench R15, le prestazioni sono diminuite di circa il 28% (!) nei primi tre cicli e sono rimaste costanti in seguito. Nella modalità ottimizzata standard, il consumo energetico era inizialmente di circa 38 W e poi è sceso a 27 W. Le immagini a destra mostrano il comportamento del consumo energetico in Cinebench R23, a seconda della modalità ventola.
Cinebench R15 Multi Continuous Test
Cinebench R23: Multi Core | Single Core
Cinebench R20: CPU (Multi Core) | CPU (Single Core)
Cinebench R15: CPU Multi 64Bit | CPU Single 64Bit
Blender: v2.79 BMW27 CPU
7-Zip 18.03: 7z b 4 | 7z b 4 -mmt1
Geekbench 6.4: Multi-Core | Single-Core
Geekbench 5.5: Multi-Core | Single-Core
HWBOT x265 Benchmark v2.2: 4k Preset
LibreOffice : 20 Documents To PDF
R Benchmark 2.5: Overall mean
| CPU Performance Rating | |
| Framework Laptop 13.5 Core Ultra 7 155H | |
| MSI Prestige 13 AI Plus Evo A2VMG | |
| Dell XPS 13 9350 | |
| Media Intel Core Ultra 7 268V | |
| Media della classe Subnotebook | |
| Dell Pro 13 Premium PA13250 | |
| Lenovo ThinkPad X13 2-in-1 Gen 5 | |
| Microsoft Surface Pro Copilot+ -2! | |
| Cinebench R23 / Multi Core | |
| Framework Laptop 13.5 Core Ultra 7 155H | |
| Media della classe Subnotebook (1555 - 21812, n=76, ultimi 2 anni) | |
| MSI Prestige 13 AI Plus Evo A2VMG | |
| Dell XPS 13 9350 | |
| Media Intel Core Ultra 7 268V (9835 - 10535, n=2) | |
| Dell Pro 13 Premium PA13250 | |
| Microsoft Surface Pro Copilot+ | |
| Lenovo ThinkPad X13 2-in-1 Gen 5 | |
| Cinebench R23 / Single Core | |
| Dell Pro 13 Premium PA13250 | |
| Media Intel Core Ultra 7 268V (1910 - 1985, n=2) | |
| Dell XPS 13 9350 | |
| MSI Prestige 13 AI Plus Evo A2VMG | |
| Framework Laptop 13.5 Core Ultra 7 155H | |
| Media della classe Subnotebook (358 - 2165, n=76, ultimi 2 anni) | |
| Lenovo ThinkPad X13 2-in-1 Gen 5 | |
| Microsoft Surface Pro Copilot+ | |
| Cinebench R20 / CPU (Multi Core) | |
| Framework Laptop 13.5 Core Ultra 7 155H | |
| Media della classe Subnotebook (579 - 8541, n=71, ultimi 2 anni) | |
| MSI Prestige 13 AI Plus Evo A2VMG | |
| Dell XPS 13 9350 | |
| Media Intel Core Ultra 7 268V (3811 - 4129, n=2) | |
| Dell Pro 13 Premium PA13250 | |
| Lenovo ThinkPad X13 2-in-1 Gen 5 | |
| Microsoft Surface Pro Copilot+ | |
| Cinebench R20 / CPU (Single Core) | |
| Dell Pro 13 Premium PA13250 | |
| Media Intel Core Ultra 7 268V (736 - 764, n=2) | |
| Dell XPS 13 9350 | |
| MSI Prestige 13 AI Plus Evo A2VMG | |
| Framework Laptop 13.5 Core Ultra 7 155H | |
| Media della classe Subnotebook (128 - 826, n=71, ultimi 2 anni) | |
| Lenovo ThinkPad X13 2-in-1 Gen 5 | |
| Microsoft Surface Pro Copilot+ | |
| Cinebench R15 / CPU Multi 64Bit | |
| Framework Laptop 13.5 Core Ultra 7 155H | |
| Microsoft Surface Pro Copilot+ | |
| Media della classe Subnotebook (327 - 3345, n=77, ultimi 2 anni) | |
| MSI Prestige 13 AI Plus Evo A2VMG | |
| Media Intel Core Ultra 7 268V (1601 - 1616, n=2) | |
| Dell Pro 13 Premium PA13250 | |
| Dell XPS 13 9350 | |
| Lenovo ThinkPad X13 2-in-1 Gen 5 | |
| Cinebench R15 / CPU Single 64Bit | |
| Dell Pro 13 Premium PA13250 | |
| Media Intel Core Ultra 7 268V (287 - 302, n=2) | |
| Dell XPS 13 9350 | |
| MSI Prestige 13 AI Plus Evo A2VMG | |
| Framework Laptop 13.5 Core Ultra 7 155H | |
| Media della classe Subnotebook (72.4 - 322, n=72, ultimi 2 anni) | |
| Lenovo ThinkPad X13 2-in-1 Gen 5 | |
| Microsoft Surface Pro Copilot+ | |
| Blender / v2.79 BMW27 CPU | |
| Dell Pro 13 Premium PA13250 | |
| Microsoft Surface Pro Copilot+ | |
| Lenovo ThinkPad X13 2-in-1 Gen 5 | |
| Media della classe Subnotebook (159 - 2271, n=75, ultimi 2 anni) | |
| Media Intel Core Ultra 7 268V (337 - 410, n=2) | |
| Dell XPS 13 9350 | |
| MSI Prestige 13 AI Plus Evo A2VMG | |
| Framework Laptop 13.5 Core Ultra 7 155H | |
| 7-Zip 18.03 / 7z b 4 | |
| Framework Laptop 13.5 Core Ultra 7 155H | |
| Media della classe Subnotebook (11668 - 77867, n=67, ultimi 2 anni) | |
| Microsoft Surface Pro Copilot+ | |
| Dell XPS 13 9350 | |
| MSI Prestige 13 AI Plus Evo A2VMG | |
| Media Intel Core Ultra 7 268V (32797 - 35687, n=2) | |
| Dell Pro 13 Premium PA13250 | |
| Lenovo ThinkPad X13 2-in-1 Gen 5 | |
| 7-Zip 18.03 / 7z b 4 -mmt1 | |
| Media Intel Core Ultra 7 268V (5884 - 6021, n=2) | |
| Dell Pro 13 Premium PA13250 | |
| Dell XPS 13 9350 | |
| MSI Prestige 13 AI Plus Evo A2VMG | |
| Media della classe Subnotebook (2643 - 6442, n=69, ultimi 2 anni) | |
| Framework Laptop 13.5 Core Ultra 7 155H | |
| Microsoft Surface Pro Copilot+ | |
| Lenovo ThinkPad X13 2-in-1 Gen 5 | |
| Geekbench 6.4 / Multi-Core | |
| Microsoft Surface Pro Copilot+ | |
| Framework Laptop 13.5 Core Ultra 7 155H | |
| Media della classe Subnotebook (2244 - 17489, n=72, ultimi 2 anni) | |
| MSI Prestige 13 AI Plus Evo A2VMG | |
| Dell XPS 13 9350 | |
| Media Intel Core Ultra 7 268V (10589 - 11279, n=3) | |
| Dell Pro 13 Premium PA13250 | |
| Lenovo ThinkPad X13 2-in-1 Gen 5 | |
| Geekbench 6.4 / Single-Core | |
| Dell Pro 13 Premium PA13250 | |
| Dell XPS 13 9350 | |
| Media Intel Core Ultra 7 268V (2583 - 2871, n=3) | |
| MSI Prestige 13 AI Plus Evo A2VMG | |
| Media della classe Subnotebook (960 - 3655, n=67, ultimi 2 anni) | |
| Microsoft Surface Pro Copilot+ | |
| Framework Laptop 13.5 Core Ultra 7 155H | |
| Lenovo ThinkPad X13 2-in-1 Gen 5 | |
| Lenovo ThinkPad X13 2-in-1 Gen 5 | |
| Geekbench 5.5 / Multi-Core | |
| Framework Laptop 13.5 Core Ultra 7 155H | |
| Media della classe Subnotebook (2557 - 17218, n=68, ultimi 2 anni) | |
| Media Intel Core Ultra 7 268V (9491 - 9801, n=3) | |
| MSI Prestige 13 AI Plus Evo A2VMG | |
| Dell Pro 13 Premium PA13250 | |
| Dell XPS 13 9350 | |
| Lenovo ThinkPad X13 2-in-1 Gen 5 | |
| Geekbench 5.5 / Single-Core | |
| Media Intel Core Ultra 7 268V (2008 - 2091, n=3) | |
| Dell XPS 13 9350 | |
| Dell Pro 13 Premium PA13250 | |
| MSI Prestige 13 AI Plus Evo A2VMG | |
| Media della classe Subnotebook (726 - 2350, n=68, ultimi 2 anni) | |
| Framework Laptop 13.5 Core Ultra 7 155H | |
| Lenovo ThinkPad X13 2-in-1 Gen 5 | |
| HWBOT x265 Benchmark v2.2 / 4k Preset | |
| MSI Prestige 13 AI Plus Evo A2VMG | |
| Framework Laptop 13.5 Core Ultra 7 155H | |
| Dell XPS 13 9350 | |
| Media della classe Subnotebook (0.97 - 25.1, n=70, ultimi 2 anni) | |
| Media Intel Core Ultra 7 268V (10.4 - 12.9, n=2) | |
| Dell Pro 13 Premium PA13250 | |
| Lenovo ThinkPad X13 2-in-1 Gen 5 | |
| Microsoft Surface Pro Copilot+ | |
| LibreOffice / 20 Documents To PDF | |
| Dell Pro 13 Premium PA13250 | |
| Microsoft Surface Pro Copilot+ | |
| Lenovo ThinkPad X13 2-in-1 Gen 5 | |
| Media della classe Subnotebook (38.5 - 220, n=68, ultimi 2 anni) | |
| Media Intel Core Ultra 7 268V (48 - 60.8, n=2) | |
| Dell XPS 13 9350 | |
| MSI Prestige 13 AI Plus Evo A2VMG | |
| Framework Laptop 13.5 Core Ultra 7 155H | |
| R Benchmark 2.5 / Overall mean | |
| Microsoft Surface Pro Copilot+ | |
| Lenovo ThinkPad X13 2-in-1 Gen 5 | |
| Media della classe Subnotebook (0.403 - 1.456, n=70, ultimi 2 anni) | |
| Framework Laptop 13.5 Core Ultra 7 155H | |
| MSI Prestige 13 AI Plus Evo A2VMG | |
| Dell XPS 13 9350 | |
| Media Intel Core Ultra 7 268V (0.4344 - 0.4565, n=2) | |
| Dell Pro 13 Premium PA13250 | |
* ... Meglio usare valori piccoli
AIDA64: FP32 Ray-Trace | FPU Julia | CPU SHA3 | CPU Queen | FPU SinJulia | FPU Mandel | CPU AES | CPU ZLib | FP64 Ray-Trace | CPU PhotoWorxx
| Performance Rating | |
| Framework Laptop 13.5 Core Ultra 7 155H | |
| Media della classe Subnotebook | |
| MSI Prestige 13 AI Plus Evo A2VMG | |
| Dell XPS 13 9350 | |
| Media Intel Core Ultra 7 268V | |
| Dell Pro 13 Premium PA13250 | |
| Lenovo ThinkPad X13 2-in-1 Gen 5 | |
| Microsoft Surface Pro Copilot+ | |
| AIDA64 / FP32 Ray-Trace | |
| Media della classe Subnotebook (1135 - 32888, n=70, ultimi 2 anni) | |
| MSI Prestige 13 AI Plus Evo A2VMG | |
| Dell XPS 13 9350 | |
| Framework Laptop 13.5 Core Ultra 7 155H | |
| Media Intel Core Ultra 7 268V (10556 - 11547, n=2) | |
| Dell Pro 13 Premium PA13250 | |
| Microsoft Surface Pro Copilot+ | |
| Lenovo ThinkPad X13 2-in-1 Gen 5 | |
| AIDA64 / FPU Julia | |
| MSI Prestige 13 AI Plus Evo A2VMG | |
| Dell XPS 13 9350 | |
| Framework Laptop 13.5 Core Ultra 7 155H | |
| Media della classe Subnotebook (5218 - 123315, n=70, ultimi 2 anni) | |
| Media Intel Core Ultra 7 268V (47659 - 56299, n=2) | |
| Dell Pro 13 Premium PA13250 | |
| Lenovo ThinkPad X13 2-in-1 Gen 5 | |
| Microsoft Surface Pro Copilot+ | |
| AIDA64 / CPU SHA3 | |
| Media della classe Subnotebook (444 - 5287, n=70, ultimi 2 anni) | |
| MSI Prestige 13 AI Plus Evo A2VMG | |
| Framework Laptop 13.5 Core Ultra 7 155H | |
| Dell XPS 13 9350 | |
| Media Intel Core Ultra 7 268V (2117 - 2538, n=2) | |
| Dell Pro 13 Premium PA13250 | |
| Lenovo ThinkPad X13 2-in-1 Gen 5 | |
| Microsoft Surface Pro Copilot+ | |
| AIDA64 / CPU Queen | |
| Framework Laptop 13.5 Core Ultra 7 155H | |
| Media della classe Subnotebook (10579 - 115682, n=70, ultimi 2 anni) | |
| Microsoft Surface Pro Copilot+ | |
| MSI Prestige 13 AI Plus Evo A2VMG | |
| Dell Pro 13 Premium PA13250 | |
| Media Intel Core Ultra 7 268V (49645 - 49759, n=2) | |
| Dell XPS 13 9350 | |
| Lenovo ThinkPad X13 2-in-1 Gen 5 | |
| AIDA64 / FPU SinJulia | |
| Framework Laptop 13.5 Core Ultra 7 155H | |
| Media della classe Subnotebook (744 - 18418, n=70, ultimi 2 anni) | |
| Lenovo ThinkPad X13 2-in-1 Gen 5 | |
| Dell XPS 13 9350 | |
| MSI Prestige 13 AI Plus Evo A2VMG | |
| Media Intel Core Ultra 7 268V (4353 - 4426, n=2) | |
| Dell Pro 13 Premium PA13250 | |
| Microsoft Surface Pro Copilot+ | |
| AIDA64 / FPU Mandel | |
| MSI Prestige 13 AI Plus Evo A2VMG | |
| Dell XPS 13 9350 | |
| Media della classe Subnotebook (3341 - 65433, n=70, ultimi 2 anni) | |
| Framework Laptop 13.5 Core Ultra 7 155H | |
| Media Intel Core Ultra 7 268V (25929 - 29637, n=2) | |
| Dell Pro 13 Premium PA13250 | |
| Lenovo ThinkPad X13 2-in-1 Gen 5 | |
| Microsoft Surface Pro Copilot+ | |
| AIDA64 / CPU AES | |
| Framework Laptop 13.5 Core Ultra 7 155H | |
| Microsoft Surface Pro Copilot+ | |
| Media della classe Subnotebook (638 - 161430, n=70, ultimi 2 anni) | |
| Dell XPS 13 9350 | |
| MSI Prestige 13 AI Plus Evo A2VMG | |
| Lenovo ThinkPad X13 2-in-1 Gen 5 | |
| Media Intel Core Ultra 7 268V (33196 - 38706, n=2) | |
| Dell Pro 13 Premium PA13250 | |
| AIDA64 / CPU ZLib | |
| Framework Laptop 13.5 Core Ultra 7 155H | |
| Media della classe Subnotebook (164.9 - 1379, n=70, ultimi 2 anni) | |
| Microsoft Surface Pro Copilot+ | |
| MSI Prestige 13 AI Plus Evo A2VMG | |
| Dell XPS 13 9350 | |
| Lenovo ThinkPad X13 2-in-1 Gen 5 | |
| Media Intel Core Ultra 7 268V (441 - 583, n=2) | |
| Dell Pro 13 Premium PA13250 | |
| AIDA64 / FP64 Ray-Trace | |
| MSI Prestige 13 AI Plus Evo A2VMG | |
| Media della classe Subnotebook (610 - 17495, n=70, ultimi 2 anni) | |
| Dell XPS 13 9350 | |
| Media Intel Core Ultra 7 268V (5938 - 6214, n=2) | |
| Framework Laptop 13.5 Core Ultra 7 155H | |
| Dell Pro 13 Premium PA13250 | |
| Lenovo ThinkPad X13 2-in-1 Gen 5 | |
| Microsoft Surface Pro Copilot+ | |
| AIDA64 / CPU PhotoWorxx | |
| MSI Prestige 13 AI Plus Evo A2VMG | |
| Dell XPS 13 9350 | |
| Media Intel Core Ultra 7 268V (46733 - 53540, n=2) | |
| Dell Pro 13 Premium PA13250 | |
| Framework Laptop 13.5 Core Ultra 7 155H | |
| Media della classe Subnotebook (6569 - 64588, n=70, ultimi 2 anni) | |
| Lenovo ThinkPad X13 2-in-1 Gen 5 | |
| Microsoft Surface Pro Copilot+ | |
Prestazioni del sistema
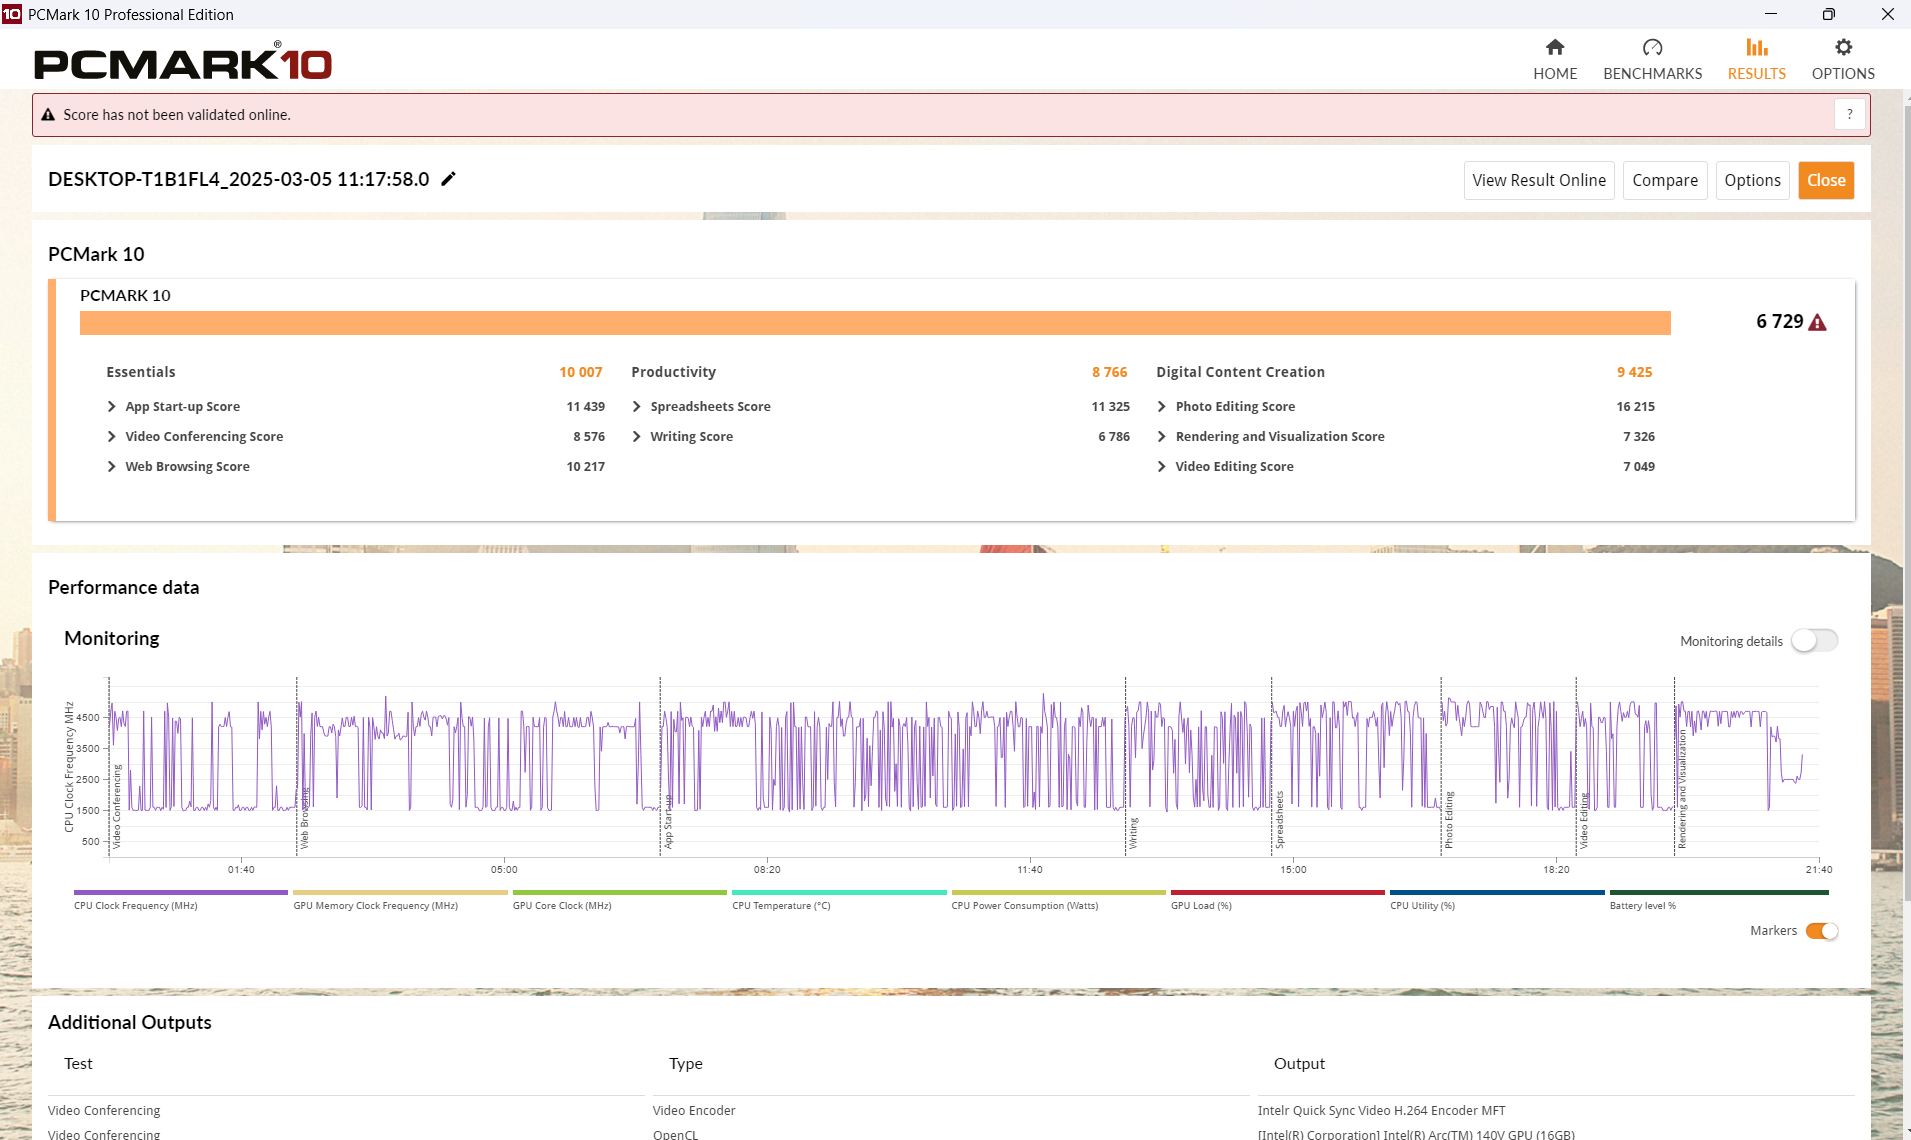
In PCMark 10 e CrossMark, i dispositivi di confronto sono vicini l'uno all'altro, ma sia in quest'area che nei test web, il nostro Dell Pro si posiziona più nel mezzo che in testa alla classifica.
CrossMark: Overall | Productivity | Creativity | Responsiveness
WebXPRT 3: Overall
WebXPRT 4: Overall
Mozilla Kraken 1.1: Total
| PCMark 10 / Score | |
| Media Intel Core Ultra 7 268V, Intel Arc Graphics 140V (6729 - 7236, n=2) | |
| Dell XPS 13 9350 | |
| Framework Laptop 13.5 Core Ultra 7 155H | |
| MSI Prestige 13 AI Plus Evo A2VMG | |
| Dell Pro 13 Premium PA13250 | |
| Media della classe Subnotebook (4993 - 7788, n=59, ultimi 2 anni) | |
| Lenovo ThinkPad X13 2-in-1 Gen 5 | |
| PCMark 10 / Essentials | |
| Lenovo ThinkPad X13 2-in-1 Gen 5 | |
| Framework Laptop 13.5 Core Ultra 7 155H | |
| Media della classe Subnotebook (9363 - 11331, n=59, ultimi 2 anni) | |
| Media Intel Core Ultra 7 268V, Intel Arc Graphics 140V (10007 - 10701, n=2) | |
| MSI Prestige 13 AI Plus Evo A2VMG | |
| Dell Pro 13 Premium PA13250 | |
| Dell XPS 13 9350 | |
| PCMark 10 / Productivity | |
| Dell XPS 13 9350 | |
| Media Intel Core Ultra 7 268V, Intel Arc Graphics 140V (8766 - 9217, n=2) | |
| Dell Pro 13 Premium PA13250 | |
| Framework Laptop 13.5 Core Ultra 7 155H | |
| Media della classe Subnotebook (5435 - 10623, n=59, ultimi 2 anni) | |
| MSI Prestige 13 AI Plus Evo A2VMG | |
| Lenovo ThinkPad X13 2-in-1 Gen 5 | |
| PCMark 10 / Digital Content Creation | |
| MSI Prestige 13 AI Plus Evo A2VMG | |
| Media Intel Core Ultra 7 268V, Intel Arc Graphics 140V (9425 - 10427, n=2) | |
| Dell XPS 13 9350 | |
| Framework Laptop 13.5 Core Ultra 7 155H | |
| Dell Pro 13 Premium PA13250 | |
| Media della classe Subnotebook (5305 - 12442, n=59, ultimi 2 anni) | |
| Lenovo ThinkPad X13 2-in-1 Gen 5 | |
| CrossMark / Overall | |
| Dell XPS 13 9350 | |
| MSI Prestige 13 AI Plus Evo A2VMG | |
| Media Intel Core Ultra 7 268V, Intel Arc Graphics 140V (1643 - 1738, n=2) | |
| Framework Laptop 13.5 Core Ultra 7 155H | |
| Dell Pro 13 Premium PA13250 | |
| Media della classe Subnotebook (365 - 2018, n=68, ultimi 2 anni) | |
| Lenovo ThinkPad X13 2-in-1 Gen 5 | |
| Microsoft Surface Pro Copilot+ | |
| CrossMark / Productivity | |
| Dell XPS 13 9350 | |
| MSI Prestige 13 AI Plus Evo A2VMG | |
| Media Intel Core Ultra 7 268V, Intel Arc Graphics 140V (1577 - 1680, n=2) | |
| Framework Laptop 13.5 Core Ultra 7 155H | |
| Dell Pro 13 Premium PA13250 | |
| Lenovo ThinkPad X13 2-in-1 Gen 5 | |
| Media della classe Subnotebook (364 - 1875, n=68, ultimi 2 anni) | |
| Microsoft Surface Pro Copilot+ | |
| CrossMark / Creativity | |
| MSI Prestige 13 AI Plus Evo A2VMG | |
| Dell XPS 13 9350 | |
| Media Intel Core Ultra 7 268V, Intel Arc Graphics 140V (1866 - 1976, n=2) | |
| Framework Laptop 13.5 Core Ultra 7 155H | |
| Dell Pro 13 Premium PA13250 | |
| Media della classe Subnotebook (372 - 2396, n=68, ultimi 2 anni) | |
| Lenovo ThinkPad X13 2-in-1 Gen 5 | |
| Microsoft Surface Pro Copilot+ | |
| CrossMark / Responsiveness | |
| Lenovo ThinkPad X13 2-in-1 Gen 5 | |
| Framework Laptop 13.5 Core Ultra 7 155H | |
| Dell XPS 13 9350 | |
| Media della classe Subnotebook (312 - 1899, n=68, ultimi 2 anni) | |
| MSI Prestige 13 AI Plus Evo A2VMG | |
| Media Intel Core Ultra 7 268V, Intel Arc Graphics 140V (1267 - 1311, n=2) | |
| Dell Pro 13 Premium PA13250 | |
| Microsoft Surface Pro Copilot+ | |
| WebXPRT 3 / Overall | |
| Microsoft Surface Pro Copilot+ | |
| Media della classe Subnotebook (156 - 479, n=67, ultimi 2 anni) | |
| Dell XPS 13 9350 | |
| MSI Prestige 13 AI Plus Evo A2VMG | |
| Framework Laptop 13.5 Core Ultra 7 155H | |
| Media Intel Core Ultra 7 268V, Intel Arc Graphics 140V (266 - 310, n=2) | |
| Dell Pro 13 Premium PA13250 | |
| Lenovo ThinkPad X13 2-in-1 Gen 5 | |
| WebXPRT 4 / Overall | |
| MSI Prestige 13 AI Plus Evo A2VMG | |
| Dell XPS 13 9350 | |
| Media Intel Core Ultra 7 268V, Intel Arc Graphics 140V (245 - 287, n=2) | |
| Media della classe Subnotebook (132 - 348, n=68, ultimi 2 anni) | |
| Microsoft Surface Pro Copilot+ | |
| Framework Laptop 13.5 Core Ultra 7 155H | |
| Dell Pro 13 Premium PA13250 | |
| Lenovo ThinkPad X13 2-in-1 Gen 5 | |
| Mozilla Kraken 1.1 / Total | |
| Lenovo ThinkPad X13 2-in-1 Gen 5 | |
| Framework Laptop 13.5 Core Ultra 7 155H | |
| Media della classe Subnotebook (278 - 1104, n=76, ultimi 2 anni) | |
| Dell Pro 13 Premium PA13250 | |
| Media Intel Core Ultra 7 268V, Intel Arc Graphics 140V (475 - 476, n=2) | |
| MSI Prestige 13 AI Plus Evo A2VMG | |
| Dell XPS 13 9350 | |
| Microsoft Surface Pro Copilot+ | |
* ... Meglio usare valori piccoli
| PCMark 10 Score | 6729 punti | |
Aiuto | ||
| AIDA64 / Memory Copy | |
| MSI Prestige 13 AI Plus Evo A2VMG | |
| Media Intel Core Ultra 7 268V (100445 - 107108, n=2) | |
| Dell XPS 13 9350 | |
| Dell Pro 13 Premium PA13250 | |
| Media della classe Subnotebook (14554 - 109035, n=70, ultimi 2 anni) | |
| Framework Laptop 13.5 Core Ultra 7 155H | |
| Lenovo ThinkPad X13 2-in-1 Gen 5 | |
| Microsoft Surface Pro Copilot+ | |
| AIDA64 / Memory Read | |
| Microsoft Surface Pro Copilot+ | |
| Dell XPS 13 9350 | |
| MSI Prestige 13 AI Plus Evo A2VMG | |
| Media Intel Core Ultra 7 268V (82511 - 88341, n=2) | |
| Dell Pro 13 Premium PA13250 | |
| Framework Laptop 13.5 Core Ultra 7 155H | |
| Media della classe Subnotebook (15948 - 122210, n=70, ultimi 2 anni) | |
| Lenovo ThinkPad X13 2-in-1 Gen 5 | |
| AIDA64 / Memory Write | |
| MSI Prestige 13 AI Plus Evo A2VMG | |
| Media Intel Core Ultra 7 268V (115959 - 117888, n=2) | |
| Dell Pro 13 Premium PA13250 | |
| Dell XPS 13 9350 | |
| Media della classe Subnotebook (15709 - 117898, n=70, ultimi 2 anni) | |
| Framework Laptop 13.5 Core Ultra 7 155H | |
| Lenovo ThinkPad X13 2-in-1 Gen 5 | |
| Microsoft Surface Pro Copilot+ | |
| AIDA64 / Memory Latency | |
| Lenovo ThinkPad X13 2-in-1 Gen 5 | |
| Framework Laptop 13.5 Core Ultra 7 155H | |
| Media della classe Subnotebook (7.2 - 187.8, n=69, ultimi 2 anni) | |
| Dell Pro 13 Premium PA13250 | |
| MSI Prestige 13 AI Plus Evo A2VMG | |
| Dell XPS 13 9350 | |
| Media Intel Core Ultra 7 268V (97.4 - 101.2, n=2) | |
| Microsoft Surface Pro Copilot+ | |
* ... Meglio usare valori piccoli
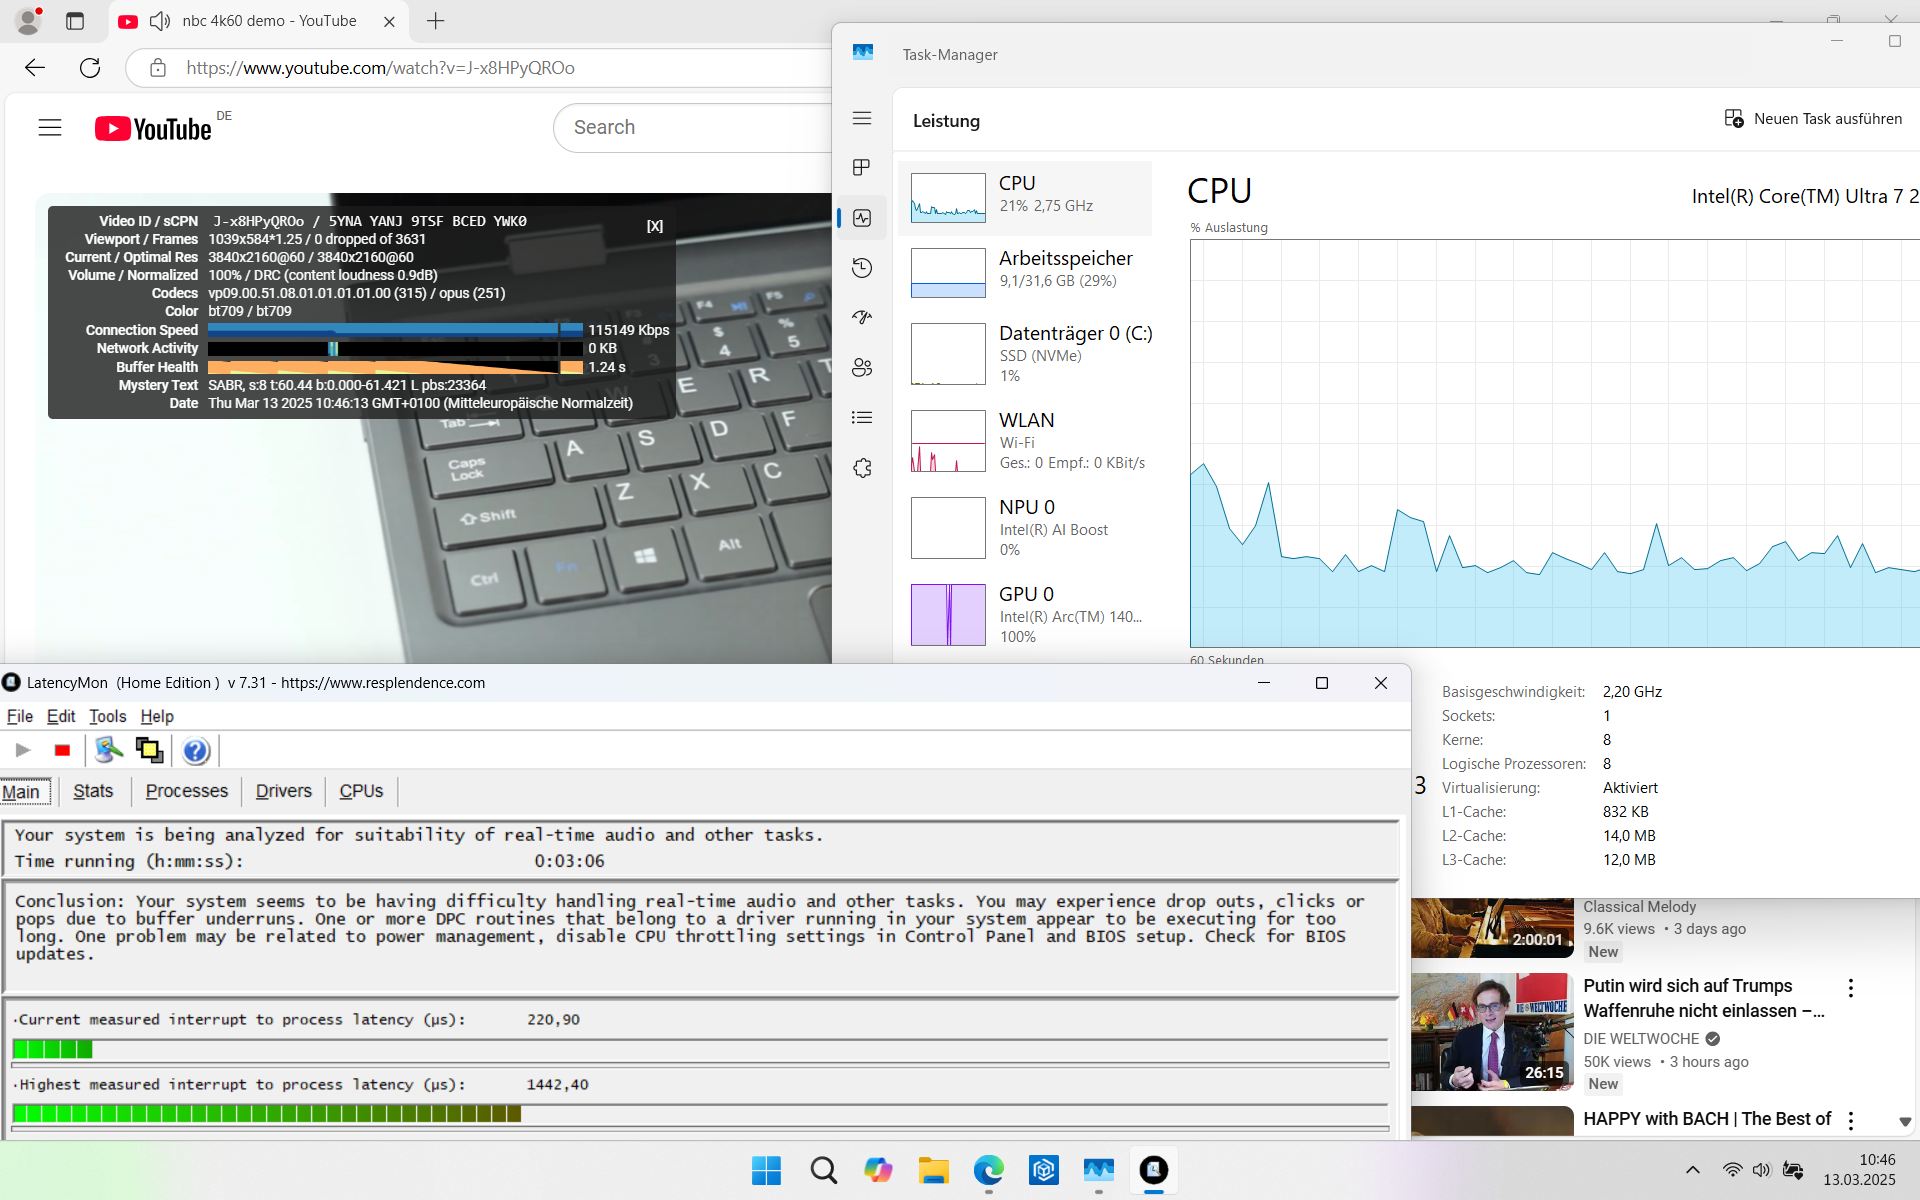
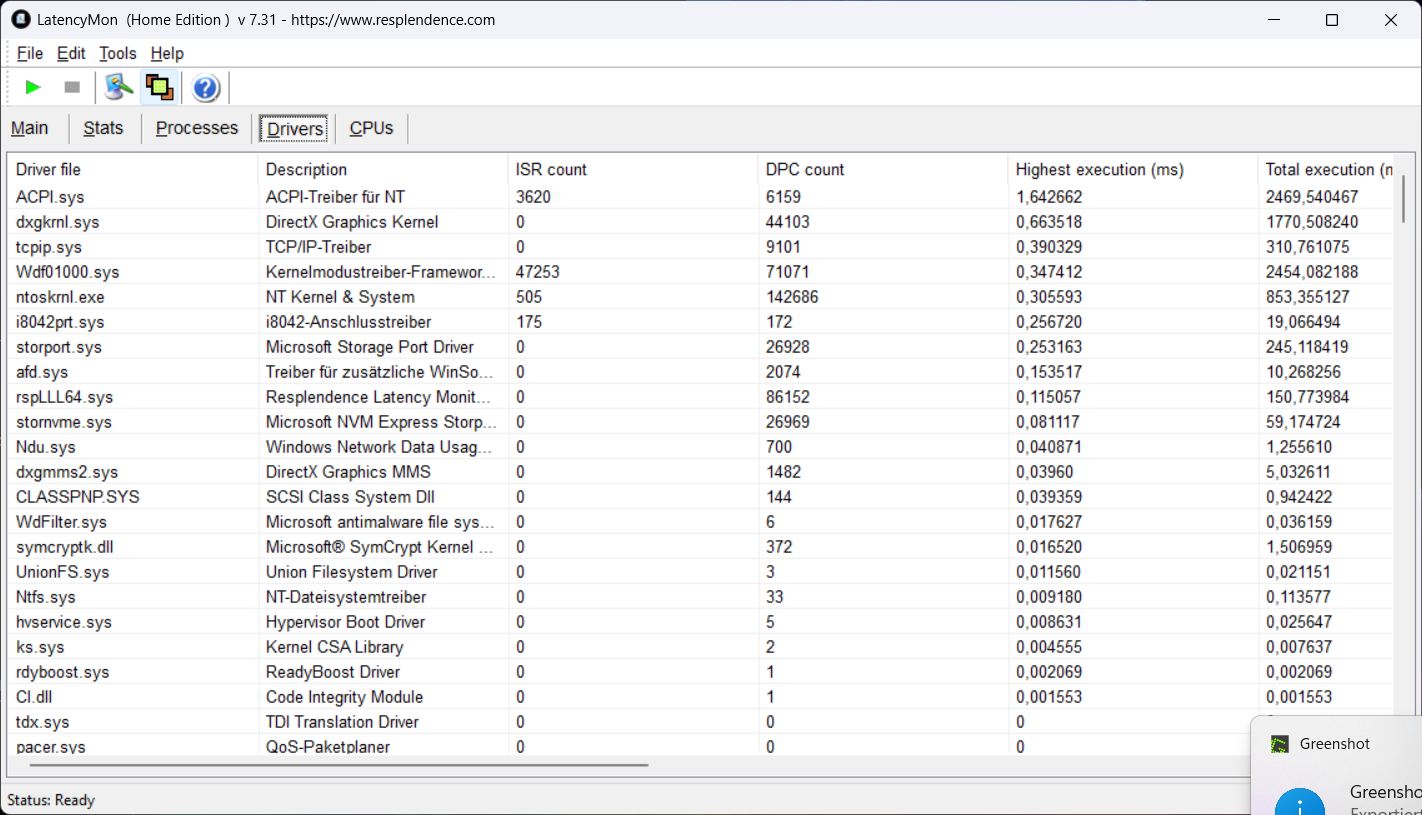
Latenze DPC
I primi seri problemi di latenza si sono manifestati quando si sono aperte più schede del browser. La latenza è aumentata durante la riproduzione del nostro video YouTube a 4K/60fps, che fortunatamente ha continuato a girare senza perdere fotogrammi. Il valore finale è un po' troppo alto per noi.

| DPC Latencies / LatencyMon - interrupt to process latency (max), Web, Youtube, Prime95 | |
| Dell Pro 13 Premium PA13250 | |
| Lenovo ThinkPad X13 2-in-1 Gen 5 | |
| MSI Prestige 13 AI Plus Evo A2VMG | |
| Framework Laptop 13.5 Core Ultra 7 155H | |
* ... Meglio usare valori piccoli
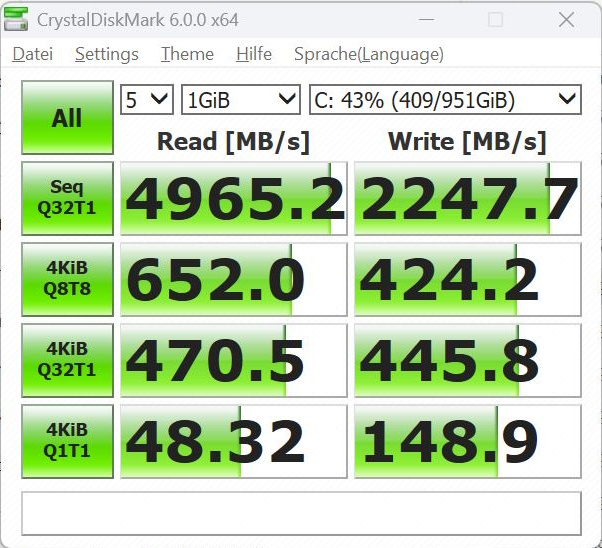
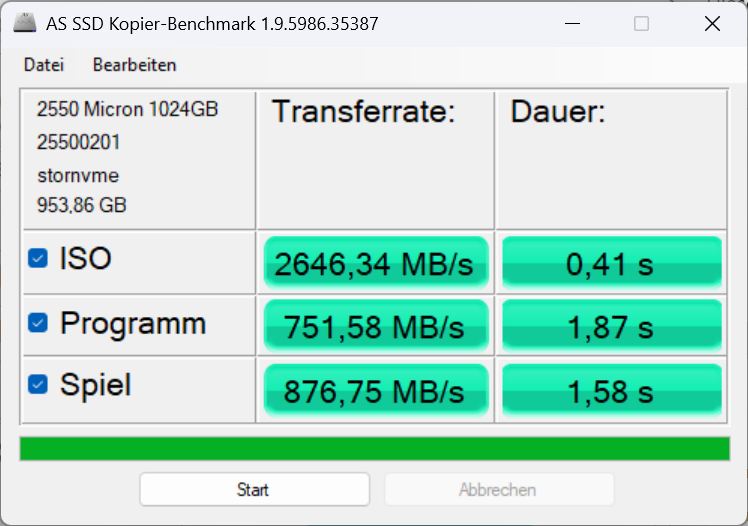
Memoria di massa
L'archiviazione si presenta sotto forma di un Micron 2550 da 1 TB, anche se, a seconda della configurazione, sono disponibili anche modelli da 512 GB. Nel complesso, l'unità è deludente in termini di velocità, ma le prestazioni rimangono abbastanza costanti nel tempo.


* ... Meglio usare valori piccoli
Continuous Performance Read: DiskSpd Read Loop, Queue Depth 8
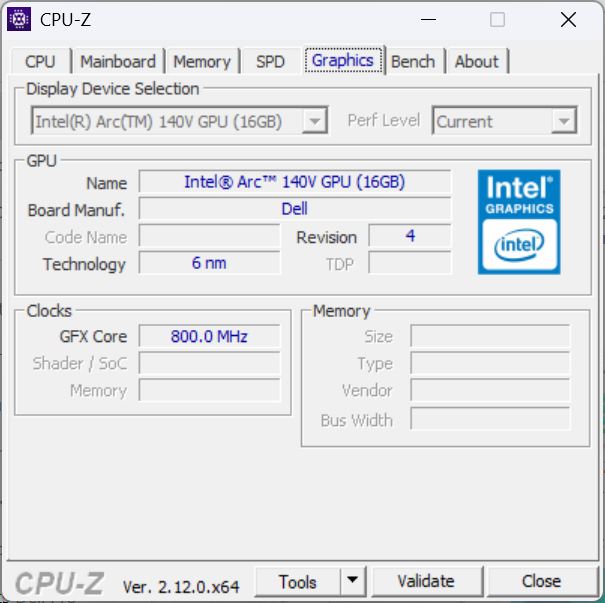
Scheda grafica
La Intel Arc Graphics 140V iGPU È una scheda grafica integrata relativamente veloce. Nei benchmark sintetici 3DMark, ha ottenuto prestazioni pari o leggermente superiori alle nostre aspettative. Non abbiamo notato alcuna riduzione delle prestazioni in un ciclo di Fire Strike con alimentazione a batteria.
Anche nei giochi si è comportata in modo impressionante: quasi tutti i giochi funzionavano in Full HD e con dettagli medi superiori a 30fps, e in alcuni casi era persino sufficiente per dettagli elevati. La frequenza dei fotogrammi a 30 minuti in Cyberpunk 2077 è risultata molto costante.
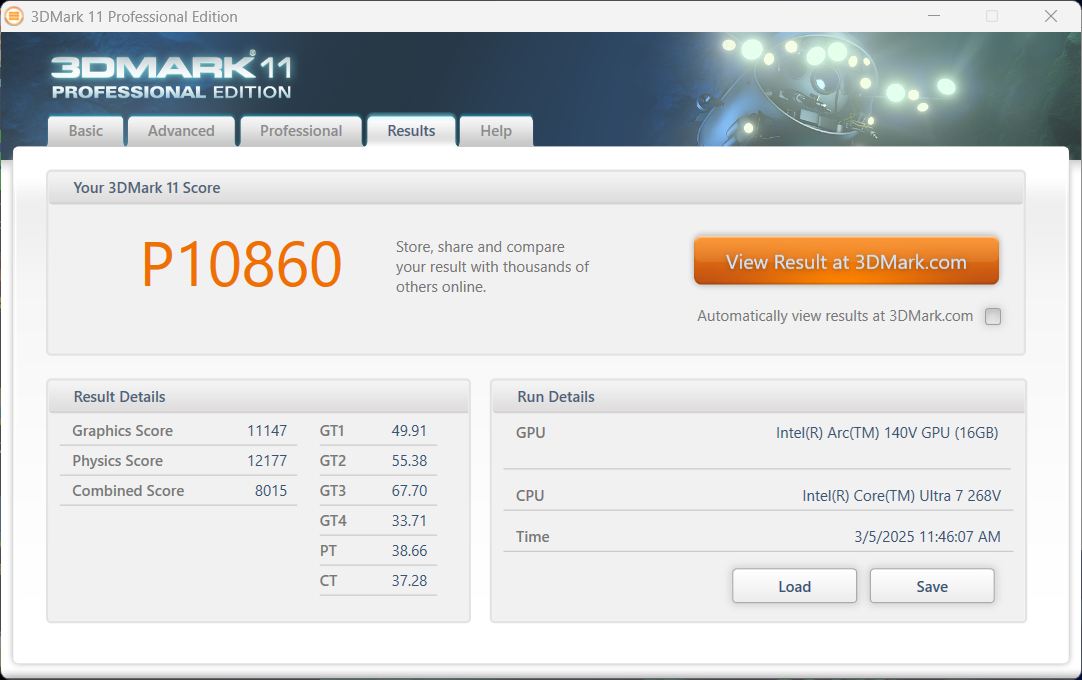
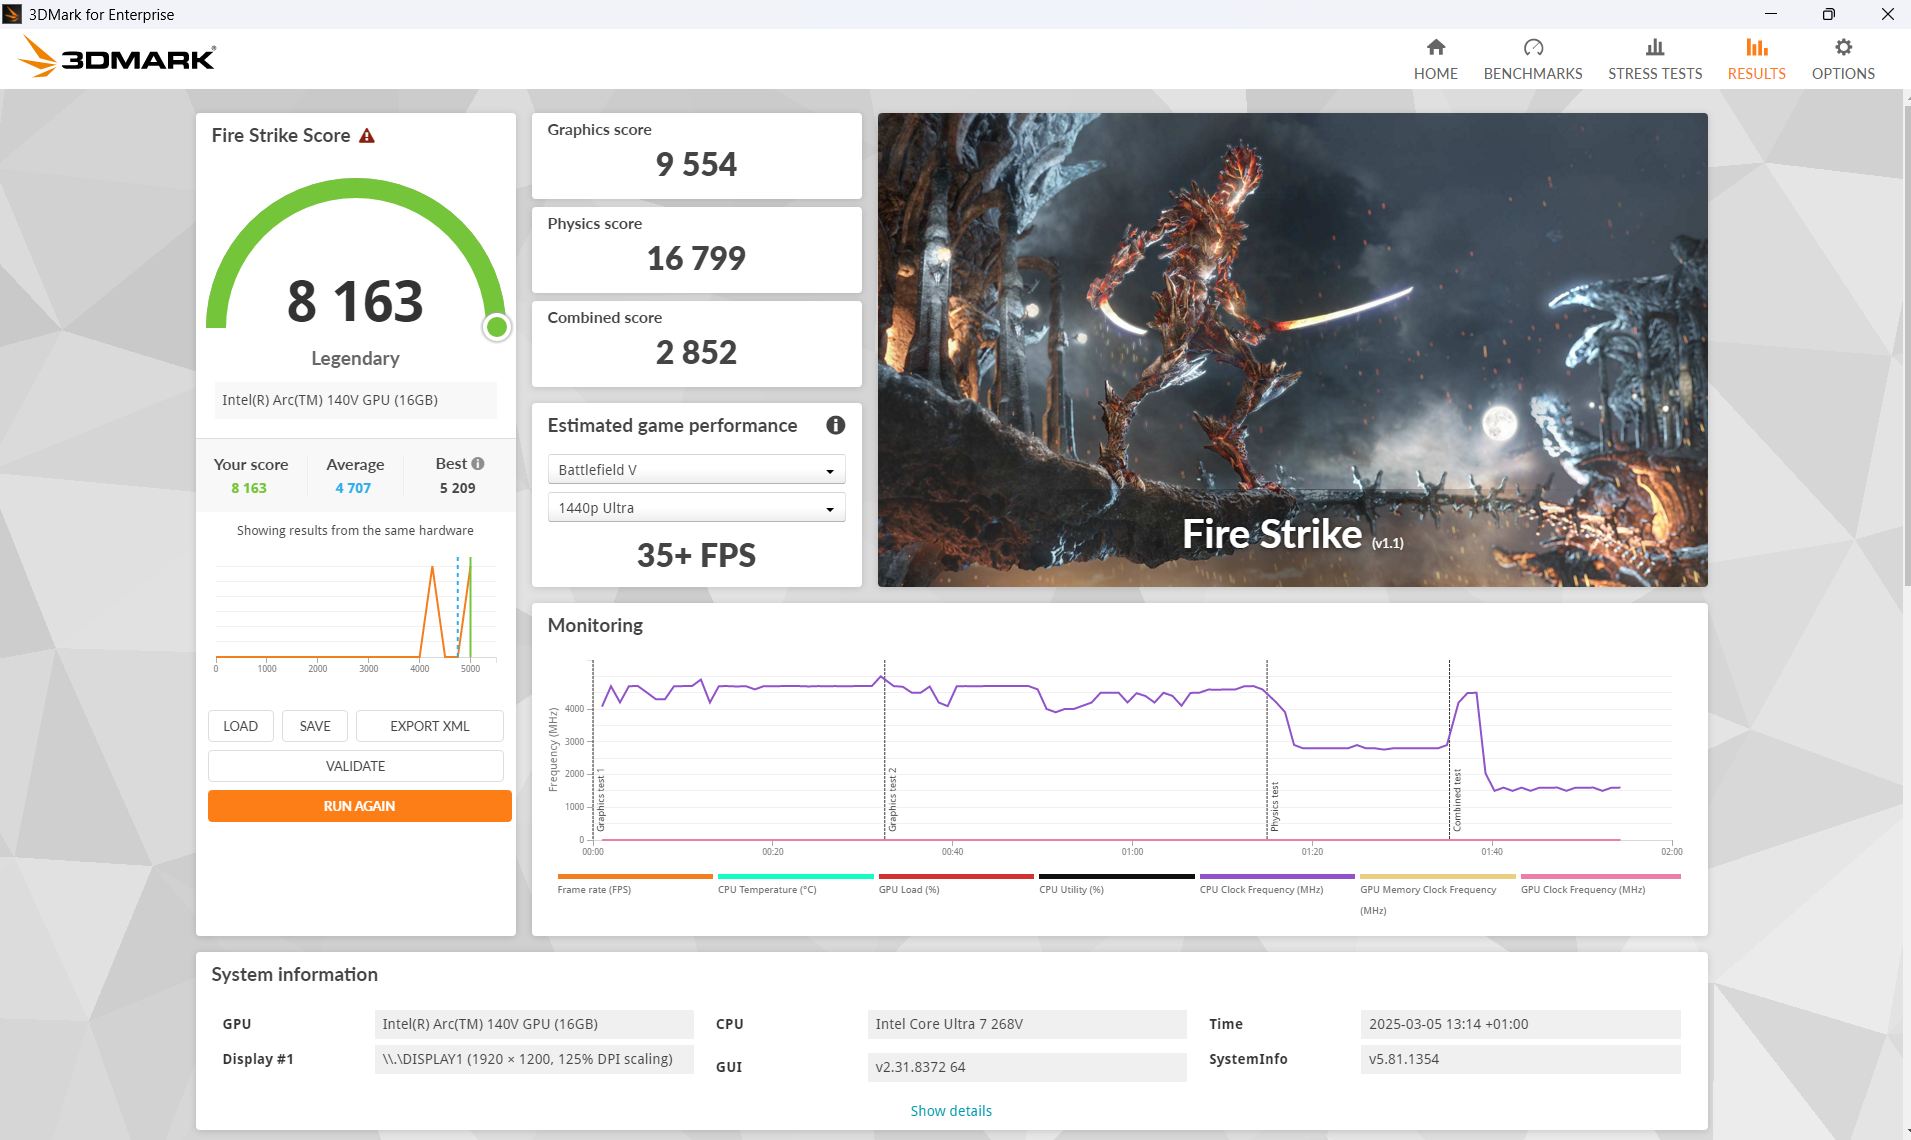
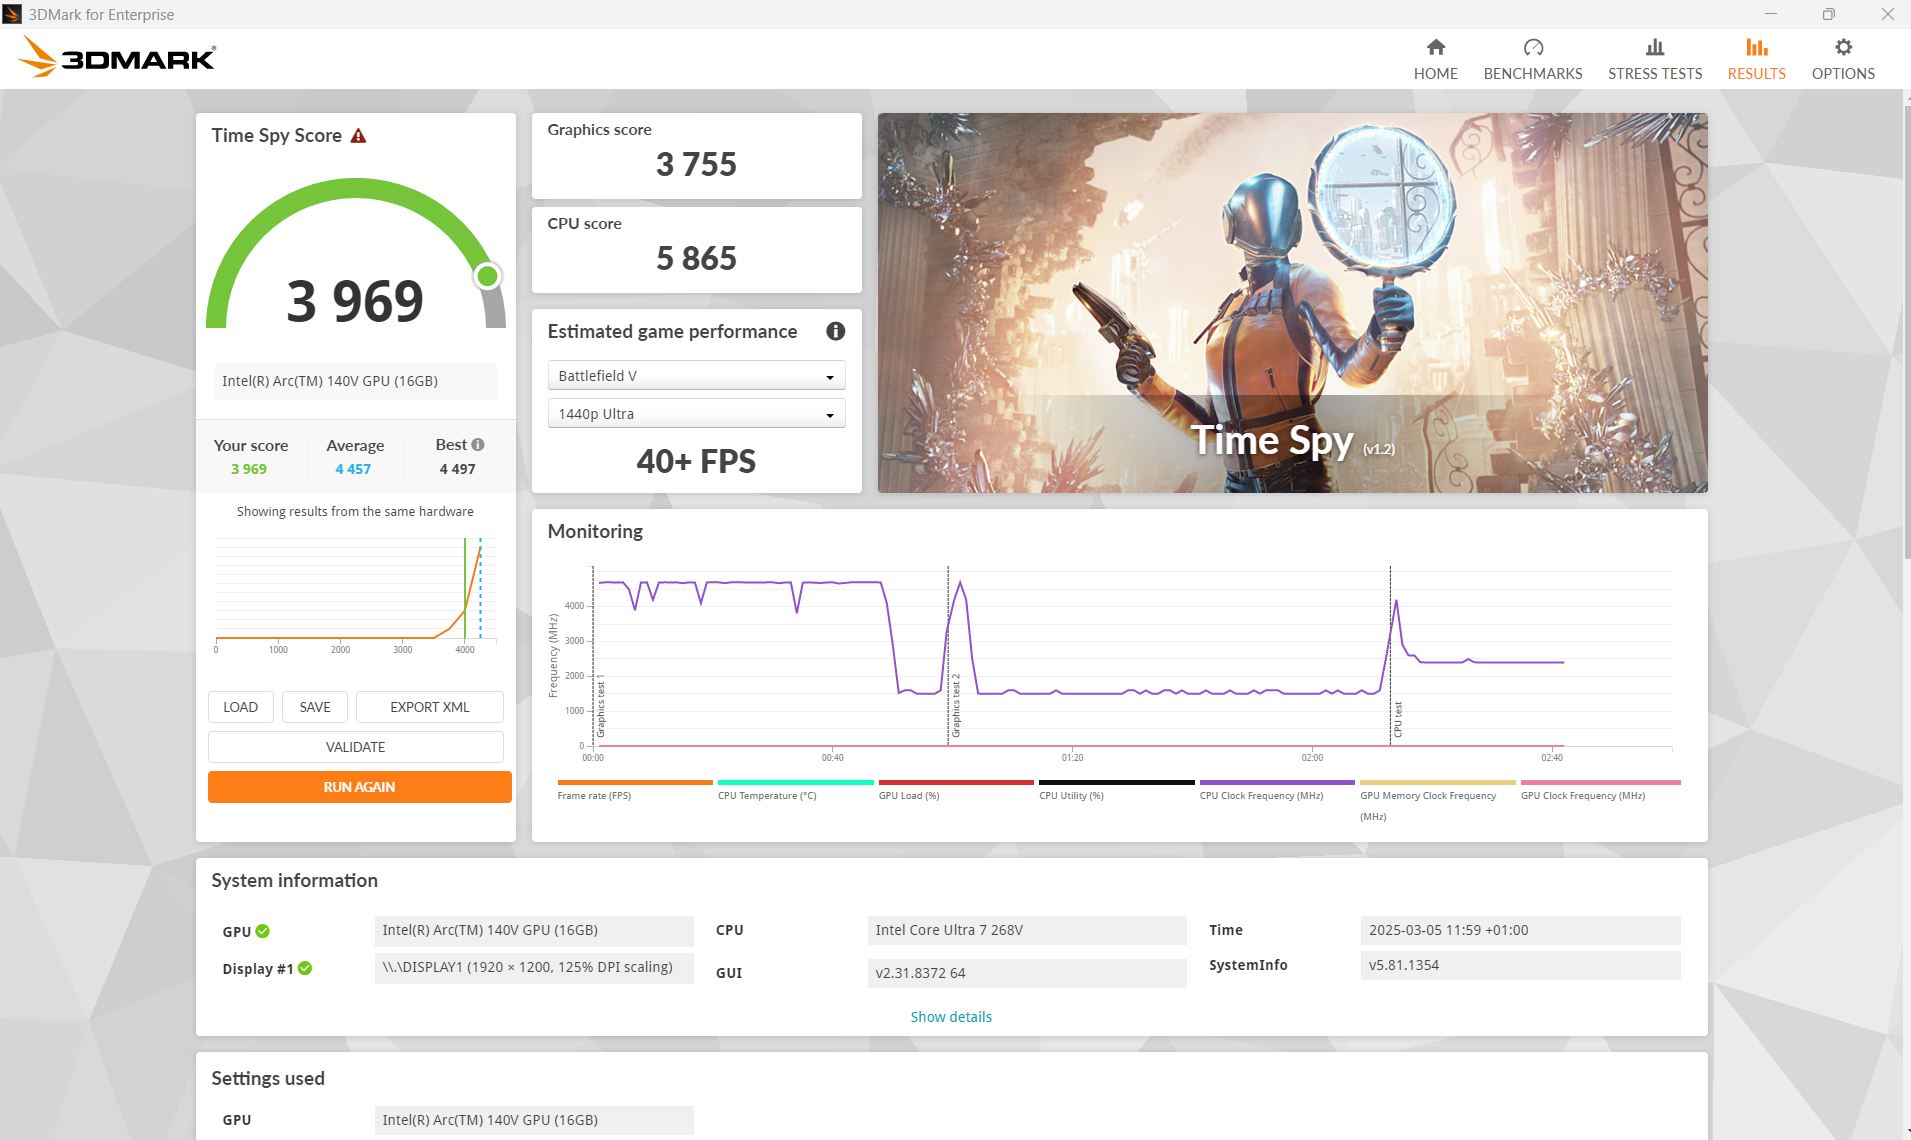
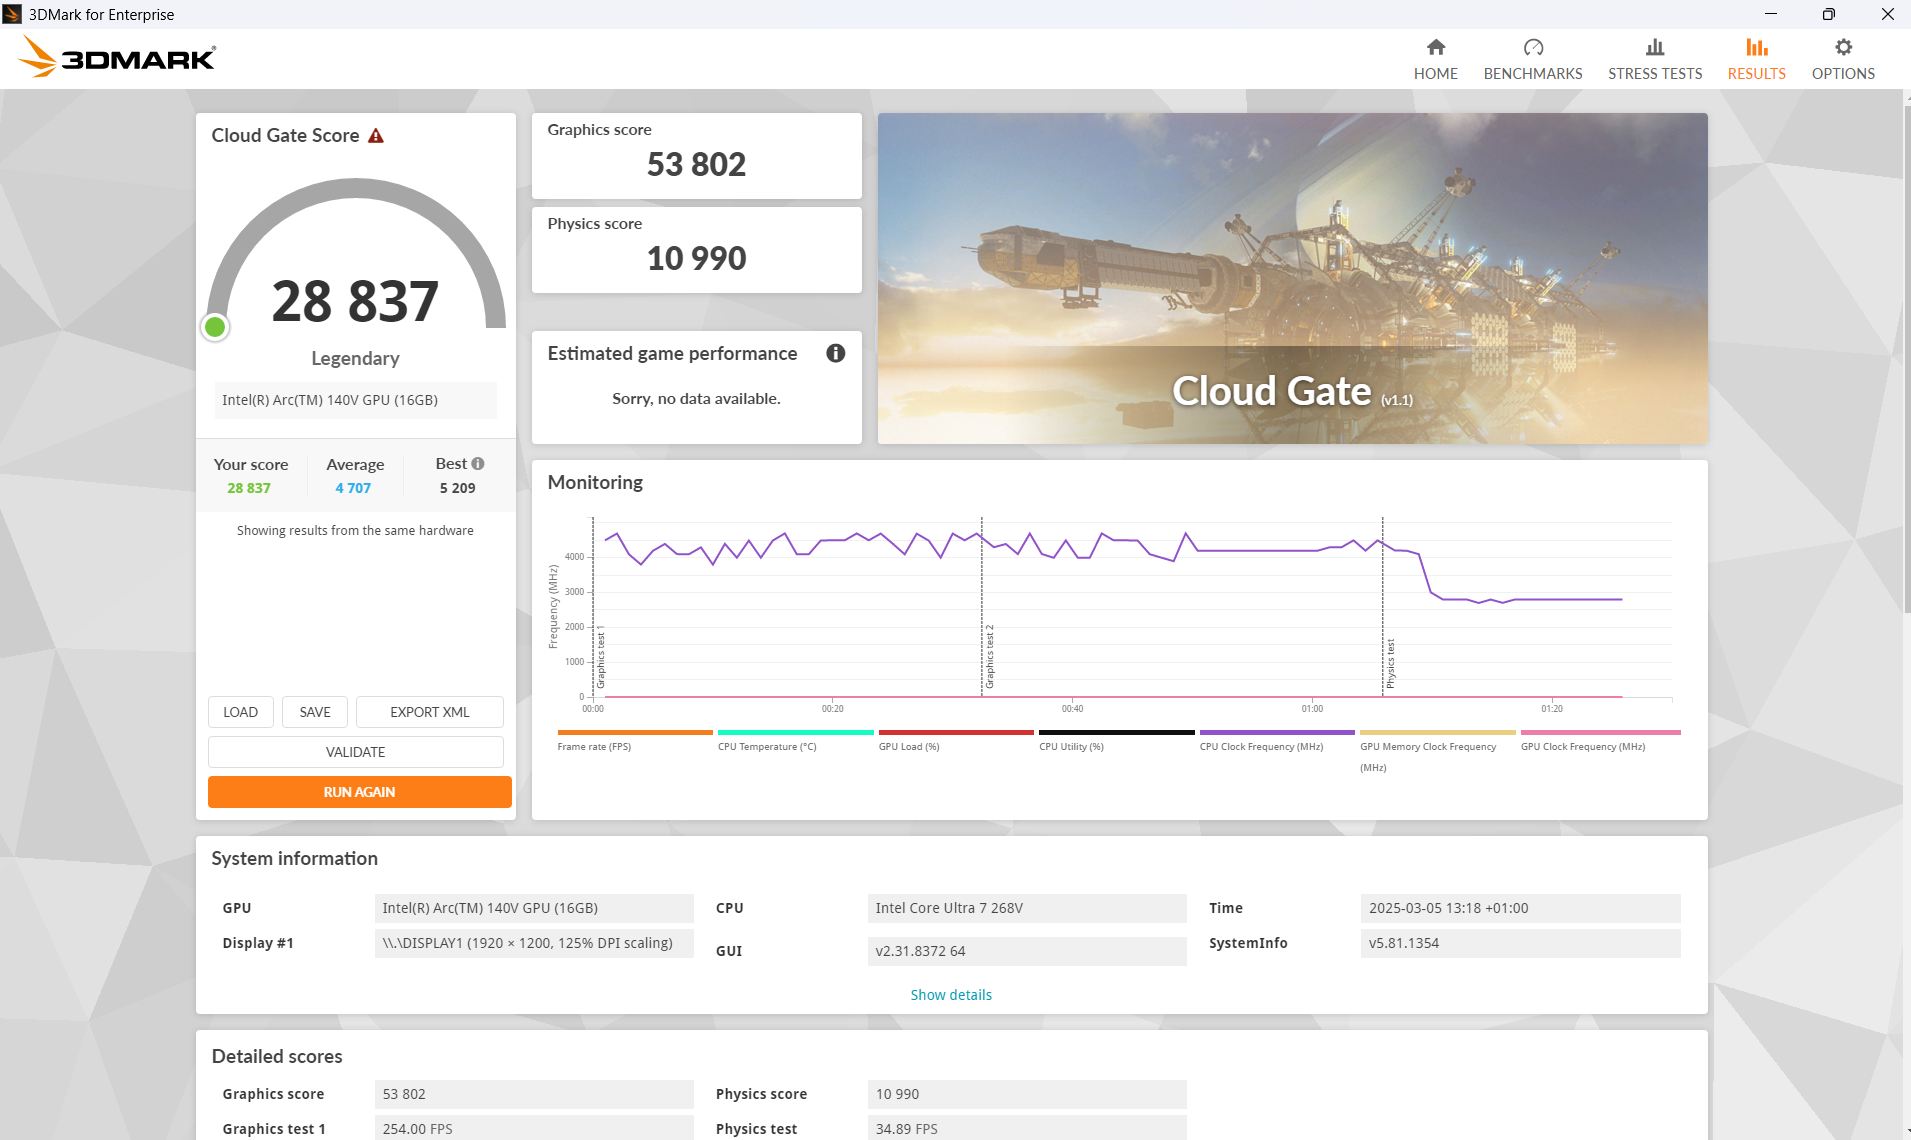
| 3DMark 11 Performance | 10860 punti | |
| 3DMark Cloud Gate Standard Score | 28837 punti | |
| 3DMark Fire Strike Score | 8163 punti | |
| 3DMark Time Spy Score | 3969 punti | |
Aiuto | ||
* ... Meglio usare valori piccoli
| Cyberpunk 2077 2.2 Phantom Liberty - 1920x1080 Ultra Preset (FSR off) | |
| MSI Prestige 13 AI Plus Evo A2VMG | |
| Dell Pro 13 Premium PA13250 | |
| Framework Laptop 13.5 Core Ultra 7 155H | |
| Media della classe Subnotebook (8.48 - 31.4, n=47, ultimi 2 anni) | |
| Dell XPS 13 9350 | |
| Microsoft Surface Pro Copilot+ | |
| Lenovo ThinkPad X13 2-in-1 Gen 5 | |
| GTA V - 1920x1080 Highest Settings possible AA:4xMSAA + FX AF:16x | |
| MSI Prestige 13 AI Plus Evo A2VMG | |
| Dell Pro 13 Premium PA13250 | |
| Dell XPS 13 9350 | |
| Microsoft Surface Pro Copilot+ | |
| Media della classe Subnotebook (7.81 - 53, n=67, ultimi 2 anni) | |
| Framework Laptop 13.5 Core Ultra 7 155H | |
| Lenovo ThinkPad X13 2-in-1 Gen 5 | |
Cyberpunk 2077 ultra FPS diagram
| basso | medio | alto | ultra | |
|---|---|---|---|---|
| GTA V (2015) | 153.4 | 140 | 26.3 | |
| Dota 2 Reborn (2015) | 107.5 | 101.7 | 87.8 | 71.2 |
| Final Fantasy XV Benchmark (2018) | 74.9 | 42.3 | 29.1 | |
| X-Plane 11.11 (2018) | 48.1 | 36.7 | 32.7 | |
| Strange Brigade (2018) | 223 | 83.3 | 69.5 | 57.8 |
| Baldur's Gate 3 (2023) | 45.5 | 35.7 | 31.3 | 30.8 |
| Cyberpunk 2077 2.2 Phantom Liberty (2023) | 43.5 | 35.4 | 28.6 | 28.1 |
Emissioni ed energia - Dell Pro è economico
Emissioni di rumore
Le ventole sono generalmente silenziose quando funzionano al minimo. Durante il gioco sotto carico massimo, abbiamo misurato un massimo di 42 dB, ma in realtà era più basso (anche negli stress test) e spesso raggiungeva solo 36 o 37 dB.
Rumorosità
| Idle |
| 23 / 23 / 23 dB(A) |
| Sotto carico |
| 37 / 42.74 dB(A) |
 | ||
30 dB silenzioso 40 dB(A) udibile 50 dB(A) rumoroso |
||
min: | ||
| Dell Pro 13 Premium PA13250 Arc 140V, Core Ultra 7 268V, Micron 2550 1TB | MSI Prestige 13 AI Plus Evo A2VMG Arc 140V, Core Ultra 7 258V | Lenovo ThinkPad X13 2-in-1 Gen 5 Graphics 4-Core, Ultra 7 165U, Lenovo UMIS RPETJ1T24MHP2QDQ | Framework Laptop 13.5 Core Ultra 7 155H Arc 8-Core, Ultra 7 155H | Dell XPS 13 9350 Arc 140V, Core Ultra 7 256V, Micron 2550 512GB | Microsoft Surface Pro Copilot+ Adreno X1-85 3.8 TFLOPS, SD X Plus X1P-64-100, Samsung PM9B1 256GB MZ9L4256HCJQ | |
|---|---|---|---|---|---|---|
| Noise | -8% | 4% | -7% | 3% | 2% | |
| off /ambiente * | 23 | 24.1 -5% | 23 -0% | 24 -4% | 24.1 -5% | 23.8 -3% |
| Idle Minimum * | 23 | 24.8 -8% | 23 -0% | 24.1 -5% | 24.4 -6% | 23.8 -3% |
| Idle Average * | 23 | 24.8 -8% | 23 -0% | 25.1 -9% | 24.4 -6% | 23.8 -3% |
| Idle Maximum * | 23 | 26.7 -16% | 23 -0% | 27 -17% | 24.4 -6% | 23.8 -3% |
| Load Average * | 37 | 36.8 1% | 34.44 7% | 38.4 -4% | 26.2 29% | 23.8 36% |
| Cyberpunk 2077 ultra * | 42.74 | 44.5 -4% | 38.28 10% | 43.7 -2% | 34.2 20% | 44.7 -5% |
| Load Maximum * | 42.74 | 50.8 -19% | 39.04 9% | 45.8 -7% | 45.2 -6% | 44.7 -5% |
* ... Meglio usare valori piccoli
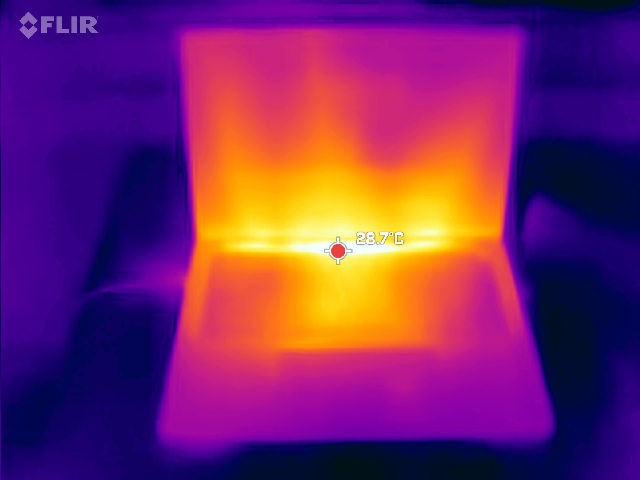
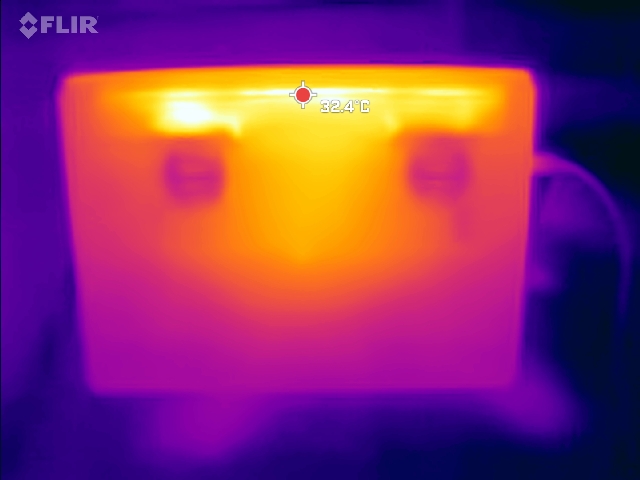
Temperatura
A differenza di molti concorrenti per l'ufficio e le aziende di queste dimensioni, Dell Pro 13 Premium utilizza due ventole invece di una sola, e questo ha un impatto positivo sulle temperature di superficie. Il gioco diventa più caldo rispetto al nostro stress test, ma anche in questo caso abbiamo misurato punti caldi di appena 37°C. Entrambi i lati del portatile sono raffreddati allo stesso modo, invece di un solo lato come accade in alcuni concorrenti.
(+) La temperatura massima sul lato superiore è di 31 °C / 88 F, rispetto alla media di 35.9 °C / 97 F, che varia da 21.4 a 59 °C per questa classe Subnotebook.
(+) Il lato inferiore si riscalda fino ad un massimo di 31 °C / 88 F, rispetto alla media di 39.3 °C / 103 F
(+) In idle, la temperatura media del lato superiore è di 22.3 °C / 72 F, rispetto alla media deld ispositivo di 30.8 °C / 87 F.
(+) 3: The average temperature for the upper side is 28.8 °C / 84 F, compared to the average of 30.8 °C / 87 F for the class Subnotebook.
(+) I poggiapolsi e il touchpad sono piu' freddi della temperatura della pelle con un massimo di 26 °C / 78.8 F e sono quindi freddi al tatto.
(+) La temperatura media della zona del palmo della mano di dispositivi simili e'stata di 28.2 °C / 82.8 F (+2.2 °C / 4 F).
| Dell Pro 13 Premium PA13250 Intel Core Ultra 7 268V, Intel Arc Graphics 140V | MSI Prestige 13 AI Plus Evo A2VMG Intel Core Ultra 7 258V, Intel Arc Graphics 140V | Lenovo ThinkPad X13 2-in-1 Gen 5 Intel Core Ultra 7 165U, Intel Graphics 4-Core iGPU (Arc) | Framework Laptop 13.5 Core Ultra 7 155H Intel Core Ultra 7 155H, Intel Arc 8-Core iGPU | Dell XPS 13 9350 Intel Core Ultra 7 256V, Intel Arc Graphics 140V | Microsoft Surface Pro Copilot+ Qualcomm Snapdragon X Plus X1P-64-100, Qualcomm SD X Adreno X1-85 3.8 TFLOPS | |
|---|---|---|---|---|---|---|
| Heat | -23% | -52% | -29% | -12% | -25% | |
| Maximum Upper Side * | 31 | 43.4 -40% | 60 -94% | 42.8 -38% | 34.8 -12% | 43.9 -42% |
| Maximum Bottom * | 31 | 42.4 -37% | 57 -84% | 45.2 -46% | 37.4 -21% | 44.9 -45% |
| Idle Upper Side * | 24 | 25.4 -6% | 27 -13% | 27.2 -13% | 25.4 -6% | 26.2 -9% |
| Idle Bottom * | 24 | 25.6 -7% | 28 -17% | 28.6 -19% | 26.2 -9% | 24.6 -3% |
* ... Meglio usare valori piccoli
Altoparlanti
Per un portatile così piccolo, gli altoparlanti riescono persino a superare alcuni modelli molto più grandi. La gamma media è equilibrata, ma mancano ancora i bassi. È disponibile un ingresso jack audio per il collegamento a dispositivi esterni.
Dell Pro 13 Premium PA13250 analisi audio
(+) | gli altoparlanti sono relativamente potenti (87.49 dB)
Bassi 100 - 315 Hz
(-) | quasi nessun basso - in media 15.9% inferiori alla media
(±) | la linearità dei bassi è media (8.3% delta rispetto alla precedente frequenza)
Medi 400 - 2000 Hz
(+) | medi bilanciati - solo only 2.9% rispetto alla media
(+) | medi lineari (4.7% delta rispetto alla precedente frequenza)
Alti 2 - 16 kHz
(±) | alti ridotti - circa 5.2% inferiori alla media
(±) | la linearità degli alti è media (7.1% delta rispetto alla precedente frequenza)
Nel complesso 100 - 16.000 Hz
(+) | suono nel complesso lineare (12.2% differenza dalla media)
Rispetto alla stessa classe
» 14% di tutti i dispositivi testati in questa classe è stato migliore, 4% simile, 82% peggiore
» Il migliore ha avuto un delta di 5%, medio di 19%, peggiore di 53%
Rispetto a tutti i dispositivi testati
» 8% di tutti i dispositivi testati in questa classe è stato migliore, 2% similare, 89% peggiore
» Il migliore ha avuto un delta di 4%, medio di 24%, peggiore di 134%
MSI Prestige 13 AI Plus Evo A2VMG analisi audio
(+) | gli altoparlanti sono relativamente potenti (84.5 dB)
Bassi 100 - 315 Hz
(-) | quasi nessun basso - in media 19.4% inferiori alla media
(±) | la linearità dei bassi è media (9.6% delta rispetto alla precedente frequenza)
Medi 400 - 2000 Hz
(±) | medi elevati - circa 6.4% superiore alla media
(+) | medi lineari (5.1% delta rispetto alla precedente frequenza)
Alti 2 - 16 kHz
(±) | alti elevati - circa 6.1% superiori alla media
(+) | alti lineari (4.6% delta rispetto alla precedente frequenza)
Nel complesso 100 - 16.000 Hz
(±) | la linearità complessiva del suono è media (18.2% di differenza rispetto alla media
Rispetto alla stessa classe
» 50% di tutti i dispositivi testati in questa classe è stato migliore, 7% simile, 43% peggiore
» Il migliore ha avuto un delta di 5%, medio di 19%, peggiore di 53%
Rispetto a tutti i dispositivi testati
» 36% di tutti i dispositivi testati in questa classe è stato migliore, 8% similare, 56% peggiore
» Il migliore ha avuto un delta di 4%, medio di 24%, peggiore di 134%
Consumo di energia
Grazie al SoC Lunar Lake, il Dell Pro 13 è molto economico. Consuma solo da 2 a 4,75 W quando è al minimo, e abbiamo misurato solo 38 W durante l'esecuzione di Cyberpunk 2077. Solo il Dell XPS 13 9350con la sua CPU Lunar Lake leggermente più debole, è più economico e tutti gli altri concorrenti consumano di più
| Off / Standby | |
| Idle | |
| Sotto carico |
|
Leggenda:
min: | |
| Dell Pro 13 Premium PA13250 Core Ultra 7 268V, Arc 140V | MSI Prestige 13 AI Plus Evo A2VMG Core Ultra 7 258V, Arc 140V | Lenovo ThinkPad X13 2-in-1 Gen 5 Ultra 7 165U, Graphics 4-Core | Framework Laptop 13.5 Core Ultra 7 155H Ultra 7 155H, Arc 8-Core | Dell XPS 13 9350 Core Ultra 7 256V, Arc 140V | Microsoft Surface Pro Copilot+ SD X Plus X1P-64-100, Adreno X1-85 3.8 TFLOPS | Media della classe Subnotebook | |
|---|---|---|---|---|---|---|---|
| Power Consumption | -39% | -19% | -26% | 7% | -23% | -62% | |
| Idle Minimum * | 2 | 3.5 -75% | 3.2 -60% | 2.5 -25% | 1.3 35% | 1.9 5% | 4.3 ? -115% |
| Idle Average * | 4.3 | 5.9 -37% | 6.1 -42% | 5.2 -21% | 2.5 42% | 9.2 -114% | 7.33 ? -70% |
| Idle Maximum * | 4.75 | 10 -111% | 6.7 -41% | 5.8 -22% | 4.1 14% | 9.5 -100% | 9.07 ? -91% |
| Load Average * | 40 | 38.7 3% | 44.2 -11% | 47.5 -19% | 40.1 -0% | 29.6 26% | 45.2 ? -13% |
| Cyberpunk 2077 ultra * | 36.4 | 46.3 -27% | 25.2 31% | 54.5 -50% | 46.1 -27% | 39.5 -9% | |
| Cyberpunk 2077 ultra external monitor * | 38 | 45.6 -20% | 38.5 -1% | 52.4 -38% | 43.1 -13% | 37.4 2% | |
| Load Maximum * | 57 | 61.5 -8% | 62.5 -10% | 61.5 -8% | 57.3 -1% | 40.7 29% | 69 ? -21% |
* ... Meglio usare valori piccoli
Power consumption Cyberpunk / stress test
Power consumption with an external monitor
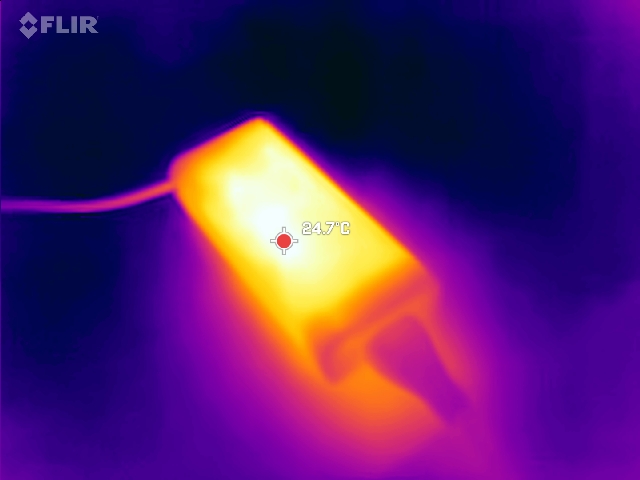
Durata della batteria
Grazie al basso consumo energetico, la durata della batteria è eccellente. Abbiamo registrato quasi 24 ore nei test Wi-Fi e video, un risultato fantastico! La batteria da 60W è piuttosto di fascia media in termini di capacità. L' XPS 13 perde solo marginalmente a causa della sua batteria leggermente più piccola (55 Wh).
| Dell Pro 13 Premium PA13250 Core Ultra 7 268V, Arc 140V, 60 Wh | MSI Prestige 13 AI Plus Evo A2VMG Core Ultra 7 258V, Arc 140V, 75 Wh | Lenovo ThinkPad X13 2-in-1 Gen 5 Ultra 7 165U, Graphics 4-Core, 54.7 Wh | Framework Laptop 13.5 Core Ultra 7 155H Ultra 7 155H, Arc 8-Core, 61 Wh | Dell XPS 13 9350 Core Ultra 7 256V, Arc 140V, 55 Wh | Microsoft Surface Pro Copilot+ SD X Plus X1P-64-100, Adreno X1-85 3.8 TFLOPS, 47 Wh | Media della classe Subnotebook | |
|---|---|---|---|---|---|---|---|
| Autonomia della batteria | -44% | -50% | -52% | -15% | -48% | -36% | |
| H.264 | 1425 | 731 -49% | 841 -41% | 961 ? -33% | |||
| WiFi v1.3 | 1440 | 804 -44% | 739 -49% | 630 -56% | 1236 -14% | 662 -54% | 757 ? -47% |
| Load | 170 | 84 -51% | 90 -47% | 142 -16% | 89 -48% | 121.3 ? -29% | |
| Reader / Idle | 2296 | 3407 | 1882 ? |
Valutazione complessiva di Notebookcheck
Il Dell Pro 13 Premium è quasi tutto ciò che ci si aspetta da un portatile business: È abbastanza piccolo, leggero, economico, ha un'ottima durata della batteria e offre comunque prestazioni di alto livello. A parte il prezzo elevato, non ci sono praticamente lamentele reali da fare.
Dell Pro 13 Premium PA13250
- 03/14/2025 v8
Christian Hintze
 Total Sustainability Score:
 Transparency
La selezione dei dispositivi da recensire viene effettuata dalla nostra redazione. Il campione di prova è stato fornito all'autore come prestito dal produttore o dal rivenditore ai fini di questa recensione. L'istituto di credito non ha avuto alcuna influenza su questa recensione, né il produttore ne ha ricevuto una copia prima della pubblicazione. Non vi era alcun obbligo di pubblicare questa recensione. Non accettiamo mai compensi o pagamenti in cambio delle nostre recensioni. In quanto società mediatica indipendente, Notebookcheck non è soggetta all'autorità di produttori, rivenditori o editori.
Ecco come Notebookcheck esegue i test
Ogni anno, Notebookcheck esamina in modo indipendente centinaia di laptop e smartphone utilizzando procedure standardizzate per garantire che tutti i risultati siano comparabili. Da circa 20 anni sviluppiamo continuamente i nostri metodi di prova e nel frattempo stabiliamo gli standard di settore. Nei nostri laboratori di prova, tecnici ed editori esperti utilizzano apparecchiature di misurazione di alta qualità. Questi test comportano un processo di validazione in più fasi. Il nostro complesso sistema di valutazione si basa su centinaia di misurazioni e parametri di riferimento ben fondati, che mantengono l'obiettività.
