Notebookcheck Logo

Recensione del portatile rugged Durabook S15: Sorprendentemente sottile e leggero per la sua categoria
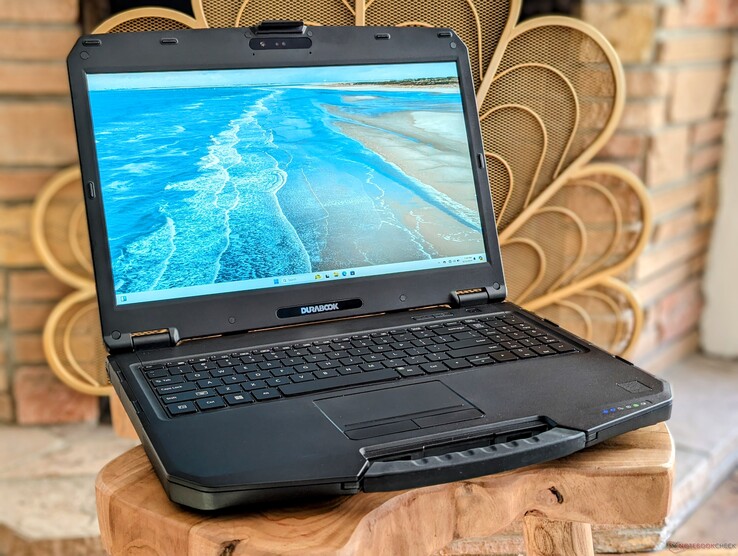
Diverse modifiche da cima a fondo.

L'S15 è tornato con ulteriori caratteristiche opzionali, tra cui un display IPS super-luminoso da 1000 nit e la grafica discreta Quadro T1000. La sua struttura relativamente leggera è forse la più impressionante, ma la tastiera e la durata della batteria potrebbero essere leggermente migliori.
2024 Durabook S15
2024 Durabook S15

Il modello 2024 S15 è l'ultimo computer portatile rugged da 15,6 pollici di Durabook che succede al vecchio modello 2020 S15. Comporta una manciata di modifiche esterne, oltre alle nuove CPU Alder Lake pronte per vPro, che sostituiscono le vecchie opzioni Whiskey Lake-U del 2020.

La nostra unità in prova è dotata di CPU Core i7-1255U di 12a generazione, grafica Iris Xe integrata e display IPS 1080p a 1000 nit, mentre altre SKU possono offrire il Core i5-1235U più lento, la grafica discreta Quadro T1000 più veloce o un display più debole. Il foglio delle specifiche completo è disponibile all'indirizzo https://media.durabook.com/wp-content/uploads/2023/11/01165229/DURABOOK_DM_S15_US_20231101.pdf.

Altre recensioni di Durabook:

Durabook S15
Processore
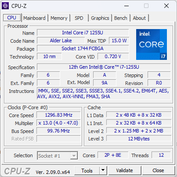
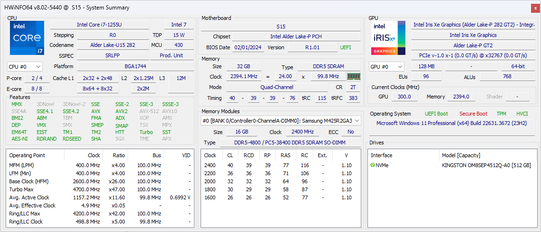
Intel Core i7-1255U 10 x 1.2 - 4.7 GHz, 34 W PL2 / Short Burst, 15 W PL1 / Sustained, Alder Lake-U
Scheda grafica
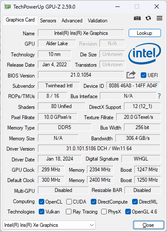
Intel Iris Xe Graphics G7 96EUs, Core: 1250 MHz, Memoria: 2400 MHz, DDR5, 31.0.101.5186
Memoria
32 GB 
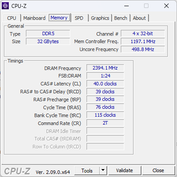
, DDR5-4800, 40-39-39-76, Dual-Channel
Schermo
15.60 pollici 16:9, 1920 x 1080 pixel 141 PPI, HKC MY MB156CS01'2, IPS, 60 Hz
Scheda madre
Intel Alder Lake-P PCH
Harddisk
Kingston OM8SEP4512Q-AA, 512 GB 
Scheda audio
Intel Alder Lake-P PCH - cAVS (Audio, Voice, Speech)
Porte di connessione
3 USB 3.0 / 3.1, 1 USB 3.1 Gen 2, 1 Thunderbolt, USB-C Power Delivery (PD), 1 HDMI, 2 DisplayPort, 1 Kensington Lock, 1 Porta Docking, Connessioni Audio: 3.5 mm combo, Lettore schede: SD
Rete
Intel Ethernet Connection I219-LM (10/100/1000MBit/s), Intel Wi-Fi 6E AX211 (a/b/g/h/n = Wi-Fi 4/ac = Wi-Fi 5/ax = Wi-Fi 6/ Wi-Fi 6E 6 GHz), Bluetooth 5.3
Dimensioni
altezza x larghezza x profondità (in mm): 29.5 x 375 x 273
Batteria
56 Wh, 7600 mAh ioni di litio, removibile
Sistema Operativo
Microsoft Windows 11 Pro
Camera
Fotocamera Principale: 5 MPix 1944p30
Altre caratteristiche
Casse: Stereo, Tastiera: Chiclet, Illuminazione Tastiera: si, 36 Mesi Garanzia, gommato
Peso
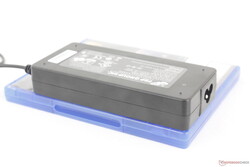
2.663 kg, Alimentazione: 414 gr
Nota: il produttore potrebbe usare componenti di fornitori diversi pannelli dei diplay, drive o banchi di memoria con specifiche simili.


Potenziali concorrenti a confrontos

Punteggio
Data
Modello
Peso
Altezza
Dimensione
Risoluzione
Miglior Prezzo
80.5 %
06/2024
Durabook S15
i7-1255U, Iris Xe G7 96EUs
2.7 kg29.5 mm15.60"1920x1080
78.3 %
v7 (old)
04/2020
Durabook S15ABG2
i5-8265U, UHD Graphics 620
2.6 kg30 mm15.60"1920x1080

v (old)
07/2022
Panasonic Toughbook 40
i7-1185G7, Iris Xe G7 96EUs
3.9 kg53.4 mm14.00"1920x1080
82.9 %
v7 (old)
06/2024
Getac S410 G5
i5-1350P, Iris Xe G7 80EUs
2.9 kg34.9 mm14.00"1920x1080
89.2 %
v6 (old)
03/2019
Dell Latitude 5420 Rugged-P85G
i7-8650U, Radeon RX 540
2.8 kg32.9 mm14.00"1920x1080
82.4 %
v7 (old)
12/2021
Acer Enduro Urban N3 EUN314
i7-1165G7, Iris Xe G7 96EUs
1.8 kg21.95 mm14.00"1920x1080

Custodia - Certificata MIL-STD-810H

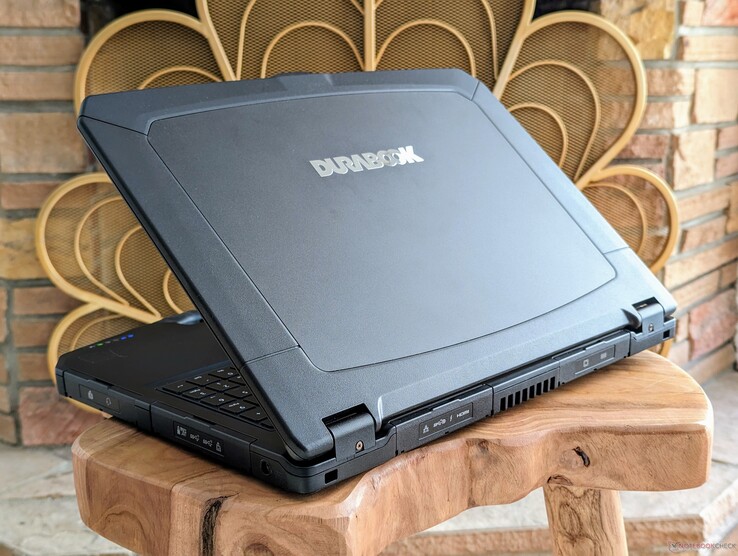
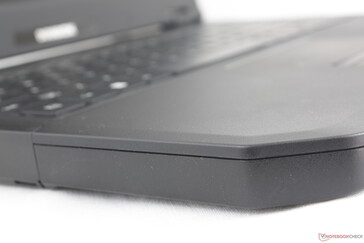
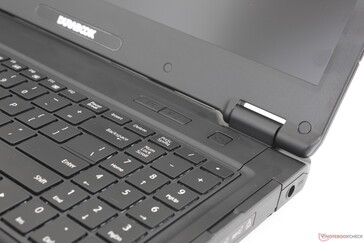
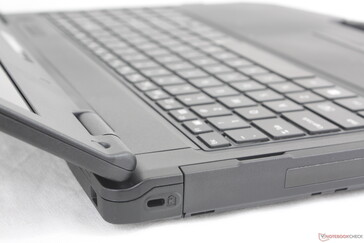
Visivamente, sono state apportate alcune modifiche allo chassis, tra cui il nuovo colore nero uniforme, la tastiera più grande con tastierino numerico, la transizione della superficie più liscia tra il piano della tastiera e la maniglia di trasporto e il posizionamento rivisto delle porte a causa di tutte le modifiche interne alla scheda madre. La qualità dello chassis rimane eccellente come in precedenza, tranne che per la parte della tastiera con il tastierino numerico, dove la superficie tende a deformarsi molto più facilmente quando si esercita una pressione. Troviamo che il Getac S410, più spesso, sia più robusto, soprattutto negli angoli, dato che il Durabook non è gommato per una migliore protezione dalle cadute.

Il peso e le dimensioni sono sostanzialmente identici al design del 2020, per preservare la compatibilità con il maggior numero possibile di accessori. Il vecchio design era già molto portatile per la categoria e questo rimane vero anche per l'S15 2024, dove il produttore si fregia del titolo di "più sottile e leggero". Il modello da 14 pollici Getac S410 G5, ad esempio, è più pesante e più spesso dell'S15, anche se il Durabook offre uno schermo più grande da 15,6 pollici.

Telaio in lega di alluminio e magnesio
Tasti P1 e P2 programmabili dall'utente
Le cerniere possono aprirsi fino a ~170 gradi massimo
Le superfici ruvide e opache nascondono bene le impronte digitali
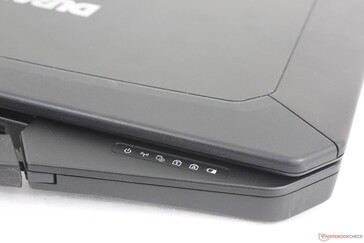
L'utile fila di indicatori LED è visibile senza dover prima aprire il coperchio
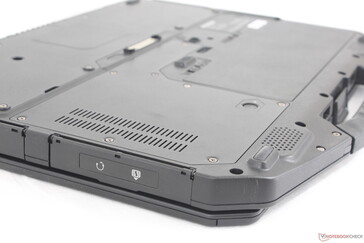
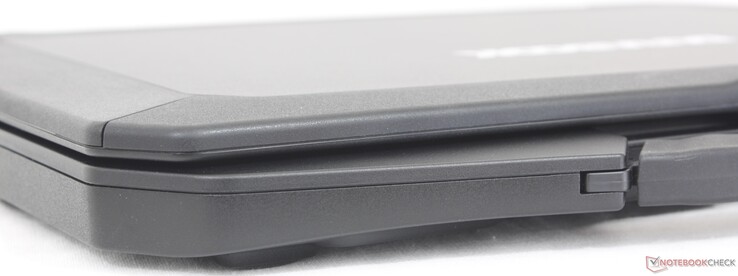
I perni POGO sono ora sempre esposti sulla superficie inferiore

Confronto delle dimensioni

353 mm 302 mm 53.4 mm 3.9 kg375 mm 273 mm 30 mm 2.6 kg375 mm 273 mm 29.5 mm 2.7 kg350 mm 293 mm 34.9 mm 2.9 kg347 mm 244.5 mm 32.9 mm 2.8 kg351 mm 244 mm 21.95 mm 1.8 kg297 mm 210 mm 1 mm 5.7 g

Connettività - Ora con più porte USB-C

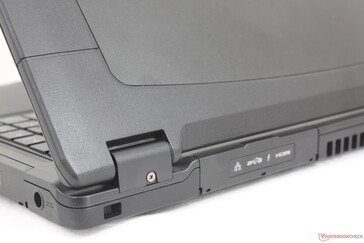
La varietà di porte è eccellente, con il ritorno di tutte le stesse opzioni del modello più spesso S15AB. La cosa più notevole è l'aggiunta di una seconda porta USB-C per il supporto Thunderbolt e il pratico slot ODD per lo scambio a caldo di memoria aggiuntiva o accessori specializzati. Si noti che mentre entrambe le porte USB-C supportano DisplayPort, solo la porta compatibile con Thunderbolt supporta Power Delivery per la ricarica dell'unità.

Gli sportelli protettivi che coprono le porte sono notevolmente più facili da aprire e chiudere rispetto agli sportelli di Getac S410. È un piccolo dettaglio che rende il Durabook un po' più facile da usare sul campo.

Anteriore: Nessuna porta
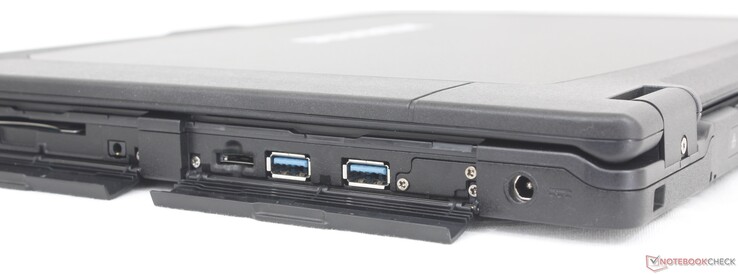
A destra: Lettore di Smart Card, cuffie da 3,5 mm, lettore MicroSD, 2x USB-A 3.2 Gen. 2, adattatore CA
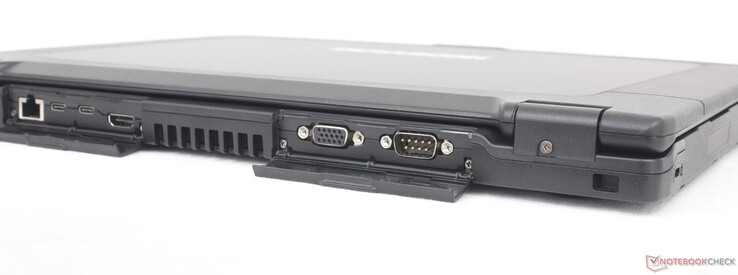
Posteriore: RJ-45 (1 Gbps), USB-C 3.2 Gen. 2 con DisplayPort, USB-C con Thunderbolt 4 + DisplayPort + Power Delivery, HDMI, VGA, Seriale RS232
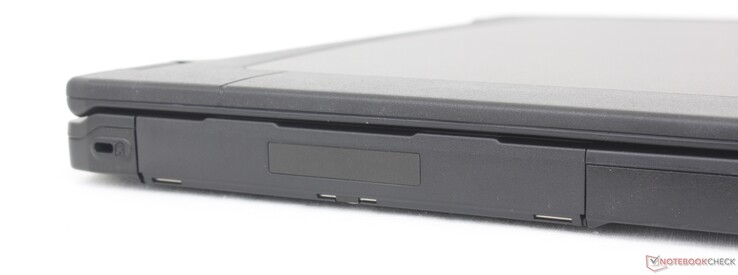
Blocco Kensington, porta docking laterale

Lettore di schede SD

Le velocità di trasferimento della scheda SD non sono migliorate. Consigliamo di dare un'occhiata alla serie Dell Latitude serie Rugged che tendono a integrare lettori di schede SD molto più veloci, se la velocità di trasferimento è una priorità.

SD Card Reader
average JPG Copy Test (av. of 3 runs)
Dell Latitude 5420 Rugged-P85G
Intel Core i7-8650U (Toshiba Exceria Pro SDXC 64 GB UHS-II)
182.9 MB/s +504%
Getac S410 G5
Intel Core i5-1350P (AV Pro V60)
83.4 MB/s +175%
Panasonic Toughbook 40
Intel Core i7-1185G7 (AV Pro V60)
70.8 MB/s +134%
Durabook S15ABG2
Intel Core i5-8265U (Toshiba Exceria Pro SDXC 64 GB UHS-II)
69.3 MB/s +129%
Durabook S15
Intel Core i7-1255U (AV Pro V60)
30.3 MB/s
Acer Enduro Urban N3 EUN314
Intel Core i7-1165G7 (AV Pro V60)
22.9 MB/s -24%
maximum AS SSD Seq Read Test (1GB)
Dell Latitude 5420 Rugged-P85G
Intel Core i7-8650U (Toshiba Exceria Pro SDXC 64 GB UHS-II)
228.8 MB/s +165%
Getac S410 G5
Intel Core i5-1350P (AV Pro V60)
89.2 MB/s +3%
Durabook S15
Intel Core i7-1255U (AV Pro V60)
86.4 MB/s
Durabook S15ABG2
Intel Core i5-8265U (Toshiba Exceria Pro SDXC 64 GB UHS-II)
84.4 MB/s -2%
Panasonic Toughbook 40
Intel Core i7-1185G7 (AV Pro V60)
81.1 MB/s -6%
Acer Enduro Urban N3 EUN314
Intel Core i7-1165G7 (AV Pro V60)
25.8 MB/s -70%

Comunicazione

La nostra unità viene fornita con un Intel AX211 per la connettività Wi-Fi 6E e Bluetooth 5.3. Le velocità di trasferimento sono eccellenti e sorprendentemente costanti quando viene accoppiata al nostro router di prova Asus AXE11000.

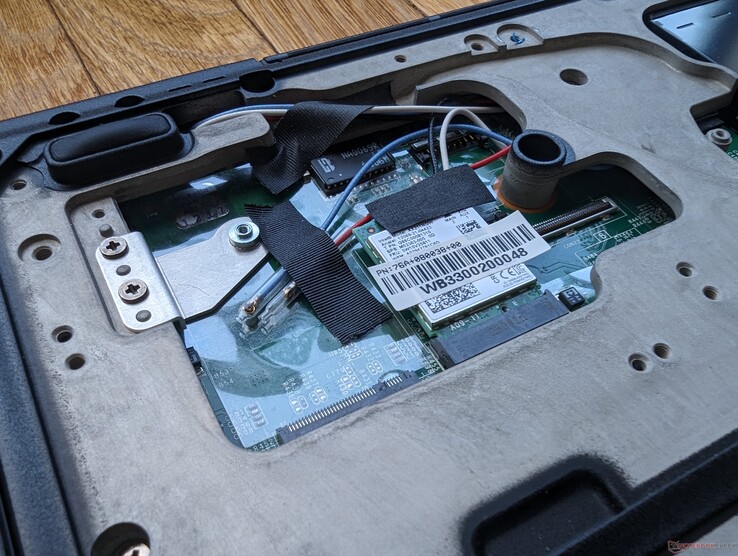
Modulo WLAN rimovibile. Sono incluse antenne extra per l'installazione del modulo WAN
Networking
iperf3 transmit AX12
Acer Enduro Urban N3 EUN314
Intel Wi-Fi 6 AX201
1396 (1280min - 1515max) MBit/s
Durabook S15ABG2
Intel Wireless-AC 9260
1048 (1000min - 1089max) MBit/s
Dell Latitude 5420 Rugged-P85G
Intel Dual Band Wireless-AC 8265
540 MBit/s
iperf3 receive AX12
Acer Enduro Urban N3 EUN314
Intel Wi-Fi 6 AX201
1487 (1396min - 1542max) MBit/s
Durabook S15ABG2
Intel Wireless-AC 9260
1154 (1110min - 1202max) MBit/s
Dell Latitude 5420 Rugged-P85G
Intel Dual Band Wireless-AC 8265
652 MBit/s
iperf3 transmit AXE11000
Durabook S15
Intel Wi-Fi 6E AX211
1453 (1249min - 1585max) MBit/s
Panasonic Toughbook 40
Intel Wi-Fi 6 AX201
1334 (1089min - 1419max) MBit/s -8%
Getac S410 G5
Intel Wi-Fi 6E AX211
823 (671min - 889max) MBit/s -43%
iperf3 receive AXE11000
Panasonic Toughbook 40
Intel Wi-Fi 6 AX201
1417 (1197min - 1475max) MBit/s +17%
Durabook S15
Intel Wi-Fi 6E AX211
1215 (1035min - 1300max) MBit/s
Getac S410 G5
Intel Wi-Fi 6E AX211
830 (793min - 859max) MBit/s -32%
iperf3 transmit AXE11000 6GHz
Durabook S15
Intel Wi-Fi 6E AX211
1433 (1287min - 1482max) MBit/s
Getac S410 G5
Intel Wi-Fi 6E AX211
1065 (1007min - 1126max) MBit/s -26%
iperf3 receive AXE11000 6GHz
Durabook S15
Intel Wi-Fi 6E AX211
1447 (1427min - 1471max) MBit/s
Getac S410 G5
Intel Wi-Fi 6E AX211
1189 (1091min - 1291max) MBit/s -18%
0501001502002503003504004505005506006507007508008509009501000105011001150120012501300135014001450Tooltip
Durabook S15; iperf3 transmit AXE11000 6GHz; iperf 3.1.3: Ø1433 (1287-1482)
Durabook S15; iperf3 receive AXE11000 6GHz; iperf 3.1.3: Ø1447 (1427-1471)

Webcam

La webcam può essere configurata a 2 MP, 5 MP o nessuna, a seconda dell'applicazione dell'utente. La nostra unità include un sensore da 5 MP con IR integrato per il supporto di Hello. L'otturatore scorrevole fisico è di serie per la privacy.
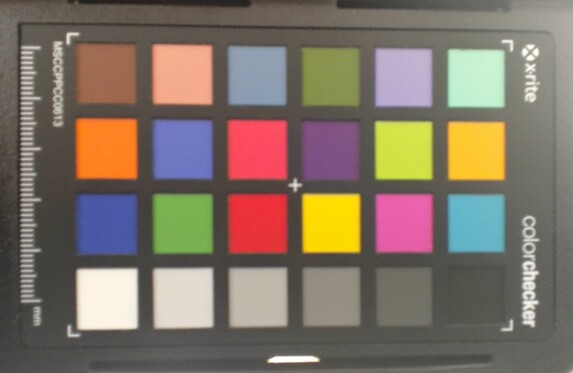
ColorChecker
12.5 ∆E
10.3 ∆E
13.1 ∆E
17.6 ∆E
16.2 ∆E
16.5 ∆E
7.8 ∆E
11.7 ∆E
11.1 ∆E
8.8 ∆E
11.6 ∆E
10.3 ∆E
9 ∆E
12 ∆E
12.6 ∆E
5.2 ∆E
10.1 ∆E
17 ∆E
6.8 ∆E
7.6 ∆E
9.8 ∆E
9.9 ∆E
11.3 ∆E
11.9 ∆E
ColorChecker Durabook S15: 11.27 ∆E min: 5.15 - max: 17.63 ∆E

Manutenzione

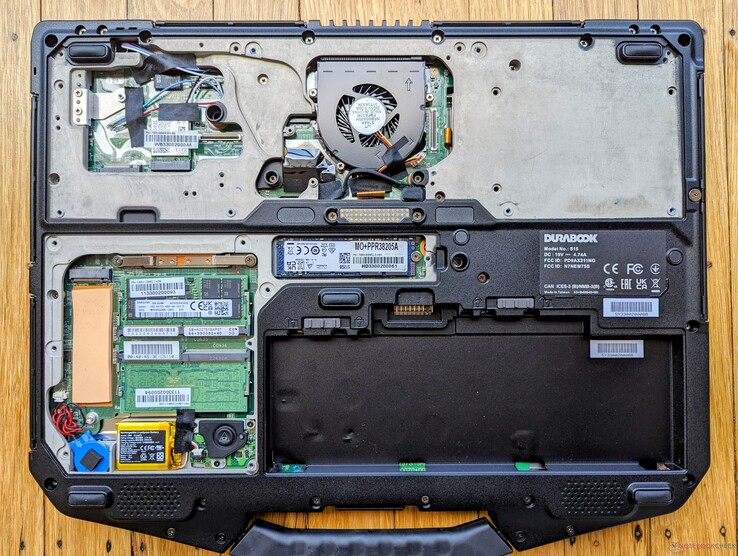
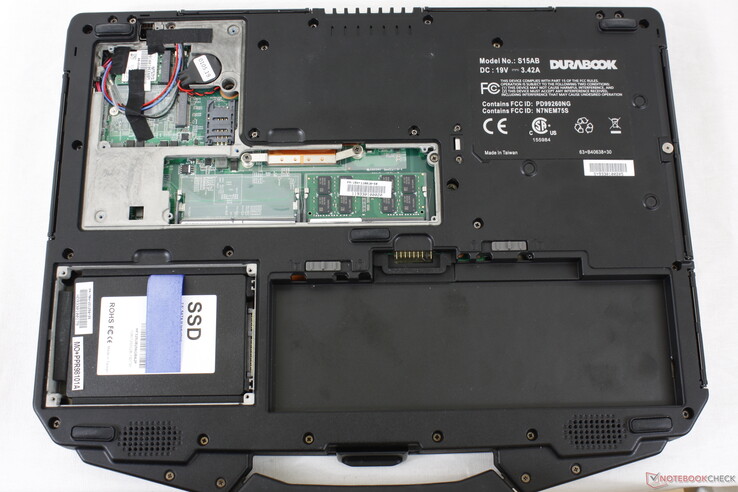
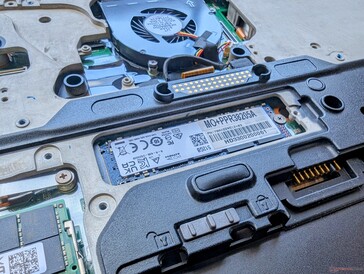
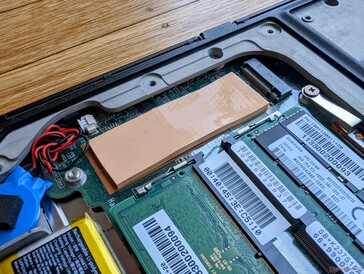
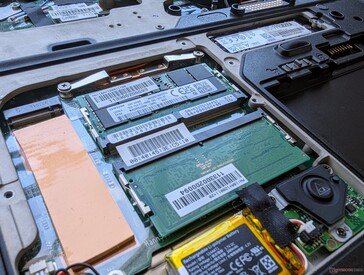
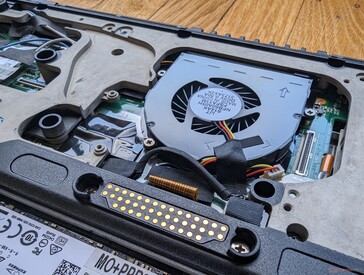
Il lato inferiore (pannello D) è stato quasi completamente ridisegnato. È sparito il vecchio slot SATA III da 2,5 pollici a favore di uno slot secondario M.2 2280, mentre la ventola interna è ora molto più facile da raggiungere per la pulizia o la manutenzione.

2024 Durabook S15
2024 Durabook S15
2020 Durabook S15AB G2 a confronto

Accessori e garanzia

Durabook offre diversi accessori opzionali, tra cui alloggiamenti multimediali di espansione, adattatori per auto, docking station e batterie di ricambio. Si noti che non ci sono penna o stilo, poiché il touchscreen non è un'opzione.

La garanzia limitata di tre anni del produttore è standard.

Dispositivi di input - Tastiera scadente abbinata a un ottimo touchpad

Tastiera

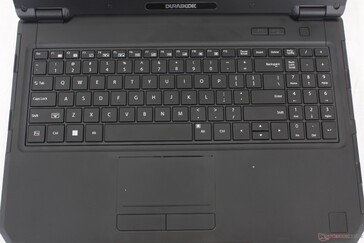
La tastiera, purtroppo, è un misto di cose. Pur essendo spaziosa e dotata di un tastierino numerico integrato, il feedback dei tasti è debole e la corsa è troppo bassa, anche se paragonata a quella di laptop più sottili di livello consumer come HP Pavilion o Lenovo IdeaPad. Il tasto Spazio, in particolare, risulta spugnoso quando viene premuto, mentre tradizionalmente è più solido e più cliccabile dei tasti QWERTY principali. Anche la già citata deformazione quando si preme sul tastierino numerico non aiuta il feedback dei tasti. La digitazione può quindi risultare insoddisfacente sull'S15.

Touchpad

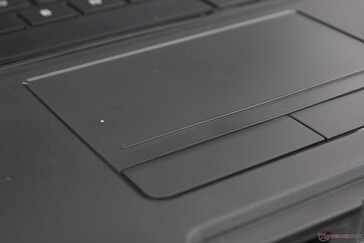
L'area utilizzabile del touchpad è identica a quella del touchpad del 2020 S15AB, con 10 x 5 cm. Dobbiamo dire "utilizzabile" perché la superficie effettiva del trackpad sembra leggermente più grande, ma la sezione stretta tra la barra in rilievo e i pulsanti del mouse dedicati è solo spazio morto. La superficie è leggermente strutturata, con un'eccellente reattività, mentre i trackpad di altri computer portatili rugged, come Getac S410 o Panasonic Toughbook 40 possono spesso saltare o registrare male gli input. Questo è uno dei trackpad migliori che abbiamo visto per la categoria.

Nel frattempo, i pulsanti del mouse dedicati sono solidi e rumorosi quando vengono premuti, per una sensazione soddisfacente. La corsa avrebbe potuto essere un po' più profonda, tuttavia.

La tastiera rivista è ora più facile da sostituire e include un tastierino numerico integrato
la retroilluminazione dei tasti è rossa anziché bianca, per facilitare la vista se si digita al buio
Il touchpad è più piccolo di quanto sembri, poiché la sottile regione sopra i pulsanti del mouse integrati è solo spazio morto
I tasti Numpad sono più elastici rispetto ai tasti QWERTY principali

Display - Luminoso IPS a 1000 nit

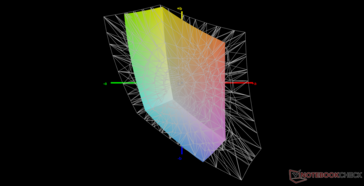
L'S15 è il primo modello del nostro database a montare il pannello IPS HKC MB156CS01'2. Si tratta di un miglioramento significativo rispetto al pannello TN Chi Mei del vecchio S15ABG2 in termini di angoli di visione, contrasto e luminosità. Si tratta di un miglioramento significativo rispetto al pannello Chi Mei TN del vecchio S15ABG2 in termini di angoli di visione, contrasto e luminosità, mentre altri aspetti come i tempi di risposta e i colori sono in gran parte gli stessi. Altri modelli rugged come Dell Latitude 5420 Rugged o Acer Enduro Urban offrono pannelli con una maggiore copertura sRGB per colori più vivaci.
Il display extra-luminoso da 1000 nit presenta una moderata e irregolare retroilluminazione lungo i bordi
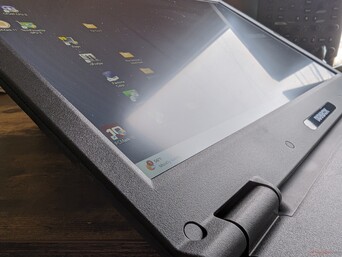
Nessuna protezione in vetro edge-to-edge o opzioni touchscreen
Cornici laterali strette per un dispositivo robusto
La sovrapposizione opaca è più granulosa rispetto alla maggior parte dei computer portatili consumer, ma è ancora relativamente nitida se si considera la categoria rugged
973.1
cd/m²
1023.6
cd/m²
1018.7
cd/m²
982.9
cd/m²
1087.3
cd/m²
1042.6
cd/m²
945.7
cd/m²
915.9
cd/m²
982.8
cd/m²
Distribuzione della luminosità
HKC MY MB156CS01'2 tested with X-Rite i1Pro 2
Massima: 1087.3 cd/m² (Nits) Media: 997 cd/m² Minimum: 51.9 cd/m²
Distribuzione della luminosità: 84 %
Al centro con la batteria: 1087.3 cd/m²
Contrasto: 1066:1 (Nero: 1.02 cd/m²)
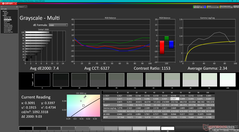
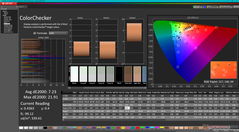
ΔE Color 7.23 | 0.5-29.43 Ø4.92, calibrated: 4.14
ΔE Greyscale 7.4 | 0.5-98 Ø5.2
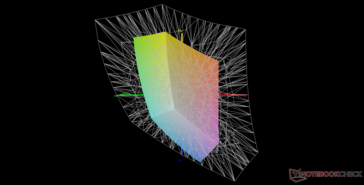
41.2% AdobeRGB 1998 (Argyll 2.2.0 3D)
59% sRGB (Argyll 2.2.0 3D)
39.9% Display P3 (Argyll 2.2.0 3D)
Gamma: 2.34
Durabook S15
HKC MY MB156CS01'2, IPS, 1920x1080, 15.6"
Durabook S15ABG2
Chi Mei N156HGE-EA2, TN LED, 1920x1080, 15.6"
Panasonic Toughbook 40
InfoVision M140NWF5 R3, IPS, 1920x1080, 14"
Getac S410 G5
CSOT T9 SNE001BS1-1, IPS, 1920x1080, 14"
Dell Latitude 5420 Rugged-P85G
AU Optronics AUO523D, IPS, 1920x1080, 14"
Acer Enduro Urban N3 EUN314
XR140EA6T, IPS, 1920x1080, 14"
Display
29%
-10%
-3%
57%
58%
Display P3 Coverage
39.9
51.4
29%
35.8
-10%
38.5
-4%
62.5
57%
63.5
59%
sRGB Coverage
59
77.1
31%
53.8
-9%
57.9
-2%
92.4
57%
91.9
56%
AdobeRGB 1998 Coverage
41.2
52.9
28%
37
-10%
39.8
-3%
64.2
56%
65.5
59%
Response Times
-15%
-28%
45%
-64%
-20%
Response Time Grey 50% / Grey 80% *
22.4 ?(10, 12.4)
24.4 ?(12.8, 11.6)
-9%
50.4 ?(24.4, 26)
-125%
29 ?(14.6, 14.4)
-29%
68 ?(34, 34)
-204%
56 ?(25.2, 30.8)
-150%
Response Time Black / White *
14.5 ?(7, 7.5)
19.6 ?(14.4, 5.2)
-35%
27.6 ?(14.4, 13.2)
-90%
18.6 ?(9.4, 9.2)
-28%
33.6 ?(18.8, 14.8)
-132%
35.2 ?(16.4, 18.8)
-143%
PWM Frequency
300 ?(99)
301.2 ?(99)
0%
694.4 ?(99)
131%
876 ?(100)
192%
735 ?(100)
145%
1000 ?(99)
233%
Screen
-31%
28%
16%
24%
6%
Brightness middle
1087.3
284.8
-74%
1284.3
18%
958.4
-12%
1111.7
2%
487.8
-55%
Brightness
997
267
-73%
1289
29%
978
-2%
1026
3%
464
-53%
Brightness Distribution
84
86
2%
82
-2%
86
2%
80
-5%
89
6%
Black Level *
1.02
0.7
31%
0.89
13%
0.96
6%
0.81
21%
0.48
53%
Contrast
1066
407
-62%
1443
35%
998
-6%
1372
29%
1016
-5%
Colorchecker dE 2000 *
7.23
11.48
-59%
4.67
35%
4.95
32%
3.83
47%
6.51
10%
Colorchecker dE 2000 max. *
21.91
19.71
10%
19.85
9%
16.88
23%
7.85
64%
11.36
48%
Colorchecker dE 2000 calibrated *
4.14
3.06
26%
2.21
47%
1.96
53%
2.98
28%
1.77
57%
Greyscale dE 2000 *
7.4
13.2
-78%
2.7
64%
3.9
47%
5.6
24%
7.8
-5%
Gamma
2.34 94%
2.09 105%
1.97 112%
2.14 103%
2.306 95%
2.28 96%
CCT
6327 103%
14566 45%
6222 104%
7174 91%
7676 85%
8102 80%
Color Space (Percent of AdobeRGB 1998)
48.8
59
Color Space (Percent of sRGB)
76.8
93
Media totale (Programma / Settaggio)
-6% / -16%
-3% / 9%
19% / 18%
6% / 13%
15% / 11%

* ... Meglio usare valori piccoli

rispetto a sRGB
rispetto a sRGB
contro P3
contro P3

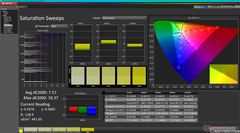
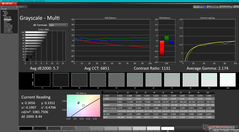
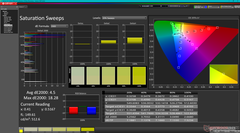
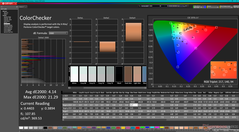
Il display viene fornito con una calibrazione inadeguata, con valori medi di deltaE della scala di grigi e del colore relativamente elevati, rispettivamente di 7,4 e 7,23. La calibrazione del display da parte nostra migliorerebbe un po' le cose, ma i colori diventano sempre più imprecisi all'aumentare del livello di saturazione, a causa della già citata copertura sRGB limitata. In ogni caso, i colori precisi di solito non sono una priorità su questi tipi di computer portatili.

Scala di grigi prima della calibrazione
Sweep di saturazione prima della calibrazione
ColorChecker prima della calibrazione
Scala di grigi dopo la calibrazione
Sweep di saturazione dopo la calibrazione
ColorChecker dopo la calibrazione

Tempi di risposta del Display

I tempi di risposta del display mostrano quanto sia veloce lo schermo a cambaire da un colore all'altro. Tempi di risposta lenti possono creare sovrapposizioni negloi oggetti in movimento. Specialmente i giocatori patiti del 3D dovrebbero usare uno schermo con tempi di risposta bassi.
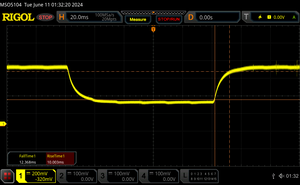
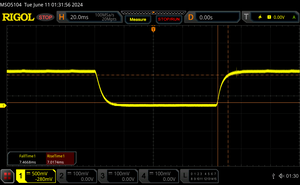
       Tempi di risposta dal Nero al Bianco
14.5 ms ... aumenta ↗ e diminuisce ↘ combinato↗ 7 ms Incremento
↘ 7.5 ms Calo
Lo schermo mostra buoni tempi di risposta durante i nostri tests, ma potrebbe essere troppo lento per i gamers competitivi.
In confronto, tutti i dispositivi di test variano da 0.1 (minimo) a 240 (massimo) ms. » 32 % di tutti i dispositivi è migliore.
Questo significa che i tempi di risposta rilevati sono migliori rispettto alla media di tutti i dispositivi testati (21 ms).
       Tempo di risposta dal 50% Grigio all'80% Grigio
22.4 ms ... aumenta ↗ e diminuisce ↘ combinato↗ 10 ms Incremento
↘ 12.4 ms Calo
Lo schermo mostra buoni tempi di risposta durante i nostri tests, ma potrebbe essere troppo lento per i gamers competitivi.
In confronto, tutti i dispositivi di test variano da 0.165 (minimo) a 636 (massimo) ms. » 30 % di tutti i dispositivi è migliore.
Questo significa che i tempi di risposta rilevati sono migliori rispettto alla media di tutti i dispositivi testati (32.9 ms).

Sfarfallio dello schermo / PWM (Pulse-Width Modulation)

Per ridurre la luminosità dello schermo, alcuni portatili accendono e spengono la retroilluminazione in rapida successione - un metodo chiamato Pulse Width Modulation (PWM). Questa frequenza di ciclo a livello ideale non dovrebbe essere percepibile dall'occhi umano. Se tale frequenza è troppo bassa, gli utenti con occhi sensibili potrebbero stancarsi gli occhi o avere mal di testa o anche notare uno sfarfallio.
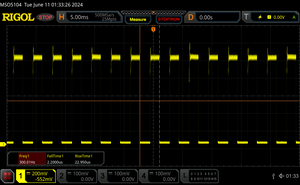
flickering dello schermo / PWM rilevato 300 Hz ≤ 99 % settaggio luminosita'

Il display sfarfalla a 300 Hz (Probabilmente a causa dell'uso di PWM) Flickering rilevato ad una luminosita' di 99 % o inferiore. Non dovrebbe verificarsi flickering o PWM sopra questo valore di luminosita'.

La frequenza di 300 Hz è relativamente elevata, quindi la maggioranza degli utenti sensibili al PWM non dovrebbe notare alcun flickering. Tuttavia, è stato segnalato che alcuni utenti sono sensibili al PWM a 500 Hz ed oltre, quindi prestate attenzione.

In confronto: 53 % di tutti i dispositivi testati non utilizza PWM per ridurre la luminosita' del display. Se è rilevato PWM, una media di 8746 (minimo: 5 - massimo: 343500) Hz è stata rilevata.

La modulazione di larghezza di impulso è presente su tutti i livelli di luminosità, tranne quello massimo. La sua frequenza è costante a 300 Hz da 0 a 99 percento di luminosità, il che significa che gli utenti sensibili allo sfarfallio sullo schermo potrebbero voler evitare di usare il Durabook per lunghi periodi di tempo.

luminosità al 100 percento
75 percento di luminosità
50 percento di luminosità
25 percento di luminosità
0 per cento di luminosità

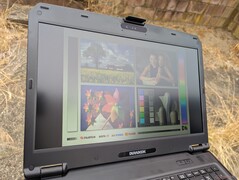
La visibilità all'aperto è eccellente quando è all'ombra e utilizzabile quando è alla luce del sole o in presenza di un cielo coperto. Sarà presente un po' di bagliore, ma la retroilluminazione a 1000 nit aiuta a mitigare la luminosità dell'ambiente per rendere i testi più facilmente leggibili.

All'aperto, con un cielo molto nuvoloso
All'aperto, all'ombra
All'aperto, con un cielo molto nuvoloso
Ampi angoli di visione IPS con degradazione del colore e del contrasto ad angoli estremi

Prestazioni - Intel 12th Gen con vPro


Condizioni del test

Abbiamo impostato Windows in modalità Prestazioni prima di eseguire i benchmark qui sotto.

Processore

Le prestazioni della CPU sono ben superiori a quelle del Core i5-8265U nel vecchio S15ABG2, come era prevedibile, e anche leggermente più veloce dei processori Core i7 Tiger Lake, come quelli presenti sul Panasonic Toughbook FZ o Acer Enduro Urban. D'altra parte, però, è anche sensibilmente più lento rispetto alla media dei computer portatili del nostro database, equipaggiati con gli stessi processori Core i7-1255U Di circa il 20-25%. Questo suggerisce che l'S15 utilizza il processore in modo conservativo per migliorare la coerenza e l'affidabilità delle prestazioni.

Per un aumento più significativo delle prestazioni, le consigliamo di dare un'occhiata al modello Getac S410 G5 che è dotato di opzioni di CPU Raptor Lake-P di 13a generazione per prestazioni multi-thread fino al 60-70% più veloci rispetto al nostro Core i7-1255U.

Cinebench R15 Multi Loop

09018027036045054063072081090099010801170126013501440153016201710Tooltip
Durabook S15 Intel Core i7-1255U: Ø905 (835.54-1016.39)
Durabook S15ABG2 Intel Core i5-8265U: Ø406 (400.88-461.45)
Panasonic Toughbook 40 Intel Core i7-1185G7: Ø709 (633.51-720.99)
Getac S410 G5 Intel Core i5-1350P: Ø1335 (1282.54-1777.86)
Dell Latitude 5420 Rugged-P85G Intel Core i7-8650U: Ø466 (461.37-494.52)
Acer Enduro Urban N3 EUN314 Intel Core i7-1165G7: Ø807 (480.95-841.33)
CPU Performance Rating: Percent
Cinebench R23: Multi Core | Single Core
Cinebench R20: CPU (Multi Core) | CPU (Single Core)
Cinebench R15: CPU Multi 64Bit | CPU Single 64Bit
Blender: v2.79 BMW27 CPU
7-Zip 18.03: 7z b 4 | 7z b 4 -mmt1
Geekbench 6.3: Multi-Core | Single-Core
Geekbench 5.5: Multi-Core | Single-Core
HWBOT x265 Benchmark v2.2: 4k Preset
LibreOffice : 20 Documents To PDF
R Benchmark 2.5: Overall mean
CPU Performance Rating
Getac S410 G5
Intel Core i5-1350P
89.2 pt
Media Intel Core i7-1255U
 
79.2 pt
Durabook S15
Intel Core i7-1255U
71.4 pt
Dell Latitude 7330 Rugged Extreme -2!
Intel Core i7-1185G7
64.7 pt
Acer Enduro Urban N3 EUN314 -2!
Intel Core i7-1165G7
61.3 pt
Panasonic Toughbook FZ-55 MK2 -4!
Intel Core i7-1185G7
60.7 pt
Getac S410 Gen 4 -2!
Intel Core i7-1185G7
59.9 pt
Panasonic Toughbook 40 -2!
Intel Core i7-1185G7
57.3 pt
Durabook S14I -2!
Intel Core i7-1165G7
54.6 pt
Getac B360 -3!
Intel Core i7-10710U
51.9 pt
Getac S410 -14!
Intel Core i7-8550U
48.2 pt
Dell Latitude 5420 Rugged-P85G -14!
Intel Core i7-8650U
41.6 pt
Durabook S15ABG2 -4!
Intel Core i5-8265U
35.3 pt
Cinebench R23 / Multi Core
Getac S410 G5
Intel Core i5-1350P
9844 (8909.23min - 9844.03max) Points +59%
Media Intel Core i7-1255U
  (5269 - 9628, n=10)
7996 Points +30%
Durabook S15
Intel Core i7-1255U
6174 (5729.63min - 6173.83max) Points
Dell Latitude 7330 Rugged Extreme
Intel Core i7-1185G7
5559 (5199.16min - 5559.2max) Points -10%
Panasonic Toughbook FZ-55 MK2
Intel Core i7-1185G7
5291 (5195.32min - 5290.58max) Points -14%
Acer Enduro Urban N3 EUN314
Intel Core i7-1165G7
5265 (4984.42min - 5264.54max) Points -15%
Getac S410 Gen 4
Intel Core i7-1185G7
5119 (4979.64min - 5119.05max) Points -17%
Panasonic Toughbook 40
Intel Core i7-1185G7
4766 (4659.62min - 4765.97max) Points -23%
Getac B360
Intel Core i7-10710U
4079 (3948.22min - 4079.14max) Points -34%
Durabook S14I
Intel Core i7-1165G7
3773 (3752.06min - 3773.43max) Points -39%
Cinebench R23 / Single Core
Getac S410 G5
Intel Core i5-1350P
1780 Points +26%
Media Intel Core i7-1255U
  (1408 - 1775, n=10)
1625 Points +15%
Dell Latitude 7330 Rugged Extreme
Intel Core i7-1185G7
1532 Points +9%
Panasonic Toughbook FZ-55 MK2
Intel Core i7-1185G7
1418 Points +1%
Acer Enduro Urban N3 EUN314
Intel Core i7-1165G7
1413 Points 0%
Getac S410 Gen 4
Intel Core i7-1185G7
1408 Points 0%
Durabook S15
Intel Core i7-1255U
1408 Points
Panasonic Toughbook 40
Intel Core i7-1185G7
1380 Points -2%
Durabook S14I
Intel Core i7-1165G7
1366 Points -3%
Getac B360
Intel Core i7-10710U
863 Points -39%
Cinebench R20 / CPU (Multi Core)
Getac S410 G5
Intel Core i5-1350P
3853 Points +61%
Media Intel Core i7-1255U
  (2095 - 3702, n=10)
3044 Points +27%
Durabook S15
Intel Core i7-1255U
2391 Points
Dell Latitude 7330 Rugged Extreme
Intel Core i7-1185G7
2083 Points -13%
Panasonic Toughbook FZ-55 MK2
Intel Core i7-1185G7
2052 Points -14%
Acer Enduro Urban N3 EUN314
Intel Core i7-1165G7
2035 Points -15%
Getac S410 Gen 4
Intel Core i7-1185G7
1973 Points -17%
Panasonic Toughbook 40
Intel Core i7-1185G7
1841 Points -23%
Getac B360
Intel Core i7-10710U
1568 Points -34%
Durabook S14I
Intel Core i7-1165G7
1466 Points -39%
Durabook S15ABG2
Intel Core i5-8265U
972 Points -59%
Cinebench R20 / CPU (Single Core)
Getac S410 G5
Intel Core i5-1350P
680 Points +9%
Media Intel Core i7-1255U
  (550 - 682, n=10)
634 Points +1%
Durabook S15
Intel Core i7-1255U
625 Points
Dell Latitude 7330 Rugged Extreme
Intel Core i7-1185G7
588 Points -6%
Acer Enduro Urban N3 EUN314
Intel Core i7-1165G7
546 Points -13%
Panasonic Toughbook FZ-55 MK2
Intel Core i7-1185G7
545 Points -13%
Getac S410 Gen 4
Intel Core i7-1185G7
542 Points -13%
Durabook S14I
Intel Core i7-1165G7
536 Points -14%
Panasonic Toughbook 40
Intel Core i7-1185G7
526 Points -16%
Getac B360
Intel Core i7-10710U
429 Points -31%
Durabook S15ABG2
Intel Core i5-8265U
401 Points -36%
Cinebench R15 / CPU Multi 64Bit
Getac S410 G5
Intel Core i5-1350P
1778 (1282.54min - 1777.86max) Points +75%
Media Intel Core i7-1255U
  (919 - 1577, n=10)
1330 Points +31%
Durabook S15
Intel Core i7-1255U
1016 (835.54min - 1016.39max) Points
Acer Enduro Urban N3 EUN314
Intel Core i7-1165G7
841 (480.95min - 841.33max) Points -17%
Dell Latitude 7330 Rugged Extreme
Intel Core i7-1185G7
839 (794.12min - 838.68max) Points -17%
Panasonic Toughbook FZ-55 MK2
Intel Core i7-1185G7
812 (789.97min - 811.61max) Points -20%
Getac S410 Gen 4
Intel Core i7-1185G7
787 (745.67min - 787.01max) Points -23%
Panasonic Toughbook 40
Intel Core i7-1185G7
721 (633.51min - 720.99max) Points -29%
Getac B360
Intel Core i7-10710U
665 (654.44min - 664.93max) Points -35%
Durabook S14I
Intel Core i7-1165G7
599 (571.89min - 599.28max) Points -41%
Getac S410
Intel Core i7-8550U
539 Points -47%
Durabook S15ABG2
Intel Core i5-8265U
461 (400.88min - 461.45max) Points -55%
Dell Latitude 5420 Rugged-P85G
Intel Core i7-8650U
451 Points -56%
Cinebench R15 / CPU Single 64Bit
Getac S410 G5
Intel Core i5-1350P
247 Points +8%
Durabook S15
Intel Core i7-1255U
229 Points
Media Intel Core i7-1255U
  (161 - 251, n=11)
229 Points 0%
Dell Latitude 7330 Rugged Extreme
Intel Core i7-1185G7
226 Points -1%
Panasonic Toughbook FZ-55 MK2
Intel Core i7-1185G7
225 Points -2%
Acer Enduro Urban N3 EUN314
Intel Core i7-1165G7
214 Points -7%
Getac S410 Gen 4
Intel Core i7-1185G7
211 Points -8%
Durabook S14I
Intel Core i7-1165G7
208 Points -9%
Panasonic Toughbook 40
Intel Core i7-1185G7
203 Points -11%
Getac B360
Intel Core i7-10710U
176 Points -23%
Getac S410
Intel Core i7-8550U
163 Points -29%
Durabook S15ABG2
Intel Core i5-8265U
161 Points -30%
Dell Latitude 5420 Rugged-P85G
Intel Core i7-8650U
143 Points -38%
Blender / v2.79 BMW27 CPU
Durabook S15ABG2
Intel Core i5-8265U
1098 Seconds * -108%
Durabook S14I
Intel Core i7-1165G7
777 Seconds * -47%
Getac B360
Intel Core i7-10710U
651 Seconds * -24%
Panasonic Toughbook 40
Intel Core i7-1185G7
630 Seconds * -20%
Getac S410 Gen 4
Intel Core i7-1185G7
588 Seconds * -12%
Panasonic Toughbook FZ-55 MK2
Intel Core i7-1185G7
567 Seconds * -8%
Acer Enduro Urban N3 EUN314
Intel Core i7-1165G7
567 Seconds * -8%
Dell Latitude 7330 Rugged Extreme
Intel Core i7-1185G7
567 Seconds * -8%
Durabook S15
Intel Core i7-1255U
527 Seconds *
Media Intel Core i7-1255U
  (372 - 601, n=10)
430 Seconds * +18%
Getac S410 G5
Intel Core i5-1350P
374 Seconds * +29%
7-Zip 18.03 / 7z b 4
Getac S410 G5
Intel Core i5-1350P
36404 MIPS +40%
Media Intel Core i7-1255U
  (24126 - 37365, n=10)
33261 MIPS +28%
Durabook S15
Intel Core i7-1255U
26011 MIPS
Acer Enduro Urban N3 EUN314
Intel Core i7-1165G7
24357 MIPS -6%
Dell Latitude 7330 Rugged Extreme
Intel Core i7-1185G7
24300 MIPS -7%
Panasonic Toughbook FZ-55 MK2
Intel Core i7-1185G7
23797 MIPS -9%
Getac S410 Gen 4
Intel Core i7-1185G7
22829 MIPS -12%
Getac B360
Intel Core i7-10710U
21871 MIPS -16%
Panasonic Toughbook 40
Intel Core i7-1185G7
21244 MIPS -18%
Durabook S14I
Intel Core i7-1165G7
18625 MIPS -28%
Durabook S15ABG2
Intel Core i5-8265U
13731 MIPS -47%
7-Zip 18.03 / 7z b 4 -mmt1
Dell Latitude 7330 Rugged Extreme
Intel Core i7-1185G7
5332 MIPS +5%
Acer Enduro Urban N3 EUN314
Intel Core i7-1165G7
5322 MIPS +5%
Media Intel Core i7-1255U
  (5059 - 5529, n=10)
5284 MIPS +4%
Panasonic Toughbook FZ-55 MK2
Intel Core i7-1185G7
5266 MIPS +4%
Durabook S14I
Intel Core i7-1165G7
5257 MIPS +4%
Getac S410 G5
Intel Core i5-1350P
5150 MIPS +2%
Durabook S15
Intel Core i7-1255U
5059 MIPS
Panasonic Toughbook 40
Intel Core i7-1185G7
4989 MIPS -1%
Getac S410 Gen 4
Intel Core i7-1185G7
4979 MIPS -2%
Getac B360
Intel Core i7-10710U
4676 MIPS -8%
Durabook S15ABG2
Intel Core i5-8265U
4154 MIPS -18%
Geekbench 6.3 / Multi-Core
Getac S410 G5
Intel Core i5-1350P
9204 Points +16%
Durabook S15
Intel Core i7-1255U
7914 Points
Media Intel Core i7-1255U
  ()
7914 Points 0%
Geekbench 6.3 / Single-Core
Getac S410 G5
Intel Core i5-1350P
2435 Points +5%
Durabook S15
Intel Core i7-1255U
2313 Points
Media Intel Core i7-1255U
  ()
2313 Points 0%
Geekbench 5.5 / Multi-Core
Getac S410 G5
Intel Core i5-1350P
8585 Points +23%
Media Intel Core i7-1255U
  (4463 - 8821, n=11)
7283 Points +5%
Durabook S15
Intel Core i7-1255U
6960 Points
Dell Latitude 7330 Rugged Extreme
Intel Core i7-1185G7
5550 Points -20%
Acer Enduro Urban N3 EUN314
Intel Core i7-1165G7
5352 Points -23%
Getac S410 Gen 4
Intel Core i7-1185G7
4963 Points -29%
Panasonic Toughbook 40
Intel Core i7-1185G7
4620 Points -34%
Getac B360
Intel Core i7-10710U
4575 Points -34%
Durabook S14I
Intel Core i7-1165G7
4284 Points -38%
Durabook S15ABG2
Intel Core i5-8265U
3442 Points -51%
Geekbench 5.5 / Single-Core
Getac S410 G5
Intel Core i5-1350P
1718 Points +2%
Durabook S15
Intel Core i7-1255U
1682 Points
Media Intel Core i7-1255U
  (1560 - 1712, n=11)
1644 Points -2%
Dell Latitude 7330 Rugged Extreme
Intel Core i7-1185G7
1555 Points -8%
Acer Enduro Urban N3 EUN314
Intel Core i7-1165G7
1548 Points -8%
Durabook S14I
Intel Core i7-1165G7
1517 Points -10%
Getac S410 Gen 4
Intel Core i7-1185G7
1466 Points -13%
Panasonic Toughbook 40
Intel Core i7-1185G7
1451 Points -14%
Getac B360
Intel Core i7-10710U
1225 Points -27%
Durabook S15ABG2
Intel Core i5-8265U
1043 Points -38%
HWBOT x265 Benchmark v2.2 / 4k Preset
Getac S410 G5
Intel Core i5-1350P
10.6 fps +53%
Media Intel Core i7-1255U
  (6.31 - 10.1, n=10)
9 fps +30%
Dell Latitude 7330 Rugged Extreme
Intel Core i7-1185G7
7.16 fps +4%
Durabook S15
Intel Core i7-1255U
6.91 fps
Panasonic Toughbook FZ-55 MK2
Intel Core i7-1185G7
6.87 fps -1%
Acer Enduro Urban N3 EUN314
Intel Core i7-1165G7
6.78 fps -2%
Getac S410 Gen 4
Intel Core i7-1185G7
6.64 fps -4%
Panasonic Toughbook 40
Intel Core i7-1185G7
6.2 fps -10%
Getac B360
Intel Core i7-10710U
5.58 fps -19%
Durabook S14I
Intel Core i7-1165G7
5.02 fps -27%
Durabook S15ABG2
Intel Core i5-8265U
3.38 fps -51%
LibreOffice / 20 Documents To PDF
Durabook S15ABG2
Intel Core i5-8265U
67.8 s * -29%
Acer Enduro Urban N3 EUN314
Intel Core i7-1165G7
63.1 s * -20%
Panasonic Toughbook 40
Intel Core i7-1185G7
52.9 s * -1%
Durabook S15
Intel Core i7-1255U
52.5 s *
Getac S410 Gen 4
Intel Core i7-1185G7
52 s * +1%
Dell Latitude 7330 Rugged Extreme
Intel Core i7-1185G7
50.2 s * +4%
Panasonic Toughbook FZ-55 MK2
Intel Core i7-1185G7
49.4 s * +6%
Media Intel Core i7-1255U
  (44.5 - 52.5, n=10)
49.3 s * +6%
Durabook S14I
Intel Core i7-1165G7
45 s * +14%
Getac S410 G5
Intel Core i5-1350P
44.3 s * +16%
R Benchmark 2.5 / Overall mean
Durabook S15ABG2
Intel Core i5-8265U
0.72 sec * -45%
Getac B360
Intel Core i7-10710U
0.674 sec * -36%
Panasonic Toughbook 40
Intel Core i7-1185G7
0.608 sec * -23%
Getac S410 Gen 4
Intel Core i7-1185G7
0.607 sec * -22%
Durabook S14I
Intel Core i7-1165G7
0.601 sec * -21%
Acer Enduro Urban N3 EUN314
Intel Core i7-1165G7
0.577 sec * -16%
Panasonic Toughbook FZ-55 MK2
Intel Core i7-1185G7
0.572 sec * -15%
Dell Latitude 7330 Rugged Extreme
Intel Core i7-1185G7
0.571 sec * -15%
Media Intel Core i7-1255U
  (0.4688 - 0.558, n=10)
0.502 sec * -1%
Getac S410 G5
Intel Core i5-1350P
0.4987 sec * -1%
Durabook S15
Intel Core i7-1255U
0.4958 sec *
CPU Performance Rating: Percent
Cinebench R23: Multi Core | Single Core
Cinebench R20: CPU (Multi Core) | CPU (Single Core)
Cinebench R15: CPU Multi 64Bit | CPU Single 64Bit
Blender: v2.79 BMW27 CPU
7-Zip 18.03: 7z b 4 | 7z b 4 -mmt1
Geekbench 6.3: Multi-Core | Single-Core
Geekbench 5.5: Multi-Core | Single-Core
HWBOT x265 Benchmark v2.2: 4k Preset
LibreOffice : 20 Documents To PDF
R Benchmark 2.5: Overall mean

* ... Meglio usare valori piccoli

Cinebench R15 CPU Multi 64Bit
1016 Points
Cinebench R15 OpenGL 64Bit
99.8 fps
Cinebench R15 Ref. Match 64Bit
97.8 %
Cinebench R15 CPU Single 64Bit
229 Points
Cinebench R20 CPU (Multi Core)
2391 Points
Cinebench R20 CPU (Single Core)
625 Points
Cinebench R23 Single Core
1408 Points
Cinebench R23 Multi Core
6174 Points
Aiuto
Performance Rating
Getac S410 G5
Intel Core i5-1350P, Iris Xe G7 80EUs
96.6 pt
Media Intel Core i7-1255U
 
78 pt
Acer Enduro Urban N3 EUN314
Intel Core i7-1165G7, Iris Xe G7 96EUs
77 pt
Durabook S15
Intel Core i7-1255U, Iris Xe G7 96EUs
64.6 pt
Panasonic Toughbook 40
Intel Core i7-1185G7, Iris Xe G7 96EUs
61.5 pt
Durabook S15ABG2
Intel Core i5-8265U, UHD Graphics 620
37.9 pt
AIDA64 / FP32 Ray-Trace
Getac S410 G5
Intel Core i5-1350P, Iris Xe G7 80EUs
8756 KRay/s +64%
Acer Enduro Urban N3 EUN314
Intel Core i7-1165G7, Iris Xe G7 96EUs
6904 KRay/s +30%
Media Intel Core i7-1255U
  (4313 - 8127, n=10)
6677 KRay/s +25%
Panasonic Toughbook 40
Intel Core i7-1185G7, Iris Xe G7 96EUs
5873 KRay/s +10%
Durabook S15
Intel Core i7-1255U, Iris Xe G7 96EUs
5323 KRay/s
Durabook S15ABG2
Intel Core i5-8265U, UHD Graphics 620
802 KRay/s -85%
AIDA64 / FPU Julia
Getac S410 G5
Intel Core i5-1350P, Iris Xe G7 80EUs
44727 Points +65%
Media Intel Core i7-1255U
  (19813 - 41353, n=10)
34070 Points +26%
Acer Enduro Urban N3 EUN314
Intel Core i7-1165G7, Iris Xe G7 96EUs
29711 Points +10%
Durabook S15
Intel Core i7-1255U, Iris Xe G7 96EUs
27082 Points
Panasonic Toughbook 40
Intel Core i7-1185G7, Iris Xe G7 96EUs
24570 Points -9%
Durabook S15ABG2
Intel Core i5-8265U, UHD Graphics 620
22366 Points -17%
AIDA64 / CPU SHA3
Getac S410 G5
Intel Core i5-1350P, Iris Xe G7 80EUs
2119 MB/s +52%
Acer Enduro Urban N3 EUN314
Intel Core i7-1165G7, Iris Xe G7 96EUs
1993 MB/s +43%
Media Intel Core i7-1255U
  (1325 - 2135, n=10)
1813 MB/s +30%
Panasonic Toughbook 40
Intel Core i7-1185G7, Iris Xe G7 96EUs
1615 MB/s +16%
Durabook S15
Intel Core i7-1255U, Iris Xe G7 96EUs
1395 MB/s
Durabook S15ABG2
Intel Core i5-8265U, UHD Graphics 620
1017 MB/s -27%
AIDA64 / CPU Queen
Getac S410 G5
Intel Core i5-1350P, Iris Xe G7 80EUs
83751 Points +36%
Media Intel Core i7-1255U
  (61375 - 65892, n=10)
64472 Points +5%
Durabook S15
Intel Core i7-1255U, Iris Xe G7 96EUs
61375 Points
Acer Enduro Urban N3 EUN314
Intel Core i7-1165G7, Iris Xe G7 96EUs
50412 Points -18%
Panasonic Toughbook 40
Intel Core i7-1185G7, Iris Xe G7 96EUs
45594 Points -26%
Durabook S15ABG2
Intel Core i5-8265U, UHD Graphics 620
44685 Points -27%
AIDA64 / FPU SinJulia
Getac S410 G5
Intel Core i5-1350P, Iris Xe G7 80EUs
6143 Points +64%
Acer Enduro Urban N3 EUN314
Intel Core i7-1165G7, Iris Xe G7 96EUs
4792 Points +28%
Media Intel Core i7-1255U
  (3577 - 5095, n=10)
4540 Points +21%
Panasonic Toughbook 40
Intel Core i7-1185G7, Iris Xe G7 96EUs
4027 Points +8%
Durabook S15ABG2
Intel Core i5-8265U, UHD Graphics 620
3890 Points +4%
Durabook S15
Intel Core i7-1255U, Iris Xe G7 96EUs
3746 Points
AIDA64 / FPU Mandel
Getac S410 G5
Intel Core i5-1350P, Iris Xe G7 80EUs
22212 Points +66%
Acer Enduro Urban N3 EUN314
Intel Core i7-1165G7, Iris Xe G7 96EUs
17742 Points +32%
Media Intel Core i7-1255U
  (11759 - 20187, n=10)
16981 Points +27%
Panasonic Toughbook 40
Intel Core i7-1185G7, Iris Xe G7 96EUs
14900 Points +11%
Durabook S15
Intel Core i7-1255U, Iris Xe G7 96EUs
13394 Points
Durabook S15ABG2
Intel Core i5-8265U, UHD Graphics 620
10896 Points -19%
AIDA64 / CPU AES
Acer Enduro Urban N3 EUN314
Intel Core i7-1165G7, Iris Xe G7 96EUs
66115 MB/s +131%
Getac S410 G5
Intel Core i5-1350P, Iris Xe G7 80EUs
43605 MB/s +52%
Media Intel Core i7-1255U
  (27900 - 67458, n=10)
39078 MB/s +36%
Panasonic Toughbook 40
Intel Core i7-1185G7, Iris Xe G7 96EUs
33966 MB/s +19%
Durabook S15
Intel Core i7-1255U, Iris Xe G7 96EUs
28641 MB/s
Durabook S15ABG2
Intel Core i5-8265U, UHD Graphics 620
15076 MB/s -47%
AIDA64 / CPU ZLib
Getac S410 G5
Intel Core i5-1350P, Iris Xe G7 80EUs
623 MB/s +47%
Media Intel Core i7-1255U
  (393 - 640, n=10)
539 MB/s +27%
Durabook S15
Intel Core i7-1255U, Iris Xe G7 96EUs
424 MB/s
Acer Enduro Urban N3 EUN314
Intel Core i7-1165G7, Iris Xe G7 96EUs
371 MB/s -12%
Panasonic Toughbook 40
Intel Core i7-1185G7, Iris Xe G7 96EUs
302 MB/s -29%
Durabook S15ABG2
Intel Core i5-8265U, UHD Graphics 620
269 MB/s -37%
AIDA64 / FP64 Ray-Trace
Getac S410 G5
Intel Core i5-1350P, Iris Xe G7 80EUs
4677 KRay/s +68%
Acer Enduro Urban N3 EUN314
Intel Core i7-1165G7, Iris Xe G7 96EUs
3741 KRay/s +34%
Media Intel Core i7-1255U
  (2474 - 4400, n=10)
3623 KRay/s +30%
Panasonic Toughbook 40
Intel Core i7-1185G7, Iris Xe G7 96EUs
3148 KRay/s +13%
Durabook S15
Intel Core i7-1255U, Iris Xe G7 96EUs
2787 KRay/s
Durabook S15ABG2
Intel Core i5-8265U, UHD Graphics 620
406 KRay/s -85%
AIDA64 / CPU PhotoWorxx
Getac S410 G5
Intel Core i5-1350P, Iris Xe G7 80EUs
35467 MPixel/s +7%
Durabook S15
Intel Core i7-1255U, Iris Xe G7 96EUs
33186 MPixel/s
Media Intel Core i7-1255U
  (13899 - 44054, n=10)
32417 MPixel/s -2%
Acer Enduro Urban N3 EUN314
Intel Core i7-1165G7, Iris Xe G7 96EUs
25825 MPixel/s -22%
Panasonic Toughbook 40
Intel Core i7-1185G7, Iris Xe G7 96EUs
22349 MPixel/s -33%
Durabook S15ABG2
Intel Core i5-8265U, UHD Graphics 620
11215 MPixel/s -66%

Test da sforzo

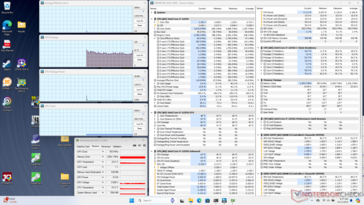
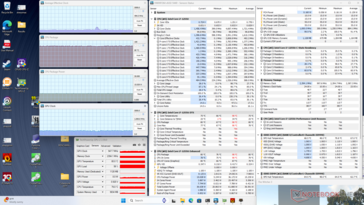
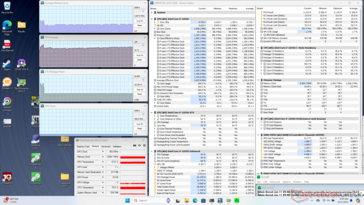
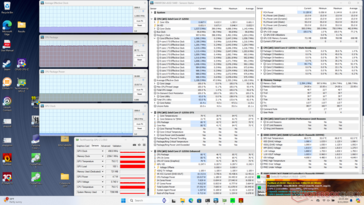
La CPU aumentava a 2,4 GHz e 34 W quando si avviava lo stress Prime95. Dopo aver raggiunto una temperatura del nucleo di 85 C pochi secondi dopo, tuttavia, il processore scendeva a 1,3 GHz e 15 W per mantenere una temperatura leggermente più fredda di 80 C. Questo intervallo di temperatura è simile a quello che abbiamo registrato sul 2020 S15ABG2.

Sistema inattivo
Sistema inattivo
Witcher 3 stress
Witcher 3 stress
Stress Prime95
Stress Prime95
Stress di Prime95+FurMark
Clock medio della CPU (GHz) Clock della GPU (MHz) Temperatura media della CPU (°C)
Sistema inattivo -- -- 60
Prime95 Stress 1,6 -- 76
Prime95 + FurMark Stress 1,1 499 80
Witcher 3 Stress 0,5 948 80

Prestazioni del sistema

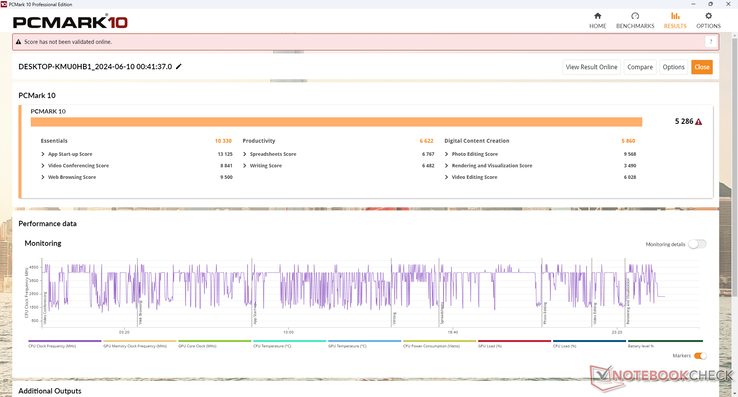
I punteggi di PCMark sono superiori alla maggior parte degli altri portatili rugged che utilizzano le vecchie piattaforme Intel di 11° o 10° generazione. Forse, in particolare, è molto più avanti rispetto al più vecchio 2020 S15ABG2 nel sottotest Creazione di contenuti digitali, dove le prestazioni della GPU sono più importanti.

PCMark 10 Standard
PCMark 10 Standard
PCMark 10 / Score
Getac S410 G5
Iris Xe G7 80EUs, i5-1350P, SSSTC CL4-8D512
5589 Points +6%
Media Intel Core i7-1255U, Intel Iris Xe Graphics G7 96EUs
  (4676 - 5523, n=9)
5313 Points +1%
Durabook S15
Iris Xe G7 96EUs, i7-1255U, Kingston OM8SEP4512Q-AA
5286 Points
Panasonic Toughbook 40
Iris Xe G7 96EUs, i7-1185G7, Samsung PM991 MZVLQ1T0HALB
4997 Points -5%
Durabook S14I
Iris Xe G7 96EUs, i7-1165G7, UDinfo M2P M2P80DE512GBAEP
4826 Points -9%
Acer Enduro Urban N3 EUN314
Iris Xe G7 96EUs, i7-1165G7, Samsung PM991 MZVLQ1T0HALB
4580 Points -13%
Dell Latitude 5420 Rugged-P85G
Radeon RX 540, i7-8650U, SK hynix PC401 NVMe 500 GB
4451 Points -16%
Durabook S15ABG2
UHD Graphics 620, i5-8265U, UDinfo HF3-25UB HF325UB256GBA2P
3699 Points -30%
PCMark 10 / Essentials
Media Intel Core i7-1255U, Intel Iris Xe Graphics G7 96EUs
  (9381 - 11654, n=9)
10367 Points 0%
Durabook S15
Iris Xe G7 96EUs, i7-1255U, Kingston OM8SEP4512Q-AA
10330 Points
Durabook S14I
Iris Xe G7 96EUs, i7-1165G7, UDinfo M2P M2P80DE512GBAEP
10076 Points -2%
Getac S410 G5
Iris Xe G7 80EUs, i5-1350P, SSSTC CL4-8D512
10033 Points -3%
Panasonic Toughbook 40
Iris Xe G7 96EUs, i7-1185G7, Samsung PM991 MZVLQ1T0HALB
9731 Points -6%
Acer Enduro Urban N3 EUN314
Iris Xe G7 96EUs, i7-1165G7, Samsung PM991 MZVLQ1T0HALB
9063 Points -12%
Dell Latitude 5420 Rugged-P85G
Radeon RX 540, i7-8650U, SK hynix PC401 NVMe 500 GB
8503 Points -18%
Durabook S15ABG2
UHD Graphics 620, i5-8265U, UDinfo HF3-25UB HF325UB256GBA2P
7854 Points -24%
PCMark 10 / Productivity
Dell Latitude 5420 Rugged-P85G
Radeon RX 540, i7-8650U, SK hynix PC401 NVMe 500 GB
7328 Points +11%
Getac S410 G5
Iris Xe G7 80EUs, i5-1350P, SSSTC CL4-8D512
7109 Points +7%
Durabook S14I
Iris Xe G7 96EUs, i7-1165G7, UDinfo M2P M2P80DE512GBAEP
6976 Points +5%
Media Intel Core i7-1255U, Intel Iris Xe Graphics G7 96EUs
  (6530 - 7418, n=9)
6902 Points +4%
Durabook S15
Iris Xe G7 96EUs, i7-1255U, Kingston OM8SEP4512Q-AA
6622 Points
Panasonic Toughbook 40
Iris Xe G7 96EUs, i7-1185G7, Samsung PM991 MZVLQ1T0HALB
6547 Points -1%
Durabook S15ABG2
UHD Graphics 620, i5-8265U, UDinfo HF3-25UB HF325UB256GBA2P
6154 Points -7%
Acer Enduro Urban N3 EUN314
Iris Xe G7 96EUs, i7-1165G7, Samsung PM991 MZVLQ1T0HALB
5842 Points -12%
PCMark 10 / Digital Content Creation
Getac S410 G5
Iris Xe G7 80EUs, i5-1350P, SSSTC CL4-8D512
6644 Points +13%
Durabook S15
Iris Xe G7 96EUs, i7-1255U, Kingston OM8SEP4512Q-AA
5860 Points
Media Intel Core i7-1255U, Intel Iris Xe Graphics G7 96EUs
  (4498 - 6203, n=9)
5709 Points -3%
Panasonic Toughbook 40
Iris Xe G7 96EUs, i7-1185G7, Samsung PM991 MZVLQ1T0HALB
5317 Points -9%
Acer Enduro Urban N3 EUN314
Iris Xe G7 96EUs, i7-1165G7, Samsung PM991 MZVLQ1T0HALB
4926 Points -16%
Durabook S14I
Iris Xe G7 96EUs, i7-1165G7, UDinfo M2P M2P80DE512GBAEP
4341 Points -26%
Dell Latitude 5420 Rugged-P85G
Radeon RX 540, i7-8650U, SK hynix PC401 NVMe 500 GB
3843 Points -34%
Durabook S15ABG2
UHD Graphics 620, i5-8265U, UDinfo HF3-25UB HF325UB256GBA2P
2844 Points -51%
CrossMark / Overall
Media Intel Core i7-1255U, Intel Iris Xe Graphics G7 96EUs
  (1329 - 1573, n=9)
1459 Points +5%
Getac S410 G5
Iris Xe G7 80EUs, i5-1350P, SSSTC CL4-8D512
1433 Points +3%
Durabook S15
Iris Xe G7 96EUs, i7-1255U, Kingston OM8SEP4512Q-AA
1393 Points
Panasonic Toughbook 40
Iris Xe G7 96EUs, i7-1185G7, Samsung PM991 MZVLQ1T0HALB
1291 Points -7%
CrossMark / Productivity
Media Intel Core i7-1255U, Intel Iris Xe Graphics G7 96EUs
  (1364 - 1554, n=9)
1448 Points +5%
Getac S410 G5
Iris Xe G7 80EUs, i5-1350P, SSSTC CL4-8D512
1394 Points +1%
Durabook S15
Iris Xe G7 96EUs, i7-1255U, Kingston OM8SEP4512Q-AA
1384 Points
Panasonic Toughbook 40
Iris Xe G7 96EUs, i7-1185G7, Samsung PM991 MZVLQ1T0HALB
1336 Points -3%
CrossMark / Creativity
Getac S410 G5
Iris Xe G7 80EUs, i5-1350P, SSSTC CL4-8D512
1596 Points +13%
Media Intel Core i7-1255U, Intel Iris Xe Graphics G7 96EUs
  (1372 - 1660, n=9)
1538 Points +9%
Durabook S15
Iris Xe G7 96EUs, i7-1255U, Kingston OM8SEP4512Q-AA
1410 Points
Panasonic Toughbook 40
Iris Xe G7 96EUs, i7-1185G7, Samsung PM991 MZVLQ1T0HALB
1329 Points -6%
CrossMark / Responsiveness
Durabook S15
Iris Xe G7 96EUs, i7-1255U, Kingston OM8SEP4512Q-AA
1371 Points
Media Intel Core i7-1255U, Intel Iris Xe Graphics G7 96EUs
  (1117 - 1434, n=9)
1275 Points -7%
Getac S410 G5
Iris Xe G7 80EUs, i5-1350P, SSSTC CL4-8D512
1127 Points -18%
Panasonic Toughbook 40
Iris Xe G7 96EUs, i7-1185G7, Samsung PM991 MZVLQ1T0HALB
1067 Points -22%
WebXPRT 3 / Overall
Media Intel Core i7-1255U, Intel Iris Xe Graphics G7 96EUs
  (200 - 366, n=9)
275 Points
Getac S410 G5
Iris Xe G7 80EUs, i5-1350P, SSSTC CL4-8D512
258 Points
Durabook S14I
Iris Xe G7 96EUs, i7-1165G7, UDinfo M2P M2P80DE512GBAEP
253 Points
Panasonic Toughbook 40
Iris Xe G7 96EUs, i7-1185G7, Samsung PM991 MZVLQ1T0HALB
249 Points
Acer Enduro Urban N3 EUN314
Iris Xe G7 96EUs, i7-1165G7, Samsung PM991 MZVLQ1T0HALB
196 Points
Durabook S15ABG2
UHD Graphics 620, i5-8265U, UDinfo HF3-25UB HF325UB256GBA2P
186 Points
WebXPRT 4 / Overall
Getac S410 G5
Iris Xe G7 80EUs, i5-1350P, SSSTC CL4-8D512
235 Points 0%
Durabook S15
Iris Xe G7 96EUs, i7-1255U, Kingston OM8SEP4512Q-AA
235 Points
Media Intel Core i7-1255U, Intel Iris Xe Graphics G7 96EUs
  (183.4 - 249, n=9)
229 Points -3%
Mozilla Kraken 1.1 / Total
Dell Latitude 5420 Rugged-P85G
Radeon RX 540, i7-8650U, SK hynix PC401 NVMe 500 GB
1078 ms * -87%
Durabook S15ABG2
UHD Graphics 620, i5-8265U, UDinfo HF3-25UB HF325UB256GBA2P
960 ms * -66%
Acer Enduro Urban N3 EUN314
Iris Xe G7 96EUs, i7-1165G7, Samsung PM991 MZVLQ1T0HALB
775 ms * -34%
Panasonic Toughbook 40
Iris Xe G7 96EUs, i7-1185G7, Samsung PM991 MZVLQ1T0HALB
663 ms * -15%
Durabook S14I
Iris Xe G7 96EUs, i7-1165G7, UDinfo M2P M2P80DE512GBAEP
640 ms * -11%
Media Intel Core i7-1255U, Intel Iris Xe Graphics G7 96EUs
  (476 - 727, n=10)
586 ms * -2%
Durabook S15
Iris Xe G7 96EUs, i7-1255U, Kingston OM8SEP4512Q-AA
577 ms *
Getac S410 G5
Iris Xe G7 80EUs, i5-1350P, SSSTC CL4-8D512
536 ms * +7%

* ... Meglio usare valori piccoli

PCMark 10 Score
5286 punti
Aiuto
AIDA64 / Memory Copy
Durabook S15
Intel Core i7-1255U, Iris Xe G7 96EUs
57437 MB/s
Getac S410 G5
Intel Core i5-1350P, Iris Xe G7 80EUs
54157 MB/s -6%
Media Intel Core i7-1255U
  (22846 - 67017, n=10)
50373 MB/s -12%
Acer Enduro Urban N3 EUN314
Intel Core i7-1165G7, Iris Xe G7 96EUs
40118 MB/s -30%
Panasonic Toughbook 40
Intel Core i7-1185G7, Iris Xe G7 96EUs
36515 MB/s -36%
Durabook S15ABG2
Intel Core i5-8265U, UHD Graphics 620
18610 MB/s -68%
AIDA64 / Memory Read
Durabook S15
Intel Core i7-1255U, Iris Xe G7 96EUs
63015 MB/s
Getac S410 G5
Intel Core i5-1350P, Iris Xe G7 80EUs
58679 MB/s -7%
Media Intel Core i7-1255U
  (22877 - 67398, n=10)
50511 MB/s -20%
Acer Enduro Urban N3 EUN314
Intel Core i7-1165G7, Iris Xe G7 96EUs
47843 MB/s -24%
Panasonic Toughbook 40
Intel Core i7-1185G7, Iris Xe G7 96EUs
38394 MB/s -39%
Durabook S15ABG2
Intel Core i5-8265U, UHD Graphics 620
18450 MB/s -71%
AIDA64 / Memory Write
Durabook S15
Intel Core i7-1255U, Iris Xe G7 96EUs
65701 MB/s
Getac S410 G5
Intel Core i5-1350P, Iris Xe G7 80EUs
63742 MB/s -3%
Media Intel Core i7-1255U
  (22883 - 65839, n=10)
52362 MB/s -20%
Acer Enduro Urban N3 EUN314
Intel Core i7-1165G7, Iris Xe G7 96EUs
46876 MB/s -29%
Panasonic Toughbook 40
Intel Core i7-1185G7, Iris Xe G7 96EUs
37684 MB/s -43%
Durabook S15ABG2
Intel Core i5-8265U, UHD Graphics 620
17994 MB/s -73%
AIDA64 / Memory Latency
Getac S410 G5
Intel Core i5-1350P, Iris Xe G7 80EUs
110.1 ns * -18%
Panasonic Toughbook 40
Intel Core i7-1185G7, Iris Xe G7 96EUs
94 ns * -0%
Durabook S15
Intel Core i7-1255U, Iris Xe G7 96EUs
93.7 ns *
Media Intel Core i7-1255U
  (76 - 163.2, n=10)
88.5 ns * +6%
Acer Enduro Urban N3 EUN314
Intel Core i7-1165G7, Iris Xe G7 96EUs
84.5 ns * +10%
Durabook S15ABG2
Intel Core i5-8265U, UHD Graphics 620
65.3 ns * +30%

* ... Meglio usare valori piccoli

Latenza DPC

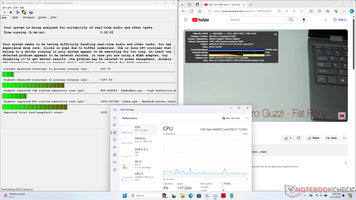
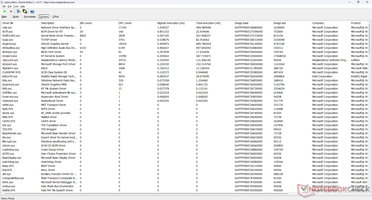
LatencyMon rivela problemi DPC minori quando si aprono più schede del browser della nostra homepage. anche la riproduzione di video 4K a 60 FPS è imperfetta, con almeno un paio di fotogrammi saltati durante una finestra temporale di 60 secondi, anche dopo molteplici tentativi.

LatenzaMon
LatenzaMon
Elenco dei conducenti
DPC Latencies / LatencyMon - interrupt to process latency (max), Web, Youtube, Prime95
Acer Enduro Urban N3 EUN314
Iris Xe G7 96EUs, i7-1165G7, Samsung PM991 MZVLQ1T0HALB
3966 μs * -184%
Getac S410 G5
Iris Xe G7 80EUs, i5-1350P, SSSTC CL4-8D512
2305.4 μs * -65%
Durabook S15
Iris Xe G7 96EUs, i7-1255U, Kingston OM8SEP4512Q-AA
1397.6 μs *
Panasonic Toughbook 40
Iris Xe G7 96EUs, i7-1185G7, Samsung PM991 MZVLQ1T0HALB
1291.6 μs * +8%
Durabook S15ABG2
UHD Graphics 620, i5-8265U, UDinfo HF3-25UB HF325UB256GBA2P
915 μs * +35%

* ... Meglio usare valori piccoli

Dispositivi di archiviazione

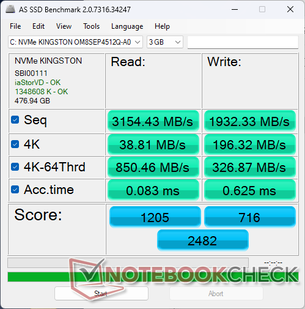
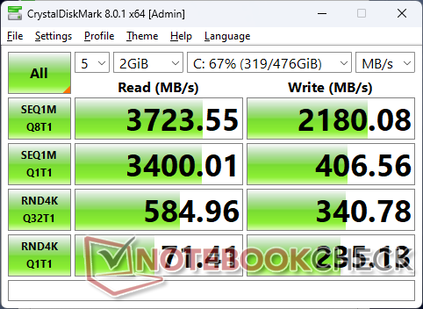
La nostra unità viene fornita con il Kingston OM8SEP4512Q-AA SSD PCIe4 NVMe per velocità di lettura e scrittura sequenziali di circa 3300 MB/s e 2200 MB/s, rispettivamente. L'unità non avrebbe problemi a mantenere queste velocità massime sotto stress.

AS SSD
AS SSD
CDM 8
CDM 8
Slot SSD M.2 primario occupato
Slot M.2 secondario non occupato, con pad termico per l'espansione
Kingston OM8SEP4512Q-AA
CDM 5/6 Read Seq Q32T1: 3779 MB/s
CDM 5/6 Write Seq Q32T1: 2174 MB/s
CDM 5/6 Read 4K Q32T1: 580.5 MB/s
CDM 5/6 Write 4K Q32T1: 337.4 MB/s
CDM 5 Read Seq: 3424 MB/s
CDM 5 Write Seq: 405.2 MB/s
CDM 5/6 Read 4K: 72.17 MB/s
CDM 5/6 Write 4K: 234.7 MB/s
Drive Performance Rating - Percent
Acer Enduro Urban N3 EUN314
Samsung PM991 MZVLQ1T0HALB
83.8 pt
Getac S410 G5
SSSTC CL4-8D512
79.6 pt
Panasonic Toughbook 40
Samsung PM991 MZVLQ1T0HALB
76.5 pt
Durabook S15
Kingston OM8SEP4512Q-AA
71.9 pt
Dell Latitude 5420 Rugged-P85G -8!
SK hynix PC401 NVMe 500 GB
68 pt
Durabook S15ABG2
UDinfo HF3-25UB HF325UB256GBA2P
27.7 pt
DiskSpd
seq read
Durabook S15
Kingston OM8SEP4512Q-AA
2775 (2758.32min - 2774.65max) MB/s
Getac S410 G5
SSSTC CL4-8D512
2566 (2383.05min - 2565.87max) MB/s -8%
Panasonic Toughbook 40
Samsung PM991 MZVLQ1T0HALB
1828 (1803.55min - 1827.88max) MB/s -34%
Acer Enduro Urban N3 EUN314
Samsung PM991 MZVLQ1T0HALB
1550 (1540.63min - 1549.63max) MB/s -44%
Durabook S15ABG2
UDinfo HF3-25UB HF325UB256GBA2P
396 (385.25min - 396.36max) MB/s -86%
seq write
Panasonic Toughbook 40
Samsung PM991 MZVLQ1T0HALB
1535 (1511min - 1535.4max) MB/s +278%
Acer Enduro Urban N3 EUN314
Samsung PM991 MZVLQ1T0HALB
1528 (1279.47min - 1528.49max) MB/s +276%
Getac S410 G5
SSSTC CL4-8D512
1523 (1471.98min - 1522.74max) MB/s +275%
Durabook S15
Kingston OM8SEP4512Q-AA
406 (401.22min - 405.62max) MB/s
Durabook S15ABG2
UDinfo HF3-25UB HF325UB256GBA2P
304 (294.27min - 303.86max) MB/s -25%
seq q8 t1 read
Getac S410 G5
SSSTC CL4-8D512
3588 (3166.07min - 3587.55max) MB/s +1%
Durabook S15
Kingston OM8SEP4512Q-AA
3570 (3223.32min - 3570.39max) MB/s
Panasonic Toughbook 40
Samsung PM991 MZVLQ1T0HALB
3095 (2909.43min - 3094.98max) MB/s -13%
Acer Enduro Urban N3 EUN314
Samsung PM991 MZVLQ1T0HALB
2288 (2042.21min - 2287.53max) MB/s -36%
Durabook S15ABG2
UDinfo HF3-25UB HF325UB256GBA2P
468 (297.76min - 468.18max) MB/s -87%
seq q8 t1 write
Durabook S15
Kingston OM8SEP4512Q-AA
2170 (474.48min - 2170.13max) MB/s
Getac S410 G5
SSSTC CL4-8D512
2125 (2104.06min - 2125.04max) MB/s -2%
Panasonic Toughbook 40
Samsung PM991 MZVLQ1T0HALB
1698 (1677.93min - 1697.64max) MB/s -22%
Acer Enduro Urban N3 EUN314
Samsung PM991 MZVLQ1T0HALB
1621 (1596.56min - 1620.68max) MB/s -25%
Durabook S15ABG2
UDinfo HF3-25UB HF325UB256GBA2P
316 (192.06min - 315.83max) MB/s -85%
4k q1 t1 read
Panasonic Toughbook 40
Samsung PM991 MZVLQ1T0HALB
51.2 (50.51min - 51.19max) MB/s +33%
Acer Enduro Urban N3 EUN314
Samsung PM991 MZVLQ1T0HALB
41.5 (38.08min - 41.48max) MB/s +8%
Getac S410 G5
SSSTC CL4-8D512
40.4 (39.22min - 40.4max) MB/s +5%
Durabook S15
Kingston OM8SEP4512Q-AA
38.4 (37.63min - 38.4max) MB/s
Durabook S15ABG2
UDinfo HF3-25UB HF325UB256GBA2P
26.3 (25.66min - 26.32max) MB/s -32%
4k q1 t1 write
Durabook S15
Kingston OM8SEP4512Q-AA
215 (209.19min - 215.16max) MB/s
Acer Enduro Urban N3 EUN314
Samsung PM991 MZVLQ1T0HALB
210 (189.87min - 210.35max) MB/s -2%
Getac S410 G5
SSSTC CL4-8D512
129.9 (121.27min - 129.88max) MB/s -40%
Panasonic Toughbook 40
Samsung PM991 MZVLQ1T0HALB
120.9 (118.09min - 120.86max) MB/s -44%
Durabook S15ABG2
UDinfo HF3-25UB HF325UB256GBA2P
73.7 (73.29min - 73.7max) MB/s -66%
4k q32 t16 read
Acer Enduro Urban N3 EUN314
Samsung PM991 MZVLQ1T0HALB
1223 (975.21min - 1223.29max) MB/s +22%
Durabook S15
Kingston OM8SEP4512Q-AA
1003 (978.26min - 1002.52max) MB/s
Panasonic Toughbook 40
Samsung PM991 MZVLQ1T0HALB
780 (732.69min - 780.23max) MB/s -22%
Getac S410 G5
SSSTC CL4-8D512
777 (567.89min - 777.03max) MB/s -23%
Durabook S15ABG2
UDinfo HF3-25UB HF325UB256GBA2P
315 (288.87min - 315.15max) MB/s -69%
4k q32 t16 write
Acer Enduro Urban N3 EUN314
Samsung PM991 MZVLQ1T0HALB
949 (790.77min - 949.21max) MB/s +142%
Durabook S15
Kingston OM8SEP4512Q-AA
392 (381.44min - 391.55max) MB/s
Getac S410 G5
SSSTC CL4-8D512
363 (317.42min - 362.74max) MB/s -7%
Panasonic Toughbook 40
Samsung PM991 MZVLQ1T0HALB
335 (328.74min - 335.42max) MB/s -15%
Durabook S15ABG2
UDinfo HF3-25UB HF325UB256GBA2P
317 (285.93min - 317.38max) MB/s -19%
AS SSD
Score Total
Acer Enduro Urban N3 EUN314
Samsung PM991 MZVLQ1T0HALB
3325 Points +34%
Getac S410 G5
SSSTC CL4-8D512
3198 Points +29%
Panasonic Toughbook 40
Samsung PM991 MZVLQ1T0HALB
2913 Points +17%
Durabook S15
Kingston OM8SEP4512Q-AA
2482 Points
Dell Latitude 5420 Rugged-P85G
SK hynix PC401 NVMe 500 GB
2475 Points 0%
Durabook S15ABG2
UDinfo HF3-25UB HF325UB256GBA2P
938 Points -62%
Score Read
Acer Enduro Urban N3 EUN314
Samsung PM991 MZVLQ1T0HALB
1396 Points +16%
Durabook S15
Kingston OM8SEP4512Q-AA
1205 Points
Getac S410 G5
SSSTC CL4-8D512
1148 Points -5%
Panasonic Toughbook 40
Samsung PM991 MZVLQ1T0HALB
1145 Points -5%
Dell Latitude 5420 Rugged-P85G
SK hynix PC401 NVMe 500 GB
921 Points -24%
Durabook S15ABG2
UDinfo HF3-25UB HF325UB256GBA2P
369 Points -69%
Score Write
Getac S410 G5
SSSTC CL4-8D512
1527 Points +113%
Acer Enduro Urban N3 EUN314
Samsung PM991 MZVLQ1T0HALB
1238 Points +73%
Panasonic Toughbook 40
Samsung PM991 MZVLQ1T0HALB
1237 Points +73%
Dell Latitude 5420 Rugged-P85G
SK hynix PC401 NVMe 500 GB
1143 Points +60%
Durabook S15
Kingston OM8SEP4512Q-AA
716 Points
Durabook S15ABG2
UDinfo HF3-25UB HF325UB256GBA2P
374 Points -48%
Seq Read
Durabook S15
Kingston OM8SEP4512Q-AA
3154.43 MB/s
Getac S410 G5
SSSTC CL4-8D512
3083.8 MB/s -2%
Panasonic Toughbook 40
Samsung PM991 MZVLQ1T0HALB
2525.49 MB/s -20%
Acer Enduro Urban N3 EUN314
Samsung PM991 MZVLQ1T0HALB
2104 MB/s -33%
Dell Latitude 5420 Rugged-P85G
SK hynix PC401 NVMe 500 GB
2054 MB/s -35%
Durabook S15ABG2
UDinfo HF3-25UB HF325UB256GBA2P
424.7 MB/s -87%
Seq Write
Durabook S15
Kingston OM8SEP4512Q-AA
1932.33 MB/s
Getac S410 G5
SSSTC CL4-8D512
1617.97 MB/s -16%
Acer Enduro Urban N3 EUN314
Samsung PM991 MZVLQ1T0HALB
1571 MB/s -19%
Panasonic Toughbook 40
Samsung PM991 MZVLQ1T0HALB
1169.49 MB/s -39%
Dell Latitude 5420 Rugged-P85G
SK hynix PC401 NVMe 500 GB
653 MB/s -66%
Durabook S15ABG2
UDinfo HF3-25UB HF325UB256GBA2P
290.4 MB/s -85%
4K Read
Panasonic Toughbook 40
Samsung PM991 MZVLQ1T0HALB
51.28 MB/s +32%
Getac S410 G5
SSSTC CL4-8D512
42.72 MB/s +10%
Acer Enduro Urban N3 EUN314
Samsung PM991 MZVLQ1T0HALB
40.22 MB/s +4%
Dell Latitude 5420 Rugged-P85G
SK hynix PC401 NVMe 500 GB
39.34 MB/s +1%
Durabook S15
Kingston OM8SEP4512Q-AA
38.81 MB/s
Durabook S15ABG2
UDinfo HF3-25UB HF325UB256GBA2P
35.07 MB/s -10%
4K Write
Durabook S15
Kingston OM8SEP4512Q-AA
196.32 MB/s
Acer Enduro Urban N3 EUN314
Samsung PM991 MZVLQ1T0HALB
175.6 MB/s -11%
Panasonic Toughbook 40
Samsung PM991 MZVLQ1T0HALB
143.89 MB/s -27%
Getac S410 G5
SSSTC CL4-8D512
142.49 MB/s -27%
Dell Latitude 5420 Rugged-P85G
SK hynix PC401 NVMe 500 GB
96.4 MB/s -51%
Durabook S15ABG2
UDinfo HF3-25UB HF325UB256GBA2P
46.69 MB/s -76%
4K-64 Read
Acer Enduro Urban N3 EUN314
Samsung PM991 MZVLQ1T0HALB
1145 MB/s +35%
Durabook S15
Kingston OM8SEP4512Q-AA
850.46 MB/s
Panasonic Toughbook 40
Samsung PM991 MZVLQ1T0HALB
841.29 MB/s -1%
Getac S410 G5
SSSTC CL4-8D512
797.22 MB/s -6%
Dell Latitude 5420 Rugged-P85G
SK hynix PC401 NVMe 500 GB
677 MB/s -20%
Durabook S15ABG2
UDinfo HF3-25UB HF325UB256GBA2P
291.8 MB/s -66%
4K-64 Write
Getac S410 G5
SSSTC CL4-8D512
1223.18 MB/s +274%
Dell Latitude 5420 Rugged-P85G
SK hynix PC401 NVMe 500 GB
982 MB/s +200%
Panasonic Toughbook 40
Samsung PM991 MZVLQ1T0HALB
976.57 MB/s +199%
Acer Enduro Urban N3 EUN314
Samsung PM991 MZVLQ1T0HALB
905 MB/s +177%
Durabook S15
Kingston OM8SEP4512Q-AA
326.87 MB/s
Durabook S15ABG2
UDinfo HF3-25UB HF325UB256GBA2P
297.8 MB/s -9%
Access Time Read
Durabook S15ABG2
UDinfo HF3-25UB HF325UB256GBA2P
0.192 ms * -131%
Durabook S15
Kingston OM8SEP4512Q-AA
0.083 ms *
Acer Enduro Urban N3 EUN314
Samsung PM991 MZVLQ1T0HALB
0.077 ms * +7%
Panasonic Toughbook 40
Samsung PM991 MZVLQ1T0HALB
0.071 ms * +14%
Getac S410 G5
SSSTC CL4-8D512
0.067 ms * +19%
Dell Latitude 5420 Rugged-P85G
SK hynix PC401 NVMe 500 GB
0.044 ms * +47%
Access Time Write
Durabook S15
Kingston OM8SEP4512Q-AA
0.625 ms *
Getac S410 G5
SSSTC CL4-8D512
0.428 ms * +32%
Durabook S15ABG2
UDinfo HF3-25UB HF325UB256GBA2P
0.189 ms * +70%
Panasonic Toughbook 40
Samsung PM991 MZVLQ1T0HALB
0.077 ms * +88%
Acer Enduro Urban N3 EUN314
Samsung PM991 MZVLQ1T0HALB
0.066 ms * +89%
Dell Latitude 5420 Rugged-P85G
SK hynix PC401 NVMe 500 GB
0.051 ms * +92%

* ... Meglio usare valori piccoli

Disk Throttling: DiskSpd Read Loop, Queue Depth 8

01653304956608259901155132014851650181519802145231024752640280529703135Tooltip
Durabook S15; diskspd 2.0.17 f: Ø3260 (2078.07-3294.33)

Prestazioni della GPU - Iris Xe sta iniziando a mostrare la sua età

Il modello utilizza lo stesso sistema integrato Iris Xe Della vecchia S14I, con un leggero aumento delle prestazioni grafiche complessive. La maggior parte dei computer portatili rugged deve ancora passare a Meteor Lake per la serie Arc integrata, molto migliorata, ma il modello 2024 S15 è comunque significativamente più avanti rispetto all'ormai vetusto UHD Graphics 620 da 2 a 4 volte.

La Nvidia Quadro T1000 è opzionale per coloro che richiedono una grafica discreta.

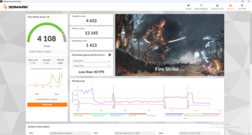
Profilo di potenzaPunteggio graficoPunteggio di fisicaPunteggio combinato
Modalità Prestazioni4652131451413
Modalità equilibrata4119 (-15%)11865 (-10%)1312 (-7%)
Alimentazione a batteria3958 (-15%)12722 (-3%)1314 (-7%)

L'esecuzione in modalità bilanciata o a batteria può influire sulle prestazioni fino al 10-15%, come mostra la nostra tabella dei risultati Fire Strike qui sopra.

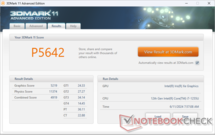
3DMark 11
3DMark 11
Fire Strike
Fire Strike
Time Spy
Time Spy
3DMark Performance Rating - Percent
Lenovo ThinkPad P1 2019-20QT000RGE
NVIDIA Quadro T1000 (Laptop), Intel Core i7-9850H
100 pt
Dell Latitude 7330 Rugged Extreme
Intel Iris Xe Graphics G7 96EUs, Intel Core i7-1185G7
62.7 pt
Getac S410 G5
Intel Iris Xe Graphics G7 80EUs, Intel Core i5-1350P
59.6 pt
Acer Enduro Urban N3 EUN314
Intel Iris Xe Graphics G7 96EUs, Intel Core i7-1165G7
58.5 pt
Media Intel Iris Xe Graphics G7 96EUs
 
57.8 pt
Panasonic Toughbook FZ-55 MK2
Intel Iris Xe Graphics G7 96EUs, Intel Core i7-1185G7
57.4 pt
Getac S410 Gen 4
Intel Iris Xe Graphics G7 96EUs, Intel Core i7-1185G7
57.2 pt
Panasonic Toughbook 40
Intel Iris Xe Graphics G7 96EUs, Intel Core i7-1185G7
56.5 pt
Durabook S15
Intel Iris Xe Graphics G7 96EUs, Intel Core i7-1255U
47.2 pt
Durabook S14I
Intel Iris Xe Graphics G7 96EUs, Intel Core i7-1165G7
41.4 pt
Dell Latitude 5420 Rugged-P85G
AMD Radeon RX 540, Intel Core i7-8650U
38.3 pt
Getac B360
Intel UHD Graphics 620, Intel Core i7-10710U
18.3 pt
Getac S410 -4!
Intel UHD Graphics 620, Intel Core i7-8550U
17 pt
Durabook S15ABG2
Intel UHD Graphics 620, Intel Core i5-8265U
15.2 pt
3DMark 11 - 1280x720 Performance GPU
Lenovo ThinkPad P1 2019-20QT000RGE
NVIDIA Quadro T1000 (Laptop), Intel Core i7-9850H
10407 Points +99%
Acer Enduro Urban N3 EUN314
Intel Iris Xe Graphics G7 96EUs, Intel Core i7-1165G7
6728 Points +29%
Dell Latitude 7330 Rugged Extreme
Intel Iris Xe Graphics G7 96EUs, Intel Core i7-1185G7
6722 Points +29%
Panasonic Toughbook FZ-55 MK2
Intel Iris Xe Graphics G7 96EUs, Intel Core i7-1185G7
6700 Points +28%
Getac S410 Gen 4
Intel Iris Xe Graphics G7 96EUs, Intel Core i7-1185G7
6613 Points +27%
Getac S410 G5
Intel Iris Xe Graphics G7 80EUs, Intel Core i5-1350P
6477 Points +24%
Panasonic Toughbook 40
Intel Iris Xe Graphics G7 96EUs, Intel Core i7-1185G7
6374 Points +22%
Media Intel Iris Xe Graphics G7 96EUs
  (2867 - 7676, n=202)
6353 Points +22%
Durabook S15
Intel Iris Xe Graphics G7 96EUs, Intel Core i7-1255U
5219 Points
Durabook S14I
Intel Iris Xe Graphics G7 96EUs, Intel Core i7-1165G7
5173 Points -1%
Dell Latitude 5420 Rugged-P85G
AMD Radeon RX 540, Intel Core i7-8650U
4983 Points -5%
Getac B360
Intel UHD Graphics 620, Intel Core i7-10710U
1913 Points -63%
Getac S410
Intel UHD Graphics 620, Intel Core i7-8550U
1766 Points -66%
Durabook S15ABG2
Intel UHD Graphics 620, Intel Core i5-8265U
1754 Points -66%
3DMark
1280x720 Cloud Gate Standard Graphics
Lenovo ThinkPad P1 2019-20QT000RGE
NVIDIA Quadro T1000 (Laptop), Intel Core i7-9850H
48965 Points +142%
Getac S410 G5
Intel Iris Xe Graphics G7 80EUs, Intel Core i5-1350P
29412 Points +45%
Dell Latitude 7330 Rugged Extreme
Intel Iris Xe Graphics G7 96EUs, Intel Core i7-1185G7
28973 Points +43%
Panasonic Toughbook FZ-55 MK2
Intel Iris Xe Graphics G7 96EUs, Intel Core i7-1185G7
26882 Points +33%
Acer Enduro Urban N3 EUN314
Intel Iris Xe Graphics G7 96EUs, Intel Core i7-1165G7
26565 Points +31%
Media Intel Iris Xe Graphics G7 96EUs
  (13162 - 38578, n=180)
26508 Points +31%
Getac S410 Gen 4
Intel Iris Xe Graphics G7 96EUs, Intel Core i7-1185G7
26448 Points +30%
Panasonic Toughbook 40
Intel Iris Xe Graphics G7 96EUs, Intel Core i7-1185G7
26164 Points +29%
Dell Latitude 5420 Rugged-P85G
AMD Radeon RX 540, Intel Core i7-8650U
25077 Points +24%
Durabook S15
Intel Iris Xe Graphics G7 96EUs, Intel Core i7-1255U
20269 Points
Durabook S14I
Intel Iris Xe Graphics G7 96EUs, Intel Core i7-1165G7
19487 Points -4%
Getac B360
Intel UHD Graphics 620, Intel Core i7-10710U
11032 Points -46%
Durabook S15ABG2
Intel UHD Graphics 620, Intel Core i5-8265U
8648 Points -57%
1920x1080 Fire Strike Graphics
Lenovo ThinkPad P1 2019-20QT000RGE
NVIDIA Quadro T1000 (Laptop), Intel Core i7-9850H
7558 Points +62%
Dell Latitude 7330 Rugged Extreme
Intel Iris Xe Graphics G7 96EUs, Intel Core i7-1185G7
5437 Points +17%
Getac S410 G5
Intel Iris Xe Graphics G7 80EUs, Intel Core i5-1350P
5183 Points +11%
Media Intel Iris Xe Graphics G7 96EUs
  (2286 - 6482, n=215)
4920 Points +6%
Acer Enduro Urban N3 EUN314
Intel Iris Xe Graphics G7 96EUs, Intel Core i7-1165G7
4847 Points +4%
Getac S410 Gen 4
Intel Iris Xe Graphics G7 96EUs, Intel Core i7-1185G7
4736 Points +2%
Panasonic Toughbook FZ-55 MK2
Intel Iris Xe Graphics G7 96EUs, Intel Core i7-1185G7
4716 Points +1%
Durabook S15
Intel Iris Xe Graphics G7 96EUs, Intel Core i7-1255U
4652 Points
Panasonic Toughbook 40
Intel Iris Xe Graphics G7 96EUs, Intel Core i7-1185G7
4623 Points -1%
Dell Latitude 5420 Rugged-P85G
AMD Radeon RX 540, Intel Core i7-8650U
3853 Points -17%
Durabook S14I
Intel Iris Xe Graphics G7 96EUs, Intel Core i7-1165G7
3279 Points -30%
Getac B360
Intel UHD Graphics 620, Intel Core i7-10710U
1424 Points -69%
Durabook S15ABG2
Intel UHD Graphics 620, Intel Core i5-8265U
1108 Points -76%
2560x1440 Time Spy Graphics
Lenovo ThinkPad P1 2019-20QT000RGE
NVIDIA Quadro T1000 (Laptop), Intel Core i7-9850H
2834 Points +148%
Dell Latitude 7330 Rugged Extreme
Intel Iris Xe Graphics G7 96EUs, Intel Core i7-1185G7
1634 Points +43%
Acer Enduro Urban N3 EUN314
Intel Iris Xe Graphics G7 96EUs, Intel Core i7-1165G7
1512 Points +33%
Media Intel Iris Xe Graphics G7 96EUs
  (707 - 1871, n=212)
1495 Points +31%
Panasonic Toughbook 40
Intel Iris Xe Graphics G7 96EUs, Intel Core i7-1185G7
1478 Points +30%
Getac S410 Gen 4
Intel Iris Xe Graphics G7 96EUs, Intel Core i7-1185G7
1466 Points +28%
Getac S410 G5
Intel Iris Xe Graphics G7 80EUs, Intel Core i5-1350P
1466 Points +28%
Panasonic Toughbook FZ-55 MK2
Intel Iris Xe Graphics G7 96EUs, Intel Core i7-1185G7
1461 Points +28%
Durabook S15
Intel Iris Xe Graphics G7 96EUs, Intel Core i7-1255U
1141 Points
Durabook S14I
Intel Iris Xe Graphics G7 96EUs, Intel Core i7-1165G7
1032 Points -10%
Dell Latitude 5420 Rugged-P85G
AMD Radeon RX 540, Intel Core i7-8650U
566 Points -50%
Getac B360
Intel UHD Graphics 620, Intel Core i7-10710U
432 Points -62%
Durabook S15ABG2
Intel UHD Graphics 620, Intel Core i5-8265U
363 Points -68%
2560x1440 Time Spy Score
Lenovo ThinkPad P1 2019-20QT000RGE
NVIDIA Quadro T1000 (Laptop), Intel Core i7-9850H
3006 Points +136%
Dell Latitude 7330 Rugged Extreme
Intel Iris Xe Graphics G7 96EUs, Intel Core i7-1185G7
1813 Points +42%
Acer Enduro Urban N3 EUN314
Intel Iris Xe Graphics G7 96EUs, Intel Core i7-1165G7
1684 Points +32%
Media Intel Iris Xe Graphics G7 96EUs
  (789 - 2133, n=209)
1675 Points +31%
Getac S410 G5
Intel Iris Xe Graphics G7 80EUs, Intel Core i5-1350P
1661 Points +30%
Panasonic Toughbook 40
Intel Iris Xe Graphics G7 96EUs, Intel Core i7-1185G7
1633 Points +28%
Getac S410 Gen 4
Intel Iris Xe Graphics G7 96EUs, Intel Core i7-1185G7
1630 Points +28%
Panasonic Toughbook FZ-55 MK2
Intel Iris Xe Graphics G7 96EUs, Intel Core i7-1185G7
1623 Points +27%
Durabook S15
Intel Iris Xe Graphics G7 96EUs, Intel Core i7-1255U
1275 Points
Durabook S14I
Intel Iris Xe Graphics G7 96EUs, Intel Core i7-1165G7
1137 Points -11%
Dell Latitude 5420 Rugged-P85G
AMD Radeon RX 540, Intel Core i7-8650U
643 Points -50%
Getac B360
Intel UHD Graphics 620, Intel Core i7-10710U
497 Points -61%
Durabook S15ABG2
Intel UHD Graphics 620, Intel Core i5-8265U
416 Points -67%
3DMark 11 Performance
5642 punti
3DMark Cloud Gate Standard Score
14383 punti
3DMark Fire Strike Score
4108 punti
3DMark Time Spy Score
1275 punti
Aiuto
Blender - v3.3 Classroom CPU
Durabook S15
Intel Iris Xe Graphics G7 96EUs, Intel Core i7-1255U
974 Seconds *
Media Intel Iris Xe Graphics G7 96EUs
  (336 - 1259, n=101)
696 Seconds * +29%
Getac S410 G5
Intel Iris Xe Graphics G7 80EUs, Intel Core i5-1350P
649 Seconds * +33%

* ... Meglio usare valori piccoli

Performance Rating - Percent
Getac S410 G5
Intel Core i5-1350P, Intel Iris Xe Graphics G7 80EUs
96.4 pt
Acer Enduro Urban N3 EUN314
Intel Core i7-1165G7, Intel Iris Xe Graphics G7 96EUs
83.9 pt
Panasonic Toughbook 40 -2!
Intel Core i7-1185G7, Intel Iris Xe Graphics G7 96EUs
80.3 pt
Durabook S15 -1!
Intel Core i7-1255U, Intel Iris Xe Graphics G7 96EUs
78.3 pt
Durabook S15ABG2 -4!
Intel Core i5-8265U, Intel UHD Graphics 620
32.6 pt
Dell Latitude 5420 Rugged-P85G -4!
Intel Core i7-8650U, AMD Radeon RX 540
17 pt
The Witcher 3 - 1920x1080 Ultra Graphics & Postprocessing (HBAO+)
Getac S410 G5
Intel Core i5-1350P, Intel Iris Xe Graphics G7 80EUs
28 (12min) fps +124%
Panasonic Toughbook 40
Intel Core i7-1185G7, Intel Iris Xe Graphics G7 96EUs
14.8 (14min) fps +18%
Acer Enduro Urban N3 EUN314
Intel Core i7-1165G7, Intel Iris Xe Graphics G7 96EUs
13.4 (10min) fps +7%
Durabook S15
Intel Core i7-1255U, Intel Iris Xe Graphics G7 96EUs
12.5 (11min) fps
Dell Latitude 5420 Rugged-P85G
Intel Core i7-8650U, AMD Radeon RX 540
6 fps -52%
GTA V - 1920x1080 Highest Settings possible AA:4xMSAA + FX AF:16x
Getac S410 G5
Intel Core i5-1350P, Intel Iris Xe Graphics G7 80EUs
9.58 (5.37min, 7.81P1) fps
Acer Enduro Urban N3 EUN314
Intel Core i7-1165G7, Intel Iris Xe Graphics G7 96EUs
8.32 (3.65min, 6.25P1) fps
Final Fantasy XV Benchmark - 1920x1080 High Quality
Acer Enduro Urban N3 EUN314
Intel Core i7-1165G7, Intel Iris Xe Graphics G7 96EUs
15.9 fps +8%
Getac S410 G5
Intel Core i5-1350P, Intel Iris Xe Graphics G7 80EUs
15.8 fps +7%
Panasonic Toughbook 40
Intel Core i7-1185G7, Intel Iris Xe Graphics G7 96EUs
15.5 fps +5%
Durabook S15
Intel Core i7-1255U, Intel Iris Xe Graphics G7 96EUs
14.7 fps
Dell Latitude 5420 Rugged-P85G
Intel Core i7-8650U, AMD Radeon RX 540
2 fps -86%
Strange Brigade - 1920x1080 ultra AA:ultra AF:16
Getac S410 G5
Intel Core i5-1350P, Intel Iris Xe Graphics G7 80EUs
25.1 (5.1min, 7.53P1) fps +15%
Acer Enduro Urban N3 EUN314
Intel Core i7-1165G7, Intel Iris Xe Graphics G7 96EUs
22.7 (5min, 6.41P1) fps +4%
Durabook S15
Intel Core i7-1255U, Intel Iris Xe Graphics G7 96EUs
21.9 (5min, 5.78P1) fps
Dota 2 Reborn - 1920x1080 ultra (3/3) best looking
Panasonic Toughbook 40
Intel Core i7-1185G7, Intel Iris Xe Graphics G7 96EUs
55.5 (49.6min) fps +19%
Getac S410 G5
Intel Core i5-1350P, Intel Iris Xe Graphics G7 80EUs
49.5 (39.9min) fps +6%
Durabook S15
Intel Core i7-1255U, Intel Iris Xe Graphics G7 96EUs
46.8 (38.1min) fps
Acer Enduro Urban N3 EUN314
Intel Core i7-1165G7, Intel Iris Xe Graphics G7 96EUs
43.4 (25.4min) fps -7%
Durabook S15ABG2
Intel Core i5-8265U, Intel UHD Graphics 620
16.7 (15.8min) fps -64%
X-Plane 11.11 - 1920x1080 high (fps_test=3)
Acer Enduro Urban N3 EUN314
Intel Core i7-1165G7, Intel Iris Xe Graphics G7 96EUs
36.5 fps +21%
Getac S410 G5
Intel Core i5-1350P, Intel Iris Xe Graphics G7 80EUs
32.7 fps +8%
Durabook S15
Intel Core i7-1255U, Intel Iris Xe Graphics G7 96EUs
30.2 fps
Panasonic Toughbook 40
Intel Core i7-1185G7, Intel Iris Xe Graphics G7 96EUs
25.9 fps -14%
Durabook S15ABG2
Intel Core i5-8265U, Intel UHD Graphics 620
12.8 fps -58%
Far Cry 5
1280x720 Low Preset AA:T
Acer Enduro Urban N3 EUN314
Intel Core i7-1165G7, Intel Iris Xe Graphics G7 96EUs
49 (43min) fps +113%
Media Intel Iris Xe Graphics G7 96EUs
  (23 - 75, n=92)
46.5 fps +102%
Dell Latitude 5420 Rugged-P85G
Intel Core i7-8650U, AMD Radeon RX 540
42 fps +83%
Durabook S15
Intel Core i7-1255U, Intel Iris Xe Graphics G7 96EUs
23 (16min) fps
1920x1080 Medium Preset AA:T
Media Intel Iris Xe Graphics G7 96EUs
  (14 - 39, n=90)
25.5 fps +16%
Dell Latitude 5420 Rugged-P85G
Intel Core i7-8650U, AMD Radeon RX 540
25 fps +14%
Acer Enduro Urban N3 EUN314
Intel Core i7-1165G7, Intel Iris Xe Graphics G7 96EUs
22 (20min) fps 0%
Durabook S15
Intel Core i7-1255U, Intel Iris Xe Graphics G7 96EUs
22 (18min) fps
1920x1080 High Preset AA:T
Media Intel Iris Xe Graphics G7 96EUs
  (10 - 35, n=88)
23.8 fps +25%
Dell Latitude 5420 Rugged-P85G
Intel Core i7-8650U, AMD Radeon RX 540
21 fps +11%
Acer Enduro Urban N3 EUN314
Intel Core i7-1165G7, Intel Iris Xe Graphics G7 96EUs
21 (19min) fps +11%
Durabook S15
Intel Core i7-1255U, Intel Iris Xe Graphics G7 96EUs
19 (16min) fps
1920x1080 Ultra Preset AA:T
Media Intel Iris Xe Graphics G7 96EUs
  (11 - 33, n=74)
22.6 fps +19%
Acer Enduro Urban N3 EUN314
Intel Core i7-1165G7, Intel Iris Xe Graphics G7 96EUs
20 (17min) fps +5%
Durabook S15
Intel Core i7-1255U, Intel Iris Xe Graphics G7 96EUs
19 (16min) fps
Dell Latitude 5420 Rugged-P85G
Intel Core i7-8650U, AMD Radeon RX 540
17 fps -11%
The Witcher 3
1024x768 Low Graphics & Postprocessing
Dell Latitude 7330 Rugged Extreme
Intel Core i7-1185G7, Intel Iris Xe Graphics G7 96EUs
99.3 (45min) fps +65%
Panasonic Toughbook FZ-55 MK2
Intel Core i7-1185G7, Intel Iris Xe Graphics G7 96EUs
94.5 (82min) fps +57%
Acer Enduro Urban N3 EUN314
Intel Core i7-1165G7, Intel Iris Xe Graphics G7 96EUs
89.5 (39min) fps +49%
Panasonic Toughbook 40
Intel Core i7-1185G7, Intel Iris Xe Graphics G7 96EUs
85.9 (70min) fps +43%
Media Intel Iris Xe Graphics G7 96EUs
  (28.9 - 117.2, n=186)
84 fps +40%
Getac S410 G5
Intel Core i5-1350P, Intel Iris Xe Graphics G7 80EUs
79.9 (62min) fps +33%
Getac S410 Gen 4
Intel Core i7-1185G7, Intel Iris Xe Graphics G7 96EUs
77.3 (9min) fps +28%
Durabook S15
Intel Core i7-1255U, Intel Iris Xe Graphics G7 96EUs
60.2 (39min) fps
Dell Latitude 5420 Rugged-P85G
Intel Core i7-8650U, AMD Radeon RX 540
48 fps -20%
Getac B360
Intel Core i7-10710U, Intel UHD Graphics 620
20.7 fps -66%
1366x768 Medium Graphics & Postprocessing
Dell Latitude 7330 Rugged Extreme
Intel Core i7-1185G7, Intel Iris Xe Graphics G7 96EUs
65.3 (61min) fps +42%
Acer Enduro Urban N3 EUN314
Intel Core i7-1165G7, Intel Iris Xe Graphics G7 96EUs
57.3 (53min) fps +25%
Panasonic Toughbook FZ-55 MK2
Intel Core i7-1185G7, Intel Iris Xe Graphics G7 96EUs
56.7 (51min) fps +23%
Getac S410 G5
Intel Core i5-1350P, Intel Iris Xe Graphics G7 80EUs
56.3 (53min) fps +22%
Panasonic Toughbook 40
Intel Core i7-1185G7, Intel Iris Xe Graphics G7 96EUs
54.2 (27min) fps +18%
Media Intel Iris Xe Graphics G7 96EUs
  (21.4 - 77.8, n=184)
53.6 fps +17%
Getac S410 Gen 4
Intel Core i7-1185G7, Intel Iris Xe Graphics G7 96EUs
49.4 (46min) fps +7%
Durabook S15
Intel Core i7-1255U, Intel Iris Xe Graphics G7 96EUs
46 (40min) fps
Dell Latitude 5420 Rugged-P85G
Intel Core i7-8650U, AMD Radeon RX 540
39 fps -15%
Getac B360
Intel Core i7-10710U, Intel UHD Graphics 620
14.3 (11min) fps -69%
1920x1080 High Graphics & Postprocessing (Nvidia HairWorks Off)
Dell Latitude 7330 Rugged Extreme
Intel Core i7-1185G7, Intel Iris Xe Graphics G7 96EUs
34.3 (31min) fps +38%
Getac S410 G5
Intel Core i5-1350P, Intel Iris Xe Graphics G7 80EUs
31.5 (28min) fps +27%
Panasonic Toughbook FZ-55 MK2
Intel Core i7-1185G7, Intel Iris Xe Graphics G7 96EUs
30.5 (27min) fps +22%
Panasonic Toughbook 40
Intel Core i7-1185G7, Intel Iris Xe Graphics G7 96EUs
29.5 (27min) fps +18%
Acer Enduro Urban N3 EUN314
Intel Core i7-1165G7, Intel Iris Xe Graphics G7 96EUs
29.2 (26min) fps +17%
Media Intel Iris Xe Graphics G7 96EUs
  (10.6 - 45.9, n=189)
28.7 fps +15%
Getac S410 Gen 4
Intel Core i7-1185G7, Intel Iris Xe Graphics G7 96EUs
25.6 (23min) fps +3%
Durabook S15
Intel Core i7-1255U, Intel Iris Xe Graphics G7 96EUs
24.9 (21min) fps
Getac B360
Intel Core i7-10710U, Intel UHD Graphics 620
8.4 (5min) fps -66%
Dell Latitude 5420 Rugged-P85G
Intel Core i7-8650U, AMD Radeon RX 540
8 fps -68%
1920x1080 Ultra Graphics & Postprocessing (HBAO+)
Getac S410 G5
Intel Core i5-1350P, Intel Iris Xe Graphics G7 80EUs
28 (12min) fps +124%
Dell Latitude 7330 Rugged Extreme
Intel Core i7-1185G7, Intel Iris Xe Graphics G7 96EUs
15.8 (13min) fps +26%
Panasonic Toughbook FZ-55 MK2
Intel Core i7-1185G7, Intel Iris Xe Graphics G7 96EUs
15.4 (13min) fps +23%
Panasonic Toughbook 40
Intel Core i7-1185G7, Intel Iris Xe Graphics G7 96EUs
14.8 (14min) fps +18%
Media Intel Iris Xe Graphics G7 96EUs
  (8.79 - 20.1, n=179)
14 fps +12%
Acer Enduro Urban N3 EUN314
Intel Core i7-1165G7, Intel Iris Xe Graphics G7 96EUs
13.4 (10min) fps +7%
Getac S410 Gen 4
Intel Core i7-1185G7, Intel Iris Xe Graphics G7 96EUs
12.9 (11min) fps +3%
Durabook S15
Intel Core i7-1255U, Intel Iris Xe Graphics G7 96EUs
12.5 (11min) fps
Dell Latitude 5420 Rugged-P85G
Intel Core i7-8650U, AMD Radeon RX 540
6 fps -52%
Getac B360
Intel Core i7-10710U, Intel UHD Graphics 620
4.8 (3min) fps -62%
Final Fantasy XV Benchmark
1280x720 Lite Quality
Dell Latitude 7330 Rugged Extreme
Intel Core i7-1185G7, Intel Iris Xe Graphics G7 96EUs
46.8 fps +33%
Panasonic Toughbook FZ-55 MK2
Intel Core i7-1185G7, Intel Iris Xe Graphics G7 96EUs
41.7 fps +18%
Getac S410 G5
Intel Core i5-1350P, Intel Iris Xe Graphics G7 80EUs
40.4 fps +15%
Panasonic Toughbook 40
Intel Core i7-1185G7, Intel Iris Xe Graphics G7 96EUs
40.1 fps +14%
Acer Enduro Urban N3 EUN314
Intel Core i7-1165G7, Intel Iris Xe Graphics G7 96EUs
39.9 fps +13%
Getac S410 Gen 4
Intel Core i7-1185G7, Intel Iris Xe Graphics G7 96EUs
39.4 fps +12%
Media Intel Iris Xe Graphics G7 96EUs
  (14.9 - 56.5, n=183)
39.4 fps +12%
Durabook S15
Intel Core i7-1255U, Intel Iris Xe Graphics G7 96EUs
35.2 fps
Durabook S14I
Intel Core i7-1165G7, Intel Iris Xe Graphics G7 96EUs
23.8 fps -32%
Getac B360
Intel Core i7-10710U, Intel UHD Graphics 620
14.2 fps -60%
Dell Latitude 5420 Rugged-P85G
Intel Core i7-8650U, AMD Radeon RX 540
11 fps -69%
1920x1080 Standard Quality
Dell Latitude 7330 Rugged Extreme
Intel Core i7-1185G7, Intel Iris Xe Graphics G7 96EUs
26.2 fps +30%
Acer Enduro Urban N3 EUN314
Intel Core i7-1165G7, Intel Iris Xe Graphics G7 96EUs
22.1 fps +10%
Panasonic Toughbook FZ-55 MK2
Intel Core i7-1185G7, Intel Iris Xe Graphics G7 96EUs
22 fps +9%
Getac S410 G5
Intel Core i5-1350P, Intel Iris Xe Graphics G7 80EUs
22 fps +9%
Media Intel Iris Xe Graphics G7 96EUs
  (10.5 - 31.2, n=179)
21.8 fps +8%
Panasonic Toughbook 40
Intel Core i7-1185G7, Intel Iris Xe Graphics G7 96EUs
21.3 fps +6%
Getac S410 Gen 4
Intel Core i7-1185G7, Intel Iris Xe Graphics G7 96EUs
20.1 fps 0%
Durabook S15
Intel Core i7-1255U, Intel Iris Xe Graphics G7 96EUs
20.1 fps
Durabook S14I
Intel Core i7-1165G7, Intel Iris Xe Graphics G7 96EUs
13.4 fps -33%
Getac B360
Intel Core i7-10710U, Intel UHD Graphics 620
6.77 fps -66%
Dell Latitude 5420 Rugged-P85G
Intel Core i7-8650U, AMD Radeon RX 540
3 fps -85%
1920x1080 High Quality
Dell Latitude 7330 Rugged Extreme
Intel Core i7-1185G7, Intel Iris Xe Graphics G7 96EUs
26.2 fps +78%
Media Intel Iris Xe Graphics G7 96EUs
  (8.15 - 27.8, n=172)
16.8 fps +14%
Acer Enduro Urban N3 EUN314
Intel Core i7-1165G7, Intel Iris Xe Graphics G7 96EUs
15.9 fps +8%
Getac S410 G5
Intel Core i5-1350P, Intel Iris Xe Graphics G7 80EUs
15.8 fps +7%
Panasonic Toughbook FZ-55 MK2
Intel Core i7-1185G7, Intel Iris Xe Graphics G7 96EUs
15.7 fps +7%
Panasonic Toughbook 40
Intel Core i7-1185G7, Intel Iris Xe Graphics G7 96EUs
15.5 fps +5%
Getac S410 Gen 4
Intel Core i7-1185G7, Intel Iris Xe Graphics G7 96EUs
15.3 fps +4%
Durabook S15
Intel Core i7-1255U, Intel Iris Xe Graphics G7 96EUs
14.7 fps
Durabook S14I
Intel Core i7-1165G7, Intel Iris Xe Graphics G7 96EUs
9.86 fps -33%
Getac B360
Intel Core i7-10710U, Intel UHD Graphics 620
5.05 fps -66%
Dell Latitude 5420 Rugged-P85G
Intel Core i7-8650U, AMD Radeon RX 540
2 fps -86%
Dota 2 Reborn
1280x720 min (0/3) fastest
Dell Latitude 7330 Rugged Extreme
Intel Core i7-1185G7, Intel Iris Xe Graphics G7 96EUs
115.6 (103.2min) fps +23%
Panasonic Toughbook 40
Intel Core i7-1185G7, Intel Iris Xe Graphics G7 96EUs
112.9 (100.9min) fps +20%
Media Intel Iris Xe Graphics G7 96EUs
  (36 - 148, n=215)
100.3 fps +7%
Getac S410 G5
Intel Core i5-1350P, Intel Iris Xe Graphics G7 80EUs
94.8 (66min) fps +1%
Durabook S15
Intel Core i7-1255U, Intel Iris Xe Graphics G7 96EUs
93.7 (73.5min) fps
Getac B360
Intel Core i7-10710U, Intel UHD Graphics 620
85.9 (74.3min) fps -8%
Panasonic Toughbook FZ-55 MK2
Intel Core i7-1185G7, Intel Iris Xe Graphics G7 96EUs
84.2 (51.7min) fps -10%
Getac S410 Gen 4
Intel Core i7-1185G7, Intel Iris Xe Graphics G7 96EUs
83.1 (52.4min) fps -11%
Acer Enduro Urban N3 EUN314
Intel Core i7-1165G7, Intel Iris Xe Graphics G7 96EUs
78.5 (48.2min) fps -16%
Durabook S14I
Intel Core i7-1165G7, Intel Iris Xe Graphics G7 96EUs
75.4 (46.6min) fps -20%
Durabook S15ABG2
Intel Core i5-8265U, Intel UHD Graphics 620
71.3 (61.5min) fps -24%
1366x768 med (1/3)
Dell Latitude 7330 Rugged Extreme
Intel Core i7-1185G7, Intel Iris Xe Graphics G7 96EUs
108.5 (97.4min) fps +65%
Panasonic Toughbook 40
Intel Core i7-1185G7, Intel Iris Xe Graphics G7 96EUs
104.6 (77min) fps +59%
Panasonic Toughbook FZ-55 MK2
Intel Core i7-1185G7, Intel Iris Xe Graphics G7 96EUs
86.7 (62.7min) fps +32%
Acer Enduro Urban N3 EUN314
Intel Core i7-1165G7, Intel Iris Xe Graphics G7 96EUs
81.6 (57.4min) fps +24%
Media Intel Iris Xe Graphics G7 96EUs
  (31.6 - 108.5, n=215)
75.7 fps +15%
Getac S410 G5
Intel Core i5-1350P, Intel Iris Xe Graphics G7 80EUs
71.3 (51.5min) fps +9%
Getac S410 Gen 4
Intel Core i7-1185G7, Intel Iris Xe Graphics G7 96EUs
67.7 (50.3min) fps +3%
Durabook S15
Intel Core i7-1255U, Intel Iris Xe Graphics G7 96EUs
65.7 (49.1min) fps
Durabook S14I
Intel Core i7-1165G7, Intel Iris Xe Graphics G7 96EUs
60 (42.4min) fps -9%
Getac B360
Intel Core i7-10710U, Intel UHD Graphics 620
56 (50.3min) fps -15%
Durabook S15ABG2
Intel Core i5-8265U, Intel UHD Graphics 620
42.3 (37.8min) fps -36%
1920x1080 high (2/3)
Dell Latitude 7330 Rugged Extreme
Intel Core i7-1185G7, Intel Iris Xe Graphics G7 96EUs
65 (59.9min) fps +25%
Panasonic Toughbook 40
Intel Core i7-1185G7, Intel Iris Xe Graphics G7 96EUs
62.4 (56.2min) fps +20%
Getac S410 G5
Intel Core i5-1350P, Intel Iris Xe Graphics G7 80EUs
55.8 (44.3min) fps +8%
Media Intel Iris Xe Graphics G7 96EUs
  (23.2 - 88.1, n=215)
54.2 fps +5%
Panasonic Toughbook FZ-55 MK2
Intel Core i7-1185G7, Intel Iris Xe Graphics G7 96EUs
53.9 (31.9min) fps +4%
Durabook S15
Intel Core i7-1255U, Intel Iris Xe Graphics G7 96EUs
51.8 (43.4min) fps
Acer Enduro Urban N3 EUN314
Intel Core i7-1165G7, Intel Iris Xe Graphics G7 96EUs
48.7 (29.2min) fps -6%
Getac S410 Gen 4
Intel Core i7-1185G7, Intel Iris Xe Graphics G7 96EUs
48 (33.3min) fps -7%
Durabook S14I
Intel Core i7-1165G7, Intel Iris Xe Graphics G7 96EUs
36.8 (21.3min) fps -29%
Getac B360
Intel Core i7-10710U, Intel UHD Graphics 620
22.8 (21.1min) fps -56%
Durabook S15ABG2
Intel Core i5-8265U, Intel UHD Graphics 620
19.1 (17.5min) fps -63%
1920x1080 ultra (3/3) best looking
Dell Latitude 7330 Rugged Extreme
Intel Core i7-1185G7, Intel Iris Xe Graphics G7 96EUs
57.3 (51.2min) fps +22%
Panasonic Toughbook 40
Intel Core i7-1185G7, Intel Iris Xe Graphics G7 96EUs
55.5 (49.6min) fps +19%
Getac S410 G5
Intel Core i5-1350P, Intel Iris Xe Graphics G7 80EUs
49.5 (39.9min) fps +6%
Media Intel Iris Xe Graphics G7 96EUs
  (20.6 - 78.5, n=215)
49.4 fps +6%
Panasonic Toughbook FZ-55 MK2
Intel Core i7-1185G7, Intel Iris Xe Graphics G7 96EUs
48.6 (28min) fps +4%
Durabook S15
Intel Core i7-1255U, Intel Iris Xe Graphics G7 96EUs
46.8 (38.1min) fps
Getac S410 Gen 4
Intel Core i7-1185G7, Intel Iris Xe Graphics G7 96EUs
45.7 (33.2min) fps -2%
Acer Enduro Urban N3 EUN314
Intel Core i7-1165G7, Intel Iris Xe Graphics G7 96EUs
43.4 (25.4min) fps -7%
Durabook S14I
Intel Core i7-1165G7, Intel Iris Xe Graphics G7 96EUs
32.8 (18.3min) fps -30%
Getac B360
Intel Core i7-10710U, Intel UHD Graphics 620
20.3 (18.9min) fps -57%
Durabook S15ABG2
Intel Core i5-8265U, Intel UHD Graphics 620
16.7 (15.8min) fps -64%
X-Plane 11.11
1280x720 low (fps_test=1)
Getac S410 G5
Intel Core i5-1350P, Intel Iris Xe Graphics G7 80EUs
47.6 fps +6%
Durabook S15
Intel Core i7-1255U, Intel Iris Xe Graphics G7 96EUs
44.8 fps
Getac S410 Gen 4
Intel Core i7-1185G7, Intel Iris Xe Graphics G7 96EUs
44.4 fps -1%
Media Intel Iris Xe Graphics G7 96EUs
  (13.4 - 88.4, n=212)
41.5 fps -7%
Durabook S14I
Intel Core i7-1165G7, Intel Iris Xe Graphics G7 96EUs
37.4 fps -17%
Dell Latitude 7330 Rugged Extreme
Intel Core i7-1185G7, Intel Iris Xe Graphics G7 96EUs
27.5 fps -39%
Panasonic Toughbook FZ-55 MK2
Intel Core i7-1185G7, Intel Iris Xe Graphics G7 96EUs
27 fps -40%
Panasonic Toughbook 40
Intel Core i7-1185G7, Intel Iris Xe Graphics G7 96EUs
24.8 fps -45%
Acer Enduro Urban N3 EUN314
Intel Core i7-1165G7, Intel Iris Xe Graphics G7 96EUs
22.1 fps -51%
Durabook S15ABG2
Intel Core i5-8265U, Intel UHD Graphics 620
20.9 fps -53%
Getac B360
Intel Core i7-10710U, Intel UHD Graphics 620
13.2 fps -71%
1920x1080 med (fps_test=2)
Acer Enduro Urban N3 EUN314
Intel Core i7-1165G7, Intel Iris Xe Graphics G7 96EUs
41.4 fps +24%
Getac S410 G5
Intel Core i5-1350P, Intel Iris Xe Graphics G7 80EUs
36.1 fps +8%
Media Intel Iris Xe Graphics G7 96EUs
  (11.6 - 69.5, n=213)
35.2 fps +6%
Getac S410 Gen 4
Intel Core i7-1185G7, Intel Iris Xe Graphics G7 96EUs
33.9 fps +2%
Durabook S15
Intel Core i7-1255U, Intel Iris Xe Graphics G7 96EUs
33.3 fps
Durabook S14I
Intel Core i7-1165G7, Intel Iris Xe Graphics G7 96EUs
28.8 fps -14%
Dell Latitude 7330 Rugged Extreme
Intel Core i7-1185G7, Intel Iris Xe Graphics G7 96EUs
25.3 fps -24%
Panasonic Toughbook FZ-55 MK2
Intel Core i7-1185G7, Intel Iris Xe Graphics G7 96EUs
24.8 fps -26%
Panasonic Toughbook 40
Intel Core i7-1185G7, Intel Iris Xe Graphics G7 96EUs
23.3 fps -30%
Durabook S15ABG2
Intel Core i5-8265U, Intel UHD Graphics 620
14.2 fps -57%
Getac B360
Intel Core i7-10710U, Intel UHD Graphics 620
13.8 fps -59%
1920x1080 high (fps_test=3)
Acer Enduro Urban N3 EUN314
Intel Core i7-1165G7, Intel Iris Xe Graphics G7 96EUs
36.5 fps +21%
Getac S410 G5
Intel Core i5-1350P, Intel Iris Xe Graphics G7 80EUs
32.7 fps +8%
Media Intel Iris Xe Graphics G7 96EUs
  (11.1 - 59.8, n=212)
31.6 fps +5%
Getac S410 Gen 4
Intel Core i7-1185G7, Intel Iris Xe Graphics G7 96EUs
30.9 fps +2%
Durabook S15
Intel Core i7-1255U, Intel Iris Xe Graphics G7 96EUs
30.2 fps
Durabook S14I
Intel Core i7-1165G7, Intel Iris Xe Graphics G7 96EUs
26.2 fps -13%
Panasonic Toughbook 40
Intel Core i7-1185G7, Intel Iris Xe Graphics G7 96EUs
25.9 fps -14%
Panasonic Toughbook FZ-55 MK2
Intel Core i7-1185G7, Intel Iris Xe Graphics G7 96EUs
22.3 fps -26%
Dell Latitude 7330 Rugged Extreme
Intel Core i7-1185G7, Intel Iris Xe Graphics G7 96EUs
22 fps -27%
Durabook S15ABG2
Intel Core i5-8265U, Intel UHD Graphics 620
12.8 fps -58%
Getac B360
Intel Core i7-10710U, Intel UHD Graphics 620
12.4 fps -59%
Strange Brigade
1280x720 lowest AF:1
Getac S410 G5
Intel Core i5-1350P, Intel Iris Xe Graphics G7 80EUs
86.2 (15.1min, 23.6P1) fps +18%
Media Intel Iris Xe Graphics G7 96EUs
  (48.5 - 115.1, n=168)
84.8 fps +16%
Acer Enduro Urban N3 EUN314
Intel Core i7-1165G7, Intel Iris Xe Graphics G7 96EUs
82.9 (19.2min, 30.7P1) fps +14%
Getac S410 Gen 4
Intel Core i7-1185G7, Intel Iris Xe Graphics G7 96EUs
79.2 (17.9min, 27.8P1) fps +8%
Durabook S15
Intel Core i7-1255U, Intel Iris Xe Graphics G7 96EUs
73 (12.2min, 23P1) fps
1920x1080 medium AA:medium AF:4
Getac S410 G5
Intel Core i5-1350P, Intel Iris Xe Graphics G7 80EUs
38.9 (15.2min, 23.6P1) fps +20%
Media Intel Iris Xe Graphics G7 96EUs
  (18.2 - 51.4, n=166)
36.5 fps +13%
Acer Enduro Urban N3 EUN314
Intel Core i7-1165G7, Intel Iris Xe Graphics G7 96EUs
34.1 (10.7min, 19.3P1) fps +5%
Durabook S15
Intel Core i7-1255U, Intel Iris Xe Graphics G7 96EUs
32.4 (7.8min, 12.2P1) fps
Getac S410 Gen 4
Intel Core i7-1185G7, Intel Iris Xe Graphics G7 96EUs
31.5 (8.3min, 12.3P1) fps -3%
1920x1080 high AA:high AF:8
Getac S410 G5
Intel Core i5-1350P, Intel Iris Xe Graphics G7 80EUs
31 (5min, 12.6P1) fps +16%
Media Intel Iris Xe Graphics G7 96EUs
  (15.4 - 39.8, n=165)
29.3 fps +10%
Acer Enduro Urban N3 EUN314
Intel Core i7-1165G7, Intel Iris Xe Graphics G7 96EUs
28.2 (8.4min, 14.1P1) fps +6%
Getac S410 Gen 4
Intel Core i7-1185G7, Intel Iris Xe Graphics G7 96EUs
26.8 (6.7min, 9.67P1) fps 0%
Durabook S15
Intel Core i7-1255U, Intel Iris Xe Graphics G7 96EUs
26.7 (5.3min, 8.7P1) fps
1920x1080 ultra AA:ultra AF:16
Getac S410 G5
Intel Core i5-1350P, Intel Iris Xe Graphics G7 80EUs
25.1 (5.1min, 7.53P1) fps +15%
Media Intel Iris Xe Graphics G7 96EUs
  (13.2 - 31.7, n=163)
23.7 fps +8%
Acer Enduro Urban N3 EUN314
Intel Core i7-1165G7, Intel Iris Xe Graphics G7 96EUs
22.7 (5min, 6.41P1) fps +4%
Getac S410 Gen 4
Intel Core i7-1185G7, Intel Iris Xe Graphics G7 96EUs
22 (5min, 5.79P1) fps 0%
Durabook S15
Intel Core i7-1255U, Intel Iris Xe Graphics G7 96EUs
21.9 (5min, 5.78P1) fps
Tiny Tina's Wonderlands
1280x720 Lowest Preset (DX12)
Media Intel Iris Xe Graphics G7 96EUs
  (25.9 - 67.3, n=31)
49.4 fps +91%
Durabook S15
Intel Core i7-1255U, Intel Iris Xe Graphics G7 96EUs
25.9 fps
1920x1080 Low Preset (DX12)
Media Intel Iris Xe Graphics G7 96EUs
  (22.3 - 53, n=31)
29.7 fps +27%
Durabook S15
Intel Core i7-1255U, Intel Iris Xe Graphics G7 96EUs
23.4 fps
F1 22
1280x720 Ultra Low Preset AA:T AF:16x
Media Intel Iris Xe Graphics G7 96EUs
  (57.4 - 94.6, n=52)
75.8 fps +32%
Durabook S15
Intel Core i7-1255U, Intel Iris Xe Graphics G7 96EUs
57.4 (39min, 41P1) fps
1920x1080 Low Preset AA:T AF:16x
Media Intel Iris Xe Graphics G7 96EUs
  (33.3 - 57.2, n=57)
44.6 fps +29%
Durabook S15
Intel Core i7-1255U, Intel Iris Xe Graphics G7 96EUs
34.7 (25min, 25P1) fps
1920x1080 Medium Preset AA:T AF:16x
Media Intel Iris Xe Graphics G7 96EUs
  (28 - 52.3, n=57)
40.3 fps +38%
Durabook S15
Intel Core i7-1255U, Intel Iris Xe Graphics G7 96EUs
29.1 (22min, 21P1) fps
Baldur's Gate 3
1280x720 Low Preset
Media Intel Iris Xe Graphics G7 96EUs
  (14.5 - 28.2, n=7)
22.8 fps +57%
Durabook S15
Intel Core i7-1255U, Intel Iris Xe Graphics G7 96EUs
14.5 fps
1920x1080 Low Preset
Media Intel Iris Xe Graphics G7 96EUs
  (9.4 - 19.9, n=7)
15.6 fps +66%
Durabook S15
Intel Core i7-1255U, Intel Iris Xe Graphics G7 96EUs
9.4 fps
Cyberpunk 2077 2.1 Phantom Liberty
1280x720 Low Preset (FSR off)
Media Intel Iris Xe Graphics G7 96EUs
  (21.4 - 37.3, n=12)
28.9 fps +26%
Durabook S15
Intel Core i7-1255U, Intel Iris Xe Graphics G7 96EUs
23 (17.7min) fps
1920x1080 Low Preset (FSR off)
Media Intel Iris Xe Graphics G7 96EUs
  (13.1 - 22.5, n=12)
17.3 fps +20%
Durabook S15
Intel Core i7-1255U, Intel Iris Xe Graphics G7 96EUs
14.4 (12min) fps

Witcher 3 FPS Chart

051015202530354045505560657075Tooltip
Durabook S15: Ø75.2 (64-79)
bassomedioaltoultra
The Witcher 3 (2015) 60.2 46 24.9 12.5
Dota 2 Reborn (2015) 93.7 65.7 51.8 46.8
Final Fantasy XV Benchmark (2018) 35.2 20.1 14.7
X-Plane 11.11 (2018) 44.8 33.3 30.2
Far Cry 5 (2018) 23 22 19 19
Strange Brigade (2018) 73 32.4 26.7 21.9
Tiny Tina's Wonderlands (2022) 23.4
F1 22 (2022) 34.7 29.1 22.1
Baldur's Gate 3 (2023) 9.4
Cyberpunk 2077 2.1 Phantom Liberty (2023) 14.4

Emissioni

Rumore del sistema

Il rumore della ventola è uno dei più silenziosi per qualsiasi computer portatile della categoria rugged. Quando si eseguono carichi molto impegnativi, come giochi o Prime95, il rumore della ventola può raggiungere un massimo di 37 dB(A), prima di ridursi rapidamente a 28 dB(A), quasi silenziosi. Questo approccio molto conservativo integra le prestazioni della CPU inferiori alla media menzionate in precedenza. Quando si considera il pubblico delle applicazioni governative o scientifiche, il rumore della ventola più silenzioso è probabilmente preferibile, anche se comporta prestazioni ridotte.

Slot 2x SODIMM accessibili
La soluzione di raffreddamento consiste in una ventola da 40 a 45 mm e in un tubo di calore corto
Profilo del rumore del ventilatore (Bianco: Sfondo, Rosso: Sistema inattivo, Blu: 3DMark 06, Arancione: Witcher 3 verde: Prime95 stress)

Rumorosità

Idle
26.3 / 26.3 / 26.8 dB(A)
Sotto carico
27.7 / 37.4 dB(A)
  red to green bar
 
 
30 dB
silenzioso
40 dB(A)
udibile
50 dB(A)
rumoroso
 
min: dark, med: mid, max: light   Earthworks M23R, Arta (15 cm di distanza)   Rumorosità ambientale: 24.6 dB(A)
dB(A) 0102030405060708090Deep BassMiddle BassHigh BassLower RangeMidsHigher MidsLower HighsMid HighsUpper HighsSuper Highs2040.938.139.740.738.92534.930.632.929.828.53129.227.828.927.125.94022.623.123.321.720.9502529.224.623.127.16328.227.124.923.829.88025.923.425.525.625.210022.720.821.421.322.812520.81919.418.921.316020.516.818.615.920.22001717.116.915.421.325015.115.814.913.722.231516.317.615.516.323.740014.316.614.514.224.450012.912.512.612.825.463012.713.112.211.92680010.911.31111.527.4100010.310.710.410.426.2125010.410.810.31028.4160011.511.510.910.429200013.413.512.710.725.4250012.913.212.71127.2315013.81412.411.624.8400017.217.215.11220.7500018.117.815.512.319.2630015.915.515.612.616.6800017.918.616.613171000019.119.518.513.6191250019.42118.51618.11600022.523.218.819.722.3SPL27.427.726.324.437.4N0.80.90.70.62.5median 15.9median 16.6median 15.1median 12.8median 22.8Delta3.12.92.82.33hearing rangehide median Fan NoiseDurabook S15
Durabook S15
Iris Xe G7 96EUs, i7-1255U, Kingston OM8SEP4512Q-AA
Durabook S15ABG2
UHD Graphics 620, i5-8265U, UDinfo HF3-25UB HF325UB256GBA2P
Panasonic Toughbook 40
Iris Xe G7 96EUs, i7-1185G7, Samsung PM991 MZVLQ1T0HALB
Getac S410 G5
Iris Xe G7 80EUs, i5-1350P, SSSTC CL4-8D512
Dell Latitude 5420 Rugged-P85G
Radeon RX 540, i7-8650U, SK hynix PC401 NVMe 500 GB
Acer Enduro Urban N3 EUN314
Iris Xe G7 96EUs, i7-1165G7, Samsung PM991 MZVLQ1T0HALB
Noise
-13%
-10%
-12%
-8%
-1%
off /ambiente *
24.6
29.3
-19%
22.8
7%
23.4
5%
28.3
-15%
23.8
3%
Idle Minimum *
26.3
29.3
-11%
26
1%
23.4
11%
28.3
-8%
24.1
8%
Idle Average *
26.3
29.3
-11%
26
1%
25.9
2%
28.3
-8%
24.1
8%
Idle Maximum *
26.8
29.3
-9%
26
3%
26
3%
28.3
-6%
24.1
10%
Load Average *
27.7
35.5
-28%
37.6
-36%
38.7
-40%
29.9
-8%
27.9
-1%
Witcher 3 ultra *
27.4
37.8
-38%
42.1
-54%
35.7
-30%
Load Maximum *
37.4
38
-2%
40.3
-8%
42.1
-13%
38
-2%
38.6
-3%

* ... Meglio usare valori piccoli

Temperatura

La metà destra del sistema sarà sempre più calda di quella sinistra, a causa del posizionamento della batteria e della soluzione di raffreddamento. I punti caldi sul fondo possono raggiungere poco più di 40 C, come nel caso dei modelli più spessi e più pesanti Panasonic Toughbook 40 o al vecchio Durabook S15ABG2.

Scarico posteriore
Scarico posteriore
L'adattatore CA raggiunge oltre 33 C quando si utilizzano carichi impegnativi
Carico massimo
 26.4 °C38.6 °C34.2 °C 
 25.4 °C33.4 °C34.8 °C 
 24.4 °C28 °C32.6 °C 
Massima: 38.6 °C
Media: 30.9 °C
40.4 °C41 °C36 °C
39.8 °C40.2 °C34.6 °C
36.4 °C30.2 °C25.4 °C
Massima: 41 °C
Media: 36 °C
Alimentazione (max)  35 °C | Temperatura della stanza 20 °C | Fluke 62 Mini IR Thermometer
(+) La temperatura media del lato superiore sotto carico massimo e' di 30.9 °C / 88 F, rispetto alla media di 29.5 °C / 85 F per i dispositivi di questa classe Office.
(+) La temperatura massima sul lato superiore è di 38.6 °C / 101 F, rispetto alla media di 34.3 °C / 94 F, che varia da 21.2 a 62.5 °C per questa classe Office.
(±) Il lato inferiore si riscalda fino ad un massimo di 41 °C / 106 F, rispetto alla media di 36.8 °C / 98 F
(+) In idle, la temperatura media del lato superiore è di 26.6 °C / 80 F, rispetto alla media deld ispositivo di 29.5 °C / 85 F.
(+) I poggiapolsi e il touchpad raggiungono la temperatura massima della pelle (32.6 °C / 90.7 F) e quindi non sono caldi.
(-) La temperatura media della zona del palmo della mano di dispositivi simili e'stata di 27.7 °C / 81.9 F (-4.9 °C / -8.8 F).
Sistema inattivo (in alto)
Sistema inattivo (in basso)
Stress Prime95+FurMark (in alto)
Stress Prime95+FurMark (in basso)
Durabook S15
Intel Core i7-1255U, Intel Iris Xe Graphics G7 96EUs
Durabook S15ABG2
Intel Core i5-8265U, Intel UHD Graphics 620
Panasonic Toughbook 40
Intel Core i7-1185G7, Intel Iris Xe Graphics G7 96EUs
Getac S410 G5
Intel Core i5-1350P, Intel Iris Xe Graphics G7 80EUs
Dell Latitude 5420 Rugged-P85G
Intel Core i7-8650U, AMD Radeon RX 540
Acer Enduro Urban N3 EUN314
Intel Core i7-1165G7, Intel Iris Xe Graphics G7 96EUs
Heat
-3%
4%
-1%
-6%
1%
Maximum Upper Side *
38.6
44
-14%
35.6
8%
37
4%
42.2
-9%
37.8
2%
Maximum Bottom *
41
42
-2%
40
2%
42.2
-3%
42
-2%
45.8
-12%
Idle Upper Side *
28.8
28
3%
28.6
1%
28.8
-0%
31.6
-10%
26.4
8%
Idle Bottom *
31.4
30.6
3%
29.4
6%
33
-5%
31.8
-1%
30.2
4%

* ... Meglio usare valori piccoli

Altoparlanti

Altoparlanti stereo con apertura verso il basso vicino agli angoli anteriori
Gli altoparlanti sono decentemente rumorosi, ma con una forte carenza di bassi. Tuttavia, questo non è raro nei computer portatili rugged
dB(A) 0102030405060708090Deep BassMiddle BassHigh BassLower RangeMidsHigher MidsLower HighsMid HighsUpper HighsSuper Highs2035.539.735.52527.732.927.73127.628.927.64026.323.326.35026.824.626.86327.624.927.68024.925.524.910022.921.422.912522.319.422.316025.818.625.82002816.92825034.414.934.431540.815.540.840050.414.550.450058.612.658.663064.912.264.980073.61173.610007510.475125072.210.372.2160073.910.973.9200074.312.774.3250075.612.775.631507612.47640007915.179500070.715.570.7630076.315.676.3800075.116.675.11000072.518.572.51250069.318.569.3160006918.869SPL86.726.386.7N65.70.765.7median 70.7median 15.1median 70.7Delta142.81426.325.821.422.12624.925.127.622.532.523.448.72655.818.860.922.167.2267019.372.317.674.217.774.319.575.31571.711.871.311.27410.574.21072.710.17210.67210.97511.374.811.671.71269.71269.612.371.112.669.61270.111.269.824.784.70.666.6median 12median 71.73.42.2hearing rangehide median Pink NoiseDurabook S15Apple MacBook Pro 16 2021 M1 Pro
Diagramma frequenza (le caselle possono essere selezionate/deselezionate per confrontare i dispositivi)
Durabook S15 analisi audio

(+) | gli altoparlanti sono relativamente potenti (86.7 dB)
Bassi 100 - 315 Hz
(-) | quasi nessun basso - in media 41.6% inferiori alla media
(+) | bassi in lineaa (6.3% delta rispetto alla precedente frequenza)
Medi 400 - 2000 Hz
(±) | medi ridotti - circa 6.7% inferiori alla media
(±) | linearità dei medi adeguata (8.8% delta rispetto alla precedente frequenza)
Alti 2 - 16 kHz
(+) | Alti bilanciati - appena 4.4% dalla media
(+) | alti lineari (5.7% delta rispetto alla precedente frequenza)
Nel complesso 100 - 16.000 Hz
(±) | la linearità complessiva del suono è media (25.8% di differenza rispetto alla media
Rispetto alla stessa classe
» 77% di tutti i dispositivi testati in questa classe è stato migliore, 8% simile, 16% peggiore
» Il migliore ha avuto un delta di 7%, medio di 22%, peggiore di 53%
Rispetto a tutti i dispositivi testati
» 77% di tutti i dispositivi testati in questa classe è stato migliore, 5% similare, 19% peggiore
» Il migliore ha avuto un delta di 4%, medio di 25%, peggiore di 134%

Apple MacBook Pro 16 2021 M1 Pro analisi audio

(+) | gli altoparlanti sono relativamente potenti (84.7 dB)
Bassi 100 - 315 Hz
(+) | bassi buoni - solo 3.8% dalla media
(+) | bassi in lineaa (5.2% delta rispetto alla precedente frequenza)
Medi 400 - 2000 Hz
(+) | medi bilanciati - solo only 1.3% rispetto alla media
(+) | medi lineari (2.1% delta rispetto alla precedente frequenza)
Alti 2 - 16 kHz
(+) | Alti bilanciati - appena 1.9% dalla media
(+) | alti lineari (2.7% delta rispetto alla precedente frequenza)
Nel complesso 100 - 16.000 Hz
(+) | suono nel complesso lineare (4.6% differenza dalla media)
Rispetto alla stessa classe
» 0% di tutti i dispositivi testati in questa classe è stato migliore, 0% simile, 100% peggiore
» Il migliore ha avuto un delta di 5%, medio di 18%, peggiore di 45%
Rispetto a tutti i dispositivi testati
» 0% di tutti i dispositivi testati in questa classe è stato migliore, 0% similare, 100% peggiore
» Il migliore ha avuto un delta di 4%, medio di 25%, peggiore di 134%

Gestione dell'energia

Consumo di energia

Il funzionamento al minimo sul desktop richiede tra i 4 W e i 16 W, un consumo sensibilmente superiore a quello del 2020 S15ABG2. Tuttavia, l'aumento del consumo può essere attribuito al display molto più luminoso del nostro S15, dove la differenza tra la luminosità minima e la luminosità massima è di circa 10 W.

Il consumo complessivo, quando si eseguono carichi più elevati, è leggermente inferiore a quello del modello Getac S410 G5 che ha una CPU più veloce della serie Core-P. Il consumo massimo può temporaneamente raggiungere i 77 W quando la CPU è sotto sforzo, prima che intervengano le limitazioni termiche, come mostrano i grafici sottostanti. Il sistema è compatibile con la maggior parte degli adattatori CA USB-C generici e quindi l'adattatore proprietario da 90 W CA a barile (~15 x 6,4 x 2,6 cm) che viene fornito nella confezione non è assolutamente necessario.

Witcher 3 consumo 1080p Ultra
consumo 3DMark 06
consumo 3DMark 06
L'avvio di Prime95 causerebbe un'impennata del consumo fino a 70 W, prima di scendere, risalire e infine scendere di nuovo a 35 W stabili
Lo stress di Prime95+FurMark è iniziato al 10s
Consumo di corrente
Off / Standbydarklight 0.24 / 1.2 Watt
Idledarkmidlight 4.4 / 14.9 / 15.6 Watt
Sotto carico midlight 45.5 / 76.2 Watt
 color bar
Leggenda: min: dark, med: mid, max: light        Metrahit Energy
Durabook S15
i7-1255U, Iris Xe G7 96EUs, Kingston OM8SEP4512Q-AA, IPS, 1920x1080, 15.6"
Durabook S15ABG2
i5-8265U, UHD Graphics 620, UDinfo HF3-25UB HF325UB256GBA2P, TN LED, 1920x1080, 15.6"
Panasonic Toughbook 40
i7-1185G7, Iris Xe G7 96EUs, Samsung PM991 MZVLQ1T0HALB, IPS, 1920x1080, 14"
Getac S410 G5
i5-1350P, Iris Xe G7 80EUs, SSSTC CL4-8D512, IPS, 1920x1080, 14"
Dell Latitude 5420 Rugged-P85G
i7-8650U, Radeon RX 540, SK hynix PC401 NVMe 500 GB, IPS, 1920x1080, 14"
Acer Enduro Urban N3 EUN314
i7-1165G7, Iris Xe G7 96EUs, Samsung PM991 MZVLQ1T0HALB, IPS, 1920x1080, 14"
Power Consumption
29%
-5%
-29%
-22%
30%
Idle Minimum *
4.4
3.5
20%
4.9
-11%
7.9
-80%
4.8
-9%
3.8
14%
Idle Average *
14.9
7.9
47%
12.3
17%
14.4
3%
13.6
9%
8
46%
Idle Maximum *
15.6
9
42%
14
10%
15.2
3%
13.8
12%
8.7
44%
Load Average *
45.5
39.8
13%
54
-19%
58.4
-28%
67.8
-49%
34.6
24%
Witcher 3 ultra *
40
46.3
-16%
53.7
-34%
69.1
-73%
35.4
11%
Load Maximum *
76.2
59.8
22%
83.6
-10%
106.5
-40%
93.5
-23%
45.4
40%

* ... Meglio usare valori piccoli

Power Consumption Witcher 3 / Stresstest

0102030405060708090100Tooltip
Durabook S15 i7-1255U, Iris Xe G7 96EUs; Witcher 3 ultra: Ø40 (38.3-41.9)
Getac S410 G5 i5-1350P, Iris Xe G7 80EUs; Witcher 3 ultra: Ø53.7 (51.4-76.5)
Durabook S15 i7-1255U, Iris Xe G7 96EUs; 1280x720 Prime95 28.10 and Furmark 1.25: Ø45.4 (42.4-76.1)
Getac S410 G5 i5-1350P, Iris Xe G7 80EUs; 1280x720 Prime95 28.10 and Furmark 1.25: Ø57 (54.3-106.5)
Durabook S15 i7-1255U, Iris Xe G7 96EUs; Idle 150cd/m2: Ø5.47 (4.12-8.71)
Getac S410 G5 i5-1350P, Iris Xe G7 80EUs; Idle 150cd/m2: Ø10.8 (6.86-16.6)

Power Consumption external Monitor

0102030405060708090100Tooltip
Durabook S15 i7-1255U, Iris Xe G7 96EUs; Prime95 V2810 Stress (external Monitor): Ø36.1 (33.2-74.4)
Getac S410 G5 i5-1350P, Iris Xe G7 80EUs; Prime95 V2810 Stress (external Monitor): Ø52.9 (48.7-101.8)
Durabook S15 i7-1255U, Iris Xe G7 96EUs; Cinebench R15 Multi (external Monitor): Ø41 (31-67.9)
Getac S410 G5 i5-1350P, Iris Xe G7 80EUs; Cinebench R15 Multi (external Monitor): Ø69.5 (44.3-97.3)
Durabook S15 i7-1255U, Iris Xe G7 96EUs; 1280x720 FurMark 1.19 GPU Stress Test (external Monitor): Ø33.6 (29.7-49.5)
Getac S410 G5 i5-1350P, Iris Xe G7 80EUs; 1280x720 FurMark 1.19 GPU Stress Test (external Monitor): Ø46.6 (43.8-56.6)
Durabook S15 i7-1255U, Iris Xe G7 96EUs; 1920x1080 The Witcher 3 ultra (external Monitor): Ø33.5 (32.2-35.5)
Getac S410 G5 i5-1350P, Iris Xe G7 80EUs; 1920x1080 The Witcher 3 ultra (external Monitor): Ø46.9 (44.9-52.1)
Durabook S15 i7-1255U, Iris Xe G7 96EUs; Idle 1min (external Monitor): Ø4.42 (3.29-8.91)
Getac S410 G5 i5-1350P, Iris Xe G7 80EUs; Idle 1min (external Monitor): Ø8.02 (6.06-13.5)

Durata della batteria

La ricarica può essere effettuata tramite l'adattatore AC incluso o la maggior parte degli altri adattatori USB-C

La batteria interna è relativamente piccola, 54 Wh, per un'autonomia WLAN reale di circa 8 ore, simile a quella del vecchio modello 2020, quando entrambi sono impostati su una luminosità di 150 nit. Sono disponibili opzioni di batteria secondaria per aumentare la durata della batteria.

La ricarica da vuoto a pieno regime è relativamente lenta: poco più di 2 ore rispetto alle 1,5 ore della maggior parte dei computer portatili consumer.

Autonomia della batteria
Idle (senza WLAN, min luminosità)
17ore 10minuti
WiFi Websurfing
8ore 00minuti
Durabook S15
i7-1255U, Iris Xe G7 96EUs, 56 Wh
Durabook S15ABG2
i5-8265U, UHD Graphics 620, 56 Wh
Panasonic Toughbook 40
i7-1185G7, Iris Xe G7 96EUs, 136 Wh
Getac S410 G5
i5-1350P, Iris Xe G7 80EUs, 150 Wh
Dell Latitude 5420 Rugged-P85G
i7-8650U, Radeon RX 540, 102 Wh
Acer Enduro Urban N3 EUN314
i7-1165G7, Iris Xe G7 96EUs, 50.3 Wh
Autonomia della batteria
-14%
137%
119%
93%
-20%
Reader / Idle
1030
1882
83%
WiFi v1.3
480
411
-14%
1137
137%
1052
119%
972
103%
382
-20%
Load
190

Pro

+ Supporto per la ricarica Thunderbolt e USB-C
+ prestazioni del processore molto migliorate
+ opzione pannello super-luminoso da 1000 nit
+ sottile e leggero per la categoria
+ touchpad reattivo

Contro

- batteria primaria relativamente piccola
- PWM quasi sempre presente
- nessuna opzione touchscreen
- copertura sRGB limitata
- tasti della tastiera spugnosi

Verdetto - Gli interni aggiornati fanno la differenza

In recensione: Durabook S15 2024

Il Durabook S15 2024 si basa sul design che abbiamo recensito nel 2020 per portare la serie al passo con i tempi, pur mantenendo tutte le qualità principali dell'originale. Le caratteristiche esterne familiari sono solide, ma con nuove specifiche hardware come Wi- Fi 6E, opzioni di visualizzazione a 1000 nit, tastiera più grande, Thunderbolt 4 e, naturalmente, prestazioni del processore più veloci. Alcuni utenti, tuttavia, potrebbero essere contrariati dall'eliminazione dello slot SATA III da 2,5 pollici e dalla mancanza del touchscreen. Alcuni modelli concorrenti, come il Getac S410 Gen 5 dispongono di touchscreen, stilo e opzioni Core-P più veloci.

Il Durabook S15 2024 può sembrare uguale dall'esterno, ma l'interno è stato quasi completamente rivisto per introdurre funzioni e opzioni moderne, pur mantenendo la compatibilità con la maggior parte degli accessori.

La presenza di PWM per il controllo della luminosità e il feedback non uniforme dei tasti tra i lati sinistro e destro della tastiera dovrebbero essere migliorati nelle revisioni future. Gli altoparlanti avrebbero potuto essere più rumorosi, mentre l'alloggiamento docking laterale richiede ancora un cacciavite per accedervi, il che può essere scomodo quando si è sul campo. La stragrande maggioranza dei computer portatili più recenti è passata a schermi da 16:10 o 16 pollici, mentre l'S15 inizia a sembrare datato con il suo fattore di forma 16:9 da 15,6 pollici. Nonostante questi inconvenienti, è impressionante che il modello rimanga uno dei più portatili della categoria anche dopo tutti questi anni.

Prezzo e disponibilità

I preventivi sono disponibili se configurati e acquistati direttamente dal produttore.

Durabook S15 - 06/17/2024 v8
Allen Ngo

Chassis
88 / 98 → 90%
Tastiera
80%
Dispositivo di puntamento
77%
Connettività
67 / 80 → 84%
Peso
59 / 20-75 → 70%
Batteria
80%
Display
74%
Prestazioni di gioco
19 / 75 → 25%
Prestazioni Applicazioni
74 / 92 → 80%
Temperatura
91%
Rumorosità
90%
Audio
70%
Fotocamera
41 / 75 → 55%
Media
70%
81%
Office - Media ponderata

Transparency

The selection of devices to be reviewed is made by our editorial team. The test sample was provided to the author as a loan by the manufacturer or retailer for the purpose of this review. The lender had no influence on this review, nor did the manufacturer receive a copy of this review before publication. There was no obligation to publish this review. We never accept compensation or payment in return for our reviews. As an independent media company, Notebookcheck is not subjected to the authority of manufacturers, retailers or publishers.

This is how Notebookcheck is testing

Every year, Notebookcheck independently reviews hundreds of laptops and smartphones using standardized procedures to ensure that all results are comparable. We have continuously developed our test methods for around 20 years and set industry standards in the process. In our test labs, high-quality measuring equipment is utilized by experienced technicians and editors. These tests involve a multi-stage validation process. Our complex rating system is based on hundreds of well-founded measurements and benchmarks, which maintains objectivity. Further information on our test methods can be found here.

Price comparison

Please share our article, every link counts!
Mail Logo
> Recensioni e prove di notebook, tablets e smartphones > Recensioni e prove > Recensioni e prove > Recensione del portatile rugged Durabook S15: Sorprendentemente sottile e leggero per la sua categoria
Allen Ngo, 2024-06-19 (Update: 2024-06-25)