

Recensione della scheda grafica desktop Sparkle Intel Arc A380 Elf - Cosa si può aspettare dalla GPU economica da 129 euro di Intel?

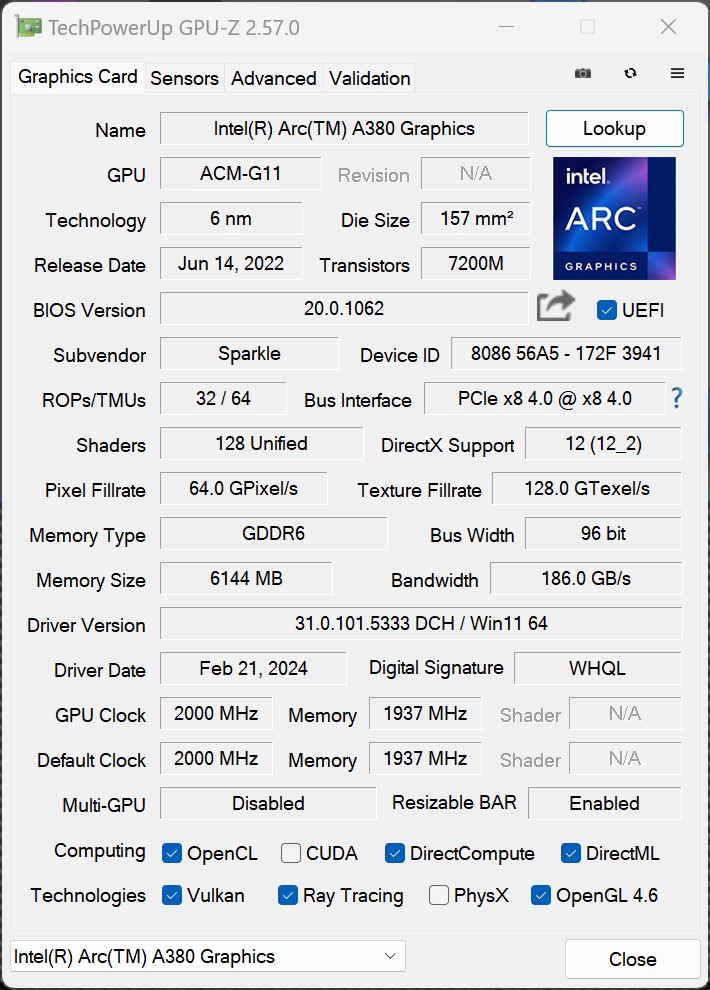
L'Intel Arc A380 costa attualmente 129 Euro (~$141). Ma la GPU entry-level offre comunque 6 GB di VRAM, anche se sono collegati solo tramite una piccola interfaccia di archiviazione a 96 bit. Con DB2-128, si ottiene un chip GPU significativamente più piccolo rispetto alle schede grafiche Intel Arc più potenti.
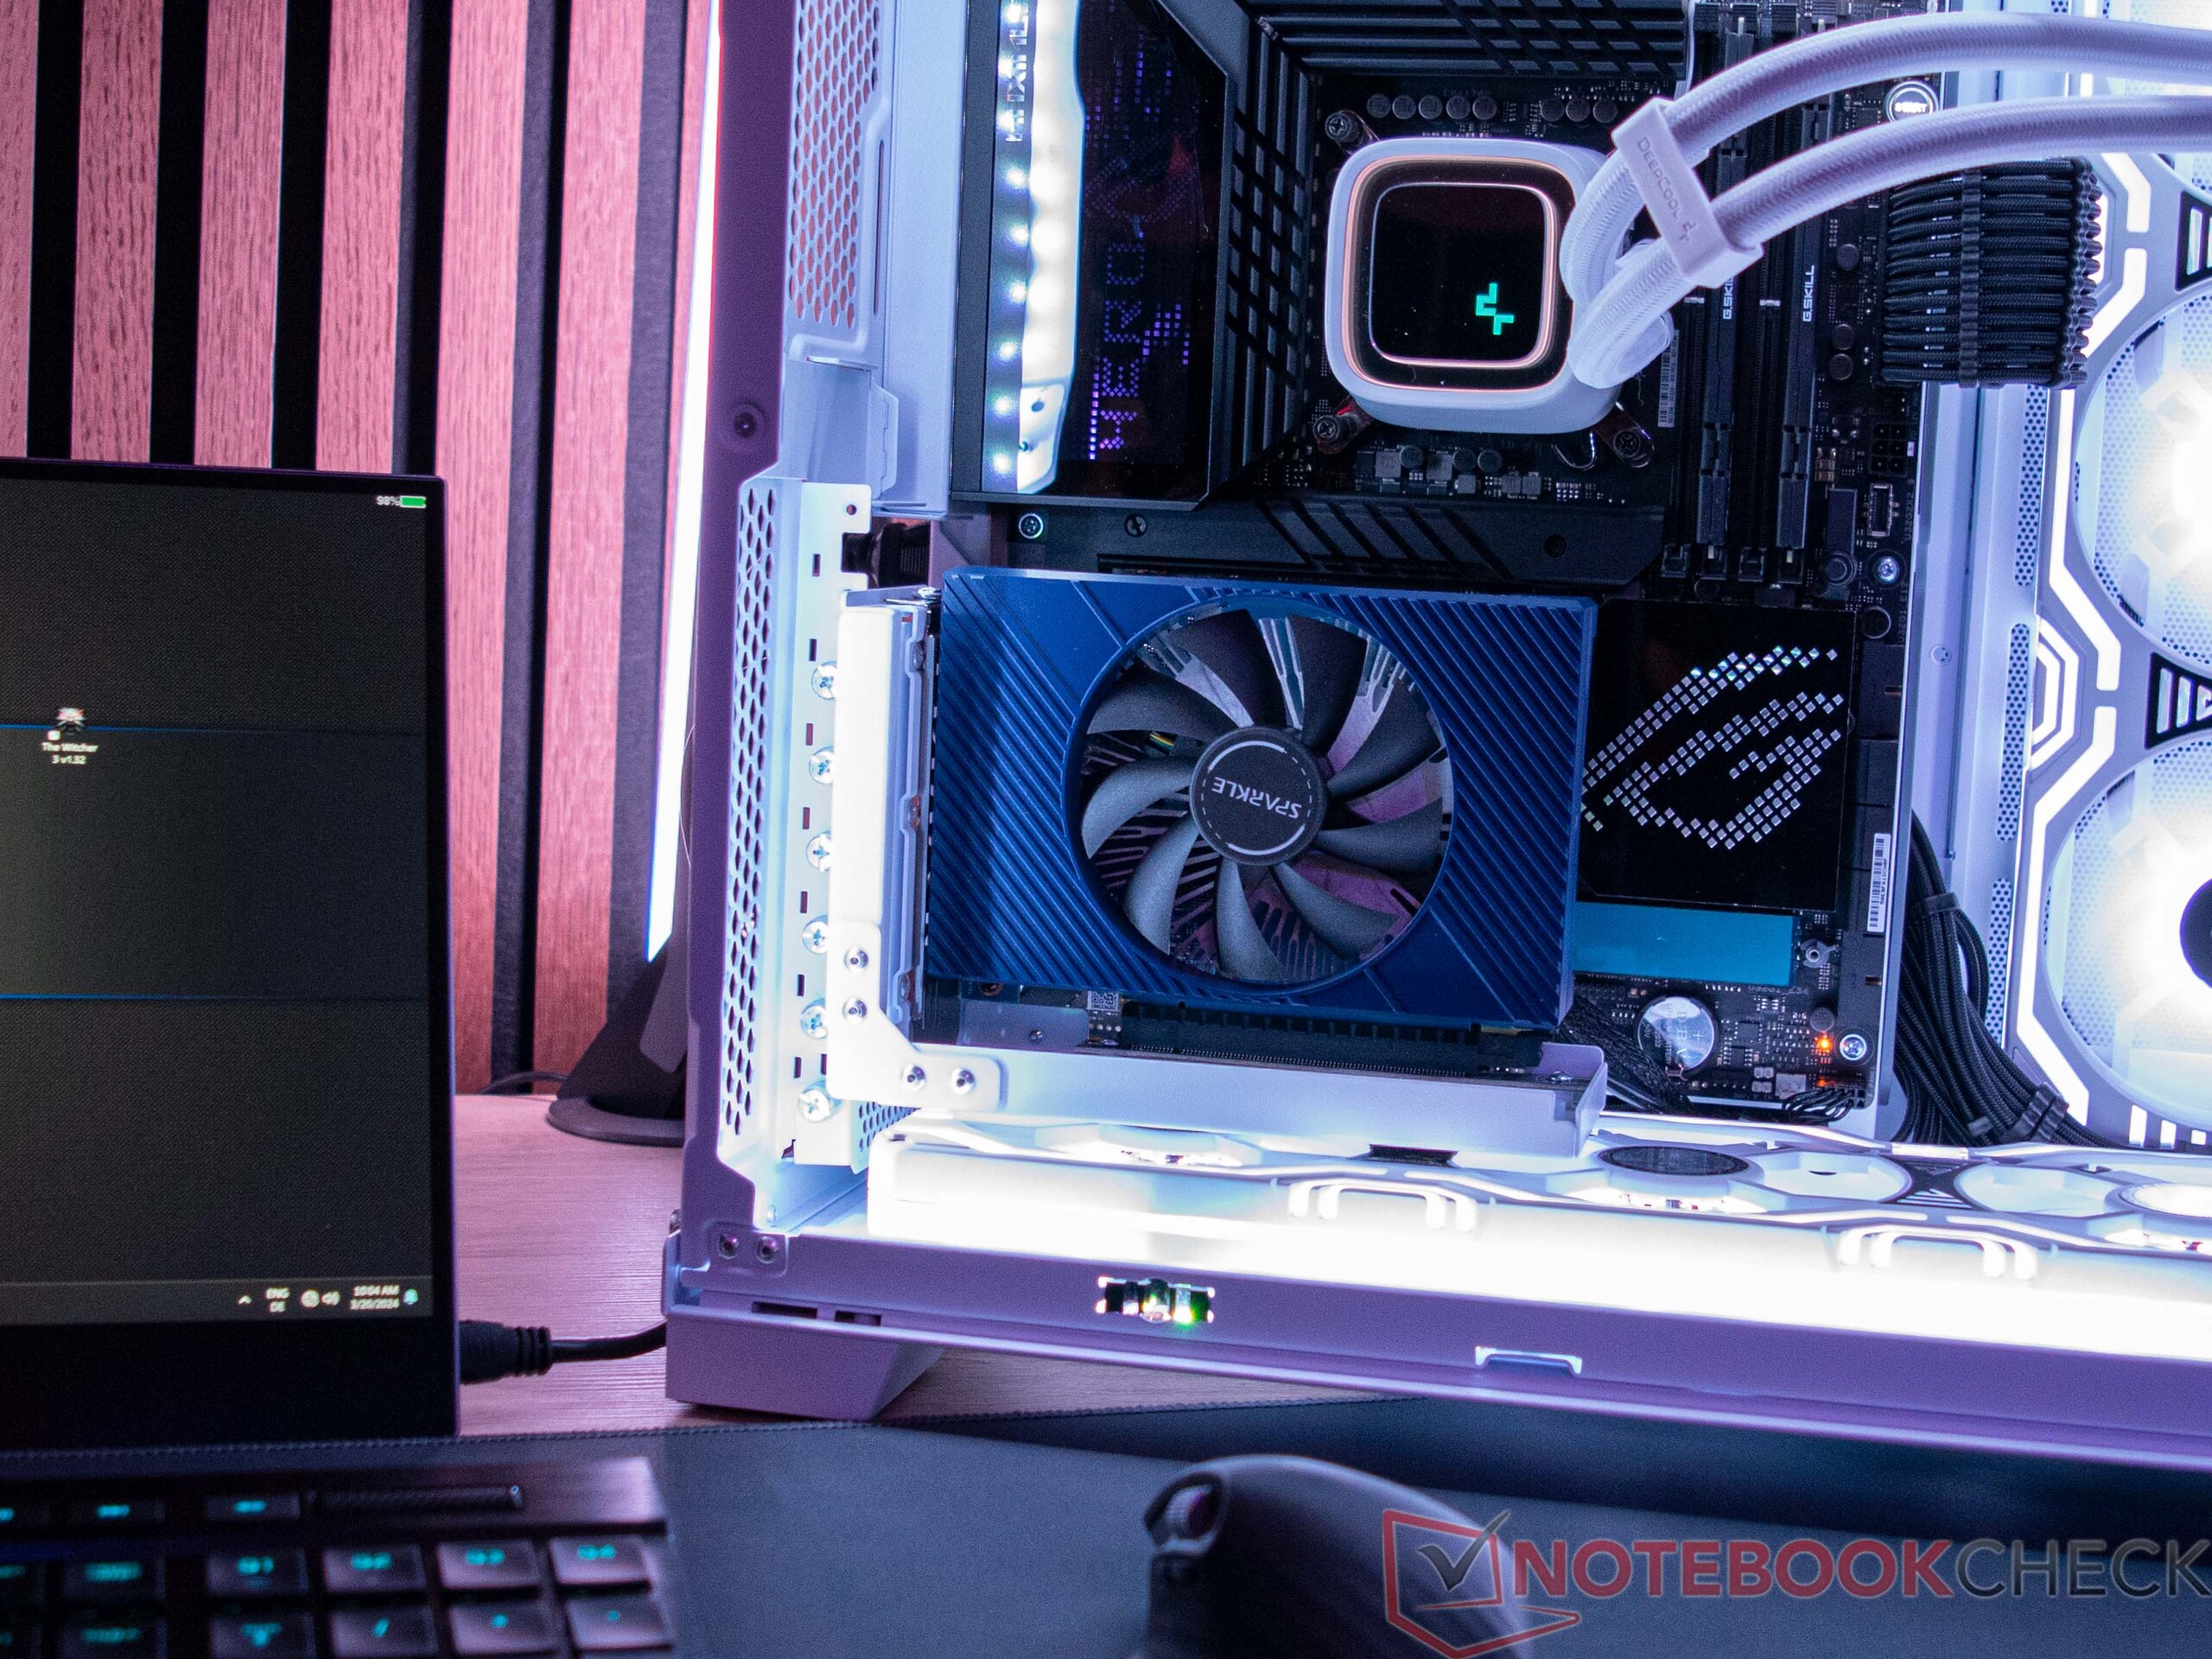
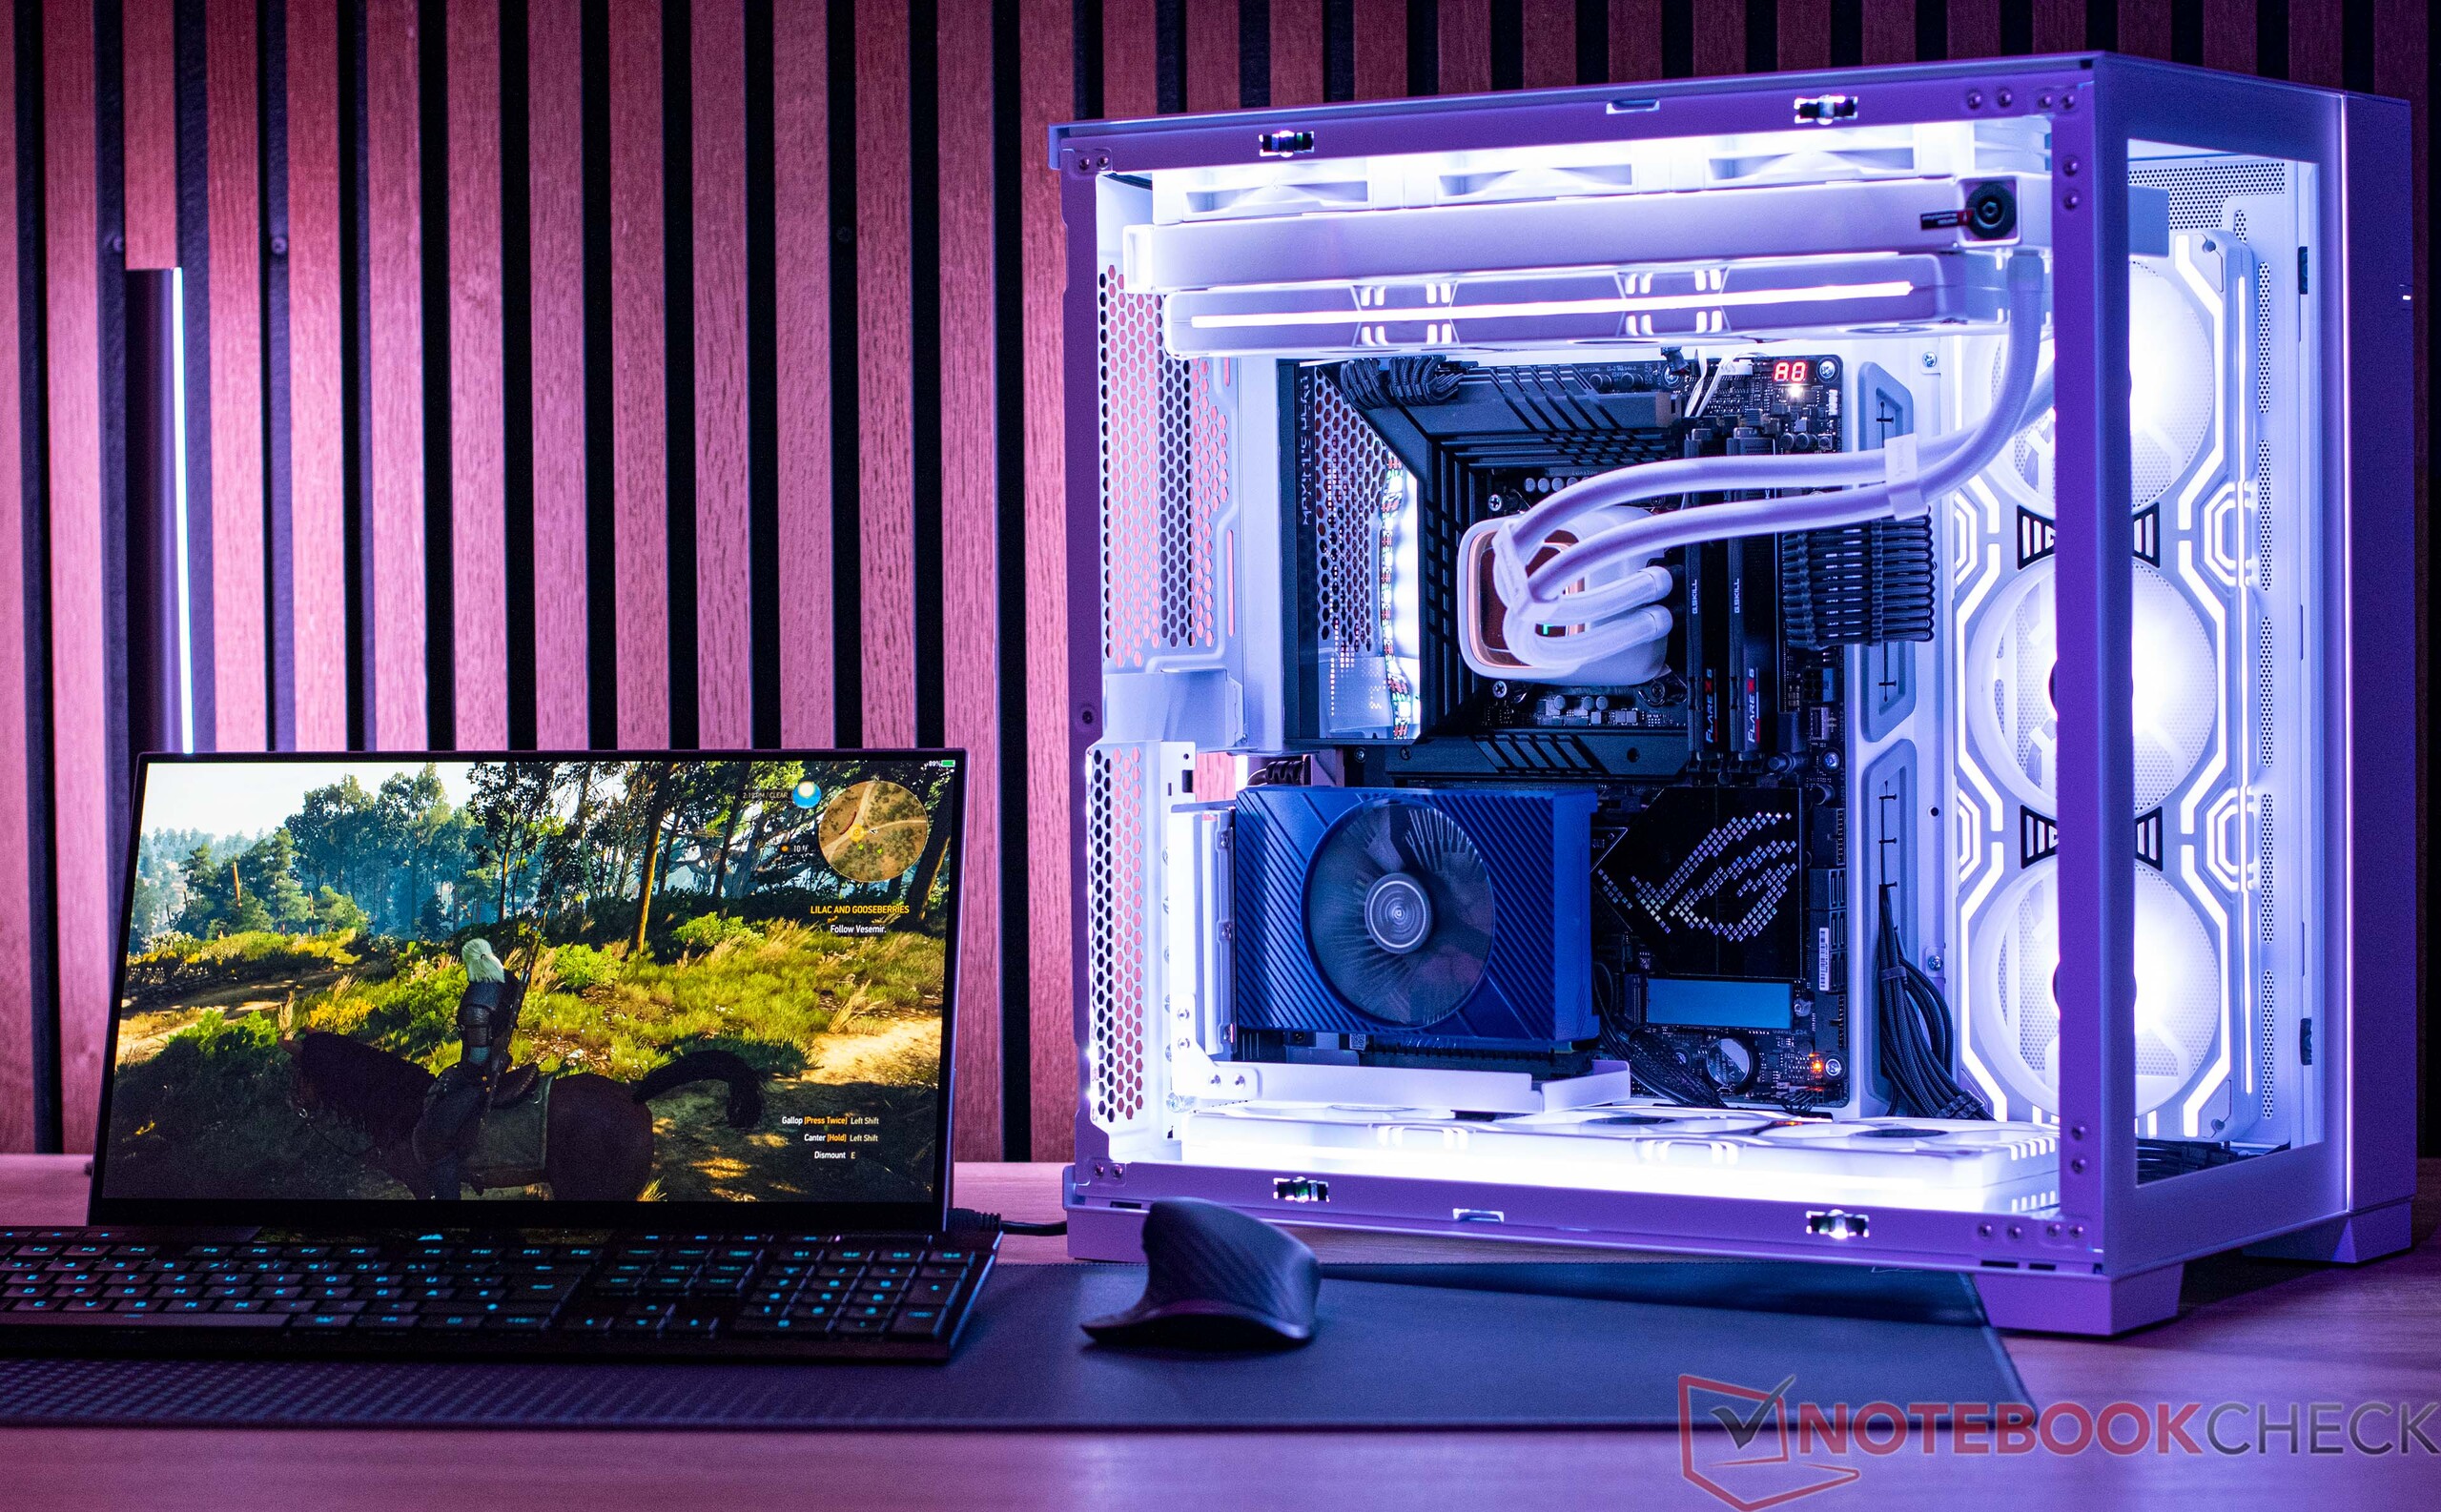
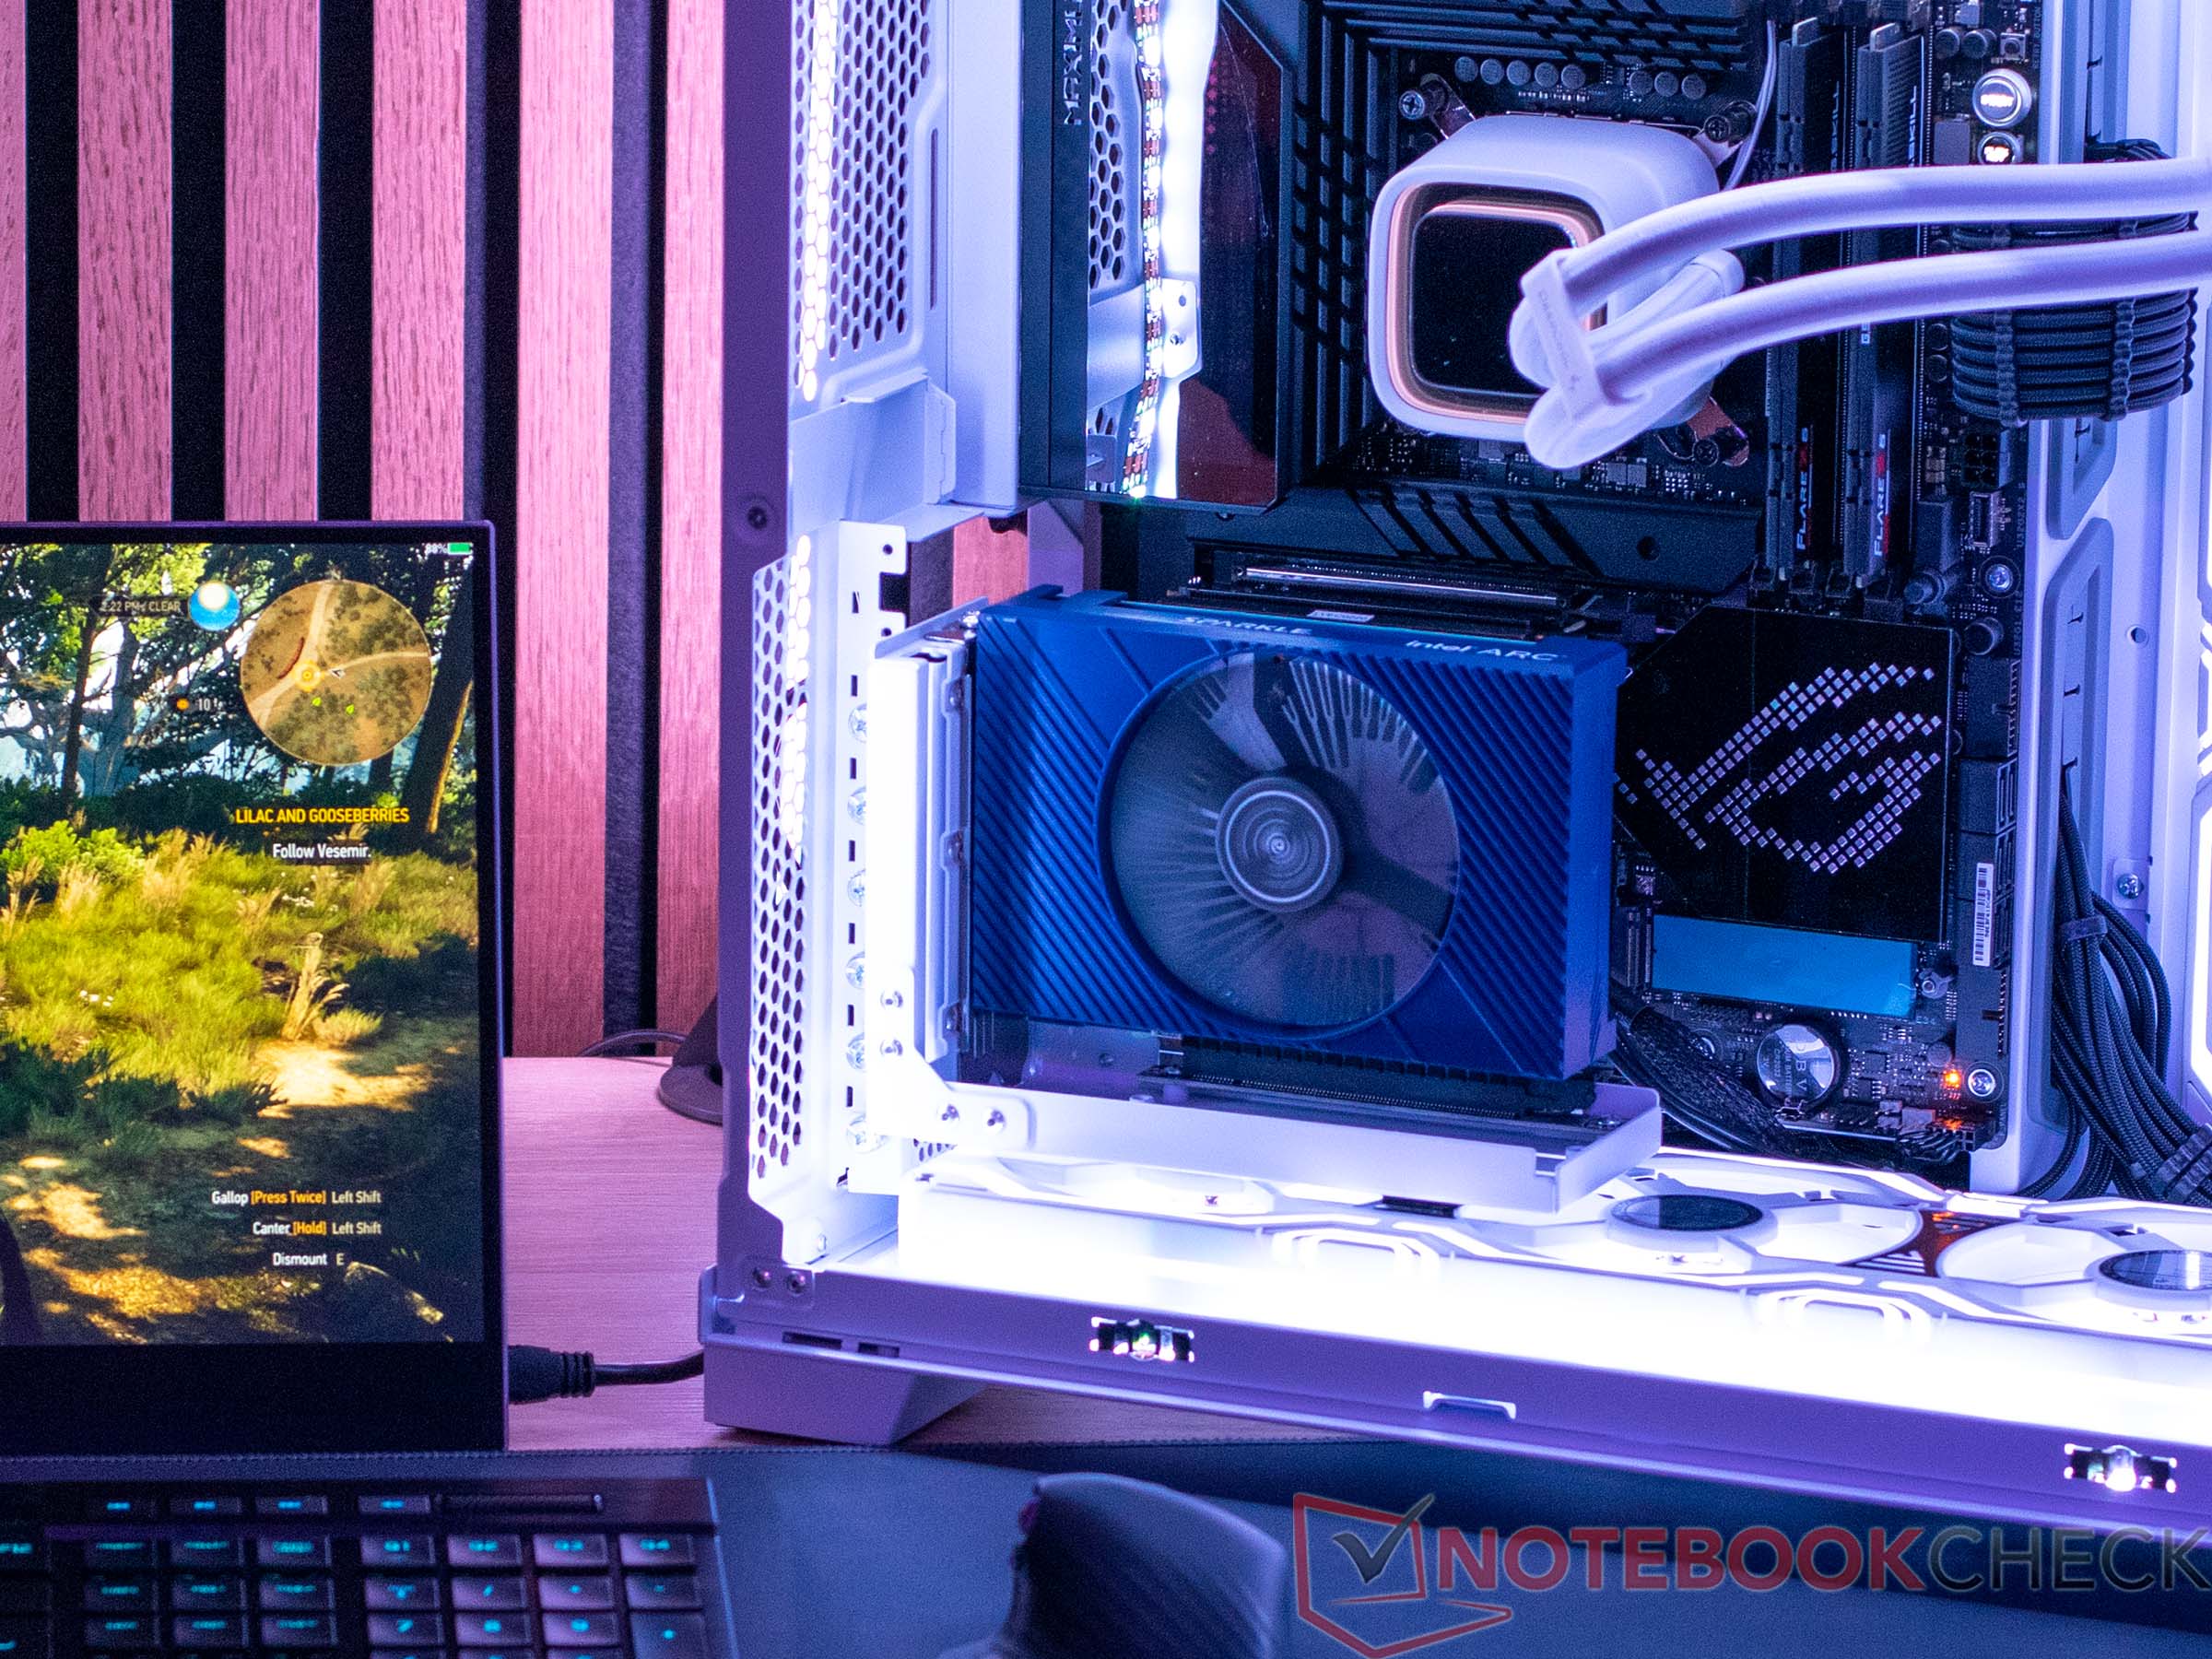
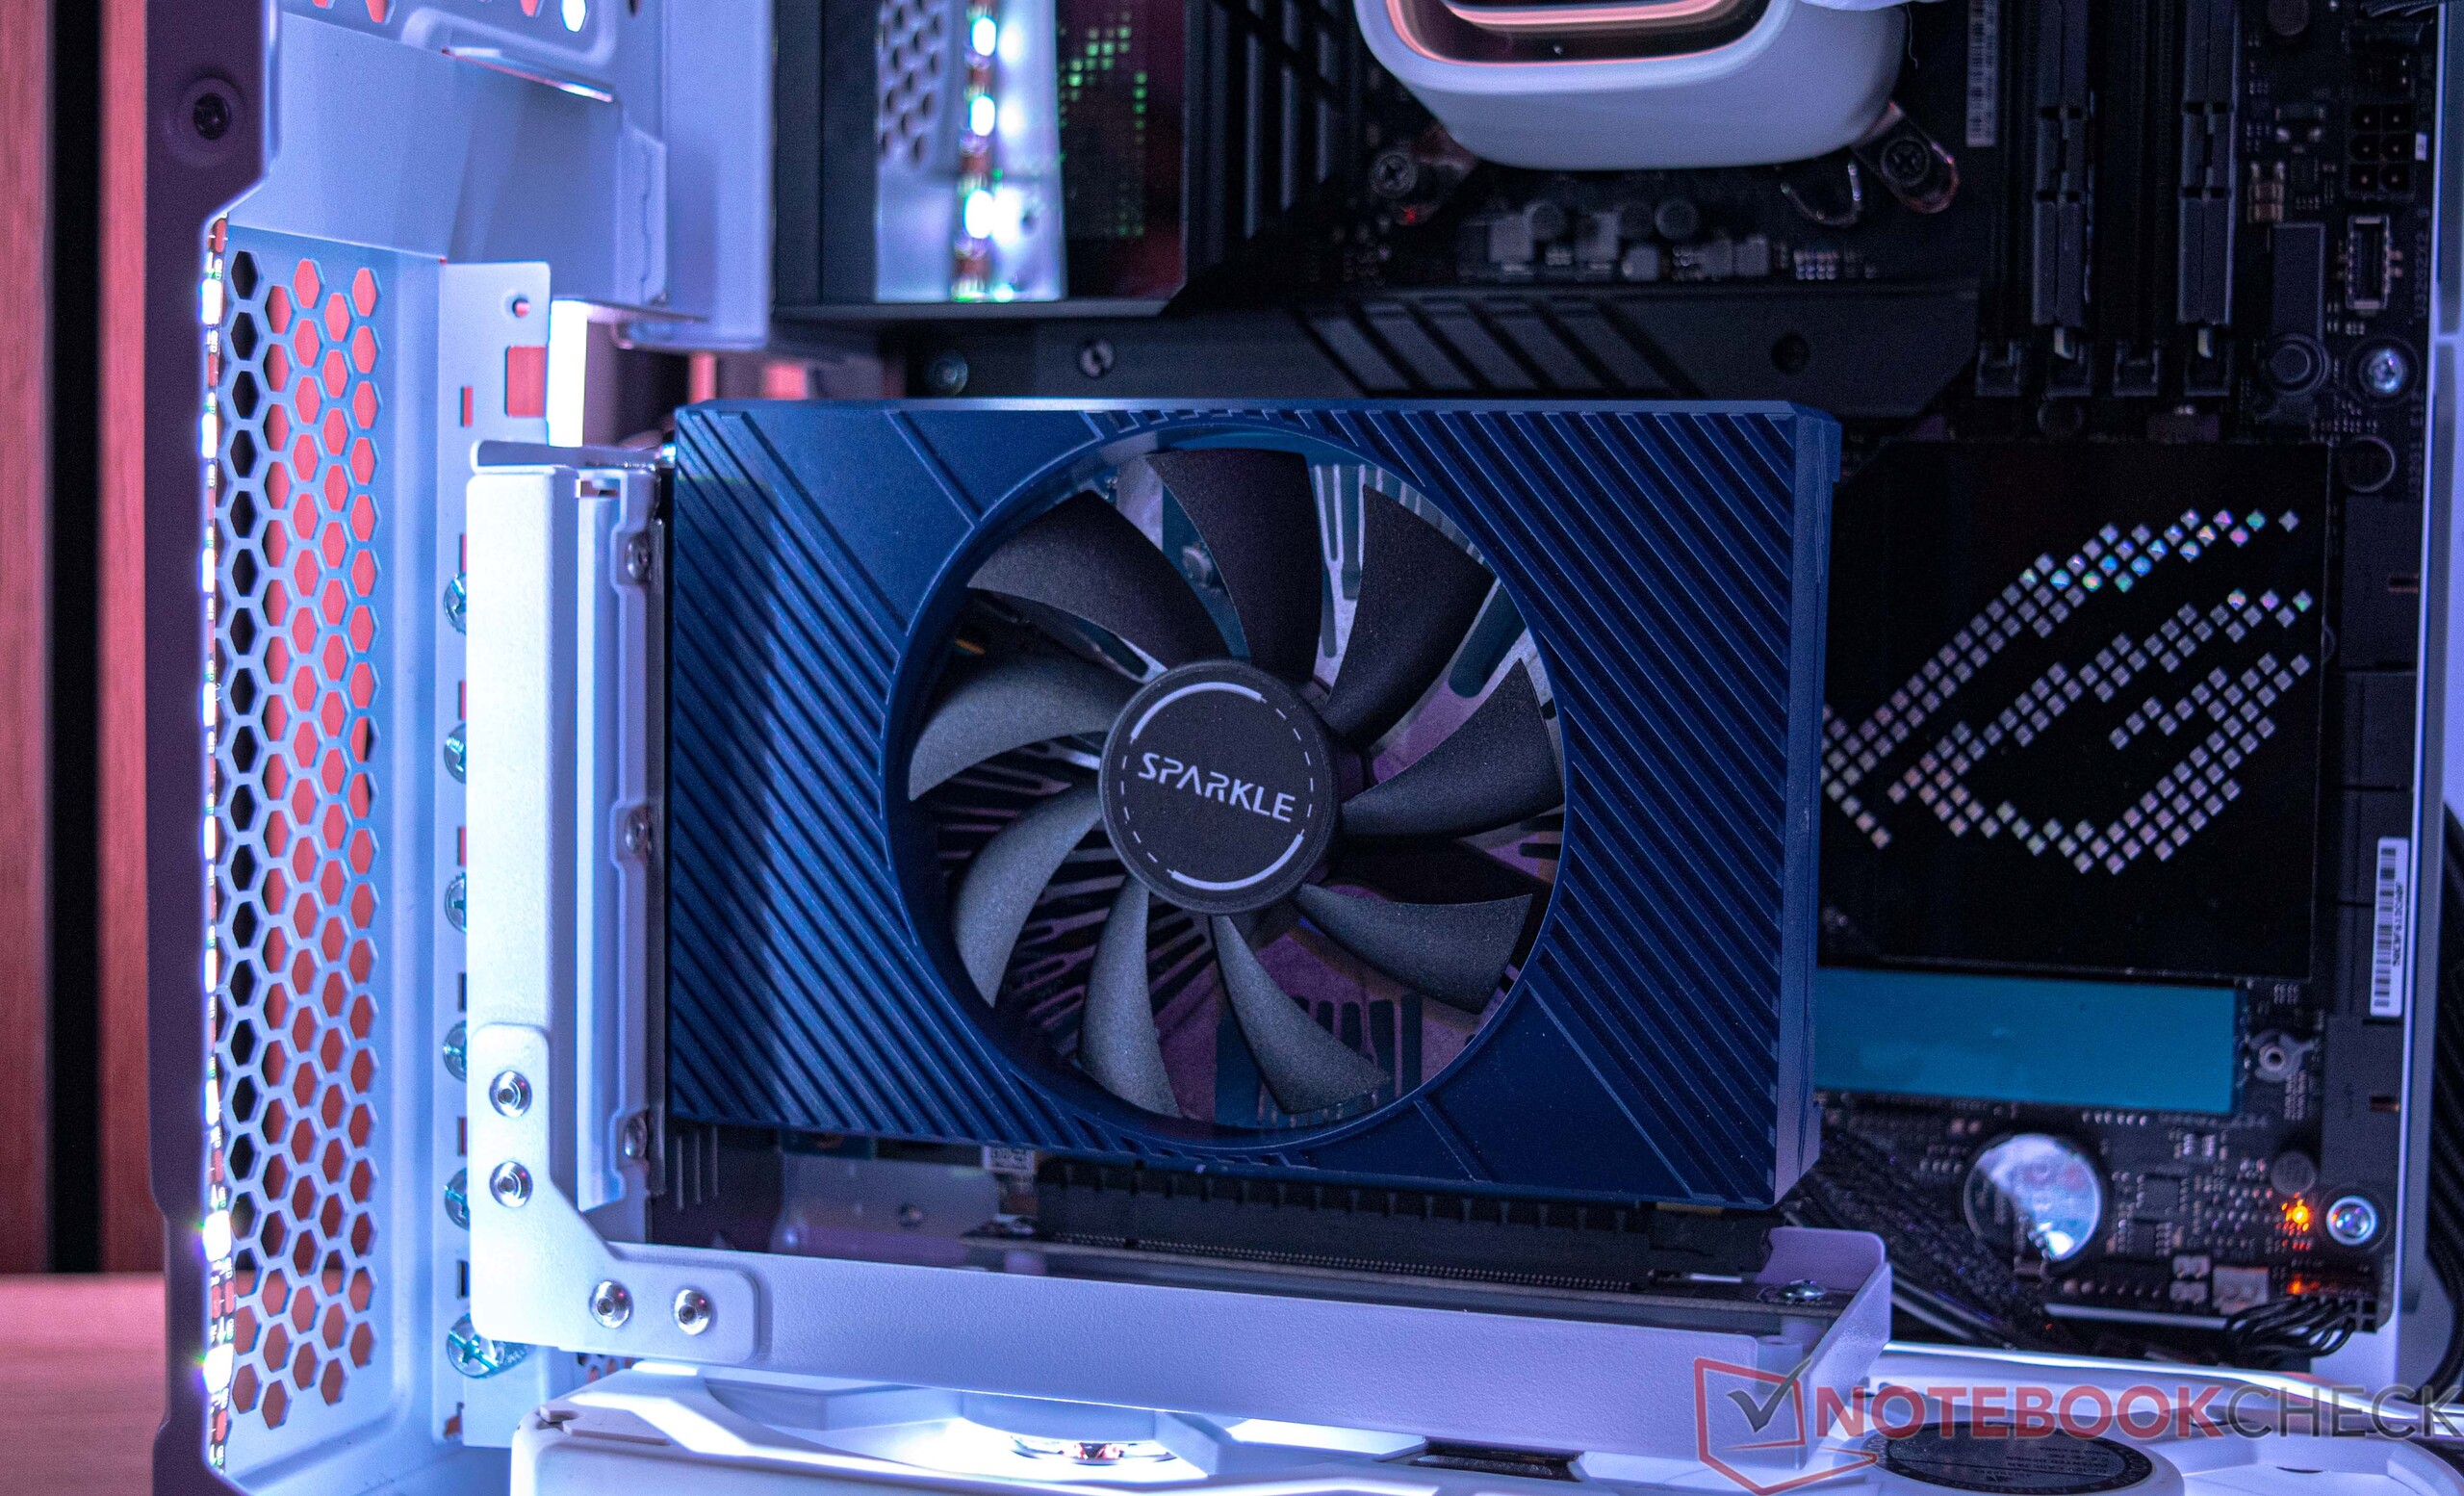
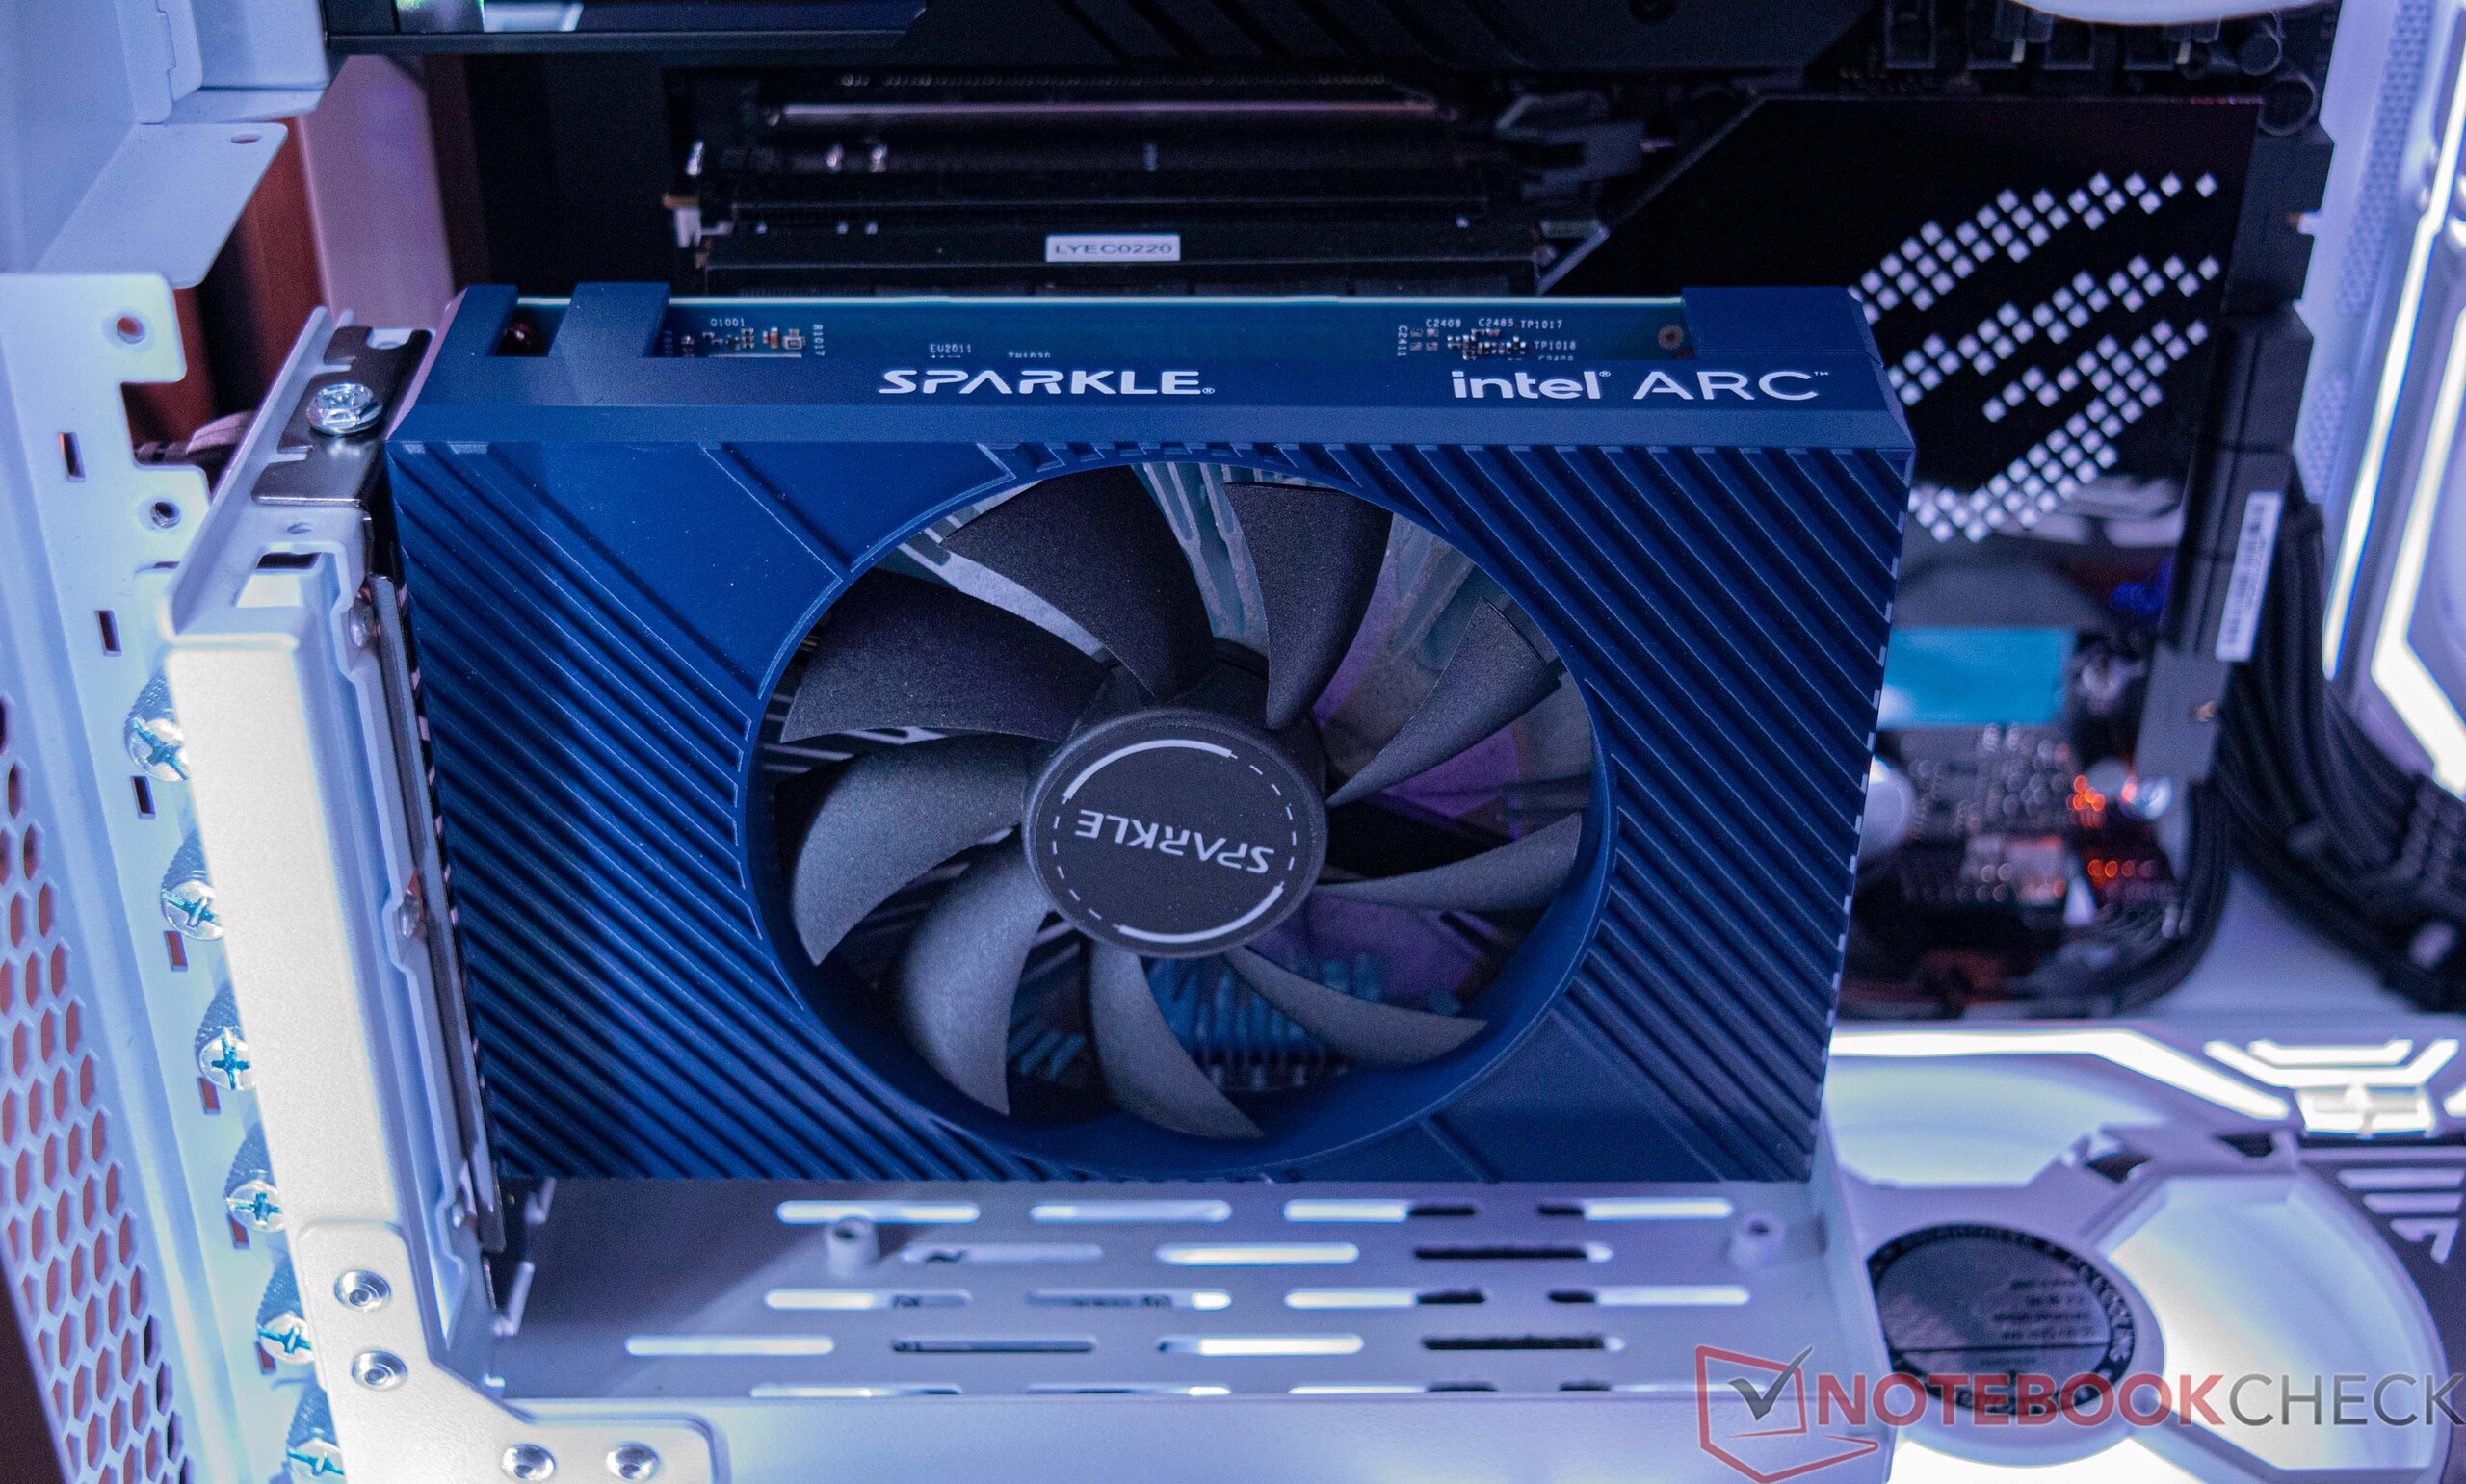
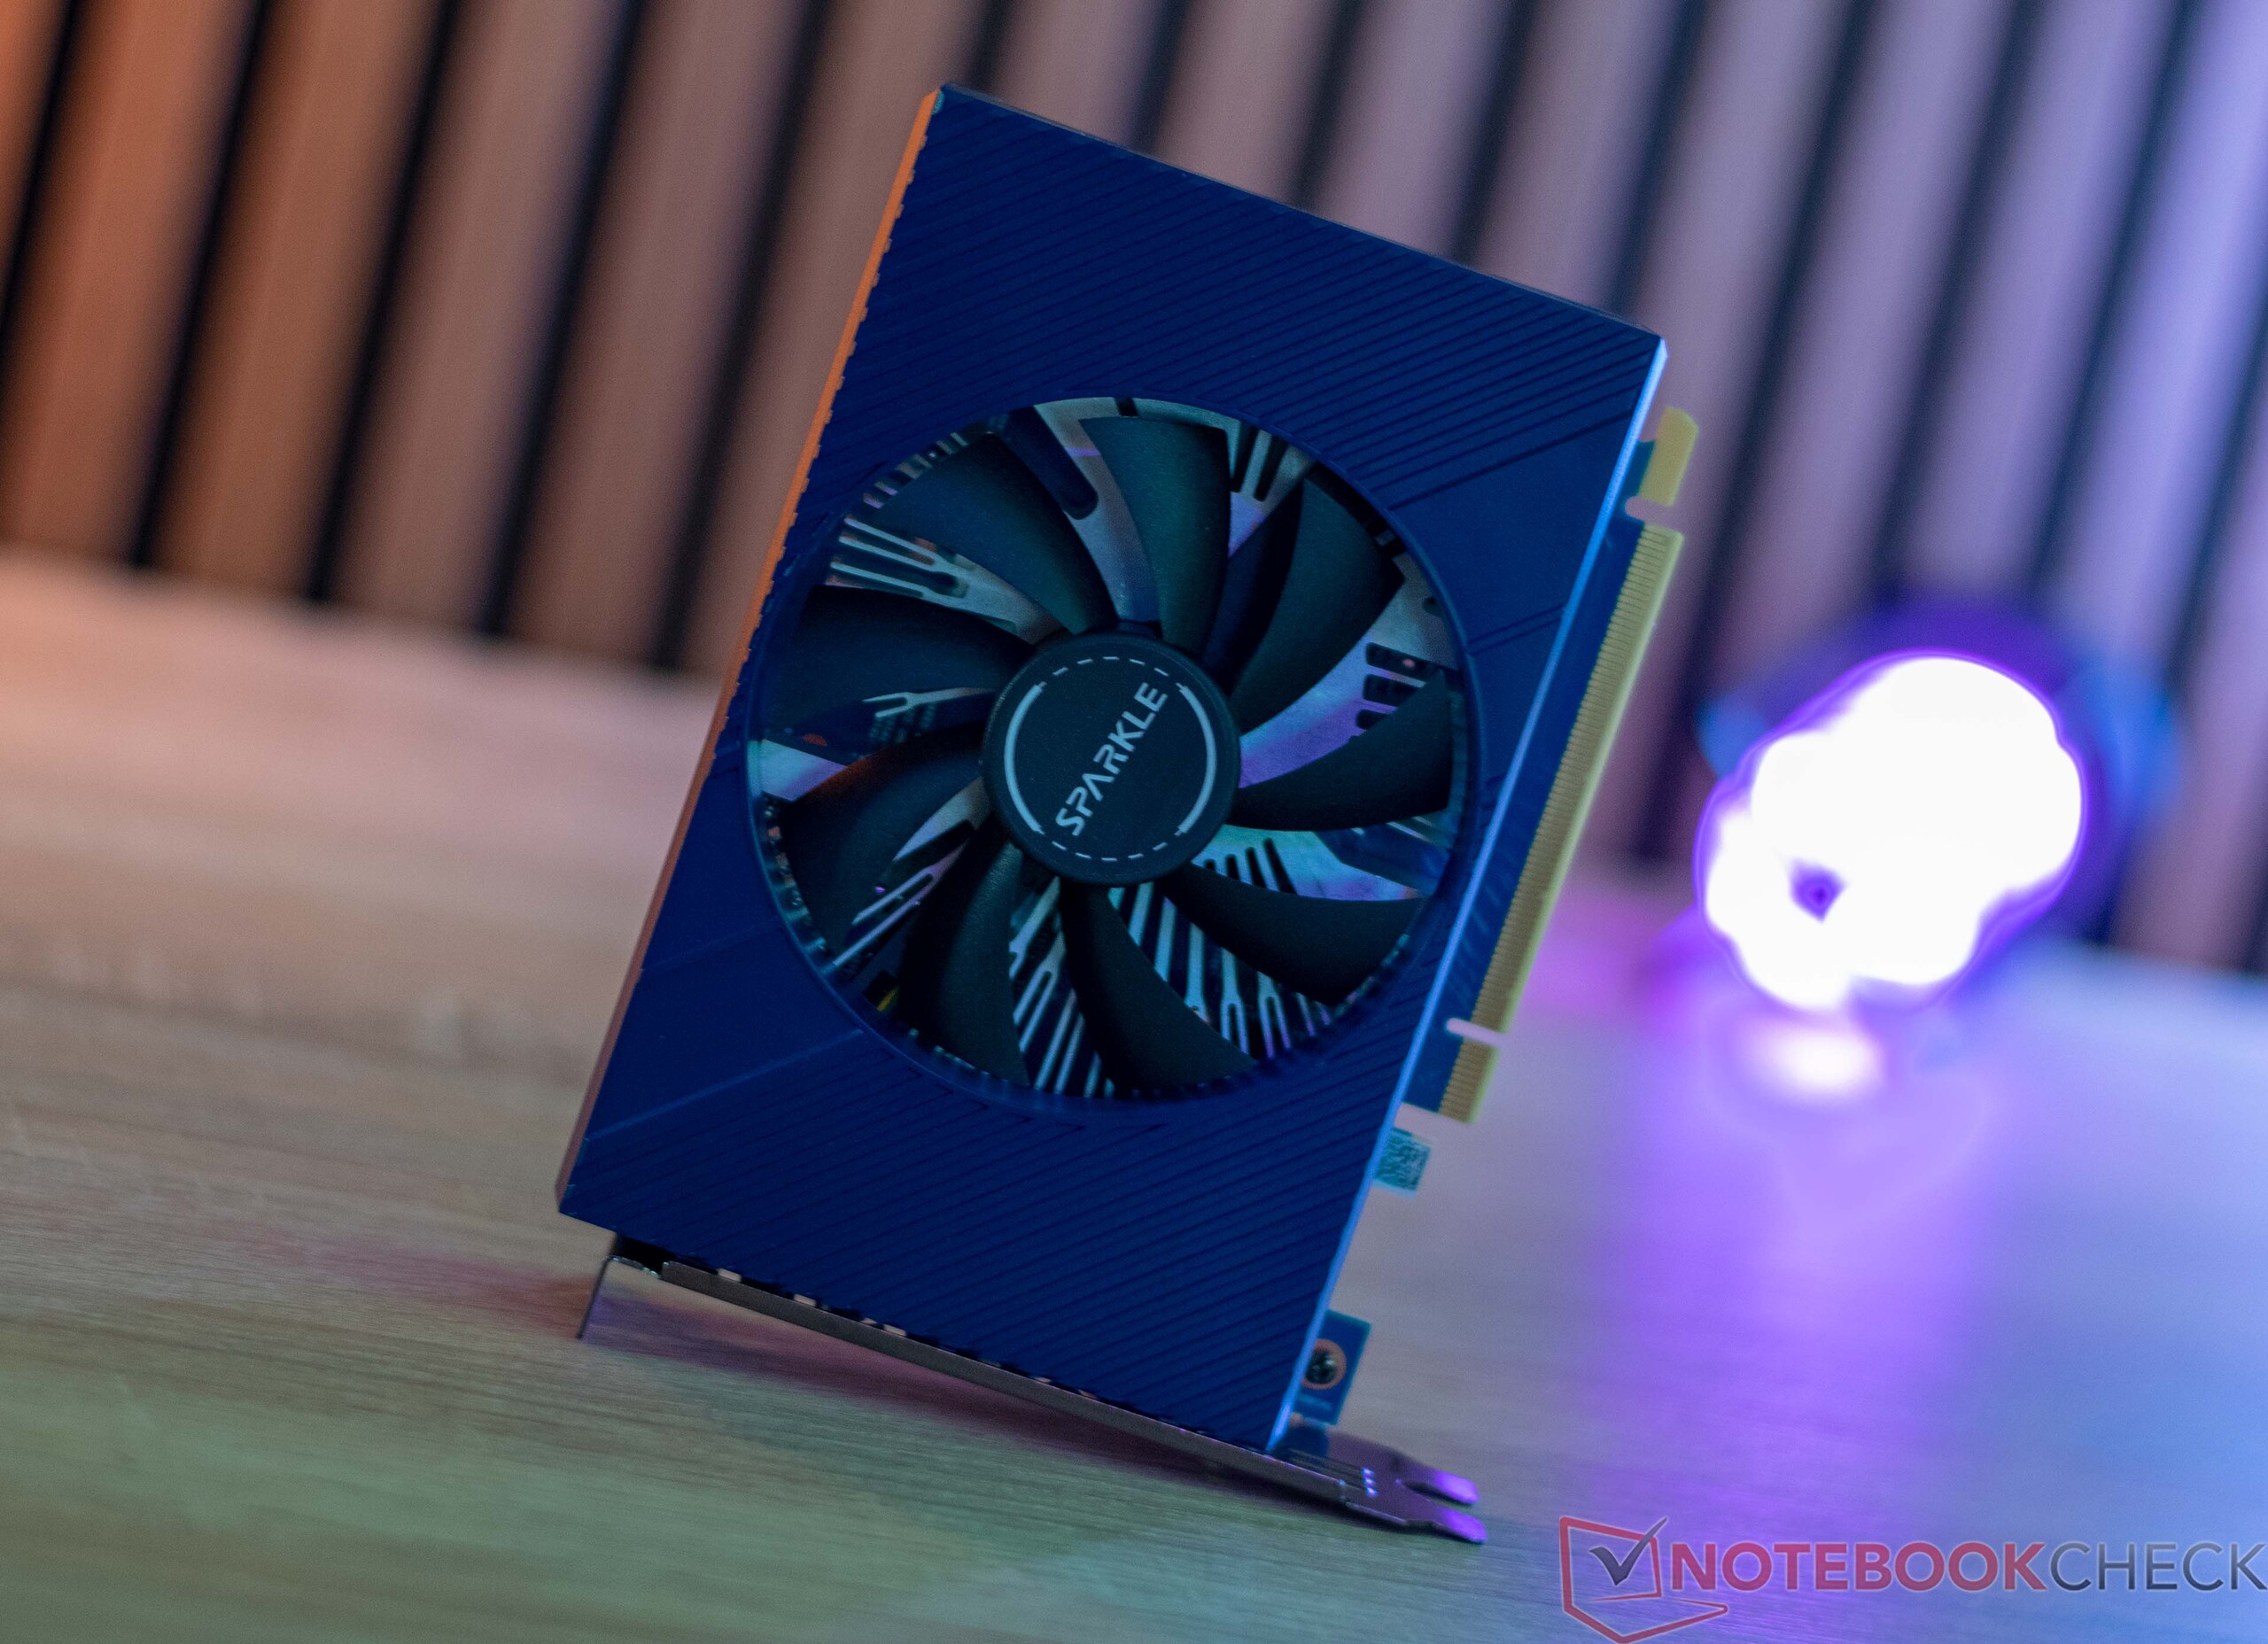
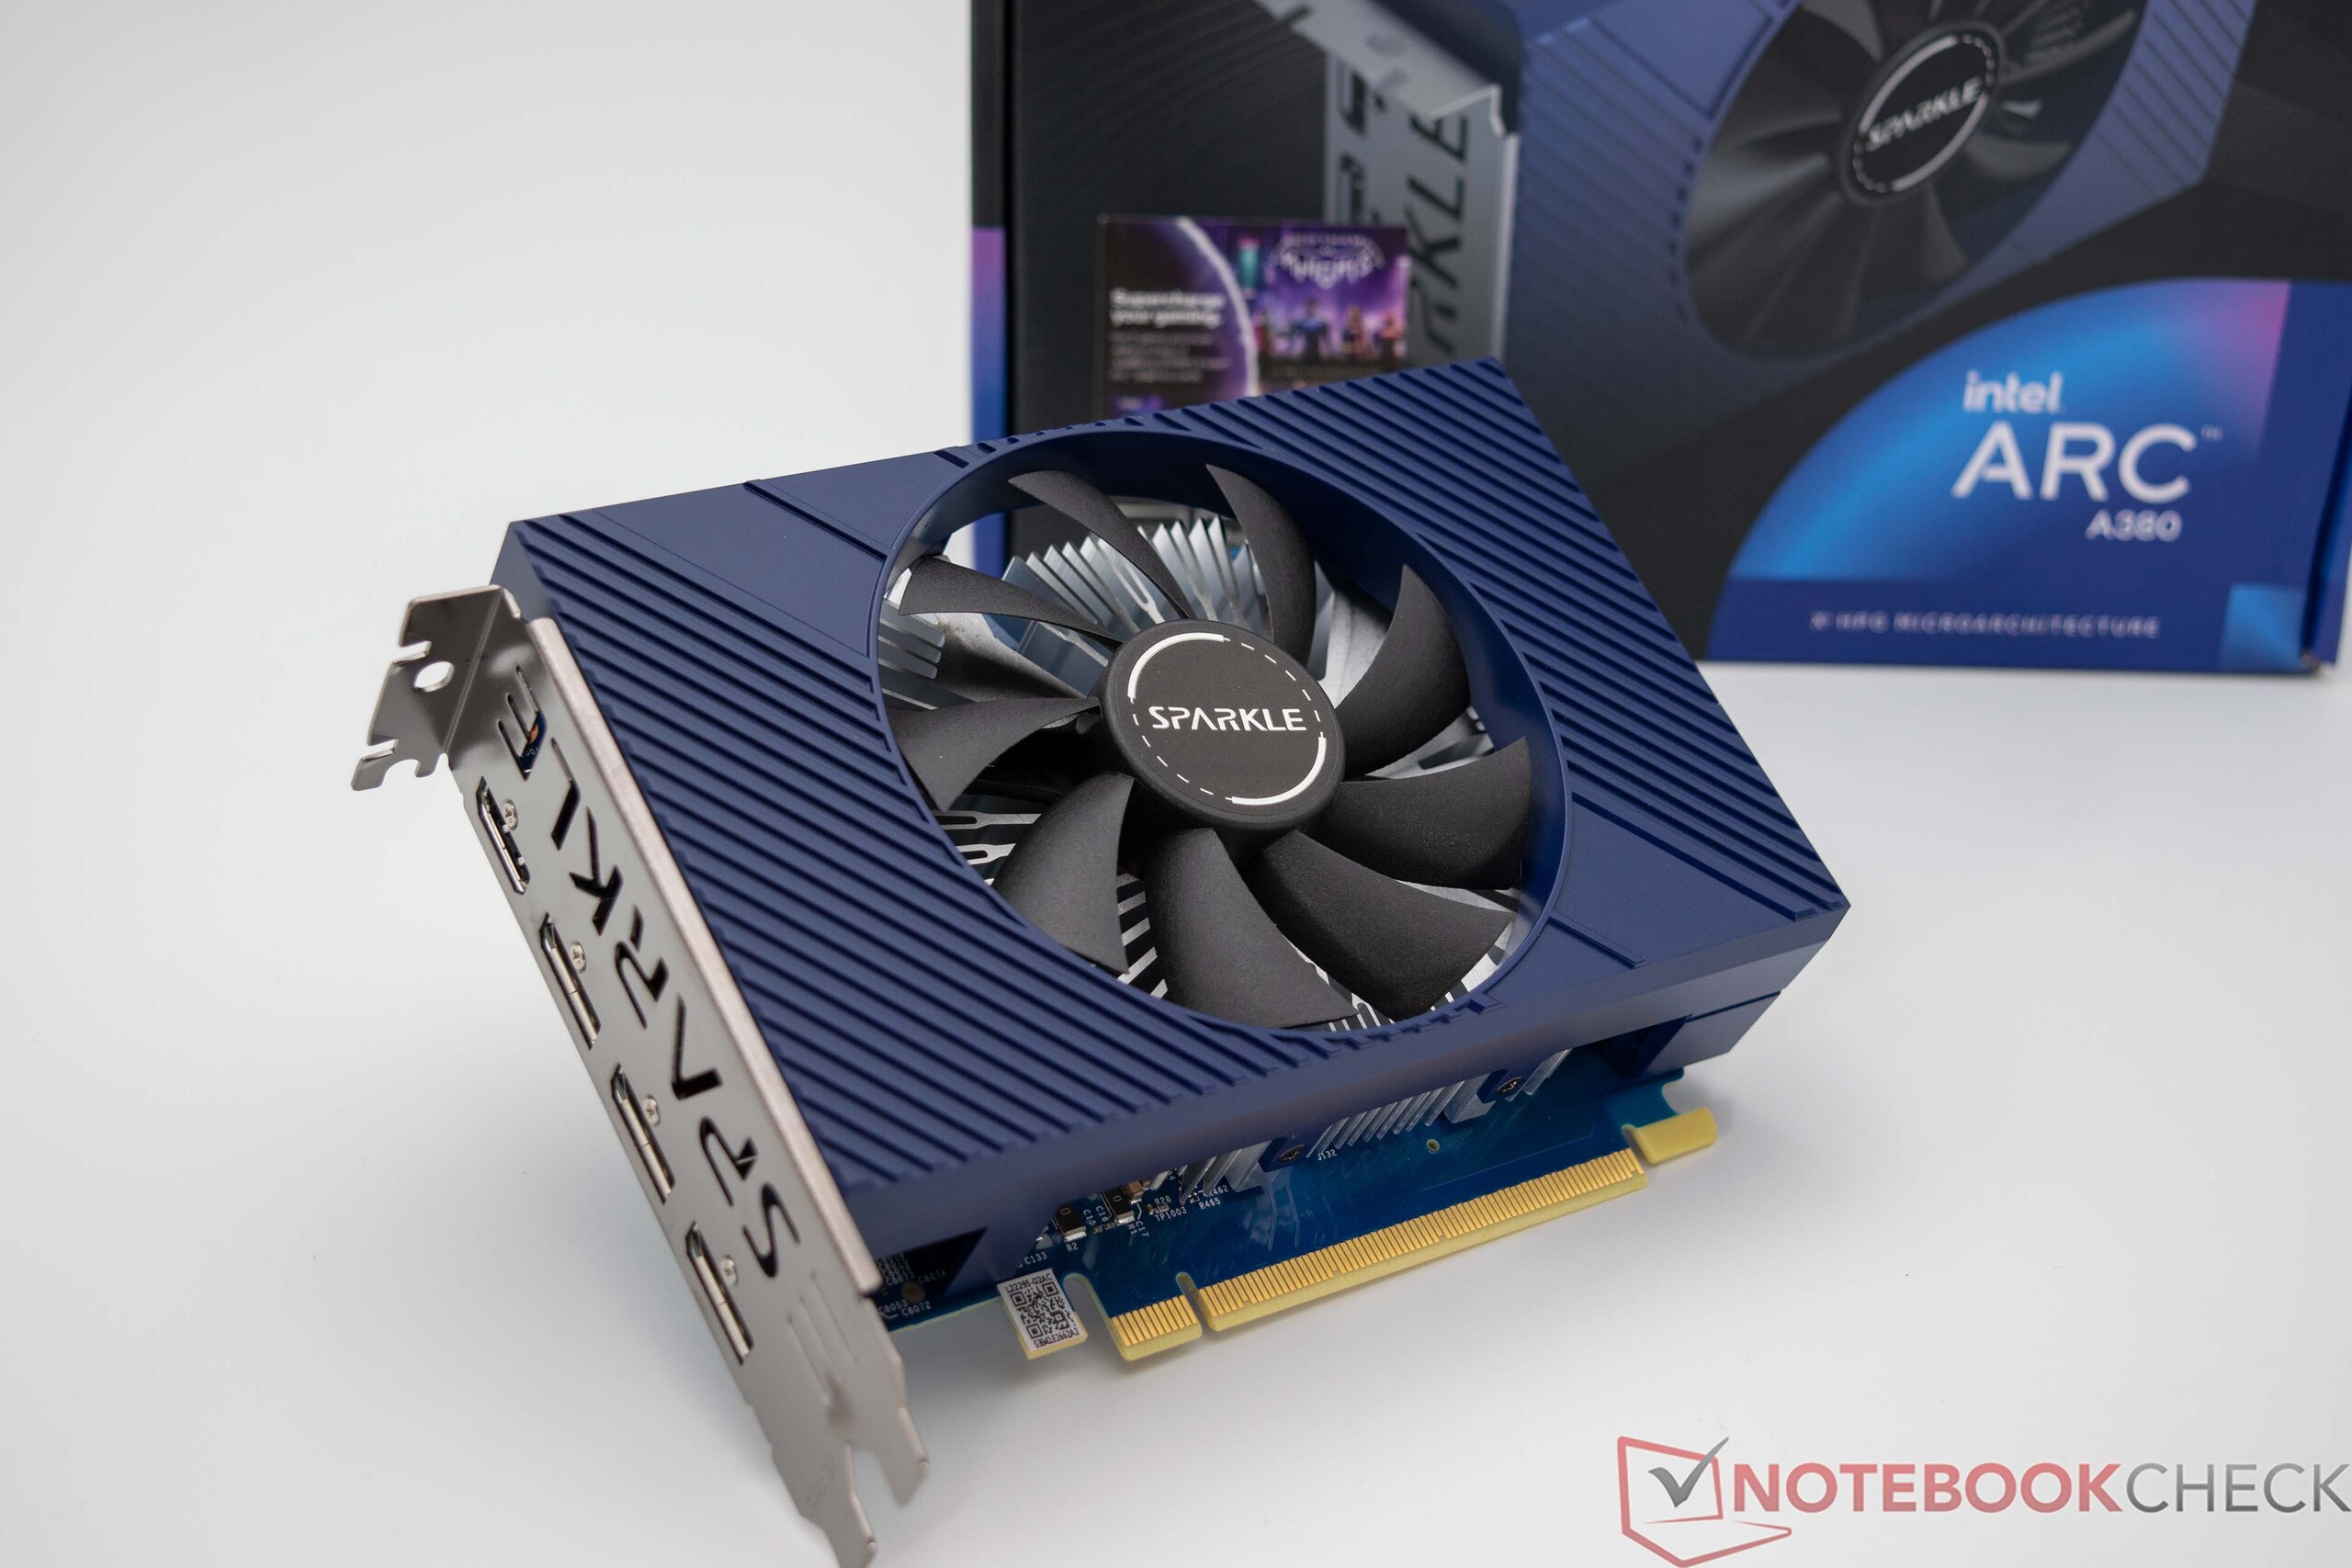
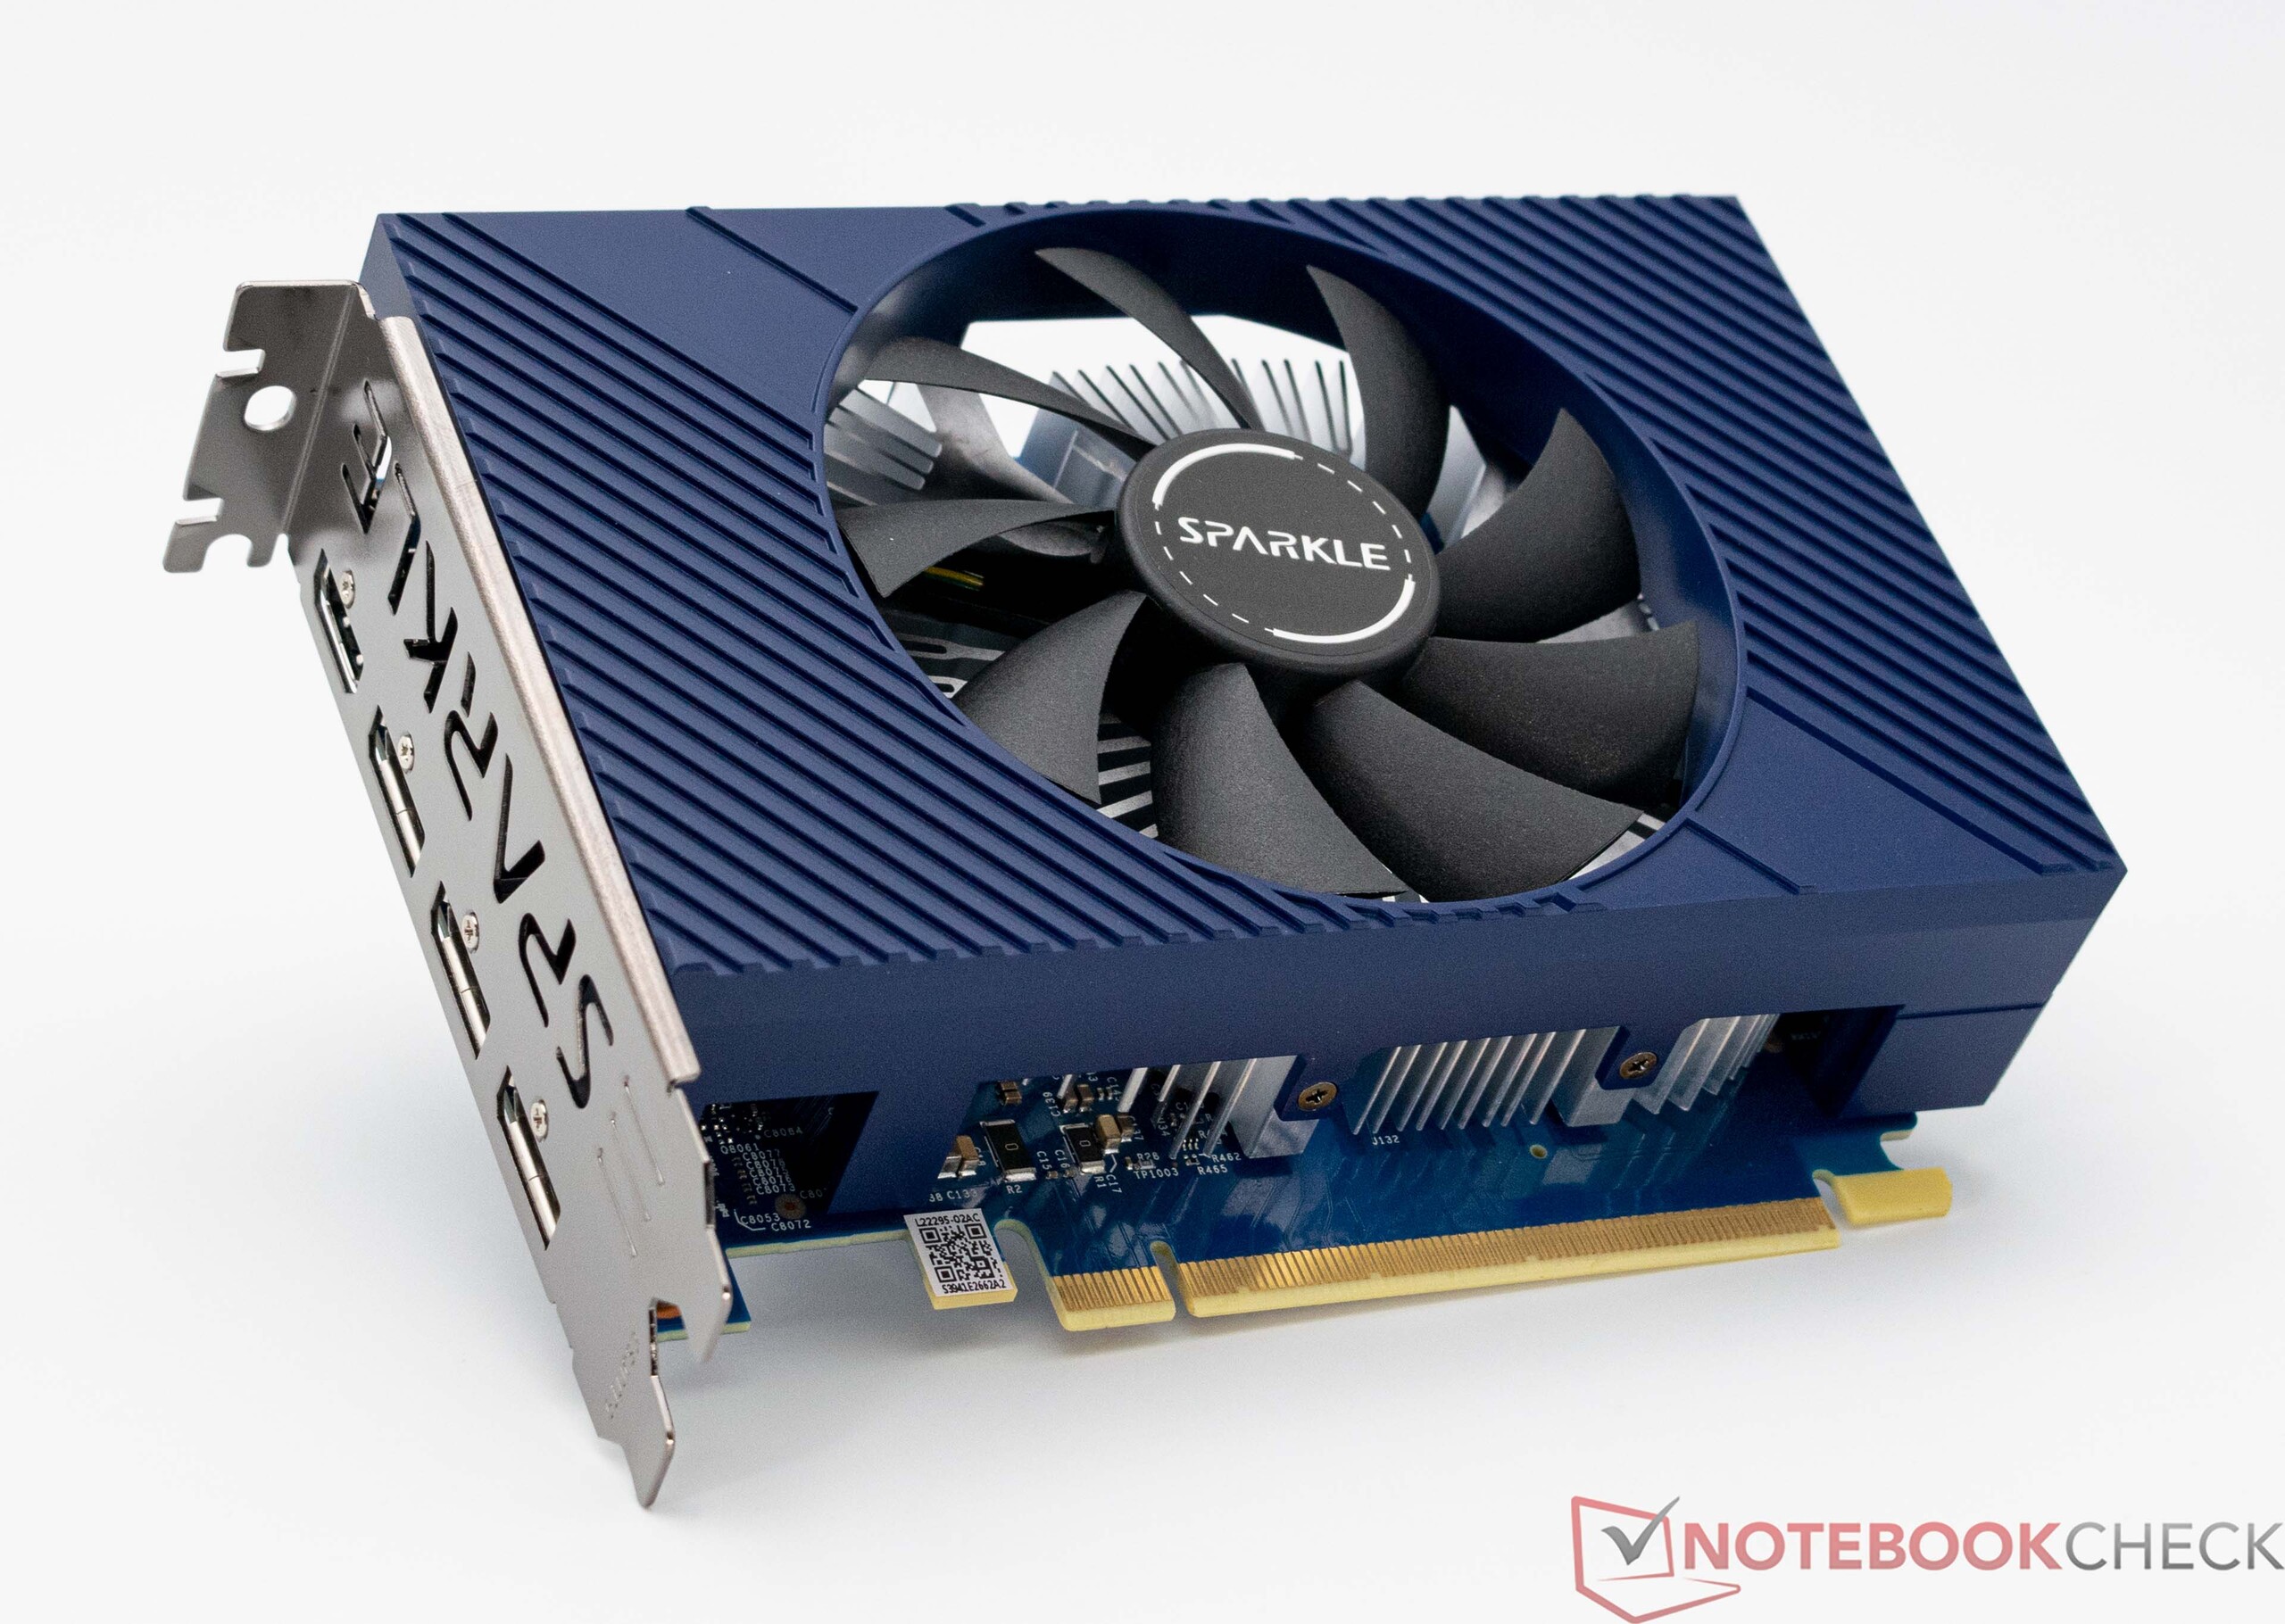
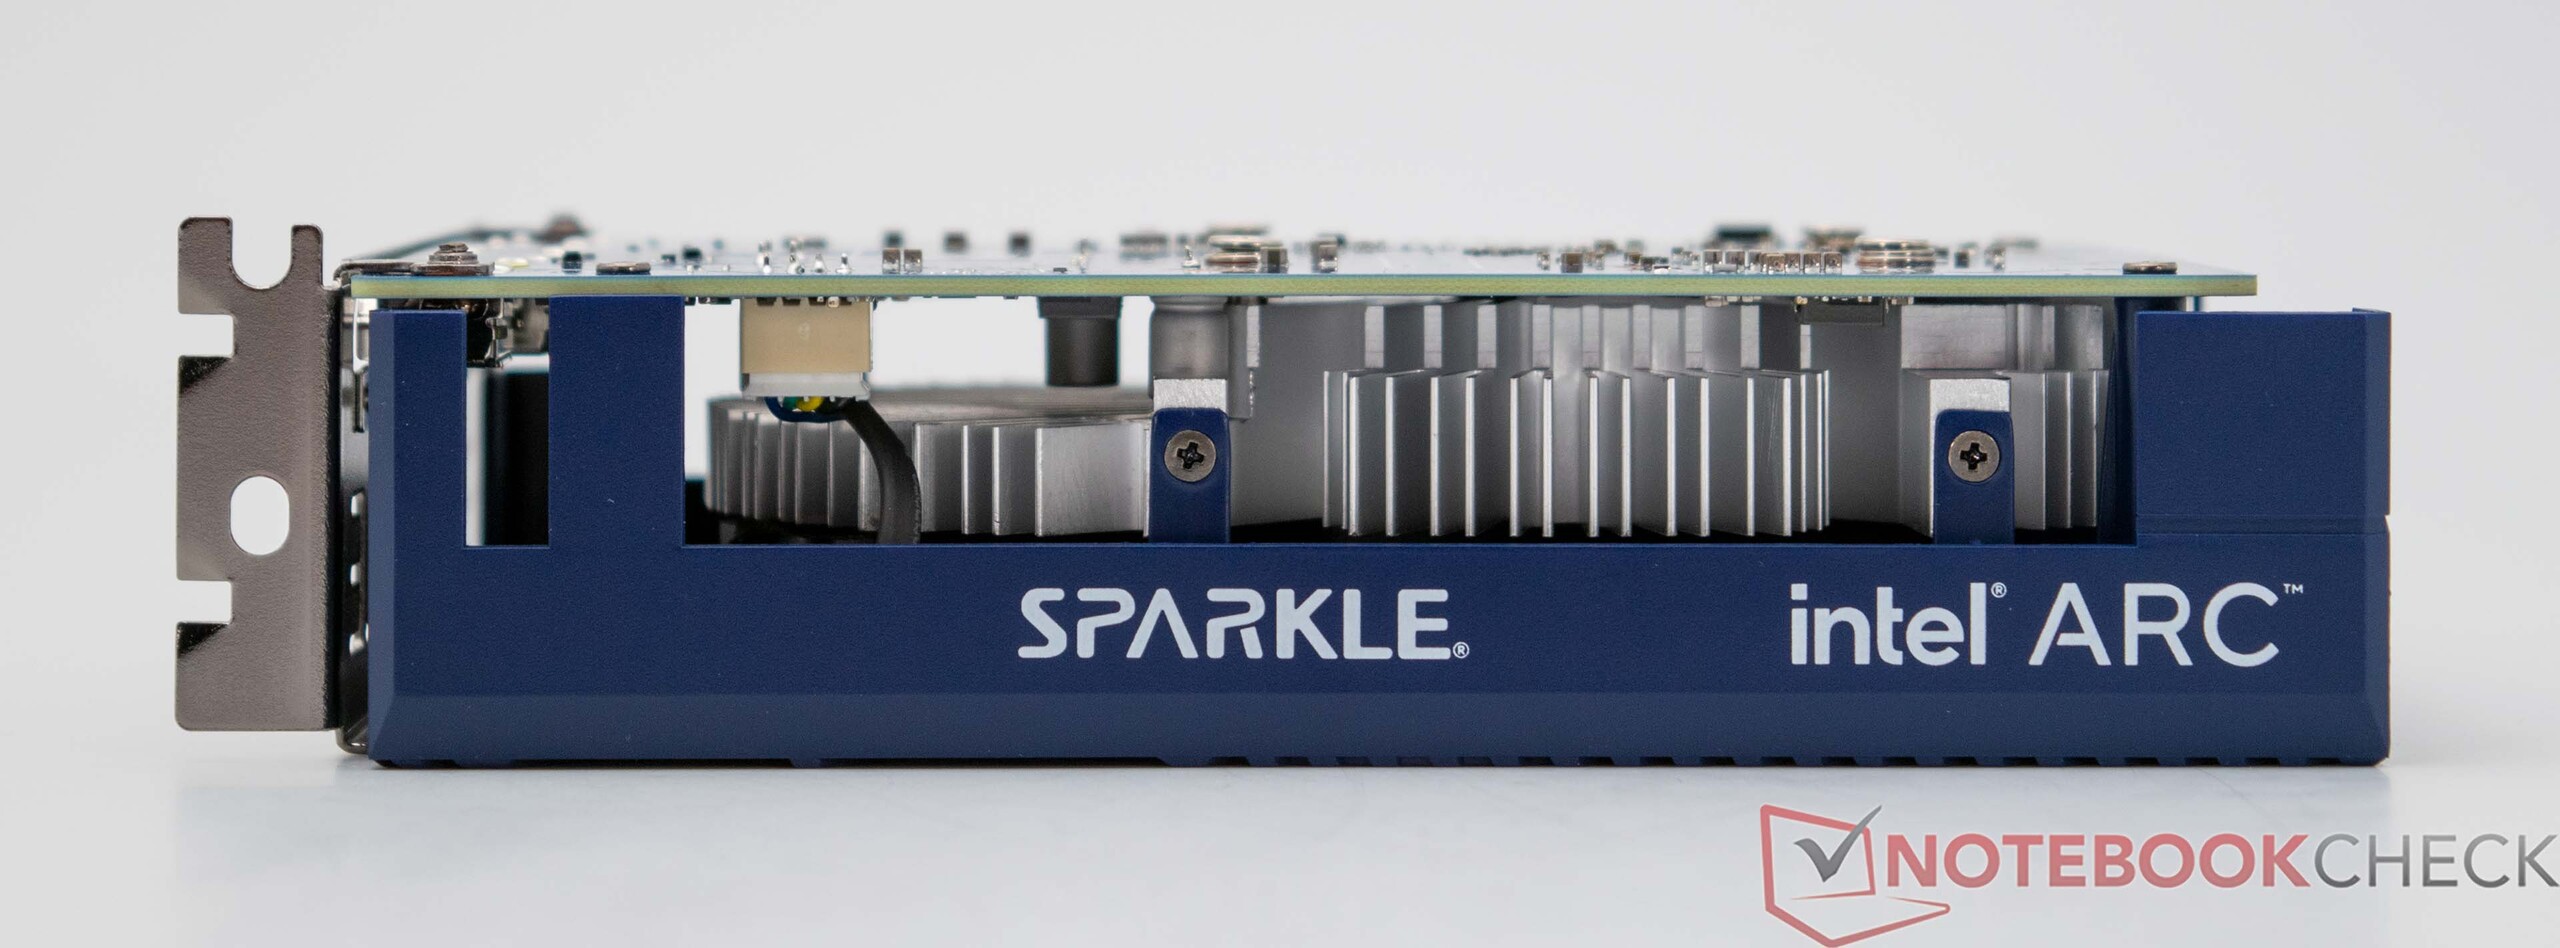
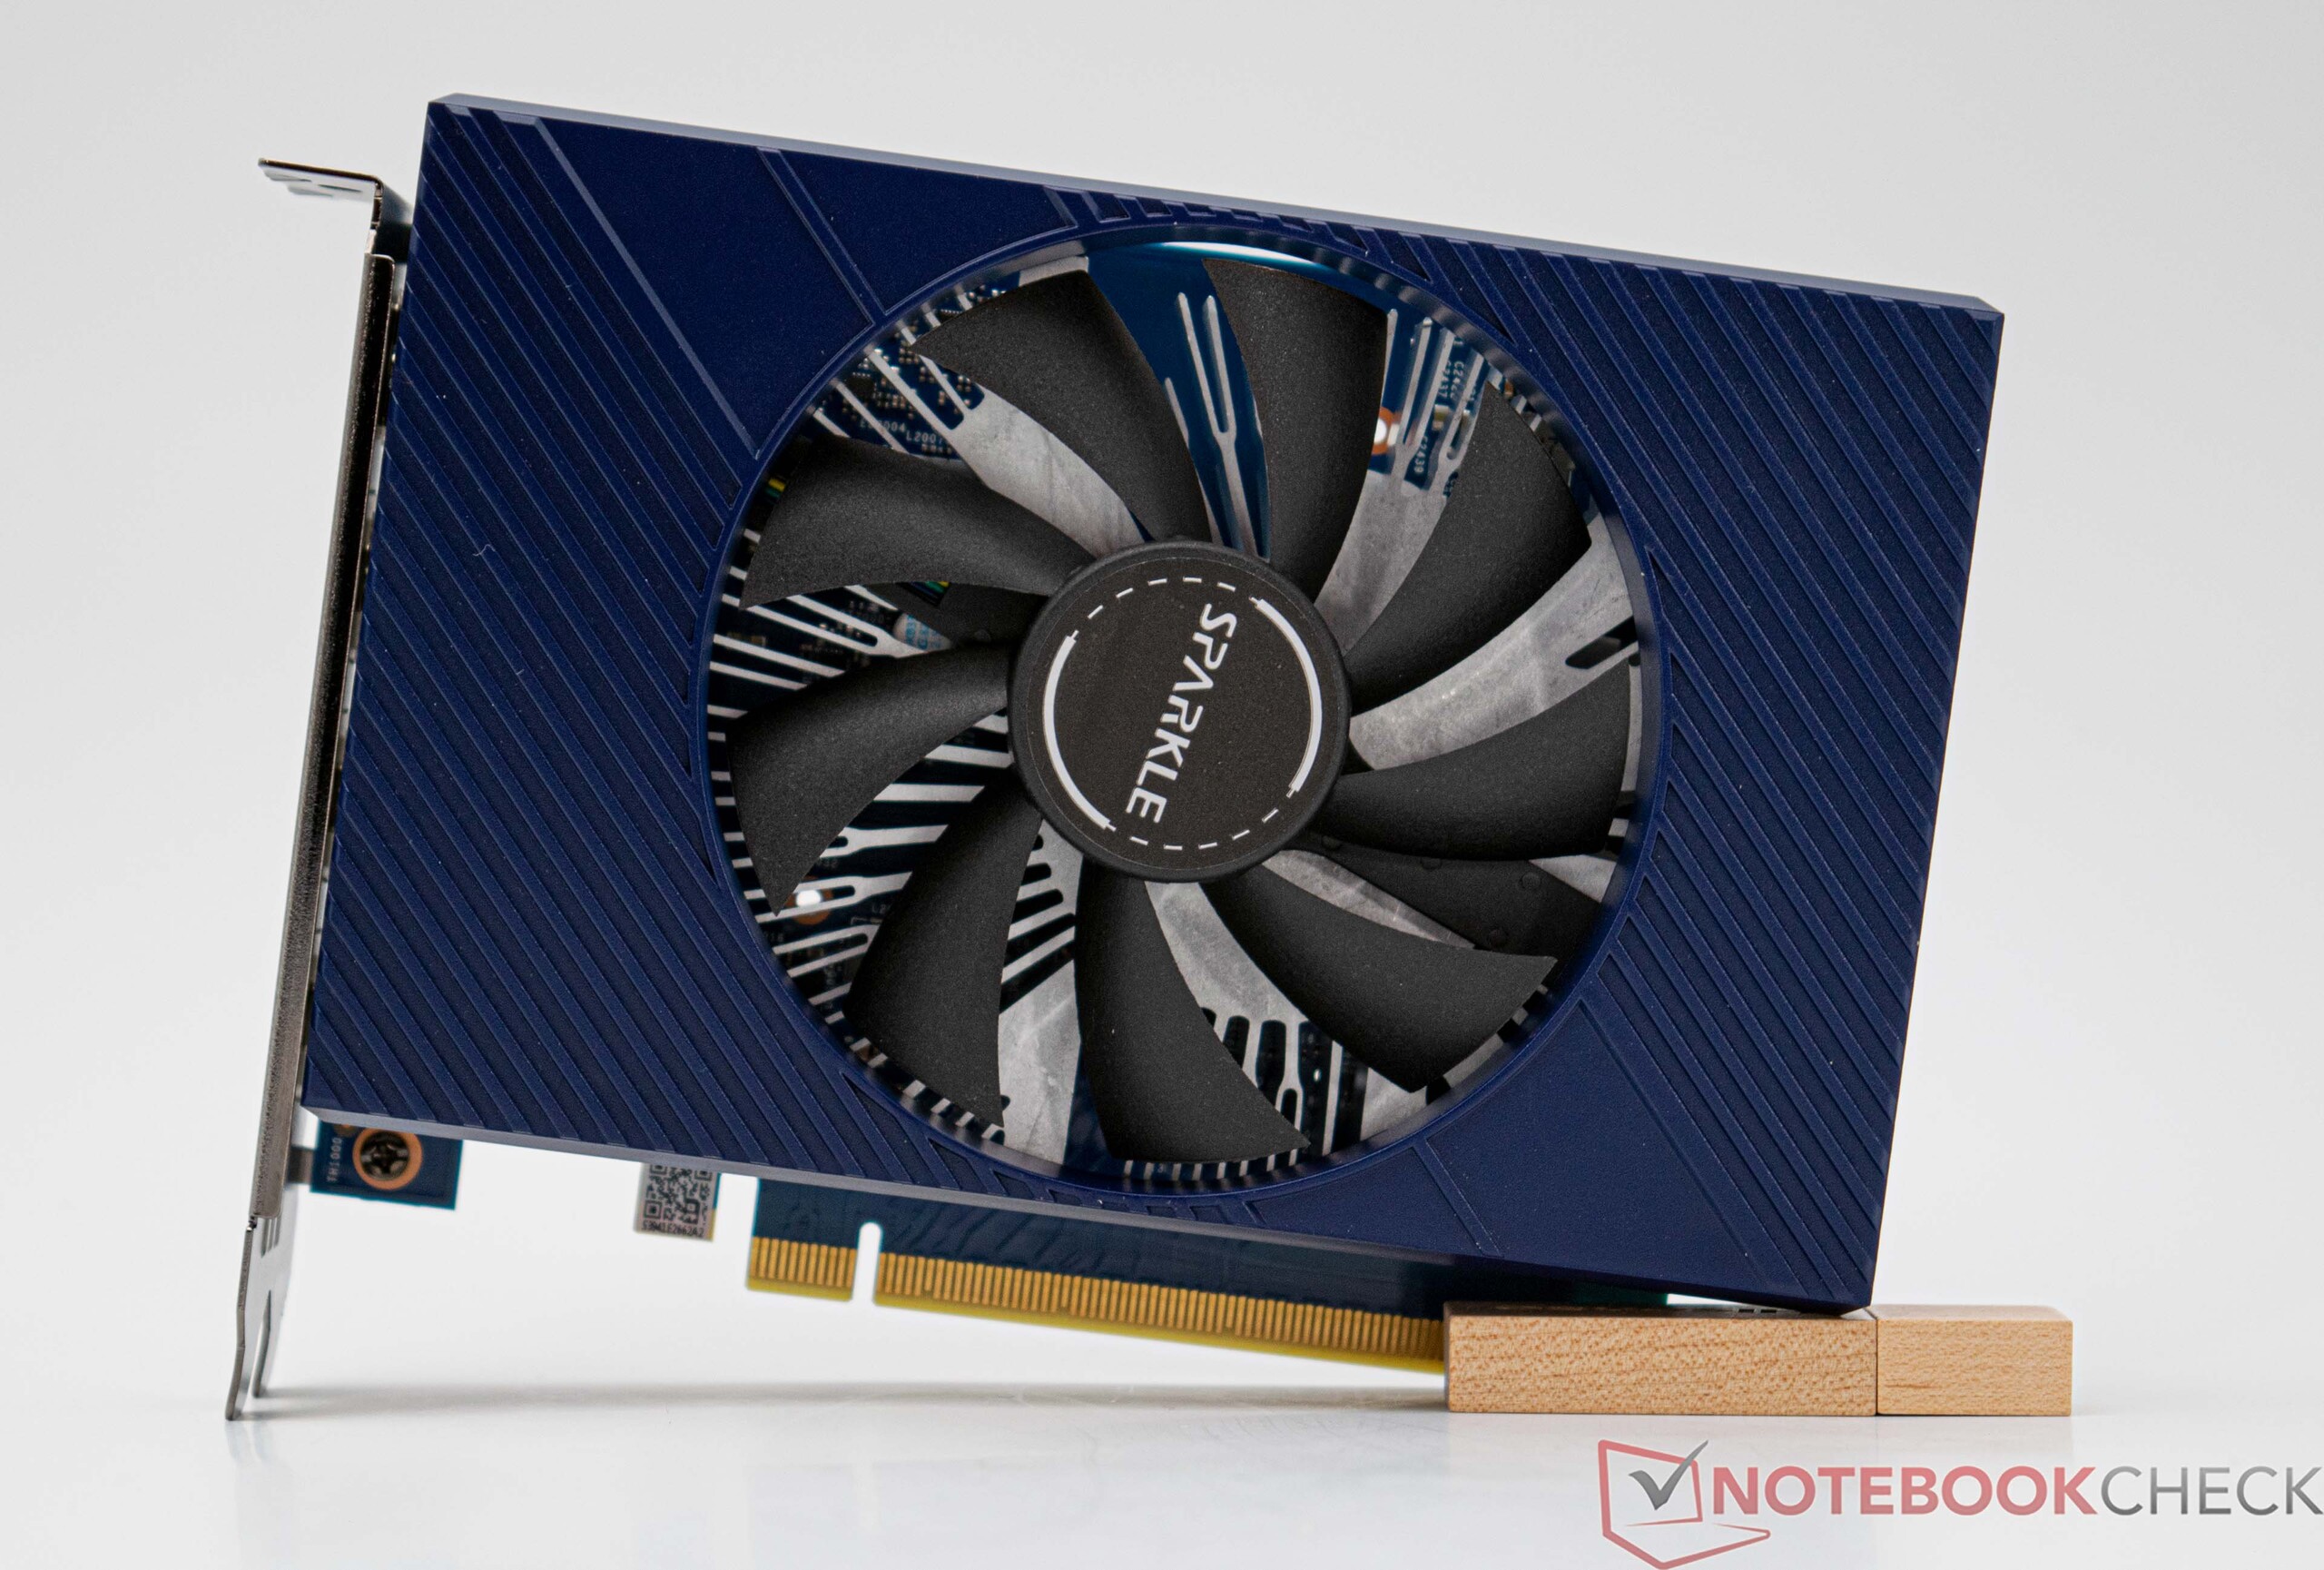
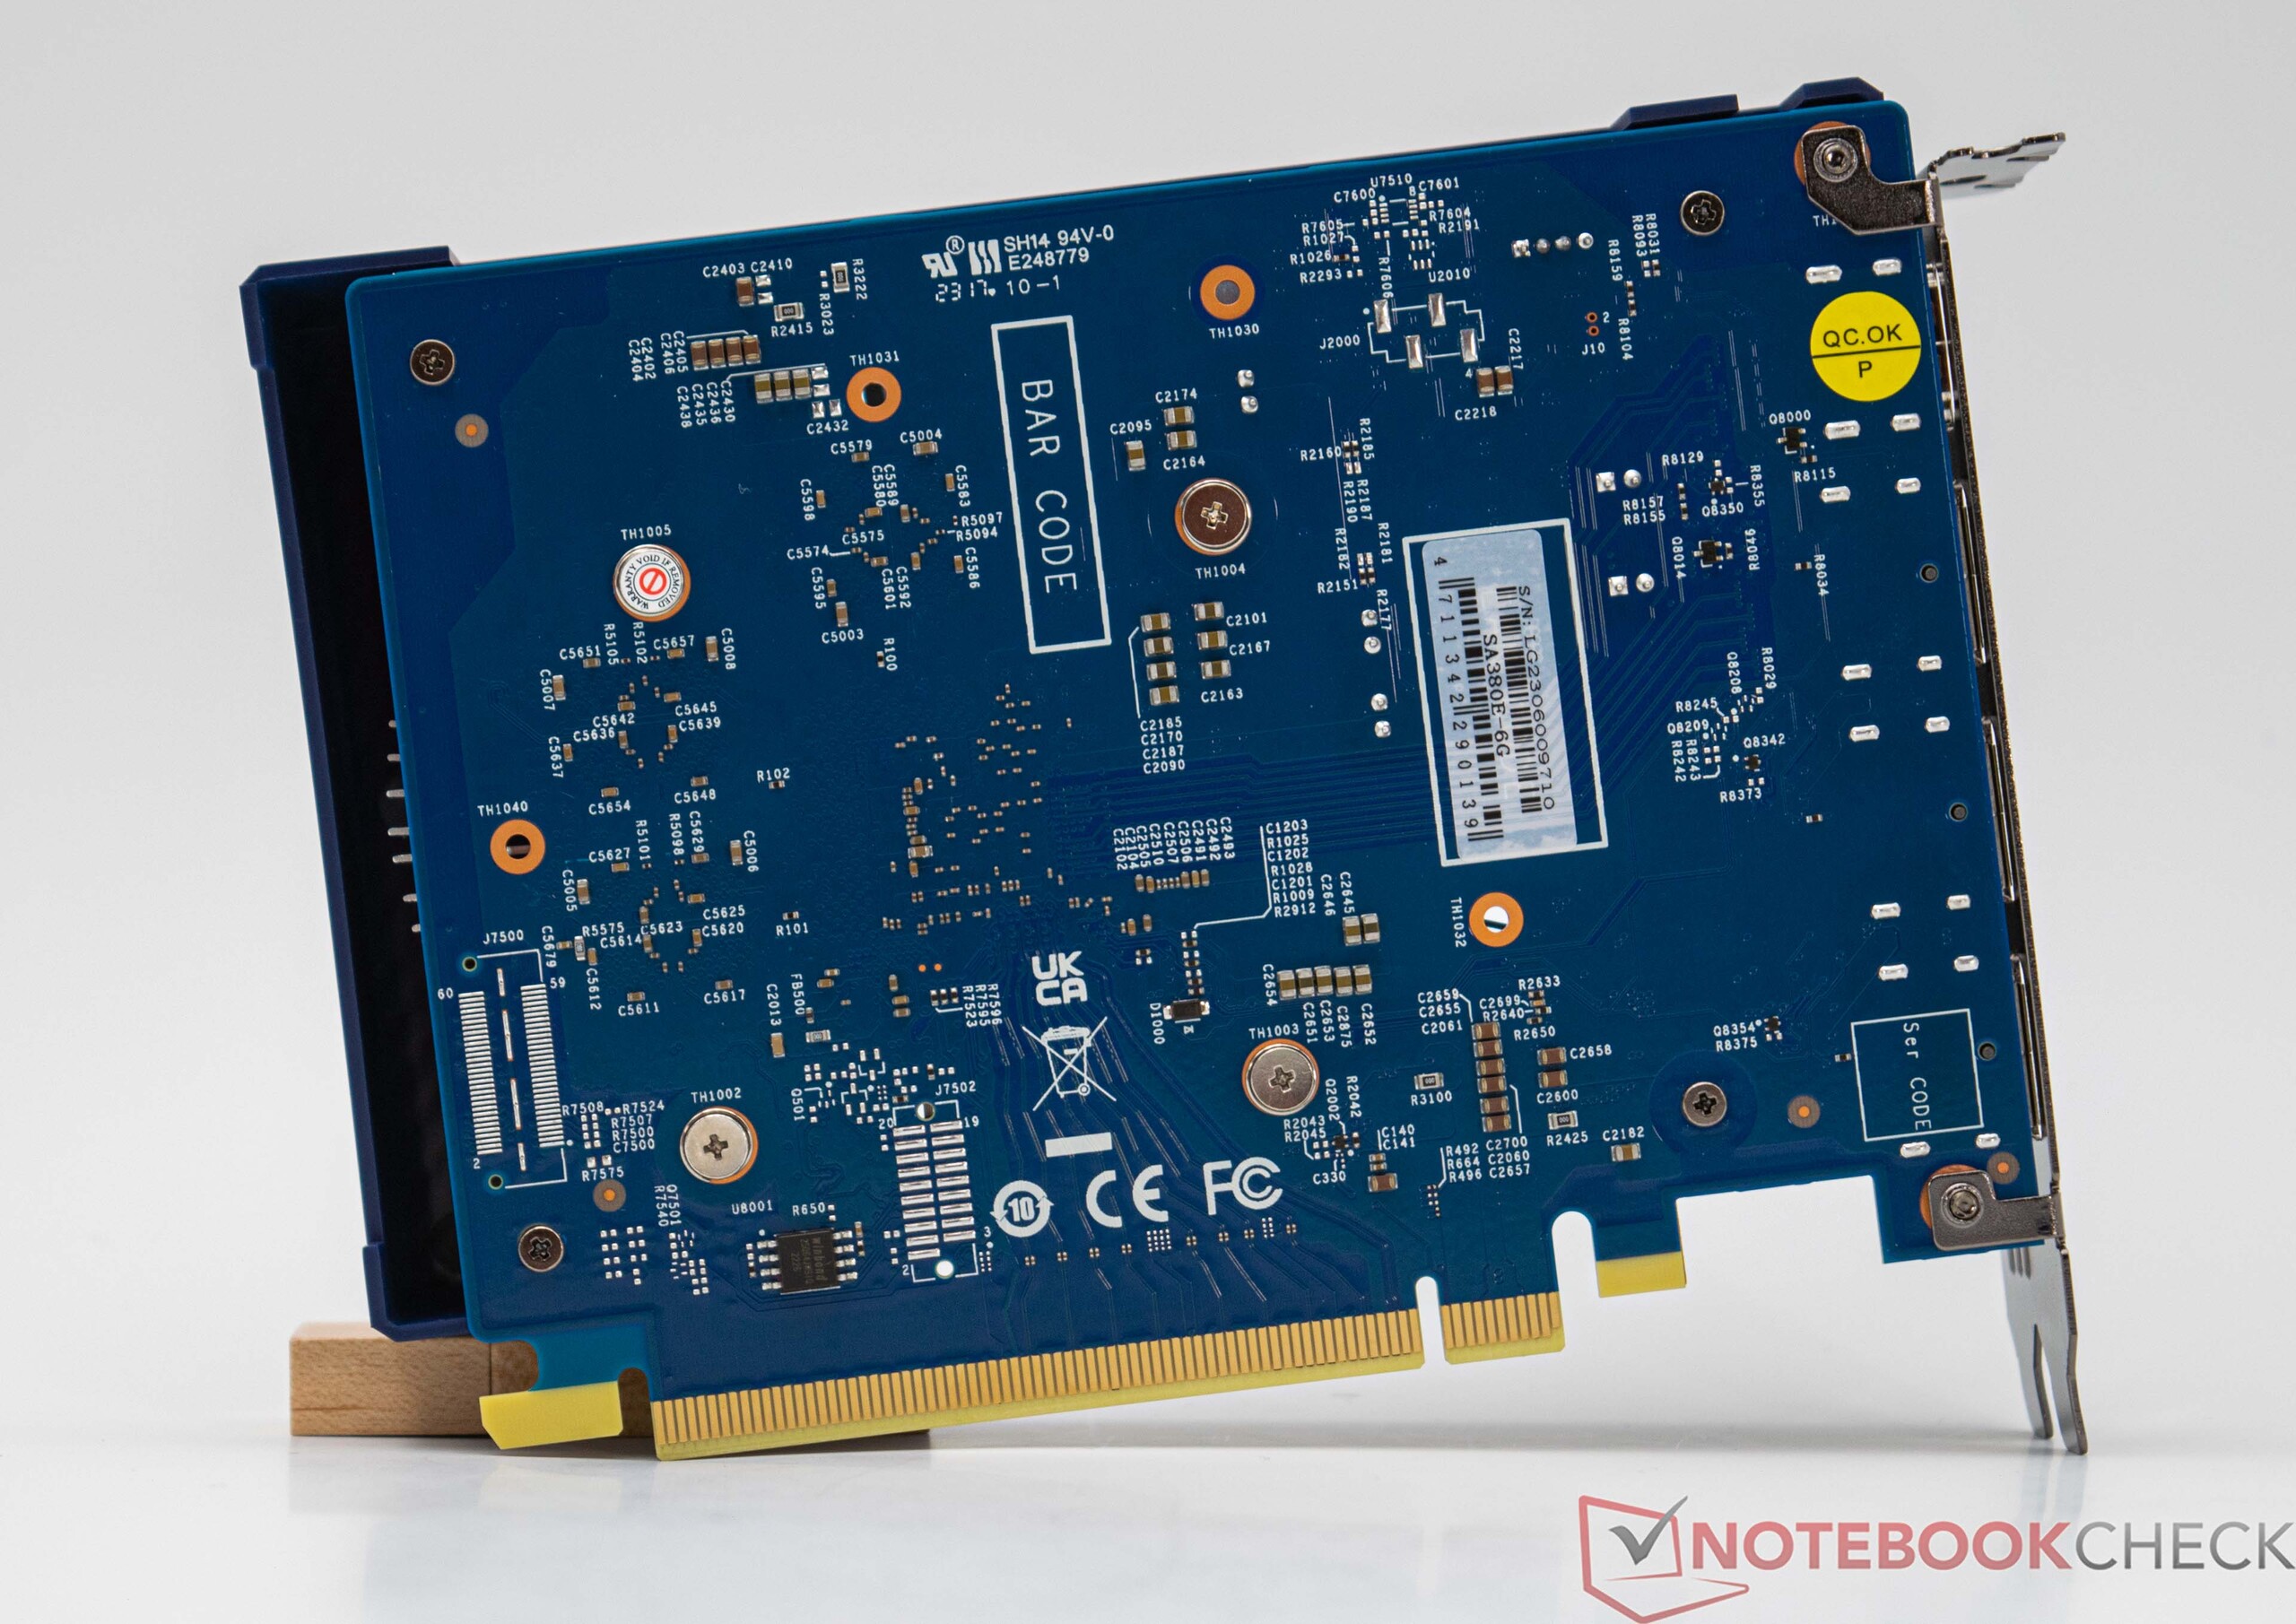
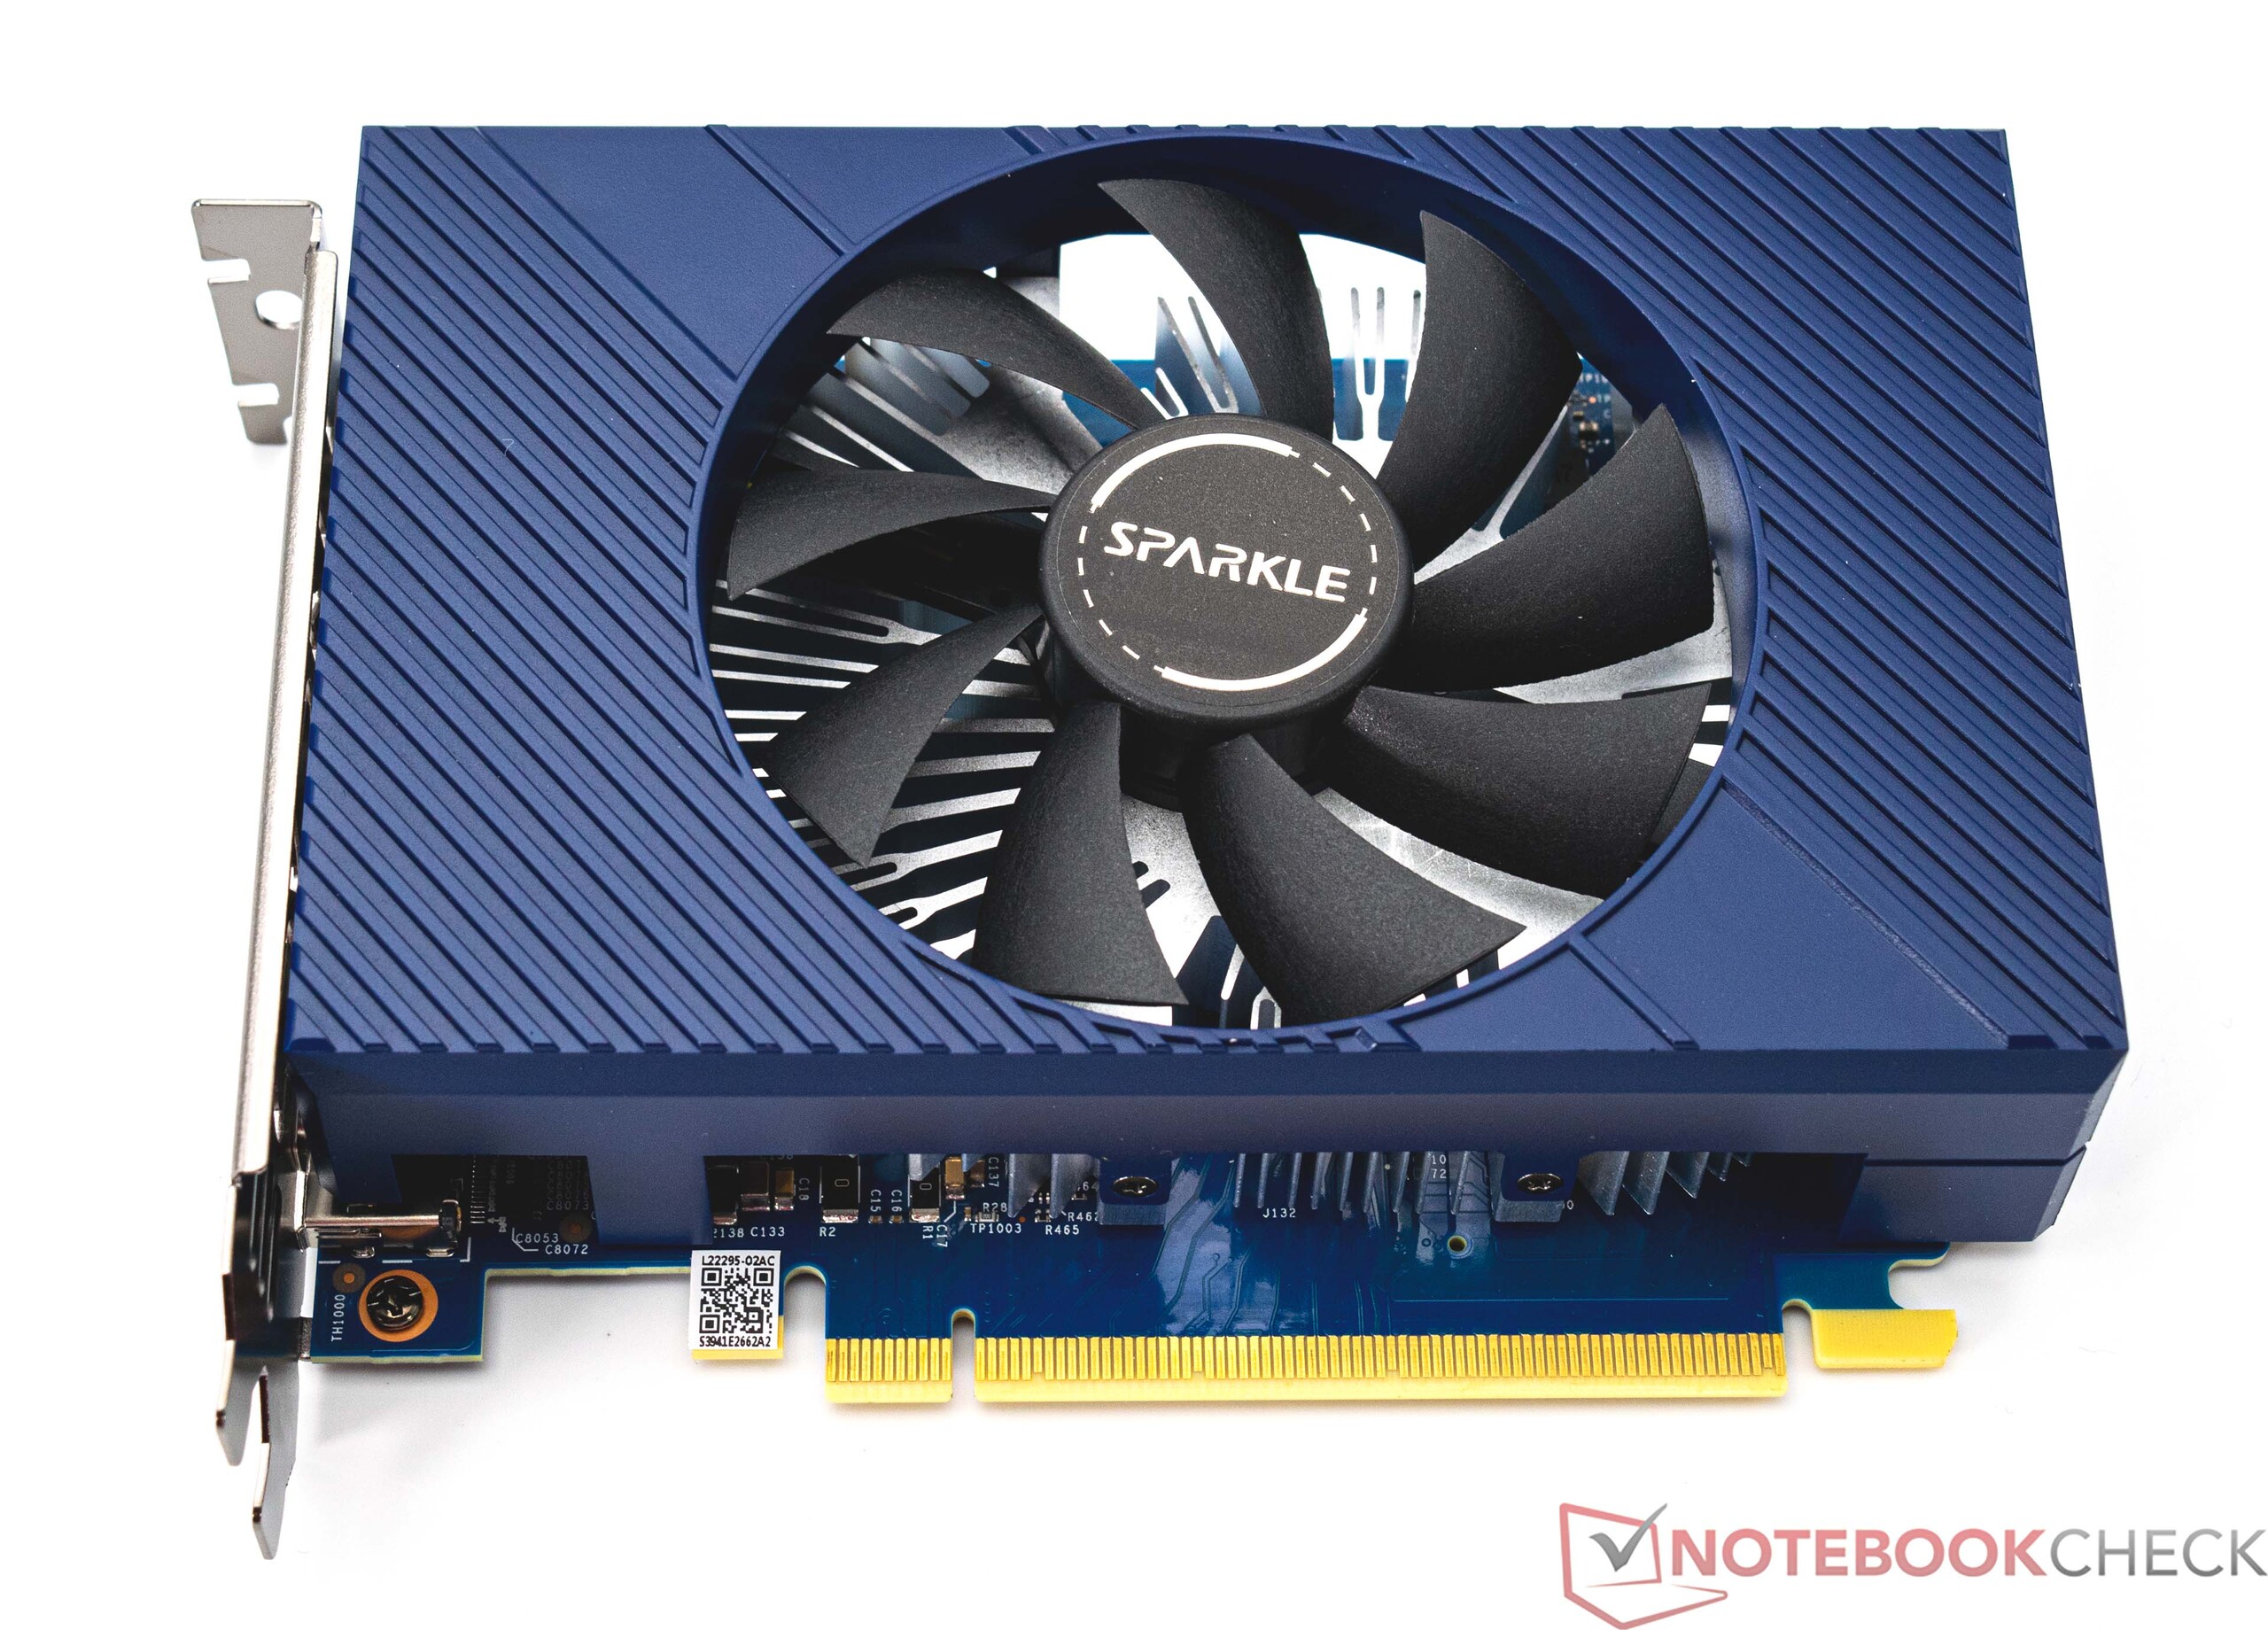
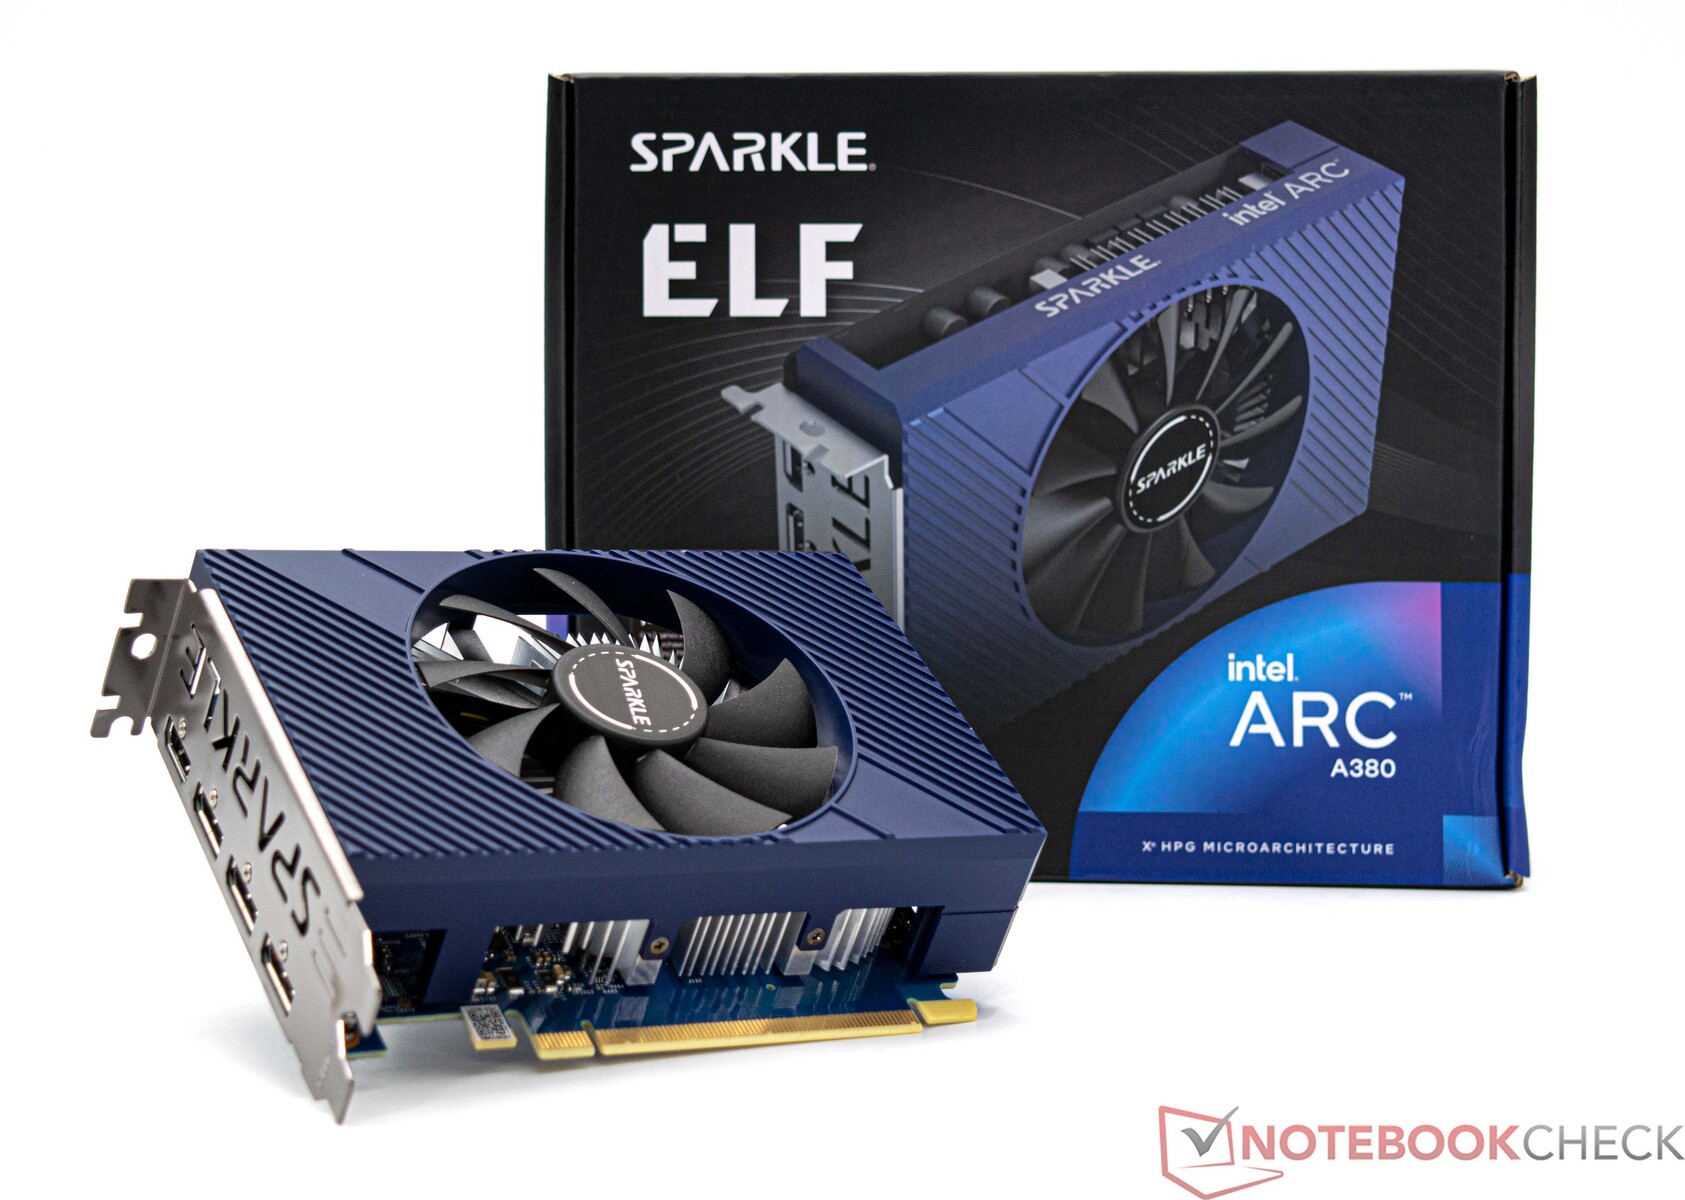
In questa recensione, diamo un'occhiata più da vicino alle prestazioni di Sparkle Arc A380 Elf. La nostra unità di prova è corta e solo minimamente più lunga dello slot PCIe, il che rende la scheda grafica molto adatta ai piccoli sistemi Mini-ITX. Il modello è dotato di una ventola assiale che fornisce aria fresca alla corta scheda grafica dual-slot. Visivamente, la scheda è mantenuta in un design blu che è condiviso dall'intera palette di modelli delle schede grafiche Intel di Sparkle. Tuttavia, è ancora possibile vedere e percepire il basso prezzo di acquisto di Sparkle Arc A380 Elf, poiché la parte anteriore è completamente in plastica e non c'è una piastra posteriore.
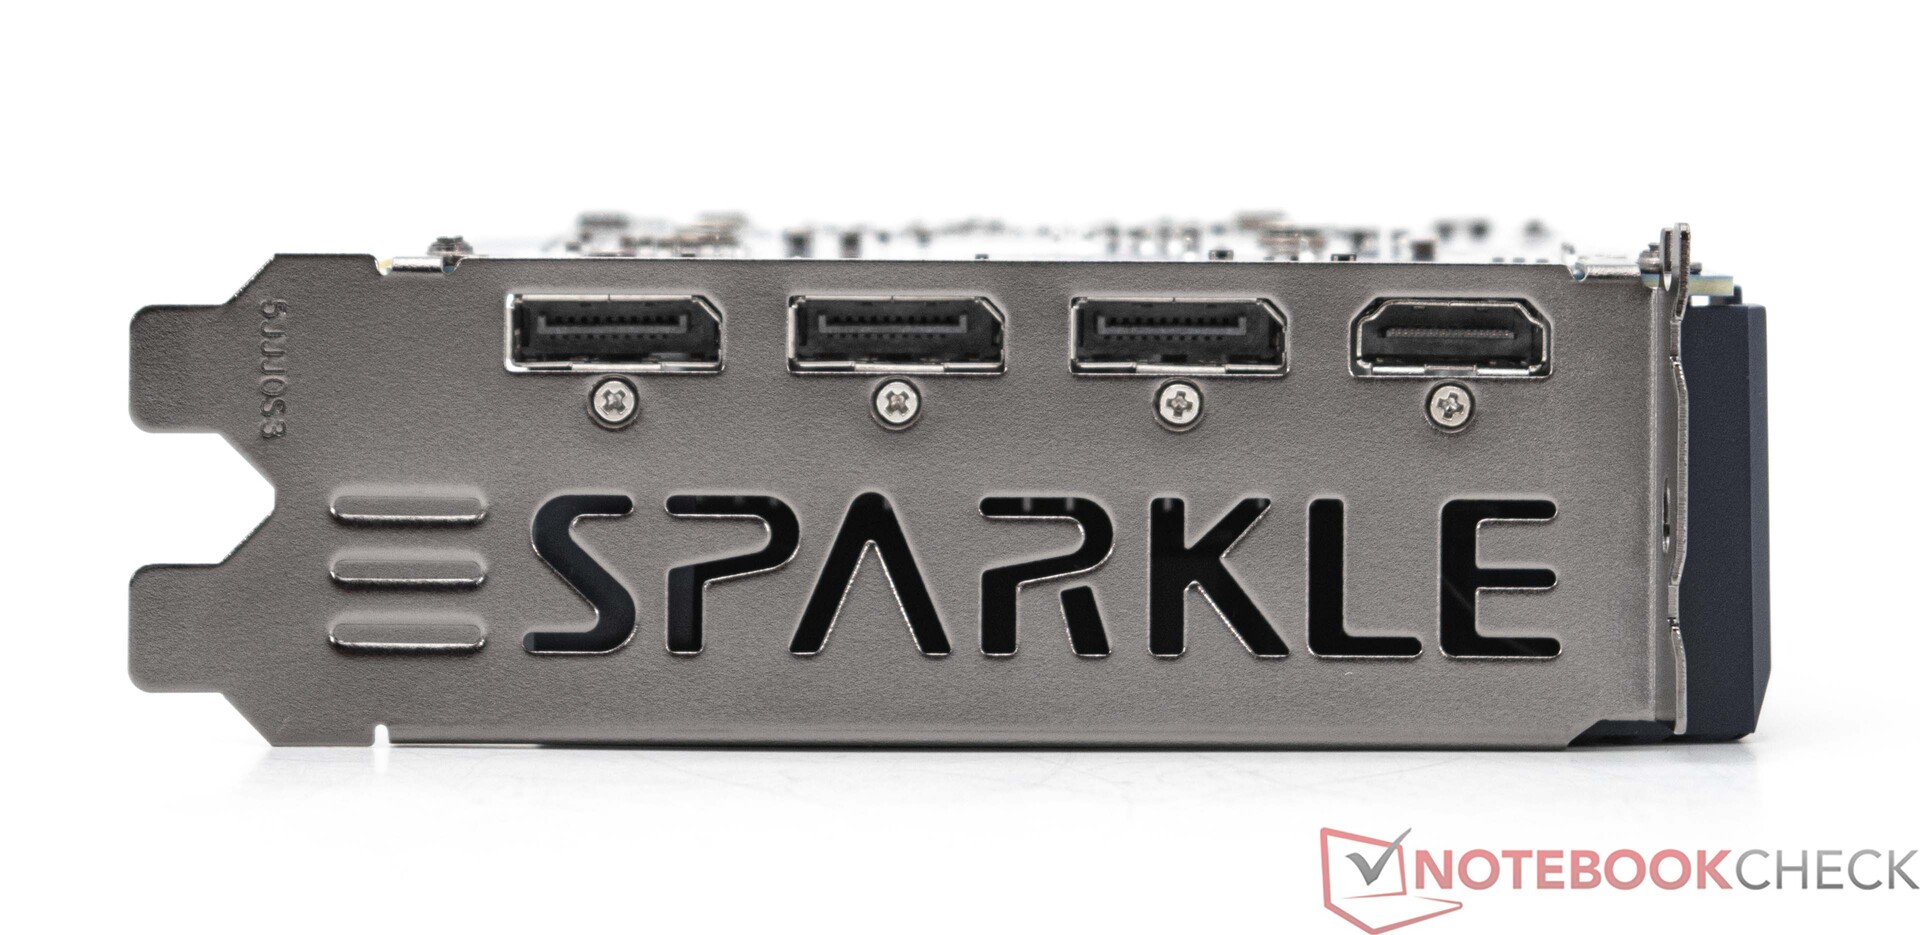
L'efficiente Sparkle Arc A380 Elf non ha bisogno di una connessione di alimentazione aggiuntiva e tutta l'alimentazione è fornita esclusivamente dallo slot PCIe. In termini di connessioni esterne, oltre alla porta HDMI 2.0, vediamo anche tre connessioni DisplayPort 2.0 nella nostra unità di prova. Con questo, anche il modello economico di Intel offre una dotazione di connessioni esterne leggermente migliore rispetto a Nvidia. A questo punto, AMD offre già DisplayPort 2.1 con i suoi modelli RX 7000.
Informazioni sul nostro Sistema di Prova
Sparkle Arc A380 Elf in dettaglio


Dati tecnici a confronto
| Specifiche | Intel Arc A770 | Intel Arc A750 | Intel Arc A580 | Intel Arc A380 | Radeon RX 7700 XT | Radeon RX 7600 | RTX 4060 Ti | RTX 4060 |
| GPU | DG2-512 | DG2-512 | DG2-512 | DG2-128 | Navi 32 XL | Navi 33 XL | AD106 | AD107 |
| Processo di produzione | 6 nm | 6 nm | 6 nm | 6nm | 5/6 nm | 6 nm | TSMC 4N | TSMC 4N |
| Unità di ombreggiatura | 4.096 | 3.584 | 3.072 | 1.024 | 3.456 | 2.048 | 4.352 | 3.072 |
| Unità di mappatura delle texture | 256 | 224 | 192 | 64 | 216 | 128 | 136 | 96 |
| Acceleratori di raggi | 32 | 28 | 24 | 8 | 54 | 32 | 34 | 24 |
| GPU Boost Clock | 2.400 MHz | 2.400 MHz | 2.000 MHz | 2.050 MHz | 2.544 MHz | 2.655 MHz | 2.460 MHz | 2.105 MHz |
| Cache | 16 MB | 16 MB | 8 MB | 4MB | 48 MB | 32 MB | 32 MB | 24 MB |
| Larghezza del bus di memoria | 256-bit | 256-bit | 256-bit | 96-bit | 256-bit | 128-bit | 128-bit | 128-bit |
| Larghezza di banda della memoria | 560 GB/s | 512 GB/s | 512 GB/s | 186 GB/s | 432 GB/s | 288 GB/s | 288 GB/s | 272 GB/s |
| Dimensioni della memoria | 16 GB GDDR6 | 8 GB GDDR6 | 8 GB GDDR6 | 6GB GDDR6 | 12 GB | 8 GB GDDR6 | 8 GB GDDR6 | 8 GB GDDR6 |
| TBP | 225 W | 225 W | 175 W | 75 W | 245 W | 165 W | 160 W | 115 W |
Velocità dell'orologio dello Sparkle Arc A380 Elf
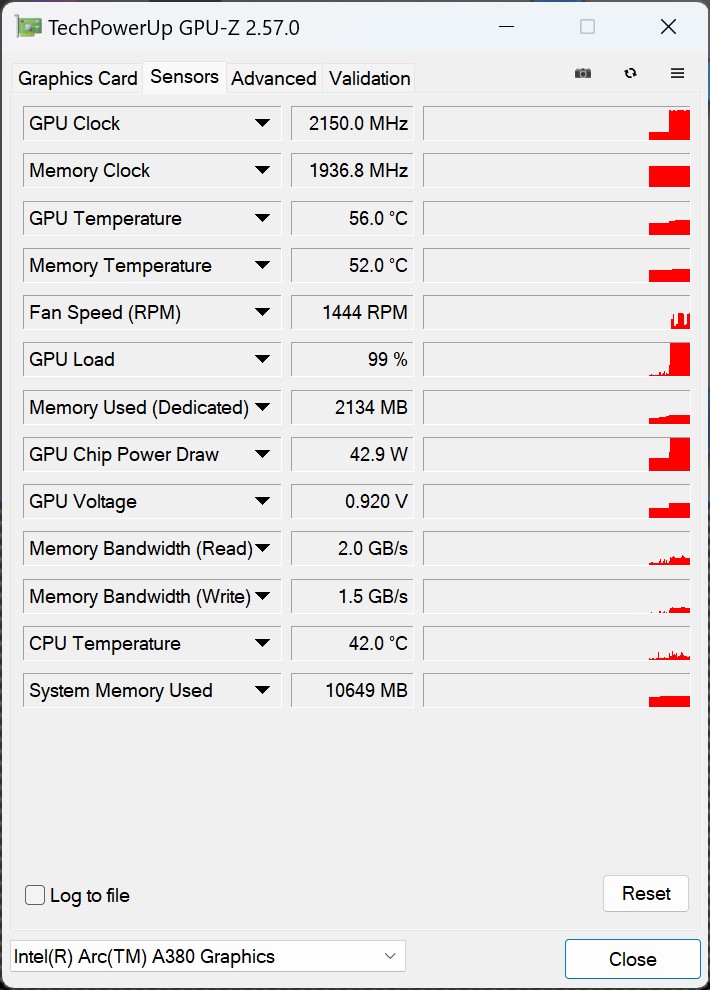
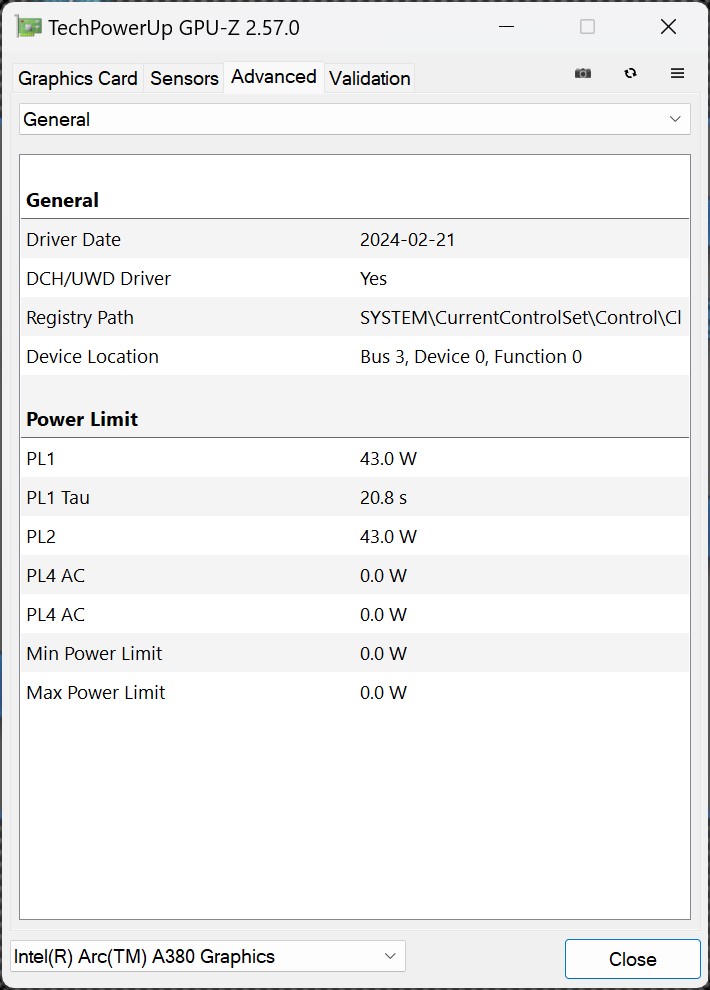
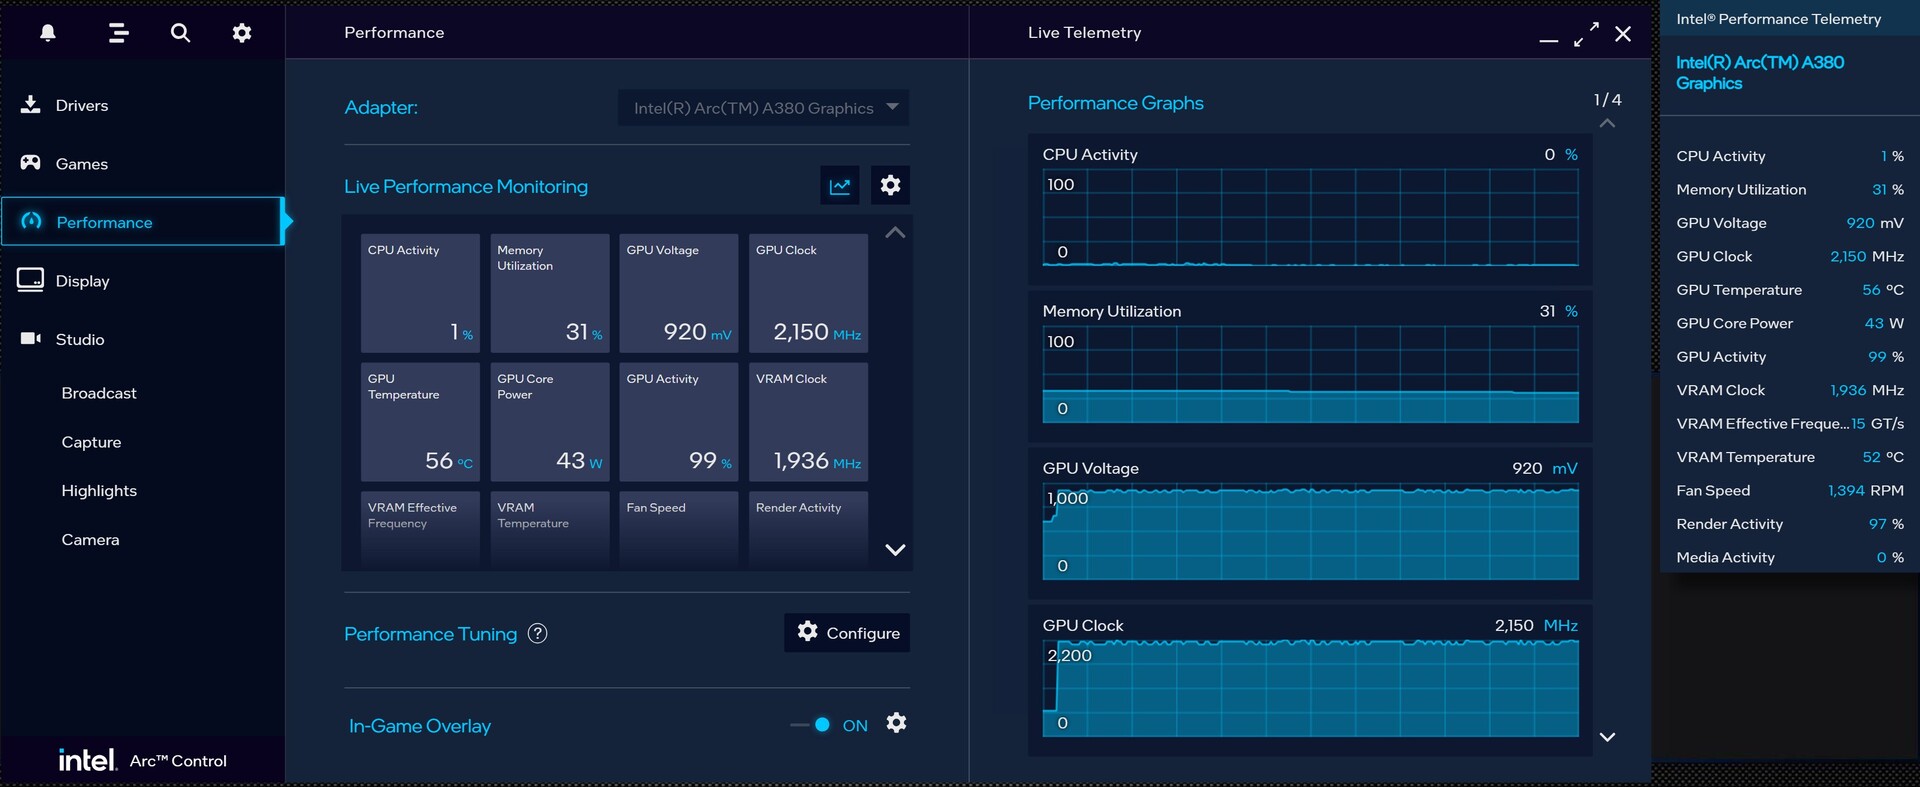
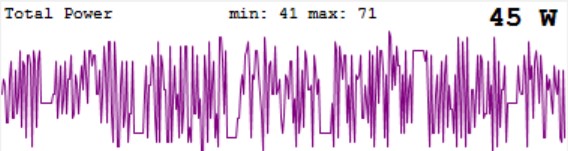
In termini di velocità di clock del chip grafico e della VRAM, Sparkle rispetta le specifiche di Intel. Sotto carico, raggiungiamo un boost della GPU fino a 2.400 MHz, sebbene questo cali sotto un carico più lungo, stabilizzandosi a circa 2.150 MHz. Il Power Target di Sparkle Arc A380 Elf è di 43 watt e non può essere aumentato ulteriormente.

Benchmark sintetici
Dalle specifiche tecniche si può già notare che Sparkle Arc A380 Elf è una scheda grafica semplice per sistemi a basso budget. Di conseguenza, la scheda grafica non è in grado di offrire prestazioni 3D elevate. Anche rispetto alla Sapphire Nitro+ Radeon RX 5500 XT 8G SEil nostro campione di prova rimane significativamente indietro. D'altra parte, la scheda grafica Intel presenta un'immagine migliore nel Benchmark Affinity Photo 2. Tuttavia, c'è un divario relativamente grande rispetto alla scheda grafica Intel Arc A580che attualmente è colmato solo da alcuni modelli di GPU più vecchi.
| Performance Rating - Percent | |
| KFA2 GeForce RTX 4070 EX Gamer | |
| Sapphire Pulse Radeon RX 7700 XT | |
| Sapphire Pulse Radeon RX 6750 XT | |
| AMD Radeon RX 6700 XT | |
| KFA2 GeForce RTX 4060 Ti EX, 16GB GDDR6 | |
| Acer Predator BiFrost Arc A770 OC, 16GB GDDR6 | |
| XFX Speedster QICK 308 Radeon RX 7600 Black Edition | |
| Sapphire Nitro+ Radeon RX 6650 XT | |
| Nvidia GeForce RTX 2070 Super | |
| KFA2 GeForce RTX 4060 1-Click-OC 2X | |
| Acer Predator BiFrost Arc A750 OC | |
| ASRock Arc A580 Challenger OC | |
| Nvidia GeForce RTX 2060 Super | |
| Sapphire Pulse Radeon RX 6600 | |
| Sapphire Nitro+ Radeon RX 5500 XT 8G SE | |
| Sparkle Intel Arc A380 Elf | |
| LuxMark v2.0 64Bit | |
| Room GPUs-only | |
| KFA2 GeForce RTX 4070 EX Gamer | |
| KFA2 GeForce RTX 4060 Ti EX, 16GB GDDR6 | |
| KFA2 GeForce RTX 4060 1-Click-OC 2X | |
| Acer Predator BiFrost Arc A750 OC | |
| Acer Predator BiFrost Arc A770 OC, 16GB GDDR6 | |
| ASRock Arc A580 Challenger OC | |
| Sapphire Pulse Radeon RX 7700 XT | |
| AMD Radeon RX 6700 XT | |
| Sapphire Pulse Radeon RX 6750 XT | |
| XFX Speedster QICK 308 Radeon RX 7600 Black Edition | |
| Sapphire Nitro+ Radeon RX 6650 XT | |
| Sapphire Pulse Radeon RX 6600 | |
| Sapphire Nitro+ Radeon RX 5500 XT 8G SE | |
| Sparkle Intel Arc A380 Elf | |
| Sala GPUs-only | |
| KFA2 GeForce RTX 4070 EX Gamer | |
| KFA2 GeForce RTX 4060 Ti EX, 16GB GDDR6 | |
| Acer Predator BiFrost Arc A770 OC, 16GB GDDR6 | |
| Acer Predator BiFrost Arc A750 OC | |
| ASRock Arc A580 Challenger OC | |
| KFA2 GeForce RTX 4060 1-Click-OC 2X | |
| Sapphire Pulse Radeon RX 7700 XT | |
| AMD Radeon RX 6700 XT | |
| Sapphire Pulse Radeon RX 6750 XT | |
| XFX Speedster QICK 308 Radeon RX 7600 Black Edition | |
| Sapphire Nitro+ Radeon RX 6650 XT | |
| Sapphire Pulse Radeon RX 6600 | |
| Sparkle Intel Arc A380 Elf | |
| Sapphire Nitro+ Radeon RX 5500 XT 8G SE | |
| Affinity Photo 2 - Combined (Single / Multi GPU) | |
| KFA2 GeForce RTX 4070 EX Gamer | |
| Nvidia GeForce RTX 2070 Super | |
| Nvidia GeForce RTX 2060 Super | |
| Sapphire Pulse Radeon RX 7700 XT | |
| Sapphire Pulse Radeon RX 6750 XT | |
| KFA2 GeForce RTX 4060 1-Click-OC 2X | |
| KFA2 GeForce RTX 4060 Ti EX, 16GB GDDR6 | |
| XFX Speedster QICK 308 Radeon RX 7600 Black Edition | |
| ASRock Arc A580 Challenger OC | |
| Acer Predator BiFrost Arc A770 OC, 16GB GDDR6 | |
| Acer Predator BiFrost Arc A750 OC | |
| Sparkle Intel Arc A380 Elf | |
| Sapphire Nitro+ Radeon RX 6650 XT | |
| AMD Radeon RX 6700 XT | |
| Sapphire Nitro+ Radeon RX 5500 XT 8G SE | |
| Sapphire Pulse Radeon RX 6600 | |
| 3DMark 05 Standard | 69490 punti | |
| 3DMark 06 Standard Score | 58638 punti | |
| 3DMark Vantage P Result | 53979 punti | |
| 3DMark 11 Performance | 15095 punti | |
| 3DMark Ice Storm Standard Score | 201497 punti | |
| 3DMark Cloud Gate Standard Score | 48677 punti | |
| 3DMark Fire Strike Score | 9728 punti | |
| 3DMark Fire Strike Extreme Score | 4735 punti | |
| 3DMark Time Spy Score | 4457 punti | |
Aiuto | ||
Applicazioni professionali
Abbiamo già visto nei test dei tre modelli Intel più veloci che Intel ha difficoltà a tenere il passo con gli attuali concorrenti. Con il chip grafico notevolmente ridotto utilizzato nel modello Sparkle Arc A380 Elf, anche qui c'è un grande divario di prestazioni tra le schede grafiche Intel. A causa delle prestazioni inferiori della GPU dell'Arc A380, sarebbe meglio passare a un altro modello in ambito professionale. Anche per l'ambito semi-professionale, la scheda grafica non merita una raccomandazione.
| ASRock Arc A580 Challenger OC i9-14900K | Intel Arc A580 i9-14900K | Intel Arc A750 R9 7950X | Intel Arc A770 R9 7950X | AMD Radeon RX 5500 XT (Desktop) R9 7950X | AMD Radeon RX 6600 R9 7950X | AMD Radeon RX 7600 R9 7950X | NVIDIA GeForce RTX 2060 Super (Desktop) R9 7950X | NVIDIA GeForce RTX 2070 Super (Desktop) R9 7950X | NVIDIA GeForce RTX 3060 Ti R9 7950X | NVIDIA GeForce RTX 4060 R9 7950X | NVIDIA GeForce RTX 4060 Ti 16G R9 7950X | NVIDIA GeForce RTX 4070 R9 7950X | Media della classe | |
|---|---|---|---|---|---|---|---|---|---|---|---|---|---|---|
| SPECviewperf 12 | 74% | 83% | 94% | 335% | 542% | 491% | 201% | 235% | 279% | 281% | 396% | 559% | 238% | |
| 1900x1060 3ds Max (3dsmax-05) | 81.4 | 154 89% | 166 104% | 179 120% | 141 73% | 258 217% | 279 243% | 220 170% | 247 203% | 297 265% | 251 208% | 290 256% | 382 369% | 198.2 ? 143% |
| 1900x1060 Catia (catia-04) | 84.2 | 162 92% | 166 97% | 174 107% | 108 28% | 256 204% | 273 224% | 84.5 0% | 114 35% | 114 35% | 113 34% | 128 52% | 161 91% | 108.2 ? 29% |
| 1900x1060 Creo (creo-01) | 39.7 | 45.5 15% | 45.7 15% | 45.3 14% | 72.7 83% | 133 235% | 115 190% | 58.8 48% | 65.7 65% | 65.2 64% | 60.6 53% | 73.4 85% | 89.1 124% | 65.2 ? 64% |
| 1900x1060 Energy (energy-01) | 1.09 | 2.02 85% | 2.25 106% | 2.44 124% | 23.1 2019% | 31.3 2772% | 25.5 2239% | 11.6 964% | 12.4 1038% | 14.4 1221% | 15.9 1359% | 22.6 1973% | 31.7 2808% | 15.8 ? 1350% |
| 1900x1060 Maya (maya-04) | 90.3 | 165 83% | 177 96% | 183 103% | 140 55% | 218 141% | 236 161% | 200 121% | 225 149% | 251 178% | 233 158% | 257 185% | 284 215% | 112.3 ? 24% |
| 1900x1060 Medical (medical-01) | 23.2 | 40.9 76% | 42.4 83% | 46.7 101% | 70.6 204% | 102 340% | 128 452% | 49.5 113% | 55.9 141% | 65.6 183% | 82.4 255% | 110 374% | 132 469% | 55.3 ? 138% |
| 1900x1060 Showcase (showcase-01) | 43.4 | 108 149% | 110 153% | 119 174% | 83.2 92% | 125 188% | 127 193% | 121 179% | 135 211% | 150 246% | 109 151% | 132 204% | 190 338% | 98.8 ? 128% |
| 1900x1060 Solidworks (sw-03) | 68.7 | 72.3 5% | 72.6 6% | 73.4 7% | 156 127% | 232 238% | 221 222% | 79.7 16% | 95.1 38% | 93.5 36% | 91.2 33% | 95.1 38% | 109 59% | 87.1 ? 27% |
| SPECviewperf 13 | 96% | 111% | 125% | 115% | 255% | 389% | 129% | 163% | 187% | 179% | 238% | 330% | 171% | |
| 3ds Max (3dsmax-06) | 81 | 151 86% | 163 101% | 179 121% | 141 74% | 258 219% | 280 246% | 218 169% | 247 205% | 297 267% | 252 211% | 289 257% | 381 370% | 189.6 ? 134% |
| Catia (catia-05) | 122 | 240 97% | 249 104% | 260 113% | 154 26% | 387 217% | 410 236% | 119 -2% | 163 34% | 167 37% | 163 34% | 189 55% | 241 98% | 202 ? 66% |
| Creo (creo-02) | 73.1 | 87.5 20% | 88.6 21% | 90 23% | 139 90% | 279 282% | 294 302% | 203 178% | 240 228% | 243 232% | 230 215% | 301 312% | 375 413% | 207 ? 183% |
| Energy (energy-02) | 6.44 | 15.7 144% | 19.3 200% | 22.5 249% | 29.4 357% | 44 583% | 82.9 1187% | 21.9 240% | 23.8 270% | 26.1 305% | 34.6 437% | 45.3 603% | 54.2 742% | 37 ? 475% |
| Maya (maya-05) | 125 | 285 128% | 301 141% | 319 155% | 208 66% | 348 178% | 333 166% | 291 133% | 344 175% | 372 198% | 343 174% | 403 222% | 510 308% | 269 ? 115% |
| Medical (medical-02) | 30.9 | 74.9 142% | 82.8 168% | 80.8 161% | 60.2 95% | 88.8 187% | 226 631% | 54.2 75% | 63.7 106% | 74.3 140% | 76.5 148% | 85.1 175% | 112 262% | 80.5 ? 161% |
| Showcase (showcase-02) | 43.3 | 109 152% | 110 154% | 119 175% | 83.2 92% | 125 189% | 127 193% | 122 182% | 135 212% | 150 246% | 108 149% | 133 207% | 191 341% | 121.1 ? 180% |
| Solidworks (sw-04) | 77.7 | 79.5 2% | 76.8 -1% | 77.5 0% | 168 116% | 220 183% | 195 151% | 119 53% | 136 75% | 135 74% | 127 63% | 135 74% | 157 102% | 121.8 ? 57% |
| SPECviewperf 2020 | 151% | 228% | 213% | 93% | 250% | 470% | 177% | 188% | 267% | 242% | 330% | 460% | 356% | |
| 3840x2160 Medical (medical-03) | 5 | 14.5 190% | 20 300% | 22.3 346% | 12.7 154% | 20.9 318% | 36.1 622% | 10.3 106% | 12 140% | 11.9 138% | 13.7 174% | 16.5 230% | 22.2 344% | 21.8 ? 336% |
| 3840x2160 Maya (maya-06) | 65.3 | 166 154% | 180 176% | 195 199% | 97.1 49% | 161 147% | 178 173% | 162 148% | 185 183% | 235 260% | 196 200% | 237 263% | 305 367% | 213 ? 226% |
| 3840x2160 Energy (energy-03) | 5.04 | 17.6 249% | 35 594% | 25 396% | 13.8 174% | 29.5 485% | 67 1229% | 22.9 354% | 17.8 253% | 31.2 519% | 33.2 559% | 44.9 791% | 57.6 1043% | 51.2 ? 916% |
| 3840x2160 Creo (creo-03) | 34.1 | 51.7 52% | 51.9 52% | 52.9 55% | 58.6 72% | 93.4 174% | 106 211% | 77.2 126% | 85.8 152% | 91.2 167% | 85.9 152% | 95.9 181% | 112 228% | 78 ? 129% |
| 3840x2160 CATIA (catia-06) | 18.3 | 36.7 101% | 38.9 113% | 38.9 113% | 30.3 66% | 60.8 232% | 68 272% | 30.5 67% | 36.7 101% | 40.5 121% | 34 86% | 38.5 110% | 51.6 182% | 47.9 ? 162% |
| 3840x2160 3ds Max (3dsmax-07) | 17.6 | 45.2 157% | 40.7 131% | 47.4 169% | 25.2 43% | 42.4 141% | 72.9 314% | 63.1 259% | 69.7 296% | 87 394% | 67.4 283% | 88.8 405% | 122 593% | 82 ? 366% |
| Media totale (Programma / Settaggio) | 107% /
103% | 141% /
132% | 144% /
138% | 181% /
189% | 349% /
358% | 450% /
448% | 169% /
168% | 195% /
196% | 244% /
242% | 234% /
233% | 321% /
321% | 450% /
448% | 255% /
246% |
Prestazioni di gioco
Diamo un'occhiata alle prestazioni 3D di Sparkle Arc A380 Elf nei giochi attuali e anche in quelli più vecchi, utilizzando numerosi titoli di gioco. Vediamo un quadro simile a quello dei benchmark sintetici 3DMark precedenti. Per confrontare le prestazioni della nostra unità di test con le potenti iGPU di AMD, includiamo anche la AMD Radeon 780M nel nostro test. Nella maggior parte dei casi, Sparkle Arc A380 Elf vince questo confronto, anche se ci sono alcuni giochi che non ci si deve aspettare che l'Arc Intel sia in grado di giocare. Coloro che hanno intenzione di acquistare l'Arc A380 dovrebbero prima capire a quali giochi vogliono giocare. Il nostro elenco di giochi testati include una serie di giochi più vecchi ma anche più attuali, che possono essere giocati con la scheda grafica economica.
Può trovare una panoramica delle prestazioni rispetto ad altre schede grafiche nella nostra Elenco di giochi GPU.
| The Witcher 3 - 1366x768 Medium Graphics & Postprocessing | |
| KFA2 GeForce RTX 4070 Ti EX Gamer | |
| AMD Radeon RX 7900 GRE | |
| KFA2 GeForce RTX 4070 EX Gamer | |
| Sapphire Pulse Radeon RX 7700 XT | |
| AMD Radeon RX 7800 XT | |
| KFA2 GeForce RTX 4060 Ti EX, 16GB GDDR6 | |
| Sapphire Pulse Radeon RX 6750 XT | |
| XFX Speedster QICK 308 Radeon RX 7600 Black Edition | |
| AMD Radeon RX 6700 XT | |
| KFA2 GeForce RTX 4060 1-Click-OC 2X | |
| Nvidia GeForce RTX 2070 Super | |
| Sapphire Nitro+ Radeon RX 6650 XT | |
| Acer Predator BiFrost Arc A770 OC, 16GB GDDR6 | |
| Acer Predator BiFrost Arc A750 OC | |
| Nvidia GeForce RTX 2060 Super | |
| ASRock Arc A580 Challenger OC | |
| Sapphire Pulse Radeon RX 6600 | |
| Sapphire Nitro+ Radeon RX 5500 XT 8G SE | |
| Sparkle Intel Arc A380 Elf | |
| Media AMD Radeon 780M (47.7 - 103.8, n=22) | |
| Metro Exodus - 1920x1080 Medium Quality AF:4x | |
| KFA2 GeForce RTX 4070 Ti EX Gamer | |
| AMD Radeon RX 7900 GRE | |
| KFA2 GeForce RTX 4070 EX Gamer | |
| AMD Radeon RX 7800 XT | |
| Sapphire Pulse Radeon RX 7700 XT | |
| Sapphire Pulse Radeon RX 6750 XT | |
| KFA2 GeForce RTX 4060 Ti EX, 16GB GDDR6 | |
| AMD Radeon RX 6700 XT | |
| Acer Predator BiFrost Arc A770 OC, 16GB GDDR6 | |
| XFX Speedster QICK 308 Radeon RX 7600 Black Edition | |
| Acer Predator BiFrost Arc A750 OC | |
| KFA2 GeForce RTX 4060 1-Click-OC 2X | |
| Nvidia GeForce RTX 2070 Super | |
| ASRock Arc A580 Challenger OC | |
| Sapphire Nitro+ Radeon RX 6650 XT | |
| Nvidia GeForce RTX 2060 Super | |
| Sapphire Pulse Radeon RX 6600 | |
| Sapphire Nitro+ Radeon RX 5500 XT 8G SE | |
| Sparkle Intel Arc A380 Elf | |
| Media AMD Radeon 780M (32.2 - 37.8, n=8) | |
| Far Cry 5 - 1920x1080 Medium Preset AA:T | |
| KFA2 GeForce RTX 4070 EX Gamer | |
| KFA2 GeForce RTX 4070 Ti EX Gamer | |
| AMD Radeon RX 7900 GRE | |
| KFA2 GeForce RTX 4060 Ti EX, 16GB GDDR6 | |
| Sapphire Pulse Radeon RX 6750 XT | |
| AMD Radeon RX 6700 XT | |
| Sapphire Pulse Radeon RX 7700 XT | |
| KFA2 GeForce RTX 4060 1-Click-OC 2X | |
| XFX Speedster QICK 308 Radeon RX 7600 Black Edition | |
| AMD Radeon RX 7800 XT | |
| Sapphire Nitro+ Radeon RX 6650 XT | |
| Nvidia GeForce RTX 2070 Super | |
| Sapphire Pulse Radeon RX 6600 | |
| Nvidia GeForce RTX 2060 Super | |
| ASRock Arc A580 Challenger OC | |
| Acer Predator BiFrost Arc A770 OC, 16GB GDDR6 | |
| Acer Predator BiFrost Arc A750 OC | |
| Sapphire Nitro+ Radeon RX 5500 XT 8G SE | |
| Sparkle Intel Arc A380 Elf | |
| Media AMD Radeon 780M (22 - 54, n=48) | |
| Far Cry 6 - 1920x1080 Medium Graphics Quality AA:SM | |
| AMD Radeon RX 7900 GRE | |
| AMD Radeon RX 7800 XT | |
| KFA2 GeForce RTX 4070 Ti EX Gamer | |
| Sapphire Pulse Radeon RX 7700 XT | |
| KFA2 GeForce RTX 4070 EX Gamer | |
| Sapphire Pulse Radeon RX 6750 XT | |
| XFX Speedster QICK 308 Radeon RX 7600 Black Edition | |
| AMD Radeon RX 6700 XT | |
| KFA2 GeForce RTX 4060 Ti EX, 16GB GDDR6 | |
| Sapphire Nitro+ Radeon RX 6650 XT | |
| KFA2 GeForce RTX 4060 1-Click-OC 2X | |
| Nvidia GeForce RTX 2070 Super | |
| Sapphire Pulse Radeon RX 6600 | |
| Acer Predator BiFrost Arc A770 OC, 16GB GDDR6 | |
| Nvidia GeForce RTX 2060 Super | |
| Acer Predator BiFrost Arc A750 OC | |
| ASRock Arc A580 Challenger OC | |
| Sapphire Nitro+ Radeon RX 5500 XT 8G SE | |
| Sparkle Intel Arc A380 Elf | |
| Media AMD Radeon 780M (43 - 48, n=4) | |
| F1 2021 - 1920x1080 Medium Preset AA:T AF:16x | |
| AMD Radeon RX 7900 GRE (874931) | |
| AMD Radeon RX 7800 XT (874931) | |
| KFA2 GeForce RTX 4070 Ti EX Gamer (874931) | |
| KFA2 GeForce RTX 4070 EX Gamer (874931) | |
| Sapphire Pulse Radeon RX 7700 XT (874931) | |
| Sapphire Pulse Radeon RX 6750 XT (874931) | |
| KFA2 GeForce RTX 4060 Ti EX, 16GB GDDR6 (874931) | |
| AMD Radeon RX 6700 XT (874931) | |
| XFX Speedster QICK 308 Radeon RX 7600 Black Edition (874931) | |
| Sapphire Nitro+ Radeon RX 6650 XT (874931) | |
| Acer Predator BiFrost Arc A770 OC, 16GB GDDR6 (874931) | |
| Nvidia GeForce RTX 2070 Super (874931) | |
| Acer Predator BiFrost Arc A750 OC (874931) | |
| Sapphire Pulse Radeon RX 6600 (874931) | |
| ASRock Arc A580 Challenger OC (874931) | |
| Nvidia GeForce RTX 2060 Super (874931) | |
| Sapphire Nitro+ Radeon RX 5500 XT 8G SE (874931) | |
| Sparkle Intel Arc A380 Elf (874931) | |
| Media AMD Radeon 780M (53.9 - 115, n=16) | |
| F1 22 - 1920x1080 Medium Preset AA:T AF:16x | |
| AMD Radeon RX 7900 GRE (959964) | |
| AMD Radeon RX 7800 XT (959964) | |
| KFA2 GeForce RTX 4070 Ti EX Gamer (959964) | |
| Sapphire Pulse Radeon RX 6750 XT (959964) | |
| Sapphire Pulse Radeon RX 7700 XT (959964) | |
| KFA2 GeForce RTX 4070 EX Gamer (959964) | |
| AMD Radeon RX 6700 XT (939134) | |
| KFA2 GeForce RTX 4060 Ti EX, 16GB GDDR6 (959964) | |
| XFX Speedster QICK 308 Radeon RX 7600 Black Edition (959964) | |
| Sapphire Nitro+ Radeon RX 6650 XT (946728) | |
| Nvidia GeForce RTX 2070 Super (923662) | |
| Acer Predator BiFrost Arc A770 OC, 16GB GDDR6 (959964) | |
| Sapphire Pulse Radeon RX 6600 (946728) | |
| Acer Predator BiFrost Arc A750 OC (959964) | |
| Nvidia GeForce RTX 2060 Super (923662) | |
| ASRock Arc A580 Challenger OC (959964) | |
| KFA2 GeForce RTX 4060 1-Click-OC 2X (959964) | |
| Sapphire Nitro+ Radeon RX 5500 XT 8G SE (959964) | |
| Sparkle Intel Arc A380 Elf (959964) | |
| Media AMD Radeon 780M (41.5 - 95, n=35) | |
| Cyberpunk 2077 1.6 - 1920x1080 Medium Preset | |
| KFA2 GeForce RTX 4070 Ti EX Gamer | |
| AMD Radeon RX 7900 GRE (1.6) | |
| AMD Radeon RX 7800 XT (1.6) | |
| KFA2 GeForce RTX 4070 EX Gamer | |
| Sapphire Pulse Radeon RX 7700 XT (1.6) | |
| KFA2 GeForce RTX 4060 Ti EX, 16GB GDDR6 (1.6) | |
| Sapphire Nitro+ Radeon RX 6650 XT (1.5) | |
| Sapphire Pulse Radeon RX 6750 XT | |
| AMD Radeon RX 6700 XT (1.61) | |
| XFX Speedster QICK 308 Radeon RX 7600 Black Edition (1.6) | |
| KFA2 GeForce RTX 4060 1-Click-OC 2X (1.6) | |
| Sapphire Pulse Radeon RX 6600 (1.5) | |
| Nvidia GeForce RTX 2070 Super (1.6) | |
| Nvidia GeForce RTX 2060 Super (1.6) | |
| Acer Predator BiFrost Arc A770 OC, 16GB GDDR6 (1.6) | |
| Acer Predator BiFrost Arc A750 OC (1.6) | |
| ASRock Arc A580 Challenger OC (1.6) | |
| Sapphire Nitro+ Radeon RX 5500 XT 8G SE | |
| Sparkle Intel Arc A380 Elf (1.6) | |
| Media AMD Radeon 780M (16 - 42, n=12) | |
| A Plague Tale Requiem - 1920x1080 Medium Preset | |
| KFA2 GeForce RTX 4070 Ti EX Gamer | |
| AMD Radeon RX 7900 GRE | |
| AMD Radeon RX 7800 XT | |
| KFA2 GeForce RTX 4070 EX Gamer | |
| Sapphire Pulse Radeon RX 7700 XT | |
| KFA2 GeForce RTX 4060 Ti EX, 16GB GDDR6 | |
| Sapphire Pulse Radeon RX 6750 XT | |
| AMD Radeon RX 6700 XT | |
| XFX Speedster QICK 308 Radeon RX 7600 Black Edition | |
| KFA2 GeForce RTX 4060 1-Click-OC 2X | |
| Sapphire Nitro+ Radeon RX 6650 XT | |
| Nvidia GeForce RTX 2070 Super | |
| Acer Predator BiFrost Arc A770 OC, 16GB GDDR6 | |
| Acer Predator BiFrost Arc A750 OC | |
| Nvidia GeForce RTX 2060 Super | |
| Sapphire Pulse Radeon RX 6600 | |
| ASRock Arc A580 Challenger OC | |
| Sapphire Nitro+ Radeon RX 5500 XT 8G SE | |
| Sparkle Intel Arc A380 Elf | |
| Media AMD Radeon 780M (n=1) | |
| Spider-Man Miles Morales - 1920x1080 Medium Preset AA:SM | |
| KFA2 GeForce RTX 4070 Ti EX Gamer | |
| AMD Radeon RX 7800 XT | |
| KFA2 GeForce RTX 4070 EX Gamer | |
| AMD Radeon RX 7900 GRE | |
| KFA2 GeForce RTX 4060 Ti EX, 16GB GDDR6 | |
| Sapphire Pulse Radeon RX 7700 XT | |
| XFX Speedster QICK 308 Radeon RX 7600 Black Edition | |
| Sapphire Pulse Radeon RX 6750 XT | |
| KFA2 GeForce RTX 4060 1-Click-OC 2X | |
| AMD Radeon RX 6700 XT | |
| Acer Predator BiFrost Arc A770 OC, 16GB GDDR6 | |
| Nvidia GeForce RTX 2070 Super | |
| Acer Predator BiFrost Arc A750 OC | |
| Sapphire Nitro+ Radeon RX 6650 XT | |
| ASRock Arc A580 Challenger OC | |
| Nvidia GeForce RTX 2060 Super | |
| Sapphire Pulse Radeon RX 6600 | |
| Sapphire Nitro+ Radeon RX 5500 XT 8G SE | |
| Sparkle Intel Arc A380 Elf | |
| Media AMD Radeon 780M (n=1) | |
| Borderlands 3 - 1920x1080 Medium Overall Quality (DX11) | |
| KFA2 GeForce RTX 4070 EX Gamer | |
| AMD Radeon RX 7900 GRE | |
| AMD Radeon RX 7800 XT | |
| Sapphire Pulse Radeon RX 7700 XT | |
| KFA2 GeForce RTX 4070 Ti EX Gamer | |
| Sapphire Pulse Radeon RX 6750 XT | |
| AMD Radeon RX 6700 XT | |
| KFA2 GeForce RTX 4060 Ti EX, 16GB GDDR6 | |
| KFA2 GeForce RTX 4060 1-Click-OC 2X | |
| Sapphire Nitro+ Radeon RX 6650 XT | |
| XFX Speedster QICK 308 Radeon RX 7600 Black Edition | |
| Nvidia GeForce RTX 2070 Super | |
| Sapphire Pulse Radeon RX 6600 | |
| Nvidia GeForce RTX 2060 Super | |
| ASRock Arc A580 Challenger OC | |
| Acer Predator BiFrost Arc A750 OC | |
| Acer Predator BiFrost Arc A770 OC, 16GB GDDR6 | |
| Sapphire Nitro+ Radeon RX 5500 XT 8G SE | |
| Sparkle Intel Arc A380 Elf | |
| Media AMD Radeon 780M (38.6 - 51.4, n=8) | |
| God of War - 1920x1080 Original Preset | |
| AMD Radeon RX 7800 XT | |
| AMD Radeon RX 7900 GRE | |
| KFA2 GeForce RTX 4070 EX Gamer | |
| Sapphire Pulse Radeon RX 7700 XT | |
| Sapphire Pulse Radeon RX 6750 XT | |
| AMD Radeon RX 6700 XT | |
| KFA2 GeForce RTX 4060 Ti EX, 16GB GDDR6 | |
| XFX Speedster QICK 308 Radeon RX 7600 Black Edition | |
| KFA2 GeForce RTX 4060 1-Click-OC 2X | |
| Nvidia GeForce RTX 2070 Super | |
| Sapphire Nitro+ Radeon RX 6650 XT | |
| Nvidia GeForce RTX 2060 Super | |
| Sapphire Pulse Radeon RX 6600 | |
| Acer Predator BiFrost Arc A770 OC, 16GB GDDR6 | |
| Acer Predator BiFrost Arc A750 OC | |
| ASRock Arc A580 Challenger OC | |
| Sapphire Nitro+ Radeon RX 5500 XT 8G SE | |
| Sparkle Intel Arc A380 Elf | |
| Media AMD Radeon 780M (19.5 - 34.3, n=8) | |
| GTA V - 1366x768 Normal/Off AF:4x | |
| AMD Radeon RX 6700 XT | |
| Sapphire Nitro+ Radeon RX 6650 XT | |
| Sapphire Pulse Radeon RX 6750 XT | |
| XFX Speedster QICK 308 Radeon RX 7600 Black Edition | |
| Sapphire Pulse Radeon RX 6600 | |
| Nvidia GeForce RTX 2060 Super | |
| KFA2 GeForce RTX 4070 EX Gamer | |
| KFA2 GeForce RTX 4060 Ti EX, 16GB GDDR6 | |
| Nvidia GeForce RTX 2070 Super | |
| KFA2 GeForce RTX 4060 1-Click-OC 2X | |
| ASRock Arc A580 Challenger OC | |
| Sapphire Nitro+ Radeon RX 5500 XT 8G SE | |
| KFA2 GeForce RTX 4070 Ti EX Gamer | |
| Sparkle Intel Arc A380 Elf | |
| AMD Radeon RX 7900 GRE | |
| AMD Radeon RX 7800 XT | |
| Sapphire Pulse Radeon RX 7700 XT | |
| Acer Predator BiFrost Arc A750 OC | |
| Acer Predator BiFrost Arc A770 OC, 16GB GDDR6 | |
| Media AMD Radeon 780M (91.2 - 159, n=46) | |
| The Quarry - 1920x1080 Medium Preset | |
| KFA2 GeForce RTX 4070 Ti EX Gamer | |
| AMD Radeon RX 7900 GRE | |
| KFA2 GeForce RTX 4070 EX Gamer | |
| AMD Radeon RX 7800 XT | |
| Sapphire Pulse Radeon RX 7700 XT | |
| KFA2 GeForce RTX 4060 Ti EX, 16GB GDDR6 | |
| Sapphire Pulse Radeon RX 6750 XT | |
| AMD Radeon RX 6700 XT | |
| KFA2 GeForce RTX 4060 1-Click-OC 2X | |
| XFX Speedster QICK 308 Radeon RX 7600 Black Edition | |
| Nvidia GeForce RTX 2070 Super | |
| Sapphire Nitro+ Radeon RX 6650 XT | |
| Nvidia GeForce RTX 2060 Super | |
| Acer Predator BiFrost Arc A770 OC, 16GB GDDR6 | |
| Sapphire Pulse Radeon RX 6600 | |
| Acer Predator BiFrost Arc A750 OC | |
| ASRock Arc A580 Challenger OC | |
| Sapphire Nitro+ Radeon RX 5500 XT 8G SE | |
| Sparkle Intel Arc A380 Elf | |
| Media AMD Radeon 780M (n=1) | |
| Tiny Tina's Wonderlands - 1920x1080 Medium Preset (DX12) | |
| AMD Radeon RX 7900 GRE | |
| KFA2 GeForce RTX 4070 Ti EX Gamer | |
| AMD Radeon RX 7800 XT | |
| KFA2 GeForce RTX 4070 EX Gamer | |
| Sapphire Pulse Radeon RX 7700 XT | |
| Sapphire Pulse Radeon RX 6750 XT | |
| AMD Radeon RX 6700 XT | |
| KFA2 GeForce RTX 4060 Ti EX, 16GB GDDR6 | |
| Sapphire Nitro+ Radeon RX 6650 XT | |
| XFX Speedster QICK 308 Radeon RX 7600 Black Edition | |
| KFA2 GeForce RTX 4060 1-Click-OC 2X | |
| Acer Predator BiFrost Arc A770 OC, 16GB GDDR6 | |
| Nvidia GeForce RTX 2070 Super | |
| Sapphire Pulse Radeon RX 6600 | |
| Acer Predator BiFrost Arc A750 OC | |
| ASRock Arc A580 Challenger OC | |
| Nvidia GeForce RTX 2060 Super | |
| Sapphire Nitro+ Radeon RX 5500 XT 8G SE | |
| Sparkle Intel Arc A380 Elf | |
| Media AMD Radeon 780M (28.4 - 55.9, n=25) | |
| GRID Legends - 1920x1080 Medium Preset | |
| AMD Radeon RX 6700 XT (643827) | |
| Sapphire Pulse Radeon RX 6750 XT (712825) | |
| Sapphire Nitro+ Radeon RX 6650 XT (643827) | |
| KFA2 GeForce RTX 4070 EX Gamer (712825) | |
| KFA2 GeForce RTX 4070 Ti EX Gamer (712825) | |
| Nvidia GeForce RTX 2070 Super (591708) | |
| AMD Radeon RX 7800 XT (800660) | |
| Sapphire Pulse Radeon RX 7700 XT (800660) | |
| AMD Radeon RX 7900 GRE (800660) | |
| Nvidia GeForce RTX 2060 Super (623651) | |
| XFX Speedster QICK 308 Radeon RX 7600 Black Edition (800660) | |
| KFA2 GeForce RTX 4060 Ti EX, 16GB GDDR6 (800660) | |
| Sapphire Pulse Radeon RX 6600 (683088) | |
| KFA2 GeForce RTX 4060 1-Click-OC 2X (800660) | |
| Acer Predator BiFrost Arc A770 OC, 16GB GDDR6 (800660) | |
| ASRock Arc A580 Challenger OC (800660) | |
| Acer Predator BiFrost Arc A750 OC (800660) | |
| Sapphire Nitro+ Radeon RX 5500 XT 8G SE (712825) | |
| Sparkle Intel Arc A380 Elf (800660) | |
| Media AMD Radeon 780M (73.4 - 92.5, n=8) | |
| F1 23 - 1920x1080 Medium Preset AA:T AF:16x | |
| AMD Radeon RX 7800 XT (1022189) | |
| AMD Radeon RX 7900 GRE (1016022) | |
| Sapphire Pulse Radeon RX 7700 XT (1026791) | |
| KFA2 GeForce RTX 4070 EX Gamer | |
| Sapphire Pulse Radeon RX 6750 XT (1016022) | |
| AMD Radeon RX 6700 XT (1016022) | |
| KFA2 GeForce RTX 4060 Ti EX, 16GB GDDR6 (1022189) | |
| XFX Speedster QICK 308 Radeon RX 7600 Black Edition (1016022) | |
| Sapphire Nitro+ Radeon RX 6650 XT (1016022) | |
| KFA2 GeForce RTX 4060 1-Click-OC 2X (1008687) | |
| Nvidia GeForce RTX 2070 Super (1021115) | |
| Acer Predator BiFrost Arc A770 OC, 16GB GDDR6 (1026791) | |
| Sapphire Pulse Radeon RX 6600 (1016022) | |
| Acer Predator BiFrost Arc A750 OC (1042581) | |
| Nvidia GeForce RTX 2060 Super (1021115) | |
| ASRock Arc A580 Challenger OC (1082038) | |
| Sapphire Nitro+ Radeon RX 5500 XT 8G SE (1022189) | |
| Sparkle Intel Arc A380 Elf (1082038) | |
| Media AMD Radeon 780M (38.1 - 84.4, n=30) | |
| Hogwarts Legacy - 1920x1080 Medium Preset AA:High T | |
| AMD Radeon RX 7900 GRE | |
| AMD Radeon RX 7800 XT | |
| Sapphire Pulse Radeon RX 7700 XT | |
| KFA2 GeForce RTX 4070 EX Gamer | |
| KFA2 GeForce RTX 4070 Ti EX Gamer | |
| Sapphire Pulse Radeon RX 6750 XT | |
| KFA2 GeForce RTX 4060 Ti EX, 16GB GDDR6 | |
| AMD Radeon RX 6700 XT | |
| XFX Speedster QICK 308 Radeon RX 7600 Black Edition | |
| KFA2 GeForce RTX 4060 1-Click-OC 2X | |
| Sapphire Nitro+ Radeon RX 6650 XT | |
| Nvidia GeForce RTX 2070 Super | |
| Acer Predator BiFrost Arc A770 OC, 16GB GDDR6 | |
| Nvidia GeForce RTX 2060 Super | |
| Sapphire Pulse Radeon RX 6600 | |
| Acer Predator BiFrost Arc A750 OC | |
| ASRock Arc A580 Challenger OC | |
| Sapphire Nitro+ Radeon RX 5500 XT 8G SE | |
| Media AMD Radeon 780M (21.9 - 37.6, n=5) | |
| Sparkle Intel Arc A380 Elf | |
| Returnal - 1920x1080 Medium Preset | |
| AMD Radeon RX 7900 GRE | |
| KFA2 GeForce RTX 4070 Ti EX Gamer | |
| AMD Radeon RX 7800 XT | |
| KFA2 GeForce RTX 4070 EX Gamer | |
| Sapphire Pulse Radeon RX 7700 XT | |
| Sapphire Pulse Radeon RX 6750 XT | |
| AMD Radeon RX 6700 XT | |
| KFA2 GeForce RTX 4060 Ti EX, 16GB GDDR6 | |
| Sapphire Nitro+ Radeon RX 6650 XT | |
| XFX Speedster QICK 308 Radeon RX 7600 Black Edition | |
| KFA2 GeForce RTX 4060 1-Click-OC 2X | |
| Nvidia GeForce RTX 2070 Super | |
| Acer Predator BiFrost Arc A770 OC, 16GB GDDR6 | |
| Nvidia GeForce RTX 2060 Super | |
| Sapphire Pulse Radeon RX 6600 | |
| Acer Predator BiFrost Arc A750 OC | |
| ASRock Arc A580 Challenger OC | |
| Sapphire Nitro+ Radeon RX 5500 XT 8G SE | |
| Sparkle Intel Arc A380 Elf | |
| Media AMD Radeon 780M (20 - 29, n=2) | |
| Diablo 4 - 1920x1080 Medium Preset | |
| KFA2 GeForce RTX 4070 EX Gamer | |
| AMD Radeon RX 7800 XT | |
| AMD Radeon RX 7900 GRE | |
| Sapphire Pulse Radeon RX 7700 XT | |
| KFA2 GeForce RTX 4060 Ti EX, 16GB GDDR6 | |
| Sapphire Pulse Radeon RX 6750 XT | |
| AMD Radeon RX 6700 XT | |
| KFA2 GeForce RTX 4060 1-Click-OC 2X | |
| Nvidia GeForce RTX 2070 Super | |
| XFX Speedster QICK 308 Radeon RX 7600 Black Edition | |
| Sapphire Nitro+ Radeon RX 6650 XT | |
| Nvidia GeForce RTX 2060 Super | |
| Acer Predator BiFrost Arc A770 OC, 16GB GDDR6 | |
| Sapphire Pulse Radeon RX 6600 | |
| Acer Predator BiFrost Arc A750 OC | |
| ASRock Arc A580 Challenger OC | |
| Sapphire Nitro+ Radeon RX 5500 XT 8G SE | |
| Sparkle Intel Arc A380 Elf | |
| Media AMD Radeon 780M (n=1) | |
Overview of the Games Tested with the Sparkle Arc A380 Elf
| basso | medio | alto | ultra | |
|---|---|---|---|---|
| Prince of Persia The Lost Crown (2024) | 308 | 200 | 185.5 | |
| Palworld (2024) | 46.3 | 37.4 | 27.4 | 24.4 |
| Enshrouded (2024) | 28.5 | 25.5 | 20.9 | 17.1 |
| Helldivers 2 (2024) | 46.6 | 36.5 | 32.4 | 33.1 |
| Skull & Bones (2024) | 41 | 36 | 30 | 23 |
| Last Epoch (2024) | 78.2 | 70.3 | 57.1 | 42.7 |
| Alone in the Dark (2024) | 84.6 | 71.6 | 59 | 29.5 |
| Horizon Forbidden West (2024) | 34.5 | 31.2 | 20.2 | 14.9 |
| Dragon's Dogma 2 (2024) | 22 | 18.9 | ||
| Ghost of Tsushima (2024) | 40 | 32.6 | 28 | 20 |
| Senua's Saga Hellblade 2 (2024) | 19.1 | 12.5 | 9.2 | |
| F1 24 (2024) | 108.8 | 91 | 63.5 | 16.3 |
Emissioni - Relativamente rumorose, nonostante le basse prestazioni
Emissioni di rumore
Sparkle Arc A380 Elf è dotata di una ventola da 90 millimetri (~3,5 pollici). Fortunatamente, il produttore non ha rinunciato alla modalità di arresto della ventola, per cui la scheda grafica può funzionare silenziosamente durante il funzionamento inattivo. Sotto carico, oltre al rumore della ventola, registriamo anche un fruscio della bobina molto evidente. Nel nostro test, questo era persino leggermente più forte sotto carico medio che durante lo stress test. Con una media di 38,3 dB(A) durante il gioco, il livello di rumore era anche leggermente superiore a quello determinato durante lo stress test (37,7 dB(A)).
Il produttore deve anche recuperare un po' di terreno in termini di controllo della velocità della ventola: Sotto carico, la ventola continua a salire inutilmente di giri in brevi intervalli di tempo. Questo è molto fastidioso a lungo andare, e si può rimediare solo regolando manualmente la curva della ventola nel driver Intel. In alternativa, può anche impostare la velocità della ventola su un valore fisso.
Rumorosità
| Idle |
| 26 / 26 / 26.5 dB(A) |
| Sotto carico |
| 39.5 / 37.7 dB(A) |
 | ||
30 dB silenzioso 40 dB(A) udibile 50 dB(A) rumoroso |
||
min: | ||
| Sparkle Intel Arc A380 Elf | ASRock Arc A580 Challenger OC | Acer Predator BiFrost Arc A750 OC | Acer Predator BiFrost Arc A770 OC, 16GB GDDR6 | AMD Radeon RX 7800 XT | KFA2 GeForce RTX 4070 Ti EX Gamer | KFA2 GeForce RTX 4070 EX Gamer | KFA2 GeForce RTX 4060 1-Click-OC 2X | ASUS Dual GeForce RTX 4060 Ti OC | XFX Speedster QICK 308 Radeon RX 7600 Black Edition | Sapphire Pulse Radeon RX 7700 XT | |
|---|---|---|---|---|---|---|---|---|---|---|---|
| Noise | 3% | -10% | -24% | -2% | -9% | -9% | -1% | -2% | 2% | -1% | |
| off /ambiente * | 25.3 | 25.3 -0% | 25.4 -0% | 25.4 -0% | 24.7 2% | 30 -19% | 30 -19% | 25.8 -2% | 25.4 -0% | 25.4 -0% | 25 1% |
| Idle Minimum * | 26 | 25.7 1% | 29 -12% | 39 -50% | 26.8 -3% | 30.1 -16% | 30.2 -16% | 25.9 -0% | 26.7 -3% | 26.3 -1% | 27.4 -5% |
| Idle Average * | 26 | 25.8 1% | 29.2 -12% | 39 -50% | 27.2 -5% | 30.1 -16% | 30.2 -16% | 25.9 -0% | 26.7 -3% | 26.3 -1% | 27.5 -6% |
| Idle Maximum * | 26.5 | 25.8 3% | 29.3 -11% | 39 -47% | 27.3 -3% | 30.1 -14% | 30.2 -14% | 25.9 2% | 26.7 -1% | 26.3 1% | 28 -6% |
| Load Average * | 39.5 | 34.3 13% | 35.1 11% | 39 1% | 30.7 22% | 30.2 24% | 31.8 19% | 30.3 23% | 29.3 26% | 29.6 25% | 32.6 17% |
| Witcher 3 ultra * | 38.3 | 37.1 3% | 44.2 -15% | 41.5 -8% | 42.6 -11% | 40.2 -5% | 45.2 -18% | 42.5 -11% | 39.6 -3% | 42.1 -10% | |
| Load Maximum * | 37.7 | 36.9 2% | 49.7 -32% | 42.1 -12% | 43 -14% | 44.7 -19% | 41.1 -9% | 43.5 -15% | 46 -22% | 39.4 -5% | 37.6 -0% |
* ... Meglio usare valori piccoli
Temperature e consumo di energia
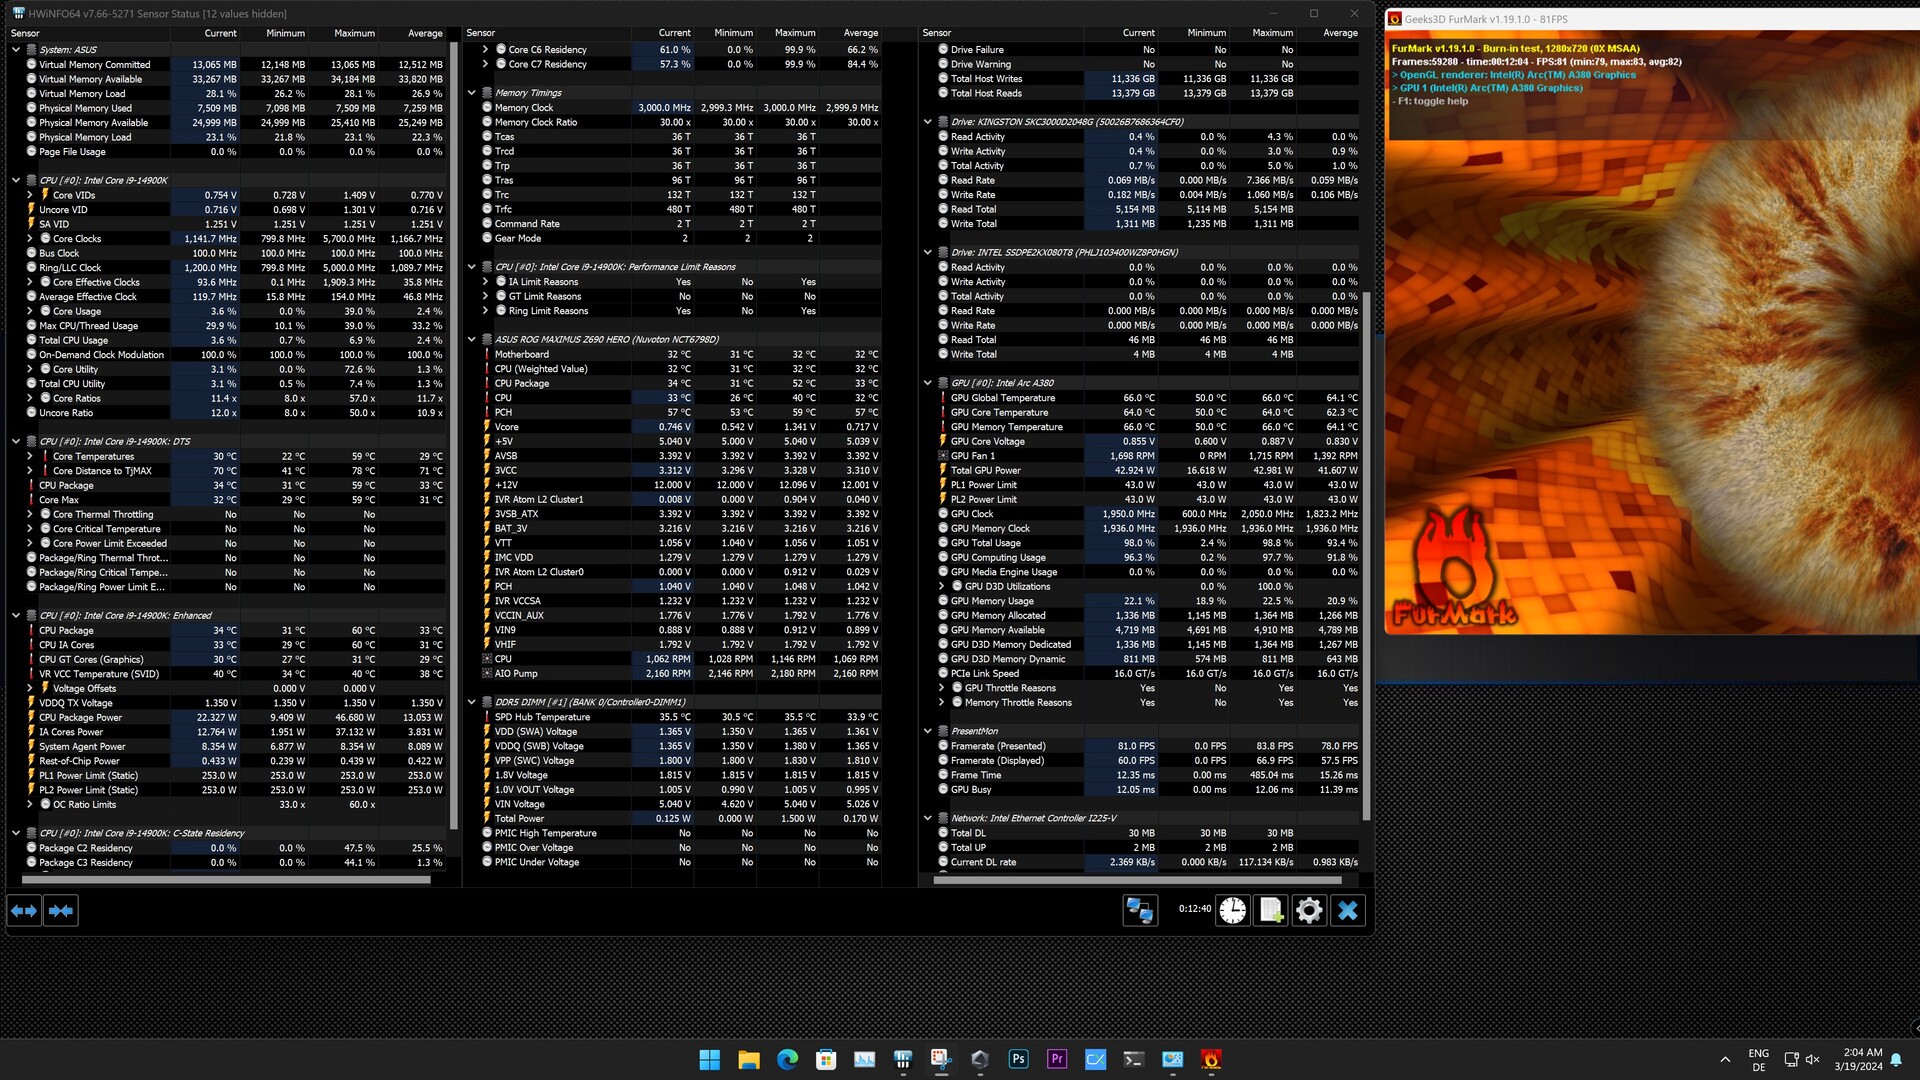
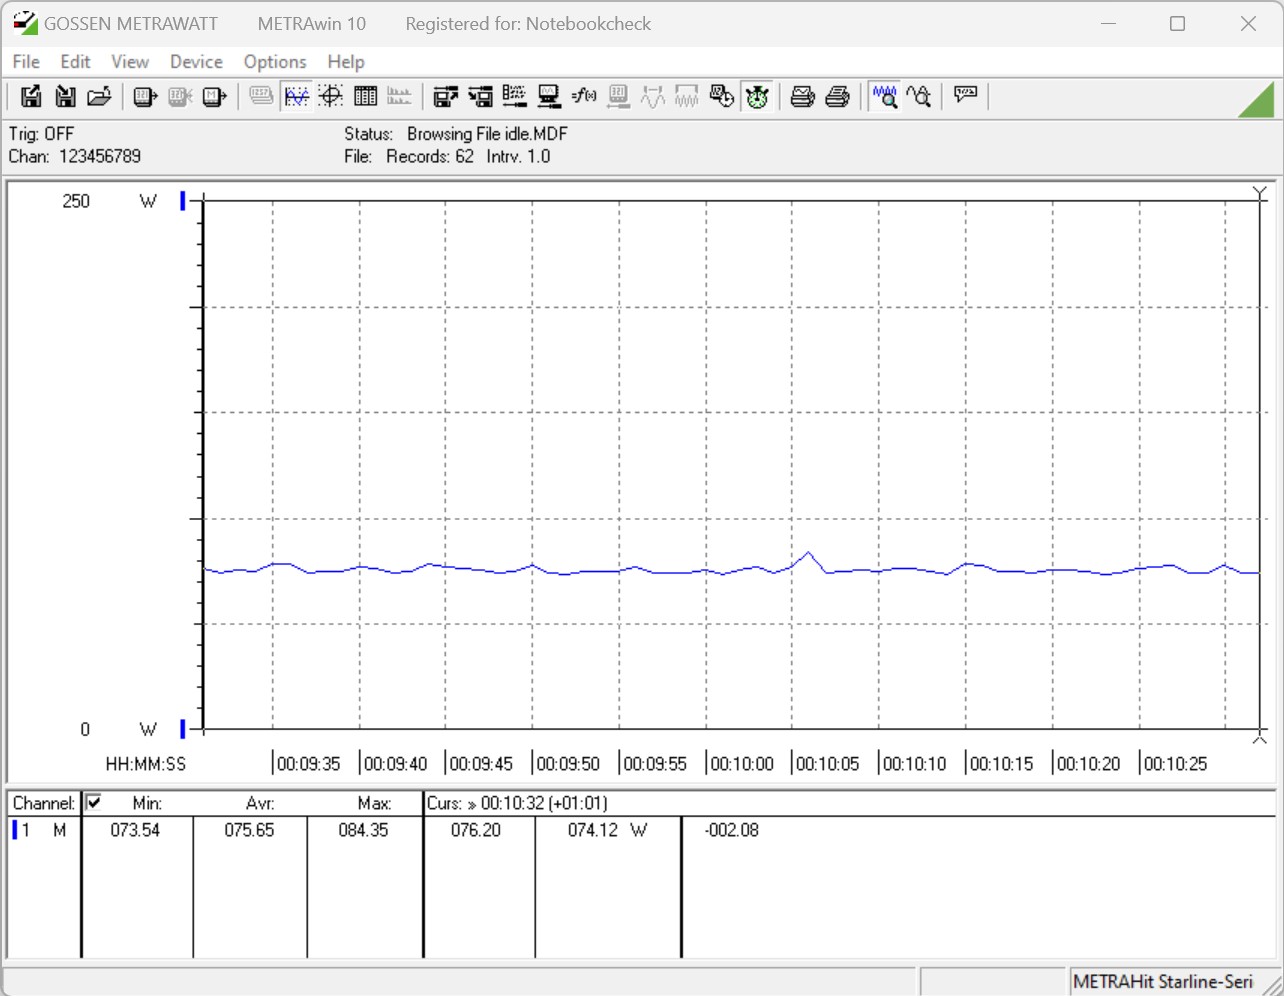
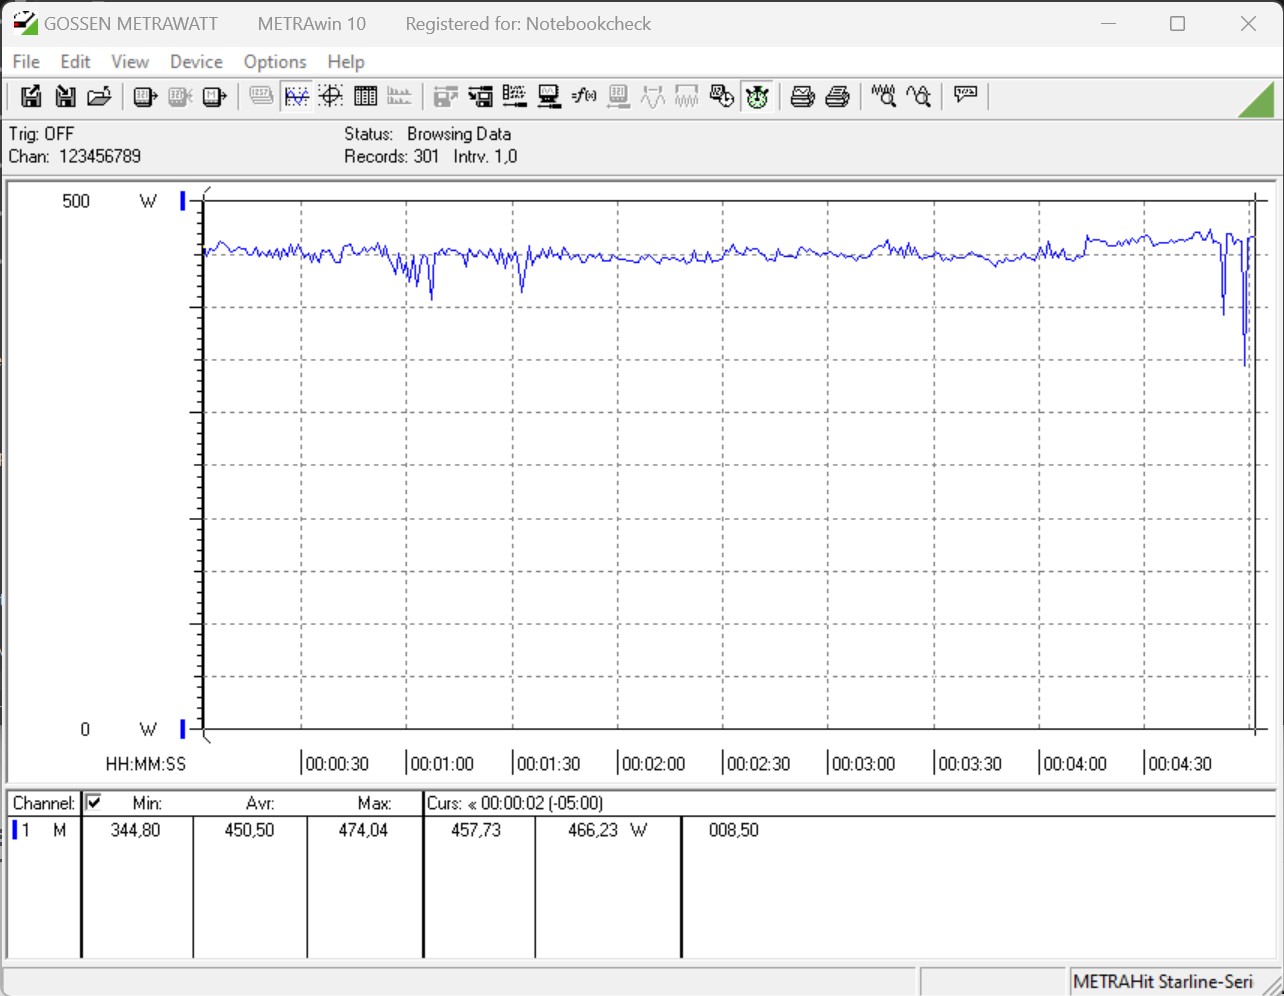
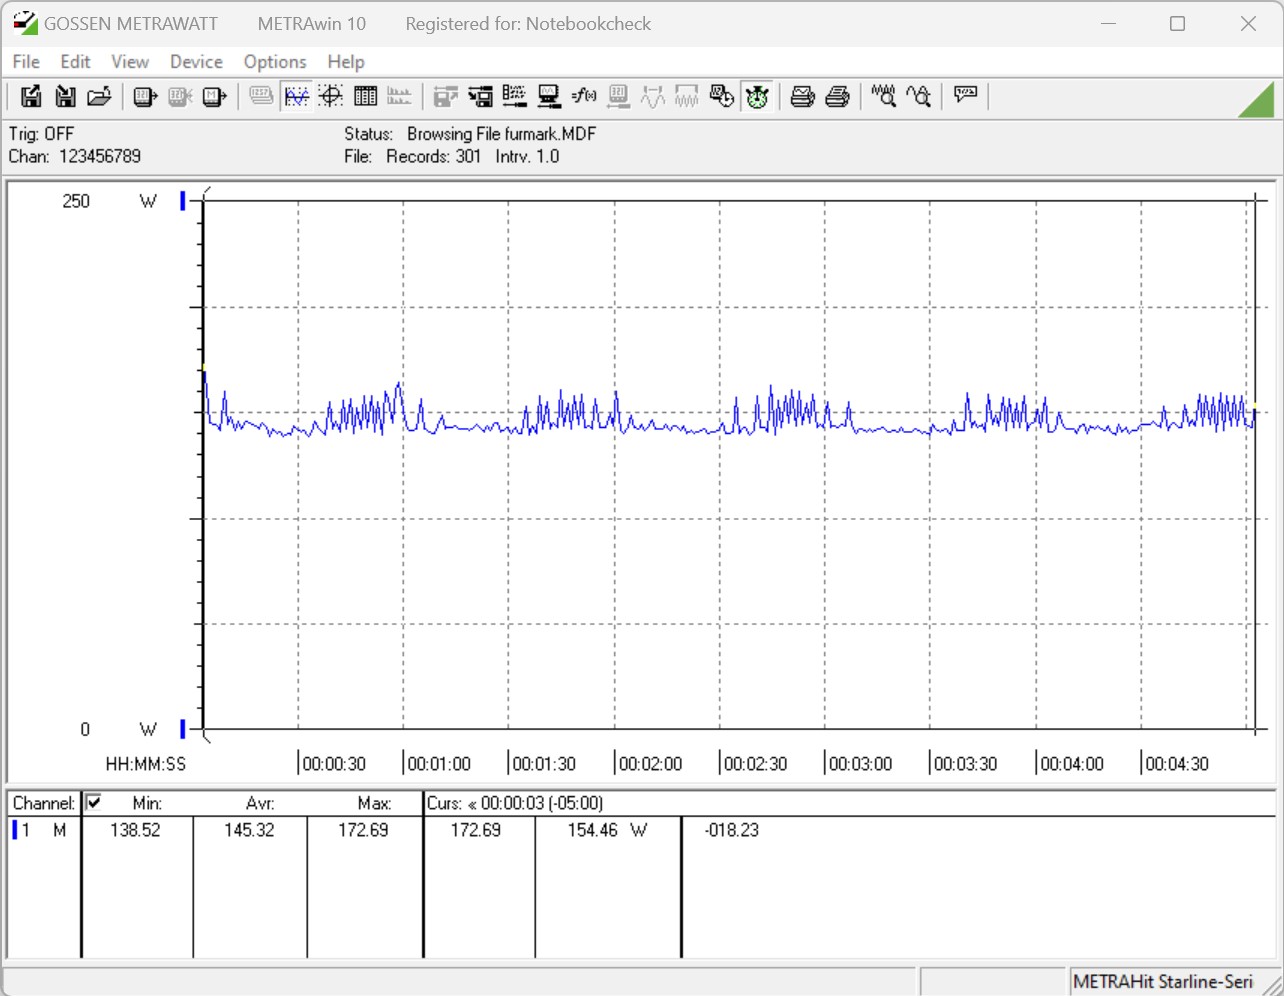
Il fatto che Sparkle Arc A380 Elf riceva l'alimentazione solo attraverso lo slot PCI Express rende chiaro che si tratta di una scheda grafica efficiente. Nel nostro confronto, il sistema di prova basato su Sparkle Arc A380 Elf è di gran lunga il più efficiente. Le nostre misurazioni mostrano solo 145 watt come valore medio durante lo stress test, anche se raggiunge circa 143 watt durante il gioco. Nel nostro confronto di efficienza, questo è persino sufficiente per superare l' Acer Predator BiFrost Arc A750 OC e ASRock Arc A580 Challenger OC.
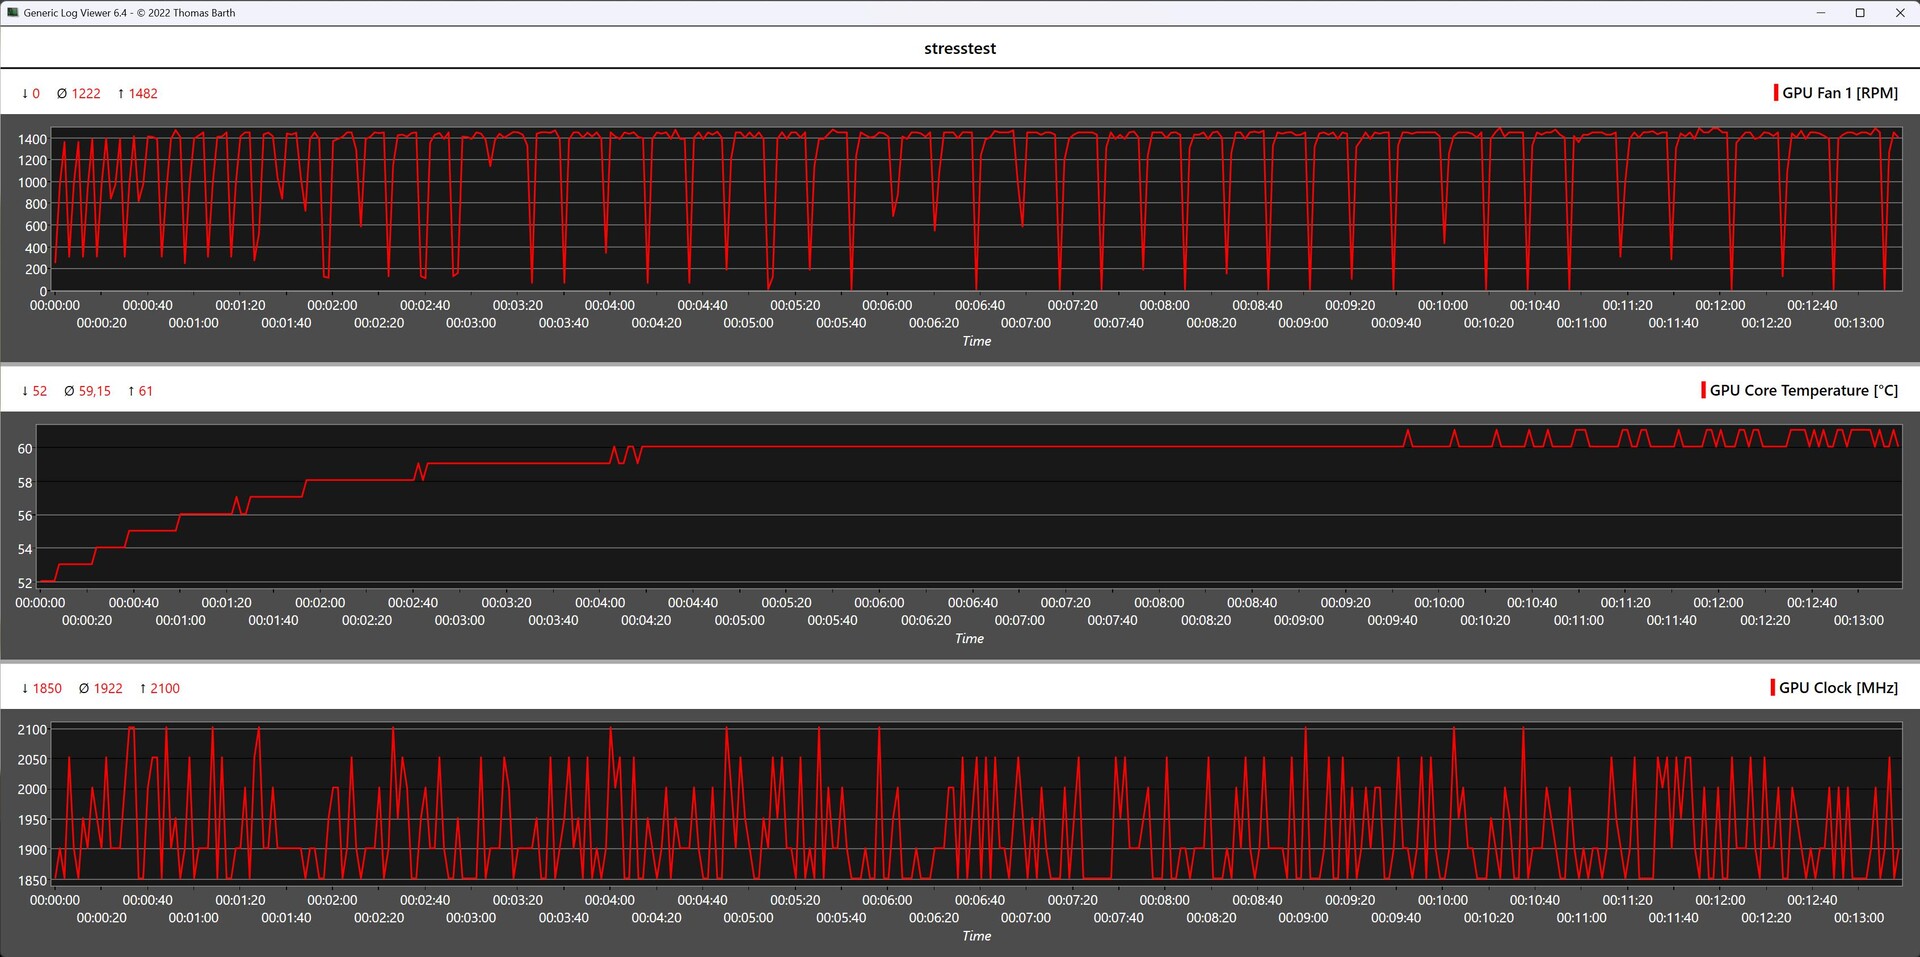
In nessun momento la nostra unità di test ha avuto problemi di temperatura. Sotto carico, la temperatura della GPU e della VRAM aumenta solo fino a 66 °C (151 °F). Quindi c'è ancora spazio sufficiente per ottimizzare la discutibile curva della ventola nello stato di consegna.
| Power Consumption / The Witcher 3 ultra (external Monitor) | |
| KFA2 GeForce RTX 3070 Ti SG (Idle: 88.9 W) | |
| AMD Radeon RX 7900 GRE | |
| KFA2 GeForce RTX 4070 Ti EX Gamer | |
| AMD Radeon RX 7800 XT | |
| Sapphire Pulse Radeon RX 6750 XT | |
| KFA2 GeForce RTX 4070 EX Gamer | |
| XFX Speedster QICK 308 Radeon RX 7600 Black Edition | |
| Sapphire Nitro+ Radeon RX 6650 XT | |
| Acer Predator BiFrost Arc A750 OC | |
| ASRock Arc A580 Challenger OC | |
| KFA2 GeForce RTX 4060 Ti EX | |
| Acer Predator BiFrost Arc A770 OC, 16GB GDDR6 | |
| KFA2 GeForce RTX 4060 1-Click-OC 2X | |
| Sparkle Intel Arc A380 Elf | |
| Power Consumption / FurMark 1.19 GPU Stress Test (external Monitor) | |
| KFA2 GeForce RTX 3070 Ti SG (Idle: 88.9 W) | |
| Acer Predator BiFrost Arc A750 OC | |
| KFA2 GeForce RTX 4070 Ti EX Gamer | |
| AMD Radeon RX 7900 GRE | |
| Sapphire Pulse Radeon RX 6750 XT | |
| AMD Radeon RX 7800 XT | |
| Acer Predator BiFrost Arc A770 OC, 16GB GDDR6 | |
| ASRock Arc A580 Challenger OC | |
| XFX Speedster QICK 308 Radeon RX 7600 Black Edition | |
| Sapphire Nitro+ Radeon RX 6650 XT | |
| KFA2 GeForce RTX 4070 EX Gamer | |
| KFA2 GeForce RTX 4060 Ti EX | |
| KFA2 GeForce RTX 4060 1-Click-OC 2X | |
| Sparkle Intel Arc A380 Elf | |
* ... Meglio usare valori piccoli
Power Consumption With External Monitor
Pro
Contro
Verdetto - Una semplice scheda grafica Intel Arc con 6 GB di VRAM
Sparkle Arc A380 Elf è una scheda grafica piuttosto semplice per PC desktop. Con 6 GB di VRAM è molto attraente e a soli 129 Euro (~$141), il prezzo di acquisto non lascerà troppo spazio al suo budget. Allo stesso tempo, non bisogna aspettarsi troppo dal chip GPU DG2-128. Con solo 1.024 unità di ombreggiatura, le prestazioni grafiche si sono ridotte notevolmente rispetto alle più veloci schede grafiche Intel Arc. Considerando le sue prestazioni, la scheda grafica non dovrebbe costare più di 100 Euro (~$109). La piccola scheda grafica avrà difficoltà a fungere da scheda grafica per il gioco puro in un sistema. Tuttavia, ci sono anche molti giochi che possono essere giocati con un frame rate adeguato.
Sparkle Arc A380 Elf è attualmente l'alternativa più conveniente ad AMD e Nvidia che consente di giocare a molti giochi a 1080p. Ma il vantaggio maggiore dell'Intel Arc A380 risiede nella codifica e nella decodifica AV1.
A causa del prezzo accessibile, il design ha un aspetto e una sensazione di economicità, anche se soddisfa comunque il suo scopo. Il produttore tiene sempre sotto controllo le temperature, ma questo non dovrebbe essere molto difficile in una scheda grafica da 75 Watt. Ciò che è meno attraente è il continuo aumento di giri della ventola sotto carico, che rende necessaria una regolazione manuale. Inoltre, la nostra unità di prova della Sparkle Arc A380 Elf si scontra con un considerevole fruscio della bobina, che può essere sentito anche attraverso un case PC chiuso. Nel complesso, la scheda grafica presenta un'alternanza di vantaggi e svantaggi, ma a causa dei suddetti svantaggi, non siamo in grado di consigliare direttamente l'acquisto. Coloro che vogliono ancora dare una possibilità alle schede grafiche Intel Arc dovrebbero invece dare un'occhiata più da vicino alla ASRock Arc A580 Challenger OC. Anche se è leggermente più costosa, offre una quantità di prestazioni relativamente più elevata rispetto alla Sparkle Arc A380 Elf.
Prezzi e disponibilità
Lo Sparkle Arc A380 Elf è attualmente disponibile a ~130 dollari su Amazon, per esempio.
Transparency
La selezione dei dispositivi da recensire viene effettuata dalla nostra redazione. Il campione di prova è stato acquistato gratuitamente dall'autore a proprie spese. L'istituto di credito non ha avuto alcuna influenza su questa recensione, né il produttore ne ha ricevuto una copia prima della pubblicazione. Non vi era alcun obbligo di pubblicare questa recensione. Non accettiamo mai compensi o pagamenti in cambio delle nostre recensioni. In quanto società mediatica indipendente, Notebookcheck non è soggetta all'autorità di produttori, rivenditori o editori.
Ecco come Notebookcheck esegue i test
Ogni anno, Notebookcheck esamina in modo indipendente centinaia di laptop e smartphone utilizzando procedure standardizzate per garantire che tutti i risultati siano comparabili. Da circa 20 anni sviluppiamo continuamente i nostri metodi di prova e nel frattempo stabiliamo gli standard di settore. Nei nostri laboratori di prova, tecnici ed editori esperti utilizzano apparecchiature di misurazione di alta qualità. Questi test comportano un processo di validazione in più fasi. Il nostro complesso sistema di valutazione si basa su centinaia di misurazioni e parametri di riferimento ben fondati, che mantengono l'obiettività.
