Notebookcheck Logo

NVIDIA RTX A500 Laptop GPU

NVIDIA RTX A500 Laptop GPU

La GPU NVIDIA RTX A500 Laptop o A500 Mobile è una scheda grafica professionale per workstation mobili. Si basa sul chip GA107 Ampere e offre prestazioni inferiori rispetto alla GPU GeForce RTX 3050 Laptop. Offre 2.048 CUDA, 16 Raytracing e 64 core Tensor abbinati a un bus di memoria a 64 bit. È disponibile in diverse varianti da 20 a 60 Watt (TGP) con diverse velocità di clock (e prestazioni). La GPU supporta eDP 1.4b per collegare il monitor interno e DisplayPort 1.4 e HDMI 2.1 per le connessioni esterne.

Non esiste più la variante Max-Q (precedentemente utilizzata per le varianti a basso consumo), ma ogni OEM può scegliere di implementare le tecnologie Max-Q (Dynamic Boost, WhisperMode).

Le prestazioni grezze dovrebbero essere inferiori a quelle della GeForce RTX 3050 per i portatili allo stesso livello TGP. Entrambe le GPU dipendono fortemente da un buon raffreddamento e da un TGP elevato per ottenere buone prestazioni. A un livello di consumo energetico simile, la RTX A500 dovrebbe essere chiaramente più veloce delle vecchie T500 e T550. 

Il chip GA107 offre 2.560 ALU FP32 di cui la metà può eseguire anche istruzioni INT32 (ovvero 1.280 ALU INT32). Con Ampere tutti gli shader possono ancora eseguire istruzioni FP32 o INT32. Secondo Nvidia, sono stati migliorati anche i core di raytracing e tensoriali del chip. L'A500 può utilizzare solo 2048 core CUDA. I chip Ampere includono anche un codificatore video migliorato di quinta generazione (NVENC per H.264 e H.265) e un decodificatore di settima generazione (per vari formati, tra cui AV1).

Il chip GA107 è prodotto da Samsung in 8 nm (8N), che non è in grado di tenere il passo con il nodo a 7 nm di TSMC (utilizzato ad esempio da AMD e anche per il chip professionale GA100 Ampere).

RTX A Serie

RTX A5500 Laptop GPU 7424 256 Bit @ 16000 MHz
RTX A4500 Laptop GPU 5888 @ 0.93 - 1.5 GHz256 Bit @ 16000 MHz
RTX A5000 Laptop GPU 6144 @ 1.22 - 1.77 GHz256 Bit @ 14000 MHz
RTX A4000 Laptop GPU 5120 @ 0.78 - 1.68 GHz256 Bit @ 12000 MHz
RTX A3000 Laptop GPU 4096 @ 1.08 - 1.56 GHz192 Bit @ 14000 MHz
RTX A2000 3328 @ 0.56 - 1.2 GHz192 Bit @ 12000 MHz
RTX A2000 Laptop GPU 2560 @ 0.89 - 1.69 GHz128 Bit @ 14000 MHz
RTX A1000 Laptop GPU 2048 128 Bit @ 14000 MHz
RTX A500 Laptop GPU 2048 64 Bit @ 14000 MHz
Nome in codiceGA107
ArchitetturaAmpere
Pipelines2048 - unified
Raytracing Cores16
Tensor / AI Cores64
Theoretical Performance7.3 TFLOPS FP32
Velocità della memoria14000 MHz
Larghezza del bus di memoria64 Bit
Tipo di memoriaGDDR6
Max. quantità di memoria4 GB
Memoria condivisano
Memory Bandwidth112 GB/s
APIDirectX 12_2, Shader 6.7, OpenGL 4.6
Consumo di corrente60 Watt (20 - 60 Watt TGP)
tecnologia8 nm
PCIe4
Data dell'annuncio30.03.2022
Link alla pagina del produttorenvdam.widen.net

Benchmark

Performance Rating - 3DMark 11 + Fire Strike + Time Spy
3.4 pt (10%)
AMD Radeon HD 8180
0.06404 -98%
...
NVIDIA Quadro P2000 Max-Q
2.98 -11%
3.01 -10%
3.02 -10%
AMD Radeon 680M
3.03 -10%
3.06 -9%
NVIDIA GeForce GTX 1050 Ti Max-Q
3.23 -4%
3.24 -4%
AMD Radeon Pro WX Vega M GL
3.24 -4%
3.3 -2%
NVIDIA RTX A500 Laptop GPU
3.36
3.41 1%
NVIDIA GeForce GTX 1050 Ti Mobile
3.42 2%
3.44 2%
3.5 4%
3.52 5%
3.59 7%
3.65 9%
3.74 11%
3.74 11%
...
20.4 507%
max:
33.3 891%
0%
100%
3DMark - 3DMark Time Spy Score
min: 3127     media: 3273     media: 3273 (9%)     massimo: 3419 Points
3DMark - 3DMark Time Spy Graphics
min: 2873     media: 2995     media: 2994.5 (8%)     massimo: 3116 Points
3DMark - 3DMark Cloud Gate Score
min: 27001     media: 28765     media: 28764.5 (27%)     massimo: 30528 Points
3DMark - 3DMark Cloud Gate Graphics
min: 46927     media: 48496     media: 48495.5 (12%)     massimo: 50064 Points
3DMark - 3DMark Fire Strike Standard Score
min: 6899     media: 6955     media: 6954.5 (12%)     massimo: 7010 Points
3DMark - 3DMark Fire Strike Standard Graphics
min: 7578     media: 7598     media: 7597.5 (9%)     massimo: 7617 Points
3DMark - 3DMark Ice Storm Graphics
88367 Points (10%)
3DMark 11 - 3DM11 Performance Score
min: 11213     media: 11289     media: 11288.5 (15%)     massimo: 11364 Points
3DMark 11 - 3DM11 Performance GPU
min: 10748     media: 10818     media: 10818 (9%)     massimo: 10888 Points
3DMark Vantage
3DM Vant. Perf. total +
3DMark Vantage - 3DM Vant. Perf. total
40923 Points (12%)
3DM Vant. Perf. GPU no PhysX +
3DMark 06 3DMark 06 - Standard 1280x1024 +
3DMark 06
40862 Points (53%)
Blender - Blender 3.3 Classroom CUDA *
min: 142     media: 146     media: 146 (22%)     massimo: 150 Seconds
Blender - Blender 3.3 Classroom OPTIX *
min: 88     media: 91.5     media: 91.5 (34%)     massimo: 95 Seconds
SPECviewperf 12
specvp12 sw-03 +
specvp12 snx-02 +
specvp12 showcase-01 +
SPECviewperf 12 - specvp12 showcase-01
31.8 fps (7%)
specvp12 maya-04 +
specvp12 creo-01 +
specvp12 catia-04 +
SPECviewperf 13 specvp13 sw-04 +
SPECviewperf 13 - specvp13 sw-04
min: 127.43     media: 129.5     media: 129.5 (35%)     massimo: 131.64 fps
specvp13 snx-03 +
SPECviewperf 13 - specvp13 snx-03
min: 145.61     media: 153.2     media: 153.2 (17%)     massimo: 160.83 fps
specvp13 showcase-02 +
SPECviewperf 13 - specvp13 showcase-02
min: 31.69     media: 34.6     media: 34.6 (8%)     massimo: 37.51 fps
specvp13 medical-02 +
specvp13 maya-05 +
SPECviewperf 13 - specvp13 maya-05
min: 121.4     media: 123.5     media: 123.5 (14%)     massimo: 125.67 fps
specvp13 energy-02 +
SPECviewperf 13 - specvp13 energy-02
min: 20.53     media: 21.4     media: 21.4 (7%)     massimo: 22.26 fps
specvp13 creo-02 +
SPECviewperf 13 - specvp13 creo-02
min: 120.07     media: 121.6     media: 121.6 (18%)     massimo: 123.09 fps
specvp13 catia-05 +
SPECviewperf 13 - specvp13 catia-05
min: 146.08     media: 154.4     media: 154.4 (17%)     massimo: 162.65 fps
specvp13 3dsmax-06 +
SPECviewperf 13 - specvp13 3dsmax-06
min: 80.81     media: 84     media: 84 (15%)     massimo: 87.19 fps
SPECviewperf 2020 specvp2020 solidworks-07 4k +
specvp2020 solidworks-07 1080p +
specvp2020 solidworks-05 1080p +
SPECviewperf 2020 - specvp2020 solidworks-05 1080p
79.9 fps (16%)
specvp2020 snx-04 1080p +
SPECviewperf 2020 - specvp2020 snx-04 1080p
min: 139.98     media: 148.5     media: 148.5 (24%)     massimo: 157.04 fps
specvp2020 medical-03 1080p +
SPECviewperf 2020 - specvp2020 medical-03 1080p
min: 27.58     media: 28.3     media: 28.3 (19%)     massimo: 28.96 fps
specvp2020 maya-06 1080p +
SPECviewperf 2020 - specvp2020 maya-06 1080p
min: 143.05     media: 143.6     media: 143.6 (16%)     massimo: 144.17 fps
specvp2020 energy-03 1080p +
SPECviewperf 2020 - specvp2020 energy-03 1080p
min: 20.44     media: 21.4     media: 21.4 (14%)     massimo: 22.29 fps
specvp2020 creo-03 1080p +
SPECviewperf 2020 - specvp2020 creo-03 1080p
min: 50.44     media: 61.4     media: 61.4 (30%)     massimo: 72.31 fps
specvp2020 catia-06 1080p +
SPECviewperf 2020 - specvp2020 catia-06 1080p
min: 34.65     media: 36.9     media: 36.9 (22%)     massimo: 39.09 fps
specvp2020 3dsmax-07 1080p +
SPECviewperf 2020 - specvp2020 3dsmax-07 1080p
min: 32.99     media: 35.4     media: 35.4 (11%)     massimo: 37.79 fps
specvp2020 snx-04 4k +
SPECviewperf 2020 - specvp2020 snx-04 4k
98.2 fps (10%)
specvp2020 medical-03 4k +
specvp2020 maya-06 4k +
SPECviewperf 2020 - specvp2020 maya-06 4k
66.7 fps (11%)
specvp2020 energy-03 4k +
specvp2020 creo-03 4k +
SPECviewperf 2020 - specvp2020 creo-03 4k
37.6 fps (18%)
specvp2020 catia-06 4k +
SPECviewperf 2020 - specvp2020 catia-06 4k
12.9 fps (8%)
specvp2020 3dsmax-07 4k +
SPECviewperf 2020 - specvp2020 3dsmax-07 4k
17.1 fps (7%)
Cinebench R10 Cinebench R10 Shading (32bit) +
Cinebench R10 - Cinebench R10 Shading (32bit)
6844 punti (5%)
Cinebench R11.5 Cinebench R11.5 OpenGL 64 Bit +
Cinebench R11.5 - Cinebench R11.5 OpenGL 64 Bit
212.8 fps (70%)
Cinebench R15
Cinebench R15 OpenGL 64 Bit +
Cinebench R15 - Cinebench R15 OpenGL 64 Bit
min: 232     media: 247     media: 247 (14%)     massimo: 262 fps
Cinebench R15 OpenGL Ref. Match 64 Bit +
Cinebench R15 - Cinebench R15 OpenGL Ref. Match 64 Bit
99.6 % (100%)
GFXBench - GFXBench 5.0 Aztec Ruins High Tier Offscreen
64.7 fps (12%)
3.3 -95%
...
AMD Radeon RX 560X (Laptop)
52.4 -19%
53.4 -17%
59.8 -8%
61.4 -5%
62.5 -3%
62.7 -3%
62.7 -3%
62.8 -3%
63.8 -1%
NVIDIA RTX A500 Laptop GPU
64.7
64.8 0%
65.5 1%
Apple M1 7-Core GPU
72.4 12%
Apple M1 8-Core GPU
74.3 15%
74.6 15%
78.8 22%
80.5 24%
84.6 31%
87.1 35%
...
536 728%
0%
100%
GFXBench - GFXBench 5.0 Aztec Ruins Normal Tier Offscreen
166.1 fps (12%)
GFXBench - GFXBench Car Chase Offscreen
174.1 fps (19%)
GFXBench 3.1 - GFXBench Manhattan ES 3.1 Offscreen
232.7 fps (5%)
GFXBench 3.0 - GFXBench 3.0 Manhattan Offscreen
321.7 fps (13%)
GFXBench (DX / GLBenchmark) 2.7
GFXBench T-Rex HD Offscreen C24Z16 +
GFXBench (DX / GLBenchmark) 2.7 - GFXBench T-Rex HD Offscreen C24Z16
554 fps (4%)
Basemark GPU 1.2 - Basemark GPU 1.2 Vulkan Official Medium Offscreen 1080
104.6 fps (3%)
Basemark GPU 1.2 - Basemark GPU 1.2 Vulkan Official High Offscreen 2160
3.6 fps (1%)
Geekbench 6.3 - Geekbench 6.3 GPU OpenCL
min: 40215     media: 41313     media: 41313 (12%)     massimo: 42411 punti
Geekbench 6.3 - Geekbench 6.3 GPU Vulkan
min: 20666     media: 30177     media: 30176.5 (8%)     massimo: 39687 punti
LuxMark v2.0 64Bit - LuxMark v2.0 Room GPU
1023 Samples/s (4%)
LuxMark v2.0 64Bit - LuxMark v2.0 Sala GPU
2268 Samples/s (4%)
ComputeMark v2.1 - ComputeMark v2.1 Result
8197 punti (9%)
Power Consumption - Furmark Stress Test Power Consumption - external Monitor *
min: 49.1     media: 51.7     media: 51.7 (7%)     massimo: 54.3 Watt
0510152025303540455055Tooltip
Power Consumption - The Witcher 3 Power Consumption - external Monitor *
54.5 Watt (8%)
051015202530354045505560657075808590Tooltip
Power Consumption - Witcher 3 Power Consumption *
56.5 Watt (12%)
05101520253035404550556065707580859095Tooltip
Power Consumption - Cyberpunk 2077 Power Consumption - external Monitor *
58.1 Watt (7%)
051015202530354045505560Tooltip
Emissions Witcher 3 Fan Noise +
- Valori di benchmark per questa scheda grafica
red legend - Valori medi di benchmark per questa scheda grafica
* Numeri più piccoli rappresentano prestazioni supeiori

Benchmarks per i giochi

I seguenti benchmarks deirivano dai benchmarks dei portatili recensiti. Le prestazioni dipendono dalla scheda grafica utilizzata, dal clock rate, dal processore, dai settaggi di sistema, dai drivers, e dai sistemi operativi. Quindi i risultati non sono rappresentativi per i portatili con questa GPU. Per informazioni dettagliate sui risultati del benchmark, cliccate sul numero di fps.

F1 24

F1 24

2024
basso 1920x1080
82.4  fps    + Confronta
medio 1920x1080
71.9  fps    + Confronta
alto 1920x1080
32.9  fps    + Confronta
ultra 1920x1080
11.7  fps    + Confronta
» Giocabile con tutti i portatili testati con dettagli medio.
basso 1920x1080
34.6  fps    + Confronta + 📈 Graph
medio 1920x1080
27.5  fps    + Confronta + 📈 Graph
alto 1920x1080
19.1  fps    + Confronta + 📈 Graph
ultra 1920x1080
14.1  fps    + Confronta + 📈 Graph
» Il Benchmark indica che il gioco non è utilizzabile con i settaggi testati.
basso 1920x1080
23.6  fps    + Confronta + 📈 Graph
alto 1920x1080
14.5  fps    + Confronta + 📈 Graph
» Il Benchmark indica che il gioco non è utilizzabile con i settaggi testati.
Additional Benchmarks
Low Preset 1280x720
28.1
basso 1920x1080
80.1  fps    + Confronta + 📈 Graph
medio 1920x1080
68.6  fps    + Confronta + 📈 Graph
alto 1920x1080
58.6  fps    + Confronta + 📈 Graph
ultra 1920x1080
43.8  fps    + Confronta + 📈 Graph
» Giocabile con tutti i portatili testati con dettagli ultra.
Additional Benchmarks
Low Preset 1280x720
104.7
basso 1920x1080
76.7  fps    + Confronta + 📈 Graph
medio 1920x1080
58.2  fps    + Confronta + 📈 Graph
alto 1920x1080
49.3  fps    + Confronta + 📈 Graph
ultra 1920x1080
33.3  fps    + Confronta + 📈 Graph
» Giocabile con tutti i portatili testati con dettagli alto.
Additional Benchmarks
Very Low Preset 1280x720
104.5
basso 1920x1080
19.5  fps    + Confronta + 📈 Graph
medio 1920x1080
12.8  fps    + Confronta + 📈 Graph
alto 1920x1080
12  fps    + Confronta + 📈 Graph
ultra 1920x1080
10.9  fps    + Confronta + 📈 Graph
» Il Benchmark indica che il gioco non è utilizzabile con i settaggi testati.
Additional Benchmarks
Low Preset 1280x720
21.9
basso 1920x1080
24.4  fps    + Confronta + 📈 Graph
medio 1920x1080
18.7  fps    + Confronta + 📈 Graph
alto 1920x1080
14.3  fps    + Confronta + 📈 Graph
ultra 1920x1080
8.3  fps    + Confronta + 📈 Graph
» Il Benchmark indica che il gioco non è utilizzabile con i settaggi testati.
Additional Benchmarks
Max. Performance 1280x720
60.8
basso 1920x1080
39.8 43.3 ~ 42 fps    + Confronta
medio 1920x1080
31.1 32.1 ~ 32 fps    + Confronta
alto 1920x1080
23.6 25.1 ~ 24 fps    + Confronta
ultra 1920x1080
19.6 20.4 ~ 20 fps    + Confronta
QHD 2560x1440
10.4  fps    + Confronta
4K 3840x2160
4.3  fps    + Confronta
» Giocabile con tutti i portatili testati con dettagli basso.
Additional Benchmarks
Low Preset (FSR off) 1280x720
69.8
60.2
Ray Tracing Ultra Preset (DLSS off) 1920x1080
4.8
30min Start Ultra Preset (FSR off) 1920x1080
17.5
0
12.6
basso 1920x1080
39.2 39.9 ~ 40 fps    + Confronta + 📈 Graph
medio 1920x1080
30.8 34.5 ~ 33 fps    + Confronta + 📈 Graph
alto 1920x1080
26.2 31.2 ~ 29 fps    + Confronta + 📈 Graph
ultra 1920x1080
25.8 30.2 ~ 28 fps    + Confronta + 📈 Graph
QHD 2560x1440
17.8  fps    + Confronta + 📈 Graph
» Giocabile con tutti i portatili testati con dettagli basso.
Additional Benchmarks
Low Preset 1280x720
63.2
F1 23

F1 23

2023
basso 1920x1080
57  fps    + Confronta
medio 1920x1080
56.3  fps    + Confronta
alto 1920x1080
43.1  fps    + Confronta
ultra 1920x1080
10.9  fps    + Confronta
QHD 2560x1440
6.6  fps    + Confronta
» Giocabile con tutti i portatili testati con dettagli alto.
Additional Benchmarks
Ultra Low Preset TAA 1280x720
171.2
basso 1920x1080
23  fps    + Confronta + 📈 Graph
medio 1920x1080
19.6  fps    + Confronta + 📈 Graph
alto 1920x1080
10.6  fps    + Confronta + 📈 Graph
ultra 1920x1080
5.4  fps    + Confronta + 📈 Graph
» Il Benchmark indica che il gioco non è utilizzabile con i settaggi testati.
Additional Benchmarks
Low Preset Low TAA 1280x720
23.8
F1 22

F1 22

2022
basso 1920x1080
92.5  fps    + Confronta
medio 1920x1080
85.2  fps    + Confronta
alto 1920x1080
57.8  fps    + Confronta
ultra 1920x1080
16.9  fps    + Confronta
» Giocabile con tutti i portatili testati con dettagli alto.
Additional Benchmarks
Ultra Low Preset 16xAF TAA 1280x720
157.6
basso 1920x1080
66.2  fps    + Confronta
medio 1920x1080
53.5  fps    + Confronta
alto 1920x1080
36.2  fps    + Confronta
ultra 1920x1080
27.6  fps    + Confronta
» Giocabile con tutti i portatili testati con dettagli alto.
Additional Benchmarks
Lowest Preset (DX12) 1280x720
107.6
Strange Brigade

Strange Brigade

2018
basso 1280x720
168.9 183.5 ~ 176 fps    + Confronta
medio 1920x1080
74.9 76.5 ~ 76 fps    + Confronta
alto 1920x1080
61.9 62.5 ~ 62 fps    + Confronta
ultra 1920x1080
53.6 54.5 ~ 54 fps    + Confronta
QHD 2560x1440
39.2  fps    + Confronta
» Giocabile con tutti i portatili testati con dettagli ultra.
Far Cry 5

Far Cry 5

2018
basso 1280x720
81 83 ~ 82 fps    + Confronta + 📈 Graph
medio 1920x1080
51 57 ~ 54 fps    + Confronta + 📈 Graph
alto 1920x1080
46 50 ~ 48 fps    + Confronta + 📈 Graph
ultra 1920x1080
44 44 ~ 44 fps    + Confronta + 📈 Graph
» Giocabile con tutti i portatili testati con dettagli ultra.
basso 1280x720
113.3 117.7 ~ 116 fps    + Confronta
medio 1920x1080
89.2 98 ~ 94 fps    + Confronta
alto 1920x1080
73.9 81.6 ~ 78 fps    + Confronta
» Giocabile con tutti i portatili testati con dettagli alto.
basso 1280x720
78.6 90.4 ~ 85 fps    + Confronta
medio 1920x1080
44.2 45.8 ~ 45 fps    + Confronta
alto 1920x1080
31.4 32.9 ~ 32 fps    + Confronta
QHD 2560x1440
23.3  fps    + Confronta
» Giocabile con tutti i portatili testati con dettagli medio.
basso 1280x720
157.7 160.4 ~ 159 fps    + Confronta
medio 1366x768
130.5 131.1 ~ 131 fps    + Confronta
alto 1920x1080
96.2 111.9 ~ 104 fps    + Confronta
ultra 1920x1080
91.6 104.8 ~ 98 fps    + Confronta
» Giocabile con tutti i portatili testati con dettagli ultra.
basso 1024x768
134.6 174.5 ~ 155 fps    + Confronta
medio 1366x768
81.6 104.1 ~ 93 fps    + Confronta
alto 1920x1080
53.4 56.8 ~ 55 fps    + Confronta
ultra 1920x1080
26.3 31.1 ~ 29 fps    + Confronta + 📈 Graph
» Giocabile con tutti i portatili testati con dettagli alto.
GTA V

GTA V

2015
basso 1024x768
173.3  fps    + Confronta
medio 1366x768
161.7  fps    + Confronta
alto 1920x1080
89.7  fps    + Confronta
ultra 1920x1080
42.9  fps    + Confronta
QHD 2560x1440
29.8  fps    + Confronta
» Giocabile con tutti i portatili testati con dettagli ultra.
Additional Benchmarks
Highest Settings possible 16xAF 4xMSAA + FXAA 3840x2160
13.8
Normal/Off 4xAF 1920x1080
156.5
Lowest Settings possible 1920x1080
162.7
bassomedioaltoultraQHD4K
F1 2482.471.932.911.7
Ghost of Tsushima34.627.519.114.1
Dragon's Dogma 223.614.5
Alone in the Dark80.168.658.643.8
Last Epoch76.758.249.333.3
Helldivers 219.512.81210.9
Enshrouded24.418.714.38.28
Cyberpunk 2077 2.1 Phantom Liberty4232242010.44.29
Baldur's Gate 34033292817.8
F1 235756.343.110.96.63
Hogwarts Legacy2319.610.65.43
F1 2292.585.257.816.9
Tiny Tina's Wonderlands66.253.536.227.6
Strange Brigade17676625439.2
Far Cry 582544844
X-Plane 11.111169478
Final Fantasy XV Benchmark85453223.3
Dota 2 Reborn15913110498
The Witcher 3155935529
GTA V173.3161.789.742.929.8
< 30 fps
< 60 fps
< 120 fps
≥ 120 fps
4
4
8
4
4
7
6
2
7
9
4
11
5
1
5
1

1


Per conoscere altri giochi che potrebbero essere utilizzabili e per una lista completa di tutti i giochi e delle schede grafiche visitate la nostra Gaming List

v1.28
log 19. 20:03:33

#0 ran 0s before starting gpusingle class +0s ... 0s

#1 no ids found in url (should be separated by "_") +0s ... 0s

#2 not redirecting to Ajax server +0s ... 0s

#3 did not recreate cache, as it is less than 5 days old! Created at Sun, 19 Jan 2025 05:35:02 +0100 +0.001s ... 0.001s

#4 no comparison url found in template nbc.compare_page_1 needed +0.029s ... 0.03s

#5 no comparison url found in template nbc.compare_page_1 needed +0s ... 0.03s

#6 no comparison url found in template nbc.compare_page_1 needed +0s ... 0.03s

#7 no comparison url found in template nbc.compare_page_1 needed +0s ... 0.031s

#8 no comparison url found in template nbc.compare_page_1 needed +0s ... 0.031s

#9 no comparison url found in template nbc.compare_page_1 needed +0s ... 0.031s

#10 no comparison url found in template nbc.compare_page_1 needed +0s ... 0.031s

#11 no comparison url found in template nbc.compare_page_1 needed +0s ... 0.031s

#12 composed specs +0s ... 0.031s

#13 did output specs +0s ... 0.032s

#14 start showIntegratedCPUs +0s ... 0.032s

#15 getting avg benchmarks for device 11322 +0.032s ... 0.064s

#16 got single benchmarks 11322 +0.022s ... 0.085s

#17 got avg benchmarks for devices +0s ... 0.085s

#18 min, max, avg, median took s +1.113s ... 1.198s

#19 before gaming benchmark output +0s ... 1.199s

#20 Got 113 rows for game benchmarks. +0.022s ... 1.221s

#21 composed SQL query for gamebenchmarks +0s ... 1.221s

#22 got data and put it in $dataArray +0.014s ... 1.234s

#23 benchmarks composed for output. +0.896s ... 2.131s

#24 no comparison url found in template nbc.compare_page_1 needed +0.004s ... 2.135s

#25 return log +0s ... 2.135s

Recensioni Notebook con NVIDIA RTX A500 Laptop GPU la scheda grafica

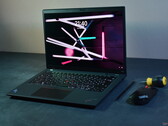
Recensione del portatile HP ZBook Firefly 14 G11: Aggiornamento Core Ultra con grafica Nvidia RTX A500

Recensione del portatile HP ZBook Firefly 14 G11: Aggiornamento Core Ultra con grafica Nvidia RTX A500

Il modello può essere configurato con CPU di 14esima generazione, a partire dal Core Ultra 5 125U fino al Core Ultra 7 165H. Tuttavia, è chiaro che il fattore d...
Intel Core Ultra 7 165H | NVIDIA RTX A500 Laptop GPU | 14.00" | 1.5 kg
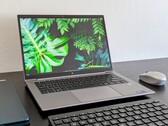
Recensione del portatile Lenovo ThinkPad P14s G4 Intel: Piccola workstation OLED con scarsa autonomia

Recensione del portatile Lenovo ThinkPad P14s G4 Intel: Piccola workstation OLED con scarsa autonomia

Lenovo ThinkPad P14s è la workstation ThinkPad più piccola. Il modello ThinkPad P14s Gen 4 Intel ha alcune caratteristiche interessanti che sono scomparse dal s...
Intel Core i7-1370P | NVIDIA RTX A500 Laptop GPU | 14.00" | 1.5 kg

HP ZBook Firefly 16 G11: Intel Core Ultra 7 155H, 16.00", 1.7 kg
  Recensioni esterne » HP ZBook Firefly 16 G11

HP ZBook Firefly 14 G11: Intel Core Ultra 7 165H, 14.00", 1.5 kg
  Recensioni esterne » HP ZBook Firefly 14 G11

Lenovo ThinkPad P14s G4, i7-1370P: Intel Core i7-1370P, 14.00", 1.3 kg
  Recensioni esterne » Lenovo ThinkPad P14s G4, i7-1370P

HP ZBook Firefly 16 G10, i7-1355U: Intel Core i7-1355U, 16.00", 1.8 kg
  Recensioni esterne » HP ZBook Firefly 16 G10, i7-1355U

Lenovo ThinkPad P14s G4: Intel Core i5-1340P, 14.00", 1.3 kg
  Recensioni esterne » Lenovo ThinkPad P14s G4

HP ZBook Firefly 16 G10: Intel Core i7-1365U, 16.00", 1.8 kg
  Recensioni esterne » HP ZBook Firefly 16 G10

Dell Precision 15 3580: Intel Core i7-1360P, 15.60", 1.6 kg
  Recensioni esterne » Dell Precision 15 3580

Please share our article, every link counts!
Mail Logo

Classe 1

Classe 2

GeForce RTX 5060 Laptop *
Radeon RX 8060S *
M1 Max 32-Core GPU *
GeForce RTX 2070 Super Mobile
M1 Max 24-Core GPU *
Radeon RX 8050S *
Radeon RX 5700M *
M1 Pro 16-Core GPU *
Radeon PRO W6600M *
GeForce RTX 2070 Super Max-Q
M1 Pro 14-Core GPU *
GeForce RTX 5050 Laptop *
Quadro P4200
Radeon RX 8040S *
Arc 140T *
Quadro P5000 Max-Q *
Arc 130T *
GeForce RTX 3050 4GB Laptop GPU
Quadro P4000 Max-Q
Radeon RX 580X (Laptop) *
Radeon RX 580 (Laptop)
Radeon Pro 5300M
Radeon RX 5300M
Quadro P3000 Max-Q *
Radeon Pro WX 7100 *
Radeon RX 570X (Laptop) *

Classe 3

Radeon RX 570 (Laptop) *
Radeon RX 470 (Laptop) *
GeForce GTX 1050 Ti Mobile
Radeon 680M
Quadro P2000 Max-Q
Radeon R9 M395X
GeForce GTX 1050 Ti Max-Q *
WX Vega M GL
Radeon R9 M485X
GeForce GTX 1050 Max-Q *
Radeon 660M
Radeon RX 560X (Laptop)
Radeon RX 560 (Laptop)
Radeon Pro 560X
Radeon Pro 560
Radeon Pro 460
Radeon Pro WX 4130 *
Quadro P620 *
Radeon RX 550X (Laptop)
Radeon Pro 555X
Radeon Pro 555
Radeon Pro 455
Quadro P600
Arc Graphics 3-core (Arrow Lake) *
Radeon RX 540X *
Radeon Pro WX 2100 *
Radeon Pro WX 3100 *
Arc Graphics 2-core (Arrow Lake) *
Radeon Pro 450
Radeon 630
Radeon 540X *
Quadro P520
Quadro P500 *
Iris Plus Graphics G7 (Ice Lake 64 EU) *
Vega 10 *
Iris Pro Graphics 580
Vega 9
FirePro W5130M
UHD Graphics Xe G4 48EUs *
UHD Graphics 32EUs
UHD Graphics Xe 32EUs (Tiger Lake-H) *
UHD Graphics 750
UHD Graphics 730
Vega 7
Radeon R7 M465
Vega 8
Iris Plus Graphics G4 (Ice Lake 48 EU)
Quadro M600M
FirePro W4190M
Radeon R7 M445
UHD Graphics 24EUs (Alder Lake-N) *
Radeon R7 M340
Radeon 610M *
UHD Graphics G1 (Ice Lake 32 EU)
UHD Graphics Xe 16EUs (Tiger Lake-H) *
Radeon R5 (Bristol Ridge)
Adreno 690 *
Adreno 685 *
Adreno 680 *

Classe 4

Posizione approssimativa dell'adattatore grafico

Klaus Hinum, 2022-05-18 (Update: 2022-05-18)