Notebookcheck Logo

NVIDIA GeForce GTX 280M SLI
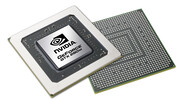
NVIDIA GeForce GTX 280M SLI

Due Nvidia GeForce GTX 280M combinate con tecnologia SLI. Poiché non tutti i giochi supportano la SLI in modo adeguato, l'incremento di  prestazioni rispetto ad una singola scheda è di appena 0-40%. Inoltre, ad un frame-rates tra 20-30 fps la soluzione SLI potrebbe avere qualche piccolo problema di scatti (a causa del diverso frametimes rilasciato dalle due schede).
Ognuna delle due GeForce GTX 280M si basa su un core G92b prodotto pertanto in 55nm. Sfrutta tutte le 128 pipelines del core G92b e di conseguenza è paragonabile alla 9800M GTX+ desktop e non alla desktop GTX 280.
La Nvidia GeForce GTX 280M SLI è unita al chipset GeForce 9400M G e di conseguenza supporta la HybridPower (se il produttore la abilitata). Con l'Hybrid Power, entrambe le schede GTX possono essere disabilitate facendo funzionare solo il graphic chipset core, con conseguente risparmio energetico (e con una possibile diminuzione della rumorosità delle ventole).
Il consumo di corrente ed il riscaldamento sono il doppio rispetto a quanto produce una singola GTX 280M (a causa delle due schede) e di conseguenza la combinazione SLI può essere trovata solo sui grandi portatili DTR (come l'Alienware M17x).

GeForce GTX 200M Serie

GeForce GTX 285M SLI 256 @ 0.58 GHz256 Bit @ 1020 MHz
GeForce GTX 280M SLI 256 @ 0.59 GHz256 Bit @ 950 MHz
GeForce GTX 260M SLI 224 @ 0.55 GHz256 Bit @ 950 MHz
GeForce GTX 285M 128 @ 0.58 GHz256 Bit @ 1020 MHz
GeForce GTX 280M 128 @ 0.59 GHz256 Bit @ 950 MHz
GeForce GTX 260M 112 @ 0.55 GHz256 Bit @ 950 MHz
Nome in codiceN10E-GTX
ArchitetturaG9x
Pipelines256 - unified
Velocità del core585 MHz
Velocità de Shader1463 MHz
Velocità della memoria950 MHz
Larghezza del bus di memoria256 Bit
Tipo di memoriaGDDR3
Max. quantità di memoria2048 MB
Memoria condivisano
APIDirectX 10, Shader 4.0
Consumo di corrente150 Watt
Transistor Count1.5 Billion
tecnologia55 nm
CaratteristicheHybridPower, PureVideo HD, CUDA, PhysX ready
Dimensione del portatilegrande
Data dell'annuncio02.03.2009
InformazioniMXM 3

Benchmark

3DMark Vantage
3DM Vant. Perf. total +
3DMark Vantage - 3DM Vant. Perf. total
min: 8728     media: 9435     media: 9435 (3%)     massimo: 10142 Points
3DM Vant. Perf. GPU no PhysX +
3DMark Vantage - 3DM Vant. Perf. GPU no PhysX
min: 9649     media: 9947     media: 9946.5 (5%)     massimo: 10244 Points
62 -99%
...
9089 -9%
9135 -8%
9184 -8%
Intel UHD Graphics Xe G4 48EUs
9484 -5%
9666 -3%
9694 -3%
9844 -1%
9902 0%
AMD Radeon RX Vega 10
9909 0%
NVIDIA GeForce GTX 280M SLI
9947
10052 1%
10067 1%
AMD Radeon Pro WX 3100
10150 2%
10211 3%
10234 3%
AMD Radeon 540X
10287 3%
10511 6%
10514 6%
10561 6%
...
132443 1231%
max:
170928 1618%
0%
100%
3DMark 2001SE - 3DMark 2001 - Standard
min: 37453     media: 38453     media: 38453 (40%)     massimo: 39453 Points
3DMark 03 - 3DMark 03 - Standard
min: 57010     media: 57553     media: 57552.5 (30%)     massimo: 58095 Points
3DMark 05 - 3DMark 05 - Standard
min: 19180     media: 19268     media: 19267.5 (21%)     massimo: 19355 Points
Intel Graphics Media Accelerator (GMA) 500
133.4 -99%
...
18414 -4%
18466 -4%
18522 -4%
18829 -2%
18903 -2%
18965 -2%
19079 -1%
19100 -1%
19187 0%
NVIDIA GeForce GTX 280M SLI
19268
Intel Iris Plus Graphics G4 (Ice Lake 48 EU)
19383 1%
Intel UHD Graphics Xe 16EUs (Tiger Lake-H)
19694 2%
19971 4%
20171 5%
20313 5%
20551 7%
20818 8%
20861 8%
20882 8%
...
69623 261%
max:
87172 352%
0%
100%
3DMark 06 3DMark 06 - Standard 1280x1024 +
3DMark 06
min: 14340     media: 15019     media: 15000 (20%)     massimo: 15717 Points
Windows Vista Experience Index - Windows Vista Leistungsindex - Grafik (Spiele)
5.9 Points (87%)
Windows Vista Experience Index - Windows Vista Leistungsindex - Grafik
5.9 Points (87%)
Cinebench R10 Cinebench R10 Shading (32bit) +
Cinebench R10 - Cinebench R10 Shading (32bit)
min: 4835     media: 5197     media: 5197 (4%)     massimo: 5559 punti
- Valori di benchmark per questa scheda grafica
red legend - Valori medi di benchmark per questa scheda grafica
* Numeri più piccoli rappresentano prestazioni supeiori

Benchmarks per i giochi

I seguenti benchmarks deirivano dai benchmarks dei portatili recensiti. Le prestazioni dipendono dalla scheda grafica utilizzata, dal clock rate, dal processore, dai settaggi di sistema, dai drivers, e dai sistemi operativi. Quindi i risultati non sono rappresentativi per i portatili con questa GPU. Per informazioni dettagliate sui risultati del benchmark, cliccate sul numero di fps.

Anno 1404

Anno 1404

2009
basso 1024x768
105  fps    + Confronta
ultra 1280x1024
37.6  fps    + Confronta
» Giocabile con tutti i portatili testati con dettagli ultra.
Sims 3

Sims 3

2009
basso 800x600
312  fps    + Confronta
medio 1024x768
145  fps    + Confronta
alto 1280x1024
120  fps    + Confronta
» Giocabile con tutti i portatili testati con dettagli alto.
F.E.A.R. 2

F.E.A.R. 2

2009
basso 800x600
180 208.8 ~ 194 fps    + Confronta
medio 1024x768
127.5  fps    + Confronta
alto 1280x1024
116.9 123.1 ~ 120 fps    + Confronta
» Giocabile con tutti i portatili testati con dettagli alto.
GTA IV - Grand Theft Auto

GTA IV - Grand Theft Auto

2008
basso 800x600
46.1 65.4 ~ 56 fps    + Confronta
medio 1024x768
44.6 45.2 ~ 45 fps    + Confronta
alto 1280x1024
35.5 62.2 ~ 49 fps    + Confronta
» Giocabile con tutti i portatili testati con dettagli alto.
Left 4 Dead

Left 4 Dead

2008
basso 640x480
165  fps    + Confronta
alto 1024x768
104  fps    + Confronta
» Giocabile con tutti i portatili testati con dettagli alto.
Far Cry 2

Far Cry 2

2008
basso 640x480
91.6  fps    + Confronta
alto 1024x768
50.8  fps    + Confronta
» Giocabile con tutti i portatili testati con dettagli alto.
Crysis Warhead

Crysis Warhead

2008
basso 800x600
73  fps    + Confronta
ultra 1024x768
35  fps    + Confronta
» Giocabile con tutti i portatili testati con dettagli basso.
Racedriver: GRID

Racedriver: GRID

2008
basso 800x600
122 208.8 ~ 165 fps    + Confronta
medio 1024x768
81 127.5 ~ 104 fps    + Confronta
alto 1280x1024
77 116.9 ~ 97 fps    + Confronta
» Giocabile con tutti i portatili testati con dettagli alto.
Call of Duty 4 - Modern Warfare

Call of Duty 4 - Modern Warfare

2007
basso 800x600
237.2  fps    + Confronta
medio 1024x768
175.3  fps    + Confronta
alto 1280x1024
105.9 119 ~ 112 fps    + Confronta
» Giocabile con tutti i portatili testati con dettagli alto.
Supreme Commander - FA Bench

Supreme Commander - FA Bench

2007
basso 1024x768
77.2  fps    + Confronta
medio 1024x768
67.2  fps    + Confronta
alto 1024x768
64.6  fps    + Confronta
» Giocabile con tutti i portatili testati con dettagli alto.
Crysis - GPU Benchmark

Crysis - GPU Benchmark

2007
basso 1024x768
102.6 108.5 ~ 106 fps    + Confronta
medio 1024x768
64.1  fps    + Confronta
alto 1024x768
52 53.2 ~ 53 fps    + Confronta
» Giocabile con tutti i portatili testati con dettagli alto.
Crysis - CPU Benchmark

Crysis - CPU Benchmark

2007
basso 1024x768
123.5 124.8 ~ 124 fps    + Confronta
medio 1024x768
65.4  fps    + Confronta
alto 1024x768
41.3 53.2 ~ 47 fps    + Confronta
» Giocabile con tutti i portatili testati con dettagli alto.
World in Conflict - Benchmark

World in Conflict - Benchmark

2007
medio 1024x768
47  fps    + Confronta
alto 1024x768
74  fps    + Confronta
» Giocabile con tutti i portatili testati con dettagli alto.
Half Life 2 - Lost Coast Benchmark

Half Life 2 - Lost Coast Benchmark

2005
alto 1024x768
130.8  fps    + Confronta
» Giocabile con tutti i portatili testati con dettagli alto.
World of Warcraft

World of Warcraft

2005
basso 800x600
267  fps    + Confronta
alto 1280x1024
52  fps    + Confronta
» Giocabile con tutti i portatili testati con dettagli alto.
Doom 3

Doom 3

2004
basso 640x480
217.1  fps    + Confronta
ultra 1024x768
215.7  fps    + Confronta
» Giocabile con tutti i portatili testati con dettagli ultra.
bassomedioaltoultraQHD4K
Anno 140410537.6
Sims 3312145120
F.E.A.R. 2194127.5120
GTA IV - Grand Theft Auto564549
Left 4 Dead165104
Far Cry 291.650.8
Crysis Warhead7335
Racedriver: GRID16510497
Call of Duty 4 - Modern Warfare237.2175.3112
Supreme Commander - FA Bench77.267.264.6
Crysis - GPU Benchmark10664.153
Crysis - CPU Benchmark12465.447
World in Conflict - Benchmark4774
Half Life 2 - Lost Coast Benchmark130.8
World of Warcraft26752
Doom 3217.1215.7
< 30 fps
< 60 fps
< 120 fps
≥ 120 fps

1
5
8

2
4
3

5
5
3

2

1


Per conoscere altri giochi che potrebbero essere utilizzabili e per una lista completa di tutti i giochi e delle schede grafiche visitate la nostra Gaming List

v1.28
log 05. 04:06:35

#0 ran 0s before starting gpusingle class +0s ... 0s

#1 no ids found in url (should be separated by "_") +0s ... 0s

#2 not redirecting to Ajax server +0s ... 0s

#3 did not recreate cache, as it is less than 5 days old! Created at Sat, 04 Jan 2025 05:33:17 +0100 +0.001s ... 0.001s

#4 no comparison url found in template nbc.compare_page_1 needed +0.028s ... 0.029s

#5 no comparison url found in template nbc.compare_page_1 needed +0s ... 0.029s

#6 no comparison url found in template nbc.compare_page_1 needed +0s ... 0.03s

#7 no comparison url found in template nbc.compare_page_1 needed +0s ... 0.03s

#8 no comparison url found in template nbc.compare_page_1 needed +0s ... 0.03s

#9 composed specs +0s ... 0.03s

#10 did output specs +0s ... 0.03s

#11 start showIntegratedCPUs +0s ... 0.03s

#12 getting avg benchmarks for device 1122 +0.013s ... 0.043s

#13 got single benchmarks 1122 +0.014s ... 0.057s

#14 got avg benchmarks for devices +0s ... 0.057s

#15 min, max, avg, median took s +0.278s ... 0.335s

#16 before gaming benchmark output +0s ... 0.335s

#17 Got 52 rows for game benchmarks. +0.004s ... 0.339s

#18 composed SQL query for gamebenchmarks +0s ... 0.339s

#19 got data and put it in $dataArray +0.007s ... 0.345s

#20 benchmarks composed for output. +0.349s ... 0.695s

#21 no comparison url found in template nbc.compare_page_1 needed +0.003s ... 0.697s

#22 return log +0s ... 0.697s

Recensioni Notebook con NVIDIA GeForce GTX 280M SLI la scheda grafica

SCHENKER XMG8: Intel Core 2 Duo T6500, 18.40", 5.6 kg
  Recensioni esterne » mySN XMG8

Alienware M17x: Intel Core 2 Extreme QX9300, 17.00", 5.8 kg
  Recensioni esterne » Alienware M17x

Please share our article, every link counts!
Mail Logo

Classe 1

Classe 2

GeForce RTX 5060 Laptop *
M1 Max 32-Core GPU *
GeForce RTX 2070 Super Mobile
M1 Max 24-Core GPU *
Radeon RX 5700M *
M1 Pro 16-Core GPU *
Radeon PRO W6600M *
GeForce RTX 2070 Super Max-Q
M1 Pro 14-Core GPU *
GeForce RTX 5050 Laptop *
Quadro P4200
Quadro P5000 Max-Q *
GeForce RTX 3050 4GB Laptop GPU
Quadro P4000 Max-Q
Radeon RX 580X (Laptop) *
Radeon RX 580 (Laptop)
Radeon Pro 5300M
Radeon RX 5300M
Quadro P3000 Max-Q *
Radeon Pro WX 7100 *
Radeon RX 570X (Laptop) *

Classe 3

Radeon RX 570 (Laptop) *
Radeon RX 470 (Laptop) *
GeForce GTX 1050 Ti Mobile
Radeon 680M
Quadro P2000 Max-Q
Radeon R9 M395X
GeForce GTX 1050 Ti Max-Q *
WX Vega M GL
Radeon R9 M485X
GeForce GTX 1050 Max-Q *
Radeon 660M
Radeon RX 560X (Laptop)
Radeon RX 560 (Laptop)
Radeon Pro 560X
Radeon Pro 560
Radeon Pro 460
Radeon Pro WX 4130 *
Quadro P620 *
Radeon RX 550X (Laptop)
Radeon Pro 555X
Radeon Pro 555
Radeon Pro 455
Quadro P600
Radeon RX 540X *
Radeon Pro WX 2100 *
Radeon Pro WX 3100 *
Radeon Pro 450
Radeon 630
Radeon 540X *
Quadro P520
Quadro P500 *
Iris Plus Graphics G7 (Ice Lake 64 EU) *
Vega 10 *
Iris Pro Graphics 580
Vega 9
FirePro W5130M
UHD Graphics Xe G4 48EUs *
UHD Graphics 32EUs
UHD Graphics Xe 32EUs (Tiger Lake-H) *
UHD Graphics 750
UHD Graphics 730
Vega 7
Radeon R7 M465
Vega 8
Iris Plus Graphics G4 (Ice Lake 48 EU)
Quadro M600M
FirePro W4190M
Radeon R7 M445
UHD Graphics 24EUs (Alder Lake-N) *
Radeon R7 M340
Radeon 610M *
UHD Graphics G1 (Ice Lake 32 EU)
UHD Graphics Xe 16EUs (Tiger Lake-H) *
Radeon R5 (Bristol Ridge)
Adreno 690 *
Adreno 685 *
Adreno 680 *

Classe 4

Posizione approssimativa dell'adattatore grafico

Klaus Hinum, 2009-09-18 (Update: 2014-09-19)