Notebookcheck Logo

Intel Core i9-14900

L'Intel Core i9-14900 è un processore di fascia alta basato sull'architettura Raptor-Lake. Il processore di base è a 2,0 GHz e può, in condizioni ottimali, arrivare fino a 5,8 GHz. Gli oltre 32 thread sono suddivisi, come nel modello superiore (Intel Core i9-14900K), in 8 P- e 16 E-Kerne. Gli 8 Performance-Kerne (P-Cores) offrono zudem l'Hyperthreading, che in somma 32 Threads può essere lavorato in modo semplice. Per i modelli non K si tratta di un processore di dimensioni ridotte. Per quanto riguarda l'Arbeitsspeicher, c'è la possibilità di scegliere tra DDR4 e DDR5.

Prestazioni

Nel confronto con Intel Core i9-14900K, il Core i9-14900 offre la stessa quantità di caratteristiche fisiche. A fronte di una maggiore durata di vita, l'Intel Core i9-14900 offre però una durata di vita inferiore. L'Einsatzzweck si concentra in ultima istanza sui PC kompakte, che offrono solo poche possibilità di utilizzo.

Grafikeinheit

Come anche l'Intel Core i9-14900K, l'Intel Core i9-14900 offre una Grafikeinheit integrata. Come base si basa ancora una volta sull'architettura Intel Iris Xe. Il livello di resistenza tecnica di Intel UHD Graphics 770 non ha subito alcun cambiamento.

Leistungsaufnahme

L'Intel Core i9-14900 ha un TDP di 65 Watt, che corrisponde al valore PL1. Con Boost, la potenza dei processori può raggiungere i 219 Watt (PL2). Le caratteristiche principali sono un'ottima efficienza. Rispetto al processore Intel Core i9-13900, la sua efficienza energetica non è stata compromessa.

Nome in codiceRaptor Lake
SerieIntel Raptor Lake-R

Serie: Raptor Lake-R Raptor Lake

Intel Core i9-14900K3.2 - 6 GHz24 / 32 cores36 MB L3
Intel Core i7-14700K2.5 - 5.6 GHz20 / 28 cores33 MB L3
Intel Core i9-14900 « 2 - 5.8 GHz24 / 32 cores36 MB L3
Intel Core i7-147001.5 - 5.4 GHz20 / 28 cores33 MB L3
Intel Core i5-14600K3.5 - 5.3 GHz14 / 20 cores24 MB L3
Intel Core i5-145002.6 - 5 GHz14 / 20 cores24 MB L3
Intel Core i5-14500T1.7 - 4.8 GHz14 / 20 cores24 MB L3
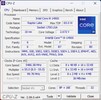
Clock Rate2000 - 5800 MHz
Level 2 Cache32 MB
Level 3 Cache36 MB
Numero di Cores / Threads24 / 32
8 x 5.8 GHz Intel Raptor Cove P-Core
16 x 4.3 GHz Intel Gracemont E-Core
Consumo energetico (TDP = Thermal Design Power)65 Watt
TDP Turbo PL2219 Watt
Tecnologia del produttore10 nm
Dimensione Die257 mm2
Temperatura massima100 °C
SocketLGA 1700
GPUIntel UHD Graphics 770 (300 - 1650 MHz)
64 BitSupporto 64 Bit
Architecturex86
Prezzo base$549 U.S.
Data di annuncio01/08/2024
Collegamento Prodotto (esterno)www.intel.de

Benchmark

Performance Rating - CB R15 + R20 + 7-Zip + X265 + Blender + 3DM11 CPU
47.2 pt (79%)
Cinebench 2024 - Cinebench 2024 CPU Single Core
129 Points (72%)
Cinebench 2024 - Cinebench 2024 CPU Multi Core
1245 Points (23%)
Cinebench R23 - Cinebench R23 Single Core
2212 Points (94%)
74.4 -97%
...
2116 -4%
Intel Core Ultra 5 245K
2132 -4%
2151 -3%
2160 -2%
2172 -2%
2184 -1%
2202 0%
2209 0%
2211 0%
Intel Core i9-14900
2212
2221 0%
2238 1%
2253 2%
2263 2%
2270 3%
Intel Core Ultra 9 285K
2348 6%
0%
100%
Cinebench R20 - Cinebench R20 CPU (Single Core)
846 Points (94%)
Cinebench R20 - Cinebench R20 CPU (Multi Core)
11291 Points (28%)
Cinebench R15 - Cinebench R15 CPU Multi 64 Bit
4793 Points (30%)
02505007501000125015001750200022502500275030003250350037504000425045004750Tooltip
Cinebench R15 - Cinebench R15 CPU Single 64 Bit
315 Points (88%)
19 -94%
...
305.1 -3%
305.6 -3%
305.9 -3%
307 -3%
308 -2%
311 -1%
313.5 0%
313.7 0%
314.1 0%
Intel Core i9-14900
315
316 0%
Intel Core Ultra 5 245K
322 2%
322.2 2%
324.5 3%
326 3%
AMD Ryzen 7 9800X3D
328 4%
342 9%
344 9%
346 10%
...
Intel Core Ultra 9 285K
355.5 13%
0%
100%
Cinebench R11.5 - Cinebench R11.5 CPU Multi 64 Bit
56.6 Points (73%)
Cinebench R11.5 - Cinebench R11.5 CPU Single 64 Bit
3.8 Points (90%)
Cinebench R10 - Cinebench R10 Rend. Single (32bit)
12284 punti (74%)
Cinebench R10 - Cinebench R10 Rend. Multi (32bit)
82492 punti (60%)
Cinebench R10 - Cinebench R10 Rend. Multi (64bit)
121768 Points (78%)
Cinebench R10 - Cinebench R10 Rend. Single (64bit)
17590 Points (21%)
wPrime 2.10 - wPrime 2.0 1024m *
85.6 s (1%)
wPrime 2.10 - wPrime 2.0 32m *
2.4 s (0%)
7-Zip 18.03 - 7-Zip 18.03 Multi Thread 4 runs
101652 MIPS (58%)
7-Zip 18.03 - 7-Zip 18.03 Single Thread 4 runs
7276 MIPS (86%)
X264 HD Benchmark 4.0 - x264 Pass 2
222 fps (74%)
X264 HD Benchmark 4.0 - x264 Pass 1
358.5 fps (83%)
HWBOT x265 Benchmark v2.2 - HWBOT x265 4k Preset
31.6 fps (56%)
0510152025303540Tooltip
TrueCrypt - TrueCrypt Serpent
2.4 GB/s (71%)
TrueCrypt - TrueCrypt Twofish
4.9 GB/s (84%)
TrueCrypt - TrueCrypt AES
18.5 GB/s (48%)
Blender - Blender 2.79 BMW27 CPU *
131 Seconds (1%)
R Benchmark 2.5 - R Benchmark 2.5 *
0.4 sec (8%)
3DMark 06 - CPU - 3DMark 06 - CPU
18728 Points (40%)
Super Pi mod 1.5 XS 1M - Super Pi mod 1.5 XS 1M *
5.8 s (1%)
Super Pi mod 1.5 XS 2M - Super Pi mod 1.5 XS 2M *
12.6 s (1%)
Super Pi Mod 1.5 XS 32M - Super Pi mod 1.5 XS 32M *
303.4 s (1%)
3DMark Vantage - 3DM Vant. Perf. CPU no Physx
93183 Points (72%)
3DMark 11 - 3DM11 Performance Physics
28622 Points (72%)
3DMark - 3DMark Ice Storm Physics
88787 Points (72%)
3DMark - 3DMark Ice Storm Unlimited Physics
93001 Points (77%)
3DMark - 3DMark Cloud Gate Physics
20179 Points (51%)
3DMark - 3DMark Fire Strike Standard Physics
42316 Points (75%)
3DMark - 3DMark Time Spy CPU
19492 Points (82%)
Geekbench 6.3 - Geekbench 6.3 Single-Core
3022 punti (77%)
Geekbench 6.3 - Geekbench 6.3 Multi-Core
15962 punti (62%)
Mediatek Helio A22 MT6761
491 -97%
...
14863 -7%
15016 -6%
15136 -5%
15220 -5%
Intel Core Ultra 9 285H
15330 -4%
15378 -4%
15480 -3%
15882 -1%
15910 0%
Intel Core i9-14900
15962
16010 0%
16094 1%
16228 2%
16523 4%
16782 5%
16817 5%
16928 6%
16957 6%
16991 6%
...
25760 61%
0%
100%
Geekbench 5.5 - Geekbench 5.1 - 5.5 64 Bit Single-Core
2140 punti (84%)
Geekbench 5.5 - Geekbench 5.1 - 5.5 64 Bit Multi-Core
17395 punti (31%)
Geekbench 5.0 - Geekbench 5.0 64 Bit Single-Core
2077 punti (9%)
Geekbench 5.0 - Geekbench 5.0 64 Bit Multi-Core
17218 punti (54%)
Geekbench 4.4 - Geekbench 4.1 - 4.4 64 Bit Single-Core
9143 punti (91%)
Geekbench 4.4 - Geekbench 4.1 - 4.4 64 Bit Multi-Core
67178 punti (67%)
Mozilla Kraken 1.1 - Kraken 1.1 Total Score *
436 ms (1%)
Power Consumption - Prime95 Power Consumption - external Monitor *
145.5 Watt (25%)
0153045607590105120135150165180195210225240255270Tooltip
Power Consumption - Cinebench R15 Multi Power Consumption - external Monitor *
253 Watt (46%)
0153045607590105120135150165180195210225240255270285Tooltip
Power Consumption - Idle Power Consumption - external Monitor *
29.9 Watt (20%)
051015202530Tooltip
Power Consumption - Cinebench R15 Multi Power Efficiency - external Monitor
18.9 Points per Watt (14%)
- Valori di benchmark per questa scheda grafica
red legend - Valori medi di benchmark per questa scheda grafica
* Numeri più piccoli rappresentano prestazioni supeiori

v1.28
log 19. 12:36:31

#0 ran 0s before starting gpusingle class +0s ... 0s

#1 no ids found in url (should be separated by "_") +0s ... 0s

#2 not redirecting to Ajax server +0s ... 0s

#3 did not recreate cache, as it is less than 5 days old! Created at Thu, 19 Dec 2024 05:30:11 +0100 +0.001s ... 0.001s

#4 no comparison url found in template nbc.compare_page_2 needed +0.002s ... 0.003s

#5 no comparison url found in template nbc.compare_page_2 needed +0s ... 0.003s

#6 no comparison url found in template nbc.compare_page_2 needed +0s ... 0.004s

#7 no comparison url found in template nbc.compare_page_2 needed +0s ... 0.004s

#8 no comparison url found in template nbc.compare_page_2 needed +0s ... 0.004s

#9 no comparison url found in template nbc.compare_page_2 needed +0s ... 0.004s

#10 composed specs +0.001s ... 0.005s

#11 did output specs +0s ... 0.005s

#12 getting avg benchmarks for device 18150 +0.019s ... 0.024s

#13 got single benchmarks 18150 +0.009s ... 0.034s

#14 got avg benchmarks for devices +0s ... 0.034s

#15 min, max, avg, median took s +1.093s ... 1.127s

#16 no comparison url found in template nbc.compare_page_2 needed +0s ... 1.127s

#17 return log +0s ... 1.127s

Please share our article, every link counts!
Mail Logo

» Confronto CPU Mobile
Confronto di tutte le serie di CPU mobile

» Processori Mobile - Elenco Benchmark
Elenco Benchmark di tutte le CPUs conosciute, usate nei portatili (CPUs desktop e portatili)

Altre CPU della serie Raptor Lake-R

» Intel Core i9-14900K
   24x 3.2 GHz - 6 GHz
» Intel Core i7-14700K
   20x 2.5 GHz - 5.6 GHz
» Intel Core i9-14900
   24x 2 GHz - 5.8 GHz
» Intel Core i7-14700
   20x 1.5 GHz - 5.4 GHz
» Intel Core i5-14600K
   14x 3.5 GHz - 5.3 GHz
» Intel Core i5-14500
   14x 2.6 GHz - 5 GHz
» Intel Core i5-14500T
   14x 1.7 GHz - 4.8 GHz

CPUs simili

+ AMD Ryzen 9 9900X
   12x 4.4 GHz - 5.6 GHz
+ Intel Core i7-14700K
   20x 2.5 GHz - 5.6 GHz
+ AMD Ryzen 9 7900X
   12x 4.7 GHz - 5.6 GHz
+ Intel Core i7-13700K
   16x 3.4 GHz - 5.4 GHz
+ AMD Ryzen Threadripper PRO 3975WX
   32x 3.5 GHz - 4.2 GHz
» Intel Core i9-14900
   24x 2 GHz - 5.8 GHz
- Intel Core i7-14700
   20x 1.5 GHz - 5.4 GHz
- AMD Ryzen 7 9700X
   8x 3.8 GHz - 5.5 GHz
- AMD Ryzen 9 7900
   12x 3.7 GHz - 5.4 GHz
- Intel Core i9-12900K
   16x 3.2 GHz - 5.2 GHz
- Intel Core Ultra 5 245K
   14x 3.6 GHz - 5.2 GHz
Klaus Hinum (Update: 2024-10-13)