Recensioni per il Intel Core i5-13420H processore
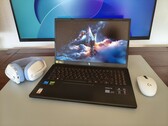
Una economica new entry nel mondo gaming: Acer Nitro V 15 non convince su tutta la linea
I computer portatili da gioco possono costare rapidamente diverse migliaia di euro. Coloro che cercano di tenere sotto controllo la spesa potrebbero trovare interessante il Nitro V 15 di Acer, che offre una GPU RTX 5050 a un prezzo relativamente moderato. Confrontiamo il laptop da gioco da 15 pollici con il suo predecessore e con i modelli concorrenti.
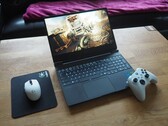
Intel Core i5-13420H, NVIDIA GeForce RTX 5050 Laptop, 15.6", 2.1 kgRecensione del portatile HP Victus 15 RTX 5050: Un gamer economico a 1.200 dollari
Con la versione RTX 5050 del Victus 15, HP offre uno dei portatili da gioco più convenienti basati sull'architettura Blackwell di Nvidia. Abbiamo messo alla prova il modello da 15 pollici e abbiamo discusso tutti i suoi pro e contro in questo articolo.
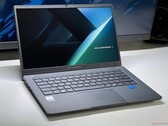
Intel Core i5-13420H, NVIDIA GeForce RTX 5050 Laptop, 15.6", 2.4 kgRecensione dell'Asus ExpertBook B1 - portatile da ufficio da 14" con Win 11 Pro e una garanzia di 3 anni a 700 dollari
Il nuovo ExpertBook B1 di Asus è un portatile da ufficio da 14 pollici conveniente, con processore Intel Core i5 e RAM aggiornabile. Include anche Win 11 Pro e una garanzia di 3 anni, ma dovrà scendere a compromessi per quanto riguarda i tempi di esecuzione.
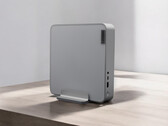
Intel Core i5-13420H, UHD Graphics Xe G4 48EUs, 14", 1.5 kgRecensione del Lenovo IdeaCentre Mini 5: Il mini PC per l'uso quotidiano si rivela un ottimo rapporto qualità-prezzo
Lenovo IdeaCentre Mini 5 è un PC desktop compatto che combina prestazioni e dimensioni ridotte. Con il suo design moderno, l'hardware potente e le opzioni di connettività versatili, si rivolge agli utenti che cercano una soluzione efficiente e discreta per l'uso quotidiano o per lavorare da casa. In questa recensione, abbiamo analizzato le sue prestazioni, le sue caratteristiche e la sua praticità per vedere se è in grado di distinguersi dalla massa dei mini PC.
Intel Core i5-13420H, UHD Graphics Xe G4 48EUs, 1.8 kgRecensione dell'Acer Nitro V 15 ANV15-51: gaming Laptop economico con RTX 4050
Nitro V 15 si rivolge ai giocatori che cercano un computer portatile potente nella fascia di prezzo di 1.000 euro (1.085 dollari). Legga la nostra recensione per scoprire se la configurazione con una RTX 4050 di GeForce è in grado di tenere il passo con la concorrenza.
Intel Core i5-13420H, NVIDIA GeForce RTX 4050 Laptop GPU, 15.6", 2.1 kgMSI Cyborg 15 A13UC: NVIDIA GeForce RTX 3050 4GB Laptop GPU, 15.60", 2 kg
Recensioni esterne » MSI Cyborg 15 A13UC
Asus Vivobook 14 A1405VA, i5-13420H: Intel UHD Graphics Xe G4 48EUs, 14.00", 1.6 kg
Recensioni esterne » Asus Vivobook 14 A1405VA, i5-13420H
Acer Nitro Lite 16 NL16-71G, RTX 4050: NVIDIA GeForce RTX 4050 Laptop GPU, 16.00", 2 kg
Recensioni esterne » Acer Nitro Lite 16 NL16-71G, RTX 4050
Lenovo IdeaPad Slim 3 15IRH10: Intel UHD Graphics Xe G4 48EUs, 15.60", 1.6 kg
Recensioni esterne » Lenovo IdeaPad Slim 3 15IRH10
Lenovo ThinkBook 14 G6 IRL: Intel UHD Graphics Xe G4 48EUs, 14.00", 1.4 kg
Recensioni esterne » Lenovo ThinkBook 14 G6 IRL
MSI Thin 15 B13VE, i5-13420H: NVIDIA GeForce RTX 4050 Laptop GPU, 15.60", 1.9 kg
Recensioni esterne » MSI Thin 15 B13VE, i5-13420H
Asus Vivobook 15 X1502VA: Intel UHD Graphics Xe G4 48EUs, 15.60", 1.7 kg
Recensioni esterne » Asus Vivobook 15 X1502VA
Asus Vivobook S14 S3407VA: Intel UHD Graphics Xe G4 48EUs, 14.00", 1.4 kg
Recensioni esterne » Asus Vivobook S14 S3407VA
Acer Extensa 15 EX215-57: Intel UHD Graphics Xe G4 48EUs, 15.60", 1.8 kg
Recensioni esterne » Acer Extensa 15 EX215-57
Asus ExpertBook P1 P1503CVA: Intel UHD Graphics Xe G4 48EUs, 15.60", 1.6 kg
Recensioni esterne » Asus ExpertBook P1 P1503CVA
Lenovo IdeaPad Slim 3 14IRH10 : Intel UHD Graphics Xe G4 48EUs, 14.00", 1.4 kg
Recensioni esterne » Lenovo IdeaPad Slim 3 14IRH10
Acer Nitro V 15 ANV15-51, RTX 2050: NVIDIA GeForce RTX 2050 Mobile, 15.60", 2.1 kg
Recensioni esterne » Acer Nitro V 15 ANV15-51, RTX 2050
Lenovo V14 G4 IRU: Intel UHD Graphics Xe G4 48EUs, 14.00", 1.4 kg
Recensioni esterne » Lenovo V14 G4 IRU
Honor MagicBook X 16 (2025): Intel UHD Graphics Xe G4 48EUs, 16.00", 1.7 kg
Recensioni esterne » Honor MagicBook X 16 (2025)
MSI Thin 15 B13UC: NVIDIA GeForce RTX 3050 4GB Laptop GPU, 15.60", 1.9 kg
Recensioni esterne » MSI Thin 15 B13UC
Asus ExpertBook B1 B1403CVA: Intel UHD Graphics Xe G4 48EUs, 14.00", 1.5 kg
Recensioni esterne » Asus ExpertBook B1 B1403CVA
Lenovo IdeaPad Slim 5 14IRL8, i5-13420H: Intel UHD Graphics Xe G4 48EUs, 14.00", 1.5 kg
Recensioni esterne » Lenovo IdeaPad Slim 5 14IRL8, i5-13420H
Honor MagicBook X 14 Pro 2024: Intel UHD Graphics Xe G4 48EUs, 14.00", 1.4 kg
Recensioni esterne » Honor MagicBook X 14 Pro 2024
Honor MagicBook X 16 Pro 2024: Intel UHD Graphics Xe G4 48EUs, 16.00", 1.7 kg
Recensioni esterne » Honor MagicBook X 16 Pro 2024
Huawei MateBook D 14 2024: Intel UHD Graphics Xe G4 48EUs, 14.00", 1.4 kg
Recensioni esterne » Huawei MateBook D 14 2024
Acer Nitro V 15 ANV15-51, RTX 3050: NVIDIA GeForce RTX 3050 6GB Laptop GPU, 15.60", 2.1 kg
Recensioni esterne » Acer Nitro V 15 ANV15-51, RTX 3050
Lenovo V15 G4 IRU: Intel UHD Graphics Xe G4 48EUs, 15.60", 1.7 kg
Recensioni esterne » Lenovo V15 G4 IRU
HP Omen 16-wd0000: NVIDIA GeForce RTX 4050 Laptop GPU, 16.10", 2.4 kg
Recensioni esterne » HP Omen 16-wd0000
Acer Nitro V 15 ANV15-51: NVIDIA GeForce RTX 4050 Laptop GPU, 15.60", 2.1 kg
Recensioni esterne » Acer Nitro V 15 ANV15-51
Acer Aspire 5 A515-58GM: NVIDIA GeForce RTX 2050 Mobile, 15.60", 1.7 kg
Recensioni esterne » Acer Aspire 5 A515-58GM
Lenovo IdeaPad Slim 3 15IRH8: Intel UHD Graphics Xe G4 48EUs, 15.60", 1.6 kg
Recensioni esterne » Lenovo IdeaPad Slim 3 15IRH8
HP Victus 15-fa1000ng: NVIDIA GeForce RTX 4050 Laptop GPU, 15.60", 2.3 kg
Recensioni esterne » HP Victus 15-fa1000ng
Lenovo LOQ 15IRH8, i5-13420H: NVIDIA GeForce RTX 4050 Laptop GPU, 15.60", 2.4 kg
Recensioni esterne » Lenovo LOQ 15IRH8, i5-13420H
Lenovo LOQ 16IRH8, i5-13420H RTX 3050: NVIDIA GeForce RTX 3050 4GB Laptop GPU, 16.00", 2.6 kg
Recensioni esterne » Lenovo LOQ 16IRH8, i5-13420H RTX 3050