Notebookcheck Logo

Intel Iris Plus Graphics 655

Intel Iris Plus Graphics 655

L'Intel Iris Plus Graphics 655 (GT3e) è una scheda grafica per processori annunciata nel settembre 2017. Come successore della Intel Iris Graphics 650 (Kaby Lake), la Iris Plus Graphics 655 viene utilizzata per i modelli da 28 Watt Coffee Lake-U. La differenza maggiore è la cache eDRAM raddoppiata da 128 MB. Non ci dovrebbero essere grandi cambiamenti rispetto all'Iris Graphics 650.

La cosiddetta versione GT3e della GPU Kaby Lake ha ancora 48 Execution Units (EUs), che possono raggiungere fino a 1200 MHz (precedentemente 1100 MHz) a seconda del modello. Oltre alla cache eDRAM, l'Iris 655 può anche accedere alla memoria di sistema (2x 64 Bit DDR3L-2133/DDR4-2400) tramite interfaccia processore.

Rispetto all'Iris Plus 640 dei modelli da 15 Watt, l'Iris 655 ha un clock massimo solo leggermente superiore e quasi il doppio del TDP, il che permette un migliore utilizzo del potenziale del Turbo Boost.

Performance

Le esatte prestazioni dell'Iris Plus Graphics 655 dipendono dal modello di CPU, perché il clock massimo e le dimensioni della cache dell'L3 possono differire leggermente. Anche la memoria di sistema (DDR3/DDR4) influisce sulle prestazioni.

I chip più veloci sono modelli Core i7 con clock elevato come il Core i7-8559U. A seconda del gioco, l'Iris Plus 655 sarà probabilmente alla pari con una GeForce 930M o GeForce 940MX dedicata e può gestire un gameplay fluido nei titoli moderni con impostazioni medio-basse.

Features

Il motore video rielaborato ora supporta completamente la decodifica hardware dei video H.265/HEVC. Contrariamente alla Skylake, tuttavia, la Kaby Lake può ora anche decodificare H.265/HEVC Main 10 con una profondità di colore a 10 bit e il codec VP9 di Google. L'uscita video è possibile tramite DP 1.2/eDP 1.3 (fino a 3840 x 2160 @60 Hz), mentre l'HDMI è supportato anche nel vecchio standard 1.4a. Un'uscita HDMI 2.0 può essere aggiunta tramite convertitore da DisplayPort. La GPU può gestire fino a tre display contemporaneamente.

Consumo Energetico

L'Iris Plus Graphics 655 è utilizzata per i processori da 28 Watt e quindi per notebook di piccole e medie dimensioni.

Gen. 9.5 Serie

Iris Plus Graphics 655 48 @ 0.3 - 1.2 GHz
Iris Plus Graphics 650 48 @ 0.3 - 1.1 GHz64/128 Bit
Iris Plus Graphics 645 48 @ 0.3 - 1.15 GHz
Iris Plus Graphics 640 48 @ 0.3 - 1.05 GHz64/128 Bit
UHD Graphics 630 24 @ 0.3 - 1.15 GHz64/128 Bit
UHD Graphics P630 24 @ 0.3 - 1.2 GHz64/128 Bit
HD Graphics 630 24 @ 0.3 - 1.15 GHz64/128 Bit
HD Graphics P630 24 64/128 Bit
UHD Graphics 620 24 @ 0.3 - 1.15 GHz
HD Graphics 620 24 @ 0.3 - 1.05 GHz64/128 Bit
UHD Graphics 617 24 @ 0.3 - 1.15 GHz64/128 Bit
UHD Graphics 615 24 @ 0.3 - 1 GHz64/128 Bit
HD Graphics 615 24 @ 0.3 - 1.05 GHz64/128 Bit
Nome in codiceKaby Lake GT3e
ArchitetturaGen. 9.5 Kaby Lake
Pipelines48 - unified
Velocità del core300 - 1200 (Boost) MHz
Tipo di memoriaDDR3/DDR4
Memoria condivisasi
APIDirectX 12_1, OpenGL 4.5
tecnologia14 nm
CaratteristicheQuickSync
Data dell'annuncio01.09.2017
CPU in Iris Plus Graphics 655GPU Base SpeedGPU Boost / Turbo
Intel Core i7-8559U4 x 2700 MHz, 28 W300 MHz1200 MHz
Intel Core i5-8269U4 x 2600 MHz, 28 W300 MHz1100 MHz
Intel Core i5-8279U4 x 2400 MHz, 28 W300 MHz1150 MHz
min. - max.300 MHz1050 - 1200 MHz

Benchmark

Performance Rating - 3DMark 11 + Fire Strike + Time Spy
0.9 pt (3%)
AMD Radeon HD 8180
0.06404 -93%
...
0.777 -11%
0.78 -11%
0.815 -7%
0.833 -5%
0.84 -4%
Intel Iris Pro Graphics 580
0.841 -4%
0.853 -3%
0.861 -2%
AMD Radeon 610M
0.868 -1%
Intel Iris Plus Graphics 655
0.876
0.882 1%
0.882 1%
0.917 5%
0.93 6%
AMD FirePro W5130M
0.932 6%
Intel Iris Plus Graphics G4 (Ice Lake 48 EU)
0.938 7%
0.958 9%
Intel UHD Graphics Xe 750 32EUs (Rocket Lake)
0.96 10%
0.971 11%
...
20.4 2229%
max:
33.3 3701%
0%
100%
3DMark - 3DMark Time Spy Score
min: 348     media: 647     media: 684 (2%)     massimo: 722 Points
3DMark - 3DMark Time Spy Graphics
min: 301     media: 570     media: 604.5 (2%)     massimo: 633 Points
113 -80%
...
452.3 -21%
AMD Radeon R7 M445
471 -17%
493 -14%
AMD Radeon 610M
511 -10%
Intel UHD Graphics Xe 750 32EUs (Rocket Lake)
539 -5%
550 -4%
552 -3%
555 -3%
558 -2%
Intel Iris Plus Graphics 655
570
577 1%
614 8%
NVIDIA Quadro M600M
631 11%
Intel Iris Plus Graphics G4 (Ice Lake 48 EU)
639 12%
650 14%
Intel UHD Graphics Xe 32EUs (Tiger Lake-H)
670 18%
AMD Radeon RX Vega 8 (Ryzen 2000/3000)
673 18%
AMD Radeon RX Vega 10
724 27%
733 29%
...
19434 3309%
max:
36259 6261%
0%
100%
3DMark - 3DMark Ice Storm Unlimited Graphics
min: 131607     media: 139716     media: 137266 (14%)     massimo: 152727 Points
3DMark - 3DMark Ice Storm Extreme Graphics
min: 57033     media: 72655     media: 71073 (8%)     massimo: 89859 Points
3DMark - 3DMark Cloud Gate Score
min: 6769     media: 10798     media: 11622 (11%)     massimo: 13037 Points
3DMark - 3DMark Cloud Gate Graphics
min: 6498     media: 13736     media: 14343 (4%)     massimo: 16698 Points
3DMark - 3DMark Fire Strike Standard Score
min: 852     media: 1703     media: 1850 (3%)     massimo: 2040 Points
3DMark - 3DMark Fire Strike Standard Graphics
min: 920     media: 1836     media: 1983 (2%)     massimo: 2260 Points
3DMark 11 - 3DM11 Performance Score
min: 1548     media: 2942     media: 3180.5 (4%)     massimo: 3349 Points
3DMark 11 - 3DM11 Performance GPU
min: 1365     media: 2707     media: 2894 (2%)     massimo: 3081 Points
171.8 -94%
...
2549 -6%
2577 -5%
2582 -5%
2595 -4%
2615 -3%
2658 -2%
AMD Radeon R6 M340DX
2681 -1%
2693 -1%
2702 0%
Intel Iris Plus Graphics 655
2707
2709 0%
2729 1%
2762 2%
2766 2%
2801 3%
2817 4%
AMD Radeon HD 6970M
2821 4%
2872 6%
NVIDIA Quadro M600M
2911 8%
...
59943 2114%
max:
104201 3749%
0%
100%
3DMark Vantage
3DM Vant. Perf. total +
3DMark Vantage - 3DM Vant. Perf. total
min: 12093     media: 12287     media: 12287 (4%)     massimo: 12481 Points
3DM Vant. Perf. GPU no PhysX +
3DMark Vantage - 3DM Vant. Perf. GPU no PhysX
min: 10337     media: 10514     media: 10513.5 (6%)     massimo: 10690 Points
62 -99%
...
AMD Radeon RX Vega 10
9909 -6%
9947 -5%
10052 -4%
10067 -4%
AMD Radeon Pro WX 3100
10150 -3%
10211 -3%
10234 -3%
AMD Radeon 540X
10287 -2%
10511 0%
Intel Iris Plus Graphics 655
10514
10561 0%
10701 2%
10755 2%
10861 3%
Intel UHD Graphics Xe 32EUs (Tiger Lake-H)
10953 4%
NVIDIA Quadro M600M
10958 4%
11019 5%
11047 5%
AMD Radeon RX Vega 9
11100 6%
...
132443 1160%
max:
170928 1526%
0%
100%
3DMark 05 - 3DMark 05 - Standard
22740 Points (25%)
Intel Graphics Media Accelerator (GMA) 500
133.4 -99%
...
21185 -7%
AMD Radeon R7 M445
21189 -7%
21266 -6%
21287 -6%
21505 -5%
21611 -5%
AMD Radeon HD 6970M
21991 -3%
22463 -1%
22649 0%
Intel Iris Plus Graphics 655
22740
22798 0%
22852 0%
23057 1%
23434 3%
23752 4%
23810 5%
23823 5%
24001 6%
24337 7%
...
69623 206%
max:
87172 283%
0%
100%
3DMark 06 3DMark 06 - Standard 1280x1024 +
3DMark 06
min: 17176     media: 17885     media: 17885 (23%)     massimo: 18594 Points
Unigine Valley 1.0 - Unigine Valley 1.0 DX
8.2 fps (2%)
SPECviewperf 12
specvp12 sw-03 +
SPECviewperf 12 - specvp12 sw-03
28.2 fps (7%)
specvp12 snx-02 +
specvp12 showcase-01 +
SPECviewperf 12 - specvp12 showcase-01
10.3 fps (2%)
specvp12 mediacal-01 +
SPECviewperf 12 - specvp12 mediacal-01
4.6 fps (1%)
specvp12 maya-04 +
SPECviewperf 12 - specvp12 maya-04
20.4 fps (6%)
specvp12 energy-01 +
SPECviewperf 12 - specvp12 energy-01
0.3 fps (0%)
specvp12 creo-01 +
SPECviewperf 12 - specvp12 creo-01
14.9 fps (6%)
specvp12 catia-04 +
SPECviewperf 12 - specvp12 catia-04
18.8 fps (3%)
specvp12 3dsmax-05 +
SPECviewperf 12 - specvp12 3dsmax-05
18.1 fps (3%)
SPECviewperf 13 specvp13 sw-04 +
SPECviewperf 13 - specvp13 sw-04
34.6 fps (9%)
specvp13 snx-03 +
SPECviewperf 13 - specvp13 snx-03
3.8 fps (0%)
specvp13 showcase-02 +
SPECviewperf 13 - specvp13 showcase-02
10.3 fps (2%)
specvp13 medical-02 +
SPECviewperf 13 - specvp13 medical-02
3.8 fps (1%)
specvp13 maya-05 +
SPECviewperf 13 - specvp13 maya-05
25.9 fps (3%)
specvp13 energy-02 +
SPECviewperf 13 - specvp13 energy-02
1.1 fps (0%)
specvp13 creo-02 +
SPECviewperf 13 - specvp13 creo-02
19.6 fps (3%)
specvp13 catia-05 +
SPECviewperf 13 - specvp13 catia-05
26.4 fps (3%)
specvp13 3dsmax-06 +
SPECviewperf 13 - specvp13 3dsmax-06
18.2 fps (3%)
SPECviewperf 2020 specvp2020 solidworks-05 4k +
specvp2020 snx-04 4k +
specvp2020 medical-03 4k +
SPECviewperf 2020 - specvp2020 medical-03 4k
1.8 fps (2%)
specvp2020 maya-06 4k +
SPECviewperf 2020 - specvp2020 maya-06 4k
32.7 fps (5%)
specvp2020 energy-03 4k +
SPECviewperf 2020 - specvp2020 energy-03 4k
1.1 fps (0%)
specvp2020 creo-03 4k +
SPECviewperf 2020 - specvp2020 creo-03 4k
12.1 fps (6%)
specvp2020 catia-06 4k +
SPECviewperf 2020 - specvp2020 catia-06 4k
6.3 fps (4%)
specvp2020 3dsmax-07 4k +
SPECviewperf 2020 - specvp2020 3dsmax-07 4k
8.4 fps (3%)
Cinebench R10 Cinebench R10 Shading (32bit) +
Cinebench R10 - Cinebench R10 Shading (32bit)
min: 7836     media: 9544     media: 10263 (7%)     massimo: 10533 punti
Cinebench R11.5 Cinebench R11.5 OpenGL 64 Bit +
Cinebench R11.5 - Cinebench R11.5 OpenGL 64 Bit
min: 50.25     media: 51.4     media: 51.6 (17%)     massimo: 52.2 fps
Cinebench R15
Cinebench R15 OpenGL 64 Bit +
Cinebench R15 - Cinebench R15 OpenGL 64 Bit
min: 33.91     media: 67     media: 74 (4%)     massimo: 88 fps
Cinebench R15 OpenGL Ref. Match 64 Bit +
Cinebench R15 - Cinebench R15 OpenGL Ref. Match 64 Bit
min: 97.8     media: 98.1     media: 97.8 (98%)     massimo: 99.3 %
GFXBench 3.1 - GFXBench Manhattan ES 3.1 Offscreen
min: 43.1     media: 2387     media: 2387.1 (50%)     massimo: 4731 fps
GFXBench (DX / GLBenchmark) 2.7
GFXBench T-Rex HD Offscreen C24Z16 +
GFXBench (DX / GLBenchmark) 2.7 - GFXBench T-Rex HD Offscreen C24Z16
min: 199.6     media: 6375     media: 6375.3 (51%)     massimo: 12551 fps
LuxMark v2.0 64Bit - LuxMark v2.0 Room GPU
min: 359     media: 419.5     media: 419.5 (2%)     massimo: 480 Samples/s
LuxMark v2.0 64Bit - LuxMark v2.0 Sala GPU
min: 882     media: 1038     media: 1038 (2%)     massimo: 1194 Samples/s
ComputeMark v2.1 - ComputeMark v2.1 Result
min: 1584     media: 1713     media: 1712.5 (2%)     massimo: 1841 punti
Power Consumption - Furmark Stress Test Power Consumption - external Monitor *
min: 28.9     media: 37.4     media: 39.2 (6%)     massimo: 42.4 Watt
0510152025303540455055Tooltip
Power Consumption - The Witcher 3 Power Consumption - external Monitor *
min: 35.3     media: 40.6     media: 39.4 (6%)     massimo: 47.2 Watt
05101520253035404550Tooltip
Power Consumption - Witcher 3 Power Consumption *
min: 39.4     media: 43.3     media: 43.3 (10%)     massimo: 47.2 Watt
0510152025303540Tooltip
Power Consumption - Witcher 3 ultra Power Efficiency
0.1 fps per Watt (13%)
Power Consumption - Witcher 3 ultra Power Efficiency - external Monitor
0.2 fps per Watt (13%)
Emissions Witcher 3 Fan Noise +
Emissions - Witcher 3 Fan Noise
min: 32.5     media: 36.2     media: 37.2 (60%)     massimo: 39 dB(A)
Clock Speed - GPU Clock Witcher 3 ultra
998 MHz (39%)
- Valori di benchmark per questa scheda grafica
red legend - Valori medi di benchmark per questa scheda grafica
* Numeri più piccoli rappresentano prestazioni supeiori

Benchmarks per i giochi

I seguenti benchmarks deirivano dai benchmarks dei portatili recensiti. Le prestazioni dipendono dalla scheda grafica utilizzata, dal clock rate, dal processore, dai settaggi di sistema, dai drivers, e dai sistemi operativi. Quindi i risultati non sono rappresentativi per i portatili con questa GPU. Per informazioni dettagliate sui risultati del benchmark, cliccate sul numero di fps.

F1 2021

F1 2021

2021
basso 1280x720
44.6  fps    + Confronta
medio 1920x1080
21.6  fps    + Confronta
alto 1920x1080
16.4  fps    + Confronta
ultra 1920x1080
10.2  fps    + Confronta
» Giocabile con tutti i portatili testati con dettagli basso.
F1 2020

F1 2020

2020
basso 1280x720
40.7  fps    + Confronta
medio 1920x1080
19.1  fps    + Confronta
alto 1920x1080
14.5  fps    + Confronta
ultra 1920x1080
9.6  fps    + Confronta
» Giocabile con tutti i portatili testati con dettagli basso.
basso 1280x720
54.8  fps    + Confronta
medio 1920x1080
17.3  fps    + Confronta
alto 1920x1080
11.6  fps    + Confronta
» Giocabile con tutti i portatili testati con dettagli basso.
basso 1280x720
0 (!)  fps    + Confronta
basso 1280x720
29.1  fps    + Confronta
medio 1920x1080
16.2  fps    + Confronta
alto 1920x1080
14.1  fps    + Confronta
ultra 1920x1080
6.6  fps    + Confronta
» Il Benchmark indica che il gioco non è utilizzabile con i settaggi testati.
alto 1920x1080
59.8  fps    + Confronta
4K 3840x2160
27.2  fps    + Confronta
» Giocabile con tutti i portatili testati con dettagli alto.
basso 1280x720
15.8  fps    + Confronta
» Il Benchmark indica che il gioco non è utilizzabile con i settaggi testati.
basso 1280x720
0 (!)  fps    + Confronta
GRID 2019

GRID 2019

2019
basso 1280x720
36.3 (!)  fps    + Confronta
medio 1920x1080
20.9 (!)  fps    + Confronta
» Giocabile con tutti i portatili testati con dettagli basso.
basso 1280x720
0 (!)  fps    + Confronta
FIFA 20

FIFA 20

2019
basso 1280x720
92  fps    + Confronta
medio 1920x1080
55.9  fps    + Confronta
alto 1920x1080
46.3  fps    + Confronta
ultra 1920x1080
34.9  fps    + Confronta
QHD 2560x1440
26.5  fps    + Confronta
4K 3840x2160
13.6  fps    + Confronta
» Giocabile con tutti i portatili testati con dettagli alto.
basso 1280x720
22.5 23.5 ~ 23 fps    + Confronta
medio 1920x1080
10.2 10.4 ~ 10 fps    + Confronta
alto 1920x1080
6.4 6.7 ~ 7 fps    + Confronta
» Il Benchmark indica che il gioco non è utilizzabile con i settaggi testati.
Additional Benchmarks
Very Low Overall Quality (DX11) 1920x1080
13
15.5
Control

Control

2019
basso 1280x720
25.4 (!)  fps    + Confronta
» Il Benchmark indica che il gioco non è utilizzabile con i settaggi testati.
F1 2019

F1 2019

2019
basso 1280x720
51.2  fps    + Confronta
medio 1920x1080
21.9  fps    + Confronta
alto 1920x1080
19.3  fps    + Confronta
» Giocabile con tutti i portatili testati con dettagli basso.
basso 1280x720
56.7  fps    + Confronta
medio 1920x1080
18.5  fps    + Confronta
alto 1920x1080
10.5  fps    + Confronta
» Giocabile con tutti i portatili testati con dettagli basso.
Rage 2

Rage 2

2019
basso 1280x720
24.5  fps    + Confronta
» Il Benchmark indica che il gioco non è utilizzabile con i settaggi testati.
Anno 1800

Anno 1800

2019
basso 1280x720
30.2  fps    + Confronta
» Il Benchmark indica che il gioco non è utilizzabile con i settaggi testati.
basso 1280x720
35  fps    + Confronta
» Il Benchmark indica che il gioco non è utilizzabile con i settaggi testati.
basso 1280x720
64  fps    + Confronta
medio 1920x1080
22.8  fps    + Confronta
» Giocabile con tutti i portatili testati con dettagli basso.
Anthem

Anthem

2019
basso 1280x720
16.6  fps    + Confronta
» Il Benchmark indica che il gioco non è utilizzabile con i settaggi testati.
basso 1280x720
21 22 ~ 22 fps    + Confronta + 📈 Graph
medio 1920x1080
11 11 ~ 11 fps    + Confronta + 📈 Graph
alto 1920x1080
10  fps    + Confronta + 📈 Graph
ultra 1920x1080
9  fps    + Confronta + 📈 Graph
» Il Benchmark indica che il gioco non è utilizzabile con i settaggi testati.
basso 1280x720
18.3 20.1 ~ 19 fps    + Confronta
medio 1920x1080
10.1  fps    + Confronta
alto 1920x1080
7.4  fps    + Confronta
» Il Benchmark indica che il gioco non è utilizzabile con i settaggi testati.
basso 1280x720
19.9  fps    + Confronta
» Il Benchmark indica che il gioco non è utilizzabile con i settaggi testati.
basso 1280x720
0 (!)  fps    + Confronta
basso 1280x720
13 18 ~ 16 fps    + Confronta
» Il Benchmark indica che il gioco non è utilizzabile con i settaggi testati.
basso 1280x720
25  fps    + Confronta
medio 1920x1080
0 (!)  fps    + Confronta
» Il Benchmark indica che il gioco non è utilizzabile con i settaggi testati.
FIFA 19

FIFA 19

2018
basso 1280x720
82  fps    + Confronta
medio 1920x1080
45.8  fps    + Confronta
alto 1920x1080
40.3  fps    + Confronta
ultra 1920x1080
36.7  fps    + Confronta
» Giocabile con tutti i portatili testati con dettagli ultra.
basso 1280x720
19 20.5 22 23.5 ~ 21 fps    + Confronta
medio 1920x1080
11 13 ~ 12 fps    + Confronta
alto 1920x1080
8 10.1 ~ 9 fps    + Confronta
» Il Benchmark indica che il gioco non è utilizzabile con i settaggi testati.
Additional Benchmarks
Lowest Preset 1920x1080
14
16.6
Strange Brigade

Strange Brigade

2018
basso 1280x720
41.4  fps    + Confronta
medio 1920x1080
17.6  fps    + Confronta
alto 1920x1080
16.9  fps    + Confronta
ultra 1920x1080
14.5  fps    + Confronta
» Giocabile con tutti i portatili testati con dettagli basso.
F1 2018

F1 2018

2018
basso 1280x720
45  fps    + Confronta
medio 1920x1080
23  fps    + Confronta
alto 1920x1080
17  fps    + Confronta
ultra 1920x1080
12 12 ~ 12 fps    + Confronta
» Giocabile con tutti i portatili testati con dettagli basso.
basso 1280x720
30.9  fps    + Confronta
» Il Benchmark indica che il gioco non è utilizzabile con i settaggi testati.
Far Cry 5

Far Cry 5

2018
basso 1280x720
20 22 23 ~ 22 fps    + Confronta + 📈 Graph
medio 1920x1080
10 11 11 ~ 11 fps    + Confronta + 📈 Graph
alto 1920x1080
10  fps    + Confronta + 📈 Graph
ultra 1920x1080
9  fps    + Confronta + 📈 Graph
» Il Benchmark indica che il gioco non è utilizzabile con i settaggi testati.
Additional Benchmarks
Low Preset TAA 1920x1080
13
12
World of Tanks enCore

World of Tanks enCore

2018
basso 1366x768
15.7 250 ~ 133 fps    + Confronta
medio 1920x1080
40.3  fps    + Confronta
» Giocabile con tutti i portatili testati con dettagli medio.
basso 1280x720
13.8 21.2 22.4 25.3 26.8 32.6 42.8 ~ 26 fps    + Confronta
medio 1920x1080
9.8 15 15.3 18 18.4 23.3 29.5 ~ 18 fps    + Confronta
alto 1920x1080
8.6 12.3 13.4 15.9 16 19.8 25.1 ~ 16 fps    + Confronta
» Il Benchmark indica che il gioco non è utilizzabile con i settaggi testati.
basso 1280x720
9.1 14.7 15.6 16.6 16.9 17 17.3 18.1 ~ 16 fps    + Confronta
medio 1920x1080
7.9 8.8 9.1 9.7 ~ 9 fps    + Confronta
alto 1920x1080
5.3 6 6.1 6.6 ~ 6 fps    + Confronta
» Il Benchmark indica che il gioco non è utilizzabile con i settaggi testati.
Fortnite

Fortnite

2018
basso 1280x720
51.5  fps    + Confronta
medio 1920x1080
21.6  fps    + Confronta
» Giocabile con tutti i portatili testati con dettagli basso.
basso 1280x720
13  fps    + Confronta
» Il Benchmark indica che il gioco non è utilizzabile con i settaggi testati.
basso 1280x720
30  fps    + Confronta
medio 1920x1080
18  fps    + Confronta
alto 1920x1080
14  fps    + Confronta
ultra 1920x1080
9  fps    + Confronta
» Il Benchmark indica che il gioco non è utilizzabile con i settaggi testati.
basso 1280x720
128  fps    + Confronta
medio 1366x768
125  fps    + Confronta
alto 1920x1080
113  fps    + Confronta
ultra 1920x1080
57.8  fps    + Confronta
4K 3820x2160
34.4  fps    + Confronta
» Giocabile con tutti i portatili testati con dettagli ultra.
basso 1280x720
78 97 133.3 ~ 103 fps    + Confronta
medio 1920x1080
40.6 46 59.1 ~ 49 fps    + Confronta
alto 1920x1080
32.7 36 38.8 ~ 36 fps    + Confronta
» Giocabile con la maggior parte dei portatili testati con dettagli alto.
Additional Benchmarks
Performance 1920x1080
92
60
basso 1280x720
20.4 22.7 ~ 22 fps    + Confronta
medio 1920x1080
10.2  fps    + Confronta
» Il Benchmark indica che il gioco non è utilizzabile con i settaggi testati.
For Honor

For Honor

2017
basso 1280x720
0 (!) 41.3 ~ 21 fps    + Confronta
medio 1920x1080
16.1  fps    + Confronta
» Giocabile con tutti i portatili testati con dettagli basso.
basso 1280x720
28.7  fps    + Confronta
medio 1366x768
21.1  fps    + Confronta
» Il Benchmark indica che il gioco non è utilizzabile con i settaggi testati.
Overwatch

Overwatch

2016
basso 1280x720
91  fps    + Confronta
medio 1366x768
68  fps    + Confronta
alto 1920x1080
29.9  fps    + Confronta
ultra 1920x1080
18.2  fps    + Confronta
» Giocabile con tutti i portatili testati con dettagli medio.
basso 1280x768
19.4  fps    + Confronta
medio 1920x1080
11.3  fps    + Confronta
alto 1920x1080
10.5  fps    + Confronta
» Il Benchmark indica che il gioco non è utilizzabile con i settaggi testati.
basso 1280x720
34.2  fps    + Confronta
medio 1366x768
21.2  fps    + Confronta
» Il Benchmark indica che il gioco non è utilizzabile con i settaggi testati.
basso 1024x768
25.9 39.2 ~ 33 fps    + Confronta
medio 1366x768
17.6 22.3 ~ 20 fps    + Confronta
alto 1920x1080
10.8  fps    + Confronta
ultra 1920x1080
8.9  fps    + Confronta
» Il Benchmark indica che il gioco non è utilizzabile con i settaggi testati.
basso 1024x768
75.8  fps    + Confronta
medio 1366x768
0 (!)  fps    + Confronta
» Giocabile con tutti i portatili testati con dettagli basso.
basso 1280x720
51.4 84 86.8 87.9 92.6 94.4 95 98 ~ 86 fps    + Confronta
medio 1366x768
34.6 37.1 57 63 64 66 68 77.9 ~ 58 fps    + Confronta
alto 1920x1080
15.8 25.3 27.8 31.9 32.4 33.3 34.5 34.7 ~ 29 fps    + Confronta
ultra 1920x1080
13.4 22.7 24.5 27.7 28.1 28.1 29.9 30.4 ~ 26 fps    + Confronta
4K 3840x2160
11.6 12.2 ~ 12 fps    + Confronta
» Giocabile con la maggior parte dei portatili testati con dettagli medio.
basso 1024x768
23.2 24.7 27.4 27.9 ~ 26 fps    + Confronta + 📈 Graph
medio 1366x768
14.6 17.8 ~ 16 fps    + Confronta
alto 1920x1080
10.1 10.9 ~ 11 fps    + Confronta
ultra 1920x1080
5.6 5.6 ~ 6 fps    + Confronta + 📈 Graph
» Il Benchmark indica che il gioco non è utilizzabile con i settaggi testati.
Additional Benchmarks
Medium Graphics & Postprocessing 1920x1080
12.3
GTA V

GTA V

2015
basso 1024x768
57 61 68 ~ 62 fps    + Confronta
medio 1366x768
51.2 51.8 62.1 ~ 55 fps    + Confronta
alto 1920x1080
13.7 14.3 15.8 ~ 15 fps    + Confronta
ultra 1920x1080
5.2 5.5 6.2 ~ 6 fps    + Confronta
QHD 2560x1440
4.2  fps    + Confronta
» Giocabile con tutti i portatili testati con dettagli medio.
Additional Benchmarks
Normal/Off 4xAF 1920x1080
45.5
38.2
Lowest Settings possible 1920x1080
48.1
39.9
basso 1280x720
78.4 116.6 ~ 98 fps    + Confronta
medio 1366x768
54.3 64.8 ~ 60 fps    + Confronta
alto 1366x768
49.4 55 ~ 52 fps    + Confronta
ultra 1920x1080
15.5 17 ~ 16 fps    + Confronta
» Giocabile con tutti i portatili testati con dettagli alto.
alto 1366x768
93.7  fps    + Confronta
ultra 1920x1080
49.6  fps    + Confronta
4K 3820x2160
12.4  fps    + Confronta
» Giocabile con tutti i portatili testati con dettagli ultra.
bassomedioaltoultraQHD4K
F1 202144.621.616.410.2
F1 202040.719.114.59.64
Gears Tactics54.817.311.6
Doom Eternal
Escape from Tarkov29.116.214.16.59
Hearthstone59.827.2
Red Dead Redemption 215.8
Call of Duty Modern Warfare 2019
GRID 201936.320.9
Ghost Recon Breakpoint
FIFA 209255.946.334.926.513.6
Borderlands 323107
Control25.4
F1 201951.221.919.3
Total War: Three Kingdoms56.718.510.5
Rage 224.5
Anno 180030.2
The Division 235
Dirt Rally 2.06422.8
Anthem16.6
Far Cry New Dawn2211109
Metro Exodus1910.17.41
Battlefield V19.9
Call of Duty Black Ops 4
Assassin´s Creed Odyssey16
Forza Horizon 425
FIFA 198245.840.336.7
Shadow of the Tomb Raider21129
Strange Brigade41.417.616.914.5
F1 201845231712
The Crew 230.9
Far Cry 52211109
World of Tanks enCore13340.3
X-Plane 11.11261816
Final Fantasy XV Benchmark1696
Fortnite51.521.6
Assassin´s Creed Origins13
Middle-earth: Shadow of War3018149
Team Fortress 212812511357.834.4
Rocket League1034936
Ghost Recon Wildlands2210.2
For Honor2116.1
Deus Ex Mankind Divided28.721.1
Overwatch916829.918.2
Ashes of the Singularity19.411.310.5
The Division34.221.2
Rise of the Tomb Raider332010.88.9
Rainbow Six Siege75.8
Dota 2 Reborn8658292612
The Witcher 32616116
GTA V62551564.17
BioShock Infinite98605216
Counter-Strike: GO93.749.612.4
< 30 fps
< 60 fps
< 120 fps
≥ 120 fps
21
15
9
2
26
6
2
1
22
5
2
14
4

2


4
1

Per conoscere altri giochi che potrebbero essere utilizzabili e per una lista completa di tutti i giochi e delle schede grafiche visitate la nostra Gaming List

v1.28
log 19. 08:23:20

#0 ran 0s before starting gpusingle class +0s ... 0s

#1 no ids found in url (should be separated by "_") +0s ... 0s

#2 not redirecting to Ajax server +0s ... 0s

#3 did not recreate cache, as it is less than 5 days old! Created at Thu, 19 Dec 2024 05:31:27 +0100 +0.001s ... 0.001s

#4 no comparison url found in template nbc.compare_page_1 needed +0.028s ... 0.028s

#5 no comparison url found in template nbc.compare_page_1 needed +0s ... 0.029s

#6 no comparison url found in template nbc.compare_page_1 needed +0s ... 0.029s

#7 no comparison url found in template nbc.compare_page_1 needed +0s ... 0.029s

#8 no comparison url found in template nbc.compare_page_1 needed +0s ... 0.029s

#9 no comparison url found in template nbc.compare_page_1 needed +0s ... 0.029s

#10 no comparison url found in template nbc.compare_page_1 needed +0s ... 0.029s

#11 no comparison url found in template nbc.compare_page_1 needed +0s ... 0.03s

#12 no comparison url found in template nbc.compare_page_1 needed +0s ... 0.03s

#13 no comparison url found in template nbc.compare_page_1 needed +0s ... 0.03s

#14 no comparison url found in template nbc.compare_page_1 needed +0s ... 0.03s

#15 no comparison url found in template nbc.compare_page_1 needed +0s ... 0.03s

#16 composed specs +0s ... 0.03s

#17 did output specs +0s ... 0.03s

#18 start showIntegratedCPUs +0s ... 0.03s

#19 getting avg benchmarks for device 8828 +0.029s ... 0.059s

#20 got single benchmarks 8828 +0.025s ... 0.084s

#21 got avg benchmarks for devices +0s ... 0.084s

#22 min, max, avg, median took s +1.061s ... 1.145s

#23 before gaming benchmark output +0s ... 1.145s

#24 Got 248 rows for game benchmarks. +0.021s ... 1.166s

#25 composed SQL query for gamebenchmarks +0s ... 1.166s

#26 got data and put it in $dataArray +0.034s ... 1.201s

#27 benchmarks composed for output. +1.534s ... 2.734s

#28 no comparison url found in template nbc.compare_page_1 needed +0.005s ... 2.739s

#29 return log +0s ... 2.739s

Recensioni Notebook con Intel Iris Plus Graphics 655 la scheda grafica

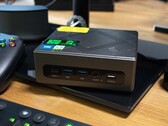
ACEMagician ACE-CK10-8259U

Recensione del mini PC ACEMagician ACE-CK10-8259U - un PC da ufficio silenzioso con spazio per tre SSD

L'ACEMagician ACE-CK10-8259U è un piccolo PC da ufficio basato su un processore nativo a 4 core. Tuttavia, il suo processore fa ancora parte della generazione C...
Intel Core i5-8259U | Intel Iris Plus Graphics 655 | 449 gr
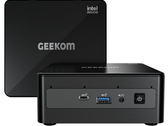
Geekom Mini IT8 SFF desktop hands-on

Geekom Mini IT8 SFF desktop hands-on

Il Geekom Mini IT8 è un desktop compatto. Nonostante il suo piccolo ingombro, racchiude una potenza decente grazie alla sua CPU quad-core e all'iGPU Intel Iris ...
Intel Core i5-8259U | Intel Iris Plus Graphics 655 | 586 gr
Recensione di Beelink SEi8: Core i3-8109U non comune per un nuovo mini PC

Recensione di Beelink SEi8: Core i3-8109U non comune per un nuovo mini PC

Se vuoi qualcosa di più veloce del Celeron o dell'Atom senza dover pagare troppo per le ultime soluzioni Core i5 o Core i7, allora questo conveniente Beelink SE...
Intel Core i3-8109U | Intel Iris Plus Graphics 655 | 346 gr
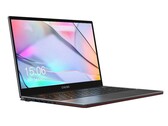
Recensione del portatile Chuwi CoreBook X Pro: Display da 120 Hz a buon mercato

Recensione del portatile Chuwi CoreBook X Pro: Display da 120 Hz a buon mercato

Il CoreBook X Pro è il portatile da 15,6 pollici meno costoso in circolazione con un pannello da 120 Hz. La fregatura, tuttavia, è che dovrete fare i conti con ...
Intel Core i5-8259U | Intel Iris Plus Graphics 655 | 15.60" | 1.8 kg
Recensione del portatile Chuwi CoreBook X: Come un Huawei MateBook, ma più economico

Recensione del portatile Chuwi CoreBook X: Come un Huawei MateBook, ma più economico

Il CoreBook X è una buona soluzione per coloro che vogliono massimizzare la qualità del display e dei colori per un prezzo basso. Tuttavia, ci sono molti piccol...
Intel Core i5-8259U | Intel Iris Plus Graphics 655 | 14.00" | 1.5 kg

GMK NucBox 2: Intel Core i5-8259U, 0.4 kg
  recensione » Recensione del Mini PC GMK NucBox 2: Prezzo ragionevole con buona possibilità di aggiornamento

Apple MacBook Pro 13 2019 i5 4TB3: Intel Core i5-8279U, 13.30", 1.4 kg
  recensione » Recensione del Laptop Apple MacBook Pro 13 2019: buone prestazioni, ma non ci sono vere innovazioni

Intel NUC8i7BEH Asura NVMe SSD: Intel Core i7-8559U, 0.7 kg
  recensione » Confronto SSD Asura Genesis Xtreme M.2 NVMe vs. SSD Samsung 970 Pro

Intel NUC8i7BE: Intel Core i7-8559U, 0.7 kg
  recensione » Recensione del Mini PC Intel NUC Kit NUC8i7BEH (i7-8559U)

Apple MacBook Pro 13 2018 Touchbar i5: Intel Core i5-8259U, 13.30", 1.4 kg
  recensione » Recensione del portatile Apple MacBook Pro 13 2018 (Touch Bar, i5)

Chuwi CoreBook X Pro: Intel Core i5-8259U, 15.60", 1.8 kg
  Recensioni esterne » Chuwi CoreBook X Pro

Chuwi CoreBook X: Intel Core i5-8259U, 14.00", 1.5 kg
  Recensioni esterne » Chuwi CoreBook X

LG Gram 15Z90N-V-AR53B: Intel Core i5-1035G7, 15.60", 1.1 kg
  Recensioni esterne » LG Gram 15Z90N-V-AR53B

Apple MacBook Pro 13 2019 i5 4TB3: Intel Core i5-8279U, 13.30", 1.4 kg
  Recensioni esterne » Apple MacBook Pro 13 2019 i5 4TB3

Apple MacBook Pro 13 2019-Z0WQ: unknown, 13.30", 1.4 kg
  Recensioni esterne » Apple MacBook Pro 13 2019-Z0WQ

Apple MacBook Pro 13 2018 Touchbar i7: Intel Core i7-8559U, 13.30", 1.4 kg
  Recensioni esterne » Apple MacBook Pro 13 2018 Touchbar i7

Apple MacBook Pro 13 2018 Touchbar i5: Intel Core i5-8259U, 13.30", 1.4 kg
  Recensioni esterne » Apple MacBook Pro 13 2018 Touchbar i5

Please share our article, every link counts!
Mail Logo

Classe 1

Classe 2

M1 Max 32-Core GPU *
GeForce RTX 2070 Super Mobile
M1 Max 24-Core GPU *
Radeon RX 5700M *
M1 Pro 16-Core GPU *
Radeon PRO W6600M *
GeForce RTX 2070 Super Max-Q
M1 Pro 14-Core GPU *
Quadro P4200
Quadro P5000 Max-Q *
GeForce RTX 3050 4GB Laptop GPU
Quadro P4000 Max-Q
Radeon RX 580X (Laptop) *
Radeon RX 580 (Laptop)
Radeon Pro 5300M
Radeon RX 5300M
Quadro P3000 Max-Q *
Radeon Pro WX 7100 *
Radeon RX 570X (Laptop) *

Classe 3

Radeon RX 570 (Laptop) *
Radeon RX 470 (Laptop) *
GeForce GTX 1050 Ti Mobile
Radeon 680M
Quadro P2000 Max-Q
Radeon R9 M395X
GeForce GTX 1050 Ti Max-Q *
WX Vega M GL
Radeon R9 M485X
GeForce GTX 1050 Max-Q *
Radeon 660M
Radeon RX 560X (Laptop)
Radeon RX 560 (Laptop)
Radeon Pro 560X
Radeon Pro 560
Radeon Pro 460
Radeon Pro WX 4130 *
Quadro P620 *
Radeon RX 550X (Laptop)
Radeon Pro 555X
Radeon Pro 555
Radeon Pro 455
Quadro P600
Radeon RX 540X *
Radeon Pro WX 2100 *
Radeon Pro WX 3100 *
Radeon Pro 450
Radeon 630
Radeon 540X *
Quadro P520
Quadro P500 *
Iris Plus Graphics G7 (Ice Lake 64 EU) *
Vega 10 *
Iris Pro Graphics 580
Vega 9
FirePro W5130M
UHD Graphics Xe G4 48EUs *
UHD Graphics 32EUs
UHD Graphics Xe 32EUs (Tiger Lake-H) *
UHD Graphics 750
UHD Graphics 730
Vega 7
Radeon R7 M465
Vega 8
Iris Plus Graphics G4 (Ice Lake 48 EU)
Quadro M600M
FirePro W4190M
Radeon R7 M445
UHD Graphics 24EUs (Alder Lake-N) *
Radeon R7 M340
Radeon 610M *
UHD Graphics G1 (Ice Lake 32 EU)
UHD Graphics Xe 16EUs (Tiger Lake-H) *
Radeon R5 (Bristol Ridge)
Adreno 690 *
Adreno 685 *
Adreno 680 *

Classe 4

Posizione approssimativa dell'adattatore grafico

Klaus Hinum, 2018-09-27 (Update: 2018-09-27)