Notebookcheck Logo

AMD Radeon RX 6650M

AMD Radeon RX 6650M

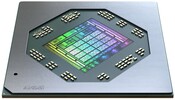
La AMD Radeon RX 6650M è una scheda grafica mobile di fascia media basata sul chip Navi 23 (architettura RDNA 2) prodotto nel moderno processo a 7nm. Dispone di 1.792 core (28 CUs - compute unit) e 8 GB di veloce memoria grafica GDDR6 collegata con un bus di memoria a 128 Bit. Il chip include anche 32 MB di Infinity Cache. La velocità di clock dei core dipenderà dal portatile secondo AMD. La velocità di clock specificata per il gioco è di 2222 MHz e quindi solo leggermente superiore alla RX 6600M. Il consumo energetico (impostazioni TDP) varia da 100 a 120 Watt (simile a quello di Nvidia).

AMD paragona le prestazioni alla RTX 3060 per computer portatili e simili alla RX 6600M. Quando gli effetti Raytracing sono attivati, cade dietro le GPU GeForce.

Il chip Navi 21 è prodotto da TSMC nel moderno processo a 7nm.

Radeon RX 6000M Serie

Radeon RX 6850M XT 2560 @ 2.46 GHz192 Bit @ 18000 MHz
Radeon RX 6800M 2560 @ 2.12 - 2.3 GHz192 Bit @ 16000 MHz
Radeon RX 6800S 2048 @ 1.8 - 1.98 GHz128 Bit @ 16000 MHz
Radeon RX 6700M 2304 @ 2.3 GHz160 Bit @ 16000 MHz
Radeon RX 6650M XT 2048 @ 2.16 GHz128 Bit @ 18000 MHz
Radeon RX 6650M 1792 @ 2.22 GHz128 Bit @ 18000 MHz
Radeon RX 6600M 1792 @ 2.07 - 2.18 GHz128 Bit @ 14000 MHz
Radeon RX 6700S 1792 @ 1.7 - 1.89 GHz128 Bit @ 14000 MHz
Radeon PRO W6600M 1792 128 Bit @ 14000 MHz
Radeon RX 6600S 1792 @ 1.88 GHz128 Bit @ 16000 MHz
Radeon RX 6550M 1024 @ 2 - 2.56 GHz64 Bit @ 18000 MHz
Radeon RX 6500M 1024 @ 2.19 GHz64 Bit @ 18000 MHz
Radeon RX 6550S 1024 @ 2.17 GHz64 Bit @ 16000 MHz
Radeon RX 6450M 768 @ 2 - 2.22 GHz64 Bit @ 18000 MHz
Radeon RX 6300M 768 @ 1.51 GHz128 Bit @ 18000 MHz
ArchitetturaRDNA 2
Pipelines1792 - unified
Velocità del core2222 (Boost) MHz
Velocità della memoria18000 MHz
Larghezza del bus di memoria128 Bit
Tipo di memoriaGDDR6
Max. quantità di memoria8 GB
Memoria condivisano
APIDirectX 12, Shader 6.4, OpenGL 4.6
Consumo di corrente120 Watt
Transistor Count11.1 Billion
tecnologia7 nm
CaratteristicheDisplayPort 1.4 w/DFSC, HDMI 2.0b, Radeon Media Engine (H.264 4K150 decode, 4K90 encode / H.265 4K90 decode, 4K60 encode / VP9 4K90 decode)
Dimensione del portatilegrande
Data dell'annuncio04.01.2022
Link alla pagina del produttorewww.amd.com

Benchmark

3DMark - 3DMark Fire Strike Standard Graphics
25739 Points (29%)
Cinebench R15
Cinebench R15 OpenGL 64 Bit +
Cinebench R15 OpenGL Ref. Match 64 Bit +
Cinebench R15 - Cinebench R15 OpenGL Ref. Match 64 Bit
98 % (98%)
Power Consumption - Furmark Stress Test Power Consumption - external Monitor *
199.8 Watt (28%)
0153045607590105120135150165180195210Tooltip
Power Consumption - The Witcher 3 Power Consumption - external Monitor *
205 Watt (29%)
0153045607590105120135150165180195210Tooltip
Power Consumption - Witcher 3 Power Consumption *
206 Watt (45%)
0153045607590105120135150165180195210Tooltip
Emissions Witcher 3 Fan Noise +
Emissions - Witcher 3 Fan Noise
54.1 dB(A) (87%)
- Valori di benchmark per questa scheda grafica
red legend - Valori medi di benchmark per questa scheda grafica
* Numeri più piccoli rappresentano prestazioni supeiori

Benchmarks per i giochi

I seguenti benchmarks deirivano dai benchmarks dei portatili recensiti. Le prestazioni dipendono dalla scheda grafica utilizzata, dal clock rate, dal processore, dai settaggi di sistema, dai drivers, e dai sistemi operativi. Quindi i risultati non sono rappresentativi per i portatili con questa GPU. Per informazioni dettagliate sui risultati del benchmark, cliccate sul numero di fps.

F1 22

F1 22

2022
basso 1920x1080
217  fps    + Confronta
medio 1920x1080
215  fps    + Confronta
alto 1920x1080
178.2  fps    + Confronta
ultra 1920x1080
40.6  fps    + Confronta
» Giocabile con tutti i portatili testati con dettagli ultra.
Additional Benchmarks
Ultra Low Preset 16xAF TAA 1280x720
264
basso 1920x1080
126.8  fps    + Confronta
medio 1920x1080
106.3  fps    + Confronta
alto 1920x1080
78.9  fps    + Confronta
ultra 1920x1080
63.8  fps    + Confronta
» Giocabile con tutti i portatili testati con dettagli ultra.
basso 1920x1080
69.3  fps    + Confronta
medio 1920x1080
68.4  fps    + Confronta
alto 1920x1080
64.3  fps    + Confronta
ultra 1920x1080
51.5  fps    + Confronta
» Giocabile con tutti i portatili testati con dettagli ultra.
Additional Benchmarks
Low Preset 1280x720
76.9
basso 1280x720
117  fps    + Confronta
medio 1920x1080
110  fps    + Confronta
alto 1920x1080
111  fps    + Confronta
ultra 1920x1080
105  fps    + Confronta
» Giocabile con tutti i portatili testati con dettagli ultra.
Additional Benchmarks
Low Preset 1920x1080
111
Far Cry 6

Far Cry 6

2021
basso 1280x720
111  fps    + Confronta
medio 1920x1080
105  fps    + Confronta
alto 1920x1080
96  fps    + Confronta
ultra 1920x1080
88  fps    + Confronta
» Giocabile con tutti i portatili testati con dettagli ultra.
Additional Benchmarks
Low Graphics Quality 1920x1080
118
F1 2021

F1 2021

2021
basso 1280x720
315  fps    + Confronta
medio 1920x1080
247  fps    + Confronta
alto 1920x1080
216  fps    + Confronta
ultra 1920x1080
100  fps    + Confronta
» Giocabile con tutti i portatili testati con dettagli ultra.
Additional Benchmarks
Ultra Low Preset 1920x1080
263
Hitman 3

Hitman 3

2021
basso 1280x720
224.8  fps    + Confronta
medio 1920x1080
178.8  fps    + Confronta
alto 1920x1080
165.5  fps    + Confronta
ultra 1920x1080
156.3  fps    + Confronta
» Giocabile con tutti i portatili testati con dettagli ultra.
Additional Benchmarks
Minimum Settings 1920x1080
212.4
Dirt 5

Dirt 5

2020
basso 1280x720
236.6  fps    + Confronta
medio 1920x1080
135.4  fps    + Confronta
alto 1920x1080
109.1  fps    + Confronta
ultra 1920x1080
83.6  fps    + Confronta
» Giocabile con tutti i portatili testati con dettagli ultra.
basso 1280x720
109  fps    + Confronta
medio 1920x1080
104  fps    + Confronta
alto 1920x1080
94  fps    + Confronta
ultra 1920x1080
62  fps    + Confronta
» Giocabile con tutti i portatili testati con dettagli ultra.
Additional Benchmarks
Ultra Preset + Ultra Ray Tracing (DX12) 1920x1080
14
basso 1280x720
162.8  fps    + Confronta
medio 1920x1080
205.9  fps    + Confronta
alto 1920x1080
124.2  fps    + Confronta
ultra 1920x1080
100.4  fps    + Confronta
» Giocabile con tutti i portatili testati con dettagli ultra.
basso 1280x720
110.4  fps    + Confronta
medio 1920x1080
95.9  fps    + Confronta
alto 1920x1080
85.2  fps    + Confronta
ultra 1920x1080
67.4  fps    + Confronta
» Giocabile con tutti i portatili testati con dettagli ultra.
Additional Benchmarks
Very Low Overall Quality (DX11) 1920x1080
108.5
basso 1280x720
138.8  fps    + Confronta
medio 1920x1080
111.5  fps    + Confronta
alto 1920x1080
81  fps    + Confronta
ultra 1920x1080
65.8  fps    + Confronta
» Giocabile con tutti i portatili testati con dettagli ultra.
Strange Brigade

Strange Brigade

2018
basso 1280x720
337  fps    + Confronta
medio 1920x1080
222  fps    + Confronta
alto 1920x1080
190  fps    + Confronta
ultra 1920x1080
167.2  fps    + Confronta
» Giocabile con tutti i portatili testati con dettagli ultra.
basso 1280x720
66.4  fps    + Confronta
medio 1920x1080
52.7  fps    + Confronta
alto 1920x1080
46.4  fps    + Confronta
» Giocabile con tutti i portatili testati con dettagli alto.
basso 1280x720
164.7  fps    + Confronta
medio 1920x1080
113.3  fps    + Confronta
alto 1920x1080
83.2  fps    + Confronta
» Giocabile con tutti i portatili testati con dettagli alto.
Fortnite

Fortnite

2018
basso 1280x720
95.5  fps    + Confronta
medio 1920x1080
54.1  fps    + Confronta
alto 1920x1080
46  fps    + Confronta
ultra 1920x1080
40.4  fps    + Confronta
» Giocabile con tutti i portatili testati con dettagli ultra.
Overwatch

Overwatch

2016
basso 1280x720
507.9  fps    + Confronta
medio 1366x768
481.9  fps    + Confronta
alto 1920x1080
350.9  fps    + Confronta
ultra 1920x1080
150  fps    + Confronta
» Giocabile con tutti i portatili testati con dettagli ultra.
Additional Benchmarks
Medium (Render Scale 100 %) 2xAF FXAA 1920x1080
403.2
basso 1280x720
141  fps    + Confronta
medio 1366x768
130.7  fps    + Confronta
alto 1920x1080
118  fps    + Confronta
ultra 1920x1080
100  fps    + Confronta
» Giocabile con tutti i portatili testati con dettagli ultra.
basso 1024x768
276.5  fps    + Confronta
medio 1366x768
217.4  fps    + Confronta
alto 1920x1080
167  fps    + Confronta
ultra 1920x1080
90.1  fps    + Confronta + 📈 Graph
» Giocabile con tutti i portatili testati con dettagli ultra.
bassomedioaltoultraQHD4K
F1 22217215178.240.6
Cyberpunk 2077 1.6126.8106.378.963.8
God of War69.368.464.351.5
Guardians of the Galaxy117110111105
Far Cry 61111059688
F1 2021315247216100
Hitman 3224.8178.8165.5156.3
Dirt 5236.6135.4109.183.6
Watch Dogs Legion1091049462
Gears Tactics162.8205.9124.2100.4
Borderlands 3110.495.985.267.4
Metro Exodus138.8111.58165.8
Strange Brigade337222190167.2
X-Plane 11.1166.452.746.4
Final Fantasy XV Benchmark164.7113.383.2
Fortnite95.554.14640.4
Overwatch507.9481.9350.9150
Dota 2 Reborn141130.7118100
The Witcher 3276.5217.416790.1
< 30 fps
< 60 fps
< 120 fps
≥ 120 fps


7
12

2
8
9

2
10
7

3
11
3


Per conoscere altri giochi che potrebbero essere utilizzabili e per una lista completa di tutti i giochi e delle schede grafiche visitate la nostra Gaming List

v1.28
log 19. 00:32:03

#0 ran 0s before starting gpusingle class +0s ... 0s

#1 no ids found in url (should be separated by "_") +0s ... 0s

#2 not redirecting to Ajax server +0s ... 0s

#3 did not recreate cache, as it is less than 5 days old! Created at Fri, 17 Jan 2025 09:55:31 +0100 +0.001s ... 0.001s

#4 no comparison url found in template nbc.compare_page_1 needed +0.029s ... 0.03s

#5 no comparison url found in template nbc.compare_page_1 needed +0s ... 0.03s

#6 no comparison url found in template nbc.compare_page_1 needed +0s ... 0.03s

#7 no comparison url found in template nbc.compare_page_1 needed +0s ... 0.031s

#8 no comparison url found in template nbc.compare_page_1 needed +0s ... 0.031s

#9 no comparison url found in template nbc.compare_page_1 needed +0s ... 0.031s

#10 no comparison url found in template nbc.compare_page_1 needed +0s ... 0.031s

#11 no comparison url found in template nbc.compare_page_1 needed +0s ... 0.031s

#12 no comparison url found in template nbc.compare_page_1 needed +0s ... 0.032s

#13 no comparison url found in template nbc.compare_page_1 needed +0s ... 0.032s

#14 no comparison url found in template nbc.compare_page_1 needed +0s ... 0.032s

#15 no comparison url found in template nbc.compare_page_1 needed +0s ... 0.032s

#16 no comparison url found in template nbc.compare_page_1 needed +0s ... 0.033s

#17 no comparison url found in template nbc.compare_page_1 needed +0s ... 0.033s

#18 composed specs +0s ... 0.033s

#19 did output specs +0s ... 0.033s

#20 start showIntegratedCPUs +0s ... 0.033s

#21 getting avg benchmarks for device 11134 +0.014s ... 0.047s

#22 got single benchmarks 11134 +0.009s ... 0.056s

#23 got avg benchmarks for devices +0s ... 0.056s

#24 min, max, avg, median took s +0.264s ... 0.32s

#25 before gaming benchmark output +0s ... 0.32s

#26 Got 74 rows for game benchmarks. +0.028s ... 0.349s

#27 composed SQL query for gamebenchmarks +0s ... 0.349s

#28 got data and put it in $dataArray +0.012s ... 0.361s

#29 benchmarks composed for output. +0.825s ... 1.186s

#30 no comparison url found in template nbc.compare_page_1 needed +0.003s ... 1.189s

#31 return log +0s ... 1.189s

Please share our article, every link counts!
Mail Logo

Classe 1

Classe 2

GeForce RTX 5060 Laptop *
Radeon RX 8060S *
M1 Max 32-Core GPU *
GeForce RTX 2070 Super Mobile
M1 Max 24-Core GPU *
Radeon RX 8050S *
Radeon RX 5700M *
M1 Pro 16-Core GPU *
Radeon PRO W6600M *
GeForce RTX 2070 Super Max-Q
M1 Pro 14-Core GPU *
GeForce RTX 5050 Laptop *
Quadro P4200
Radeon RX 8040S *
Arc 140T *
Quadro P5000 Max-Q *
Arc 130T *
GeForce RTX 3050 4GB Laptop GPU
Quadro P4000 Max-Q
Radeon RX 580X (Laptop) *
Radeon RX 580 (Laptop)
Radeon Pro 5300M
Radeon RX 5300M
Quadro P3000 Max-Q *
Radeon Pro WX 7100 *
Radeon RX 570X (Laptop) *

Classe 3

Radeon RX 570 (Laptop) *
Radeon RX 470 (Laptop) *
GeForce GTX 1050 Ti Mobile
Radeon 680M
Quadro P2000 Max-Q
Radeon R9 M395X
GeForce GTX 1050 Ti Max-Q *
WX Vega M GL
Radeon R9 M485X
GeForce GTX 1050 Max-Q *
Radeon 660M
Radeon RX 560X (Laptop)
Radeon RX 560 (Laptop)
Radeon Pro 560X
Radeon Pro 560
Radeon Pro 460
Radeon Pro WX 4130 *
Quadro P620 *
Radeon RX 550X (Laptop)
Radeon Pro 555X
Radeon Pro 555
Radeon Pro 455
Quadro P600
Arc Graphics 3-core (Arrow Lake) *
Radeon RX 540X *
Radeon Pro WX 2100 *
Radeon Pro WX 3100 *
Arc Graphics 2-core (Arrow Lake) *
Radeon Pro 450
Radeon 630
Radeon 540X *
Quadro P520
Quadro P500 *
Iris Plus Graphics G7 (Ice Lake 64 EU) *
Vega 10 *
Iris Pro Graphics 580
Vega 9
FirePro W5130M
UHD Graphics Xe G4 48EUs *
UHD Graphics 32EUs
UHD Graphics Xe 32EUs (Tiger Lake-H) *
UHD Graphics 750
UHD Graphics 730
Vega 7
Radeon R7 M465
Vega 8
Iris Plus Graphics G4 (Ice Lake 48 EU)
Quadro M600M
FirePro W4190M
Radeon R7 M445
UHD Graphics 24EUs (Alder Lake-N) *
Radeon R7 M340
Radeon 610M *
UHD Graphics G1 (Ice Lake 32 EU)
UHD Graphics Xe 16EUs (Tiger Lake-H) *
Radeon R5 (Bristol Ridge)
Adreno 690 *
Adreno 685 *
Adreno 680 *

Classe 4

Posizione approssimativa dell'adattatore grafico